Pericolosità e microzonazione sismica: esiste un loro punto di … · A cosa servono le carte...
27
Pericolosità e microzonazione sismica: esiste un loro punto di contatto? Dario Slejko
Transcript of Pericolosità e microzonazione sismica: esiste un loro punto di … · A cosa servono le carte...

Pericolosità e microzonazione sismica: esiste un loro punto di contatto?
Dario Slejko

Prendendola alla larga …Matteo 7, 24-27Perciò chiunque ascolta queste mie parole e le mette in pratica, è simile a un uomo saggio che ha costruito la sua casa sulla roccia. Cadde la pioggia, strariparono i fiumi, soffiarono i venti e si abbatterono su quella casa, ed essa non cadde, perché era fondata sopra la roccia. Chiunque ascolta queste mie parole e non le mette in pratica, è simile a un uomo stolto che ha costruito la sua casa sulla sabbia. Cadde la pioggia, strariparono i fiumi, soffiarono i venti e si abbatterono su quella casa, ed essa cadde, e la sua rovina fu grande".
Più scientificamente …Studies on the effects that local site conditions have on the characteistics of strong earthquake ground motion can be dated to 1910 when Reid reported the consequencies of the California earthquake of April 18, 1906.

Il primo? lavoro sugli effetti di sito
Bull. Seism. Soc. Am., 47, 221-250, 1957

Tredici anni dopo …
Measurements of ground motion generated by nuclear explosions in Nevada were made for 37 locations near San Francisco Bay, California. The results were compared with the San Francisco 1906 earthquake intensities and the strong-motion recordings of the San Francisco earthquake of March 22, 1957. The recordings of ground motion generated by nuclear explosions in Nevada show marked amplitude variations related to the geologic setting of the recording site. For sites underlain by a layer of younger bay mud or artificial fill, maximum horizontal ground velocities generally increased with thickness of the layer and were as much as ten times greater than those recorded on nearby bedrock. Consistent correlations with the 1906 earthquake intensities and the spectral amplification curves for the 1957 earthquake suggest that areas of high amplification determined from small ground motions may also be areas of high intensity in future earthquakes.
Borcherdt, R. D. (1970). Effects of local geology on ground motion near San Francisco Bay, Bull. Seism. Soc. Am. 60, 29–61.

Passano ancora gli anni …
The San Fernando earthquake gave evidence of slower attenuation of acceleration with distance on alluvial soil sites and smaller values of expected PGA on soil sites in the near field (d<60 km) (Duke et al., 1972; Donovan, 1973; Seed el al., 1976)

Prime relazioni di attenuazione con condizioni di sito
Per gli Stati UnitiTrifunac M.D. and Brady A.G.; 1976: Correlations of peak acceleration, velocity and displacement with earthquake magnitude, distance and site conditions. Earthquake Eng. & Struct. Dyn., 4, 455–471.
A brief review of proposed correlations between peak accelerations and earthquake magnitude and distance has been presented. It has been found that most investigators agree favourably on what should be the amplitude of peak accelerations for the distance range between about 20 and 200 km. For distances less than 20 km, there is significant disagreement in the predicted peak amplitudes, reflecting the lack of data there and the uncertainties associated with the extrapolation.Correlations of peak accelerations, peak velocities and peak displacements with earthquake magnitude, epicentral distance and the geologic conditions of the recording sites have been presented for 187 accelerograms recorded during 57 earthquakes. … The influence of geologic conditions at the recording station seems to be of minor importance for scaling peak accelerations, but it becomes noticeable for the peaks of velocity and even more apparent for the peaks of displacement.
Per l’Italia

Cosa c’era nei codici sismici pre-1994
Soil profile types, site coefficients and spectral shapes contained in seismic codes prior to NERRP 1994 (Martin and Dobry, 1994)

Le basi per le 1994 NEHRP Provisions
Borcherdt R. D. (1994). Estimates of site-dependent response spectra for design (methodology and justification), Earthquake Spectra, 10, 617–653.

Effetti di sito nelle NEHRP Provisions 1994
Una tabella simile è definita per FV (velocità)

Confronto prima e NEHRP-94

Effetti di sito nelle 2009 NEHRP Provisions
Non-linearità

Metodi di valutazione degli effetti di sito1 – attenuation relationship approach
2 – code-factor approach
3 – site response analysis approach

Amplificazioni da relazioni di attenuazione: the Bayamo experience 1
PGA (median values plus one standard deviation of the attenuation relation) with a 475-year return period computed according to the soil typologies for the broader Bayamo region: upper panel) using European soil-dependent attenuation relations (Ambraseys et al., 1996); lower panel) using American soil-dependent attenuation relations (Dahle et al., 1995).
Geological characterisation of the broader Bayamo region, red lines indicate faults: a) regional geologicalmap of the study area; b) soil characterisation.

Amplificazioni da VS30 : the Bayamo experience 2
PGA (median values plus one standard deviation of the attenuation relation) with a 475-year return period computed according to the soil typologies for the broader Bayamo region: a) using European soil-dependent attenuation relations (Ambraseys et al., 1996); b) amplifying (CEN, 2002) the values for rock obtained by the Ambraseys at al. (1996) attenuation relation (a); c) using American soil-dependent attenuation relations (Dahle et al., 1995); d) amplifying (BSSC, 2001) the values for rock obtained by the Dahle et al. (1995) attenuation relation.
Geological characterisation of the broader Bayamo region, red lines indicate faults: a) regional geologicalmap of the study area; b) soil characterisation.

FA calcolati da profili di velocità
Background 2008 USGS 2% probability of exceedence with B/C site conditions

Mappe nazionali e regionali con effetti di sito
Slejko et al. (2008)Romeo et al. (2000)
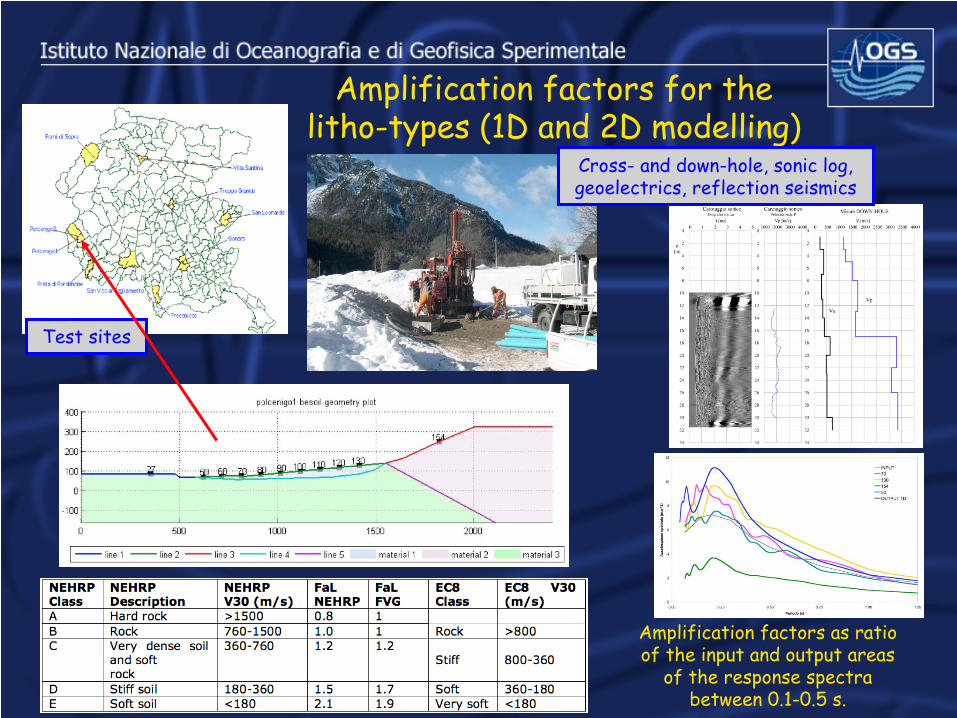
Amplification factors for the litho-types (1D and 2D modelling)
Amplification factors as ratio of the input and output areas
of the response spectra between 0.1-0.5 s.
Test sites
Cross-
and down-hole, sonic log, geoelectrics, reflection seismics
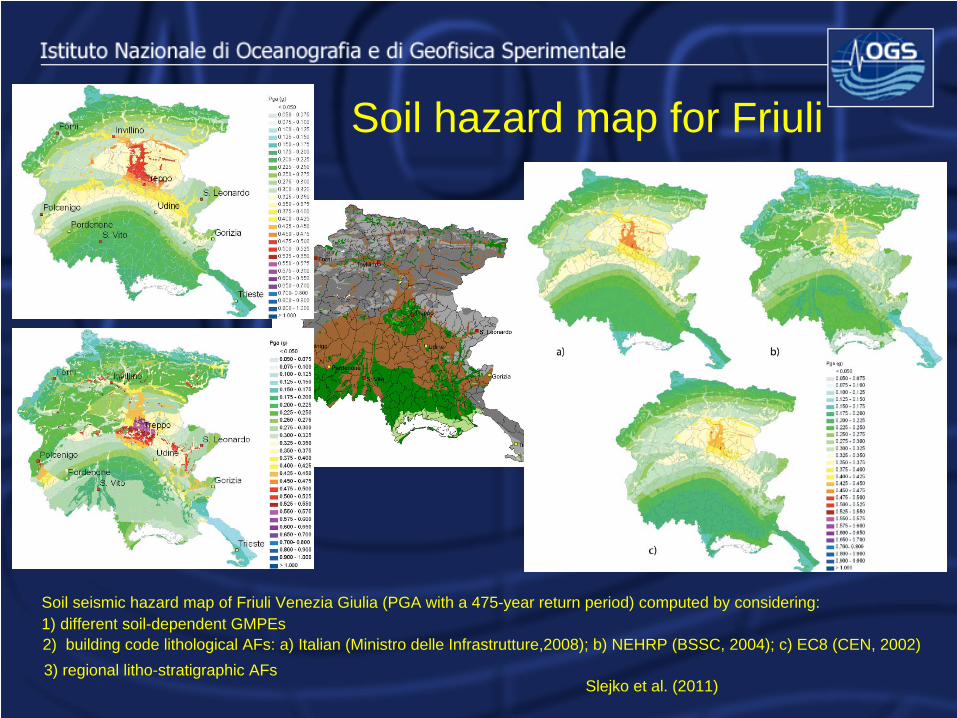
Soil hazard map for Friuli
2) building code lithological AFs: a) Italian (Ministro delle Infrastrutture,2008); b) NEHRP (BSSC, 2004); c) EC8 (CEN, 2002)3) regional litho-stratigraphic AFs
Soil seismic hazard map of Friuli Venezia Giulia (PGA with a 475-year return period) computed by considering:1) different soil-dependent GMPEs
Slejko et al. (2011)

Amplification factors for the morpho-types
Amplification factors:1 = 1.02 = 4.03 = 1.84 = 4.05 = 4.06 = 3.57 = 1.08 = 1.6
1 2
3 4
5 6
7 8
from the analysis of the damage observed during the
ML6.4 1976 earthquake (Grimaz, 2006)

Hazard map from morphological amplification factors in terms of PGA with a 475-year return period
PGA with OGS amplification factors
Morphological themes
PGA with EC8 amplification factors
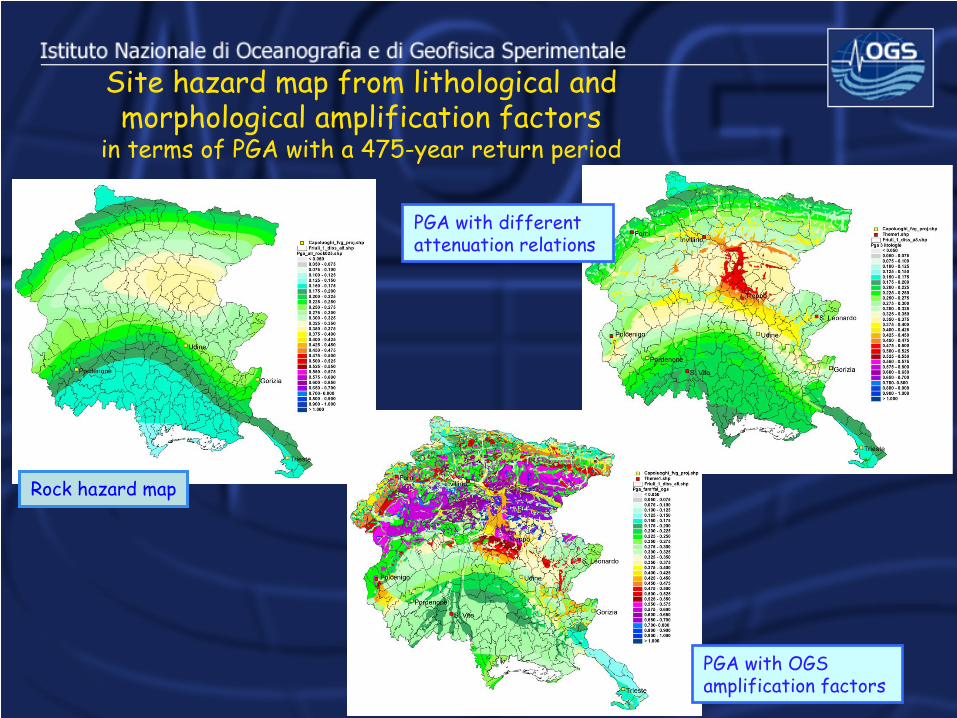
Site hazard map from lithological and morphological amplification factors
in terms of PGA with a 475-year return period
Rock hazard map
PGA with different attenuation relations
PGA with OGS amplification factors

Trifunac la pensa così
Trifunac M.; 2008: The nature of site response during earthquakes. Nato ARW Workshop, Springer.

E se non l’avete capito …
V30 has become the parameter used by many engineering design codes. In 1995, the authors studied this problem and concluded that V30 should not be used as an older site characterization in terms of the soil site parameter SL
proposed by Seed et al. worked better because it included a measure of the thickness of the soil layers to considerably greater depths.V30 should not be the only site parameter used to scale strong-motion amplitudes and it is better to use SL to describe the amplification of seismic waves by soil deposits near the surface.

E allora?
Cadet et al. (2011) have found that the largest variance reduction is obtained with twin-parameter characterizations, out of which the couple (f0 ,VS30 ) proves to provide the lower misfit.
Cadet H., Bard P.Y., Duval A.-M. and Bertrand E.; 2011:Site effect assessment using KiK-net data: part 2—site amplification prediction equation based on f0 and Vsz. Bull Earthquake Eng., DOI 10.1007/s10518-011-9298-7

Visto che sembra condiviso che la VS30 sia un indicatore grossolano dell’amplificazione locale (anche perchè tecniche
diverse danno profili di velocità diversi)
A cosa servono le carte “site hazard”?• A quantificare lo scuotimento realmente atteso
• A confrontare le stime di pericolosità con altri osservatbil (intensitàmacrossismiche)
• A smentire chi dopo ogni terremoto afferma che lo scuotimentoregistrato è stato superiore a quello atteso
PS: le norme fanno riferimento a roccia di 800 m/s;è quella sotto ai nostri piedi?

Progetto DPC-INGV S2
Sviluppo di mappe soil-hazard(effetti di sito e studi di microzonazione)
d.1. motivazioni/scopiIn merito agli effetti di sito andrebbe esplorata la possibilità, per aree campione, di utilizzare i risultati degli studi di microzonazione che stanno portando avanti diverse regioni (es. Lazio, L’Aquila, etc.) in base ai finanziamenti dell’art. 111 della legge n 24/6/09, n. 77Per consentire una validazione del modello con l’osservato è necessario portare le stime da rock� type a soil�type, o free�field, dove con quest’ultimo termine si intende una quantificazione grossolana della risposta locale. Concettualmente la medesima operazione viene fatta quando si tenta un confronto fra valori strumentali (PGA o altro) e l’intensità macrosismica. A questo scopo è dedicato il sottoprogetto S2_a�conversione.

"Building a culture of prevention is not easy… the benefits are not tangible;
they are the disasters that did not happen”
Kofi Annan after the Bam earthquake