
GUBBIO - esse3.mi.ingv.itesse3.mi.ingv.it/deliverables/Deliverables_S3_D22-D23.pdf · Progetti...
46
Progetti sismologici di interesse per il DPC Progetto S3 Progetto S3 – Scenari di scuotimento in aree di interesse prioritario e/o strategico Responsabili: Francesca Pacor (INGV-MI) e Marco Mucciarelli (Unibas) TASK 6 – GUBBIO - DELIVERABLES D22-D23 SHAKING SCENARIOS INCLUDING SITE EFFECTS A cura di UR1 –D.Bindi, E. Fiorini, F.Pacor, L. Luzi UR2 – A. Rovelli, F. Cara, G. Di Giulio, G.Milana, G. Monachesi UR4 – D. Albarello, V. D’Amico, M. Picozzi UR6 – M. Mucciarelli UR9 – G. Ferretti UR10 – Emolo GFZ-Potsdam - S. Parolai, S. Richwalsky July 2007
Transcript of GUBBIO - esse3.mi.ingv.itesse3.mi.ingv.it/deliverables/Deliverables_S3_D22-D23.pdf · Progetti...
Progetti sismologici di interesse per il DPC Progetto S3
Progetto S3 – Scenari di scuotimento in aree di interesse prioritario e/o strategico
Responsabili: Francesca Pacor (INGV-MI) e Marco Mucciarelli (Unibas)
TASK 6 – GUBBIO - DELIVERABLES D22-D23
SHAKING SCENARIOS INCLUDING SITE EFFECTS
A cura di
UR1 –D.Bindi, E. Fiorini, F.Pacor, L. Luzi UR2 – A. Rovelli, F. Cara, G. Di Giulio, G.Milana, G. Monachesi
UR4 – D. Albarello, V. D’Amico, M. Picozzi UR6 – M. Mucciarelli
UR9 – G. Ferretti UR10 – Emolo
GFZ-Potsdam - S. Parolai, S. Richwalsky
July 2007
Progetti sismologici di interesse per il DPC Progetto S3
INDEX
1. INTRODUCTION.........................................................................................3
2. VELOCIMETRIC STATIONS ....................................................................5
2.1 GENOA TRANSECT ................................................................................................... 5 2.2.1 INSTRUMENT ........................................................................................................ 5 2.2.2 DATA SET ............................................................................................................... 6 2.2.3 ANALYSIS ............................................................................................................... 8
2.2 GFZ TRANSECT ........................................................................................................ 13 2.2.1 INSTRUMENT ...................................................................................................... 13 2.2.2 DATA SET ............................................................................................................. 14 2.2.3 ANALYSIS ............................................................................................................. 15
2.3 INGV STATIONS (Transect and array2D) ........................................................... 17 2.3.1 INSTRUMENT ...................................................................................................... 17 2.3.2 DATA SET ............................................................................................................. 19 2.3.3 ANALYSIS ............................................................................................................. 22
3. EMPIRICAL SITE RESPONSES ..............................................................24
3.1 DATA SET ................................................................................................................... 24
3.2 DATA ANALYSIS...................................................................................................... 24 3.2.1 Horizontal to vertical spectral ratio H/V................................................................ 24 3.2.2. The standard spectral ratio SSR ............................................................................ 26 3.2.3 Generalized inversion technique - GIT ................................................................... 28
3.3 DISCUSSIONS ........................................................................................................... 29
4. AMPLIFICATION IN THE BASIN .........................................................30
5. RESONANCE FREQUENCIES OF BUILDINGS.................................35
6. SHAKING SCENARIOS INCLUDING SITE EFFECTS.....................41
7. GEOGRAPHICAL INFORMATION SYSTEM ....................................43
8. CONCLUSION ............................................................................................45
REFERENCES...................................................................................................46
Task 6 - Deliverables D22-D23 2
Progetti sismologici di interesse per il DPC Progetto S3
1. INTRODUCTION Within the Italian Project S3 (DPC-INGV) “Shaking seismic scenarios in area of strategic and/or priority interest” the urban area of Gubbio has been chosen as a test site for the calculation of ground shaking scenarios for forecasting purposes. The area has been selected because the urban and / or geomorphologic characteristics of the town of Gubbio and its surrounding are good representatives of many areas in Central Italy: an historical centre of high cultural and artistic value founded on a rocky hillside with new residential and industrial areas developed on the alluvial plain. A great deal of effort has been put in the seismic characterisation of the Gubbio basin, since the general purpose of this work has been the quantification of site effects in intra-mountain basins. Recent studies have shown in fact that significant site effects take place in the Eugubina plain, as evidenced by the generation of surface waves. In particular, the strong motions recorded at the accelerometric station GPB, belonging to the RAN (Rete accelerometrica italiana), installed within the alluvial basin, shows strong amplification and lengthening of significant duration respect to rock sites (Pacor et al; 2007). Several investigations with active and passive seismic survey techniques have been planned and carried out in the plain, also favoured by the intense seismic activity typical of the area (see PS3-Deliverable 21). All data are collected in a GIS herewith enclosed (section 7). The estimates of the empirical transfer functions in the basin have been related to the monitoring activities of 4 temporary transects of seismometric stations (Figure 1.1), operating between June 2005 and May 2006 and described in this Deliverable. The velocemetric records are collected in PS3-Deliverable D26 The amplitude transfer functions for sites corresponding to the stations installed in the basin have been determined by applying three different methods, namely the horizontal-to-vertical spectral ratio (H/V), the standard spectral ratio (SSR) and the generalized inversion technique (GIT). To find the amplification factors for sites inside the basin, an empirical procedure has been applied using the frequency of the H/V spectral ratio peak as a parameter for linking the position within the basin with a frequency dependent amplification coefficient. In summary: • The sites inside the basin were classified with their fundamental frequencies,
estimated from the HVSR applied to earthquake recordings. • The amplification factors were computed by the ratio between the response
spectra at soil sites and the response spectra at a hard-rock site using data from two seismic transects
• The empirical amplification functions were associated to the fundamental frequencies applying an interpolation technique
• The correspondence between the fundamental frequency and the amplification function was verified computing the amplified spectra and comparing it with recorded spectra from the third transect of velocimetric stations.
Task 6 - Deliverables D22-D23
3
Progetti sismologici di interesse per il DPC Progetto S3
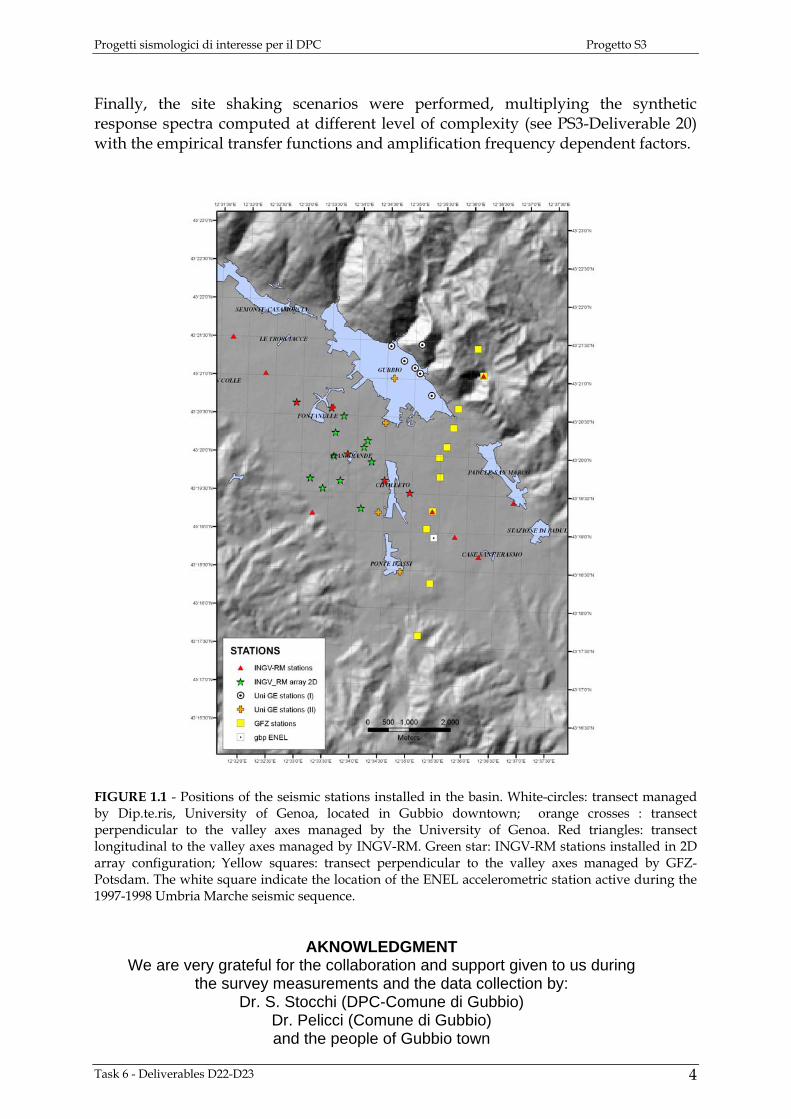
Finally, the site shaking scenarios were performed, multiplying the synthetic response spectra computed at different level of complexity (see PS3-Deliverable 20) with the empirical transfer functions and amplification frequency dependent factors.
FIGURE 1.1 - Positions of the seismic stations installed in the basin. White-circles: transect managed by Dip.te.ris, University of Genoa, located in Gubbio downtown; orange crosses : transect perpendicular to the valley axes managed by the University of Genoa. Red triangles: transect longitudinal to the valley axes managed by INGV-RM. Green star: INGV-RM stations installed in 2D array configuration; Yellow squares: transect perpendicular to the valley axes managed by GFZ- Potsdam. The white square indicate the location of the ENEL accelerometric station active during the 1997-1998 Umbria Marche seismic sequence.
We are very grateful for the survey mea
Dr. S. StDr. and
Task 6 - Deliverables D22-D23
AKNOWLEDGMENT the collaboration and support given to us during surements and the data collection by: occhi (DPC-Comune di Gubbio) Pelicci (Comune di Gubbio) the people of Gubbio town
4

Progetti sismologici di interesse per il DPC Progetto S3
2. VELOCIMETRIC STATIONS In this paragraph, the velocimetric stations installed in the basin are described. Two transects have been positioned perpendicularly to the valley axes, one parallel and one near to the Gubbio city. More than 300 local and regional earthquakes have been recorded, with maximum magnitude equal to 4. A 2D array has been operating as well from June to September 2006, to better understand the generation of surface waves. 2.1 GENOA TRANSECT Within the scope of the project, the Dip.Te.Ris., University of Genoa, has planned and managed two temporary seismic networks, that operated separately in different time intervals, with the aim to investigate and define the seismic response of downtown Gubbio and the Gubbio basin (Figure 1.1). 2.2.1 INSTRUMENT In particular a first network composed by six seismic stations was installed from October 2005 to February 2006 in historical downtown of Gubbio (Figure 2.1.1a) considering the sites described in table 2.1.1.
Figure 2.1.1 a) Position of the velocimetric stations of University of Genoa in a) Gubbio downtown b) in the basin CODE Coordinates
Longitude –Latitude Location
GUB1 12.5750 43.3561 (S. Illuminata school) north-western sector of Gubbio downtown – alluvial fan/slope deposits
GUB2 12.5823 43.3515 public archive office) Gubbio downtown – slope deposits GUB3 12.5839 43.3503 (S. Agostino church) Gubbio downtown – alluvia fan GUB4 12.5875 43.3456 (barracks of the firemen) south-western sector of Gubbio
downtown – slope deposits GUB5 12.5842 43.3566 (S. Ubaldo church) north-eastern sector of Gubbio
downtown – bedrock (limestone) GUB6 12.5790 43.3530 (Palazzo dei Consoli) Gubbio downtown – alluvial
fan/slope deposits Table 2.1.1 - Code, geographical coordinates and location of the seismic stations belonging to the first-stage network (historical downtown of Gubbio, parallel to the valley axes near to the slope)
Task 6 - Deliverables D22-D23
5

Progetti sismologici di interesse per il DPC Progetto S3
Since February 2006 to June 2006, a second temporary network composed of 5 stations has been installed in the Gubbio basin (Figure 2.1.2) along a transect perpendicular to the valley axes. The site used is described in table 2.1.2: Each station has been equipped with a velocimetric sensor (Lennartz 3D-5s) and a digital acquisition system (Lennartz Marslite HD) with a GPS or DCF synchronization system. CODE Coordinates
Longitude –Latitude Location
STAa 12.5823 43.3515 (public archive office, ex GUB2) Gubbio downtown - slope deposits
STAb 12.5763 43.3491 (Gubbio primary school) – south-western sector of Gubbio downtown – alluvial fan deposits
STAc 12.5740 43.3393 (agrarian consortium) south-east of Gubbio – fluvial-lacustrine deposits
STAd 12.5725 43.3199 (hangar) north-east of Ponte D’Assi town – fluvial-lacustrine deposits
STAe 12.5795 43.3070 (old church of Ponte D’Assi) Ponte D’Assi – lacustrine deposits
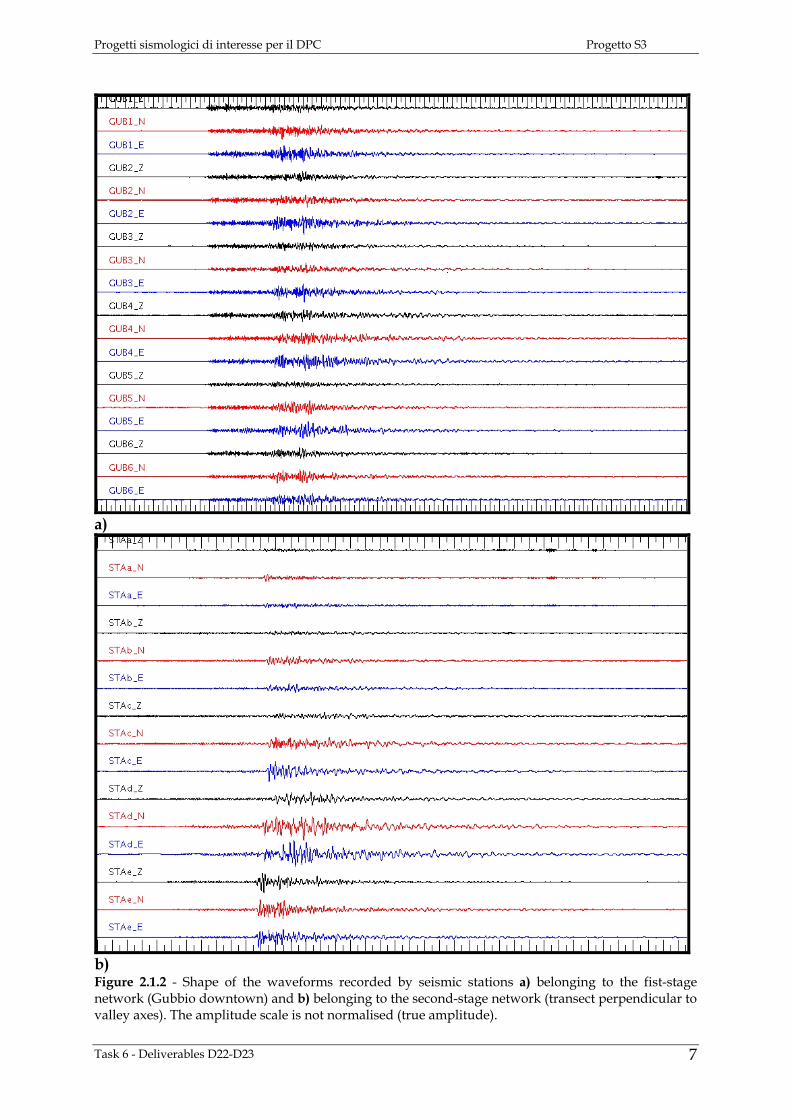
Table 2.1.2 - code, geographical coordinates and location of the seismic stations belonging to the second-stage network (Gubbio basin, perpendicular to the valley axes) 2.2.2 DATA SET For each station the continuous stream of data was recorded and collected. From this complete database it is possible to extract any temporary window in SAC format. Since October 2005 to June 2006 more than 300 low energy seismic events (2 < Md < 4) and more than 20 regional events have been recorded by installed velocimeters. All events were recognized and located by INGV seismic network. Among micro-earthquakes showing an acceptable SNR (signal to noise ratio), records were selected focusing on: -epicentral distance < 60 Km; -local magnitude > 2.5. In particular we have selected 15 local events from the dataset recorded by the first-stage temporary network (located along Gubbio downtown) and 79 local events and 9 regional events from the dataset recorded by the network positioned perpendicularly to the valley axes. An example of recording is shown in Figure 2.1.2.
Task 6 - Deliverables D22-D23 6
Progetti sismologici di interesse per il DPC Progetto S3
a)
b) Figure 2.1.2 - Shape of the waveforms recorded by seismic stations a) belonging to the fist-stage network (Gubbio downtown) and b) belonging to the second-stage network (transect perpendicular to valley axes). The amplitude scale is not normalised (true amplitude).
Task 6 - Deliverables D22-D23
7

Progetti sismologici di interesse per il DPC Progetto S3
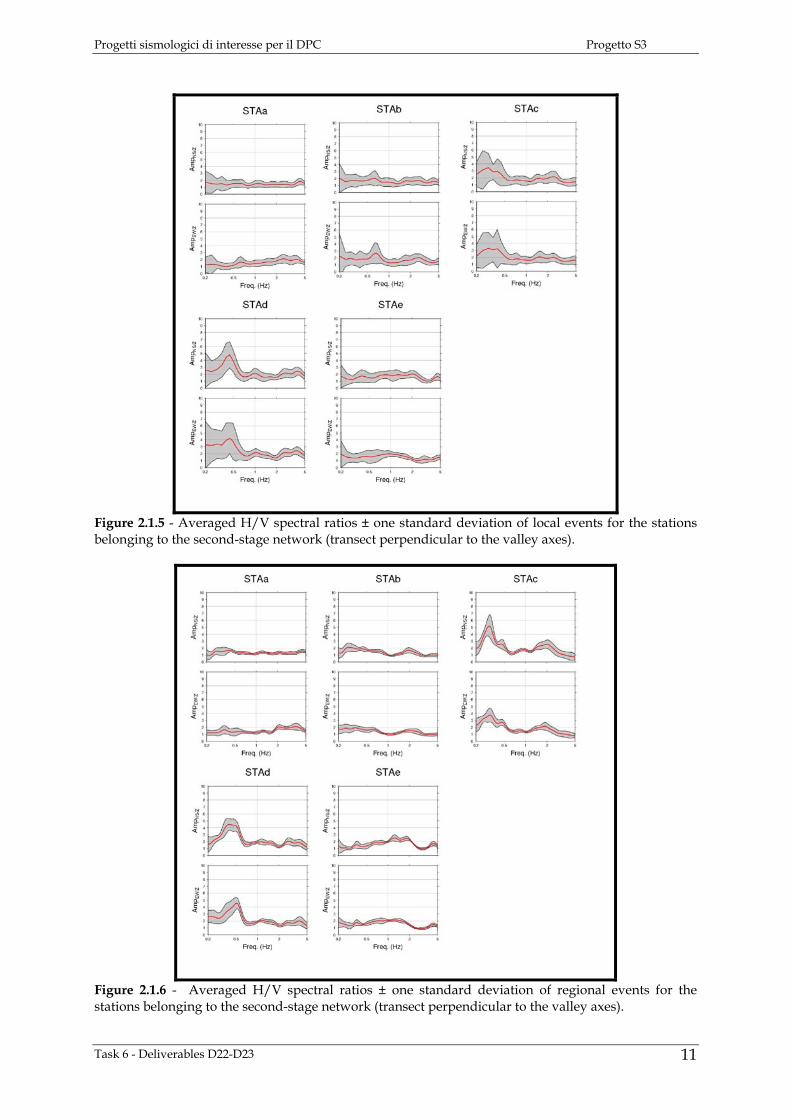
2.2.3 ANALYSIS Using all events selected for each station, SSR (Standard Spectral Ratio) and HVSR techniques were applied. For what concerns SSR method, it is important to underline that a good seismic response estimation is generally obtained if the distance between each station and the reference site is small if compared to epicentral distance of selected events. Moreover, no site effects must be present at the reference site. Being installed on outcropping limestone, according to the other partners of the project, the station installed in the Madonna del Sasso church was used as reference station (station eu00 of the INGV transect or station GU00 of the GFZ transect). Results from spectral analyses pointed out different results for the two transects (parallel and perpendicular to the valley axes) defined by the two temporary networks: while the stations installed in the historical downtown of Gubbio do not show any particular site effect for both alluvial fan, slope deposits and limestone, the presence of relevant site amplification effects involving the Gubbio basin was clearly shown by several stations belonging to the second-stage network installed following a transect perpendicular to the valley axes. Local earthquake data, collected during the campaign, were processed as follow: (1) filtering the signals between 0.2 and 20 Hz, (2) computing smoothed (Konno-Ohmachi window) Fourier spectra for windows that include 20s after S-phase arrival and (3) computing the arithmetic mean and standard deviation (± 1σ) of all H/V ratios. Regional earthquake data were similarly processed but considering a window that includes 100s after S-phase arrival. Starting from information derived using both SSR and HVSR techniques (Figures from 2.1.3 to 2.1.8) it is possible to recognize three main zones characterized by different seismic response:
• the “Gubbio downtown” zone, where no significant amplification effects have been detected. The stations GUB1, GUB2, GUB3, GUB4, GUB5 and GUB6 show “flat” H/V curves (no significant peak can be clearly recognised) while the comparison with the reference station do not indicate particular spectral amplifications (for GUB 4 and GUB5 spectral amplification lower than 2.5 can be detected in the frequency range 1 - 2 Hz); it is worth noting that for this transect longitudinal to the valley axes we have used station GUB2 as reference station. As previous mentioned, 15 local events have been analysed for these stations.
• the “alluvial fan” zone located near Gubbio downtown towards the basin (STAb station) where the H/V curve derived from local events shows spectral amplification lower than 3 at about 0.7 Hz, the H/V curve derived from regional events do not indicate particular spectral amplification and the SSR method (by using eu00 as reference station) shows, considering both local and regional events, moderate spectral amplifications (with amplitude spanning from 4 to 6) in the frequency range 0.7 - 2 Hz;
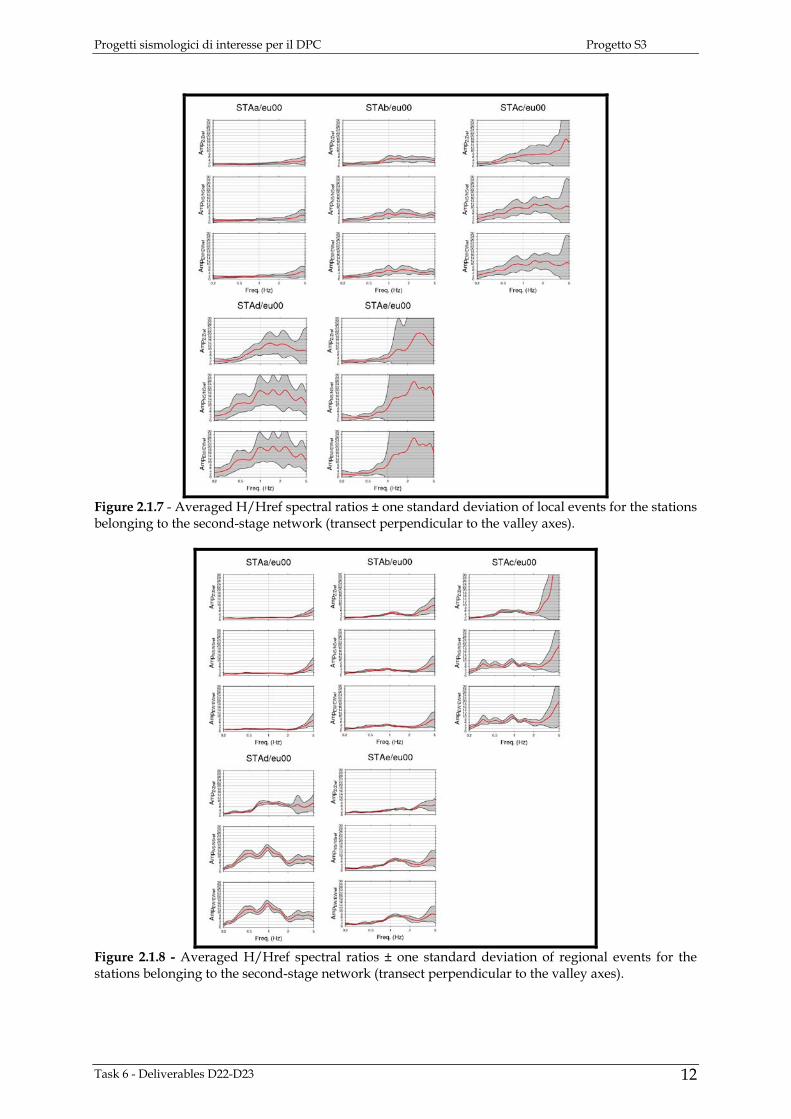
• the “basin” zone (STAc and STAd stations), where H/V curves as derived from both local and regional events show clear resonance frequencies ranging from 0.3 – 0.4 Hz for STAc station (with an amplification level of 3 - 4) to 0.4 – 0.5 Hz for STAd station (with an amplification level of about 5). The H/Href curves show for both stations a significant amplification between 0.4 and 2.5
Task 6 - Deliverables D22-D23 8

Progetti sismologici di interesse per il DPC Progetto S3
Hz with a mean amplitude level of about 8 for STAc and of about 15-18 for STAd;
• the zone located near Ponte D’Assi village (STAe station), where the results coming from local event analysis do not show particular site effects even if the H/Href curve shows very large errors for frequencies greater than 1 Hz. Nevertheless, both the H/V and H/Href curves derived from analysing regional events show clear amplification effects between 1 and 2 Hz with an amplitude level lower than 3 for H/V and of about 7 for H/Href.
It is worth noting that for frequencies greater than 5 Hz the H/Href curves computed considering eu00 station as reference site show very large standard deviation, presumably related by local anthropic sources biasing the results at high frequencies.
Figure 2.1.3 - Averaged H/V spectral ratios ± one standard deviation of local events for the stations belonging to the first-stage network (historical downtown of Gubbio).
Task 6 - Deliverables D22-D23
9

Progetti sismologici di interesse per il DPC Progetto S3
Figure 2.1.4 - Averaged H/Href spectral ratios ± one standard deviation of local events for the stations belonging to the first-stage network (historical downtown of Gubbio) computed considering GUB2 as reference site.
Task 6 - Deliverables D22-D23 10
Progetti sismologici di interesse per il DPC Progetto S3
Figure 2.1.5 - Averaged H/V spectral ratios ± one standard deviation of local events for the stations belonging to the second-stage network (transect perpendicular to the valley axes).
Figure 2.1.6 - Averaged H/V spectral ratios ± one standard deviation of regional events for the stations belonging to the second-stage network (transect perpendicular to the valley axes).
Task 6 - Deliverables D22-D23
11
Progetti sismologici di interesse per il DPC Progetto S3
Figure 2.1.7 - Averaged H/Href spectral ratios ± one standard deviation of local events for the stations belonging to the second-stage network (transect perpendicular to the valley axes).
Figure 2.1.8 - Averaged H/Href spectral ratios ± one standard deviation of regional events for the stations belonging to the second-stage network (transect perpendicular to the valley axes).
Task 6 - Deliverables D22-D23 12

Progetti sismologici di interesse per il DPC Progetto S3
2.2 GFZ TRANSECT 2.2.1 INSTRUMENT From the beginning of June 2005 until middle of December 2005 a linear array of 10 stations was installed in the basin in the N-S direction (Figure 2.1.1 and Fig 2.2.1). Between June and middle of September, Reftek acquisition systems equipped with Mark L-4C-3D 1Hz sensors and GPS timing were used. From middle of September 2005 the acquisition systems were substituted with EarthDataLoggers. Stations were set to continuous recording and the sampling rate was fixed to 100 s.p.s. Station GU00 was installed outside of the basin on rock outcrop, and is considered the reference station in the following analysis. The coordinates of the stations are shown in Table2.2.1.
Figure 2.2.1 – GFZ stations
Table 2.2.1 Station ID Location Longitude Latitude Altitude GU00 Madonna del Sasso 12.60381° 43.35117° 600 GU01 Cimitero 12.59634° 43.34373° 540 GU02 Casa Piergentili 12.59618° 43.33964° 540 GU03 Casa Ragnacci 12.59299° 43.33510° 520 GU04 Casa Martella 12.59132° 43.33292° 500 GU05 Casa Monia 12.59134° 43.32857° 480 GU07 Casa Capponi 12.59008° 43.32154° 460 GU08 Casa Merli 12.58741° 43.31717° 460 GU09 Casa Maddalena 12.58867° 43.30530° 430 GU10 Agriturismo 12.58604° 43.29359° 540
From October to December, the GFZ transect worked simultaneously with the one installed by UR-INGV-Roma1 along the main axes of the basin. The latter is described in paragraph 2.3.
Task 6 - Deliverables D22-D23
13

Progetti sismologici di interesse per il DPC Progetto S3
2.2.2 DATA SET Local earthquakes have been extracted using the INGV bulletin (http://www.ingv.it/~roma/reti/rms/bollettino/index.php) as a reference and considering a maximum epicentral distance from the linear array of 300 km. A pre-event time of 50 seconds before the origin time was considered for the beginning of the extracted window. The signal window length was chosen taking into account the magnitude of the selected event. After visual inspection of the data set, a further selection was carried out eliminating seismograms with low signal-to-noise ratio. The final data base is composed by 134 local earthquakes in the magnitude range 0.8<M<4.7 (Figure 2.2.2). Regional and teleseismic events have been extracted from continuos recordings using the NEIC bulletin (http://neic.usgs.gov/neis/epic/). In this case, a pre-event time of 60 seconds before the origin time was considered and a window of 1 hour of signal selected. Only earthquakes with epicentral distances between 300km and 3000km and magnitude greater than 4.5 have been considered for the selection of regional events. Only earthquakes with epicentral distance greater than 3000km and magnitude larger than 6 have been considered for the creation of the teleseismic event data base. Due to the high level of cultural noise affecting the Gubbio basin both during day and night, a selection of the data set based on signal-to-noise ratio criteria, as well as, the rejection of close low-magnitude events due to their short duration, lead to a final data set of few regional and teleseismic earthquakes. Stations recorded altogether 23 regional and 34 teleseismic events (Figure 2.2.3 and 2.2.4).
Figure 2.2.2. Map showing epicenter of local events recorded by GFZ transect
Task 6 - Deliverables D22-D23 14

Progetti sismologici di interesse per il DPC Progetto S3
Figure 2.2.3. Map showing epicenter of regional events recorded by GFZ transect
Figure 2.2.4. Map showing epicenter of teleseismic events recorded by GFZ transect 2.2.3 ANALYSIS For each station, the H/V ratio was computed considering both a windows of 30 s, starting about 1 s before the S-wave arrivals, and a window of 20 s selected in pre-event noise window. The standard spectral ratio technique was also applied for estimating the relative transfer function between each station and station GU00. The Fourier spectra were smoothed using the Konno-Ohmachi window (b=20). The empirical transfer functions are shown in Figure 2.2.5. The H/V computed considering the S wave and the pre-event noise windows are in good agreement: stations installed in the basin (GU03, GU04, GU05, GU07, GU08, and GU09) show a peak of amplification between 0.2 and 0.6 Hz, with a maximum average amplification of 7 at station GU07; station GU00 is free from significant local site amplification, while station GU10 shows weak amplifications at frequencies greater than 2 Hz; finally, no remarkable site amplifications are detected for stations GU01 and GU02. For stations installed in the basin, the SSR ratios show complex amplification patterns with amplifications over a wide frequency range, from about the frequencies of H/V peak of amplification up to 8 Hz.
Task 6 - Deliverables D22-D23
15

Progetti sismologici di interesse per il DPC Progetto S3
GU00
GU01
GU02
GU03
GU04
GU05
Task 6 - Deliverables D22-D23 16

Progetti sismologici di interesse per il DPC Progetto S3
GU07
GU08
GU09
GU10
Figure 2.2.5 - Averaged H/Href (right), H/V from earthquake (middle) and H/V from noise (left) spectral ratios ± one standard deviation of local events for the stations belonging to GFZ transect (transect perpebndicular to the valley axes). In each box the record number used in the analysis is reported. 2.3 INGV STATIONS (Transect and array2D) 2.3.1 INSTRUMENT Since the end of October 2005, INGV set up a transect of ten seismological stations along the main axis of the Gubbio basin, in NW-SE direction (Figure 2.3.1). All stations (EU01, EU02,…, EU10) were equipped with Lennartz Marslite high-dynamic digitizers, Lennartz 5-second sensors and GPS timing, using a sampling rate of 125 sps in continuos recording configuration. Public and private properties have been kindly granted to safely accommodate stations. Table 2.3.1 summarizes the coordinates of stations. In order to compare different instrumentation, station EU10 was installed in the same site of station GU07 of the GFZ transect. After the dismissal of this transect (middle December), station EU10 was moved to the reference site, previously occupied by station GU00, and renamed EU00. Moreover, the old location of GU07 and EU10 was
Task 6 - Deliverables D22-D23
17
Progetti sismologici di interesse per il DPC Progetto S3
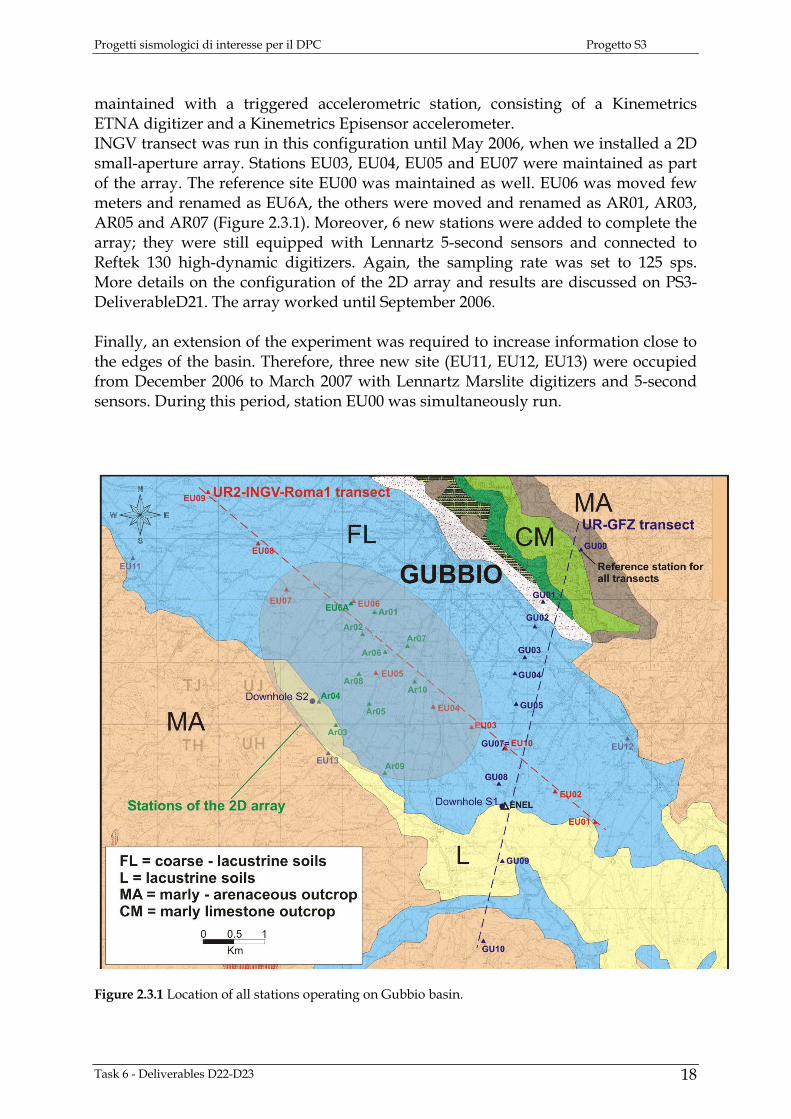
maintained with a triggered accelerometric station, consisting of a Kinemetrics ETNA digitizer and a Kinemetrics Episensor accelerometer. INGV transect was run in this configuration until May 2006, when we installed a 2D small-aperture array. Stations EU03, EU04, EU05 and EU07 were maintained as part of the array. The reference site EU00 was maintained as well. EU06 was moved few meters and renamed as EU6A, the others were moved and renamed as AR01, AR03, AR05 and AR07 (Figure 2.3.1). Moreover, 6 new stations were added to complete the array; they were still equipped with Lennartz 5-second sensors and connected to Reftek 130 high-dynamic digitizers. Again, the sampling rate was set to 125 sps. More details on the configuration of the 2D array and results are discussed on PS3-DeliverableD21. The array worked until September 2006. Finally, an extension of the experiment was required to increase information close to the edges of the basin. Therefore, three new site (EU11, EU12, EU13) were occupied from December 2006 to March 2007 with Lennartz Marslite digitizers and 5-second sensors. During this period, station EU00 was simultaneously run.
Figure 2.3.1 Location of all stations operating on Gubbio basin.
Task 6 - Deliverables D22-D23 18

Progetti sismologici di interesse per il DPC Progetto S3
Table 2.3.1 Station ID Location Longitude Latitude EU00 Church ‐ Madonna del Sasso 12.60381° 43.35117° EU01 Factory – Umbrinox 12.60381° 43.31167° EU02 Berettoni’s home 12.59657° 43.31586° EU03 Zampagli’s home 12.58274° 43.32521° EU04 Cipolleto school 12.57507° 43.32790° EU05 Ferranti’s home 12.56386° 43.33338° EU06 Menichetti’s home 12.55909° 43.34374° EU6A Procacci’s home 12.55860° 43.34326° EU07 Paciotti’s home 12.54809° 43.34433° EU08 Monacelli’s home 12.53865° 43.35058° EU09 Bellucci’s home 12.52866° 43.35831° EU10 Capponi’s home 12.58964° 43.32131 ° AR01 Angeletti’s home 12.56243° 43.34166° AR02 Municipal slaughterhouse 12.55997° 43.33801° AR03 Municipal kennels 12.55658° 43.32581° AR04 Regional plants nursery 12.55280° 43.32790° AR05 Church ‐ S.Agostino 12.56181° 43.32756° AR06 Casagrande’s home 12.56867° 43.33494° AR07 Paffi’s home 12.56970° 43.33643° AR08 Urbani’s home 12.55974° 43.33287° AR09 Ortoguidone camping 12.56819° 43.32163° AR10 Tasso’s home 12.57106° 43.33181° EU11 Barboni’s home 12.61380° 43.32364° EU12 Miti’s home 12.51476° 43.34763° EU13 Uccellani’s home 12.55375° 43.32048°
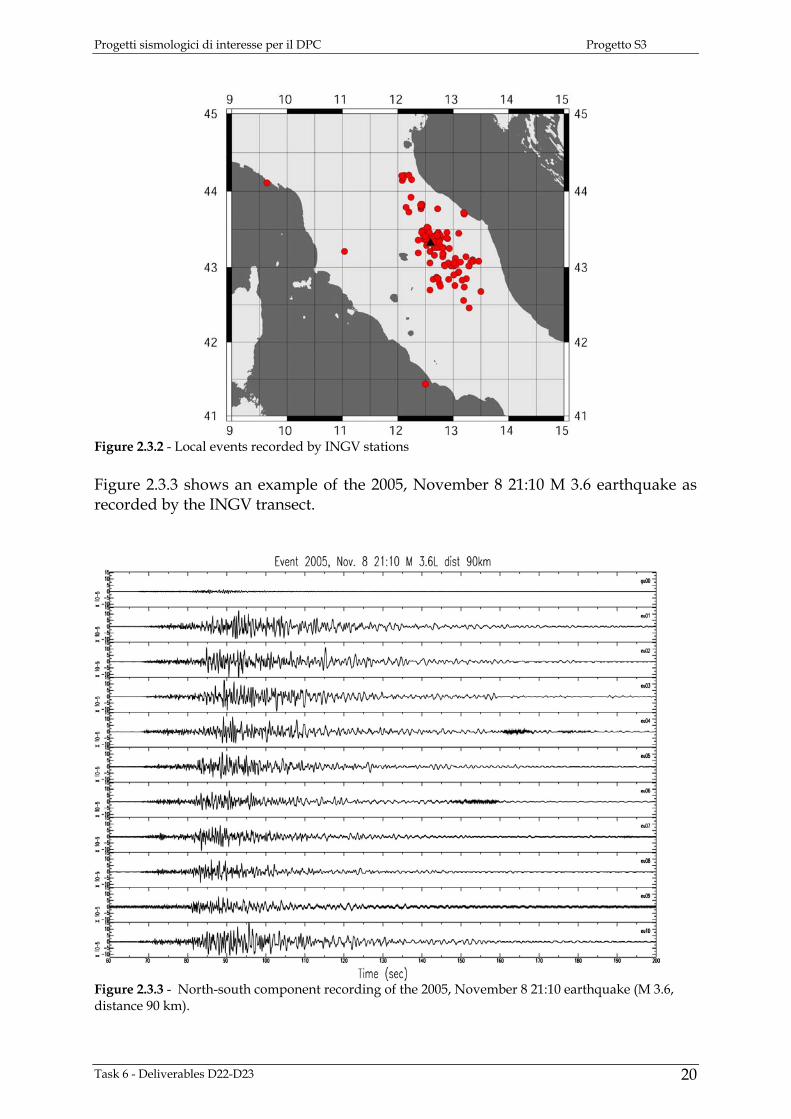
2.3.2 DATA SET Local earthquakes were extracted using the INGV bulletin (http://www.ingv.it/~roma/reti/rms/bollettino/index.php) giving an upper limit of distance at 300km, a pre-event time of 50 seconds and a duration related to the magnitude of the event. Stations recorded 302 local earthquakes (epicentral distance less than 300km) in the magnitude range 0.8<M<4.5 (Figure 2.3.2.1). Most of these events are relative to Umbria-Marche seismicity and in particular 16% of them are localized in the Gubbio faults. The distribution of the events during the three phases of the experiment is: 178 events recorded by the transect, 80 events by the 2D-array and 44 by the last three stations close to the NW and SE edges.
Task 6 - Deliverables D22-D23
19
Progetti sismologici di interesse per il DPC Progetto S3
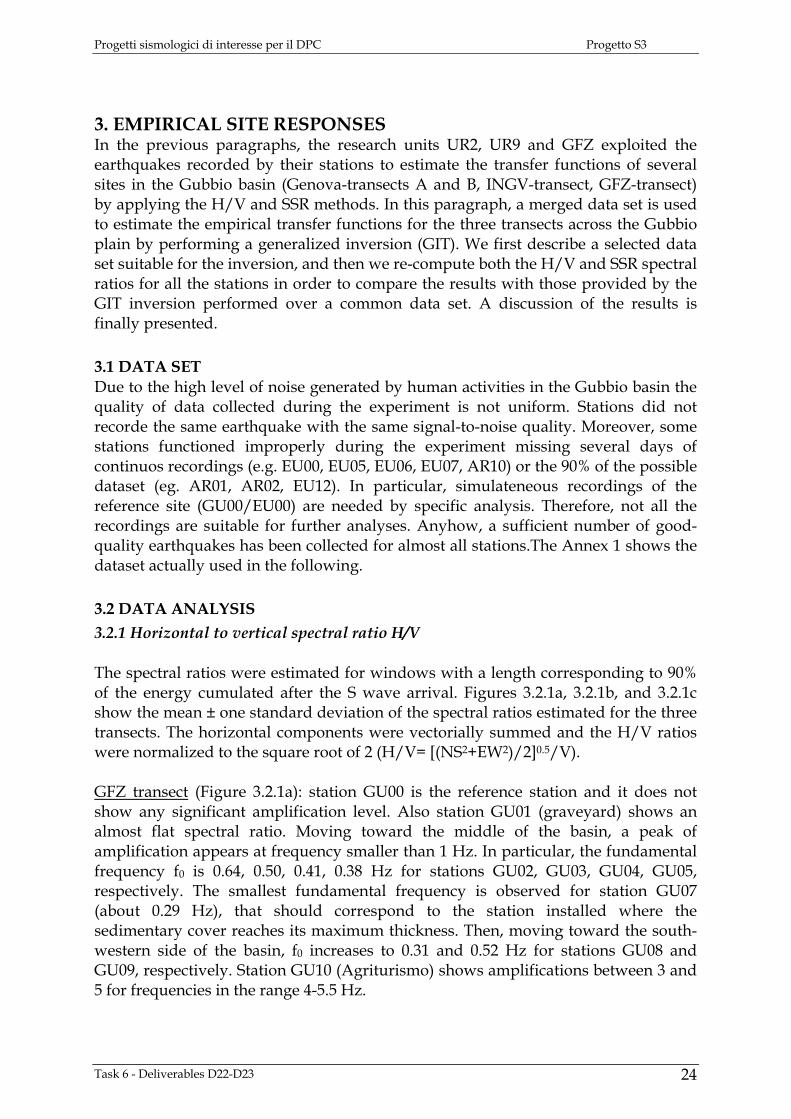
Figure 2.3.2 - Local events recorded by INGV stations Figure 2.3.3 shows an example of the 2005, November 8 21:10 M 3.6 earthquake as recorded by the INGV transect.
Figure 2.3.3 - North-south component recording of the 2005, November 8 21:10 earthquake (M 3.6, distance 90 km).
Task 6 - Deliverables D22-D23 20

Progetti sismologici di interesse per il DPC Progetto S3
Note the higher level of amplification for stations in the middle of the basin compared with the reference station GU00. Differences of signal within stations of the transect are clearly recognizable too, suggesting different thickness or/and velocity contrasts variations along the basin. In particular, the SE part of the basin shows the largest amplification if compared with the NW part. The generation of scattered surface waves that increase the duration of the earthquake is also evident. Looking at the sonograms of the vertical components (Figure 2.3.4), we note that the amplification affects these components too, especially in the 0.2-2 Hz frequency band. This explains the large differences observed between horizontal-to-vertical spectral ratios and horizontal site-to-reference spectral ratios.
Figure 2.3.4 - Position of the stations belonging to the INGV transects and the recorded vertical seismograms (event: 2005, 8th of November 21:10, Ml=3.6, distance 90 km). Seismograms are filtered in the 0.1-25 Hz frequency band. Regional (Figure 2.3.5) and teleseismic (Figure 2.3.6) events have been extracted from continuos recordings using the NEIC bulletin (http://neic.usgs.gov/neis/epic/)
Task 6 - Deliverables D22-D23
21

Progetti sismologici di interesse per il DPC Progetto S3
giving a pre-event time of 60 seconds and cutting 1 hour of signal. Distance between 300km and 3000km and magnitude greater than 4.5 has been considered for regional events, distance greater than 3000km and magnitude greater than 6 for teleseismic events. A dataset of 31 regional and 33 teleseismic events has been collected.
Figure 2.3.5 - Regional events recorded by INGV stations
Figure 2.3.6 - Teleseismic events recorded by INGV stations 2.3.3 ANALYSIS For each station, we computed the H/V ratio considering the most energetic part of the signal, starting about 1 s before the S-wave arrivals. Moreover, the H/V ratio on noise was computed using the continuos recording of the stations (60-sec windows). The standard spectral ratio technique was also applied for estimating the relative transfer function between each station and station GU00. The Fourier spectra were smoothed using the Konno-Ohmachi window (b=40). The empirical transfer functions are shown in Figure 2.3.7.
Task 6 - Deliverables D22-D23 22

Progetti sismologici di interesse per il DPC Progetto S3
The H/V computed considering the S wave and the noise windows are in good agreement: the stations, installed in the middle of the basin along the north-west to south-east axis, show a peak of amplification between 0.2 and 0.5 Hz, with mean amplifications up to 10 (station EU10). In agreement with the results obtained for the GFZ transect, the SSR ratios show amplifications over a wide frequency band for all the stations but EU00 (Madonna del Sasso).
Figure 2.3.7 - Averaged H/Href (right), H/V from earthquake (middle) and H/V from noise (left) spectral ratios ± one standard deviation of local events for some stations belonging to INGV transect (transect perpendicular to the valley axes). In each box the record number used is reported.
EU04
EU03
EU10
EU02
EU01
Task 6 - Deliverables D22-D23
23
Progetti sismologici di interesse per il DPC Progetto S3
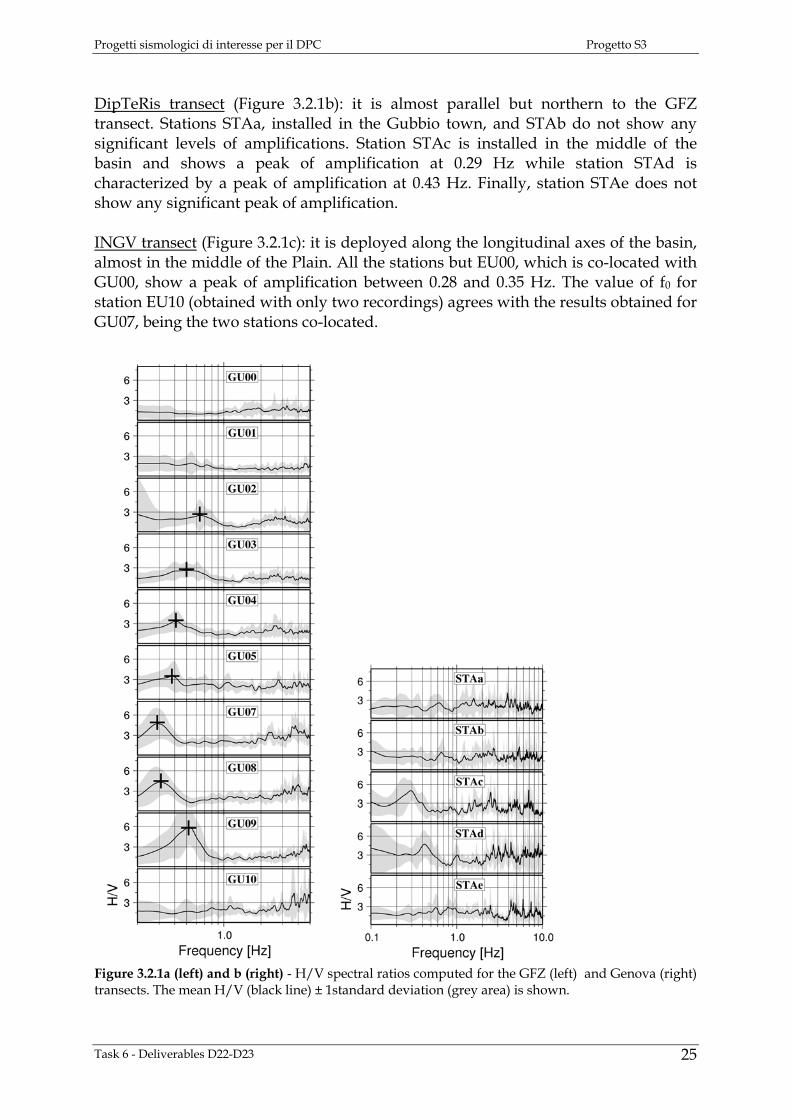
3. EMPIRICAL SITE RESPONSES In the previous paragraphs, the research units UR2, UR9 and GFZ exploited the earthquakes recorded by their stations to estimate the transfer functions of several sites in the Gubbio basin (Genova-transects A and B, INGV-transect, GFZ-transect) by applying the H/V and SSR methods. In this paragraph, a merged data set is used to estimate the empirical transfer functions for the three transects across the Gubbio plain by performing a generalized inversion (GIT). We first describe a selected data set suitable for the inversion, and then we re-compute both the H/V and SSR spectral ratios for all the stations in order to compare the results with those provided by the GIT inversion performed over a common data set. A discussion of the results is finally presented. 3.1 DATA SET Due to the high level of noise generated by human activities in the Gubbio basin the quality of data collected during the experiment is not uniform. Stations did not recorde the same earthquake with the same signal-to-noise quality. Moreover, some stations functioned improperly during the experiment missing several days of continuos recordings (e.g. EU00, EU05, EU06, EU07, AR10) or the 90% of the possible dataset (eg. AR01, AR02, EU12). In particular, simulateneous recordings of the reference site (GU00/EU00) are needed by specific analysis. Therefore, not all the recordings are suitable for further analyses. Anyhow, a sufficient number of good-quality earthquakes has been collected for almost all stations.The Annex 1 shows the dataset actually used in the following. 3.2 DATA ANALYSIS 3.2.1 Horizontal to vertical spectral ratio H/V The spectral ratios were estimated for windows with a length corresponding to 90% of the energy cumulated after the S wave arrival. Figures 3.2.1a, 3.2.1b, and 3.2.1c show the mean ± one standard deviation of the spectral ratios estimated for the three transects. The horizontal components were vectorially summed and the H/V ratios were normalized to the square root of 2 (H/V= [(NS2+EW2)/2]0.5/V). GFZ transect (Figure 3.2.1a): station GU00 is the reference station and it does not show any significant amplification level. Also station GU01 (graveyard) shows an almost flat spectral ratio. Moving toward the middle of the basin, a peak of amplification appears at frequency smaller than 1 Hz. In particular, the fundamental frequency f0 is 0.64, 0.50, 0.41, 0.38 Hz for stations GU02, GU03, GU04, GU05, respectively. The smallest fundamental frequency is observed for station GU07 (about 0.29 Hz), that should correspond to the station installed where the sedimentary cover reaches its maximum thickness. Then, moving toward the south-western side of the basin, f0 increases to 0.31 and 0.52 Hz for stations GU08 and GU09, respectively. Station GU10 (Agriturismo) shows amplifications between 3 and 5 for frequencies in the range 4-5.5 Hz.
Task 6 - Deliverables D22-D23 24
Progetti sismologici di interesse per il DPC Progetto S3
DipTeRis transect (Figure 3.2.1b): it is almost parallel but northern to the GFZ transect. Stations STAa, installed in the Gubbio town, and STAb do not show any significant levels of amplifications. Station STAc is installed in the middle of the basin and shows a peak of amplification at 0.29 Hz while station STAd is characterized by a peak of amplification at 0.43 Hz. Finally, station STAe does not show any significant peak of amplification. INGV transect (Figure 3.2.1c): it is deployed along the longitudinal axes of the basin, almost in the middle of the Plain. All the stations but EU00, which is co-located with GU00, show a peak of amplification between 0.28 and 0.35 Hz. The value of f0 for station EU10 (obtained with only two recordings) agrees with the results obtained for GU07, being the two stations co-located.
Figure 3.2.1a (left) and b (right) - H/V spectral ratios computed for the GFZ (left) and Genova (right) transects. The mean H/V (black line) ± 1standard deviation (grey area) is shown.
Task 6 - Deliverables D22-D23
25

Progetti sismologici di interesse per il DPC Progetto S3
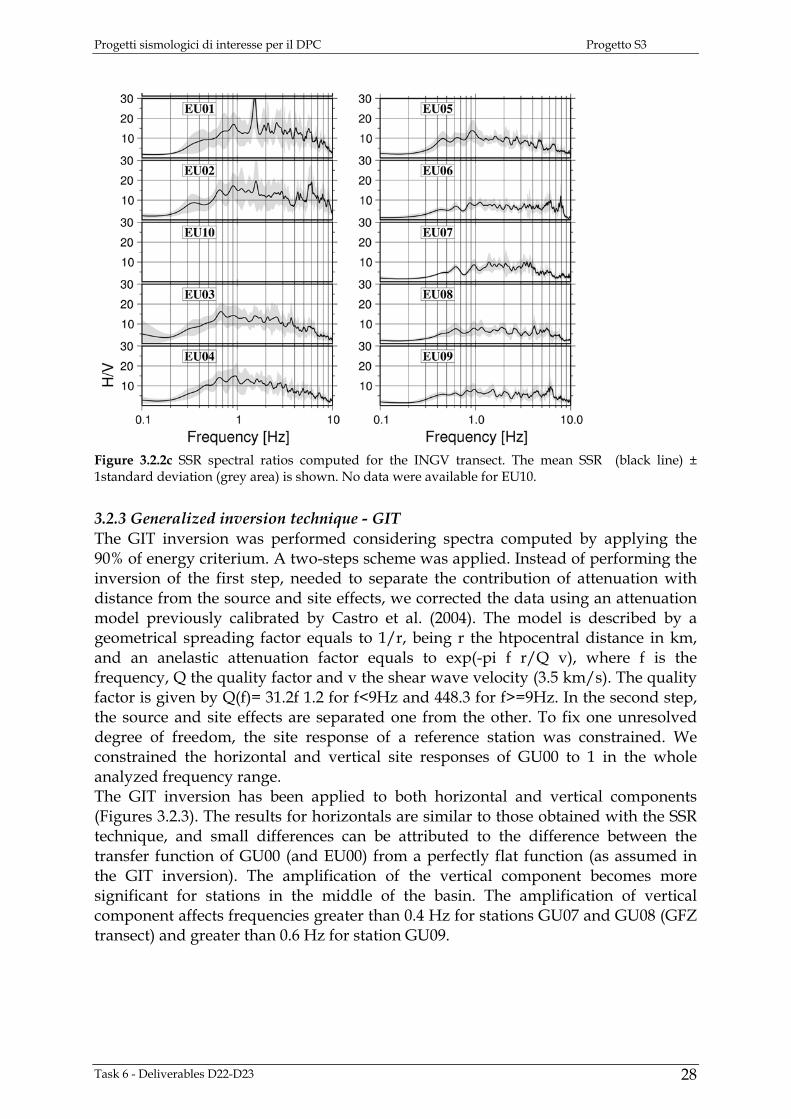
Figure 3.2.1 - c H/V spectral ratios computed for the INGV transect. The mean H/V (black line) ± 1standard deviation (grey area) is shown. For EU10, the only two available ratios are shown. 3.2.2. The standard spectral ratio SSR The standard spectral ratio method was applied considering spectra computed for time windows with a fixed length of 30 s. Figures 3.2.2a, 3.2.2b, and 3.2.2c show the obtained mean ± 1 standard deviation. Figure 3.2.2a shows the SSRs computed for the GFZ transect. The cross symbols indicate the peak of amplification of the H/V ratios computed for each station (Figure 3.2.1a). The stations installed in the basin show site responses very different from the H/V. In particular, amplifications from 5 to 20 over a wide frequency band, froma bout 0.2-0.3 Hz up to 3-4 Hz are shown . Figure 3.2.2b shows the SSR for the DipTeRis transect. Stations STAa and STAb are not affected by significant amplifications, whereas stations STAc and STAd shows remarkable amplifications greater in amplitude and affecting a wider frequency range than those estimated from the H/V. The SSRs for the INGV transect is shown in Figure 3.2.2c. Since all the stations (but EU00) are installed in the basin, all site responses show large amplification.
Task 6 - Deliverables D22-D23 26

Progetti sismologici di interesse per il DPC Progetto S3
Figure 3.2.2a (left) and b (right). SSR spectral ratios computed for the GFZ (left) and Genova (right) transects. The mean SSR (black line) ± 1standard deviation (grey area) is shown.
Task 6 - Deliverables D22-D23
27
Progetti sismologici di interesse per il DPC Progetto S3
Figure 3.2.2c SSR spectral ratios computed for the INGV transect. The mean SSR (black line) ± 1standard deviation (grey area) is shown. No data were available for EU10. 3.2.3 Generalized inversion technique - GIT The GIT inversion was performed considering spectra computed by applying the 90% of energy criterium. A two-steps scheme was applied. Instead of performing the inversion of the first step, needed to separate the contribution of attenuation with distance from the source and site effects, we corrected the data using an attenuation model previously calibrated by Castro et al. (2004). The model is described by a geometrical spreading factor equals to 1/r, being r the htpocentral distance in km, and an anelastic attenuation factor equals to exp(-pi f r/Q v), where f is the frequency, Q the quality factor and v the shear wave velocity (3.5 km/s). The quality factor is given by Q(f)= 31.2f 1.2 for f<9Hz and 448.3 for f>=9Hz. In the second step, the source and site effects are separated one from the other. To fix one unresolved degree of freedom, the site response of a reference station was constrained. We constrained the horizontal and vertical site responses of GU00 to 1 in the whole analyzed frequency range. The GIT inversion has been applied to both horizontal and vertical components (Figures 3.2.3). The results for horizontals are similar to those obtained with the SSR technique, and small differences can be attributed to the difference between the transfer function of GU00 (and EU00) from a perfectly flat function (as assumed in the GIT inversion). The amplification of the vertical component becomes more significant for stations in the middle of the basin. The amplification of vertical component affects frequencies greater than 0.4 Hz for stations GU07 and GU08 (GFZ transect) and greater than 0.6 Hz for station GU09.
Task 6 - Deliverables D22-D23 28
Progetti sismologici di interesse per il DPC Progetto S3
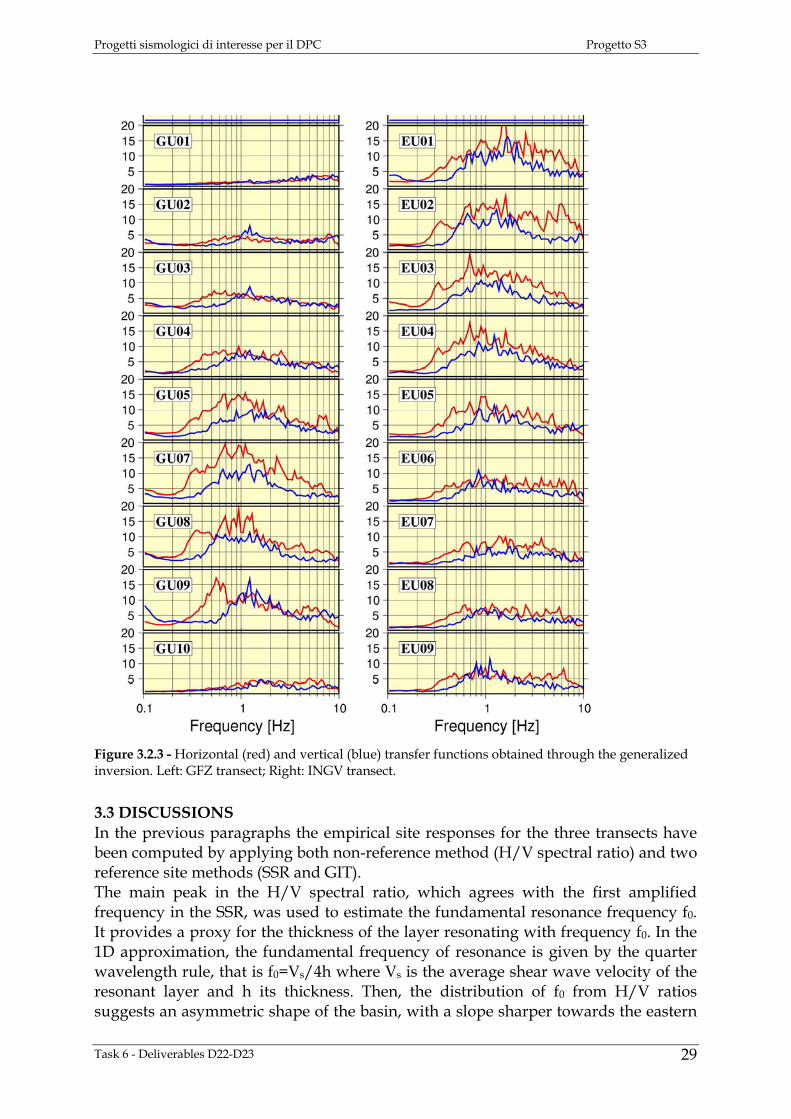
Figure 3.2.3 - Horizontal (red) and vertical (blue) transfer functions obtained through the generalized inversion. Left: GFZ transect; Right: INGV transect. 3.3 DISCUSSIONS In the previous paragraphs the empirical site responses for the three transects have been computed by applying both non-reference method (H/V spectral ratio) and two reference site methods (SSR and GIT). The main peak in the H/V spectral ratio, which agrees with the first amplified frequency in the SSR, was used to estimate the fundamental resonance frequency f0. It provides a proxy for the thickness of the layer resonating with frequency f0. In the 1D approximation, the fundamental frequency of resonance is given by the quarter wavelength rule, that is f0=Vs/4h where Vs is the average shear wave velocity of the resonant layer and h its thickness. Then, the distribution of f0 from H/V ratios suggests an asymmetric shape of the basin, with a slope sharper towards the eastern
Task 6 - Deliverables D22-D23
29
Progetti sismologici di interesse per il DPC Progetto S3
side of the basin, and a thickness of the soil column, considering the range of S-wave velocities estimated in 2.1 for the sedimentary cover, of some hundreds of meters in correspondence of GU07 and GU08. Differently from the H/V, the reference methods compare the spectrum of the ground motion recorded at a given site with the spectrum of the ground motion at a reference station generally installed on rock and weakly affected by local site effects. Then, these methods provide site responses that account for effects related to the finite extent of the basin (2D or 3D effects). The difference between the methods is that in the SSR method the spectra of the same earthquake recorded at both the considered site and at the reference station are compared while, in the GIT inversion, the spectra of several earthquakes recorded by a network of stations are processed altogether. The GIT and SSR horizontal site responses show amplifications from 5 to 20 over a wide frequency band, from about 0.2-0.3 Hz up to 3-4 Hz, in agreement with the spectral content of the surface waves locally generated. Figure 3.4.1 shows that also the vertical components are amplified. Since the lower bound of the frequency range corresponding to significant vertical amplification is greater than 0.4 Hz, the peak of amplification between 0.29 and 0.38 Hz provided by the H/V for the stations installed in the basin should correspond mainly to the 1D resonance. 4. AMPLIFICATION IN THE BASIN The empirical site responses derived in Chapter 3 clearly highlight the necessity of taking into account, for seismic hazard assessment in the Gubbio basin, the significant amplification of earthquake ground motion. However, since the strong amplification is not only due to the 1-D vertical propagation of seismic wave below a site, but also includes complex lateral propagation of body and surface waves, the standard approach based on knowledge of the S-wave velocity structure below a site could provide ineffective results. In fact, this could neither correctly estimate the frequency dependent amplification nor the lengthening of the earthquake ground motion. In order to attempt to take into account complicated 3D effects, at least with respect to the amplification value, we followed an empirical approach. Considering that: (1) the site response was found to vary within the basin consistently with the variation in the first peak of the horizontal-to-vertical (H/V) spectral ratio of seismic noise and (2) that the peak of the H/V spectral ratio of noise was found to be in excellent agreement with the fundamental resonance frequency peak of the earthquake site responses, we used the frequency of the H/V spectral ratio peak (which depends upon the S-wave velocity and thickness of the sedimentary cover below a site) as a parameter for linking the position within the basin with a frequency dependent amplification coefficient. Since seismic hazard is very often calculated in terms of Spectral Acceleration (SA), we decided to express the frequency dependent amplification coefficient as the ratio between the response spectra at soil sites and the response spectra at a hard-rock site. Using the recordings of about 30 local earthquakes, response spectra for the three components of ground motion were calculated for each station of the INGV and GFZ networks.
Task 6 - Deliverables D22-D23 30

Progetti sismologici di interesse per il DPC Progetto S3
The response spectra ratio was calculated for each earthquake and station using GU00 (located on hard rock) as the reference, and their geometric average was computed. Figure 4.1 shows, as an example, the results obtained for the GFZ stations crossing the basin.
Figure 4.1 - Geometric average (thin black line) ± 1 standard deviation (grey area) of the spectral ratios between the response spectra computed for stations of the GFZ transect and the corresponding response spectra computed for the reference station (GU00). The NS, EW and vertical components are shown from left to right, respectively.
Task 6 - Deliverables D22-D23
31
Progetti sismologici di interesse per il DPC Progetto S3
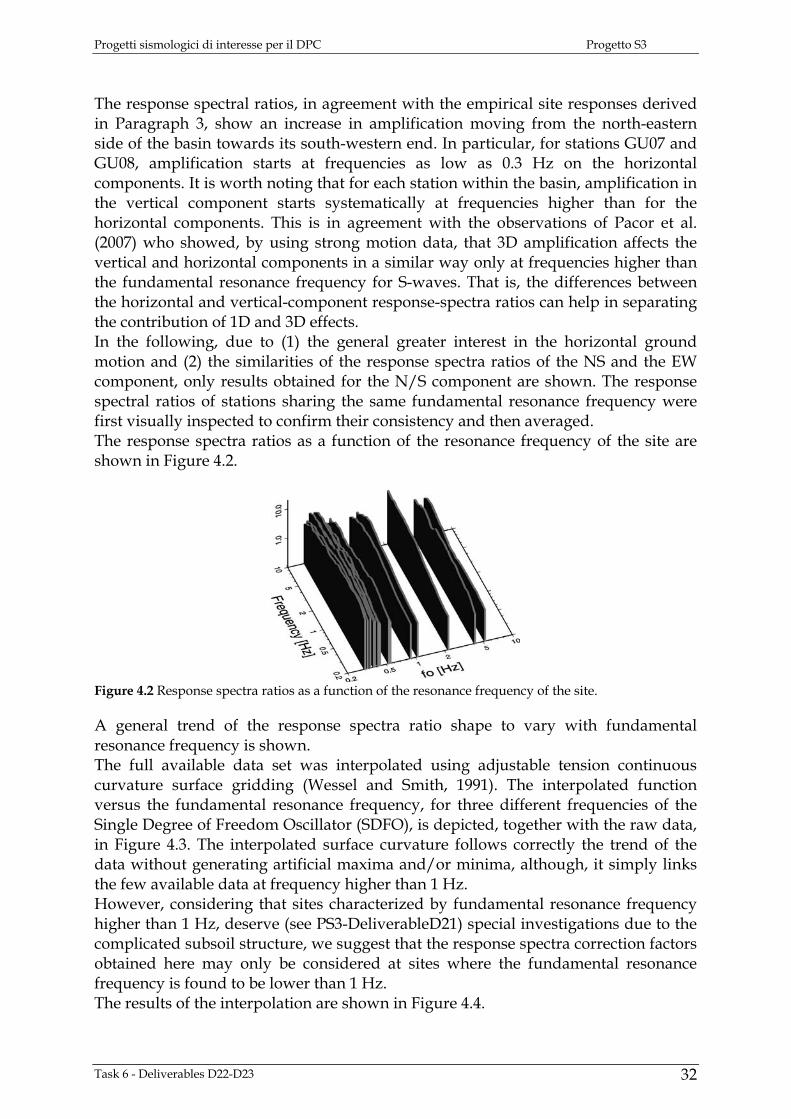
The response spectral ratios, in agreement with the empirical site responses derived in Paragraph 3, show an increase in amplification moving from the north-eastern side of the basin towards its south-western end. In particular, for stations GU07 and GU08, amplification starts at frequencies as low as 0.3 Hz on the horizontal components. It is worth noting that for each station within the basin, amplification in the vertical component starts systematically at frequencies higher than for the horizontal components. This is in agreement with the observations of Pacor et al. (2007) who showed, by using strong motion data, that 3D amplification affects the vertical and horizontal components in a similar way only at frequencies higher than the fundamental resonance frequency for S-waves. That is, the differences between the horizontal and vertical-component response-spectra ratios can help in separating the contribution of 1D and 3D effects. In the following, due to (1) the general greater interest in the horizontal ground motion and (2) the similarities of the response spectra ratios of the NS and the EW component, only results obtained for the N/S component are shown. The response spectral ratios of stations sharing the same fundamental resonance frequency were first visually inspected to confirm their consistency and then averaged. The response spectra ratios as a function of the resonance frequency of the site are shown in Figure 4.2.
Figure 4.2 Response spectra ratios as a function of the resonance frequency of the site. A general trend of the response spectra ratio shape to vary with fundamental resonance frequency is shown. The full available data set was interpolated using adjustable tension continuous curvature surface gridding (Wessel and Smith, 1991). The interpolated function versus the fundamental resonance frequency, for three different frequencies of the Single Degree of Freedom Oscillator (SDFO), is depicted, together with the raw data, in Figure 4.3. The interpolated surface curvature follows correctly the trend of the data without generating artificial maxima and/or minima, although, it simply links the few available data at frequency higher than 1 Hz. However, considering that sites characterized by fundamental resonance frequency higher than 1 Hz, deserve (see PS3-DeliverableD21) special investigations due to the complicated subsoil structure, we suggest that the response spectra correction factors obtained here may only be considered at sites where the fundamental resonance frequency is found to be lower than 1 Hz. The results of the interpolation are shown in Figure 4.4.
Task 6 - Deliverables D22-D23 32

Progetti sismologici di interesse per il DPC Progetto S3
1Hz 2 Hz 4 Hz Figure 4.3 Interpolated function (thin line) versus the fundamental resonance frequency, for three different frequencies (1, 2 and 4 Hz) of the Single Degree of Freedom Oscillator (SDFO). The raw data are shown as black points.
Figure 4.4 Interpolated amplification factors (logarithmic values) as function of the resonance frequency fo of the site (x-axis) and the frequency of the SDFO (y-axis).
In order to verify the reliability of the response spectra correction factors, we performed tests considering the recordings of two stations (STAC and STAD) installed within the basin by the University of Genoa. These tests consisted of:
1) Calculating the response spectra of each of the considered recording at the Genova stations.
2) The corresponding response spectra at the reference station were computed. 3) Each response spectrum at the reference station was corrected, generating a
“synthetic” response spectra, by considering the correction factors appropriate for the fundamental resonance frequency -estimated by H/V- of the stations installed by the University of Genova.
4) The synthetic response spectra were then compared with the observed ones.
Task 6 - Deliverables D22-D23
33
Progetti sismologici di interesse per il DPC Progetto S3
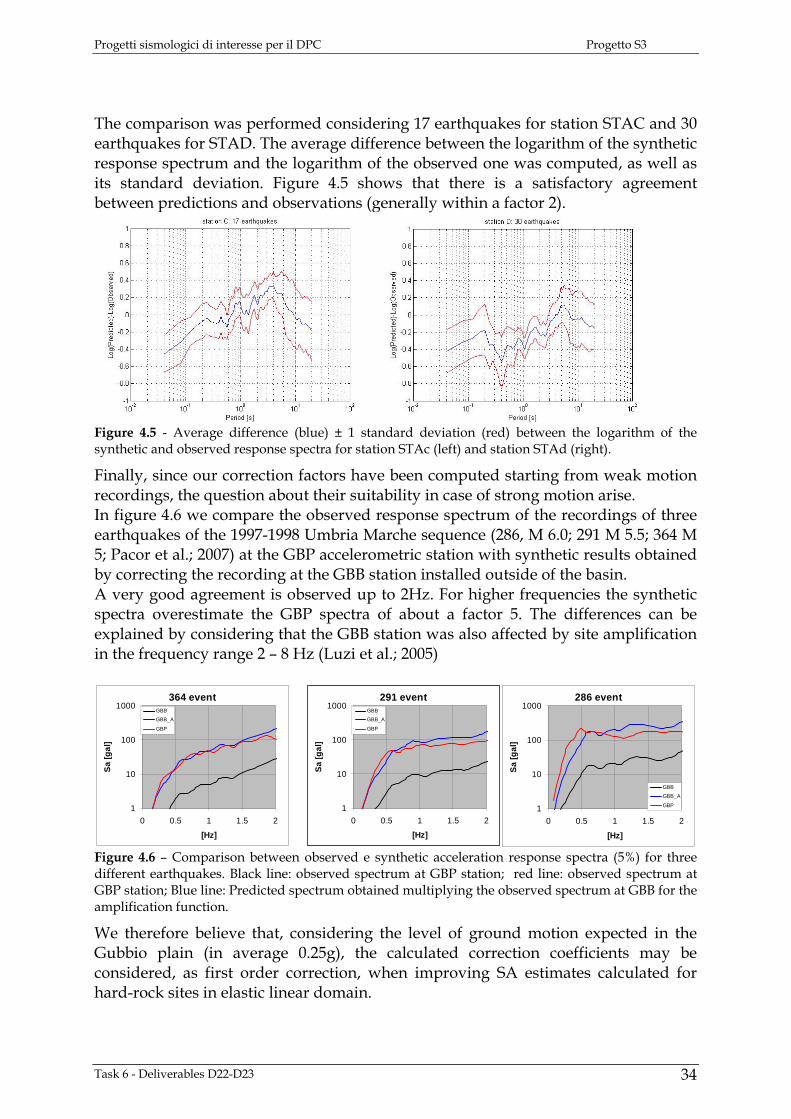
The comparison was performed considering 17 earthquakes for station STAC and 30 earthquakes for STAD. The average difference between the logarithm of the synthetic response spectrum and the logarithm of the observed one was computed, as well as its standard deviation. Figure 4.5 shows that there is a satisfactory agreement between predictions and observations (generally within a factor 2).
Figure 4.5 - Average difference (blue) ± 1 standard deviation (red) between the logarithm of the synthetic and observed response spectra for station STAc (left) and station STAd (right).
Finally, since our correction factors have been computed starting from weak motion recordings, the question about their suitability in case of strong motion arise. In figure 4.6 we compare the observed response spectrum of the recordings of three earthquakes of the 1997-1998 Umbria Marche sequence (286, M 6.0; 291 M 5.5; 364 M 5; Pacor et al.; 2007) at the GBP accelerometric station with synthetic results obtained by correcting the recording at the GBB station installed outside of the basin. A very good agreement is observed up to 2Hz. For higher frequencies the synthetic spectra overestimate the GBP spectra of about a factor 5. The differences can be explained by considering that the GBB station was also affected by site amplification in the frequency range 2 – 8 Hz (Luzi et al.; 2005)
364 event
1
10
100
1000
0 0.5 1 1.5 2
[Hz]
Sa [g
al]
GBB
GBB_A
GBP
286 event
1
10
100
1000
0 0.5 1 1.5 2
[Hz]
Sa [g
al]
GBB
GBB_A
GBP
291 event
1
10
100
1000
0 0.5 1 1.5 2
[Hz]
Sa [g
al]
GBB
GBB_A
GBP
Figure 4.6 – Comparison between observed e synthetic acceleration response spectra (5%) for three different earthquakes. Black line: observed spectrum at GBP station; red line: observed spectrum at GBP station; Blue line: Predicted spectrum obtained multiplying the observed spectrum at GBB for the amplification function.
We therefore believe that, considering the level of ground motion expected in the Gubbio plain (in average 0.25g), the calculated correction coefficients may be considered, as first order correction, when improving SA estimates calculated for hard-rock sites in elastic linear domain.
Task 6 - Deliverables D22-D23 34
Progetti sismologici di interesse per il DPC Progetto S3
5. RESONANCE FREQUENCIES OF BUILDINGS Damages expected as a consequence of future seismic events can be highly enhanced if resonance effects exits between ground shaking and buildings oscillations. Actually, in a very rough approximation, these can be considered as damped oscillators subjected to a forcing term represented by the inertial forces induced by ground shaking. In this model (e.g., Kramer, 1996), maximum damages to structures are expected when significant energy is associated to ground vibrations characterised by periods corresponding to natural vibration periods of the oscillator (building). Thus, a preliminary estimate expected damages can be performed by comparing ground motion spectra and natural frequencies of buildings exposed to the earthquake. In principle, natural vibration properties of modern buildings can be obtained theoretically by an accurate dynamic modelling of its structural properties deduced by the original project. This task, however, requires numerical and analytical efforts proportional to the structural complexity of the considered constructions. Furthermore, many aspects (e.g., dynamic response of brick walls, etc.) can be only approximately modelised. These problems become increasingly troublesome when old existing buildings are considered. In these cases in fact, detailed information on structural and building materials properties is generally lacking. Furthermore aging effects and subsequent modifications cannot be easily accounted for. In these cases, direct experimental estimates are mandatory. Actually, these kind of measurements are of general utility since, also in better constrained cases, an experimental ex-post validation of numerical modelling is of great utility. A possible tool to perform this task is the monitoring of building response to environmental noise (see, e.g., the NATO SfP Project 980857 on the web site http://nato.gfz.hr/). The basic idea underlying this approach is that the ratio of the average spectral amplitude of horizontal motion registered at the top of the building and that registered at the ground level outside of the building only depends on the vibration properties of the structure. These ratios are expected to exhibit a maximum in correspondence of natural vibration frequencies of the building. The basic limitation of this approach is related to the very low level of the considered load that dose not allow to evaluate the non-linear response of the structures under strong seismic load. In this sense, the natural frequencies measured in this way underestimate systematically those exhibited in the case strong seismic motions. Anyway these represent the dynamic response of the structure at the beginning of the seismic loading when the damages begin to develop. In order to evaluate the feasibility of this approach it has been tentatively applied to six buildings located in the study area. The considered structures have been selected in agreement with local Authorities. Four of them are schools (Primary school “Moro”, Secondary schools “Gattapone” and “Cassata” and “Mazzantini”) all located in the plain in the immediate neighbourhoods of the City centre. Two are civil constructions respectively representative of new (early ’60) and old (before II World War) constructions: the first one is located near the scholastic structures cited above while the second is located in the countryside in middle of the alluvial plain. In each building, several noise measurements have been performed by using the
Task 6 - Deliverables D22-D23
35
Progetti sismologici di interesse per il DPC Progetto S3
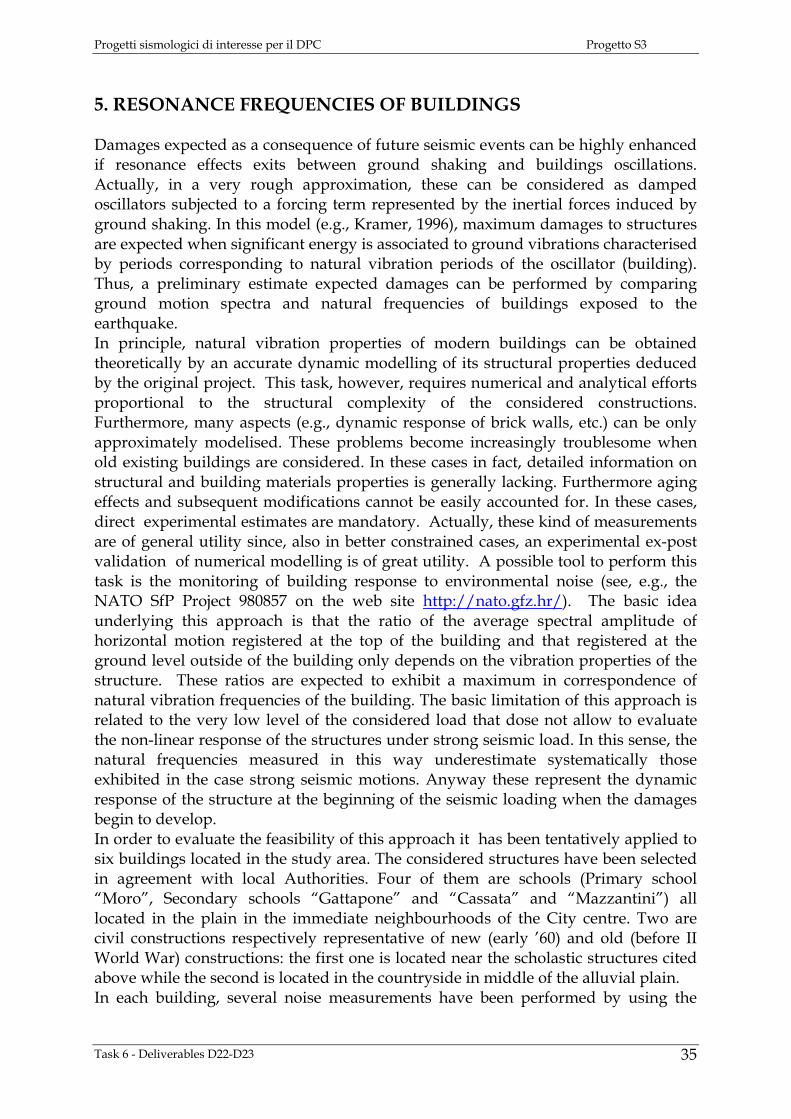
“Tromino” digital tromometer (www.tromino.com). Each noise measurement had a duration of 10 minutes. The average spectra have been computed relative to three perpendicular directions (vertical and along the principal directions of the structure) by using the procedure described in Picozzi et al., 2006. The Figure 5.1 shows the results obtained at the primary school “Moro”, a two storey RC L-shaped building built after the II World War and recently restored after significant damages produced by a recent earthquake. The structure is rather complex being constituted by three elements characterised by slightly different rigidities. This feature is revealed by the slight difference in the natural resonance frequencies obtained at the different positions. The fundamental ones range between 5 and 6 Hz with minor differences between the two components of the motion. A singnificant difference exists instead between the amplitude of “E-W” and “N-S” maxima of the spectral ratios. This suggests the presence of a significant structural directional heterogeneity in the seismic response of the structure. A further consideration concerns the presence of other maxima in the spectral ratios at frequency larger than the fundamental ones that could correspond to upper vibrational modes. As concerns these vibrational modes, significant differences exist between the possible resonance frequencies along the two main directions of the structure.
Figure 5.1 – Results of noise measurements carried on at the “A.Moro” primary school. N and E respectively indicate the main axes of the building and also represents the directions along which the noise has been measured. Arrows indicate the locations of the measuring points on the first floor of the building. The Plots, represent the ratios of the average spectral amplitudes at the site of measurement and the one obtained for the corresponding direction (upper portion “N”, lower portion
Task 6 - Deliverables D22-D23 36

Progetti sismologici di interesse per il DPC Progetto S3
“E”) at the ground floor. The Figure 5.2 shows the results obtained at the High School “Mazzantini”, a three storey (ground and two upraised storeys) RC structure of an apparently simple elongated geometry. However, the building is located in contact (along its longer side) with a larger 2 storey structure (ground floor and one upraised storey) and this makes less simple the evaluation of the expected resonance frequency. Measurements have been performed at the second floor and this also explain the larger amplitudes (about three times) of the spectral ratios with respect to those obtained at the “Moro” School. Resonance frequencies are 5-6 Hz along both the principal directions of the structure.
Figure 5.2 – Results of noise measurements carried on at the “Mazzantini” High school (see caption figure 5.1). The third building considered is the “Gattapone” High School. This is a complex 2 storey (ground and 1 upraised story) modern structure. As shown in figure 5.3, measurements carried on upraised story indicate a sharp peak of the spectral ratio curve in correspondence of frequency 7-8 Hz. This implies that resonance properties of this building are different from those obtained in the previous cases. Ratios amplitudes are larger than those measured at the “Moro” school, despite of the fact that both the buildings have the same number of storeys. These differences probably
Task 6 - Deliverables D22-D23
37

Progetti sismologici di interesse per il DPC Progetto S3
reflect significant structural variations between the considered buildings.
Figure 5.3 – Results of noise measurements carried on at the “Gattapone” High school (see caption figure 5.1). The fourth considered public building is the “Cassata” High school. This is a rather RC complex structure, characterised by the arrangement of a number of different buindings variably connected one to each other. The most interesting feature enlightened by the noise measurements are the strong difference between the natural resonance frequencies obtained along the two principal directions of the structure (7 vs. 8-10). In this case, the amplitudes of the spectral ratios appear relatively low. Natural vibration frequencies of a typical modern (about ’70) RC apartment house (ground plus two upraised storeys) have been also measured. The building is characterised by an elongated structure (the ratio between the two horizontal dimensions is more than 1:5). This strong asymmetry is well evidenced by the spectral ratios obtained along the two principal directions of the structure (Fig. 5.4): 7 Hz along the direction of maximum length vs. 9 Hz along the perpendicular direction. At least one upper vibrational mode is well visible in the direction of maximum length. In both the directions the peaks are very sharp and large. These features appear strongly different from those obtained by measuring vibrational characteristics of an old (before II World war) apartment house in the countryside. The three storeys structure (two upraised storeys) has been built by using different materials (bricks, stones, RC) in a very regular shape.
Task 6 - Deliverables D22-D23 38

Progetti sismologici di interesse per il DPC Progetto S3
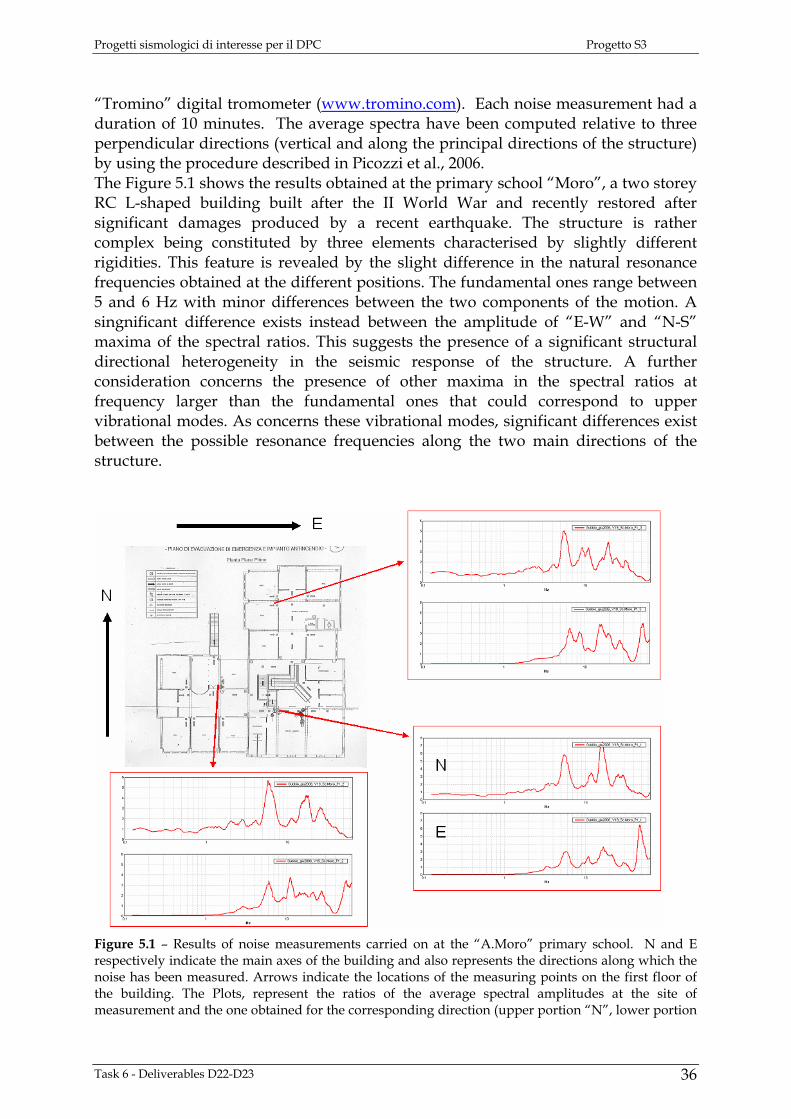
Figure 5.4 – Results of noise measurements carried on at the “Cassata” High school (see caption figure 5.1) The results obtained in this case are reported in figure 5.5. It appears evident that structural differences clearly reflects in the resonance measurements. The natural vibrational frequencies are similar (6 Hz) to those obtained for other analogous modern structures (Fig. 5.6), but the relevant amplitudes are much lower. Furthermore, differently from the sharp peaks obtained for the RC structures, spectral ratios curves show a clear broadening. The complete interpretation of the above results is beyond the scope of this very preliminary survey. Anyway, the obtained results indicate that differences in the structural properties of the considered buildings clearly reflect in the spectral ratios patterns obtained from noise measurements. This suggests that noise spectral ratios on buildings could be considered a potentially effective tool for a fast and cheap estimate of structures vulnerability useful for large scale preliminary surveys.
Task 6 - Deliverables D22-D23
39
Progetti sismologici di interesse per il DPC Progetto S3
Figure 5.5 – Results of noise measurements carried on a typical countryside old apartment house (see caption figure 5.1)
igure 5.6 – Results of noise measurements carried on a typical apartment house (see caption figure
F5.1)
Task 6 - Deliverables D22-D23 40
Progetti sismologici di interesse per il DPC Progetto S3
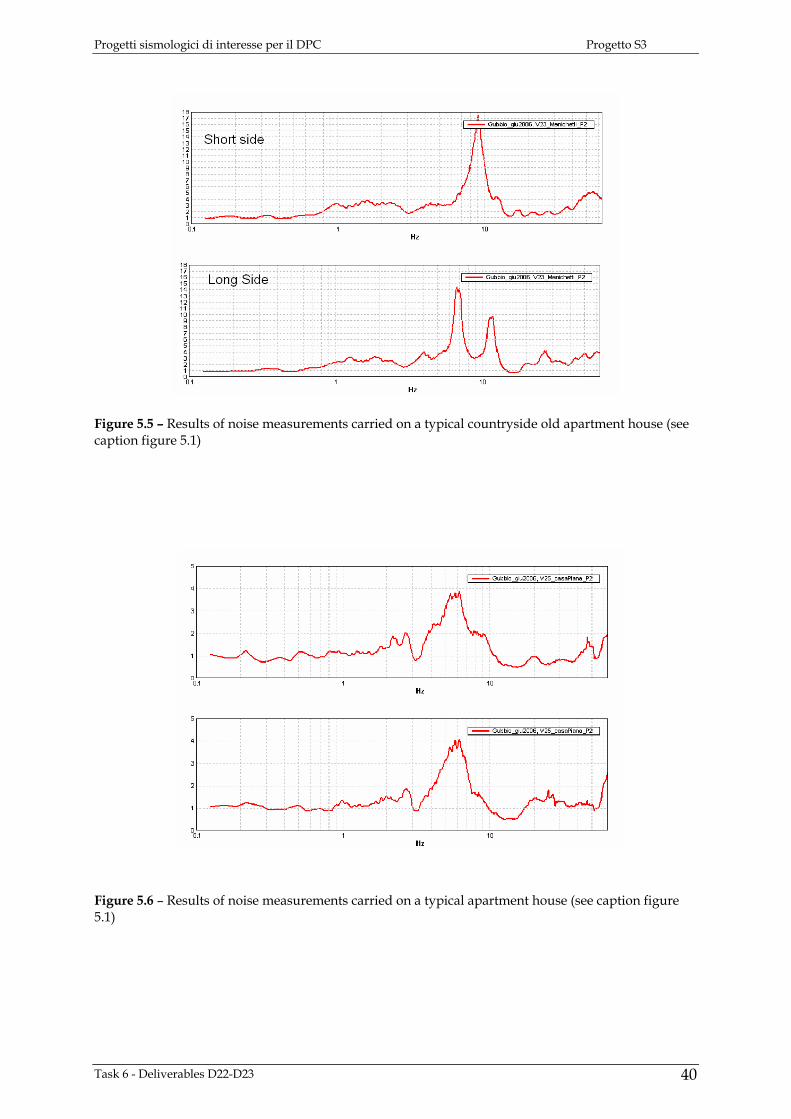
6. SHAKING SCENARIOS INCLUDING SITE EFFECTS To compute the shaking scenarios including the site effects, we adopt the amplification factors found in Chapter 4. We start from the bedrock shaking scenarios computed for the Gubbio area and described Progetto S3 – Deliverable 20. The bedrock ground motions have been estimated considering the two fault geometries for ITGG037 source and ITGG038 source (see Figure 6.1), capable og generating earthquake with M 6. The synthetic seismograms have been computed at 30 sites (Fig. 6.1). The 27 sites inside the basin correspond to the locations of some installed velocimetric stations, some points of noise measurements and of the accelerometric station GBP. The others correspond to bedrock sites, located at Gubbio town, at GU00 and at acceletometric station GBB.
Fig 6.1 –Source models and site locations for the computation of site shaking scenarios, plotted on the geological map. The red circles indicate the four sites used for selecting representative shaking scenarios. The stars correspond to nucleation point generating mean shaking scenarios in the Gubbio
Task 6 - Deliverables D22-D23
41
Progetti sismologici di interesse per il DPC Progetto S3
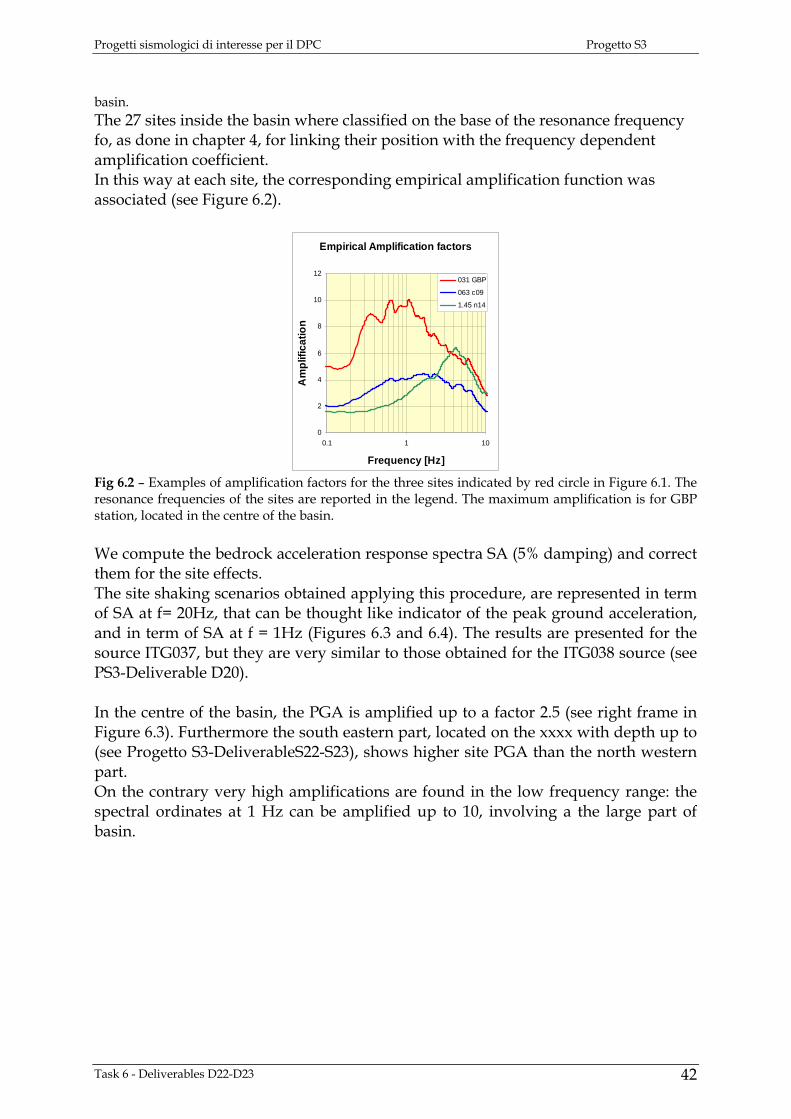
basin. The 27 sites inside the basin where classified on the base of the resonance frequency fo, as done in chapter 4, for linking their position with the frequency dependent amplification coefficient. In this way at each site, the corresponding empirical amplification function was associated (see Figure 6.2).
Empirical Amplification factors
0
2
4
6
8
10
12
0.1 1 10
Frequency [Hz]
Am
plifi
catio
n
031 GBP
063 c09
1.45 n14
Fig 6.2 – Examples of amplification factors for the three sites indicated by red circle in Figure 6.1. The resonance frequencies of the sites are reported in the legend. The maximum amplification is for GBP station, located in the centre of the basin. We compute the bedrock acceleration response spectra SA (5% damping) and correct them for the site effects. The site shaking scenarios obtained applying this procedure, are represented in term of SA at f= 20Hz, that can be thought like indicator of the peak ground acceleration, and in term of SA at f = 1Hz (Figures 6.3 and 6.4). The results are presented for the source ITG037, but they are very similar to those obtained for the ITG038 source (see PS3-Deliverable D20). In the centre of the basin, the PGA is amplified up to a factor 2.5 (see right frame in Figure 6.3). Furthermore the south eastern part, located on the xxxx with depth up to (see Progetto S3-DeliverableS22-S23), shows higher site PGA than the north western part. On the contrary very high amplifications are found in the low frequency range: the spectral ordinates at 1 Hz can be amplified up to 10, involving a the large part of basin.
Task 6 - Deliverables D22-D23 42

Progetti sismologici di interesse per il DPC Progetto S3
Fig. 6.3 – Maps of SA at 20Hz. Left - Bedrock scenarios; Centre - Site scenarios; Right Empirical amplification factor at 20 Hz
Fig. 6.4 – Maps of SA at 1Hz. Left - Bedrock scenarios; Centre - Site scenarios; Right - Empirical amplification factor at 1 Hz. 7. GEOGRAPHICAL INFORMATION SYSTEM For the Task6 – Gubbio a GIS for the DPC (Dipartimento Protezione Civile) has been produced to present the final results of the shaking scenarios and of the 3D model. All data are referenced to the projected system ED_1950_UTM_Zone 33N. The GIS project can be opened with Esri® ArcMap, but the single shapefiles and raster layers usually can be imported in other software as the ESRI format is quite common The GIS stores the ground shaking scenarios calculated at bedrock and on soft soil, the latter calculated by using the amplification function produced for the Gubbio basin. The GIS also includes the map of fundamental frequencies and the amplification map at 1HZ and 20 HZ. The original data are presented as point layers (e.g. noise measurements, pga in correspondence of the simulated sites), while interpolated values are represented as rasters in the ESRI grid format. Further the transfer functions for each station of the different transects and the layers of the 3D model are included. Project data not strictly related with the ground shaking scenarios but important for the general development of the project are included under the heading Project data.
Task 6 - Deliverables D22-D23
43
Progetti sismologici di interesse per il DPC Progetto S3
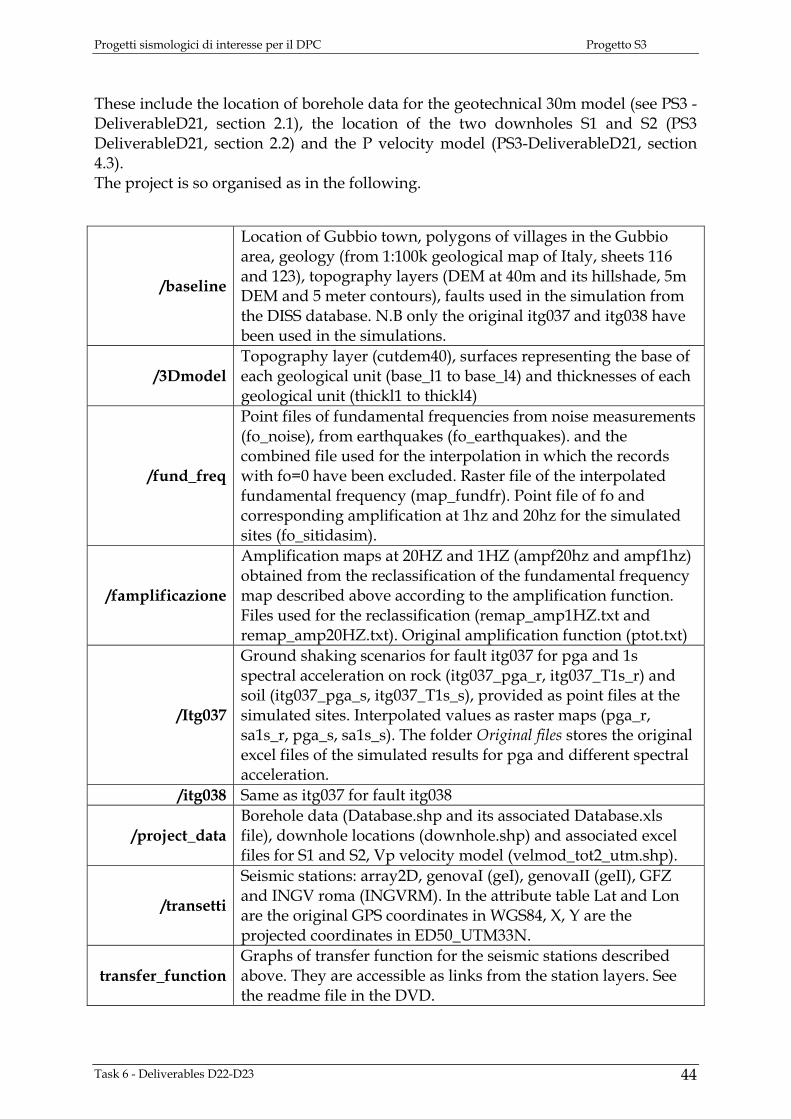
These include the location of borehole data for the geotechnical 30m model (see PS3 -DeliverableD21, section 2.1), the location of the two downholes S1 and S2 (PS3 DeliverableD21, section 2.2) and the P velocity model (PS3-DeliverableD21, section 4.3). The project is so organised as in the following.
/baseline
Location of Gubbio town, polygons of villages in the Gubbio area, geology (from 1:100k geological map of Italy, sheets 116 and 123), topography layers (DEM at 40m and its hillshade, 5m DEM and 5 meter contours), faults used in the simulation from the DISS database. N.B only the original itg037 and itg038 have been used in the simulations.
/3Dmodel Topography layer (cutdem40), surfaces representing the base of each geological unit (base_l1 to base_l4) and thicknesses of each geological unit (thickl1 to thickl4)
/fund_freq
Point files of fundamental frequencies from noise measurements (fo_noise), from earthquakes (fo_earthquakes). and the combined file used for the interpolation in which the records with fo=0 have been excluded. Raster file of the interpolated fundamental frequency (map_fundfr). Point file of fo and corresponding amplification at 1hz and 20hz for the simulated sites (fo_sitidasim).
/famplificazione
Amplification maps at 20HZ and 1HZ (ampf20hz and ampf1hz) obtained from the reclassification of the fundamental frequency map described above according to the amplification function. Files used for the reclassification (remap_amp1HZ.txt and remap_amp20HZ.txt). Original amplification function (ptot.txt)
/Itg037
Ground shaking scenarios for fault itg037 for pga and 1s spectral acceleration on rock (itg037_pga_r, itg037_T1s_r) and soil (itg037_pga_s, itg037_T1s_s), provided as point files at the simulated sites. Interpolated values as raster maps (pga_r, sa1s_r, pga_s, sa1s_s). The folder Original files stores the original excel files of the simulated results for pga and different spectral acceleration.
/itg038 Same as itg037 for fault itg038
/project_data Borehole data (Database.shp and its associated Database.xls file), downhole locations (downhole.shp) and associated excel files for S1 and S2, Vp velocity model (velmod_tot2_utm.shp).
/transetti
Seismic stations: array2D, genovaI (geI), genovaII (geII), GFZ and INGV roma (INGVRM). In the attribute table Lat and Lon are the original GPS coordinates in WGS84, X, Y are the projected coordinates in ED50_UTM33N.
transfer_function Graphs of transfer function for the seismic stations described above. They are accessible as links from the station layers. See the readme file in the DVD.
Task 6 - Deliverables D22-D23 44

Progetti sismologici di interesse per il DPC Progetto S3
8. CONCLUSION The main goal of this work was the estimate of the empirical transfer functions in the Gubbio town and in the Gubbio basin. To do this, monitoring activities were planned and 4 temporary transects of seismometric stations were installed, operating between June 2005 and May 2006. Hundreds of earthquakes have been recorded and the recordings were analyzed in order to estimate the amplitude of transfer functions. Three different methods were applied, namely the horizontal-to-vertical spectral ratio (H/V), the standard spectral ratio (SSR) and the generalized inversion technique (GIT). Differently from the H/V, the reference methods compare the spectrum of the ground motion recorded at a given site with the spectrum of the ground motion at a reference station generally installed on rock and weakly affected by local site effects. Then, these methods provide site responses that account for effects related to the finite extent of the basin (2D or 3D effects). From these analyses we found that the sites located in the Gubbio town are slightly affected by site effects. Conversely strong amplification are found in all the sites located in the basin, with amplitude from 5 to 20 over a wide frequency band, from about 0.2-0.3 Hz up to 3-4 Hz, in agreement with the spectral content of the surface waves locally generated. Furthermore we found that also the vertical components are amplified. This explains because the H/V cannot be used to estimate empirical transfer functions inside the basin and methods based on reference stations should be applied. In order to extend the results at other points of the basin, where no seismometric stations were installed, an empirical procedure was developed and validated. It consist in classifying the sites with the fundamental frequency fo and using it to associate the empirical amplification factor. The empirical amplification factors were estimated by the ratio between the response spectra recorded at the velocimetric station in the basin and those recorded at the reference station. Using this function we are able to compute site shaking scenarios and the results clearly highlight the necessity of taking into account, for seismic hazard assessment in the Gubbio basin, the significant amplification of earthquake ground motion.
Task 6 - Deliverables D22-D23
45
Progetti sismologici di interesse per il DPC Progetto S3
REFERENCES Pacor F., Bindi D., Luzi L., Parolai S., Marzorati S. and Monachesi G. (2006). Characteristics
of strong ground motion data recorded in the Gubbio sedimentary basin (Central Italy), Bull. Earthqu. Eng. doi: 10.1007/s10518-006-9026-X..
PS3-Deliverables D20 (2007). Task6 – GUBBIO - Deliverables D20 – Bedrock Shaking scenarios, July 2007.
PS3-Deliverables D21 (2007). Task6 – GUBBIO - Deliverable D21- Geological model of the Gubbio Basin (Italy) for the characterisation of local seismic response, July 2007.
PS3-Deliverables D26 (2007). Task6 – GUBBIO - Deliverable D26-Data set of velocimetric records and noise measurements, July 2007.
Task 6 - Deliverables D22-D23 46