
Ludovico Ariosto 1474-1533 a cura del prof. Marco Migliardi .

ANNO
Organo ufficialedella Divisione SSOG di InnovhubStazioni Sperimentali per l’industriaAzienda Specialedella Camera di Commercio di Milano
91RISG
LA
RIVISTAITALIANA
DELL
SOSTANZEGRASSE
E
2014
OTTOBRE/DICEMBRE 2014ISSN 0035-6808 RISGARD 91 (4) 209-284 (2014)Poste Italiane S.p.a. - Spedizione in Abbonamento Postale - 70%Finito di stampare nel mese di Marzo 2015
4

Biblioteca

Redazione: [email protected] web: www.innovhub-ssi.it
100,00 200,00umero singolo 30,00
ORGANO UFFICIALE DELLA DIVISIONE SSOG DI INNOVHUB
STAZIONI SPERIMENTALI PER L’INDUSTRIA
AZIENDA SPECIALE DELLA CAMERA DI COMMERCIO DI MILANO
E–mail: [email protected] – Sito web: www.ssog.it
100,00 200,00umero singolo 30,00
ORGANO UFFICIALE DELLA DIVISIONE SSOG DI INNOVHUB STAZIONI SPERIMENTALI PER L’INDUSTRIA
AZIENDA SPECIALE DELLA CAMERA DI COMMERCIO DI MILANO
SSOG_1_ok:Layout 1 22-02-2013 9:01 Pagina 1
direttore responsabile: M. Surdiredazione: F. paparella
GraFiCa, iMpaGinazione e staMpa
Grafiche parole Nuove srlVia Garibaldi 58 - Brugherio
4duemilaquattordiciOTTOBRE/DICEMBRE 2014 - ANNO XCI
abbonaMenti e arretrati
[email protected]. 02/70649732Fax: 02/2665380
Sommario
M. Sala, F. Taormina, R. Maina, P. Ruggeri
211 Nota tecnica. Lubrificanti. Corrispondenze tra metodi analitici. (gennaio-dicembre 2014)
A.M. Giuffrè 221 Variation in triacylglycerols of olive oils produced in Calabria (Southern Italy) during olive ripening
C. Guillaume, Ch. Gertz, L. Ravetti
241 Pyropheophytin a and 1,2 di-acyl-glycerols in natural olive oils under different storage conditions over time
B. Matthäus, M.M. Özcan,F. AL Juhaimic,
255 Some physico-chemical properties and composition in wild olive (Olea europaea L. subsp. oleaster) fruit and oil
J.S. Amaral, S. Soares, I. Mafra, M. Beatriz PP Oliveira
261 Assessing the variability of the fatty acid profile and cholesterol content of meat sausages
Notiziario 273

Comitato di redazione
P. BONDIOLI settore tecnologie olearie e oleochimiche
L. FOLEGATTI settore sostanze grasse e proteine vegetali
S. TAGLIABUE settore cosmetica
G. GASPERINI settore prodotti vernicianti
P. ROVELLINI settore qualità/genuinità (micronutrienti e sicurezza
alimentare)
D. MARIANI settore detersivi e tensioattivi
M. SALA settore lubrificanti
Comitato di Referee
R. APARICIO Istituto de la Grasa y sus Derivados – Siviglia (E)
E. CHRISTOPOULOU Hellenic Republic Ministry of Finance – G.S. of
Consumer – Directorate Technical Control – Atene (Gr)
G. CONTARINI Istituto Lattiero Caseario - Lodi
L. CONTE Dipartimento di Scienza degli Alimenti – Università di Udine
G. DONATI Istituto Superiore Sanità – Roma
A. FABERI Ministero delle Politiche Agricole Alimentari e Forestali – Roma
H.J. FIEBIG Federal Research Centre for Nutrition and Food – Institute for Lipid
Research – Münster (D)
C. GIGLIOTTI Dipartimento di Scienze Biomediche e Biotecnologiche –
Università di Brescia
K. GROB Kantonales Laboratorium – Zurigo (CH)
F. LACOSTE Institut des Corps Gras – ITERG – Pessac (F)
G. LERCKER Dipartimento di Scienze Alimentari – Università di Bologna
L. MANNINA Facoltà di Agraria – Università degli Studi di Campobasso
R. SACCHI Dipartimento Scienze Alimentari – Università Federico II – Portici
(NA)
C. SCESA Corso di Laurea in Tecniche Erboristiche – Facoltà di Farmacia –
Università di Urbino
M. SERVILI Dipartimento di Scienze Economico-Estimative e degli Alimenti –
Università di Perugia
L. SISTI Henkel – Divisione Tensioattivi – Lomazzo (CO)
E. TISCORNIA Genova
Ö. TOKUŞOĞLU Celal Bayar University - Engineering Faculty – Manisa Turkey
Indexed and Abstracted in:• Thomson Scientific Service: Science Citation Index Expanded
(SciSearch), Journal Citation/Science Edition, Current Contents/Clinical Medicine
• Chemical Abstracts• Elsevier Bibliographic Databases: SCOPUS• FSTA – Food Science and Technology Abstract (IFIS Publishing – UK)
IMPACT FACTOR 2009: 0,340
La RIVISTA ITALIANA DELLE SOSTANZE GRASSEè l’organo ufficiale della Divisione SSOG di Innovhub
- Stazioni Sperimentali per l’Industria - Azienda Speciale della Camera di Commercio di Milano. Ha
periodicità trimestrale e la scientificità dei contenuti è garantita da un Comitato Internazionale di Referee.
Pubblica lavori originali e sperimentali di autori italiani ed esteri riguardanti la chimica, la biochimica,
l’analisi e la tecnologia nei settori: sostanze grasse e loro derivati, tensioattivi, detersivi, cosmetici, oli
minerali. Pubblica un Notiziario con informazioni su congressi,
notizie in breve e libri.La Rivista viene distribuita e consultata in Italia dalle
industrie produttrici ed esportatrici di oli e grassi alimentari ed industriali, dalle industrie chimiche, da laboratori di enti statali, da istituti di ricerca e facoltà
universitarie, da dove provengono diversi lavori scientifici.
È inoltre distribuita all’estero in vari Paesi come Spagna, Principato di Monaco, Canada, Paesi
Bassi, Svizzera, Slovenia, Regno Unito, Turchia, Lussemburgo, Malaysia, Grecia, Francia, Germania, Tunisia, Nigeria, Congo, Polonia, Romania, Bulgaria,
Russia, Stati Uniti, Brasile, Cina, Giappone.
La rivista itaLiana deLLe sostanze grasse - voL. XCi - ottoBre/diCeMBre 2014
211
M. Sala1*F. Taormina1
R. Maina2
P. Ruggeri3
1Divisione INNOVHUB - SSIAzienda Speciale della
Camera di Commercio di MilanoDivisione SSOG – Milano
2Sea Marconi Technologies s.a.sTorino
3ENI SpA – Refining & MarketingMilano
*CORRISPONDENZA AUTOREE-mail: [email protected]
nota tecnicalubrificanti
Corrispondenze tra metodi analitici
(gennaio-dicembre 2014)
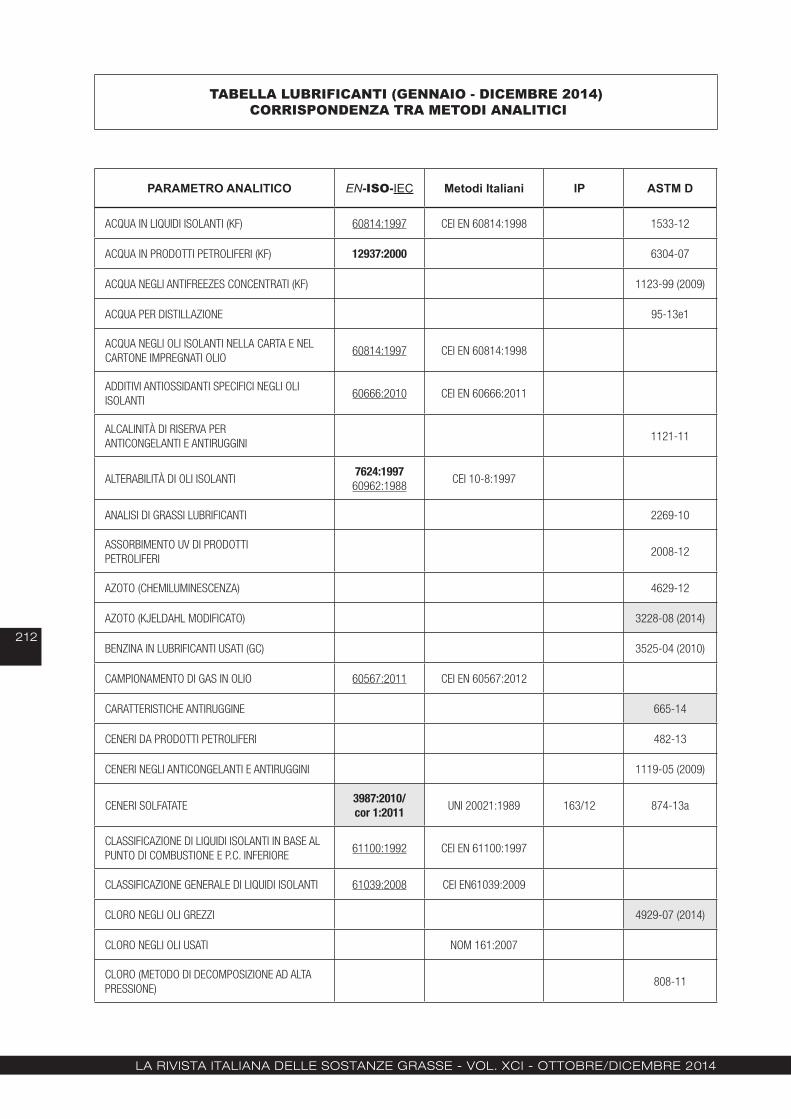
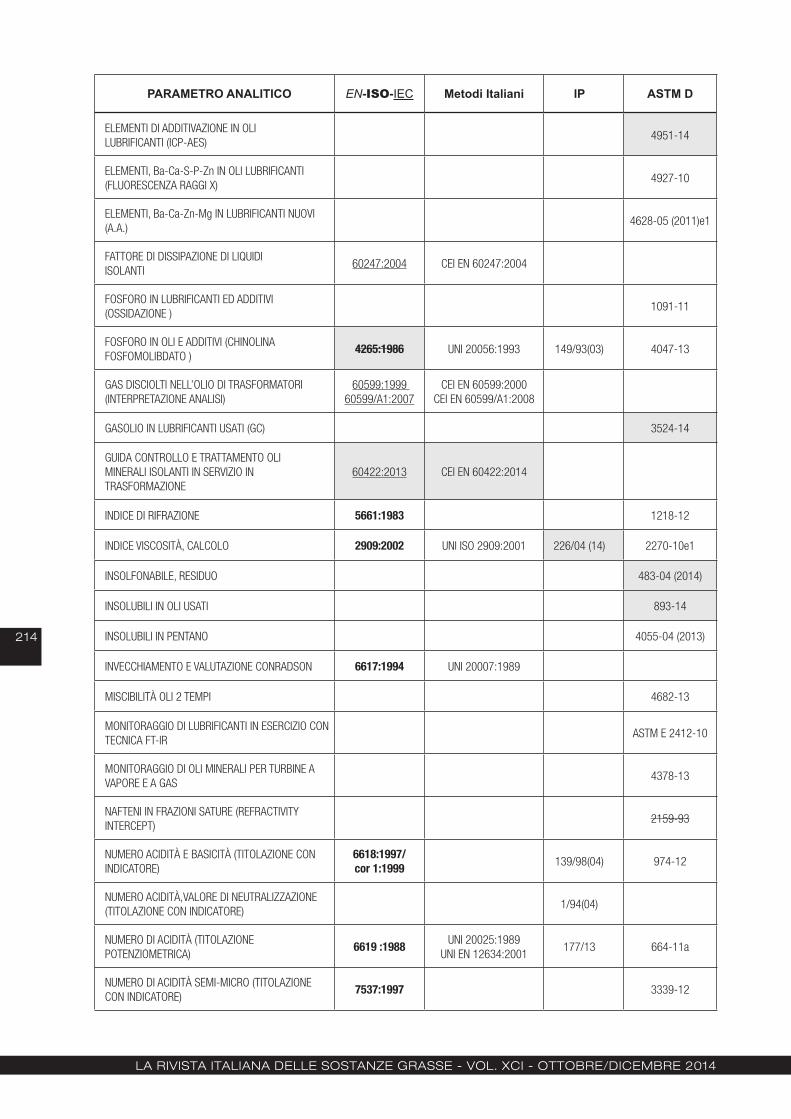
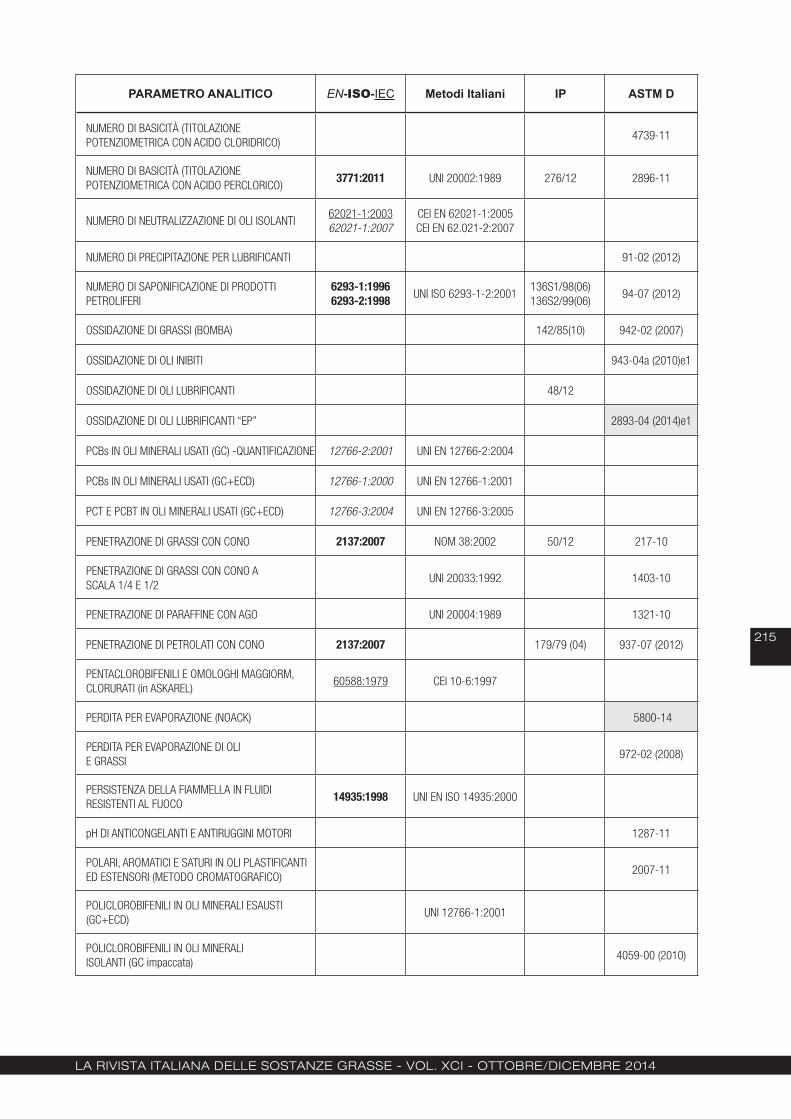
Da diversi anni viene pubblicata una guida, a disposizione di chi lavora nel settore dei lubrificanti, in cui sono riportati i controlli maggiormente utilizzati per la caratterizzazione dei prodotti petroliferi e lubrificanti e i relativi metodi di analisi pubblicati da Enti Nazionali ed Internazionali (UNI, CEI, ASTM, IP, ISO, IEC, EN).Quest’anno è stata fatta la revisione della tabella con un aggiornamento di tutti i metodi pubblicati da gennaio a dicembre 2014.La struttura base della tabella non è stata modificata rispetto alla versione precedente: nella prima colonna si riporta il parametro analitico, cui corrispondono i numeri di norma/metodo riportati nelle colonne successive.I riferimenti normativi sono sempre divisi in quattro classi: EN - ISO - IEC; Metodi Italiani (UNI - UNI EN - UNI EN ISO - CEI – NOM); IP; ASTM.Tutti i metodi che durante l’anno hanno avuto revisioni o modifiche sono evidenziati con lo sfondo grigio.La nuova versione dei metodi ASTM è stata confrontata con l’edizione precedente e nel foglio “Commento alle nuove revisioni” si riportano i risultati di tale confronto. Quando compare la dizione “equivalenti” significa che c’è una perfetta rispondenza tra le metodiche; differenze non sostanziali tra i vari metodi sono riassunte nell’espressione “tecnicamente equivalenti”; per i metodi in cui è stata riscontrata anche una sola, ma significativa differenza, viene riportata l’espressione “non equivalenti”. Per i metodi IP si rimanda al sito http://ein.powerweb.co.uk/cssiptmqbe.htm dove è disponibile l’elenco aggiornato dei metodi e un loro confronto con i metodi ASTM e ISO.Preso atto della velocità di cambiamento dei metodi in ambito normativo, soprattutto dei metodi ASTM, si ricorda che la presente guida, non potendo essere aggiornata in tempo reale, ma facendo riferimento ad una valutazione temporale pari a un anno solare, ha delle lacune, insite proprio nella modalità in cui è stato concepito il lavoro di revisione. Per questo motivo alcuni metodi ASTM hanno come data di revisione il 2013, anche se l’ultima ricerca condotta a Dicembre 2014 non li citava come metodi in revisione.
La rivista itaLiana deLLe sostanze grasse - voL. XCi - ottoBre/diCeMBre 2014
212
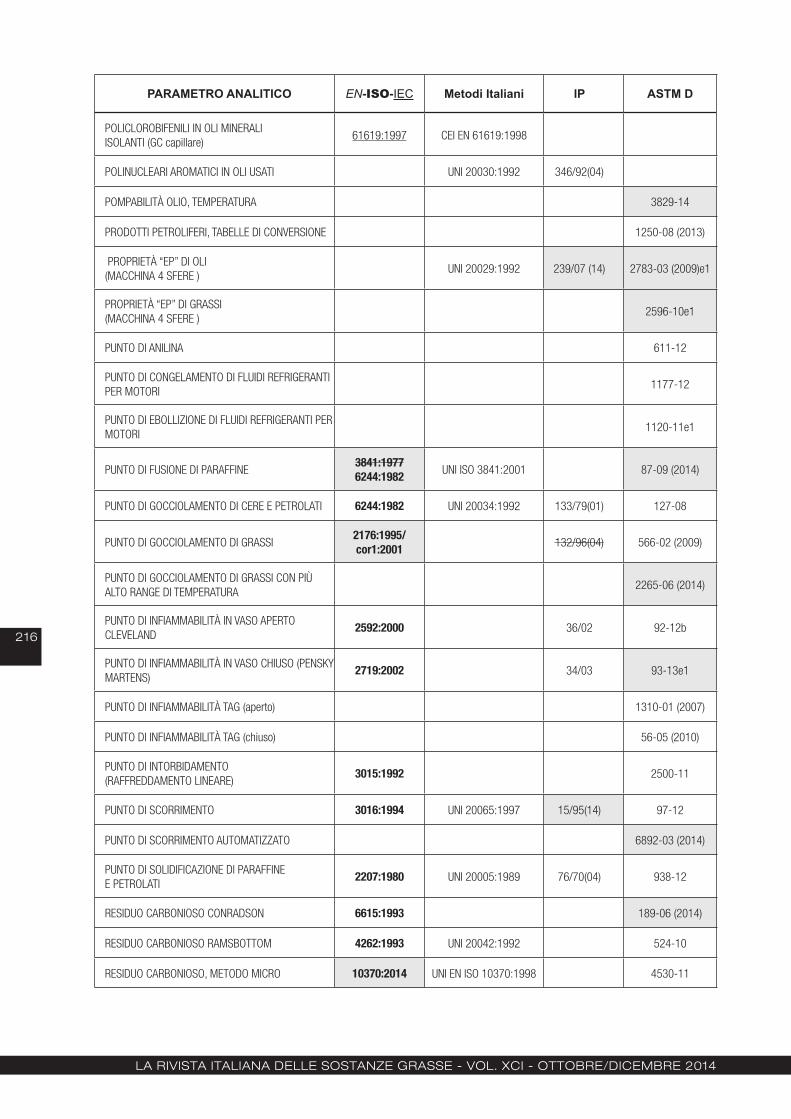
TABELLA LUBRIFICANTI (GENNAIO - DICEMBRE 2014) CORRISPONDENZA TRA METODI ANALITICI
PARAMETRO ANALITICO EN-ISO-IEC Metodi Italiani IP ASTM D
ACQUA IN LIQUIDI ISOLANTI (KF) 60814:1997 CEI EN 60814:1998 1533-12
ACQUA IN PRODOTTI PETROLIFERI (KF) 12937:2000 6304-07
ACQUA NEGLI ANTIFREEZES CONCENTRATI (KF) 1123-99 (2009)
ACQUA PER DISTILLAZIONE 95-13e1
ACQUA NEGLI OLI ISOLANTI NELLA CARTA E NEL CARTONE IMPREGNATI OLIO
60814:1997 CEI EN 60814:1998
ADDITIVI ANTIOSSIDANTI SPECIFICI NEGLI OLI ISOLANTI
60666:2010 CEI EN 60666:2011
ALCALINITÀ DI RISERVA PER ANTICONGELANTI E ANTIRUGGINI
1121-11
ALTERABILITÀ DI OLI ISOLANTI7624:1997
60962:1988CEI 10-8:1997
ANALISI DI GRASSI LUBRIFICANTI 2269-10
ASSORBIMENTO UV DI PRODOTTI PETROLIFERI
2008-12
AZOTO (CHEMILUMINESCENZA) 4629-12
AZOTO (KJELDAHL MODIFICATO) 3228-08 (2014)
BENZINA IN LUBRIFICANTI USATI (GC) 3525-04 (2010)
CAMPIONAMENTO DI GAS IN OLIO 60567:2011 CEI EN 60567:2012
CARATTERISTICHE ANTIRUGGINE 665-14
CENERI DA PRODOTTI PETROLIFERI 482-13
CENERI NEGLI ANTICONGELANTI E ANTIRUGGINI 1119-05 (2009)
CENERI SOLFATATE3987:2010/cor 1:2011 UNI 20021:1989 163/12 874-13a
CLASSIFICAZIONE DI LIQUIDI ISOLANTI IN BASE AL PUNTO DI COMBUSTIONE E P.C. INFERIORE
61100:1992 CEI EN 61100:1997
CLASSIFICAZIONE GENERALE DI LIQUIDI ISOLANTI 61039:2008 CEI EN61039:2009
CLORO NEGLI OLI GREZZI 4929-07 (2014)
CLORO NEGLI OLI USATI NOM 161:2007
CLORO (METODO DI DECOMPOSIZIONE AD ALTA PRESSIONE)
808-11

La rivista itaLiana deLLe sostanze grasse - voL. XCi - ottoBre/diCeMBre 2014
213
PARAMETRO ANALITICO EN-ISO-IEC Metodi Italiani IP ASTM D
CLORO IONICO O IDROLIZZABILE (IN ASKAREL) 60588:1979 CEI 10-6:1997
COLORE A S T M 2049:1996 UNI 20026:1989 196/97(14) 1500-12
COLORE (METODO AUTOMATICO “TRISTIMOLO”) 6045-12
COLORE SAYBOLT 156-12
COLORE APHA HAZEN (per ASKAREL) 60588:1979 CEI 10-6:1997
CONTAMINAZIONE IN DISTILLATI MEDI 12662:2008
CONTAMINAZIONE DA PARTICELLE SOLIDE 4406:1999
CONTENUTO DI OLIO NELLE PARAFFINE 2908:1974 721-06 (2011)
COPPIA DI SPUNTO E ROTOLAMENTO GRASSI (A BASSA TEMPERATURA)
1478-11
CORROSIONE DI GRASSI CON LASTRINA DI RAME UNI 20035:1992 4048-10
CORROSIONE RAME CON LAMINA 2160:1998 UNI EN ISO 2160:2001 154/00 (13) 130-12
DEMULSIVITÀ DI OLI 2711-11
DEMULSIVITÀ DI OLI MINERALI E SINTETICI 6614:1994 UNI ISO 6614:2001 1401-12
DENSITÀ (DENSIMETRO DIGITALE)12185:1996/cor 1:2001 365/97(04) 4052-11
DENSITÀ, MASSA VOLUMICA 3675:1998 UNI EN ISO 3675:2002 160/99 1298-12b
DENSITÀ O DENSITÀ RELATIVA DI LIQUIDI REFRIGERANTI
1122-13
DETERMINAZIONE DELLE CARATTERISTICHE DI OSSIDAZIONE DI OLI INIBITI E FLUIDI – TOST TESTParte 1 – Oli MineraliParte 2 – Fluidi idraulici HFCParte 3 – Procedura anidra per fluidi idraulici sinteticiParte 4 – Oli per cambi industriali
4263-1:20034263-2:20034263-3:2010
4263-4:2006
UNI EN ISO 4263-1:2005UNI EN ISO 4263-2:2005UNI EN ISO 4263-3:2010
UNI EN ISO 4263-4:2006
DILAVAMENTO CON ACQUA DI GRASSI UNI 20055:1993 1264-12
DILUIZIONE BENZINA DI OLIO USATO(DISTILLAZIONE )
UNI 20046:1992 322-97 (2012)
DISTILLAZIONE ATMOSFERICA 3405:2011 86-12
DISTILLAZIONE SOTTO VUOTO 1160-13
ELEMENTI DI ADDITIVAZIONE, METALLI DI USURA E CONTAMINANTI IN OLI LUBRIFICANTI USATI E OLI BASE (ICP-AES)
5185-13e1
ELEMENTI DI USURA E CONTAMINANTI IN OLI LUBRIFICANTI USATI O FLUIDI IDRAULICI USATI
6595-00 (2011)
La rivista itaLiana deLLe sostanze grasse - voL. XCi - ottoBre/diCeMBre 2014
214
PARAMETRO ANALITICO EN-ISO-IEC Metodi Italiani IP ASTM D
ELEMENTI DI ADDITIVAZIONE IN OLI LUBRIFICANTI (ICP-AES)
4951-14
ELEMENTI, Ba-Ca-S-P-Zn IN OLI LUBRIFICANTI (FLUORESCENZA RAGGI X)
4927-10
ELEMENTI, Ba-Ca-Zn-Mg IN LUBRIFICANTI NUOVI (A.A.)
4628-05 (2011)e1
FATTORE DI DISSIPAZIONE DI LIQUIDI ISOLANTI
60247:2004 CEI EN 60247:2004
FOSFORO IN LUBRIFICANTI ED ADDITIVI(OSSIDAZIONE )
1091-11
FOSFORO IN OLI E ADDITIVI (CHINOLINA FOSFOMOLIBDATO )
4265:1986 UNI 20056:1993 149/93(03) 4047-13
GAS DISCIOLTI NELL’OLIO DI TRASFORMATORI (INTERPRETAZIONE ANALISI)
60599:1999 60599/A1:2007
CEI EN 60599:2000 CEI EN 60599/A1:2008
GASOLIO IN LUBRIFICANTI USATI (GC) 3524-14
GUIDA CONTROLLO E TRATTAMENTO OLIMINERALI ISOLANTI IN SERVIZIO IN TRASFORMAZIONE
60422:2013 CEI EN 60422:2014
INDICE DI RIFRAZIONE 5661:1983 1218-12
INDICE VISCOSITÀ, CALCOLO 2909:2002 UNI ISO 2909:2001 226/04 (14) 2270-10e1
INSOLFONABILE, RESIDUO 483-04 (2014)
INSOLUBILI IN OLI USATI 893-14
INSOLUBILI IN PENTANO 4055-04 (2013)
INVECCHIAMENTO E VALUTAZIONE CONRADSON 6617:1994 UNI 20007:1989
MISCIBILITÀ OLI 2 TEMPI 4682-13
MONITORAGGIO DI LUBRIFICANTI IN ESERCIZIO CON TECNICA FT-IR
ASTM E 2412-10
MONITORAGGIO DI OLI MINERALI PER TURBINE A VAPORE E A GAS
4378-13
NAFTENI IN FRAZIONI SATURE (REFRACTIVITY INTERCEPT)
2159-93
NUMERO ACIDITÀ E BASICITÀ (TITOLAZIONE CON INDICATORE)
6618:1997/cor 1:1999 139/98(04) 974-12
NUMERO ACIDITÀ,VALORE DI NEUTRALIZZAZIONE (TITOLAZIONE CON INDICATORE)
1/94(04)
NUMERO DI ACIDITÀ (TITOLAZIONE POTENZIOMETRICA)
6619 :1988 UNI 20025:1989 UNI EN 12634:2001
177/13 664-11a
NUMERO DI ACIDITÀ SEMI-MICRO (TITOLAZIONE CON INDICATORE)
7537:1997 3339-12
La rivista itaLiana deLLe sostanze grasse - voL. XCi - ottoBre/diCeMBre 2014
215
PARAMETRO ANALITICO EN-ISO-IEC Metodi Italiani IP ASTM D
NUMERO DI BASICITÀ (TITOLAZIONE POTENZIOMETRICA CON ACIDO CLORIDRICO)
4739-11
NUMERO DI BASICITÀ (TITOLAZIONEPOTENZIOMETRICA CON ACIDO PERCLORICO)
3771:2011 UNI 20002:1989 276/12 2896-11
NUMERO DI NEUTRALIZZAZIONE DI OLI ISOLANTI62021-1:200362021-1:2007
CEI EN 62021-1:2005 CEI EN 62.021-2:2007
NUMERO DI PRECIPITAZIONE PER LUBRIFICANTI 91-02 (2012)
NUMERO DI SAPONIFICAZIONE DI PRODOTTI PETROLIFERI
6293-1:1996 6293-2:1998 UNI ISO 6293-1-2:2001
136S1/98(06) 136S2/99(06)
94-07 (2012)
OSSIDAZIONE DI GRASSI (BOMBA) 142/85(10) 942-02 (2007)
OSSIDAZIONE DI OLI INIBITI 943-04a (2010)e1
OSSIDAZIONE DI OLI LUBRIFICANTI 48/12
OSSIDAZIONE DI OLI LUBRIFICANTI “EP” 2893-04 (2014)e1
PCBs IN OLI MINERALI USATI (GC) -QUANTIFICAZIONE 12766-2:2001 UNI EN 12766-2:2004
PCBs IN OLI MINERALI USATI (GC+ECD) 12766-1:2000 UNI EN 12766-1:2001
PCT E PCBT IN OLI MINERALI USATI (GC+ECD) 12766-3:2004 UNI EN 12766-3:2005
PENETRAZIONE DI GRASSI CON CONO 2137:2007 NOM 38:2002 50/12 217-10
PENETRAZIONE DI GRASSI CON CONO A SCALA 1/4 E 1/2
UNI 20033:1992 1403-10
PENETRAZIONE DI PARAFFINE CON AGO UNI 20004:1989 1321-10
PENETRAZIONE DI PETROLATI CON CONO 2137:2007 179/79 (04) 937-07 (2012)
PENTACLOROBIFENILI E OMOLOGHI MAGGIORM, CLORURATI (in ASKAREL)
60588:1979 CEI 10-6:1997
PERDITA PER EVAPORAZIONE (NOACK) 5800-14
PERDITA PER EVAPORAZIONE DI OLI E GRASSI
972-02 (2008)
PERSISTENZA DELLA FIAMMELLA IN FLUIDI RESISTENTI AL FUOCO
14935:1998 UNI EN ISO 14935:2000
pH DI ANTICONGELANTI E ANTIRUGGINI MOTORI 1287-11
POLARI, AROMATICI E SATURI IN OLI PLASTIFICANTI ED ESTENSORI (METODO CROMATOGRAFICO)
2007-11
POLICLOROBIFENILI IN OLI MINERALI ESAUSTI (GC+ECD)
UNI 12766-1:2001
POLICLOROBIFENILI IN OLI MINERALI ISOLANTI (GC impaccata)
4059-00 (2010)
La rivista itaLiana deLLe sostanze grasse - voL. XCi - ottoBre/diCeMBre 2014
216
PARAMETRO ANALITICO EN-ISO-IEC Metodi Italiani IP ASTM D
POLICLOROBIFENILI IN OLI MINERALI ISOLANTI (GC capillare)
61619:1997 CEI EN 61619:1998
POLINUCLEARI AROMATICI IN OLI USATI UNI 20030:1992 346/92(04)
POMPABILITÀ OLIO, TEMPERATURA 3829-14
PRODOTTI PETROLIFERI, TABELLE DI CONVERSIONE 1250-08 (2013)
PROPRIETÀ “EP” DI OLI(MACCHINA 4 SFERE )
UNI 20029:1992 239/07 (14) 2783-03 (2009)e1
PROPRIETÀ “EP” DI GRASSI(MACCHINA 4 SFERE )
2596-10e1
PUNTO DI ANILINA 611-12
PUNTO DI CONGELAMENTO DI FLUIDI REFRIGERANTI PER MOTORI
1177-12
PUNTO DI EBOLLIZIONE DI FLUIDI REFRIGERANTI PER MOTORI
1120-11e1
PUNTO DI FUSIONE DI PARAFFINE3841:19776244:1982 UNI ISO 3841:2001 87-09 (2014)
PUNTO DI GOCCIOLAMENTO DI CERE E PETROLATI 6244:1982 UNI 20034:1992 133/79(01) 127-08
PUNTO DI GOCCIOLAMENTO DI GRASSI2176:1995/cor1:2001 132/96(04) 566-02 (2009)
PUNTO DI GOCCIOLAMENTO DI GRASSI CON PIÙ ALTO RANGE DI TEMPERATURA
2265-06 (2014)
PUNTO DI INFIAMMABILITÀ IN VASO APERTO CLEVELAND
2592:2000 36/02 92-12b
PUNTO DI INFIAMMABILITÀ IN VASO CHIUSO (PENSKY MARTENS)
2719:2002 34/03 93-13e1
PUNTO DI INFIAMMABILITÀ TAG (aperto) 1310-01 (2007)
PUNTO DI INFIAMMABILITÀ TAG (chiuso) 56-05 (2010)
PUNTO DI INTORBIDAMENTO(RAFFREDDAMENTO LINEARE)
3015:1992 2500-11
PUNTO DI SCORRIMENTO 3016:1994 UNI 20065:1997 15/95(14) 97-12
PUNTO DI SCORRIMENTO AUTOMATIZZATO 6892-03 (2014)
PUNTO DI SOLIDIFICAZIONE DI PARAFFINEE PETROLATI
2207:1980 UNI 20005:1989 76/70(04) 938-12
RESIDUO CARBONIOSO CONRADSON 6615:1993 189-06 (2014)
RESIDUO CARBONIOSO RAMSBOTTOM 4262:1993 UNI 20042:1992 524-10
RESIDUO CARBONIOSO, METODO MICRO 10370:2014 UNI EN ISO 10370:1998 4530-11

La rivista itaLiana deLLe sostanze grasse - voL. XCi - ottoBre/diCeMBre 2014
217
PARAMETRO ANALITICO EN-ISO-IEC Metodi Italiani IP ASTM D
RIGIDITÀ DIELETTRICA DI OLI ISOLANTI 60156:1995
RIGIDITÀ DIELETTRICA DI OLI TRASFORMATORE 60296:2012 CEI EN 60296:2013
RILASCIO ARIA DI OLI MINERALI 9120:1997 NOM 121:2002 3427-14
RUGGINE, PROVA DINAMICA PER GRASSI (EMCOR )
UNI 20036:1992
SCHIUMEGGIAMENTO DI ANTICONGELANTI 1881-97 (2009)
SCHIUMEGGIAMENTO DI OLI LUBRIFICANTI6247:1998/cor 1:1999 UNI 20023:1989 146/10 892-13
SEDIMENTI IN TRACCE NEGLI OLI LUBRIFICANTI 2273-08 (2012)
SEPARAZIONE DI OLIO DA GRASSO LUBRIFICANTE 6184-98 (2005)
SEPARAZIONE DI OLIO DA GRASSI DURANTE LO STOCCAGGIO
1742-06 (2013)
SFORZO DI SOGLIA E VISCOSITÀ APPARENTE (A BASSA TEMPERATURA)
4684-14
SOLFONATI NATURALI E SINTETICI (HPLC) 3712-05 (2011)
SPECIFICA DI LIQUIDI SILICONICI PER USI ELETTRICI60836:200560944:1988
CEI EN 60836:2005
SPECIFICA DI OLI MINERALI ISOLANTI 60296:2012 CEI EN 60296:2013
SPECIFICA PER CAPILLARI VISCOSIMETRICI 3105:1994 UNI ISO 3105:2001 71S2/95(04) 446-12
STABILITÀ AL ROTOLAMENTO DI GRASSI UNI 20018:1989 1831-11
STABILITÀ ALL’ OSSIDAZIONE DI OLI MINERALI INIBITI PER TURBINE
UNI 20019:1989 280/99(11)
STABILITÀ ALL’OSSIDAZIONE DI LIQUIDI ISOLANTI NUOVI A BASE IDROCARBURI
61125:1992 am1:2004
CEI EN 61125/97+ A1:2005
STABILITÀ ALL’OSSIDAZIONE DI OLI PER TURBINE A VAPORE (BOMBA)
2272-14a
STABILITÀ IDROLITICA DI OLI IDRAULICI 2619-09 (2014)
STABILITÀ TERMICA ( in ASKAREL) 60588:1979 CEI 10-6:1997
TENDENZA A FORMARE DEPOSITI E CORROSIONE 4310-10
TENSIONE DI SCARICA LIQUIDI ISOLANTI 60156:1995 CEI EN 60156:1998
TENSIONE INTERFACCIALE DI OLI (METODO RING)
6295:1983 971-12
TRAFILAMENTO DI GRASSI NEI CUSCINETTI UNI 20054:1993 1263-94 (2005)e1
CARATTERISTICHE ANTIUSURA DI GRASSI LUBRIFICANTI (MACCHINA TIMKEN)
2509-03 (2008)

La rivista itaLiana deLLe sostanze grasse - voL. XCi - ottoBre/diCeMBre 2014
218
PARAMETRO ANALITICO EN-ISO-IEC Metodi Italiani IP ASTM D
CARATTERISTICHE ANTIUSURA DI GRASSI LUBRIFICANTI (MACCHINA 4 SFERE)
2266-01 (2008)
CARATTERISTICHE ANTIUSURA DI OLI LUBRIFICANTI (MACCHINA 4 SFERE )
4172-94 (2010)
USURA DI OLI IDRAULICI 4998-13
USURA DI PELLICOLE SOLIDE DI LUBRIFICANTE 2981-94 (2014)
USURA E ATTRITO (MACCHINA FALEX) 2714-94 (2014)
PROPRIETÀ EP DI GRASSI (MACCHINA SRV) 5706-11
PROPRIETÀ EP DI OLI LUBRIFICANTI(MACCHINA TIMKEN)
2782-02 (2014)
VISCOSITÀ CINEMATICA3104:1994/cor 1:1997 UNI EN ISO 3104 :2000 71S1/97 445-14e2
VISCOSITÀ /TEMPERATURA, DIAGRAMMA 341-09
VISCOSITÀ AD ALTI GRADIENTI 4683-13
VISCOSITÀ APPARENTE DI GRASSI 1092-12
VISCOSITÀ APPARENTE DI OLI MOTORE(CCS)
5293-14
VISCOSITÀ DI LUBRIFICANTI TRAZIONE (BROOKFIELD)
UNI 20028:1992 2983-09
VISCOSITÀ DI OLI TURBINA DOPO PERMANENZA A BASSA TEMPERATURA
2532-10
VISCOSITÀ/TEMPERATURA DI OLI A BASSA TEMPERATURA, RELAZIONE
5133-13
VISCOSITÀ-GRAVITA’ CALCOLO DELLA COSTANTE (VGC)
2501-14
ZOLFO (BOMBA) 129-13
ZOLFO (FLUORESCENZA RAGGI X) 8754:2003 4294-10
ZOLFO (METODO AD ALTA TEMPERATURA) 1552-08 (2014)e1
ZOLFO (METODO WICKBOLD) 4260:1987
ZOLFO (FLUORESCENZA UV) 5453-12
ZOLFO ATTIVO DI OLI DA TAGLIO 1662-08 (2014)
ZOLFO CORROSIVO DI OLI ISOLANTI 62535:2008 UNI 20052:1992 315/98(04) 1275-06
La rivista itaLiana deLLe sostanze grasse - voL. XCi - ottoBre/diCeMBre 2014
219
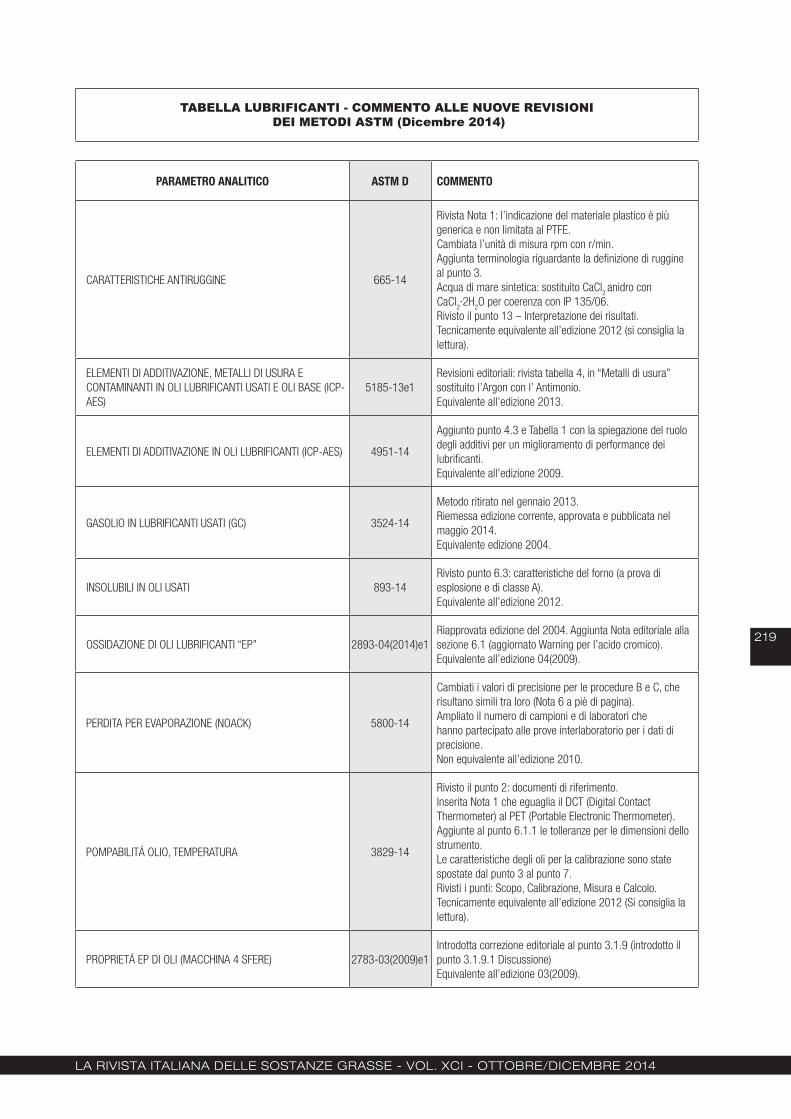
TABELLA LUBRIFICANTI - COMMENTO ALLE NUOVE REVISIONI DEI METODI ASTM (Dicembre 2014)
PARAMETRO ANALITICO ASTM D COMMENTO
CARATTERISTICHE ANTIRUGGINE 665-14
Rivista Nota 1: l’indicazione del materiale plastico è più generica e non limitata al PTFE.Cambiata l’unità di misura rpm con r/min.Aggiunta terminologia riguardante la definizione di ruggine al punto 3.Acqua di mare sintetica: sostituito CaCl
2 anidro con
CaCl2∙2H
2O per coerenza con IP 135/06.
Rivisto il punto 13 – Interpretazione dei risultati.Tecnicamente equivalente all’edizione 2012 (si consiglia la lettura).
ELEMENTI DI ADDITIVAZIONE, METALLI DI USURA E CONTAMINANTI IN OLI LUBRIFICANTI USATI E OLI BASE (ICP-AES)
5185-13e1Revisioni editoriali: rivista tabella 4, in “Metalli di usura” sostituito l’Argon con l’ Antimonio.Equivalente all’edizione 2013.
ELEMENTI DI ADDITIVAZIONE IN OLI LUBRIFICANTI (ICP-AES) 4951-14
Aggiunto punto 4.3 e Tabella 1 con la spiegazione del ruolo degli additivi per un miglioramento di performance dei lubrificanti.Equivalente all’edizione 2009.
GASOLIO IN LUBRIFICANTI USATI (GC) 3524-14
Metodo ritirato nel gennaio 2013.Riemessa edizione corrente, approvata e pubblicata nel maggio 2014.Equivalente edizione 2004.
INSOLUBILI IN OLI USATI 893-14Rivisto punto 6.3: caratteristiche del forno (a prova di esplosione e di classe A).Equivalente all’edizione 2012.
OSSIDAZIONE DI OLI LUBRIFICANTI “EP” 2893-04(2014)e1Riapprovata edizione del 2004. Aggiunta Nota editoriale alla sezione 6.1 (aggiornato Warning per l’acido cromico).Equivalente all’edizione 04(2009).
PERDITA PER EVAPORAZIONE (NOACK) 5800-14
Cambiati i valori di precisione per le procedure B e C, che risultano simili tra loro (Nota 6 a piè di pagina).Ampliato il numero di campioni e di laboratori che hanno partecipato alle prove interlaboratorio per i dati di precisione.Non equivalente all’edizione 2010.
POMPABILITÁ OLIO, TEMPERATURA 3829-14
Rivisto il punto 2: documenti di riferimento.Inserita Nota 1 che eguaglia il DCT (Digital Contact Thermometer) al PET (Portable Electronic Thermometer). Aggiunte al punto 6.1.1 le tolleranze per le dimensioni dello strumento.Le caratteristiche degli oli per la calibrazione sono state spostate dal punto 3 al punto 7.Rivisti i punti: Scopo, Calibrazione, Misura e Calcolo.Tecnicamente equivalente all’edizione 2012 (Si consiglia la lettura).
PROPRIETÁ EP DI OLI (MACCHINA 4 SFERE) 2783-03(2009)e1Introdotta correzione editoriale al punto 3.1.9 (introdotto il punto 3.1.9.1 Discussione)Equivalente all’edizione 03(2009).

La rivista itaLiana deLLe sostanze grasse - voL. XCi - ottoBre/diCeMBre 2014
220
PARAMETRO ANALITICO ASTM D COMMENTO
PROPRIETÁ EP DI GRASSI (MACCHINA 4 SFERE) 2596-10e1Introdotta correzione editoriale al punto 3.1.9 (introdotto il punto 3.1.9.1 Discussione)Equivalente all’edizione 2010.
PUNTO DI INFIAMMABILITÀ IN VASO CHIUSO (PENSKY MARTENS)
93-13e1
Revisione editoriale al punto 15: riportare il risultato con riferimento al metodo usato ( ASTM D93 o IP 34, procedura A, B o C).Equivalente all’edizione 2013.
RILASCIO ARIA IN OLI MINERALI 3427-14
Al punto 6.1.5 sostituita la parola host fittings con hose fittings.Al punto 6.5 cronometro: deve avere una precisione di 1 secondo, con un’accuratezza migliore dell’1%.Aggiunta sezione 8 per la preparazione del campione in accordo alla norma D4057.Rinumerati i punti da 9 a 13.Modificata l’espressione del risultato in secondi.Non equivalente all’edizione 2012.
SFORZO DI SOGLIA E VISCOSITÁ APPARENTE ( A BASSA TEMPERATURA)
4684-14
Riviste il punto 6.4.1: caratteristiche del termometro digitale.Rivisto il punto 2: documenti di riferimento.Rivisti i punti: Scopo, Definizioni, Materiali, Calibrazione, Misura e Calcolo.Tecnicamente equivalente all’edizione 2012 (Si consiglia la lettura).
STABILITÁ ALL’OSSIDAZIONE DI OLI PER TURBINE A VAPORE (BOMBA)
2272-14a
2272-14: rivisto il punto 7 Campionamento.Cambiati i dati di precisione del metodo A e B.Introdotte nell’Annesso A1 e A2 le calibrazioni per la Temperatura e per la Pressione.2272-14a: nell’Annesso A1 e A2 la durata delle calibrazioni di Pressione e Temperatura deve essere annuale.Non equivalente alla versione 2011.
VISCOSITÁ CINEMATICA 445-14e2
445-14: aggiunto il punto 6.6 con indicazione del bagno ad ultrasuoni. Aggiornato il punto 11.1 per i campioni che trattengono l’aria. Aggiornato il punto 17 con i dati di precisione per cherosene, diesel e biodiesel.445-14e1: correzioni editoriali al punto 17.1.1 determinabilità.445-14 e2: correzioni editoriali al punto 17Equivalente all’edizione 2012 (si ricorda che sono stati ampliati i dati di precisione per i prodotti cherosene, diesel e biodiesel).
VISCOSITÁ APPARENTE DI OLI MOTORE (CCS) 5293-14
Aggiunti i punti 6.6 e 9.2 (indicazioni del bagno ad ultrasuoni da usare per dissipare eventuali bolle d’aria presenti in campioni viscosi).Equivalente all’edizione 2010e1.
VISCOSITÁ – GRAVITÁ CALCOLO DELLA COSTANTE 2501-14Aggiunto il metodo D7042 al punto 5.1 e 5.2.Equivalente all’edizione 2011.
ZOLFO (METODO AD ALTA TEMPERATURA) 1552-08(2014)e1Cancellata nota a piè di pagina n°3: riferimento ad uno strumento.Equivalente all’edizione 2008.

La rivista itaLiana deLLe sostanze grasse - voL. XCi - ottoBre/diCeMBre 2014
221
A. M. GiuffrèDipartimento AGRARIA
Università degli Studi “Mediterranea” di Reggio Calabria
CORRESPONDENCE: dr. Angelo M. Giuffrè
Dipartimento AGRARIAUniversità degli Studi “Mediterranea”
di Reggio Calabria (Italia)E-mail: [email protected].
Phone +39 (0) 965.324077Fax +39 (0) 965.311092
Variation in triacylglycerols of olive oils produced in Calabria (southern italy)
during olive ripening
Variations in the triacylglycerol (TAG) content of virgin and extra virgin olive oil from cultivars grown in South West Calabria (Southern Italy) were studied every two weeks for three harvest years 2005-2006-2007. Three autochtho-nous cultivars from Calabria: Cassanese, Ottobratica and Sinopolese and seven allochthonous cultivars: Coratina, Itrana, Leccino, Nocellara Messi-nese, Nociara, Pendolino and Picholine were considered. With regard to the TAG evolution, the highest quantity was triolein (OOO) which increased dur-ing ripening; one of the minor components found was trilinolein (LLL) which decreased. A decreasing trend was observed for POO+SOL, the second major detected peak. Triacylglycerols were grouped by considering their Equivalent Carbon Number (ECN). The ANOVA analysis demonstrated that the cultivar influenced the TAG composition at each harvest date and differ-ences were statistically very highly significant (p ≤ 0.001), as well the harvest date influenced the TAG composition of each cultivar and differences were statistically significant (p ≤ 0.05), highly significant (p ≤ 0.01) and very highly significant (p ≤ 0.001).Keywords: Calabria, cultivar, maturation, Olea europaea L., olive oil, ripening, triglycerides.
Variazione dei trigliceridi degli oli di oliva prodotti in Calabria (Italia meridionale) durante la maturazione delle olive È stata studiata la variazione nel contenuto in triacilgliceroli (TAG) da oli extra vergini di oliva estratti da olive campionate ogni due settimane per tre annate (2005-2006-2007) da cultivar allevate nel sud ovest della Calabria (Sud Ita-lia). Sono state considerate tre cultivar autoctone: Cassanese, Ottobratica e Sinopolese e sette cultivar alloctone: Coratina, Itrana, Leccino, Nocellara Messinese, Nociara, Pendolino e Picholine. Rispetto all’evoluzione dei triacil-gliceroli, la quantità maggiore era di trioleina (OOO) che aumentava durante la maturazione delle olive. Uno dei componenti presenti in minore quantità era la trilinoleina (LLL) che invece diminuiva. È stato osservato un andamento decrescente per POO+SOL, il secondo maggiore picco individuato.I triacilgliceroli sono stati raggruppati considerando il loro numero di carbonio equivalente (ECN). L’analisi della varianza (ANOVA) ha dimostrato che la cultivar ha influenzato la composizione di triacilgliceroli in ciascuna data di raccolta e le differenze sono molto altamente significative (p ≤ 0.001), come anche la data di raccolta ha influenzato la composizione di triacilgliceroli in ciascuna cultivar e le diffe-renze sono state significative (p ≤ 0.05), molto significative (p ≤ 0.01) e molto altamente significative (p ≤ 0.001).Parole chiave: Calabria, cultivar, maturazione, Olea europaea L., olio d’oliva, trigliceridi.
La rivista itaLiana deLLe sostanze grasse - voL. XCi - ottoBre/diCeMBre 2014
222
1. INTRODUCTION
Acylglycerols are the main constituents of olive oil (more than 98%) and TAGs represent the largest part of acylglycerols. Mono and diacylglycerols gener-ated by hydrolysis of TAGs are present in olive oil as secondary constituents and in low percentages. All glyceride percentages are related to the free acidity of the olive oil. TAGs in fats and in vegetable oils are a chemical combination of glycerol and fatty acids. Fatty acids in olive oil can be saturated or unsaturated and with medium and long chains ranging from 14 to 24 atom carbon numbers. The stereospecific position of fatty acids is important because it determines how triglycerides are digested. Fatty acids released from the sn-1 and sn-3 positions often have different metabolic fates than fatty acids retained in the sn-2 position. These metabolic fates depend on the fatty acid chain-length and stereospe-cific location on the triglyceride [1]. Triacylglycerols (TAG) are the major storage and trans-port forms of energy that provide 9 kcals/g. Under normal conditions, humans consume about 90-120 g of fat per day and more than 95% of it is absorbed [2].The current evidence argues compellingly for includ-ing triglyceride in the evaluation of patient risk for cor-onary artery disease. For the present, measurement of fasting triglyceride and its assessment in conjunc-tion with LDL cholesterol and HDL cholesterol con-centrations would seem to be the most practical way of evaluating any additional risk posed by hypertrig-lyceridemia [3].The origin, cultivar, extraction technology, state of rip-ening of the fruit, climatic conditions, and rainfall all influence biosynthesis within the fruit and, therefore, the composition and quality of the oil [4].Triacylglycerol (TAG) composition is a critical charac-teristic in the quality of fats and oils because it can affect not only their physiological properties such as melting point and crystallization but also their nutri-tional properties such as susceptibility to lipase-hy-drolysis [5]. The Italian olive germplasm is estimated to include about 800 cultivars, most of them being landraces vegetatively propagated at a farm level since ancient times. The number is probably underestimated be-cause of the scarce information on minor local variet-ies widespread in the different olive growing areas [6]. The Calabrian Region has an ancient tradition with re-spect to olive oil production and many cultivars grown in this territory [7], with a specific morphological and genetic structure [8]. It is important to study the oil composition of all Italian cultivars in order to provide for each oil, useful consumer information on the label, especially for the monocultivar oils.In a previous paper the influence of cultivar and har-vest year on triglyceride composition of olive oil for each of the three harvest years was studied. Find-
ings showed that the cultivar effect had a significant or highly significant influence on TG composition. The effect of harvest year and the combination cultivar × harvest year showed a lower influence [9]. In the same microclimatic, agronomic and oil’s extrac-tive conditions, the cultivar and the harvest date were proved to influence also the sterols [10, 11], fatty al-cohols [12, 13] and waxes [14, 15]. The harvest date was also proved to influence phenolic and fatty acid methly ester composition [16].The aim of this paper is to study the TAG composition of pressed virgin olive oils from autochthonous and allochthonous cultivars grown in South West Calabria (Southern Italy). Particular emphasis is placed on the variation on TAG composition during olive ripening. No previous data exists regarding the TAG evolution of olive oil during harvest time in this geographical area.
2. MATERIALS AND METHODS
PLANT MATERIAL AND EXTRACTION SYSTEMDrupes from olive trees were sampled in three harvest years 2005, 2006 and 2007 from plantations in the Plain of Gioia Tauro situated in South West Calabria (Southern Italy). In each plantation only one cultivar was grown. All plantations were in the same micro-climatic conditions, at 100 m above sea level, with damp and rainy winters and hot summers. Cassanese (7 samplings), Ottobratica (7 samplings) and Sinopo-lese (7 samplings) are autochthonous cultivars for the Region of Calabria. Coratina (5 samplings), Itrana (5 samplings), Leccino (5 samplings), Nocellara Messi-nese (7 samplings), Nociara (6 samplings), Pendolino (6 samplings) and Picholine (5 samplings) are alloch-thonous for this region. For Nocellara Messinese only one sampling was conducted in the harvest year 2005. No nutrient and water deficiency or pest damage were found on the trees. Drupes were harvested every two weeks from the beginning of October until 20% ripe fruits were no longer found on trees. For each harvest approximately 40 kg of olives per cultivar were picked (more or less 2.5 kg per tree) from fifteen previously selected 25-40 year old plants. At each harvest olives were randomly hand picked and quickly transferred to the laboratory. Before oil extraction, leaves were re-moved and olives were washed in fresh water.Olives were immediately processed in a laboratory mill “Mini 30” (AGRIMEC Valpesana, Calzaiolo, S. Casciano VP, Florence), with a capacity of 40 kg. Ol-ive crushing, the first step, was conducted by means of a hammer-mill. Malaxation of olive paste, the sec-ond step, was conducted at a temperature between 15 and 20°C for 35 minutes. The prepared paste was placed between a pile of circular metallic grids and pressed using a hydraulic press with a mild and con-tinuous increase in pressure up to 200 bar. The liquid phase was submitted to separation by centrifugation and the obtained oil was filtered through filter paper.
La rivista itaLiana deLLe sostanze grasse - voL. XCi - ottoBre/diCeMBre 2014
223
Amber glass flasks (100 mL) were filled as completely as possible with oil to minimize oxidation. The flasks were then stored in dark conditions at 15-20°C, until analysis.
CHEMICALSStandard samples of trimyristin, tripalmitin, tristearin, triolein, 1,2-palmitolein-3olein, 1,2-stearin-3olein, from Larodan Fine Chemicals, Malmö (Sweden), were used as references. Acetonitrile, acetone, diethyl ether, petroleum ether were from Carlo Erba, Milan, Italy. Silica gel 70-230 mesh, was from Merck S.p.A., (Milan, Italy).
Determination of triacylglycerolsThe identification and quantification of TAGs was conducted as described in Annex XVIII of the Eu-ropean Regulation [17]. A comparison of retention indices with those of authentic samples was made. The olive oil was purified through a silica-gel column using petroleum ether/ethyl ether (87/13) as an elu-ent and then filtered. The solvent was eliminated by means a Rotavapor. A 10 µl aliquot of sample (5% of purified olive oil in acetone) was used for the HPLC analysis with an isocratic mobile phase consisting of acetonitrile + acetone (50/50) at a flow rate of 0.5 mL/min. An HP instrument was used equipped with a re-fractive index detector, using a 3 × 200 mm × 3 µm, C18 column (Varian Scientific, Lake City, CA, USA).
STATISTICAL ANALYSISAnalyses were conducted in triplicate. Excel software (2003 version) was used for graph constructions. Percentage relative standard deviations (%RSD) were calculated as follows: standard deviation (SD)/mean × 100. Data were also determined by analysis of vari-ance (ANOVA) using SPSS version 15.0 for Windows (IL, USA). The Tukey test was used to determine any significant difference among all of the treatments at p ≤ 0.05.
3. RESULTS AND DISCUSSION
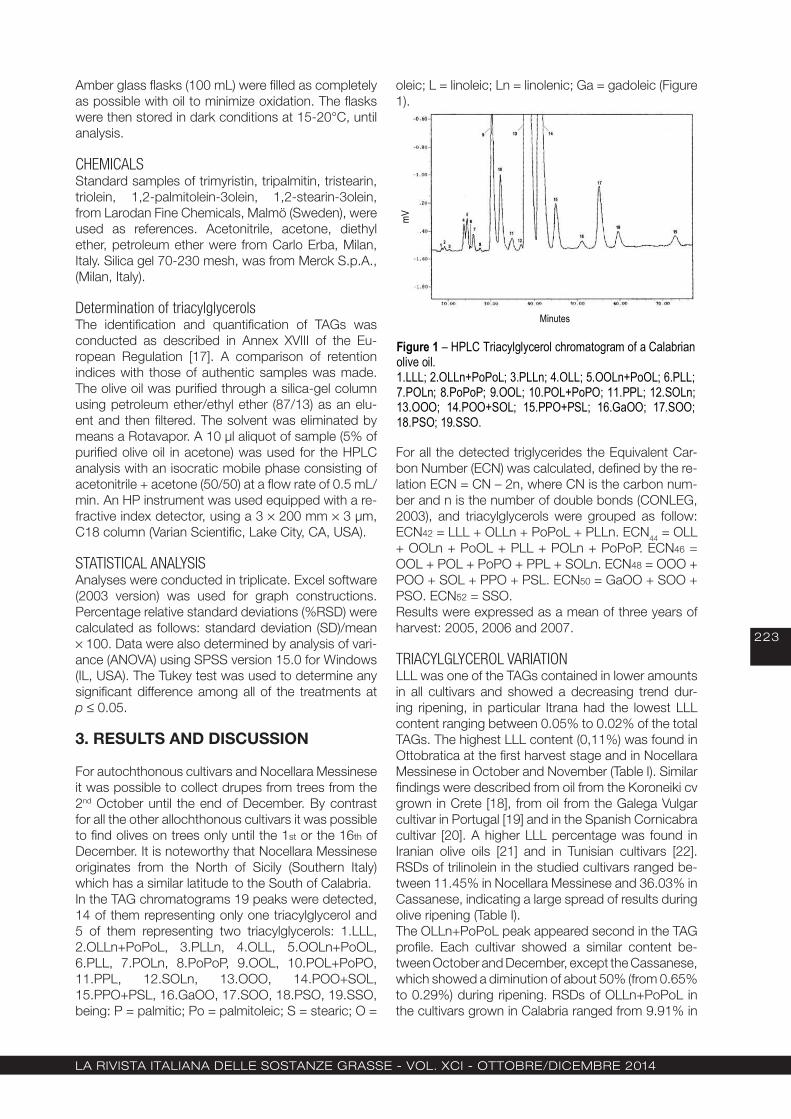
For autochthonous cultivars and Nocellara Messinese it was possible to collect drupes from trees from the 2nd October until the end of December. By contrast for all the other allochthonous cultivars it was possible to find olives on trees only until the 1st or the 16th of December. It is noteworthy that Nocellara Messinese originates from the North of Sicily (Southern Italy) which has a similar latitude to the South of Calabria.In the TAG chromatograms 19 peaks were detected, 14 of them representing only one triacylglycerol and 5 of them representing two triacylglycerols: 1.LLL, 2.OLLn+PoPoL, 3.PLLn, 4.OLL, 5.OOLn+PoOL, 6.PLL, 7.POLn, 8.PoPoP, 9.OOL, 10.POL+PoPO, 11.PPL, 12.SOLn, 13.OOO, 14.POO+SOL, 15.PPO+PSL, 16.GaOO, 17.SOO, 18.PSO, 19.SSO, being: P = palmitic; Po = palmitoleic; S = stearic; O =
oleic; L = linoleic; Ln = linolenic; Ga = gadoleic (Figure 1).
Figure 1 – HPLC Triacylglycerol chromatogram of a Calabrian olive oil. 1.LLL; 2.OLLn+PoPoL; 3.PLLn; 4.OLL; 5.OOLn+PoOL; 6.PLL; 7.POLn; 8.PoPoP; 9.OOL; 10.POL+PoPO; 11.PPL; 12.SOLn; 13.OOO; 14.POO+SOL; 15.PPO+PSL; 16.GaOO; 17.SOO; 18.PSO; 19.SSO.
Minutes
mV
For all the detected triglycerides the Equivalent Car-bon Number (ECN) was calculated, defined by the re-lation ECN = CN – 2n, where CN is the carbon num-ber and n is the number of double bonds (CONLEG, 2003), and triacylglycerols were grouped as follow: ECN42 = LLL + OLLn + PoPoL + PLLn. ECN44 = OLL + OOLn + PoOL + PLL + POLn + PoPoP. ECN46 = OOL + POL + PoPO + PPL + SOLn. ECN48 = OOO + POO + SOL + PPO + PSL. ECN50 = GaOO + SOO + PSO. ECN52 = SSO.Results were expressed as a mean of three years of harvest: 2005, 2006 and 2007.
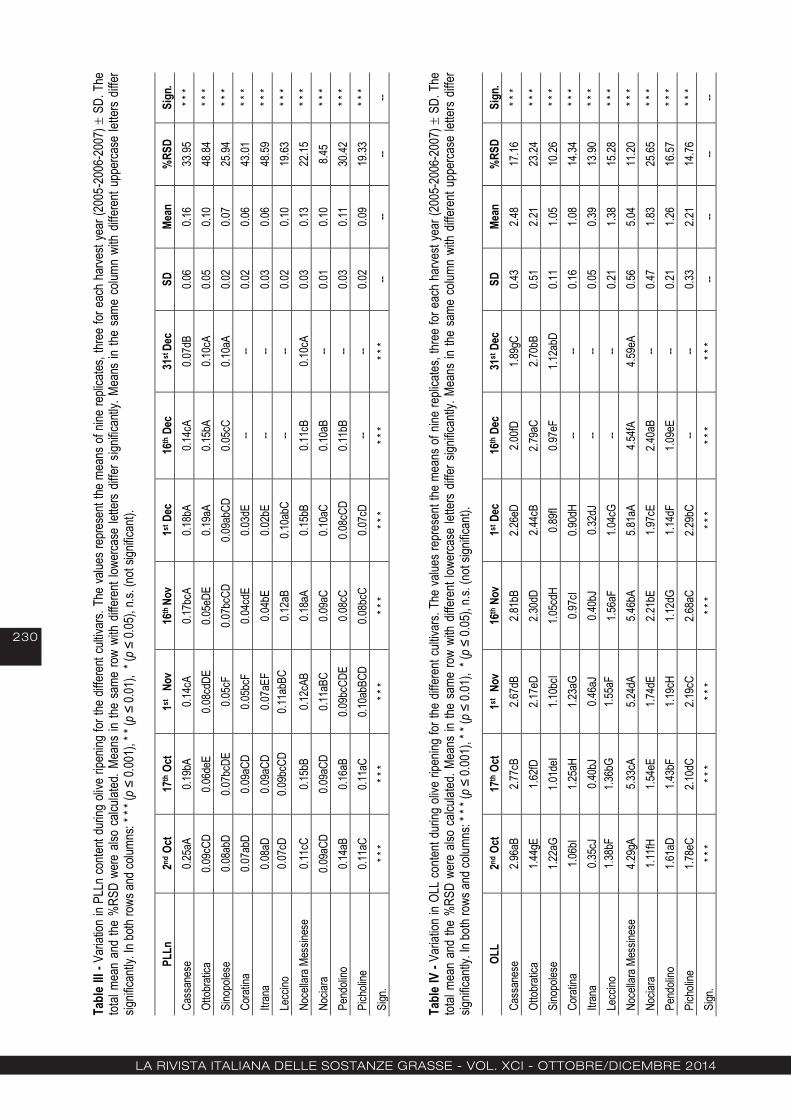
TRIACYLGLYCEROL VARIATIONLLL was one of the TAGs contained in lower amounts in all cultivars and showed a decreasing trend dur-ing ripening, in particular Itrana had the lowest LLL content ranging between 0.05% to 0.02% of the total TAGs. The highest LLL content (0,11%) was found in Ottobratica at the first harvest stage and in Nocellara Messinese in October and November (Table I). Similar findings were described from oil from the Koroneiki cv grown in Crete [18], from oil from the Galega Vulgar cultivar in Portugal [19] and in the Spanish Cornicabra cultivar [20]. A higher LLL percentage was found in Iranian olive oils [21] and in Tunisian cultivars [22]. RSDs of trilinolein in the studied cultivars ranged be-tween 11.45% in Nocellara Messinese and 36.03% in Cassanese, indicating a large spread of results during olive ripening (Table I). The OLLn+PoPoL peak appeared second in the TAG profile. Each cultivar showed a similar content be-tween October and December, except the Cassanese, which showed a diminution of about 50% (from 0.65% to 0.29%) during ripening. RSDs of OLLn+PoPoL in the cultivars grown in Calabria ranged from 9.91% in
La rivista itaLiana deLLe sostanze grasse - voL. XCi - ottoBre/diCeMBre 2014
224
Leccino to 27.85% in Pendolino, also in this case with a large spread of results (Table II).PLLn was constant during olive maturation and re-mained below 0.18%. Only in the first ripening stage of Cassanese a 0.25% content was found (Table III). In all the studied cultivars, at the end of ripening a PLLn content ≤ 0.11% was found, similar to contents in the Galega Vulgar cultivar (Spain) [19] and in Ira-nian olive oils [21]. Nociara showed the lowest %RSD (8.41) and Ottobratica the highest %RSD (48.84), (Table III). OLL was lowest in Itrana among the allochthonous cultivars, remaining below 0.50%, and in Sinopolese among the autochthonous cultivars, accounting from a maximum of 1.22% and a minimum of 0.89%. The majority of cultivars showed a %RDS within 20%, ex-cept for Ottobratica and Nocellara Messinese, with a 23.24% and 25.65% value, respectively (Table IV).The OOLn+PoOL peak appeared fifth in the TAG pro-file. Nocellara Messinese had the highest OOLn+PoOL content on all the seven sampling dates, accounting for between 2.45% and 3.11% of the total TAGs. In all other cultivars the OOLn+PoOL content was always below 2%; in Ottobratica the OOLn+PoOL account-ed for less than 1% throughout the ripening period. This peak showed one of the lowest variations during ripening and the %RSD was less than 12.50 for all cultivars (Table V). The PLL value decreased throughout ripening for Cassanese, Sinopolese and Pendolino. The PLL con-tent was 1.14% and 0.95% respectively on the first and on the second harvest dates of Cassanese and remained constantly below 0.85% of total TAGs for all other cultivars in all the harvest stages. The autochtho-nous cultivars presented three of the highest %RSD, ranging from 25.71 to 37.84. In particular Cassanese showed the highest SD (± 0.27) and %RSD (37.84), (Table VI). Some Authors studied Spanish olive oils of the Extremadura Region from seven cultivars extract-ed at different stages of ripening and always found a PLL content lower than 0.80% [23]. Compared to the olive oil of South West Calabria, an higher PLL amount was found in Picholine Marocaine olive oil from three different sites (1,75%, 2.02% and 2,15% respectively), although other Moroccan autochtho-nous cultivars showed a similar content [24].The POLn content decreased from the first to the last stage of this study for Cassanese (1.34% - 0.62%) and Pendolino (1.29% - 0.89%) and remained con-stantly below 0.93% for all other cultivars throughout ripening. Leccino showed the lowest %RSD (5.25). The highest SD and %RSD were found in Cassanese (±0.24 and 27.09, respectively) (Table VII). PoPoP was another of the TAGs contained in a lower amount in all cultivars and showed a constant con-tent for Sinopolese, Coratina and Nociara and a vary-ing content during their growth for the seven remain-ing cultivars. The highest PoPoP content (0.15%) was found in Cassanese in the first harvest date. Worthy
of note are the RSDs for Sinopolese, Leccino and Nociara (15.59, 39.03 and 69.92 respectively) which presented a very similar standard deviation (±0.01) and a different mean; this is explained by the influ-ence of the mean on this parameter (Table VIII).OOL showed a constant increase in Ottobratica (11.57% - 15.94%), in Nociara (10.90% - 16.07%), in Picholine (13.66% - 15.92%), whereas in Nocellara Messinese the content was constant for the first four sampling dates (12-13%) and increased rapidly in De-cember (12.26% - 20.82%). The %RSD was 25.43 in Nocellara Messinese and less than 15.50 in all other cultivars (Table IX).POL+PoPO was the tenth detected peak in the HPLC chromatogram. POL+PoPO declined constantly in Cassanese from the first to the seventh sampling of growth from 9.75% to 5.34% with a drop of 45.23%. Also Coratina and Pendolino had a fall in POL+PoPO (4.98% - 3.98%) and (6.43% - 4.74%) respectively. In general, the concentation of POL+PoPO remained below 8% in all cultivars for most of their growth ex-cept for Nocellara Messinese in which the sum of these two TAGs was always above 10% of the to-tal TAGs. Cassanese showed the highest SD (±1.58) and the highest %RSD (22.25), (Table X).PPL was always above 15% for Ottobratica, Sinoplese and Nocellara Messinese and below 15% for all oth-er cultivars during ripening. All cultivars presented a %RSD higher than 15.50; the highest value was in Picholine (45.43) (Table XI).SOLn decreased for Cassanese from 1.26% to 0.49% and increased for Nociara from 0.60% to 0.95%. No-cellara Messinese was notable for a SOLn content higher than 1.30% in all the seven ripening stages. Similar to other cases, Cassanese presented the highest SD (± 0.26) and the highest %RSD (33.27), (Table XII).OOO was the highest TAG found in all cultivars and constituted 30-50% of the total TAGs, also in this case Cassanese presented the highest SD (5.43) and the highest %RSD (13.34). A %RSD ranging from 6.89 to 8.46 was calculated for Pendolino and Nocellara Messinese. The seven remaining cultivars presented a %RSD lower than 5.00, (Table XIII). OOO increased 1.5 times from 2nd October to 31st Decem-ber (31.96%-47.39%), in Cassanese oil. All other cul-tivars had a slight or very slight increase except for Nociara which showed a slight fall from the beginning of October to the end of December. The highest OOO percentage, 51% ca. was found in Coratina on the last two sampling dates. Mateos et al. found in Pic-ual and Hoijiblanca cultivars a OOO content ranging between 50-51%; in Chemlali a 29.84% content and in Picholine 42.24% [25]. This is similar to Picholine of South West Calabria: 40.83%-42.60% on the last two harvest dates. Some researchers measured, in eleven Sardinian and in one Corsican olive oil, a OOO content ranging between 21.21% and 33.22% of the total TAGs, always lower than the minimum found in
La rivista itaLiana deLLe sostanze grasse - voL. XCi - ottoBre/diCeMBre 2014
225
the Calabrian olive oils [26]. A partial microclimatic effect was found by comparing the percentage of OOO in olive oils from different areas of the Extrema-dura Region: Sierra Norte del Cáceres (48.79±3.63), Serena-Siberia (36.15±3.65) and Tierra de Barros (34.81±4.90), [27].POO+SOL was the second highest detected peak for which a constant decline in all cultivars was found, most evident for Ottobratica and least evident in No-cellara Messinese which had the lowest POO+SOL content among all cultivars grown in South West Ca-labria. The POO+SOL was below 30% of the total TAGs in all the studied cultivars at all samplings. All cultivars showed a %RSD lower than 9.50. Leccino showed the lowest SD (±0.50) and the lowest %RSD (1.95), (Table XIV).PPO+PSL was the fifteenth detected peak. All culti-vars exhibited similar profiles of degradation, record-ing a decrease which ranged from 53.77% for Cassa-nese to 10.45% for Nocellara Messinese (Table XV). In all the studied cultivars the maximum PPO+PSL percentage was found in the first stage of harvesting. As it was noted for other compounds, Cassanese presented the highest SD (± 0.78) and the highest %RSD (26.81).GaOO was higher in Coratina which exhibited an in-creasing trend in the later stage of ripening reaching a maximum of 1.2% of total TAGs. This was similar to Cassanese and Ottobratica with a final content of 0.83% and 0.62% respectively. All other cultivars showed a GaOO content lower than 0.7% throughout ripening. Cassanese presented again both the high-est SD (± 0.17) and the highest %RSD (28.09), (Table XVI).SOO was higher in Sinopolese in all the harvesting stages with a 5.80% maximum content at the end of December (Table XVII). A rise in SOO occurred in Cassanese from 2.70% at first sampling to 3.95% at final sampling. All others cultivars showed a relatively constant SOO profile always remaining below 5% of the total TAGs. These results are similar to those of Ollivier et al. [28] who found a SOO content ranging between 2.43% and 4.86% in French olive oils with a registered designation of origin, in six different geo-graphical areas. Ouni et al. [29] in Tunisian olive oils from seven different locations found a similar SOO percentage ranging between 2.50% and 5.50% of the total TAGs. SD and %RSD were higher in Cas-sanese (±0.47 and 13.60 respectively).PSO showed a varying profile in all the cultivars during olive ripening with a content always remaining below 1.30% of total TAGs. The highest %RSD was found in Cassanese (17.73), whereas the lowest was found in Sinopolese (5.75) (Table XVIII).SSO was the last detected TAG and showed a ten-dency to increase in autochthonous cultivars and a stationary trend for the allochthonous, always remain-ing below 1.1% of the total TAGs (Table XIX). The percentage of ECN42 showed little change during
ripening for almost all cultivars, only in Cassanese a decrease was found from 1% to 0.4% during the two months of sampling. Cassanese presented the high-est SD (±0.20) and the highest %RSD (28.09), (Table XX). By and large all the Calabrian cultivars accounted for less than 1% of the total TAGs, similar to the find-ings of Osorio-Bueno et al. [23] for Spanish olive oils from the Extremadura Region. The difference between the theoretical ECN42 and the experimental results achieved by LC analysis (LC ECN42) was found to be a parameter for a rapid and easy analytical approach to detect the presence of 10% hazelnut oil in virgin olive oil [30].The ECN44 percentage was almost constant during harvest time for the allochthonous cultivars: Nocel-lara Messinese having the highest content (8-10%), a slight increase was measured in Nociara. Regard-ing autochthonous cultivars, a decreasing trend was found in Cassanese in contrast with an increasing trend in Ottobratica. In all cultivars the %RSD was less than 18.00; Ottobratica and Cassanese, two au-tochthonous cultivars presented the two highest val-ues (17.30 and 16.47 respectively), (Table XXI). The trend of ECN46 were similar to those of ECN44 with an almost constant concentration for nearly all the allochthonous cultivars with Nocellara Messinese having the highest amount (31-35%), double that of Itrana (14-15%). Nociara, however, showed an increasing trend. For autochthonous cultivars Otto-bratica showed an increase from 19.50% to 24.32%, Cassanese a decrease from 27.56% to 21.46%. No-ciara presented the highest %RSD (15.03), and all other cultivars presented a %RSD less than 10.00 (Table XXII).The ECN48 rates are, again, similar. However, Nocel-lara Messinese is notable for a percentage which re-mained lower than 60% of total TAGs. The %RSD was always less than 5.50 in all cultivars (Table XXIII).The ECN50 percentage was calculated. Also in this case, in the autochthonous group, the oils of Cas-sanese and Ottobratica had a divergent trend. In the allochthonous group, Nocellara Messinese showed a 30% diminution from 2nd October to 31st December and Itrana a 20% increase in the same period. The highest %RSD were found in Nocellara Messinese (12.34) and in Cassanese (11.56), the remaining culti-vars presented less than 9.00 as %RSD, (Table XXIV). In the present study, ECN52 was represented only by one TAG, i.e. SSO, which has already been described (Table XIX).
ANOVA RESULTS
Data are evaluated row by row.Differences are statistically considered for each har-vest date during olive ripening and are: significant (p ≤ 0.05), highly significant (p ≤ 0.01), very highly signifi-cant (p ≤ 0.001). LLL showed significant, high significant or very high
La rivista itaLiana deLLe sostanze grasse - voL. XCi - ottoBre/diCeMBre 2014
226
significant differences in the studied cultivars during ripening and the highest significant values were found in the first three samplings (Table I).OLL content was very highly influenced by the har-vest date in all cultivars. Cassanese, Ottobratica, No-cellara Messinese and Picholine presented different values on each harvest date (Table IV).POLn was always very highly different, in particular, in Cassanese a very high lowering during ripening (p ≤ 0.001) was found (Table VII). PoPoP showed no significant differences in Sinopo-lese on all the harvest dates and it was very highly dif-ferent during ripening in all other cultivars (Table VIII).The harvest date very highly influenced the OOL con-tent of each cultivar and in Nociara caused a very highly significant increase in OOL during olive matu-ration (Table IX).POL+PoPO was very highly different for all cultivars on almost all harvest dates, except for Sinopolese on 1st and 31st December (4.11%) and for Pendolino on 16th November and on 1st December (5.32 - 5.33%), (Table X).SOLn was very highly influenced by the harvest date in all cultivars (p ≤ 0.001). In Cassanese, SOLn per-centage constantly lowered during olive maturation (Table XII). The harvest date very highly affected OOO in all cul-tivars during olive ripening, except in Ottobratica in which the same percentage was found on 2nd Octo-ber and on 1st December (39.32%), (Table XIII).POO+SOL percentage was very highly different in all cultivars during ripening. The autochthonous cultivars and Itrana and Nociara showed a constant increase from early October to the end of December (Table XIV).PPO+PSL was influenced by the harvest date in all cultivars. Cassanese, Ottobratica, Coratina, Itrana, Pendolino, Leccino and Picholine showed very high differences on each harvest date (Table XV).A very high significant effect of the harvest date was found in all cultivars with respect to GaOO and SOO content. In the former, Sinopolese, Coratina and No-cellara Messinese had different values on each har-vest date (Table XVI); the same situation was found in the latter for Cassanese, Ottobratica, Nociara, Pen-dolino and Picholine (Table XVII).ECN42 was very highly different in all the cultivars dur-ing ripening. Itrana showed significant differences on all the harvest dates (Table XX).ECN44 content was very highly influenced by the harvest date in all cultivars. Cassanese, Ottobratica, Coratina, Nocellara Messinese and Nociara always showed a different value on each harvest date (Table XXI).The effect of the harvest date and maturity on ECN46
is presented in Table XXII; findings show very high significant differences for all cultivars during ripening. In particular, ECN46 in Pendolino constantly increased with harvest time and maturity.
ECN48 was very highly different in all the cultivars dur-ing ripening. Cassanese and Nociara had an inverse trend: in the former cultivar the ECN48 percentage constantly decreased whereas in the latter it con-stantly and significantly increased during ripening (Table XXIII).ECN50 was very highly different on all the harvest dates for all the cultivars, this is most evident in Cassanese, Leccino and Picholine (Table XXIV).
Data are evaluated column by column.Differences are statistically considered for each culti-var during olive ripening and are: significant (p ≤ 0.05), highly significant (p ≤ 0.01), very highly significant (p ≤ 0.001). LLL content was very highly influenced by the cultivar on all the harvest dates. Itrana had the lowest content (p ≤ 0.05) during ripening (Table I).The cultivar affected very highly the OLLn+PoPoL and the PLLn content on each harvest date. In both cases Itrana showed the lowest or the second lowest percentage (Tables II and III). OLL and POL+PoPO content were very highly affected by the cultivar on each harvest date showing percent-ages significantly different. In both cases the highest percentage on each harvest date was found in Nocel-lara Messinese and in both cases Itrana showed the lowest or the second lowest content (Tables IV, X).The cultivar very highly differentiated OOLn+PoOL, PLL and POLn content (p ≤ 0.001) on all harvest dates (Tables V, VI, VII).OOO was very highly influenced by the cultivar on all the harvest dates with the exception of 16th No-vember when no significant difference was found in Sinopolese and Pendolino, as well on 16th December when Ottobratica and Nociara had the same percent-age. Coratina showed the highest content on the first five samplings (Table XIII). The cultivar very highly influenced the PPO+PSL con-tent on all harvest dates, this is mainly evident on 16th November and on 1st December (Table XV).Also SSO, the only TAG grouped as ECN52 was very highly influenced by the cultivar. Sinopolese showed the highest or the second highest content on each harvest date (Table XIX). ECN42 was very highly affected by the cultivar. In this group Picholine had the third highest content for the first five samplings (Table XX).The cultivar effect very highly influenced the ECN44 on all the harvest dates. The highest effect was found on 17th October and in December (Table XXI). ECN46 was very highly affected by the cultivar. On all the harvest dates the cultivar effect caused different values. Itrana showed the lowest ECN46 content on the first five harvest dates, Sinopolese was always the second lowest and Coratina was always the third lowest (Table XXII). ECN48 was very highly influenced by the cultivar on all the harvest dates. Itrana showed the highest ECN48
La rivista itaLiana deLLe sostanze grasse - voL. XCi - ottoBre/diCeMBre 2014
227
content on the first five harvest dates whereas No-cellara Messinese had the lowest content from 2nd October to 31st December (Table XXIII). The cultivar very highly influenced the ECN50 content on all the harvest dates and in many cases Otto-bratica and Sinopolese, two autochthonous cultivars, had the highest content. In December the differences found in ECN50 were the most evident (Table XXIV).
4. CONCLUSIONS
All the oils studied in this paper were produced from olives grown in the same geographical area and with the same microclimatic conditions. The same agro-nomic conditions and the same extraction procedure were also applied to all the cultivars, consequently, all variations in TAG content are dependent on the cul-tivar and the ripening stage factors. LLL, PLLn, PLL, POLn, POL+PoPo, SOLn, OOO, PPO+PSL, GaOO, SOO and ECN42 showed both the highest SD and %RSD in the Cassanese. The ANOVA analysis dem-onstrated that the cultivar influenced the TAG com-position at each harvest date and differences were statistically very highly significant (p ≤ 0.001), as well the harvest date influenced the TAG composition of each cultivar and differences were statistically sig-nificant (p ≤ 0.05), highly significant (p ≤ 0.01) and very highly significant (p ≤ 0.001) in the olive oil from olives produced in South West Calabria (Italy). The findings of this study contribute to the knowledge of the composition of South West Calabrian olive oil dur-ing ripening and can consequently inform one of the choice for the most suitable moment for harvesting.
REFERENCES
[1] J.E. Hunter, Studies on effects of dietary fatty acids as related to their position on triglycerides. Lipids 36, 635-648 (2001).
[2] X.Pan, M.M. Hussain, Gut triglyceride produc-tion. Biochim. Biophys. Acta 1821, 727-735 (2012).
[3] A.M. Gotto, Triglyceride as a risk for coronary artery disease. Am. J. Cardiol. 82, 22Q-25Q (1998).
[4] D. Firestone – Olive oil - Bailey’s Industrial Oil and Fat Products, Sixth Edition, Six Volume Set. Edited by Fereidoon Shahidi. Copyright # 2005 John Wiley & Sons, Inc.
[5] Y. Endo, A. Ohta, H. Kido, M. Kuriyama, Y. Saka-guchi, S. Takebayashi, H. Hirai, C. Murakami, S. Wada, Determination of triacylglycerol compo-sition in vegetable oils using high-performance liquid chromatography: a collaborative study. J. Oleo Sci. 60, 451-456 (2011).
[6] I. Muzzalupo, Olive Germplasm – Italian Cata-logue of Olive Varieties.
http://www.intechopen.com/books/olive-germ-
plasm-italian-catalogue-of-olive-varieties. Edited by Innocenzo Muzzalupo, ISBN 978-
953-51-0884-9. Published by InTech, Janeza Trdine 9, 51000 Rijeka, Croatia.
[7] A.M. Giuffré, L’olio di oliva calabrese: aspetti produttivi e tecnologici. Industrie Alimentari 42, 20-25 (2003).
[8] F. P. Marra, T. Caruso, F. Costa, C. Di Vaio, R. Mafrica, A. Marchese, Genetic relationships, structure and parentage simulation among the olive tree (Olea europaea L. subsp. europaea) cultivated in Southern Italy revealed by SSR markers. Tree Genet. Genomes 9, 961-973 (2013).
[9] A.M. Giuffrè, Influence of cultivar and harvest year on triglyceride composition of olive oils pro-duced in Calabria (Southern Italy). Eur. J. Lipid Sci. Technol. 115, 928-934 (2013).
[10] A.M. Giuffré, L. Louadj, Influence of crop season and cultivar on sterol composition of monovari-etal olive oils in Reggio Calabria (Italy). Czech J. Food Sci. 31, 256-263 (2013).
[11] A.M. Giuffré, L. Louadj, M. Poiana, A. Maca-rio, Composition en stérols des huiles extraites d’olives de cultivars de la province de Reggio Calabria (Sud d’Italie). Riv. Ital. Sostanze Grasse 89, 177-183 (2012).
[12] A.M. Giuffré, The effects of cultivar and harvest year on the fatty alcohol composition of olive oils from Southwest Calabria (Italy). Grasas Aceites 65, e011 (2014).
[13] A.M. Giuffré, Evolution of fatty alcohols in olive oils produced in Calabria (Southern Italy) during fruit ripening. J. Oleo Sci. 63, 486-496 (2014).
[14] A.M. Giuffré, Influence of harvest year and culti-var on wax composition of olive oils. Eur. J. Lipid Sci. Technol. 115, 549-555 (2013).
[15] A.M. Giuffré, Wax ester variation in olive oils pro-duced in Calabria (Southern Italy) during olive ripening. J. Am Oil Chem Soc. 91, 1355-1366 (2014).
[16] A.M. Giuffré, A. Piscopo, V. Sicari, M. Poiana, The effects of harvesting on phenolic com-pounds and fatty acids content in virgin olive oil (cv Roggianella). Riv. Ital. Sostanze Grasse 87, 14-23 (2010).
[17] Consolidated text, CONSLEG: 1991R2568 - 01/11/2003, on the characteristics of olive oil and olive-residue oil and on the relevant me-thods of analysis, Annex XVIII.
[18] E. Stefanoudaki, F. Kotsifaki, A. Koutsaftakis, The potential of HPLC triglyceride profiles for the classification of Cretan olive oils. Food Chem. 60, 425-432 (1997).
[19] L. Vaz-Freire, J.M.J. Gouveia, A.M. Costa Frei-tas, Analytical characteristics of olive oils pro-duced by two different extraction techniques, in the Portuguese olive variety “Galega Vulgar”. Grasas Aceites 59, 260-266 (2008).
La rivista itaLiana deLLe sostanze grasse - voL. XCi - ottoBre/diCeMBre 2014
228
[20] F. Aranda, S. Gómez-Alonso, R.M. Rivera Del Álamo, M.D. Salvador, G. Fregapane, Triglycer-ide, total and 2-position fatty acid composition of Cornicabra virgin olive oil: Comparison with other Spanish cultivars. Food Chem. 86, 485-492 (2004).
[21] Z. Piravi-Vanak, M. Ghavami, H. Ezzatpanah, J. Arab, H. Safafar, J.B. Ghashemi, Evaluation of Iranian olive oil by fatty acid and triacylglycerol profiles. J. Am. Oil Chem. Soc. 86, 827-833 (2009).
[22] I. Oueslati, H. Manai, F.M. Haddada, D. Daoud, J. Sánchez, E. Osorio, M. Zarrouk, Sterol, triter-penic dialcohol, and triacylglycerol compounds of extra virgin olive oils from some Tunisian va-rieties grown in the Region of Tataouine. Food Sci. Tech. Int. 15, 5-13 (2007).
[23] E. Osorio Bueno, J.J. Sánchez Casas, M. Már-tinez Cano, A.M. Montaño García, Estudio del contenido en triglicéridos de aceites monovarie-tales elaborados a partir de aceitunas produci-das en la region extremeña. Grasas Aceites 54, 1-6 (2003).
[24] N. Boukachabine, H. Ajana, A. El Antari, A study of fatty acids and triglycerides oil composition and quality parameters of five autochthon olive varieties in Morocco. Lebanese Science Journal 12, 45-65 (2011).
[25] R. Mateos, M. Trujllo, M.C. Peä Rez-Camino, W. Moreda, A. Cert, Relationships between oxi-dative stability, triacylglycerol composition, and
antioxidant content in olive oil matrices. J. Agric. Food Chem. 53, 5766-5771 (2005).
[26] L. Cerretani, A. Bendini, A. Del Caro, A. Piga, V. Vacca, M.F. Caboni, T. Gallina Toschi, Prelimi-nary characterisation of virgin olive oils obtained from different cultivars in Sardinia. Eur. Food Res. Technol. 222, 354-361 (2006).
[27] J. Sánchez Casas, C. De Miguel Gordillo, E. Osorio Bueno, J. Marín Expósito, M. Fuentes Mendoza, T. Ardila Hierro, L. Gallardo Gonzáles, M. Martínez Cano, Characteristics of virgin olive oils from the olive zone of Extremadura (Spain), and an approximation to their varietal origin. J. Am. Oil Chem. Soc. 86, 933-940 (2009).
[28] D. Ollivier, C. Pinatel, N. Dupuy, M. Guérère, J. Artaud, Caractérisations sensorielles et chimi-ques d’huiles d’olive vierges de six AOC fran-çaises. OCL-OL Corps Gras Li. 14, 116-129 (2007).
[29] Y. Ouni, G. Flamini, N. Ben Youssef, M. Guerfel, M. Zarrouk, Sterolic composition and triacylg-lycerols of Oueslati virgin olive oil: comparison among different geographic areas. Int. J. Food Sci. Tech. 46, 1747-1754 (2011).
[30] S. Vichi, L. Pizzale, E. Toffano, R. Bortolomeazzi, L. Conte, Detection of hazelnut oil in virgin olive oil by assessment of free sterols and triacylglyc-erols. J. AOAC Int. 84, 1534-1541 (2001).
Received, February 18, 2013Accepted, October 29, 2013

La rivista itaLiana deLLe sostanze grasse - voL. XCi - ottoBre/diCeMBre 2014
229
Tabl
e I -
Varia
tion i
n LL
L co
ntent
durin
g oli
ve ri
penin
g for
the
differ
ent c
ultiva
rs. T
he va
lues r
epre
sent
the m
eans
of n
ine re
plica
tes, t
hree
for e
ach
harve
st ye
ar (2
005-
2006
-200
7)
SD.
The
total
me
an an
d the
%RS
D we
re al
so ca
lculat
ed. M
eans
in th
e sam
e ro
w wi
th dif
feren
t lowe
rcase
lette
rs dif
fer si
gnific
antly
. Mea
ns in
the s
ame c
olumn
with
diffe
rent
uppe
rcase
lette
rs dif
fer si
gnific
antly
. In
both
rows
and c
olumn
s: * *
* (p
≤ 0.
001)
, * *
(p ≤
0.01
), *
(p ≤
0.05
), n.s
. (no
t sign
ifican
t).
LLL
2nd O
ct 17
th O
ct 1st
Nov
16
th N
ov
1st D
ec
16th
Dec
31
st D
ec
SD
Mean
%
RSD
Sign
. Ca
ssan
ese
0.08a
bB
0.09a
ABC
0.06b
BC
0.05c
DE
0.04c
BC
0.04c
C 0.0
4cB
0.02
0.06
36.03
* *
* Ot
tobra
tica
0.11a
A 0.0
7bCD
0.0
8bAB
0.0
9abA
B 0.0
8bA
0.07b
B 0.0
8bA
0.01
0.08
16.66
* *
Si
nopo
lese
0.08a
B 0.0
7aCD
0.0
6abB
C 0.0
6abC
DE
0.06a
bAB
0.06a
bBC
0.04b
B 0.0
1 0.0
6 19
.78
* *
Cora
tina
0.08a
B 0.0
8aBC
0.0
6abB
C 0.0
4bEF
0.0
5aBC
--
-- 0.0
2 0.0
6 28
.85
* * *
Itran
a 0.0
4abC
0.0
5aD
0.05a
C 0.0
2bF
0.03a
bC
-- --
0.01
0.04
34.31
* *
* Le
ccino
0.0
8abB
0.0
9aAB
C 0.0
9aA
0.08a
bBC
0.06b
AB
-- --
0.01
0.08
15.31
* *
* No
cella
ra M
essin
ese
0.10a
bAB
0.11a
A 0.0
9abA
0.1
1aA
0.08b
A 0.1
0abA
0.0
9abA
0.0
1 0.1
0 11
.45
* No
ciara
0.0
9aAB
0.0
8abB
C 0.0
8abA
B 0.0
7abc
BCD
0.06b
cAB
0.05c
BC
-- 0.0
1 0.0
7 20
.54
* * *
Pend
olino
0.1
1aA
0.10a
AB
0.09a
A 0.0
6bCD
E 0.0
6bAB
0.0
6bBC
--
0.02
0.08
28.50
* *
* Pi
choli
ne
0.09a
AB
0.08a
bBC
0.08a
bAB
0.06b
cCDE
0.0
5cBC
--
-- 0.0
2 0.0
7 22
.82
* Si
gn.
* * *
* * *
* * *
* * *
* * *
* * *
* * *
-- --
-- --
Tabl
e II -
Var
iation
in O
OLn+
PoPo
L con
tent d
uring
olive
ripen
ing fo
r the
diffe
rent
cultiv
ars.
The v
alues
repr
esen
t the m
eans
of ni
ne re
plica
tes, t
hree
for e
ach h
arve
st ye
ar (2
005-
2006
-200
7)
SD.
Th
e tot
al me
an a
nd th
e %
RSD
were
also
calcu
lated
. Mea
ns in
the
same
row
with
differ
ent l
ower
case
lette
rs dif
fer si
gnific
antly
. Mea
ns in
the
same
colum
n wi
th dif
feren
t upp
erca
se le
tters
differ
sig
nifica
ntly.
In bo
th ro
ws an
d colu
mns:
* * *
(p ≤
0.00
1), *
* (p
≤ 0.
01),
* (p
≤ 0.
05),
n.s. (
not s
ignific
ant).
OLLn
+PoP
oL
2nd O
ct 17
th O
ct 1st
Nov
16
th N
ov
1st D
ec
16th
Dec
31
st D
ec
SD
Mean
%
RSD
Sign
. Ca
ssan
ese
0.65a
A 0.5
9bA
0.51c
A 0.5
0cdB
0.4
8dA
0.34e
B 0.2
9fB
0.13
0.48
26.60
* *
* Ot
tobra
tica
0.17c
EF
0.15c
G 0.2
1bEF
0.2
1bF
0.23b
CD
0.29a
C 0.2
8aB
0.05
0.22
23.83
* *
* Si
nopo
lese
0.19b
cE
0.16d
FG
0.20b
cF
0.21b
F 0.2
5aC
0.18c
dD
0.21b
C 0.0
3 0.2
0 13
.56
* * *
Cora
tina
0.19b
E 0.2
3aE
0.19b
F 0.1
8bG
0.18b
F --
-- 0.0
2 0.1
9 10
.61
* * *
Itran
a 0.1
6aF
0.18a
F 0.1
3bG
0.16a
G 0.1
1bG
-- --
0.03
0.15
19.08
* *
* Le
ccino
0.2
3bD
0.22b
cE
0.26a
D 0.2
4abE
0.2
0cEF
--
-- 0.0
2 0.2
3 9.9
1 * *
* No
cella
ra M
essin
ese
0.39d
B 0.4
2cC
0.46b
B 0.5
1aAB
0.4
9aA
0.40c
dA
0.36e
A 0.0
6 0.4
3 12
.77
* * *
Nocia
ra
0.29c
C 0.2
9cD
0.35b
C 0.3
5bC
0.22d
DE
0.39a
A --
0.06
0.32
18.97
* *
* Pe
ndoli
no
0.40a
B 0.4
1aC
0.23c
DE
0.29b
D 0.2
2cDE
0.2
7bC
-- 0.0
8 0.3
0 27
.85
* * *
Pich
oline
0.4
0dB
0.46b
B 0.4
6bB
0.53a
A 0.4
3cB
-- --
0.05
0.45
10.57
* *
* Si
gn.
* * *
* * *
* * *
* * *
* * *
* * *
* * *
-- --
-- --
La rivista itaLiana deLLe sostanze grasse - voL. XCi - ottoBre/diCeMBre 2014
230
Tabl
e III
- Var
iation
in P
LLn
conte
nt du
ring
olive
ripe
ning
for th
e dif
feren
t cult
ivars.
The
value
s rep
rese
nt the
mea
ns o
f nine
repli
cates
, thr
ee fo
r eac
h ha
rvest
year
(200
5-20
06-2
007)
S
D. T
he
total
mean
and
the
%RS
D we
re a
lso c
alcula
ted. M
eans
in th
e sa
me ro
w wi
th dif
feren
t low
erca
se le
tters
differ
sign
ifican
tly. M
eans
in th
e sa
me c
olumn
with
diffe
rent
uppe
rcase
lette
rs dif
fer
signif
icantl
y. In
both
rows
and c
olumn
s: * *
* (p
≤ 0.
001)
, * *
(p ≤
0.01
), *
(p ≤
0.05
), n.s
. (no
t sign
ifican
t).
PLLn
2nd
Oct
17th
Oct
1st N
ov
16th
Nov
1st
Dec
16
th D
ec
31st
Dec
SD
Me
an
%RS
D Si
gn.
Cass
anes
e 0.2
5aA
0.19b
A 0.1
4cA
0.17b
cA
0.18b
A 0.1
4cA
0.07d
B 0.0
6 0.1
6 33
.95
* * *
Ottob
ratic
a 0.0
9cCD
0.0
6deE
0.0
8cdD
E 0.0
5eDE
0.1
9aA
0.15b
A 0.1
0cA
0.05
0.10
48.84
* *
* Si
nopo
lese
0.08a
bD
0.07b
cDE
0.05c
F 0.0
7bcC
D 0.0
9abC
D 0.0
5cC
0.10a
A 0.0
2 0.0
7 25
.94
* * *
Cora
tina
0.07a
bD
0.09a
CD
0.05b
cF
0.04c
dE
0.03d
E --
-- 0.0
2 0.0
6 43
.01
* * *
Itran
a 0.0
8aD
0.09a
CD
0.07a
EF
0.04b
E 0.0
2bE
-- --
0.03
0.06
48.59
* *
* Le
ccino
0.0
7cD
0.09b
cCD
0.11a
bBC
0.12a
B 0.1
0abC
--
-- 0.0
2 0.1
0 19
.63
* * *
Noce
llara
Mes
sines
e 0.1
1cC
0.15b
B 0.1
2cAB
0.1
8aA
0.15b
B 0.1
1cB
0.10c
A 0.0
3 0.1
3 22
.15
* * *
Nocia
ra
0.09a
CD
0.09a
CD
0.11a
BC
0.09a
C 0.1
0aC
0.10a
B --
0.01
0.10
8.45
* * *
Pend
olino
0.1
4aB
0.16a
B 0.0
9bcC
DE
0.08c
C 0.0
8cCD
0.1
1bB
-- 0.0
3 0.1
1 30
.42
* * *
Pich
oline
0.1
1aC
0.11a
C 0.1
0abB
CD
0.08b
cC
0.07c
D --
-- 0.0
2 0.0
9 19
.33
* * *
Sign
. * *
* * *
* * *
* * *
* * *
* * *
* * *
* --
-- --
--
Tabl
e IV
- Va
riatio
n in
OLL
conte
nt du
ring
olive
ripe
ning
for th
e dif
feren
t cult
ivars.
The
value
s rep
rese
nt the
mea
ns o
f nine
repli
cates
, thr
ee fo
r eac
h ha
rvest
year
(200
5-20
06-2
007)
S
D. T
he
total
mean
and
the
%RS
D we
re a
lso c
alcula
ted. M
eans
in th
e sa
me ro
w wi
th dif
feren
t low
erca
se le
tters
differ
sign
ifican
tly. M
eans
in th
e sa
me c
olumn
with
diffe
rent
uppe
rcase
lette
rs dif
fer
signif
icantl
y. In
both
rows
and c
olumn
s: * *
* (p
≤ 0.
001)
, * *
(p ≤
0.01
), *
(p ≤
0.05
), n.s
. (no
t sign
ifican
t).
OLL
2nd O
ct 17
th O
ct 1st
Nov
16
th N
ov
1st D
ec
16th
Dec
31
st D
ec
SD
Mean
%
RSD
Sign
. Ca
ssan
ese
2.96a
B 2.7
7cB
2.67d
B 2.8
1bB
2.26e
D 2.0
0fD
1.89g
C 0.4
3 2.4
8 17
.16
* * *
Ottob
ratic
a 1.4
4gE
1.62fD
2.1
7eD
2.30d
D 2.4
4cB
2.79a
C 2.7
0bB
0.51
2.21
23.24
* *
* Si
nopo
lese
1.22a
G 1.0
1deI
1.10b
cI 1.0
5cdH
0.8
9fI
0.97e
F 1.1
2abD
0.1
1 1.0
5 10
.26
* * *
Cora
tina
1.06b
I 1.2
5aH
1.23a
G 0.9
7cI
0.90d
H --
-- 0.1
6 1.0
8 14
.34
* * *
Itran
a 0.3
5cJ
0.40b
J 0.4
6aJ
0.40b
J 0.3
2dJ
-- --
0.05
0.39
13.90
* *
* Le
ccino
1.3
8bF
1.36b
G 1.5
5aF
1.56a
F 1.0
4cG
-- --
0.21
1.38
15.28
* *
* No
cella
ra M
essin
ese
4.29g
A 5.3
3cA
5.24d
A 5.4
6bA
5.81a
A 4.5
4fA
4.59e
A 0.5
6 5.0
4 11
.20
* * *
Nocia
ra
1.11fH
1.5
4eE
1.74d
E 2.2
1bE
1.97c
E 2.4
0aB
-- 0.4
7 1.8
3 25
.65
* * *
Pend
olino
1.6
1aD
1.43b
F 1.1
9cH
1.12d
G 1.1
4dF
1.09e
E --
0.21
1.26
16.57
* *
* Pi
choli
ne
1.78e
C 2.1
0dC
2.19c
C 2.6
8aC
2.29b
C --
-- 0.3
3 2.2
1 14
.76
* * *
Sign
. * *
* * *
* * *
* * *
* * *
* * *
* * *
* --
-- --
--
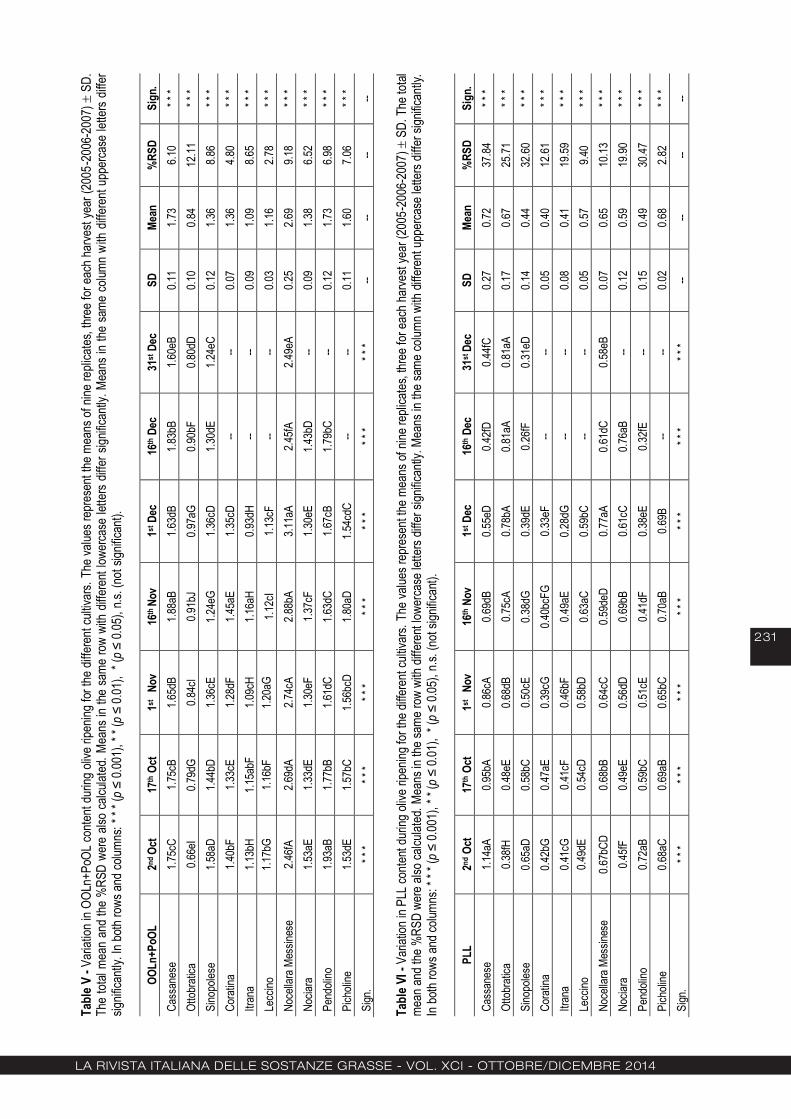
La rivista itaLiana deLLe sostanze grasse - voL. XCi - ottoBre/diCeMBre 2014
231
Tabl
e V -
Varia
tion i
n OOL
n+Po
OL co
ntent
durin
g oliv
e ripe
ning f
or the
diffe
rent
cultiv
ars.
The
value
s rep
rese
nt the
mea
ns of
nine
repli
cates
, thr
ee fo
r eac
h har
vest
year
(200
5-20
06-2
007)
S
D.
The
total
mean
and
the
%RS
D we
re a
lso ca
lculat
ed. M
eans
in th
e sa
me ro
w wi
th dif
feren
t low
erca
se le
tters
differ
sign
ifican
tly. M
eans
in th
e sa
me co
lumn
with
differ
ent u
pper
case
lette
rs dif
fer
signif
icantl
y. In
both
rows
and c
olumn
s: * *
* (p
≤ 0.
001)
, * *
(p ≤
0.01
), *
(p ≤
0.05
), n.s
. (no
t sign
ifican
t).
OO
Ln+P
oOL
2nd O
ct 17
th O
ct 1st
Nov
16
th N
ov
1st D
ec
16th
Dec
31
st D
ec
SD
Mean
%
RSD
Sign
. Ca
ssan
ese
1.75c
C 1.7
5cB
1.65d
B 1.8
8aB
1.63d
B 1.8
3bB
1.60e
B 0.1
1 1.7
3 6.1
0 * *
* Ot
tobra
tica
0.66e
I 0.7
9dG
0.84c
I 0.9
1bJ
0.97a
G 0.9
0bF
0.80d
D 0.1
0 0.8
4 12
.11
* * *
Sino
poles
e 1.5
8aD
1.44b
D 1.3
6cE
1.24e
G 1.3
6cD
1.30d
E 1.2
4eC
0.12
1.36
8.86
* * *
Cora
tina
1.40b
F 1.3
3cE
1.28d
F 1.4
5aE
1.35c
D --
-- 0.0
7 1.3
6 4.8
0 * *
* Itr
ana
1.13b
H 1.1
5abF
1.0
9cH
1.16a
H 0.9
3dH
-- --
0.09
1.09
8.65
* * *
Lecc
ino
1.17b
G 1.1
6bF
1.20a
G 1.1
2cI
1.13c
F --
-- 0.0
3 1.1
6 2.7
8 * *
* No
cella
ra M
essin
ese
2.46fA
2.6
9dA
2.74c
A 2.8
8bA
3.11a
A 2.4
5fA
2.49e
A 0.2
5 2.6
9 9.1
8 * *
* No
ciara
1.5
3aE
1.33d
E 1.3
0eF
1.37c
F 1.3
0eE
1.43b
D --
0.09
1.38
6.52
* * *
Pend
olino
1.9
3aB
1.77b
B 1.6
1dC
1.63d
C 1.6
7cB
1.79b
C --
0.12
1.73
6.98
* * *
Pich
oline
1.5
3dE
1.57b
C 1.5
6bcD
1.8
0aD
1.54c
dC
-- --
0.11
1.60
7.06
* * *
Sign
. * *
* * *
* * *
* * *
* * *
* * *
* * *
* --
-- --
-- Ta
ble V
I - V
ariat
ion in
PLL
conte
nt du
ring o
live r
ipenin
g for
the d
iffere
nt cu
ltivar
s. Th
e valu
es re
pres
ent th
e mea
ns of
nine
repli
cates
, thre
e for
each
harve
st ye
ar (2
005-
2006
-200
7)
SD.
The
total
me
an an
d the
%RS
D we
re al
so ca
lculat
ed. M
eans
in th
e sam
e row
with
diffe
rent
lower
case
lette
rs dif
fer si
gnific
antly
. Mea
ns in
the s
ame c
olumn
with
diffe
rent
uppe
rcase
lette
rs dif
fer si
gnific
antly
. In
both
rows
and c
olumn
s: * *
* (p
≤ 0.
001)
, * *
(p ≤
0.01
), *
(p ≤
0.05
), n.s
. (no
t sign
ifican
t).
PL
L 2nd
Oct
17th
Oct
1st N
ov
16th
Nov
1st
Dec
16
th D
ec
31st
Dec
SD
Me
an
%RS
D Si
gn.
Cass
anes
e 1.1
4aA
0.95b
A 0.8
6cA
0.69d
B 0.5
5eD
0.42fD
0.4
4fC
0.27
0.72
37.84
* *
* Ot
tobra
tica
0.38fH
0.4
8eE
0.68d
B 0.7
5cA
0.78b
A 0.8
1aA
0.81a
A 0.1
7 0.6
7 25
.71
* * *
Sino
poles
e 0.6
5aD
0.58b
C 0.5
0cE
0.38d
G 0.3
9dE
0.26fF
0.3
1eD
0.14
0.44
32.60
* *
* Co
ratin
a 0.4
2bG
0.47a
E 0.3
9cG
0.40b
cFG
0.33e
F --
-- 0.0
5 0.4
0 12
.61
* * *
Itran
a 0.4
1cG
0.41c
F 0.4
6bF
0.49a
E 0.2
8dG
-- --
0.08
0.41
19.59
* *
* Le
ccino
0.4
9dE
0.54c
D 0.5
8bD
0.63a
C 0.5
9bC
-- --
0.05
0.57
9.40
* * *
Noce
llara
Mes
sines
e 0.6
7bCD
0.6
8bB
0.64c
C 0.5
9deD
0.7
7aA
0.61d
C 0.5
8eB
0.07
0.65
10.13
* *
* No
ciara
0.4
5fF
0.49e
E 0.5
6dD
0.69b
B 0.6
1cC
0.76a
B --
0.12
0.59
19.90
* *
* Pe
ndoli
no
0.72a
B 0.5
9bC
0.51c
E 0.4
1dF
0.38e
E 0.3
2fE
-- 0.1
5 0.4
9 30
.47
* * *
Pich
oline
0.6
8aC
0.69a
B 0.6
5bC
0.70a
B 0.6
9B
-- --
0.02
0.68
2.82
* * *
Sign
. * *
* * *
* * *
* * *
* * *
* * *
* * *
* --
-- --
--

La rivista itaLiana deLLe sostanze grasse - voL. XCi - ottoBre/diCeMBre 2014
232
Tabl
e VI
I - V
ariat
ion in
POL
n co
ntent
durin
g oli
ve ri
penin
g for
the d
iffere
nt cu
ltivar
s. Th
e va
lues r
epre
sent
the m
eans
of n
ine re
plica
tes, t
hree
for e
ach
harve
st ye
ar (2
005-
2006
-200
7)
SD.
The
tot
al me
an a
nd th
e %
RSD
were
also
calc
ulated
. Mea
ns in
the
same
row
with
differ
ent l
ower
case
lette
rs dif
fer s
ignific
antly
. Mea
ns in
the
same
colu
mn w
ith d
iffere
nt up
perca
se le
tters
differ
sig
nifica
ntly.
In bo
th ro
ws an
d colu
mns:
* * *
(p ≤
0.00
1), *
* (p
≤ 0.
01),
* (p
≤ 0.
05),
n.s. (
not s
ignific
ant).
POLn
2nd
Oct
17th
Oct
1st N
ov
16th
Nov
1st
Dec
16
th D
ec
31st
Dec
SD
Me
an
%RS
D Si
gn.
Cass
anes
e 1.3
4aA
1.03b
B 0.9
6cA
0.93d
A 0.7
4eC
0.70fB
0.6
2gB
0.24
0.90
27.09
* *
* Ot
tobra
tica
0.55b
H 0.4
9dH
0.49d
G 0.5
7bG
0.61a
F 0.5
2cC
0.41e
C 0.0
7 0.5
2 12
.51
* * *
Sino
poles
e 0.7
0bF
0.58c
G 0.5
2dF
0.70b
E 0.9
3aA
0.69b
B 0.7
1bA
0.13
0.69
18.64
* *
* Co
ratin
a 0.8
2aD
0.74b
E 0.6
3dE
0.70c
E 0.7
1cD
-- --
0.07
0.72
9.57
* * *
Itran
a 0.8
4aD
0.83a
C 0.7
2cI
0.75b
CD
0.63d
F --
-- 0.0
9 0.7
5 11
.43
* * *
Lecc
ino
0.74a
E 0.7
0bF
0.73a
C 0.6
5cF
0.68b
E --
-- 0.0
4 0.7
0 5.2
5 * *
* No
cella
ra M
essin
ese
0.30b
I 0.2
3cI
0.28b
H 0.2
9bH
0.34a
G 0.1
7dD
0.29b
D 0.0
6 0.2
7 20
.34
* * *
Nocia
ra
0.65c
G 0.7
3aE
0.70b
D 0.7
3aD
0.61d
F 0.6
8bB
-- 0.0
5 0.6
8 6.9
1 * *
* Pe
ndoli
no
1.29a
B 1.1
6bA
0.85d
B 0.7
9eB
0.85d
B 0.8
9cA
-- 0.2
0 0.9
7 20
.89
* * *
Pich
oline
0.8
8aC
0.80b
D 0.7
0dD
0.76c
C 0.7
0dDE
--
-- 0.0
8 0.7
7 9.8
5 * *
* Si
gn.
* * *
* * *
* * *
* * *
* * *
* * *
* * *
-- --
-- --
Tabl
e VIII
- Var
iation
in P
oPoP
conte
nt du
ring o
live r
ipenin
g for
the d
iffere
nt cu
ltivar
s. Th
e valu
es re
pres
ent t
he m
eans
of ni
ne re
plica
tes, t
hree
for e
ach h
arve
st ye
ar (2
005-
2006
-200
7)
SD.
The
tot
al me
an a
nd th
e %
RSD
were
also
calc
ulated
. Mea
ns in
the
same
row
with
differ
ent l
ower
case
lette
rs dif
fer s
ignific
antly
. Mea
ns in
the
same
colu
mn w
ith d
iffere
nt up
perca
se le
tters
differ
sig
nifica
ntly.
In bo
th ro
ws an
d colu
mns:
* * *
(p ≤
0.00
1), *
* (p
≤ 0.
01),
* (p
≤ 0.
05),
n.s. (
not s
ignific
ant),
n.d.
(not
detec
ted).
Po
PoP
2nd O
ct 17
th O
ct 1st
Nov
16
th N
ov
1st D
ec
16th
Dec
31
st D
ec
SD
Mean
%
RSD
Sign
. Ca
ssan
ese
0.15a
A 0.0
6cCD
0.0
3dDE
0.0
7bcA
0.0
6cBC
0.0
3dA
0.09b
A 0.0
4 0.0
7 58
.90
* * *
Ottob
ratic
a 0.0
7bB
0.06b
cCD
0.12a
A 0.0
4cBC
0.0
6bcB
C 0.0
4cA
0.04c
B 0.0
3 0.0
6 46
.45
* * *
Sino
poles
e 0.0
3aDE
0.0
3aEF
0.0
3aDE
0.0
4aBC
0.0
4aCD
E 0.0
4aA
0.03a
B 0.0
1 0.0
3 15
.59
n.s.
Cora
tina
0.08a
B 0.0
7aC
0.06a
bBC
0.04b
BC
0.04b
CDE
-- --
0.02
0.06
30.84
* *
* Itr
ana
0.07b
cB
0.13a
A 0.0
8bB
0.05c
ABC
0.13a
A --
-- 0.0
4 0.0
9 39
.49
* * *
Lecc
ino
0.04a
bCD
0.04a
bDE
0.02b
EF
0.06a
AB
0.03b
DE
-- --
0.01
0.04
39.03
* *
* No
cella
ra M
essin
ese
n.d.
0.02c
EF
n.d.
0.05b
ABC
n.d.
0.03b
cA
0.10a
A 0.0
4 0.0
3 12
8.48
* * *
Nocia
ra
0.01a
bEF
0.01a
bF
0.02a
EF
0.03a
C 0.0
2aEF
n.d
. --
0.01
0.02
69.92
* *
* Pe
ndoli
no
0.07b
B 0.1
0aB
0.05b
cBC
0.07b
A 0.0
5bcB
CD
0.04c
A --
0.02
0.06
34.11
* *
* Pi
choli
ne
0.06a
BC
0.03b
EF
0.05a
bCD
0.07a
A 0.0
7aB
-- --
0.02
0.06
29.88
* *
* Si
gn.
* * *
* * *
* * *
* * *
* * *
* * *
* * *
-- --
-- --

La rivista itaLiana deLLe sostanze grasse - voL. XCi - ottoBre/diCeMBre 2014
233
Tabl
e IX
- Va
riatio
n in
OOL
conte
nt du
ring
olive
ripe
ning
for th
e dif
feren
t cult
ivars.
The
value
s rep
rese
nt the
mea
ns o
f nine
repli
cates
, thr
ee fo
r eac
h ha
rvest
year
(200
5-20
06-2
007)
S
D. T
he
total
mean
and
the
%RS
D we
re a
lso c
alcula
ted. M
eans
in th
e sa
me ro
w wi
th dif
feren
t low
erca
se le
tters
differ
sign
ifican
tly. M
eans
in th
e sa
me c
olumn
with
diffe
rent
uppe
rcase
lette
rs dif
fer
signif
icantl
y. In
both
rows
and c
olumn
s: * *
* (p
≤ 0.
001)
, * *
(p ≤
0.01
), *
(p ≤
0.05
), n.s
. (no
t sign
ifican
t).
OO
L 2nd
Oct
17th
Oct
1st N
ov
16th
Nov
1st
Dec
16
th D
ec
31st
Dec
SD
Me
an
%RS
D Si
gn.
Cass
anes
e 16
.47dA
16
.89bA
17
.00aA
14
.23gC
16
.71cA
16
.16eB
15
.55fC
0.9
8 16
.14
6.05
* * *
Ottob
ratic
a 11
.57fF
12
.61eD
13
.49dC
14
.72cB
14
.85bD
15
.94aD
15
.94aB
1.6
7 14
.16
11.78
* *
* Si
nopo
lese
8.92e
H 9.5
0cI
10.11
aH
9.90b
I 8.9
1eI
9.51c
F 9.2
4dD
0.46
9.44
4.85
* * *
Cora
tina
10.92
eG
11.81
bG
12.35
aF
11.33
cH
11.19
dH
-- --
0.57
11.52
4.9
1 * *
* Itr
ana
8.93d
H 9.0
2cJ
9.23b
I 9.5
8aJ
8.53e
J --
-- 0.3
9 9.0
6 4.2
7 * *
* Le
ccino
11
.89eD
12
.57cE
13
.16aD
12
.86bE
12
.23dF
--
-- 0.5
0 12
.54
4.00
* * *
Noce
llara
Mes
sines
e 12
.64eC
13
.23cC
12
.89dE
12
.25fF
12
.26fE
19
.86bA
20
.82aA
3.7
8 14
.85
25.43
* *
* No
ciara
10
.90fG
11
.19eH
13
.50dC
14
.06cD
15
.01bC
16
.07aC
--
2.06
13.46
15
.33
* * *
Pend
olino
11
.78dE
11
.97aF
11
.75eG
11
.83cG
11
.75eG
11
.86bE
--
0.08
11.82
0.7
1 * *
* Pi
choli
ne
13.66
eB
14.79
dB
15.51
cB
16.08
aA
15.92
bB
-- --
0.99
15.19
6.5
2 * *
* Si
gn.
* * *
* * *
* * *
* * *
* * *
* * *
* * *
-- --
-- --
Tabl
e X
- Var
iation
in P
OL+P
oPO
conte
nt du
ring
olive
ripe
ning
for th
e dif
feren
t cult
ivars.
The
value
s rep
rese
nt the
mea
ns of
nine
repli
cates
, thr
ee fo
r eac
h ha
rvest
year
(200
5-20
06-2
007)
S
D.
The
total
mean
and
the
%RS
D we
re a
lso c
alcula
ted. M
eans
in th
e sa
me ro
w wi
th dif
feren
t low
erca
se le
tters
differ
sign
ifican
tly. M
eans
in th
e sa
me co
lumn
with
differ
ent u
pper
case
lette
rs dif
fer
signif
icantl
y. In
both
rows
and c
olumn
s: * *
* (p
≤ 0.
001)
, * *
(p ≤
0.01
), *
(p ≤
0.05
), n.s
. (no
t sign
ifican
t).
PO
L+Po
PO
2nd O
ct 17
th O
ct 1st
Nov
16
th N
ov
1st D
ec
16th
Dec
31
st D
ec
SD
Mean
%
RSD
Sign
. Ca
ssan
ese
9.75a
B 8.4
5bB
7.54c
B 6.6
4dE
6.30e
D 5.7
0fD
5.34g
C 1.5
8 7.1
0 22
.25
* * *
Ottob
ratic
a 6.3
9gF
6.69fD
6.8
6eC
7.30b
B 6.9
1dC
7.46a
C 7.0
7cB
0.36
6.95
5.24
* * *
Sino
poles
e 4.5
4dH
4.81b
H 5.0
6aH
4.67c
H 4.1
1fH
4.26e
F 4.1
1fD
0.36
4.51
8.08
* *
Cora
tina
4.98a
I 4.6
6bI
4.34c
J 3.7
9eJ
3.98d
I --
-- 0.4
9 4.3
5 11
.20
* * *
Itran
a 4.4
2dJ
4.62a
J 4.5
7bI
4.50c
I 3.7
4eJ
-- --
0.36
4.37
8.23
* * *
Lecc
ino
6.48d
D 6.5
2cE
6.74a
D 6.5
8bF
6.09e
E --
-- 0.2
4 6.4
8 3.7
2 * *
* No
cella
ra M
essin
ese
10.31
fA
12.02
cA
11.74
dA
12.27
bA
12.39
aA
10.04
gA
10.91
eA
0.96
11.38
8.4
2 * *
* No
ciara
5.4
8fG
5.51e
G 6.5
0dE
6.84c
C 7.4
5bB
7.77a
B --
0.96
6.59
14.51
* *
* Pe
ndoli
no
6.43a
E 6.0
8bF
5.44c
G 5.3
2dG
5.33d
G 4.7
4eE
-- 0.6
1 5.5
6 10
.91
* *
Pich
oline
6.8
9ac
6.81b
C 6.3
5dF
6.71c
D 5.8
3eF
-- --
0.44
6.52
6.72
* * *
Sign
. * *
* * *
* * *
* * *
* * *
* * *
* * *
* --
-- --
--
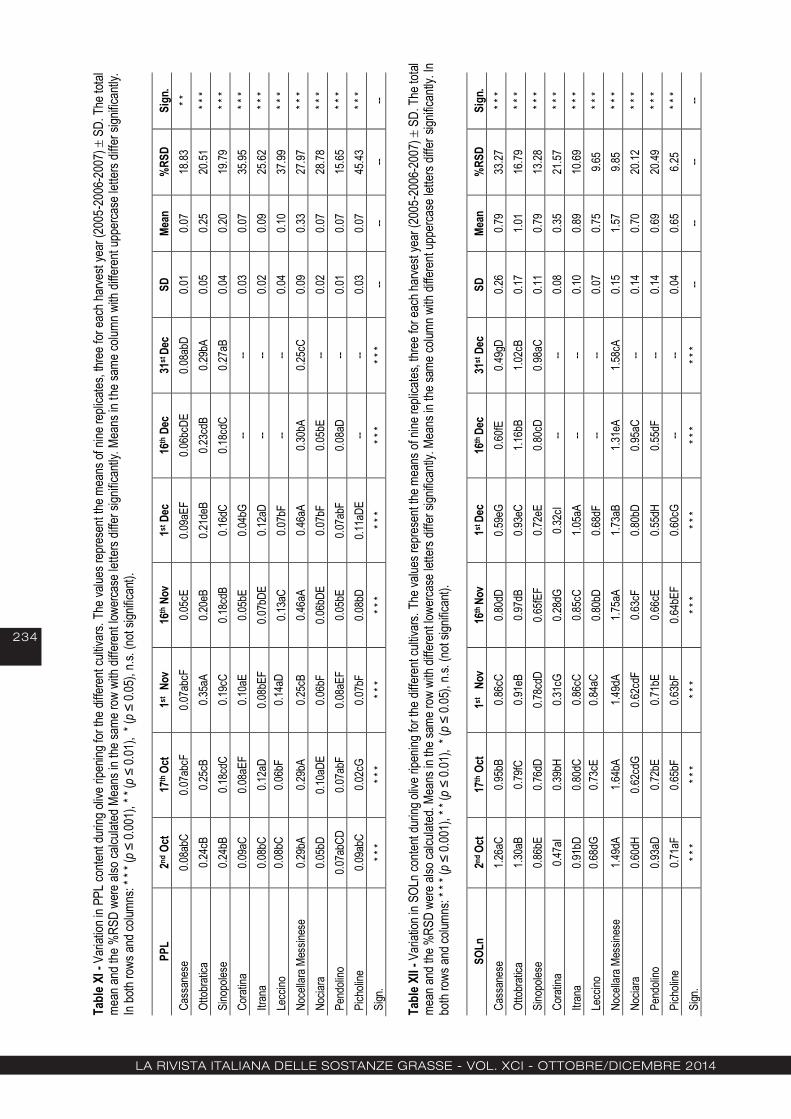
La rivista itaLiana deLLe sostanze grasse - voL. XCi - ottoBre/diCeMBre 2014
234
Tabl
e XI -
Var
iation
in P
PL co
ntent
durin
g oliv
e ripe
ning f
or th
e diffe
rent
cultiv
ars.
The v
alues
repr
esen
t the
mea
ns of
nine
repli
cates
, thre
e for
each
harve
st ye
ar (2
005-
2006
-200
7)
SD.
The
total
me
an an
d the
%RS
D we
re al
so ca
lculat
ed M
eans
in th
e sam
e row
with
diffe
rent
lower
case
lette
rs dif
fer si
gnific
antly
. Mea
ns in
the s
ame c
olumn
with
diffe
rent
uppe
rcase
lette
rs dif
fer si
gnific
antly
. In
both
rows
and c
olumn
s: * *
* (p
≤ 0.
001)
, * *
(p ≤
0.01
), *
(p ≤
0.05
), n.s
. (no
t sign
ifican
t).
PP
L 2nd
Oct
17th
Oct
1st
Nov
16
th N
ov
1st D
ec
16th
Dec
31
st D
ec
SD
Mean
%
RSD
Sign
. Ca
ssan
ese
0.08a
bC
0.07a
bcF
0.07a
bcF
0.05c
E 0.0
9aEF
0.0
6bcD
E 0.0
8abD
0.0
1 0.0
7 18
.83
* *
Ottob
ratic
a 0.2
4cB
0.25c
B 0.3
5aA
0.20e
B 0.2
1deB
0.2
3cdB
0.2
9bA
0.05
0.25
20.51
* *
* Si
nopo
lese
0.24b
B 0.1
8cdC
0.1
9cC
0.18c
dB
0.16d
C 0.1
8cdC
0.2
7aB
0.04
0.20
19.79
* *
* Co
ratin
a 0.0
9aC
0.08a
EF
0.10a
E 0.0
5bE
0.04b
G --
-- 0.0
3 0.0
7 35
.95
* * *
Itran
a 0.0
8bC
0.12a
D 0.0
8bEF
0.0
7bDE
0.1
2aD
-- --
0.02
0.09
25.62
* *
* Le
ccino
0.0
8bC
0.06b
F 0.1
4aD
0.13a
C 0.0
7bF
-- --
0.04
0.10
37.99
* *
* No
cella
ra M
essin
ese
0.29b
A 0.2
9bA
0.25c
B 0.4
6aA
0.46a
A 0.3
0bA
0.25c
C 0.0
9 0.3
3 27
.97
* * *
Nocia
ra
0.05b
D 0.1
0aDE
0.0
6bF
0.06b
DE
0.07b
F 0.0
5bE
-- 0.0
2 0.0
7 28
.78
* * *
Pend
olino
0.0
7abC
D 0.0
7abF
0.0
8aEF
0.0
5bE
0.07a
bF
0.08a
D --
0.01
0.07
15.65
* *
* Pi
choli
ne
0.09a
bC
0.02c
G 0.0
7bF
0.08b
D 0.1
1aDE
--
-- 0.0
3 0.0
7 45
.43
* * *
Sign
. * *
* * *
* * *
* * *
* * *
* * *
* * *
* --
-- --
-- Ta
ble X
II - V
ariat
ion in
SOL
n con
tent d
uring
olive
ripen
ing fo
r the
diffe
rent
cultiv
ars.
The v
alues
repr
esen
t the m
eans
of ni
ne re
plica
tes, th
ree f
or ea
ch ha
rvest
year
(200
5-20
06-2
007)
S
D. T
he to
tal
mean
and t
he %
RSD
were
also
calcu
lated
. Mea
ns in
the s
ame r
ow w
ith di
ffere
nt low
erca
se le
tters
differ
sign
ifican
tly. M
eans
in th
e sam
e colu
mn w
ith di
ffere
nt up
perca
se le
tters
differ
sign
ifican
tly. In
bo
th ro
ws an
d colu
mns:
* * *
(p ≤
0.00
1), *
* (p
≤ 0.
01),
* (p
≤ 0.
05),
n.s. (
not s
ignific
ant).
SOLn
2nd
Oct
17th
Oct
1st N
ov
16th
Nov
1st
Dec
16
th D
ec
31st
Dec
SD
Me
an
%RS
D Si
gn.
Cass
anes
e 1.2
6aC
0.95b
B 0.8
6cC
0.80d
D 0.5
9eG
0.60fE
0.4
9gD
0.26
0.79
33.27
* *
* Ot
tobra
tica
1.30a
B 0.7
9fC
0.91e
B 0.9
7dB
0.93e
C 1.1
6bB
1.02c
B 0.1
7 1.0
1 16
.79
* * *
Sino
poles
e 0.8
6bE
0.76d
D 0.7
8cdD
0.6
5fEF
0.72e
E 0.8
0cD
0.98a
C 0.1
1 0.7
9 13
.28
* * *
Cora
tina
0.47a
I 0.3
9bH
0.31c
G 0.2
8dG
0.32c
I --
-- 0.0
8 0.3
5 21
.57
* * *
Itran
a 0.9
1bD
0.80d
C 0.8
6cC
0.85c
C 1.0
5aA
-- --
0.10
0.89
10.69
* *
* Le
ccino
0.6
8dG
0.73c
E 0.8
4aC
0.80b
D 0.6
8dF
-- --
0.07
0.75
9.65
* * *
Noce
llara
Mes
sines
e 1.4
9dA
1.64b
A 1.4
9dA
1.75a
A 1.7
3aB
1.31e
A 1.5
8cA
0.15
1.57
9.85
* * *
Nocia
ra
0.60d
H 0.6
2cdG
0.6
2cdF
0.6
3cF
0.80b
D 0.9
5aC
-- 0.1
4 0.7
0 20
.12
* * *
Pend
olino
0.9
3aD
0.72b
E 0.7
1bE
0.66c
E 0.5
5dH
0.55d
F --
0.14
0.69
20.49
* *
* Pi
choli
ne
0.71a
F 0.6
5bF
0.63b
F 0.6
4bEF
0.6
0cG
-- --
0.04
0.65
6.25
* * *
Sign
. * *
* * *
* * *
* * *
* * *
* * *
* * *
* --
-- --
--

La rivista itaLiana deLLe sostanze grasse - voL. XCi - ottoBre/diCeMBre 2014
235
Tabl
e XI
II - V
ariat
ion in
OOO
conte
nt du
ring
olive
ripe
ning
for th
e diffe
rent
cultiv
ars.
The
value
s rep
rese
nt the
mea
ns of
nine
repli
cates
, thr
ee fo
r eac
h ha
rvest
year
(200
5-20
06-2
007)
S
D. T
he
total
mean
and
the
%RS
D we
re a
lso c
alcula
ted. M
eans
in th
e sa
me ro
w wi
th dif
feren
t low
erca
se le
tters
differ
sign
ifican
tly. M
eans
in th
e sa
me c
olumn
with
diffe
rent
uppe
rcase
lette
rs dif
fer
signif
icantl
y. In
both
rows
and c
olumn
s: * *
* (p
≤ 0.
001)
, * *
(p ≤
0.01
), *
(p ≤
0.05
), n.s
. (no
t sign
ifican
t).
OO
O 2nd
Oct
17th
Oct
1st
Nov
16
th N
ov
1st D
ec
16th
Dec
31
st D
ec
SD
Mean
%
RSD
Sign
. Ca
ssan
ese
31.96
gI 36
.10fI
38.40
eI 42
.23dD
43
.58cE
45
.00bC
47
.39aA
5.4
3 40
.67
13.34
* *
* Ot
tobra
tica
39.42
bG
38.91
cH
38.78
dH
38.18
fH
39.42
bH
38.32
eD
39.52
aC
0.55
38.94
1.4
0 *
* Si
nopo
lese
43.22
gC
43.89
fC
44.05
eD
45.28
dC
46.02
cC
46.38
bB
46.95
aB
1.42
45.11
3.1
4 * *
* Co
ratin
a 45
.56eA
47
.41dA
48
.33cA
51
.08aA
50
.82bA
--
-- 2.3
3 48
.64
4.80
* * *
Itran
a 44
.40dB
44
.25eB
45
.86cB
46
.59bB
48
.69aB
--
-- 1.8
2 45
.96
3.96
* * *
Lecc
ino
40.23
cE
40.45
bF
39.46
eF
39.86
dF
41.48
aG
-- --
0.76
40.30
1.8
9 * *
* No
cella
ra M
essin
ese
30.65
cJ
27.32
eJ
27.81
dJ
27.28
fI 26
.58gJ
33
.00aE
30
.94bD
2.4
3 29
.08
8.36
* * *
Nocia
ra
40.66
bD
41.26
aD
39.34
cG
38.82
dG
38.72
eI 38
.32fD
--
1.18
39.52
2.9
8 * *
* Pe
ndoli
no
39.90
fF
40.62
eE
44.11
dC
45.26
cC
45.41
bD
47.74
aA
-- 3.0
2 43
.84
6.89
* * *
Pich
oline
38
.17eH
39
.47dG
41
.01bE
40
.83cE
42
.60aF
--
-- 1.6
7 40
.42
4.14
* * *
Sign
. * *
* * *
* * *
* * *
* * *
* * *
* * *
* --
-- --
-- Ta
ble
XIV
- Var
iation
in P
OO+S
OL co
ntent
durin
g oli
ve ri
penin
g for
the
differ
ent c
ultiva
rs. T
he va
lues r
epre
sent
the m
eans
of n
ine re
plica
tes, t
hree
for e
ach
harve
st ye
ar (2
005-
2006
-200
7)
SD.
Th
e tot
al me
an a
nd th
e %
RSD
were
also
calc
ulated
. Mea
ns in
the
same
row
with
differ
ent l
ower
case
lette
rs dif
fer s
ignific
antly
. Mea
ns in
the
same
colu
mn w
ith d
iffere
nt up
perca
se le
tters
differ
sig
nifica
ntly.
In bo
th ro
ws an
d colu
mns:
* * *
(p ≤
0.00
1), *
* (p
≤ 0.
01),
* (p
≤ 0.
05),
n.s. (
not s
ignific
ant).
POO+
SOL
2nd O
ct 17
th O
ct 1st
Nov
16
th N
ov
1st D
ec
16th
Dec
31
st D
ec
SD
Mean
%
RSD
Sign
. Ca
ssan
ese
23.64
aI 22
.09bI
21.22
cH
20.38
dI 19
.02eJ
18
.96fF
18
.28gD
1.9
3 20
.51
9.42
* * *
Ottob
ratic
a 26
.03aE
26
.02bE
24
.89cE
23
.63dF
22
.93eF
21
.46fD
20
.96gB
2.0
6 23
.70
8.67
* * *
Sino
poles
e 26
.64aC
26
.36bC
25
.46cD
25
.34dB
25
.19eC
24
.33fA
23
.53gA
1.0
8 25
.26
4.28
* * *
Cora
tina
24.70
aH
22.84
bH
22.24
cG
21.65
eG
21.98
dG
-- --
1.21
22.68
5.3
3 * *
* Itr
ana
29.06
aA
28.92
bA
27.73
cA
26.88
dA
25.94
eB
-- --
1.33
27.71
4.8
1 * *
* Le
ccino
26
.37aD
26
.09bD
25
.48dD
25
.11eC
25
.97cA
--
-- 0.5
0 25
.80
1.95
* * *
Noce
llara
Mes
sines
e 20
.87aJ
20
.80bJ
20
.53cI
20.05
dJ
19.79
fI 19
.71gE
20
.02eC
0.4
8 20
.25
2.35
* * *
Nocia
ra
27.75
aB
27.36
bB
25.71
cB
24.38
dE
23.78
eE
22.30
fC
-- 2.1
2 25
.21
8.42
* * *
Pend
olino
25
.87bF
25
.93aF
25
.51cC
24
.70dD
24
.49eD
22
.86fB
--
1.16
24.89
4.6
7 * *
* Pi
choli
ne
25.45
aG
23.98
bG
22.38
cF
20.70
eH
20.88
dH
-- --
2.04
22.68
8.9
9 * *
* Si
gn.
* * *
* * *
* * *
* * *
* * *
* * *
* * *
-- --
-- --
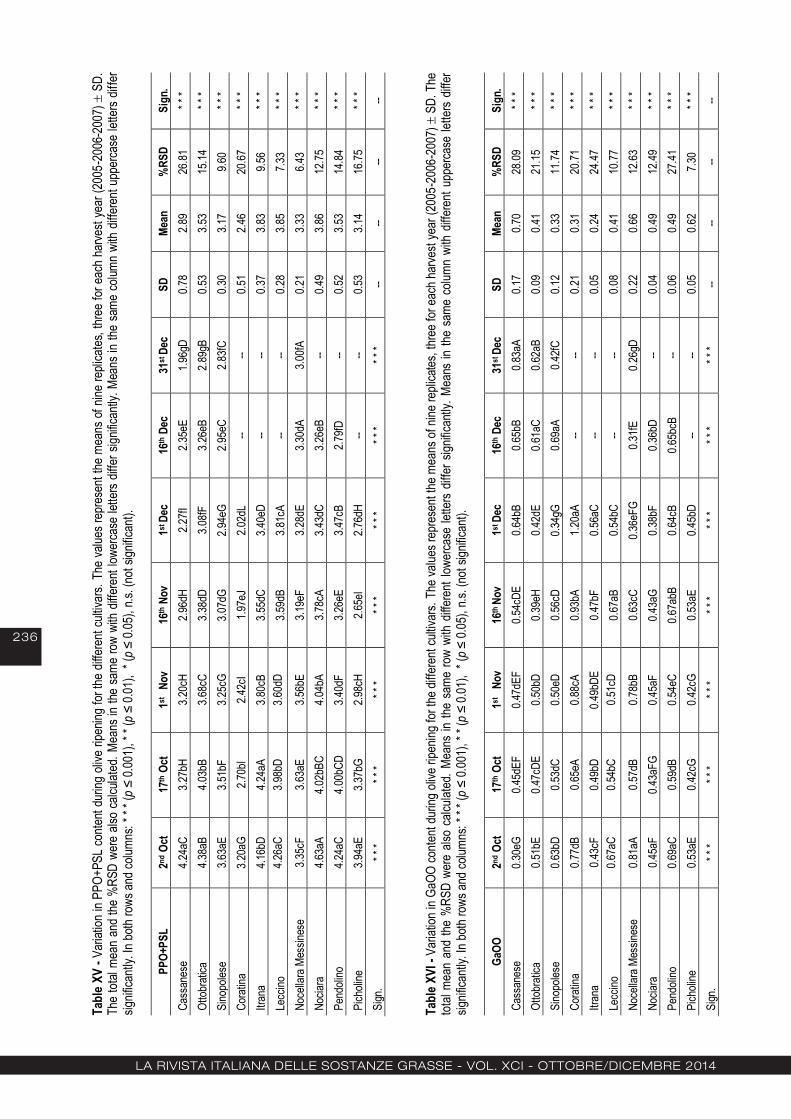
La rivista itaLiana deLLe sostanze grasse - voL. XCi - ottoBre/diCeMBre 2014
236
Tabl
e XV
- Va
riatio
n in
PPO+
PSL
conte
nt du
ring
olive
ripe
ning
for th
e dif
feren
t cult
ivars.
The
value
s rep
rese
nt the
mea
ns of
nine
repli
cates
, thr
ee fo
r eac
h ha
rvest
year
(200
5-20
06-2
007)
S
D.
The
total
mean
and
the
%RS
D we
re a
lso ca
lculat
ed. M
eans
in th
e sa
me ro
w wi
th dif
feren
t low
erca
se le
tters
differ
sign
ifican
tly. M
eans
in th
e sa
me co
lumn
with
differ
ent u
pper
case
lette
rs dif
fer
signif
icantl
y. In
both
rows
and c
olumn
s: * *
* (p
≤ 0.
001)
, * *
(p ≤
0.01
), *
(p ≤
0.05
), n.s
. (no
t sign
ifican
t).
PP
O+PS
L 2nd
Oct
17th
Oct
1st N
ov
16th
Nov
1st
Dec
16
th D
ec
31st
Dec
SD
Me
an
%RS
D Si
gn.
Cass
anes
e 4.2
4aC
3.27b
H 3.2
0cH
2.96d
H 2.2
7fI
2.35e
E 1.9
6gD
0.78
2.89
26.81
* *
* Ot
tobra
tica
4.38a
B 4.0
3bB
3.68c
C 3.3
8dD
3.08fF
3.2
6eB
2.89g
B 0.5
3 3.5
3 15
.14
* * *
Sino
poles
e 3.6
3aE
3.51b
F 3.2
5cG
3.07d
G 2.9
4eG
2.95e
C 2.8
3fC
0.30
3.17
9.60
* * *
Cora
tina
3.20a
G 2.7
0bI
2.42c
I 1.9
7eJ
2.02d
L --
-- 0.5
1 2.4
6 20
.67
* * *
Itran
a 4.1
6bD
4.24a
A 3.8
0cB
3.55d
C 3.4
0eD
-- --
0.37
3.83
9.56
* * *
Lecc
ino
4.26a
C 3.9
8bD
3.60d
D 3.5
9dB
3.81c
A --
-- 0.2
8 3.8
5 7.3
3 * *
* No
cella
ra M
essin
ese
3.35c
F 3.6
3aE
3.56b
E 3.1
9eF
3.28d
E 3.3
0dA
3.00fA
0.2
1 3.3
3 6.4
3 * *
* No
ciara
4.6
3aA
4.02b
BC
4.04b
A 3.7
8cA
3.43d
C 3.2
6eB
-- 0.4
9 3.8
6 12
.75
* * *
Pend
olino
4.2
4aC
4.00b
CD
3.40d
F 3.2
6eE
3.47c
B 2.7
9fD
-- 0.5
2 3.5
3 14
.84
* * *
Pich
oline
3.9
4aE
3.37b
G 2.9
8cH
2.65e
I 2.7
6dH
-- --
0.53
3.14
16.75
* *
* Si
gn.
* * *
* * *
* * *
* * *
* * *
* * *
* * *
-- --
-- --
Tabl
e XVI
- Va
riatio
n in
GaOO
conte
nt du
ring o
live r
ipenin
g for
the d
iffere
nt cu
ltivar
s. Th
e valu
es re
pres
ent t
he m
eans
of ni
ne re
plica
tes, t
hree
for e
ach h
arve
st ye
ar (2
005-
2006
-200
7)
SD.
The
tot
al me
an a
nd th
e %
RSD
were
also
calc
ulated
. Mea
ns in
the
same
row
with
differ
ent l
ower
case
lette
rs dif
fer s
ignific
antly
. Mea
ns in
the
same
colu
mn w
ith d
iffere
nt up
perca
se le
tters
differ
sig
nifica
ntly.
In bo
th ro
ws an
d colu
mns:
* * *
(p ≤
0.00
1), *
* (p
≤ 0.
01),
* (p
≤ 0.
05),
n.s. (
not s
ignific
ant).
GaOO
2nd
Oct
17th
Oct
1st N
ov
16th
Nov
1st
Dec
16
th D
ec
31st
Dec
SD
Me
an
%RS
D Si
gn.
Cass
anes
e 0.3
0eG
0.45d
EF
0.47d
EF
0.54c
DE
0.64b
B 0.6
5bB
0.83a
A 0.1
7 0.7
0 28
.09
* * *
Ottob
ratic
a 0.5
1bE
0.47c
DE
0.50b
D 0.3
9eH
0.42d
E 0.6
1aC
0.62a
B 0.0
9 0.4
1 21
.15
* * *
Sino
poles
e 0.6
3bD
0.53d
C 0.5
0eD
0.56c
D 0.3
4gG
0.69a
A 0.4
2fC
0.12
0.33
11.74
* *
* Co
ratin
a 0.7
7dB
0.65e
A 0.8
8cA
0.93b
A 1.2
0aA
-- --
0.21
0.31
20.71
* *
* Itr
ana
0.43c
F 0.4
9bD
0.49b
DE
0.47b
F 0.5
6aC
-- --
0.05
0.24
24.47
* *
* Le
ccino
0.6
7aC
0.54b
C 0.5
1cD
0.67a
B 0.5
4bC
-- --
0.08
0.41
10.77
* *
* No
cella
ra M
essin
ese
0.81a
A 0.5
7dB
0.78b
B 0.6
3cC
0.36e
FG
0.31fE
0.2
6gD
0.22
0.66
12.63
* *
* No
ciara
0.4
5aF
0.43a
FG
0.45a
F 0.4
3aG
0.38b
F 0.3
6bD
-- 0.0
4 0.4
9 12
.49
* * *
Pend
olino
0.6
9aC
0.59d
B 0.5
4eC
0.67a
bB
0.64c
B 0.6
5bcB
--
0.06
0.49
27.41
* *
* Pi
choli
ne
0.53a
E 0.4
2cG
0.42c
G 0.5
3aE
0.45b
D --
-- 0.0
5 0.6
2 7.3
0 * *
* Si
gn.
* * *
* * *
* * *
* * *
* * *
* * *
* * *
-- --
-- --
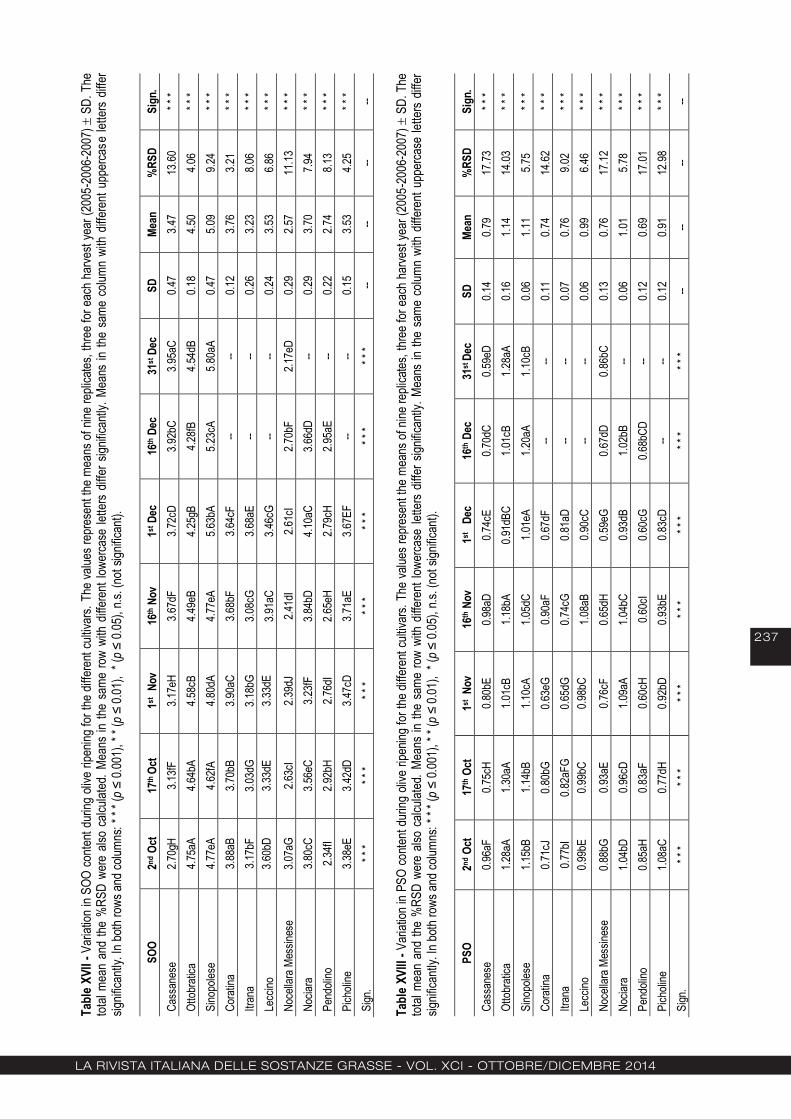
La rivista itaLiana deLLe sostanze grasse - voL. XCi - ottoBre/diCeMBre 2014
237
Tabl
e XV
II - V
ariat
ion in
SOO
conte
nt du
ring
olive
ripe
ning f
or th
e diffe
rent
cultiv
ars.
The v
alues
repr
esen
t the
mea
ns o
f nine
repli
cates
, thr
ee fo
r eac
h ha
rvest
year
(200
5-20
06-2
007)
S
D. T
he
total
mean
and
the
%RS
D we
re a
lso c
alcula
ted. M
eans
in th
e sa
me ro
w wi
th dif
feren
t low
erca
se le
tters
differ
sign
ifican
tly. M
eans
in th
e sa
me c
olumn
with
diffe
rent
uppe
rcase
lette
rs dif
fer
signif
icantl
y. In
both
rows
and c
olumn
s: * *
* (p
≤ 0.
001)
, * *
(p ≤
0.01
), *
(p ≤
0.05
), n.s
. (no
t sign
ifican
t).
SO
O 2nd
Oct
17th
Oct
1st
Nov
16
th N
ov
1st D
ec
16th
Dec
31
st D
ec
SD
Mean
%
RSD
Sign
. Ca
ssan
ese
2.70g
H 3.1
3fF
3.17e
H 3.6
7dF
3.72c
D 3.9
2bC
3.95a
C 0.4
7 3.4
7 13
.60
* * *
Ottob
ratic
a 4.7
5aA
4.64b
A 4.5
8cB
4.49e
B 4.2
5gB
4.28fB
4.5
4dB
0.18
4.50
4.06
* * *
Sino
poles
e 4.7
7eA
4.62fA
4.8
0dA
4.77e
A 5.6
3bA
5.23c
A 5.8
0aA
0.47
5.09
9.24
* * *
Cora
tina
3.88a
B 3.7
0bB
3.90a
C 3.6
8bF
3.64c
F --
-- 0.1
2 3.7
6 3.2
1 * *
* Itr
ana
3.17b
F 3.0
3dG
3.18b
G 3.0
8cG
3.68a
E --
-- 0.2
6 3.2
3 8.0
6 * *
* Le
ccino
3.6
0bD
3.33d
E 3.3
3dE
3.91a
C 3.4
6cG
-- --
0.24
3.53
6.86
* * *
Noce
llara
Mes
sines
e 3.0
7aG
2.63c
I 2.3
9dJ
2.41d
I 2.6
1cI
2.70b
F 2.1
7eD
0.29
2.57
11.13
* *
* No
ciara
3.8
0cC
3.56e
C 3.2
3fF
3.84b
D 4.1
0aC
3.66d
D --
0.29
3.70
7.94
* * *
Pend
olino
2.3
4fI
2.92b
H 2.7
6dI
2.65e
H 2.7
9cH
2.95a
E --
0.22
2.74
8.13
* * *
Pich
oline
3.3
8eE
3.42d
D 3.4
7cD
3.71a
E 3.6
7EF
-- --
0.15
3.53
4.25
* * *
Sign
. * *
* * *
* * *
* * *
* * *
* * *
* * *
* --
-- --
-- Ta
ble
XVIII
- Var
iation
in P
SO co
ntent
durin
g oli
ve ri
penin
g for
the d
iffere
nt cu
ltivar
s. Th
e va
lues r
epre
sent
the m
eans
of n
ine re
plica
tes, t
hree
for e
ach
harve
st ye
ar (2
005-
2006
-200
7)
SD.
The
tot
al me
an a
nd th
e %
RSD
were
also
calc
ulated
. Mea
ns in
the
same
row
with
differ
ent l
ower
case
lette
rs dif
fer s
ignific
antly
. Mea
ns in
the
same
colu
mn w
ith d
iffere
nt up
perca
se le
tters
differ
sig
nifica
ntly.
In bo
th ro
ws an
d colu
mns:
* * *
(p ≤
0.00
1), *
* (p
≤ 0.
01),
* (p
≤ 0.
05),
n.s. (
not s
ignific
ant).
PSO
2nd O
ct 17
th O
ct 1st
Nov
16
th N
ov
1st D
ec
16th
Dec
31
st D
ec
SD
Mean
%
RSD
Sign
. Ca
ssan
ese
0.96a
F 0.7
5cH
0.80b
E 0.9
8aD
0.74c
E 0.7
0dC
0.59e
D 0.1
4 0.7
9 17
.73
* * *
Ottob
ratic
a 1.2
8aA
1.30a
A 1.0
1cB
1.18b
A 0.9
1dBC
1.0
1cB
1.28a
A 0.1
6 1.1
4 14
.03
* * *
Sino
poles
e 1.1
5bB
1.14b
B 1.1
0cA
1.05d
C 1.0
1eA
1.20a
A 1.1
0cB
0.06
1.11
5.75
* * *
Cora
tina
0.71c
J 0.8
0bG
0.63e
G 0.9
0aF
0.67d
F --
-- 0.1
1 0.7
4 14
.62
* * *
Itran
a 0.7
7bI
0.82a
FG
0.65d
G 0.7
4cG
0.81a
D --
-- 0.0
7 0.7
6 9.0
2 * *
* Le
ccino
0.9
9bE
0.99b
C 0.9
8bC
1.08a
B 0.9
0cC
-- --
0.06
0.99
6.46
* * *
Noce
llara
Mes
sines
e 0.8
8bG
0.93a
E 0.7
6cF
0.65d
H 0.5
9eG
0.67d
D 0.8
6bC
0.13
0.76
17.12
* *
* No
ciara
1.0
4bD
0.96c
D 1.0
9aA
1.04b
C 0.9
3dB
1.02b
B --
0.06
1.01
5.78
* * *
Pend
olino
0.8
5aH
0.83a
F 0.6
0cH
0.60c
I 0.6
0cG
0.68b
CD
-- 0.1
2 0.6
9 17
.01
* * *
Pich
oline
1.0
8aC
0.77d
H 0.9
2bD
0.93b
E 0.8
3cD
-- --
0.12
0.91
12.98
* *
* Si
gn.
* * *
* * *
* * *
* * *
* * *
* * *
* * *
-- --
-- --

La rivista itaLiana deLLe sostanze grasse - voL. XCi - ottoBre/diCeMBre 2014
238
Tabl
e XI
X - V
ariat
ion in
SSO
conte
nt du
ring
olive
ripe
ning f
or th
e dif
feren
t cult
ivars.
The
value
s rep
rese
nt the
mea
ns o
f nine
repli
cates
, thr
ee fo
r eac
h ha
rvest
year
(200
5-20
06-2
007)
S
D. T
he
total
mean
and
the
%RS
D we
re a
lso c
alcula
ted. M
eans
in th
e sa
me ro
w wi
th dif
feren
t low
erca
se le
tters
differ
sign
ifican
tly. M
eans
in th
e sa
me c
olumn
with
diffe
rent
uppe
rcase
lette
rs dif
fer
signif
icantl
y. In
both
rows
and c
olumn
s: * *
* (p
≤ 0.
001)
, * *
(p ≤
0.01
), *
(p ≤
0.05
), n.s
. (no
t sign
ifican
t).
SS
O 2nd
Oct
17th
Oct
1st N
ov
16th
Nov
1st
Dec
16
th D
ec
31st
Dec
SD
Me
an
%RS
D Si
gn.
Cass
anes
e 0.3
3eI
0.41d
F 0.3
9dF
0.47b
F 0.4
4cG
0.40d
E 0.5
0aD
0.06
0.42
13.33
* *
* Ot
tobra
tica
0.65b
C 0.5
7cD
0.25d
G 0.6
3bC
0.74a
C 0.7
3aB
0.65b
B 0.1
7 0.6
0 27
.57
* * *
Sino
poles
e 0.8
7cB
0.78d
B 0.8
8cA
0.78d
A 0.9
6bA
0.95b
A 1.0
1aA
0.09
0.89
10.01
* *
* Co
ratin
a 0.6
1bDE
0.6
9aC
0.61b
C 0.5
7cDE
0.5
9bcD
--
-- 0.0
5 0.6
1 7.4
3 * *
* Itr
ana
0.60c
E 0.4
8dE
0.48d
E 0.6
3bC
0.86a
B --
-- 0.1
6 0.6
1 25
.50
* * *
Lecc
ino
0.63c
CD
0.71b
C 0.8
8aA
0.63c
C 0.6
0dD
-- --
0.11
0.69
16.49
* *
* No
cella
ra M
essin
ese
0.91b
A 1.0
5aA
0.84c
B 0.6
7dB
0.53fF
0.3
9gE
0.59e
C 0.2
3 0.7
1 32
.63
* * *
Nocia
ra
0.40d
G 0.4
3cF
0.58a
D 0.5
9aD
0.46b
G 0.4
6bD
-- 0.0
8 0.4
9 16
.32
* * *
Pend
olino
0.6
4aC
0.56b
cD
0.49d
E 0.5
5cE
0.45e
G 0.5
8bC
-- 0.0
7 0.5
5 12
.32
* * *
Pich
oline
0.5
6aF
0.47b
E 0.4
7bE
0.47b
F 0.5
6aE
-- --
0.05
0.51
9.74
* * *
Sign
. * *
* * *
* * *
* * *
* * *
* * *
* * *
* --
-- --
-- Ta
ble X
X - V
ariat
ion in
ECN
42 co
ntent
durin
g oliv
e ripe
ning f
or th
e diffe
rent
cultiv
ars.
The v
alues
repr
esen
t the
mea
ns of
nine
repli
cates
, thr
ee fo
r eac
h har
vest
year
(200
5-20
06-2
007)
S
D. T
he
total
mean
and
the
%RS
D we
re a
lso c
alcula
ted. M
eans
in th
e sa
me ro
w wi
th dif
feren
t low
erca
se le
tters
differ
sign
ifican
tly. M
eans
in th
e sa
me c
olumn
with
diffe
rent
uppe
rcase
lette
rs dif
fer
signif
icantl
y. In
both
rows
and c
olumn
s: * *
* (p
≤ 0.
001)
, * *
(p ≤
0.01
), *
(p ≤
0.05
), n.s
. (no
t sign
ifican
t).
EC
N 42
2nd
Oct
17th
Oct
1st N
ov
16th
Nov
1st
Dec
16
th D
ec
31st
Dec
SD
Me
an
%RS
D Si
gn.
Cass
anes
e 0.9
8aA
0.87b
A 0.7
0cdA
0.7
2cB
0.69d
B 0.5
2eBC
0.4
0fC
0.20
0.70
28.09
* *
* Ot
tobra
tica
0.37c
E 0.2
8dG
0.37c
G 0.3
5cF
0.50a
D 0.5
1aC
0.46b
B 0.0
9 0.4
1 21
.15
* * *
Sino
poles
e 0.3
6bEF
0.2
9cFG
0.3
0cH
0.34b
F 0.3
9aE
0.29c
E 0.3
5bD
0.04
0.33
11.74
* *
* Co
ratin
a 0.3
4bF
0.40a
E 0.3
0cH
0.25d
G 0.2
5dG
-- --
0.06
0.31
20.71
* *
* Itr
ana
0.28b
G 0.3
1aF
0.24c
I 0.2
1dH
0.16e
H --
-- 0.0
6 0.2
4 24
.47
* * *
Lecc
ino
0.38d
E 0.4
1cE
0.47a
E 0.4
4bE
0.36d
F --
-- 0.0
4 0.4
1 10
.77
* * *
Noce
llara
Mes
sines
e 0.6
0dC
0.68c
B 0.6
7cB
0.80a
A 0.7
2bA
0.61d
A 0.5
5eA
0.08
0.66
12.63
* *
* No
ciara
0.4
8cD
0.46c
D 0.5
4aD
0.51b
D 0.3
8dEF
0.5
4aB
-- 0.0
6 0.4
9 12
.49
* * *
Pend
olino
0.6
5aB
0.67a
BC
0.40c
F 0.4
3bE
0.36d
F 0.4
3bD
-- 0.1
3 0.4
9 27
.41
* * *
Pich
oline
0.6
0bC
0.65a
C 0.6
4aC
0.66a
C 0.5
5cC
-- --
0.05
0.62
7.30
* * *
Sign
. * *
* * *
* * *
* * *
* * *
* * *
* * *
* --
-- --
--
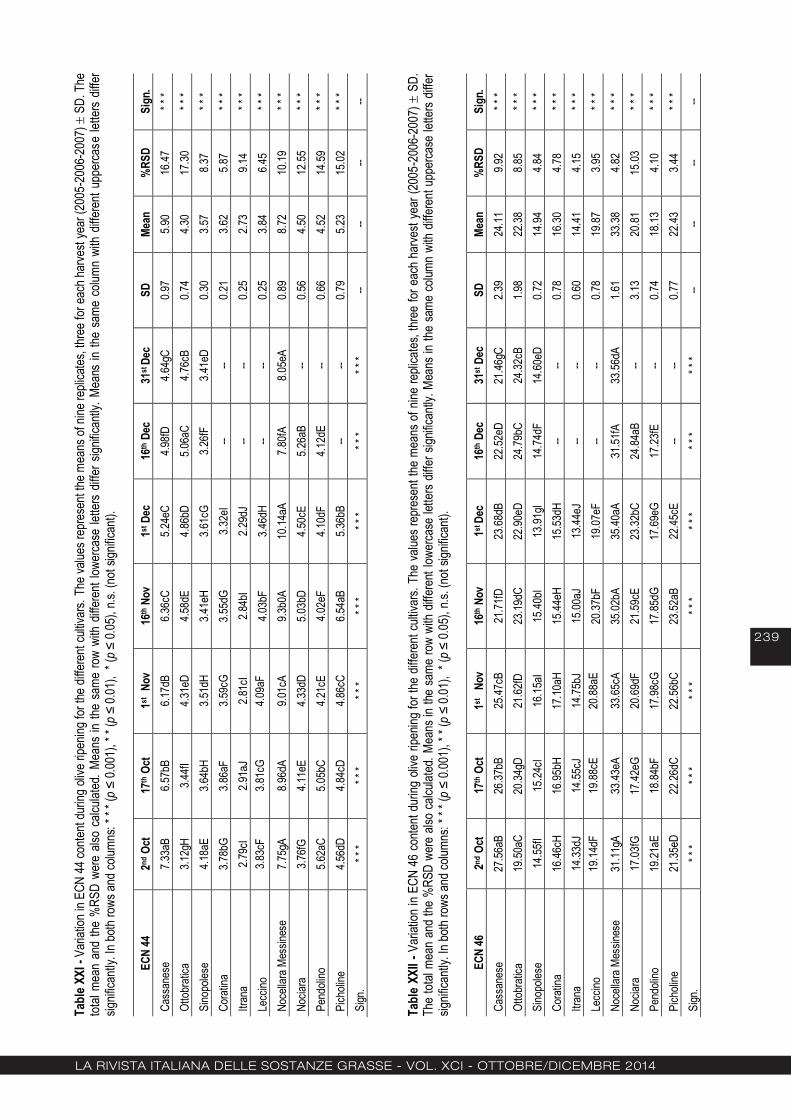
La rivista itaLiana deLLe sostanze grasse - voL. XCi - ottoBre/diCeMBre 2014
239
Tabl
e XXI
- Va
riatio
n in E
CN 44
conte
nt du
ring o
live r
ipenin
g for
the d
iffere
nt cu
ltivar
s. Th
e valu
es re
pres
ent th
e mea
ns of
nine
repli
cates
, thre
e for
each
harve
st ye
ar (2
005-
2006
-200
7)
SD.
The
tot
al me
an a
nd th
e %
RSD
were
also
calc
ulated
. Mea
ns in
the
same
row
with
differ
ent l
ower
case
lette
rs dif
fer s
ignific
antly
. Mea
ns in
the
same
colu
mn w
ith d
iffere
nt up
perca
se le
tters
differ
sig
nifica
ntly.
In bo
th ro
ws an
d colu
mns:
* * *
(p ≤
0.00
1), *
* (p
≤ 0.
01),
* (p
≤ 0.
05),
n.s. (
not s
ignific
ant).
ECN
44
2nd O
ct 17
th O
ct 1st
Nov
16
th N
ov
1st D
ec
16th
Dec
31
st D
ec
SD
Mean
%
RSD
Sign
. Ca
ssan
ese
7.33a
B 6.5
7bB
6.17d
B 6.3
6cC
5.24e
C 4.9
8fD
4.64g
C 0.9
7 5.9
0 16
.47
* * *
Ottob
ratic
a 3.1
2gH
3.44fI
4.3
1eD
4.58d
E 4.8
6bD
5.06a
C 4.7
6cB
0.74
4.30
17.30
* *
* Si
nopo
lese
4.18a
E 3.6
4bH
3.51d
H 3.4
1eH
3.61c
G 3.2
6fF
3.41e
D 0.3
0 3.5
7 8.3
7 * *
* Co
ratin
a 3.7
8bG
3.86a
F 3.5
9cG
3.55d
G 3.3
2eI
-- --
0.21
3.62
5.87
* * *
Itran
a 2.7
9cI
2.91a
J 2.8
1cI
2.84b
I 2.2
9dJ
-- --
0.25
2.73
9.14
* * *
Lecc
ino
3.83c
F 3.8
1cG
4.09a
F 4.0
3bF
3.46d
H --
-- 0.2
5 3.8
4 6.4
5 * *
* No
cella
ra M
essin
ese
7.75g
A 8.9
6dA
9.01c
A 9.3
b0A
10.14
aA
7.80fA
8.0
5eA
0.89
8.72
10.19
* *
* No
ciara
3.7
6fG
4.11e
E 4.3
3dD
5.03b
D 4.5
0cE
5.26a
B --
0.56
4.50
12.55
* *
* Pe
ndoli
no
5.62a
C 5.0
5bC
4.21c
E 4.0
2eF
4.10d
F 4.1
2dE
-- 0.6
6 4.5
2 14
.59
* * *
Pich
oline
4.5
6dD
4.84c
D 4.8
6cC
6.54a
B 5.3
6bB
-- --
0.79
5.23
15.02
* *
* Si
gn.
* * *
* * *
* * *
* * *
* * *
* * *
* * *
-- --
-- --
Tabl
e XX
II - V
ariat
ion in
ECN
46
conte
nt du
ring
olive
ripe
ning
for th
e dif
feren
t cult
ivars.
The
value
s rep
rese
nt the
mea
ns o
f nine
repli
cates
, thr
ee fo
r eac
h ha
rvest
year
(200
5-20
06-2
007)
S
D.
The
total
mean
and
the
%RS
D we
re a
lso ca
lculat
ed. M
eans
in th
e sa
me ro
w wi
th dif
feren
t low
erca
se le
tters
differ
sign
ifican
tly. M
eans
in th
e sa
me co
lumn
with
differ
ent u
pper
case
lette
rs dif
fer
signif
icantl
y. In
both
rows
and c
olumn
s: * *
* (p
≤ 0.
001)
, * *
(p ≤
0.01
), *
(p ≤
0.05
), n.s
. (no
t sign
ifican
t).
EC
N 46
2nd
Oct
17th
Oct
1st N
ov
16th
Nov
1st
Dec
16
th D
ec
31st
Dec
SD
Me
an
%RS
D Si
gn.
Cass
anes
e 27
.56aB
26
.37bB
25
.47cB
21
.71fD
23
.68dB
22
.52eD
21
.46gC
2.3
9 24
.11
9.92
* * *
Ottob
ratic
a 19
.50aC
20
.34gD
21
.62fD
23
.19dC
22
.90eD
24
.79bC
24
.32cB
1.9
8 22
.38
8.85
* * *
Sino
poles
e 14
.55fI
15.24
cI 16
.15aI
15.40
bI 13
.91gI
14.74
dF
14.60
eD
0.72
14.94
4.8
4 * *
* Co
ratin
a 16
.46cH
16
.95bH
17
.10aH
15
.44eH
15
.53dH
--
-- 0.7
8 16
.30
4.78
* * *
Itran
a 14
.33dJ
14
.55cJ
14
.75bJ
15
.00aJ
13
.44eJ
--
-- 0.6
0 14
.41
4.15
* * *
Lecc
ino
19.14
dF
19.88
cE
20.88
aE
20.37
bF
19.07
eF
-- --
0.78
19.87
3.9
5 * *
* No
cella
ra M
essin
ese
31.11
gA
33.43
eA
33.65
cA
35.02
bA
35.40
aA
31.51
fA
33.56
dA
1.61
33.38
4.8
2 * *
* No
ciara
17
.03fG
17
.42eG
20
.69dF
21
.59cE
23
.32bC
24
.84aB
--
3.13
20.81
15
.03
* * *
Pend
olino
19
.21aE
18
.84bF
17
.98cG
17
.85dG
17
.69eG
17
.23fE
--
0.74
18.13
4.1
0 * *
* Pi
choli
ne
21.35
eD
22.26
dC
22.56
bC
23.52
aB
22.45
cE
-- --
0.77
22.43
3.4
4 * *
* Si
gn.
* * *
* * *
* * *
* * *
* * *
* * *
* * *
-- --
-- --

La rivista itaLiana deLLe sostanze grasse - voL. XCi - ottoBre/diCeMBre 2014
240
Tabl
e XX
III - V
ariat
ion in
ECN
48
conte
nt du
ring
olive
ripe
ning f
or th
e dif
feren
t cult
ivars.
The
value
s rep
rese
nt the
mea
ns o
f nine
repli
cates
, thr
ee fo
r eac
h ha
rvest
year
(200
5-20
06-2
007)
S
D.
The
total
mean
and
the
%RS
D we
re a
lso ca
lculat
ed. M
eans
in th
e sa
me ro
w wi
th dif
feren
t low
erca
se le
tters
differ
sign
ifican
tly. M
eans
in th
e sa
me co
lumn
with
differ
ent u
pper
case
lette
rs dif
fer
signif
icantl
y. In
both
rows
and c
olumn
s: * *
* (p
≤ 0.
001)
, * *
(p ≤
0.01
), *
(p ≤
0.05
), n.s
. (no
t sign
ifican
t).
EC
N 48
2nd
Oct
17th
Oct
1st
Nov
16
th N
ov
1st D
ec
16th
Dec
31
st D
ec
SD
Mean
%
RSD
Sign
. Ca
ssan
ese
59.83
gI 61
.46fI
62.82
eI 65
.57cG
64
.86dI
66.31
bC
67.63
aB
2.80
64.07
4.3
6 * *
* Ot
tobra
tica
69.83
aG
68.96
bG
67.35
cG
65.19
eH
65.43
dH
63.04
gE
63.37
fC
2.64
66.17
3.9
9 * *
* Si
nopo
lese
73.49
eB
73.76
bB
72.76
gD
73.69
cC
74.15
aC
73.66
dA
73.31
fA
0.43
73.55
0.5
9 * *
* Co
ratin
a 73
.46cC
72
.95eC
72
.99dC
74
.70bB
74
.82aB
--
-- 0.9
1 73
.78
1.24
* * *
Itran
a 77
.62bA
77
.40cA
77
.40cA
77
.02dA
78
.03aA
--
-- 0.3
7 77
.49
0.48
* * *
Lecc
ino
70.76
bE
70.33
cF
68.87
dF
68.87
dE
71.63
aE
-- --
1.21
70.09
1.7
3 * *
* No
cella
ra M
essin
ese
54.87
bJ
51.75
eJ
51.90
dJ
50.52
fJ 49
.65gJ
56
.01aF
53
.96cD
2.3
4 52
.67
4.44
* * *
Nocia
ra
73.04
aD
72.64
bD
69.09
cE
66.97
dF
65.93
eG
63.88
fD
-- 3.7
0 68
.59
5.39
* * *
Pend
olino
70
.01eF
70
.54dE
73
.02cB
73
.23bD
73
.37aD
73
.38aB
--
1.55
72.26
2.1
5 * *
* Pi
choli
ne
67.56
aH
66.83
bH
66.37
cH
64.18
eI 66
.23dF
--
-- 1.2
6 66
.23
1.90
* * *
Sign
. * *
* * *
* * *
* * *
* * *
* * *
* * *
* --
-- --
-- Ta
ble
XXIV
- Va
riatio
n in
ECN
50 co
ntent
durin
g oli
ve ri
penin
g for
the
differ
ent c
ultiva
rs. T
he va
lues r
epre
sent
the m
eans
of n
ine re
plica
tes, t
hree
for e
ach
harve
st ye
ar (2
005-
2006
-200
7)
SD.
Th
e tot
al me
an a
nd th
e %
RSD
were
also
calcu
lated
. Mea
ns in
the
same
row
with
differ
ent l
ower
case
lette
rs dif
fer si
gnific
antly
. Mea
ns in
the
same
colum
n wi
th dif
feren
t upp
erca
se le
tters
differ
sig
nifica
ntly.
In bo
th ro
ws an
d colu
mns:
* * *
(p ≤
0.00
1), *
* (p
≤ 0.
01),
* (p
≤ 0.
05),
n.s. (
not s
ignific
ant).
ECN
50
2nd O
ct 17
th O
ct 1st
Nov
16
th N
ov
1st D
ec
16th
Dec
31
st D
ec
SD
Mean
%
RSD
Sign
. Ca
ssan
ese
3.96g
H 4.3
2fH
4.44e
F 5.1
9cF
5.10d
F 5.2
7bC
5.37a
C 0.5
6 4.8
1 11
.56
* * *
Ottob
ratic
a 6.5
3aA
6.41b
A 6.0
9cB
6.06c
B 5.5
8eB
5.89d
B 6.4
4bB
0.34
6.14
5.56
* * *
Sino
poles
e 6.5
5dA
6.29fB
6.4
0eA
6.38e
A 6.9
8cA
7.12b
A 7.3
2aA
0.41
6.72
6.13
* * *
Cora
tina
5.36c
B 5.1
6dC
5.40b
C 5.5
0aD
5.51a
C --
-- 0.1
4 5.3
9 2.6
3 * *
* Itr
ana
4.37b
G 4.3
4cGH
4.3
3cG
4.28d
G 5.2
2aE
-- --
0.40
4.51
8.86
* * *
Lecc
ino
5.26b
D 4.8
6dE
4.81e
D 5.6
6aC
4.89c
H --
-- 0.3
6 5.1
0 7.1
1 * *
* No
cella
ra M
essin
ese
4.76a
F 4.1
3bI
3.93c
H 3.6
9dI
3.56e
J 3.6
8dF
3.29fA
0.4
8 3.8
6 12
.34
* * *
Nocia
ra
5.29b
C 4.9
5dD
4.77e
E 5.3
1bE
5.42a
D 5.0
3cD
-- 0.2
5 5.1
3 4.8
9 * *
* Pe
ndoli
no
3.87e
I 4.3
5aG
3.90d
I 3.9
2dH
4.03c
I 4.2
7bE
-- 0.2
1 4.0
6 5.0
6 * *
* Pi
choli
ne
4.99b
E 4.6
1eF
4.81d
D 5.1
7aF
4.94c
G --
-- 0.2
1 4.9
0 4.2
6 * *
* Si
gn.
* * *
* * *
* * *
* * *
* * *
* * *
* * *
-- --
-- --

La rivista itaLiana deLLe sostanze grasse - voL. XCi - ottoBre/diCeMBre 2014
241
C. Guillaume*Ch. GertzL. Ravetti
Modern Olives Laboratory ServicesLara, Vctoria - Australia
(*) CORRESPONDING AUTHOR:Claudia Guillaume
P. O. Box 92 – Lara, Victoria 3212 Australia
+61 3 5272 9500 +61 3 5272 9599
pyropheophytin a and 1,2 di-acyl-glycerols in natural olive oils under
different storage conditions over time
The effect of storage conditions (light, temperature, container types) and time on the quality of natural olive oil from different varieties and Australian regions were studied. The changing quality of the oils was monitored through several physico-chemical methods (free fatty acids, peroxide value, UV-spectrometry (K232, K270 and ΔK), induction time, total polyphenol content, bitterness, pyropheophytin a and 1,2-di-acyl-glycerol content) and sensory analysis over 24 months.Pyropheophytins a and 1,2-di-acyl-glycerols criteria showed a very good performance as indicators of overall olive oil quality and freshness as well as highlighting any problems during the storage of the product. Pyropheophytin a has an average increment of 7% per year and the 1,2-di-acyl-glycerols decreases at an average of 23% per year at normal storage conditions over time.Key words: Olive oil, storage, quality, oxidation, pyropheophytin a, 1,2-di-acyl-glycerol.
Pyropheophytin a e 1,2 di-acil gliceroli in oli di oliva naturali in diverse condizioni di conservazione nel tempo Sono stati studiati l’effetto delle condizioni di conservazione (luce, temperatura, tipo di contenitori) e del tempo, sulla qualità dell’olio di oliva naturale di diverse varietà e regioni australiane. Il cambiamento della qualità degli oli è stato monitorato attraverso diversi parametri fisico-chimici (acidi grassi liberi, perossidi, spettrometria UV (K232, K270 e ∆K), tempo di induzione, polifenoli totali, amarezza, pyropheophytin a e contenuto di 1,2-di-acil-glicerolo) e di analisi sensoriale, in 24 mesi.Pyropheophytins a e 1,2-di-acil-Gliceroli hanno mostrato prestazioni molto buone come indicatori della qualità complessiva dell’olio d’oliva e della freschezza, nonché evidenziando eventuali problemi durante la conservazione del prodotto. Pyropheophytin a ha un incremento in media del 7% l’anno e l’1,2-di-acil-gliceroli diminuisce in media del 23% all’anno in normali condizioni di conservazione.Parole chiave: olio d’oliva, conservazione, qualità, ossidazione, pyropheophytin a, 1,2-di-acil-glicerolo.

La rivista itaLiana deLLe sostanze grasse - voL. XCi - ottoBre/diCeMBre 2014
242
INTRODUCTION
Sensory characteristics (flavor, taste and appearance) and nutritional composition of foods have a critical impact on consumer benefits from that food and in-fluence consumer choice [1]. Vegetable oils made as virgin, unrefined or cold pressed have natural charac-teristics, intense color, aroma and taste that refined oils do not possess because of the alteration to the oil during the refining process [2]. From the producer to the consumer and within the scientific community there is a particular interest in extra virgin olive oil (EVOO) because of its unique sensory and nutritional qualities. Governments, food authorities and the trade use vari-ous methods and standards at an attempt to clas-sify and define different olive oil qualities. The different categories of these official and trade standards are classified by a number of physico-chemical parame-ters and organoleptic characteristics. For each grade, minimum and/or maximum limits for most chemical parameters are prescribed, in addition to a sensory test which has to be executed by a trained group of tasters. Sensory analysis alone needs to be repeat-ed if defects are detected and to be confirmed by a second or even a third panel test. With the expan-sion of the olive oil market worldwide there are not enough skilled sensory experts in organized panels in the world to deal with all traded olive oils. Objective chemical indices that correlate with sensory charac-teristics are needed to help to properly qualify and authenticate the world’s olive oils. In the last century analytical standards from the sci-ence of fats and oils were developed and applied to olive oils that were predominantly grown in the Medi-terranean region and for traditional varieties of olive trees. These standards developed into various legis-lative and trade regulations. At the same time the olive production and its market expanded into new regions and adopted new varieties and this transformation of the industry continues. This evolution needs to be ac-counted for in the evaluation of olive oils that naturally vary in their physical and chemical make-up. The objectives of this project are firstly to evaluate the effectiveness of the mentioned quality parameters to monitor the thermo-oxidative and hydrolytic changes during aging of olive oil under various storage condi-tions and secondly to further evaluate how methods such as the determination of 1,2-di-acyl-glycerols (DAGs) and pyropheophytins a (PPPs) correlate with the outcomes of the most relevant quality parameters over time [3] [4].At the beginning of this work a broad screening of natural olive oils from a range of varieties and envi-ronments within Australia was done. These samples provide the range of initial oil qualities and varieties so the changes in the oil during storage and aging could be further evaluated in relation to the variety and its initial quality (data not shown). Factors such
as storage temperature, different packaging, influ-ence of light and oxygen were applied to these oils to simulate the storage conditions for olive oil in the retail supply chain.
MATERIAL AND METHODS
EFFECT OF ENVIRONMENTKöppen’s modified scheme recognises six principal groups of climates, which are described as equa-torial, tropical, subtropical, dessert, grassland and temperate. Each of these climates is further divided into sub-divisions based upon differences in the sea-sonal distribution of temperature and precipitation [5]. Please refer to Figure 1. In order to screen the varia-tion of Australian climate conditions; samples from Victoria, New South Wales, South Australia, Queen-sland, Western Australia, and Tasmania were analy-sed, covering all the areas of plantation in Australia (subtropical, grassland and temperate).
EFFECT OF VARIETYThe varietal screening of olive oils involved analysing samples of the most representative varieties grown in Australia. 21 samples of oil made from Arbequina, Picual, Frantoio, Coratina, Koroneiki, Barnea, Leccino and Manzanilla were collected and tested. This sam-pling represents 97% of the volume and variety of ol-ive oils produced throughout Australia. Frantoio was the only variety from all the different environments.
EFFECT OF STORAGE CONDITIONSIn order to evaluate the impact of storage conditions, oils from different varieties were bottled in three differ-ent containers (dark glass, clear glass and dark plas-tic) and stored at different temperatures (20°C and 30°C). The purpose of these different containers was to determine the effect of the light (artificial light in a warehouse – for 24 hours during the life of the project), temperature and air on olive oils. All the 21 samples were stored in dark glass at 20°C, 7 samples of most representative varieties (Arbequina, Barnea, Frantoio and Picual) from different regions were stored in dark glass 30°C, clear glass 20°C and dark plastic 20°C as well. Sufficient samples were stored for each set to be discarded after testing at each time.
EFFECT OF STORAGE TIMETo evaluate the impact of storage time on the olive oil quality, 42 samples were tested every 4 months until the oils were 24 months old. Therefore 231 bottles were tested by the end of the project. The testing started at 4 months of storage in order to be equal in age for all the varieties from different regions which had been harvested and processed at differ-ent times.
BASIC QUALITY PARAMETERSDetermination of free fatty acids (FFA) (AOCS Ca 5a-

La rivista itaLiana deLLe sostanze grasse - voL. XCi - ottoBre/diCeMBre 2014
243
40), peroxide value (PV) (AOCS Cd 8-53) and UV co-efficients: K232, K270 and ∆K (AOCS Ch 5-91) were carried out. Results were expressed as percentage of oleic acid, meq O2/kg oil and extinction at 232 and 270 nm, respectively.
INDUCTION TIME (IND)This parameter (AOCS Cd 12b-92) was measured with a 743 Rancimat (Metrohm & Co), using an oil sample of 2.5 g warmed at 130°C and 20 l/h air flow. The results were expressed in hours.
TOTAL POLYPHENOLS CONTENT (PPH)The phenol extract was isolated by SPE Diol column 6ml/500mg (Chromabond Macherey-Nagel GmbH & Co) using an elution solution of 1:1 methanol: water. The Folin-Ciocalteu method was used to evaluate the concentration of total polyphenols in the samples measured at 725 nm. The results were expressed as mg/kg of caffeic acid.
BITTERNESS INDEX (K225)The bitter compounds were isolated by SPE C18 column 6ml/500mg (Chromabond Macherey-Nagel GmbH & Co) using an elution solution of methanol: water. The obtained extract was measured at 225 nm of absorbance against methanol: water (1:1) as blank in a 1 cm quartz cuvette [6]. The results were expressed as extinction at 225 nm.
PYROPHEOPHYTIN a (ISO 29841:2009)The pigments were isolated by SPE SiOH column 6ml/500mg (Chromabond Macherey-Nagel GmbH & Co) using acetone as elution solvent. The eluate was analysed by RP18-HPLC and the separated compo-nents were monitored at 410 nm using a photometric detector. The results were expressed as relative pro-portions (%) of the analyses (Pheophytin a and a’ and Pyropheophytin a)
1,2-DI-ACYL-GLYCEROL CONTENT (ISO 29822:2009)The isomeric di-acyl-glycerols were isolated by SPE SiOH column 6ml/500mg (Chromabond Macherey-Nagel GmbH & Co) using diethyl ether as elution solvent. The eluate was analysed by gas chroma-tography after silylation. The peak areas of 1,2- and 1,3-isomers were determined. Only C32 , C34 and C36-diacyl-glycerols were taken into account. The re-sults were expressed as mass percentage (%) of 1,2 di-acyl-glycerols over the total amount of 1,2 and 1,3 di-acyl-glycerols content in the sample.
SENSORY ANALYSISSensory analysis of the samples was carried out by trained panellists according to the method de-scribed in the International Olive Council (IOC/T.20/Doc. N° 15-Rev.4 November 2011) [3]. The method involves, as a measurement instrument, a group of 8 to 12 people suitably selected and trained to iden-
Figure 1 - Climate classification of Australia according to Köppen's modified scheme Ref: In circles are the areas where the olives plantations are located

La rivista itaLiana deLLe sostanze grasse - voL. XCi - ottoBre/diCeMBre 2014
244
tify and evaluate the intensities of positive and nega-tive sensory perceptions. Samples were randomly presented and tasters were requested to mark their perceptions on a profile sheet and to evaluate their intensity on an unstructured scale ranked from 0 to 10. The procedure was repeated three times in dif-ferent order to minimise the error. Data provided by tasters were statistically processed to verify the reli-ability of the test. The median values of the defect (DEF) and positive attributes (Fruitiness – FRU; Bit-terness – BIT and Pungency – PUN) perceived were utilised to identify the oil category. The samples clas-sified defective were sent to a second laboratory for confirmation.
STATISTICAL ANALYSIS The data was subjected to a statistical analysis of variance using XLSTAT Pro Version 2009 (Addinsoft SARL). Tukey-Kramer’s multiple comparison test was done to check the statistical significance of changes and differences measured during the time of stor-age.
RESULTS AND DISCUSSION
EFFECT OF ENVIRONMENTPyropheophytins a (PPPs) and 1,2-di-acyl-glycerols (DAGs) are not influenced by the different growing en-vironments studied. Figure 2 shows the evolution of PPPs in Frantoio from the different regions, when stored in dark glass con-
tainers at a temperature of 20°C during 24 months. The rate of evolution per year of PPPs was between 5-6%. Figure 3 shows the evolution of DAGs in Frantoio from the different regions, when stored in dark glass con-tainers at a temperature of 20°C during 24 months. The rate of evolution per year of DAGs was between 18% and 23%. All the samples were below the limits according to Australian Standards® [7] for both parameters at the end of the project.
EFFECT OF VARIETYPyropheophytins a (PPPs) and 1,2-diacyl-glycerols (DAGs) are not influenced by the different varieties studied. This is in agreement with other researches [8].Figure 4 shows the evolution of PPPs in all the differ-ent varieties, when stored in dark glass containers at a temperature of 20°C during 24 months. Figure 5 shows the rate of evolution per year of PPPs in the different varieties (between 6-7%), which was very similar in all the oils regardless of the varieties. Figure 6 shows the evolution of DAGs in all the dif-ferent varieties, when stored in dark glass containers at a temperature of 20°C during 24 months. Figure 7 shows the rate of evolution per year of DAGs in the different varieties (between 16-19%).All samples were below the limits according to Aus-tralian Standards® [7] for both parameters at the end of the project.
Figure 2 - Evolution of PPPs in Frantoio from different regions in Australia Ref: QLD: Queensland. SA: South Australia. VIC: Victoria. TAS: Tasmania. WA: Western Australia. NSW: New South Wales Sample size = 18
0
2
4
6
8
10
12
14
16
4 months 8 months 12 months 16 months 20 months 24 months
% P
PP
Evolution of PPP in Frantoio from different locations
QLD
SA
VIC
TAS
WA
NSW

La rivista itaLiana deLLe sostanze grasse - voL. XCi - ottoBre/diCeMBre 2014
245
EVOLUTION OF OIL QUALITY UNDER DIFFERENT STORAGE CONDITIONSTables I a-d show the statistical evaluation of the re-sults during the storage period for the different stor-age conditions. Figure 8 and 9 show the evolution of PPPs and DAGs according to the different storage conditions during the life of the project.
At the end of the project all the samples stored in dark containers (glass and plastic) at 20°C were within the Extra Virgin olive oil category according to current standards [3] [4] [7]. Samples exposed to the light were no longer Extra Virgin soon after 12 months ac-cording to Australian Standards® and soon after 16 months according to the International Olive Council
Figure 3 - Evolution of DAGs in Frantoio from different regions in Australia Ref: QLD: Queensland. SA: South Australia. VIC: Victoria. TAS: Tasmania. WA: Western Australia. NSW: New South Wales. Sample size = 18
0
10
20
30
40
50
60
70
80
90
100
4 months 8 months 12 months 16 months 20 months 24 months
% 1,
2-DA
G
Evolution of 1,2-DAG in Frantoio from different locations
QLD
SA
VIC
TAS
WA
NSW
Figure 4 - Evolution of PPPs in the different varieties grown in Australia Sample size: 21
0
2
4
6
8
10
12
14
16
18
4 months 8 months 12 months 16 months 20 months 24 months
% P
PP
Evolution of PPP according to different varieties
Arbequina
Barnea
Coratina
Frantoio
Koroneiki
Leccino
Picual

La rivista itaLiana deLLe sostanze grasse - voL. XCi - ottoBre/diCeMBre 2014
246
Standard and European Union Regulations. The sam-ples exposed to 30°C temperatures were no longer complying with the category before 12 months ac-cording to Australian Standards® and soon after 12 months according to the International Olive Council Standard and European Union Regulations. Refer to Tables I a-d and Figure 8 and 9.Pearson’s correlation coefficient (r) indicates the strength of a linear relationship between two variables. It is interesting to observe the Tables II a-d (correla-tion coefficients whose magnitude are greater than /0.6/ are highlighted); Pyropheophitins a show a high positive correlation with UV coefficients (mainly K270) and defect. The correlation became stronger when
the impact of the light and higher temperatures was studied. 1,2-di-acyl-glycerols shows a high negative correlation with initial FFA, UV coefficients and PPPs also the correlation became stronger under the pres-ence of light and higher temperatures.
LIPID OXIDATIONLipid oxidation is a major cause of extra virgin olive oil (EVOO) quality deterioration. When unsaturated fatty acids are exposed to air, molecular oxygen reacts with them by a free radical chain mechanism yield-ing hydro-peroxides and conjugated compounds [9], which decompose to a complex variety of secondary oxidation products such as aldehydes and ketones
Figure 5 - PPPs evolution ratio per year in the different varieties grown in Australia
5,78 6,67
5,85 6,31 6,94
6,02 7,31
-1
1
3
5
7
9
11
13
15
Arbequina Barnea Coratina Frantoio Koroneiki Leccino Picual
PPPs: Ratio x year
Figure 6 - Evolution of DAGs in the different varieties grown in Australia Sample size: 21
0
10
20
30
40
50
60
70
80
90
100
4 months 8 months 12 months 16 months 20 months 24 months
% 1,
2-DA
G
Evolution of 1,2-DAG according to different varieties
Arbequina
Barnea
Coratina
Frantoio
Koroneiki
Leccino
Picual
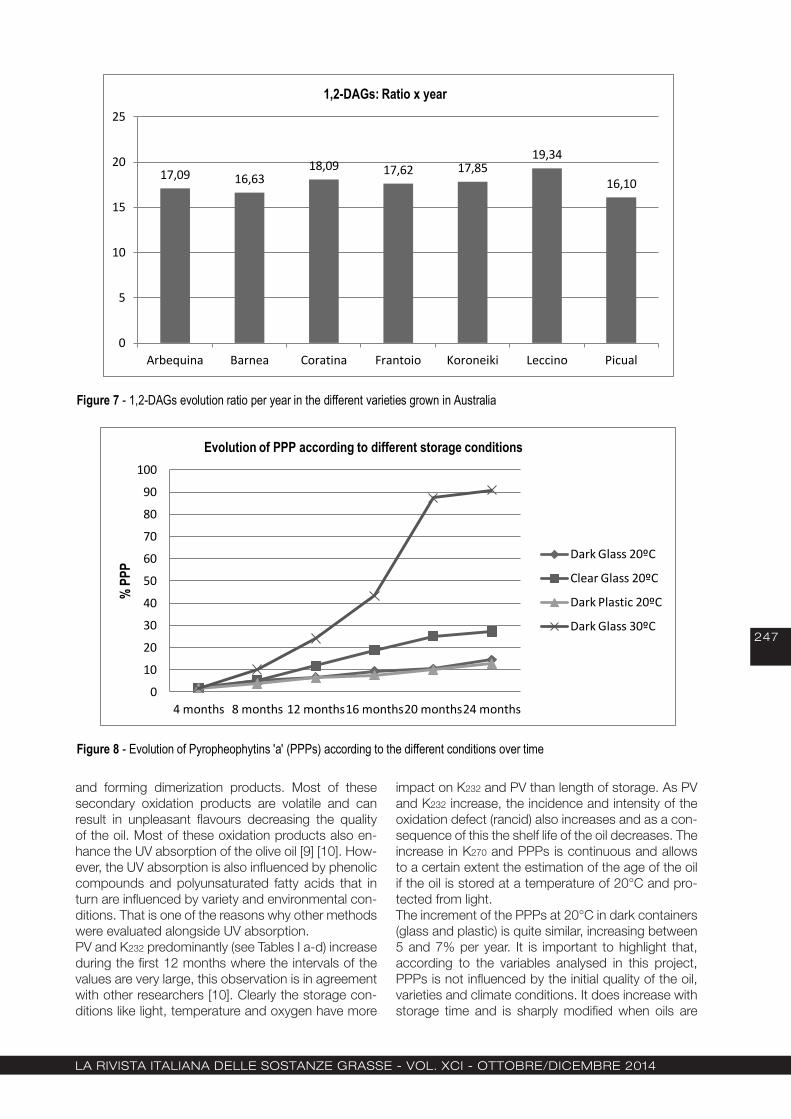
La rivista itaLiana deLLe sostanze grasse - voL. XCi - ottoBre/diCeMBre 2014
247
and forming dimerization products. Most of these secondary oxidation products are volatile and can result in unpleasant flavours decreasing the quality of the oil. Most of these oxidation products also en-hance the UV absorption of the olive oil [9] [10]. How-ever, the UV absorption is also influenced by phenolic compounds and polyunsaturated fatty acids that in turn are influenced by variety and environmental con-ditions. That is one of the reasons why other methods were evaluated alongside UV absorption. PV and K232 predominantly (see Tables I a-d) increase during the first 12 months where the intervals of the values are very large, this observation is in agreement with other researchers [10]. Clearly the storage con-ditions like light, temperature and oxygen have more
impact on K232 and PV than length of storage. As PV and K232 increase, the incidence and intensity of the oxidation defect (rancid) also increases and as a con-sequence of this the shelf life of the oil decreases. The increase in K270 and PPPs is continuous and allows to a certain extent the estimation of the age of the oil if the oil is stored at a temperature of 20°C and pro-tected from light. The increment of the PPPs at 20°C in dark containers (glass and plastic) is quite similar, increasing between 5 and 7% per year. It is important to highlight that, according to the variables analysed in this project, PPPs is not influenced by the initial quality of the oil, varieties and climate conditions. It does increase with storage time and is sharply modified when oils are
Figure 7 - 1,2-DAGs evolution ratio per year in the different varieties grown in Australia
17,09 16,63 18,09 17,62 17,85
19,34
16,10
0
5
10
15
20
25
Arbequina Barnea Coratina Frantoio Koroneiki Leccino Picual
1,2-DAGs: Ratio x year
Figure 8 - Evolution of Pyropheophytins 'a' (PPPs) according to the different conditions over time
0
10
20
30
40
50
60
70
80
90
100
4 months 8 months 12 months 16 months 20 months 24 months
% P
PP
Evolution of PPP according to different storage conditions
Dark Glass 20ºC
Clear Glass 20ºC
Dark Plastic 20ºC
Dark Glass 30ºC
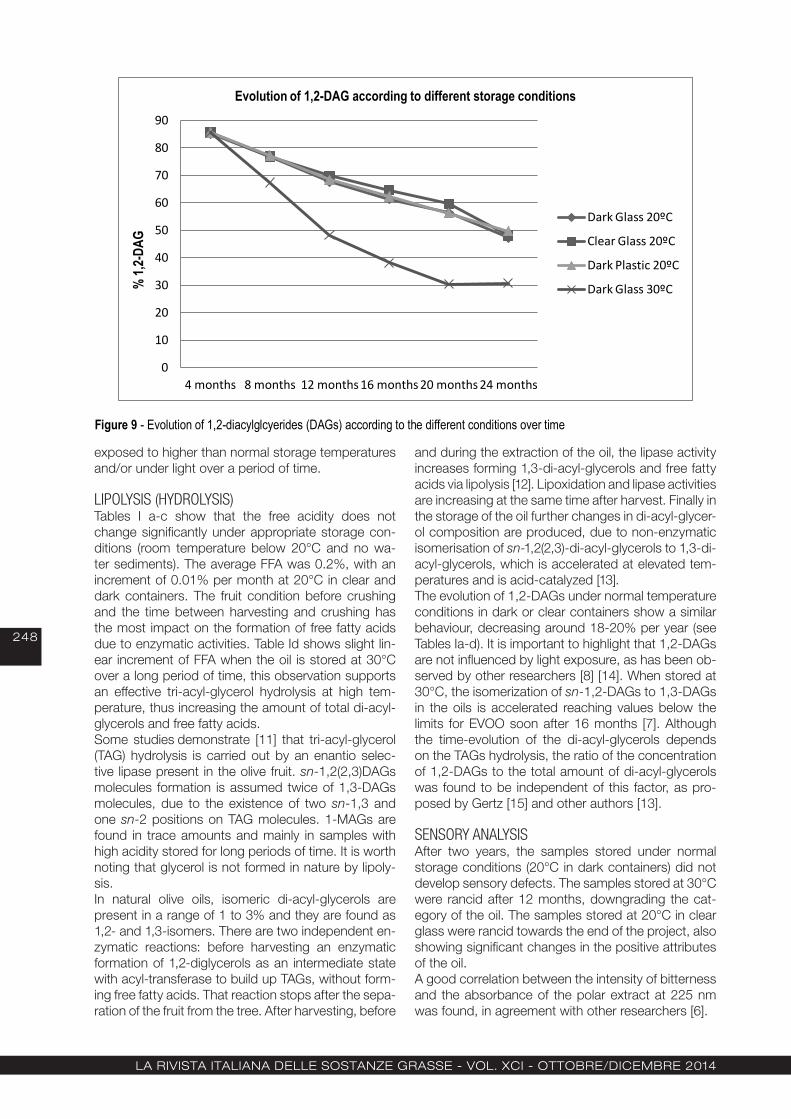
La rivista itaLiana deLLe sostanze grasse - voL. XCi - ottoBre/diCeMBre 2014
248
exposed to higher than normal storage temperatures and/or under light over a period of time.
LIPOLYSIS (HYDROLYSIS)Tables I a-c show that the free acidity does not change significantly under appropriate storage con-ditions (room temperature below 20°C and no wa-ter sediments). The average FFA was 0.2%, with an increment of 0.01% per month at 20°C in clear and dark containers. The fruit condition before crushing and the time between harvesting and crushing has the most impact on the formation of free fatty acids due to enzymatic activities. Table Id shows slight lin-ear increment of FFA when the oil is stored at 30°C over a long period of time, this observation supports an effective tri-acyl-glycerol hydrolysis at high tem-perature, thus increasing the amount of total di-acyl-glycerols and free fatty acids.Some studies demonstrate [11] that tri-acyl-glycerol (TAG) hydrolysis is carried out by an enantio selec-tive lipase present in the olive fruit. sn-1,2(2,3)DAGs molecules formation is assumed twice of 1,3-DAGs molecules, due to the existence of two sn-1,3 and one sn-2 positions on TAG molecules. 1-MAGs are found in trace amounts and mainly in samples with high acidity stored for long periods of time. It is worth noting that glycerol is not formed in nature by lipoly-sis.In natural olive oils, isomeric di-acyl-glycerols are present in a range of 1 to 3% and they are found as 1,2- and 1,3-isomers. There are two independent en-zymatic reactions: before harvesting an enzymatic formation of 1,2-diglycerols as an intermediate state with acyl-transferase to build up TAGs, without form-ing free fatty acids. That reaction stops after the sepa-ration of the fruit from the tree. After harvesting, before
and during the extraction of the oil, the lipase activity increases forming 1,3-di-acyl-glycerols and free fatty acids via lipolysis [12]. Lipoxidation and lipase activities are increasing at the same time after harvest. Finally in the storage of the oil further changes in di-acyl-glycer-ol composition are produced, due to non-enzymatic isomerisation of sn-1,2(2,3)-di-acyl-glycerols to 1,3-di-acyl-glycerols, which is accelerated at elevated tem-peratures and is acid-catalyzed [13]. The evolution of 1,2-DAGs under normal temperature conditions in dark or clear containers show a similar behaviour, decreasing around 18-20% per year (see Tables Ia-d). It is important to highlight that 1,2-DAGs are not influenced by light exposure, as has been ob-served by other researchers [8] [14]. When stored at 30°C, the isomerization of sn-1,2-DAGs to 1,3-DAGs in the oils is accelerated reaching values below the limits for EVOO soon after 16 months [7]. Although the time-evolution of the di-acyl-glycerols depends on the TAGs hydrolysis, the ratio of the concentration of 1,2-DAGs to the total amount of di-acyl-glycerols was found to be independent of this factor, as pro-posed by Gertz [15] and other authors [13].
SENSORY ANALYSISAfter two years, the samples stored under normal storage conditions (20°C in dark containers) did not develop sensory defects. The samples stored at 30°C were rancid after 12 months, downgrading the cat-egory of the oil. The samples stored at 20°C in clear glass were rancid towards the end of the project, also showing significant changes in the positive attributes of the oil.A good correlation between the intensity of bitterness and the absorbance of the polar extract at 225 nm was found, in agreement with other researchers [6].
Figure 9 - Evolution of 1,2-diacylglcyerides (DAGs) according to the different conditions over time
0
10
20
30
40
50
60
70
80
90
4 months 8 months 12 months 16 months 20 months 24 months
% 1,
2-DA
G
Evolution of 1,2-DAG according to different storage conditions
Dark Glass 20ºC
Clear Glass 20ºC
Dark Plastic 20ºC
Dark Glass 30ºC
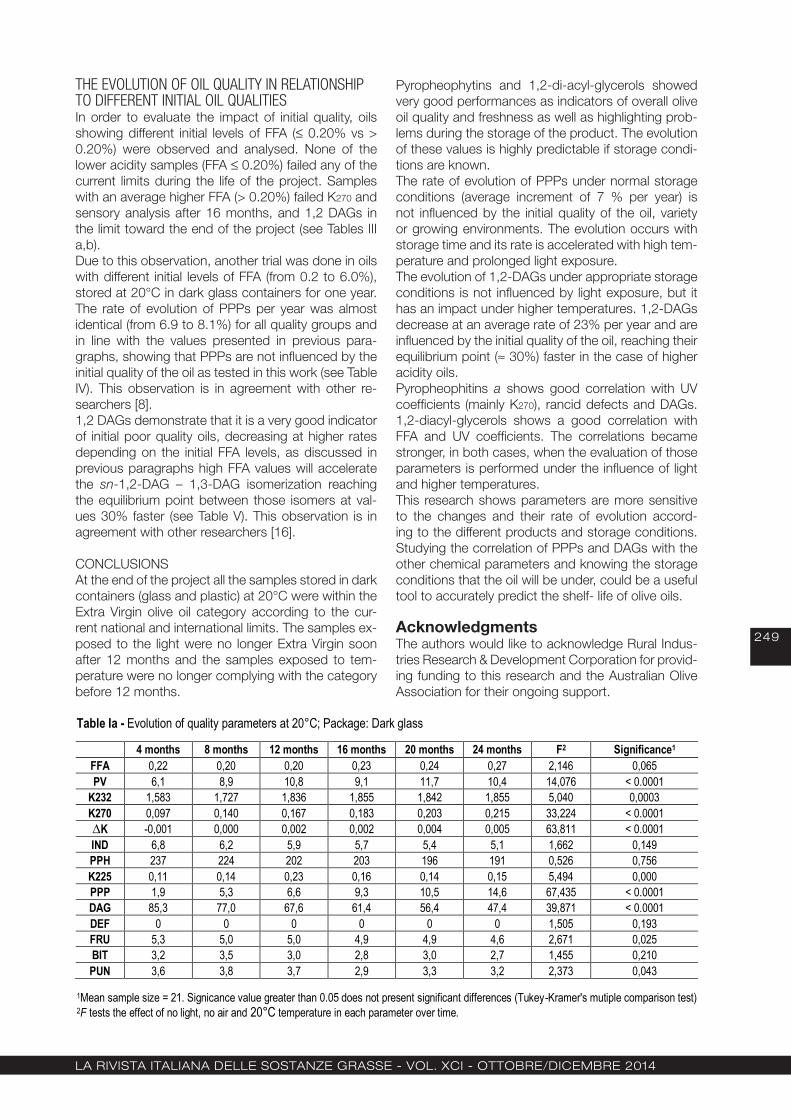
La rivista itaLiana deLLe sostanze grasse - voL. XCi - ottoBre/diCeMBre 2014
249
THE EVOLUTION OF OIL QUALITY IN RELATIONSHIP TO DIFFERENT INITIAL OIL QUALITIESIn order to evaluate the impact of initial quality, oils showing different initial levels of FFA (≤ 0.20% vs > 0.20%) were observed and analysed. None of the lower acidity samples (FFA ≤ 0.20%) failed any of the current limits during the life of the project. Samples with an average higher FFA (> 0.20%) failed K270 and sensory analysis after 16 months, and 1,2 DAGs in the limit toward the end of the project (see Tables III a,b). Due to this observation, another trial was done in oils with different initial levels of FFA (from 0.2 to 6.0%), stored at 20°C in dark glass containers for one year. The rate of evolution of PPPs per year was almost identical (from 6.9 to 8.1%) for all quality groups and in line with the values presented in previous para-graphs, showing that PPPs are not influenced by the initial quality of the oil as tested in this work (see Table IV). This observation is in agreement with other re-searchers [8].1,2 DAGs demonstrate that it is a very good indicator of initial poor quality oils, decreasing at higher rates depending on the initial FFA levels, as discussed in previous paragraphs high FFA values will accelerate the sn-1,2-DAG – 1,3-DAG isomerization reaching the equilibrium point between those isomers at val-ues 30% faster (see Table V). This observation is in agreement with other researchers [16].
CONCLUSIONS At the end of the project all the samples stored in dark containers (glass and plastic) at 20°C were within the Extra Virgin olive oil category according to the cur-rent national and international limits. The samples ex-posed to the light were no longer Extra Virgin soon after 12 months and the samples exposed to tem-perature were no longer complying with the category before 12 months.
Pyropheophytins and 1,2-di-acyl-glycerols showed very good performances as indicators of overall olive oil quality and freshness as well as highlighting prob-lems during the storage of the product. The evolution of these values is highly predictable if storage condi-tions are known.The rate of evolution of PPPs under normal storage conditions (average increment of 7 % per year) is not influenced by the initial quality of the oil, variety or growing environments. The evolution occurs with storage time and its rate is accelerated with high tem-perature and prolonged light exposure.The evolution of 1,2-DAGs under appropriate storage conditions is not influenced by light exposure, but it has an impact under higher temperatures. 1,2-DAGs decrease at an average rate of 23% per year and are influenced by the initial quality of the oil, reaching their equilibrium point (≈ 30%) faster in the case of higher acidity oils. Pyropheophitins a shows good correlation with UV coefficients (mainly K270), rancid defects and DAGs. 1,2-diacyl-glycerols shows a good correlation with FFA and UV coefficients. The correlations became stronger, in both cases, when the evaluation of those parameters is performed under the influence of light and higher temperatures. This research shows parameters are more sensitive to the changes and their rate of evolution accord-ing to the different products and storage conditions. Studying the correlation of PPPs and DAGs with the other chemical parameters and knowing the storage conditions that the oil will be under, could be a useful tool to accurately predict the shelf- life of olive oils.
AcknowledgmentsThe authors would like to acknowledge Rural Indus-tries Research & Development Corporation for provid-ing funding to this research and the Australian Olive Association for their ongoing support.
Table Ia - Evolution of quality parameters at 20°C; Package: Dark glass
4 months 8 months 12 months 16 months 20 months 24 months F2 Significance1 FFA 0,22 0,20 0,20 0,23 0,24 0,27 2,146 0,065 PV 6,1 8,9 10,8 9,1 11,7 10,4 14,076 < 0.0001
K232 1,583 1,727 1,836 1,855 1,842 1,855 5,040 0,0003 K270 0,097 0,140 0,167 0,183 0,203 0,215 33,224 < 0.0001 ∆K -0,001 0,000 0,002 0,002 0,004 0,005 63,811 < 0.0001 IND 6,8 6,2 5,9 5,7 5,4 5,1 1,662 0,149 PPH 237 224 202 203 196 191 0,526 0,756 K225 0,11 0,14 0,23 0,16 0,14 0,15 5,494 0,000 PPP 1,9 5,3 6,6 9,3 10,5 14,6 67,435 < 0.0001 DAG 85,3 77,0 67,6 61,4 56,4 47,4 39,871 < 0.0001 DEF 0 0 0 0 0 0 1,505 0,193 FRU 5,3 5,0 5,0 4,9 4,9 4,6 2,671 0,025 BIT 3,2 3,5 3,0 2,8 3,0 2,7 1,455 0,210 PUN 3,6 3,8 3,7 2,9 3,3 3,2 2,373 0,043
1Mean sample size = 21. Signicance value greater than 0.05 does not present significant differences (Tukey-Kramer's mutiple comparison test) 2F tests the effect of no light, no air and 20°C temperature in each parameter over time.
Table Ib - Evolution of quality parameters at 20°C; Package: Clear glass
4 months 8 months 12 months 16 months 20 months 24 months F2 Significance1 FFA 0,19 0,17 0,18 0,20 0,22 0,24 0,941 0,467 PV 6,2 10,2 15,5 9,3 14,0 10,9 6,802 0,000
K232 1,600 1,810 2,187 1,945 1,924 1,915 3,041 0,022 K270 0,073 0,146 0,165 0,212 0,231 0,222 24,096 < 0.0001 ∆K -0,001 0,002 0,002 0,005 0,006 0,004 3,499 0,011 IND 5,7 4,2 4,2 3,9 3,6 3,6 1,163 0,346 PPH 155 159 123 127 129 127 0,746 0,595 K225 0,09 0,14 0,12 0,11 0,11 0,12 2,131 0,084 PPP 1,8 5,4 11,9 19,0 25,2 27,3 10,536 < 0.0001 DAG 85,6 76,8 69,8 64,6 59,7 48,1 11,746 < 0.0001 DEF 0 0 0 0 0 1 1,113 0,371 FRU 5,1 4,8 4,4 4,5 4,4 3,3 7,541 < 0.0001 BIT 3,0 2,3 2,1 2,1 2,2 1,6 3,871 0,007 PUN 3,8 3,1 3,0 2,4 2,2 1,6 8,612 < 0.0001
1 Mean sample size = 7. Signicance value greater than 0.05 does not present significant differences (Tukey-Kramer's mutiple comparison test). 2 F tests the effect of light, no air and 20ºC temperature in each parameter over time.
Table Ic - Evolution of quality parameters at 20°C; Package: Dark plastic
4 months 8 months 12 months 16 months 20 months 24 months F2 Significance1 FFA 0,19 0,17 0,17 0,19 0,21 0,22 0,693 0,632 PV 6,2 6,2 12,8 11,7 15,4 14,7 21,401 < 0.0001
K232 1,600 1,889 1,953 2,089 2,216 2,087 2,702 0,036 K270 0,073 0,111 0,172 0,158 0,172 0,158 16,593 < 0.0001 ∆K -0,001 0,000 0,003 0,001 0,003 0,003 12,186 < 0.0001 IND 5,7 3,9 4,1 3,7 3,1 3,2 1,854 0,127 PPH 155 188 131 137 139 139 1,016 0,422 K225 0,09 0,14 0,14 0,13 0,11 0,13 2,563 0,044 PPP 1,8 3,9 6,4 7,6 10,1 12,9 101,750 < 0.0001 DAG 85,6 77,2 68,3 62,3 56,2 49,6 9,083 < 0.0001 DEF 0 0 0 0 0 0 0,730 0,605 FRU 5,1 5,0 4,6 4,4 4,8 4,0 3,983 0,006 BIT 3,0 2,7 2,2 2,3 2,1 1,6 4,405 0,003 PUN 3,8 3,6 3,4 2,5 2,1 2,2 4,895 0,002
1 Mean sample size = 7. Signicance value greater than 0.05 does not present significant differences (Tukey-Kramer's mutiple comparison test). 2 F tests the effect of no light, air permeability and 20ºC temperature in each parameter over time.
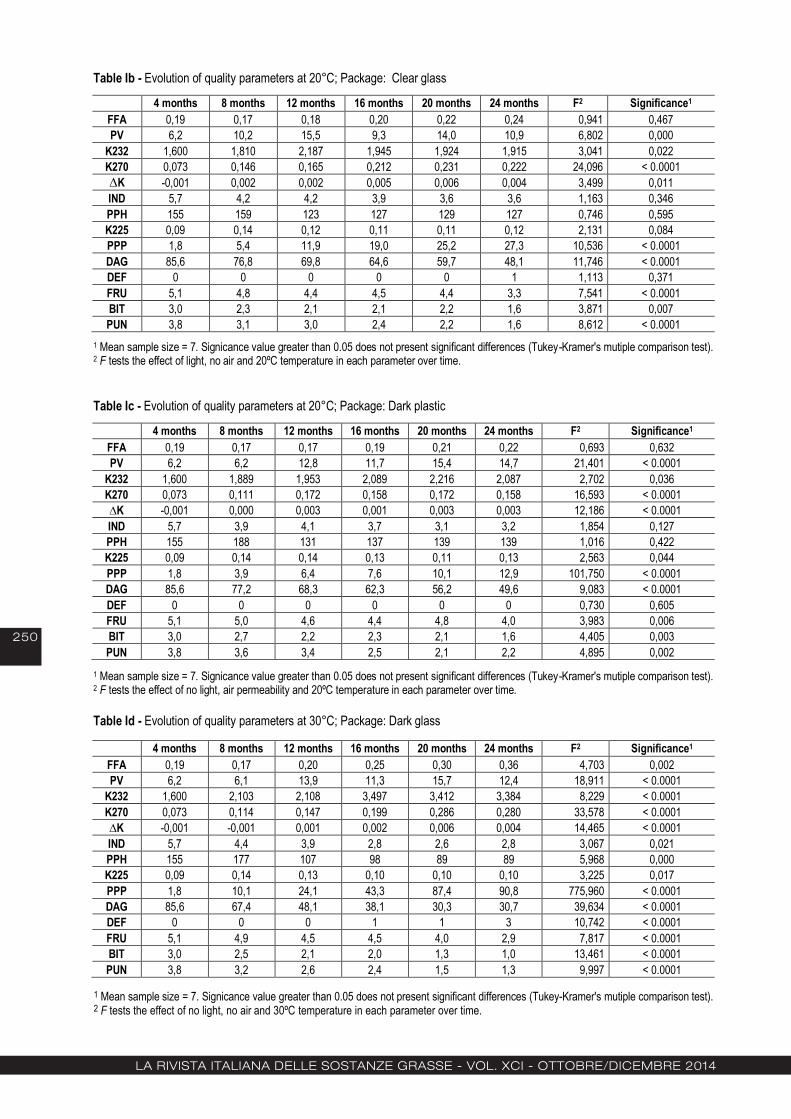
La rivista itaLiana deLLe sostanze grasse - voL. XCi - ottoBre/diCeMBre 2014
250
Table Ia - Evolution of quality parameters at 20°C; Package: Dark glass
4 months 8 months 12 months 16 months 20 months 24 months F2 Significance1 FFA 0,22 0,20 0,20 0,23 0,24 0,27 2,146 0,065 PV 6,1 8,9 10,8 9,1 11,7 10,4 14,076 < 0.0001
K232 1,583 1,727 1,836 1,855 1,842 1,855 5,040 0,0003 K270 0,097 0,140 0,167 0,183 0,203 0,215 33,224 < 0.0001 ∆K -0,001 0,000 0,002 0,002 0,004 0,005 63,811 < 0.0001 IND 6,8 6,2 5,9 5,7 5,4 5,1 1,662 0,149 PPH 237 224 202 203 196 191 0,526 0,756 K225 0,11 0,14 0,23 0,16 0,14 0,15 5,494 0,000 PPP 1,9 5,3 6,6 9,3 10,5 14,6 67,435 < 0.0001 DAG 85,3 77,0 67,6 61,4 56,4 47,4 39,871 < 0.0001 DEF 0 0 0 0 0 0 1,505 0,193 FRU 5,3 5,0 5,0 4,9 4,9 4,6 2,671 0,025 BIT 3,2 3,5 3,0 2,8 3,0 2,7 1,455 0,210 PUN 3,6 3,8 3,7 2,9 3,3 3,2 2,373 0,043
1Mean sample size = 21. Signicance value greater than 0.05 does not present significant differences (Tukey-Kramer's mutiple comparison test) 2F tests the effect of no light, no air and 20°C temperature in each parameter over time.
Table Ib - Evolution of quality parameters at 20°C; Package: Clear glass
4 months 8 months 12 months 16 months 20 months 24 months F2 Significance1 FFA 0,19 0,17 0,18 0,20 0,22 0,24 0,941 0,467 PV 6,2 10,2 15,5 9,3 14,0 10,9 6,802 0,000
K232 1,600 1,810 2,187 1,945 1,924 1,915 3,041 0,022 K270 0,073 0,146 0,165 0,212 0,231 0,222 24,096 < 0.0001 ∆K -0,001 0,002 0,002 0,005 0,006 0,004 3,499 0,011 IND 5,7 4,2 4,2 3,9 3,6 3,6 1,163 0,346 PPH 155 159 123 127 129 127 0,746 0,595 K225 0,09 0,14 0,12 0,11 0,11 0,12 2,131 0,084 PPP 1,8 5,4 11,9 19,0 25,2 27,3 10,536 < 0.0001 DAG 85,6 76,8 69,8 64,6 59,7 48,1 11,746 < 0.0001 DEF 0 0 0 0 0 1 1,113 0,371 FRU 5,1 4,8 4,4 4,5 4,4 3,3 7,541 < 0.0001 BIT 3,0 2,3 2,1 2,1 2,2 1,6 3,871 0,007 PUN 3,8 3,1 3,0 2,4 2,2 1,6 8,612 < 0.0001
1 Mean sample size = 7. Signicance value greater than 0.05 does not present significant differences (Tukey-Kramer's mutiple comparison test). 2 F tests the effect of light, no air and 20ºC temperature in each parameter over time.
Table Ic - Evolution of quality parameters at 20°C; Package: Dark plastic
4 months 8 months 12 months 16 months 20 months 24 months F2 Significance1 FFA 0,19 0,17 0,17 0,19 0,21 0,22 0,693 0,632 PV 6,2 6,2 12,8 11,7 15,4 14,7 21,401 < 0.0001
K232 1,600 1,889 1,953 2,089 2,216 2,087 2,702 0,036 K270 0,073 0,111 0,172 0,158 0,172 0,158 16,593 < 0.0001 ∆K -0,001 0,000 0,003 0,001 0,003 0,003 12,186 < 0.0001 IND 5,7 3,9 4,1 3,7 3,1 3,2 1,854 0,127 PPH 155 188 131 137 139 139 1,016 0,422 K225 0,09 0,14 0,14 0,13 0,11 0,13 2,563 0,044 PPP 1,8 3,9 6,4 7,6 10,1 12,9 101,750 < 0.0001 DAG 85,6 77,2 68,3 62,3 56,2 49,6 9,083 < 0.0001 DEF 0 0 0 0 0 0 0,730 0,605 FRU 5,1 5,0 4,6 4,4 4,8 4,0 3,983 0,006 BIT 3,0 2,7 2,2 2,3 2,1 1,6 4,405 0,003 PUN 3,8 3,6 3,4 2,5 2,1 2,2 4,895 0,002
1 Mean sample size = 7. Signicance value greater than 0.05 does not present significant differences (Tukey-Kramer's mutiple comparison test). 2 F tests the effect of no light, air permeability and 20ºC temperature in each parameter over time.
Table Id - Evolution of quality parameters at 30°C; Package: Dark glass
4 months 8 months 12 months 16 months 20 months 24 months F2 Significance1 FFA 0,19 0,17 0,20 0,25 0,30 0,36 4,703 0,002 PV 6,2 6,1 13,9 11,3 15,7 12,4 18,911 < 0.0001
K232 1,600 2,103 2,108 3,497 3,412 3,384 8,229 < 0.0001 K270 0,073 0,114 0,147 0,199 0,286 0,280 33,578 < 0.0001 ∆K -0,001 -0,001 0,001 0,002 0,006 0,004 14,465 < 0.0001 IND 5,7 4,4 3,9 2,8 2,6 2,8 3,067 0,021 PPH 155 177 107 98 89 89 5,968 0,000 K225 0,09 0,14 0,13 0,10 0,10 0,10 3,225 0,017 PPP 1,8 10,1 24,1 43,3 87,4 90,8 775,960 < 0.0001 DAG 85,6 67,4 48,1 38,1 30,3 30,7 39,634 < 0.0001 DEF 0 0 0 1 1 3 10,742 < 0.0001 FRU 5,1 4,9 4,5 4,5 4,0 2,9 7,817 < 0.0001 BIT 3,0 2,5 2,1 2,0 1,3 1,0 13,461 < 0.0001 PUN 3,8 3,2 2,6 2,4 1,5 1,3 9,997 < 0.0001
1 Mean sample size = 7. Signicance value greater than 0.05 does not present significant differences (Tukey-Kramer's mutiple comparison test). 2 F tests the effect of no light, no air and 30ºC temperature in each parameter over time.
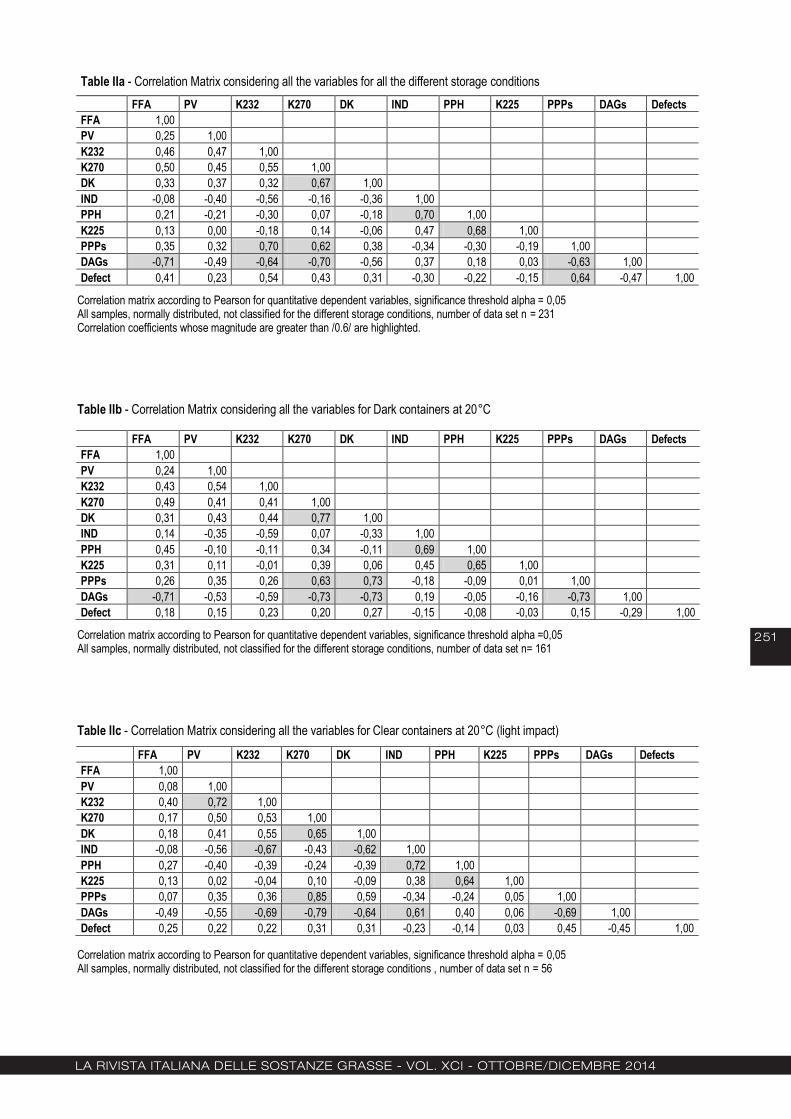
La rivista itaLiana deLLe sostanze grasse - voL. XCi - ottoBre/diCeMBre 2014
251
Table IIa - Correlation Matrix considering all the variables for all the different storage conditions FFA PV K232 K270 DK IND PPH K225 PPPs DAGs Defects FFA 1,00
PV 0,25 1,00 K232 0,46 0,47 1,00
K270 0,50 0,45 0,55 1,00 DK 0,33 0,37 0,32 0,67 1,00
IND -0,08 -0,40 -0,56 -0,16 -0,36 1,00 PPH 0,21 -0,21 -0,30 0,07 -0,18 0,70 1,00
K225 0,13 0,00 -0,18 0,14 -0,06 0,47 0,68 1,00 PPPs 0,35 0,32 0,70 0,62 0,38 -0,34 -0,30 -0,19 1,00
DAGs -0,71 -0,49 -0,64 -0,70 -0,56 0,37 0,18 0,03 -0,63 1,00 Defect 0,41 0,23 0,54 0,43 0,31 -0,30 -0,22 -0,15 0,64 -0,47 1,00
Correlation matrix according to Pearson for quantitative dependent variables, significance threshold alpha = 0,05 All samples, normally distributed, not classified for the different storage conditions, number of data set n = 231 Correlation coefficients whose magnitude are greater than /0.6/ are highlighted.
Table IIb - Correlation Matrix considering all the variables for Dark containers at 20°C FFA PV K232 K270 DK IND PPH K225 PPPs DAGs Defects FFA 1,00
PV 0,24 1,00 K232 0,43 0,54 1,00
K270 0,49 0,41 0,41 1,00 DK 0,31 0,43 0,44 0,77 1,00
IND 0,14 -0,35 -0,59 0,07 -0,33 1,00 PPH 0,45 -0,10 -0,11 0,34 -0,11 0,69 1,00
K225 0,31 0,11 -0,01 0,39 0,06 0,45 0,65 1,00 PPPs 0,26 0,35 0,26 0,63 0,73 -0,18 -0,09 0,01 1,00
DAGs -0,71 -0,53 -0,59 -0,73 -0,73 0,19 -0,05 -0,16 -0,73 1,00 Defect 0,18 0,15 0,23 0,20 0,27 -0,15 -0,08 -0,03 0,15 -0,29 1,00
Correlation matrix according to Pearson for quantitative dependent variables, significance threshold alpha =0,05 All samples, normally distributed, not classified for the different storage conditions, number of data set n= 161
Table IIc - Correlation Matrix considering all the variables for Clear containers at 20°C (light impact) FFA PV K232 K270 DK IND PPH K225 PPPs DAGs Defects FFA 1,00
PV 0,08 1,00 K232 0,40 0,72 1,00
K270 0,17 0,50 0,53 1,00 DK 0,18 0,41 0,55 0,65 1,00
IND -0,08 -0,56 -0,67 -0,43 -0,62 1,00 PPH 0,27 -0,40 -0,39 -0,24 -0,39 0,72 1,00
K225 0,13 0,02 -0,04 0,10 -0,09 0,38 0,64 1,00 PPPs 0,07 0,35 0,36 0,85 0,59 -0,34 -0,24 0,05 1,00
DAGs -0,49 -0,55 -0,69 -0,79 -0,64 0,61 0,40 0,06 -0,69 1,00 Defect 0,25 0,22 0,22 0,31 0,31 -0,23 -0,14 0,03 0,45 -0,45 1,00
Correlation matrix according to Pearson for quantitative dependent variables, significance threshold alpha = 0,05 All samples, normally distributed, not classified for the different storage conditions , number of data set n = 56
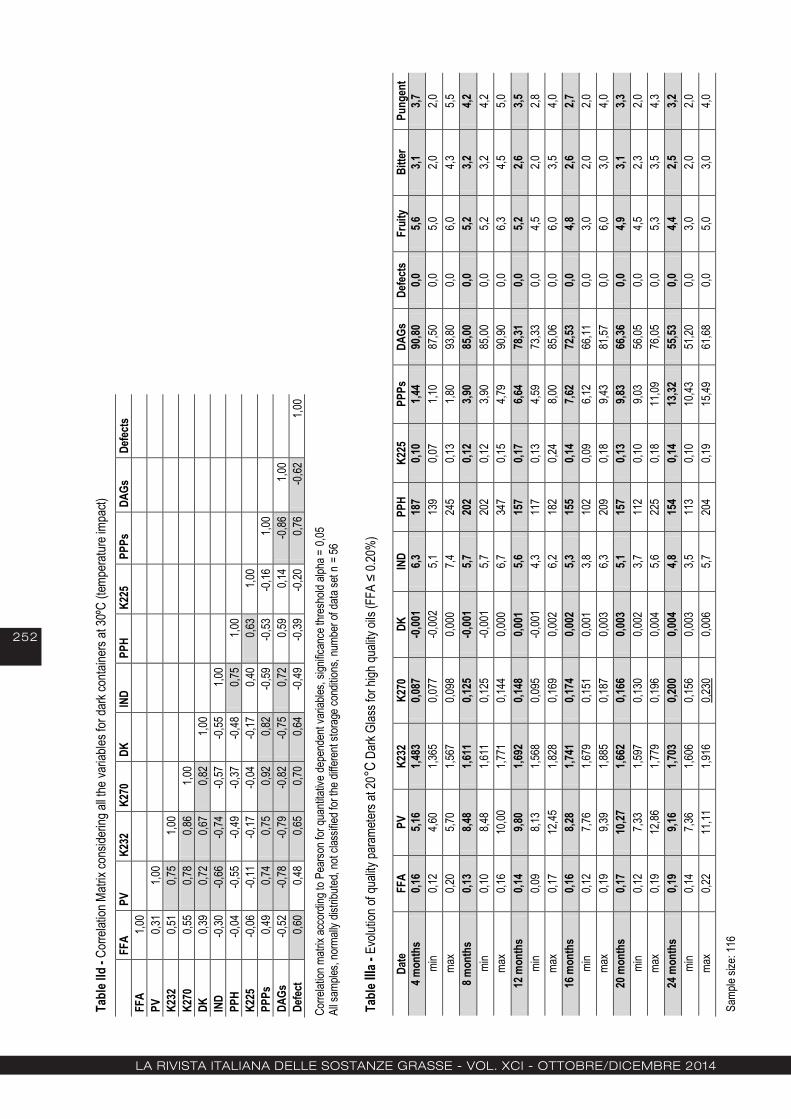
La rivista itaLiana deLLe sostanze grasse - voL. XCi - ottoBre/diCeMBre 2014
252
Tabl
e IId
- Co
rrelat
ion M
atrix
cons
iderin
g all t
he va
riable
s for
dark
conta
iners
at 30
ºC (t
empe
ratur
e imp
act)
FF
A PV
K2
32
K270
DK
IN
D PP
H K2
25
PPPs
DA
Gs
Defe
cts
FFA
1,00
PV
0,31
1,00
K2
32
0,51
0,75
1,00
K270
0,5
5 0,7
8 0,8
6 1,0
0
DK
0,39
0,72
0,67
0,82
1,00
IND
-0,30
-0
,66
-0,74
-0
,57
-0,55
1,0
0
PPH
-0,04
-0
,55
-0,49
-0
,37
-0,48
0,7
5 1,0
0
K2
25
-0,06
-0
,11
-0,17
-0
,04
-0,17
0,4
0 0,6
3 1,0
0
PPPs
0,4
9 0,7
4 0,7
5 0,9
2 0,8
2 -0
,59
-0,53
-0
,16
1,00
DAGs
-0
,52
-0,78
-0
,79
-0,82
-0
,75
0,72
0,59
0,14
-0,86
1,0
0
Defe
ct
0,60
0,48
0,65
0,70
0,64
-0,49
-0
,39
-0,20
0,7
6 -0
,62
1,00
Corre
lation
matr
ix ac
cord
ing to
Pea
rson f
or qu
antita
tive d
epen
dent
varia
bles,
signif
icanc
e thr
esho
ld alp
ha =
0,05
All s
ample
s, no
rmall
y dist
ribute
d, no
t clas
sified
for t
he di
ffere
nt sto
rage
cond
itions
, num
ber o
f data
set n
= 56
Ta
ble I
IIa -
Evolu
tion o
f qua
lity pa
rame
ters a
t 20°
C Da
rk Gl
ass f
or hi
gh qu
ality
oils (
FFA
≤ 0.2
0%)
Date
FF
A PV
K2
32
K270
DK
IN
D PP
H K2
25
PPPs
DA
Gs
Defe
cts
Frui
ty Bi
tter
Pung
ent
4 mon
ths
0,16
5,16
1,483
0,0
87
-0,00
1 6,3
18
7 0,1
0 1,4
4 90
,80
0,0
5,6
3,1
3,7
min
0,12
4,60
1,365
0,0
77
-0,00
2 5,1
13
9 0,0
7 1,1
0 87
,50
0,0
5,0
2,0
2,0
max
0,20
5,70
1,567
0,0
98
0,000
7,4
24
5 0,1
3 1,8
0 93
,80
0,0
6,0
4,3
5,5
8 mon
ths
0,13
8,48
1,611
0,1
25
-0,00
1 5,7
20
2 0,1
2 3,9
0 85
,00
0,0
5,2
3,2
4,2
min
0,10
8,48
1,611
0,1
25
-0,00
1 5,7
20
2 0,1
2 3,9
0 85
,00
0,0
5,2
3,2
4,2
max
0,16
10,00
1,7
71
0,144
0,0
00
6,7
347
0,15
4,79
90,90
0,0
6,3
4,5
5,0
12
mon
ths
0,14
9,80
1,692
0,1
48
0,001
5,6
15
7 0,1
7 6,6
4 78
,31
0,0
5,2
2,6
3,5
min
0,09
8,13
1,568
0,0
95
-0,00
1 4,3
11
7 0,1
3 4,5
9 73
,33
0,0
4,5
2,0
2,8
max
0,17
12,45
1,8
28
0,169
0,0
02
6,2
182
0,24
8,00
85,06
0,0
6,0
3,5
4,0
16
mon
ths
0,16
8,28
1,741
0,1
74
0,002
5,3
15
5 0,1
4 7,6
2 72
,53
0,0
4,8
2,6
2,7
min
0,12
7,76
1,679
0,1
51
0,001
3,8
10
2 0,0
9 6,1
2 66
,11
0,0
3,0
2,0
2,0
max
0,19
9,39
1,885
0,1
87
0,003
6,3
20
9 0,1
8 9,4
3 81
,57
0,0
6,0
3,0
4,0
20 m
onth
s 0,1
7 10
,27
1,662
0,1
66
0,003
5,1
15
7 0,1
3 9,8
3 66
,36
0,0
4,9
3,1
3,3
min
0,12
7,33
1,597
0,1
30
0,002
3,7
11
2 0,1
0 9,0
3 56
,05
0,0
4,5
2,3
2,0
max
0,19
12,86
1,7
79
0,196
0,0
04
5,6
225
0,18
11,09
76
,05
0,0
5,3
3,5
4,3
24 m
onth
s 0,1
9 9,1
6 1,7
03
0,200
0,0
04
4,8
154
0,14
13,32
55
,53
0,0
4,4
2,5
3,2
min
0,14
7,36
1,606
0,1
56
0,003
3,5
11
3 0,1
0 10
,43
51,20
0,0
3,0
2,0
2,0
ma
x 0,2
2 11
,11
1,916
0,2
30
0,006
5,7
20
4 0,1
9 15
,49
61,68
0,0
5,0
3,0
4,0
Samp
le siz
e: 11
6

La rivista itaLiana deLLe sostanze grasse - voL. XCi - ottoBre/diCeMBre 2014
253
Tabl
e IIIb
- Ev
olutio
n of q
uality
param
eters
at 20
°C D
ark G
lass f
or lo
w qu
ality
oils (
FFA
> 0.2
0%)
Da
te
FFA
PV
K232
K2
70
DK
IND
PPH
K225
PP
Ps
DAGs
De
fect
s Fr
uity
Bitte
r Pu
ngen
t 4 m
onth
s 0,2
9 6,6
4 1,6
89
0,112
-0
,002
7,3
301
0,12
2,48
79,24
0,0
5,2
3,4
3,7
mi
n 0,2
5 4,8
0 1,2
91
0,072
-0
,002
3,2
112
0,09
2,00
74,60
0,0
4,0
2,5
3,0
ma
x 0,3
6 9,5
0 2,0
62
0,138
0,0
00
10,0
437
0,19
2,90
84,70
0,0
6,0
4,0
4,5
8 m
onth
s 0,2
6 9,5
4 1,8
37
0,158
0,0
00
6,8
268
0,16
5,24
68,52
0,0
5,0
4,2
4,1
mi
n 0,2
0 7,7
0 1,4
03
0,117
-0
,001
2,7
111
0,08
4,53
64,50
0,0
4,3
2,5
3,0
ma
x 0,3
2 11
,30
2,248
0,1
92
0,001
10
,1 36
1 0,2
2 6,6
1 74
,50
0,0
5,5
5,8
5,3
12 m
onth
s 0,2
7 12
,21
1,997
0,1
94
0,002
6,6
25
5 0,2
4 6,9
6 57
,37
0,0
5,1
3,5
4,3
min
0,21
9,46
1,437
0,1
49
0,001
2,7
90
0,1
3 5,4
3 51
,40
0,0
4,8
2,5
3,5
max
0,33
16,32
2,7
20
0,239
0,0
04
9,2
351
0,33
8,40
68,05
0,0
5,5
5,0
5,5
16
mon
ths
0,30
10,11
1,9
66
0,207
0,0
02
6,3
253
0,19
8,76
49,79
0,6
5,1
2,9
3,2
mi
n 0,2
2 7,9
8 1,4
81
0,162
0,0
02
2,9
101
0,08
7,60
39,78
0,0
4,3
1,8
2,0
ma
x 0,3
7 12
,37
2,372
0,2
47
0,004
8,3
36
5 0,2
7 11
,06
61,09
2,0
5,5
4,5
4,0
20
mon
ths
0,32
12,61
1,9
60
0,228
0,0
05
6,1
233
0,17
10,98
45
,86
0,4
4,8
3,0
3,6
min
0,25
9,60
1,539
0,1
98
0,004
2,5
94
0,1
0 9,2
0 40
,66
0,0
4,3
2,0
2,8
max
0,39
15,06
2,3
51
0,272
0,0
05
8,2
353
0,26
13,04
55
,70
2,0
5,3
4,0
4,0
24 m
onth
s 0,3
5 10
,14
1,932
0,2
36
0,006
6,0
24
2 0,1
9 14
,55
38,44
0,6
4,2
2,9
3,3
mi
n 0,2
8 7,8
6 1,5
24
0,182
0,0
04
2,4
99
0,11
13,03
34
,35
0,0
3,5
1,0
1,0
max
0,43
11,96
2,3
03
0,287
0,0
08
7,8
338
0,27
17,60
43
,68
2,0
5,0
4,0
4,8
Samp
le siz
e: 11
5 Ta
ble I
V - E
volut
ion of
Pyro
pheo
phyti
n 'a'
in oil
s with
diffe
rent
initia
l qua
lity (a
ccor
ding t
o FFA
leve
ls)
Mo
nth
FFA
= 0.2
FF
A =
0.4
FFA
= 0.8
FF
A =
1.0
FFA
= 3.5
FF
A =
5.4
FFA
= 6.0
0
0,00
0,00
0,50
0,00
0,00
0,00
0,00
2 0,6
0 1,0
1 0,9
2 0,7
0 0,5
3 0,4
9 0,6
5 4
0,99
1,33
1,65
1,05
0,81
1,09
1,03
5 1,3
8 2,1
8 2,1
0 1,5
0 1,4
0 1,3
6 2,1
1 6
1,73
2,88
3,16
2,17
1,93
1,96
2,11
8 2,5
4 3,0
5 3,5
7 3,2
1 2,6
4 2,4
1 2,4
7 10
4,2
4 4,2
3 4,6
0 5,1
9 4,0
9 4,0
9 4,1
7 11
5,8
7 6,3
2 6,2
8 7,2
7 6,4
0 5,4
8 6,4
7 12
6,8
9 7,0
8 7,7
8 8,0
8 8,0
1 7,8
9 7,5
3 Ta
ble V
- Ev
olutio
n of 1
,2-d
iacylg
lycer
ols in
oils
with
differ
ent in
itial q
uality
(acc
ordin
g to F
FA le
vels)
Mont
h FF
A =
0.2
FFA
= 0.4
FF
A =
0.8
FFA
= 1.0
FF
A =
3.5
FFA
= 5.4
FF
A =
6.0
0 96
,5 96
,1 81
,8 79
,9 73
,5 61
,7 57
,0 2
95,5
94,5
75,5
66,8
57,2
49,4
43,6
3 93
,7 92
,3 66
,2 59
,0 43
,6 35
,2 32
,9 4
91,6
90,8
59,8
54,5
37,6
33,2
32,6
5 88
,4 87
,4 55
,0 50
,5 33
,3 30
,1 29
,6 6
89,5
83,6
48,2
44,2
29,4
28,2
27,6
8 85
,7 82
,0 45
,4 42
,5 31
,1 30
,1 29
,7 10
82
,1 78
,5 41
,8 36
,9 28
,7 29
,1 28
,4 11
78
,7 73
,5 34
,1 32
,5 28
,4 27
,6 27
,2 12
78
,1 70
,0 32
,8 31
,6 26
,0 25
,4 26
,5
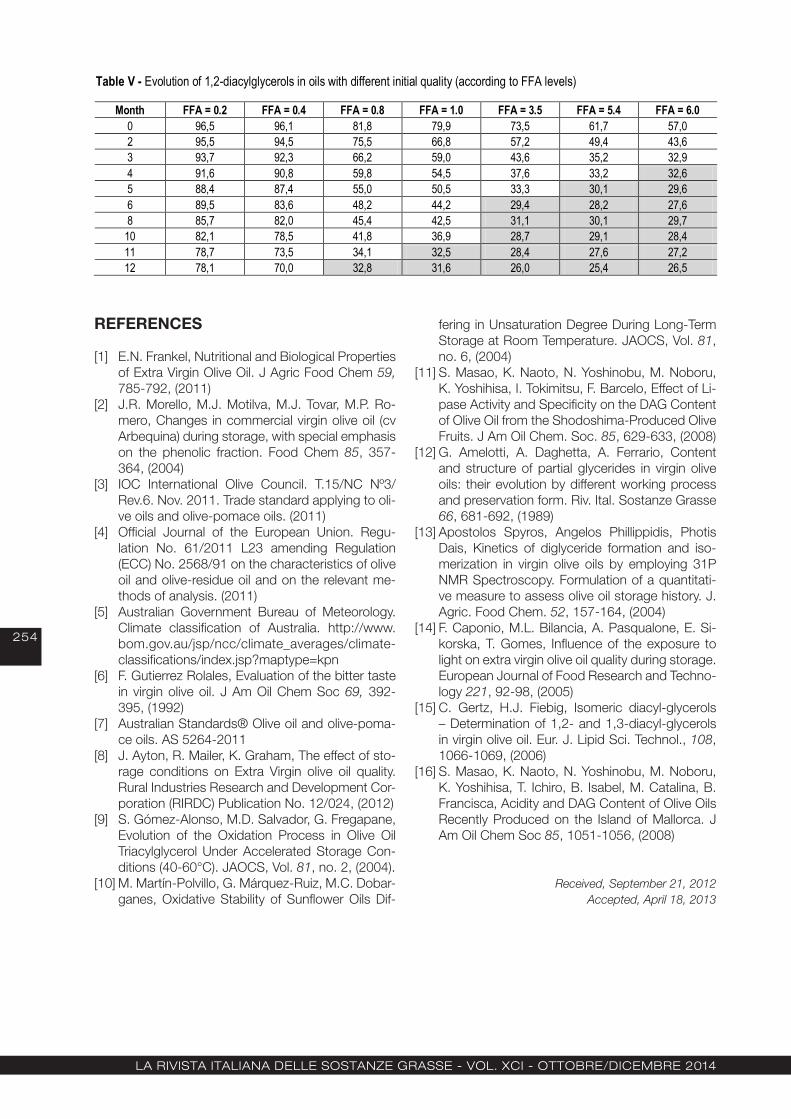
La rivista itaLiana deLLe sostanze grasse - voL. XCi - ottoBre/diCeMBre 2014
254
REFERENCES
E.N. Frankel, Nutritional and Biological Properties [1] of Extra Virgin Olive Oil. J Agric Food Chem 59, 785-792, (2011)J.R. Morello, M.J. Motilva, M.J. Tovar, M.P. Ro-[2] mero, Changes in commercial virgin olive oil (cv Arbequina) during storage, with special emphasis on the phenolic fraction. Food Chem 85, 357-364, (2004)IOC International Olive Council. T.15/NC Nº3/ [3] Rev.6. Nov. 2011. Trade standard applying to oli-ve oils and olive-pomace oils. (2011)Official Journal of the European Union. Regu-[4] lation No. 61/2011 L23 amending Regulation (ECC) No. 2568/91 on the characteristics of olive oil and olive-residue oil and on the relevant me-thods of analysis. (2011)Australian Government Bureau of Meteorology. [5] Climate classification of Australia. http://www.bom.gov.au/jsp/ncc/climate_averages/climate-classifications/index.jsp?maptype=kpnF. Gutierrez Rolales, Evaluation of the bitter taste [6] in virgin olive oil. J Am Oil Chem Soc 69, 392-395, (1992)Australian Standards® Olive oil and olive-poma-[7] ce oils. AS 5264-2011J. Ayton, R. Mailer, K. Graham, The effect of sto-[8] rage conditions on Extra Virgin olive oil quality. Rural Industries Research and Development Cor-poration (RIRDC) Publication No. 12/024, (2012)S. Gómez-Alonso, M.D. Salvador, G. Fregapane, [9] Evolution of the Oxidation Process in Olive Oil Triacylglycerol Under Accelerated Storage Con-ditions (40-60°C). JAOCS, Vol. 81, no. 2, (2004). M. Martín-Polvillo, G. Márquez-Ruiz, M.C. Dobar-[10] ganes, Oxidative Stability of Sunflower Oils Dif-
fering in Unsaturation Degree During Long-Term Storage at Room Temperature. JAOCS, Vol. 81, no. 6, (2004)S. Masao, K. Naoto, N. Yoshinobu, M. Noboru, [11] K. Yoshihisa, I. Tokimitsu, F. Barcelo, Effect of Li-pase Activity and Specificity on the DAG Content of Olive Oil from the Shodoshima-Produced Olive Fruits. J Am Oil Chem. Soc. 85, 629-633, (2008)G. Amelotti, A. Daghetta, A. Ferrario, Content [12] and structure of partial glycerides in virgin olive oils: their evolution by different working process and preservation form. Riv. Ital. Sostanze Grasse 66, 681-692, (1989)Apostolos Spyros, Angelos Phillippidis, Photis [13] Dais, Kinetics of diglyceride formation and iso-merization in virgin olive oils by employing 31P NMR Spectroscopy. Formulation of a quantitati-ve measure to assess olive oil storage history. J. Agric. Food Chem. 52, 157-164, (2004)F. Caponio, M.L. Bilancia, A. Pasqualone, E. Si-[14] korska, T. Gomes, Influence of the exposure to light on extra virgin olive oil quality during storage. European Journal of Food Research and Techno-logy 221, 92-98, (2005)C. Gertz, H.J. Fiebig, Isomeric diacyl-glycerols [15] – Determination of 1,2- and 1,3-diacyl-glycerols in virgin olive oil. Eur. J. Lipid Sci. Technol., 108, 1066-1069, (2006)S. Masao, K. Naoto, N. Yoshinobu, M. Noboru, [16] K. Yoshihisa, T. Ichiro, B. Isabel, M. Catalina, B. Francisca, Acidity and DAG Content of Olive Oils Recently Produced on the Island of Mallorca. J Am Oil Chem Soc 85, 1051-1056, (2008)
Received, September 21, 2012Accepted, April 18, 2013
Table IV - Evolution of Pyropheophytin 'a' in oils with different initial quality (according to FFA levels)
Month FFA = 0.2 FFA = 0.4 FFA = 0.8 FFA = 1.0 FFA = 3.5 FFA = 5.4 FFA = 6.0 0 0,00 0,00 0,50 0,00 0,00 0,00 0,00 2 0,60 1,01 0,92 0,70 0,53 0,49 0,65 4 0,99 1,33 1,65 1,05 0,81 1,09 1,03 5 1,38 2,18 2,10 1,50 1,40 1,36 2,11 6 1,73 2,88 3,16 2,17 1,93 1,96 2,11 8 2,54 3,05 3,57 3,21 2,64 2,41 2,47
10 4,24 4,23 4,60 5,19 4,09 4,09 4,17 11 5,87 6,32 6,28 7,27 6,40 5,48 6,47 12 6,89 7,08 7,78 8,08 8,01 7,89 7,53
Table V - Evolution of 1,2-diacylglycerols in oils with different initial quality (according to FFA levels)
Month FFA = 0.2 FFA = 0.4 FFA = 0.8 FFA = 1.0 FFA = 3.5 FFA = 5.4 FFA = 6.0 0 96,5 96,1 81,8 79,9 73,5 61,7 57,0 2 95,5 94,5 75,5 66,8 57,2 49,4 43,6 3 93,7 92,3 66,2 59,0 43,6 35,2 32,9 4 91,6 90,8 59,8 54,5 37,6 33,2 32,6 5 88,4 87,4 55,0 50,5 33,3 30,1 29,6 6 89,5 83,6 48,2 44,2 29,4 28,2 27,6 8 85,7 82,0 45,4 42,5 31,1 30,1 29,7
10 82,1 78,5 41,8 36,9 28,7 29,1 28,4 11 78,7 73,5 34,1 32,5 28,4 27,6 27,2 12 78,1 70,0 32,8 31,6 26,0 25,4 26,5

La rivista itaLiana deLLe sostanze grasse - voL. XCi - ottoBre/diCeMBre 2014
255
B. Matthäusa
M.M. Özcan*b
F. AL Juhaimic
aMax Rubner-Institut (MRI) Bundesforschungsinstitut
für Ernährung und Lebensmittel, Institut für Sicherheit und Qualität bei,
Detmold-Germany
bDepartment of Food Engineering Faculty of Agricultural
Selçuk University Konya, Turkey
cDepartment of Food Science & Nutrition, College of Food and
Agricultural Sciences, King Saud University, Riyadh-Saudi Arabia
*CORRESPONDING ADDRESS:Dr. M.M. Özcan
Department of Food Engineering Faculty of Agriculture
Selçuk University 42031 Konya, Turkey
Tlf:+90.332.2232933Fax:+90.332.2410108
e-mail: [email protected]
some physico-chemical properties and composition in wild olive (Olea europaea
l. subsp. oleaster) fruit and oil
In this study, some physico-chemical properties and composition in wild olive fruit and oil were determined. The fatty acid compositions of wild olive oils were determined using GC. Generally, oil contents of both samples were found to be 27.3 and 31.6% in the Mersin (Büyükeceli) and Antalya (Geyikbayır) locations, respectively in Turkey. Free fatty acid (0.9-1.2% oleic acid), peroxide value (12.7-10.4 meq O2/kg oil), total phenol (27.8-32.4 mg/kg) and specific gravity (0.927-0.931 g/cm3) of wild olive oils provided from Mersin (Büyükeceli) and Antalya (Geyikbayır) provinces were established, respectively. Oleic acid (67.8-58.9%) was presented as the highest concentration followed by linoleic acid (7-17%), palmitic (15.6-15.2%) and stearic acids (2.9-3.0%) in Mersin (Büyükeceli) and Antalya (Geyikbayir) wild olive oils, respectively. Tocopherol analyses by HPLC revealed the presence of α, β and γ-tocopherols in both the olive oil samples studied. Tocopherol contents of both samples changed between 34.2-27.6 mg/kg α-tocopherol, 0.0-0.3 mg/kg β-tocopherol and 0.5-0.7 mg/kg γ-tocopherol.Key words: wild olive, oil, proximate analyses, fatty acid composition, tocopherol
Alcune proprietà fisico-chimiche e la composizione del frutto di olivo selvatico (Olea europaea L. subsp. Oleastro) e dell’olioIn questo studio sono state determinate alcune proprietà fisico-chimiche e la composizione del frutto dell’olivo selvatico e dell’olio. Le composizioni di acidi grassi degli oli di oliva selvatica sono state determinate mediante GC. In generale, il contenuto di olio determinato in entrambi i campioni era 27,3 e 31,6% rispettivamente nelle sedi di Mersin (Büyükeceli) e Antalya (Geyikbayır), in Turchia. Sono stati rispettivamente determinati, acidi grassi liberi (0,9-1,2% di acido oleico), numero di perossidi (12,7-10,4 meq O2/kg olio), fenoli totali (27,8-32,4 mg/kg) e la densità (0,927-0,931 g/cm3) degli oli di oliva selvatica prodotti nelle province di Mersin (Büyükeceli) e Antalya (Geyikbayır); inoltre, negli stessi oli, l’acido oleico (67,8-58,9%) era presente come la più alta concentrazione seguito dall’acido linoleico (7-17%), acido palmitico (15,6-15,2%) e acido stearico (2,9-3,0%).L’analisi dei tocoferoli mediante HPLC ha rivelato la presenza di α, β e γ-tocoferoli in entrambi i campioni di olio di oliva studiati. Il contenuto di tocoferoli di entrambi i campioni variava tra 34,2-27,6 mg/kg di α-tocoferolo, 0,0-0,3 mg/kg di β-tocoferolo e di 0,5-0,7 mg/kg γ-tocoferolo.Parole chiave: oliva selvatica, olio, analisi immediate, composizione in acidi grassi, tocoferolo
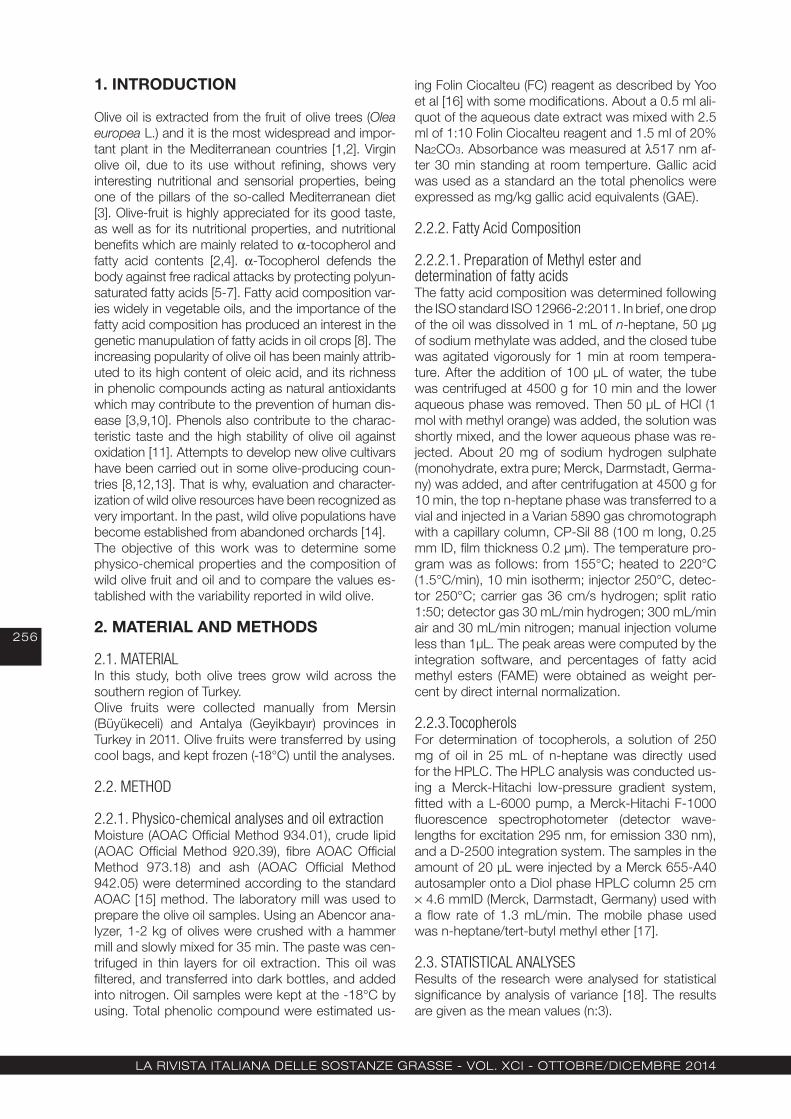
La rivista itaLiana deLLe sostanze grasse - voL. XCi - ottoBre/diCeMBre 2014
256
1. INTRODUCTION
Olive oil is extracted from the fruit of olive trees (Olea europea L.) and it is the most widespread and impor-tant plant in the Mediterranean countries [1,2]. Virgin olive oil, due to its use without refining, shows very interesting nutritional and sensorial properties, being one of the pillars of the so-called Mediterranean diet [3]. Olive-fruit is highly appreciated for its good taste, as well as for its nutritional properties, and nutritional benefits which are mainly related to α-tocopherol and fatty acid contents [2,4]. α-Tocopherol defends the body against free radical attacks by protecting polyun-saturated fatty acids [5-7]. Fatty acid composition var-ies widely in vegetable oils, and the importance of the fatty acid composition has produced an interest in the genetic manupulation of fatty acids in oil crops [8]. The increasing popularity of olive oil has been mainly attrib-uted to its high content of oleic acid, and its richness in phenolic compounds acting as natural antioxidants which may contribute to the prevention of human dis-ease [3,9,10]. Phenols also contribute to the charac-teristic taste and the high stability of olive oil against oxidation [11]. Attempts to develop new olive cultivars have been carried out in some olive-producing coun-tries [8,12,13]. That is why, evaluation and character-ization of wild olive resources have been recognized as very important. In the past, wild olive populations have become established from abandoned orchards [14].The objective of this work was to determine some physico-chemical properties and the composition of wild olive fruit and oil and to compare the values es-tablished with the variability reported in wild olive.
2. MATERIAL AND METHODS
2.1. MATERIALIn this study, both olive trees grow wild across the southern region of Turkey.Olive fruits were collected manually from Mersin (Büyükeceli) and Antalya (Geyikbayır) provinces in Turkey in 2011. Olive fruits were transferred by using cool bags, and kept frozen (-18°C) until the analyses.
2.2. METHOD
2.2.1. Physico-chemical analyses and oil extractionMoisture (AOAC Official Method 934.01), crude lipid (AOAC Official Method 920.39), fibre AOAC Official Method 973.18) and ash (AOAC Official Method 942.05) were determined according to the standard AOAC [15] method. The laboratory mill was used to prepare the olive oil samples. Using an Abencor ana-lyzer, 1-2 kg of olives were crushed with a hammer mill and slowly mixed for 35 min. The paste was cen-trifuged in thin layers for oil extraction. This oil was filtered, and transferred into dark bottles, and added into nitrogen. Oil samples were kept at the -18°C by using. Total phenolic compound were estimated us-
ing Folin Ciocalteu (FC) reagent as described by Yoo et al [16] with some modifications. About a 0.5 ml ali-quot of the aqueous date extract was mixed with 2.5 ml of 1:10 Folin Ciocalteu reagent and 1.5 ml of 20% Na2CO3. Absorbance was measured at λ517 nm af-ter 30 min standing at room temperture. Gallic acid was used as a standard an the total phenolics were expressed as mg/kg gallic acid equivalents (GAE).
2.2.2. Fatty Acid Composition
2.2.2.1. Preparation of Methyl ester and determination of fatty acidsThe fatty acid composition was determined following the ISO standard ISO 12966-2:2011. In brief, one drop of the oil was dissolved in 1 mL of n-heptane, 50 µg of sodium methylate was added, and the closed tube was agitated vigorously for 1 min at room tempera-ture. After the addition of 100 µL of water, the tube was centrifuged at 4500 g for 10 min and the lower aqueous phase was removed. Then 50 µL of HCl (1 mol with methyl orange) was added, the solution was shortly mixed, and the lower aqueous phase was re-jected. About 20 mg of sodium hydrogen sulphate (monohydrate, extra pure; Merck, Darmstadt, Germa-ny) was added, and after centrifugation at 4500 g for 10 min, the top n-heptane phase was transferred to a vial and injected in a Varian 5890 gas chromotograph with a capillary column, CP-Sil 88 (100 m long, 0.25 mm ID, film thickness 0.2 µm). The temperature pro-gram was as follows: from 155°C; heated to 220°C (1.5°C/min), 10 min isotherm; injector 250°C, detec-tor 250°C; carrier gas 36 cm/s hydrogen; split ratio 1:50; detector gas 30 mL/min hydrogen; 300 mL/min air and 30 mL/min nitrogen; manual injection volume less than 1µL. The peak areas were computed by the integration software, and percentages of fatty acid methyl esters (FAME) were obtained as weight per-cent by direct internal normalization.
2.2.3.TocopherolsFor determination of tocopherols, a solution of 250 mg of oil in 25 mL of n-heptane was directly used for the HPLC. The HPLC analysis was conducted us-ing a Merck-Hitachi low-pressure gradient system, fitted with a L-6000 pump, a Merck-Hitachi F-1000 fluorescence spectrophotometer (detector wave-lengths for excitation 295 nm, for emission 330 nm), and a D-2500 integration system. The samples in the amount of 20 µL were injected by a Merck 655-A40 autosampler onto a Diol phase HPLC column 25 cm × 4.6 mmID (Merck, Darmstadt, Germany) used with a flow rate of 1.3 mL/min. The mobile phase used was n-heptane/tert-butyl methyl ether [17].
2.3. STATISTICAL ANALYSES Results of the research were analysed for statistical significance by analysis of variance [18]. The results are given as the mean values (n:3).
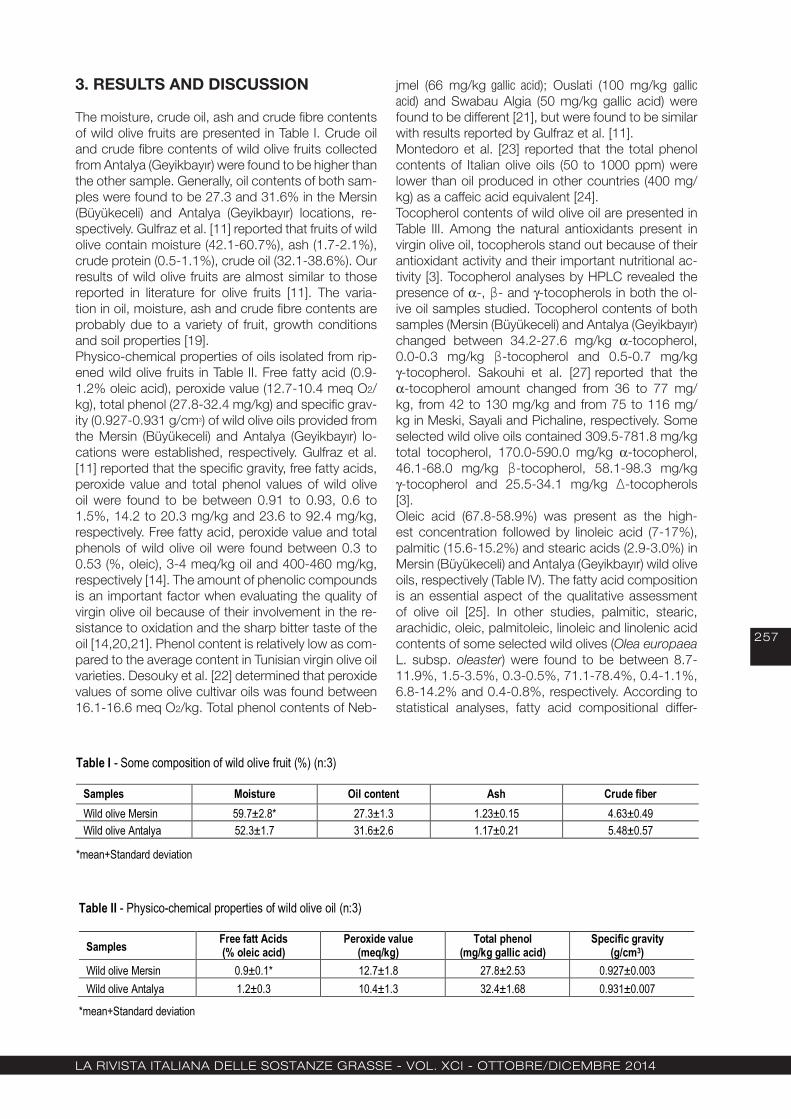
La rivista itaLiana deLLe sostanze grasse - voL. XCi - ottoBre/diCeMBre 2014
257
3. RESULTS AND DISCUSSION
The moisture, crude oil, ash and crude fibre contents of wild olive fruits are presented in Table I. Crude oil and crude fibre contents of wild olive fruits collected from Antalya (Geyikbayır) were found to be higher than the other sample. Generally, oil contents of both sam-ples were found to be 27.3 and 31.6% in the Mersin (Büyükeceli) and Antalya (Geyikbayır) locations, re-spectively. Gulfraz et al. [11] reported that fruits of wild olive contain moisture (42.1-60.7%), ash (1.7-2.1%), crude protein (0.5-1.1%), crude oil (32.1-38.6%). Our results of wild olive fruits are almost similar to those reported in literature for olive fruits [11]. The varia-tion in oil, moisture, ash and crude fibre contents are probably due to a variety of fruit, growth conditions and soil properties [19].Physico-chemical properties of oils isolated from rip-ened wild olive fruits in Table II. Free fatty acid (0.9-1.2% oleic acid), peroxide value (12.7-10.4 meq O2/kg), total phenol (27.8-32.4 mg/kg) and specific grav-ity (0.927-0.931 g/cm3) of wild olive oils provided from the Mersin (Büyükeceli) and Antalya (Geyikbayır) lo-cations were established, respectively. Gulfraz et al. [11] reported that the specific gravity, free fatty acids, peroxide value and total phenol values of wild olive oil were found to be between 0.91 to 0.93, 0.6 to 1.5%, 14.2 to 20.3 mg/kg and 23.6 to 92.4 mg/kg, respectively. Free fatty acid, peroxide value and total phenols of wild olive oil were found between 0.3 to 0.53 (%, oleic), 3-4 meq/kg oil and 400-460 mg/kg, respectively [14]. The amount of phenolic compounds is an important factor when evaluating the quality of virgin olive oil because of their involvement in the re-sistance to oxidation and the sharp bitter taste of the oil [14,20,21]. Phenol content is relatively low as com-pared to the average content in Tunisian virgin olive oil varieties. Desouky et al. [22] determined that peroxide values of some olive cultivar oils was found between 16.1-16.6 meq O2/kg. Total phenol contents of Neb-
jmel (66 mg/kg gallic acid); Ouslati (100 mg/kg gallic acid) and Swabau Algia (50 mg/kg gallic acid) were found to be different [21], but were found to be similar with results reported by Gulfraz et al. [11].Montedoro et al. [23] reported that the total phenol contents of Italian olive oils (50 to 1000 ppm) were lower than oil produced in other countries (400 mg/kg) as a caffeic acid equivalent [24].Tocopherol contents of wild olive oil are presented in Table III. Among the natural antioxidants present in virgin olive oil, tocopherols stand out because of their antioxidant activity and their important nutritional ac-tivity [3]. Tocopherol analyses by HPLC revealed the presence of α-, β- and γ-tocopherols in both the ol-ive oil samples studied. Tocopherol contents of both samples (Mersin (Büyükeceli) and Antalya (Geyikbayır) changed between 34.2-27.6 mg/kg α-tocopherol, 0.0-0.3 mg/kg β-tocopherol and 0.5-0.7 mg/kg γ-tocopherol. Sakouhi et al. [27] reported that the α-tocopherol amount changed from 36 to 77 mg/kg, from 42 to 130 mg/kg and from 75 to 116 mg/kg in Meski, Sayali and Pichaline, respectively. Some selected wild olive oils contained 309.5-781.8 mg/kg total tocopherol, 170.0-590.0 mg/kg α-tocopherol, 46.1-68.0 mg/kg β-tocopherol, 58.1-98.3 mg/kg γ-tocopherol and 25.5-34.1 mg/kg ∆-tocopherols [3]. Oleic acid (67.8-58.9%) was present as the high-est concentration followed by linoleic acid (7-17%), palmitic (15.6-15.2%) and stearic acids (2.9-3.0%) in Mersin (Büyükeceli) and Antalya (Geyikbayır) wild olive oils, respectively (Table IV). The fatty acid composition is an essential aspect of the qualitative assessment of olive oil [25]. In other studies, palmitic, stearic, arachidic, oleic, palmitoleic, linoleic and linolenic acid contents of some selected wild olives (Olea europaea L. subsp. oleaster) were found to be between 8.7-11.9%, 1.5-3.5%, 0.3-0.5%, 71.1-78.4%, 0.4-1.1%, 6.8-14.2% and 0.4-0.8%, respectively. According to statistical analyses, fatty acid compositional differ-
1
Table I - Some composition of wild olive fruit (%) (n:3)
*mean+Standard deviation
Table II - Physico-chemical properties of wild olive oil (n:3)
Samples Free fatt Acids (% oleic acid)
Peroxide value (meq/kg)
Total phenol (mg/kg gallic acid)
Specific gravity (g/cm3)
Wild olive Mersin 0.9±0.1* 12.7±1.8 27.8±2.53 0.927±0.003 Wild olive Antalya 1.2±0.3 10.4±1.3 32.4±1.68 0.931±0.007
*mean+Standard deviation
Table III - Tocopherol contents of wild olive oil (mg/Kg) (n:3)
Samples -tocopherol - tocopherol -tocopherol Total Wild olive Mersin 34.3±1.2 0.0 0.5±0.1 34.8±2.3 Wild olive Antalya 27.6±0.9 0.3±0.1 0.7±0.2 28.6±1.7
*mean+Standard deviation
Table IV - Fatty acid composition of wild olive oil collected from two locations in Turkey (%) (n:3)
Locations Palmitic Stearic Oleic Cis-vaccenic Linoleic Linolenic Arachidic 20:1D11 Behenic Total
Wild olive Mersin
15.6±1.1 2.9±0.2 67.8±2.2 2.8±0.2 7,0±0.2 0.9±0.1 0.5±0.0 0.2±0.0 0.1±0.0 97.9±1.6*
Wild olive Antalya 15.2±1.6 3.0±0.1 58.9±1.8 2.2±0.2 17,0±1.2 0.5±0.1 0.3±0.0 0.2±0.0 0.1±0.0 97.5±1.3
*mean+Standard deviation
Samples Moisture Oil content Ash Crude fiber Wild olive Mersin 59.7±2.8* 27.3±1.3 1.23±0.15 4.63±0.49 Wild olive Antalya 52.3±1.7 31.6±2.6 1.17±0.21 5.48±0.57

La rivista itaLiana deLLe sostanze grasse - voL. XCi - ottoBre/diCeMBre 2014
258
ences among the oils studied were significant. These results are in agreement with the results of other au-thors [3, 11, 22]. The fatty acid composition of oils is affected by species, genetics, variety, growing con-ditions, locality, climatic condition, and post harvest treatment [26]. Also, toxicological studies are required before this new oil can be recommended for human consumption.
4. CONCLUSION
Crude oil and crude fibre contents of wild olive fruits collected from Antalya (Geyikbayır) were found to be higher than the other sample. Free fatty acid (0.9-1.2% oleic acid), peroxide value (12.7-10.4 meq O2/kg), total phenol (27.8-32.4 mg/kg) and specific grav-ity (0.927-0.931 g/cm3) of wild olive oils provided from the Mersin and Antalya locations were established, respectively. Tocopherol contents of both samples Mersin (Büyükeceli) and Antalya (Geyikbayır) changed between 34.2-27.6 mg/kg α-tocopherol, 0.0-0.3 mg/kg β-tocopherol and 0.5-0.7 mg/kg γ-tocopherol. The fatty acid compositions of wild olive oils determined using GC suggested that oleic acid (67.8-58.9%) was present showing the highest concentration followed by linoleic acid (7-17%), palmitic (15.6-15.2%) and stearic acids (2.9-3.0%) in Mersin (Büyükeceli) and Antalya (Geyikbayır) wild olive oils, respectively. The knowledge about chemical and physical characteris-tics in both the wild olive samples was very important due to the nutritional value. These characteristics may contribute to having good nutritional values from this product.
Acknowledgements
This study was supported by Selcuk University Scien-tific Research Project (S.Ü.-BAP, Konya-Turkey). The authors wish to thank BAP Staffs.
REFERENCES
[1] B. Baccouri, W. Zarrouk, D.Krichene, N.B. Nou-airi Youssef, D. Daoud, M. Zarrouk, Influence of fruit ripening and crop yield on chemical pro-perties of virgin olive oils from seven selected oleasters (Olea europea L.). J. Agronomy 6 (3), 388-396 (2007).
[2] F. Sakouhi, S. Harrabi, C. Absalon, K. Sbei, S. Boukhchina, H. Kallel, α-Tocopherol and fatty acids contents of some Tunisian table olives (Olea europea L.): Changes in their composiion during ripening and processing. Food Chem. 108, 833-839 (2008).
[3] B. Baccouri, W. Zarrouk, O. Baccouri, M. Guer-fel, I. Nouairi, D. Krichene, D. Daoud, M. Zar-rouk, Composition, quality and oxidative stability of virgin olive oils from some selected wild oli-ves (Olea europaea L.subsp. oleaster). Grasas y Aceites 59, 346-351 (2008).
[4] F. Ribarova, R. Zanev, S. Shishkov, N. Rizov, α-Tocopherol, fatty acids and their correlations in Bulgarian foodstuffs. J. Food Com. Anal 16, 659-667 (2003).
[5] K.H. Cheeseeman, T.F. Slater, An introduction to free radical biochemistry. British Med. Bull. 49, 481-493 (1993).
[6] C.J. Doelman, In: C. Anclair & I. Emerit (Eds.). Antioxidant Therapy and Preventive Medicine. New York: Plenum Press, 9 (1989).
[7] A. Kamal-Eldin, R.A. Andersson, Multivaria-te study of the correlation between tocopherol content and fatty acid composition in vegeta-ble oils. J. Am. Oil Chem. Soc. 74 (4), 375-380 (1997).
[8] L. Leòn, M. Uceda, L.M. Jiménez, L.M. Martin, L. Rallo, Variability of fatty acid composition in olive (Olea europaea L.) Progenies. Spanish J. Agric. Res. 2 (3), 353-359 (2004).
1
Table I - Some composition of wild olive fruit (%) (n:3)
*mean+Standard deviation
Table II - Physico-chemical properties of wild olive oil (n:3)
Samples Free fatt Acids (% oleic acid)
Peroxide value (meq/kg)
Total phenol (mg/kg gallic acid)
Specific gravity (g/cm3)
Wild olive Mersin 0.9±0.1* 12.7±1.8 27.8±2.53 0.927±0.003 Wild olive Antalya 1.2±0.3 10.4±1.3 32.4±1.68 0.931±0.007
*mean+Standard deviation
Table III - Tocopherol contents of wild olive oil (mg/Kg) (n:3)
Samples -tocopherol - tocopherol -tocopherol Total Wild olive Mersin 34.3±1.2 0.0 0.5±0.1 34.8±2.3 Wild olive Antalya 27.6±0.9 0.3±0.1 0.7±0.2 28.6±1.7
*mean+Standard deviation
Table IV - Fatty acid composition of wild olive oil collected from two locations in Turkey (%) (n:3)
Locations Palmitic Stearic Oleic Cis-vaccenic Linoleic Linolenic Arachidic 20:1D11 Behenic Total
Wild olive Mersin
15.6±1.1 2.9±0.2 67.8±2.2 2.8±0.2 7,0±0.2 0.9±0.1 0.5±0.0 0.2±0.0 0.1±0.0 97.9±1.6*
Wild olive Antalya 15.2±1.6 3.0±0.1 58.9±1.8 2.2±0.2 17,0±1.2 0.5±0.1 0.3±0.0 0.2±0.0 0.1±0.0 97.5±1.3
*mean+Standard deviation
Samples Moisture Oil content Ash Crude fiber Wild olive Mersin 59.7±2.8* 27.3±1.3 1.23±0.15 4.63±0.49 Wild olive Antalya 52.3±1.7 31.6±2.6 1.17±0.21 5.48±0.57
La rivista itaLiana deLLe sostanze grasse - voL. XCi - ottoBre/diCeMBre 2014
259
[9] F. Visioli, C. Galli, The effect of minor consti-tuents of olive oil on cardiovasiular disease: new findings. Nutr . Rev. 56,142-147 (1998).
[10] F. Visioli, C. Galli, F. Barnet, A. Mattei, R. Petelli, G. Galli, D. Caruso, Olive oil phenolics are do-se-dependently absorbed in humans. Fed. Eur. Biochem. Soc. 468,159-160 (2000).
[11] M. Gulfraz, R. Kasuar, G. Arshad, S. Mehmood, N. Minhas, M.J. Asad, A. Ahmad, F. Siddique, Isalation and characterization of edible oil from wild Olive. African J. Biotechnol. 8 (16), 3734-3738 (2009).
[12] M. Issaou, B. Mechri, A. Echbili, S. Dbbou, A. Yangui, H. Belguith, A. Trigui, M. Hammami, Chemometric characterization of five Tunusian varietals of Olea europaea L. Olive fruit accor-ding to different maturation indices. J. Food Li-pids 15, 277-296 (2008).
[13] A. Ranalli, A.Tombesi, M.L. Ferrante, G. De Mat-tia, Respiratory rate of olive drupes during their ripening cycle and quality of oil extracted. J. Sci. Food Agric. 77, 359-367 (1998).
[14] B. Baccouri, M. Geuerel, W. Zarrouk, W. Taa-malli, D. Daoud, M. Zarrouk, Wild olive (Olea eu-ropaea L.) selection for quality oil production. J. Food Biochem. 35 (1), 161-176 (2011).
[15] AOCS, Official Methods and recommended practices (Vol.1, 4th ed.). American Oil Chemists` Society, Champaign, IL (1990).
[16] K.M. Yoo, K.W. Lee, J.B. Park, H.J. Lee, I.K. Hwang, Variation in major antioxidants and to-tal antioxidant activity of Yuzu (Citrus junos Sieb ex Tanaka) during maturation and between cul-tivars. J. Agric. Food Chem. 52, 5907-5913 (2004).
[17] M. Balz, E. Schulte, H.P. Their, Trennung von To-copherolen und Tocotrienolen durch HPLC. Fat Sci. Tehnol. 94, 209-213 (1992).
[18] H. Püskülcü, F. İkiz, Introduction to Statistic. Bilgehan Press. Bornova. İzmir,Turkey. (in Turk-ish), 333 (1989)
[19] J.L.R. Pitchard, Analysis and properties of oil seed. In:Rossel JB, Pitchard JIR, Editor, Analy-sis of oil seeds, fats and fatty foods, Elsevier Science, Oxford, 305-308 (1991).
[20] F. Gutierrez, T. Arnaud, A. Garrido, Contribution of polyhenols to the oxidative stability of virgin olive oil. J. Sci. Food Agric. 81, 1-8 (2001).
[21] D. Krichene, W. Taamalli, D. Daoud, M.D. Sal-vador, G.D. Fregapane, M. Zarrouk, Phenolic compounds, tocopherols and other minor com-ponents in virgin olive oils of some Tunusian va-rieties. J. Food Biochem. 31, 194-197 (2007).
[22] I.M. Desouky, L.F. Haggag, M.M.M. Abd El-Migeed, E.S. El-Hady, Changes in Some Phy-sical and Chemical Properties of Fruit and Oil in Some Olive Oil Cultivars During Harvesting Sta-ge. World J. Agric. Sci. 5 (6), 760-765 (2009).
[23] G.F. Montedoro, M. Servili, M. Baldioli, E. Miniati, Simple and hydrolyzable phenolic compounds in virgin olive oil. Their extraction separation and quantitative and semi quantitative evaluation by HPLC. J. Agric. Food Chem. 40, 1571-1576 (1992).
[24] J.M. Garcia, S. Seller, M.C. Perz-Camino, In-fluence of fruit ripening on olive oil quality. J. Agric. Food Chem. 44, 3516 (1996).
[25] D. Boskou, Olive oil Quality in Boskou D. (Ed.) Olive Oil: Chemistry and Tekhnology 101-120. AOCS Press, Champaign, IL, USA (1996).
[26] K. Warner, S. Knowlton, Frying quality and oxi-dative stability of high-oleic corn oils. J. Am. Oil Chem. Soc. 74, 1317-1321 (1997).
[27] F. Sakouhi, S. Harrabi, C. Absalon, K. Sbei, H. Boukhchina Kallel, α-Tocopherol and fatty ac-ids contents of some Tunisian table olives (Olea europea L.). Changes in their composition dur-ing ripening and processing. Food Chem. 108, 833-839 (2008).
Received, March 25, 2013Accepted, May 29, 2013
Laboratorio
di analisi sensoriale
dell’Olio di
Oliva vergine
INNOVHUB - Stazioni Sperimentali per l’Industria Azienda Speciale della Camera di Commercio – Milano
Divisione SSOG – Dr.ssa Silvia Tagliabue Responsabile Laboratorio Analisi Sensoriale
Tel.: 02.706497.78 - Fax: 02.2363953 - E-mail: [email protected]
Il Reg. UE 1348 /2013 (modifica del Reg. CEE 2568/1991) stabilisce i parametri chimico-fisici e i metodi per il controllo di qualità dell’olio di oliva. La valutazione organolettica (Panel test), introdotta nel regolamento comunitario, concorre alla definizione della qualità dell’olio e alla classificazione merceologica di appartenenza. Il Regolamento classifica l’olio di oliva vergine nelle categorie:
OLIO EXTRA VERGINE DI OLIVA OLIO DI OLIVA VERGINE OLIO DI OLIVA LAMPANTE
in funzione dell’intensità del fruttato, della presenza e dell’intensità di eventuali difetti. Fornisce inoltre indicazioni sulle caratteristiche organolettiche per l’etichettatura facoltativa. La valutazione organolettica è qualificata da un livello di affidabilità paragonabile a quello delle prove analitiche e viene eseguita da un panel di assaggiatori selezionati e addestrati, avvalendosi di tecniche statistiche per il trattamento dei dati. Il nostro Panel è riconosciuto dal MiPAF (Ministero delle Politiche Agricole Alimentari e Forestali) come comitato di assaggio incaricato del controllo ufficiale delle caratteristiche degli oli di oliva vergini e degli oli DOP e IGP e dal COI (Consiglio Oleicolo Internazionale). La valutazione organolettica è accreditata da ACCREDIA. Il Panel è al servizio dell’industria, di consorzi di produzione, di enti certificatori e della grande distribuzione.

La rivista itaLiana deLLe sostanze grasse - voL. XCi - ottoBre/diCeMBre 2014
261
J.S. Amaral1,2,*
S. Soares1
I. Mafra1,*
M. Beatriz PP Oliveira1
1 REQUIMTEDepartamento de Ciências
QuímicasFaculdade de Farmácia
Universidade do PortoPorto, Portugal
2 ESTiGInstituto Politécnico de Bragança
Bragança, Portugal
* CORRESPONDING AUTHOR:Joana S. Amaral
REQUIMTEDepartamento de Ciências
QuímicasFaculdade de Farmácia
Universidade do PortoRua de Jorge Viterbo Ferreira, 228
4050-313 Porto, Portugal phone: +351 273303138
e-mail: [email protected]
Isabel Mafrae-mail: [email protected]
assessing the variability of the fatty acid profile and cholesterol
content of meat sausages
Eighteen different brands of meat sausages including pork, poultry and the mixture of both meats (pork and poultry) in sausages, were analysed for their nutritional composition (total fat, moisture, crude protein and ash), cholesterol content and fatty acid composition. As expected, the pork Frankfurter sausages presented a higher fat content compared to sausages that include poultry meat in their composition. A multivariate statistical analysis was applied to the data showing the existence of significant differences among samples. Regarding fatty acid composition, significant differences were verified in canonical variate plots when the samples were grouped by sausage type, suggesting that the fatty acid profile is strongly influenced by the type of meats, as well as other ingredients such as vegetable oil and lard, used in its formulation. The group of poultry Frankfurter sausages presented lower levels of SFA and higher levels of PUFA, which can point to a healthier profile compared to the pork and meat mixture sausages. Nevertheless, some poultry sausages showed a higher cholesterol content compared to the pork Frankfurters. The lowest mean cholesterol content was obtained for the group of pork Frankfurters, which somehow contradicts the consumers’ idea that pork meat products should be avoided due to its high cholesterol levels.Keywords: Frankfurter sausages, pork meat, poultry meat, cholesterol, fatty acid composition
Accesso alla variabilità del profilo degli acidi grassi e del colesterolo contenuti nelle salsicce di carneDiciotto diverse marche di salsicce di carne che comprendono carni suine, pollame e miscela di entrambe le carni (maiale e pollame), sono state analizzate per la loro composizione nutrizionale (grassi totali, umidità, proteine grezze e ceneri), contenuto di colesterolo e composizione in acidi grassi. Come previsto, le salsicce di maiale Frankfurter hanno presentato un più alto contenuto di grassi rispetto alle salsicce che nella loro composizione comprendono carne di pollame. Ai dati è stata applicata l’analisi statistica multivariata che mostra l’esistenza di differenze significative tra i campioni. Per quanto riguarda la composizione in acidi grassi, sono state verificate differenze significative quando i campioni sono stati raggruppati in base al tipo di salsiccia, il che suggerisce che il profilo degli acidi grassi è fortemente influenzato dal tipo di carne, così come da altri ingredienti come l’olio vegetale e lo strutto, utilizzati per la sua formulazione.Il gruppo di salsicce di pollame Frankfurter ha presentato livelli più bassi di SFA e livelli più alti di PUFA, che può puntare a un profilo più sano rispetto a salsicce con carne di maiale e a salsicce a base di miscele di carni. Tuttavia, alcune salsicce di pollame hanno mostrato contenuto di colesterolo più elevato rispetto alle salsicce di maiale Frankfurter. Il più basso contenuto di colesterolo medio è stato ottenuto per il gruppo di salsicce di maiale Frankfurter e contraddice in qualche modo l’idea dei consumatori che i prodotti a base di carne di maiale dovrebbero essere evitati per i loro alti livelli di colesterolo.Parole Chiave: Salsicce Frankfurter, carne di maiale, carne di pollame, colesterolo, composizione degli acidi grassi
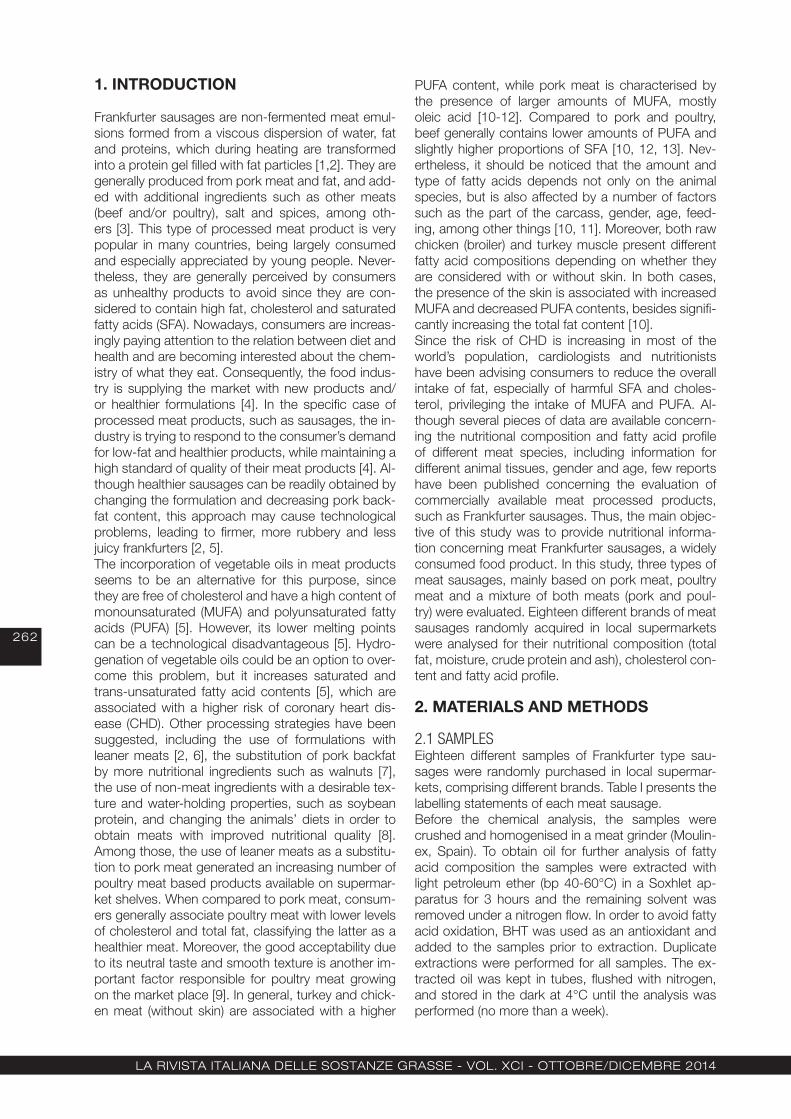
La rivista itaLiana deLLe sostanze grasse - voL. XCi - ottoBre/diCeMBre 2014
262
1. INTRODUCTION
Frankfurter sausages are non-fermented meat emul-sions formed from a viscous dispersion of water, fat and proteins, which during heating are transformed into a protein gel filled with fat particles [1,2]. They are generally produced from pork meat and fat, and add-ed with additional ingredients such as other meats (beef and/or poultry), salt and spices, among oth-ers [3]. This type of processed meat product is very popular in many countries, being largely consumed and especially appreciated by young people. Never-theless, they are generally perceived by consumers as unhealthy products to avoid since they are con-sidered to contain high fat, cholesterol and saturated fatty acids (SFA). Nowadays, consumers are increas-ingly paying attention to the relation between diet and health and are becoming interested about the chem-istry of what they eat. Consequently, the food indus-try is supplying the market with new products and/or healthier formulations [4]. In the specific case of processed meat products, such as sausages, the in-dustry is trying to respond to the consumer’s demand for low-fat and healthier products, while maintaining a high standard of quality of their meat products [4]. Al-though healthier sausages can be readily obtained by changing the formulation and decreasing pork back-fat content, this approach may cause technological problems, leading to firmer, more rubbery and less juicy frankfurters [2, 5]. The incorporation of vegetable oils in meat products seems to be an alternative for this purpose, since they are free of cholesterol and have a high content of monounsaturated (MUFA) and polyunsaturated fatty acids (PUFA) [5]. However, its lower melting points can be a technological disadvantageous [5]. Hydro-genation of vegetable oils could be an option to over-come this problem, but it increases saturated and trans-unsaturated fatty acid contents [5], which are associated with a higher risk of coronary heart dis-ease (CHD). Other processing strategies have been suggested, including the use of formulations with leaner meats [2, 6], the substitution of pork backfat by more nutritional ingredients such as walnuts [7], the use of non-meat ingredients with a desirable tex-ture and water-holding properties, such as soybean protein, and changing the animals’ diets in order to obtain meats with improved nutritional quality [8]. Among those, the use of leaner meats as a substitu-tion to pork meat generated an increasing number of poultry meat based products available on supermar-ket shelves. When compared to pork meat, consum-ers generally associate poultry meat with lower levels of cholesterol and total fat, classifying the latter as a healthier meat. Moreover, the good acceptability due to its neutral taste and smooth texture is another im-portant factor responsible for poultry meat growing on the market place [9]. In general, turkey and chick-en meat (without skin) are associated with a higher
PUFA content, while pork meat is characterised by the presence of larger amounts of MUFA, mostly oleic acid [10-12]. Compared to pork and poultry, beef generally contains lower amounts of PUFA and slightly higher proportions of SFA [10, 12, 13]. Nev-ertheless, it should be noticed that the amount and type of fatty acids depends not only on the animal species, but is also affected by a number of factors such as the part of the carcass, gender, age, feed-ing, among other things [10, 11]. Moreover, both raw chicken (broiler) and turkey muscle present different fatty acid compositions depending on whether they are considered with or without skin. In both cases, the presence of the skin is associated with increased MUFA and decreased PUFA contents, besides signifi-cantly increasing the total fat content [10].Since the risk of CHD is increasing in most of the world’s population, cardiologists and nutritionists have been advising consumers to reduce the overall intake of fat, especially of harmful SFA and choles-terol, privileging the intake of MUFA and PUFA. Al-though several pieces of data are available concern-ing the nutritional composition and fatty acid profile of different meat species, including information for different animal tissues, gender and age, few reports have been published concerning the evaluation of commercially available meat processed products, such as Frankfurter sausages. Thus, the main objec-tive of this study was to provide nutritional informa-tion concerning meat Frankfurter sausages, a widely consumed food product. In this study, three types of meat sausages, mainly based on pork meat, poultry meat and a mixture of both meats (pork and poul-try) were evaluated. Eighteen different brands of meat sausages randomly acquired in local supermarkets were analysed for their nutritional composition (total fat, moisture, crude protein and ash), cholesterol con-tent and fatty acid profile.
2. MATERIALS AND METHODS
2.1 SAMPLESEighteen different samples of Frankfurter type sau-sages were randomly purchased in local supermar-kets, comprising different brands. Table I presents the labelling statements of each meat sausage. Before the chemical analysis, the samples were crushed and homogenised in a meat grinder (Moulin-ex, Spain). To obtain oil for further analysis of fatty acid composition the samples were extracted with light petroleum ether (bp 40-60°C) in a Soxhlet ap-paratus for 3 hours and the remaining solvent was removed under a nitrogen flow. In order to avoid fatty acid oxidation, BHT was used as an antioxidant and added to the samples prior to extraction. Duplicate extractions were performed for all samples. The ex-tracted oil was kept in tubes, flushed with nitrogen, and stored in the dark at 4°C until the analysis was performed (no more than a week).

La rivista itaLiana deLLe sostanze grasse - voL. XCi - ottoBre/diCeMBre 2014
263
2.2 PROXIMATE ANALYSIS Analyses of moisture, total fat, ash and crude protein were carried out in triplicate for each sample. Moisture was determined (ca. 5 g test sample) using a SMO 01 infrared moisture balance (Scaltec, Goettingen, Ger-many) at 100±2°C. Ash, crude protein (N × 6.25), and total fat content were determined according to AOAC Official Methods [14]. Carbohydrate content was es-timated using the following formula:
carbohydrate content = 100% - (%moisture + %protein + %fat + %ash).
2.3 FATTY ACID COMPOSITIONThe fatty acid profile was determined by gas-liquid chromatography with flame ionisation detection (GLC-FID)/capillary column. The fatty acids were converted to fatty acid methyl esters (FAME) by hydrolysis of the extracted oil with a 11 g/L methanolic potassium hy-droxide solution, followed by methyl esterification with BF3/MeOH, extraction with n-heptane and quantifi-cation using a Chrompack CP 9001 chromatograph (Middelburg, The Netherlands) equipped with a split-splitless injector, a FID and an autosampler Chrom-pack CP-9050. The temperatures of the injector and detector were 230°C and 270°C, respectively. Sepa-ration was achieved on a 50 m × 0.25 mm i.d. fused silica capillary column coated with a 0.19 µm film of CP-Sil 88 (Chrompack). Helium was used as a carrier gas at an internal pressure of 120 kPa. The column temperature was 160°C, with a one minute hold, and then programmed to increase to 239°C at a rate of
4°C/min and then 10 minutes hold. The split ratio was 1:50 and the injected volume was 1.2 µL. The results were expressed in relative percentage of each fatty acid, calculated by internal normalisation of the chro-matographic peak area. Fatty acid identification was made by comparing the relative retention times of fatty acid methyl esters (FAME) peaks with standards. A Supelco mixture of 37 FAME was used as the stan-dard. The fatty acid isomers methyl cis-9-trans-12-octadecadienoate, methyl trans-9-cis-12-octadec-adienoate and methyl cis-11-octadecenoate were identified using individual standards purchased from Supelco. Analyses were carried out in triplicate as-says for each sample.
2.4 CHOLESTEROLCholesterol content was determined based on a methodology previously reported [15]. Briefly, approx-imately 1 g of each sample was accurately weighed into a glass screw cap tube and dispersed in 3 mL ethanol solution (96%) by vortex mixing. Saponifica-tion was performed by adding 2 mL of KOH (50%) in water. The mixture was stirred for 1 min, sonicated for 10 min and put in a water bath at 70°C with agita-tion for 30 min. After hydrolysis, 2.5 mL of cold water were added and the mixture was allowed to cool to room temperature. Subsequently, 5 mL of n-hexane were added, the mixture was vigorously vortex stirred for 1 min, centrifuged (3 min, 4000 g) (Heraeus Se-patech, Germany) and the clean n-hexane layer was collected into another glass tube. The mixture was re-extracted twice, the combined extracts were taken to
Table I - Composition of the different Frankfurter sausages according to label information
Sample Ingredients Pork meat based
F1 Pork meat, ice, mechanically separated pork meat, connective tissue, vegetal protein, salt, spices. F2 Pork meat, ice, pork fat, salt, spices, soya protein, dairy proteins, dextrose. Contains: celery, soybean, mustard, milk and wheat. F3 Pork meat, water, salt, dairy proteins, spices, sugar, hydrolysed vegetable protein. F4 Pork meat, water, soya protein, salt, extract of paprika, spices, chilli, spicy, sugar. F5 Pork meat, water, salt, sodium caseinate, spices (with celery), condiments, lactose, smoke. F6 Pork meat, water, salt, milk protein, spices, mustard, condiments, celery, lactose, dextrose, smoke. F7 Pork meat, water, salt, dairy proteins, spices (with celery), hydrolysed whey milk protein, lactose, smoke.
Poultry meat based F8 Poultry meat (chicken and turkey), water, lard, salt, dairy proteins, aromatic herbs, spices, sugar, maltodextrin. F9 Turkey meat, water, vegetable fat, mechanically recovered meats from poultry, salt, milk proteins, soya protein, spices, dextrose. F10 Mechanically separated meats from poultry, ice, poultry meat, vegetable oil, starches, soya protein, poultry fat, salt, spices,
sugars, dairy proteins, dextrose. F11 Poultry mechanically recovered meat, water, soy protein, maize starch, salt, dextrose, spices. F12 Poultry meat (chicken, turkey), water, lard, salt, spices (with celery), hydrolysed whey milk protein, lactose and smoke. F13 Turkey meat, water, vegetable oil, spices, extract of spices, condiments, lactose. F14 Chicken meat, water, mechanically recovered meats from poultry, salt, soya protein, milk proteins, spices, dextrose, sugars.
Pork and Poultry mixtures F15 Pork meat, ice, mechanically separated meats from poultry, pork fat, rind of pork, soya protein, gluten, salt, spices, dairy proteins. F16 Pork meat, ice, mechanically separated meats from poultry, connective tissue, soybean protein, starch, salt, spices. F17 Pork meat, ice, mechanically separated meats from poultry, fat pig, soybean protein, gluten, salt, spices, sugar, dairy proteins,
dextrose. F18 Mechanically separated meats from turkey/chicken, water, pork meat, salt, dairy proteins, spices (with celery), hydrolysed
vegetable protein.

La rivista itaLiana deLLe sostanze grasse - voL. XCi - ottoBre/diCeMBre 2014
264
dryness under a nitrogen stream on a Reacti-Therm module (Pierce, Rockford, IL) operating at ambient temperature, and the residue was reconstituted to a final volume of 2 mL with n-hexane. The extract was transferred to a 2 mL vial and 20 µL were analysed by High Performance Liquid Chromatography (HPLC). A Jasco integrated system (Japan) equipped with an AS-950 automated injector, a PU-980 pump and a MD-910 multiwavelength diode array detector (DAD) was used for the analysis of cholesterol. Separation was carried out on a 75 × 3.0 mm (3 µm) SupelcosilTM LC-SI normal phase column from Supelco (Bellefon-te, PA, USA) operating at room temperature (~20°C). The mobile phase used consisted of a mixture of hexane and 1,4-dioxane (97.5:2.5, v/v) at a flow rate of 1 mL/min. All solvents were reagent-grade for ex-traction and HPLC grade for chromatography. Cho-lesterol identification was made by comparing the relative retention times and UV spectra of peaks with data from cholesterol standard obtained from Sigma-Aldrich (Madrid, Spain). Chromatographic data were analysed using a Borwin-PDA Controller 156 Soft-ware (JMBS, France) 1.5 version based on the chro-matograms recorded at 210 nm. Quantification was carried out by external standardisation. The standard solutions were subjected to the entire extraction method described above and a calibration curve with a concentration range from 0.14 to 0.56 mg/mL was used for quantification purposes. Analyses were car-ried out in triplicate assays for each sample.
2.5 STATISTICAL ANALYSISData were reported as mean ± standard deviation. Analysis of variance (ANOVA) and Tukey’s HSD test were carried out to identify significant differences (p <0.05) concerning the cholesterol content. To evalu-ate significant differences among samples regarding its nutritional composition (fat, protein, carbohydrates, ash and moisture contents) data were subjected to multivariate analysis comprising: i) MANOVA to evaluate the hypothesis “there is
at least one group different from the others in at least one parameter”, also calculating the Wilks’ lambda and the Pillai-Bartlett trace values;
ii) Hotelling T2 tests applied to pairs of groups, to evaluate the hypothesis that “the two groups are significantly different in at least one parameter”, calculating T2 values and calculating and tabling the respective F values and corresponding prob-abilities;
iii) forward stepwise discriminant analysis to select the most discriminant variables;
iv) canonical variate analysis (CVA) based on a sub-set of the selected variables to further analyse the differences between groups and display those differences in convenient canonical variate plots. Multivariate analysis of data concerning the fatty acid composition of samples included a forward stepwise discriminant analysis to select the most
discriminant variables followed by CVA based on a subset of the selected variables to further anal-yse the differences between groups and display those differences in convenient canonical variate plots. All analyses were carried out in the Statis-tica for Windows statistical package (Statistica for Windows, StatSoft Inc., Tulsa, OK).
3. RESULTS AND DISCUSSION
3.1 NUTRITIONAL COMPOSITIONSo far, several studies have been performed focus-ing on Frankfurter sausages, yet they mainly concern technological or nutritional improvements regarding their production or microbiological safety evaluation, with very few reports concerning nutritional data of commercial Frankfurters. Table I shows the ingredi-ents stated on the label of each analysed sample and Table II shows the chemical composition obtained for the eighteen Frankfurters, evidencing the nutritional differences among pork, poultry and pork/poultry meat based sausages. In all samples, moisture was the predominant component, followed by fat and pro-tein, which is in good agreement with other previously published results for commercial Frankfurters [9, 16-18]. When compared with data for pork Frankfurters reported in the USDA National Nutrient Database for Standard Reference [19], the mean value for mois-ture in the analysed samples (64.85%) was slightly higher than the one of the USDA database (59.85%), with only one sample presenting a much lower value (50.92%). Identical values were obtained for protein (12.70% versus 12.81% USDA database), lower val-ues were found for ash content (2.07% versus 3.35% USDA database) and higher values were calculated by difference for carbohydrates (2.21% versus 0.28% USDA database). Regarding total fat, mean content (18.17%) was below the value reported in the USDA database (23.68%), with 3 samples presenting much lower values. This might indicate an increased careful-ness by the industry in lowering the fat content of these products, although maintaining the protein level. In what concerns the poultry meat based sausages, compared to the USDA values reported for chicken and turkey Frankfurters, all the analysed samples showed higher moisture contents and lower fat con-tents. In general, ash and carbohydrates were lower and protein levels were identical or slightly lower than the values reported in the USDA database. Similar analyses were carried out by González-Viñas et al. [16] in 10 samples of commercial Frankfurters purchased in Spain, comprising of only one pork meat based sausage, with the remaining composed of both pork and poultry meat. Compared to the results for the herein studied Frankfurters produced with meat mixtures, the values reported by González-Viñas et al. [16] are mainly different regarding moisture contents, which were much lower (54.5-63.8%). Moreover, some samples had higher fat (10.83-21.92%) and

La rivista itaLiana deLLe sostanze grasse - voL. XCi - ottoBre/diCeMBre 2014
265
protein (11.13-6.06%) contents when compared with the values obtained in the present study (Tab. II). In general, variations can be observed within the groups (Tab. II), which can be explained by the ingre-dients used in each brand formulation since, as re-ferred, different tissues from the same animal species can vary widely in moisture, protein and fat content, thus affecting the sausage composition. To check for significant differences among the 3 groups consid-ered (pork, poultry and meat mixture based Frankfurt-ers), multivariate statistical analysis was carried out to exploit data for nutritional composition. The results of Hotelling T2 tests (Tab. III) showed that all groups were statistically different, with pork sausages signifi-
cantly presenting higher fat and lower moisture con-tents, while poultry sausages presented significantly lower fat and higher protein contents when compared to meat mixture based sausages. Univariate analy-sis of variance and Discriminant analysis (DA) were subsequently carried out to check for the most im-portant parameters in the discrimination among the groups and a canonical variate analysis (CVA) was performed to enable the visualisation of the results. Figure 1 shows the plot of Canonical Variates 1 ver-sus 2, where all the information is condensed: 88.3% of data information is represented in the first dimen-sion, mainly separating pork Frankfurters from the other two groups reflecting its higher fat content. The
Table II - Chemical composition of commercial Frankfurters (g/100 g of sample, mean ± standard deviation).
Sample Moisture Crude protein Total fat Ash Carbohydrates Fat/protein Pork meat based
F1 75.86 ± 0.23 11.58 ± 0.29 8.54 ± 0.01 2.05 ± 0.14 1.98 ± 0.66 0.74 F2 66.22 ± 0.33 14.97 ± 0.25 15.88 ± 0.00 1.80 ± 0.01 1.13 ± 0.08 1.06 F3 68.18 ± 0.11 12.40 ± 0.17 15.25 ± 0.49 2.10 ± 0.02 2.07 ± 0.45 1.23 F4 50.92 ± 0.62 16.08 ± 0.27 25.36 ± 0.16 2.95 ± 0.03 4.70 ± 0.54 1.58 F5 62.89 ± 0.51 11.49 ± 0.23 20.04 ± 0.09 1.88 ± 0.06 3.71 ± 0.77 1.74 F6 64.93 ± 0.04 11.28 ± 0.22 21.09 ± 0.29 1.77 ± 0.01 0.92 ± 0.46 1.87 F7 64.92 ± 0.03 11.13 ± 0.02 21.07 ± 0.09 1.94 ± 0.01 0.94 ± 0.12 1.89
Mean 64.85 12.70 18.17 2.07 2.21 1.44 Range 50.9 - 75.9 11.1 - 16.1 8.5 - 25.4 1.8 - 3.0 0.9 - 4.7 0.7 - 1.9
Poultry meat based F8 68.76 ± 0.42 12.21 ± 0.41 13.64 ± 0.10 2.56 ± 0.03 2.83 ± 0.14 1.12 F9 70.75 ± 0.11 11.32 ± 0.32 11.76 ± 0.19 1.96 ± 0.06 4.21 ± 0.46 1.04
F10 71.02 ± 0.19 13.90 ± 0.12 8.83 ± 0.08 2.65 ± 0.01 3.60 ± 0.21 0.64 F11 70.18 ± 0.38 14.01 ± 0.04 11.05 ± 0.05 2.33 ± 0.17 2.43 ± 0.30 0.79 F12 71.49 ± 0.23 11.69 ± 0.07 14.33 ± 0.08 1.99 ± 0.15 0.51 ± 0.10 1.23 F13 71.08 ± 0.10 14.18 ± 0.36 11.36 ± 0.68 1.97 ± 0.05 1.41 ± 0.17 0.80 F14 76.50 ± 0.42 12.94 ± 0.08 6.91 ± 0.05 1.79 ± 0.03 1.86 ± 0.42 0.53
Mean 71.39 12.89 11.13 2.18 2.41 0.88 Range 68.8 - 76.5 11.3 - 14.2 6.9 - 14.3 1.8 - 2.7 0.5 - 4.2 0.5 - 1.2
Pork and Poultry mixtures F15 69.89 ± 0.06 9.97 ± 0.07 14.54 ± 0.19 2.04 ± 0.02 3.56 ± 0.20 1.46 F16 72.70 ± 0.08 8.86 ± 0.14 12.11 ± 0.06 2.11 ± 0.05 4.21 ± 0.24 1.37 F17 69.51 ± 0.18 10.82 ± 0.03 14.53 ± 0.69 1.75 ± 0.07 3.40 ± 0.95 1.34 F18 67.85 ± 0.01 15.04 ± 0.09 13.06 ± 0.18 2.62 ± 0.03 1.44 ± 0.11 0.87 Mean 69.99 11.17 13.56 2.13 3.15 1.18 Range 69.5 - 72.7 8.9 - 15.0 12.1 - 14.5 1.8 - 2.6 1.4 - 4.2 0.9 - 1.5
Table III - MANOVA and Hotelling T2 tests for the overall difference between group samples of Frankfurters based on the chemical composition.
Summary of MANOVA tests Wilks’ Lambda = 0.35361 Pillai-Bartlett trace = 0.75894
Summary of Hotelling T2 tests Pork Poultry Mixture
Pork ----- Fat Moisture
Fat Moisture
Poultry F(5,36) = 9.0126 p <0.00001 ----- Protein
Fat
Mixture F(5,27) = 5.1809 p <0.00185
F(5,27) = 2.9691 p <0.02912 -----
Lower triangle: Fobs values (Hotelling T2); Upper triangle: variables for which tobs values were found to be significant on the univariate test of the hypothesis that two group means are equal.

La rivista itaLiana deLLe sostanze grasse - voL. XCi - ottoBre/diCeMBre 2014
266second canonical dimension expresses the fact that some poultry Frankfurters have lower fat and high-er protein contents compared to the meat mixture based sausages. Nevertheless, it can be observed that some poultry and meat mixture based sausages have a similar composition, with the two groups being close to each other in the biplot. The achieved results showed that, as expected, commercial pork Frank-furters have a higher fat content when compared to those that include poultry meat in their composition.
3.2 FATTY ACID COMPOSITIONNowadays, there is a general agreement that the type of fat or fatty acids consumed is of utmost importance with regard to our health. In fact, fatty acid composi-tion can influence various physiological and biochem-ical processes, including blood pressure regulation, glucose metabolism, lipidic metabolism, platelet ag-gregation, and erythrocyte deformability [20].The fatty acid profile of the analysed Frankfurters is shown in Table IV. The data shows that the samples of pork and pork/poultry meats present more within the group similarities than the ones belonging to the group of poultry Frankfurters, which present a higher variability regarding fatty acid composition.
With one exception (sample F9), oleic acid was the predominant compound in all groups of Frankfurters. All samples also presented considerable amounts of palmitic, linoleic and stearic acids, with some varia-tions regarding their proportions depending on the Frankfurter type. In the case of the pork and poul-try meat mixture and most pork meat samples, oleic acid was followed by palmitic, linoleic and stearic acids (with some pork sausages having higher con-tents of stearic rather than linoleic acid). These results are in good agreement with data reported for pork Frankfurters manufactured in pilot plants [7, 21]. In the group of poultry samples, a higher dispersion of results was observed as had been already referred to: in some samples oleic acid was followed by lino-leic, palmitic and steric acids, while others presented higher levels of palmitic rather than linoleic acid. The variability of results regarding fatty acid composition of this group of Frankfurters can possibly be related to the use of different ingredients in its production. For example, samples F8 and F12 refer to the use of lard, which is associated with higher SFA contents. Samples F9, F10 and F13 refer to the use of veg-etable oil, which present a higher MUFA or PUFA con-tent depending on the oil, and samples F9, F10, F11
Pork Mixture Poultry-4 -3 -2 -1 0 1 2 3 4
Canonical Variate 1 (88.3%)
-3
-2
-1
0
1
2
3C
anon
ical
Var
iate
2 (1
1.7%
)
Protein
Fat
Moisture
Fat
Figure 1 - Biplot of canonical variates 1 versus 2 obtained by a CVA applied to chemical composition data with the type of Frankfurter as the grouping factor (parameters labelling canonical axes are important for their interpretation).
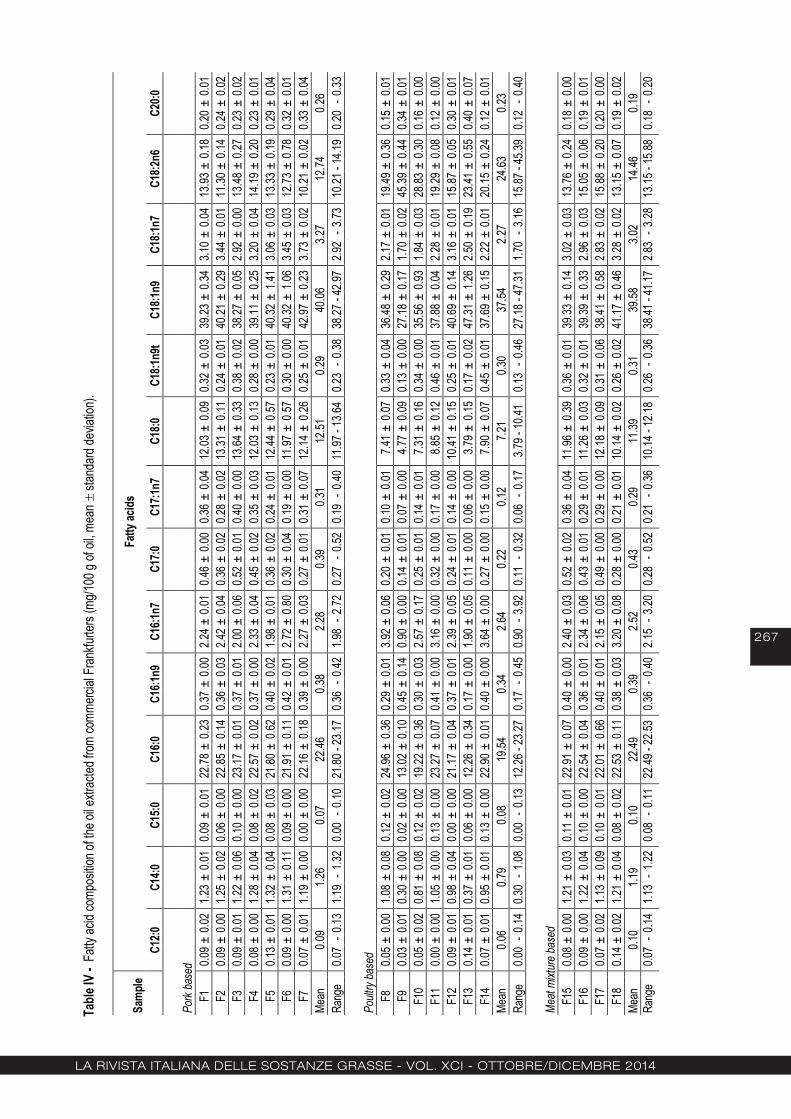
La rivista itaLiana deLLe sostanze grasse - voL. XCi - ottoBre/diCeMBre 2014
267
Table
IV -
Fatty
acid
comp
ositio
n of th
e oil e
xtrac
ted fr
om co
mmerc
ial F
rankfu
rters
(mg/1
00 g
of oil
, mea
n
stand
ard de
viatio
n).
Samp
le Fa
tty ac
ids
C12:0
C1
4:0
C15:0
C1
6:0
C16:1
n9
C16:1
n7
C17:0
C1
7:1n7
C1
8:0
C18:1
n9t
C18:1
n9
C18:1
n7
C18:2
n6
C20:0
Po
rk ba
sed
F1
0.09
± 0.0
2 1.2
3 ±
0.01
0.09
± 0.0
1 22
.78 ±
0.23
0.3
7 ±
0.00
2.24
± 0.0
1 0.4
6 ±
0.00
0.36
± 0.0
4 12
.03 ±
0.09
0.3
2 ±
0.03
39.23
± 0
.34
3.10
± 0.0
4 13
.93 ±
0.18
0.2
0 ±
0.01
F2
0.0
9 ±
0.00
1.25
± 0.0
2 0.0
6 ±
0.00
22.85
± 0
.14
0.36
± 0.0
3 2.4
2 ±
0.04
0.36
± 0.0
2 0.2
8 ±
0.02
13.31
± 0
.11
0.24
± 0.0
1 40
.21 ±
0.29
3.4
4 ±
0.01
11.30
± 0
.14
0.24
± 0.0
2 F3
0.09
± 0.0
1 1.2
2 ±
0.06
0.10
± 0.0
0 23
.17 ±
0.01
0.3
7 ±
0.01
2.00
± 0.0
6 0.5
2 ±
0.01
0.40
± 0.0
0 13
.64 ±
0.33
0.3
8 ±
0.02
38.27
± 0
.05
2.92
± 0.0
0 13
.48 ±
0.27
0.2
3 ±
0.02
F4
0.0
8 ±
0.00
1.28
± 0.0
4 0.0
8 ±
0.02
22.57
± 0
.02
0.37
± 0.0
0 2.3
3 ±
0.04
0.45
± 0.0
2 0.3
5 ±
0.03
12.03
± 0
.13
0.28
± 0.0
0 39
.11 ±
0.25
3.2
0 ±
0.04
14.19
± 0
.20
0.23
± 0.0
1 F5
0.13
± 0.0
1 1.3
2 ±
0.04
0.08
± 0.0
3 21
.80 ±
0.62
0.4
0 ±
0.02
1.98
± 0.0
1 0.3
6 ±
0.02
0.24
± 0.0
1 12
.44 ±
0.57
0.2
3 ±
0.01
40.32
± 1
.41
3.06
± 0.0
3 13
.33 ±
0.19
0.2
9 ±
0.04
F6
0.0
9 ±
0.00
1.31
± 0.1
1 0.0
9 ±
0.00
21.91
± 0
.11
0.42
± 0.0
1 2.7
2 ±
0.80
0.30
± 0.0
4 0.1
9 ±
0.00
11.97
± 0
.57
0.30
± 0.0
0 40
.32 ±
1.06
3.4
5 ±
0.03
12.73
± 0
.78
0.32
± 0.0
1 F7
0.07
± 0.0
1 1.1
9 ±
0.00
0.00
± 0.0
0 22
.16 ±
0.18
0.3
9 ±
0.00
2.27
± 0.0
3 0.2
7 ±
0.01
0.31
± 0.0
7 12
.14 ±
0.26
0.2
5 ±
0.01
42.97
± 0
.23
3.73
± 0.0
2 10
.21 ±
0.02
0.3
3 ±
0.04
Mean
0.09
1.26
0.07
22.46
0.3
8 2.2
8 0.3
9 0.3
1 12
.51
0.29
40.06
3.2
7 12
.74
0.26
Rang
e
0.07
- 0.1
3 1.1
9 -
1.32
0.00
- 0.1
0 21
.80 -
23.17
0.3
6 -
0.42
1.98
- 2.7
2 0.2
7 -
0.52
0.19
- 0.4
0 11
.97 -
13.64
0.2
3 -
0.38
38.27
- 42
.97
2.92
- 3.7
3 10
.21 -
14.19
0.2
0 -
0.33
Poult
ry ba
sed
F8
0.05
± 0.0
0 1.0
8 ±
0.08
0.12
± 0.0
2 24
.96 ±
0.36
0.2
9 ±
0.01
3.92
± 0.0
6 0.2
0 ±
0.01
0.10
± 0.0
1 7.4
1 ±
0.07
0.33
± 0.0
4 36
.48 ±
0.29
2.1
7 ±
0.01
19.49
± 0
.36
0.15
± 0.0
1 F9
0.03
± 0.0
1 0.3
0 ±
0.00
0.02
± 0.0
0 13
.02 ±
0.10
0.4
5 ±
0.14
0.90
± 0.0
0 0.1
4 ±
0.01
0.07
± 0.0
0 4.7
7 ±
0.09
0.13
± 0.0
0 27
.18 ±
0.17
1.7
0 ±
0.02
45.39
± 0
.44
0.34
± 0.0
1 F1
0
0.05
± 0.0
2 0.8
1 ±
0.08
0.12
± 0.0
2 19
.22 ±
0.36
0.3
0 ±
0.03
2.57
± 0.1
7 0.2
5 ±
0.01
0.14
± 0.0
1 7.3
1 ±
0.16
0.34
± 0.0
0 35
.56 ±
0.93
1.8
4 ±
0.03
28.83
± 0
.30
0.16
± 0.0
0 F1
1
0.00
± 0.0
0 1.0
5 ±
0.00
0.13
± 0.0
0 23
.27 ±
0.07
0.4
1 ±
0.00
3.16
± 0.0
0 0.3
2 ±
0.00
0.17
± 0.0
0 8.8
5 ±
0.12
0.46
± 0.0
1 37
.88 ±
0.04
2.2
8 ±
0.01
19.29
± 0
.08
0.12
± 0.0
0 F1
2
0.09
± 0.0
1 0.9
8 ±
0.04
0.00
± 0.0
0 21
.17 ±
0.04
0.3
7 ±
0.01
2.39
± 0.0
5 0.2
4 ±
0.01
0.14
± 0.0
0 10
.41 ±
0.15
0.2
5 ±
0.01
40.69
± 0
.14
3.16
± 0.0
1 15
.87 ±
0.05
0.3
0 ±
0.01
F13
0.1
4 ±
0.01
0.37
± 0.0
1 0.0
6 ±
0.00
12.26
± 0
.34
0.17
± 0.0
0 1.9
0 ±
0.05
0.11
± 0.0
0 0.0
6 ±
0.00
3.79
± 0.1
5 0.1
7 ±
0.02
47.31
± 1
.26
2.50
± 0.1
9 23
.41 ±
0.55
0.4
0 ±
0.07
F14
0.0
7 ±
0.01
0.95
± 0.0
1 0.1
3 ±
0.00
22.90
± 0
.01
0.40
± 0.0
0 3.6
4 ±
0.00
0.27
± 0.0
0 0.1
5 ±
0.00
7.90
± 0.0
7 0.4
5 ±
0.01
37.69
± 0
.15
2.22
± 0.0
1 20
.15 ±
0.24
0.1
2 ±
0.01
Mean
0.06
0.79
0.08
19.54
0.3
4 2.6
4 0.2
2 0.1
2 7.2
1 0.3
0 37
.54
2.27
24.63
0.2
3 Ra
nge
0.0
0 -
0.14
0.30
- 1.0
8 0.0
0 -
0.13
12.26
- 23
.27
0.17
- 0.4
5 0.9
0 -
3.92
0.11
- 0.3
2 0.0
6 -
0.17
3.79 -
10.41
0.1
3 -
0.46
27.18
- 47
.31
1.70
- 3.1
6 15
.87 -
45.39
0.1
2 -
0.40
Meat
mixtu
re ba
sed
F1
5
0.08
± 0.0
0 1.2
1 ±
0.03
0.11
± 0.0
1 22
.91 ±
0.07
0.4
0 ±
0.00
2.40
± 0.0
3 0.5
2 ±
0.02
0.36
± 0.0
4 11
.96 ±
0.39
0.3
6 ±
0.01
39.33
± 0
.14
3.02
± 0.0
3 13
.76 ±
0.24
0.1
8 ±
0.00
F16
0.0
9 ±
0.00
1.22
± 0.0
4 0.1
0 ±
0.00
22.54
± 0
.04
0.36
± 0.0
1 2.3
4 ±
0.06
0.43
± 0.0
1 0.2
9 ±
0.01
11.26
± 0
.03
0.32
± 0.0
1 39
.39 ±
0.33
2.9
6 ±
0.03
15.05
± 0
.06
0.19
± 0.0
1 F1
7
0.07
± 0.0
2 1.1
3 ±
0.09
0.10
± 0.0
1 22
.01 ±
0.66
0.4
0 ±
0.01
2.15
± 0.0
5 0.4
9 ±
0.00
0.29
± 0.0
0 12
.18 ±
0.09
0.3
1 ±
0.06
38.41
± 0
.58
2.83
± 0.0
2 15
.88 ±
0.20
0.2
0 ±
0.00
F18
0.1
4 ±
0.02
1.21
± 0.0
4 0.0
8 ±
0.02
22.53
± 0
.11
0.38
± 0.0
3 3.2
0 ±
0.08
0.28
± 0.0
0 0.2
1 ±
0.01
10.14
± 0
.02
0.26
± 0.0
2 41
.17 ±
0.46
3.2
8 ±
0.02
13.15
± 0
.07
0.19
± 0.0
2 Me
an
0.1
0 1.1
9 0.1
0 22
.49
0.39
2.52
0.43
0.29
11.39
0.3
1 39
.58
3.02
14.46
0.1
9 Ra
nge
0.0
7 -
0.14
1.13
- 1.2
2 0.0
8 -
0.11
22.49
- 22
.53
0.36
- 0.4
0 2.1
5 -
3.20
0.28
- 0.5
2 0.2
1 -
0.36
10.14
- 12
.18
0.26
- 0.3
6 38
.41 -
41.17
2.8
3 -
3.28
13.15
- 15
.88
0.18
- 0.2
0
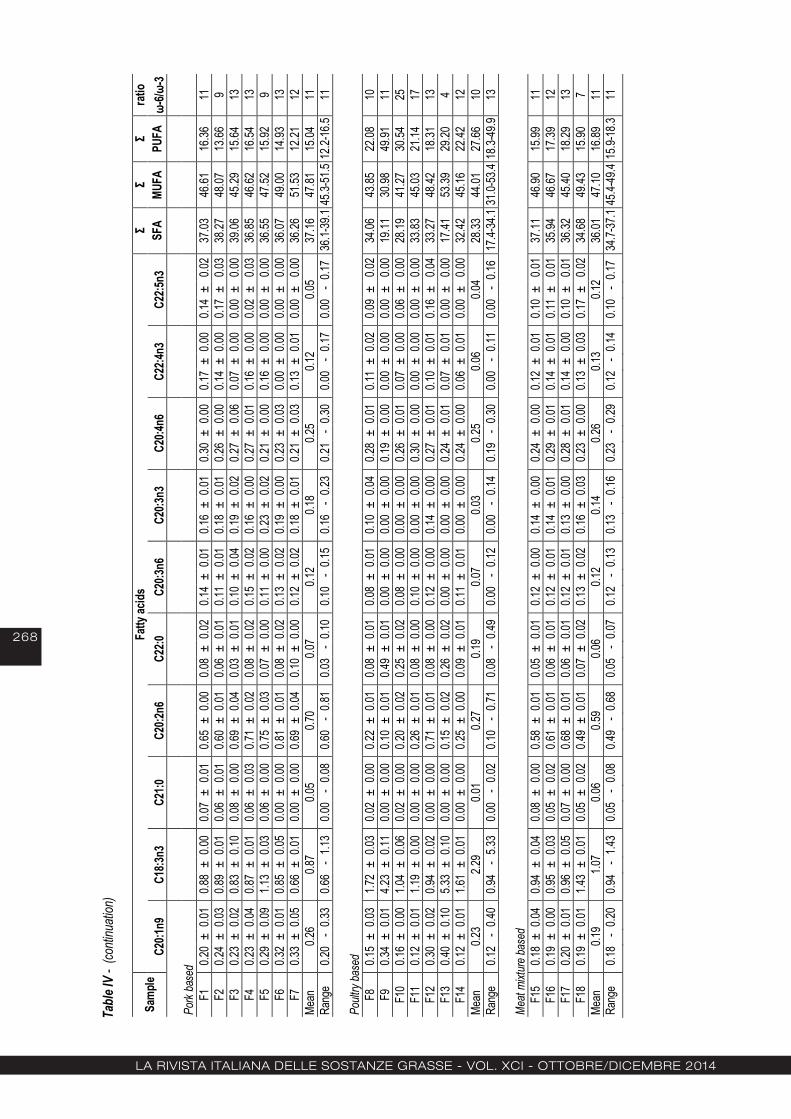
La rivista itaLiana deLLe sostanze grasse - voL. XCi - ottoBre/diCeMBre 2014
268
Table
IV -
(con
tinua
tion)
Samp
le Fa
tty ac
ids
Σ Σ
Σ ra
tio
C20:1
n9
C18:3
n3
C21:0
C2
0:2n6
C2
2:0
C20:3
n6
C20:3
n3
C20:4
n6
C22:4
n3
C22:5
n3
SFA
MUFA
PU
FA
ω-6/ω
-3
Pork
base
d
F1
0.20
± 0.0
1 0.8
8 ±
0.00
0.07
± 0.0
1 0.6
5 ±
0.00
0.08
± 0.0
2 0.1
4 ±
0.01
0.16
± 0.0
1 0.3
0 ±
0.00
0.17
± 0.0
0 0.1
4 ±
0.02
37.03
46
.61
16.36
11
F2
0.2
4 ±
0.03
0.89
± 0.0
1 0.0
6 ±
0.01
0.60
± 0.0
1 0.0
6 ±
0.01
0.11
± 0.0
1 0.1
8 ±
0.01
0.26
± 0.0
0 0.1
4 ±
0.00
0.17
± 0.0
3 38
.27
48.07
13
.66
9 F3
0.2
3 ±
0.02
0.83
± 0.1
0 0.0
8 ±
0.00
0.69
± 0.0
4 0.0
3 ±
0.01
0.10
± 0.0
4 0.1
9 ±
0.02
0.27
± 0.0
6 0.0
7 ±
0.00
0.00
± 0.0
0 39
.06
45.29
15
.64
13
F4
0.23
± 0.0
4 0.8
7 ±
0.01
0.06
± 0.0
3 0.7
1 ±
0.02
0.08
± 0.0
2 0.1
5 ±
0.02
0.16
± 0.0
0 0.2
7 ±
0.01
0.16
± 0.0
0 0.0
2 ±
0.03
36.85
46
.62
16.54
13
F5
0.2
9 ±
0.09
1.13
± 0.0
3 0.0
6 ±
0.00
0.75
± 0.0
3 0.0
7 ±
0.00
0.11
± 0.0
0 0.2
3 ±
0.02
0.21
± 0.0
0 0.1
6 ±
0.00
0.00
± 0.0
0 36
.55
47.52
15
.92
9 F6
0.3
2 ±
0.01
0.85
± 0.0
5 0.0
0 ±
0.00
0.81
± 0.0
1 0.0
8 ±
0.02
0.13
± 0.0
2 0.1
9 ±
0.00
0.23
± 0.0
3 0.0
0 ±
0.00
0.00
± 0.0
0 36
.07
49.00
14
.93
13
F7
0.33
± 0.0
5 0.6
6 ±
0.01
0.00
± 0.0
0 0.6
9 ±
0.04
0.10
± 0.0
0 0.1
2 ±
0.02
0.18
± 0.0
1 0.2
1 ±
0.03
0.13
± 0.0
1 0.0
0 ±
0.00
36.26
51
.53
12.21
12
Me
an
0.26
0.87
0.05
0.70
0.07
0.12
0.18
0.25
0.12
0.05
37.16
47
.81
15.04
11
Ra
nge
0.20
- 0.3
3 0.6
6 -
1.13
0.00
- 0.0
8 0.6
0 -
0.81
0.03
- 0.1
0 0.1
0 -
0.15
0.16
- 0.2
3 0.2
1 -
0.30
0.00
- 0.1
7 0.0
0 -
0.17
36.1-
39.1
45.3-
51.5
12.2-
16.5
11
Po
ultry
base
d
F8
0.1
5 ±
0.03
1.72
± 0.0
3 0.0
2 ±
0.00
0.22
± 0.0
1 0.0
8 ±
0.01
0.08
± 0.0
1 0.1
0 ±
0.04
0.28
± 0.0
1 0.1
1 ±
0.02
0.09
± 0.0
2 34
.06
43.85
22
.08
10
F9
0.34
± 0.0
1 4.2
3 ±
0.11
0.00
± 0.0
0 0.1
0 ±
0.01
0.49
± 0.0
1 0.0
0 ±
0.00
0.00
± 0.0
0 0.1
9 ±
0.00
0.00
± 0.0
0 0.0
0 ±
0.00
19.11
30
.98
49.91
11
F1
0 0.1
6 ±
0.00
1.04
± 0.0
6 0.0
2 ±
0.00
0.20
± 0.0
2 0.2
5 ±
0.02
0.08
± 0.0
0 0.0
0 ±
0.00
0.26
± 0.0
1 0.0
7 ±
0.00
0.06
± 0.0
0 28
.19
41.27
30
.54
25
F11
0.12
± 0.0
1 1.1
9 ±
0.00
0.00
± 0.0
0 0.2
6 ±
0.01
0.08
± 0.0
0 0.1
0 ±
0.00
0.00
± 0.0
0 0.3
0 ±
0.00
0.00
± 0.0
0 0.0
0 ±
0.00
33.83
45
.03
21.14
17
F1
2 0.3
0 ±
0.02
0.94
± 0.0
2 0.0
0 ±
0.00
0.71
± 0.0
1 0.0
8 ±
0.00
0.12
± 0.0
0 0.1
4 ±
0.00
0.27
± 0.0
1 0.1
0 ±
0.01
0.16
± 0.0
4 33
.27
48.42
18
.31
13
F13
0.40
± 0.1
0 5.3
3 ±
0.10
0.00
± 0.0
0 0.1
5 ±
0.02
0.26
± 0.0
2 0.0
0 ±
0.00
0.00
± 0.0
0 0.2
4 ±
0.01
0.07
± 0.0
1 0.0
0 ±
0.00
17.41
53
.39
29.20
4
F14
0.12
± 0.0
1 1.6
1 ±
0.01
0.00
± 0.0
0 0.2
5 ±
0.00
0.09
± 0.0
1 0.1
1 ±
0.01
0.00
± 0.0
0 0.2
4 ±
0.00
0.06
± 0.0
1 0.0
0 ±
0.00
32.42
45
.16
22.42
12
Me
an
0.23
2.29
0.01
0.27
0.19
0.07
0.03
0.25
0.06
0.04
28.33
44
.01
27.66
10
Ra
nge
0.12
- 0.4
0 0.9
4 -
5.33
0.00
- 0.0
2 0.1
0 -
0.71
0.08
- 0.4
9 0.0
0 -
0.12
0.00
- 0.1
4 0.1
9 -
0.30
0.00
- 0.1
1 0.0
0 -
0.16
17.4-
34.1
31.0-
53.4
18.3-
49.9
13
Me
at mi
xture
base
d
F15
0.18
± 0.0
4 0.9
4 ±
0.04
0.08
± 0.0
0 0.5
8 ±
0.01
0.05
± 0.0
1 0.1
2 ±
0.00
0.14
± 0.0
0 0.2
4 ±
0.00
0.12
± 0.0
1 0.1
0 ±
0.01
37.11
46
.90
15.99
11
F1
6 0.1
9 ±
0.00
0.95
± 0.0
3 0.0
5 ±
0.02
0.61
± 0.0
1 0.0
6 ±
0.01
0.12
± 0.0
1 0.1
4 ±
0.01
0.29
± 0.0
1 0.1
4 ±
0.01
0.11
± 0.0
1 35
.94
46.67
17
.39
12
F17
0.20
± 0.0
1 0.9
6 ±
0.05
0.07
± 0.0
0 0.6
8 ±
0.01
0.06
± 0.0
1 0.1
2 ±
0.01
0.13
± 0.0
0 0.2
8 ±
0.01
0.14
± 0.0
0 0.1
0 ±
0.01
36.32
45
.40
18.29
13
F1
8 0.1
9 ±
0.01
1.43
± 0.0
1 0.0
5 ±
0.02
0.49
± 0.0
1 0.0
7 ±
0.02
0.13
± 0.0
2 0.1
6 ±
0.03
0.23
± 0.0
0 0.1
3 ±
0.03
0.17
± 0.0
2 34
.68
49.43
15
.90
7 Me
an
0.19
1.07
0.06
0.59
0.06
0.12
0.14
0.26
0.13
0.12
36.01
47
.10
16.89
11
Ra
nge
0.18
- 0.2
0 0.9
4 -
1.43
0.05
- 0.0
8 0.4
9 -
0.68
0.05
- 0.0
7 0.1
2 -
0.13
0.13
- 0.1
6 0.2
3 -
0.29
0.12
- 0.1
4 0.1
0 -
0.17
34.7-
37.1
45.4-
49.4
15.9-
18.3
11

La rivista itaLiana deLLe sostanze grasse - voL. XCi - ottoBre/diCeMBre 2014
269
and F14 refer to the inclusion of mechanically sepa-rated meats. Previous studies concerning the effects of deboning methods on the chemical composition of turkey meat showed that mechanical deboning re-sulted on lower levels of stearic and arachidonic acids and higher levels of oleic, linoleic and linolenic acids, when compared to turkey meat separated by hand deboning processes [22]. Moreover, differences have been reported concerning the fatty acid composition of light versus dark meat, both for chicken and tur-key meats as well as to the presence of the skin [10]. Besides increasing the fat content, the use of skin in the case of chicken meat increases the MUFA con-tent while decreasing the PUFA, in comparison with the same meat without skin. In the case of turkey, the meat with skin is associated with higher MUFA and lower SFA and PUFA contents [10]. Since these specifications (quantity and type of oil, quantity of lard, quantity and type of meat (light/dark), quantity of mechanically deboned meat, meat with/without skin) are not referred to on the label of products, it is very difficult to correlate the differences in fatty acid com-position with the differences in formulations.Considering the three groups of fatty acids (Tab. IV), almost all samples presented MUFA as the major group, followed by SFA and PUFA. Nevertheless, 3
samples of poultry Frankfurters presented a different profile, namely sample F9 (with PUFA>MUFA>SFA) and samples F10 and F13 (with MUFA>PUFA>SFA). This is probably associated with the addition of veg-etable oil that is declared on the label of the referred three samples. The same samples were also those with the highest linoleic acid content and the lowest levels of miristic, palmitic and steric acids. Samples F10 and F13 also presented the highest α-linolenic acid content, while sample F9 presented the highest content of oleic acid. As referred to, this can be prob-ably explained due to the addition of different veg-etable oils. It can be hypothesised that in the case of sample F9, a vegetable oil rich in oleic acid, such as olive oil was probably used, while samples F10 and F13 probably included soybean oil, which present high levels of linoleic acid in its composition.To check for significant differences concerning the fatty acid composition among the three groups con-sidered (pork, poultry and meat mixture based Frank-furter sausages) multivariate statistical analysis was carried out. A forward stepwise DA was applied to the data from the three groups of samples in order to select the fatty acids with relevant information for the evaluation of significant differences among the groups. A CVA was then performed based on the se-
Pork Mixture Poultry-6 -4 -2 0 2 4 6 8
Canonical Variate 1 (98.9%)
-3
-2
-1
0
1
2
3
Can
onic
al V
aria
te (1
.1%
)
C18:3n3C18:2n6
C18:0C20:3n3C18:1n7
C14:0
C18:3n3C18:2n6
Figure 2 - Biplot of canonical variates 1 versus 2 obtained by a CVA applied to fatty acid composition data with the type of Frankfurter as the grouping factor (parameters labelling canonical axes are important for their interpretation).
La rivista itaLiana deLLe sostanze grasse - voL. XCi - ottoBre/diCeMBre 2014
270
lected fatty acids, displaying the differences among the groups in a canonical variate plot (Fig. 2). As it can be observed, almost all the information in the data is represented in the first dimension of the plot, separating the poultry Frankfurters from the other samples and reflecting their higher contents in linoleic (C18:2n6) and α-linolenic (C18:3n3) acids and lower contents in stearic (C18:0), vaccenic (C18:1n7) and cis-11,14,17-eicosatrienoic (C20:3n3) acids. The plot also evidences the similarities between the fatty acid composition of the pork Frankfurters and the meat mixture Frankfurters. Although the pork sausages presented slightly higher contents of stearic, vaccenic and cis-11,14,17-eicosatrienoic acids, both groups are very close to each other. These results suggest that larger quantities of pork rather than poultry meat are used in the production of meat mixture based Frankfurters. Nevertheless, it should be noted that two samples of this type of Frankfurter (F15 and F17) declared the presence of lard/pig fat on their labels. The plot also evidences a larger variation of fatty acid composition within the poultry group of samples. As referred to, this group is characterised by lower levels of SFA and higher levels of PUFA, which can point to a healthier profile of this type of sausage compared to the other two groups. In particular, samples F9 and F13 showed a much lower level of SFA, with spe-cial emphasis for miristic and palmitic acids, which are considered as having more atherogenic potential than stearic acid. Samples F9 and F13 also showed a much higher level of the omega-3 α-linolenic acid, which has been associated to the prevention of CHD due to antiarrythmic, hypolipipdemic, antithrombotic and anti-inflammatory properties [23]. Sample F13 also followed the recommendation respecting the bal-ance between ω-6/ω-3 PUFA, which is considered a risk factor for CHD and should be approximately 4. The values presented on Table IV shows that, with the exception of two poultry Frankfurters having a ratio ω-6/ω-3 of 25 and 17 (samples F10 and F11, respectively), all other samples showed similar val-ues ranging from 9 to 13. Regarding the presence of harmful trans fatty acids, all samples showed very low contents (< 0.5%), thus having a negligible impact on the nutritional value of the Frankfurters.
3.3 CHOLESTEROL CONTENTThe external standard method was used for choles-terol quantification purposes. Linearity was tested using five concentration levels ranging from 140 to 700 µg/mL, each subjected to the entire extraction protocol. A linear relationship between the choles-terol concentration and the detector response was obtained under the assayed conditions. A calibration curve was obtained by plotting the peak-area versus standard concentration, achieving a correlation co-efficient of 0.9935. To assess the method precision, reproducibility was evaluated by preparing four repli-cates of the same Frankfurter sample, each analysed
twice. A variation coefficient of 6.02% was obtained showing the reproducibility of the used method. The results obtained for cholesterol content of the analysed samples are presented in Table V. Mean values of 62.7 mg/100 g, 80.5 mg/100 g and 63.4 mg/100 g were obtained for pork, poultry and meat mixture Frankfurters, respectively. These values are in good agreement with the ones reported in the USDA database for pork (66 mg/100 g), turkey (77 mg/100 g) and chicken (96 mg/100 g) Frankfurters. The low-est cholesterol found in some pork sausages can be possibly explained by the fact that pork fat is mostly accumulated in a subcutaneous layer, being easily re-moved, thus allowing the control of the quantity of fat incorporated in the sausages in the form of pork backfat. Additionally, the cholesterol content in pork backfat (57 mg/100 g) is reported to be generally low-er when compared to different types (dark and light, with and without skin) of chicken (ranging from 58 to 83 mg/100 g) and turkey meat (ranging from 65 to 74 mg/100 g). Bragagnolo and Rodriguez-Amaya [24] reported a mean of 33 mg of cholesterol per 100 g of adult pig backfat, which was significantly lower than the values obtained by the same authors in previous studies (54 mg/100 g). The reported differences were attributed to the animal breed analysed in the sec-
Table V - Cholesterol content of commercial Frankfurters(mg/100 g of sample, mean ± standard deviation)
Sample Cholesterol* Pork meat based
F1 60.26 ± 3.63b F2 76.77 ± 0.28f F3 64.96 ± 1.78c F4 72.88 ± 2.46e,f F5 48.25 ± 0.83a F6 58.13 ± 0.83b F7 57.26 ± 0.99b
mean 62.65 range 48.3 – 76.8
Poultry meat based F8 95.89 ± 1.26h F9 81.56 ± 0.40g
F10 60.04 ± 0.23b F11 70.40 ± 3.63d,e F12 68.30 ± 0.24c,d F13 121.91 ± 4.33i F14 65.17 ± 0.14c
mean 80.47 range 60.0 – 121.9
Pork and Poultry mixtures F15 60.08 ± 1.08b F16 47.43 ± 0.19a
F17 73.95 ± 0.62e,f F18 72.21 ± 0.58e
mean 63.42 range 47.4 – 72.2
* values with different letters indicate significant differences (p <0.05)
La rivista itaLiana deLLe sostanze grasse - voL. XCi - ottoBre/diCeMBre 2014
271
ond study, which was being introduced as a low-fat and low-cholesterol pork. These findings are also in agreement with the results reported by Baggio and Bragagnolo [18], who found lower cholesterol lev-els in Brazilian commercial sausages produced only with pork, when compared to Frankfurters with other meats in their formulation. These authors reported a mean cholesterol value of 33.4 mg/100g in processed pork sausages (ranging from 27.4 to 36.7 mg/100g in 5 brands) and of 51.8 mg/100 g in meat mixture Frankfurters (ranging from 44.3 to 71.1 mg/100 g in 5 brands of Frankfurters containing pork, beef and mechanically deboned poultry meat). Identically to what was observed for fatty acid com-position, Table V also allows verifying a larger variation in the cholesterol contents within the group of poul-try Frankfurters. As mentioned above, several fac-tors such as breed, age, diet and part of the animal might affect the final content of meat cholesterol and, consequently in the final processed product. One way-ANOVA analysis applied to the three consid-ered groups evidenced the significantly higher cho-lesterol content of the poultry Frankfurters group (p <0.05) compared to the other analysed samples, and showed that the pork and meat mixture Frankfurters presented similar cholesterol contents (p >0.05). According to the World Health Organization and the American Heart Association, the daily cholesterol in-take should be below 300 mg/day. Hence, consider-ing the mean values obtained for the three considered groups, the consumption of 100 g of Frankfurters would provide around 20 to 27% of cholesterol total intake.
4. CONCLUSIONS
In this work, several brands of commercial Frank-furters were evaluated for nutritional composition (including moisture, protein, fat, carbohydrates and ash contents), fatty acid composition and cholesterol content. The obtained results showed that, in gen-eral, commercial pork Frankfurters presented a higher fat content than the other samples with poultry meat in their composition. Regarding the fatty acid profile, the results suggest that it is strongly influenced by the type of meats, as well as other ingredients such as vegetable oil and lard, used in the formulation of Frankfurters. In general, the group of poultry Frank-furters was characterised by lower levels of SFA and higher levels of PUFA, which can point to a healthier profile of this type of sausages compared to the other two groups. Nevertheless, it should be noticed that some samples of this group presented higher levels of cholesterol compared to the pork and meat mix-ture Frankfurters. In fact, the group of pork Frankfurt-ers was the one with the lowest mean cholesterol content, which somehow contradicts the consumers’ idea that pork meat products should be avoided due to its high cholesterol levels.
Acknowledgements
The authors acknowledge the grant no. PEst-C/EQB/LA0006/2011 to FCT - Fundação para a Ciência e a Tecnologia. Sónia Soares is grateful to FCT PhD grant (SFRH/BD/75091/2010).
Conflict of interest statement
The Authors declare that there is no conflict of inter-est.
BIBLIOGRAPHY
[1] J. Giese, Developing low-fat meat products. Food Technology 46, 100-108 (1992).
[2] E.D. Paneras, J.G. Bloukas, S.N. Papadima, Ef-fect of meat source and fat level on processing and quality characteristics of Frankfurters. Le-bensmittel-Wissenschaft und-Technologie 29, 507-514 (1996).
[3] Instituto Português da Qualidade. Salsicha tipo Frankfurt, Definição e características. Norma Portuguesa NP 724, (2006).
[4] M.M.C. Ferreira, M.A. Morgano, S.C.N. Queiroz, D.M.B. Mantovani, Relationships of the mine-rals and fatty acid contents in processed turkey meat products. Food Chemistry 69, 259-265, (2000)
[5] E.B. Ozvural, H. Vural, Utilization of interesteri-fied oil blends in the production of frankfurters. Meat Science 78, 211-216, (2008).
[6] F. Jimenez-Colmenero, J.S. Carballo, Cofra-des, Healthier meat and meat products: Their role as functional foods. Meat Science 59, 5-13, (2001).
[7] J. Ayo, J. Carballo, J. Serrano, B. Olmedilla-Alonso, C. Ruiz-Capillas, F. Jiménez-Colmenero, Effect of total replacement of pork backfat with walnut on the nutritional profile of frankfurters. Meat Science 77, 173-181, (2007).
[8] P.A. Riley, M. Enser, G.R. Nute, J.D. Wood, Ef-fects of dietary linseed on nutritional value and other quality aspects of pig muscle and adipose tissue. Animal Science 71, 483-500, (2000).
[9] S.R. Baggio, A.M.R. Miguel, N. Bragagnolo, Si-multaneous determination of cholesterol oxides, cholesterol and fatty acids in processed turkey meat products. Food Chemistry 89, 475-484, (2005).
[10] A.H. Cantor, E.A. Decker, V.P. Collins, Fatty acids in poultry and egg products. In: Chow CK (ed.) Fatty acids in foods and their health im-plications. 3rd edition. Boca Raton: CRC Press, Taylor, Francis Group, 127-154, (2008).
[11] J.D. Wood, M. Enser, A.V. Fisher, G.R. Nute, P.R. Sheard, R.I. Richardson. Fat deposition, fatty acid composition and meat quality: A re-view. Meat Science 78, 343-358, (2008).

La rivista itaLiana deLLe sostanze grasse - voL. XCi - ottoBre/diCeMBre 2014
272
[12] J.D. Wood, M. Enser, R.I. Richardson, F.M. Whittington, Fatty acids in meat and meat pro-ducts. In: Chow, C. K. (Ed.) Fatty acids in foods and their health implications. 3rd edition. Boca Raton: CRC Press, Taylor & Francis Group, 87-107, (2008).
[13] L.M. Valsta, H. Tapanainen, S. Mannisto, Meat fats in nutrition. Meat Science 70, 525-530, (2005).
[14] W. Horwitz, Official Methods of Analysis of AOAC International. 17th edition. Arlington, VA: AOAC, Vol II, (2000).
[15] H.M.M. Ramalho, S. Casal, M.B.PP Oliveira, Total Cholesterol and Desmosterol contents in raw, UHT, infant formula powder and human milks determined by a new fast micro-HPLC method. Food Analytical Methods 4, 424-430, (2010).
[16] M.A. González-Viñas, A.B. Caballero, I. Gallego, A. García-Ruiz, Evaluation of the physico-che-mical, rheological and sensory characteristics of commercially available Frankfurters in Spain and consumer preferences. Meat Science 67, 633-641, (2004).
[17] S.R. Baggio, N. Bragagnolo, The effect of heat treatment on the cholesterol oxides, cholesterol, total lipid and fatty acid contents of processed meat products. Food Chemistry 95, 611-619, (2006).
[18] S.R. Baggio, N. Bragagnolo, Lipid fraction qua-lity evaluation of Brazilian meat-based products.
Journal of the Brazilian Chemical Society 19, 463-470, (2008).
[19] USDA, National Nutrient Database for Standard Reference.
http://www.nal.usda.gov/fnic/foodcomp/search (accessed on January 2013).
[20] H. Iso, S. Sato, U. Umemura, M. Kudo, K. Koi-ke, A. Kitamura, Linoleic acid, other fatty acids, and the risk of stroke. Stroke 33, 2086-2093, (2002).
[21] M. Estévez, D. Morcuende, R. Cava, Extensive-ly reared Iberian pigs versus intensively reared white pigs for the manufacture of frankfurters. Meat Science 72, 352-364, (2006).
[22] M. Serdaroglu, G.Y. Turp, Effects of deboning methods on chemical composition and some properties of beef and turkey meat. Turkish Journal of Veterinary Animal Science 29, 797-802, (2005).
[23] C.R. Harper, T.A. Jacobson, The fats of life: the role of Omega-3 fatty acids in the prevention of coronary heart disease. Archives of Internal Me-dicine 161, 2185-2192, (2001).
[24] N. Bragagnolo, D.B. Rodríguez-Amaya, Simul-taneous determination of total lipid, cholesterol and fatty acids in meat and backfat of suckling and adult pigs. Food Chemistry 79, 255-260 (2002).
Received, March 6, 2013Accepted, June 6, 2013
La rivista itaLiana deLLe sostanze grasse - voL. XCi - ottoBre/diCeMBre 2014
273
• • • • • • • • • • • • iN BiBliOTeCaaTTiViTÀ ediTOriale della diViSiONe SSOG
aNNO 2013
Oli di semi di spremitura: un nuovo prodotto nel panorama olearioP. BondioliLa Chimica e l’Industria, Settembre 13, 87-91 (2013)The possibility of processing and sell seed oils pre-pared by simple pressing represents one of the pos-sible innovation for the oil international system.In this paper reasons, available technologies and bar-riers existing for this new class of oil products are dis-cussed. There are several reasons to promote these products, that are different from the refined oils ac-tually available on the market. The main differences are based on flavor, color and nutritional reasons. The possibility to fill the existing gap on ω3 polyunsatu-rated fatty acids, by means of the consumption of flax, hemp, rapeseed, walnut. In every case the consumption of these oils has a number of health benefits but it cannot substitute the supply of long chain polyunsaturated fatty acids of the ω3 series coming from fish and algae oils.È possibile richiedere copia del presente articolo a: [email protected]
Study of biodiesel solid contaminants by means of scan electron mycro-scopy (SEM)P. Bondioli, S. Faragò, A. Boschi, S. Beretta, L. Della Bella, G. RivoltaComunicazione presentata al 11° EUROFEDLIPID Congress, 27-30 Ottobre 2013 Antalya, TurchiaThe presence of solid particles in biodiesel renewable fuel represents one of the main problem for the in field use either as a neat product or in blends with mineral diesel fuel. The presence of solid particles is regulated in EN 14214 specification as “Total Contamination” parameter set at the value of 24 mg/kg max, as de-termined according to the prEN 12662:2012 Stan-dard.. Several studies are available about the possi-ble correlation between total contamination and filter plugging behavior in terms of FBT (filter blocking test) or CSFBT (cold soak filter blocking test) also in view of the presence of the typical organic contaminants such as Steryl Glucosides and Saturated Monoglyc-erides. With this presentation we need to show and discuss the results obtained by evaluating by means of SEM instrument the solid material retained on the prEN 12662:2012 glass fiber filter. The solid particles on the filter were evaluated in terms on morphology, particle size and possible chemical identification, by coupling the SEM results with other diagnostic tech-niques such as FT-IR, X Rays for inorganic constitu-ents and GC-FID.
Some SEM pictures of different contamination situa-tion will be shown and discussed also in comparison with the classical physic-chemical characterization data of the same biodiesel samples.È possibile richiedere copia della presentazione a: [email protected]
Easy synthesis of polyolesters with solid acid catalystsM. Mariani, P. Bondioli, S. Brini, R. Psaro, N. Ravasio, F. ZaccheriaComunicazione presentata a 11° EUROFEDLIPID Congress, 27-30 Ottobre 2013 Antalya, TurchiaWorld lubricants consumption is estimated to be around 40 million metric tonnes per year. Automotive and hydraulics are the largest group of sold and used lubricant in the world. About 50% of all sold lubricants are lost in environment, resulting in severe contamina-tion of soil, groundwater and air. As a result, there is an increasing demand for biolubricants derived from vegetable oils. This class of materials is renewable, biodegradable and can be used as an energy source at the end of lifeclycle, to limit the environmental im-pact. Synthesis of biolubricants is based on the esterifi-cation reaction between fatty acids, derived from vegetable oils and polyols, like pentaerythrol (PE) or trimethylolpropane (TMP). The reaction is usually car-ried out with an homogeneous acidic catalyst (e.g., p-toluenesulfonic acid, mineral acids). In order to make the reaction more enviromentally friendly we here suggest the use of heterogeneous catalysis. The heterogeneous catalysts would provide simpler and cheaper separation processes, reduce or eliminate wastes production and in principle could be re-used until deactivation.Some experiences in solid acid catalysts, using dif-ferent modified silicas in order to catalyze the esteri-fication reaction are here presented and discussed. Conversion yields up to 99% in only 6 hours reaction, with selectivity up to 95% in triesters using a SiO2-ZrO2 were obtained. The catalyst can be recycled 6 times at least.È possibile richiedere copia della presentazione a: [email protected]
Stabilisation of camelina oil methyl esters through selective hydrogenation.P. Pecchia, I. Galasso, S. Mapelli, P. Bondioli, F. Zac-cheria, N. RavasioIndustrial Crops and Products 51, 306-309 (2013)Camelina sativa (L.) Crantz in the last few years is garnering a lot of attention as a biofuel and as raw material for the chemical industry due to its high oil productivity. However the high percentage of polyun-saturated fatty acids of camelina oil (over 50%), which is rich in linolenic acid (37-40%) limits its commer-cial value and large-scale production. To improve the oil quality and its oxidative stability the methyl esters
Notiziario
La rivista itaLiana deLLe sostanze grasse - voL. XCi - ottoBre/diCeMBre 2014
274
Notiz
iario have been selectively hydrogenated using a non-toxic
and non-pyrophoric heterogeneous copper catalyst (Cu/SiO2 or Cu/Al2O3). Our results showed that both catalysts are able to reduce the linolenic acid content below 1% while selectively increasing the monoun-saturated one.È possibile richiedere copia del presente articolo a: [email protected]
Methods for triacylglycerols analysis in veg-etable oilsE. Moret, L. Pizzale, S. Moret, C. Mariani, L. ConteComunicazione presentata a 11° EUROFEDLIPID Congress, 27-30 Ottobre 2013 Antalya, TurchiaTriacylglycerols analysis is a powerful tool to assess purity of vegetable oils, mainly applied to olive oils. Of-ficial methods by UE and IOC standardized RP-HPLC analysis of triacylglycerols to evaluate the amount of ECN42 terms, even if, in many cases, the obtained separation was not satisfactory, the method was ad-opted to check for extraneous oils with high amounts of oleic acid. An improvement of the method, suitable to check for admixtures with several oils had been proposed by substituting acetonitrile/acetone as elut-ing solvents with propionitrile. Ratios between se-lected TAGs were then calculated. The ECN42 values obtained by using the two different eluting solvents were compared and some discrepancies were high-lighted. Some peculiar mixtures of seed oils and olive oil, however, cannot be detected even by these ap-proaches, while gas chromatography can be a suit-able approach. Capillary GC on short columns coat-ed with non polar stationary phase was applied and results suggested that some limits can be proposed for C48 and C60.Care must be applied to the injection method, as thermal degradation can easily take place.
A critical evaluation of some methods used to assess purity of olive oilsL. Conte, C. MarianiComunicazione presentata al EC Workshop on “Olive oil authentication”, 10-11 June 2013, Madrid, SpainPer approfondimenti: http://ec.europa.eu/agriculture/events/olive-oil-wor-kshop-2013_en.htm
Chlorophyllian pigments in extra virgin olive oilsP. Rovellini, S. Venturini, P. FusariPoster presentato al 7th International Congress on Pigments in Food 18-21 June 2013, Novara, ItalyThe chemical composition of the olive oils pigments (Olea europaea L.) varies on the base of parameters such as variety, degree of ripeness, environmental conditions, growing region, processing and storage. The pigments, in particular the chlorophylls and pheophytins affects considerably the preservation of this important diet mediterranean product as pro-oxi-
dants in synergy with metals trace eventually present enhancing the autooxidation process. In virgin olive oils the principal compounds present in decreasing content order are pheophytins A and A’ followed from pheophytins B and B’, pyropheophytin A and at last chlorophyll A. This type of analysis is conducted as quality param-eter to point out high oxidized lipidic status or detect eventually deodorization process or thermal treat-ment. The official method to quantify these compounds is ISO 29841:2009 method, but on the base of our big experience on a lot of samples of this lipidic matrix we have evidenced that applying the over method the % content of pyropheophytin A respect to pheophyt-ins A+A+pyropheophytin A is increased until to 40%, respect to the data obtained after direct injection of a sample solution in acetone in a HPLC-UV system: the passage through the silica column cause a partial modification of pigments profile, in particular chloro-phyll A, pheophytins B+B’, pheophytins A+A’ are par-tially detained on column in particular these last. Per informazioni, rivolgersi a:[email protected]
Short note. Insect oils: the composition of oil extracted from Mosca carnaria (Sar-cophaga carnaria L.) larvaP. Bondioli, G. RivoltaRiv. Ital. Sostanze Grasse 90 (1), 5-8 (2013)This short paper reports about the quantity and the composition of the liquid oil that can be obtained from Sarcophaga carnaria L. larvae by means of hexane extraction. The obtained oil contains palmitic, palmi-toleic, oleic and linoleic as the main fatty acids. In par-ticular 2 different positional isomers of palmitoleic, for a total content of approx. 18% were detected. Data are reported about the sterol composition of oil. The residual meal is constituted of 70% of protein and could be of potential interest as a feed. The amino acid composition of the protein fraction is reported.È possibile richiedere copia del presente articolo a: [email protected]
Olio e farina da Cannabis sativa L. analisi multiscreening di micotossine, ftalati, idro-carburi policiclici aromatici, metalli e fito-farmaciP. Fusari, P. Rovellini, L. Folegatti, D. Baglio, A. Cava-lieriRiv. Ital. Sostanze Grasse 90 (1), 9-19 (2013)Il presente lavoro descrive l’applicazione di metodi finalizzati alla determinazione di micotossine, ftalati, idrocarburi policiclici aromatici, metalli e residui di fi-tofarmaci nell’olio e nella farina ottenuti da Cannabis sativa L. Questa pianta è coltivata per la produzio-ne di fibre tessili e per l’estrazione dell’olio dai semi

La rivista itaLiana deLLe sostanze grasse - voL. XCi - ottoBre/diCeMBre 2014
275
Notiziarioed è utilizzata come alimento e nelle preparazioni di medicina tradizionale per i suoi effetti benefici, quali l’abbassamento del colesterolo e della pressione del sangue. Inoltre visto l’elevato grado di insaturazione presente nell’olio, quest’ultimo trova impiego nella produzione di inchiostro da stampa, di conservanti del legno e in detergenti e saponi. Le analisi multi-screening riguardanti le micotossine (aflatossina B1, B2, G1, G2, deossinivalenolo, ocratossina A, zeara-lenone) e gli idrocarburi policiclici aromatici condotte sull’olio e sulla farina di canapa sono risultate negati-ve per tutte le sue componenti. L’analisi dei principali ftalati, impiegati nella produzione di materie plastiche, ha evidenziato un contenuto abbastanza elevato di dietilesilftalato nell’olio di canapa, probabilmente dovuto al tipo di packaging in cui il campione era conservato. La ricerca dei metalli pesanti (piombo, cadmio, nichel, arsenico e cromo) e di alcuni metalli derivanti da processi industriali (ferro, rame e fosforo) nell’olio di canapa non ha riscontrato alcuna presenza per i primi e una minima quantità per i secondi. La farina di canapa è invece risultata essere una fonte potenziale di micronutrienti, quali ferro, manganese e zinco, utili nell’alimentazione umana e animale, oltre a possedere un’elevata quantità di fosforo altamente assimilabile, mentre le concentrazioni dei composti metallici tossici sono risultate essere inferiori ai limiti di rilevabilità dei metodi analitici. L’esecuzione dell’analisi multiscreening mirata alla determinazione dei fitofarmaci è risultata positiva per alcuni residui sull’olio, sulla farina e sull’olio estratto dalla farina, anche se presenti in basse concentra-zioni.È possibile richiedere copia del presente articolo a: [email protected]
Application note. Assessment of the clean-ing performances of hand dishwashing de-tergents. Bowl wash procedureD. Mariani, G. Pallotti, E. TrimignoRiv. Ital. Sostanze Grasse 90 (2), 67-70 (2013)A testing procedure for the assessment of the perfor-mances of hand dishwashing products is described in this application note. Basing on the experiences already present into the scientific international land-scape a simple but really reliable procedure was de-veloped, also for making comparisons among differ-ent products or formulas.È possibile richiedere copia del presente articolo a: [email protected]
Nota tecnica. Lubrificanti. Corrispondenza tra metodi analitici (gennaio – dicembre 2012)M. Sala, F. Taormina, P. Fornasari, P. RuggeriRiv. Ital. Sostanze Grasse 90 (2), 115-122 (2013)Da diversi anni viene pubblicata una guida, a dispo-
sizione di chi lavora nel settore dei lubrificanti, in cui sono riportati i controlli maggiormente utilizzati per la caratterizzazione dei prodotti petroliferi e lubrificanti e i relativi metodi di analisi pubblicati da Enti Nazionali ed Internazionali (UNI, CEI, ASTM, IP, ISO, IEC, EN).Quest’anno è stata fatta la revisione della tabella con un aggiornamento di tutti i metodi pubblicati da gen-naio a dicembre 2012. I riferimenti normativi sono sempre divisi in quattro classi: EN - ISO - IEC; Metodi Italiani (UNI - UNI EN - UNI EN ISO - CEI – NOM); IP; ASTM.La nuova versione dei metodi ASTM è stata confron-tata con l’edizione precedente e nel foglio “Commen-to alle nuove revisioni” si riportano i risultati di tale confronto. Per i metodi IP si rimanda al sito http://ein.powerweb.co.uk/cssiptmqbe.htm dove è disponibile l’elenco ag-giornato dei metodi e un loro confronto con i metodi ASTM e ISO.Preso atto della velocità di cambiamento dei metodi in ambito normativo, soprattutto dei metodi ASTM, si ricorda che la presente guida, non potendo essere aggiornata in tempo reale, ma facendo riferimento ad una valutazione temporale pari a un anno solare, ha delle lacune, insite proprio nella modalità in cui è stato concepito il lavoro di revisione.Per informazioni, rivolgersi a:[email protected]
Caratterizzazione chimica dell’olio ottenuto dalla spremitura a freddo dei semi di Can-nabis sativa L.P. Rovellini, L. Folegatti, D. Baglio, S. De Cesarei, P. Fusari, S. Venturini, A. CavalieriRiv. Ital. Sostanze Grasse 90 (3), 139-152 (2013)Il presente lavoro ha focalizzato l’attenzione sulla ca-ratterizzazione chimica dell’olio ottenuto dalla spremi-tura a freddo dei semi decorticati di Cannabis Sativa L. La Cannabis sativa è una pianta della famiglia del-le Cannabinacee, annuale, erbacea, molto rustica, poco esigente, adattabile a tutti i tipi di terreno e fa parte delle piante più antiche conosciute nella medi-cina tradizionale e di quelle più studiate dal punto di vista fitochimico.I semi di canapa e i prodotti da essi derivati, in aggiun-ta al loro valore nutrizionale, hanno dimostrato effetti benefici riguardanti l’abbassamento del colesterolo ematico, dei trigliceridi, della pressione sanguigna, nella cura delle dermatiti, delle malattie degenerative del sistema immunitario, dell’apparato respiratorio e hanno trovato impieghi in campo alimentare sia come integratori che nelle preparazioni della medicina tra-dizionale.La caratterizzazione chimica ha riguardato i principali parametri di qualità, il contenuto e la composizione di acidi grassi, di steroli e trigliceridi, di acidi grassi ossidati, di tocoferoli ossidati e di composti carbonilici

La rivista itaLiana deLLe sostanze grasse - voL. XCi - ottoBre/diCeMBre 2014
276
Notiz
iario volatili. Inoltre sono stati determinati i contenuti delle
principali vitamine, dei pigmenti (clorofille e carotenoi-di) ed è stata effettuata la caratterizzazione di alcuni composti fenolici.I valori di alcuni parametri rientrano nei limiti proposti dalla normativa Codex per un olio vergine ottenuto da semi per pressione, quali umidità (0.08%), impurità (0.01%) e acidità (0.49% in acido oleico); mentre si è evidenziato un certo stato di ossidazione in base ai valori del numero di perossidi (28.2 meq O2/kg), del K232 (5.13), del contenuto in acidi grassi ossi-dati (13.92 mg/100 mg) e del contenuto in composti carbonilici volatili (465 mg/kg). E’ stata riscontrata la presenza di luteina (5 mg/kg) e non di beta-carotene e di un buon contenuto in pigmenti clorofilliani (51.8 mg/kg). Per quanto concerne la composizione in aci-di grassi, l’alto tenore in PUFA (79.25%) e il rapporto ω6/ω3 pari a 3.20 confermano l’ottimale apporto nutri-zionale dell’olio di canapa.La composizione sterolica ha messo in risalto il beta-sitosterolo quale componente principale e un buon livello di steroli totali (4393 mg/kg). Dall’analisi del profilo trigliceridico il picco della LLL (16.78%) è risultato essere quello prevalente in un range di classi ECN da 30 a 52.Il contenuto in tocoferoli totali è risultato essere pari a 928 mg/kg con un rapporto tra i vari isomeri simile a quello di un olio di soia. Dal punto di vista dei com-posti fenolici è stata messa in evidenza la presenza di acido cinnamico.Infine dall’analisi multi-screening delle vitamine si è evidenziata la presenza di vitamina A, D2, K1, B3 (PP) coenzima Q10 e Q9, Ubichinolo 9.È possibile richiedere copia del presente articolo a: [email protected]
Determinazione diretta di alcuni metalli negli oli extra vergini di oliva mediante as-sorbimento atomico con fornetto di grafite (GF-AAS)D. Baglio, L. FolegattiRiv. Ital. Sostanze Grasse 90 (3), 153-162 (2013)Il presente studio ha lo scopo di sviluppare e validare i metodi di analisi per la determinazione di 14 elementi metallici (Al, As, Cd, Co, Cr, Cu, Fe, Mn, Mo, Ni, Pb, Sn, Zn e V) negli oli extra vergini di oliva mediante diluizione del campione in un solvente organico (ci-cloesano) e introduzione diretta in uno spettrofotome-tro ad assorbimento atomico dotato di un fornetto di grafite.I diversi metodi di analisi sono stati ottimizzati per adattarli alla tipologia dei campioni in esame, selezio-nando il migliore modificante di matrice e le migliori condizioni strumentali di temperatura per il processo di pirolisi e di atomizzazione. Le metodologie sono state successivamente validate determinando la line-arità in un intervallo compreso tra 10 e 60 µg/kg di olio, la precisione in termini di ripetibilità, l’accuratez-za e la sensibilità in termini di limite di rilevabilità e di
quantificazione. I risultati ottenuti sono stati confron-tati con i metodi di riferimento ISO, ove disponibili, con ottima corrispondenza tra loro.I contenuti dei singoli metalli nei campioni sono poi stati utilizzati per classificare i diversi oli extra vergini di oliva sulla base delle origini geografiche impiegan-do tecniche chemio metriche ed in particolare l’analisi delle componenti principali e l’analisi discriminante lineare.È possibile richiedere copia del presente articolo a: [email protected]
Sul possibile aumento degli alchilesteri negli oli extra vergini di oliva. Nota 2 C. Mariani, G. BellanRiv. Ital. Sostanze Grasse 90 (4), 211-217 (2013)Il Reg. CE 61/2011 ha introdotto un nuovo parametro di qualità per gli oli extra vergini di oliva, gli alchilesteri. Da più parti si sostiene che gli alchilesteri possono aumentare nel tempo in seguito alla reazione tra gli acidi grassi liberi e gli alcoli metilico ed etilico natural-mente presenti nell’olio.Nell’esperienza qui riportata abbiamo verificato l’au-mento in alchilesteri che si riscontra in alcuni oli con-fezionati del commercio, sia di provenienza Italiana che comunitaria. Abbiamo altresì verificato il conte-nuto in alcoli metilico ed etilico, nonché la variazione del contenuto in cere, che, come noto, aumentano durante la conservazione.È possibile richiedere copia del presente articolo a: [email protected]
• • • • • • • • • NOTiZie iN BreVeConvegno “FOOD PACK TODAY 2ed”Milano, 27 febbraio 2014Il giorno 27 febbraio si è svolto a Milano c/o il NOVO-TEL di Via Mecenate la seconda edizione del Con-vegno organizzato da AITA (Associazione Italiana dei Tecnologi Alimentari) riguardante i problemi del packaging nell’ Industria Alimentare. Il Convegno ha rappresentato un contesto importante dal punto di vista dell’aggiornamento legislativo e metodologico riguardante i materiali a contatto con gli alimenti. Al-cune relazioni hanno inoltre riguardato la produzione di nuovi packaging innovativi e illustrato le direzioni commerciali verso cui si muovono i fabbricanti. Par-ticolare attenzione è stata data alla recente introdu-zione di nuovi materiali costituiti da bioplastica (bioPE e bioPET) prodotti a partire da BIOMASSE di scar-to industriale quale la lignina e il possibile recupero durante la lavorazione di sostanze chimiche ad alto valore quali i fenoli. Sono stati intrapresi contatti con l’ Università degli Studi di Parma in particolare con

La rivista itaLiana deLLe sostanze grasse - voL. XCi - ottoBre/diCeMBre 2014
277
Notiziarioil centro CIPACK coordinato dal prof. Montenero e con l’ azienda Beta Renewables di Tortona (AL) per la possibilità di future collaborazioni a progetti di ri-cerca.Referente: Pierangela Rovellini – Divisione SSOG di INNOVHUB-SSI Azienda Speciale della Camera di Commercio di Milano [email protected]
Riunione CODEX ALIMENTARIUSComitato contaminanti negli alimentiRoma, 25 Marzo 2014Il 25 marzo si è svolto a Roma c/o il Ministero delle Politiche Agricole Alimentari e Forestali un incontro riservato agli esperti del settore relativo ai temi da discutere all’ 8° sessione del Comitato Codex (The Hague Paesi Bassi, 31 marzo - 4 aprile). La discussione ha riguardato la revisione dei limiti relativi al contenuto di Pb nei formulati dell’ infanzia, all’As inorganico nel riso, al Hg e al metil-Hg nei pesci, al Deossinivalenolo e delle sue forme acetilate nei ce-reali e negli alimenti a base di cereali, alle Fumonisine nel mais e alle Aflatossine totali e ai Solventi alogenati nell’ olio di oliva. All’ incontro hanno partecipato i rap-presentanti delle più importanti istituzioni. L’armonizzazione dei limiti europei e di quelli Codex è stato il punto centrale della giornata.Referente: Pierangela Rovellini – Divisione SSOG di INNOVHUB-SSI Azienda Speciale della Camera di Commercio di [email protected]
Accademia dei GeorgofiliInaugurazione 261° Anno AccademicoFirenze, 25 Marzo 2014 In occasione dell’inaugurazione dell’Anno Accade-mico, nella importante sede della Loggia degli Uffizi Vecchi, il dr. Paolo Bondioli della Divisione SSOG di INNOVHUB-SSI Azienda Speciale della Camera di Commercio di Milano, ha ricevuto il diploma di Acca-demico Aggregato, che lo inserisce a pieno titolo tra i circa 800 Accademici Italiani e Stranieri. L’Accademia dei Georgofili, con sede a Firenze e fondata nel 1753 si propone di contribuire al progresso delle scienze e delle loro applicazioni all’agricoltura in senso lato, alla tutela dell’ambiente, del territorio agricolo e allo sviluppo del mondo rurale.L’importante riconoscimento è stato attribuito in con-siderazione dell’attività scientifica e tecnica realizzata dal nuovo Accademico nel corso della sua carriera più che trentennale. La manifestazione è quindi prosegui-ta nel Salone dei Cinquecento di Palazzo Vecchio con le relazione di apertura del Presidente dell’Accade-mia Franco Scaramuzzi ed una relazione sul Credito Agrario tenuta da Antonio Patuelli. La manifestazione si è conclusa con la consegna dei diplomi ai nuovi Ac-cademici Ordinari e Emeriti e di alcuni premi a lavori
scientifici e tesi di laurea.Referente: Paolo Bondioli - Divisione SSOG di INNO-VHUB-SSI Azienda Speciale della Camera di Com-mercio di [email protected]
Riunione CEN TC 19/JWG1 – Biodiesel ana-lytical methodsAmsterdam, 22 Settembre 2014 Il giorno 22 Settembre ha avuto luogo ad Amsterdam, presso la sede Shell, il 18° meeting del gruppo di la-voro che si occupa della messa a punto e della nor-mazione di metodi di prova sulla matrice biodiesel. Rappresentavano il nostro Paese Andrea Gallonzel-li (Divisione Combustibili) e Paolo Bondioli (Divisione SSOG). L’attività normativa su questa tematica prose-gue ormai da moltissimi anni e consente di mettere a disposizione del mercato dei biocombustibili tecniche di controllo adeguate ed in linea con i cambiamenti della tecnologia di produzione, delle materie prime e dell’utilizzo finale del biodiesel puro o in miscela con gasolio.Referente: Paolo Bondioli – Divisione SSOG di INNO-VHUB-SSI Azienda Speciale della Camera di Com-mercio di Milano [email protected]
67th plenary meeting of the Scientific Panel on Contaminants in the food chain (CON-TAM-EFSA)Parma, 30 settembre - 2 ottobre 2014La sessione era aperta a 10 osservatori internazionali, tra i quali Liliana Folegatti della Divisione SSOG.In agenda la presentazione e la discussione di diversi drafts su alcuni contaminanti presenti nei cibi e nei mangimi animali (perclorato, cloramfenicolo, meta-boliti e micotossine modificate, nickel), i commen-ti ricevuti dalla consultazione pubblica per il parere sull’acrilamide negli alimenti e l’adozione di un pro-tocollo sulla presenza di nitrati negli ortaggi a foglia. Una volta approvati, i drafts verranno pubblicati sul sito www.efsa.europa.eu. Molto interessante è stata la presentazione dei dati raccolti su microparticelle di plastica negli animali marini e nel cibo a seguito della richiesta di un parere scientifico.Referente: Liliana Folegatti – Divisione SSOG di INNOVHUB-SSI Azienda Speciale della Camera di Commercio di Milano [email protected]
Workshop on Biolubricants Marketing, Uses and ChemistryMilano, 9-10 Ottobre 2014 Nei giorni 9 e 10 Ottobre ha avuto luogo, presso la Sala Convegni dell’Area Ricerca Milano del CNR, il convegno in oggetto. Si è discusso di aspetti chimi-

La rivista itaLiana deLLe sostanze grasse - voL. XCi - ottoBre/diCeMBre 2014
278
Notiz
iario ci, normativi ed ambientali correlati con lo sviluppo e
l’utilizzazione di lubrificanti biodegradabili e prodotti da materie prime rinnovabili. All’evento hanno parte-cipato più di 70 esperti provenienti da Olanda, Fran-cia, Germania, Inghilterra, Belgio, Grecia, Svizzera, Iran e ovviamente Italia. Il programma di lavoro pre-vedeva la presentazione di 14 relazioni. Al termine di ogni relazione era previsto lo spazio per domande ed approfondimenti.Le presentazioni per le quali è stata acquisita l’auto-rizzazione alla divulgazione sono scaricabili dal sito:http://www.innovhub-ssi.it/web/stazione-sperimen-tale-per-gli-oli-e-i-grassi/workshop1Allo stesso indirizzo possono essere scaricate le presentazioni relative al Workshop 2012 on Glycerol Marketing, Uses and ChemistryReferente: Paolo Bondioli - Divisione SSOG di INNO-VHUB-SSI Azienda Speciale della Camera di Com-mercio di Milano [email protected]
Riunione degli esperti chimici - Consiglio Oleicolo internazionale COIMadrid, 2-3 ottobre 2014Nei giorni 2 e 3 ottobre a Madrid presso la sede del Consiglio Oleicolo Internazionale si è svolta unariunione degli esperti chimici internazionale per discu-tere in materia di nuovi metodi di analisi e dei rispettivi limiti di legge per la commercializzazione dell’olio di oliva. A tale incontro ha partecipato Pierangela Rovel-lini in qualità di esperto chimico nominata dal COI.Referente: Pierangela Rovellini – Divisione SSOG di INNOVHUB-SSI Azienda Speciale della Camera di Commercio di Milano [email protected]
IV Workshop – Laboratori Nazionali di Riferi-mento (LNR) per metalli pesanti negli ali-menti e mangimi e additivi nei mangimiTorino, 6-7 novembre 2014Si è svolto a Torino il 6-7 novembre il workshop an-nuale di aggiornamento sulle attività dei laboratori nazionali di riferimento (LNR) del sistema di control-lo per i metalli pesanti in alimenti e mangimi. Il wor-kshop è stato organizzato dall’Istituto Zooprofilattico Sperimentale del Piemonte, Liguria e Valle d’Aosta e dall’Istituto Superiore di Sanità. Il convegno è sta-to un momento di confronto fra le strutture coinvolte nei 10 controlli ufficiali al fine di condividere eventuali criticità e ottimizzare le attività. Sono stati presi con-tatti per possibili collaborazioni future e per parteci-pare ai prossimi Proficiency Test (PT) sui metalli pe-santi.Referente: Liliana Folegatti - Divisione SSOG di IN-NOVHUB-SSI Azienda Speciale della Camera di Commercio di Milano [email protected]
• • • • • • • • • • • • • • CONGreSSi
Vegetable Oil Frying: Live demonstrations, Oil Analyses and Product EvaluationPractical Short Course on Vegetable Oil Frying: Live demonstrations, Oil Analyses and Product EvaluationApril 12-14, 2015 - College Station, TexasOrganized by : The Food Protein Research & Development CenterFats and Oil ProgramTexas A&M Engineering Experiment StationThe Texas A&M University SystemCollege Station, Texas 77843-2476 U.S.A.Objectives of Short CourseOne of a kind practical Vegetable Oil Frying course to learn:
The art of Frying with various selected frying oils, •including palm oilWhat different oils offer and what to use for specific •applicationsHow to handle frying foods•Onsite frying of french fries and breaded chicken•Fried food safety•
and much more!For additional technical information, write, call, fax or e-mail to:Dr. M.S. AlamHead, Fats and Oils ProgramFood Protein R&D CenterTexas A&M University2476 TAMU, 373 Olsen Blvd., Cater-Mattil HallCollege Station, Texas 77843-2476 U.S.ATel: 979-845-2740, Fax: 979-845-2744E-mail: [email protected] registration inquiries contact:Short Course CoordinatorFood Protein R&D CenterPhone: 979-845-2741Fax: 979-845-2744E-mail: [email protected]
106th ACOS Annual Meeting & ExpoMay 3-6, 2015 - Orlando, Florida, USAVenue: Rosen Shingle CreekContact: ACOS Meetings Department, USATelephone: +1 217 6934821Website: http//annualmeeting.aocs.org Email: [email protected] the date
12th Yeast Lipid ConferenceMay 14-16, 2015 – Ghent, BelgiumOrganizer: Dr. Inge Van BogaertLaboratory of Industrial Microbiology and Biocatalysis
La rivista itaLiana deLLe sostanze grasse - voL. XCi - ottoBre/diCeMBre 2014
279
Notiziario- Department of Biochemical and Microbial Technolo-gyGhent University, BelgiumSave the datehttp://www.yeastlipidconference.tugraz.at/Future.htm
12th Asian Congress of Nutrition (12th ACN2015)“Nutrition and food for longevity: for the well-being of all”May 14-18, 2015 – Yokohama, JapanOrganized by: Japan Society of Nutrition and Food Science (JSNFS)Science Council of Japan (SCJ)Under the Auspice of: Federation of Asian Nutrition SocietiesFor information: http://www.acn2015.org/
XXXVI CIOSTA CIGR V Conference 2015May 26-28, 2015 – St. Petersburg, RussiaThe Conference provides a forum to present and ex-change ideas and to promote research development and application of efficient and safe technology and management in production processes of agriculture and forestry. CIOSTA emphasizes a holistic approach to design-ing and improving sustainable systems in agriculture and forestry and fosters cooperation among scien-tists, technicians, advisers and agricultural producers throughout the world.The scientific programme includes plenary sessions, oral presentations and poster sessions. Technical tours will also be organized.Topics
Labour, ergonomics, safety and health•IT-based farm and forestry management•Environmental impact of technologies, machines •and equipment for production and processing of farm crops and livestock productsEnergy-saving agricultural technologies with the •use of renewable energy-sourcesFarm waste management and recycling technolo-•giesInnovative technology for sustainable rural devel-•opmentOrganic farming•Organization of field experiments•Sustainable small-scale agricultural production•Forestry in XXI century•Agrarian education and retraining: new challenges•Open topics•
LanguageConference languages will be English and Russian, with the simultaneous translation being provided dur-ing the sessions.Contact address: [email protected] URL: http://ciosta2015.org/
XVI Convegno di Tribologia28 maggio 2015 - NapoliOrganizzato da: Associazione Meridionale di Mecca-nica (www.asmeccanica.it) e Dipartimento di Ingegn-eria Chimica, dei Materiali e della Produzione Industri-ale dell’Università degli Studi di Napoli “Federico II”. Questo Convegno avrà luogo a Napoli il 28 mag-gio 2015 presso l’Aula Magna del Centro Congressi Universitario in via Partenope 36, si svolge in lingua italiana ed ha lo scopo di approfondire le citate prob-lematiche per una loro migliore comprensione.Per informazioni:e mail: [email protected]
EUBCE 201523rd European Biomass Conference and ExhibitionJune 1-4, 2015 Vienna AustriaThe European Biomass Conference and Exhibition (EUBCE) is a world class annual event which, since 1980, is held at different venues throughout Europe.It is Europe’s largest international conference focused on biomass combining a highly-respected interna-tional scientific conference with an industrial exhibi-tion and gathers participants from research, industry, policy and business of biomass.
It highlights progress in research, technological de-•velopment and production processes.It brings together all key specialists to make it the •most important international platform for dialogue between research, industry, research and industry, and policy in the biomass sector.The EUBCE is the event in which the members of •the bioenergy community can get a broad picture of the situation and trends emerging in today’s market.The Conference provides a high-level scientific •programme and parallel events which attract par-ticipants from a wide-ranging background: re-searchers, engineers, technologists, standards organisations, financial institutions, policy makers and decision makers.This event is supported by European and interna-•tional organizations. The Technical Programme is coordinated by DG Joint Research Centre of the European Commission.
Bioenergy in Integrated Energy SystemsDeployment of renewables at a very large scale re-quires impact-advanced strategies and technolo-gies for energy system integration. Development and demonstration of such solutions should be done in the broad context of the transition to a sustainable energy system, where Bioenergy is accompanied by other renewables and a changing range of conven-tional energy technologies.This Focus Session aims to bring together energy system specialists, experts from the renewable en-ergy sectors and other stakeholders to present and

La rivista itaLiana deLLe sostanze grasse - voL. XCi - ottoBre/diCeMBre 2014
280
Notiz
iario discuss experiences, plans and options for advanced
system integration.Present at the EUBCE Conference. An opportunity for the bioenergy industryBased on the success and positive feedback regard-ing the initiative in the past edition of the conference, the EUBCE Executive Committee has decided to set-up a specific Industry dedicated section in the Pro-gramme in order to promote the interest and needs of the bioenergy sector and establish a platform to influence the market deployment of new innovative bioenergy technologies while at the same time ad-dressing key policy initiatives.The aim is to create a balance in the event between the scientific content and the industry contributions to ensure the coverage of the entire bioenergy value chain.All industry experts and players are invited to con-tribute and to submit abstracts, propose workshops or events, suggest industry speakers and make con-structive recommendations to serve the needs of the bioenergy industry.This is an opportunity for the bioenergy industry to reinforce the 23rd EUBCE Conference programme!For updates:http://www.eubce.com/Home.404.0.html#.VF-d0OTSG_Co
28th Nordic Lipidforum SymposiumJune 3-6, 2015 - Reykjavik IcelandThe Nordic Lipidforum is a professional arena for people interested in lipids in the five Nordic countries, Norway, Sweden, Finland, Denmark and Iceland. The forum should benefit both scientists and compa-nies involved by having a common meeting place and a system for exchange of knowledge.The Nordic Lipidforum was formally founded in 1969.Key points in the Nordic Lipidforum activities are:
Organize a contact network for a Nordic collabora-•tion in the lipid areaPromote applied research and technology for in-•dustrial application of lipids, fats and oils with a special focus on the Nordic raw materials such as fish and other marine oils, rapeseed, camelina and flaxseed oil.Provide information network playground for Nor-•dic and international meetings, job opportunities in academia, research institutes and/or industry, etc.Provide a forum for exchanging of ideas and infor-•mationIncrease international visibility of Nordic research •and industry in the lipid field.To inspire talented employees to increase their •competence in lipid science and development.
For information and updates:http://www.lipidforum.info/
Personal & Home Care, Cosmetics & Foods Industry Focus at the Tech-Connect World Innovation ConferenceJune 15-18, 2015 – Washington DC USAThe consumer products and food industries are driv-en by innovations in materials, and in natural and syn-thetic materials characterization and processing: from texture, rheology, and product appearance to active delivery and shelf-life.Join industry partners and applied research leader-ship accelerating the development and deployment of new material solutions into products and society.http://www.techconnectworld.com/World2015/in-dustry/PersonalHomeCareCosmeticsFoods_Indus-try.html
4th International Conference and Exhibition on Food Processing & TechnologyAugust 10-12, 2015 - London, UKOMICS Group feel blissful to invite you all to attend “4th International Conference and Exhibition on Food Processing & Technology (Food Technology-2015)” which is going to be held during August 10-12th, 2015 on a theme “Food Technology: Trends and Strategies for Innovation of Sustainable Foods”.This meet enables a common platform for the partici-pants to discuss their research in order to establish a scientific network between the academia and indus-try leading to foster collaboration and to evaluate the emerging issues, technologies and innovations leads to explore new possibilities and improving the existed opportunities.The prevention of diet-related diseases is one of the new societal challenges of the 21st century. In Octo-ber 2011, the world population passed the 7 billion mark. Such growth will put a massive strain on the global food supply. These factors alone make the pro-duction and distribution of food a critical issue for the 21st century. London’s food sector is worth a mas-sive £17bn with small and medium food businesses providing the majority of the industry’s 300,000 jobs. In 2011, 25 countries together accounted for 90% of UK food supply. Just over half of this (51.8%) was supplied domestically from within the UK.Food Technology-2015 is designed to offer compre-hensive range of sessions that includes breaking inno-vations in Food Science, Preservation, Quality Stan-dard and Systems Management, Food Processing and Packaging Technology, Nutrition and Nutritional Management, Food and Health, Application of Food Technology, Nutritional Deficiencies and Nutraceuti-cals, Sustainable Food Security, Food Nanotechnol-ogy and Food Biotechnology.Conference Highlights:
Breaking Innovations in Food Science•Functional & baby foods•Non-thermal Food Preservation Technologies•Packaging processes, materials & components•
La rivista itaLiana deLLe sostanze grasse - voL. XCi - ottoBre/diCeMBre 2014
281
NotiziarioFood regulatory affairs & sensory analysis•Nutritional Deficiencies and Nutraceuticals•Sustainable Food Security•Food fortification•
For information and updates:http://foodtechnology.conferenceseries.com/
2nd High Oleic Oil Congress - HOC 2015September 2-4, 2015 – Paris, France The High Oleic Oils Congress (HOC) is the only event dedicated to the fast growing high oleic oil market. High oleic (HO) oil is a niche market with its own codes and unclear rules for new entrants: premium prices for grain and oil, closed contracts between producers and traders, and regular unbalances between supply and demand.The objective of the congress is to explain the HO oil market from demand to supply. We will describe the current state of the HO oil market and analyze key market topics of direct commercial relevance to industry participants, while giving an overview of the entire value chain.The congress also provides participants with an ex-cellent opportunity to network with other key players in the HO oils industry.For information and updates:http://higholeicmarket.com/
Oils+FatsSeptember 16-18, 2015 - Messe München´s MOC GermanyOils+fats: the trade fair for your success!Oils+fats is the world’s only Trade Fair for Business, Technology and Innovations in the field of vegeta-ble as well as animal oils and fats.2015 will be the sixth time it takes place in Mu-nich. This is where the industry meets, which makes it an absolute must!Vegetable and animal oils and fats comprise a mar-ket whose significance continues to increase. As the world’s only Trade Fair for Business and Tech-nologies of oils and fats, the oils+fats offers informa-tion on the latest Innovations and showcases cur-rent trends, products and services. As in the past, the three-day exhibition at the MOC Veranstaltungscenter München will show that it is worthwhile! In 2013, oils+fats demonstrated yet again that exhibitors and visitors share the same opinion. A total of 2,221 visitors from 110 countries attended the fair, and the share of international visitors at oils+fats was 58 percent. That is why exhibitors also appreciate oils+fats as a unique opportunity to meet with customers from throughout Europe. Companies were particular praise-worthy of the visitors’ extraordinary technical expertise. Visitors consider oils+fats a success: According to a representative survey conducted by GMM Gelszus
Messe-Marktforschung, 84% of visitors are planning to attend oils+fats again. For information and updates:http://www.oils-and-fats.com/en/Home
23rd IFSCC Conference 2015September 21-23, 2015 - ZürichThe Swiss organization of cosmetic chemists SWISS SCC is organizing the conference in 2015 in Zurich. In 2015 it is exactly 20 years ago that the last IFSCC conference was held in Switzerland. It took place in Montreux at the Lake Léman with a beautiful view to the Alps. We looked back to that conference. Its title FACTS AND ILLUSIONS IN COSMETICS gave us the inspiration for the new scheme in 2015. Time has changed and facts have gained importance with changing legislation for cosmetic products and their ingredients (REACH) and many new developments in the area of analytics and product testing whether in vitro, ex vivo or in vivo.The new conference title became “More Facts, Less Illusions”. We are convinced that some more illusions will be transferred into facts and that there is much more to come in the future. The conference venue will be the Conference Center ZurichWe are looking forward to welcoming you in Switzer-land soon.for information on the scientific program: www.ifscc2015.com
13th Euro Fed Lipid Congress “Fats, Oils and Lipids: New Challenges in Technology, “Quality Control and Health”September 27-30 2015 - Florence, Italyhosted by SISSGThe Italian Society for Fats and Oils Research-es (Società Italiana per lo Studio delle Sostanze Grasse - SISSG) is proud to host the Euro Fed Lipid congress 27-30 September 2015 in Florence. The symposium will be hosted in Firenze Fiera Congress and Exhibition Center located inside the 18th century Villa Vittoria, at walking distance from the historical centre of one of the most beau-tiful towns of Italy, rich of artistic masterpieces, with an ancient history rich of arts and science. Palazzo Vecchio, Piazza della Signoria, Ponte Vec-chio, the Dome, Galleria degli Uffizi are world wide well known symbols of this ancient town, where Leonardo da’ Vinci began his work, be-fore moving to Milan and other Europeans towns. Tradition in hosting science in Florence dates back to 1753, when the “Accademia dei Georgofili” was estab-lished, the headquarter is in the Uffizi Gallery building. With such a background, the choice for the 2015 Euro Fed Lipid congress in Italy was really easy!

La rivista itaLiana deLLe sostanze grasse - voL. XCi - ottoBre/diCeMBre 2014
282
Notiz
iario Science, however is still alive in Florence and its re-
gion, Tuscany, with different University (Florence itself, Pisa, Siena) and a number of research centre (Nation-al Research Council of Italy - CNR) where research is actively carried out on several topics, enclosing Agri-cultural and Food Science which are the basis of the topics to which Euro Fed Lipid looks to. Tuscany agricultural landscape is well known for food production and some of these like extra virgin olive oil will be one of the topics of Euro Fed Lipid congress, however, within the frame of a developed agricultural and food industry production, other topics like Plant lipids and oilseeds as well as Animal Science will surely meet interests outside of the “traditional” Euro Fed Lipid attendants.Social program could surely ensure a number of in-teresting possibilities while the traditional gala dinner will be hosted at Palazzo Borghese, a wonderful an-cient residence. Symposium topics will be Analytics, Authenticity & Lipidomics, Bioscience, Biocatalysi & Biochemistry, Lipid oxidation & Antioxidants, Lipids in animal Science, Health and Nutrition, Microbial & Algae lipids, Oliseeds, Plant breeding & Plant lipids, Oleochemistry & Biodiesel, Olive oil, Physical chemis-try, Processing, sustainability & Industrial innovation.The Scientifc Committee, established by involving scientists from Europe and outside and SISSG will be delighted to welcome an huge number of Lipid Sci-entist in Florence!
Plenary Lectures:European Lipid Science Award Lecture•European Lipid Technology Award Lecture•Chevreul Medal Lecture•Wilhelm Normann Medal Lecture•
Main Topics/Keynote Lectures:Analytics, Authenticity, Lipidomics•Bioscience, Biocatalysis, Biochemistry: Romas •Kazlauskas, University of Minnesota, St. Paul/MN, USA “How the Ser-His-Asp Catalytic Triad Cata-lyzes Different Reactions”Lipid Oxidation and Antioxidants•Lipids in Animal Science•Health and Nutrition: Andrea Poli, Nutrition Foun-•dation of Italy, Milano, Italy, “Omega-6 Fatty Acids and Health: an Unbiased Critique of the Available Evidence”Microbial and Algae Lipids: Antonio Molinaro, Uni-•versity of Napoli, Italy “Microbial Cell Wall Lipogly-cans as Keywords in the Dialogue with the Eukary-otic HostOil Seeds, Plant Breeding and Plant Lipids•Oleochemistry, Biodiesel•Olive Oil•Palm Oil•Physical Chemistry•Processing and Sustainability•
http://www.eurofedlipid.org/meetings/florence2015/index.php
Vegtetable Oil Processing and Products of Vegetable Oil/BiodieselPractical Short Course on Vegetable Oil Pro-cessing and Products of Vegetable Oil/Biodie-selOctober 4-8, 2015 - College Station, TexasOrganized by theFood Protein Research & Development CenterFats and Oil ProgramTexas A&M Engineering Experiment StationThe Texas A&M University SystemCollege Station, TX 77843-2476 U.S.A. Objectives of Short CourseTrain production personnel in principles and practices of:
New methods in vegetable oil refining and pro-•cessingLatest methods in bleaching, hydrogenation, in-•teresterification, and deodorization of major veg-etable oilsProduction of biofuels•Production of non-trans fats•Filtration Systems•
Who Should AttendThis short course is a must attend for anyone involved in the field of Vegetable Oil Processing and interested in the latest developments in bleaching, hydrogena-tion, interesterification, deodorization, production of biodiesel and non-trans fats.- Plant Managers and Engineers- R &D Personnel- Sales and Marketing Personnel- Quality Control and Quality Assurance Personnel- Application ScientistsFor additional technical information, write, call, fax or e-mail to:Dr. M.S. AlamHead, Fats and Oils Program Food Protein R&D Center 2476 TAMU, Texas A&M University System College Station, Texas 77843-2476 U.S.ATel: 979-845-2740, Fax: 979-845-2744E-mail: [email protected] registration inquiries contact:Marcy Bundick Short Course CoordinatorFood Protein R&D CenterPhone: (979) 845-2741, Fax: (979) 845-2744E-mail: [email protected]
SODEOPEC2015Soaps, Detergents, Oleochemicals, and Per-sonal Care October 27-30, 2015 - Miami, Florida, USAOn behalf of the organizing committee, AOCS, in-vite you to attend SODEOPEC2015, the eighth in a series of successful meetings. Continuing the tradi-tion of covering the four interrelated areas of soaps, detergents, oleochemicals, and personal care, the
La rivista itaLiana deLLe sostanze grasse - voL. XCi - ottoBre/diCeMBre 2014
283
Notiziariomeeting will deliver “practical solutions for tomorrow’s challenges”.Presentations:
TThe State of the Industries•Chair: Tom Branna, Happi, USANews you can use to improve the product line and bottom line!
Keeping Healt - hy. Look at the critical role that proper hygiene plays in maintaining human health around the world. Room to Grow. Past results are no guarantee of -future performance, but analysts paint a bright fu-ture for the industries.Now Smell This! Learn how fragrance trends are -shaking up the business.Let’s Get Small. Start-ups play a crucial role in -bringing innovation to market.Big and Powerful. See how a multinational corpo- -ration views the landscape.Sustainability in Action•
Chair: Brian Sansoni, American Cleaning Institute, USACompanies throughout the cleaning product sup-ply chain are challenged with greater demands for transparency on how they operate sustainably and responsibly. This session will explore the drive for sus-tainability improvements at the company and industry levels, plus how it affects society at-large.
The Analytics of SODEOPEC•Chair: George A. Smith, Huntsman Performance Products, USAThe session will cover the manufacturing and testing of detergent products for home and personal care ap-plications. Different analytical methods for determin-ing product specifications will be surveyed, along with statistical quality control (SQC) techniques for opti-mizing the manufacturing process and product qual-ity. The session will also discuss preparation of soil swatches for assessing the performance of laundry detergent formulations and different test methods for laundry, liquid dish, and hard surface cleaning appli-cations. Use of image analysis and colorimetric deter-minations for optimizing the performance properties of finished products will also be discussed.
Contract Manufacturing•Chair: David P. Hempson, Marietta Corporation, USA- Evolution of Contract Manufacturing in the Personal
Care Industry-A 30-year PerspectiveDavid P. Hempson, Senior Vice President Business Development, Marietta Corporation, USA.An in-depth review of the contract manufacturing in-dustry from an insider’s view – how the industry has changed in the areas of selling strategies, customer expectations, and contract manufacturer capability. An overview of the direction of the industry and how market forces will shape the landscape as the con-tract manufacturing industry continues to evolve.- Industry Association and Their Impact on the Contract
Manufacturing IndustryLisa Shambro, Executive Director, Foundation for Strategic Sourcing, USA.An overview of the history of the Foundation for Stra-tegic Sourcing –what compelled the formation of the F4SS; what is the role of the association in bridging the gap between customers and suppliers (contract manufacturers) in the areas of networking, establish-ment of industry standards, thought leadership, and continuous improvement.- Regulatory Controls and the Advent of Good Documen-tation Practices, Analytical Testing, Microbiological Test-ing in the Contract Manufacturing EnvironmentChris Calhoun, Senior Vice President Quality and Regulatory Affairs, Marietta Corporation, USA.How have expectations changed in the area of regu-latory compliance for contract manufacturers – what drove the changes and how has the industry re-sponded? Where is the industry headed with regard to regulatory compliance expectations?- The Future of Contract Manufacturing-GloballyPanel discussion: D. Hempson, L. Shambro, and C. CalhounA round table discussion leveraging the presented topics as to where we see the contract manufactur-ing industry headed – as large food and consumer products companies look for agility, speed to market, and divest manufacturing operations, how will the contract manufacturing industry adapt?
From Solids to Liquids•Chair: Jose Manuel Tamayo, Complexityless Solu-tions, LLC, USA- Flexible Formulation for Soaps to Optimize CostJose Manuel Tamayo, Complexityless Solutions, LLC, USA.This interactive session will use a proven model to op-timize the cost of bar soap formulation, based on the fats and oils market price and alternative raw material availability. This lecture also provides an overview of the key process fundamentals required to optimize and improve the manufacturing plant’s flexibility and output.- Computer Monitoring System for Soap Dryers and Fin-ishing LinesPablo Felipe Quintero, Hada S.A., Colombia.- Above and Beyond Bars - Welcome to Liquids Technology Jose Manuel Tamayo, Complexityless Solutions, LLC, USAWhen moving from solids - bar soap to liquids - there are a lot of challenges to overcome to obtain a clear picture of what is key to make this move more effec-tive and productive. Such as reducing the cost im-plications in formula and manufacturing processing. This presentation will analyze a basic formula to make body wash, highlighting the key cost drivers as well as the equipment required, then overview the market trends for liquid hand soap and body wash products in the USA.- Liquid Detergents Technology - What You Need to Know
La rivista itaLiana deLLe sostanze grasse - voL. XCi - ottoBre/diCeMBre 2014
284
Notiz
iario James Cush, Independent Home Care Supply Chain
Consultant, USA.Consumer product giants, or young, growing contrac-tor manufacturers, in the household liquid detergent arena are subject to many factors which make serv-ing the marketplace complex. This, in turn, requires an in–depth analysis of configuring the manufacturing operation to be flexible and efficient all while address-ing the demands of your customers. This presenta-tion will discuss many factors which need to be con-sidered for liquid detergent production both now and in the future.- Innovative New Ingredients and Technologies for Per-sonal CareShyam Gupta, Bioderm Research, USAReview the exciting new and unusual ingredients and technologies for personal care. Today’s topics of current high consumer interest are skin rejuvenation, acne, skin clarification, and skin brightening. The pre-sentation will also include a discussion on the poten-tial, albeit futuristic, application of blue-sky pathways such as topical growth factors, stem cell therapies, senescense, autophagy, apoptosis, and mitochon-dria in personal care research. The emerging tech-nologies in this presentation have the potential for the development of innovative, on-the-horizon skin care formulations.For information: Meeting Manager: Connie Hilson [email protected]
World Congress on Oils & Fats and 31st ISF Lectureship SeriesOctober 31 - November 4, 2015 - Rosario Argentina“Evoluzione, innovazione e sfide per un Futuro Sostenibile” Il Congresso è l’nvito ad uno scambio e ad un aggior-namento delle conoscenze nel campo di applicazione di oli e grassi rivolto a specialisti, ricercatori, profes-sionisti, studenti e aziende.Sta emergendo una nuova coscienza: lavorare per ridurre al minimo l’impatto ambientale attuando un pi-ano che si rivolgerà all’uso efficiente delle risorse; as-sumere un ruolo forte nella sensibilizzazione di questo problema attraverso i canali di comunicazione.L’obiettivo è quella di organizzare un evento per las-ciare il segno.Per informazioni sul programma scientifico:http://www.asagaworldcongress.org.ar/index.php/es/
PIPOC 2015 The Premier Oil Palm event is back!October 6-8, 2015 - Kuala Lumpur Convention Centre, Ma-laysia Organized by: Malaysian Palm Oil Board
Ministry of Plantation Industries & CommoditiesThe grand MPOB International Palm Oil Congress and Exhibition (PIPOC) with five concurrent Confer-ences will examine and discuss the many facets of the oil palm industry.PIPOC 2013 was attended by more than 2200 par-ticipants from 48 countries.PIPOC 2015 features 5 concurrent Conferences, namely:•Agriculture,Biotechnology&Sustainability•Chemistry,ProcessingTechnology&Bio-Energy•Food,Lifestyle&Health•Oleo&SpecialtyChemicals•GlobalEconomics&MarketingAnother attraction of the Congress is an Evening Fo-rum on Current Issues.You may opt to be a:speaker, poster presenter or participant or your or-ganisation may:•EXHIBITyourproductsand/orservices•ADVERTISEintheSouvenirProgrammeoftheCon-gress 6 - 8 October 2015After two years, it is timely to update your knowledge and information on the developments in the R&D of oil palm. It will be a platform for participants to interact and share information in all areas pertaining to the oil palm/palm oil industry.This bi-annual Congress provides a platform that showcases the latest advances in the industry.A grand exhibition with a total floor space of more than 2000 m2 and 300 booths will showcase many new technologies and information to increase the productivity of your business.Technical tours to an oil palm plantation, palm oil mill, refinery and R&D facilities will also be arranged. A golf tournament is also in store for participants and golf enthusiasts.So, be part of the event and don’t miss this opportu-nity to update and get yourself networked.For information and updates:[email protected]
SCS FORMULATE 201517-18 November 2015www.ifscc2015.comSave the date.


INNOVHUB - Stazioni Sperimentali per l’IndustriaAzienda Speciale della Camera di Commercio di Milano
Divisione SSOGVia Giuseppe Colombo 79 - 20133 MILANOTel. +39 02 7064971 - Fax +39 02 2363953
e-mail: [email protected] - sito web: www.innovhub-ssi.it