“OLD AND LOW-COST SENSOR” FOR MICROPHOTOGRAMMETRY. CASE …
8
“OLD AND LOW-COST SENSOR” FOR MICROPHOTOGRAMMETRY. CASE STUDY: THE EMPEROR MAXIMIANUS HERCULEUS’ MEDALLION AT THE CORRER MUSEUM (VENICE) S. Berto 1, *, G. Salemi 1 1 Dipartimento dei Beni Culturali: archeologia, storia dell’arte, del cinema e della musica, Università di Padova, Piazza Capitaniato 7, Padova, 35139, Italy – [email protected], [email protected] Commission II KEY WORDS: Microphotogrammetry, Roman Medallion, Structured light scanner, Virtual gallery, 3DHOP ABSTRACT: The microphotogrammetric survey of the roman emperor Maximianus Herculeus’ medallion, described in this report, demonstrated that, despite the use of an “old” and, nowadays, “low cost” camera sensor it is still possible to obtain a detailed 3D textured model useful for different scientific purposes and virtual enhancement. Here are presented the photogrammetric results reached with the selection of the best solutions in terms of number of images, in order to speed up the entire photogrammetric workflow and pursue the goals previously explained. This medallion is one of the most important examples of roman medallions which belongs to the numismatic collection stored at the Correr Museum in Venice. Its 3D survey was developed as a parallel step of a main project which aims to acquire in three-dimensions, with a structured light scanner, the complete roman collection of medallions. This digitization project proposes to record the volumetric information of these small archaeological remains and to realize an online virtual gallery in the web site of the museum (using 3DHOP, an open source web viewer developed by the Visual Computing Lab of the CNR-ISTI of Pisa). At the end of the microphotogrammetric workflow, a distance analysis was computed to highlight the differences between the meshes obtained with a photogrammetric approach and a structured light scanner. * Corresponding author 1. INTRODUCTION Cultural Heritage and Digital Technologies Since the last two decades Cultural Heritage have increased their public diffusion due to a general widespread employment of three-dimensional survey techniques for acquisition and digital tools for interaction (Silver, 2016; Scopigno et al., 2017). In the first case, 3D survey techniques are used, with active or passive sensors, to register the volumetric and colour information of objects or environments. In the second case, 3D web viewer, pdf 3D or others 3D sharing solutions constitute useful results to visualize, share and interact with 3D models. This outcome is a positive consequence of the evident progress in the Digital Technologies which has allowed to increase the development of new software and hardware dedicated to improve the overall recording and presenting workflow (Stylianidis et al. 2016). With reference to numismatics, the use of these two digital solutions (i.e. 3D survey techniques and 3D web-viewers), for recording, studying, sharing and enhancing this particular class of archaeological materials, is playing a key role for the creation of digital collections. These collections can offer an alternative and complementary way of studying, analysing and, also, comparing numismatic materials physically stored in different places. In this decade, Museums, institutions (public and private) and foundations are investing their resources into innovative projects for digitizing parts of their collections (for the digitization of some numismatics examples or collections see the Smithsonian 3D project - https://3d.si.edu/ - and the sketchfab galleries of the Kunsthistorisches Museum of Wien - https://sketchfab.com/KunsthistorischesMuseumWien -, the museum of Jaén - https://sketchfab.com/museo-de-jaen -, the Wirtualne Muzea of the Małopolska Province - https://sketchfab.com/WirtualneMuzeaMalopolski - and the museum of royal fine art of Hue - https://sketchfab.com/hue- museum-of-royal-fine-arts -). This kind of initiatives contribute to create digital reproductions of unique artefacts useful both for research (Asolati, Crisafulli, 2019; Bentkowska-Kafel et al., 2017) and enhancement purposes. 3D models represent accurate and scaled digital replica of real objects which can give relevant information about morphology, volume, aspect, conservation status and material. At the same time, 3D objects can be exhibited, as virtual contents, inside Virtual Museums. Here, through virtual galleries, visitors, with the employ of different interaction methodologies (e.g., by exploring a virtual environment with hotspots or by using desktop 3D viewers) shareable through several devices (desktop, smartphone, tablet), can freely observe all the digital replica and, possibly, interact with them (Pescarin, 2014). With this same purpose of sharing and enhancing its materials the Correr Museum of Venice, in 2017, in collaboration with the Dipartimento dei Beni Culturali: archeologia, storia dell’arte, del cinema e della musica the University of Padova, promoted the digitization of its entire collection of roman medallions, composed of 22 unique copies. These particular roman artefacts, mostly created for celebrating or commemorating roman prestigious personalities, such as members of the court, remarkable roman citizens or members of the roman army, were distinguished from the other coins by their dimensions, bigger with respect to the standard, and their high artistic level (Crisafulli, 2019). For pursuing the goals of the project, the 3D survey of the whole collection of medallions was executed with a structured light scanner (Aurum 3D produced by Open Technologies, now FARO Technologies The International Archives of the Photogrammetry, Remote Sensing and Spatial Information Sciences, Volume XLII-2/W17, 2019 6th International Workshop LowCost 3D – Sensors, Algorithms, Applications, 2–3 December 2019, Strasbourg, France This contribution has been peer-reviewed. https://doi.org/10.5194/isprs-archives-XLII-2-W17-61-2019 | © Authors 2019. CC BY 4.0 License. 61
Transcript of “OLD AND LOW-COST SENSOR” FOR MICROPHOTOGRAMMETRY. CASE …
“OLD AND LOW-COST SENSOR” FOR MICROPHOTOGRAMMETRY. CASE STUDY: THE EMPEROR MAXIMIANUS HERCULEUS’ MEDALLION
AT THE CORRER MUSEUM (VENICE)
S. Berto 1, *, G. Salemi 1
1Dipartimento dei Beni Culturali: archeologia, storia dell’arte, del cinema e della musica, Università di Padova,
Piazza Capitaniato 7, Padova, 35139, Italy – [email protected], [email protected]
Commission II
KEY WORDS: Microphotogrammetry, Roman Medallion, Structured light scanner, Virtual gallery, 3DHOP ABSTRACT: The microphotogrammetric survey of the roman emperor Maximianus Herculeus’ medallion, described in this report, demonstrated that, despite the use of an “old” and, nowadays, “low cost” camera sensor it is still possible to obtain a detailed 3D textured model useful for different scientific purposes and virtual enhancement. Here are presented the photogrammetric results reached with the selection of the best solutions in terms of number of images, in order to speed up the entire photogrammetric workflow and pursue the goals previously explained. This medallion is one of the most important examples of roman medallions which belongs to the numismatic collection stored at the Correr Museum in Venice. Its 3D survey was developed as a parallel step of a main project which aims to acquire in three-dimensions, with a structured light scanner, the complete roman collection of medallions. This digitization project proposes to record the volumetric information of these small archaeological remains and to realize an online virtual gallery in the web site of the museum (using 3DHOP, an open source web viewer developed by the Visual Computing Lab of the CNR-ISTI of Pisa). At the end of the microphotogrammetric workflow, a distance analysis was computed to highlight the differences between the meshes obtained with a photogrammetric approach and a structured light scanner.
* Corresponding author
1. INTRODUCTION
Cultural Heritage and Digital Technologies
Since the last two decades Cultural Heritage have increased their public diffusion due to a general widespread employment of three-dimensional survey techniques for acquisition and digital tools for interaction (Silver, 2016; Scopigno et al., 2017). In the first case, 3D survey techniques are used, with active or passive sensors, to register the volumetric and colour information of objects or environments. In the second case, 3D web viewer, pdf 3D or others 3D sharing solutions constitute useful results to visualize, share and interact with 3D models. This outcome is a positive consequence of the evident progress in the Digital Technologies which has allowed to increase the development of new software and hardware dedicated to improve the overall recording and presenting workflow (Stylianidis et al. 2016). With reference to numismatics, the use of these two digital solutions (i.e. 3D survey techniques and 3D web-viewers), for recording, studying, sharing and enhancing this particular class of archaeological materials, is playing a key role for the creation of digital collections. These collections can offer an alternative and complementary way of studying, analysing and, also, comparing numismatic materials physically stored in different places. In this decade, Museums, institutions (public and private) and foundations are investing their resources into innovative projects for digitizing parts of their collections (for the digitization of some numismatics examples or collections see the Smithsonian 3D project - https://3d.si.edu/ - and the sketchfab galleries of the Kunsthistorisches Museum of Wien - https://sketchfab.com/KunsthistorischesMuseumWien -, the
museum of Jaén - https://sketchfab.com/museo-de-jaen -, the Wirtualne Muzea of the Małopolska Province - https://sketchfab.com/WirtualneMuzeaMalopolski - and the museum of royal fine art of Hue - https://sketchfab.com/hue-museum-of-royal-fine-arts -). This kind of initiatives contribute to create digital reproductions of unique artefacts useful both for research (Asolati, Crisafulli, 2019; Bentkowska-Kafel et al., 2017) and enhancement purposes. 3D models represent accurate and scaled digital replica of real objects which can give relevant information about morphology, volume, aspect, conservation status and material. At the same time, 3D objects can be exhibited, as virtual contents, inside Virtual Museums. Here, through virtual galleries, visitors, with the employ of different interaction methodologies (e.g., by exploring a virtual environment with hotspots or by using desktop 3D viewers) shareable through several devices (desktop, smartphone, tablet), can freely observe all the digital replica and, possibly, interact with them (Pescarin, 2014). With this same purpose of sharing and enhancing its materials the Correr Museum of Venice, in 2017, in collaboration with the Dipartimento dei Beni Culturali: archeologia, storia dell’arte, del cinema e della musica the University of Padova, promoted the digitization of its entire collection of roman medallions, composed of 22 unique copies. These particular roman artefacts, mostly created for celebrating or commemorating roman prestigious personalities, such as members of the court, remarkable roman citizens or members of the roman army, were distinguished from the other coins by their dimensions, bigger with respect to the standard, and their high artistic level (Crisafulli, 2019). For pursuing the goals of the project, the 3D survey of the whole collection of medallions was executed with a structured light scanner (Aurum 3D produced by Open Technologies, now FARO Technologies
The International Archives of the Photogrammetry, Remote Sensing and Spatial Information Sciences, Volume XLII-2/W17, 2019 6th International Workshop LowCost 3D – Sensors, Algorithms, Applications, 2–3 December 2019, Strasbourg, France
This contribution has been peer-reviewed. https://doi.org/10.5194/isprs-archives-XLII-2-W17-61-2019 | © Authors 2019. CC BY 4.0 License.
61
Inc.). The project aims to record in 3D the complete morphology of each medallion in order to realize a virtual copy of them useful not only for analysing the surface not only with a geometrical approach but also with multidisciplinary approaches; for mapping the conservation status, for promoting these ancient artefacts to the public. In reason of both their dimensions and their decoration (on the two sides), these exceptional examples of roman art are often hard to exhibit with appropriate solutions. The case study described in this report, deals with the photogrammetric acquisition of one of the most important artefacts of this collection, i.e. the emperor Maximiuanus Herculeus’ medallion. This survey developed as a parallel step of the main project, previously described, with the intent of:
§ analysing the entire photogrammetric workflow acquired and processed with “old” and, nowadays, “low cost” devices (i.e. the camera sensor used for the acquisition and the hardware employed for the elaboration);
§ suggesting the best acquisition strategy, in terms of minimum number of images, in order to speed up the whole photogrammetric survey workflow of small objects;
§ comparing the photogrammetric 3D model with a scanner mesh of the same medallion to comprehend the geometrical differences between the models and the efficiency of photogrammetry, applied to small and metallic objects acquired with an “old” camera sensor, in terms of numismatic research and enhancement.
2. THE ROMAN EMPEROR MAXIMIANUS HERCULEUS’ MEDALLION
A unique example of ancient roman art
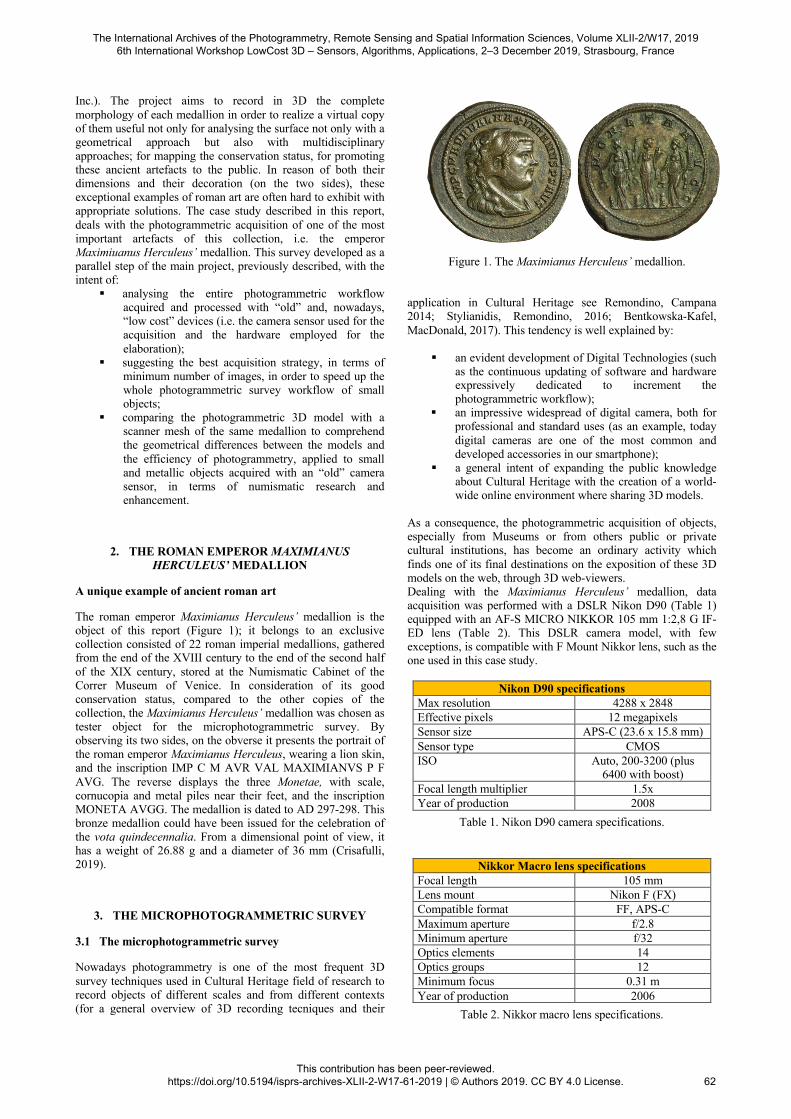
The roman emperor Maximianus Herculeus’ medallion is the object of this report (Figure 1); it belongs to an exclusive collection consisted of 22 roman imperial medallions, gathered from the end of the XVIII century to the end of the second half of the XIX century, stored at the Numismatic Cabinet of the Correr Museum of Venice. In consideration of its good conservation status, compared to the other copies of the collection, the Maximianus Herculeus’ medallion was chosen as tester object for the microphotogrammetric survey. By observing its two sides, on the obverse it presents the portrait of the roman emperor Maximianus Herculeus, wearing a lion skin, and the inscription IMP C M AVR VAL MAXIMIANVS P F AVG. The reverse displays the three Monetae, with scale, cornucopia and metal piles near their feet, and the inscription MONETA AVGG. The medallion is dated to AD 297-298. This bronze medallion could have been issued for the celebration of the vota quindecennalia. From a dimensional point of view, it has a weight of 26.88 g and a diameter of 36 mm (Crisafulli, 2019).
3. THE MICROPHOTOGRAMMETRIC SURVEY
3.1 The microphotogrammetric survey
Nowadays photogrammetry is one of the most frequent 3D survey techniques used in Cultural Heritage field of research to record objects of different scales and from different contexts (for a general overview of 3D recording tecniques and their
application in Cultural Heritage see Remondino, Campana 2014; Stylianidis, Remondino, 2016; Bentkowska-Kafel, MacDonald, 2017). This tendency is well explained by:
§ an evident development of Digital Technologies (such as the continuous updating of software and hardware expressively dedicated to increment the photogrammetric workflow);
§ an impressive widespread of digital camera, both for professional and standard uses (as an example, today digital cameras are one of the most common and developed accessories in our smartphone);
§ a general intent of expanding the public knowledge about Cultural Heritage with the creation of a world-wide online environment where sharing 3D models.
As a consequence, the photogrammetric acquisition of objects, especially from Museums or from others public or private cultural institutions, has become an ordinary activity which finds one of its final destinations on the exposition of these 3D models on the web, through 3D web-viewers. Dealing with the Maximianus Herculeus’ medallion, data acquisition was performed with a DSLR Nikon D90 (Table 1) equipped with an AF-S MICRO NIKKOR 105 mm 1:2,8 G IF-ED lens (Table 2). This DSLR camera model, with few exceptions, is compatible with F Mount Nikkor lens, such as the one used in this case study.
Nikon D90 specifications Max resolution 4288 x 2848 Effective pixels 12 megapixels Sensor size APS-C (23.6 x 15.8 mm) Sensor type CMOS ISO Auto, 200-3200 (plus
6400 with boost) Focal length multiplier 1.5x Year of production 2008
Table 1. Nikon D90 camera specifications.
Nikkor Macro lens specifications Focal length 105 mm Lens mount Nikon F (FX) Compatible format FF, APS-C Maximum aperture f/2.8 Minimum aperture f/32 Optics elements 14 Optics groups 12 Minimum focus 0.31 m Year of production 2006
Table 2. Nikkor macro lens specifications.
Figure 1. The Maximianus Herculeus’ medallion.
The International Archives of the Photogrammetry, Remote Sensing and Spatial Information Sciences, Volume XLII-2/W17, 2019 6th International Workshop LowCost 3D – Sensors, Algorithms, Applications, 2–3 December 2019, Strasbourg, France
This contribution has been peer-reviewed. https://doi.org/10.5194/isprs-archives-XLII-2-W17-61-2019 | © Authors 2019. CC BY 4.0 License.
62
The entire photogrammetric acquisition was recorded with a circular trajectory around the medallion, which was placed with one of its two faces (obverse first and then reverse) on the top of a support. The camera was always slightly tilted respect to the surface of the medallion. No images were directly taken for the edge. Before starting the acquisition procedure, the set was illuminated with two lamps, mutually placed in opposite positions and both oriented to a convergent direction, and a diffusion material was put between the medallion and the two sources of light to prevent a non-uniform dispersion of the light caused by the metallic surface of the medallion. Afterward, a manual white balance of the camera was executed. The camera settings are listed in Table 3. The use of a tripod allowed to acquire images by employing a lower aperture of the diaphragm; as a consequence, both the depth of field and the shutter speed values increased.
Nikon D90 settings Shooting mode A (Aperture priority) Camera accessory IR remote controller ISO Auto Image resolution 4288 x 2848 White balance Manual
Table 3. Manual camera settings.
152 images were acquired: 72 for the obverse and 80 for the reverse. Since one of the purposes of the survey consisted on the documentation of the adequate number of images useful to: realize a correct digital replica of the medallion, speed up the data processing, compare the result with the 3D model obtained with the scanner, the data processing workflow was organized in four different datasets (Table 4). These datasets are based on the progressive reduction by 25%, 50%, 75% from dataset 1.
Dataset Number of images Total Obverse Reverse
1 152 72 80 2 114 54 60 3 68 36 40 4 45 18 20
Table 4. Number of images for all datasets.
The photogrammetric workflow was performed with the software Photoscan Pro (Photoscan Pro, 2016) installed in a Windows 10 partition located in a MacBook Pro Retina (mid. 2012; processor: 2.6 GHz Intel Core i7 quad-core; ram: 16 GB 1660 MHz DDR3; Intel HD Graphics 4000, NVIDIA GeForce GT 650M). All the datasets were processed following the standard workflow: 1) Alignment; 2) Gradual Selection; 3) Dense Cloud generation; 4) Mesh generation; 5) Texture generation. 1) Alignment. First of all, the camera was calibrated. Then calibration file was imported in Photoscan and set up for all the datasets. Table 5 presents all the parameters set for the alignment. At the end of the process, 8 sparse clouds were elaborated. Table 9 presents both parameters and timing values registered for each dataset. 2) Gradual selection. Before filtering the 8 sparse clouds with the gradual selection filter, every sparse cloud was manually cleaned of all the points refereed to the support where the
medallion was placed. Therefore, after this step, gradual selection filter was used to further clean all the sparse clouds; then an optimization of the result was executed.
Photoscan step: Alignment Accuracy High Pair selection Disabled Key point limit 40.000 Tie point limit 4.000 Constrain features by mask No Adaptive camera model fitting No
Table 5. Alignment settings for all datasets. 3) Dense cloud generation. Within a single project file of Photoscan (among all, four project files were created) every dataset was composed by one chunck for the obverse and one for the reverse. These two chuncks were elaborated separately until the processing of the dense cloud (Table 6). The final result, the dense cloud, was then manually cleaned of all the superfluous points (Table 9). Most of these points were mainly placed by the software on the upper and lower part of the edge of the medallion. Afterwards, within every project file, the two dense clouds were aligned by using four controls points, which were manually placed in Photoscan on the external part of the edge of the medallion. Then, after a further cleaning, the two clouds were merged together.
Photoscan step: Dense cloud generation Quality High Depth filtering Moderate
Table 6. Dense cloud generation settings for all datasets.
4) Mesh generation. At the end, for every dataset a mesh was generated by following the parameters listed in Table 7. As for the dense generation step, Table 9 presents all the parameters and timing values referred to the mesh generation.
Photoscan step: Mesh generation Surface type Arbitrary Source data Dense cloud Face count High Interpolation Enabled Point classes All
Table 7. Mesh generation settings for all datasets.
5) Texture generation. To enhance the quality of the texture, which was created with Photoscan, a further selection of images was necessary for all the four groups. In this case, since all the four datasets contained all the images of dataset 4 (i.e. the dataset with the lower number of images: 18 for the obverse and 20 for the reverse) a selection between its 38 images was executed and transferred to the other datasets. Images from both the two sides were selected from 8 useful point of view by choosing an approximate regular distance between all the images along the recording circular trajectory. At the end, for all the datasets, the texture was generated with the same 8 images for each side. Table 8 presents all the parameters set for the texture generation.
The International Archives of the Photogrammetry, Remote Sensing and Spatial Information Sciences, Volume XLII-2/W17, 2019 6th International Workshop LowCost 3D – Sensors, Algorithms, Applications, 2–3 December 2019, Strasbourg, France
This contribution has been peer-reviewed. https://doi.org/10.5194/isprs-archives-XLII-2-W17-61-2019 | © Authors 2019. CC BY 4.0 License.
63
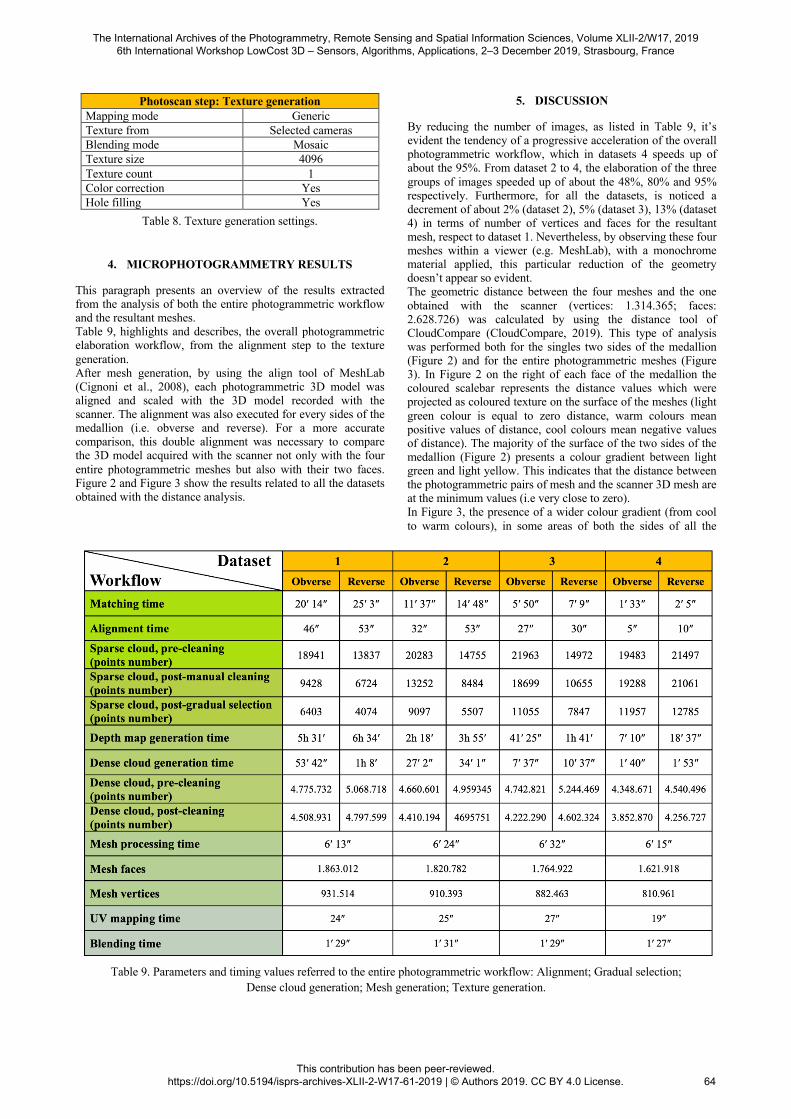
Photoscan step: Texture generation Mapping mode Generic Texture from Selected cameras Blending mode Mosaic Texture size 4096 Texture count 1 Color correction Yes Hole filling Yes
Table 8. Texture generation settings.
4. MICROPHOTOGRAMMETRY RESULTS
This paragraph presents an overview of the results extracted from the analysis of both the entire photogrammetric workflow and the resultant meshes. Table 9, highlights and describes, the overall photogrammetric elaboration workflow, from the alignment step to the texture generation. After mesh generation, by using the align tool of MeshLab (Cignoni et al., 2008), each photogrammetric 3D model was aligned and scaled with the 3D model recorded with the scanner. The alignment was also executed for every sides of the medallion (i.e. obverse and reverse). For a more accurate comparison, this double alignment was necessary to compare the 3D model acquired with the scanner not only with the four entire photogrammetric meshes but also with their two faces. Figure 2 and Figure 3 show the results related to all the datasets obtained with the distance analysis.
5. DISCUSSION
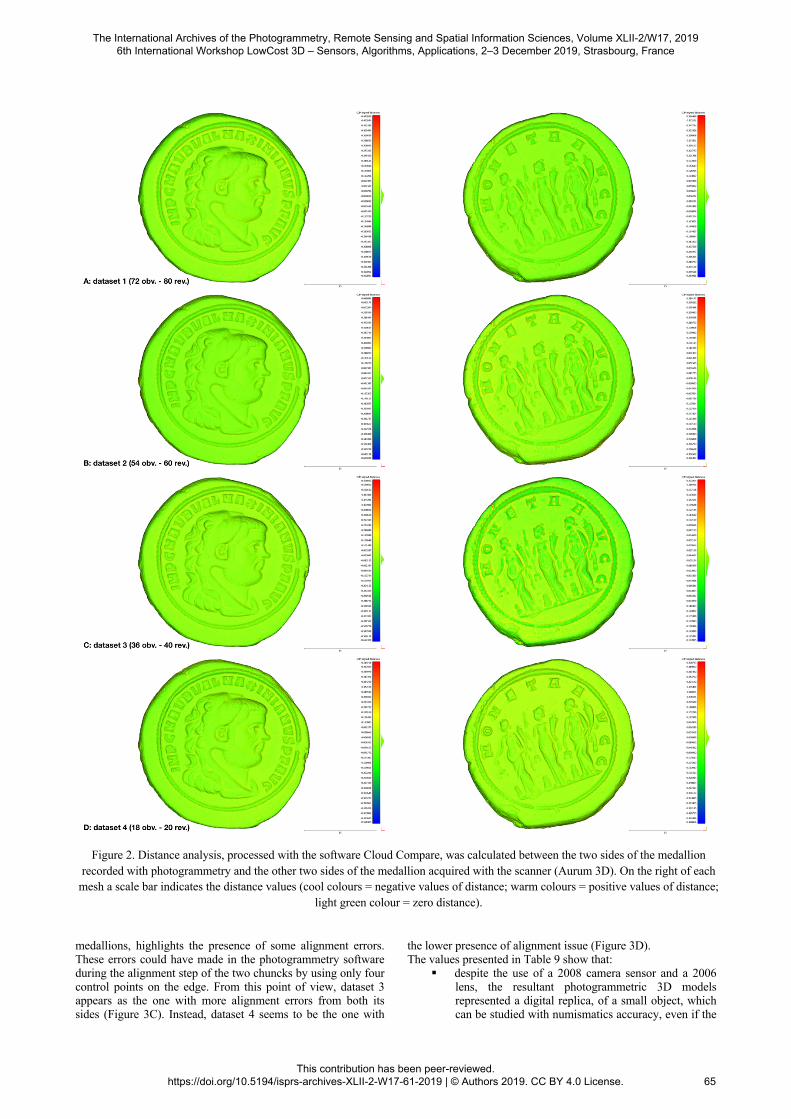
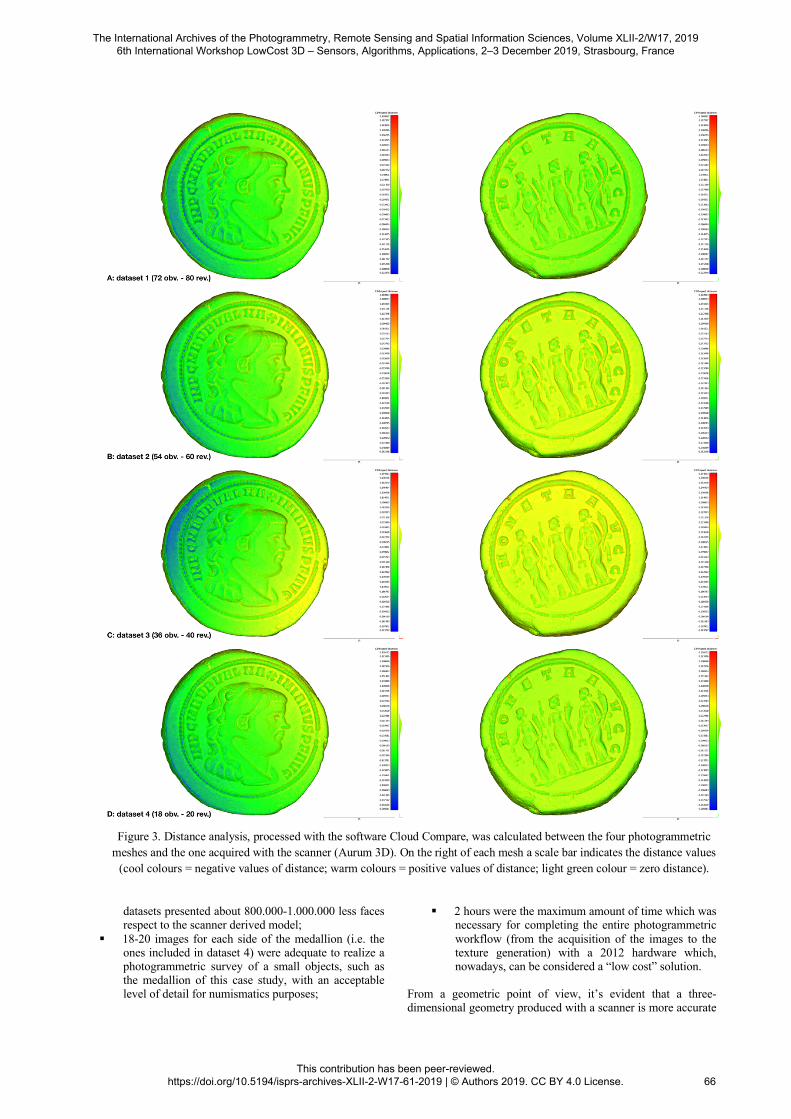
By reducing the number of images, as listed in Table 9, it’s evident the tendency of a progressive acceleration of the overall photogrammetric workflow, which in datasets 4 speeds up of about the 95%. From dataset 2 to 4, the elaboration of the three groups of images speeded up of about the 48%, 80% and 95% respectively. Furthermore, for all the datasets, is noticed a decrement of about 2% (dataset 2), 5% (dataset 3), 13% (dataset 4) in terms of number of vertices and faces for the resultant mesh, respect to dataset 1. Nevertheless, by observing these four meshes within a viewer (e.g. MeshLab), with a monochrome material applied, this particular reduction of the geometry doesn’t appear so evident. The geometric distance between the four meshes and the one obtained with the scanner (vertices: 1.314.365; faces: 2.628.726) was calculated by using the distance tool of CloudCompare (CloudCompare, 2019). This type of analysis was performed both for the singles two sides of the medallion (Figure 2) and for the entire photogrammetric meshes (Figure 3). In Figure 2 on the right of each face of the medallion the coloured scalebar represents the distance values which were projected as coloured texture on the surface of the meshes (light green colour is equal to zero distance, warm colours mean positive values of distance, cool colours mean negative values of distance). The majority of the surface of the two sides of the medallion (Figure 2) presents a colour gradient between light green and light yellow. This indicates that the distance between the photogrammetric pairs of mesh and the scanner 3D mesh are at the minimum values (i.e very close to zero). In Figure 3, the presence of a wider colour gradient (from cool to warm colours), in some areas of both the sides of all the
Table 9. Parameters and timing values referred to the entire photogrammetric workflow: Alignment; Gradual selection; Dense cloud generation; Mesh generation; Texture generation.
The International Archives of the Photogrammetry, Remote Sensing and Spatial Information Sciences, Volume XLII-2/W17, 2019 6th International Workshop LowCost 3D – Sensors, Algorithms, Applications, 2–3 December 2019, Strasbourg, France
This contribution has been peer-reviewed. https://doi.org/10.5194/isprs-archives-XLII-2-W17-61-2019 | © Authors 2019. CC BY 4.0 License.
64
medallions, highlights the presence of some alignment errors. These errors could have made in the photogrammetry software during the alignment step of the two chuncks by using only four control points on the edge. From this point of view, dataset 3 appears as the one with more alignment errors from both its sides (Figure 3C). Instead, dataset 4 seems to be the one with
the lower presence of alignment issue (Figure 3D). The values presented in Table 9 show that:
§ despite the use of a 2008 camera sensor and a 2006 lens, the resultant photogrammetric 3D models represented a digital replica, of a small object, which can be studied with numismatics accuracy, even if the
Figure 2. Distance analysis, processed with the software Cloud Compare, was calculated between the two sides of the medallion recorded with photogrammetry and the other two sides of the medallion acquired with the scanner (Aurum 3D). On the right of each
mesh a scale bar indicates the distance values (cool colours = negative values of distance; warm colours = positive values of distance; light green colour = zero distance).
The International Archives of the Photogrammetry, Remote Sensing and Spatial Information Sciences, Volume XLII-2/W17, 2019 6th International Workshop LowCost 3D – Sensors, Algorithms, Applications, 2–3 December 2019, Strasbourg, France
This contribution has been peer-reviewed. https://doi.org/10.5194/isprs-archives-XLII-2-W17-61-2019 | © Authors 2019. CC BY 4.0 License.
65
datasets presented about 800.000-1.000.000 less faces respect to the scanner derived model;
§ 18-20 images for each side of the medallion (i.e. the ones included in dataset 4) were adequate to realize a photogrammetric survey of a small objects, such as the medallion of this case study, with an acceptable level of detail for numismatics purposes;
§ 2 hours were the maximum amount of time which was necessary for completing the entire photogrammetric workflow (from the acquisition of the images to the texture generation) with a 2012 hardware which, nowadays, can be considered a “low cost” solution.
From a geometric point of view, it’s evident that a three-dimensional geometry produced with a scanner is more accurate
Figure 3. Distance analysis, processed with the software Cloud Compare, was calculated between the four photogrammetric meshes and the one acquired with the scanner (Aurum 3D). On the right of each mesh a scale bar indicates the distance values
(cool colours = negative values of distance; warm colours = positive values of distance; light green colour = zero distance).
The International Archives of the Photogrammetry, Remote Sensing and Spatial Information Sciences, Volume XLII-2/W17, 2019 6th International Workshop LowCost 3D – Sensors, Algorithms, Applications, 2–3 December 2019, Strasbourg, France
This contribution has been peer-reviewed. https://doi.org/10.5194/isprs-archives-XLII-2-W17-61-2019 | © Authors 2019. CC BY 4.0 License.
66
and precise respect to a “low cost” photogrammetric mesh. However, by considering the scale of the object, the result obtained with photogrammetry is positive, despite the presence of some minor alignment issue.
6. VIRTUAL ENHANCEMENT
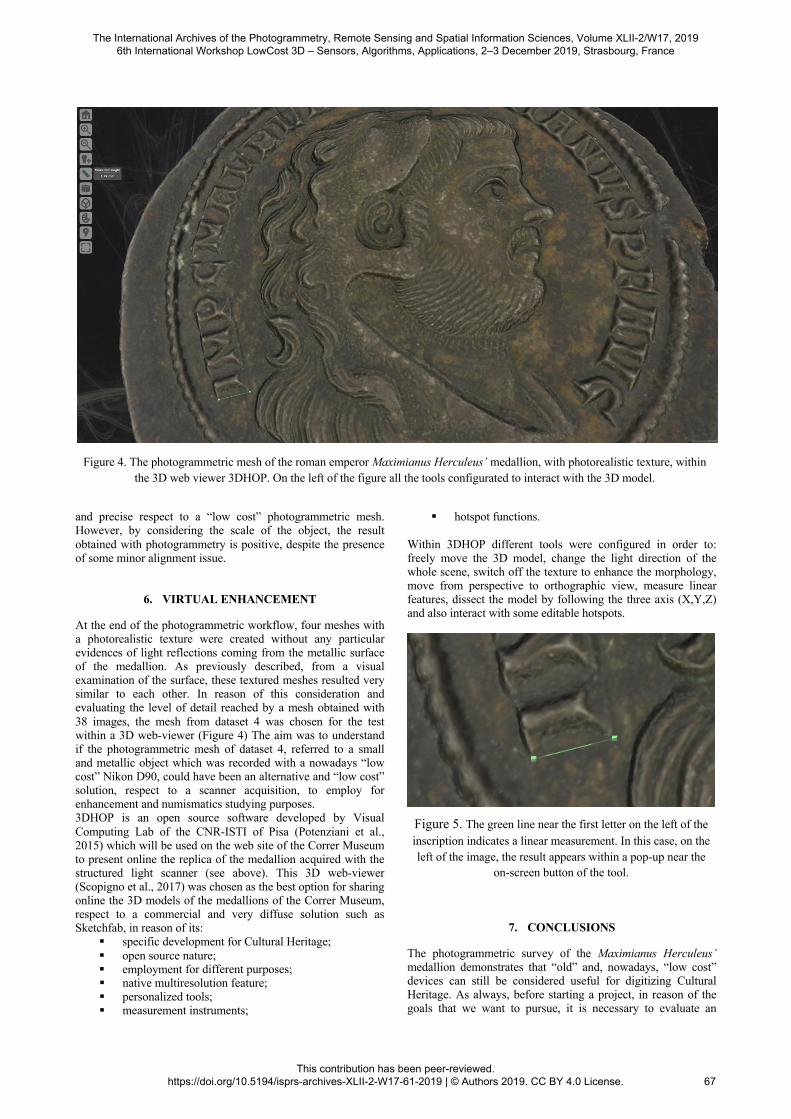
At the end of the photogrammetric workflow, four meshes with a photorealistic texture were created without any particular evidences of light reflections coming from the metallic surface of the medallion. As previously described, from a visual examination of the surface, these textured meshes resulted very similar to each other. In reason of this consideration and evaluating the level of detail reached by a mesh obtained with 38 images, the mesh from dataset 4 was chosen for the test within a 3D web-viewer (Figure 4) The aim was to understand if the photogrammetric mesh of dataset 4, referred to a small and metallic object which was recorded with a nowadays “low cost” Nikon D90, could have been an alternative and “low cost” solution, respect to a scanner acquisition, to employ for enhancement and numismatics studying purposes. 3DHOP is an open source software developed by Visual Computing Lab of the CNR-ISTI of Pisa (Potenziani et al., 2015) which will be used on the web site of the Correr Museum to present online the replica of the medallion acquired with the structured light scanner (see above). This 3D web-viewer (Scopigno et al., 2017) was chosen as the best option for sharing online the 3D models of the medallions of the Correr Museum, respect to a commercial and very diffuse solution such as Sketchfab, in reason of its:
§ specific development for Cultural Heritage; § open source nature; § employment for different purposes; § native multiresolution feature; § personalized tools; § measurement instruments;
§ hotspot functions. Within 3DHOP different tools were configured in order to: freely move the 3D model, change the light direction of the whole scene, switch off the texture to enhance the morphology, move from perspective to orthographic view, measure linear features, dissect the model by following the three axis (X,Y,Z) and also interact with some editable hotspots.
7. CONCLUSIONS
The photogrammetric survey of the Maximianus Herculeus’ medallion demonstrates that “old” and, nowadays, “low cost” devices can still be considered useful for digitizing Cultural Heritage. As always, before starting a project, in reason of the goals that we want to pursue, it is necessary to evaluate an
Figure 4. The photogrammetric mesh of the roman emperor Maximianus Herculeus’ medallion, with photorealistic texture, within the 3D web viewer 3DHOP. On the left of the figure all the tools configurated to interact with the 3D model.
Figure 5. The green line near the first letter on the left of the inscription indicates a linear measurement. In this case, on the left of the image, the result appears within a pop-up near the
on-screen button of the tool.
The International Archives of the Photogrammetry, Remote Sensing and Spatial Information Sciences, Volume XLII-2/W17, 2019 6th International Workshop LowCost 3D – Sensors, Algorithms, Applications, 2–3 December 2019, Strasbourg, France
This contribution has been peer-reviewed. https://doi.org/10.5194/isprs-archives-XLII-2-W17-61-2019 | © Authors 2019. CC BY 4.0 License.
67
appropriate data recording-processing workflow and a proper instrumental equipment. In this case study, despite some minor alignment errors, the results achieved, by employing devices produced from 2006 to 2012, it respected the intent of the project. In less than 2 hours, the processing of 38 images produced a “detailed” 3D model of a roman medallion (diameter 36 mm), also with photorealistic texture, shareable with a 3D web viewer (i.e. 3DHOP) both for numismatic purposes (e.g. for: making some linear measurements on the surface, observing the orientation of the two sides, studying the decoration, etc.) and for enhancement.
ACKNOWLEDGEMENTS
The authors acknowledge: Cristina Crisafulli, the supervisor of the numismatic collection at the Correr Museum, for the kind cooperation.
REFERENCES
Agisoft Photoscan Pro, 2016. Agisoft Photoscan Pro Software, Version 1.2.6, www.agisoft.com (23 October 2019). Asolati, M., Crisafulli, C., 2019: Dal gabinetto numismatico al “museo” virtuale, dal disegno alla nuvola di punti. La collezione di medaglioni romani imperiali del Museo Correr di Venezia, Numismatica Patavina, 14. Bentkowska-Kafel, A., Macdonald, L. 2017: Digital techniques for documenting and preserving cultural heritage, Croydon, UK. Bentkowska-Kafel, A., Moitinho de Almeida, V., Macdonald, L. Del Hoyo-Meléndez, J. M., Mathys, A. 2017: Beyond photography: an interdisciplinary, exploratory case study in the recording and examination of roman silver coins. Bentkowska-Kafel, A., Macdonald, L. (eds.), Digital techniques for documenting and preserving cultural heritage, Croydon, UK, 35-66. Cignoni, P., Callieri, M., Corsini, M., Dellepiane, M.; Ganovelli, F., Ranzuglia, G., 2008: MeshLab: an Open-Source Mesh Processing Tool. Sixth Eurographics Italian Chapter Conference, 129-136. CloudCompare, 2019. CloudCompare Software, Version 2.9.1, www.cloudcompare.org (23 October 2019). Crisafulli, C., 2019: La “collezione” dei medaglioni romani imperiali del Museo Correr di Venezia. Asolati, M., Crisafulli, C. (eds.), Dal gabinetto numismatico al “museo” virtuale, dal disegno alla nuvola di punti. La collezione di medaglioni romani imperiali del Museo Correr di Venezia, Numismatica Patavina, 14, 19-53. MeshLab, 2016. MeshLab Software, Version 2016.12, www.meshlab.net (23 October 2019). Pescarin, S. 2014: Museum and Virtual Museum in Europe: reaching expectations. SCIentific RESearch and Information Technology, 4, 4. 131-140. doi.org/10.2423/i22394303v4n1p131. Potenziani, M., Callieri, M., Dellepiane, M., Corsini, M., Ponchio, F., Scopigno, R., 2015: 3DHOP: 3D Heritage Online Presenter. Computer & Graphics, 52, 129-141.
doi.org/10.1016/j.cag.2015.07.001. Remondino, F., Campana, S., 2014: 3D Recording and Modelling in Archaeology and Cultural Heritage – Theory and Best Practices, British Archaeological Reports, IS, 2598, Oxford. Scopigno, R., Calieri, M., Dellepiane, M., Ponchio, F., Potenziani, M., 2017: Delivering and using 3D models on the web: Are we ready? Virtual Archaeology Review, 8 (17), 1-9. doi.org/10.4995/var.2017.6405. Silver, M. 2016: Conservation Tecniques in Cultural Heritage. Stylianidis, E., Remondino, F. (eds.), 3D Recording, Documentation and Management of Cultural Heritage, Dunbeath, Scotland, 15-105. Stylianidis, E., Georgopoulos, A., Remondino, F., 2016: Basics of Image-based Modelling Techniques in Cultural Heritage 3D Recording. Stylianidis, E., Remondino, F. (eds.), 3D Recording, Documentation and Management of Cultural Heritage, Dunbeath, Scotland, 253-304. Stylianidis, E., Remondino, F. 2016: 3D Recording, Documentation and Management of Cultural Heritage, Dunbeath, Scotland.
The International Archives of the Photogrammetry, Remote Sensing and Spatial Information Sciences, Volume XLII-2/W17, 2019 6th International Workshop LowCost 3D – Sensors, Algorithms, Applications, 2–3 December 2019, Strasbourg, France
This contribution has been peer-reviewed. https://doi.org/10.5194/isprs-archives-XLII-2-W17-61-2019 | © Authors 2019. CC BY 4.0 License.
68