
Marco Fritelli, Ilaria Peri n 224.pdf · Marco Frittelli Ilaria Periy March 12, 2012 Abstract In...
25
Dipartimento di Metodi Quantitativi per le Scienze Economiche ed Aziendali Università degli Studi di Milano Bicocca Via Bicocca degli Arcimboldi 8, - 20126 Milano - Italia Tel +39/02/6448.3103 o 3139 Fax +39/2/64483105 Segreteria di redazione: Andrea Bertolini Rapporto n. 224 From Risk Measures to Research Measures Marco Fritelli, Ilaria Peri Marzo 2012
Transcript of Marco Fritelli, Ilaria Peri n 224.pdf · Marco Frittelli Ilaria Periy March 12, 2012 Abstract In...
Dipartimento di Metodi Quantitativi per le Scienze Economiche ed Aziendali
Università degli Studi di Milano Bicocca Via Bicocca degli Arcimboldi 8, - 20126 Milano - Italia
Tel +39/02/6448.3103 o 3139 Fax +39/2/64483105 Segreteria di redazione: Andrea Bertolini
Rapporto n. 224
From Risk Measures to Research Measures
Marco Fritelli, Ilaria Peri
Marzo 2012
From Risk Measures to Research Measures
Marco Frittelli� Ilaria Periy
March 12, 2012
Abstract
In order to evaluate the quality of the scienti�c research, we introducea new family of scienti�c performance measures, called Scienti�c ResearchMeasures (SRM). Our proposal originates from the more recent develop-ments in the theory of risk measures and is an attempt to resolve themany problems of the existing bibliometric indices.
The SRM that we introduce are: �exible to �t peculiarities of di¤er-ent areas and seniorities; inclusive, as they comprehend several popularindices; coherent, as they share the same structural properties; calibratedto the particular scienti�c community; granular, as they allow a more pre-cise comparison between scientists and are based on the whole scientist�scitation curve.
Keywords: Bibliometric Indices, Citations, Risk Measures, Scienti�c Im-pact Measures
1 Introduction
In the recent years the evaluation of the scientist�s performance has becomeincreasingly important. In fact, most crucial decisions regarding faculty re-cruitment, accepting research projects, research time, academic positions, travelmoney, award of grants and promotions depend on great extent upon the scien-ti�c merits of the involved researchers.
The scope of the valuation of the scienti�c research is mainly twofold:
� Provide an updated picture of the existing research activity, in order toallocate �nancial resources in relation to the scienti�c quality and scienti�cproduction;
� Determine an increase in the quality of the scienti�c research (of the struc-tures).
�Università degli Studi di Milano.yUniversità degli Studi di Milano Bicocca.
1

The methodologies for the valuation can be divided into two categories:
� content valuation, based on:
� internal judgments committee;
� external reviews of peer panels.
� context valuation, based on:
� bibliometrics (i.e. statistics derived from citation data);
� characteristics of the Journals associated to the publications.
Economic considerations strongly depone of using the context method on asystematic (yearly) base, while peer review is more plausible on a multiple yearbase and should also be �nalized to check, harmonize, and tune the outcomesbased on bibliometric indices.So in order to have a simple and cheaper assessment method and thank to
the major availability of the online database (i.e. Google Scholar, ISI Web ofScience, MathSciNet and Scopus) several di¤erent bibliometric measures havebeen introduced.There are several critics, as those clearly underlined by the Citation Statistics
Report of the International Mathematical Union (2008) [CIT], to the use ofthe citations as a key factor in the assessment of the quality of the research.However, many of these critics can be satisfactorily addressed and our proposalis one reasonable way to achieve this task. We emphasize that the output ofthe valuation is the classi�cation of authors (and structures) into few classes ofhomogeneous research quality: it is not intended to provide a �ne ranking.
Many indices were developed to quantify the production of researchers, e.g.the total number of published papers in a period of time; or the impact of theirpublications, e.g. the total number of citations, the average number of citationsper paper, the number and percentage of signi�cant papers (with more than acertain amount of citations).In 2005 Hirsch [H05] proposed the h-index, that is now the most popular
and used citation-based metric. A scientist has index h if h of his n papers haveat least h citations each and the other (n� h) papers have at most h citationseach. The h-index is an attempt measures at the same time the productivity interms of number of publications and the research quality in terms of citationsper publication.After its introduction, the h-index received wide attention from the scienti�c
community and it has been extended by many authors who have proposed otherindices (for an overview see Alonso et al., 2009 [ACHH]) in order to overcomesome of the drawbacks of it (see Bornmann and Daniel, 2007 [BD07]).
Di¤erently from any existing approach, our formulation is clearly germinatedfrom the Theory of Risk Measures. The axiomatic approach developed in the
2
seminal paper by Artzner et al.[ADEH99] turned out to be, in this last decade,very in�uential for the theory of risk measures: instead of focusing on someparticular measurement of the risk carried by �nancial positions (the variance,the V@R, etc. etc.), [ADEH99] proposed a class of measures satisfying somereasonable properties (the �coherent� axioms). Ideally, each institution couldselect its own risk measure, provided it obeyed the structural coherent proper-ties. This approach added �exibility in the selection of the risk measure and, atthe same time, established a uni�ed framework. We propose the same approachin order to determine a good class of scienti�c performance measures, that wecall Scienti�c Research Measures (SRM).
The theory of coherent risk measures was later extended to the class of con-vex risk measures (Follmer and Schied [FS02], Frittelli and Rosazza [FR02]).The origin of our proposal can be traced in the more recent development ofthis theory, leading to the notion of quasi-convex risk measures introduced byCerreia-Vioglio et al. [CMMM] and further developed in the dynamic framework by Frittelli and Maggis [FM11]. Additional papers in this area include:Cherny and Madan [CM09], that introduced the concept of an AcceptabilityIndex having the property of quasi-concavity; Drapeau and Kupper [DK10],where the correspondence between a quasi-convex risk measure and the associ-ated family of acceptance sets - already present in [CM09] - is fully analyzed.The representation of quasi-concave monotone maps in terms of family of ac-ceptance sets, as well as their dual formulations, are the key ideas underlyingour de�nition of SRM.We propose a family of SRMs that are:
� �exible in order to �t peculiarities of di¤erent areas and ages;
� inclusive, as they comprehends several popular indices;
� calibrated to the particular scienti�c community;
� coherent, as they share the same structural properties - based on an ax-iomatic approach;
� granular, as they allow a more precise comparison between scientists andare based on the whole citation curve of a scientist.
The de�nition of the SRM, the relative properties and some examples aregiven in Section 2. A new interesting approach to the whole area of bibliometricindices is provided by the dual representation of a SRM discussed in Section 3.We also show the method to compute a particular SRM, called �-index, and wereport some empirical results obtained by calibrating the performance curvesto a speci�c data set (built using Google Scholar).
3
2 On a class of Scienti�c Research Measure
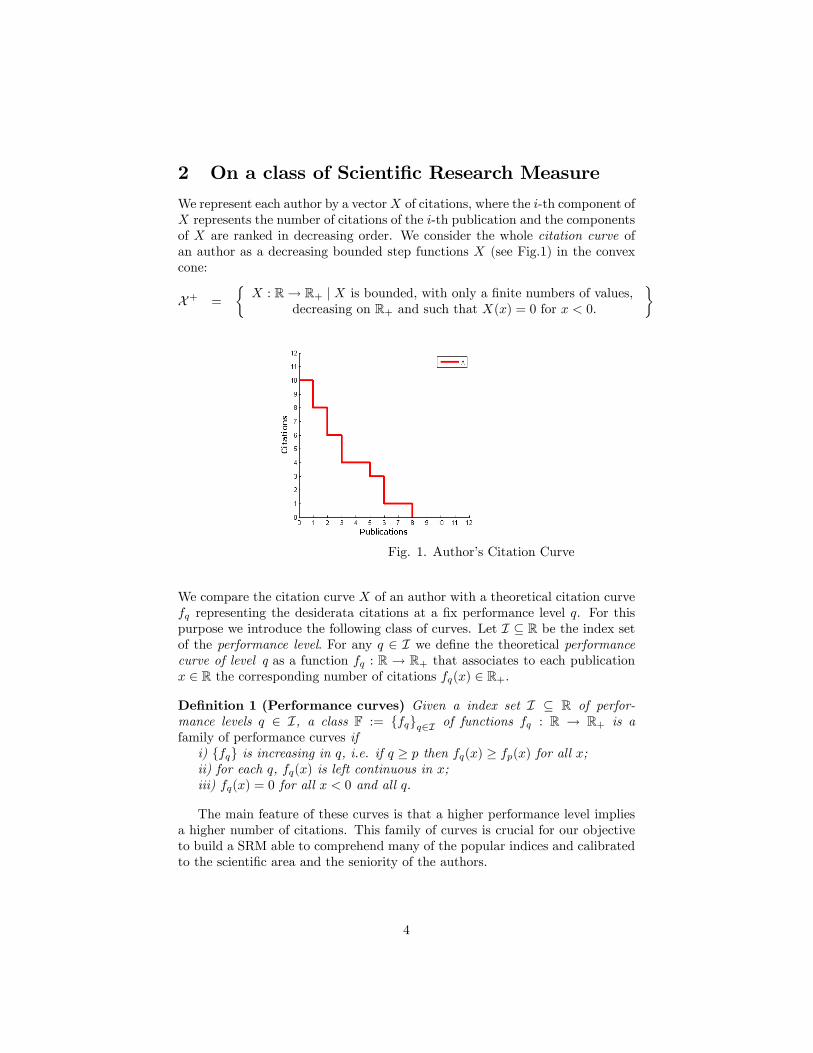
We represent each author by a vectorX of citations, where the i-th component ofX represents the number of citations of the i-th publication and the componentsof X are ranked in decreasing order. We consider the whole citation curve ofan author as a decreasing bounded step functions X (see Fig.1) in the convexcone:
X+ =
�X : R! R+ j X is bounded, with only a �nite numbers of values,
decreasing on R+ and such that X(x) = 0 for x < 0:
�
Fig. 1. Author�s Citation Curve
We compare the citation curve X of an author with a theoretical citation curvefq representing the desiderata citations at a �x performance level q. For thispurpose we introduce the following class of curves. Let I � R be the index setof the performance level. For any q 2 I we de�ne the theoretical performancecurve of level q as a function fq : R ! R+ that associates to each publicationx 2 R the corresponding number of citations fq(x) 2 R+.
De�nition 1 (Performance curves) Given a index set I � R of perfor-mance levels q 2 I, a class F := ffqgq2I of functions fq : R ! R+ is afamily of performance curves ifi) ffqg is increasing in q, i.e. if q � p then fq(x) � fp(x) for all x;ii) for each q, fq(x) is left continuous in x;iii) fq(x) = 0 for all x < 0 and all q:
The main feature of these curves is that a higher performance level impliesa higher number of citations. This family of curves is crucial for our objectiveto build a SRM able to comprehend many of the popular indices and calibratedto the scienti�c area and the seniority of the authors.
4

De�nition 2 (Performance sets and SRM) Given a family of performancecurves F = ffqgq, we de�ne the family of performance sets AF := fAqgq by
Aq :=�X 2 X+ j X(x) � fq(x) for all x 2 R
:
The Scienti�c Research Measure (SRM) is the map �F : X+ ! [0;1] associatedto F and AF given by
�F(X) : = sup fq 2 I j X 2 Aqg= sup fq 2 I j X(x) � fq(x) for all x 2 Rg : (1)
The SRM �F is obtained by the comparison between the real citation curveof an author X (the red line in Fig.2) and the family F of performance curves(the blue line in Fig.2): the �F(X) is the greatest level q of the performancecurve fq below the author�s citation curve X:
Fig. 2. Determination of a particular SRM, the h-index(that in this example is equal to 4).
2.1 Some examples of existing SRMs
The previous de�nition points out the importance of the family of theoreticalperformance curves for the determination of the SRM. It is clear that di¤erentchoices of F := ffqgq lead to di¤erent SRM �F. The following examples showthat some well known indices of scienti�c performance are particular cases ofour SRM. In the following examples, if X has p � 1 publications that receivedat least one citation, we set: X =
Ppi=1 xi1(i�1;i] , with xi � xi+1 for all i.
5
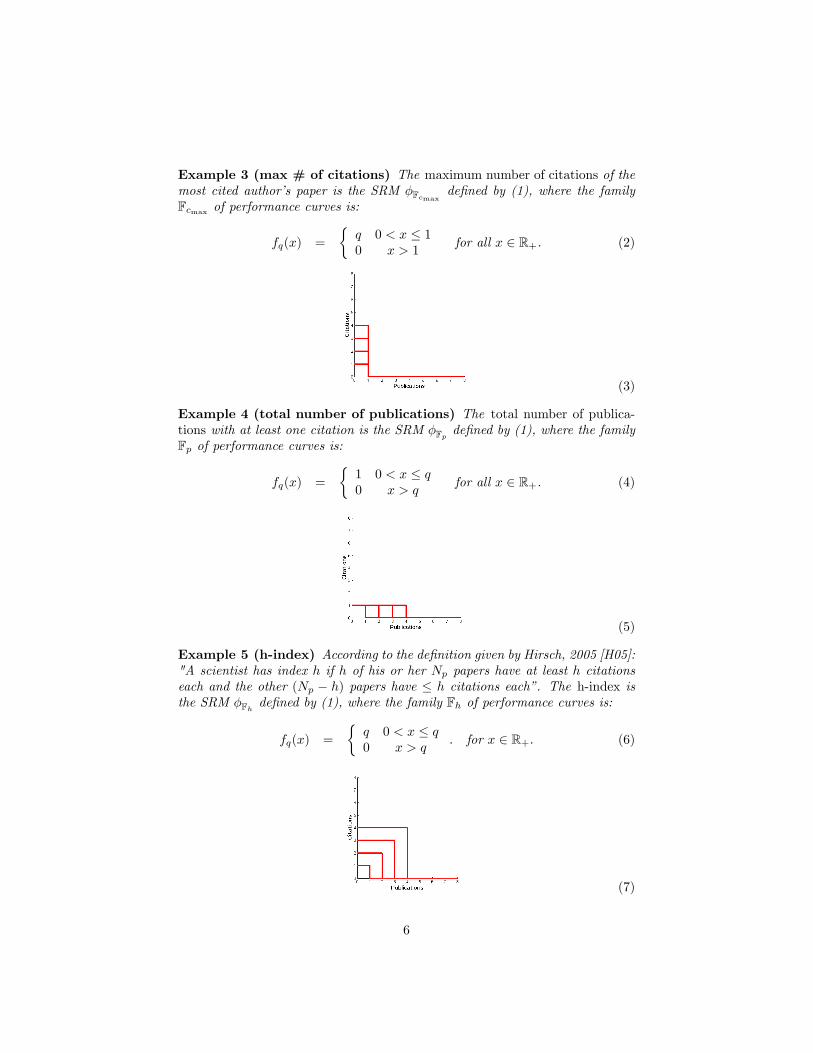
Example 3 (max # of citations) The maximum number of citations of themost cited author�s paper is the SRM �Fcmax de�ned by (1), where the familyFcmax of performance curves is:
fq(x) =
�q 0 < x � 10 x > 1
for all x 2 R+. (2)
(3)
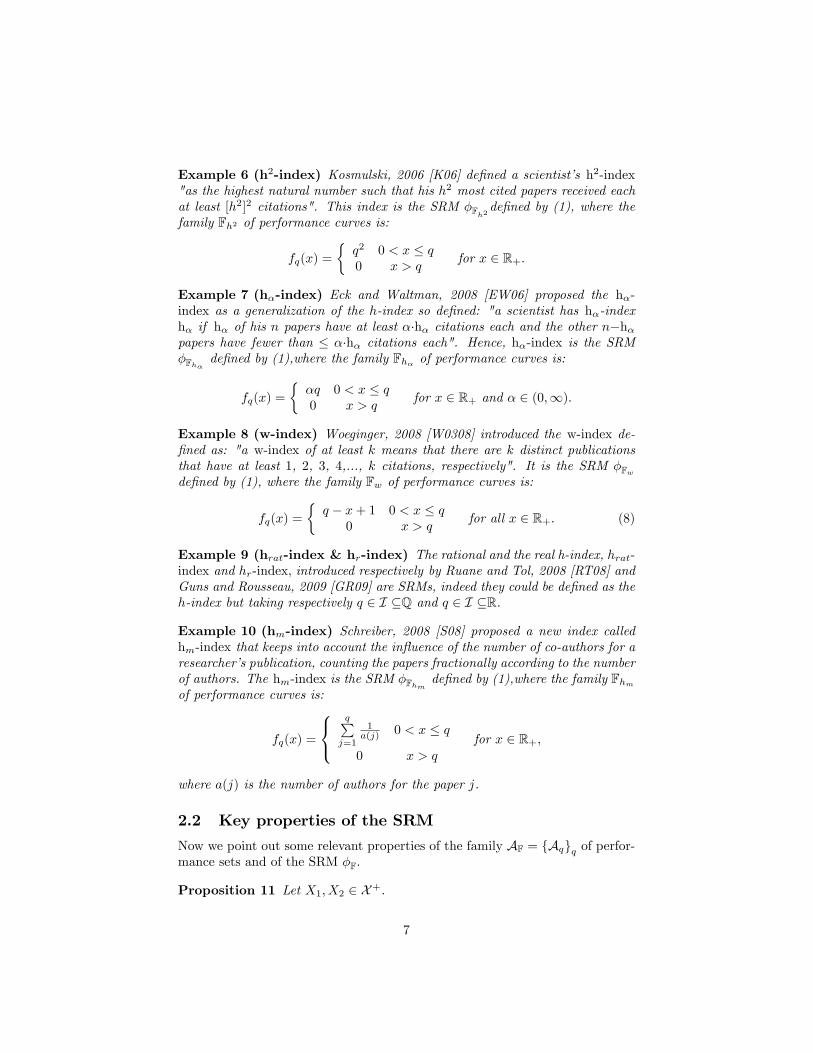
Example 4 (total number of publications) The total number of publica-tions with at least one citation is the SRM �Fp de�ned by (1), where the familyFp of performance curves is:
fq(x) =
�1 0 < x � q0 x > q
for all x 2 R+. (4)
(5)
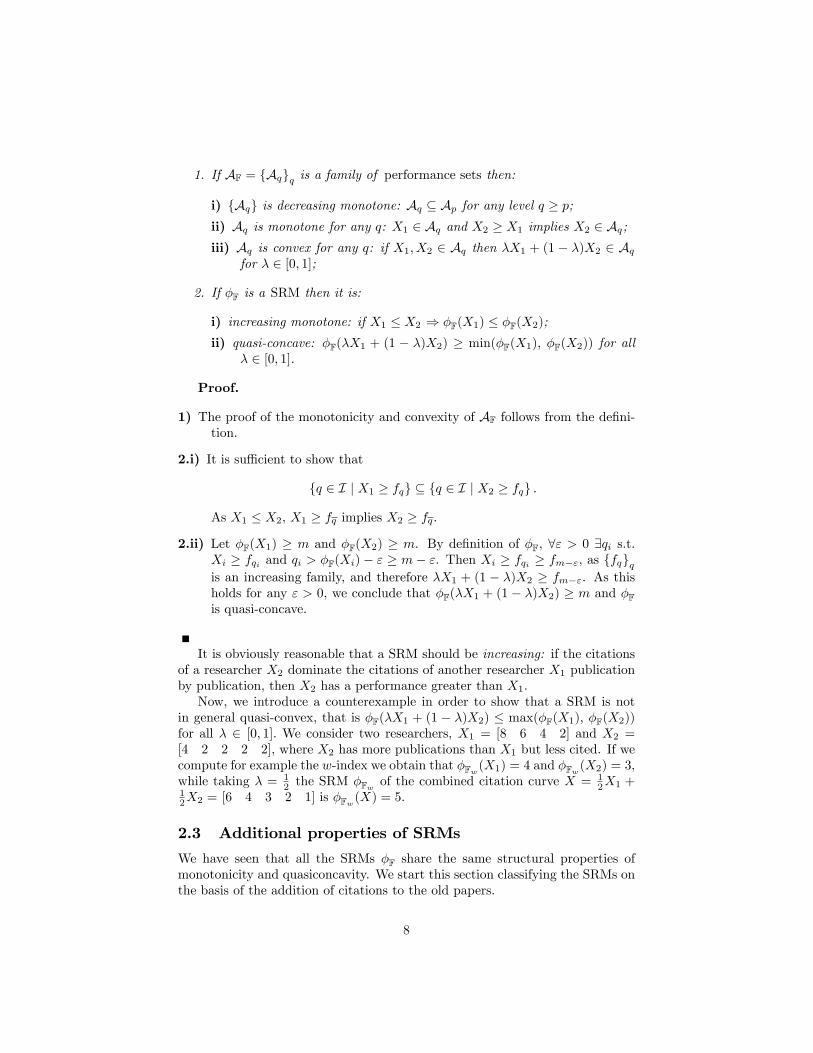
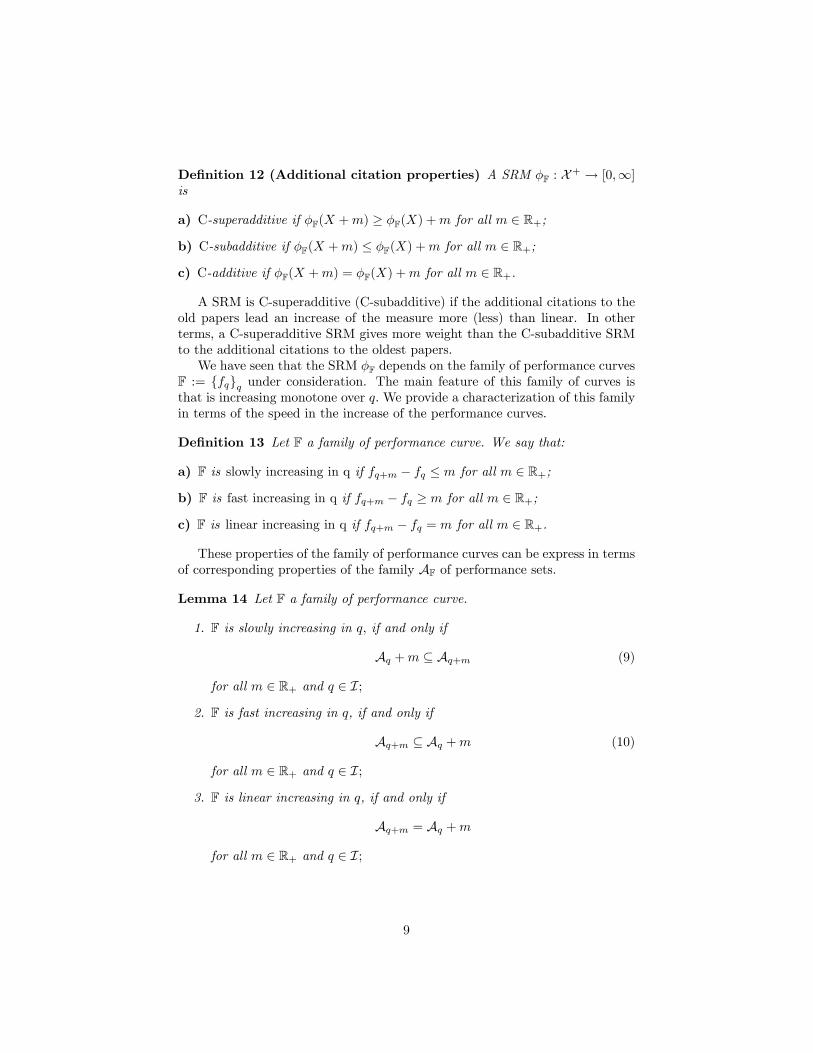
Example 5 (h-index) According to the de�nition given by Hirsch, 2005 [H05]:"A scientist has index h if h of his or her Np papers have at least h citationseach and the other (Np � h) papers have � h citations each�. The h-index isthe SRM �Fh de�ned by (1), where the family Fh of performance curves is:
fq(x) =
�q 0 < x � q0 x > q
: for x 2 R+: (6)
(7)
6
Example 6 (h2-index) Kosmulski, 2006 [K06] de�ned a scientist�s h2-index"as the highest natural number such that his h2 most cited papers received eachat least [h2]2 citations". This index is the SRM �Fh2de�ned by (1), where thefamily Fh2 of performance curves is:
fq(x) =
�q2 0 < x � q0 x > q
for x 2 R+:
Example 7 (h�-index) Eck and Waltman, 2008 [EW06] proposed the h�-index as a generalization of the h-index so de�ned: "a scientist has h�-indexh� if h� of his n papers have at least ��h� citations each and the other n�h�papers have fewer than � ��h� citations each". Hence, h�-index is the SRM�Fh� de�ned by (1),where the family Fh� of performance curves is:
fq(x) =
��q 0 < x � q0 x > q
for x 2 R+ and � 2 (0;1):
Example 8 (w-index) Woeginger, 2008 [W0308] introduced the w-index de-�ned as: "a w-index of at least k means that there are k distinct publicationsthat have at least 1, 2, 3, 4,..., k citations, respectively". It is the SRM �Fwde�ned by (1), where the family Fw of performance curves is:
fq(x) =
�q � x+ 1 0 < x � q
0 x > qfor all x 2 R+: (8)
Example 9 (hrat-index & hr-index) The rational and the real h-index, hrat-index and hr-index, introduced respectively by Ruane and Tol, 2008 [RT08] andGuns and Rousseau, 2009 [GR09] are SRMs, indeed they could be de�ned as theh-index but taking respectively q 2 I �Q and q 2 I �R.
Example 10 (hm-index) Schreiber, 2008 [S08] proposed a new index calledhm-index that keeps into account the in�uence of the number of co-authors for aresearcher�s publication, counting the papers fractionally according to the numberof authors. The hm-index is the SRM �Fhm de�ned by (1),where the family Fhmof performance curves is:
fq(x) =
8<:qPj=1
1a(j) 0 < x � q
0 x > qfor x 2 R+;
where a(j) is the number of authors for the paper j.
2.2 Key properties of the SRM
Now we point out some relevant properties of the family AF = fAqgq of perfor-mance sets and of the SRM �F.
Proposition 11 Let X1; X2 2 X+.
7
1. If AF = fAqgq is a family of performance sets then:
i) fAqg is decreasing monotone: Aq � Ap for any level q � p;ii) Aq is monotone for any q: X1 2 Aq and X2 � X1 implies X2 2 Aq;iii) Aq is convex for any q: if X1; X2 2 Aq then �X1 + (1 � �)X2 2 Aq
for � 2 [0; 1];
2. If �F is a SRM then it is:
i) increasing monotone: if X1 � X2 ) �F(X1) � �F(X2);ii) quasi-concave: �F(�X1 + (1 � �)X2) � min(�F(X1); �F(X2)) for all
� 2 [0; 1].
Proof.
1) The proof of the monotonicity and convexity of AF follows from the de�ni-tion.
2.i) It is su¢ cient to show that
fq 2 I j X1 � fqg � fq 2 I j X2 � fqg :
As X1 � X2, X1 � fq implies X2 � fq:
2.ii) Let �F(X1) � m and �F(X2) � m. By de�nition of �F, 8" > 0 9qi s.t.Xi � fqi and qi > �F(Xi)� " � m� ". Then Xi � fqi � fm�", as ffqgqis an increasing family, and therefore �X1 + (1 � �)X2 � fm�". As thisholds for any " > 0, we conclude that �F(�X1 + (1 � �)X2) � m and �Fis quasi-concave.
It is obviously reasonable that a SRM should be increasing: if the citationsof a researcher X2 dominate the citations of another researcher X1 publicationby publication, then X2 has a performance greater than X1.Now, we introduce a counterexample in order to show that a SRM is not
in general quasi-convex, that is �F(�X1 + (1 � �)X2) � max(�F(X1); �F(X2))for all � 2 [0; 1]: We consider two researchers, X1 = [8 6 4 2] and X2 =[4 2 2 2 2], where X2 has more publications than X1 but less cited. If wecompute for example the w-index we obtain that �Fw(X1) = 4 and �Fw(X2) = 3,while taking � = 1
2 the SRM �Fw of the combined citation curve X = 12X1 +
12X2 = [6 4 3 2 1] is �Fw(X) = 5.
2.3 Additional properties of SRMs
We have seen that all the SRMs �F share the same structural properties ofmonotonicity and quasiconcavity. We start this section classifying the SRMs onthe basis of the addition of citations to the old papers.
8
De�nition 12 (Additional citation properties) A SRM �F : X+ ! [0;1]is
a) C-superadditive if �F(X +m) � �F(X) +m for all m 2 R+;
b) C-subadditive if �F(X +m) � �F(X) +m for all m 2 R+;
c) C-additive if �F(X +m) = �F(X) +m for all m 2 R+.
A SRM is C-superadditive (C-subadditive) if the additional citations to theold papers lead an increase of the measure more (less) than linear. In otherterms, a C-superadditive SRM gives more weight than the C-subadditive SRMto the additional citations to the oldest papers.We have seen that the SRM �F depends on the family of performance curves
F := ffqgq under consideration. The main feature of this family of curves isthat is increasing monotone over q:We provide a characterization of this familyin terms of the speed in the increase of the performance curves.
De�nition 13 Let F a family of performance curve. We say that:
a) F is slowly increasing in q if fq+m � fq � m for all m 2 R+;
b) F is fast increasing in q if fq+m � fq � m for all m 2 R+;
c) F is linear increasing in q if fq+m � fq = m for all m 2 R+.
These properties of the family of performance curves can be express in termsof corresponding properties of the family AF of performance sets.
Lemma 14 Let F a family of performance curve.
1. F is slowly increasing in q; if and only if
Aq +m � Aq+m (9)
for all m 2 R+ and q 2 I;
2. F is fast increasing in q, if and only if
Aq+m � Aq +m (10)
for all m 2 R+ and q 2 I;
3. F is linear increasing in q, if and only if
Aq+m = Aq +m
for all m 2 R+ and q 2 I;
9
Proof. (1) In order to show that Aq +m � Aq+m we observe that:
Aq+m :=�X 2 X+ j X � fq+m
Aq +m =
�X 2 X+ j X � fq
+m
= fX j X � fq +mg
As fq +m � fq+m, if X is such that X � fq +m then X � fq+m. This meansthat X 2 Aq +m implies that X 2 Aq+m:Regarding the other implication, we know that if X 2 Aq + m then X 2
Aq+m, that is X � fq+m implies X � fq+m. This implies that fq+m � fq+m.(2) By hypothesis we know that fq+m � fq + m. Hence, if X is such
that X � fq+m then X � fq + m. This means that X 2 Aq+m implies thatX 2 Aq +m.Regarding the other side, we know that if X 2 Aq+m then X 2 Aq + m;
that is X � fq+m implies X � fq +m. This implies that fq+m � fq +m.(3) The proof of this point follows directly from the previous ones, observing
that F is linear increasing in q if and only if F is slowly and fast increasing in qand Aq+m = Aq +m if both of the inclusions (9) and (10) hold.
The following lemma shows that the additional citation properties of theSRM �F can be built in from the corresponding properties of the family F ofthe performance curves or AF of performance sets.
Lemma 15 Let F a family of performance curves.
1. If F is slowly increasing in q; then �F is C-superadditive;
2. If F is fast increasing in q; then �F is C-subadditive;
3. If F is linear increasing in q; then �F is C-additive.
Proof. (1) In order to show that �F(X +m)�m � �F(X) for all m 2 R+we use the de�nition in (1) and we observe that
�F(X +m)�m = sup fq 2 I j X +m � fqg �m= sup fq �m 2 I j X � fq �mg= sup fq 2 I j X � fq+m �mg (11)
Hence it�s su¢ cient to show that fq j X � fqg � fq j X � fq+m �mg and thisis true since fq � fq+m �m;(2) In order to show that �F(X +m) �m � �F(X) for all m 2 R+ we use
the de�nition in (1) and the relation (11). Hence it�s su¢ cient to show thatfq j X � fq+m �mg � fq j X � fqg and this is true since fq+m �m � fq;(3) It follows directly from the previous points observing that F is linear
increasing in q if and only if it is slowly and fast increasing in q and that �F isC-additive if and only if it is C-superadditive and C-subadditive.
Now we give some examples using some popular SRMs.
10

Example 16 The h-index in the example (5) is a C-subadditive SRM, but theassociated family F of performance curves de�ned in (6) is fast increasing inq. Indeed the property is true only on [0; q + m] for any m 2 R+ since theperformance curves are equal to zero outside. Hence, the performance curves ofthe h-index are fast increasing only in the Hirsch core.The same considerations hold for the h2- and h�- index (see examples (6)
and (7)).
Example 17 The family F de�ned in 8 of the w-index (see example 8) is slowlyincreasing in q. This condition is su¢ cient to say that the w-index is a C-superadditive SRM.
Example 18 The maximum number of citations of an article (see example 3) isa C-additive SRM, even if the family F of performance curves de�ned in 2 is notlinear increasing in q. This property holds only on [0; 1], since the performancecurves are equal to zero outside.
Example 19 The total number of publications (see example 4) is a C-superadditiveSRM since the family F of performance curves de�ned in 4 is slowly increasingin q.
We now de�ne further properties linked to the addition of a single publicationto the author�s citation curve.
De�nition 20 (Additional paper properties) Let p := max fx : X(x) > 0gthe maximum number of publications with at least one citation of the author X.A SRM �F : X+ ! R+ is
a) P-superadditive if �F(X + 1fp+1g) � �F(X) + 1;
b) P-subadditive if �F(X + 1fp+1g) � �F(X) + 1;
c) P-additive if �F(X + 1fp+1g) = �F(X) + 1;
c) P-invariance if �F(X + 1fp+1g) = �F(X).
A SRM is P-superadditive if the addition of one citation to a new publicationleads to an increase of the measure more than linear. Someway if we use a P-superadditive SRM in our evaluation we are giving more weight to the additionalpublication than in case of P-subadditive SRM. Many known SRMs are P-invariance (i.e. the cmax, h-, h2- and h�-index in the examples (3) (5), (6)and (7)) as the addition of one citation to a new publication leaves the SRMinvariant. The w-index (in the example (8)) is P-subadditive as the addition ofone citation to a new publication makes it greater at most of 1 unit. While thetotal number of publications p with at least one citation (in the example (4)) isclearly P-additive.
11
3 On the Dual Representation of the SRM
The goal of this section is to provide a dual representation of the SRM. To thisscope, we need some topological structure. Let (R;B(R); �) be a probabilityspace, where B(R) is the �-algebra of the Borel sets, � is a probability measureon B(R). Since the citation curve of an author X is a bounded function, itappears natural to take X 2 L1(R;B(R); �), where L1(R;B(R); �) is the spaceof B(R)-measurable functions that are � almost surely bounded. If we endow L1with the weak topology �(L1; L1) then L1 = (L1; �(L1; L1))0 is its topologicaldual. In the dual pairing (L1; L1; h�; �i) the bilinear form h�; �i : L1 � L1 ! Ris given by hX;Zi = E[ZX], the linear function X 7! E[ZX], with Z 2 L1,is �(L1; L1) continuous and (L1; �(L1; L1)) is a locally convex topologicalvector space.We have seen in the Section 1 that the SRM is a quasi-concave and monotone
map. Under appropriate continuity assumptions, the dual representation ofthese type of maps can be found in [PV90],[Vo98], [CMMM].
De�nition 21 A map � : L1(R) ! R is �(L1; L1)�upper-semicontinuous ifthe upper level sets
fX 2 L1(R) j �(X) � qg
are �(L1; L1)�closed for all q 2 R.
Lemma 22 If AF = fAqgq is a family of performance sets then Aq is �(L1; L1)-closed for any q.
Proof. To prove thatAq is �(L1; L1)-closed let Yn 2 Aq := fX 2 L1 j X � fqgsatisfy Yn
�(L1;L1)! Y . By contradiction, suppose that �(A) > 0 where A :=fx 2 R j Y (x) < fq(x)g 2 B(R). Taking as a continuous linear functional Z =1A 2 L1, from Yn
�(L1;L1)! Y we deduce: E[1Afq] � E[1AYn] ! E[1AY ] <E[1Afq].
The following lemma shows the relation between the continuity property ofthe family F of performance curves, those of the family AF of performance setsand those of the SRM �F:
Lemma 23 Let F be a family of performance curves. If F is left continuous inq, that is
fq�"(x) " fq(x) for " # 0; for all x,
then:
1. AF is left-continuous in q, that is
Aq =\�>0
Aq�";
12
2.Aq = fX 2 L1 j �F(X) � qg , for all q 2 I: (12)
3. �F is �(L1; L1)-upper-semicontinuous.
Proof.
1. By assumption we have that fq�"(x) " fq(x) for "! 0, for all x 2 R. Wehave proved in Proposition (11) that fAqg is decreasing monotone, hencewe know that Aq �
T">0
Aq�". By contradiction we suppose that
\">0
Aq�" % Aq;
so that there will exist X 2 L1 such that X � fq�" for every " > 0 butX(A) < fq(A) for some A 2 B(R) such that �(A) > 0. Then there exists� > 0 such that fq(x)�X(x) � � for any x in B � A such that �(B) > 0.Then fq(x)�X(x) > �
2 for any x 2 B. Since fq�" " fq we may �nd " > 0such that fq(x)�fq�"(x) < �
2 for x 2 B. ThusX(x) � fq�"(x) > fq(x)��2
for x 2 B and this is a contradiction
2. Now letBq := fX 2 L1 j �F(X) � qg :
Aq � Bq follows directly from the de�nition of �F: We have to showthat Bq � Aq: Let X 2 Bq. Hence �F(X) � q and for all " > 0 thereexists q such that q + " � q and X(x) � fq(x) for all x 2 R: Sincefq are increasing in q we have that X(x) � fq�"(x) for all x 2 R and" > 0, therefore X 2 Aq�". By the left continuity in q of the family F wehave know that fAqg is left-continuous in q for the previous item and so:X 2
T�>0
Aq�" = Aq.
3. By Lemma (22) we know that Aq is �(L1; L1)�closed for any q andtherefore the upper level sets Bq = Aq are �(L1; L1)�closed and �F is�(L1; L1) upper semicontinuous.
Notice that �(L1; L1)-upper semicontinuity is equal to the continuity fromabove of a SRM. This fact can be proved in a way similar to the convex case(see for example [FS04]).
Lemma 24 Let �F : L1 ! R+ be a SRM. Then the following are equivalent:
�F is �(L1; L1)-upper semicontinuous;
�F is continuous from above: Xn; X 2 L1 and Xn # X imply �F(Xn) # �F(X)
Proof. Let �F be �(L1; L1)-upper semicontinuous and suppose that Xn #
X. As the elements in L1 are order continuous, we also have: Xn�(L1;L1)�! X.
13

The monotonicity of �F implies �F(Xn) # and q := limn �F(Xn) � �F(X).Hence �F(Xn) � q and Xn 2 Bq := fY 2 L1 j �F(Y ) � qg which is closedby assumption. Hence X 2 Bq; which implies that �F(X) = q and that �F iscontinuous from above.Conversely, suppose that �F is continuous from above. We have to show
that the convex set Bq is �(L1; L1)-closed for any q. By the Krein SmulianTheorem it is su¢ cient to prove that C := Bq \ fX 2 L1 j k X k1< rg is�(L1; L1)-closed for any �xed r > 0 and q 2 R. As C � L1 � L1 and as theembedding
(L1; �(L1; L1)) ,! (L1; �(L1; L1))
is continuous it is su¢ cient to show that C is �(L1; L1)-closed. Since the�(L1; L1) topology and the L1 norm topology are compatible, and C is convex,it is su¢ cient to prove that C is closed in L1. Take Xn 2 C such that Xn ! Xin L1. Then there exists a subsequence fYngn � fXngn such that Yn ! Xa.s. and �F(Yn) � q for all n. Set Zm := supn�m Yn _ X. Then Zm 2 L1,since fYngn is uniformly bounded; and Zm � Ym, �F(Zm) � �F(Ym) and Zm #X. From the continuity from above we conclude: �F(X) = limm �F(Zm) �lim supm �F(Ym) � q. Thus X 2 Bq and consequently X 2 C:
When the family of performance curves F is left continuous, Lemma (23)shows that the SRM is �(L1; L1)-upper semicontinuous. Hence we can providea dual representation for the SRM in the same spirit of [Vo98] and [DK10].Denote
P := fQ� Pg and Z :=�Z =
dQ
dPj Q 2 P
�=�Z 2 L1+ j E[Z] = 1
Theorem 25 Suppose that the family of performance curves F is left contin-uous. Each SRM �F : L
1(R;B(R); �) ! R de�ned in (1) can be representedas
�F(X) = infZ2Z
H(Z;E[ZX]) = infZ2Z
H+(Z;E[ZX]) (13)
= infQ2P
H+(Q;EQ[X]) for all X 2 L1
where H : L1 � R! R is de�ned by
H(Z; t) := sup�2L1
f�F(�) j E[�Z] � tg ;
H+(Z; �) is its right continuous version:
H+(Z; t) := infs>tH(Z; s) = sup fq 2 R j t � (Z; q)g ; (14)
and : L1 � R! R is de�ned by:
(Z; q) := infX2L1
fE[ZX] j �F(X) � qg : (15)
14
Proof. Step 1: �F(X) = infZ2Z H(Z;E[ZX]):Fix X 2 L1. As X 2 f� 2 L1 j E[Z�] � E[ZX]g, by the de�nition of
H(Z; t) we deduce that, for all Z 2 L1;
H(Z;E[ZX]) � �F(X)
henceinfZ2L1
H(Z;E[ZX]) � �F(X):
We prove the opposite inequality. Let " > 0 and de�ne the set
C" := f� 2 L1 j �F(�) � �F(X) + "g
As �F is quasi-concave and �(L1; L1)-upper semicontinuous, C is convex and
�(L1; L1)�closed. Since X =2 C", the Hahn Banach theorem implies the exis-tence of a continuous linear functional that strongly separates X and C"; thatis there exist k 2 R and Z" 2 L1 such that
E[�Z"] > k > E[XZ"] for all � 2 C":
Hence
f� 2 L1 j E[�Z"] � E[XZ"]g � Cc" := f� 2 L1 j �F(�) < �F(X) + "g
and
�F(X) � infZ2L1
H(Z;E[ZX]) � H(Z"; E[XZ"])
= sup f�F(�) j � 2 L1 and E[�Z"] � E[XZ"]g� sup f�F(�) j � 2 L1 and �F(�) < �F(X) + "g � �F(X) + ":
Therefore, �F(X) = infZ2L1 H(Z;E[ZX]). To show that the inf can be takenover the positive cone L1+, it is su¢ cient to prove that Z" � L1+. Let Y 2 L1+and � 2 C": Given that �F is monotone increasing, �+nY 2 C" for every n 2 Nand we have:
E[(� + nY )Z"] > k > E[XZ"]) E[Y Z"] >E[Z"(X � �)]
n! 0; as n!1:
As this holds for any Y 2 L1+ we deduce that Z" � L1+. Therefore, �F(X) =infZ2L1+ H(Z;E[ZX]).By de�nition of H(Z; t),
H(Z;E[ZX]) = H(�Z;E[X(�Z)]) 8Z 2 L1 and Z 6= 0:
Hence we deduce
�F(X) = infZ2L1+(R)
H(Z;E[ZX]) = infZ2Z
H(Z;E[ZX]) = infQ2P
H(Q;EQ[X]):
15
Step 2: �F(X) = infZ2Z H+(Z;E[ZX]):
Since H(Z; �) is increasing and Z 2 L1+ we obtain
H+(Z;E[ZX]) := infs>E[ZX]
H(Z; s) � limXm#X
H(Z;E[XmZ]);
�F(X) = infZ2L1+
H(Z;E[ZX]) � infZ2L1+
H+(Z;E[ZX]) � infZ2L1+
limXm#X
H(Z;E[XmZ])
= limXm#X
infZ2L1+
H(Z;E[XmZ]) = limXm#X
�F(Xm)(CFA)= �F(X):
Step 3: H+(Z; t) := infs>tH(Z; s) = sup fq 2 R j t � (Z; q)g :Now let the RHS of equation (14) be denoted by
S(Z; t) := sup fq 2 R j (Z; q) � tg ; (Z; t) 2 L1 � R; (16)
and note that S(Z; �) is the right inverse of the increasing function (Z; �) andtherefore S(Z; �) is right continuous.To prove that H+(Z; t) � S(Z; t) it is su¢ cient to show that for all p > t wehave:
H(Z; p) � S(Z; p); (17)
Indeed, if (17) is true
H+(Z; t) = infp>t
H(Z; p) � infp>t
S(Z; p) = S(Z; t);
as both H+ and S are right continuous in the second argument.Writing explicitly the inequality (17)
sup�2L1
f�F(�) j E[�Z] � pg � sup fq 2 R j (Z; q) � pg
and letting � 2 L1 satisfying E[�Z] � p, we see that it is su¢ cient to show theexistence of q 2 R such that (Z; q) � p and q � �F(�). If �F(�) = 1 then (Z; q) � p for any q and therefore S(Z; p) = H(Z; p) =1.Suppose now that 1 > �F(�) > �1 and de�ne q := �F(�): As E[�Z] � p
we have: (Z; q) := inf fE[�Z] j �F(�) � qg � p:
Then q 2 R satis�es the required conditions.To obtain H+(Z; t) := infp>tH(Z; p) � S(Z; t) it is su¢ cient to prove that,
for all p > t; H(Z; p) � S(Z; t), that is :
sup�2L1
f�F(�) j E[�Z] � pg � sup fq 2 R j (Z; q) � tg : (18)
Fix any p > t and consider any q 2 R such that (Z; q) � t. By the de�nitionof , for all " > 0 there exists �" 2 L1 such that �F(�") � q and E[�"Z] � t+ ":Take " such that 0 < " < p � t. Then E[�"Z] � p and �F(�") � q and (18)follows.
16

Remark 26 This dual representation provides an interesting interpretation ofthe SRM. Let Q be the �weight�that we can assign to the author�s publications(for example, the impact factor of the Journal where the article is published).For a �xed Q; the term (Q; q) := inf fEQ[�] j �F(�) � qg represents the smallestQ-average of citations that a generic author needs in order to have the SRM atleast of q. We observe that this term is independent from the citations of theauthor X:On the light of these considerations we can interpret the term H+(Q;EQ[X]) :=
sup fq 2 R j EQ[X] � (Q; q)g as the greatest performance level that the authorX can reach, in the case that we attribute the weight Q to the publications.Namely, we compare the Q-average of the author X, EQ[X], with the minimumQ-average necessary to reach each level q, that is (Q; q).Finally, the SRM of the author X; �F(X) = infQ2P H
+(Q;EQ[X]), corre-sponds to the smallest performance level obtained changing the weight attributedto the journals.The theorem exhibits the relationship between the performance curve ap-
proach and this average approach.
In the following examples we �nd the dual representation of some existing in-dices. In all these examples the family F of performance curves is left continuoushence, by Lemma (23), the associated SRM �F is �(L
1; L1)-upper semicontin-uous and X satis�es: �F(X) � q i¤ X 2 Aq i¤ X � fq: Therefore, we �nd thedual representation computing ; H+ and �F applying the formulas: (15),(14)and (13). Recall that X =
Ppi=1 xi1(i�1;i] , with xi � xi+1 for all i.
Example 27 (max # of citations) Consider the example (3). For Z 2 L1+;we compute (Z; q)
(Z; q) := inf�Fcmax
(X)�qE[ZX] = inf
X(x)�q1(0;1](x)E[ZX] = qE[1(0;1]Z]
where the �rst equality is due to (12). We obtain
H+(Z;E[ZX]) := sup�q 2 R j E[ZX] � qE[1(0;1]Z]
=
E[ZX]
E[1(0;1]Z]:
In our application, any non zero citation vector X always satis�es X � x11(0;1]and, since E[X1(0;1]] = x1E[1(0;1]]; we also have:
1(0;1]E[1(0;1]]
� XE[X1(0;1]]
. There-fore,
E
�Z
1(0;1]
E[1(0;1]]
�� E
�Z
X
E[X1(0;1]]
�8Z 2 L1+(R)
andE [ZX]
E�Z1(0;1]
� � E[1(0;1]X]
E[1(0;1]]8Z 2 L1+(R):
17
Hence:
�Fcmax(X) = inf
Z2L1+(R)H+(Z;E[ZX]) = inf
Z2L1+(R)
E[ZX]
E[Z1(0;1]]
=E[1(0;1]X]
E[1(0;1]1(0;1]];
i.e. the in�mum is attained at Z = 1(0;1] 2 L1+, which is of course natural asthis SRM weights only to the �rst publication.
Example 28 (total # of publications) Consider the example (4). For Z 2L1+; we compute (Z; q) as in the previous example:
(Z; q) = infX�1(0;q]
E[ZX] = E[1(0;q]Z]
We obtain
H+(Z;E[ZX]) := sup�q 2 R j E[ZX] � E[1(0;q]Z]
Hence the dual representation of the total number of publications p with at leastone citation is
�Fp(X) = infZ2L1+(R)
supE[ZX]�E[1[0;q]Z]
q
We show indeed that �Fp(X) = p, where p is such that X = X1(0;p] 2 L1+ . Firstwe check that �Fp(X) � p. For all Z 2 L
1+; and q � p we have
E[ZX] = E[ZX1(0;p]] � E[1(0;q]Z]
and thereforesup
E[ZX]�E[1(0;q]Z]q � p 8Z 2 L1+;
and �Fp(X) � p. Regarding the � inequality, it is enough to take Z = 1(p;p+�],with � > 0; for X = X1(0;p]. In this case, the condition E[ZX] � E[1(0;q]Z]becomes
0 = E[1(p;p+�]X] � E[1(0;q]1(p;p+�]]
that holds only for q � p, hence
supE[X1(p;p+�]]�E[1(0;q]1(p;p+�]]
q = p
and �Fp(X) � p.
Example 29 (h-index) Consider the example (5). For Z 2 L1+;
(Z; q) = infX(x)�q1(0;q](x)
E[ZX] = E[Zq1(0;q]]
18
We obtain
H+(Z;E[ZX]) := sup�q 2 R j E[ZX] � E[Zq1(0;q]]
Hence the dual representation of the h-index is
�Fh(X) = infZ2L1+(R+)
supE[ZX]�E[Zq1(0;q]]
q
We indeed show that �Fh(X) = h, where h is such that X1(0;h] � h1(0;h] andX1(h;+1) � h1(h;+1). First we check that �Fh(X) � h. For all Z 2 L1+; andq � h we have
E[ZX] � E[ZX1(0;h]] � E[Zq1(0;q]];
hencesup
E[ZX]�E[q1(0;q]Z]q � h 8Z 2 L1+
and �Fh(X) � h.Regarding the � side, take Z = 1(h;h+�] with � > 0. For any q � h the
conditionE[X1(h;h+�]] � E[q1(0;q]1(h;h+�]] = 0
holds. Instead, 8q > h there exists � > 0 such that h+ � < q and then
E[X1(h;h+�]] � E[h1(h;h+�]] < E[q1(0;q]1(h;h+�]]
hencesup
E[X1(h;h+�]]�E[q1(0;q]1(h;h+�]]q � h
and �Fh(X) � h.
3.1 On an alternative approach to SRMs
The dual representation suggests us another approach for the de�nition of ageneric class of SRMs. This approach is based on the assumption that we canrepresent the author�s citation as a function X(w) de�ned on the events w 2 ,where each event now corresponds to the journal in which the paper appeared.We start �xing a plausible family P � fQ� Pg where each Q(w) represents
the �value� attributed to the journal w 2 . It is clear that the valuationcriterion for journals (i.e. the selection of the family P) has to be determined apriori and could be based on the �impact factor� or other criterion. A speci�cQ could attribute more importance to the journals with a large number ofcitations (a large impact factor); another particular Q to the journals having ahigh quality.As suggested from the dual representation results and in particular from the
equations (13) and (14) we consider, independently to the particular scientistX, a family
� ��2R of functions � : P ! R that associate to each Q the
19
value �(Q), that should represent the smallest Q-average of citations in orderto reach a quality index at least of �.So given a particular value Q(wi) for each ith-journal and the average cita-
tions �(Q) necessary to have an index level greater than �, we build the SRMin the following way. We de�ne the function H+ : P � R ! R that associatesto each pair (Q;EQ(X)) the number
H+(Q;EQ(X)) := sup�� 2 R j EQ(X) � �(Q)
;
which represents the greatest quality index that the author X can reach whenQ is �xed, and we build the SRM as follows:
�(X) := infQ2P
H+(Q;EQ(X))
which represents a prudential and robust approach with respect to P, the plau-sible di¤erent selections of the evaluation of the Journals: This SRM is by con-struction quasi-concave and monotone increasing.
4 Empirical results
Since the SRM introduced in Section 2 depend on the particular family F ofperformance curves, in this section we provide a procedure to calibrate thefamily F from the historic data available for one particular scienti�c area andseniority. In this way, each SRM will �t appropriately the characteristics ofthe research �eld and seniority under consideration. The SRM should be usedonly in relative terms (to compare the author quality with respect to the otherresearchers in the same area) in order to classify the authors (and structures)into few classes of homogeneous research quality.
4.1 Sample setting
The �rst step consists in the selection of a representative sample of M authorsin the same scienti�c area and with the same seniority.If p is the total number of the author�s publications with at least one citation,
then X =Pp
i=1 xi1(i�1;i], with xi � xi+1 for all i, where the �rst component x1corresponds to the number of citations received by the most cited article andsimilarly for x1 � x2 � ::: � xp.The citation data of each author are downloaded from Google Scholar by a
procedure implemented in Pyton. This procedure performs a �lter on the nameof the author and on the scienti�c area we are analyzing.
4.2 Determination of the family ffqgq and of the SRMFirst of all we need to determine the family of curves ffqgq that better representsthe citation curve of the sample of the selected scientists. By the analysis of
20
the data we found that the theoretical model is the following hyperbole-typeequation:
y = fq(x) =q
x�(19)
with q; � 2 R+. Setting ln y = Y , ln(q) = q̂; lnx = X, � = �̂ we obtain thelinearized model
Y = q̂ � �̂X. (20)
For each i-th author of the sample we determine �̂i that minimizes the sumof the square distances of the points from the line (20). Fixing the parameter��, we obtain the �-index of each author X as
�(X) = sup
�q 2 R j X(x) � q
x��8x�
(21)
4.3 Our Results
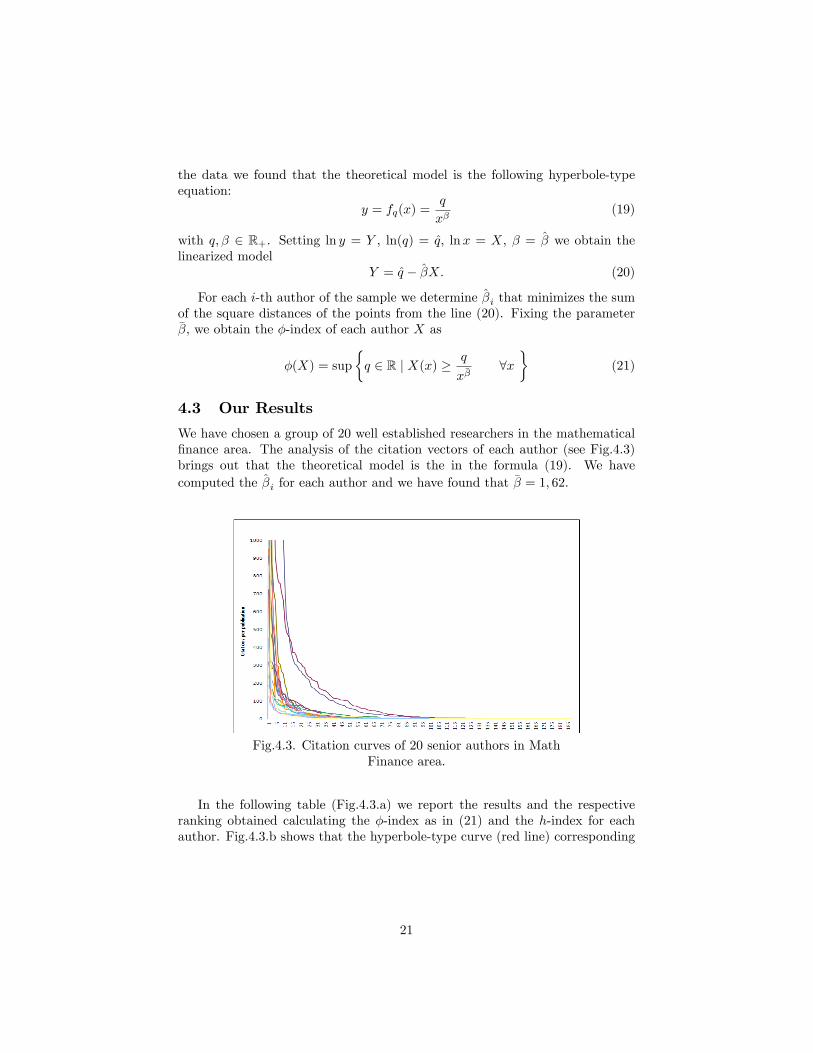
We have chosen a group of 20 well established researchers in the mathematical�nance area. The analysis of the citation vectors of each author (see Fig.4.3)brings out that the theoretical model is the in the formula (19). We havecomputed the �̂i for each author and we have found that �� = 1; 62.
Fig.4.3. Citation curves of 20 senior authors in MathFinance area.
In the following table (Fig.4.3.a) we report the results and the respectiveranking obtained calculating the �-index as in (21) and the h-index for eachauthor. Fig.4.3.b shows that the hyperbole-type curve (red line) corresponding
21
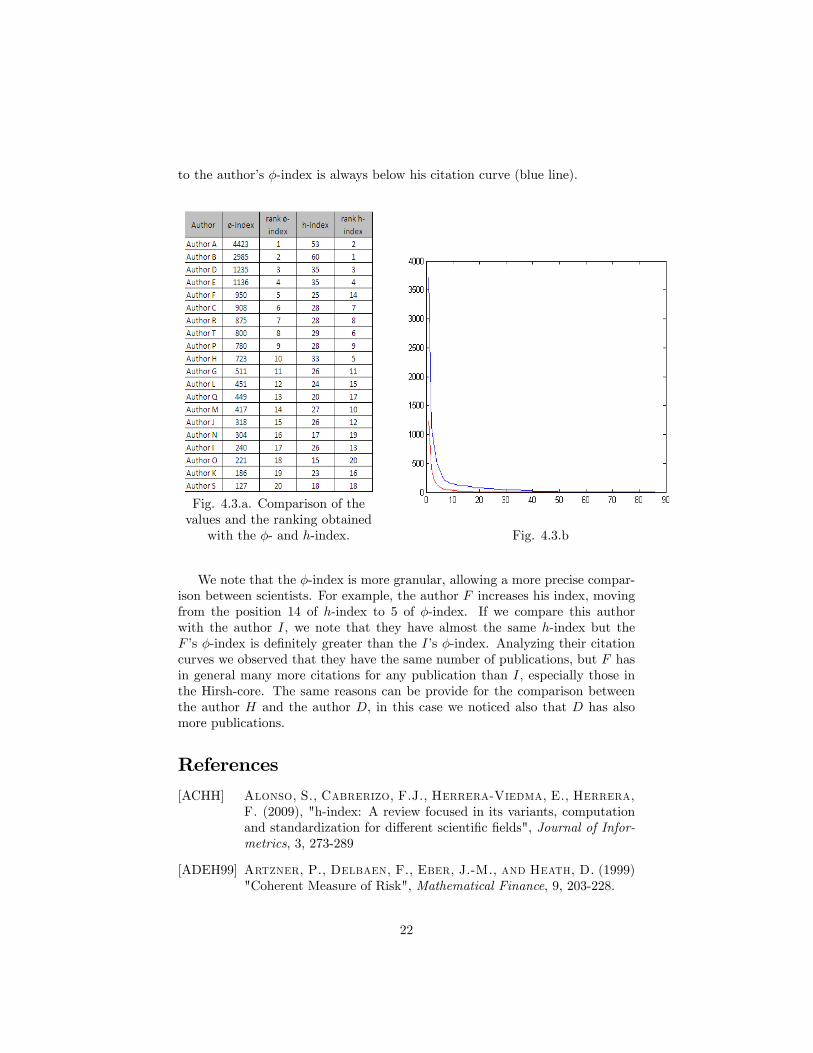
to the author�s �-index is always below his citation curve (blue line).
Fig. 4.3.a. Comparison of thevalues and the ranking obtained
with the �- and h-index. Fig. 4.3.b
We note that the �-index is more granular, allowing a more precise compar-ison between scientists. For example, the author F increases his index, movingfrom the position 14 of h-index to 5 of �-index. If we compare this authorwith the author I, we note that they have almost the same h-index but theF�s �-index is de�nitely greater than the I�s �-index. Analyzing their citationcurves we observed that they have the same number of publications, but F hasin general many more citations for any publication than I, especially those inthe Hirsh-core. The same reasons can be provide for the comparison betweenthe author H and the author D, in this case we noticed also that D has alsomore publications.
References
[ACHH] Alonso, S., Cabrerizo, F.J., Herrera-Viedma, E., Herrera,F. (2009), "h-index: A review focused in its variants, computationand standardization for di¤erent scienti�c �elds", Journal of Infor-metrics, 3, 273-289
[ADEH99] Artzner, P., Delbaen, F., Eber, J.-M., and Heath, D. (1999)"Coherent Measure of Risk", Mathematical Finance, 9, 203-228.
22
[BD07] Bornmann, L., Daniel, H. (2007) "What do we know about theh-index?", Journal of the American Society for Information Scienceand Technology, 58(9), 1381�1385.
[CIT] Adler, R., Ewing, J., Taylor, P. (2008) �Citation Statistics�,http://www.mathunion.org/�leadmin/IMU/Report/CitationStatistics.pdf.
[CM09] Cherny, A. and Madan, D. (2009) "New measures for perfor-mance evaluation", Review of Financial Studies, 22, 2571-2606.
[CMMM] Cerreia-Vioglio, S., Maccheroni, F., Marinacci, M. andMontrucchio, L. (2011a) "Risk measures: rationality and diver-si�cation", Mathematical Finance, 21, 743-774.
[DK10] Drapeau, S. and Kupper, M. (2010) �Risk preferences and theirrobust representation�, preprint.
[EW06] Eck, N. V., Waltman, L. (2008) "Generalizing the h- and g-indices" Journal of Informetrics, 2(4), 263�271.
[FS02] Follmer, H., and Schied, A. (2002) "Convex measures of riskand trading constraints", Finance and Stochastics, 6, 429-447.
[FS04] Follmer and Schied (2004) "Stochastic Finance. An Introductionin Discrete Time", 2nd ed., de Gruyter Studies in Mathematics, 27.
[FM11] Frittelli, M. and Maggis, M. (2011) "Dual representation ofquasiconvex conditional maps", SIAM J. Financial Math, Vol 2, pp357-382
[FR02] Frittelli, M., and Rosazza Gianin, E. (2002) �Putting orderin risk measures�, Journal of Banking and Finance, 26, 1473�1486.
[GR09] Guns, R., Rousseau, R. (2009) "Real and rational variants of theh-index and the g-index", Journal of Informetrics, 3, 64�71.
[H05] Hirsch, J. E. (2005) "An index to quantify an individual�s scienti�cresearch output", Proceedings of the National Academy of Sciencesof the United States of America, 102 (46), 16569�16572.
[K06] Kosmulski, M. (2006) "A new Hirsch-type index saves time andworks equally well as the original h-index", ISSI Newsletter, 2(3),4�6.
[PV90] Penot, J.P. and Volle, M. (1990) �On Quasi-Convex Duality�,Mathematics of Operations Research, Vol.15(4), 597-625 .
[RT08] Ruane, F., and Tol, R. (2008) "Rational (successive) h-indices:An application to economics in the Republic of Ireland", Sciento-metrics, 75(2), 395�405.
23
[S08] Schreiber, M. (2008), "To share the fame in a fair way, hm formulti-authored manuscripts", New Journal of Physics, 10(040201),1�9.
[Vo98] Volle, M. (1998) �Duality for the level sum of quasiconvex func-tions and applications�, Control, Optimisation and Calculus of vari-ations, Vol.3, 329-343.
[W0308] Woeginger, G. J. (Mar 2008) "An axiomatic characterization ofthe Hirsch-index", Mathematical Social Sciences, 56, 224�232.
24