Luxottica: i risultati del terzo trimestre confermano …...Q3 2012 a cambi correnti Variazione a...
23
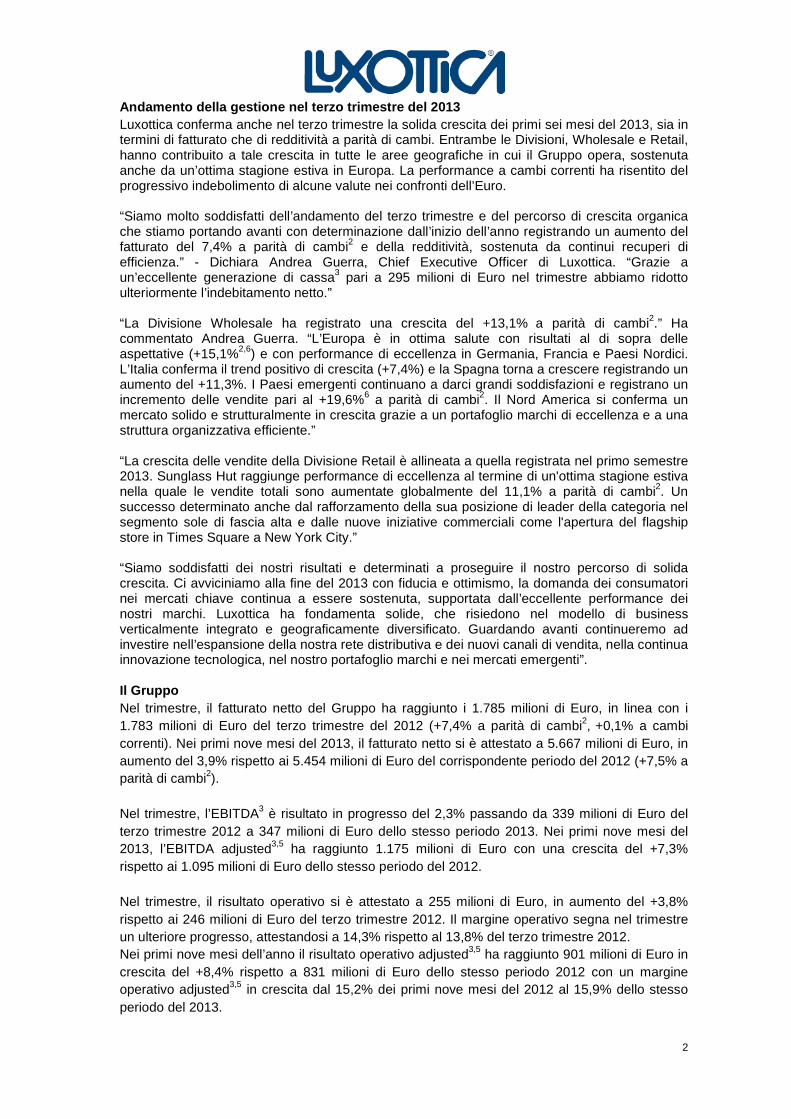
1 Comunicato stampa Luxottica: i risultati del terzo trimestre confermano la solida crescita del Gruppo Fatturato netto a Euro 1,8 miliardi (+7,4% a parità di cambi 2 ) Generazione di cassa 3 record a Euro 295 milioni Milano (Italia), 29 ottobre 2013 – Il Consiglio di Amministrazione di Luxottica Group S.p.A. (MTA: LUX; NYSE: LUX), leader nel design, produzione, distribuzione e vendita di occhiali di fascia alta, di lusso e sportivi, riunitosi oggi, ha approvato i risultati consolidati del terzo trimestre e dei primi nove mesi chiusi il 30 settembre 2013 secondo i principi contabili IAS/IFRS. Terzo trimestre 2013 1 (milioni di Euro) Q3 2013 a cambi correnti Q3 2012 a cambi correnti Variazione a cambi costanti 2 Variazione a cambi correnti Fatturato 1.785 1.783 7,4% 0,1% Divisione Wholesale 686 647 13,1% 6,1% Divisione Retail 1.099 1.137 4,2% -3,3% Utile operativo 255 246 3,8% Utile netto attribuibile al Gruppo 148 137 7,9% Utile per azione 0,31 0,29 6,2% Utile per azione in US$ 0,41 0,37 12,5% Primi nove mesi 2013 1 (milioni di Euro) 9M 2013 a cambi correnti 9M 2012 a cambi correnti Variazione a cambi costanti 2 Variazione a cambi correnti Fatturato 5.667 5.454 7,5% 3,9% Divisione Wholesale 2.347 2.162 12,1% 8,6% Divisione Retail 3.320 3.292 4,5% 0,8% Utile operativo 892 809 10,2% Adjusted 3,5 901 831 8,4% Utile netto attribuibile al Gruppo 519 459 12,9% Adjusted 3,5 525 475 10,5% Utile per azione 1,10 0,99 11,1% Adjusted 3,5 1,11 1,02 8,8% Utile per azione in US$ 1,45 1,27 14,2% Adjusted 3,5 1,46 1,31 11,8%
Transcript of Luxottica: i risultati del terzo trimestre confermano …...Q3 2012 a cambi correnti Variazione a...
1
Comunicato stampa
Luxottica: i risultati del terzo trimestre conferma no la solida crescita del Gruppo
Fatturato netto a Euro 1,8 miliardi (+7,4% a parità di cambi2) Generazione di cassa3 record a Euro 295 milioni
Milano (Italia), 29 ottobre 2013 – Il Consiglio di Amministrazione di Luxottica Group S.p.A. (MTA: LUX; NYSE: LUX), leader nel design, produzione, distribuzione e vendita di occhiali di fascia alta, di lusso e sportivi, riunitosi oggi, ha approvato i risultati consolidati del terzo trimestre e dei primi nove mesi chiusi il 30 settembre 2013 secondo i principi contabili IAS/IFRS. Terzo trimestre 2013 1
(milioni di Euro)
Q3 2013 a cambi correnti
Q3 2012 a cambi correnti
Variazione a cambi
costanti 2
Variazione a cambi correnti
Fatturato 1.785 1.783 7,4% 0,1%
Divisione Wholesale 686 647 13,1% 6,1%
Divisione Retail 1.099 1.137 4,2% -3,3%
Utile operativo
255 246
3,8%
Utile netto attribuibile al Gruppo
148 137
7,9%
Utile per azione
0,31 0,29
6,2%
Utile per azione in US$
0,41 0,37 12,5% Primi nove mesi 2013 1
(milioni di Euro)
9M 2013 a cambi correnti
9M 2012 a cambi correnti
Variazione a cambi costanti 2
Variazione a cambi correnti
Fatturato 5.667 5.454 7,5% 3,9%
Divisione Wholesale 2.347 2.162 12,1% 8,6%
Divisione Retail 3.320 3.292 4,5% 0,8%
Utile operativo 892 809
10,2%
Adjusted 3,5 901 831
8,4%
Utile netto attribuibile al Gruppo 519 459
12,9%
Adjusted 3,5 525 475
10,5%
Utile per azione 1,10 0,99
11,1%
Adjusted 3,5 1,11 1,02
8,8%
Utile per azione in US$
1,45 1,27 14,2%
Adjusted 3,5 1,46 1,31 11,8%
2
Andamento della gestione nel terzo trimestre del 20 13 Luxottica conferma anche nel terzo trimestre la solida crescita dei primi sei mesi del 2013, sia in termini di fatturato che di redditività a parità di cambi. Entrambe le Divisioni, Wholesale e Retail, hanno contribuito a tale crescita in tutte le aree geografiche in cui il Gruppo opera, sostenuta anche da un’ottima stagione estiva in Europa. La performance a cambi correnti ha risentito del progressivo indebolimento di alcune valute nei confronti dell’Euro. “Siamo molto soddisfatti dell’andamento del terzo trimestre e del percorso di crescita organica che stiamo portando avanti con determinazione dall’inizio dell’anno registrando un aumento del fatturato del 7,4% a parità di cambi2 e della redditività, sostenuta da continui recuperi di efficienza.” - Dichiara Andrea Guerra, Chief Executive Officer di Luxottica. “Grazie a un’eccellente generazione di cassa3 pari a 295 milioni di Euro nel trimestre abbiamo ridotto ulteriormente l’indebitamento netto.” “La Divisione Wholesale ha registrato una crescita del +13,1% a parità di cambi2.” Ha commentato Andrea Guerra. “L’Europa è in ottima salute con risultati al di sopra delle aspettative (+15,1%2,6) e con performance di eccellenza in Germania, Francia e Paesi Nordici. L’Italia conferma il trend positivo di crescita (+7,4%) e la Spagna torna a crescere registrando un aumento del +11,3%. I Paesi emergenti continuano a darci grandi soddisfazioni e registrano un incremento delle vendite pari al +19,6%6 a parità di cambi2. Il Nord America si conferma un mercato solido e strutturalmente in crescita grazie a un portafoglio marchi di eccellenza e a una struttura organizzativa efficiente.” “La crescita delle vendite della Divisione Retail è allineata a quella registrata nel primo semestre 2013. Sunglass Hut raggiunge performance di eccellenza al termine di un'ottima stagione estiva nella quale le vendite totali sono aumentate globalmente del 11,1% a parità di cambi2. Un successo determinato anche dal rafforzamento della sua posizione di leader della categoria nel segmento sole di fascia alta e dalle nuove iniziative commerciali come l'apertura del flagship store in Times Square a New York City.” “Siamo soddisfatti dei nostri risultati e determinati a proseguire il nostro percorso di solida crescita. Ci avviciniamo alla fine del 2013 con fiducia e ottimismo, la domanda dei consumatori nei mercati chiave continua a essere sostenuta, supportata dall’eccellente performance dei nostri marchi. Luxottica ha fondamenta solide, che risiedono nel modello di business verticalmente integrato e geograficamente diversificato. Guardando avanti continueremo ad investire nell’espansione della nostra rete distributiva e dei nuovi canali di vendita, nella continua innovazione tecnologica, nel nostro portafoglio marchi e nei mercati emergenti”. Il Gruppo Nel trimestre, il fatturato netto del Gruppo ha raggiunto i 1.785 milioni di Euro, in linea con i 1.783 milioni di Euro del terzo trimestre del 2012 (+7,4% a parità di cambi2, +0,1% a cambi correnti). Nei primi nove mesi del 2013, il fatturato netto si è attestato a 5.667 milioni di Euro, in aumento del 3,9% rispetto ai 5.454 milioni di Euro del corrispondente periodo del 2012 (+7,5% a parità di cambi2). Nel trimestre, l’EBITDA3 è risultato in progresso del 2,3% passando da 339 milioni di Euro del terzo trimestre 2012 a 347 milioni di Euro dello stesso periodo 2013. Nei primi nove mesi del 2013, l’EBITDA adjusted3,5 ha raggiunto 1.175 milioni di Euro con una crescita del +7,3% rispetto ai 1.095 milioni di Euro dello stesso periodo del 2012. Nel trimestre, il risultato operativo si è attestato a 255 milioni di Euro, in aumento del +3,8% rispetto ai 246 milioni di Euro del terzo trimestre 2012. Il margine operativo segna nel trimestre un ulteriore progresso, attestandosi a 14,3% rispetto al 13,8% del terzo trimestre 2012. Nei primi nove mesi dell’anno il risultato operativo adjusted3,5 ha raggiunto 901 milioni di Euro in crescita del +8,4% rispetto a 831 milioni di Euro dello stesso periodo 2012 con un margine operativo adjusted3,5 in crescita dal 15,2% dei primi nove mesi del 2012 al 15,9% dello stesso periodo del 2013.
3
L’utile netto del terzo trimestre del 2013 registra un incremento del 7,9% attestandosi a 148 milioni di Euro rispetto a 137 milioni di Euro nel terzo trimestre del 2012, corrispondenti ad un EPS (utile per azione) di Euro 0,31. L’EPS in dollari si è attestato a USD 0,41 in crescita del 12,5% (con un cambio medio Euro/USD pari a 1,3242). Nei primi nove mesi del 2013, l’utile netto adjusted3,5 è pari a 525 milioni di Euro, in crescita del 10,5% rispetto ai 475 milioni di Euro dello stesso periodo del 2012. Nel terzo trimestre 2013 il Gruppo ha raggiunto un nuovo record in termini di generazione di cassa3 che è stata pari a 295 milioni di Euro. Questo risultato ha consentito di ridurre ulteriormente l’indebitamento netto a 1.572 milioni di Euro al 30 settembre 2013 (1.662 milioni di Euro al 31 dicembre 2012), con un rapporto indebitamento netto/LTM adjusted EBITDA3,5 pari a 1,1x. Divisione Wholesale L’andamento delle vendite Wholesale nel trimestre conferma una crescita a doppia cifra a parità di cambi. L’Europa è stata particolarmente favorita dalla ottima stagione estiva (+15,1%6 a parità di cambi2) e i mercati emergenti hanno continuato a registrare risultati di eccellenza (+19,6%6 a parità di cambi2). Il fatturato in Nord America è cresciuto del +8,8%2,6 in USD escludendo il calo delle vendite di Oakley all’esercito americano. Nel terzo trimestre 2013, il fatturato netto della Divisione Wholesale si attesta a 686 milioni di Euro, in crescita del 6,1% rispetto ai 647 milioni di Euro del terzo trimestre del 2012 (+13,1% a parità di cambi2). Nei nove mesi, il fatturato netto è pari a 2.347 milioni di Euro rispetto a 2.162 milioni di Euro del corrispondente periodo del 2012 in progresso dell’8,6% (+12,1% a parità di cambi2). Il risultato operativo del terzo trimestre 2013 si è attestato a 134 milioni di Euro, in aumento del 7,1% rispetto a 125 milioni di Euro del terzo trimestre 2012, con un margine operativo pari a 19,5% (19,3% nello stesso periodo dell’anno precedente). Nei primi nove mesi del 2013, il risultato operativo adjusted3 è salito a 5645 milioni di Euro rispetto a 505 milioni di Euro, con un incremento dell’11,6%5 rispetto al corrispondente periodo del 2012. Il margine operativo adjusted3 è aumentato al 24,0%5 dal 23,4% nello stesso periodo del 2012. Divisione Retail Nel trimestre, le vendite omogenee4 della Divisione hanno registrato una crescita del 2,5% rispetto allo stesso periodo del 2012. LensCrafters, la più grande catena specializzata nel segmento vista, ha conseguito un miglioramento della redditività, a parità di vendite omogenee4, rispetto al terzo trimestre del 2012. Sunglass Hut ha proseguito nel suo trend di crescita eccellente sostenuto dalla maggior penetrazione nel segmento premium e lusso, dallo sviluppo di nuovi canali distributivi come l'e-commerce e i department store e da una crescente concentrazione nelle cosiddette gateway e megacity. Le vendite omogenee4 sono aumentate del +7,5% a livello globale, con performance di assoluto rilievo nel Regno Unito, nei Paesi emergenti e in Nord America dove ha registrato un incremento del +6,3%. Nel trimestre, il fatturato netto della Divisione si è attestato a 1.099 milioni di Euro rispetto ai 1.137 milioni di Euro dello stesso periodo 2012 (+4,2% a parità di cambi2, -3,3% a cambi correnti). Nei nove mesi il fatturato netto è aumentato a 3.320 milioni di Euro dai 3.292 milioni di Euro del corrispondente periodo del 2012 (+4,5% a parità di cambi2, +0,8% a cambi correnti). Nel terzo trimestre il risultato operativo si è attestato a 165 milioni di Euro rispetto a 166 milioni di Euro dello stesso periodo 2012 (pari a -0,7%). Nel trimestre, il margine operativo è aumentato
4
al 15,0% dal 14,6% dello stesso trimestre del 2012. Nei primi nove mesi del 2013, il risultato operativo adjusted3 della Divisione è passato a 477 milioni di Euro da 4615 milioni di Euro del corrispondente periodo del 2012 (pari a +3,5%5). Il margine operativo adjusted3 nei nove mesi del 2013 è stato pari a 14,4% (14,0%5 nello stesso periodo del 2012).
§
I risultati del terzo trimestre e dei primi nove mesi del 2013 saranno illustrati oggi a partire dalle ore 18:30 CET nel corso di una conference call con la comunità finanziaria. La presentazione sarà disponibile in webcast in diretta sul sito Internet www.luxottica.com. Il Dirigente Preposto alla redazione dei documenti contabili societari Enrico Cavatorta dichiara ai sensi del comma 2 articolo 154 bis del Testo Unico della Finanza che l’informativa contabile contenuta nel presente comunicato corrisponde alle risultanze documentali, ai libri e alle scritture contabili. Luxottica Group – Contatti Cristina Parenti Group Corporate Communication and Public Relations Director Tel.: +39 (02) 8633 4683 E-mail: [email protected]
Alessandra Senici Group Investor Relations Director Tel.: +39 (02) 8633 4870 E-mail: [email protected]
Ana Iris Reece Group Financial and Corporate Press Office Manager Tel.: +39 (02) 8633 4912 E-mail: [email protected]
Note al comunicato stampa 1 Tutti i confronti, incluse le variazioni percentuali, si riferiscono ai tre e ai nove mesi terminati il 30 settembre 2013. A partire dal 1 gennaio 2013 il Gruppo ha adottato lo IAS 19 revised “Employee benefits”. I risultati del Gruppo nei periodi precedenti sono stati riesposti in base a quanto richiesto dal nuovo standard. Il risultato operativo e l’utile netto del Gruppo del terzo trimestre 2012 sono, pertanto, diminuiti, rispettivamente, di Euro 3,1 milioni ed Euro 1,9 milioni. Il risultato operativo e l’utile netto del Gruppo dei primi nove mesi 2012 sono, pertanto, diminuiti, rispettivamente, di Euro 9,0 milioni ed Euro 5,5 milioni. 2 I dati a parità cambi sono calcolati utilizzando il cambio medio del rispettivo periodo di confronto. Per ulteriori informazioni si rimanda alle tabelle allegate. 3 L’EBITDA, il margine EBITDA, l’EBITDA adjusted, il margine EBITDA adjusted, il risultato operativo/utile operativo adjusted, il margine operativo adjusted, il free cash flow, l’indebitamento netto, il rapporto indebitamento netto/EBITDA adjusted, il risultato netto adjusted e l’EPS adjusted sono indicatori non previsti dai principi contabili IAS/IFRS. Per ulteriori informazioni relative a tali indicatori si rimanda alle tabelle allegate. 4 Per vendite omogenee si intendono le vendite a parità di negozi, cambi e perimetro di consolidamento. 5 I dati adjusted dei primi nove mesi del 2013 escludono i costi non ricorrenti derivanti dalla riorganizzazione della nuova acquisita Alain Mikli International per circa Euro 9 milioni sull’utile operativo, pari a circa Euro 6 milioni dopo l’effetto fiscale. I dati adjusted dei primi nove mesi del 2012 escludono i costi non ricorrenti derivanti dalla riorganizzazione del business retail Australiano per circa Euro 22 milioni sull’utile operativo, pari a circa Euro 15 milioni dopo l’effetto fiscale. 6 Le vendite della Divisione Wholesale di Luxottica Group nel terzo trimestre del 2013, rispetto allo stesso periodo del 2012, hanno registrato una variazione a cambi correnti del 13,0% in Europa. A cambi correnti il fatturato dei Paesi Emergenti ha registrato una variazione del +7,0%. Il fatturato del Nord America, escludendo le vendite di Oakley all’esercito americano, ha registrato una variazione del +8,0% a cambi correnti in USD.
5
Luxottica Group S.p.A. Luxottica Group è leader nel settore degli occhiali di fascia alta, di lusso e sportivi, con circa 7.000 negozi operanti sia nel segmento vista che sole in Nord America, Asia-Pacifico, Cina, Sudafrica, America Latina ed Europa e un portafoglio marchi forte e ben bilanciato. Tra i marchi di proprietà figurano Ray-Ban, il marchio di occhiali da sole più conosciuto al mondo, Oakley, Vogue Eyewear, Persol, Oliver Peoples, Alain Mikli e Arnette mentre i marchi in licenza includono Giorgio Armani, Bulgari, Burberry, Chanel, Coach, Dolce & Gabbana, Donna Karan, Polo Ralph Lauren, Prada, Starck Eyes, Tiffany e Versace. Oltre a un network wholesale globale che tocca 130 Paesi, il Gruppo gestisce nei mercati principali alcune catene leader nel retail tra le quali LensCrafters, Pearle Vision e ILORI in Nord America, OPSM e Laubman & Pank in Asia-Pacifico, LensCrafters in Cina, GMO in America Latina e Sunglass Hut in tutto il mondo. I prodotti del Gruppo sono progettati e realizzati in sei impianti produttivi in Italia, in due, interamente controllati, nella Repubblica Popolare Cinese, in uno in Brasile e in uno negli Stati Uniti, dedicato alla produzione di occhiali sportivi. Nel 2012, Luxottica Group ha registrato vendite nette pari a oltre 7,0 miliardi di Euro. Ulteriori informazioni sul Gruppo sono disponibili su www.luxottica.com. Safe Harbor Statement Talune dichiarazioni contenute in questo comunicato stampa potrebbero costituire previsioni ("forward looking statements") così come definite dal Private Securities Litigation Reform Act del 1995. Tali dichiarazioni riguardano rischi, incertezze e altri fattori che potrebbero portare i risultati effettivi a differire, anche in modo sostanziale, da quelli anticipati. Tra tali rischi e incertezze rientrano, a titolo meramente esemplificativo e non esaustivo, la capacità di gestire gli effetti dell’attuale incerta congiuntura economica internazionale, la capacità di acquisire nuove attività e di integrarle efficacemente, la capacità di prevedere le future condizioni economiche e cambi nelle preferenze dei consumatori, la capacità di introdurre e commercializzare con successo nuovi prodotti, la capacità di mantenere un sistema distributivo efficiente, la capacità di raggiungere e gestire la crescita, la capacità di negoziare e mantenere accordi di licenza favorevoli, la disponibilità di strumenti correttivi alternativi agli occhiali da vista, fluttuazioni valutarie, variazioni nelle condizioni locali, la capacità di proteggere la proprietà intellettuale, la capacità di mantenere le relazioni con chi ospita nostri negozi, problemi dei sistemi informativi, rischi legati agli inventari, rischi di credito e assicurativi, cambiamenti nei regimi fiscali, così come altri fattori politici, economici e tecnologici e altri rischi e incertezze già evidenziati nei nostri filing presso la Securities and Exchange Commission. Tali previsioni ("forward looking statements") sono state rilasciate alla data di oggi e non ci assumiamo alcun obbligo di aggiornamento.
– SEGUE L’APPENDICE –
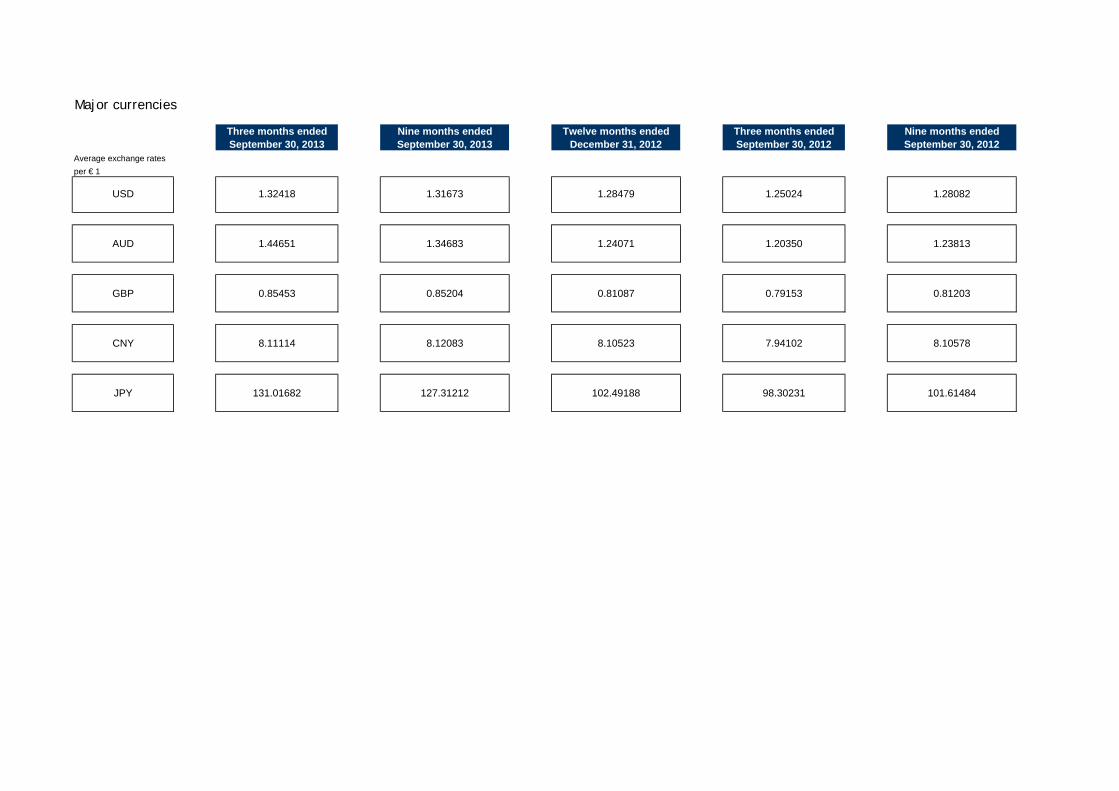
Major currencies
Three months ended Nine months ended Twelve months ended Three months ended Nine months endedSeptember 30, 2013 September 30, 2013 December 31, 2012 September 30, 2012 September 30, 2012
Average exchange ratesper € 1
1.32418 1.31673 1.28479 1.25024 1.28082
1.44651 1.34683 1.24071 1.20350 1.23813
0.85453 0.85204 0.81087 0.79153 0.81203
8.11114 8.12083 8.10523 7.94102 8.10578
131.01682 127.31212 102.49188 98.30231 101.61484
USD
AUD
GBP
CNY
JPY
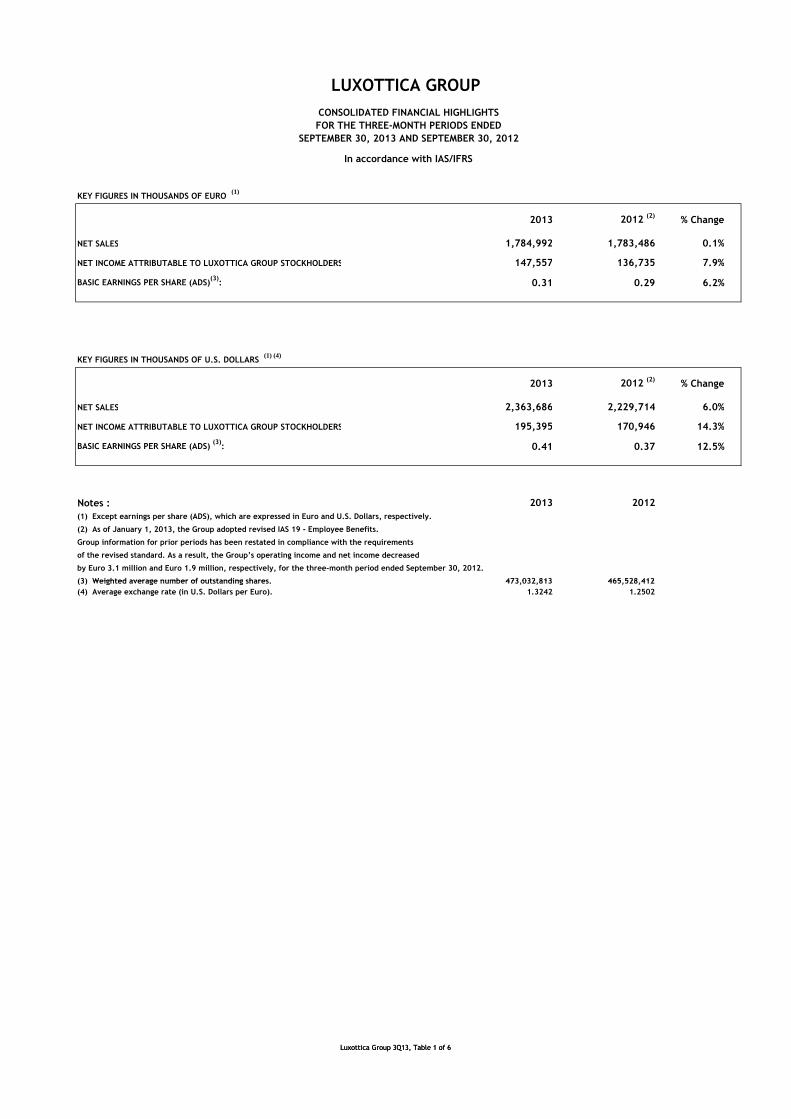
KEY FIGURES IN THOUSANDS OF EURO (1)
2013 2012 (2)
% Change
NET SALES 1,784,992 1,783,486 0.1%
NET INCOME ATTRIBUTABLE TO LUXOTTICA GROUP STOCKHOLDERS 147,557 136,735 7.9%
BASIC EARNINGS PER SHARE (ADS)(3)
: 0.31 0.29 6.2%
KEY FIGURES IN THOUSANDS OF U.S. DOLLARS (1) (4)
2013 2012 (2)
% Change
NET SALES 2,363,686 2,229,714 6.0%
NET INCOME ATTRIBUTABLE TO LUXOTTICA GROUP STOCKHOLDERS 195,395 170,946 14.3%
BASIC EARNINGS PER SHARE (ADS) (3)
: 0.41 0.37 12.5%
Notes : 2013 2012
(1) Except earnings per share (ADS), which are expressed in Euro and U.S. Dollars, respectively.
(2) As of January 1, 2013, the Group adopted revised IAS 19 - Employee Benefits.
Group information for prior periods has been restated in compliance with the requirements
of the revised standard. As a result, the Group’s operating income and net income decreased
by Euro 3.1 million and Euro 1.9 million, respectively, for the three-month period ended September 30, 2012.
(3) Weighted average number of outstanding shares. 473,032,813 465,528,412
In accordance with IAS/IFRS
LUXOTTICA GROUP
CONSOLIDATED FINANCIAL HIGHLIGHTS
FOR THE THREE-MONTH PERIODS ENDED
SEPTEMBER 30, 2013 AND SEPTEMBER 30, 2012
Luxottica Group 3Q13, Table 1 of 6
(3) Weighted average number of outstanding shares. 473,032,813 465,528,412
(4) Average exchange rate (in U.S. Dollars per Euro). 1.3242 1.2502
Luxottica Group 3Q13, Table 1 of 6
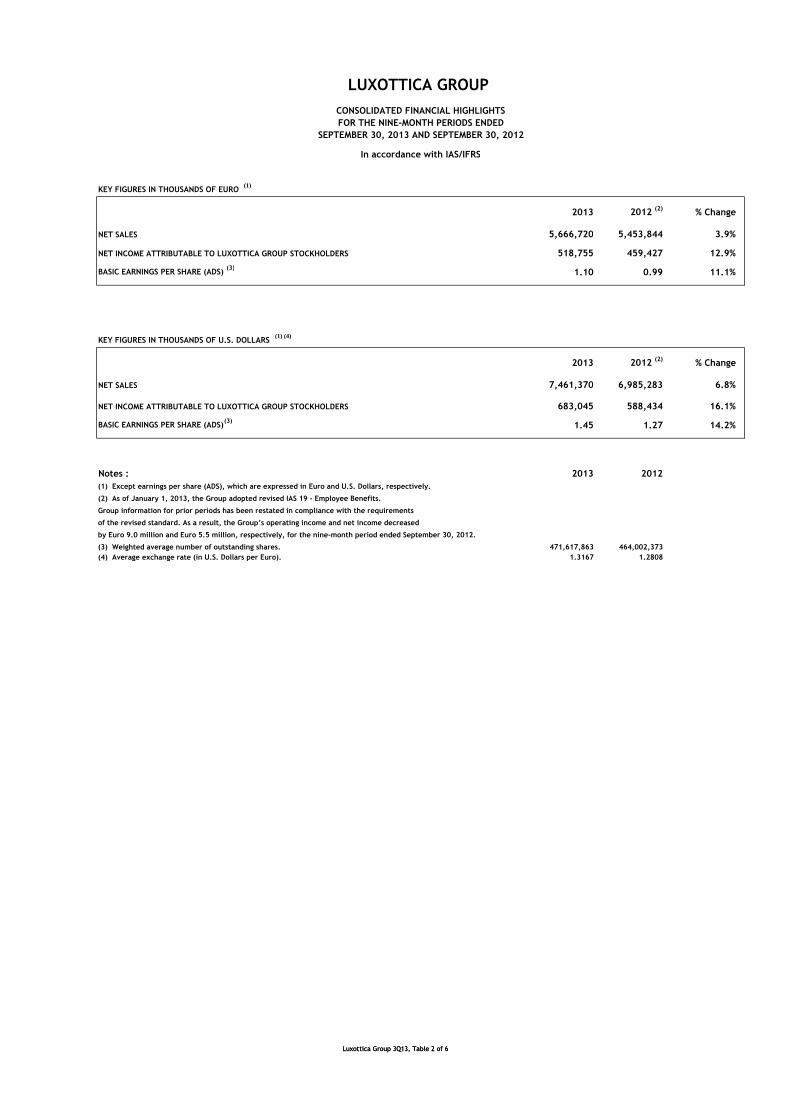
KEY FIGURES IN THOUSANDS OF EURO (1)
2013 2012 (2)
% Change
NET SALES 5,666,720 5,453,844 3.9%
NET INCOME ATTRIBUTABLE TO LUXOTTICA GROUP STOCKHOLDERS 518,755 459,427 12.9%
BASIC EARNINGS PER SHARE (ADS) (3)
1.10 0.99 11.1%
KEY FIGURES IN THOUSANDS OF U.S. DOLLARS (1) (4)
2013 2012 (2)
% Change
NET SALES 7,461,370 6,985,283 6.8%
NET INCOME ATTRIBUTABLE TO LUXOTTICA GROUP STOCKHOLDERS 683,045 588,434 16.1%
BASIC EARNINGS PER SHARE (ADS)(3)
1.45 1.27 14.2%
Notes : 2013 2012
(1) Except earnings per share (ADS), which are expressed in Euro and U.S. Dollars, respectively.
(2) As of January 1, 2013, the Group adopted revised IAS 19 - Employee Benefits.
Group information for prior periods has been restated in compliance with the requirements
of the revised standard. As a result, the Group’s operating income and net income decreased
by Euro 9.0 million and Euro 5.5 million, respectively, for the nine-month period ended September 30, 2012.
(3) Weighted average number of outstanding shares. 471,617,863 464,002,373
(4) Average exchange rate (in U.S. Dollars per Euro). 1.3167 1.2808
In accordance with IAS/IFRS
LUXOTTICA GROUP
CONSOLIDATED FINANCIAL HIGHLIGHTS
FOR THE NINE-MONTH PERIODS ENDED
SEPTEMBER 30, 2013 AND SEPTEMBER 30, 2012
Luxottica Group 3Q13, Table 2 of 6Luxottica Group 3Q13, Table 2 of 6
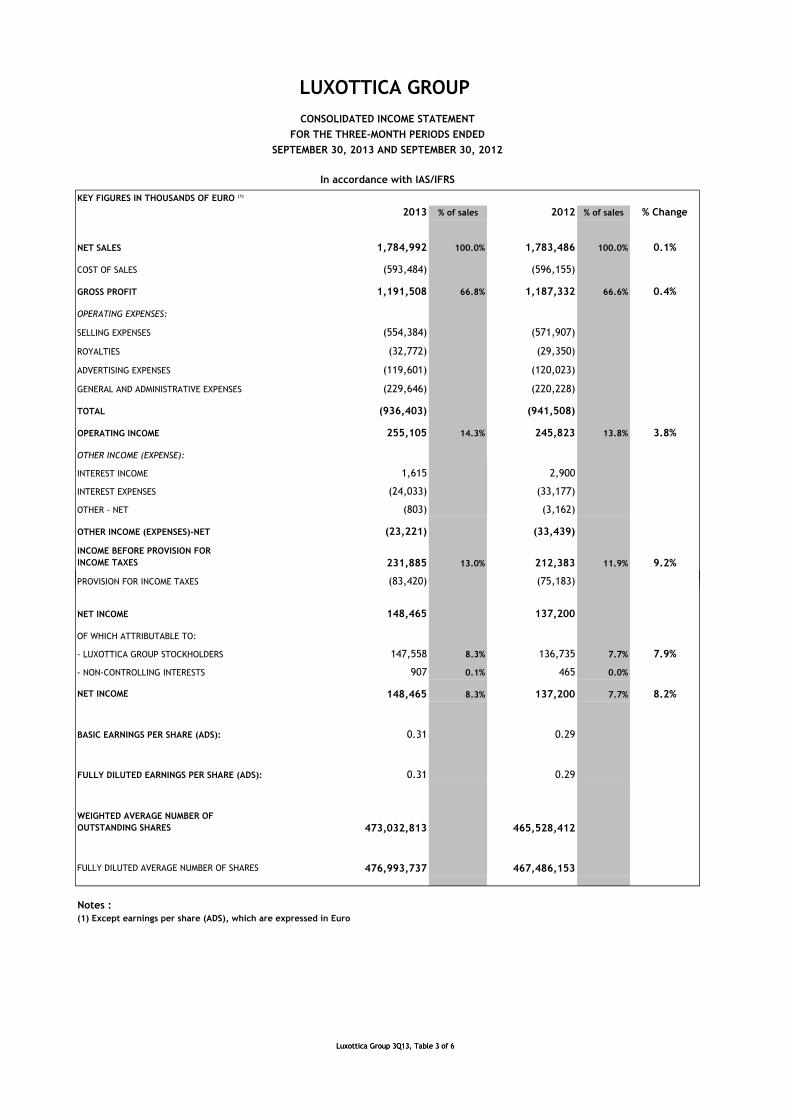
KEY FIGURES IN THOUSANDS OF EURO (1)
2013 % of sales 2012 % of sales % Change
NET SALES 1,784,992 100.0% 1,783,486 100.0% 0.1%
COST OF SALES (593,484) (596,155)
GROSS PROFIT 1,191,508 66.8% 1,187,332 66.6% 0.4%
OPERATING EXPENSES:
SELLING EXPENSES (554,384) (571,907)
ROYALTIES (32,772) (29,350)
ADVERTISING EXPENSES (119,601) (120,023)
GENERAL AND ADMINISTRATIVE EXPENSES (229,646) (220,228)
TOTAL (936,403) (941,508)
OPERATING INCOME 255,105 14.3% 245,823 13.8% 3.8%
OTHER INCOME (EXPENSE):
INTEREST INCOME 1,615 2,900
INTEREST EXPENSES (24,033) (33,177)
OTHER - NET (803) (3,162)
OTHER INCOME (EXPENSES)-NET (23,221) (33,439)
INCOME BEFORE PROVISION FOR
INCOME TAXES 231,885 13.0% 212,383 11.9% 9.2%
PROVISION FOR INCOME TAXES (83,420) (75,183)
LUXOTTICA GROUP
CONSOLIDATED INCOME STATEMENT
FOR THE THREE-MONTH PERIODS ENDED
SEPTEMBER 30, 2013 AND SEPTEMBER 30, 2012
In accordance with IAS/IFRS
Luxottica Group 3Q13, Table 3 of 6
PROVISION FOR INCOME TAXES (83,420) (75,183)
NET INCOME 148,465 137,200
OF WHICH ATTRIBUTABLE TO:
- LUXOTTICA GROUP STOCKHOLDERS 147,558 8.3% 136,735 7.7% 7.9%
- NON-CONTROLLING INTERESTS 907 0.1% 465 0.0%
NET INCOME 148,465 8.3% 137,200 7.7% 8.2%
BASIC EARNINGS PER SHARE (ADS): 0.31 0.29
FULLY DILUTED EARNINGS PER SHARE (ADS): 0.31 0.29
WEIGHTED AVERAGE NUMBER OF
OUTSTANDING SHARES 473,032,813 465,528,412
FULLY DILUTED AVERAGE NUMBER OF SHARES 476,993,737 467,486,153
Notes :
(1) Except earnings per share (ADS), which are expressed in Euro
Luxottica Group 3Q13, Table 3 of 6
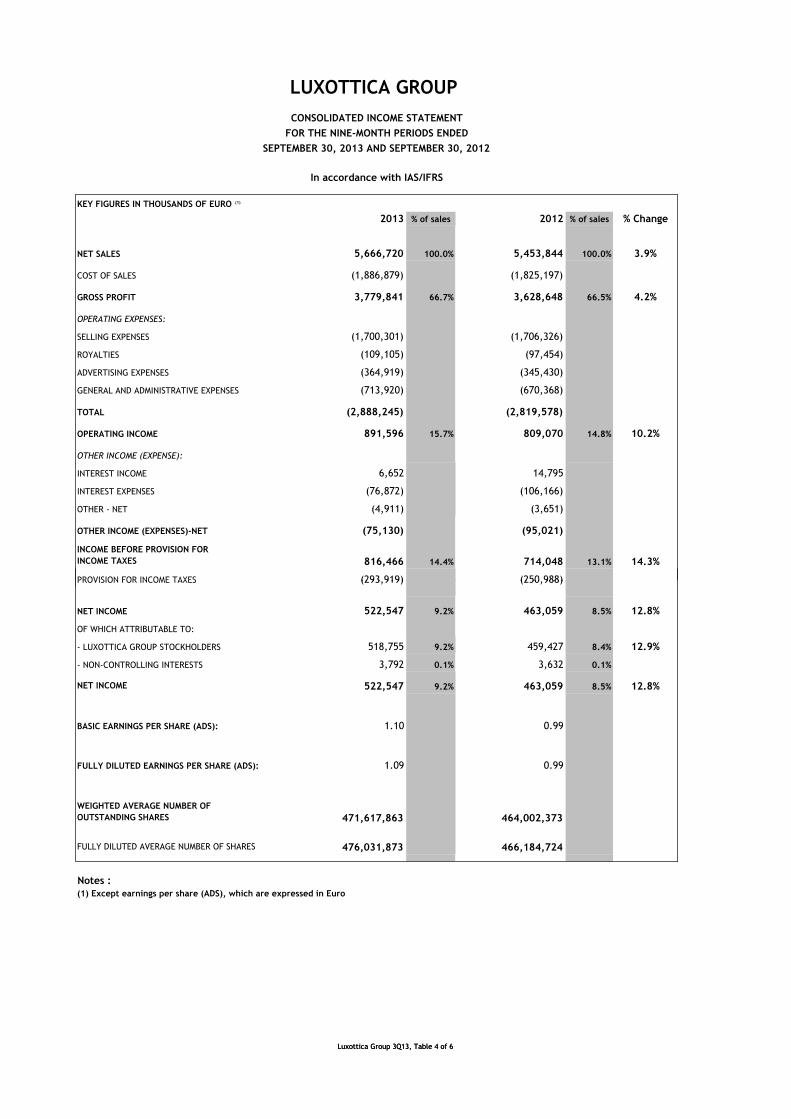
KEY FIGURES IN THOUSANDS OF EURO (1)
2013 % of sales 2012 % of sales % Change
NET SALES 5,666,720 100.0% 5,453,844 100.0% 3.9%
COST OF SALES (1,886,879) (1,825,197)
GROSS PROFIT 3,779,841 66.7% 3,628,648 66.5% 4.2%
OPERATING EXPENSES:
SELLING EXPENSES (1,700,301) (1,706,326)
ROYALTIES (109,105) (97,454)
ADVERTISING EXPENSES (364,919) (345,430)
GENERAL AND ADMINISTRATIVE EXPENSES (713,920) (670,368)
TOTAL (2,888,245) (2,819,578)
OPERATING INCOME 891,596 15.7% 809,070 14.8% 10.2%
OTHER INCOME (EXPENSE):
INTEREST INCOME 6,652 14,795
INTEREST EXPENSES (76,872) (106,166)
OTHER - NET (4,911) (3,651)
OTHER INCOME (EXPENSES)-NET (75,130) (95,021)
INCOME BEFORE PROVISION FOR
INCOME TAXES 816,466 14.4% 714,048 13.1% 14.3%
PROVISION FOR INCOME TAXES (293,919) (250,988)
In accordance with IAS/IFRS
LUXOTTICA GROUP
CONSOLIDATED INCOME STATEMENT
FOR THE NINE-MONTH PERIODS ENDED
SEPTEMBER 30, 2013 AND SEPTEMBER 30, 2012
Luxottica Group 3Q13, Table 4 of 6
PROVISION FOR INCOME TAXES (293,919) (250,988)
NET INCOME 522,547 9.2% 463,059 8.5% 12.8%
OF WHICH ATTRIBUTABLE TO:
- LUXOTTICA GROUP STOCKHOLDERS 518,755 9.2% 459,427 8.4% 12.9%
- NON-CONTROLLING INTERESTS 3,792 0.1% 3,632 0.1%
NET INCOME 522,547 9.2% 463,059 8.5% 12.8%
BASIC EARNINGS PER SHARE (ADS): 1.10 0.99
FULLY DILUTED EARNINGS PER SHARE (ADS): 1.09 0.99
WEIGHTED AVERAGE NUMBER OF
OUTSTANDING SHARES 471,617,863 464,002,373
FULLY DILUTED AVERAGE NUMBER OF SHARES 476,031,873 466,184,724
Notes :
(1) Except earnings per share (ADS), which are expressed in Euro
(2) certain amounts of 2009 have been reclassified to conform to 2010 presentation
Luxottica Group 3Q13, Table 4 of 6
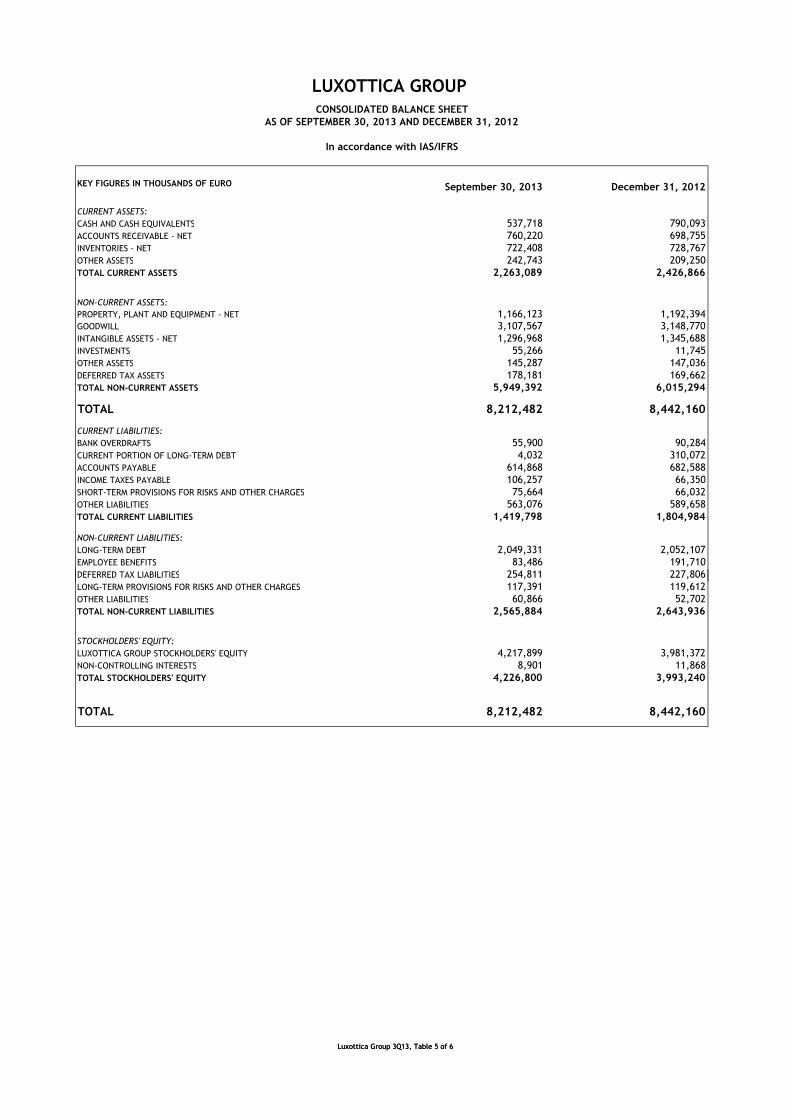
KEY FIGURES IN THOUSANDS OF EURO September 30, 2013 December 31, 2012
CURRENT ASSETS:
CASH AND CASH EQUIVALENTS 537,718 790,093
ACCOUNTS RECEIVABLE - NET 760,220 698,755
INVENTORIES - NET 722,408 728,767
OTHER ASSETS 242,743 209,250
TOTAL CURRENT ASSETS 2,263,089 2,426,866
NON-CURRENT ASSETS:
PROPERTY, PLANT AND EQUIPMENT - NET 1,166,123 1,192,394GOODWILL 3,107,567 3,148,770
INTANGIBLE ASSETS - NET 1,296,968 1,345,688
INVESTMENTS 55,266 11,745
OTHER ASSETS 145,287 147,036
DEFERRED TAX ASSETS 178,181 169,662
TOTAL NON-CURRENT ASSETS 5,949,392 6,015,294
TOTAL 8,212,482 8,442,160
CURRENT LIABILITIES:
BANK OVERDRAFTS 55,900 90,284
CURRENT PORTION OF LONG-TERM DEBT 4,032 310,072
ACCOUNTS PAYABLE 614,868 682,588
INCOME TAXES PAYABLE 106,257 66,350
SHORT-TERM PROVISIONS FOR RISKS AND OTHER CHARGES 75,664 66,032
OTHER LIABILITIES 563,076 589,658
TOTAL CURRENT LIABILITIES 1,419,798 1,804,984
NON-CURRENT LIABILITIES:
LONG-TERM DEBT 2,049,331 2,052,107
EMPLOYEE BENEFITS 83,486 191,710
DEFERRED TAX LIABILITIES 254,811 227,806
LUXOTTICA GROUP CONSOLIDATED BALANCE SHEET
AS OF SEPTEMBER 30, 2013 AND DECEMBER 31, 2012
In accordance with IAS/IFRS
Luxottica Group 3Q13, Table 5 of 6
254,811 227,806
LONG-TERM PROVISIONS FOR RISKS AND OTHER CHARGES 117,391 119,612
OTHER LIABILITIES 60,866 52,702
TOTAL NON-CURRENT LIABILITIES 2,565,884 2,643,936
STOCKHOLDERS' EQUITY:
LUXOTTICA GROUP STOCKHOLDERS' EQUITY 4,217,899 3,981,372
NON-CONTROLLING INTERESTS 8,901 11,868
TOTAL STOCKHOLDERS' EQUITY 4,226,800 3,993,240
TOTAL 8,212,482 8,442,160
Luxottica Group 3Q13, Table 5 of 6
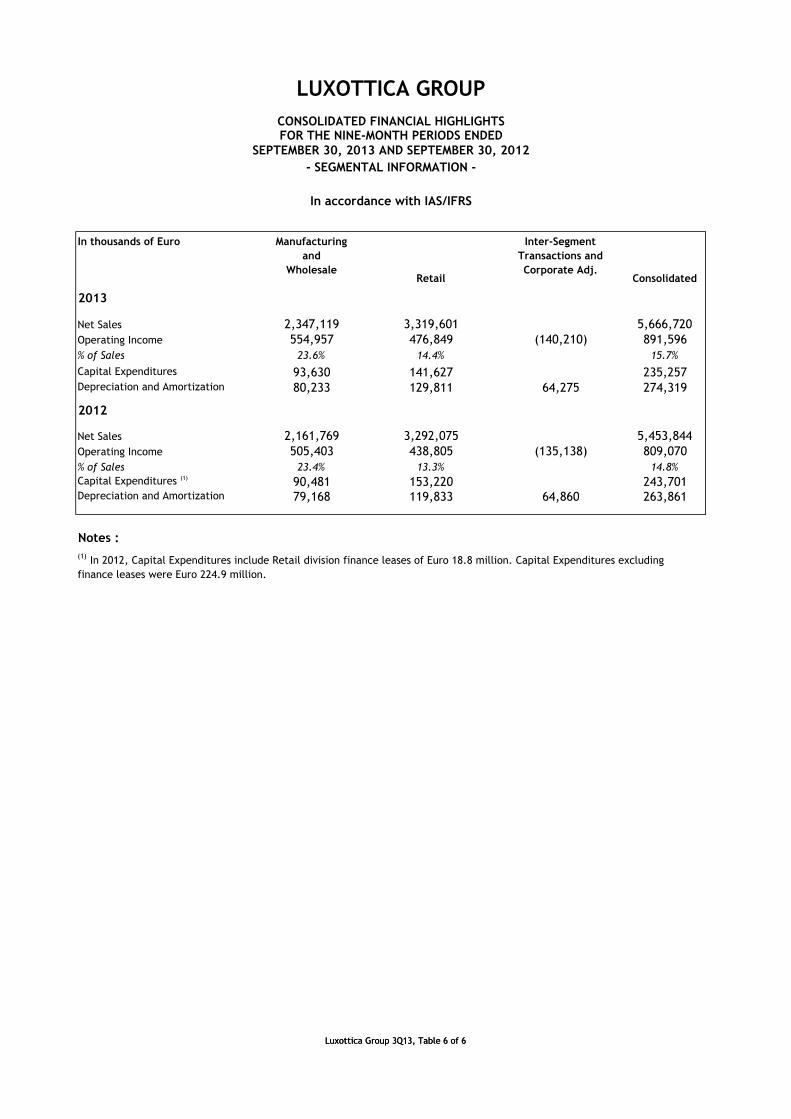
In thousands of Euro Manufacturing
and
Wholesale Retail
Inter-Segment
Transactions and
Corporate Adj.Consolidated
2013
Net Sales 2,347,119 3,319,601 5,666,720
Operating Income 554,957 476,849 (140,210) 891,596
% of Sales 23.6% 14.4% 15.7%
Capital Expenditures 93,630 141,627 235,257Depreciation and Amortization 80,233 129,811 64,275 274,319
2012
Net Sales 2,161,769 3,292,075 5,453,844
Operating Income 505,403 438,805 (135,138) 809,070
% of Sales 23.4% 13.3% 14.8%
Capital Expenditures (1)90,481 153,220 243,701
Depreciation and Amortization 79,168 119,833 64,860 263,861
Notes :
(1) In 2012, Capital Expenditures include Retail division finance leases of Euro 18.8 million. Capital Expenditures excluding
finance leases were Euro 224.9 million.
In accordance with IAS/IFRS
SEPTEMBER 30, 2013 AND SEPTEMBER 30, 2012
LUXOTTICA GROUP
CONSOLIDATED FINANCIAL HIGHLIGHTSFOR THE NINE-MONTH PERIODS ENDED
- SEGMENTAL INFORMATION -
Luxottica Group 3Q13, Table 6 of 6
finance leases were Euro 224.9 million.
Luxottica Group 3Q13, Table 6 of 6
Non-IAS/IFRS Measures: Adjusted measures
In order to provide a supplemental comparison of current period results of operations to prior periods, we have adjusted for certain non-recurring transactions or events.
We have made such adjustments to the following measures: EBITDA, EBITDA margin, operating income, operating margin, net income and earnings per share.
For comparative purposes, management has adjusted each of the foregoing measures by excluding non-recurring restructuring costs related to the Alain Mikli acquisition of approximately Euro 9.0 million as of September 30, 2013.
In addition, we have made adjustments to fiscal year 2012 measures for comparative purposes as described in the footnotes to the tables that contain such fiscal year 2012 data.
As of January 1, 2013, the Group adopted revised IAS 19 - Employee Benefits. Group information for prior periods has been restated in compliance with the requirements of the revised standard. As a result, 2012 Group’s operating income and net income decreased by Euro 9.0 million and Euro 5.5 million, respectively, for the nine-month period ended September 30, 2012 and Euro 3.1 million and Euro 1.9 million, respectively, for the three-month period ended September 30, 2012.
The Company believes that these adjusted measures are useful to both management and investors in evaluating the Company’s operating performance compared with that of other companies in its industry because they exclude the impact of non-recurring items that are not relevant to the Company’soperating performance.operating performance.
The adjusted measures referenced above are not measures of performance in accordance with International Financial Reporting Standards as issued by the International Accounting Standards Board (IAS/IFRS). We include these adjusted measures in this presentation in order to provide a supplemental view of operations that excludes items that are unusual, infrequent or unrelated to our ongoing core operations.
These adjusted measures are not meant to be considered in isolation or as a substitute for items appearing on our financial statements prepared in accordance with IAS/IFRS. Rather, these non-IAS/IFRS measures should be used as a supplement to IAS/IFRS results to assist the reader in better understanding the operational performance of the Company. The Company cautions that these adjusted measures are not defined terms under IAS/IFRSand their definitions should be carefully reviewed and understood by investors. Investors should be aware that Luxottica Group’s method of calculating these adjusted measures may differ from methods used by other companies.
The Company recognizes that there are limitations in the usefulness of adjusted measures due to the subjective nature of items excluded by management in calculating adjusted comparisons. We compensate for the foregoing limitation by using these adjusted measures as a comparative tool, together with IAS/IFRS measures, to assist in the evaluation of our operating performance.
See the tables on the following pages for a reconciliation of the adjusted measures discussed above to their most directly comparable IAS/IFRS financial measures or, in the case of adjusted EBITDA and adjusted EBITDA margin, to EBITDA and EBITDA margin, respectively, which are also non-IAS/IFRSmeasures. For a discussion of EBITDA and EBITDA margin and a reconciliation of EBITDA and EBITDA margin to their most directly comparable IAS/IFRSfinancial measures, see the tables on the pages immediately following the reconciliation of the adjusted measures.
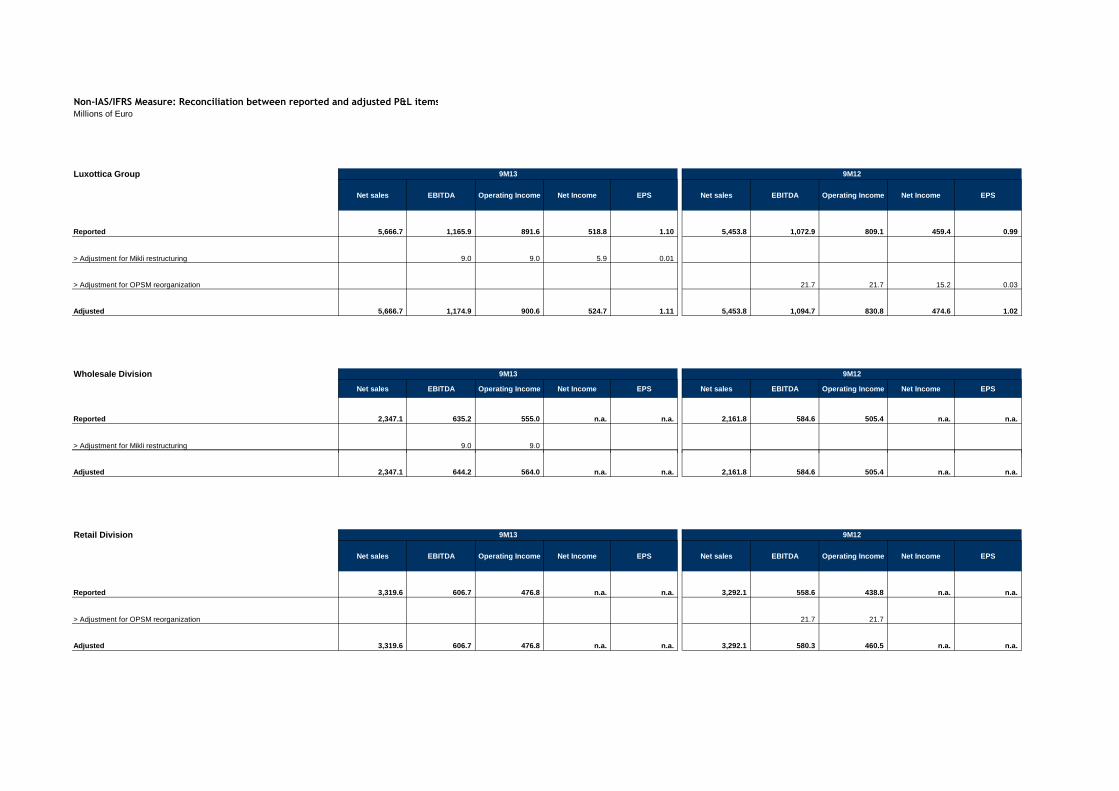
Non-IAS/IFRS Measure: Reconciliation between reported and adjusted P&L items
Millions of Euro
Luxottica Group
Net sales EBITDA Operating Income Net Income EPS Net sales EBITDA Operating Income Net Income EPS
Reported 5,666.7 1,165.9 891.6 518.8 1.10 5,453.8 1,072.9 809.1 459.4 0.99
> Adjustment for Mikli restructuring 9.0 9.0 5.9 0.01
> Adjustment for OPSM reorganization 21.7 21.7 15.2 0.03
Adjusted 5,666.7 1,174.9 900.6 524.7 1.11 5,453.8 1,094.7 830.8 474.6 1.02
Wholesale Division
Net sales EBITDA Operating Income Net Income EPS Net sales EBITDA Operating Income Net Income EPS
Reported 2,347.1 635.2 555.0 n.a. n.a. 2,161.8 584.6 505.4 n.a. n.a.
> Adjustment for Mikli restructuring 9.0 9.0
9M13 9M12
9M13 9M12
Adjusted 2,347.1 644.2 564.0 n.a. n.a. 2,161.8 584.6 505.4 n.a. n.a.
Retail Division
Net sales EBITDA Operating Income Net Income EPS Net sales EBITDA Operating Income Net Income EPS
Reported 3,319.6 606.7 476.8 n.a. n.a. 3,292.1 558.6 438.8 n.a. n.a.
> Adjustment for OPSM reorganization 21.7 21.7
Adjusted 3,319.6 606.7 476.8 n.a. n.a. 3,292.1 580.3 460.5 n.a. n.a.
9M13 9M12
Non-IAS/IFRS Measure: EBITDA and EBITDA margin
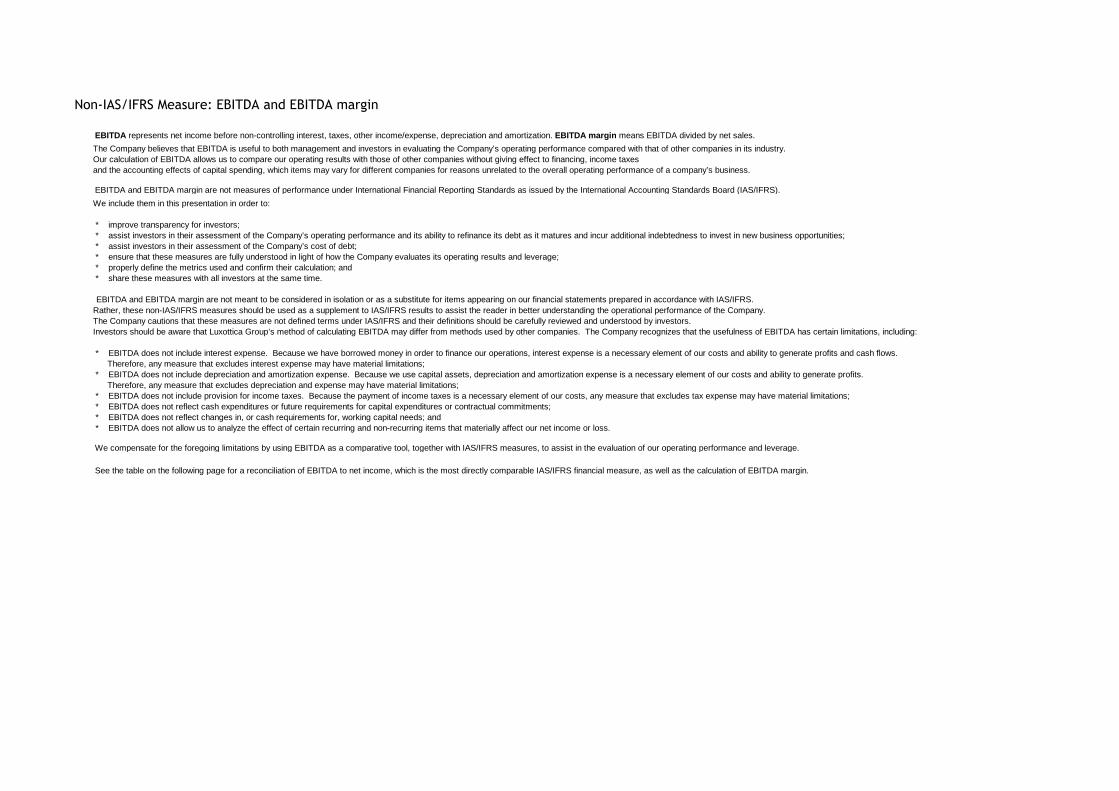
EBITDA represents net income before non-controlling interest, taxes, other income/expense, depreciation and amortization. EBITDA margin means EBITDA divided by net sales.
The Company believes that EBITDA is useful to both management and investors in evaluating the Company’s operating performance compared with that of other companies in its industry. Our calculation of EBITDA allows us to compare our operating results with those of other companies without giving effect to financing, income taxes and the accounting effects of capital spending, which items may vary for different companies for reasons unrelated to the overall operating performance of a company’s business.
EBITDA and EBITDA margin are not measures of performance under International Financial Reporting Standards as issued by the International Accounting Standards Board (IAS/IFRS).
We include them in this presentation in order to:
* improve transparency for investors;* assist investors in their assessment of the Company’s operating performance and its ability to refinance its debt as it matures and incur additional indebtedness to invest in new business opportunities;* assist investors in their assessment of the Company’s cost of debt;* ensure that these measures are fully understood in light of how the Company evaluates its operating results and leverage;* properly define the metrics used and confirm their calculation; and* share these measures with all investors at the same time.
EBITDA and EBITDA margin are not meant to be considered in isolation or as a substitute for items appearing on our financial statements prepared in accordance with IAS/IFRS. Rather, these non-IAS/IFRS measures should be used as a supplement to IAS/IFRS results to assist the reader in better understanding the operational performance of the Company. The Company cautions that these measures are not defined terms under IAS/IFRS and their definitions should be carefully reviewed and understood by investors. Investors should be aware that Luxottica Group’s method of calculating EBITDA may differ from methods used by other companies. The Company recognizes that the usefulness of EBITDA has certain limitations, including:
* EBITDA does not include interest expense. Because we have borrowed money in order to finance our operations, interest expense is a necessary element of our costs and ability to generate profits and cash flows. Therefore, any measure that excludes interest expense may have material limitations;
* EBITDA does not include depreciation and amortization expense. Because we use capital assets, depreciation and amortization expense is a necessary element of our costs and ability to generate profits. Therefore, any measure that excludes depreciation and expense may have material limitations;* EBITDA does not include provision for income taxes. Because the payment of income taxes is a necessary element of our costs, any measure that excludes tax expense may have material limitations;* EBITDA does not reflect cash expenditures or future requirements for capital expenditures or contractual commitments;* EBITDA does not reflect changes in, or cash requirements for, working capital needs; and* EBITDA does not allow us to analyze the effect of certain recurring and non-recurring items that materially affect our net income or loss.
We compensate for the foregoing limitations by using EBITDA as a comparative tool, together with IAS/IFRS measures, to assist in the evaluation of our operating performance and leverage.
See the table on the following page for a reconciliation of EBITDA to net income, which is the most directly comparable IAS/IFRS financial measure, as well as the calculation of EBITDA margin.
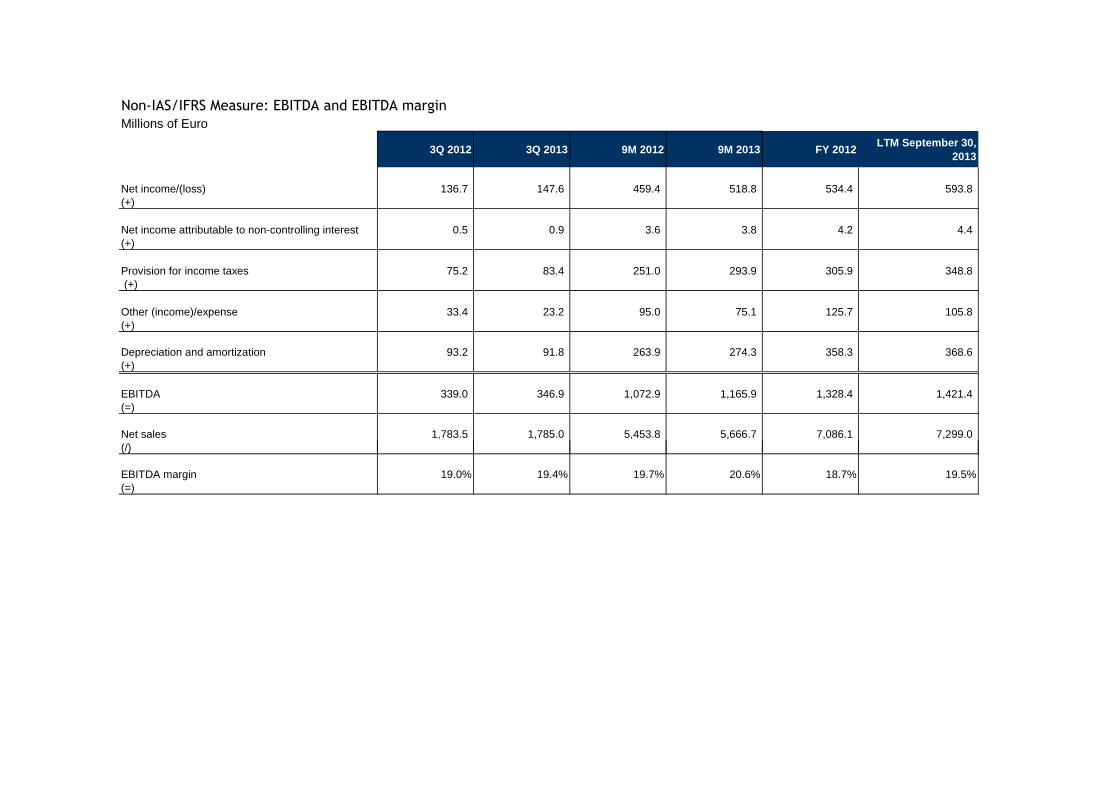
Non-IAS/IFRS Measure: EBITDA and EBITDA margin
Millions of Euro
3Q 2012 3Q 2013 9M 2012 9M 2013 FY 2012LTM September 30,
2013
Net income/(loss) 136.7 147.6 459.4 518.8 534.4 593.8 (+)
Net income attributable to non-controlling interest 0.5 0.9 3.6 3.8 4.2 4.4 (+)
Provision for income taxes 75.2 83.4 251.0 293.9 305.9 348.8 (+)
Other (income)/expense 33.4 23.2 95.0 75.1 125.7 105.8 (+)
Depreciation and amortization 93.2 91.8 263.9 274.3 358.3 368.6 (+)
EBITDA 339.0 346.9 1,072.9 1,165.9 1,328.4 1,421.4 (=)
Net sales 1,783.5 1,785.0 5,453.8 5,666.7 7,086.1 7,299.0 (/)(/)
EBITDA margin 19.0% 19.4% 19.7% 20.6% 18.7% 19.5%(=)
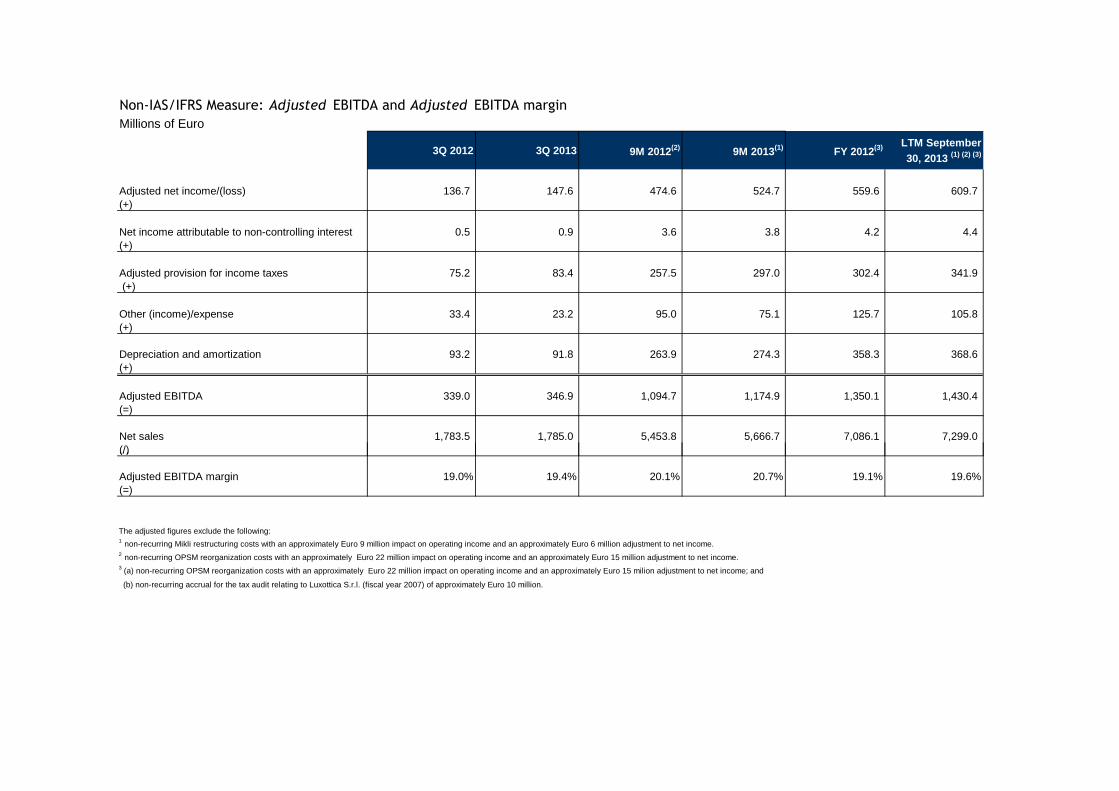
Non-IAS/IFRS Measure: Adjusted EBITDA and Adjusted EBITDA margin
Millions of Euro
3Q 2012 3Q 2013 9M 2012(2) 9M 2013(1) FY 2012(3) LTM September 30, 2013 (1) (2) (3)
Adjusted net income/(loss) 136.7 147.6 474.6 524.7 559.6 609.7 (+)
Net income attributable to non-controlling interest 0.5 0.9 3.6 3.8 4.2 4.4 (+)
Adjusted provision for income taxes 75.2 83.4 257.5 297.0 302.4 341.9 (+)
Other (income)/expense 33.4 23.2 95.0 75.1 125.7 105.8 (+)
Depreciation and amortization 93.2 91.8 263.9 274.3 358.3 368.6 (+)
Adjusted EBITDA 339.0 346.9 1,094.7 1,174.9 1,350.1 1,430.4 (=)
Net sales 1,783.5 1,785.0 5,453.8 5,666.7 7,086.1 7,299.0 (/)(/)
Adjusted EBITDA margin 19.0% 19.4% 20.1% 20.7% 19.1% 19.6%(=)
The adjusted figures exclude the following:1 non-recurring Mikli restructuring costs with an approximately Euro 9 million impact on operating income and an approximately Euro 6 million adjustment to net income.2 non-recurring OPSM reorganization costs with an approximately Euro 22 million impact on operating income and an approximately Euro 15 million adjustment to net income.3 (a) non-recurring OPSM reorganization costs with an approximately Euro 22 million impact on operating income and an approximately Euro 15 milion adjustment to net income; and
(b) non-recurring accrual for the tax audit relating to Luxottica S.r.l. (fiscal year 2007) of approximately Euro 10 million.
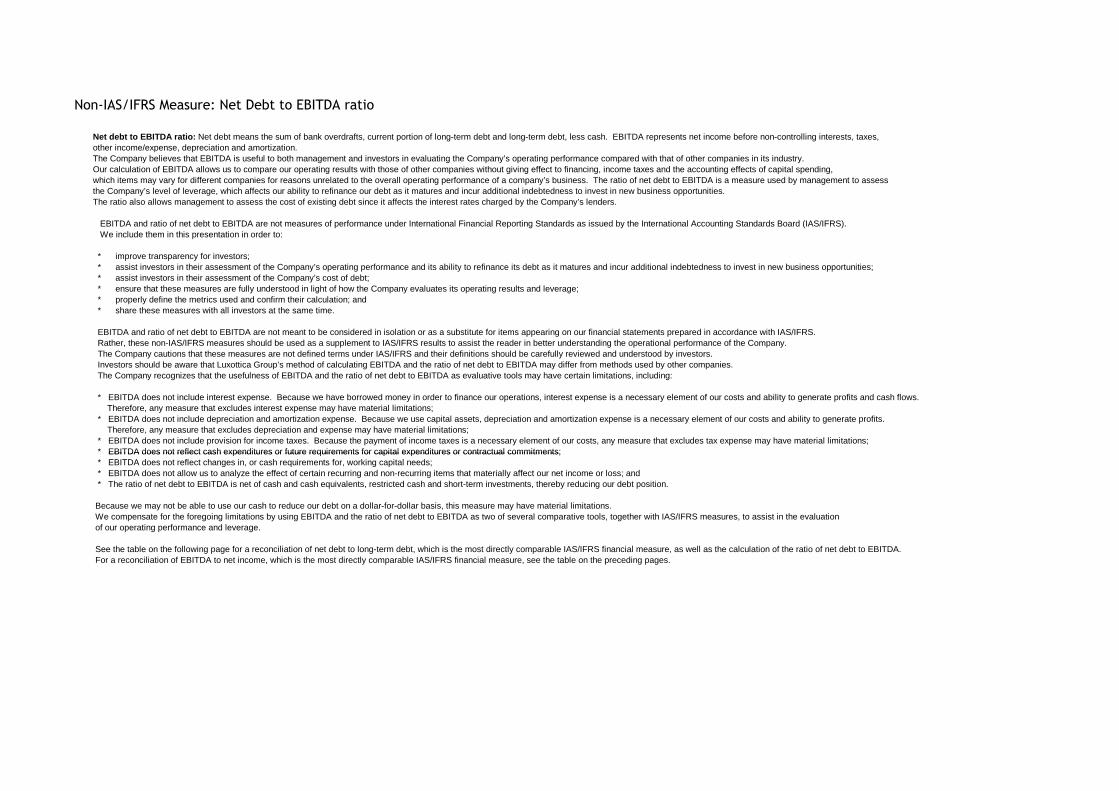
Non-IAS/IFRS Measure: Net Debt to EBITDA ratio
Net debt to EBITDA ratio: Net debt means the sum of bank overdrafts, current portion of long-term debt and long-term debt, less cash. EBITDA represents net income before non-controlling interests, taxes, other income/expense, depreciation and amortization.
The Company believes that EBITDA is useful to both management and investors in evaluating the Company’s operating performance compared with that of other companies in its industry. Our calculation of EBITDA allows us to compare our operating results with those of other companies without giving effect to financing, income taxes and the accounting effects of capital spending, which items may vary for different companies for reasons unrelated to the overall operating performance of a company’s business. The ratio of net debt to EBITDA is a measure used by management to assess the Company’s level of leverage, which affects our ability to refinance our debt as it matures and incur additional indebtedness to invest in new business opportunities. The ratio also allows management to assess the cost of existing debt since it affects the interest rates charged by the Company’s lenders.
EBITDA and ratio of net debt to EBITDA are not measures of performance under International Financial Reporting Standards as issued by the International Accounting Standards Board (IAS/IFRS). We include them in this presentation in order to:
* improve transparency for investors; * assist investors in their assessment of the Company’s operating performance and its ability to refinance its debt as it matures and incur additional indebtedness to invest in new business opportunities; * assist investors in their assessment of the Company’s cost of debt; * ensure that these measures are fully understood in light of how the Company evaluates its operating results and leverage; * properly define the metrics used and confirm their calculation; and * share these measures with all investors at the same time.
EBITDA and ratio of net debt to EBITDA are not meant to be considered in isolation or as a substitute for items appearing on our financial statements prepared in accordance with IAS/IFRS. Rather, these non-IAS/IFRS measures should be used as a supplement to IAS/IFRS results to assist the reader in better understanding the operational performance of the Company. The Company cautions that these measures are not defined terms under IAS/IFRS and their definitions should be carefully reviewed and understood by investors. Investors should be aware that Luxottica Group’s method of calculating EBITDA and the ratio of net debt to EBITDA may differ from methods used by other companies. The Company recognizes that the usefulness of EBITDA and the ratio of net debt to EBITDA as evaluative tools may have certain limitations, including:
* EBITDA does not include interest expense. Because we have borrowed money in order to finance our operations, interest expense is a necessary element of our costs and ability to generate profits and cash flows. Therefore, any measure that excludes interest expense may have material limitations; * EBITDA does not include depreciation and amortization expense. Because we use capital assets, depreciation and amortization expense is a necessary element of our costs and ability to generate profits.
Therefore, any measure that excludes depreciation and expense may have material limitations; * EBITDA does not include provision for income taxes. Because the payment of income taxes is a necessary element of our costs, any measure that excludes tax expense may have material limitations; * EBITDA does not reflect cash expenditures or future requirements for capital expenditures or contractual commitments; * EBITDA does not reflect cash expenditures or future requirements for capital expenditures or contractual commitments; * EBITDA does not reflect changes in, or cash requirements for, working capital needs; * EBITDA does not allow us to analyze the effect of certain recurring and non-recurring items that materially affect our net income or loss; and * The ratio of net debt to EBITDA is net of cash and cash equivalents, restricted cash and short-term investments, thereby reducing our debt position.
Because we may not be able to use our cash to reduce our debt on a dollar-for-dollar basis, this measure may have material limitations. We compensate for the foregoing limitations by using EBITDA and the ratio of net debt to EBITDA as two of several comparative tools, together with IAS/IFRS measures, to assist in the evaluation of our operating performance and leverage.
See the table on the following page for a reconciliation of net debt to long-term debt, which is the most directly comparable IAS/IFRS financial measure, as well as the calculation of the ratio of net debt to EBITDA. For a reconciliation of EBITDA to net income, which is the most directly comparable IAS/IFRS financial measure, see the table on the preceding pages.
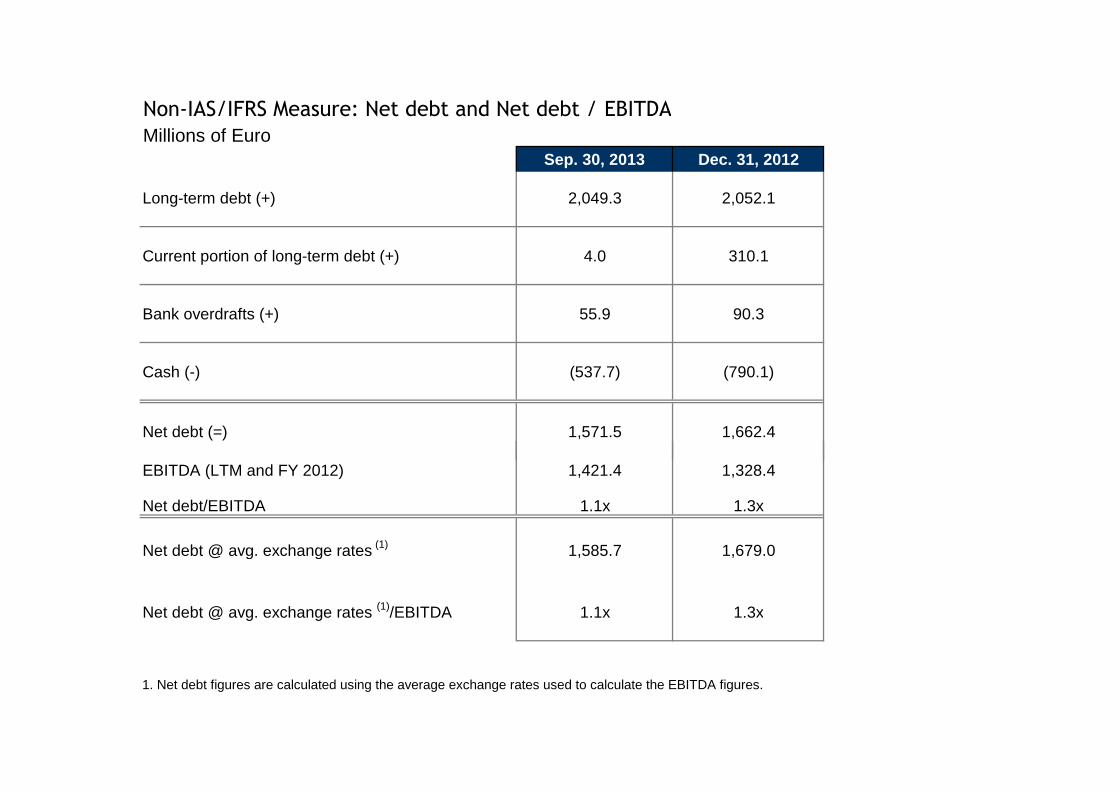
Non-IAS/IFRS Measure: Net debt and Net debt / EBITDA
Millions of EuroSep. 30, 2013 Dec. 31, 2012
Long-term debt (+) 2,049.3 2,052.1
Current portion of long-term debt (+) 4.0 310.1
Bank overdrafts (+) 55.9 90.3
Cash (-) (537.7) (790.1)
Net debt (=) 1,571.5 1,662.4
EBITDA (LTM and FY 2012) 1,421.4 1,328.4
Net debt/EBITDA 1.1x 1.3x
Net debt @ avg. exchange rates (1) 1,585.7 1,679.0
Net debt @ avg. exchange rates (1)/EBITDA 1.1x 1.3x
1. Net debt figures are calculated using the average exchange rates used to calculate the EBITDA figures.
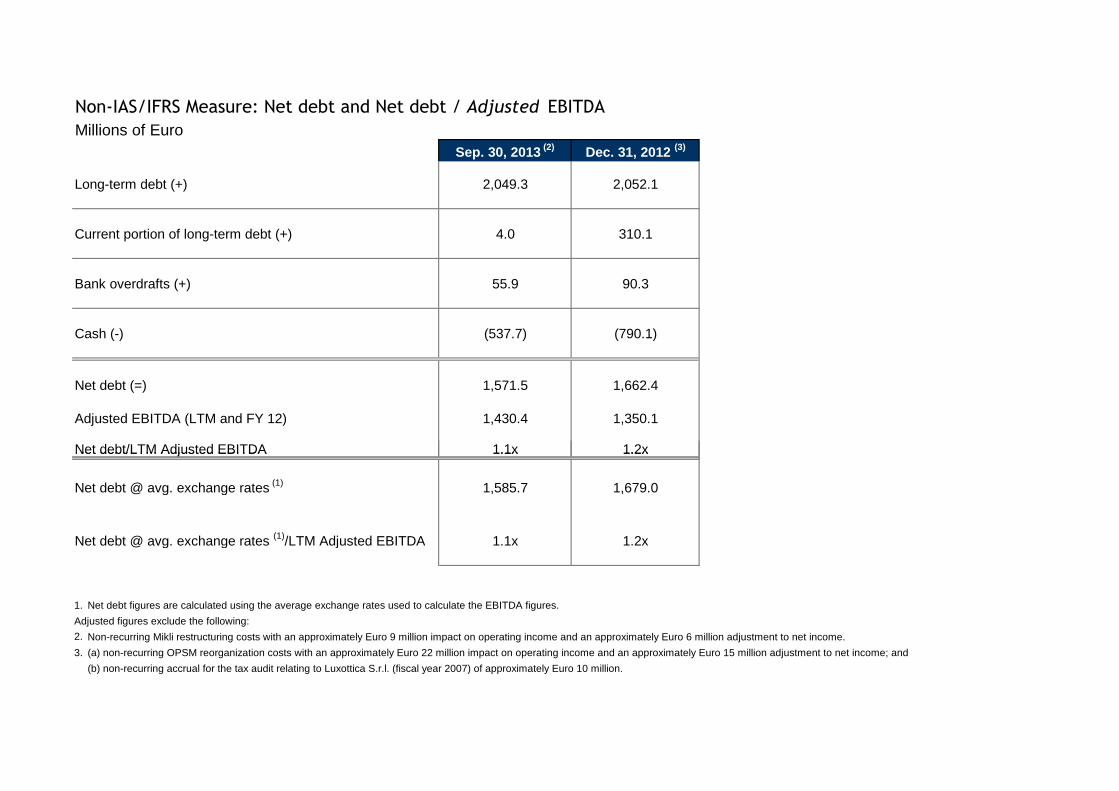
Non-IAS/IFRS Measure: Net debt and Net debt / Adjusted EBITDA
Millions of EuroSep. 30, 2013 (2) Dec. 31, 2012 (3)
Long-term debt (+) 2,049.3 2,052.1
Current portion of long-term debt (+) 4.0 310.1
Bank overdrafts (+) 55.9 90.3
Cash (-) (537.7) (790.1)
Net debt (=) 1,571.5 1,662.4
Adjusted EBITDA (LTM and FY 12) 1,430.4 1,350.1
Net debt/LTM Adjusted EBITDA 1.1x 1.2xNet debt/LTM Adjusted EBITDA 1.1x 1.2x
Net debt @ avg. exchange rates (1) 1,585.7 1,679.0
Net debt @ avg. exchange rates (1)/LTM Adjusted EBITDA 1.1x 1.2x
1. Net debt figures are calculated using the average exchange rates used to calculate the EBITDA figures.
Adjusted figures exclude the following:
2. Non-recurring Mikli restructuring costs with an approximately Euro 9 million impact on operating income and an approximately Euro 6 million adjustment to net income.
3. (a) non-recurring OPSM reorganization costs with an approximately Euro 22 million impact on operating income and an approximately Euro 15 million adjustment to net income; and
(b) non-recurring accrual for the tax audit relating to Luxottica S.r.l. (fiscal year 2007) of approximately Euro 10 million.
Non-IAS/IFRS Measures: Free Cash Flow
Free cash flow represents net income before non-controlling interests, taxes, other income/expense, depreciation and amortization (i.e. EBITDA – see table on the earlier page) plus or minus the decrease/(increase) in working capital over the prior period, less capital expenditures, plus or minus interest income/(expense) and extraordinary items, minus taxes paid. The Company believes that free cash flow is useful to both management and investors in evaluating the Company’s operating performance compared with other companies in its industry. In particular, our calculation of free cash flow provides a clearer picture of the Company’s ability to generate net cash from operations, which is used for mandatory debt service requirements, for funding discretionary investments, for paying dividends or pursuing other strategic opportunities.
Free cash flow is not a measure of performance under International Financial Reporting Standards as issued by the International Accounting Standards Board (IAS/IFRS). We include it in this presentation in order to:
* Improve transparency for investors; * Assist investors in their assessment of the Company’s operating performance and its ability to generate cash from operations in excess of its cash expenses; * Ensure that this measure is fully understood in light of how the Company evaluates its operating results; * Properly define the metrics used and confirm their calculation; and * Share this measure with all investors at the same time.
Free cash flow is not meant to be considered in isolation or as a substitute for items appearing on our financial statements prepared in accordance with IAS/IFRS. Rather, this non-IAS/IFRS measure should be used as a supplement to IAS/IFRS results to assist the reader in better understanding the operational performance of the Company. The Company cautions that this measure is not a defined term under IAS/IFRS and its definition should be carefully reviewed and understood by investors. Investors should be aware that Luxottica Group’s method of calculation of free cash flow may differ from methods used by other companies. The Company recognizes that the usefulness of free cash flow as an evaluative tool may have certain limitations, including:
• The manner in which the Company calculates free cash flow may differ from that of other companies, which limits its usefulness as a comparative measure; • Free cash flow does not represent the total increase or decrease in the net debt balance for the period since it excludes, among other things, cash used for funding discretionary investments and to pursue strategic opportunities during the period and any impact of the exchange rate changes; and • Free cash flow can be subject to adjustment at the Company’s discretion if the Company takes steps or adopts policies that increase or diminish its current liabilities and/or changes to working capital.
We compensate for the foregoing limitations by using free cash flow as one of several comparative tools, together with IAS/IFRS measures, to assist in the evaluation of our operating performance.
See the table on the following page for a reconciliation of free cash flow to EBITDA and the table on the earlier page for a reconciliation of EBITDA to net income, which is the most directly comparable IAS/IFRS financial measure.
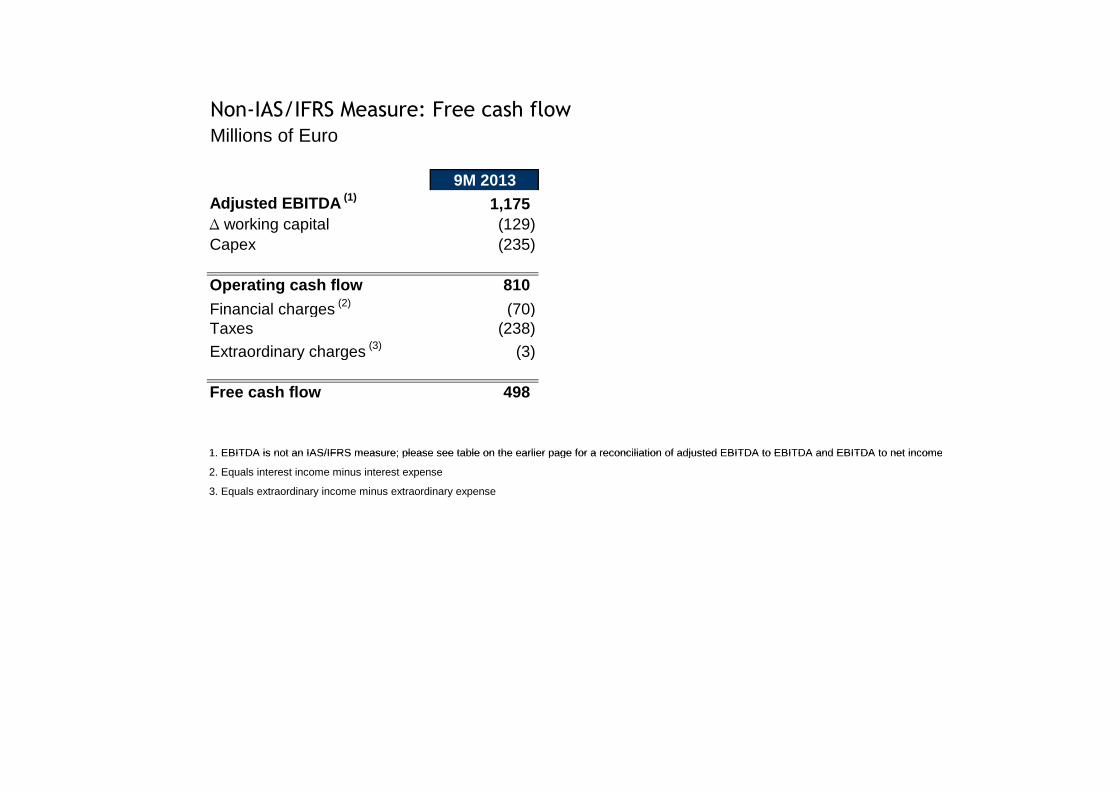
Non-IAS/IFRS Measure: Free cash flow
Millions of Euro
9M 2013Adjusted EBITDA (1) 1,175 ∆ working capital (129) Capex (235)
Operating cash flow 810
Financial charges (2) (70) Taxes (238)
Extraordinary charges (3) (3)
Free cash flow 498
1. EBITDA is not an IAS/IFRS measure; please see table on the earlier page for a reconciliation of adjusted EBITDA to EBITDA and EBITDA to net income1. EBITDA is not an IAS/IFRS measure; please see table on the earlier page for a reconciliation of adjusted EBITDA to EBITDA and EBITDA to net income
2. Equals interest income minus interest expense
3. Equals extraordinary income minus extraordinary expense
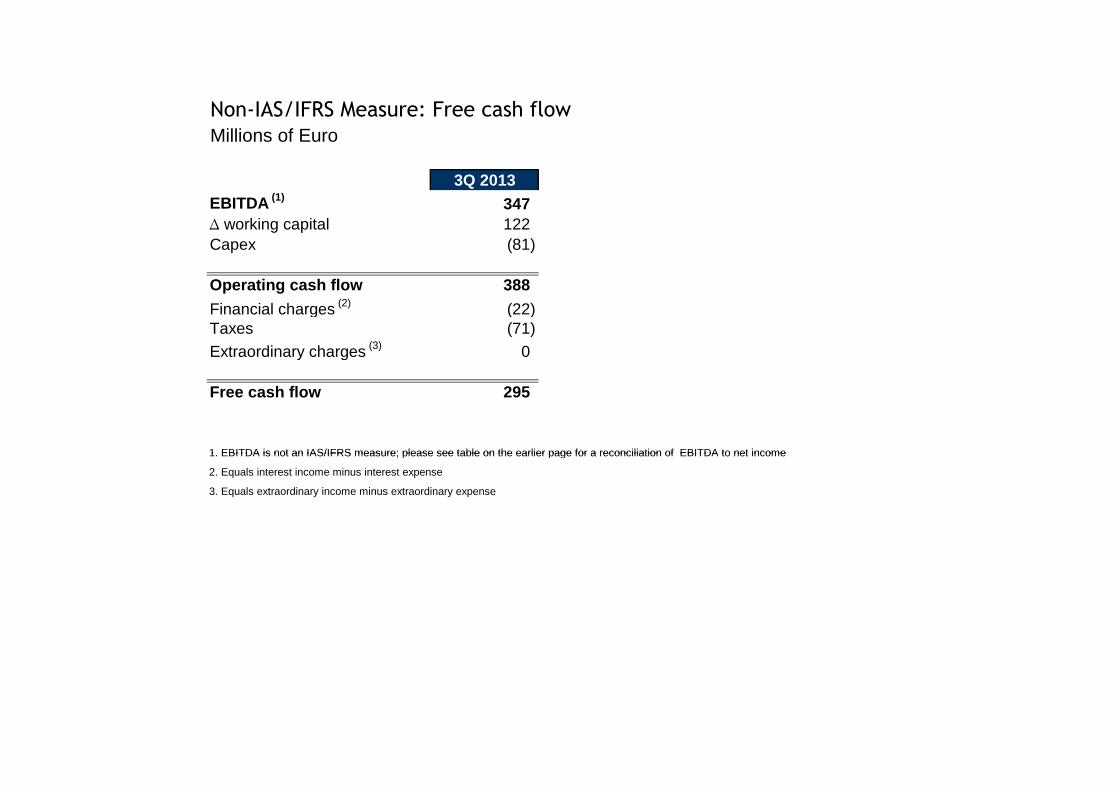
Non-IAS/IFRS Measure: Free cash flow
Millions of Euro
3Q 2013EBITDA (1) 347 ∆ working capital 122 Capex (81)
Operating cash flow 388
Financial charges (2) (22) Taxes (71)
Extraordinary charges (3) 0
Free cash flow 295
1. EBITDA is not an IAS/IFRS measure; please see table on the earlier page for a reconciliation of EBITDA to net income1. EBITDA is not an IAS/IFRS measure; please see table on the earlier page for a reconciliation of EBITDA to net income
2. Equals interest income minus interest expense
3. Equals extraordinary income minus extraordinary expense