IN SITU AND IN VITRO TECHNIQUES FOR STUDYING RUMEN ... SITU... · Chapter 4 True dry matter ......
113
Sede Amministrativa: Università degli Studi di Padova Dipartimento di SCIENZE ANIMALI SCUOLA DI DOTTORATO DI RICERCA IN: SCIENZE ANIMALI INDIRIZZO: ALLEVAMENTO, ALIMENTAZIONE, AMBIENTE, BENESSERE ANIMALE E QUALITA’ DEI PRODOTTI CICLO: XXIII IN SITU AND IN VITRO TECHNIQUES FOR STUDYING RUMEN FERMENTATIONS: METHODOLOGY AND APPLICATIONS Direttore della Scuola: Ch.mo Prof. MARTINO CASSANDRO Coordinatore d’indirizzo: Ch.ma Prof.ssa LUCIA BAILONI Supervisore: Ch.mo Prof. STEFANO SCHIAVON Dottorando: MIRKO CATTANI
Transcript of IN SITU AND IN VITRO TECHNIQUES FOR STUDYING RUMEN ... SITU... · Chapter 4 True dry matter ......
Sede Amministrativa: Università degli Studi di Padova
Dipartimento di SCIENZE ANIMALI
SCUOLA DI DOTTORATO DI RICERCA IN: SCIENZE ANIMALI
INDIRIZZO: ALLEVAMENTO, ALIMENTAZIONE, AMBIENTE,
BENESSERE ANIMALE E QUALITA’ DEI PRODOTTI
CICLO: XXIII
IN SITU AND IN VITRO TECHNIQUES FOR STUDYING RUMEN
FERMENTATIONS: METHODOLOGY AND APPLICATIONS
Direttore della Scuola: Ch.mo Prof. MARTINO CASSANDRO
Coordinatore d’indirizzo: Ch.ma Prof.ssa LUCIA BAILONI
Supervisore : Ch.mo Prof. STEFANO SCHIAVON
Dottorando : MIRKO CATTANI

2
1
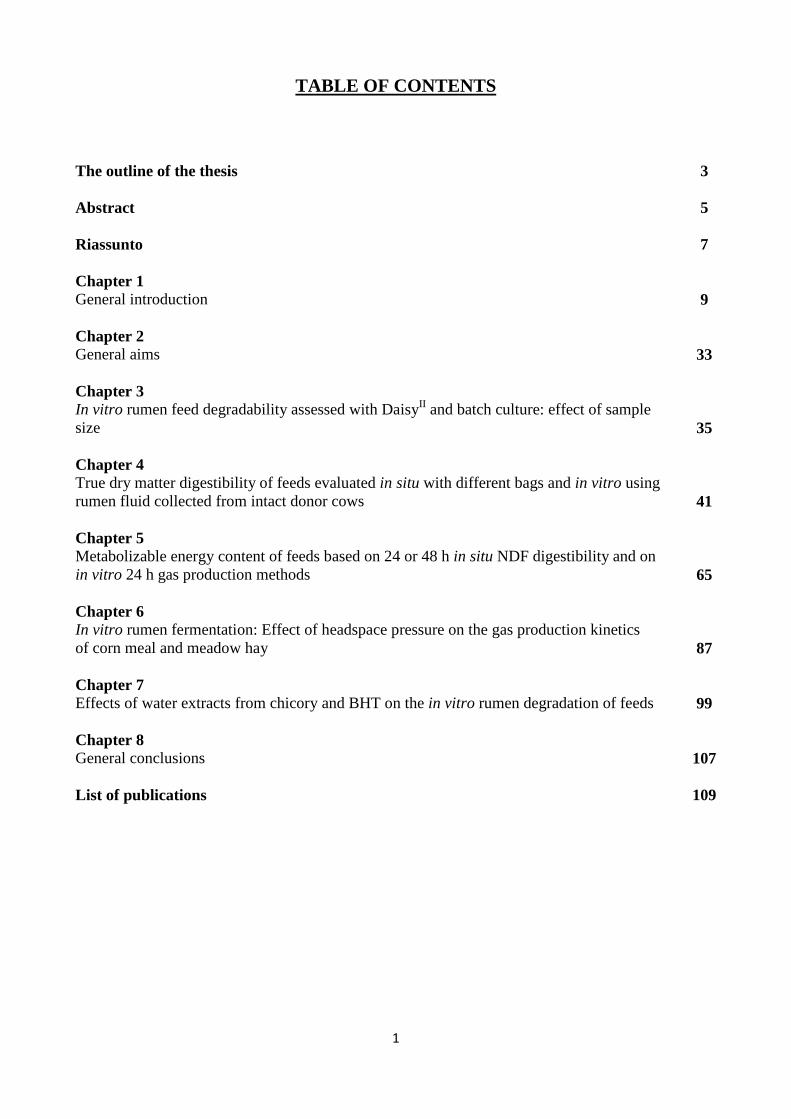
TABLE OF CONTENTS
The outline of the thesis
3
Abstract
5
Riassunto
7
Chapter 1 General introduction
9
Chapter 2 General aims
33
Chapter 3 In vitro rumen feed degradability assessed with DaisyII and batch culture: effect of sample size
35
Chapter 4 True dry matter digestibility of feeds evaluated in situ with different bags and in vitro using rumen fluid collected from intact donor cows
41
Chapter 5 Metabolizable energy content of feeds based on 24 or 48 h in situ NDF digestibility and on in vitro 24 h gas production methods
65
Chapter 6 In vitro rumen fermentation: Effect of headspace pressure on the gas production kinetics of corn meal and meadow hay
87
Chapter 7 Effects of water extracts from chicory and BHT on the in vitro rumen degradation of feeds
99
Chapter 8 General conclusions
107
List of publications 109

2
3
The outline of the thesis
The present PhD thesis includes a general description of the techniques (in vivo, in situ and
in vitro) which are commonly employed for studying rumen fermentation process. The techniques
are described focusing on methodologies, equipment, main sources of variation, strength and
weakness points of each technique (Chapter 1). In Chapter 2 the general aims of five scientific
contributes (4 methodological and 1 applicative) are given. In Chapters 3, 4, 5 and 6, the core of the
thesis, four methodological contributes are given. Chapter 7 provides the results of an applicative
contribute. Three of the five contributes have been already published in scientific papers (Chapters
3, 6 and 7), whereas the other two have been submitted to scientific journals (Chapters 4 and 5).
The last chapter (Chapter 8) reports the general conclusions. Figure 1 represents schematically the
contents of the present thesis.
4
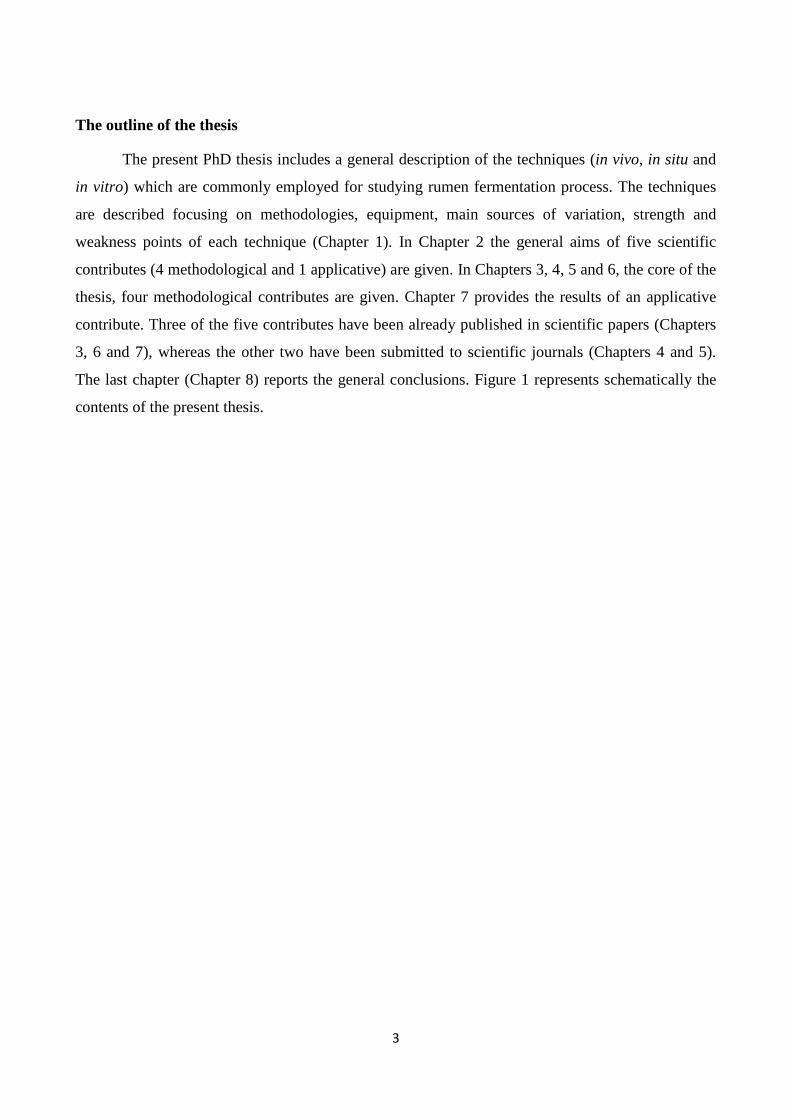
Figure 1. The outline of the thesis.
Chapter 1 General introduction
Chapter 2 General aims
Chapter 3 In vitro rumen feed
degradability assessed with DaisyII and
batch culture: effect of sample size
Chapter 7 Effects of water extracts
from chicory and BHT on the in vitro
rumen degradation of feeds
Chapter 4 True dry matter digestibility
of feeds evaluated in situ with different
bags and in vitro using rumen fluid
collected from intact donor cows
Chapter 5 Metabolizable energy
content of feeds based on 24 or 48 h in
situ NDF digestibility and on in vitro
24 h gas production methods
Chapter 6 In vitro rumen fermentation:
Effect of headspace pressure on the gas
production kinetics of corn meal and
meadow hay
Chapter 8 General conclusions
5
Abstract
The general aim of this thesis was to study rumen fermentation processes using in situ and in
vitro digestibility and in vitro gas production techniques. The thesis includes the results of five
experiments. The first experiment investigated the validity to reduce the amount of feed sample
incubated in filter bags with DaisyII (from 0.50 to 0.25 g feed/bag). This hypothesis was verified by
considering the results of two separate trials (conducted on 4 and 7 feeds, respectively) in which the
digestibility values provided by DaisyII were compared with those achieved using a conventional
batch culture. Results evidenced that, by using the lower sample size (0.25 g feed/bag), digestibility
values provided by DaisyII resulted more similar, less variable and better correlated with those
achieved with the batch culture.
The second experiment was conducted on 11 feeds and compared the digestibility values
achieved: i) in situ and in vitro using two different kinds of bag (nylon and filter) with a different
pore size (40 and 25 µm); ii) in situ, placing the bags in the rumen environment, and in vitro using
rumen fluid collected from intact cows by a suction technique. Results of the experiment showed
that the use of filter bags induced a systematic, but predictable, underestimation of digestibility
values compared to the nylon bags. Rumen fluid collected from intact cows provided digestibility
values directly proportional to those obtained in situ. This latter result is relevant, as the validity of
using rumen fluid collected from intact cows can be of interest for many research centers, in order
to overcome ethical and public concerns related to the use of surgically treated animals.
The third experiment was conducted on the same feeds analysed in the second experiment
and it was aimed to compare the energy value of feeds estimated using three different equations: i)
one equation based on feed chemical composition and in situ digestible NDF at 48 h of incubation
(MENRC); ii and iii) two equations based on feed chemical composition and in vitro gas production
at 24 h of incubation (MEMenke and MEUCD). A further aim was to evaluate the validity of reducing
the in situ incubation time from 48 to 24 h. Results of the trial evidenced that, when MENRC
estimates were taken as reference, MEUCD equation provided feed energy estimates more accurate
and precise compared to MEMenke. However, the accuracy and precision of MEMenke estimates
increased when four feeds rich in protein (CP > 16% DM) were excluded from the analysis. As the
in situ digestibility values achieved at 24 and 48 h were highly correlated and showed a comparable
reproducibility, the reduction of in situ incubation time from 48 to 24 h seems can be proposed for
reducing the cost of the tests.
6
The fourth experiment was aimed to compare the effects of two different systems of gas
release (venting at fixed times or at fixed pressure) on gas production (GP) kinetics provided by two
feeds with a different degradability (meadow hay and corn meal), using an innovative GP system.
Results of the experiment showed that the venting system exerted significant effects on GP kinetics.
The effects were particularly accentuated for corn meal and for venting at fixed times. Therefore,
when venting at fixed times is applied, the headspace volume of GP system, the venting frequency
and the amount of fermentable matter incubated must be carefully balanced to avoid the generation
of high pressures, which could alter GP kinetics. However, venting at fixed pressure is preferable to
that at fixed times, as it can strongly reduce these shortcomings.
The fifth experiment aimed to evaluate the effects of increasing dosages of two antioxidants
(BHT and a red chicory extract) on some in vitro rumen parameters, when they are incubated with
meadow hay and corn meal. Results of the experiment showed that the two antioxidants exerted
only small effects on rumen degradability, GP kinetics and volatile fatty acids profile. At the
highest dosage, the red chicory extract showed to improve the efficiency of nitrogen utilization in
the rumen, by increasing the amount of nitrogen captured by rumen microbes and utilized for
microbial protein synthesis.
7
Riassunto
Lo scopo generale del presente lavoro di tesi è stato quello di studiare le fermentazioni
ruminali mediante la tecnica in situ, e le più moderne tecniche in vitro che valutano la digeribilità e
la produzione di gas degli alimenti zootecnici. La tesi comprende i risultati di 5 diverse prove
sperimentali. L’obiettivo della prima prova è stato quello di valutare la possibilità di ridurre la
quantità di campione alimentare incubato all’interno dei filter bags previsti dal sistema DaisyII (da
0,50 a 0,25 g di alimento/filter bag). La suddetta ipotesi è stata verificata analizzando i risultati
ottenuti in due differenti prove sperimentali, condotte rispettivamente su 4 e 7 alimenti, il cui
comune obiettivo era il confronto dei valori di digeribilità forniti dal DaisyII e da un sistema in vitro
tradizionale. I risultati ottenuti hanno dimostrato che, con l’incubazione di 0,25 g di alimento/filter
bag, i valori di digeribilità forniti dal DaisyII risultavano complessivamente meno variabili, meglio
correlati e comparabili con quelli forniti dal sistema in vitro tradizionale.
La seconda prova sperimentale è stata condotta su 11 alimenti e si poneva l’obiettivo di
confrontare i valori di digeribilità ottenuti: i) in situ, attraverso l’impiego di due diversi tipi di
sacchetto (nylon e filter bags) caratterizzati da una differente porosità (40 e 25 µm); in situ,
incubando i campioni alimentari direttamente nel rumine dell’animale, ed in vitro, incubando i
campioni alimentari con liquido ruminale prelevato mediante sonda esofagea da bovine non
fistolate. I risultati della prova hanno evidenziato che l’utilizzo dei filter bags, in sostituzione dei
nylon bags, induceva una sottostima sistematica, ma comunque stimabile, dei valori di digeribilità
degli alimenti. I campioni alimentari incubati in vitro con liquido ruminale prelevato da bovine non
fistolate hanno fornito valori di digeribilità direttamente proporzionali a quelli incubati in situ. Un
tale risultato è sicuramente soddisfacente: la possibilità di utilizzare liquido ruminale prelevato da
bovine non fistolate può rappresentare infatti un’importante opportunità per molti centri di ricerca,
consentendo di superare le problematiche di natura etica legate all’impiego di bovine sottoposte ad
operazione chirurgica per l’applicazione di fistole ruminali permanenti.
La terza prova sperimentale è stata condotta sugli stessi alimenti impiegati nel secondo
contributo e si poneva l’obiettivo di determinare il valore energetico degli alimenti applicando tre
differenti equazioni: i) un’equazione basata sulla composizione chimica dell’alimento e sul valore
di digeribilità della fibra misurato in situ dopo 48 h di incubazione (MENRC); ii e iii) due equazioni
basate sulla composizione chimica dell’alimento e sulla produzione di gas misurata in vitro dopo 24
h di incubazione (MEMenke e MEUCD). Un secondo scopo era quello di valutare la possibilità di
ridurre il tempo di incubazione in situ da 48 a 24 h. I risultati della prova hanno dimostrato che,
prendendo come riferimento le stime di valore energetico ottenute applicando l’equazione MENRC,
8
l’equazione MEUCD forniva stime più accurate e precise rispetto all’equazione MEMenke. Tuttavia, il
livello di accuratezza e di precisione dell’equazione MEMenke è migliorato notevolmente escludendo
i quattro alimenti proteici (PG > 16% SS) dall’analisi. Poiché i valori di digeribilità ottenuti in situ a
24 e a 48 h sono risultati fortemente correlati e hanno evidenziato una riproducibilità comparabile,
la riduzione del tempo di incubazione in situ da 48 a 24 h può rappresentare una valida soluzione al
fine di contenere i costi di analisi.
La quarta prova sperimentale ha valutato gli effetti di due diverse modalità di rilascio del gas
(a tempi fissi oppure a pressione fissa) sulle cinetiche di produzione di gas fornite da due alimenti
caratterizzati da un differente livello di degradabilità ruminale (un fieno di graminacee e una farina
di mais). Ai fini della prova è stato utilizzato un sistema innovativo per la misurazione del gas
prodotto dalla fermentazione di matrici alimentari. I risultati della prova hanno evidenziato che la
modalità di rilascio del gas ha condizionato significativamente le produzioni di gas fornite dai due
alimenti. Tali effetti sono risultati particolarmente rilevanti nel caso della farina di mais e nel caso
del rilascio a tempi fissi. Alla luce di questi risultati, quando si adotta la modalità di rilascio a tempi
fissi, lo spazio di testa del sistema, la frequenza di rilascio del gas e la quantità di campione
alimentare incubato dovrebbero essere opportunamente bilanciati per evitare lo sviluppo di
pressioni molto elevate all’interno del sistema, le quali potrebbero alterare le normali cinetiche di
produzione del gas. Comunque, al fine di ridurre tali rischi, l’impiego di sistemi che rilasciano il gas
a pressione fissa è da ritenersi preferibile.
La quinta prova sperimentale ha valutato gli effetti di due sostanze antiossidanti (il BHT ed
un estratto di radicchio) dosate a due livelli differenti ed incubate con farina di mais e fieno di
graminacee, sui principali parametri ruminali. I risultati della prova hanno evidenziato che i due
antiossidanti hanno esercitato effetti poco rilevanti sulla degradabilità ruminale, sulle produzioni di
gas e sui profili acidici forniti dai due alimenti. Al dosaggio più elevato, l’estratto di radicchio ha
tuttavia migliorato il bilancio azotato ruminale, favorendo un aumento significativo della quota di
azoto impiegato dai microorganismi ruminali per la sintesi di proteina batterica.
9
CHAPTER 1
General introduction
1. General aspects
Feeding can account for up to 60% of the costs for animal farms, so the nutritional evaluation of
ruminant feeds and the formulation of well-balanced diets which can meet requirements of animals
represent important challenges in livestock production (Adesogan, 2002). The evaluation of a feed
is defined as “the description of a feed for its ability to sustain different types and levels of animal
performance” (France et al., 2000). The ability of a feed to sustain animal performance depends
mainly on its digestibility. Feed digestibility is influenced by its chemical (carbohydrate, protein
and fat content) and physical (feed particles size) characteristics, as these properties affect
capability of digestive enzymes to colonize and digest the feed particles (Kitessa et al., 1999). The
digestibility of ruminant feeds can be evaluated using different techniques. These techniques can be
classified as: i) biological methods, which involve the direct use of the animals, by digesting feeds
in the rumen of the animals (in vivo and in situ methods); ii) laboratory methods, which do not
require the use of animals and simulate rumen environment and digestion process using rumen fluid
collected from donor animals (in vitro methods).
1.1. In vivo technique: principles of method and shortcomings
The reference method to evaluate the nutritional value of feeds is the in vivo digestibility, which
estimates the digestibility from total collection of faeces (McDonald et al., 1981). This method is
known as “total collection technique” and involves to fed a known amount of the tested feed to a
group of animals, which are housed in individual cages to allow a measurement of daily feed intake
and the total collection of faeces. Faeces are chemically analyzed to estimate digestibility of feed
dry matter or of specific nutrients. Although this method is the most reliable for evaluation of feed
digestibility, it appears laborious, time-consuming and expensive, and so not suitable for a routine
and large-scale feed evaluation (Stern et al., 1997). An alternative technique is the “marker
technique”, which does not require the total collection of faeces, as it estimates feed digestibility by
using markers (Stern and Satter, 1982). Feed digestibility is computed as ratio between marker
concentration in the faeces and in the feed, so the results can be influenced by kind of marker used
(McDonald et al., 1981). A great limit of the total collection and marker techniques is that they
provide information about the extent of digestibility, but not about kinetics of feed digestion

10
(Kitessa et al., 1999). Moreover, some sources of variation can influence the results, as: i) animal
characteristics (sex, age, breed, and so on...); ii) feed characteristics (particle size, chemical
treatments, associative effects between feeds, and so on…) (McDonald et al., 1981; Kitessa et al.,
1999).
1.2. In situ technique: principles of method and shortcomings
The in situ technique (known also as in sacco or nylon bag technique) was originally introduced
by Quin et al. (1938), and studied degradability of ruminant feeds by incubating feed samples into
silk bags placed in the rumen of fistulated sheep. Subsequently, the silk bags were replaced with
nylon bags (Erwin and Elliston, 1959; Johnson, 1966; Rodriguez, 1968). According to the method
of Quin et al. (1938), nylon bag technique involves the incubation of feed samples into nylon bags
which are placed in the rumen of fistulated animals. The protocol involves to extract and weigh the
bags at fixed times (after 0, 2, 4, 8, 12, 24, 36, 48, 72 and 144 h of incubation) for measuring the
progressive disappearance of feed from the bags, providing information both about rate and extent
of feed digestion (Mehrez and Ørskov, 1977; Kitessa et al., 1999). Over the years, the nylon bag
technique has been largely employed to evaluate rumen degradability of feeds (Emanuele and
Staplens, 1988; Trabalza Marinucci et al., 1992; Spanghero et al., 2003; Gosselink et al., 2004;
Damiran et al., 2008) and was found to predict well the in vivo digestibility (Demarquilly and
Chenost, 1969; Fonseca et al., 1998). However, the technique still appears poorly standardized and
plagued by low repeatability and reproducibility (Michalet-Doreau and Ould-Bah, 1992; Madsen
and Hvelplund, 1994). As reviewed by several Authors (Michalet-Doreau and Ould-Bah, 1992;
Vanzant et al., 1998; Kitessa et al., 1999), a first important source of variation is represented by bag
porosity. The appropriate bag porosity should allow influx of rumen fluid and, efflux of digested
feed particles, and retention of feed particles not yet fermented (Mehrez and Ørskov, 1977). When
the bag porosity is too small (< 35 µm), microbial population could be sorted by size (Meyer and
Mackie, 1986) and the digested particles could be retained in the bags, with a consequent occlusion
of bag pores and accumulation of gases inside the bags (Uden et al., 1974; Nocek et al., 1979;
Nocek and Hall, 1984; Uden and Van Soest, 1984). On the opposite, a too large porosity (50-60
µm) could potentially facilitate the escape of feed particles not yet digested from the bags (Vanzant
et al., 1998). Several studies (Playne et al., 1978; Lindberg and Knutsson, 1981; Michalet-Doreau
and Cerneau, 1991) reported that the escape of feed particles from the bags increased with bag
porosity. Currently there is still a debate about what is the optimal bag pore size for in situ studies.
In relation to counts of protozoa and bacteria, Meyer and Mackie (1986) indicated that a bag pore
11
size of 30-53 µm could be an appropriate range, whereas Vanzant et al. (1998) recommended a pore
size included from 20 to 60 µm. On the basis of the bag porosity, an appropriate grinding size of
feed samples should be chosen (Michalet-Doreau and Ould-Bah, 1992). Feed samples are
commonly ground to pass a sieve prior to in situ incubation. However, despite of several attempts to
standardize the procedure, a wide range of different grinding sizes has been used (Stern et al.,
1997). Nocek (1985) indicated that the grinding procedure should reproduce the effects of
rumination and that feed sample size should be more similar as possible to the size of ruminated
feed. Generally, a coarse grinding size (4-5 mm) is associated with lower and slower digestion rates,
whereas a fine grinding size (< 2-3 mm) is supposed to facilitate the escape and the loss of feed
particles from the bag (Michalet-Doreau and Ould-Bah, 1992). Lindberg and Knutsson (1981)
observed that escape of feed particles from the bags increased by reducing the grinding size from
4.5 to 1 mm, whereas Others (Michalet-Doreau and Cerneau, 1991; Damiran et al., 2008) indicated
that the material losses could be influenced by the distribution of feed particles inside the bags.
Moreover, Dewhurst et al. (1995) argued that losses from the bags could be higher for concentrates
and by-products, as these feeds contain a larger proportion of soluble materials. The guideline is to
grind feeds on the basis of their chemical composition: Nocek (1988) suggested to use a 2 mm-
screen for high-protein feeds, and a 5 mm-screen for more fibrous feeds (grains, by-products and
roughages). Vanzant et al. (1998) reported that in situ studies used commonly a grinding size
ranging from <1 to 6 mm and, from the review of 53 experiments, they found that the large part of
the published experiments used a 2-mm screen (34) or a 1-mm screen (11). Generally, the choose of
1-mm screen should be preferred to simplify and standardize the laboratory procedures, as chemical
analyses of feeds are commonly performed on feed samples passed to a 1-mm screen. The choose
of an appropriate grinding size appears important because this factor can influence the ratio between
feed sample size and bag surface area (SS:SA, expressed as mg/cm2). Literature has well
documented that a change of SS:SA can alter influx of rumen fluid, efflux of digested feed particles
and retention of those not yet fermented (Nocek, 1985; Michalet-Doreau and Ould-Bah, 1992;
Vanzant et al., 1998). Despite of several attempts to standardize SS:SA, literature reports a large
number of different ratios. From the comparison between 73 in situ studies, Vanzant et al. (1998)
observed that the largest part of trials (41) used a SS:SA ranging from 10 to 20 mg/cm2, but also
SS:SA > 20 mg/cm2 and < 10 mg/cm2 were tested (in 12 and 20 trials, respectively). This is a great
shortcoming of nylon bag technique, as SS:SA was found to affect significantly degradability
measures. Several Authors (Van Keuren and Heinemann, 1962; Figroid et al., 1972; Van Hellen and
Ellis, 1977; Varga and Hoover, 1983) noted that in situ degradation of feeds decreased significantly
by increasing SS:SA, whereas Mehrez and Ørskov (1977) found that degradability values resulted
12
higher and less repeatable by decreasing SS:SA from 54 to 16 mg/cm2. Mehrez and Ørskov (1977)
suggested that use of large SS:SA could reduce feed degradation, as influx of rumen fluid and
efflux of digested particles from the bag could be limited. On the basis of these results, it is difficult
to establish what SS:SA allows to achieve the most accurate degradability measures. From results
reported by literature, Vanzant et al. (1998) suggested to use a low SS:SA (10 mg/cm2), as greater
differences and variability were found by using high SS:SA. However, a possible recommendation
could be that the choose of SS:SA should vary on the basis of bag and sample characteristics. As
confirmation of that, Playne et al. (1978) observed that in situ degradation of different roughages
did not change when sample size was triplicated and SS:SA was kept constant by increasing bag
size.
1.3. In vitro techniques
In the last years the use of in situ technique has been strongly criticized by public opinion for
the need of fistulated animals and has raised ethical and moral issues about animal welfare (Stern et
al., 1997). Moreover, high associated costs and limited analytical capacity of in situ technique have
led to the development of alternative in vitro techniques, which carried out some important
advantages: i) they do not involve the direct use of animals; ii) they are less laborious and more
suitable for a large-scale evaluation of ruminant feeds. The in vitro techniques can be classified as:
i) methods which measure the digestibility of feeds (Tilley and Terry, 1963; Goering and Van
Soest, 1970; Czerkawski and Breckenridge, 1977); ii) methods which measure gas production from
feed fermentation (Menke et al., 1979).
1.3.1. Digestibility techniques: equipment and shortcomings
The first digestibility techniques consisted in batch cultures (Tilley and Terry, 1963;
Goering and Van Soest, 1970). These methods involved a first 48-h incubation of feed samples into
individual vessels with buffered rumen fluid, followed by a second 48-h incubation with pepsin in
an acid solution (Tilley and Terry, 1963), or with a neutral detergent solution (Goering and Van
Soest, 1970). Although these methods have been largely validated with in vivo values (Van Soest,
1994), they are plagued by several disadvantages: i) they give an end-point measurement; ii) they
do not provide information about kinetics of feed digestion; iii) they are laborious and time-
consuming; iv) they involve the use of rumen fluid collected from fistulated animals and, hence,
13
they do not allow to solve public ethical concerns about animal welfare. Afterwards, Czerkawski
and Breckenridge (1977) have developed a long-term rumen simulation technique (RUSITEC),
consisting in eight vessels in which feed samples (20 g) were placed into nylon bags and digested
with rumen fluid collected from fistulated animals. The particularity of RUSITEC is that a solution
of artificial saliva (McDougall, 1948) is continuously infused in the system to maintain pH and to
reproduce the continuous influx of saliva in the rumen. This technique has been widely employed
for different applications, as for evaluating forage digestibility (Akhter et al., 1996; Tejido et al.,
2002), changes in rumen microbial population (Newbold et al., 1998) , microbial growth in the
rumen (Carro and Miller, 1999), effects of essential oil compounds on rumen fermentations
(Newbold et al., 2004). However, RUSITEC appears to be a labor and time-consuming technique,
so it has a low suitability for a routine analysis of ruminant feeds (Stern et al., 1999). To overcome
some of these shortcomings, the research for more efficient and less animal dependent techniques
has led to the development of alternative methods, as DaisyII incubator (Ankom Technology®,
Macedon, NY, USA). Compared to Tilley and Terry (1963) and Goering and Van Soest (1970)
methods, the DaisyII one leads to an improvement of labor efficiency, as it allows to analyze
simultaneously up to 100 feed samples. Several Authors (Holden, 1999; Wilman and Adesogan,
2000; Spanghero et al., 2003; Spanghero et al., 2007; Damiran et al., 2008) found that this
instrument provided digestibility measures well correlated with the nylon bag and other in vitro
techniques. An important similarity between DaisyII and the nylon bag technique is the incubation
of feed samples into bags. As consequence, also the results achieved with DaisyII can be
significantly influenced by the bag and the sample characteristics, as described for the nylon bag
technique. Tagliapietra et al. (2008), from a comparison between DaisyII and a conventional batch
culture, noted that the digestibility values achieved with DaisyII were constantly lower and less
repeatable, and attributed this result to a barrier effect exerted by the bags, which altered the normal
income and outcome of rumen fluid and feed particles. Despite of many attempts to standardize the
procedure, there is still a confusion about what sample size allows to achieve the most accurate
measures with DaisyII, as some Authors (Holden, 1999; Mabjeesh et al., 2000; Tagliapietra et al.,
2008) incubated 0.50 g feed sample/bag, whereas Others (Robinson et al., 1999; Spanghero et al.,
2003) preferred 0.25 g. The bags incubated with DaisyII are smaller than those commonly used for
in situ trials and have a different texture and porosity (F57 filter bags; 4.5x4.0 mm; proved to retain
particles > 25 µm; Ankom Technology®, Macedon, NY, USA). Recently, Damiran et al. (2008)
compared F57 filter bags and standard nylon bags, and the two feed sample sizes more commonly
used (0.25 and 0.50 g feed sample/filter bag): they observed that the two kinds of bag provided
digestibility values highly correlated, and that the incubation of 0.50 g feed sample/filter bag
14
provided digestibility values better correlated with those achieved with the nylon bag technique.
Adesogan (2002, 2005) confirmed that the results achieved with DaisyII can be affected by the
amount of sample incubated into the filter bags, and observed that the replacement of F57 filter
bags with alternative bags allowed to improve the correlation with digestibility values obtained in
situ.
1.3.2. Gas production techniques: principles of the method
Differently from the digestibility techniques which aim to evaluate the substrate
disappearance, gas production (GP) method measures the appearance of fermentation products
(gases, volatile fatty acids, NH3) (Blummel and Ørskov, 1993; Makkar et al., 1995). When a feed is
incubated with buffered rumen fluid, it is degraded, and the degraded matter is partitioned to yield
gases (mainly CO2 and CH4), end-products of fermentation (volatile fatty acids and NH3), or
microbial biomass. The assumption that GP is linearly related to the rate and the extent of feed
digestion is questionable, as GP is strongly affected by feed chemical composition (Makkar, 2005).
It is generally accepted that gas is mainly produced from carbohydrate fermentation, whereas GP is
small for proteins and negligible for fats (Menke and Steingass, 1988; Getachew et al., 1997). Gas
produced from feed fermentation is also affected by fermentation patterns and is influenced by the
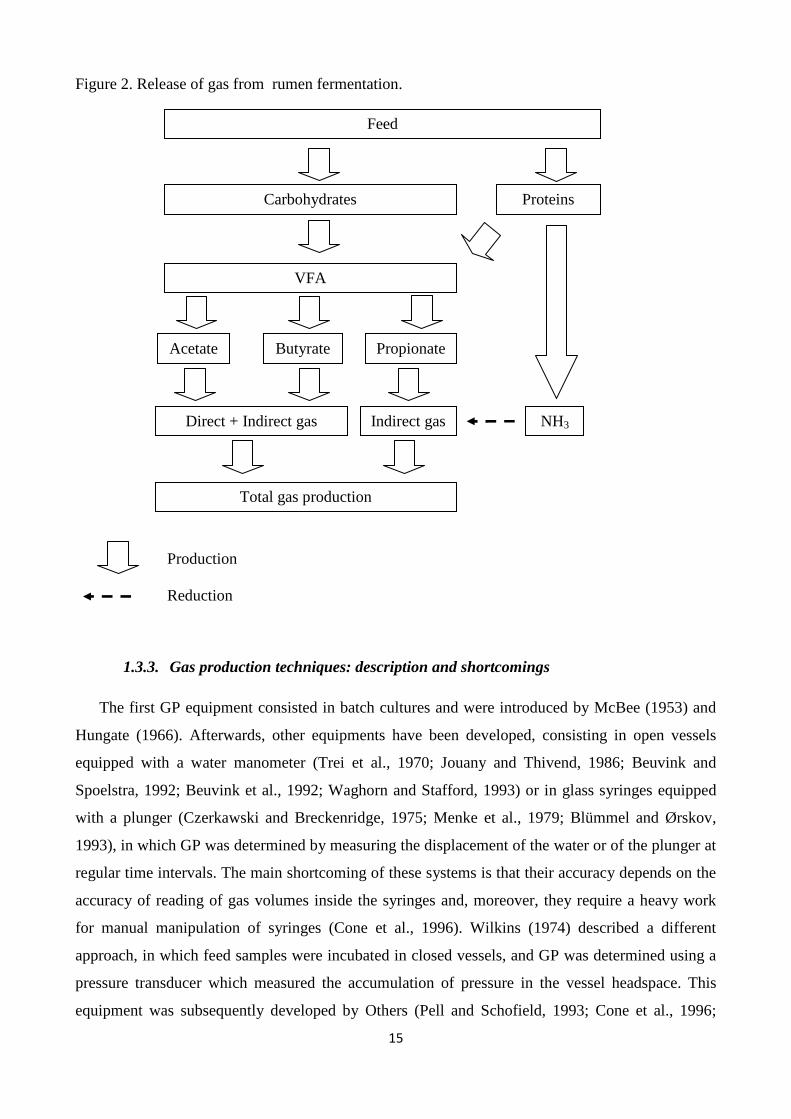
molar proportion of volatile fatty acids (VFA) in the rumen, as highlighted in Figure 2. The butyrate
and acetate formation release large amounts of CO2 and CH4, whereas propionate production does
not release gas of fermentation (Stern et al., 1997). However, GP originated from feed fermentation,
defined as “direct GP”, does not represent total GP, as a notable part of gas, defined as “indirect
GP”, is produced from buffering of VFA. From each mol of VFA produced, the bicarbonate buffer
releases about 1 mol of CO2. Makkar (2005) indicates that a starch-rich feed produces only 40% of
gas in a direct way, whereas the remaining 60% is produced indirectly from buffering of VFA.
Wolin et al. (1960), and afterwards Blummel et al. (1999), indicated that GP and VFA are
stoichiometrically related, so GP could be estimated from amount and proportion of VFA.
However, Cone et al. (1998) specified that the stoichiometrical relationship did not fit for protein-
rich feeds. According to this, Cone and Van Gelder (1999) observed that each percentage of protein
caused a reduction in GP of 2.48 ml and that the stoichiometry was altered for protein-rich feeds,
and attributed these results to the fact that protein fermentation produces NH3, which has an
inhibitory effect on the release of indirect gas. These findings were confirmed by Schofield (2000).
15
Figure 2. Release of gas from rumen fermentation.
Production
Reduction
1.3.3. Gas production techniques: description and shortcomings
The first GP equipment consisted in batch cultures and were introduced by McBee (1953) and
Hungate (1966). Afterwards, other equipments have been developed, consisting in open vessels
equipped with a water manometer (Trei et al., 1970; Jouany and Thivend, 1986; Beuvink and
Spoelstra, 1992; Beuvink et al., 1992; Waghorn and Stafford, 1993) or in glass syringes equipped
with a plunger (Czerkawski and Breckenridge, 1975; Menke et al., 1979; Blümmel and Ørskov,
1993), in which GP was determined by measuring the displacement of the water or of the plunger at
regular time intervals. The main shortcoming of these systems is that their accuracy depends on the
accuracy of reading of gas volumes inside the syringes and, moreover, they require a heavy work
for manual manipulation of syringes (Cone et al., 1996). Wilkins (1974) described a different
approach, in which feed samples were incubated in closed vessels, and GP was determined using a
pressure transducer which measured the accumulation of pressure in the vessel headspace. This
equipment was subsequently developed by Others (Pell and Schofield, 1993; Cone et al., 1996;
Feed
VFA
Proteins
Direct + Indirect gas Indirect gas NH3
Acetate Butyrate Propionate
Total gas production
Carbohydrates
16
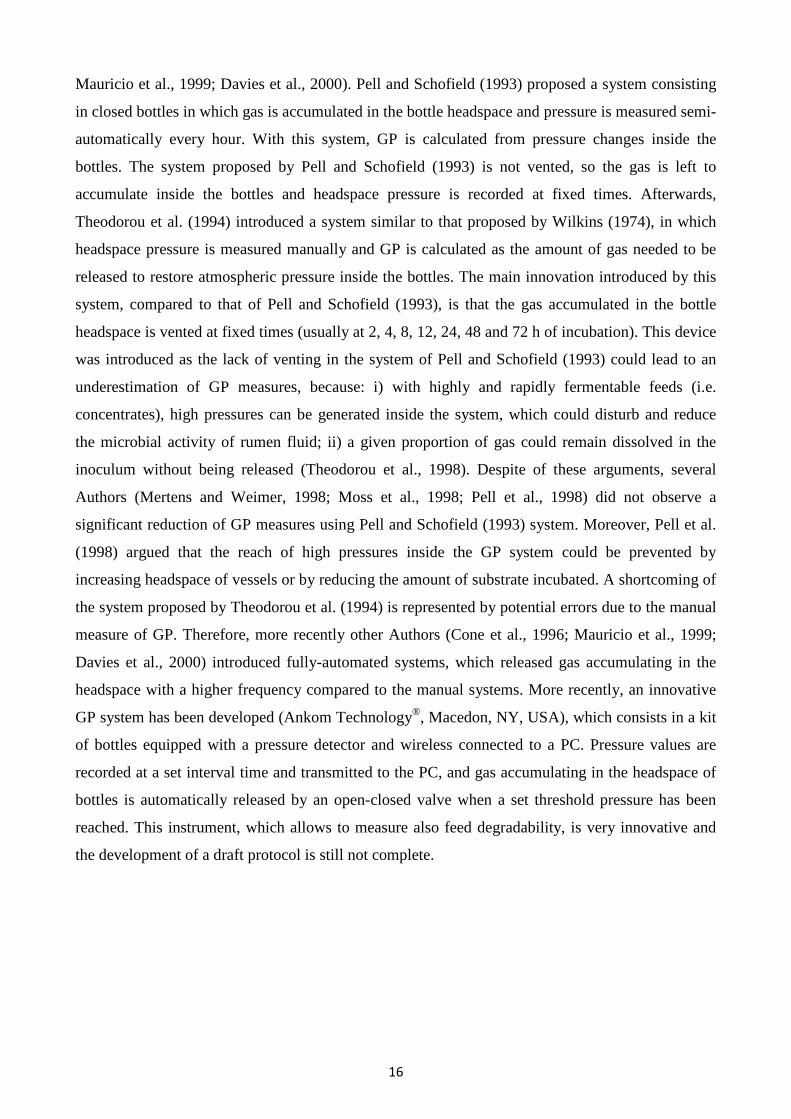
Mauricio et al., 1999; Davies et al., 2000). Pell and Schofield (1993) proposed a system consisting
in closed bottles in which gas is accumulated in the bottle headspace and pressure is measured semi-
automatically every hour. With this system, GP is calculated from pressure changes inside the
bottles. The system proposed by Pell and Schofield (1993) is not vented, so the gas is left to
accumulate inside the bottles and headspace pressure is recorded at fixed times. Afterwards,
Theodorou et al. (1994) introduced a system similar to that proposed by Wilkins (1974), in which
headspace pressure is measured manually and GP is calculated as the amount of gas needed to be
released to restore atmospheric pressure inside the bottles. The main innovation introduced by this
system, compared to that of Pell and Schofield (1993), is that the gas accumulated in the bottle
headspace is vented at fixed times (usually at 2, 4, 8, 12, 24, 48 and 72 h of incubation). This device
was introduced as the lack of venting in the system of Pell and Schofield (1993) could lead to an
underestimation of GP measures, because: i) with highly and rapidly fermentable feeds (i.e.
concentrates), high pressures can be generated inside the system, which could disturb and reduce
the microbial activity of rumen fluid; ii) a given proportion of gas could remain dissolved in the
inoculum without being released (Theodorou et al., 1998). Despite of these arguments, several
Authors (Mertens and Weimer, 1998; Moss et al., 1998; Pell et al., 1998) did not observe a
significant reduction of GP measures using Pell and Schofield (1993) system. Moreover, Pell et al.
(1998) argued that the reach of high pressures inside the GP system could be prevented by
increasing headspace of vessels or by reducing the amount of substrate incubated. A shortcoming of
the system proposed by Theodorou et al. (1994) is represented by potential errors due to the manual
measure of GP. Therefore, more recently other Authors (Cone et al., 1996; Mauricio et al., 1999;
Davies et al., 2000) introduced fully-automated systems, which released gas accumulating in the
headspace with a higher frequency compared to the manual systems. More recently, an innovative
GP system has been developed (Ankom Technology®, Macedon, NY, USA), which consists in a kit
of bottles equipped with a pressure detector and wireless connected to a PC. Pressure values are
recorded at a set interval time and transmitted to the PC, and gas accumulating in the headspace of
bottles is automatically released by an open-closed valve when a set threshold pressure has been
reached. This instrument, which allows to measure also feed degradability, is very innovative and
the development of a draft protocol is still not complete.
17
2. Feed evaluation techniques: effect of quality of rumen fluid
As outlined in the previous subchapters, many different factors can potentially influence or alter
digestibility and GP measures. Each technique has its own limitations and weakness points, and all
the different sources of variation must to be taken in account. However, it is largely recognized that
a common source of variation of in vivo, in situ and in vitro techniques is represented by the quality
of rumen fluid (Mould et al., 2005). Literature indicates that the quality of rumen fluid, in terms of
number and kind of microbial population, is mostly influenced by diet composition (Bryant and
Burkey, 1953; Makir and Foster, 1957) and by feeding frequency (Thorley et al., 1968). In vivo and
in situ trials should be preferably conducted in animals consuming the feeds or the diets of interest,
to limit the diet effects and to achieve a rumen fluid “ideal” in terms of microbial population
(Vanzant et al., 1998; Kitessa et al., 1999). As confirmation of that, some Authors (Lindberg, 1981;
Cronje, 1992) noted that in situ digestion of forages was higher in rumens of animals usually fed
forage-based diets compared to that of animals receiving high-concentrate diets. Among forage
diets, the kind of forage offered to the animals was found to influence rate and extent of in situ
digestion (Van Keuren and Heinemann, 1962; Hopson et al., 1963; Vanzant et al., 1996). Despite of
these shortcomings, the great advantage of in situ technique, compared to in vitro techniques, is that
this method digests feeds in the actual rumen environment. However, as previously mentioned, the
adoption of in situ techniques is declining for ethical and moral issues related to animal welfare
(Adesogan, 2002). Currently, it is becoming increasingly difficult for research centres to obtain the
licenses required to surgically prepare the animals and, as consequence, many laboratories are
moving toward in vitro techniques which use rumen fluid collected from intact animals. When
rumen fluid is taken from intact cows, the greatest challenge is to achieve a representative sample in
terms of microbial population and concentration (Mould et al., 2005). It is largely accepted that a
correct sampling procedure should avoid oxygen and saliva contamination of rumen fluid (Mould et
al., 2005). Saliva contamination could modify pH and alter fermentation patterns, as indicated by
Raun and Burroughs (1962), whereas oxygen contamination could reduce or completely inhibit
activity and growth of anaerobic rumen microorganisms (Hungate, 1966). Similarly to what
observed in situ, literature reports that in vitro digestibility of forages decreased when rumen fluid
was collected by donor animals consuming high-concentrate diets (Russell and Wilson, 1996;
Tejido et al., 2002; Vargas et al., 2009). To this regard, some Authors (Bryant and Burkey, 1953;
Makir and Foster, 1957) observed that high-concentrate diets significantly affected microbial count
of rumen fluid. Differently from what reported for digestibility values, the diet fed to donor animals
was found to exert small effects on GP kinetics (Schöner et al., 1981; Menke and Steingass, 1988;
Cone et al., 1996; Nagadi et al., 2000). Nagadi et al. (2000) argued that the real challenge should be

18
feeding diets which allow to attain the minimal microbial activity to ensure GP. Cone et al. (1996)
found that microbial activity of rumen fluid was significantly affected by the timing of collection, as
they noted a greater microbial activity in rumen fluid collected after feeding. Menke and Steingass
(1988) hypothesized that the minimum microbial activity should be ensured by using rumen fluid
collected from animals fed within the previous 16 h. However, the same Authors suggested to use
rumen fluid collected before feeding, as it could have a less variable composition compared to that
collected after feeding.
3. Possible applications of feed evaluation techniques
Literature reports that feed evaluation techniques (in vivo, in situ and in vitro) can be employed
in several applications, as: i) the prediction of voluntary dry matter intake (Ørskov et al., 1988; Van
Soest, 1994; Blummel et al., 1997); ii) the study of the effects of lipids on microbial activity and
rumen fermentation (Chalupa et al., 1986; Ferguson et al., 1990; Michalet-Doreau et al., 1993;
Getachew et al., 2001); iii) the study of the effects of different additives on rumen fermentation
(Hino et al., 1993; Naziroğlu et al., 2002; Cardozo et al., 2004; Busquet et al., 2006; Alexander et
al., 2008); iv) the evaluation of associative effects between ruminant feeds (Rosales et al., 1998; Liu
et al., 2002; Sandoval-Castro et al., 2002). However, the main efforts are currently focused on the
accurate estimation of energy value of feeds and on the determination of rumen nitrogen balance, in
order to evaluate the efficiency of rumen fermentation process.
3.1. Estimation of feed energy value
The accurate evaluation of energy value of ruminant feeds represents a great challenge in order
to formulate well-balanced diets, which can meet animal requirements and support their
performance. Over the years, different energy systems have been developed for estimating energy
content of ruminant feeds, and different equations have been proposed. Weiss et al. (1992)
suggested to predict energy content of ruminant feeds from their chemical composition. The main
shortcoming of this approach is that it is a theoretical method and it does not take in account neither
the animal nor the feed characteristics (Kitessa et al., 1999). Alternative approaches proposed to
estimate energy value of feeds from analytical data about chemical composition (crude protein,
ether extract, ash content) and from:; i) the in vivo organic matter (OM) digestibility (INRA, 1988);
ii) the in situ or in vitro NDF digestibility (NDFD) at 48 h of incubation (NRC, 2001); iii) the in
19
vitro NDFD at 30 h of incubation (Robinson et al., 2004); iv) the in vitro GP at 24 h of incubation
(Menke and Steingass, 1988; Robinson et al., 2004). These approaches present significant
differences, as they involve the use of values obtained from different procedures of analysis (in
vivo, in situ or in vitro). The energy system proposed by INRA (1988) is complex, as the energy
value of feeds is predicted using in vivo OM digestibility values which were established from a
database composed by more than 300 feeds. The main US energy system (NRC, 2001) suggested to
use NDFD measured after 48 h of incubation, but it is not totally clear what technique should be
used for the determination (in situ or in vitro). To this regard, NRC (2001) simply indicated that in
vitro techniques should be preferred as more standardized. Also the predictive equations using GP
measures (Menke and Steingass, 1988; Robinson et al., 2004) are based on different approaches.
The European system (Menke and Steingass, 1988; Givens et al., 1989) proposed equations in
which the energy value of single nutrients is determined from in vivo digestibility studies with
sheep. Differently, the North-American system (Robinson et al., 2004) developed more general and
summative equations in which the energy contribution of each nutrient is computed in relation to
the total energy content of feed. Moreover, the two systems attributed to GP a different energy
value. The equations based on in situ or in vitro NDFD (NRC, 2001) usually consider 48 h as
reference incubation time, whereas those based on in vitro GP use 24 h (Menke and Steingass,
1988; Robinson et al., 2004). Currently, there is still a debate about what incubation time (24 or 48
h) allows to achieve the most accurate predictions of feed energy value. In fact, 24 h appears a time
closer to the retention time of feeds in the rumen, whereas the adoption of a longer incubation time
(48 h) can allow to achieve more accurate and more repeatable predictions, especially for those
feeds, as roughages, which are characterized by slower and more variable fermentation rates.
Recently, some Authors (Robinson et al., 2004; Spanghero et al., 2010) evaluated the possibility to
adopt an intermediate incubation time (30 h) for the estimation of in vitro NDFD. Spanghero et al.
(2010) found that predictions of feed energy content using NDFD at 30 h were less repeatable and
reproducible compared to those using NDFD at 48 h, whereas Robinson et al. (2004) found that the
use of in vitro NDFD measures at 30 h provided predictions better correlated with in vivo
digestibility, compared to those at 48 h.
20
3.2. Determination of rumen nitrogen balance and evaluation of efficiency of fermentation
process
As described above, when a feed is degraded in the rumen, the degraded matter is partitioned to
yield microbial protein, volatile fatty acids (VFA) and gases. The sum of microbial protein and
VFA represents the amount of feed energy which can be potentially used by the animals to meet
their requirements, whereas gases are the proportion of energy which is lost by the animals. The
accurate estimation of microbial protein synthesized in the rumen represents a great challenge in
animal feeding, as it is the most important protein source for ruminants (Beever, 1993; Leng, 1993).
Blümmel et al. (1997) have demonstrated that the combination of in vitro degradability and GP
measures can provide important information about the partition of feed energy in the rumen, and
can allow to estimate the in vitro microbial protein. As suggested by Blummel et al. (1997), the
amount of microbial protein synthesized in vitro can be calculated as the ratio between the total
amount (mg) of substrate degraded (TSD) and the GP (ml) adjusted for a stoichiometric factor, to
take in account for VFA production. This allows to estimate the efficiency of microbial protein
synthesis (EMPS), as ratio between the microbial protein (mg) and the TSD (mg). The accurate
estimation of EMPS is crucial in animal nutrition, and several ruminant feeding systems (NRC,
1996, 2001; Offer et al., 2002) include EMPS to predict animal performance. Blummel et al. (1999)
obtained a satisfactory correlation between EMPS estimated in vitro from GP and in vivo from the
urinary excretion of allantoin. However, there is still a debate about what incubation time allows to
achieve the most accurate estimates of microbial protein and EMPS. Several Authors (Blummel et
al., 1997; Blummel et al., 1998; Makkar and Becker, 1999; Getachew et al., 2000) noted that GP
and VFA production were inversely related to the amount of microbial protein, and that at
increasing incubation times GP and VFA production increased, whereas the microbial protein
declined, as reflection of microbial lysis. Therefore, Blummel et al. (1999) suggested to measure the
microbial protein at the time at which half of asymptotic GP is produced (defined as “t½”), as it can
be supposed that microbial activity is maximum and microbial lysis is minimum at this time. This
incubation time was subsequently adopted by Grings et al. (2005), which found a good correlation
between EMPS estimated in vitro and in vivo. However, further research is needed as other findings
evidenced that the accurate prediction of EMPS is affected by animal factors (AFRC, 1993), by
feed characteristics (Hespell and Bryant, 1979) and by the level of synchronization in the rumen
fermentation of N and carbohydrate sources (Sinclair et al., 1993).
21
References
Adesogan, A.T., 2002. What are feeds worth?: A critical evaluation of selected nutritive value
methods. Proceedings 13th Annual Florida Ruminant Nutrition Symposium, pp. 33-47.
Adesogan, A.T., 2005. Effect of bag type on the apparent digestibility of feeds in ANKOM DaisyII
incubators. Anim. Feed Sci. Technol. 119, 333-344.
Agricultural and Food Research Council (AFRC), 1993. Energy and Protein Requirements of
Ruminants. An Advisory Manual Prepared by the AFRC Technical Committee on Responses to
Nutrients. CAB International, Wallingford, UK.
Akhter, S., Owen, E., Hossain, M.M., 1996. Effluent from Rusitec inoculated with rumen liquor or
cow faeces as sources of micro-organisms for in vitro digestion of forages. Asian-Aust. J. Anim.
Sci. 9, 375-379.
Alexander, G., Singh, B., Bhat, T.K., 2008. In vitro screening of plant extracts to enhance the
efficiency of utilization of energy and N in ruminant diets. Anim. Feed Sci. Technol. 145, 229-
244.
Beever, D.E., 1993. Ruminant animal production from forages: present position and future
opportunities. In: Baker, M.J. (Ed.), Grasslands for Our World. SIR Publishing, Wellington, New
Zealand, pp. 158-164.
Beuvink, J., Spoelstra, S., 1992. Interactions between substrate, fermentation end-products,
buffering systems and gas production upon fermentation of different carbohydrates by mixed
rumen microorganisms in vitro. Appl. Microbiol. Biotechnol. 37, 505-509.
Beuvink, J., Spoelstra, S., Hogendorp, R., 1992. An automated method for measuring time course
of gas production of feedstuffs incubated with buffered rumen fluid. Neth. J. Agric. Sci. 40, 401-
407.
Blummel, M., Aiple, K.P., Steingass, H., Beckner, K., 1999. A note on the stoichiometrical
relationship of short chain fatty acid production and gas formation in vitro in feedstuffs of widely
differing quality. J. Anim. Physiol. Anim. Nutr. 81, 157-167.
Blummel, M., Becker, K., 1997. The degradability characteristics of fifty-four roughages and
roughage neutral-detergent fibres as described by in vitro gas production and their relationship to
voluntary feed intake. Brit. J. Nutr. 77, 757-768.
22
Blummel, M., Makkar, H.P.S., Becker, K., 1997. In vitro gas production: a technique revisited. J.
Anim. Physiol. Anim. Nutr. 77, 24-34.
Blummel, M., Ørskov, E.R., 1993. Comparison of in vitro gas production and nylon bag
degradability of roughage in predicting feed intake in cattle. Anim. Feed Sci. Technol. 40, 109-
119.
Bryant, M.P., Burkey, L.A., 1953. Number and some predominate groups of bacteria in the rumens
of cows fed different diets. J. Dairy Sci. 36, 218-224.
Busquet, M., Calsamiglia, S., Ferret, A., Kamel, C., 2006. Plant extracts affect in vitro rumen
microbial fermentation. J. Dairy Sci. 89, 761-771.
Cardozo, P.W., Calsamiglia, S., Ferret, A., Kamel, C., 2004. Effects of natural plant extracts on
ruminal protein degradation and fermentation profiles in continuous culture. J. Anim. Sci. 82,
3230-3236.
Carro, M.D., Miller, E.L., 1999. Effect of supplementing a fibre basal diet with different nitrogen
forms on ruminal fermentation and microbial growth in an in vitro semicontinuous culture
system (RUSITEC). Br. J. Nutr. 82, 149-157.
Chalupa, W.V., Vecchiarelli, B., Elser, A.E., Kronfeld, D.S., Sklan, D., Palmquist, D.L., 1986.
Ruminal fermentation in vivo as influenced by long-chain fatty acids. J. Dairy Sci. 69, 1293-
1301.
Cone, J.W., 1998. Influence of protein fermentation on gas production profiles. Proc. Soc. Nutr.
Physiol. 7, 36-43.
Cone, J.W, Van Gelder, A.H., 1999. Influence of protein fermentation on gas production profiles.
Anim. Feed Sci. Technol. 76, 251-264.
Cone, J.W., Van Gelder, A.H., Visscher, G.J.W., Oudshoorn, L., 1996. Influence of rumen fluid and
substrate concentration on fermentation kinetics measured with a fully automated time related
gas production apparatus. Anim. Feed Sci. Technol. 61, 113-128.
Cronjé, P.B., 1992. Effects of dietary roughage: concentrate ratio and rumen ammonia
concentration on in situ feedstuff degradation in the rumen of sheep. S. Afr. J. Anim. Sci. 22,
207-213.
23
Czerkawski, J.W., Breckenridge, G., 1975. New inhibitors of methane production by rumen micro-
organisms. Development and testing of inhibitors in vitro. Br. J. Nutr. 34, 429-444.
Czerkawski, J.W., Breckenridge, G., 1977. Design and development of a long-term rumen
simulation technique (Rusitec). Br. J. Nutr. 38, 371-389.
Damiran, D., DelCurto, T., Bohnert, D.W., Findholt, S.L., 2008. Comparison of techniques and
grinding size to estimate digestibility of forage based ruminant diets. Anim. Feed Sci. Technol.
141, 15-35.
Davies, Z.S., Mason, D., Brooks, A.E., Griffith, G.W., Merry, R.J., Theodorou, M.K., 2000. An
automated system for measuring gas production from forages inoculated with rumen fluid and its
use in determining the effect of enzymes on grass silage. Anim. Feed Sci. Technol. 83, 205-221.
Demarquilly, C., Chenost, M., 1969. Étude de la digestion des fourrages dans le rumen par la
méthode des sachets de nylon: liaison avec la valeur alimentaire. Ann. Zootech. 18, 419-436.
Dewhurst, R.J., Hepper, D., Webster, A.J.F., 1995. Comparison of in sacco and in vitro techniques
for estimating the rate and extent of rumen fermentation of a range of dietary ingredients. Anim.
Feed Sci. Technol. 51, 211-229.
Emanuele, S.M., Staples, C.R., 1988. Effect of forage particle size on in situ digestion kinetics. J.
Dairy Sci. 71, 1947-1954.
Erwin, E.S., Elliston, W.G., 1959. Rapid methods of determining the digestibility of concentrates
and roughage in cattle. J. Anim. Sci. 18, 15-18.
Ferguson, J.D., Sklan, D., Chalupa, W.V., Kronfeld, D.S., 1990. Effects of hard fats on in vitro and
in vivo rumen fermentation, milk production, and reproduction in dairy cows. J. Dairy Sci. 73,
2864-2879.
Figroid, W., Hale, W.H., Theurer, B., 1972. An evaluation of the nylon bag technique for estimating
rumen utilization of grains. J. Anim. Sci. 35, 113-120.
Fonseca, A.J.M., Dias da Silva, A.A., Ørskov, E.R., 1998. In sacco degradation characteristics as
predictors of digestibility and voluntary intake of roughages by mature ewes. Anim. Feed Sci.
Technol. 72, 205-219.
24
France, J., Theodorou, M.K., Lowman, R.S., Beever, D.E., 2000. Feed evaluation for animal
production. In: Theodorou, M.K., France, J. (Eds.), Feeding Systems and Feed Evaluation
Models. CAB International, Wallingford, UK, pp. 1-9.
Getachew, G., Blummel, M., Makkar, H.P.S., Becker, K., 1998. In vitro gas measuring techniques
for assessment of nutritional quality of feeds: a review. Anim. Feed Sci. Technol. 72, 261-281.
Getachew, G., DePeters, E.J., Robinson, P.H., Taylor, S.J., 2001. In vitro rumen fermentation and
gas production: influence of yellow grease, tallow, corn oil and their potassium soaps. Anim.
Feed Sci. Technol. 93, 1-15.
Getachew, G., Makkar, H.P.S., Becker, K., 2000. Stoichiometric relationship between short chain
fatty acid and in vitro gas production in presence and absence of polyethylene glycol for tannin
containing browses. EAAP Satellite Symposium, Gas production: fermentation kinetics for feed
evaluation and to assess microbial activity, 18-19 August, Wageningen, The Netherlands.
Givens, D.I., Everington, J.M., Adamson, A.H., 1989. The digestibility and metabolizable energy
content of grass silage and their prediction from laboratory measurements. Anim. Feed Sci.
Technol. 24, 27-43.
Goering, H.K., Van Soest, P.J., 1970. Forage fibre analysis. USDA Agricultural Handbook No 379,
(USDA: Washington, DC).
Gosselink, J.M.J., Dulphy, J.P., Poncet, C., Jailler, M., Tamminga, S., Cone, J.W., 2004. Prediction
of forage digestibility in ruminants using in situ and in vitro techniques. Anim. Feed Sci.
Technol. 115, 227-246.
Grings, E.E., Blummel, M., Sudekum, K.H., 2005. Methodological considerations in using gas
production techniques for estimating ruminal microbial efficiencies for silage-based diets. Anim.
Feed Sci. Technol. 123, 527-545.
Hespell, R.B., Bryant, M.P., 1979. Efficiency of rumen microbial growth: influence of some
theoretical and experimental factors on yATP. J. Anim. Sci. 49, 1640-1659.
Hino, T., Naotomo, A., Hisao, O., 1993. Effects of β-carotene and α-tocopherol on rumen bacteria
in the utilization of long-chain fatty acids and cellulose. J. Dairy Sci. 76, 600-605.
Holden, L.A., 1999. Comparison of methods of in vitro dry matter digestibility for ten feeds. J.
Dairy Sci. 82, 1791-1794.
25
Hopson, J.D., Johnson, R.R., Dehority, B.A., 1963. Evaluation of the dacron bag technique as a
method for measuring cellulose digestibility and rate of forage digestion. J. Anim. Sci. 22, 448-
453.
Hungate, R.E., 1966. The rumen and its microbes. Academic Press, New York, USA, pp. 533.
Huntington, J.A., Givens, D.I., 1995. The in situ technique for studying rumen degradation of feeds.
A review of the procedure. Nutrition Abstracts and Reviews 65B, 63-93.
Institut National de la Recherche Agronomique (INRA), 1988. Tables de l’alimentation des bovins,
ovins et caprins. Services des publications de l’INRA, Versailles.
Johnson, R.R., 1966. Techniques and procedure for in vitro and in vivo rumen studies. J. Anim. Sci.
25, 855-075.
Jouany, J.P., Thivend, P., 1986. In vitro effect of avoparcin on protein degradability and rumen
fermentation. Anim. Feed Sci. Technol. 15, 215-229.
Kitessa, S., Flinn, P.C., Irish, G.G., 1999. Comparison of methods used to predict in vivo
digestibility of feeds in ruminants. Aust. J. Agric. Res. 50, 825-841.
Leng, R.A., 1993. Quantitative ruminant nutrition: a green science. Aust. J. Agric. Sci. 44, 363-380.
Lindberg, J.E., 1981. The effect of sample size and sample structure on the degradation of dry
matter, nitrogen and cell walls in nylon bags. Swed. J. Agric. Res. 11, 71-76.
Lindberg, J.E., Knutsson, P.G., 1981. Effect of bag pore size on the loss of particulate matter and on
the degradation of cell wall fibre. Agric. Environ. 6, 171-182.
Liu, J.X., Susenbeth, A., Sudekum, K.H., 2002. In vitro gas production measurements to evaluate
interactions between untreated and chemically treated rice straws, grass hay, and mulberry
leaves. J. Animal Sci. 80, 517-524.
Mabjeesh, S.J., Cohen, M., Arieli, A., 2000. In vitro methods for measuring the dry matter
digestibility of ruminant feedstuffs: comparison of methods and inoculum source. J. Dairy Sci.
83, 2289-2294.
Madsen, J., Hvelplund, T., 1994. Prediction of in situ protein degradability in the rumen: results of a
European ringtest. Livest. Prod. Sci. 39, 201-212.
26
Makir, L.R., Foster, E.M., 1957. Effect of roughage in the bovine ration on types of bacteria in the
rumen. J. Dairy Sci. 40, 905-913.
Makkar, H.P.S., 2005. Recent advances in the in vitro gas method for evaluation of nutritional
quality of feed resources. In: Assessing Quality and Safety of Animal Feeds. FAO Animal
Production and Health Series 160. FAO, Rome, pp. 55-88.
Makkar, H.P.S, Becker, K., 1999. Effect of saponins and plant extracts containing saponins on the
recovery of ammonia during urea-ammoniation of wheat straw and fermentation kinetics of the
treated straw. J. Agric. Sci. Camb. 132, 313-321.
Makkar, H.P.S, Blummel, M., Becker, K., 1995. Formation of complexes between polyvinyl
pyrrolidone or polyethylene glycol with tannins and their implication in gas production and true
digestibility in in vitro techniques. Brit. J. Nutr. 73, 897-913.
Mauricio, R.M., Mould, F.L., Dhanoa, M.S., Owen, Channa, K.S., Theodorou, M.K., 1999. A semi-
automated in vitro gas production technique for ruminant feedstuffs evaluation. Anim. Feed. Sci.
Technol. 79, 321-330.
McBee, R.H., 1953. Manometric method for the evaluation of microbial activity in the rumen with
application to utilization of cellulose. Appl. Microbiol. 1, 106-110.
McDonald, P.; Edwards, R.; Greenhalgh, J., 1981: Nutricion animal. 3rd edn. Zaragoza: Editorial
Acribia, SA. 518 pp.
McDougall, E.I., 1948. Studies on ruminant saliva. 1. The composition and output of sheep's saliva.
Biochem. J. 43, 99-109.
Mehrez, A.Z., Ørskov, E.R., 1977. A study of the artificial fibre bag technique for determining the
digestibility of feeds in the rumen. J. Agric. Sci. Camb. 88, 645-650.
Menke, K., Raab, L., Salewski, A., Steingass, H., Fritz, D., Schneider, W., 1979. The estimation of
the digestibility and metabolizable energy content of ruminant feedingstuffs from the gas
production when they are incubated with rumen liquor in vitro. J. Agric. Sci Camb. 93, 217-222.
Menke, K.H., Steingass, H., 1988. Estimation of the energetic feed value obtained from chemical
analysis and gas production using rumen fluid. Anim. Res. Dev. 28, 7-55.
Mertens, D.R., Weimer, P.J., 1998. Method for measuring gas production kinetics. In: Deaville,
E.R., Owen, E., Adesogan, A.T., Rymer, C., Huntington, J.A., Lawrence, T.L.J. (Eds.), In Vitro
27
Techniques for Measuring Nutrient Supply to Ruminants. BSAS, Edinburgh, UK, pp. 209-211,
BSAS Occ. Publ. No. 22.
Meyer, J.A.F., Mackie, R.I., 1986. Microbiological evaluation of the intraruminal in sacculus
digestion technique. Appl. Environ. Microbiol. 51 (3), 622-629.
Michalet-Doreau, B., Cerneau, P., 1991. Influence of foodstuff particle size on in situ degradation
of nitrogen in the rumen. Anim. Feed Sci. Technol. 35, 69-81.
Michalet-Doreau, B., Ferlay, A., 1995. Effect of dietary lipids on nitrogen metabolism in the rumen:
a review. Anim. Feed Sci. Technol. 43. 97-110.
Michalet-Doreau, B., Ould-Bah, M.Y., 1992. In vitro and in sacco methods for the estimation of
dietary nitrogen degradability in the rumen: a review. Anim. Feed Sci. Technol. 40, 57-86.
Moss, A.R., Pell, A.N., Givens, D.I., 1998. Use of the Cornell University gas production technique
to measure kinetics of carbohydrate degradation in five foods: a comparison between
laboratories. In: Deaville, E.R., Owen, E., Adesogan, A.T., Rymer, C., Huntington, J.A.,
Lawrence, T.L.J. (Eds.), In Vitro Techniques for Measuring Nutrient Supply to Ruminants.
BSAS, Edinburgh, UK, pp. 218–220, BSAS Occ. Publ. No. 22.
Mould, F.L., Kliem, K.E., Morgan, R., Mauricio, R.M., 2005. In vitro microbial inoculum: A
review of its function and properties. Anim. Feed Sci. Technol. 123-124, 31-50.
Nagadi, S., Herrero, M., Jessop, N.S., 2000. The influence of diet of the donor animal on the initial
bacterial concentration of ruminal fluid and in vitro gas production degradability parameters.
Anim. Feed Sci. Technol. 87, 231-239.
National Research Council (NRC), 1996. Nutrient Requirements of Beef Cattle, seventh ed.
National Academy Press, Washington, DC, USA.
National Research Council (NRC), 2001. Nutrient Requirements of Dairy Cattle, seventh revised
ed. National Academy Press, Washington, DC, USA.
Naziroğlu, M., Güler, T., Yüce, A., 2002. Effect of vitamin E on ruminal fermentation in vitro. J.
Vet. Med. A 49, 251-255.
Newbold, C.J., McIntosh, F.M., Wallace, R.J., 1998. Changes in the microbial population of a
rumen-simulating fermenter in response to yeast culture. Can. J. Anim . Sci. 78, 241-244.
28
Newbold, C.J., McIntosh, F.M., Williams, P., Losa, R., Wallace, R.J., 2004. Effects of a specific
blend of essential oil compounds on rumen fermentation. Anim. Feed Sci. Technol. 114, 105-
112.
Nocek, J.E., 1985. Evaluation of specific variables affecting in situ estimates of ruminal dry matter
and protein digestion. J. Anim. Sci. 60, 1347-1358.
Nocek, J. E., 1988. In situ and other methods to estimate ruminal protein and energy digestibility: A
review. J. Dairy Sci. 71, 2051-2069.
Nocek, J.E., Hall, M.B., 1984. Characterization of soyhull fiber digestion by in situ and in vitro
enzymatic procedures. J. Dairy Sci. 67, 2599-2607.
Offer, N.W., Agnew, R.E., Cottrill, B.R., Givens, D.I., Keady, T.W.J., Mayne,W.J., Rymer, C.,
Yan, T., France, J., Beever, D.E., Thomas, C., 2002. Feed into milk: an applied feeding model
coupled with a new system of feed characterisation. In: Recent Advances in Animal Nutrition
2002. Nottingham University Press, Nottingham, UK, pp. 167-194
Ørskov, E.R., Reid, G.W., Kay, M., 1988. Prediction of intake of cattle from degradation
characteristics of roughages. Anim. Prod. 46, 29-34.
Pell, A.N., Pitt, R.E., Doane, P.H., Schofield, P., 1998. The development, use and application of the
gas production technique at Cornell University, USA. In: Deaville, E.R., Owen, E., Adesogan,
A.T., Rymer, C., Huntington, J.A., Lawrence, T.L.J. (Eds.), In vitro techniques for measuring
nutrient supply to ruminants. BSAS, Edinburgh, UK, pp. 45-54, BSAS Occ. Publ. No 22.
Pell, A.N., Schofield, P., 1993. Computerised monitoring of gas production to measure forage
digestion in vitro. J. Dairy Sci. 76, 1063-1073.
Playne, M.J., Khumnualthong, W., Echevarria, M.G., 1978. Factors affecting the digestibility of
oesophageal fistula samples and hay sampled in nylon bags in the rumen of cattle. J. Agric. Sci.
Camb. 90, 193-204.
Quin, J.I., Van der Wath, J.B., Myburg, S., 1938. Studies on the alimentary tract of Merino sheep in
South Africa. IV. Description of experimental technique. Ondersterpoort J. Vet. Sci. Anim. Ind.
11(2), 341-360.
Raun, N.S., Burroughs, W., 1962. Suction strainer technique in obtaining rumen fluid samples from
intact lambs. J. Anim. Sci. 21, 454-457.
29
Robinson, P.H., Campbell, M., Fadel, J.G., 1999. Influence of storage time and temperature on in
vitro digestion of neutral detergent fibre at 48 h, and comparison to 48 h in sacco neutral
detergent fibre digestion. Anim. Feed Sci. Technol. 80, 257-266.
Robinson, P.H., Givens, D.I., Getachew, G., 2004. Evaluation of NRC, UC Davis and ADAS
approaches to estimate the metabolizable energy values of feeds at maintenance energy intake
from equations utilizing chemical assays and in vitro determinations. Anim. Feed Sci. Technol.
114, 75-90.
Rodriguez, H., 1968. The in vivo bag technique on digestibility studies. Revista Cubana de Ciencia
Agricola 2, 77-81.
Rosales, M., Gill, M., Wood, C.D., Speedy A.W., 1998. Associative effects in vitro of mixtures of
tropical fodder trees. In: Deaville, E.R., Owen, E., Adesogan, A.T., Rymer, C., Huntington, J.A.,
Lawrence, T.L.J. (Eds.), In vitro techniques for measuring nutrient supply to ruminants. BSAS,
Edinburgh, UK, pp. 175-177, BSAS Occ. Publ. No 22.
Russell, J.B., Wilson, D.B., 1996. Why are ruminal cellulolytic bacteria unable to digest cellulose at
low pH? J. Dairy Sci. 79, 1503-1509.
Rymer, C., Huntington, J.A., Williams, B.A., Givens, D.I., 2005. In vitro cumulative gas production
techniques: history, methodological considerations and challenges. Anim. Feed Sci. Technol.
123-124, 9-30.
Sandoval-Castro, C.A., Capetillo-Leal, C., Cetina-Gongora, R., Ramirez-Aviles, L., 2002. A
mixture simplex design to study associative effects with an in vitro gas production technique.
Anim. Feed Sci. Technol. 101, 191-200.
Schofield, P., 2000. Gas production methods. In: D’Mello, J.P.F. (Ed.), Farm Animal Metabolism
and Nutrition. CABI Publishing, Wallingford, UK, pp. 209-232.
Schöner, F.J., 1981. Schätzung des energetischen Futterwertes von Milchleistungsfuttern
(Ergänzungsfutter für Milchkühe) unter besonderer Berücksichtigung des Hohenheimer
Futterwerttestes. Dissertation, Bonn University, Bonn, Germany.
Setala, J., 1983. The nylon bag technique in the determination of ruminal feed protein degradation.
J. Sci. Agric. Finland 55, 1-78.

30
Sinclair, L.A., Garnsworthy, P.C., Newbold, J.R., Buttery, P.J., 1993. Effect of synchronizing the
rate of dietary energy and nitrogen release on rumen fermentation and microbial protein
synthesis. J. Agric. Sci. Camb. 120, 251-263.
Spanghero, M., Berzaghi, P., Fortina, R., Masoero, F., Rapetti, L., Zanfi, C., Tassone, S., Gallo, A.,
Colombini, S., Ferlito, J. C., 2010. Technical note: Precision and accuracy of in vitro digestion of
neutral detergent fiber and predicted net energy of lactation content of fibrous feeds. J. Dairy Sci.
93, 4855-4859.
Spanghero, M., Boccalon, S., Gracco, L., Gruber, L., 2003. NDF degradability of hays measured in
situ and in vitro. Anim. Feed Sci. Technol. 104, 201-208.
Spanghero, M., Gruber, L., Zanfi, C., 2007. Precision and accuracy of the NDF rumen degradability
of hays measured by the Daisy fermenter. Ital. J. Anim. Sci., Vol. 6 (Suppl.1), 363-365.
Stern, M.D., Bach, A., Calsamiglia, S., 1997. Alternative techniques for measuring nutrient
digestion in ruminants. J. Anim. Sci. 75, 2256-2276.
Stern, M.D., Satter, L.D., 1982. In vivo estimation of protein degradability in the rumen. In: F.N.
Owens (Ed.). Protein requirements for cattle: Symposium. Oklahoma State Univ., Stillwater, p.
57.
Tagliapietra, F., Schiavon, S., Hall, J.C., Dal Maso, M., Cattani, M., Bailoni, L., 2008. Dry matter
and NDF rumen degradability assessed by two in vitro techniques on seven feeds. Book of
Abstracts No. 14 of 59th Annual Meeting of European Association of Animal Production, p. 226.
Tejido, M.L., Ranilla, M.J., Carro, M.D., 2002. In vitro digestibility of forages as influenced by
source of inoculum (sheep rumen versus Rusitec fermenters) and diet of the donor sheep. Anim.
Feed Sci. Technol. 97, 41-51.
Theodorou, M.K., Lowman, R.S., Davies, Z.S., Cuddeford, D., Owen, E., 1998. Principles of
techniques that rely on gas measurements in ruminant nutrition. In: Deaville, E.R., Owen, E.,
Adesogan, A.T., Rymer, C., Huntington, J.A., Lawrence, T.L.J. (Eds.), In vitro techniques for
measuring nutrient supply to ruminants. BSAS, Edinburgh, UK, pp. 45-54, BSAS Occ. Publ. No
22.
Theodorou, M.K., Williams, B.A., Dhanoa, M.S., McAllan, A.B., France, J., 1994. A simple gas
production method using a pressure transducer to determine the fermentation kinetics of
ruminant feeds. Anim. Feed Sci. Technol. 48, 185-197.

31
Thorley, C.M., Sharpe, M.E., Bryant, M.P., 1968. Modification of the rumen bacterial flora by
feeding cattle ground and pelleted roughage as determined with culture media with or without
rumen fluid. J. Dairy Sci. 51, 1811-1816.
Tilley, J.M.A., Terry, R.A., 1963. A two-stage technique for the in vitro digestion of forage crops. J.
Brit. Grass. Soc. 18, 104-111.
Trabalza Marinucci, M., Dehority, B.A, Loerch, S.C., 1992. In vitro and in vivo studies of factors
affecting digestion of feeds in synthetic bags. J. Anim. Sci. 70, 296-307.
Trei, J., Hale, W., Theurer, B., 1970. Effect of grain processing on in vitro gas production. J. Anim.
Sci. 30, 825-831.
Uden, P., Parra, R., Van Soest, P.J., 1974. Factors influencing reliability of the nylon bag technique.
J. Dairy Sci. 57, 662.
Uden, P., Van Soest., P.J., 1984. Investigations of the in situ bag technique and a comparison of the
fermentation in heifers, sheep, ponies and rabbits. J. Anim. Sci. 58, 213-221.
Van Hellen, R.W., Ellis, W.C., 1977. Sample container porosities for rumen in situ studies. J. Anim.
Sci. 44, 141-146.
Van Keuren, R.W., Heinemann, W.W., 1962. Study of a nylon bag technique for in vivo estimation
of forage digestibility. J. Anim. Sci. 21, 340-345.
Van Soest, P.J., 1994. Nutritional Ecology of the Ruminant, 2nd ed. Ithaca, NY: Cornell University
Press.
Vanzant, E.S., Cochran, R.C., Titgemeyer, E.C., 1998. Standardization of in situ techniques for
ruminant feedstuff evaluation. J. Anim. Sci. 76, 2717-2729.
Vanzant, E. S., Cochran, R.C., Titgemeyer, E.C., Stafford, S.D., Olson, K.C., Johnson, D.E., St.
Jean, G., 1996. In vivo and in situ measurements of forage protein degradation in beef cattle. J.
Anim. Sci. 74, 2773-2784.
Varga, G.A., Hoover., W.H., 1983. Rate and extent of neutral detergent fiber degradation of
feedstuffs in situ. J. Dairy Sci. 66, 2109-2115.
Vargas, J.E., López, S., Giráldez, F.J., González, J.F., 2009. In vitro forage digestibility under
suboptimal microbial inoculum and culture media pH conditions. Options Méditerannéennes 85,
291-296.
32
Waghorn, G.C., Stafford, K.J., 1993. Gas production and nitrogen digestion by rumen microbes
from deer and sheep. N. Z. J. Agric. Res. 36, 493-497.
Weakley, D.C., Stern, M.D., Satter, L.D., 1983. Factors affecting disappearance of feedstuffs from
bags suspended in the rumen. J. Anim. Sci. 56, 493-507.
Weiss, W.P., 1993. Predicting energy value of feeds. J. Dairy Sci. 76, 1802-1811.
Weiss, W.P., Conrad, H.R., St. Pierre, N.R., 1992. A theoretically-based model for predicting total
digestible nutrient values of forages and concentrates. Anim. Feed Sci. Technol. 39, 95-110.
Wilkins, J., 1974. Pressure transducer method for measuring gas production by microorganisms.
Appl. Microbiol. 27, 135-140.
Wilman, D., Adesogan, A., 2000. A comparison of filter bag methods with conventional tube
methods of determining in vitro digestibility of forages. Anim. Feed Sci. Technol. 84, 33-47.
Wolin, M.J., 1960. A theoretical rumen fermentation balance. J. Dairy Sci. 40, 1452-1456.
33
CHAPTER 2
General aims
The general aim of the present thesis is the study of rumen fermentation processes using the in
situ and the in vitro digestibility techniques and the in vitro gas production technique. Five
experimental contributes will be presented, four of methodological nature (Chapters 3, 4, 5 and 6)
and one of applicative nature (Chapter 7). In detail, the aim of Chapter 3 was to investigate the
effect of feed sample size on digestibility values provided by two different in vitro techniques. The
aims of Chapter 4 were: i) to compare the digestibility values achieved in situ and in vitro using two
different kinds of bag; ii) to compare digestibility values obtained in situ with those achieved in
vitro using rumen fluid collected from intact cows. The aims of Chapter 5 were: i) to compare
energy value of feeds estimated using equations based on in situ digestibility at 48 h or in vitro gas
production at 24 h; ii) to compare in situ digestibility values measured at 24 and 48 h of incubation.
The aim of Chapter 6 was to compare the effect of two venting procedures on the GP kinetics
provided by two feeds with a different digestibility. Finally, the aim of Chapter 7 was to evaluate
the effect of increasing dosages of two additives with antioxidant properties on some in vitro rumen
parameters provided by two feeds.

34
35
CHAPTER 3
In vitro rumen feed degradability assessed with DaisyII and batch
culture: effect of sample size
Mirko Cattani, Franco Tagliapietra, Lucia Bailoni, Stefano Schiavon
Department of Animal Science. University of Padova, Italy.
Published:
ITALIAN JOURNAL OF ANIMAL SCIENCE 8: 169-171, suppl . 3, 2009
36
1. Abstract
In vitro digestibility with DaisyII (D) equipment is commonly performed with 0.5 g of feed
sample into each filter bag. Literature reported that a reduction of the ratio of sample size to bag
surface could facilitate the release of soluble or fine particulate. A reduction of sample size to 0.25
g could improve the correlation between the measurements provided by D and the conventional
batch culture (BC). This hypothesis was screened by analysing the results of 2 trials. In trial 1, 7
feeds were incubated for 48 h with rumen fluid (3 runs x 4 replications) both with D (0.5 g/bag) and
BC; the regressions between the mean values provided for the various feeds in each run by the 2
methods either for NDF (NDFD) and in vitro true DM (IVTDMD) digestibility, had R2 of 0.75 and
0.92 and RSD of 10.9 and 4.8%, respectively. In trial 2, 4 feeds were incubated (2 runs x 8
replications) with D (0.25 g/bag) and BC; the corresponding regressions for NDFD and IVTDMD
showed R2 of 0.94 and 0.98 and RSD of 3.0 and 1.3%, respectively. A sample size of 0.25 g
improved the precision of the measurements obtained with D.
Abbreviations: NDFD, NDF digestibility; IVTDMD, in vitro true dry matter digestibility; BC, batch
culture.
Key Words: In vitro techniques; Rumen degradability; Feeds; DaisyII
37
2. Introduction
DaisyII (D) is an equipment for analyzing DM and neutral detergent fiber in vitro digestibility
(NDFD). The technique entails digesting several feed samples in filter bags within glass jars which
are rotated in insulated chamber. The amount of feed sample commonly introduced in the filter bags
is 0.50 g (Holden, 1999; Mabjeesh et al., 2000), but Others preferred 0.25 g (Robinson et al., 1999;
Spanghero et al., 2003). Damiran et al. (2008) found significant differences of digestibility due to
sample size of 0.25 and 0.50 g/bag. It can be possible that a lower sample size could facilitate the
release of soluble and fine particulate, while a larger sample size can exert a barrier effect,
occluding the bags pores and limiting the rumen fluid passage. This work was aimed to evaluate
what sample size (0.25 or 0.50 g/bag) allows to achieve a better correlation between the digestibility
values obtained with the D equipment and with a conventional batch culture technique (BC;
Goering and van Soest, 1970).
3. Material and methods
The results of 2 previously conducted trials were analyzed. In trial 1, 7 feeds (corn meal,
soybean meal, dry sugar beet pulp, corn silage, alfalfa hay, grass hay and wheat straw), milled at 1
mm, were simultaneously incubated (3 incubation runs x 4 replications) for 48 h at 39°C both with
D (0.50 g feed/filter bag) and BC (0.50 g feed/bottle), using the same rumen fluid collected from 3
donor cows and a buffer solution. Standard filter bags were used (F57; 4.3x4.8 cm; Ankom).
Similarly, in trial 2, 4 feeds samples (concentrate mix; two different corn silages; alfalfa hay) were
incubated (2 incubation runs x 8 replications) both with D (0.25 g feed/filter bag) and BC (0.50 g
feed/bottle). At the end of each incubation, the residuals in the filter bags were analyzed for NDF
content with Ankom220 system while the residuals in the BC were filtered in gooch and analyzed
with a fibertech analyser (Goering and van Soest, 1970). The in vitro true DM digestibility was
computed as IVTDMD = 100*[(DMfeed–NDFres)/ DMfeed)], where NDFres was the residual
NDF after incubation, and DMfeed was the amount of DM incubated. Data of each trial, either for
NDFD and IVTDMD, were subjected to ANOVA using two models in which: i) the effect of
technique was evaluated for each single feed; ii) the effect of technique was evaluated considering
the various feeds as source of variation. The root of MSE (RMSE) and the coefficient of variations
(CV) were used as precision indexes. The mean values of digestibility obtained with D equipment
for each feed, in each trial and in each run, were compared by regression with the values obtained
with BC (trial 1: 21 pairs of values; trial 2: 8 pairs of values).
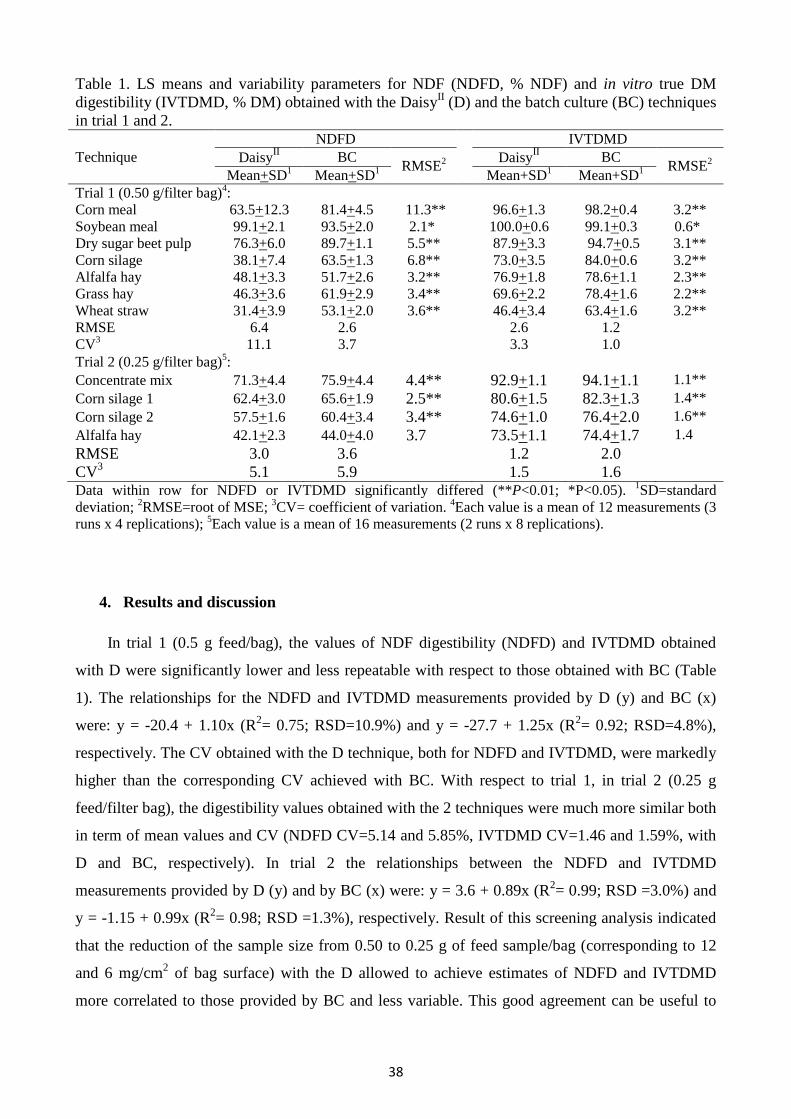
38
Table 1. LS means and variability parameters for NDF (NDFD, % NDF) and in vitro true DM digestibility (IVTDMD, % DM) obtained with the DaisyII (D) and the batch culture (BC) techniques in trial 1 and 2. NDFD IVTDMD Technique DaisyII BC
RMSE2 DaisyII BC
RMSE2 Mean+SD1 Mean+SD1 Mean+SD1 Mean+SD1 Trial 1 (0.50 g/filter bag)4: Corn meal 63.5+12.3 81.4+4.5 11.3** 96.6+1.3 98.2+0.4 3.2** Soybean meal 99.1+2.1 93.5+2.0 2.1* 100.0+0.6 99.1+0.3 0.6* Dry sugar beet pulp 76.3+6.0 89.7+1.1 5.5** 87.9+3.3 94.7+0.5 3.1** Corn silage 38.1+7.4 63.5+1.3 6.8** 73.0+3.5 84.0+0.6 3.2** Alfalfa hay 48.1+3.3 51.7+2.6 3.2** 76.9+1.8 78.6+1.1 2.3** Grass hay 46.3+3.6 61.9+2.9 3.4** 69.6+2.2 78.4+1.6 2.2** Wheat straw 31.4+3.9 53.1+2.0 3.6** 46.4+3.4 63.4+1.6 3.2** RMSE 6.4 2.6 2.6 1.2 CV3 11.1 3.7 3.3 1.0 Trial 2 (0.25 g/filter bag)5: Concentrate mix 71.3+4.4 75.9+4.4 4.4** 92.9+1.1 94.1+1.1 1.1** Corn silage 1 62.4+3.0 65.6+1.9 2.5** 80.6+1.5 82.3+1.3 1.4** Corn silage 2 57.5+1.6 60.4+3.4 3.4** 74.6+1.0 76.4+2.0 1.6** Alfalfa hay 42.1+2.3 44.0+4.0 3.7 73.5+1.1 74.4+1.7 1.4 RMSE 3.0 3.6 1.2 2.0 CV3 5.1 5.9 1.5 1.6 Data within row for NDFD or IVTDMD significantly differed (**P<0.01; *P<0.05). 1SD=standard deviation; 2RMSE=root of MSE; 3CV= coefficient of variation. 4Each value is a mean of 12 measurements (3 runs x 4 replications); 5Each value is a mean of 16 measurements (2 runs x 8 replications).
4. Results and discussion
In trial 1 (0.5 g feed/bag), the values of NDF digestibility (NDFD) and IVTDMD obtained
with D were significantly lower and less repeatable with respect to those obtained with BC (Table
1). The relationships for the NDFD and IVTDMD measurements provided by D (y) and BC (x)
were: y = -20.4 + 1.10x (R2= 0.75; RSD=10.9%) and y = -27.7 + 1.25x (R2= 0.92; RSD=4.8%),
respectively. The CV obtained with the D technique, both for NDFD and IVTDMD, were markedly
higher than the corresponding CV achieved with BC. With respect to trial 1, in trial 2 (0.25 g
feed/filter bag), the digestibility values obtained with the 2 techniques were much more similar both
in term of mean values and CV (NDFD CV=5.14 and 5.85%, IVTDMD CV=1.46 and 1.59%, with
D and BC, respectively). In trial 2 the relationships between the NDFD and IVTDMD
measurements provided by D (y) and by BC (x) were: y = 3.6 + 0.89x (R2= 0.99; RSD =3.0%) and
y = -1.15 + 0.99x (R2= 0.98; RSD =1.3%), respectively. Result of this screening analysis indicated
that the reduction of the sample size from 0.50 to 0.25 g of feed sample/bag (corresponding to 12
and 6 mg/cm2 of bag surface) with the D allowed to achieve estimates of NDFD and IVTDMD
more correlated to those provided by BC and less variable. This good agreement can be useful to
39
exploit the advantage of each technique: D allows the simultaneous incubation of a large number of
samples, giving benefit in term of labour and cost per determination, while BC gives the possibility
of measuring not only the disappearance degree of substances but also the product of fermentations,
such as volatile fatty acids and gas production.
Acknowledgements: Research financed by PRIN 2006
40
References
Damiran, D., Del Curto, T., Bohnert, D.W., Findholt, S.L., 2008. Comparison of techniques and
grinding size to estimate digestibility of forage based ruminant diets. Anim. Feed Sci. Technol.
141, 15-35.
Goering, H.H., Van Soest, P.J., 1970. Forage fiber analysis (apparatus, reagents, procedures and
some applications). Agr. Handbook No. 379, USDA.
Holden, L.A., 1999. Comparison of methods of in vitro dry matter digestibility for ten feeds. J.
Dairy Sci. 82, 1791-1794.
Mabjeesh, S.J., Cohen, M., Arieli, A., 2000. In vitro methods for measuring the dry matter
digestibility of ruminant feedstuffs: comparison of methods and inoculum source. J. Dairy Sci.
83, 2289-2294.
Robinson, P.H., Mathews, M.C., Fadel, J.G., 1999. Influence of storage time and temperature on in
vitro digestion of neutral detergent fiber at 48 h and comparison to 48 h in sacco neutral
detergent fiber digestion. Anim. Feed Sci. Technol. 80, 257-266.
Spanghero, M., Boccalon, S., Gracco, L., Gruber, L., 2003. NDF degradability of hays measured in
situ and in vitro. Anim. Feed Sci. Technol. 104, 201-208.

41
CHAPTER 4
Running title: In situ and in vitro rumen techniques
True dry matter digestibility of feeds evaluated in situ with different
bags and in vitro using rumen fluid collected from intact donor cows
Franco Tagliapietraa, Mirko Cattania, Ida K. Hindrichsenb, Hanne H. Hansenc,
Stefania Colombinid, Lucia Bailonia, Stefano Schiavona
a Department of Animal Science. University of Padova, Italy. b Animal Health and Nutrition, Chr. Hansen A/S, Bøge Allé 10-12, 2970 Denmark.
c Department of Large Animal Sciences. University of Copenhagen, Denmark. d Department of Animal Science. University of Milan, Italy.
Submitted to:
ANIMAL FEED SCIENCE AND TECHNOLOGY (2010)
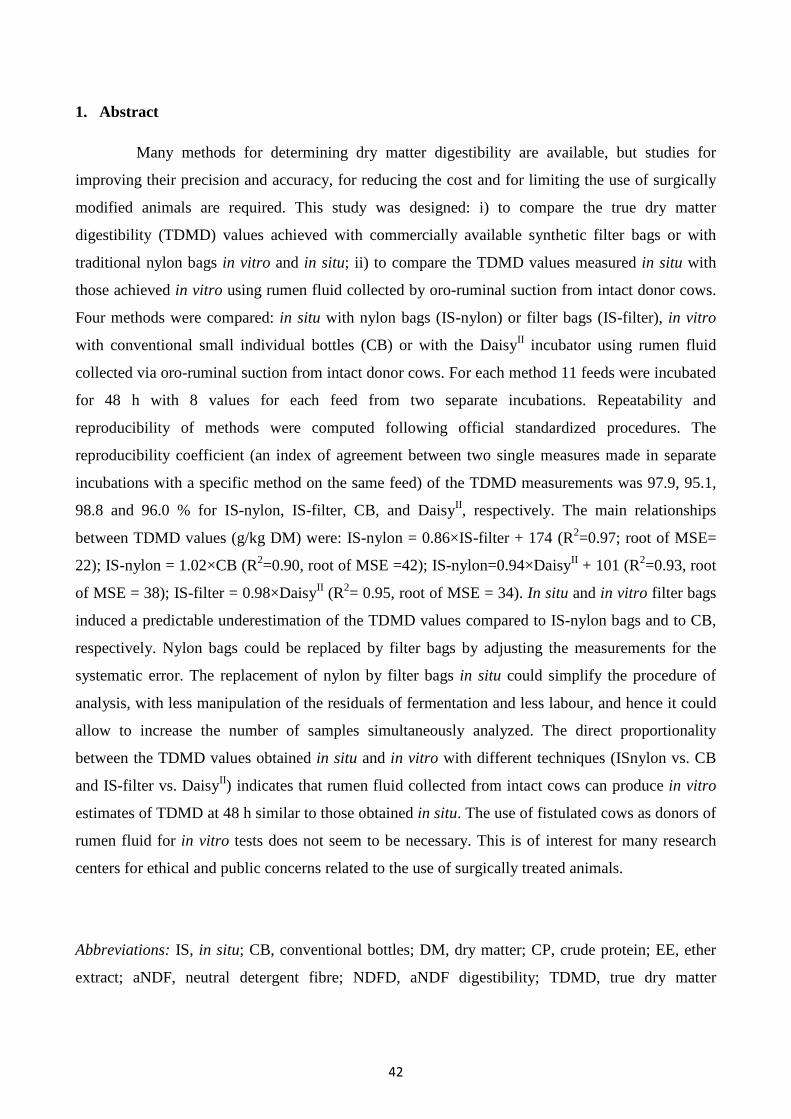
42
1. Abstract
Many methods for determining dry matter digestibility are available, but studies for
improving their precision and accuracy, for reducing the cost and for limiting the use of surgically
modified animals are required. This study was designed: i) to compare the true dry matter
digestibility (TDMD) values achieved with commercially available synthetic filter bags or with
traditional nylon bags in vitro and in situ; ii) to compare the TDMD values measured in situ with
those achieved in vitro using rumen fluid collected by oro-ruminal suction from intact donor cows.
Four methods were compared: in situ with nylon bags (IS-nylon) or filter bags (IS-filter), in vitro
with conventional small individual bottles (CB) or with the DaisyII incubator using rumen fluid
collected via oro-ruminal suction from intact donor cows. For each method 11 feeds were incubated
for 48 h with 8 values for each feed from two separate incubations. Repeatability and
reproducibility of methods were computed following official standardized procedures. The
reproducibility coefficient (an index of agreement between two single measures made in separate
incubations with a specific method on the same feed) of the TDMD measurements was 97.9, 95.1,
98.8 and 96.0 % for IS-nylon, IS-filter, CB, and DaisyII, respectively. The main relationships
between TDMD values (g/kg DM) were: IS-nylon = 0.86×IS-filter + 174 (R2=0.97; root of MSE=
22); IS-nylon = 1.02×CB (R2=0.90, root of MSE =42); IS-nylon=0.94×DaisyII + 101 (R2=0.93, root
of MSE = 38); IS-filter = 0.98×DaisyII (R2= 0.95, root of MSE = 34). In situ and in vitro filter bags
induced a predictable underestimation of the TDMD values compared to IS-nylon bags and to CB,
respectively. Nylon bags could be replaced by filter bags by adjusting the measurements for the
systematic error. The replacement of nylon by filter bags in situ could simplify the procedure of
analysis, with less manipulation of the residuals of fermentation and less labour, and hence it could
allow to increase the number of samples simultaneously analyzed. The direct proportionality
between the TDMD values obtained in situ and in vitro with different techniques (ISnylon vs. CB
and IS-filter vs. DaisyII) indicates that rumen fluid collected from intact cows can produce in vitro
estimates of TDMD at 48 h similar to those obtained in situ. The use of fistulated cows as donors of
rumen fluid for in vitro tests does not seem to be necessary. This is of interest for many research
centers for ethical and public concerns related to the use of surgically treated animals.
Abbreviations: IS, in situ; CB, conventional bottles; DM, dry matter; CP, crude protein; EE, ether
extract; aNDF, neutral detergent fibre; NDFD, aNDF digestibility; TDMD, true dry matter
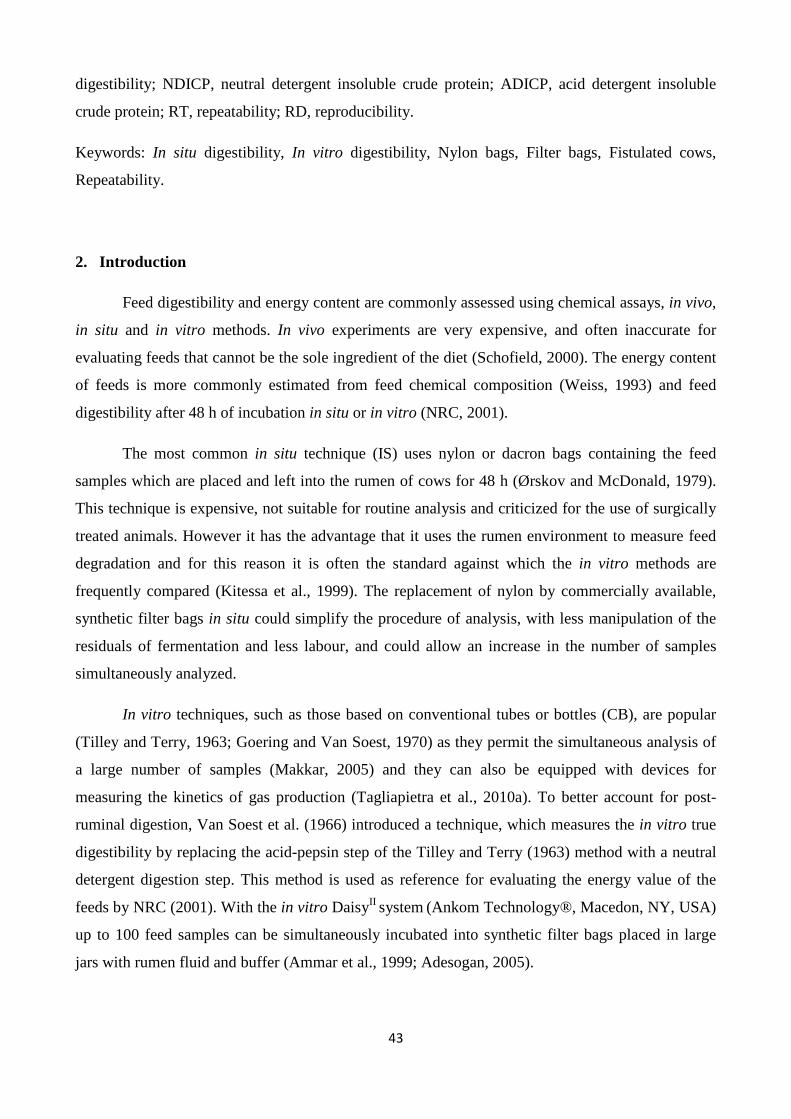
43
digestibility; NDICP, neutral detergent insoluble crude protein; ADICP, acid detergent insoluble
crude protein; RT, repeatability; RD, reproducibility.
Keywords: In situ digestibility, In vitro digestibility, Nylon bags, Filter bags, Fistulated cows,
Repeatability.
2. Introduction
Feed digestibility and energy content are commonly assessed using chemical assays, in vivo,
in situ and in vitro methods. In vivo experiments are very expensive, and often inaccurate for
evaluating feeds that cannot be the sole ingredient of the diet (Schofield, 2000). The energy content
of feeds is more commonly estimated from feed chemical composition (Weiss, 1993) and feed
digestibility after 48 h of incubation in situ or in vitro (NRC, 2001).
The most common in situ technique (IS) uses nylon or dacron bags containing the feed
samples which are placed and left into the rumen of cows for 48 h (Ørskov and McDonald, 1979).
This technique is expensive, not suitable for routine analysis and criticized for the use of surgically
treated animals. However it has the advantage that it uses the rumen environment to measure feed
degradation and for this reason it is often the standard against which the in vitro methods are
frequently compared (Kitessa et al., 1999). The replacement of nylon by commercially available,
synthetic filter bags in situ could simplify the procedure of analysis, with less manipulation of the
residuals of fermentation and less labour, and could allow an increase in the number of samples
simultaneously analyzed.
In vitro techniques, such as those based on conventional tubes or bottles (CB), are popular
(Tilley and Terry, 1963; Goering and Van Soest, 1970) as they permit the simultaneous analysis of
a large number of samples (Makkar, 2005) and they can also be equipped with devices for
measuring the kinetics of gas production (Tagliapietra et al., 2010a). To better account for post-
ruminal digestion, Van Soest et al. (1966) introduced a technique, which measures the in vitro true
digestibility by replacing the acid-pepsin step of the Tilley and Terry (1963) method with a neutral
detergent digestion step. This method is used as reference for evaluating the energy value of the
feeds by NRC (2001). With the in vitro DaisyII system (Ankom Technology®, Macedon, NY, USA)
up to 100 feed samples can be simultaneously incubated into synthetic filter bags placed in large
jars with rumen fluid and buffer (Ammar et al., 1999; Adesogan, 2005).
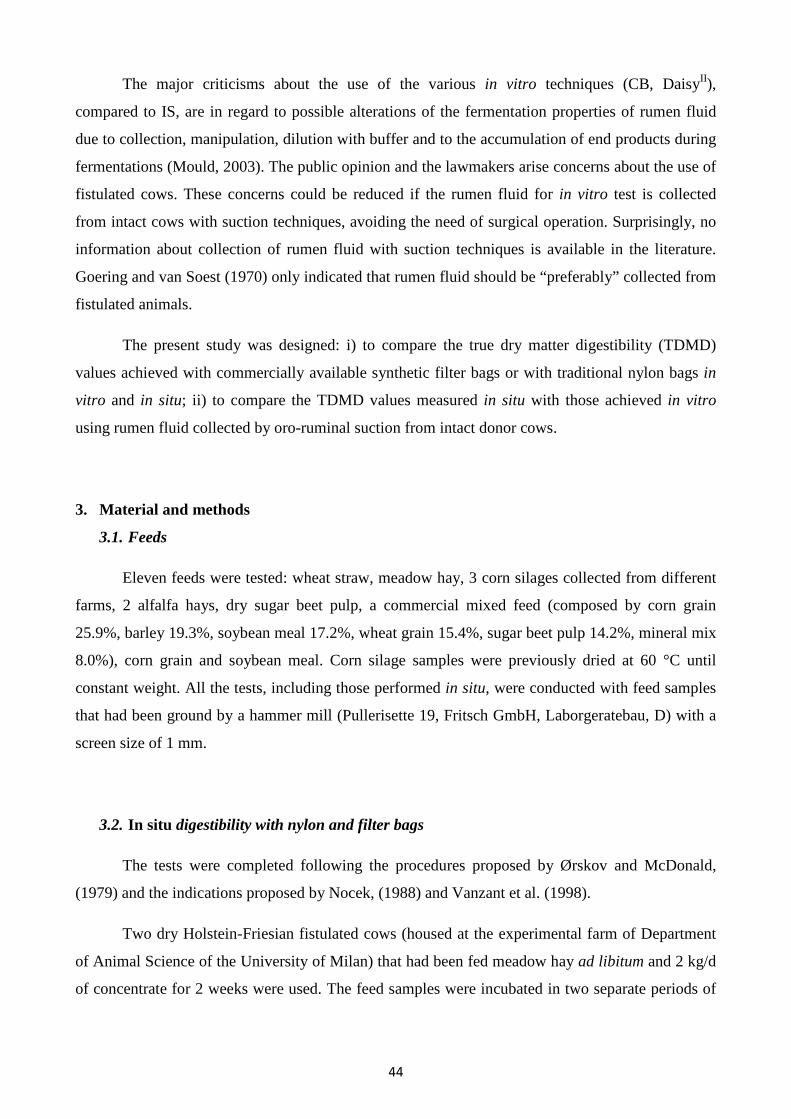
44
The major criticisms about the use of the various in vitro techniques (CB, DaisyII),
compared to IS, are in regard to possible alterations of the fermentation properties of rumen fluid
due to collection, manipulation, dilution with buffer and to the accumulation of end products during
fermentations (Mould, 2003). The public opinion and the lawmakers arise concerns about the use of
fistulated cows. These concerns could be reduced if the rumen fluid for in vitro test is collected
from intact cows with suction techniques, avoiding the need of surgical operation. Surprisingly, no
information about collection of rumen fluid with suction techniques is available in the literature.
Goering and van Soest (1970) only indicated that rumen fluid should be “preferably” collected from
fistulated animals.
The present study was designed: i) to compare the true dry matter digestibility (TDMD)
values achieved with commercially available synthetic filter bags or with traditional nylon bags in
vitro and in situ; ii) to compare the TDMD values measured in situ with those achieved in vitro
using rumen fluid collected by oro-ruminal suction from intact donor cows.
3. Material and methods
3.1. Feeds
Eleven feeds were tested: wheat straw, meadow hay, 3 corn silages collected from different
farms, 2 alfalfa hays, dry sugar beet pulp, a commercial mixed feed (composed by corn grain
25.9%, barley 19.3%, soybean meal 17.2%, wheat grain 15.4%, sugar beet pulp 14.2%, mineral mix
8.0%), corn grain and soybean meal. Corn silage samples were previously dried at 60 °C until
constant weight. All the tests, including those performed in situ, were conducted with feed samples
that had been ground by a hammer mill (Pullerisette 19, Fritsch GmbH, Laborgeratebau, D) with a
screen size of 1 mm.
3.2. In situ digestibility with nylon and filter bags
The tests were completed following the procedures proposed by Ørskov and McDonald,
(1979) and the indications proposed by Nocek, (1988) and Vanzant et al. (1998).
Two dry Holstein-Friesian fistulated cows (housed at the experimental farm of Department
of Animal Science of the University of Milan) that had been fed meadow hay ad libitum and 2 kg/d
of concentrate for 2 weeks were used. The feed samples were incubated in two separate periods of
45
incubation into the rumen of the two cows for 48 h, using simultaneously the two types of bags. For
each kind of bag the experimental design was: 2 incubations × 2 cows × 11 feeds × 2 replications,
giving a total of 8 values for each feed, plus sixteen empty bags as blanks (4 blanks/cow/bag type).
The two types of bags used were: nylon bag (40 µm of pore size; 10.5 × 8 cm of net surface area)
and synthetic filter bag (F57, Ankom Technology®, Macedon, NY, USA; which has been tested by
ANKOM to retain particles with size >25 µm; 4.5 × 4.0 cm of net surface area). The ratio between
the amount of feed sample introduced in each bag and the corresponding net surface area (excluding
the tissue areas not in contact with the feed) was 14 mg/cm2 (Nocek, 1988). Thus, the amount of
sample introduced into the nylon and filter bags was 1.150±0.005 g and 0.250 ±0.001 g,
respectively. Nylon and filter bags were bound to plastic strings and introduced into the rumen of
the cows 2 hours after the morning feeding. After 48 h the bags were extracted from the rumen,
washed in cold water and weakly centrifuged in a washing machine (2 minutes rinse + 2 minutes
spin, repeated 5 times), stored at 4°C for about 2 h which was the time required for transferring the
samples to the laboratory.
3.3. In vitro digestibility with conventional bottles
The tests were completed following the procedures proposed by Tilley and Terry (1963)
modified by Goering and Van Soest (1970).
The buffer mineral solution, prepared according to Menke and Steingass (1988), was heated
in a waterbath at 39°C and purged continuously with CO2 for 30 minutes. Sodium sulphite was used
as reducing agent and it was added (0.33 g/l solution) to the buffer solution (Menke and Steingass,
1988).
Rumen fluid was collected two hours after morning feeding from 3 dry Holstein-Friesian
cows (housed at the experimental farm of the University of Padova, Italy) that were fed meadow
hay ad libitum and 2 kg/d of concentrate for 2 weeks. Rumen fluid was collected using a vacuum
pump connected to a glass vacuum container in turn connected to a semi-flexible oro-ruminal probe
equipped with a steel strainer fixed on the top. The steel strainer (15 cm of length, 3.5 cm of
diameter and 600 g of weight) had 32 holes of 0.5 cm of width. The vacuum pump was activated
when the top of the probe was positioned in the rumen. The first 100 to 200 ml of rumen liquor
collected from each cow was discarded to limit contamination with saliva (Raun and Burroughs,
1962). The pH of the rumen liquor was measured immediately after collection and only fluids with
pH lower than 6.8 were kept for the tests. The rumen fluid was poured into two thermal flasks
46
preheated to 39.0 ± 0.5 °C and immediately transferred to the laboratory. At the laboratory the
rumen fluid was filtered through 3 layers of cheesecloth to eliminate feed particles and mixed with
the buffer mineral solution in a ratio 1 to 2. All the operations were conducted under anaerobic
conditions by flushing carbon dioxide. The time required for all the operations was less than 30
minutes.
Two incubations were performed in two successive weeks. The experimental design was: 2
incubations × 11 feeds × 4 replications, giving a total of 8 values per feed, plus 8 bottles without
feed sample as blanks. Each bottle (280 ml) was filled with 0.5000±0.0010 g of feed and equipped
with a commercial system (Ankom RF gas production system, Ankom Technology®, Macedon,
NY, USA) that allows the release of gas produced during the fermentation and maintains a low
positive pressure in the bottle headspace avoiding the entrance of air (Tagliapietra et al., 2010). The
bottles were preheated to 39 °C and filled with 75 ml of buffered rumen fluid under anaerobic
conditions by keeping the bottle headspace continuously flushed with CO2. The bottles were
incubated in an air ventilated chamber at 39 °C. After 48 h of incubation the fermentation liquor
was filtered into crucibles where the residue was collected and immediately analyzed.
3.4. In vitro digestibility with DaisyII incubator
A DaisyII incubator (Ankom Technology®, Macedon, NY, USA), consisting in a
thermostatic chamber (39 °C) with 4 rotating jars, was used to determine in vitro NDF an true DM
digestibility following the Tilley and Terry (1963) approach modified by Goering and Van Soest
(1970) as described by Ammar et al. (1999).
Two incubations were performed in two successive weeks. The experimental design was: 2
incubations x 2 rotating jars × 11 feeds × 2 replications, giving a total of 8 values per feed, plus 8
empty bags as blanks. Buffer mineral solution, collection and manipulation of rumen liquor were
performed as previously described for the CB test. The feed samples (0.2500 ± 0.0010 g/bag) were
weighed into the filter bags (F57, Ankom Technology®, Macedon, NY, USA). The filter bags were
placed into the jars filled with 2.4 l of buffered rumen fluid. After 48 h of incubation the bags were
extracted from the jars, washed in cold water and immediately analyzed as described later.

47
3.5. Chemical analyses
All the chemical analyses were performed in the laboratory of the Department of Animal
Science of Padova (Italy) by the same operator.
The feeds were analyzed in triplicate for dry matter (DM, AOAC method 934.01, 2003),
crude protein (CP, AOAC method 976.05, 2003), ether extract (EE, AOAC method 920.29, 2003)
and ash (method 942.05, AOAC, 2003). Neutral detergent fibre (aNDF) was determined (Mertens,
2002) with a treatment with α-amylase and sodium sulphite using the Ankom220 Fiber Analyzer
(Ankom Technology®, Macedon, NY, USA). ADF and sulphuric acid lignin (Lignin sa) contents
were determined sequentially after aNDF determination (Robertson and van Soest, 1981). The
measurements of aNDF, ADF and Lignin(sa) were corrected by subtracting values obtained from
blanks. The feeds were also analyzed for neutral detergent insoluble crude protein (NDICP) and
acid detergent insoluble crude protein (ADICP) (Licitra et al., 1996). The content of metabolizable
energy of feeds (ME, Mj/kg DM) was computed from the actual chemical composition following
the lignin-based approach proposed by NRC (2001).
All the residuals of fermentation obtained from the in situ and in vitro incubations were
analyzed for aNDF (Mertens, 2002) and corrected by subtracting values obtained for corresponding
blanks.
The nylon bags were dried at 60 °C in an air ventilated incubator and weighed; the residual
feed material was transferred from the bag to a weighed crucible (30 ml por. 2, Robu Glasfilter-
Geräte GMBH®, Hattert, D) and treated as indicated for the aNDF analysis (Mertens, 2002) with a
Fibertech Analyzer (VELP® Scientifica, Usmate, Milano, I). The transfer of the fermented feed
sample from the bag to the crucible can result in incomplete collection of the feed residual. The
amount of lost material was estimated by calculating the dry weight of residue remaining in the
bags (as difference between the weights of the bag with the dry residue and the empty bags) and
that collected in the crucible (as difference between the weights of the crucible with the dry residue
minus that of the empty crucible). Therefore, the residual aNDF found in each crucible was adjusted
for the DM losses computed for each bag. These losses accounted for 7.9 ±2.6 % of the dry matter
contained in the nylon bags. A further adjustment for blank crucibles was applied.
Filter bags from in situ and in vitro DaisyII incubations were analyzed using the Ankom220
Fiber Analyzer following the user’s instruction (Ankom Technology, 2005), dried at 60 °C until
constant weight and weighed. The removal of the feed residual from the bag was not applied with
48
this procedure, as only the dry weight of the bags before the incubation (empty bags) and after the
aNDF treatment is required. Data were corrected for values obtained from blanks. .
The residual fluids of fermentation obtained from CB were directly transferred from the
bottles to the crucibles and later analyzed for aNDF (Mertens, 2002) using the Fibertech Analyzer
with a correction for blanks.
3.6. Computation of true dry matter digestibility
The aNDF digestibility (NDFD) and the true DM digestibility (TDMD) were computed
using the following equations (Goering and Van Soest, 1970):
NDFD (g/kg NDF)=1000 × ((aNDFfeed – aNDFres) / aNDFfeed) (1)
TDMD (g/kg DM)=1000 × ((DMfeed – aNDFres) / DMfeed) (2)
where: aNDFfeed is the amount (g) of aNDF incubated, aNDFres is the amount (g) of aNDF measured
on the residue of fermentation, DMfeed is the amount (g) of DM incubated.
The TDMD values were also computed from the values of NDFD estimated from the
chemical composition of feeds following the lignin-based approach proposed by NRC (2001) on
page 14 (eq. 2-4e).
3.7. Statistical analysis
3.7.1. Repeatability and reproducibility of methods
Estimation of variance components was accomplished, separately for measures of NDFD or
TDMD provided by different methods, using the mixed procedure of SAS (SAS Inst. Inc.) with two
mixed linear models. In the first model the following sources of variation were considered as
random effects: incubation (I ), the feed (F), the interaction I×F and the error term (e1). Additional
random effects included in the model were: the cow for the IS-nylon and the IS-filter methods and
the jar for the DaisyII incubations. However, as the proportion of variance explained by these factors
was very low these effects were included in the error term. The restricted maximum likelihood
method (REML) was used as the method of estimation of variance components. The components of
variance of each factor, σ2I, σ
2F, σ
2I×F and σ2
e1, were used to compute the repeatability (RT), defined
as the value below which the absolute difference between two single measures obtained with the
49
same method and under the same conditions (same incubation, same feed) is expected with a 95%
probability and coefficient of repeatability (RT%) (International Organization for Standardization,
1994a,b). These parameters were computed as (International Organization for Standardization,
1994a,b):
RT=2�2� (3)
where RT is the repeatability and as:
RT%=σ2I+ σ
2F+σ
2I×F
σ2I+ σ2F+σ
2I×F + σ
2e1
× 100 (4)
where RT% is the coefficient of repeatability.
Reproducibility (RD) was defined as the value below which the absolute difference between
two single measures obtained with the same method of analysis on the same feed in different
incubations is expected within a 95% probability, and coefficient of reproducibility (RD%)
(International Organization for Standardization, 1994a,b). In this case the components of variance
of each method were estimated using the mixed procedure of SAS (SAS Inst. Inc.) running a second
mixed linear model which considered only the feed and the residual error (e2) as random factors.
The values of RD and RD% were computed as (International Organization for Standardization,
1994a,b):
RD=2�2σ�� (5)
and as:
RD%= σ2F
σ2F + σ2e2.× 100 (6)
3.7.2. Comparison among methods
From a preliminary analysis it was found that, according to the Bartlett’s test (Bartlett, 1937)
of the SAS (SAS Inst. Inc.), the variances associated to the various methods were not
homoscedastic, and so use of ANOVA linear models to compare the effects due to the different
methods was not applicable. Thus, the various methods were compared by linear regression of the
mean values of TDMD data obtained for each feed. Significant differences of the slope and
intercept from unity and zero, respectively, were tested using the regression procedure (proc reg) of
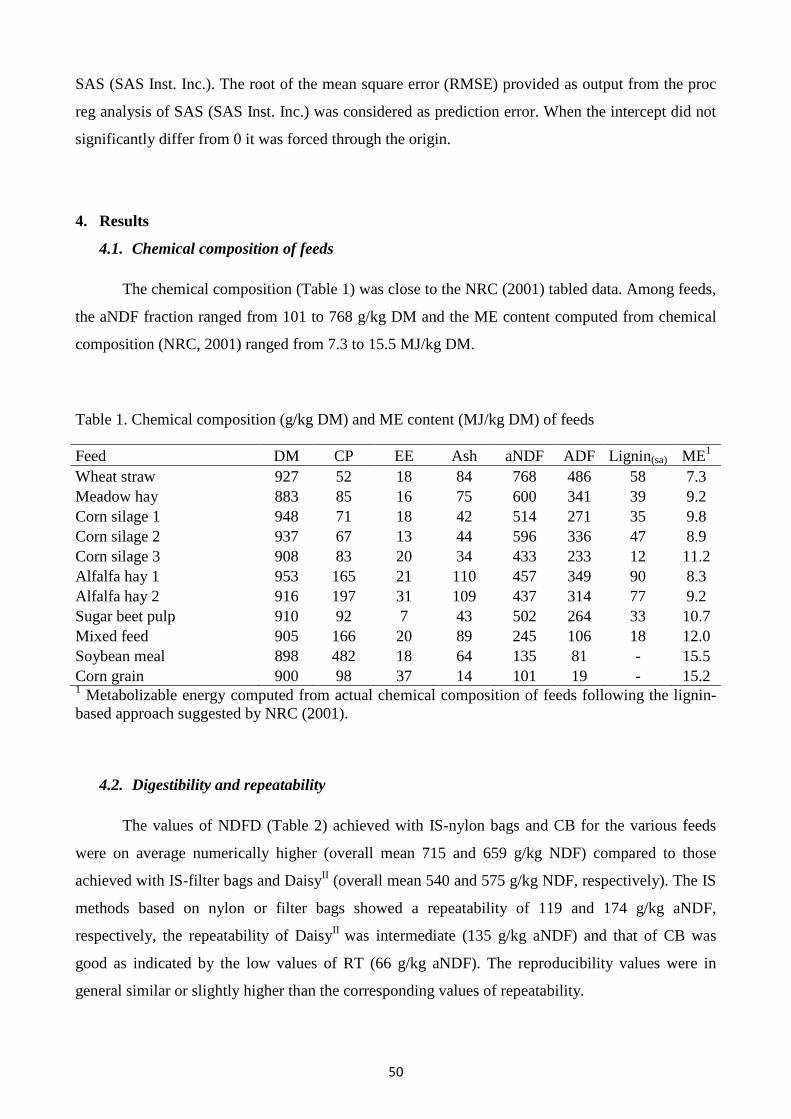
50
SAS (SAS Inst. Inc.). The root of the mean square error (RMSE) provided as output from the proc
reg analysis of SAS (SAS Inst. Inc.) was considered as prediction error. When the intercept did not
significantly differ from 0 it was forced through the origin.
4. Results
4.1. Chemical composition of feeds
The chemical composition (Table 1) was close to the NRC (2001) tabled data. Among feeds,
the aNDF fraction ranged from 101 to 768 g/kg DM and the ME content computed from chemical
composition (NRC, 2001) ranged from 7.3 to 15.5 MJ/kg DM.
Table 1. Chemical composition (g/kg DM) and ME content (MJ/kg DM) of feeds
Feed DM CP EE Ash aNDF ADF Lignin(sa) ME1 Wheat straw 927 52 18 84 768 486 58 7.3 Meadow hay 883 85 16 75 600 341 39 9.2 Corn silage 1 948 71 18 42 514 271 35 9.8 Corn silage 2 937 67 13 44 596 336 47 8.9 Corn silage 3 908 83 20 34 433 233 12 11.2 Alfalfa hay 1 953 165 21 110 457 349 90 8.3 Alfalfa hay 2 916 197 31 109 437 314 77 9.2 Sugar beet pulp 910 92 7 43 502 264 33 10.7 Mixed feed 905 166 20 89 245 106 18 12.0 Soybean meal 898 482 18 64 135 81 - 15.5 Corn grain 900 98 37 14 101 19 - 15.2 1 Metabolizable energy computed from actual chemical composition of feeds following the lignin-based approach suggested by NRC (2001).
4.2. Digestibility and repeatability
The values of NDFD (Table 2) achieved with IS-nylon bags and CB for the various feeds
were on average numerically higher (overall mean 715 and 659 g/kg NDF) compared to those
achieved with IS-filter bags and DaisyII (overall mean 540 and 575 g/kg NDF, respectively). The IS
methods based on nylon or filter bags showed a repeatability of 119 and 174 g/kg aNDF,
respectively, the repeatability of DaisyII was intermediate (135 g/kg aNDF) and that of CB was
good as indicated by the low values of RT (66 g/kg aNDF). The reproducibility values were in
general similar or slightly higher than the corresponding values of repeatability.
51
The TDMD values provided by IS-nylon bags were always numerically higher compared to
those provided by the IS-filter bag technique (847 and 778 g/kg DM respectively). With respect to
IS-nylon bags, IS-filter bag showed slightly less repeatability. The TDMD values provided by CB
were in general close to those obtained with IS-nylon bags and the overall means were 834 and 847
g/kg DM, respectively (Table 2). With respect to the other techniques, CB showed the best
repeatability, being the RT value only 24 g/kg DM. The TDMD values obtained by DaisyII, which
uses the filter bags, were always lower compared to those achieved from IS-nylon bags, but similar
to those achieved with the IS-filter bag technique (Table 2). DaisyII and IS-filter bag also provided
similar reproducibility, as the RD values were within the range from 79 to 65 g/kg, respectively.

52
Table 2. In situ and in vitro aNDF (NDFD) and true DM (TDMD) digestibility at 48 h (mean ± SD). NDFD, g/kg aNDF TDMD, g/kg DM
Feed1
In situ In vitro In situ In vitro
Nylon bag Filter bag CB2 DaisyII Nylon bag Filter bag CB DaisyII
Wheat straw 473 ±21 351 ±22 511 ±8 371 ±74 595 ±16 502 ±17 625 ±6 517 ±57
Meadow hay 503 ±27 359 ±62 628 ±24 491 ±47 702 ±16 616 ±37 777 ±14 695 ±28
Corn silage 1 723 ±10 512 ±39 637 ±20 618 ±40 857 ±5 749 ±20 813 ±10 804 ±21
Corn silage 2 591 ±82 492 ±27 586 ±34 585 ±12 756 ±49 697 ±16 753 ±20 752 ±7
Corn silage 3 588 ±42 408 ±51 633 ±9 389 ±48 822 ±18 743 ±22 841 ±4 735 ±21
Alfalfa hay 1 566 ±17 386 ±50 414 ±31 422 ±28 802 ±8 719 ±23 732 ±14 736 ±13
Alfalfa hay 2 624 ±31 445 ±100 506 ±15 480 ±29 835 ±14 757 ±44 784 ±7 773 ±12
Sugar beet pulp 1000 ±1 830 ±17 894 ±14 761 ±56 1000 ±1 915 ±9 947 ±7 880 ±28
Mixed feed 800 ±110 631 ±48 706 ±70 703 ±57 951 ±27 910 ±12 928 ±17 927 ±14
Soybean meal 1000 ±1 959 ±86 935 ±5 932 ±25 1000 ±1 994 ±12 994 ±1 991 ±3
Corn grain 1000 ±1 572 ±162 802 ±22 572 ±86 1000 ±1 957 ±16 981 ±2 957 ±9 Mean 715 540 659 575 847 778 834 797
Repeatability, RT3: 119 174 66 135 50 44 24 57
RT% 95.9 91.3 98.0 92.8 98.2 99.0 99.5 97.8
Reproducibility, RD3: 128 206 92 142 55 65 35 79
RD% 95.2 87.7 96.1 92.1 97.9 95.1 98.8 96.0 1 Each value is the mean of 8 values;2 Conventional bottles;
3 Repeatability: RT = 2�2σ��� and RT% = σ2I+ σ
2F+σ
2I×F
σ2I+ σ2F+σ
2I×F + σ
2e1 100 ; Reproducibility: RD � 2�2σ�� and RD% �
σ2F
σ2F + σ2e2.× 100
where: σ2I, σ
2F, σ
2I×F and σ2
e1 σ2e2 are variance components for incubation (I, n=2), feed (F, n=11), incubation × feed, e1 is the error term for RT and
e2 is the error term for RD.

53
4.3. Relationships between TDMD values achieved with different methods
The TDMD data provided by the two IS techniques were highly correlated (Table 3).
The regression between the IS-nylon bag and the IS-filter bags data showed a slope (P=0.02)
and an intercept (P<0.01) significantly different from unity and zero, respectively; the RMSE
was only 22 g/kg and the CV was 2.6%. The regression between IS-nylon bags and CB had a
slope not different from the unity (1.09; P=0.47) and an intercept not different from zero (-61
g/kg DM; P=0.56). Forcing the intercept to zero the slope became 1.02, the RMSE was 42
g/kg DM and the CV was 5.0%. The relationships between the TDMD values achieved with
IS-nylon bags and DaisyII showed, as observed for IS-nylon vs. IS-filter bag, a slope lower
than one (0.94), an intercept of 101 g/kg DM (P=0.19) and a RMSE of 38 g/kg DM. When the
intercept was forced to zero the slope became 1.06 and differed from the unity (P<0.01). The
relationships obtained using the CB-TDMD values as dependent variable and the IS-filter bag
or the DaisyII TDMD values as independent variables were similar to those where the IS-
nylon bags data were used as predicted variable. Likewise, the TDMD values calculated from
IS filter bags were linearly related with the TDMD values from DaisyII filter bags with a slope
of 1.09 (P=0.26) and an intercept of -89 g/kg DM (P=0.17). Forcing the intercept to the
origin the slope became close to the unity (0.98) and the RMSE was increased only from 32 to
34 g/kg DM. The results for the IS-nylon bag TDMD data regression against the TDMD
values achieved from the sole chemical analysis using the lignin based approach suggested by
NRC (2001) are also shown in table 3 for comparison. This relationship showed slope higher
than 1, a low R2 and a high RMSE.
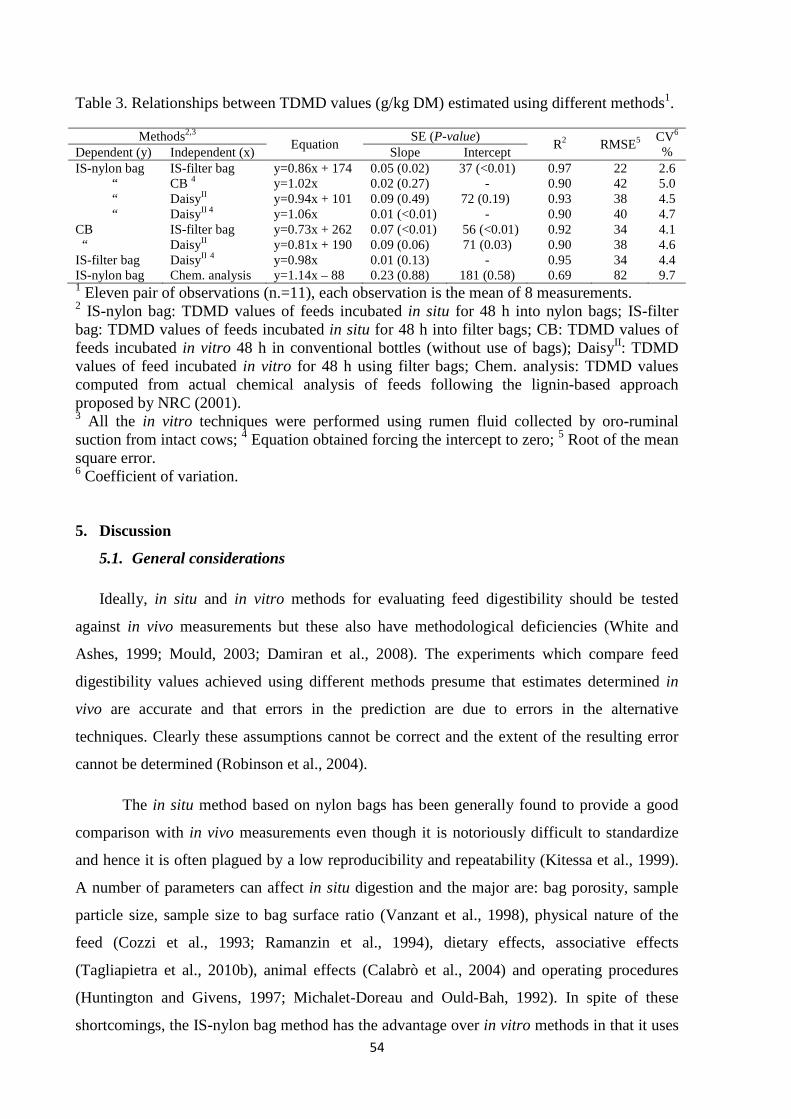
54
Table 3. Relationships between TDMD values (g/kg DM) estimated using different methods1.
Methods2,3 Equation
SE (P-value) R2 RMSE5
CV6
% Dependent (y) Independent (x) Slope Intercept IS-nylon bag IS-filter bag y=0.86x + 174 0.05 (0.02) 37 (<0.01) 0.97 22 2.6 “ CB 4 y=1.02x 0.02 (0.27) - 0.90 42 5.0 “ DaisyII y=0.94x + 101 0.09 (0.49) 72 (0.19) 0.93 38 4.5 “ DaisyII 4 y=1.06x 0.01 (<0.01) - 0.90 40 4.7 CB IS-filter bag y=0.73x + 262 0.07 (<0.01) 56 (<0.01) 0.92 34 4.1 “ DaisyII y=0.81x + 190 0.09 (0.06) 71 (0.03) 0.90 38 4.6 IS-filter bag DaisyII 4 y=0.98x 0.01 (0.13) - 0.95 34 4.4 IS-nylon bag Chem. analysis y=1.14x – 88 0.23 (0.88) 181 (0.58) 0.69 82 9.7 1 Eleven pair of observations (n.=11), each observation is the mean of 8 measurements.
2 IS-nylon bag: TDMD values of feeds incubated in situ for 48 h into nylon bags; IS-filter bag: TDMD values of feeds incubated in situ for 48 h into filter bags; CB: TDMD values of feeds incubated in vitro 48 h in conventional bottles (without use of bags); DaisyII: TDMD values of feed incubated in vitro for 48 h using filter bags; Chem. analysis: TDMD values computed from actual chemical analysis of feeds following the lignin-based approach proposed by NRC (2001). 3 All the in vitro techniques were performed using rumen fluid collected by oro-ruminal suction from intact cows; 4 Equation obtained forcing the intercept to zero; 5 Root of the mean square error. 6 Coefficient of variation.
5. Discussion
5.1. General considerations
Ideally, in situ and in vitro methods for evaluating feed digestibility should be tested
against in vivo measurements but these also have methodological deficiencies (White and
Ashes, 1999; Mould, 2003; Damiran et al., 2008). The experiments which compare feed
digestibility values achieved using different methods presume that estimates determined in
vivo are accurate and that errors in the prediction are due to errors in the alternative
techniques. Clearly these assumptions cannot be correct and the extent of the resulting error
cannot be determined (Robinson et al., 2004).
The in situ method based on nylon bags has been generally found to provide a good
comparison with in vivo measurements even though it is notoriously difficult to standardize
and hence it is often plagued by a low reproducibility and repeatability (Kitessa et al., 1999).
A number of parameters can affect in situ digestion and the major are: bag porosity, sample
particle size, sample size to bag surface ratio (Vanzant et al., 1998), physical nature of the
feed (Cozzi et al., 1993; Ramanzin et al., 1994), dietary effects, associative effects
(Tagliapietra et al., 2010b), animal effects (Calabrò et al., 2004) and operating procedures
(Huntington and Givens, 1997; Michalet-Doreau and Ould-Bah, 1992). In spite of these
shortcomings, the IS-nylon bag method has the advantage over in vitro methods in that it uses
55
the rumen environment to measure feed degradation, thus it is one of the preferred methods
for some feeding systems and it is commonly considered the standard against which the in
vitro methods are compared (Kitessa et al., 1999).
In this trial the repeatability achieved for the IS-nylon bag TDMD measurement (50
g/kg), if expressed in term of residual standard deviation (��=18 g/kg) was good and
comparable with those found by others (see the review of Kitessa et al., 1999). At least, in
part, this value might also have been influenced by the manual transfer of feed samples from
the bags to crucibles, required for the aNDF analysis, as this transfer was associated to a 7.9 ±
2.6% (30 ±11 mg) of DM losses. It should be noticed that with CB, where the whole content
of the bottles was directly filtered in the crucibles, the data were much more repeatable.
The repeatability and reproducibility values obtained with CB (24 and 35 g/kg,
respectively) were comparable, when expressed in terms of residual standard deviation
(��=8.6 and ��=12.3 g/kg) to those observed for the rumen liquor-pepsin method,
where the residual standard deviations between replicates within an incubation and between
incubations were ±6.6 and ±11.8 g/kg of apparent DM digestibility, respectively (Tilley and
Terry, 1963). The good repeatability and reproducibility of the CB methods (Tilley and Terry,
1963; Goering and van Soest, 1970; Mould, 2003) is one of the reasons why they are
recommended as reference for evaluating the energy value of feeds by the NRC (2001) energy
system.
Results of this work are also in agreement with those of Wilman and Adesogan
(2000), who found that the repeatability of the NDFD and TDMD measurements was slightly
better with CB compared to DaisyII. Spanghero et al. (2007), in a trial conducted on 162 hay
samples, obtained a limited repeatability of the Daisy-NDFD measurements (SEM=4.8% of
the mean) and attributed this result to unidentified filter bags characteristics and preparation
(porosity, sample size, amounts of substrate,…). However, the lower repeatability of the filter
bags can be overcome by increasing the number of replicates, as 3 filter bags can give, as
shown in this research, approximately the same standard error of the mean of 2.5 nylon bags
and of 2 CB measurements.
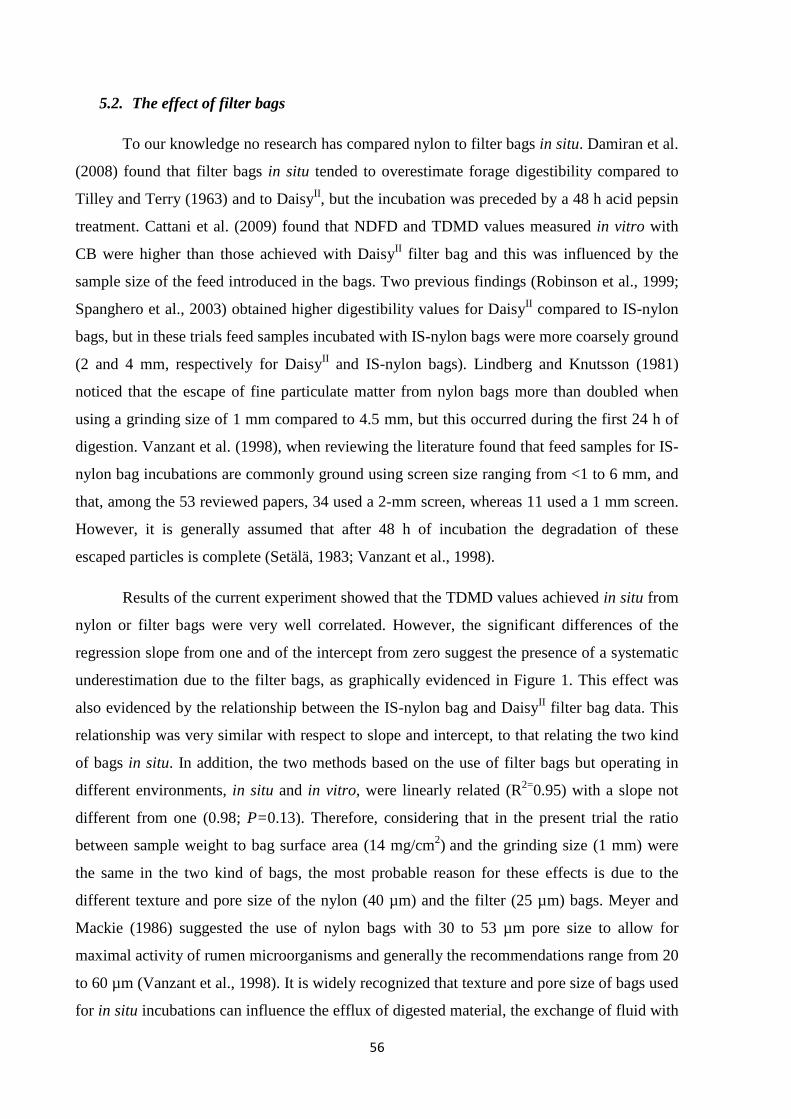
56
5.2. The effect of filter bags
To our knowledge no research has compared nylon to filter bags in situ. Damiran et al.
(2008) found that filter bags in situ tended to overestimate forage digestibility compared to
Tilley and Terry (1963) and to DaisyII, but the incubation was preceded by a 48 h acid pepsin
treatment. Cattani et al. (2009) found that NDFD and TDMD values measured in vitro with
CB were higher than those achieved with DaisyII filter bag and this was influenced by the
sample size of the feed introduced in the bags. Two previous findings (Robinson et al., 1999;
Spanghero et al., 2003) obtained higher digestibility values for DaisyII compared to IS-nylon
bags, but in these trials feed samples incubated with IS-nylon bags were more coarsely ground
(2 and 4 mm, respectively for DaisyII and IS-nylon bags). Lindberg and Knutsson (1981)
noticed that the escape of fine particulate matter from nylon bags more than doubled when
using a grinding size of 1 mm compared to 4.5 mm, but this occurred during the first 24 h of
digestion. Vanzant et al. (1998), when reviewing the literature found that feed samples for IS-
nylon bag incubations are commonly ground using screen size ranging from <1 to 6 mm, and
that, among the 53 reviewed papers, 34 used a 2-mm screen, whereas 11 used a 1 mm screen.
However, it is generally assumed that after 48 h of incubation the degradation of these
escaped particles is complete (Setälä, 1983; Vanzant et al., 1998).
Results of the current experiment showed that the TDMD values achieved in situ from
nylon or filter bags were very well correlated. However, the significant differences of the
regression slope from one and of the intercept from zero suggest the presence of a systematic
underestimation due to the filter bags, as graphically evidenced in Figure 1. This effect was
also evidenced by the relationship between the IS-nylon bag and DaisyII filter bag data. This
relationship was very similar with respect to slope and intercept, to that relating the two kind
of bags in situ. In addition, the two methods based on the use of filter bags but operating in
different environments, in situ and in vitro, were linearly related (R2=0.95) with a slope not
different from one (0.98; P=0.13). Therefore, considering that in the present trial the ratio
between sample weight to bag surface area (14 mg/cm2) and the grinding size (1 mm) were
the same in the two kind of bags, the most probable reason for these effects is due to the
different texture and pore size of the nylon (40 µm) and the filter (25 µm) bags. Meyer and
Mackie (1986) suggested the use of nylon bags with 30 to 53 µm pore size to allow for
maximal activity of rumen microorganisms and generally the recommendations range from 20
to 60 µm (Vanzant et al., 1998). It is widely recognized that texture and pore size of bags used
for in situ incubations can influence the efflux of digested material, the exchange of fluid with
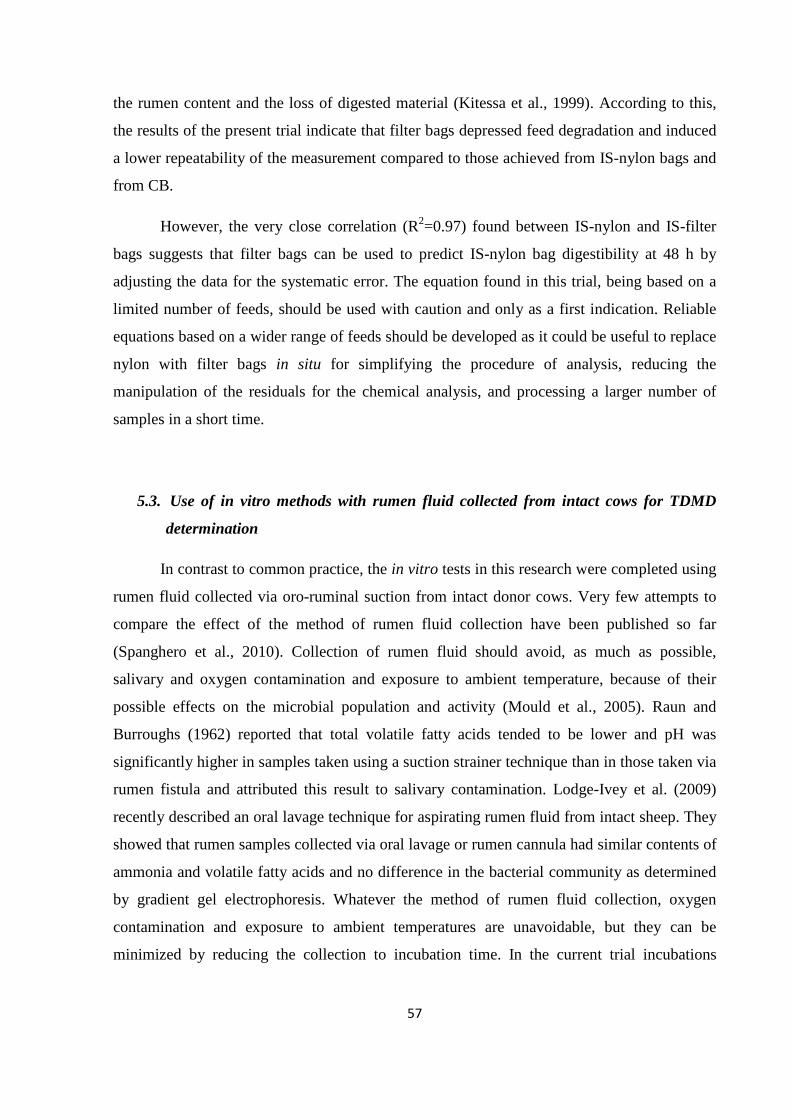
57
the rumen content and the loss of digested material (Kitessa et al., 1999). According to this,
the results of the present trial indicate that filter bags depressed feed degradation and induced
a lower repeatability of the measurement compared to those achieved from IS-nylon bags and
from CB.
However, the very close correlation (R2=0.97) found between IS-nylon and IS-filter
bags suggests that filter bags can be used to predict IS-nylon bag digestibility at 48 h by
adjusting the data for the systematic error. The equation found in this trial, being based on a
limited number of feeds, should be used with caution and only as a first indication. Reliable
equations based on a wider range of feeds should be developed as it could be useful to replace
nylon with filter bags in situ for simplifying the procedure of analysis, reducing the
manipulation of the residuals for the chemical analysis, and processing a larger number of
samples in a short time.
5.3. Use of in vitro methods with rumen fluid collected from intact cows for TDMD
determination
In contrast to common practice, the in vitro tests in this research were completed using
rumen fluid collected via oro-ruminal suction from intact donor cows. Very few attempts to
compare the effect of the method of rumen fluid collection have been published so far
(Spanghero et al., 2010). Collection of rumen fluid should avoid, as much as possible,
salivary and oxygen contamination and exposure to ambient temperature, because of their
possible effects on the microbial population and activity (Mould et al., 2005). Raun and
Burroughs (1962) reported that total volatile fatty acids tended to be lower and pH was
significantly higher in samples taken using a suction strainer technique than in those taken via
rumen fistula and attributed this result to salivary contamination. Lodge-Ivey et al. (2009)
recently described an oral lavage technique for aspirating rumen fluid from intact sheep. They
showed that rumen samples collected via oral lavage or rumen cannula had similar contents of
ammonia and volatile fatty acids and no difference in the bacterial community as determined
by gradient gel electrophoresis. Whatever the method of rumen fluid collection, oxygen
contamination and exposure to ambient temperatures are unavoidable, but they can be
minimized by reducing the collection to incubation time. In the current trial incubations
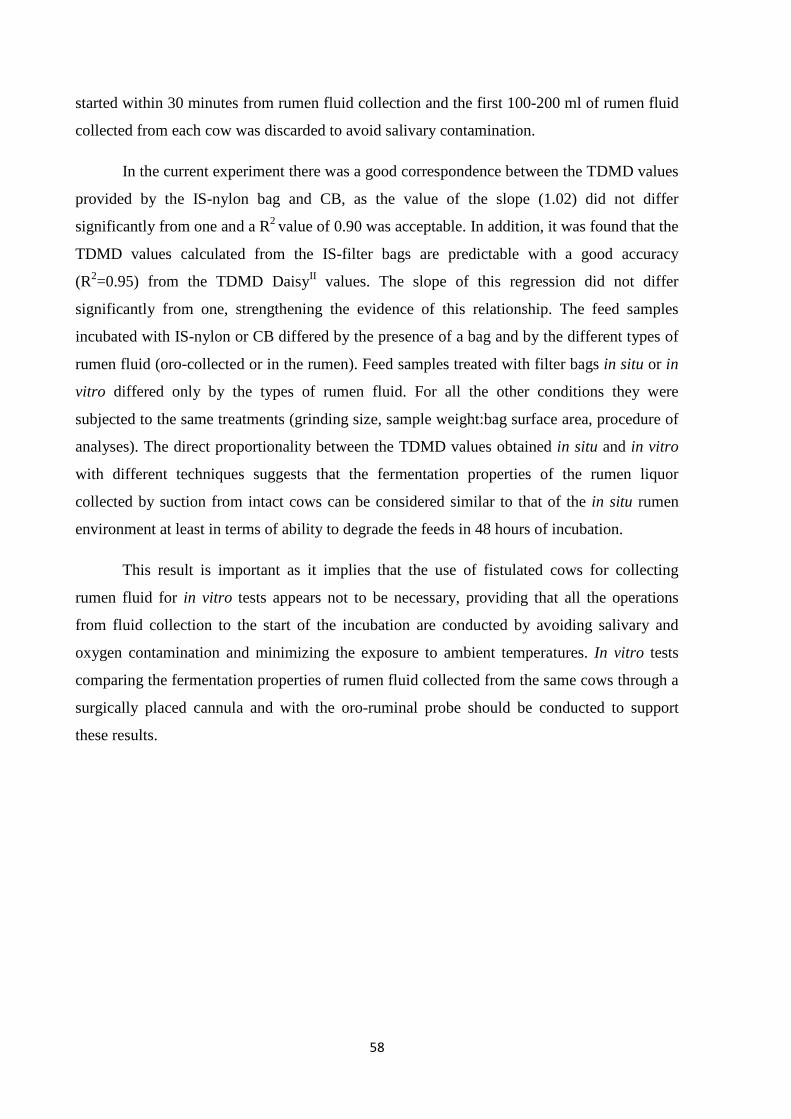
58
started within 30 minutes from rumen fluid collection and the first 100-200 ml of rumen fluid
collected from each cow was discarded to avoid salivary contamination.
In the current experiment there was a good correspondence between the TDMD values
provided by the IS-nylon bag and CB, as the value of the slope (1.02) did not differ
significantly from one and a R2 value of 0.90 was acceptable. In addition, it was found that the
TDMD values calculated from the IS-filter bags are predictable with a good accuracy
(R2=0.95) from the TDMD DaisyII values. The slope of this regression did not differ
significantly from one, strengthening the evidence of this relationship. The feed samples
incubated with IS-nylon or CB differed by the presence of a bag and by the different types of
rumen fluid (oro-collected or in the rumen). Feed samples treated with filter bags in situ or in
vitro differed only by the types of rumen fluid. For all the other conditions they were
subjected to the same treatments (grinding size, sample weight:bag surface area, procedure of
analyses). The direct proportionality between the TDMD values obtained in situ and in vitro
with different techniques suggests that the fermentation properties of the rumen liquor
collected by suction from intact cows can be considered similar to that of the in situ rumen
environment at least in terms of ability to degrade the feeds in 48 hours of incubation.
This result is important as it implies that the use of fistulated cows for collecting
rumen fluid for in vitro tests appears not to be necessary, providing that all the operations
from fluid collection to the start of the incubation are conducted by avoiding salivary and
oxygen contamination and minimizing the exposure to ambient temperatures. In vitro tests
comparing the fermentation properties of rumen fluid collected from the same cows through a
surgically placed cannula and with the oro-ruminal probe should be conducted to support
these results.
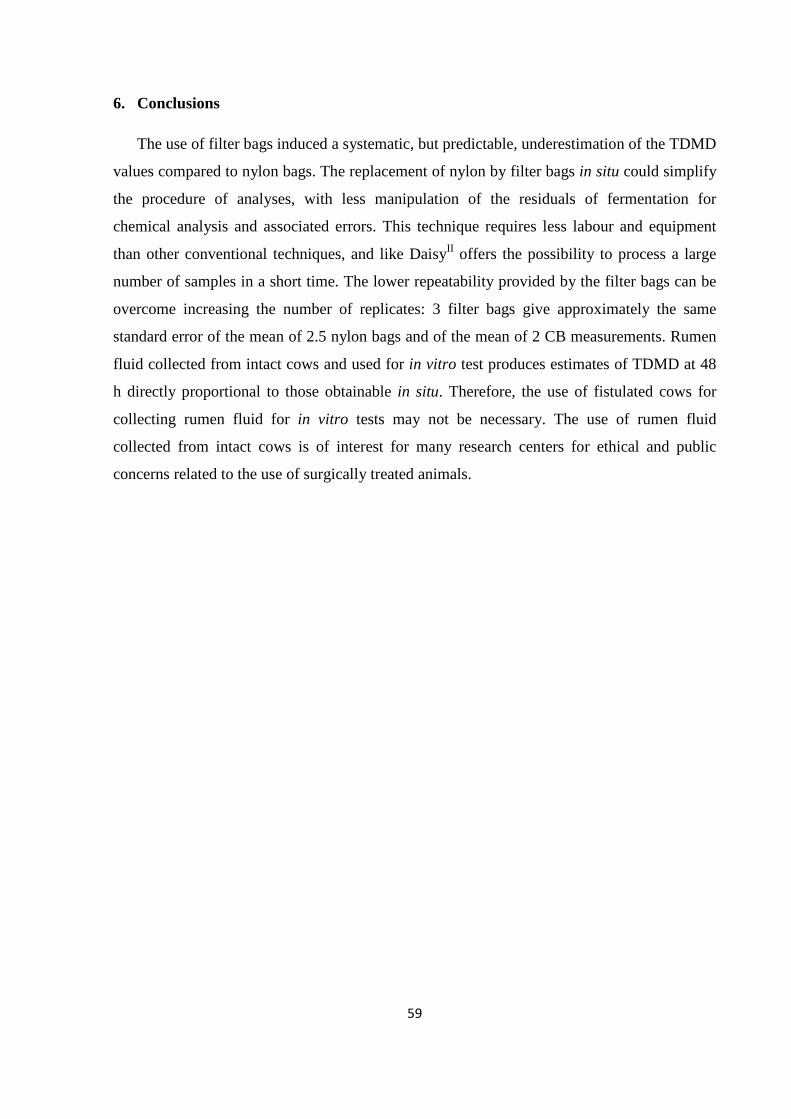
59
6. Conclusions
The use of filter bags induced a systematic, but predictable, underestimation of the TDMD
values compared to nylon bags. The replacement of nylon by filter bags in situ could simplify
the procedure of analyses, with less manipulation of the residuals of fermentation for
chemical analysis and associated errors. This technique requires less labour and equipment
than other conventional techniques, and like DaisyII offers the possibility to process a large
number of samples in a short time. The lower repeatability provided by the filter bags can be
overcome increasing the number of replicates: 3 filter bags give approximately the same
standard error of the mean of 2.5 nylon bags and of the mean of 2 CB measurements. Rumen
fluid collected from intact cows and used for in vitro test produces estimates of TDMD at 48
h directly proportional to those obtainable in situ. Therefore, the use of fistulated cows for
collecting rumen fluid for in vitro tests may not be necessary. The use of rumen fluid
collected from intact cows is of interest for many research centers for ethical and public
concerns related to the use of surgically treated animals.
60
References
Adesogan, A.T., 2005. Effect of bag type on the apparent digestibility of feeds in ANKOM
DaisyII incubators. Anim. Feed Sci. Technol. 119, 333-344.
Ankom Technology, 2005. Method for determining neutral detergent fiber (aNDF). Ankom
Technology, Macedon, NY.
Ammar, H., López, S., Bochi, O., Garcıa, R., Ranilla, M.J., 1999. Composition and in vitro
digestibility of leaves and stems of grasses and legumes harvested from permanent
mountain meadows at different maturity stages. J. Anim. Feed Sci. 8, 599-610.
AOAC, 2003. Official Methods of Analysis of the Association of Official Agricultural
Chemists. 17th ed. (2th revision). AOAC International, Gaithersburg, MD, USA.
Bartlett, M.S. 1937. Properties of sufficiency and statistical tests. Proceedings of the Royal
Society of London, Series A, 160, 268-282.
Calabrò, S., Williams, B.A., Piccolo, V., Infascelli F., Tamminga S., 2004. A comparison
between buffalo (Bubalus bubalis) and cow (Bos taurus) rumen fluids in terms of the in
vitro fermentation characteristics of three fibrous feedstuffs. J. Sci. Food. Agric. 84, 645-
652.
Cattani, M., Tagliapietra, F., Bailoni, L., Schiavon, S., 2009. In vitro rumen feed degradability
assessed with DaisyII and batch culture: effect of sample size. Ital. J. Anim. Sci. 8, 169-
171.
Cozzi, G., Bittante, G., Polan, C.E., 1993. Comparison of degradation of fibrous materials as
modifiers of in situ ruminal corn gluten meal. J. Dairy Sci. 76, 1106-1113.
Damiran D., Del Curto, T., Bohnert, D.W., Findholt, S.L., 2008. Comparison of techniques
and grinding size to estimate digestibility of forage based ruminant diets. Anim. Feed Sci.
Technol. 141, 15-35.
Goering, H.K., Van Soest, P.J., 1970. Forage Fiber Analysis (Apparatus, Reagents,
Procedures, and Some Applications). USDA Agricultural Research Service, Handbook No.
379, Washington, DC.

61
Huntington, J.A., Givens, D.I., 1997. Studies on in situ degradation of feeds in the rumen: 1.
Effect of species, bag mobility and incubation sequence on dry matter disappearance.
Anim. Feed Sci. Technol. 64, 227-241.
International Organization for Standardization, 1994a. Accuracy (trueness and precision) of
measurement methods and results - Part 1: General principles and definitions. ISO 5725-1.
International Organization for Standardization, Geneva, Switzerland.
International Organization for Standardization, 1994b. Accuracy (trueness and precision) of
measurement methods and results - Part 2: Basic method for the determination of
repeatability and reproducibility of a standard measurement method. ISO 5725-2.
International Organization for Standardization, Geneva, Switzerland.
Kitessa, S., Flinn, P.C., Irish, G.G., 1999. Comparison of methods used to predict in vivo
digestibility of feeds in ruminants. Aust. J. Agric. Res. 50, 825-841.
Licitra, G., Hernandez, T.M., Van Soest, P.J., 1996. Standardization of procedures for
nitrogen fractionation of ruminant feeds. Anim. Feed Sci. Technol. 57, 347-358.
Lindberg, J.E., Knutsson, P.G., 1981. Effect of bag pore size on the loss of particulate matter
and on the degradation of cell wall fibre. Agric. Environ. 6, 171-182.
Lodge-Ivey, S.L., Browne-Silva, J., Horvath, M.B., 2009. Technical note: bacterial diversity
and fermentation end products in rumen fluid samples collected via oral lavage or rumen
cannula. J. Anim. Sci. 87, 2333-2337.
Makkar, H.P.S., 2005. Recent advances in the in vitro gas method for evaluation of nutritional
quality of feed resources. In: Assessing Quality and Safety of Animal Feeds. FAO Animal
Production and Health Series 160. FAO, Rome, pp. 55-88.
Menke, K.H., and Steingass, H., 1988. Estimation of the energetic feed value obtained from
chemical analysis and gas production using rumen fluid. Anim. Res. Dev. 28, 7-55.
Mertens, D.R., 2002. Gravimetric determination of amylase-treated neutral detergent fiber in
feeds with refluxing in beakers or crucibles: collaborative study. J. AOAC Int. 85, 1217-
1240.
62
Meyer, J.H.F., Mackie, R.I., 1986. Microbiological evaluation of the intraruminal in sacculus
digestion technique. Appl. Environ. Microbiol. 51, 622-629.
Michalet-Doreau, B., Ould-Bah, M.Y., 1992. In vitro and in sacco methods for the estimation
of dietary nitrogen degradability in the rumen: a review. Anim. Feed Sci. Technol. 40, 57-
86.
Mould, F.L., 2003. Predicting feed quality-chemical analysis and in vitro evaluation. Field
Crops Res. 84, 31-44.
Mould, F.L., Kliem, K.E., Morgan, R., Mauricio, R.M., 2005. In vitro microbial inoculum: A
review of its function and properties. Anim. Feed Sci. Technol. 123-124, 31-50.
National Research Council (NRC), 2001. Nutrient requirements of dairy cattle, seventh
revised ed. National Academy Press, Washington, DC, USA.
Nocek, J.E., 1988. In situ and other methods to estimate ruminal protein and energy
digestibility: a review. J. Dairy Sci. 71, 2051-2069.
Ørskov, E.R., McDonald, I., 1979. The estimate of protein degradability in the rumen from
incubation measurements weighted according to rate of passage. J. Agric. Sci. Camb. 92,
499-503.
Ramanzin, M., Bailoni, L., Bittante, G., 1994. Solubility, water holding capacity, and specific
gravity of different concentrates. J. Dairy Sci. 77, 774-781.
Raun, N.S., Burroughs, W., 1962. Suction strainer technique in obtaining rumen fluid samples
from intact lambs. J. Anim. Sci. 21, 454-457.
Robertson, J.B., Van Soest, P.J., 1981. In: James, W.P.T., Theander, O., (Eds), The Analysis
of Dietary Fiber in Food. Marcel Dekker, Inc., New York, USA, pp. 123-158.
Robinson, P.H., Campbell Mathews, M., Fadel, J.G., 1999. Influence of storage time and
temperature on in vitro digestion of neutral detergent fibre at 48 h, and comparison to 48 h
in sacco neutral detergent fibre digestion. Anim. Feed Sci. Technol. 80, 257-266.
Robinson, P.H., Givens, D.I., Getachew, G., 2004. Evaluation of NRC, UC Davis and ADAS
approaches to estimate the metabolizable energy values of feeds at maintenance energy
intake from equations utilizing chemical assays and in vitro determinations. Anim. Feed
Sci. Technol. 114, 75-90.
63
SAS® User’s Guide: Statistics, version fifth ed. 2005. SAS Institute, Cary, NC, USA.
Schofield, P., 2000. Gas Production Methods. In: D’Mello, J.P.F. (Ed.), Farm animal
metabolism and nutrition. CABI Publishing. Oxon, UK.
Setälä, J., 1983. The nylon bag technique in the determination of ruminal feed protein
degradation. J. Sci. Agric. Soc. Finland 55, 1-78.
Spanghero, M., Boccalon, S., Gracco, L., Gruber, L., 2003. NDF degradability of hays
measured in situ and in vitro. Anim. Feed Sci. Technol. 104, 201-208.
Spanghero, M., Gruber, L., Zanfi, C., 2007. Precision and accuracy of the NDF rumen
degradability of hays measured by the Daisy fermenter. Ital. J. Anim. Sci. 6, 363-365.
Spanghero, M., Berzaghi, P., Fortina, R., Masoero, F., Rapetti, L., Zanfi, C., Tassone, S.,
Gallo, A., Colombini, S., Ferlito, J.C., 2010. Precision and accuracy of in vitro digestion of
neutral detergent fiber and predicted net energy of lactation content of fibrous feeds. J.
Dairy Sci. 93, 4855-4859.
Tagliapietra, F., Cattani, M., Bailoni, L., Schiavon, S., 2010a. In vitro rumen fermentation:
Effect of headspace pressure on the gas production kinetics of corn meal and meadow hay.
Anim. Feed Sci. Technol. 158, 197-201.
Tagliapietra, F., Guadagnin, M., Cattani, M., Schiavon, S., Bailoni, L., 2010b. Associative
effects of different feed combinations assessed using a gas production system. In: Book of
Abstracts of the 61st Annual Meeting of the European Association of Animal Production,
Heraklion, Greece, August 23-27, p. 166.
Tilley, J.M.A., Terry, R.A., 1963. A two-stage technique for the in vitro digestion of forage
crops. J. Br. Grassland Soc. 18, 104-111.
Van Soest, P.J., Wine, R.H., Moore, L.A., 1966. Estimation of the true digestibility of forages
by the in vitro digestion of cell walls. In: Proceedings of the 10th International Grassland
Congress, 10, 438-441.
Vanzant, E.S., Cochran, R.C., Titgemeyer, E.C., 1998. Standardization of in situ techniques
for ruminant feedstuff evaluation. J. Anim. Sci. 76, 2717-2729.
Weiss, W.P., 1993. Predicting energy values of feeds. J. Dairy Sci. 76, 1802-1811.
64
White, C.L., Ashes, J.R., 1999. A review of methods for assessing the protein value of grain
fed to ruminant. Aust. J. Agric. Res. 50, 855-869.
Wilman, D., Adesogan, A., 2000. A comparison of filter bag methods with conventional tube
methods of determination the in vitro digestibility of forages. Anim. Feed Sci. Technol. 84,
33-47.
65
CHAPTER 5
Running title: Use of NDF digestibility and gas production for feed evaluation
Metabolizable energy content of feeds based on 24 or 48 h in situ
NDF digestibility and on in vitro 24 h gas production methods
Franco Tagliapietraa, Mirko Cattania, Hanne H. Hansenb,
Ida K. Hindrichsenc, Lucia Bailonia, Stefano Schiavona
a Department of Animal Science. University of Padova, Italy.
b Department of Large Animal Sciences. University of Copenhagen, Denmark. c Animal Health and Nutrition, Chr. Hansen A/S, Bøge Allé 10-12, 2970 Denmark.
Submitted to:
ANIMAL FEED SCIENCE AND TECHNOLOGY (2011)
66
1. Abstract
The true digestible DM (TDMd) and ME contents of feeds are frequently assessed from
the amount of digestible aNDF (dNDF) measured in situ or in vitro after 48 h of incubation,
using the summative approach proposed by NRC. Alternative ways for determining the ME
content of feeds are based on the gas produced after 24 h of in vitro incubation (GP24) and
the chemical composition of feeds. The present study was aimed to: i) evaluate the validity to
reduce the in situ time of incubation from 48 to 24 h for determining TDMd; ii) to study the
relationship between the ME values estimated from dNDF and from GP24. Eleven feeds, with
an aNDF content ranging from 101 to 768 g/kg DM, were used. The feeds were
simultaneously incubated in the rumen of two cows for 24 and for 48 h with two replications.
The entire incubation was repeated a week later. Following the NRC approach, the amounts
of digestible aNDF measured after 24 and 48 h of incubation were used to compute the true
DM digestibility values (TDMd24 and TDMd48, respectively) and the ME (MENRC)
estimates. The same feeds were incubated in vitro and GP24 was measured by an automated
gas production system with 4 replications. The entire incubation was repeated at a later time.
Estimates of ME from GP24 were computed using the Hohenheim (MEMenke) and the UC
Davis (MEUCD) equations. The MENRC, MEMenke and MEUCD estimates were compared by
regression. The repeatability of TDMd24 and TDMd48 was comparable (SED=12 g/kg DM)
and they were related as: TDMd48= 0.74×TDMd24 + 260 (R2=0.98; RMSE=21.5 g/kg DM).
The results suggest that, for in situ tests, the incubation time can be shortened from 48 to 24 h,
so that the labor and the costs for feed evaluation can be reduced. The measures of GP24 and
TDMd48 were also well correlated (R2=0.97), but only for feeds with less than 16% of
CP/DM. The repeatability of MENRC, MEMenke, and MEUCD, expressed in terms of SED, were
0.35, 0.46 and 0.46 MJ/kg DM, respectively. The MENRC was predicted as 1.04×MEUCD
(RMSE=0.63 MJ/kg DM) and as 1.11×MEMenke (RMSE=1.16 MJ/kg DM). When the MENRC
values are taken as comparison terms, the UC Davis equation is more accurate and precise
than the Hohenheim ones. However, the precision and the accuracy of ME predictions based
on GP24 depend on: i) the availability of standardized procedures for measuring GP; ii) the
availability of reliable equations relating GP and feed chemical composition (with special
regards for CP) to predicted or in vivo measured energy contents of feeds; iii) the set of
equations that a given energy system proposes to predict the ME of feeds from their digestible
nutrient contents.
Keywords: Feed energy; Nylon bags; Automated gas production system; In situ digestibility;
67
2. Introduction
Energy content of ruminant feeds is often estimated from feed chemical composition
(Weiss, 1993) or alternately using in situ or in vitro methods that evaluate the feed
digestibility (NRC, 2001), or even the gas production (GP) (Menke and Steingass, 1988,
Robinson et al., 2004). The traditional in situ method (Ørskov and McDonald, 1979) has the
advantage that it uses the actual rumen environment to measure feed degradation and that it is
the standard against which the in vitro methods are often compared (Kitessa et al., 1999).
However, this technique has some shortcomings because: ii) it is expensive in terms of labour
and analytical costs; ii) it measures the feed disappearance and not the actual amount of
fermented substrate; iii) it has raised public concerns about animal welfare (Lindberg, 1985;
Nocek, 1988; Michalet-Doreau and Ould-Bah, 1992; Stern et al., 1997). The in vitro batch
culture fermentation followed by an enzymatic digestion step is a reliable alternative (Tilley
and Terry, 1963). Goering and Van Soest (1970) replaced the enzymatic step with a neutral
detergent treatment to determine the amount of digestible aNDF (dNDF) and the true dry
matter digestibility (TDMd). NRC (2001) suggests that the ME content of feeds (MENRC) can
be estimated from dNDF determined in situ or in vitro after 48 h of feed incubation with
rumen fluid. Some advantages of this technique, compared to the conventional in situ
technique, are: i) ease of standardization and low cost (Makkar, 2005); ii) less ethical
concerns related to the use of surgically cannulated cows, as rumen fluid can be collected
from intact donor cows (Tagliapietra et al., submitted). A reduction of the incubation time
from 48 to 30 or 24 h has been previously proposed, because the shorter incubation times are
considered to be closer to the retention times of the feed particles in rumen of high producing
dairy cows (Hoffman et al., 2003; Goeser and Combs, 2009). However, direct comparisons of
TDMd values achieved after 24, 30 or 48 h of incubation are still insufficient and more
information is required (Hoffman et al., 2003; Spanghero et al., 2010).
Alternative, reduced cost, ways for determining the energy value of feeds are those
based on gas production (GP). The Hohenheim technique (Menke and Steingass, 1988)
estimates the feed ME content (MEMenke) using equations based on the amount of gas
produced in syringes after 24 h of incubation (GP24) and from the feed chemical composition.
The UC Davis approach described by Robinson et al. (2004) is similar, but it uses a different
equation for estimating ME (MEUCD). This technique is evolving towards semi-automated
(Theodorou et al., 1994; Mauricio et al., 1999) and automated systems (Pell and Schofield,
1993; Cone et al., 1996; Tagliapietra, 2010); both at a reduced cost in terms of time and labor
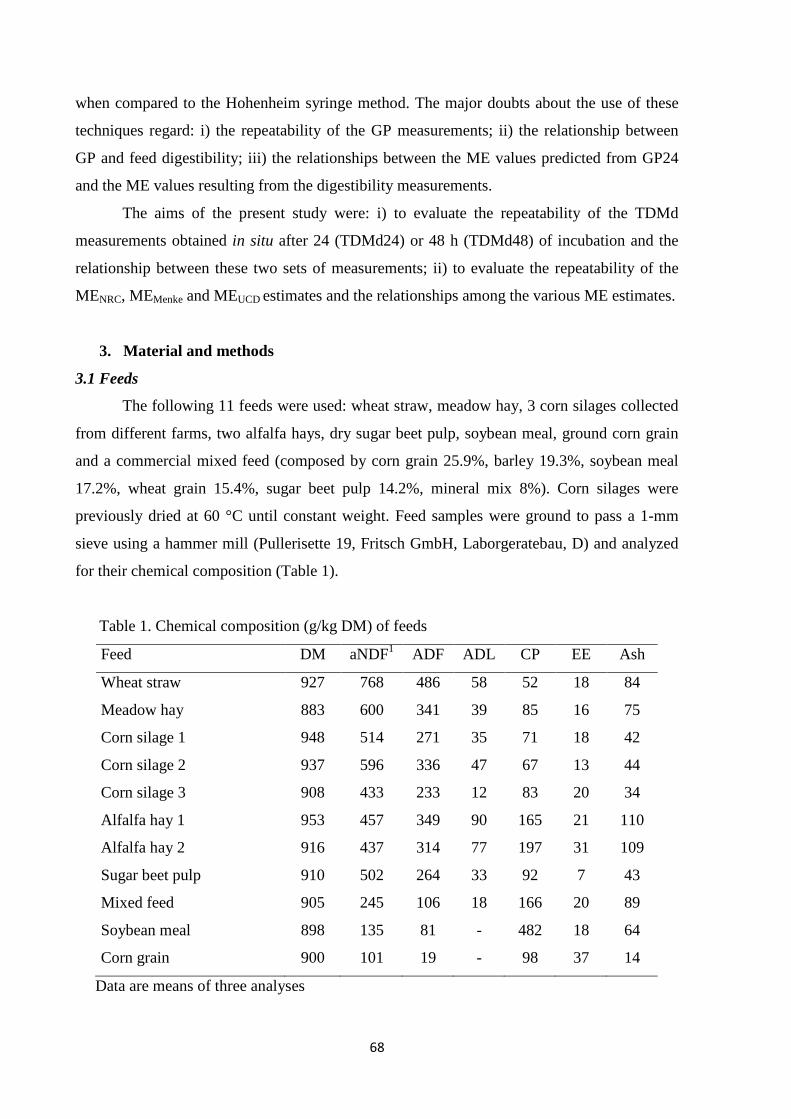
68
when compared to the Hohenheim syringe method. The major doubts about the use of these
techniques regard: i) the repeatability of the GP measurements; ii) the relationship between
GP and feed digestibility; iii) the relationships between the ME values predicted from GP24
and the ME values resulting from the digestibility measurements.
The aims of the present study were: i) to evaluate the repeatability of the TDMd
measurements obtained in situ after 24 (TDMd24) or 48 h (TDMd48) of incubation and the
relationship between these two sets of measurements; ii) to evaluate the repeatability of the
MENRC, MEMenke and MEUCD estimates and the relationships among the various ME estimates.
3. Material and methods
3.1 Feeds
The following 11 feeds were used: wheat straw, meadow hay, 3 corn silages collected
from different farms, two alfalfa hays, dry sugar beet pulp, soybean meal, ground corn grain
and a commercial mixed feed (composed by corn grain 25.9%, barley 19.3%, soybean meal
17.2%, wheat grain 15.4%, sugar beet pulp 14.2%, mineral mix 8%). Corn silages were
previously dried at 60 °C until constant weight. Feed samples were ground to pass a 1-mm
sieve using a hammer mill (Pullerisette 19, Fritsch GmbH, Laborgeratebau, D) and analyzed
for their chemical composition (Table 1).
Table 1. Chemical composition (g/kg DM) of feeds
Feed DM aNDF1 ADF ADL CP EE Ash
Wheat straw 927 768 486 58 52 18 84
Meadow hay 883 600 341 39 85 16 75
Corn silage 1 948 514 271 35 71 18 42
Corn silage 2 937 596 336 47 67 13 44
Corn silage 3 908 433 233 12 83 20 34
Alfalfa hay 1 953 457 349 90 165 21 110
Alfalfa hay 2 916 437 314 77 197 31 109
Sugar beet pulp 910 502 264 33 92 7 43
Mixed feed 905 245 106 18 166 20 89
Soybean meal 898 135 81 - 482 18 64
Corn grain 900 101 19 - 98 37 14
Data are means of three analyses
69
3.2 In situ technique
The incubations were completed according to the procedure proposed by Ørskov and
McDonald (1979), modified by Nocek (1988) and Vanzant et al. (1998).
Two dry Holstein-Friesian fistulated cows (housed at the experimental farm of
Department of Animal Science, University of Milan, Italy), that had been fed hay ad libitum
and 2 kg/d of concentrate for 2 weeks, were used. The feed samples were incubated in two
separate periods of incubation in the rumen of the two cows for 24 h and 48 h. The
experimental design was: 2 repeated incubations × 2 cows × 11 feeds × 2 incubation times × 2
replications, giving a total of 8 bags per feed and per time, plus 16 empty bags as blank.
Feed samples (1.150+0.005 g) were placed in nylon bags (40 µm of pore size; 10.5 × 8
cm of net surface area) to achieve a ratio between feed sample size and net bag surface area
(excluding bag areas not in contact with the feed) of 14 mg/cm2 (Nocek, 1988). The nylon
bags were bound to plastic strings and introduced in the rumen of the cows 2 hours after the
morning feeding. After 24 and 48 h the bags were extracted from the rumen, washed in cold
water, weakly centrifuged in a washing machine (2 minutes rinse + 2 minutes spin, repeated 5
times) and stored at 4°C for about 2 h, which was the time required for transferring the
samples to the laboratory.
3.3 Gas production technique
The in vitro gas production analyses were completed according to the procedure
proposed by for 24 h (Menke and Steingass, 1988). The feed samples were incubated in two
separate periods of incubation. The experimental design was: 2 incubation periods × 11 feeds
× 4 replications, giving a total of 8 bottles per feed, plus 8 empty bottles as blank (4
blanks/incubation).
The buffer mineral solution, prepared according to Menke and Steingass (1988), was
heated in a waterbath at 39°C and purged continuously with CO2 for 30 minutes. Sodium
sulphite was used as reducing agent in the buffer solution (0.33 g/l solution; Menke and
Steingass, 1988). Rumen fluid was collected two hours after morning feeding from 3 dry
Holstein-Friesian cows (housed at the experimental farm of the Department of Animal
Science, University of Padova, Italy) that were fed hay ad libitum and 2 kg/d of concentrate
for 2 weeks. Rumen fluid was collected using a vacuum pump connected to a glass vacuum
container in turn connected to a semi-flexible oro-ruminal probe equipped with a steel strainer
fixed on the top (Tagliapietra et al., submitted). The steel strainer (15 cm of length and 3.5 cm
70
of diameter, 600 g of weight) had 32 holes of 0.5 cm of width. The vacuum pump was
activated when the top of the probe was positioned in the rumen. The first 100 to 200 ml of
rumen sample collected from each cow was discarded to limit contamination with saliva
(Raun and Burroughs, 1962). The pH of the rumen liquor was measured immediately after
collection and only fluids with pH lower than 6.8 were kept for the tests. The rumen fluid was
poured into two thermal flasks preheated to 39.0±0.5 °C and immediately transferred to the
laboratory. At the laboratory the rumen fluid was filtered through 3 layers of cheesecloth to
eliminate feed particles and mixed with the buffer mineral solution in a ratio 1 to 2 (Menke
and Steingass, 1988). All the operations were conducted under anaerobic conditions by
flushing carbon dioxide. The time required for all the operations was less than 30 minutes.
A commercial wireless GP apparatus (Ankom RF Gas Production System, Ankom
Technology®, Macedon, NY, USA) consisting of to 48 bottles equipped with pressure sensors
(pressure range: from −69 to +3447 kPa; resolution: 0.27 kPa; accuracy: ±0.1% of measured
value) and a receiving base station and computer was used. Each bottle (280 ml) was filled
with 0.5000±0.0010 g of feed sample and preheated overnight at 39 °C. On the day of the
incubation, each bottle was filled with 75 ml of buffered rumen fluid (headspace volume of
205 ml), keeping headspace of bottle continuously flushed with CO2. After the inclusion of
the feed the bottles were closed and placed in an air ventilated oven at 39±0.4 °C.
During the incubation, the bottle headspace pressure changes, with respect to the
atmospheric pressure measured at the start of the incubation (Po), were transmitted via a radio
frequency to a PC with a set frequency of 1 minute. Gas in the headspace of the bottles was
automatically released by opening a closed valve when a threshold pressure variation of +3.4
kPa was reached. This pressure, previously used by Tagliapietra et al. (2010), is slightly lower
than 4.5 kPa used with others automated equipments (Davies et al., 2000; Calabrò et al.,
2005). The readings of gas pressure changes after 24 and 48 h of fermentation were
cumulated (∆P) and converted to units of volume (GP, ml) using the ideal gas law:
GP = (∆P/Po) × Vo (1)
where: ∆P is the cumulated pressure change (kPa) in the bottle headspace; Vo is the bottle
headspace volume (205 ml), Po is the atmospheric pressure read by the equipment at the
beginning of the trial. The final GP volume of bottles with no feed (blank) was subtracted
from the final GP volume for bottles with feed to correct for baseline fermentation in the
rumen fluid. Data of GP were expressed as ml/g DM incubated.
At the end of the incubation the fluids of fermentation were analyzed for pH to test the
ability of medium to maintain the buffer properties and the values resulted always higher than
71
the threshold of 6.2, below which the Menke’s buffer is exhausted and the release of gas
becomes not-linearly related to the production of end products of fermentation (Menke et al.,
1979; Beuvink and Spoelstra, 1992).
3.4 Chemical analyses
All the chemical analyses were performed in the same laboratory by the same
technician.
The feeds were analysed in triplicate for dry matter (DM, AOAC method 934.01,
2003), crude protein (CP, AOAC method 976.05, 2003), ether extract (EE, AOAC method
920.29, 2003) and ash content (AOAC method 942.05, 2003). Neutral detergent fibre (aNDF)
was determined (Mertens, 2002) with a treatment with α-amylase and sodium sulphite using
the Ankom220 Fiber Analyzer (Ankom Technology®, Macedon, NY, USA). ADF and
sulphuric acid lignin (Lignin(sa)) contents were determined sequentially after aNDF
determination (Robertson and Van Soest, 1981). The feeds were also analysed for neutral
detergent insoluble crude protein (NDICP) and acid detergent insoluble crude protein
(ADICP) (Licitra et al., 1996).
After incubation and washing, the nylon bags were dried at 60°C in an air ventilated
incubator and weighed; the residual feed material was transferred from each bag to weighed
crucibles (30 ml por. 2, Robu Glasfilter-Geräte GMBH®, Hattert, D) and treated as indicated
for the aNDF analysis (Mertens, 2002) with a Fibertech Analyzer (VELP® Scientifica,
Usmate, Milano, I).
3.5 Computation of TDMd and MENRC values
The digestible NDF (dNDF) and the true DM digestibility (TDMd) were computed
using the following equations (Goering and Van Soest, 1970):
dNDF (g/kg DM) = 1000 × [(aNDFfeed - aNDFres) / DMfeed]; (2)
TDMd (g/kg DM) = 1000 × [(DMfeed – aNDFres) / DMfeed]; (3)
where: aNDFfeed is the amount of aNDF incubated with the feed, aNDFres is the amount of
aNDF residual measured after 24 or 48 h of fermentation, DMfeed is the amount of DM
incubated; these amounts were expressed in grams of DM.
The energy values of feeds were computed as (NRC, 2001):
DE (MJ/kg DM) = (dNDF/1000×4.2 + tdNFC/1000×4.2 + tdCP/1000×5.6
+ tdFA/1000×9.5 - 0.3)×4.184 (4)

72
MENRC (MJ/kg DM) = [ – 0.45 × 4.184 + 1.01×DE] (5)
where: dNDF is the measurement described before but only at 48 h of incubation, and
tdNFC, tdCP and tdFA are the estimated true digestible contents of non-fibre carbohydrates,
crude protein and fat (g/kg DM) calculated using the equations proposed by NRC (2001)
(Eqs. 2-4a to 2-4e) with an adjustment factor (PAF) for different feeds selected from NRC
(2001). For the application of these equations the analytical determination of the following
feed constituents is required: aNDF, CP, NDICP, ADICP, EE and Ash.
3.6 Computation of MEMenke and MEUCD values from GP measurements
The Hohenheim gas method was developed using data from 400 in vivo digestibility
trials mainly conducted on sheep. The feed ME contents were computed considering 15.2,
34.2 12.8, and 15.9 MJ ME/kg of in vivo measured digestible CP, EE, crude fiber and
nitrogen free extract. These ME values were then regressed against the GP24 and the
proximate composition of the same feeds. The resulting equations, proposed for estimating
the feed MEMenke values from only GP24 and proximate composition, were the following,
respectively for roughages and other feeds (Menke and Steingass, 1988):
MEMenke (MJ/kg DM) = 2.20 + 0.1357×GP24200 + 0.0057×CP + 0.0002859×EE2 (6)
MEMenke (MJ/kg DM) = 1.06 + 0.1570×GP24200 + 0.0084×CP + 0.0220×EE – 0.0081×Ash (7)
where: GP24200 (ml/200 mg of DM incubated) is the gas production measured at 24 h. All the
chemical constituents were expressed as g/kg DM.
In the present research we used the first equation (6) for wheat straw, grass hay, alfalfa
hay and corn silage and the second one (7) for the remaining feeds.
Metabolizable energy content was also estimated using the UC Davis unified equation
proposed by Robinson et al. (2004) and resulting from a modification of those proposed by
Menke and Steingass (1988):
MEUCD (MJ/kg DM) = 1.25 + 0.0292 × GP24DM + [0.0143× (CP-ADICP)] + 0.0246 × EE (8)
where: GP24DM is expressed as ml/g DM.
3.7 Statistical analysis
3.7.1 Repeatability and reproducibility
Estimation of variance components was accomplished separately for estimates of
TDMd, GP at 24 and 48 h, MENRC, MEMenke, and MEUCD provided by different methods, using
the mixed procedure of SAS (SAS Inst. Inc.) with two mixed linear models. In the first model
the following sources of variation were considered as random effects: the period of incubation
73
(I ), the feed (F), the interaction I×F and the error term (e1). An additional random effect
included in the model was the effect of the different cows for the in situ method, but as the
proportion of variance explained by this factor was very low, it was included in the error term.
The restricted maximum likelihood method (REML) was used as the method of estimation of
variance components. The components of variance of each factor, σ2I, σ
2F, σ
2I×F and σ2
e1 were
used to compute the repeatability (RT), defined as the value below which the absolute
difference between two single measures obtained with the same method and under the same
conditions (same incubation, same feed) is expected with a 95% probability, and the
coefficient of repeatability (RT% ) (International Organization for Standardization, 1994a,b):
RT = 2�2� (9)
and
RT% = σ2I+ σ
2F+σ
2I×F
σ2I+ σ2F+σ
2I×F + σ
2e1
× 100 (10)
Reproducibility (RD) was defined as the value below which the absolute difference
between two single measures obtained with the same method of analysis on the same feed in
different incubations is expected within a 95% probability, and coefficient of reproducibility
(RD% ) (International Organization for Standardization, 1994a,b). In this case the components
of variance of each method were estimated using the mixed procedure of SAS (SAS Inst. Inc.)
with a second mixed linear model which considered only the feed as random factor and the
residual error (e2). The values of RD and RD% were computed as:
RD = 2�2σ�� (11)
RD% = σ2F
σ2F + σ2e2.× 100 (12)
3.7.2 Comparisons
From a preliminary analysis it was found , using the Bartlett’s test (Bartlett, 1937) of
the SAS (SAS Inst. Inc.), that the variances associated to the various methods were not
homoscedastic, and so the use of ANOVA linear models was not applicable to compare the
effects due to the different methods. Thus, the various methods were compared by linear
regression of the mean values of TDMd, GP24, MENRC, MEMenke and MEUCD data obtained
for each feed. Significant differences of the slope and intercept from unity and zero,
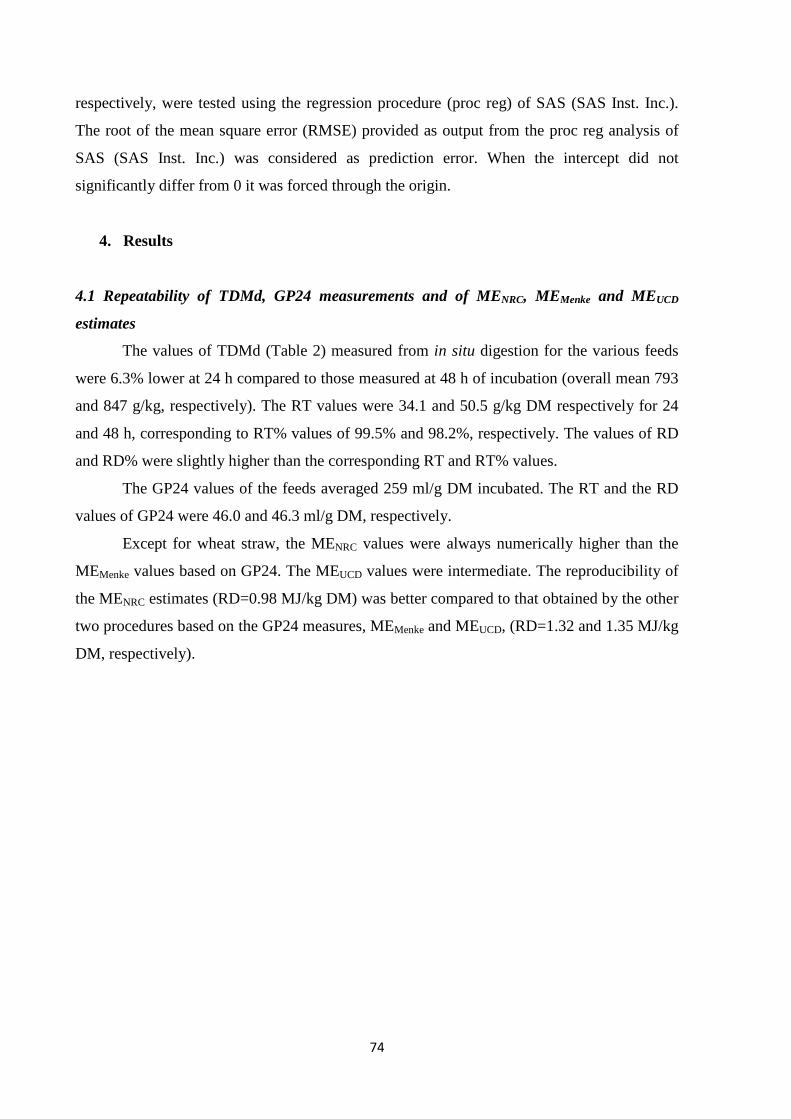
74
respectively, were tested using the regression procedure (proc reg) of SAS (SAS Inst. Inc.).
The root of the mean square error (RMSE) provided as output from the proc reg analysis of
SAS (SAS Inst. Inc.) was considered as prediction error. When the intercept did not
significantly differ from 0 it was forced through the origin.
4. Results
4.1 Repeatability of TDMd, GP24 measurements and of MENRC, MEMenke and MEUCD
estimates
The values of TDMd (Table 2) measured from in situ digestion for the various feeds
were 6.3% lower at 24 h compared to those measured at 48 h of incubation (overall mean 793
and 847 g/kg, respectively). The RT values were 34.1 and 50.5 g/kg DM respectively for 24
and 48 h, corresponding to RT% values of 99.5% and 98.2%, respectively. The values of RD
and RD% were slightly higher than the corresponding RT and RT% values.
The GP24 values of the feeds averaged 259 ml/g DM incubated. The RT and the RD
values of GP24 were 46.0 and 46.3 ml/g DM, respectively.
Except for wheat straw, the MENRC values were always numerically higher than the
MEMenke values based on GP24. The MEUCD values were intermediate. The reproducibility of
the MENRC estimates (RD=0.98 MJ/kg DM) was better compared to that obtained by the other
two procedures based on the GP24 measures, MEMenke and MEUCD, (RD=1.32 and 1.35 MJ/kg
DM, respectively).
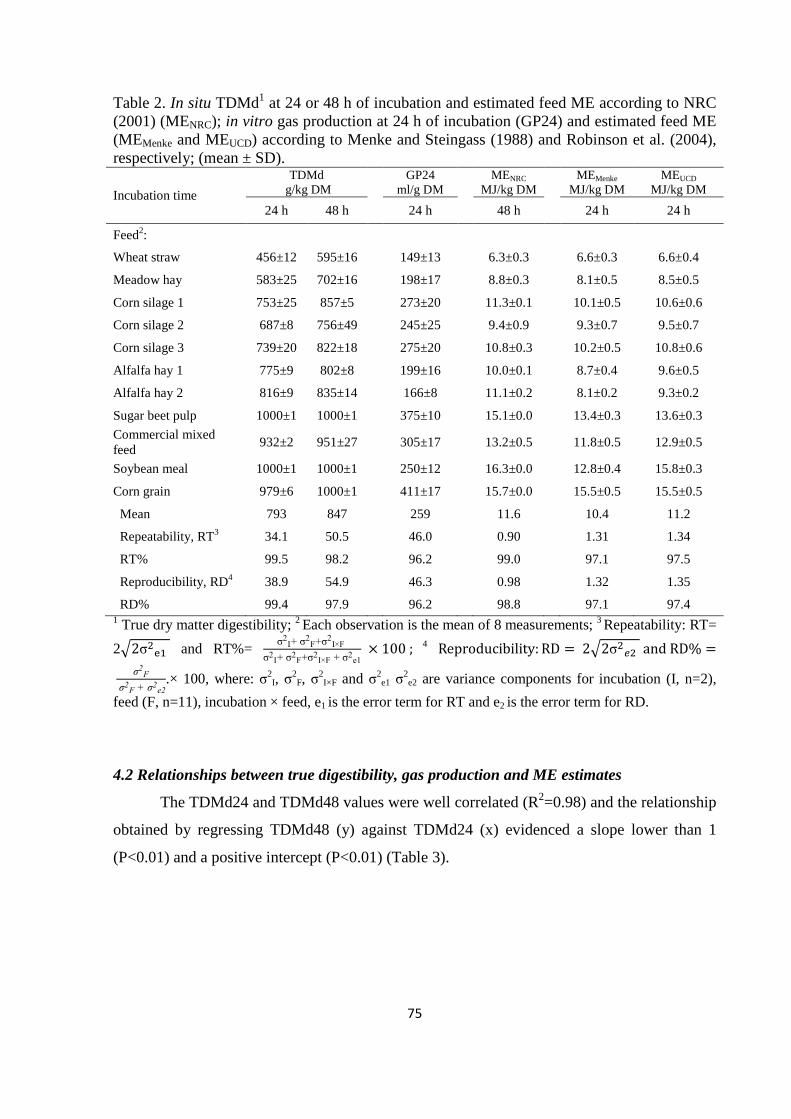
75
Table 2. In situ TDMd1 at 24 or 48 h of incubation and estimated feed ME according to NRC (2001) (MENRC); in vitro gas production at 24 h of incubation (GP24) and estimated feed ME (MEMenke and MEUCD) according to Menke and Steingass (1988) and Robinson et al. (2004), respectively; (mean ± SD).
Incubation time
TDMd g/kg DM
GP24
ml/g DM
MENRC
MJ/kg DM MEMenke
MJ/kg DM MEUCD
MJ/kg DM
24 h 48 h 24 h 48 h 24 h 24 h
Feed2:
Wheat straw 456±12 595±16 149±13 6.3±0.3 6.6±0.3 6.6±0.4
Meadow hay 583±25 702±16 198±17 8.8±0.3 8.1±0.5 8.5±0.5
Corn silage 1 753±25 857±5 273±20 11.3±0.1 10.1±0.5 10.6±0.6
Corn silage 2 687±8 756±49 245±25 9.4±0.9 9.3±0.7 9.5±0.7
Corn silage 3 739±20 822±18 275±20 10.8±0.3 10.2±0.5 10.8±0.6
Alfalfa hay 1 775±9 802±8 199±16 10.0±0.1 8.7±0.4 9.6±0.5
Alfalfa hay 2 816±9 835±14 166±8 11.1±0.2 8.1±0.2 9.3±0.2
Sugar beet pulp 1000±1 1000±1 375±10 15.1±0.0 13.4±0.3 13.6±0.3
Commercial mixed feed
932±2 951±27 305±17 13.2±0.5
11.8±0.5 12.9±0.5
Soybean meal 1000±1 1000±1 250±12 16.3±0.0 12.8±0.4 15.8±0.3
Corn grain 979±6 1000±1 411±17 15.7±0.0 15.5±0.5 15.5±0.5
Mean 793 847 259 11.6 10.4 11.2
Repeatability, RT3 34.1 50.5 46.0 0.90 1.31 1.34
RT% 99.5 98.2 96.2 99.0 97.1 97.5
Reproducibility, RD4 38.9 54.9 46.3 0.98 1.32 1.35
RD% 99.4 97.9 96.2 98.8 97.1 97.4 1 True dry matter digestibility; 2 Each observation is the mean of 8 measurements; 3 Repeatability: RT=
2�2σ��� and RT%= σ2I+ σ
2F+σ
2I×F
σ2I+ σ2F+σ
2I×F + σ
2e1 100 ; 4 Reproducibility: RD � 2�2σ�� and RD% �
σ2F
σ2F + σ2e2
.× 100, where: σ2I, σ
2F, σ
2I×F and σ2
e1 σ2e2 are variance components for incubation (I, n=2),
feed (F, n=11), incubation × feed, e1 is the error term for RT and e2 is the error term for RD.
4.2 Relationships between true digestibility, gas production and ME estimates
The TDMd24 and TDMd48 values were well correlated (R2=0.98) and the relationship
obtained by regressing TDMd48 (y) against TDMd24 (x) evidenced a slope lower than 1
(P<0.01) and a positive intercept (P<0.01) (Table 3).
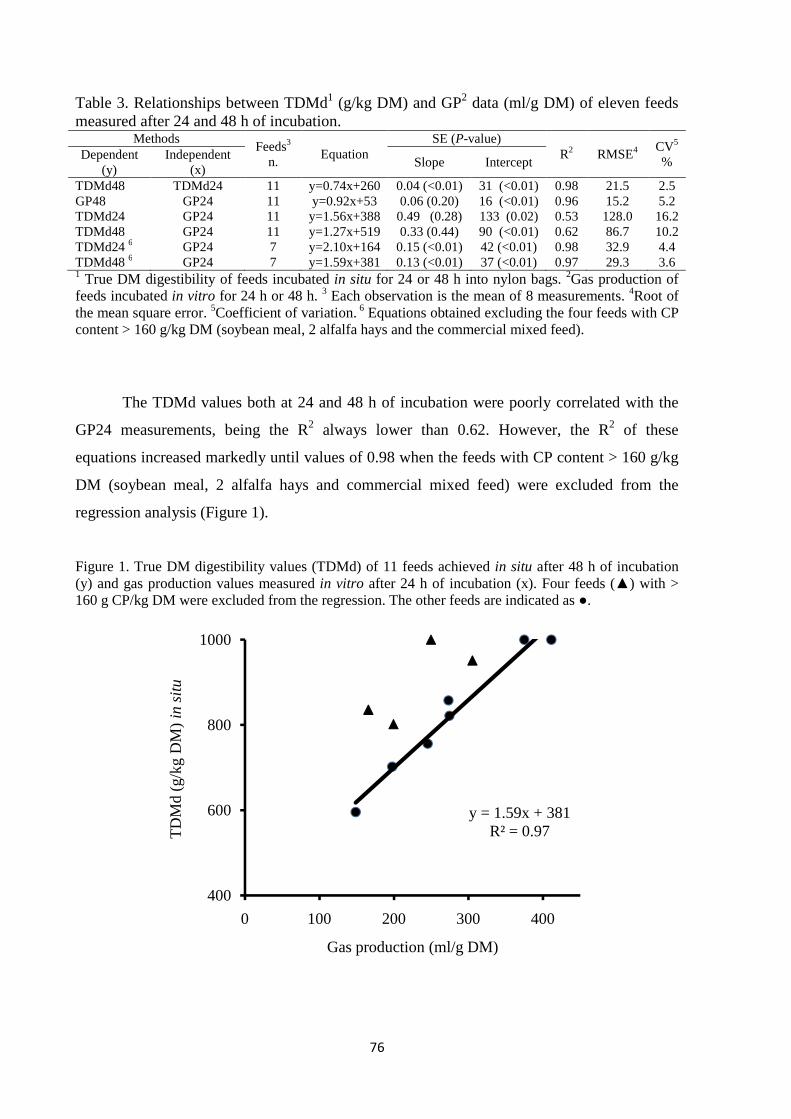
76
Table 3. Relationships between TDMd1 (g/kg DM) and GP2 data (ml/g DM) of eleven feeds measured after 24 and 48 h of incubation.
Methods Feeds3
n. Equation
SE (P-value) R2 RMSE4
CV5 % Dependent
(y) Independent
(x) Slope Intercept
TDMd48 TDMd24 11 y=0.74x+260 0.04 (<0.01) 31 (<0.01) 0.98 21.5 2.5 GP48 GP24 11 y=0.92x+53 0.06 (0.20) 16 (<0.01) 0.96 15.2 5.2 TDMd24 GP24 11 y=1.56x+388 0.49 (0.28) 133 (0.02) 0.53 128.0 16.2 TDMd48 GP24 11 y=1.27x+519 0.33 (0.44) 90 (<0.01) 0.62 86.7 10.2 TDMd24 6 GP24 7 y=2.10x+164 0.15 (<0.01) 42 (<0.01) 0.98 32.9 4.4 TDMd48 6 GP24 7 y=1.59x+381 0.13 (<0.01) 37 (<0.01) 0.97 29.3 3.6 1 True DM digestibility of feeds incubated in situ for 24 or 48 h into nylon bags. 2Gas production of feeds incubated in vitro for 24 h or 48 h. 3 Each observation is the mean of 8 measurements. 4Root of the mean square error. 5Coefficient of variation. 6 Equations obtained excluding the four feeds with CP content > 160 g/kg DM (soybean meal, 2 alfalfa hays and the commercial mixed feed).
The TDMd values both at 24 and 48 h of incubation were poorly correlated with the
GP24 measurements, being the R2 always lower than 0.62. However, the R2 of these
equations increased markedly until values of 0.98 when the feeds with CP content > 160 g/kg
DM (soybean meal, 2 alfalfa hays and commercial mixed feed) were excluded from the
regression analysis (Figure 1).
Figure 1. True DM digestibility values (TDMd) of 11 feeds achieved in situ after 48 h of incubation (y) and gas production values measured in vitro after 24 h of incubation (x). Four feeds (▲) with > 160 g CP/kg DM were excluded from the regression. The other feeds are indicated as ●.
y = 1.59x + 381R² = 0.97
400
600
800
1000
0 100 200 300 400
TD
Md
(g/k
g D
M) i
n s
itu
Gas production (ml/g DM)

77
The MENRC values were poorly correlated (R2=0.86) with the MEMenke values and the
prediction error of the corresponding regression was 1.16 MJ/kg DM (Table 4). Also in this
case, the equation was improved when the four high protein feeds were excluded from
regression analysis (R2=0.97) and in this case the prediction error was 0.63 MJ/kg DM. The
MENRC values were always well correlated (R2=0.96) with the MEUCD estimates, excluding or
not the four rich-protein feeds, and the prediction error of the equation was 0.63 MJ/kg DM.
Table 4. Relationships between ME values (MJ/kg DM) of eleven feeds estimated according to different approaches.
Methods Feeds1
n. Equation
SE (P-value) R2 RMSE2
CV3
% Dependent (y)
Independent (x)
Slope Intercept
MENRC4 MEMenke
5 11 y=1.09x+0.27 0.14 (0.55) 1.54 (0.86) 0.87 1.22 10.5 “ “ 6 11 y=1.11x 0.03 (<0.01) - 0.86 1.16 9.9
“ 6 7 y=1.06x 0.02 (0.04) - 0.97 0.63 5.7
MENRC4 MEUCD 7 11 y=1.04x-0.01 0.08 (0.57) 0.83 (0.99) 0.96 0.68 5.4
“ “ 6 11 y=1.04x 0.02 (0.03) - 0.96 0.63 5.4 “ “ 6 7 y=1.03x 0.02 (0.13) - 0.97 0.58 5.2 1 Each observation is the mean of 8 measurements. 2 Root of the mean square error. 3 Coefficient of variation. 4 ME contents estimated from the digestible aNDF content of feeds incubated in situ for 48 h into nylon bags according to NRC (2001). 5 ME contents estimated from gas production of feeds incubated in vitro for 24 h according to Menke and Steingass (1988). 6 Equation obtained forcing the intercept to zero. 7 ME contents estimated from gas production of feeds incubated in vitro for 24 h according to Robinson et al. (2004).
5. Discussion
5.1 Prediction of the true digestibility of feeds from in situ incubation at 24 or 48 h
For evaluating TDMd and the energy value of ruminant feeds NRC (2001) suggests
the use of digestible aNDF data achieved after 48 h of in situ or in vitro incubation. There is a
debate about the validity of reducing the incubation time from 48 to 30 or 24 h. A first
consideration is that a shorter incubation time will reduce the cost of feed evaluation tests.
Some authors (Hoffman et al., 2003) suggested that incubation times in the order of 24 to 30 h
are preferable, as these are closer to the retention times of the feed particles in the rumen of
high producing dairy cows. Others authors indicated that a 48-h incubation time is preferable
to shorter durations because of a better repeatability of the measures (Hall and Mertens, 2008;
Spanghero et al., 2010). Hall and Mertens (2008) compared different types of vessels for
measuring the in vitro TDMd and observed that the reduction of the incubation time from 48
to 24 h tripled the standard error of the differences (SED=√σ��; from 13 to 37 g/kg DM,
78
respectively). In the present work, conducted in situ with nylon bags, it was observed that the
reduction of the incubation time from 48 to 24 h reduced the RT of the TDMd measurements
from 50.5 to 34.1 g/kg DM. These values are in the same range of variation of those reported
by Hall and Mertens (2008), when expressed in terms of standard error of the differences (18
and 12 g/kg DM, respectively). However, in contrast to what was observed by Hall and
Mertens (2008), the shortest incubation time was associated to the best repeatability. This was
mainly due to the fact that the TDMd measures from 2 feeds (a corn silage and the
commercial mixed feed) showed low standard deviations at 24 h and high standard deviations
at 48 h (Table 2). The repeatability of TDMd24 and of TDMd48 measures was comparable
when these two feeds were excluded. The TDMd24 and TDMd48 were strongly correlated
(R2=0.98) in this experiment, which is in agreement with Hoffman et al. (2003). These results,
even considering the comparable reproducibility obtained at the 2 incubation times, suggest
the validity of developing equations to predict feed digestibility using values measured at 24
instead of 48 h. This could represent a good opportunity for reducing the costs of feed
evaluation, but requires further investigations on a larger set of feeds.
5.2 Prediction of ME content of feeds from in vitro gas production
The gas production technique is an alternative and less expensive method than in situ
studies for evaluating the value of feeds. According to published studies, the GP24 values are
commonly found to be less repeatable and reproducible than TDMd data (Gosselink et al.,
2004; Rodrigues et al., 2009). Because of the poor repeatability, the GP technique is
recommended mainly as a tool for ranking feeds (Valentin et al. 1999; Hall and Mertens,
2008). The poor reproducibility of the GP measurements between laboratories can be partially
attributed to the low standardization of the method (Getachew et al., 2002; Spanghero et al.,
2010). Instead of measuring the disappearance of insoluble feed components, as occurs in
other in situ and in vitro methods, the GP technique measures the appearance of gaseous
products. The gas measured is not only that directly generated by the fermented matter, as
additional amounts of gas are released from the buffer in relation to the acid properties of the
end-products of fermentation. Thus, although a good correlation between the amounts of OM
digested and gas produced is expected (Makkar, 2005), the degree of correlation is influenced
by various factors (different equipments, differences in experimental protocol, feed and
inoculum characteristics) that alter the release of gas from the medium (Cone et al., 2002;

79
Mould et al., 2005; Tagliapietra et al., 2010). These factors could also influence the
repeatability and the reproducibility of the GP measurements.
In the current trial we used an automated apparatus in which the headspace pressure inside
the bottles is maintained always lower than 3.4 kPa by means of automated gas valve venting.
This low threshold pressure was adopted in order to prevent underestimation of GP due to
supersaturation of the medium, as described by Tagliapietra et al. (2010). In contrast to what
is commonly practiced, we used rumen fluid collected by a suction technique from the rumen
of intact cows. This procedure was adopted on the basis of a previous trial (Tagliapietra et al.,
submitted), conducted on the same feeds used in the current experiment, where it was
observed that the in situ TDMd48 values achieved with nylon bags were predictable as 1.02
(RMSE=42 g/kg DM) of the in vitro TDMd48 data achieved from conventional bottles and
rumen fluid collected by the suction technique. In this trial the repeatability of the GP24
measurements was similar (√σ��= 16 ml/g DM) to the values reported by other authors, with
standard errors of the differences in the order of 14 ml/g DM (Valentin et al., 1999; Getachew
et al., 2002; Gierus et al., 2008). The values of repeatability of TDMd24, TDMd48 and GP24
reported in Table 2 are not directly comparable as they have a different unit of measurement.
However, when considering the ratio between RD and the corresponding means, it can be
seen that the GP24 measurements were about 3 times less reproducible than the TDMd values
computed from the aNDF measurements achieved after 24 and 48 h of fermentation.
Nevertheless, once the data were converted in ME terms, the reproducibility of the MEMenke
and of the MEUCD estimates was the same and about 30% greater (RD=1.32 and 1.35 MJ/kg
DM, respectively) than that computed for MENRC (RD=0.98 MJ/kg DM). This confirms that
GP measurements and feed chemical information must be combined for predicting the ME of
feeds, as the release of gas from the medium is influenced by the feed chemical composition
(Menke and Steingass, 1988) and likely by the extent of which the feed constituents are
fermented. On the other hand, feed chemical information alone are inadequate for a precise
ME content prediction (Robinson et al., 2004); in the present work, when the MENRC values
of feeds where regressed against ME values computed following the lignin-based NRC (2001)
approach, entirely based on chemical information of feed, the resulting equation was accurate
but not precise (MENRC = 1.04×MElignin+ 0.57; R2 =0.78).
The dietary CP content of feeds is a factor which was found to strongly reduce the amount
of gas released. Cone and Van Gelder (1999) observed that fermentation of casein produced
only 32% of gas volume compared to carbohydrates, and therefore a correction of GP values
80
for CP content of feeds is required when these values are compared with the corresponding
digestibility measurements (Chenost et al., 2001). In agreement with these findings, in the
current trial, the correlation between TDMd48 and GP24 measurements was good (R2= 0.97)
when the four feeds containing > 160 g CP/kg DM were excluded from the regression
analysis. In the current trial the MEUCD values were well correlated to the MENRC estimates
and their regression showed a prediction error of 0.63 MJ/kg DM. The same did not occur for
the MEMenke values as in this case the regression relating MEMenke to MENRC was neither
precise nor accurate, except when protein-rich feeds were excluded. These results are in
agreement with those reported by Robinson et al. (2004) and Magalhães et al. (2010). The
difference observed between the Menke and Steingass (1988) and the Robinson et al. (2004)
approaches are partially due to the different weights attributed to the various independent
variables considered in the predicting equations. The intercept of these regression equations
do not differ very much nor does the energy content attributed to GP24 [a GP of 100 ml/g DM
is equivalent to 3.14 and 2.92 MJ of ME with Menke and Steingass (1988) and with Robinson
et al. (2004), respectively] but they substantially differ for the weight attributed to the dietary
CP content. Menke and Steingass (1988) allow a contribution of 0.57 and 0.84 MJ of ME for
each 100 g of CP/kg DM for forages and concentrates, respectively, whereas Robinson et al.
(2004) attribute about 1.43 MJ of ME per 100 g CP/kg DM.
The better precision and accuracy achieved with the Robinson et al. (2004) equation
compared to those proposed by Menke and Steingass (1988) also depend on the energy
system taken as a reference. In this work we used as a reference the summative equation
approach proposed by NRC (2001), based on dNDF measurement and feed chemical analysis.
In this approach the DE content is calculated by multiplying the truly digestible nutrient
concentrations by their heats of combustion (23.43, 39.74, 17.57 and 17.57, and MJ/kg for
CP, EE, NDF and NFC, respectively); summing these products and adjusting for the
metabolic fecal energy. The resulting DE is converted into ME with the equation proposed by
NRC (2001). At the basis of the GP24-based approach of Menke and Steingass (1988), there
is the implicit assumption that ME can be predicted as: 15.2×dCP + 34.2×dEE, + 12.8×dCF +
15.9×dNFE, where dCP, dEE, dCF and dNFE are the digestible contents of crude protein,
ether extract, crude fiber and nitrogen free extract, respectively. In the two systems the
energetic coefficients used to weigh the variables are very different. Vermorel and Coulon
(1998) showed that for feeds identical for chemical composition and digestibility the use of
different coefficients in the equations proposed by the different energy systems resulted in
marked differences in the predicted ME contents. They observed that NRC (1989)
81
overestimates the ME content of feeds at maintenance with about 5-7% compared to various
European energy systems. They attributed these differences mainly to the equation adopted by
NRC (1989) to convert DE in ME (equation n. 5). This equation, established from data
obtained with lactating cows at feeding level close to 3 times maintenance (Moe and Tyrrell,
1976), is still adopted by NRC (2001). This overestimation is of the same order of magnitude
of those of + 4% and + 6% evidenced by the MENRC values compared to the MEUCD and the
MEMenke , respectively, but in this last case only excluding the protein rich feeds.
6. Conclusions
The results of the present work support the validity of reducing the duration of the in situ
incubation time from 48 to 24 h, with advantages in terms of saving labour, time and costs for
the TDMd evaluation of feeds. The reproducibility of TDMd48 and TDMd24 was comparable
(SED=14 g/kg DM) and these measures were related by the following relationship: TDMd48
= 0.74×TDMd24 + 260 (R2=0.98; RMSE=21.5 g/kg DM).
It was found that the measures of GP24 and TDMd48 are well correlated (R2=0.97), but
only for feeds with less than 16 % of CP/DM, as CP strongly reduces the release of gas
produced during fermentation. The in situ-based MENRC content of feeds can be predicted
with good precision and accuracy from measurement of GP24 and feed proximate
composition, providing that the influence of feed CP content on GP24 is adequately
quantified. To this regard the equation proposed by Robinson et al. (2004) was found to be
more precise and accurate than those proposed by Menke and Steingass (1988). However, the
precision and the accuracy of predictions based on GP24 depend on: i) the availability of
standardized procedures for measuring GP; ii) the availability of reliable equations relating
GP and feed chemical composition (with special regards for CP) to predicted or in vivo
measured energy contents of feeds; iii) the set of equations that a given energy system
proposes to predict the ME of feeds from their digestible nutrient contents.
82
References
AOAC, 2003. Official Methods of Analysis of the Association of Official Agricultural
Chemists. 17th ed. (2th revision). AOAC International, Gaithersburg, MD, USA.
Bartlett, M.S., 1937. Properties of sufficiency and statistical tests. Proceedings of the Royal
Society of London, Series A, 160, 268-282.
Beuvink, J. M., Spoelstra, S.F., 1992. Interactions between substrate, fermentation end-
products, buffering systems and gas production upon fermentation of different
carbohydrates by mixed rumen microorganisms in vitro. Appl. Microbiol. Technol. 37,
505-509.
Calabrò, S., Lopez, S., Piccolo, V., Dijkstra, J., Dhanoa, M.S., France, J., 2005. Comparative
analysis of gas production profiles obtained with buffalo and sheep ruminal fluid as the
source of inoculum. Anim. Feed Sci. Technol. 123-124, 51–65.
Chenost, M., Aufrère, J., Macheboeuf, D., 2001. The gas-test technique as a tool for
predicting the energetic value of forage plants. Anim. Res. 50, 349-364.
Cone, J.W., Van Gelder, A.H., 1999. Influence of protein fermentation on gas production
profiles. Anim. Feed Sci. Technol. 76, 251-264.
Cone, J.W., Gelder, A.H., Visscher, G.J.W., Oudshoorn, L., 1996. Influence of rumen fluid
and substrate concentration on fermentation kinetics measured with a fully automated time
related gas production apparatus. Anim. Feed Sci. Technol. 61, 113-128.
Cone, J.W., Van Gelder, A.H., Bachmann, H., 2002. Influence of inoculum source on gas
production profiles. Anim. Feed Sci. Technol. 99, 221-231.
Davies, Z.S., Mason, D., Brooks, A.E., Griffith, G.W., Merry, R.J., Theodorou, M.K., 2000.
An automated system for measuring gas production from forages inoculated with rumen
fluid and its use in determining the effect of enzymes on grass silage. Anim. Feed Sci.
Technol. 83, 205-221.
Getachew, G., Crovetto, G.M., Fondevila, M., Krishnamoorthy, U., Singh, B., Spanghero, M.,
Steingass, H., Robinson, P.H., Kailas, M.M., 2002. Laboratory variation of 24 h in vitro
gas production and estimated metabolizable energy values of ruminant feeds. Anim. Feed
Sci. Technol. 102, 169-180.
Gierus, M., Schiborra, A., Südekumb, K.H., Rave, G., Taube, F., 2008. Comparison of gas
accumulation profiles of several feeds using manual or automated gas production methods.
Anim. Feed Sci. Technol. 147, 310-325.
83
Goering, H.K., Van Soest, P.J., 1970. Forage Fiber Analysis (Apparatus, Reagents,
Procedures, and Some Applications), USDA Agricultural Research Service, Handbook No.
379, Washington, DC.
Goeser, J.P., Combs, D.K., 2009. An alternative method to assess 24-h ruminal in vitro
neutral detergent fiber digestibility. J. Dairy Sci. 92, 3833-3841.
Gosselink, J.M.J., Dulphy, J.P., Poncet, C., Jailler, M., Tamminga, S., Cone, J.W., 2004.
Prediction of forage digestibility in ruminants using in situ and in vitro techniques. Anim.
Feed Sci. Technol. 115, 227-246.
Hall, M. B., Mertens, D. R., 2008. In vitro fermentation vessel type and method alter fiber
digestibility estimates. J. Dairy Sci. 91, 301-307.
Hoffman, P.C., Lundberg, K.M., Bauman, L.M., Shaver, R.D., 2003. In vitro NDF
digestibility of forages: The 30 vs. 48 hour debate. Focus on Forage 5 (16);
http://www.uwex.edu/ces/crops/uwforage/30vs48-FOF.htm. University of Wisconsin-
Madison.
International Organization for Standardization, 1994a. Accuracy (trueness and precision) of
measurement methods and results - Part 1: General principles and definitions. ISO 5725-1.
International Organization for Standardization, Geneva, Switzerland.
International Organization for Standardization, 1994b. Accuracy (trueness and precision) of
measurement methods and results - Part 2: Basic method for the determination of
repeatability and reproducibility of a standard measurement method. ISO 5725-2.
International Organization for Standardization, Geneva, Switzerland.
Kitessa, S., Flinn, P.C., Irish, G.G., 1999. Comparison of methods used to predict in vivo
digestibility of feeds in ruminants. Aust. J. Agric. Res. 50, 825-841.
Licitra, G., Hernandez, T.M., Van Soest, P.J., 1996. Standardization of procedures for
nitrogen fractionation of ruminant feeds. Anim. Feed Sci. Technol. 57, 347-358.
Lindberg, J. E., 1985. Estimation of rumen degradability of feed proteins with the in sacco
technique and various in vitro methods. A review. Acta Agric. Scand. Sect. A-Anim. Sci.
Suppl. 25, 64-97.
Magalhães, K.A., Valadares Filho, S.C., Detmann, E., Diniz, L.L., Pina, D.S., Azevedo,
J.A.G., Araùjo, F.L., Marcondes, M.I., Fonseca, M.A., Tedeschi, L.O., 2010. Evaluation of
indirect methods to estimate the nutritional value of tropical feeds for ruminants. Anim.
Feed Sci. Technol. 155, 44-54.
84
Makkar, H.P.S., 2005. Recent advances in the in vitro gas method for evaluation of nutritional
quality of feed resources. In: Assessing Quality and Safety of Animal Feeds. FAO Animal
Production and Health Series 160. FAO, Rome, pp. 55-88.
Mauricio, R.M., Mould, F.L., Dhanoa, M.S., Owen, E., Channa, K.S., Theodorou, M.K.,
1999. A semi-automated in vitro gas production technique for ruminant feedstuff
evaluation. Anim. Feed Sci. Technol. 79, 321-330.
Menke, K.H., Raab, L., Salewski, A., Steingass, H., Fritz, D., Schneider, W., 1979. The
estimation of the digestibility and metabolizable energy contents of ruminant feedstuffs
from the gas production when they are incubated with rumen liquor. J. Agric. Sci. 92, 499-
503.
Menke, K.H., Steingass, H., 1988. Estimation of the energetic feed value obtained from
chemical analysis and in vitro gas production using rumen fluid. Anim. Res. Dev. 28, 7-55.
Mertens, D.R., 2002. Gravimetric Determination of Amylase-Treated Neutral Detergent Fiber
in Feeds with Refluxing in Beakers or Crucibles: Collaborative Study. J. AOAC Int. 85,
1217-1240.
Michalet-Doreau, B., Ould-Bah, M. Y., 1992. In vitro and in sacco methods for the estimation
of dietary nitrogen degradability in the rumen: a review. Anim. Feed Sci. Technol. 40, 57-
86.
Moe, P.W., Tyrrell, H.F., 1976. Estimating metabolizable and net energy of feeds. In
International Symposium on feed composition. Animal nutrient requirements and
computerization of diets, edited by P.V. Fonnesbeck, L.E. Harris and L.C. Kearl. Logan,
Utah, Utah State University, Utah Agricultural Experimental Station.
Mould, F.L., Kliem, K.E., Morgan, R., Mauricio, R.M., (2005). In vitro microbial inoculum:
A review of its function and properties. Anim. Feed Sci. Technol. 123-124, 31-50.
National Research Council (NRC), 1989. Nutrient Requirements of Dairy Cattle, sixth revised
ed. National Academy Press, Washington, DC, USA.
National Research Council (NRC), 2001. Nutrient Requirements of Dairy Cattle, seventh
revised ed. National Academy Press, Washington, DC, USA.
Nocek, J.E., 1988. In Situ and Other Methods to Estimate Ruminal Protein and Energy
Digestibility: A Review. J. Dairy Sci. 71, 2051-2069.
Ørskov, E.R., McDonald, I., 1979. The estimate of protein degradability in the rumen from
incubation measurements weighted according to rate of passage. J. Agric. Sci. (Camb.) 92,
499-503.
85
Pell, A.N., Schofield, P., 1993. Computerized monitoring of gas production to measure forage
digestion in vitro. J. Dairy Sci. 76, 1063-1073.
Raun, N.S., Burroughs, W., 1962. Suction strainer technique in obtaining rumen fluid samples
from intact lambs. J. Anim. Sci. 21, 454-457.
Robertson, J.B., Van Soest, P.J., 1981. In: James, W.P.T., Theander, O., (Eds), The Analysis
of Dietary Fiber in Food. Marcel Dekker, Inc., New York, USA, pp. 123-158
Robinson, P.H., Givens, D.I., Getachew, G., 2004. Evaluation of NRC, UC Davis and ADAS
approaches to estimate the metabolizable energy values of feeds at maintenance energy
intake from equations utilizing chemical assays and in vitro determinations. Anim. Feed
Sci. Technol. 114, 75-90.
Rodrigues, M.A.M., Cone, J.W., Ferreira, L.M.M., Blok, M.C., Guedes, C.V.M., 2009.
Relationship between in situ degradation kinetics and in vitro gas production fermentation
using different mathematical models. Anim. Feed Sci. Technol. 151, 86-96.
SAS® User’s Guide: Statistics, version fifth ed. 2005. SAS Institute, Cary, NC, USA.
Spanghero, M., Berzaghi, P., Fortina, R., Masoero, F., Rapetti, L., Zanfi, C., Tassone, S.,
Gallo, A., Colombini, S., Ferlito, J. C., 2010. Technical note: Precision and accuracy of in
vitro digestion of neutral detergent fiber and predicted net energy of lactation content of
fibrous feeds. J. Dairy Sci. 93, 4855-4859.
Stern, M. D., Bach, A., Calsamiglia, S., 1997. Alternative techniques for measuring nutrient
digestion in ruminants. J. Anim. Sci. 75, 2256-2276.
Tagliapietra, F., Cattani, M., Bailoni, L., Schiavon, S., 2010. In vitro rumen fermentation:
Effect of headspace pressure on the gas production kinetics of corn meal and meadow hay.
Anim. Feed Sci. Technol. 158, 197-201.
Tagliapietra, F., Cattani, M., Hindrichsen, I.K., Hansen, H.H., Colombini, S., Bailoni, L.,
Schiavon, S., submitted. True dry matter digestibility of feeds evaluated in situ with
different bags and in vitro using rumen fluid collected from intact donor cows. Submitted
to Anim. Feed Sci. Technol.
Theodorou, M.K., Williams, B.A., Dhanoa, M.S., McAllan, A.B., France, J., 1994. A simple
gas production method using a pressure transducer to determine the fermentation kinetics
of ruminant feeds. Anim. Feed Sci. Technol. 48, 185-197.
Tilley, J.M.A., Terry, R.A., 1963. A two-stage technique for the in vitro digestion of forage
crops. J. Br. Grassland Soc. 18, 104–111.
86
Valentin, S. F., Williams, P.E.V., Forbes, J.M., Sauvant, D., 1999. Comparison of the in vitro
gas production technique and the nylon bag degradability technique to measure short- and
long-term processes of degradation of maize silage in dairy cows. Anim. Feed Sci.
Technol. 78, 81-99.
Vanzant, E.S., Cochran, R.C., Titgemeyer, E.C., 1998. Standardization of in situ techniques
for ruminant feedstuff evaluation. J. Anim. Sci. 76, 2717-2729.
Vermorel, M., Coulon, J.B., 1998. Comparison of the National Research Council energy
system for lactating cows for European systems. J. Dairy Sci. 81, 846-855.
Weiss, W.P., 1993. Predicting energy values of feeds. J. Dairy Sci. 76, 1802-1811.

87
CHAPTER 6
Running head: Effect of venting on in vitro gas production
In vitro rumen fermentation: Effect of headspace pressure on the
gas production kinetics of corn meal and meadow hay
Franco Tagliapietra, Mirko Cattani, Lucia Bailoni, Stefano Schiavon
Department of Animal Science. University of Padova, Italy.
Published:
ANIMAL FEED SCIENCE AND TECHNOLOGY 158:197-201 (2010)
88
1. Abstract
An automated batch system, consisting in 20 bottles equipped with gas pressure sensors and
venting valves, was used to test the effects of headspace pressure on the kinetics of gas
production (GP). Two venting procedures were compared: with FT (fixed times) the gas
accumulated in the headspace of bottles was released after 2, 4, 6, 8, 12, 24, 48, 72 and 144 h
of incubation, whereas with FP (fixed pressure) the valves were opened at a threshold of 3.4
kPa. For each procedure, samples of corn meal and meadow hay (0.50 g) were incubated in 4
replications in 310 ml bottles with 25 ml of rumen fluid and 50 ml of medium for 144 h at
39°C. Both with FT and FP, gas pressures at the times of venting, converted in terms of
volumes, were adjusted or not for the amount of dissolved gas according to the Henry’s law.
Data were cumulated and they were best fitted by a first order model the which parameters are
the asymptotic GP (A), the time at which half of A is produced (T½) and the sharpness (c) of
the curve. The effects of the 2 procedures were evaluated using a Wilcoxon two-sample test.
The headspace pressure obtained with FT peaked 18.0±2.84 kPa at 12 h on corn, while
peaked 7.5±0.81 kPa at 48 h on hay. For corn, the un-adjusted GP achieved between 12 and
48 h of incubation were 21 and 8% lower with FT compared to FP (P=0.01), and FT also had
greater standard deviations. A similar trend, less accentuated, was observed for hay. The T½
values were greater with FT compared to FP (+1.3 and +2.3 h, for corn and hay, respectively;
P<0.05), suggesting that FT delayed the release of gas dissolved in the medium. After
adjustment, the GP values provided by the 2 procedures continued to be different for corn:
compared to FP, FT reduced GP at 12, 24 and 48 h (P=0.01). Adjustments removed all the
differences for hay due to the venting procedure. Using the FT procedure, headspace volume,
venting frequency and amount of fermentable matter must be carefully balanced to avoid high
headspace pressures, lowered gas release and, hence, altered GP kinetics.
Abbreviations: GP, gas production; FT, fixed time; FP, fixed pressure; A, asymptotic GP; T½:
time at which half of GP is obtained; c: sharpness of the kinetic curve of GP.
Keywords: In vitro rumen fermentation; Gas production techniques; Valve venting; Feed
evaluation.
89
2. Introduction
Gas released from feeds inoculated with rumen fluid reflects the microbial activity. Gas is
produced as the fermentation proceeds and the cumulated profile can give information on feed
digestibility and fermentation kinetic (Getachew et al., 1998). Kinetics of gas production (GP)
are used to rank feeds and GP at 24 h is used to estimate feed energy value (Menke and
Steingass, 1988). The main employed techniques are based on the measurement of the volume
of gas produced in syringes under atmospheric pressure (Menke and Steingass, 1988) or on
the measurement of the headspace gas pressure of incubation bottles (Pell and Schofield,
1993; Theodorou et al., 1994; Cone et al., 1996; Davies et al., 2000). Gas produced during the
in vitro fermentation obtained with the technique proposed by Pell and Schofield (1993) is not
vented, but the cumulated headspace pressure is recorded at regular times, whereas with the
techniques described by Theodorou et al. (1994), Cone et al. (1996) and Davies et al. (2000)
headspace gases are released at pre-determined times (FT) or when a pre-set threshold of
pressure (FP) is reached. The effect of venting during the incubation on the profile of GP has
been the object of many discussions (Rymer et al., 2005), in particular after the observations
of Theodorou et al. (1994) who argued that (i) when the gas pressure is left to accumulate in
the fermentation bottles, according to the Henry’s law, a given proportion of gas remains
dissolved in the culture medium, so less gas is released, and (ii) microbial activity could be
disturbed if gas pressure exceeds a given threshold (48 kPa). The effect of venting procedure
was discussed in papers reporting comparisons between techniques (Rymer et al., 2005;
Gierus et al., 2008), but the results were inconclusive, likely because of confounding effects
due to the use of different apparatus, diets and donor animals. No efforts have been made to
evaluate the effects of venting on GP using the same equipment. The effects of FT or FP
venting procedures on the GP kinetics were studied with an automated batch GP system on
feeds with different degradability.
3. Material and methods
3.1. Gas production system
A commercial apparatus (AnkomRF Gas Production System, Ankom Technology, NY, USA)
consisting up to 50 bottles equipped with pressure sensors (pressure range: −69, +3447 kPa;
resolution: 0.27 kPa; accuracy: ±0.1% of measured value) wireless connected to a computer
90
was used. During incubation the headspace pressure of each bottle is read with a frequency of
1 minute and recorded in a database. Each bottle is equipped with an electromechanical valve
that controls the release of gas: for each bottle the operator can establish the venting by fixing
a given threshold of pressure (FP) or in alternative a pre-defined sequence of times (FT).
3.2. Experimental design and incubation procedures
Eight samples of corn meal and 8 samples of meadow hay, milled through a 1 mm screen,
were incubated in a single run using 16 bottles (plus 4 for blanks) of the system. A buffer
solution (2 l), reduced with sodium sulphite according to Menke and Steingass (1988), was
placed in a waterbath at 39 °C and purged with CO2. The rumen fluid was collected by an
oesophageal probe from 3 dry Holstein-Friesian cows fed ad libitum meadow hay and 2 kg of
concentrate (500 g/kg corn meal, 250 g/kg barley meal, 250 g/kg soybean meal). The use of
fluid collected with the probe instead of fluid collected from fistulated cows was not
considered to be relevant for the purposes of this work. The rumen fluid, strained through 3
layers of cheesecloth, was stored into pre-heated thermos and immediately transferred to the
laboratory. Each bottle (310 ml) was filled with 0.5000±0.0010 g of feed, 25 ml of rumen
fluid and 50 ml of medium, for a corresponding headspace volume of 235 ml. These
procedures were conducted under anaerobic conditions by keeping the bottle headspace
continuously flushed with CO2. The bottles were placed into a ventilated incubator at 39±0.5
°C for 144 h and they were not stirred or shaken. Eight bottles were vented at fixed times
(FT), after 2, 4, 6, 8, 12, 24, 48, 72 and 144 h of incubation, as commonly done with manual
equipments (Calabrò et al., 2004; Adesogan et al., 2005; Blummel et al., 2005) and avoiding
that bottle pressure exceeded 48 kPa (Theodorou et al., 1994). The remaining 8 bottles were
vented when the headspace pressure reached the threshold of 3.4 kPa (FP). This pressure,
slightly lower than 4.5 kPa used with others automated equipments (Davies et al., 2000;
Calabrò et al., 2005), was chosen in order to: i) minimize the effect of headspace pressure on
gas release; ii) maintain a good precision of measurements according to the pressure detection
ability of the system.
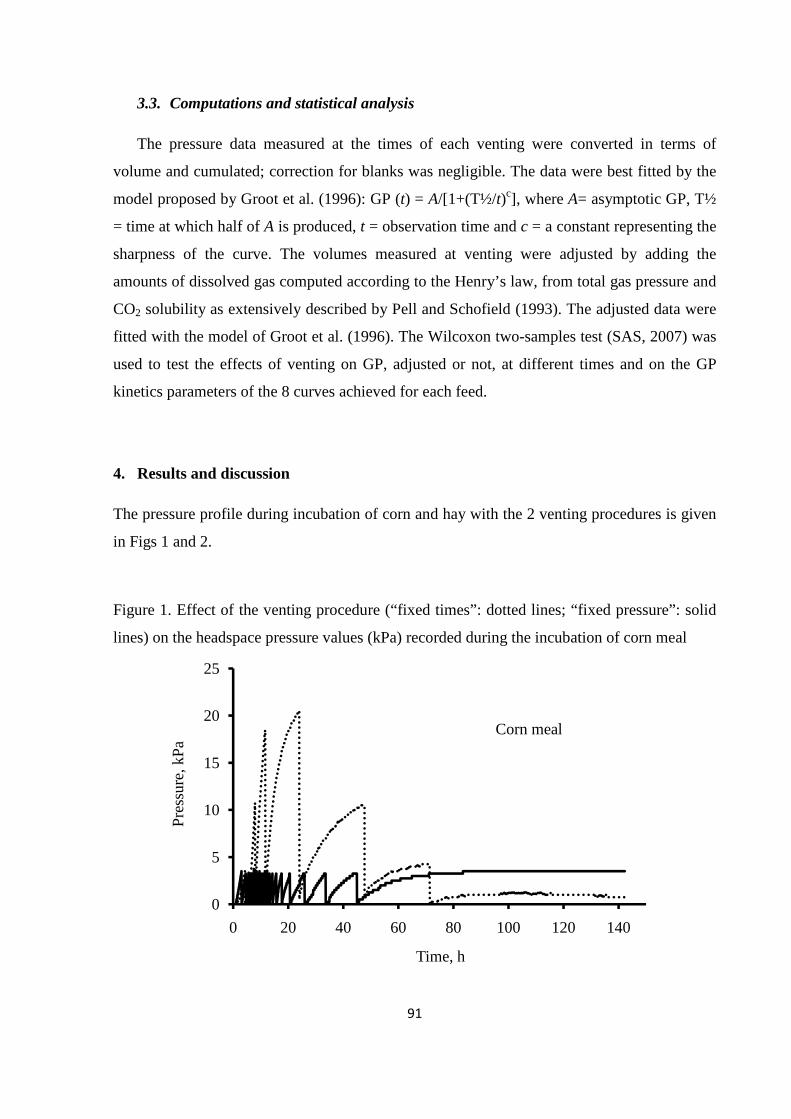
91
3.3. Computations and statistical analysis
The pressure data measured at the times of each venting were converted in terms of
volume and cumulated; correction for blanks was negligible. The data were best fitted by the
model proposed by Groot et al. (1996): GP (t) = A/[1+(T½/t)c], where A= asymptotic GP, T½
= time at which half of A is produced, t = observation time and c = a constant representing the
sharpness of the curve. The volumes measured at venting were adjusted by adding the
amounts of dissolved gas computed according to the Henry’s law, from total gas pressure and
CO2 solubility as extensively described by Pell and Schofield (1993). The adjusted data were
fitted with the model of Groot et al. (1996). The Wilcoxon two-samples test (SAS, 2007) was
used to test the effects of venting on GP, adjusted or not, at different times and on the GP
kinetics parameters of the 8 curves achieved for each feed.
4. Results and discussion
The pressure profile during incubation of corn and hay with the 2 venting procedures is given
in Figs 1 and 2.
Figure 1. Effect of the venting procedure (“fixed times”: dotted lines; “fixed pressure”: solid
lines) on the headspace pressure values (kPa) recorded during the incubation of corn meal
0
5
10
15
20
25
0 20 40 60 80 100 120 140
Pre
ssur
e, k
Pa
Time, h
Corn meal
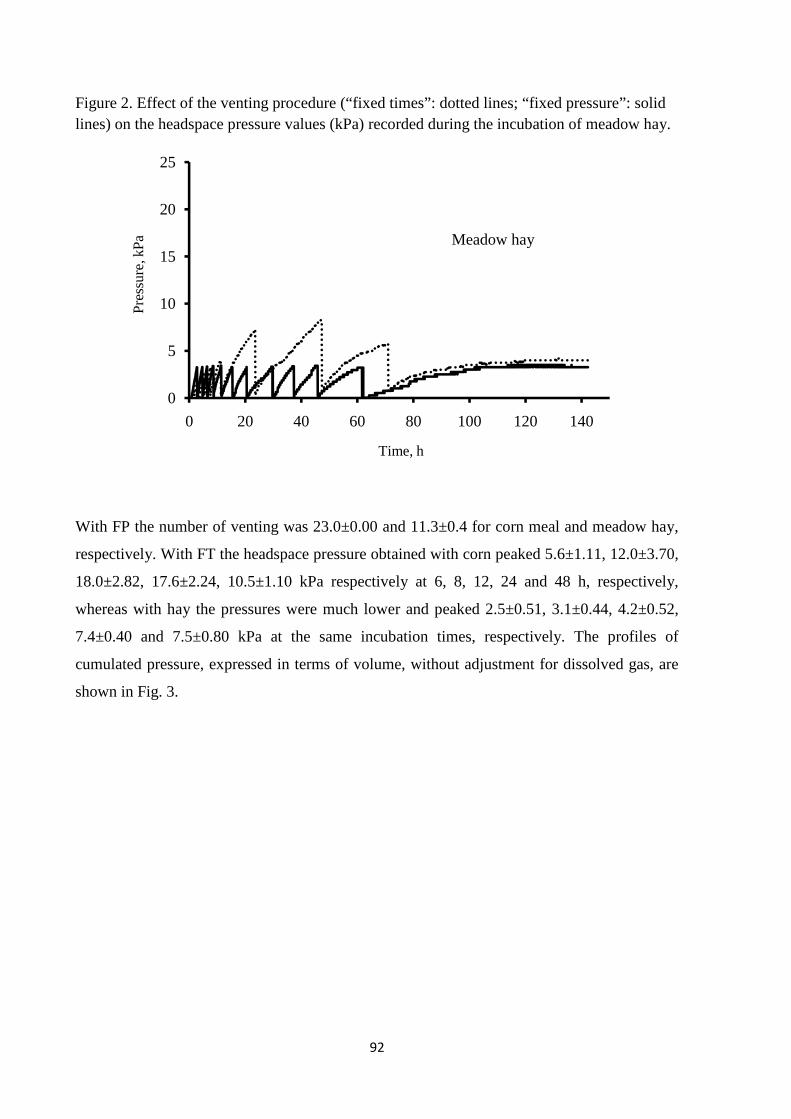
92
Figure 2. Effect of the venting procedure (“fixed times”: dotted lines; “fixed pressure”: solid lines) on the headspace pressure values (kPa) recorded during the incubation of meadow hay.
With FP the number of venting was 23.0±0.00 and 11.3±0.4 for corn meal and meadow hay,
respectively. With FT the headspace pressure obtained with corn peaked 5.6±1.11, 12.0±3.70,
18.0±2.82, 17.6±2.24, 10.5±1.10 kPa respectively at 6, 8, 12, 24 and 48 h, respectively,
whereas with hay the pressures were much lower and peaked 2.5±0.51, 3.1±0.44, 4.2±0.52,
7.4±0.40 and 7.5±0.80 kPa at the same incubation times, respectively. The profiles of
cumulated pressure, expressed in terms of volume, without adjustment for dissolved gas, are
shown in Fig. 3.
0
5
10
15
20
25
0 20 40 60 80 100 120 140
Pre
ssur
e, k
Pa
Time, h
Meadow hay
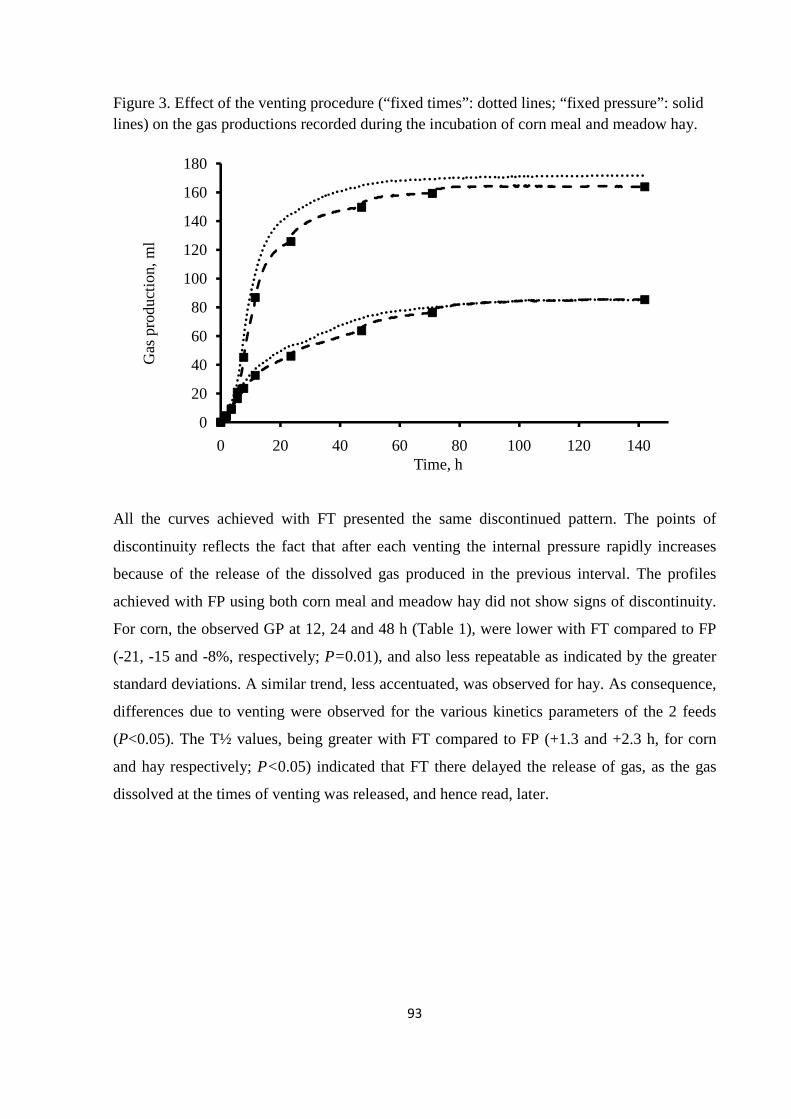
93
Figure 3. Effect of the venting procedure (“fixed times”: dotted lines; “fixed pressure”: solid lines) on the gas productions recorded during the incubation of corn meal and meadow hay.
All the curves achieved with FT presented the same discontinued pattern. The points of
discontinuity reflects the fact that after each venting the internal pressure rapidly increases
because of the release of the dissolved gas produced in the previous interval. The profiles
achieved with FP using both corn meal and meadow hay did not show signs of discontinuity.
For corn, the observed GP at 12, 24 and 48 h (Table 1), were lower with FT compared to FP
(-21, -15 and -8%, respectively; P=0.01), and also less repeatable as indicated by the greater
standard deviations. A similar trend, less accentuated, was observed for hay. As consequence,
differences due to venting were observed for the various kinetics parameters of the 2 feeds
(P<0.05). The T½ values, being greater with FT compared to FP (+1.3 and +2.3 h, for corn
and hay respectively; P<0.05) indicated that FT there delayed the release of gas, as the gas
dissolved at the times of venting was released, and hence read, later.
0
20
40
60
80
100
120
140
160
180
0 20 40 60 80 100 120 140
Gas
pro
duct
ion,
ml
Time, h
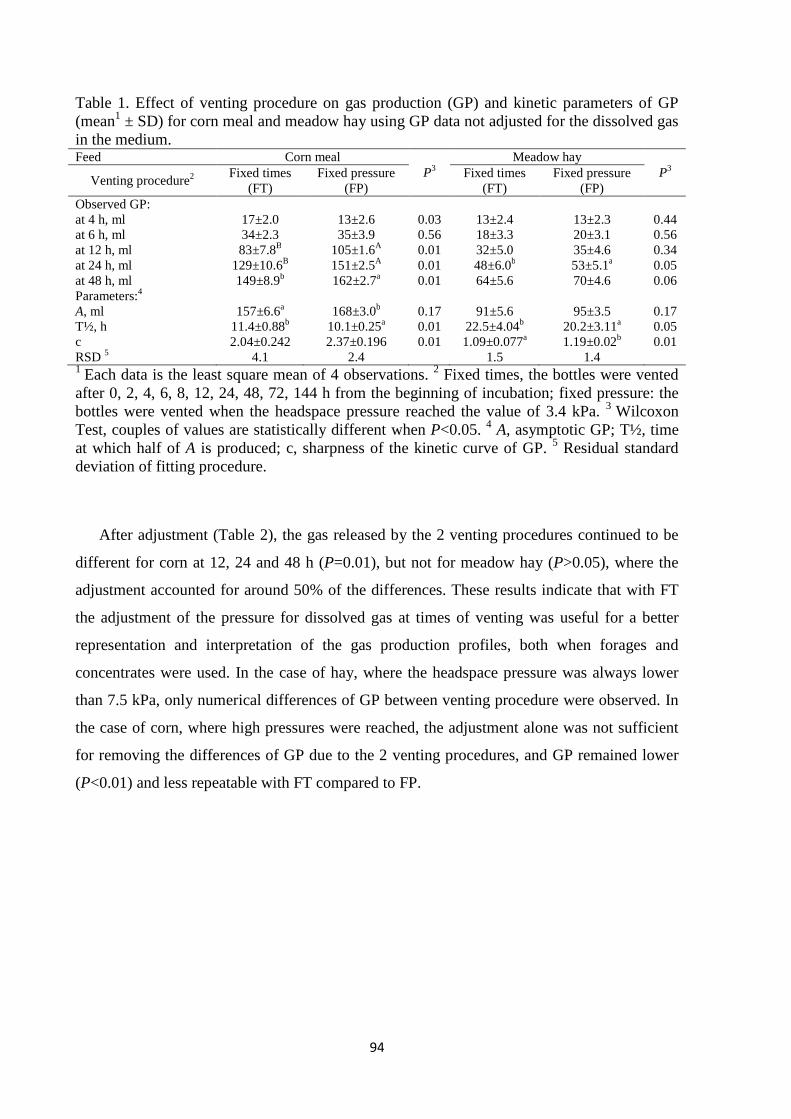
94
Table 1. Effect of venting procedure on gas production (GP) and kinetic parameters of GP (mean1 ± SD) for corn meal and meadow hay using GP data not adjusted for the dissolved gas in the medium. Feed Corn meal
P3 Meadow hay
P3 Venting procedure2
Fixed times (FT)
Fixed pressure (FP)
Fixed times (FT)
Fixed pressure (FP)
Observed GP: at 4 h, ml 17±2.0 13±2.6 0.03 13±2.4 13±2.3 0.44 at 6 h, ml 34±2.3 35±3.9 0.56 18±3.3 20±3.1 0.56 at 12 h, ml 83±7.8B 105±1.6A 0.01 32±5.0 35±4.6 0.34 at 24 h, ml 129±10.6B 151±2.5A 0.01 48±6.0b 53±5.1a 0.05 at 48 h, ml 149±8.9b 162±2.7a 0.01 64±5.6 70±4.6 0.06 Parameters:4 A, ml 157±6.6a 168±3.0b 0.17 91±5.6 95±3.5 0.17 T½, h 11.4±0.88b 10.1±0.25a 0.01 22.5±4.04b 20.2±3.11a 0.05 c 2.04±0.242 2.37±0.196 0.01 1.09±0.077a 1.19±0.02b 0.01 RSD 5 4.1 2.4 1.5 1.4 1 Each data is the least square mean of 4 observations. 2 Fixed times, the bottles were vented after 0, 2, 4, 6, 8, 12, 24, 48, 72, 144 h from the beginning of incubation; fixed pressure: the bottles were vented when the headspace pressure reached the value of 3.4 kPa. 3 Wilcoxon Test, couples of values are statistically different when P<0.05. 4 A, asymptotic GP; T½, time at which half of A is produced; c, sharpness of the kinetic curve of GP. 5 Residual standard deviation of fitting procedure.
After adjustment (Table 2), the gas released by the 2 venting procedures continued to be
different for corn at 12, 24 and 48 h (P=0.01), but not for meadow hay (P>0.05), where the
adjustment accounted for around 50% of the differences. These results indicate that with FT
the adjustment of the pressure for dissolved gas at times of venting was useful for a better
representation and interpretation of the gas production profiles, both when forages and
concentrates were used. In the case of hay, where the headspace pressure was always lower
than 7.5 kPa, only numerical differences of GP between venting procedure were observed. In
the case of corn, where high pressures were reached, the adjustment alone was not sufficient
for removing the differences of GP due to the 2 venting procedures, and GP remained lower
(P<0.01) and less repeatable with FT compared to FP.
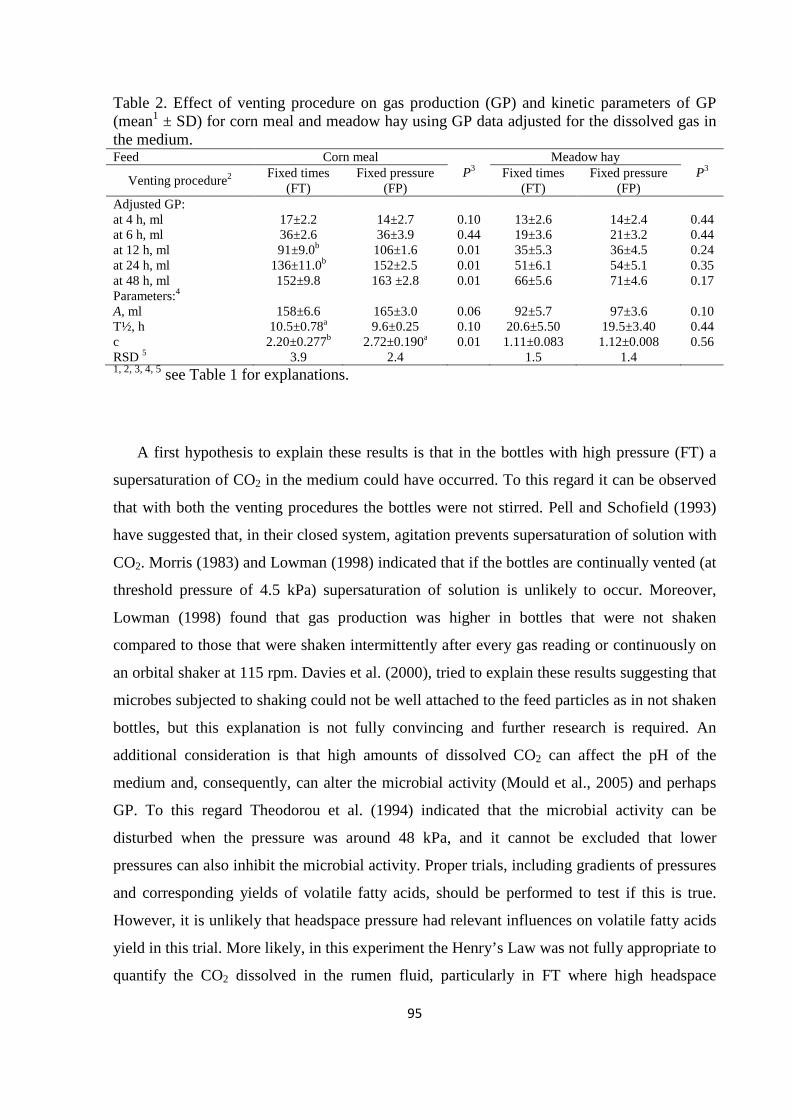
95
Table 2. Effect of venting procedure on gas production (GP) and kinetic parameters of GP (mean1 ± SD) for corn meal and meadow hay using GP data adjusted for the dissolved gas in the medium. Feed Corn meal
P3 Meadow hay
P3 Venting procedure2
Fixed times (FT)
Fixed pressure (FP)
Fixed times (FT)
Fixed pressure (FP)
Adjusted GP: at 4 h, ml 17±2.2 14±2.7 0.10 13±2.6 14±2.4 0.44 at 6 h, ml 36±2.6 36±3.9 0.44 19±3.6 21±3.2 0.44 at 12 h, ml 91±9.0b 106±1.6 0.01 35±5.3 36±4.5 0.24 at 24 h, ml 136±11.0b 152±2.5 0.01 51±6.1 54±5.1 0.35 at 48 h, ml 152±9.8 163 ±2.8 0.01 66±5.6 71±4.6 0.17 Parameters:4 A, ml 158±6.6 165±3.0 0.06 92±5.7 97±3.6 0.10 T½, h 10.5±0.78a 9.6±0.25 0.10 20.6±5.50 19.5±3.40 0.44 c 2.20±0.277b 2.72±0.190a 0.01 1.11±0.083 1.12±0.008 0.56 RSD 5 3.9 2.4 1.5 1.4 1, 2, 3, 4, 5 see Table 1 for explanations.
A first hypothesis to explain these results is that in the bottles with high pressure (FT) a
supersaturation of CO2 in the medium could have occurred. To this regard it can be observed
that with both the venting procedures the bottles were not stirred. Pell and Schofield (1993)
have suggested that, in their closed system, agitation prevents supersaturation of solution with
CO2. Morris (1983) and Lowman (1998) indicated that if the bottles are continually vented (at
threshold pressure of 4.5 kPa) supersaturation of solution is unlikely to occur. Moreover,
Lowman (1998) found that gas production was higher in bottles that were not shaken
compared to those that were shaken intermittently after every gas reading or continuously on
an orbital shaker at 115 rpm. Davies et al. (2000), tried to explain these results suggesting that
microbes subjected to shaking could not be well attached to the feed particles as in not shaken
bottles, but this explanation is not fully convincing and further research is required. An
additional consideration is that high amounts of dissolved CO2 can affect the pH of the
medium and, consequently, can alter the microbial activity (Mould et al., 2005) and perhaps
GP. To this regard Theodorou et al. (1994) indicated that the microbial activity can be
disturbed when the pressure was around 48 kPa, and it cannot be excluded that lower
pressures can also inhibit the microbial activity. Proper trials, including gradients of pressures
and corresponding yields of volatile fatty acids, should be performed to test if this is true.
However, it is unlikely that headspace pressure had relevant influences on volatile fatty acids
yield in this trial. More likely, in this experiment the Henry’s Law was not fully appropriate to
quantify the CO2 dissolved in the rumen fluid, particularly in FT where high headspace
96
pressures were reached. As no reliable methods for accounting variations of dissolved CO2
are available, systems operating at low pressure and frequent valve opening should be
preferred.
5. Conclusions
Venting exerts a critical role for the correct evaluation of GP during in vitro
fermentation, particularly when high pressures are generated from feed fermentation. It was
proved that different venting procedures influence the GP kinetics, and reasonably this could
also have consequences on feed ranking. In situation where only the FT procedure can be
applied, the headspace volume, the venting frequency and the amount of fermentable matter
must be carefully balanced to avoid high headspace pressures, less gas releasing and
consequent alterations of the GP kinetics. When high pressures are generated inside the
bottles adjustments for the amount of dissolved gas at the time of venting could not be
sufficient for a proper evaluation of the GP profile. With FT the frequency of GP reading
should be as high possible; for fibrous feeds the range should be more frequent in the range
from 12 to 24 h when the rate of gas production is highest. However, this is not commonly
done for reasons of labour and convenience. Techniques with automated devices for gas
release at low threshold pressure can strongly reduce such shortcomings, moreover they
provide repeatable measurements of the GP profile and they also are less labour consuming.
97
References
Adesogan, A.T., Krueger, N.K., Kim, S.C., 2005. A novel, wireless, automated system for
measuring fermentation gas production kinetics of feeds and its application to feed
characterization. Anim. Feed Sci. Technol. 123-124, 211-223.
Blummel, M., Cone, J.W., Van Gelder, A.H., Nshalai, I., Umunna, N.N., Makkar, H.P.S.,
Becker, K., 2005. Prediction of forage intake using in vitro gas production methods:
comparison of multiphase fermentation kinetics measured in an automated gas test, and
combined gas volume and substrate degradability measurements in a manual syringe
system. Anim. Feed Sci. Technol. 123-124, 517-526.
Calabrò, S., Williams, B.A., Piccolo, V., Infascelli, F., Tamminga, S., 2004. A comparison
between buffalo (Bubalus bubalis) and cow (Bos Taurus) rumen fluids in terms of the in
vitro fermentation characteristics of three fibrous feedstuffs. J. Sci. Food Agric. 84, 645-
652.
Calabrò, S., Lopez, S., Piccolo, V., Dijkstra, J., Dhanoa, M.S., France, J., 2005. Comparative
analysis of gas production profiles obtained with buffalo and sheep ruminal fluid as the
source of inoculum. Anim. Feed Sci. Technol. 123-124, 51-65.
Cone, J.W., Van Gelder, A.H., Visscher, G.J.W., Oudshoorn, L., 1996. Influence of rumen
fluid and substrate concentration on fermentation kinetics measured with a fully automated
time related gas production apparatus. Anim. Feed Sci. Technol. 61, 113-128.
Davies, Z.S., Mason, D., Brooks, A.E., Griffith, G.W., Merry, R.J., Theodorou, M.K., 2000.
An automated system for measuring gas production from forages inoculated with rumen
fluid and its use in determining the effect of enzymes on grass silage. Anim. Feed Sci.
Technol. 83, 205-221.
Getachew, G., Blummel, M., Makkar, H.P.S., Becker, K., 1998. In vitro gas measuring
techniques for assessment of nutritional quality of feeds: a review. Anim. Feed Sci.
Technol. 72, 261-281.
Gierus, M., Schiborra, A., Südekum, K.-H., Rave, G., Taube, F., 2008. Comparison of gas
accumulation profiles of several feeds using manual or automated gas production methods.
Anim. Feed Sci. Technol. 147, 310-325.
98
Groot, J.C.J., Cone, J.W., Williams, B.A., Debersaques, F.M.A., Lantinga E.A., 1996.
Multiphasic analysis of gas production kinetics for in vitro fermentation of ruminant feeds.
Anim. Feed Sci. Technol. 64, 77-89.
Lowman, R.S., 1998. Investigations into the factors which influence measurements during in
vitro gas production studies. PhD Thesis, University of Edinburgh.
Menke, K.H., Steingass, H., 1988. Estimation of the energetic feed value obtained from
chemical analysis and gas production using rumen fluid. Anim. Res. Dev. 28, 7-55.
Morris, J.G., 1983. A Biologists Physical Chemistry, 2nd edition. Edward Arnold, London.
Mould, F.L., Morgan, R., Kliem, K.E., Krystallidou, E., 2005. A review and simplification of
the in vitro incubation medium. Anim. Feed Sci. Technol. 123-124, 155-172.
Pell, A.N., Schofield, P., 1993. Computerised monitoring of gas production to measure forage
digestion in vitro. J. Dairy Sci. 76, 1063-1073.
Rymer, C., Huntington, J.A., Williams, B.A., Givens, D.I., 2005. In vitro cumulative gas
production techniques: History, methodological considerations and challenges. Anim. Feed
Sci. Technol. 123-124, 9-30.
SAS®, 2007. SAS User’s Guide: Basics. SAS Inst., Inc., Cary, NC.
Theodorou, M.K., Williams, B.A., Dhanoa, M.S., McAllan, A.B., France, J., 1994. A simple
gas production method using a pressure transducer to determine the fermentation kinetics
of ruminant feeds. Anim. Feed Sci. Technol. 48, 185-197.
99
CHAPTER 7
Effects of water extracts from chicory and BHT on the in vitro
rumen degradation of feeds
Franco Tagliapietra, Mirko Cattani, Matteo Dal Maso, Stefano Schiavon
Department of Animal Science. University of Padova, Italy.
Published:
ITALIAN JOURNAL OF ANIMAL SCIENCE 8, pp. 340-342, s uppl. 2 (2009)

100
1. Abstract
Effects of Butyl-Hydroxyl-Toluene (BHT) and of Red Chicory Extract (RCE) on kinetics
of gas production (GP) and rumen digestibility values (OMD, NDFD and in vitro true OM
digestibility - IVTOMD) of two feeds (meadow hay and corn meal) were evaluated using an
in vitro automatic batch system. For each feed 2 increasing dosages (0.15 and 1.5 mg/g of
feed) of BHT and RCE and a Control (C) were tested in 4 replications and 2 incubations. First
incubation lasted 72 h, the 2nd one was stopped at the times on which half of GP was
produced (T½), which were 9 and 16 h for corn and hay, respectively. From the supernatants
of the 2nd incubation, VFA, NH3, N content of the residual NDF were analyzed and the
microbial N balance was computed. The 2 feeds significantly affected rumen fermentation
parameters; BHT significantly increased asymptotic GP, t½ and IVTOMD (P<0.01),
decreased the proportion of butyrate (P<0.01) but did not affect microbial N balance; RCE
did not influence any of the parameters measured with respect to C, except for a significant
increase of the estimated N available for microbes at the higher dosage.
Abbreviations: OMD, organic matter digestibility; NDFD, NDF digestibility; IVTOMD, in
vitro true organic matter degradability; BHT, Butyl-Hydroxyl-Toluene; RCE, red chicory
extract; VFA, volatile fatty acids; GP, gas production; A, asymptotic GP; T½, time at which
half of A is produced; c, sharpness of the curve profile.
Key words: Gas production, In vitro rumen digestibility, Natural extracts, Antioxidants
101
2. Introduction
In the North East area of Po valley red chicory is enjoying a great success and in the year
2005 the local market demand reached about 250,000 ton/year. Increasing amounts of by-
products are made available. Red chicory has been shown to contain considerable amounts of
phenolic compounds with antioxidant properties (Rossetto et al., 2005).
Extraction of bioactive substances from by-products is receiving growing interest for human
and animal nutrition, also for the opportunity to replace synthetic compounds. Some studies
suggested that natural extracts from vegetables can be used to manipulate the rumen
fermentations, selecting or promoting the growth and the activity of microbes, changing the
amount and the ratio of the end products of fermentation (Naziroğlu et al., 2002; Busquet et
al., 2006; Alexander et al., 2008). However, limited data are available about the effect of
antioxidants and natural extracts on rumen fermentations. This study was aimed to screening
the effect of Red Chicory Extracts (RCE) and Butyl-Hydroxyl-Toluene (BHT) on some
parameters of rumen fermentations when incubated in vitro with different feeds.
3. Material and methods
In vitro rumen fermentations were conducted using an automatic batch gas production
(GP) system (RF, Ankom Technology®) for 72 h at 39°C. In each jar, 25 ml of rumen fluid,
collected from 3 dry cows, 50 ml of buffer (Menke et al., 1979) and 0.55 g/batch of meadow
hay or corn meal, milled at 1 mm, were used. For each feed 5 treatment groups were tested in
4 replications: 2 increasing dosages (0.15 and 1.5 mg/g of feed) of BHT (BHTL; BHTH,
respectively) and RCE (RCEL; RCEH, respectively) and a Control (C) group. Four blanks
without feeds were also included. Note that the maximum dosage of BHT permitted by law in
compounds feeds is 0.15 mg/g. Chicory extracts were achieved as described by Rossetto et al.
(2005). GP at various times (t) was measured by mean of a pressure detector every minute.
GP kinetics were fitted with the model: GP = A/[1+(T½/t)c], where A is the asymptotic GP, t½
is the time at which half of the asymptotic GP is produced, c is a constant representing the
sharpness of the switching characteristics of the curve profile. At the end of incubation OM,
NDF and the in vitro true OM digestibility (IVTOMD) were computed from chemical
analysis of feeds and residues as proposed by Grings et al. (2005). The T½ values resulting
102
from the first incubation for the 2 feeds (9 and 16 h for corn and hay, respectively) were used
to establish the times for stopping a 2nd incubation performed with the same criteria described
above. The supernatant fractions, obtained from the 2nd incubation, were analyzed for volatile
fatty acids (VFA), NH3 and N content of the undegraded NDF and the microbial N balance
was computed (Grings et al., 2005). Data were analyzed for the effects of feeds, additives at
different dosages and their interactions by ANOVA.
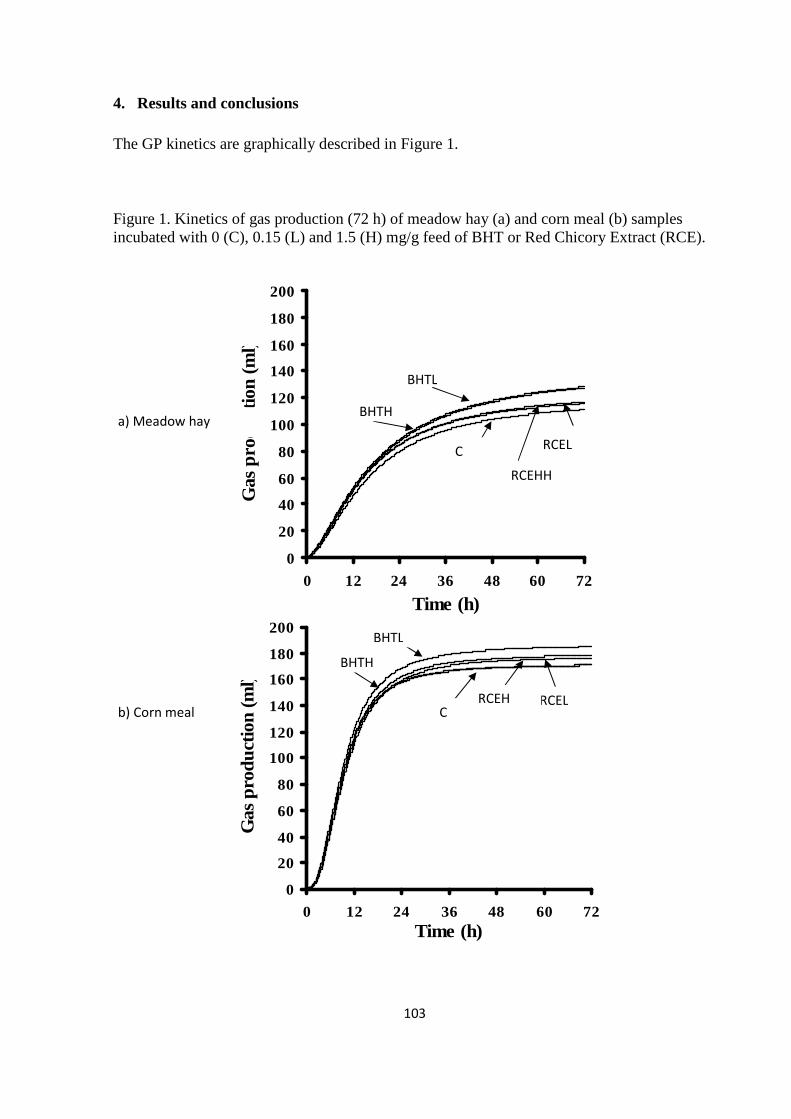
103
4. Results and conclusions
The GP kinetics are graphically described in Figure 1.
Figure 1. Kinetics of gas production (72 h) of meadow hay (a) and corn meal (b) samples incubated with 0 (C), 0.15 (L) and 1.5 (H) mg/g feed of BHT or Red Chicory Extract (RCE).
0
20
40
60
80
100
120
140
160
180
200
0 12 24 36 48 60 72
Time (h)
Gas
pro
duct
ion
(ml)
0
20
40
60
80
100
120
140
160
180
200
0 12 24 36 48 60 72Time (h)
Gas
pro
duct
ion
(ml)
b) Corn meal
a) Meadow hay
IRCEL RCEH
RCEL
C
C
BHTH
BHTL
BHTH
BHTL
RCEHH
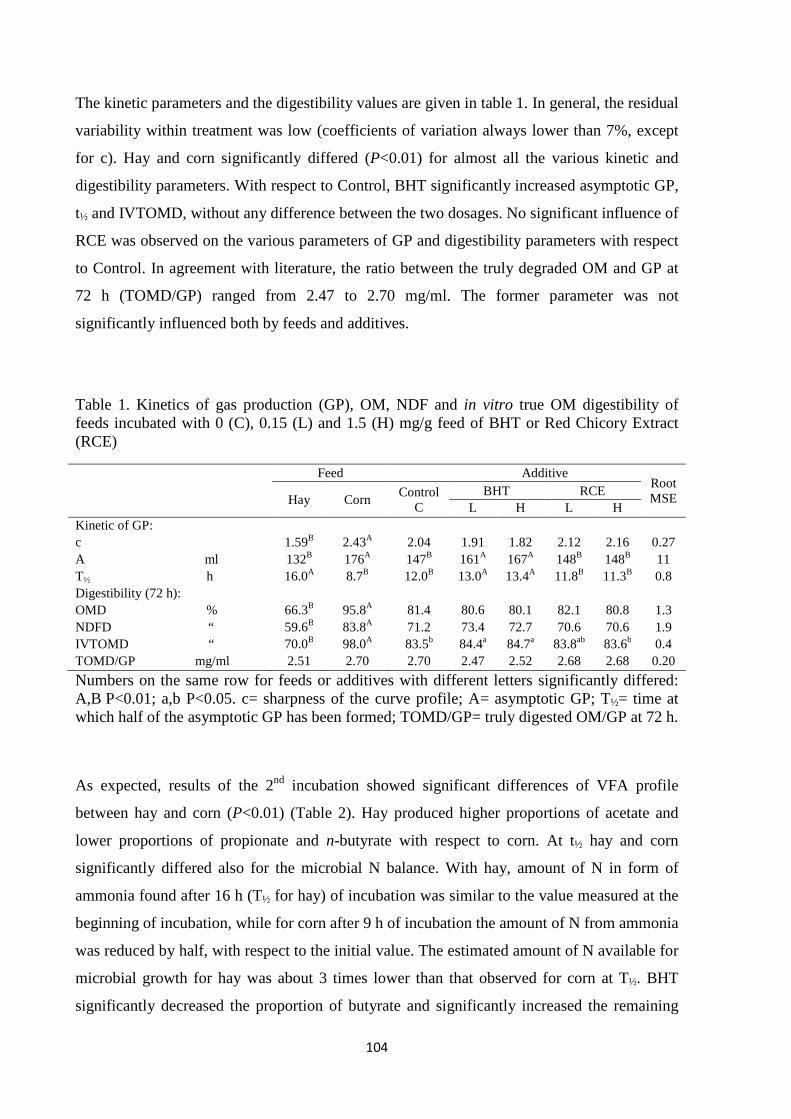
104
The kinetic parameters and the digestibility values are given in table 1. In general, the residual
variability within treatment was low (coefficients of variation always lower than 7%, except
for c). Hay and corn significantly differed (P<0.01) for almost all the various kinetic and
digestibility parameters. With respect to Control, BHT significantly increased asymptotic GP,
t½ and IVTOMD, without any difference between the two dosages. No significant influence of
RCE was observed on the various parameters of GP and digestibility parameters with respect
to Control. In agreement with literature, the ratio between the truly degraded OM and GP at
72 h (TOMD/GP) ranged from 2.47 to 2.70 mg/ml. The former parameter was not
significantly influenced both by feeds and additives.
Table 1. Kinetics of gas production (GP), OM, NDF and in vitro true OM digestibility of feeds incubated with 0 (C), 0.15 (L) and 1.5 (H) mg/g feed of BHT or Red Chicory Extract (RCE)
Feed Additive
Root MSE Hay Corn
Control C
BHT RCE L H L H
Kinetic of GP: c 1.59B 2.43A 2.04 1.91 1.82 2.12 2.16 0.27 A ml 132B 176A 147B 161A 167A 148B 148B 11 T½ h 16.0A 8.7B 12.0B 13.0A 13.4A 11.8B 11.3B 0.8 Digestibility (72 h): OMD % 66.3B 95.8A 81.4 80.6 80.1 82.1 80.8 1.3 NDFD “ 59.6B 83.8A 71.2 73.4 72.7 70.6 70.6 1.9 IVTOMD “ 70.0B 98.0A 83.5b 84.4a 84.7a 83.8ab 83.6b 0.4 TOMD/GP mg/ml 2.51 2.70 2.70 2.47 2.52 2.68 2.68 0.20
Numbers on the same row for feeds or additives with different letters significantly differed: A,B P<0.01; a,b P<0.05. c= sharpness of the curve profile; A= asymptotic GP; T½= time at which half of the asymptotic GP has been formed; TOMD/GP= truly digested OM/GP at 72 h.
As expected, results of the 2nd incubation showed significant differences of VFA profile
between hay and corn (P<0.01) (Table 2). Hay produced higher proportions of acetate and
lower proportions of propionate and n-butyrate with respect to corn. At t½ hay and corn
significantly differed also for the microbial N balance. With hay, amount of N in form of
ammonia found after 16 h (T½ for hay) of incubation was similar to the value measured at the
beginning of incubation, while for corn after 9 h of incubation the amount of N from ammonia
was reduced by half, with respect to the initial value. The estimated amount of N available for
microbial growth for hay was about 3 times lower than that observed for corn at T½. BHT
significantly decreased the proportion of butyrate and significantly increased the remaining
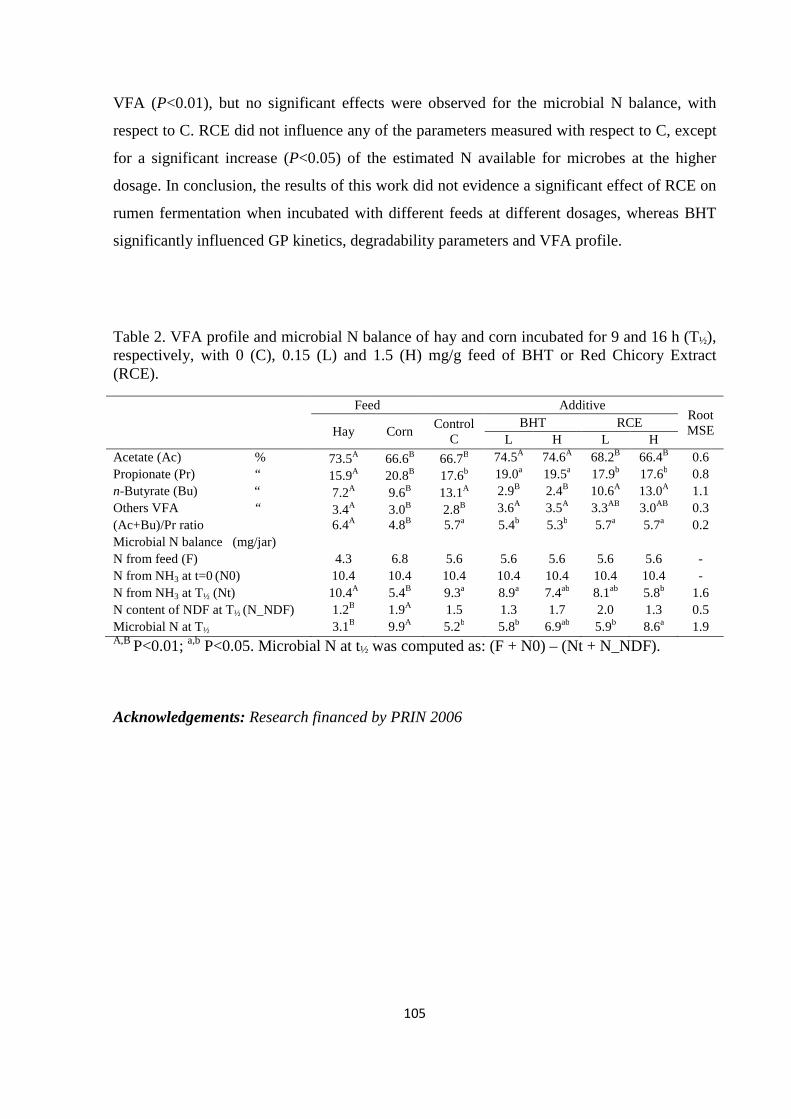
105
VFA (P<0.01), but no significant effects were observed for the microbial N balance, with
respect to C. RCE did not influence any of the parameters measured with respect to C, except
for a significant increase (P<0.05) of the estimated N available for microbes at the higher
dosage. In conclusion, the results of this work did not evidence a significant effect of RCE on
rumen fermentation when incubated with different feeds at different dosages, whereas BHT
significantly influenced GP kinetics, degradability parameters and VFA profile.
Table 2. VFA profile and microbial N balance of hay and corn incubated for 9 and 16 h (T½), respectively, with 0 (C), 0.15 (L) and 1.5 (H) mg/g feed of BHT or Red Chicory Extract (RCE).
Feed Additive
Root MSE Hay Corn
Control C
BHT RCE L H L H
Acetate (Ac) % 73.5A 66.6B 66.7B 74.5A 74.6A 68.2B 66.4B 0.6 Propionate (Pr) “ 15.9A 20.8B 17.6b 19.0a 19.5a 17.9b 17.6b 0.8 n-Butyrate (Bu) “ 7.2A 9.6B 13.1A 2.9B 2.4B 10.6A 13.0A 1.1 Others VFA “ 3.4A 3.0B 2.8B 3.6A 3.5A 3.3AB 3.0AB 0.3 (Ac+Bu)/Pr ratio 6.4A 4.8B 5.7a 5.4b 5.3b 5.7a 5.7a 0.2 Microbial N balance (mg/jar) N from feed (F) 4.3 6.8 5.6 5.6 5.6 5.6 5.6 - N from NH3 at t=0 (N0) 10.4 10.4 10.4 10.4 10.4 10.4 10.4 - N from NH3 at T½ (Nt) 10.4A 5.4B 9.3a 8.9a 7.4ab 8.1ab 5.8b 1.6 N content of NDF at T½ (N_NDF) 1.2B 1.9A 1.5 1.3 1.7 2.0 1.3 0.5 Microbial N at T½ 3.1B 9.9A 5.2b 5.8b 6.9ab 5.9b 8.6a 1.9 A,B P<0.01; a,b P<0.05. Microbial N at t½ was computed as: (F + N0) – (Nt + N_NDF).
Acknowledgements: Research financed by PRIN 2006

106
5. References
Alexander, G., Singh, B., Bhat, T.K., 2008. In vitro screening of plant extracts to enhance the
efficiency of utilization of energy and N in ruminant diets. Anim. Feed Sci. Technol. 145,
229-244.
Busquet, M., Calsamiglia, S., Ferret, A., Kamel, C., 2006. Plant extracts affect in vitro rumen
microbial fermentation. J. Dairy Sci. 89, 761-771.
Grings, E.E., Blummel, M., Sudekumc, K.H., 2005. Methodological considerations in using
gas production techniques for estimating ruminal microbial efficiencies for silage-based
diets. Anim. Feed Sci. Technol. 123, 527-545.
Menke, K.H., Raab, L., Salewski, A., Steingass, H., Fritz, D., Schneider, W., 1979. The
estimation of the digestibility and metabolisable energy content of ruminant feedingstuffs
from the gas production. J. Agric. Sci. 93, 217-222.
Naziroğlu, M., Güler, T., Yüce, A., 2002. Effect of vitamin E on ruminal fermentation in
vitro. J. Vet. Med. A 49, 251-255.
Rossetto, M., Lante, A., Vanzani, P., Spettoli, P., Scarpa, M., Rigo, A., 2005. Red Chicories
as Potent Scavengers of Highly Reactive Radicals: A Study on Their Phenolic
Composition and Peroxyl Radical Trapping Capacity and Efficiency. J. Agric. Food Chem.
53, 8169-8175.
107
CHAPTER 8
General conclusions
The main conclusions to be drawn from of this dissertation are:
• With DaisyII equipment, the use of 0.25 g feed sample/bag should be preferred to 0.50
g/bag, as this sample size seemed to provide digestibility estimates more correlated to
those achieved with a conventional batch culture and less variable
• For in situ studies commercial synthetic bags could replace nylon bags, as the two
kinds of bag provided digestibility values highly correlated; the replacement of nylon
bags with commercial bags could allow a simplification of procedure of analysis
• For in vitro studies the use of rumen fluid collected from fistulated animals seems to
be not strictly necessary, as the digestibility estimates obtained in vitro using rumen
fluid taken from intact cows were directly proportional to those achieved in situ
• As the digestibility measures at 24 and 48 h were highly correlated and showed a
comparable reproducibility, it seems to be possible to reduce the duration of the in situ
incubation time from 48 to 24 h, with advantages in terms of saving labour and costs
for feed evaluation.
• Once the GP values were converted in terms of ME, taking into account the effects of
feed chemical composition, the repeatability of the ME estimates from GP24 was only
20% higher than the ME resulting from digestibility measurements
• The precision and accuracy of feed energy estimates from GP strongly depends by the
equations used to convert GP values in energy values
• The venting procedure can affect significantly GP kinetics, especially when high
pressures are generated from feed fermentation
• With venting at fixed times the headspace volume and the amount of fermentable
matter incubated should be carefully balanced; the venting frequency should be higher
in correspondence to the highest GP rate
• When highly and rapidly fermentable feeds are incubated, high pressures could be
generated into the GP system, and the adjustment of GP measures for the amount of
dissolved gas could not be sufficient for allowing a proper evaluation of GP kinetics
• GP techniques equipped with automated devices for releasing gas at a fixed pressure
should be preferred
108
• The red chicory extract (RCE) did not exert a significant effect on rumen
fermentations, although it was found to improve the efficiency of microbial protein
synthesis; with respect to RCE, BHT showed more accentuated effects, as it
significantly influenced GP kinetics, degradability parameters and VFA profile.

109
LIST OF PUBLICATIONS
1. F. Tagliapietra, S. Schiavon, J.C. Hall, M. Dal Maso, M. Cattani , L. Bailoni, 2008.
Dry matter and NDF rumen degradability assessed by two in vitro techniques on seven
feeds. Book of Abstracts No. 14 of 59th Annual Meeting of European Association of
Animal Production (p. 226).
2. M. Dal Maso, S. Schiavon, F. Tagliapietra, M. Cattani , A. Fracasso, 2008. A survey
on rations, milk yield and nutrient excretion of dairy farm in the Veneto region (Italy).
In: Sustainable farm animal breeding, 16th International Symposium, Animal Science
Days, Strunjan (Slovenia), 17-19 Settembre.
3. S. Schiavon, M. Dal Maso, M. Cattani , F. Tagliapietra, 2009. A simplified approach
to calculate slurry production of growing pigs at farm level. Ital. J. Anim. Sci., vol. 8,
pp. 431-455.
4. M. Dal Maso, F. Tagliapietra, M. Cattani , A. Fracasso, S. Miotello, S. Schiavon,
2009. Characteristics of dairy farms in the North-Eastern part of Italy: rations, milk
yield and nutrient excretion. Proceedings of the ASPA 18th Congress, Palermo, June 9-
12, 2009 (p. 295).
5. F. Tagliapietra, M. Cattani , M. Dal Maso, S. Schiavon, 2009. Effects of water
extracts from chicory and BHT on the in vitro rumen degradation of feeds.
Proceedings of the ASPA 18th Congress, Palermo, June 9-12, 2009 (p. 340).
6. M. Cattani , F. Tagliapietra, S. Schiavon, 2009. Effects of ascorbic acid, α-tocopherol
and red chicory on in vitro hind-gut fermentations of two pig feeds. Book of Abstracts
No. 15 of 60th Annual Meeting of European Association of Animal Production, p. 575.
7. F. Tagliapietra, M. Cattani , L. Bailoni, S. Schiavon, 2009. Ascorbic acid, α-
tocopherol acetate and wine marc extract incubated in vitro with rumen fluid: gas
production and fermentation products. Book of Abstracts No. 15 of 60th Annual
Meeting of European Association of Animal Production, p. 579.

110
8. M. Cattani , F. Tagliapietra, L. Bailoni, S. Schiavon, 2009. In vitro rumen feed
degradability assessed with DaisyII and batch culture: effect of sample size. Ital. J.
Anim. Sci., vol. 8 (suppl. 3), 169-171.
9. F. Tagliapietra, M. Cattani , L. Bailoni, S. Schiavon, 2010. In vitro rumen
fermentation: effect of headspace pressure on the gas production kinetics of corn meal
and meadow hay. Anim. Feed Sci. Technol. Vol. 158, pp. 197-201.
10. H. H. Hansen, M. Cattani , P. Westermann, B. W. Strobel, I. K. Hindrichsen, 2010.
Effect of easily fermentable carbohydrates at different pH on methane emission
measured with a wireless in vitro gas production technique. NJF Report, Vol. 6, No. 1,
p. 88.
11. M. Cattani , H. H. Hansen, I. K. Hindrichsen, F. Tagliapietra, L. Bailoni, S. Schiavon,
2010. Automated in vitro gas production system compared to in situ system to predict
the energy value of ruminant feeds. NJF Report, Vol. 6, No. 1, p. 89.
12. M. Cattani , H. H. Hansen, F. Tagliapietra, I. K. Hindrichsen, 2010. Effect of easily
fermentable carbohydrates on methane emission at different pH. Greenhouse Gases
and Animal Agriculture Conference, 3-8 October, Banff, Canada (In press).
13. F. Tagliapietra, M. Guadagnin, M. Cattani , S. Schiavon, L. Bailoni, 2010.
Associative effects of different feed combinations assessed by using a gas production
system. Book of Abstracts of the 61st Annual Meeting of the European Association for
Animal Production, Heraklion (Greece), 23-27 August 2010, p. 166.
14. F. Tagliapietra, M. Cattani , I. K. Hindrichsen, H. H. Hansen, S. Colombini, L.
Bailoni, S. Schiavon, 2010. True dry matter digestibility of feeds evaluated in situ
with different bags and in vitro using rumen fluid collected from intact donor cows.
Submitted to Anim. Feed Sci. Technol.
15. F. Tagliapietra, M. Cattani , H. H. Hansen, I. K. Hindrichsen, L. Bailoni, S. Schiavon,
2010. Metabolizable energy content of feeds based on 24 or 48 h in situ NDF
digestibility and on in vitro 24 h gas production methods. Submitted to Anim. Feed
Sci. Technol.
111
Acknowledgements
I feel to be particularly indebted to the following people:
- prof. Stefano Schiavon and dr. Franco Tagliapietra, who guided me during the whole
period of my PhD., giving to me their knowledge, encouragement and assistance. I
would like also to acknowledge them for their critical comments and suggestions in
data analysis and interpretation.
- prof. Hanne Hansen and dr. Ida Katarina Hindrichsen, who gave hospitality to me at
the Department of Large Animal Sciences of the University of Copenhagen during my
stay in Denmark. I am sincerely grateful to them for their patience, guidance and
assistance and for friendly climate in which I could stay and conduct my experiments.
- the PhD Students of the Department of Animal Science of the University of Padova;
during these three years I have enjoyed all those daily talks, discussions and funny
moments.
- all the members of the Department of Animal Science of the University of Padova,
who provided me a friendly and collaborative climate.
- prof. Mauro Spanghero, who transmitted to me his enthusiasm and passion for the
research activity when I was a student at the University.
- all my friends in Vicenza, Padova and Udine: you are a very important part of my life.
- a person who can never read this inscription; we have known each other just for two
years, but it was a revealing period for me.
- my family, for their support, inspiration, understanding and encouragement.
Mirko