Genetica e sport performance -...
144
Genetica e sport performance
-
Upload
vuongxuyen -
Category
Documents
-
view
213 -
download
0
Transcript of Genetica e sport performance -...

Genetica
e
sport performance

L’attività fisica è un importante fattore che ha modellato il genoma
umano durante l’evoluzione (Bouchard & Hoffman, 2011)
Daily energy
expenditure:
49kcal/kg
Daily energy
expenditure:
32kcal/kg

La perfomance sportiva ha
sempre mostrato un elevato
grado di variazione inter-
individuale anche in campioni
di atleti ben allenati.

Sino agli anni ‘40 del secolo
scorso la maggior parte degli studi
sulla performance fisica erano
basati sulle dimensioni e gli indici
antropometrici.
Tunner nel 1964 sosteneva che
senza il fisico adeguato l’atleta
aveva scarse possibilità di
raggiungere alti livelli di
performance.
Carter nel 1970 ipotizzò che il
somatotipo rappresentasse un
importante fattore selettivo per il
successo nella performance d’elite

Last Name, First Name
(Sex/Age)
Time
Country
Rop, Rodgers (M29) 2:08:07 1 KEN
Cheboiboch, Christopher
(M25)
2:08:17 2 KEN
Kipkemboi, Laban (M24) 2:08:39 3 KEN
Ouaadi, Mohamed (M33) 2:08:53 4 FRA
Baldini, Stefano (M31) 2:09:12 5 ITA
Carroll, Mark (M30) 2:10:54 6 IRL
Thys, Gert (M30) 2:11:48 7 RSA
O'Dowd, Matt (M26) 2:12:20 8 GBR
Keflezighi, Meb (M27) 2:12:35 9 CA, USA
Ndungu, Stephen (M35) 2:13:28 10 KEN
Schiebler, Jeff (M29) 2:14:13 11 CAN
Musto, Wilson (M26) 2:15:45 12 KEN
Palumbo, Matteo (M29) 2:16:06 13 ITA
Ramaala, Hendrik (M30) 2:17:10 14 RSA
Hirayama, Mitsunori (M26) 2:17:14 15 JPN
Muchiri, Gabriel (M22) 2:17:30 16 KEN
Rutto, David (M22) 2:18:43 17 KEN
Ryzhov, Fedor (M42) 2:18:46 18 RUS
Kosgei, Japhet (M34) 2:18:55 19 KEN
Tarus, Henry (M23) 2:19:40 20 KEN
Classifica Maratona di New
York 2000
atleti classificati 21694
9 atleti keniani nei primi 20

At Boston Marathon of 2002
13 out of 14 athletes from Kenia completed the race within the first 25 positions.
1 out 1122 athletes from Canada ended the race within the first 25.
Clearly, Kenyans appear to have some inherent abilities that favor them in long-distance running.
Ranking (men)
1- Rogers Pop (Kenya)
2- Cristopher Cheboiboch
(Kenya)
3- Fred Kiprop (Kenya)
4- Mbarak Hussein (Kenya)
5- Lee Bong-Ju (Korea)
6- Elias Chebet (Kenya)
7- Simon Bor (Kenya)
8- Getachew Kebede (Etiopia)
9- Luis Fonseca (Venezuela)
10- Silvio Guerra (Ecuador)
Ranking (women)
1- Margaret Okayo (Kenya)
2- Catherine Ndereba (Kenya)
3- Elfenesh Alemu (Etiopia)
4- Sun Yingjie (Cina)
5- Firaya Sultanova (Russia)

Performance by ethnicity

Ranking 200m
Usain Bolt (Giamaica)
Yohan Blake (Giamaica)
Warren Weir (Giamaica)
Olimpic Games 2012
Ranking 100m
Usain Bolt (Giamaica)
Yohan Blake
(Giamaica)
Justin Gatlin (USA)
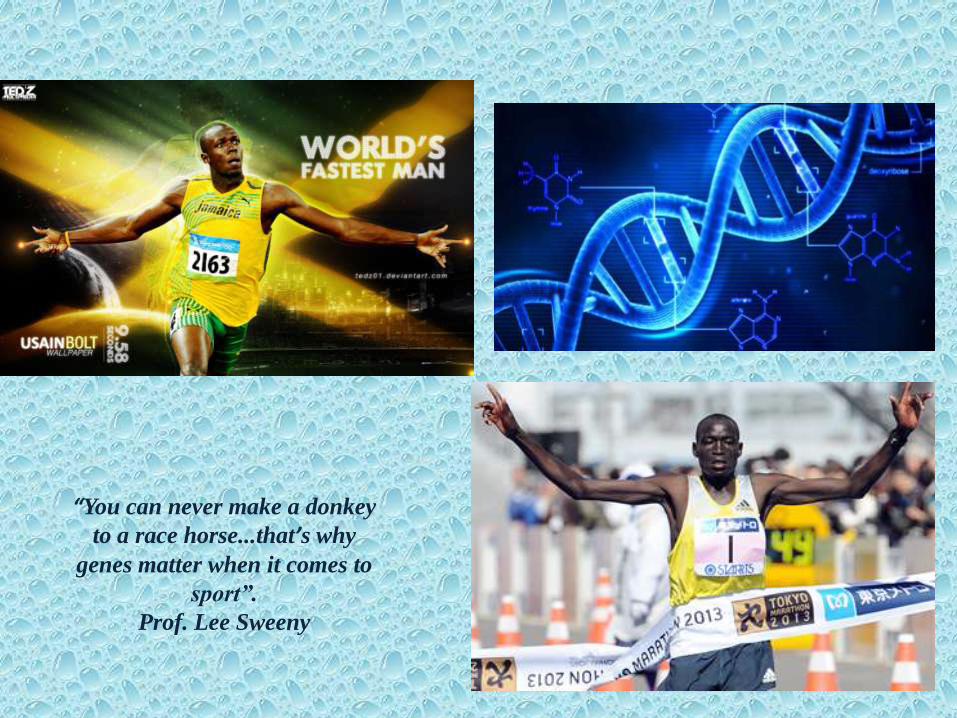
“You can never make a donkey
to a race horse...that’s why
genes matter when it comes to
sport”.
Prof. Lee Sweeny

L’esercizio fisico è il risultato una complessa
interazione tra i diversi sistemi anatomici e
fisiologici.
L’adattamento all’esercizio richiede che vengano
prodotti movimenti coordinati che implicano
cambiamenti cellulari e molecolari, che coinvolgono
l’espressione genica. Per es., i muscoli scheletrici
possono risultare più o meno efficienti e il sistema
cardiocircolatorio più o meno soggetto alla fatica in
relazione a come i geni sono espressi.

il consumo massimale e submassimale di O2,
l’attività degli enzimi ossidativi,
la percentuale di contrazione delle fibre lente,
Sezione trasversale delle fibre muscolari,
Caratteristiche antropometriche,
La performance sportiva sembra influenzata da:

La maggior parte dei lavori hanno studiato la VO2max e l’istologia delle fibre muscolari in
relazione alla capacità di performance.
La domanda: sono questi 2 parametri capaci di predire in modo assoluto la possibilità di performance?
Un atleta d’elite può essere riconosciuto in base a questi elementi?

Numerose ricerche, pubblicate nell’ultima
decade, hanno evidenziato che variazioni in
singoli geni possono influenzare la performance
sportiva. Molti di questi lavori, per esempio,
mostrano un associazione tra le frequenze
alleliche di un determinato gene e una specifica
caratteristica, come un alto consumo di ossigeno
(VO2max), la capacità aerobica, l’efficienza o la
forza muscolare.

La performance sportiva è sicuramente un tratto
poligenico e un singolo gene non può essere
responsabile del successo sportivo, ma può
diminuire o aumentare la capacità fisica (Dionne
et al., 1991). Inoltre, non tutti i genotipi favorevoli
sono presenti nello stesso atleta, e la variazione
nella performance è il risultato della
combinazione di fattori genetici e ambientali,che
include, naturalmente l’allenamento.
ambiente Life style
Genetica
sport

In che misura un determinato carattere (es.
performance o il fenotipo) è espressione delle
componenti genetiche e dei fattori ambientali?
Cioè quanto di quel fenotipo spetta alla “nature”
e quanto alla “nurture”?
La frazione di variazione fenotipica attribuibile
alle differenze genetiche può essere misurata
mediante la stima dell’ereditabilità del carattere

Vt= Vg+Va+Vi
dove:
VT = varianza fenotipica totale;
VG = frazione della varianza fenotipica dovuta ai
fattori genetici (cioè alle differenze genetiche tra gli
individui);
VA = frazione varianza fenotipica dovuta ai fattori
ambientali (cioè alle differenze nelle condizioni
ambientali nelle quali gli individui sono esposti)
VI = interazione tra geni e ambiente.

Esempio:
E’ stato dimostrato che la percentuale di
variabilità genetica ammonta a circa il 5% per il
grasso sottocutaneo, il 25% per la massa grassa
totale e il 30% per la massa magra e per il
rapporto tra il grasso sottocutaneo e quello
totale.
Ma quali geni sono implicati e come agiscono?

In che misura un carattere è dovuto a fattori ambientali e a fattori genetici?
Studi sui gemelli monozigotici (MZ) e dizigotici (DZ)
Studi familiari
Elevato contributo dei fattori genetici per la determinazione del VO2max
L’attività enzimatica implicata nella produzione di ATP mostra una base d’ereditarietà tra il 25-50%

Phenotypes and Genotypes
Solamente in questi ultimi anni si è iniziata una ricerca sistematica tesa a scoprire i geni che potrebbero essere coinvolti nella determinazione delle qualità fisiche e della performance sportiva.
Il gene candidato ideale è quello che mostra un effetto funzionale
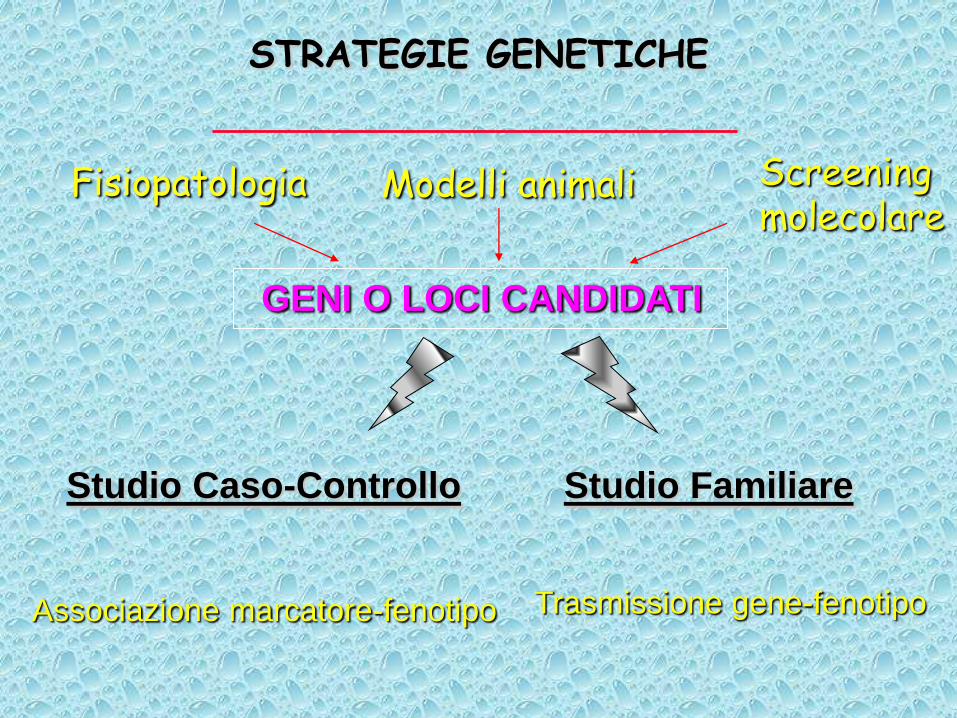
STRATEGIE GENETICHE
Fisiopatologia Modelli animali
Studio Caso-Controllo Studio Familiare
Associazione marcatore-fenotipo Trasmissione gene-fenotipo
Screening
molecolare
GENI O LOCI CANDIDATI

1968
•TAPPE FONDAMENTALI degli STUDI CONDOTTI
1976
QESTI PRIMI TENTATIVI, SI BASARONO TUTTI
SULLO STUDIO DEL
POLIMORFISMO NEGLI ANTIGENI E NEGLI
ENZIMI DEI GLOBULI ROSSI.
•Studio sugli atleti partecipanti •alle Olimpiadi del Mexico
•Studio sugli atleti partecipanti •alle Olimpiadi di Montreal

TAPPE FONDAMENTALI degli STUDI CONDOTTI E’ solo nel:
1990 STUDIO sul Livello della MOLECOLA di DNA

• GENI MAGGIORMENTE STUDIATI
• nel CAMPO dello SPORT D’ELITE
dal 1988 al 2002
• Meta-Analisi 40 Pubblicazioni Scientifiche
Ricavate da Banca dati Specializzata

GENI MAGGIORMENTE STUDIATI NEL
CAMPO DELLO SPORT D’ELITE DAL
1985 AL 2002
0
5
10
15
20
25
Gru
ppo
Sanguig
no A
B0
Enzim
a
Convert
itore
dell'A
ngio
tensin
a
(AC
E)
Recettore
Alfa 2
Adre
nerg
ico
(AD
RA
2A
)
Recettore
Beta
2
Adre
nerg
ico
(AD
RB
2A
)
Recettore
1
dell'A
gio
tensin
a
(AG
TR
1)
Recettore
2
dell'A
ngio
tensin
a
(AG
TR
2)
Cre
atin K
inasi
Muscolo
Specific
a (
CK
M)
Apolip
opro
tein
a E
(AP
OE
)

Marcatori genetici studiati nel campo della performance sportiva

15/05/2018 27
ACE Angiotensin-Converting Enzyme

Woods et al., 2001 0.004 Nuotatori
Alvarez et al., 2000 0.0009 Ciclisti, corridori, pallamano
Montgomery et al., 1997 0.02 Scalatori
Myerson et al., 1999 0.039 Corridori
Gaygay et al., 1998 0.03 Atleti Endurance
FENOTIPO: ENDURANCE E STUDI CASO-CONTROLLO
Rankinen et al., 2000 0.0006 Battito cardiaco a 50W Caucasoidi
0.0001 Indice massa VS
0.0001 Massa VS
0.02 Diam. Diastolico
0.0001 Spessore parete post.
Montgomery et al., 1997 0.0001 Spessore setto Militari
Fatini et al., 2000 0.02 Massa ventricolo sn Giocatori di soccer
FENOTIPO: RISPOSTE EMODINAMICHE ALL’ALLENAMENTO (studi di associazione)
Hagberg et al., 2000 0.04 Battito cardiaco es.submass Donne PM
Kanazawa et al., 2002 0.08 Pressione arteria polmonare Pazienti
Friedl et al., 1996 0.01 Pressione diastolica M+F
Hagberg et al., 1998 <0.05 Massimo battito cardiaco M+F
FENOTIPO:ESERCIZIO INTENSO E FENOTIPI EMODINAMICI (studi di associazione)
0.04 Tempo esercizio
Abraham et al., 2002 0.05 Picco VO2 Cardiopatici
Myerson et al., 1999 0.009 Corsa lunga distanza Caucasici
Hagberg et al., 1999 e 2002 <0.05 VO2max Donne PM
Bibliografia Probabilità Carattere Campione
FENOTIPO: ESERCIZIO INTENSO
Correla zioni con il gene ACE

L’ACE è risultato correlato con:
VO2max
Efficienza muscolare
Massimo battito cardiaco
Pressione diastolica
Diametro diastolico
Massa ventricolo Inoltre, sono risultate significative le differenze delle frequenze alleliche tra sportivi e controllo per i seguenti sport:
Atletica endurance
Corsa
Scalata
Ciclismo
Pallamano
Nuoto

15/05/2018 30
ACE Funzioni e Meccanismo d’Azione

15/05/2018 31
ACE Funzioni e Meccanismo d’Azione
AZIONE a livello
della
Muscolatura
Liscia Arterie
Per AUMENTO RESISTENZE VASCOLARI
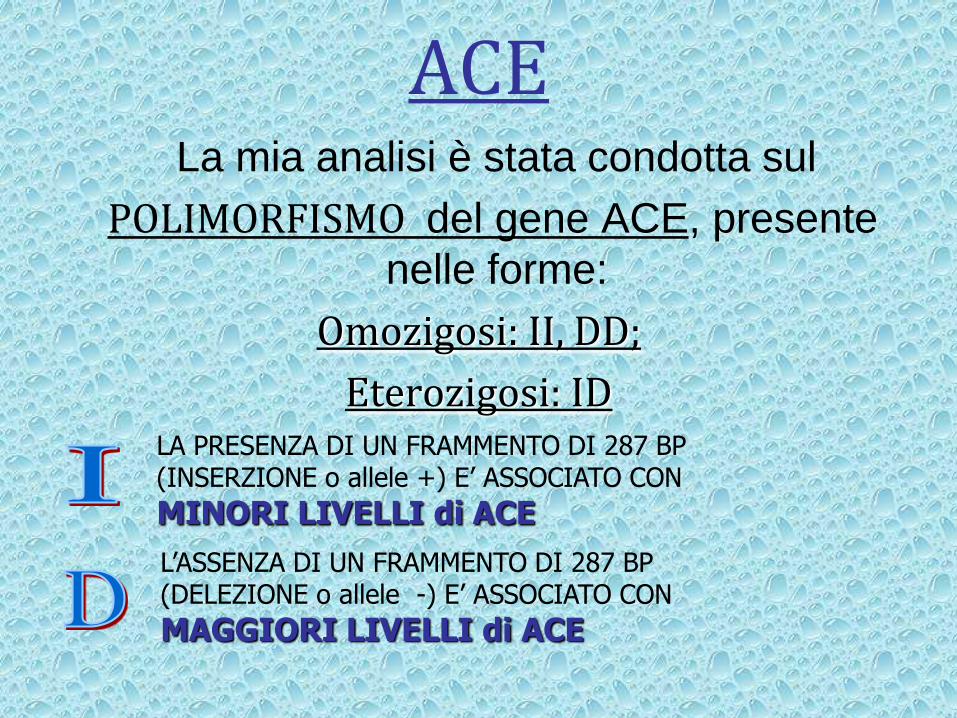
ACE La mia analisi è stata condotta sul
POLIMORFISMO del gene ACE, presente
nelle forme:
Omozigosi: II, DD;
Eterozigosi: ID LA PRESENZA DI UN FRAMMENTO DI 287 BP (INSERZIONE o allele +) E’ ASSOCIATO CON
MINORI LIVELLI di ACE
L’ASSENZA DI UN FRAMMENTO DI 287 BP (DELEZIONE o allele -) E’ ASSOCIATO CON
MAGGIORI LIVELLI di ACE

0%
10%
20%
30%
40%
50%
60%
70%
II ID DD
Distribuzione dei genotipi dell'ACE.
Potenza
Met. Misto
Controllo

ACE genotype frequency in 91 Olympic-standard runners. The proportion of I
alleles increased with distance run from 0.35 to 0.53 and 0.62 among those running
<=200 m (N = 20), 400–3000 m (N = 37), and >=5000 m (N = 34), respectively (P
= 0.009 for linear trend). The excess of I alleles (P = 0.012) and the II genotype (P
= 0.019) in the runners as a whole compared with controls was due to a skew
toward the I allele in the >=5000 m group, with a skew in favor of the D allele
among the sprinters. From: Jones, A et al: Exerc Sport Sci Rev, Volume 30(4).October 2002.184-190

II; 10%
ID; 10%
DD; 80%
II
ID
DD
II; 12%
ID; 48%
DD; 40%
II
ID
DD
Ginnasti
Controllo
ACE

Gene ACTN3
Le alfa-actine sono una famiglia di proteine leganti l’actina collegate alla distrofina e alle spectrine (Blanchard et al.,1989).
Nelle cellule non muscolari le isoforme del citoscheletro, alfa-actina 1 e 4 sono situate lungo le bande dei microfilamenti, dove mediano l’adesione alle membrane e le giunzioni di aderenza in maniera dinamica regolata dal legame con il calcio (Honda et al.,1998; Youssoufian et al.,1990).

Nel muscolo scheletrico, l’alfa-actina 2 e 3 sono le maggiori
componenti strutturali della linea Z del sarcomero dove
hanno la funzione di ancoraggio per il legame con l’actina
nei sottili filamenti in maniera costitutiva (Beggs et al., 1992).

L’alfa actina del sarcomero si lega ai sottili filamenti,alle proteine della linea Z e al fosfatidilinositolo, 4,5-bifosfato, fosfatidilinositolo 3 chinasi e PDZ-LIM proteine
adattatrici. Il gene alfa-actina 2 è espresso in tutte le fibre del muscolo scheletrico, mentre l’ACTN3 che codifica l’alfa-actina 3 è limitata alle fibre di tipo 2 veloci. L’alfa-actina 2 è capace di compensare l’assenza dell’alfa-actina 3 nelle fibre di tipo 2 veloci.

E’ stato identificato un polimorfismo SNP
(R577X) all’interno dell’esone 16 del gene
ACTN-3 (11q13–q14). associato con la
completa assenza della proteina Atn3 (North
et al. 1999).
Questo SNP è dovuto alla tranversione C – T e
converte un’ arginina in un prematuro codone
di stop nel residuo 577 (North et al. 1999).
La condizione omozigote per il codone di stop
(XX) ha una frequenza del 18% tra gli Europei
e del 16% a livello mondiale (Mills et al. 2001;
Yang et al. 2007).

Da un punto di vista evoluzionistico la sfida è spiegare l’elevata frequenza del genotipo dell’ACTN3 577XX e del genotipo 577RR.
Il genotipo 577XX sembra migliorare la performance di resistenza (allele R potrebbe diminuire la forza muscolare) mentre l’allele R aumenta l’abilità negli sport di potenza. Entrambi gli alleli potrebbero essere mantenuti ad alte frequenze nella popolazione perché entrambi conferiscono un vantaggio selettivo sotto differenti condizioni ambientali e perciò sono mantenuti ad alte frequenze per effetto di una selezione bilanciata.
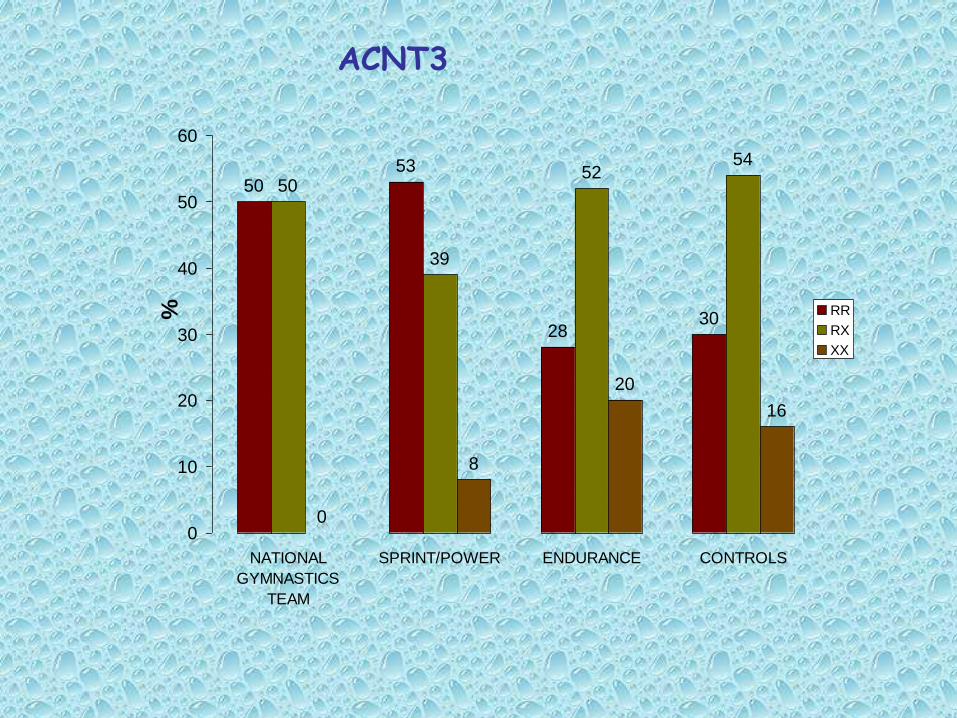
5053
2830
50
39
5254
0
8
20
16
0
10
20
30
40
50
60
NATIONAL
GYMNASTICS
TEAM
SPRINT/POWER ENDURANCE CONTROLS
% RR
RX
XX
ACNT3

7572
5457
2528
4643
0
10
20
30
40
50
60
70
80
NATIONAL
GYMNASTICS TEAM
SPRINT/POWER ENDURANCE CONTROLS
% R
X

0%
10%
20%
30%
40%
50%
60%
Distribuzione dei genotipi dell'ACTN3.
RR
RX
XX

0
0.2
0.4
0.6
0.8
1
1.2
Distribuzione degli alleli dell'ACTN3.
X
R

0
20
40
60
RR RX XX
actn3
ginnasti
controllo

ACTN3 genotype P value X allele (%) P value
RR (%) RX (%) XX (%)
Gymnasts
All, n= 35 48.5 48.5 2.8* 0.04 27.1* 0.03
Male, n=17 58.8 41.1 0* 0.03 20.5* 0.03
Female, n=18 38.8 55.5 5.5 0.35 33.4 0.35
Controls
All, n=53 32.0 49.0 18.8* __ 43.3* __
Male, n=31 32.2 51.6 16.1* __ 42.0* __
Female, n=22 31.8 45.4 22.7 __ 45.0 __
Higher
frequency of
the R allele
only in male
gymnasts with
respect to male
controls.
Male gymnastic
performance
requires a
greater degree
of muscular
strength than
female
performance

ACTN3 Genotype X allele (%) References
RR (%) RX (%) XX (%)
Gymnasts
All, n= 35 48.5 48.5 2.8 27.1
Male, n=17 58.8 41.1 0 20.5 Present Study
Female, n=18 38.8 55.5 5.5 33.4
Sprint Athletes
All, n=107 49.5 44.8 5.6 28.0
Male, n=72 52.8 38.8 8.3 27.8 Yang et al (2003)
Female, n=35 42.8 57.1 0 28.6
Endurance Athletes
All, n=194 30.9 45.3 23.7 49.2
Male, n=122 27.9 51.6 20.5 46.3 Yang et al (2003)
Female, n=72 36.1 34.8 29.1 46.5
Endurance Cycliste
Male, n=50 28.0 46.0 26.0 49.0 Lucia et al (2006)
No difference
between
gymnasts and
sprint athletes
Highly
significant
difference
between male
gymnasts and
male
endurance
athletes

0
50
100
150
200
In rosa: RR, in blu: RX

Questions about Jamaican Sprinters ?
• Jamaica a small island:
more Olympic medals than
countries many times its
size and wealth.
• 2008 Olympic Jamaica has
• 4 fastest women at 200 M,
• 4 of the top 6 at 100 M
• The fastest man 100 m

Medal record
Competitor for
Jamaica
Men's athletics
Olympic Games
Gold 2008 Beijing 100 m
Gold 2008 Beijing 200 m
Gold 2008 Beijing 4 × 100 m relay

An International Centre
for East African Running Science (ICEARS)
Established in Glasgow
Preliminary findings
• 70 % Jamaicans habitants have the ACTN3 gene
version that produce Actinin-3 protein
• 28 % of Jamaicans are heterozygous for ACTN3 gene,
which has the same effect but to a lesser degree.
• The rest have the “null” form of the gene that produces no
protein at all.
• Australians: only 30 % per cent were found with the
speed protein Actinin-3
• At least one billion people worldwide must be
completely deficient in Actinin-3

Studio sulla Nazionale Ginnastica maschile
10 atleti
Misurazioni antropometriche. Indici antropometrici
Composizione corporea, somatotipo
Analisi genetica: ACE e ACTN3
Gli atleti con il genotipo ACTN3*RR sono risultati
caratterizzati da un volume di massa muscolare
significativamente più alto, espresso da i valori di
mesomorfia, area muscolare del braccio (AMA), della
coscia (TMA) e del polpaccio (CMA), e circonferenza del
braccio, dei fianchi e della coscia.


TEST
SQUAT JUMP (TEMPO DI VOLO MIGLIORE)
SQUAT JUMP (TEMPO DI VOLO MEDIA)
SQUAT JUMP (ALTEZZA MASSIMA)
SQUAT JUMP (ALTEZZA MEDIA)
SALTO IN LUNGO DA FERMO (DISTANZA MASSIMA)
SALTO IN LUNGO DA FERMO (DISTANZA MEDIA)
CONTRO MOVIMENTO JUMP (TEMPO DI VOLO MIGLIORE)
CONTRO MOVIMENTO JUMP (TEMPO DI VOLO MEDIA)
CONTRO MOVIMENTO JUMP (ALTEZZA MASSIMA)
CONTRO MOVIMENTO JUMP (ALTEZZA MEDIA)
LANCIO PALLA ZAVORRATA AVANTI (DISTANZA MASSIMA)
LANCIO PALLA ZAVORRATA AVANTI (DISTANZA MEDIA)
STIFFNESS TEST (TEMPO DI VOLO MIGLIORE)
STIFFNESS TEST (TEMPO DI VOLO MEDIA)
STIFFNESS TEST (POTENZA MASSIMA)
STIFFNESS TEST (POTENZA MEDIA)
STUDIO SULE GINNASTE SARDE
23 ginnaste
Età media 10 anni (da 7 a 15 anni)
Analisi genetica: ACTN3
Test motori

Suddivisione del campione in due gruppi:
10 ginnaste con età 10-15 anni
13 ginnaste di età 7-9 anni.
Significativi i risultai per il gruppo 10-15 anni
Squot jump
SJBF SJMF SJBH SJMH
best p media p best p media p
RR 0,553 0,039 0,516 0,016 0,375 0,037 0,327 0,015
RX 0,517 0,039 0,460 0,016 0,328 0,037 0,261 0,015
SLMJ (salto in lungo) PZBA (palla
zavorrata) PZMA
media p best p media p
RR 57,778 0.020 490 0.008 435,667 0.011
RX 43,056 0.020 388 0.008 306,222 0.011

La divergenza di risultati statisticamente significativi nei due
sottogruppi potrebbe essere spiegata evidenziando la
componente “allenamento” che
nelle ginnaste di età maggiore e quindi con più anni di
allenamento potrebbe aver favorito l’espressione di valori
importanti di forza esplosiva.
avrebbe migliorato quelle caratteristiche di forza muscolare in
cui l’alfa actinina 3 risulta essere coinvolta, mentre nelle
ginnaste più giovani, la quantità di allenamento potrebbe non
essere stata sufficiente ad esplicitare tutte le potenzialità di
questa proteina muscolare.

ACE
Risultati significativi solo per la forza relativa
(Handgrip/peso corporeo)
Genotipi II e ID mostrano valori di forza relativa
significativamente più alti rispetto a quelli del genotipo II
(p=0,01)

0
10
20
30
40
50
60
70
80
DD ID II
Association between ACE genotype and Relative Strengh
DD
ID
II
Squadra Nazionale Senior Maschile

L’allele D potrebbe quindi conferire un vantaggio in
termini di sviluppo di forza in risposta
all’allenamento.
La maggiore quantità di Angiotensina II (genotipo
DD) nel plasma e nei tessuti potrebbe facilitare la
redirection del flusso sanguigno dalle fibre di tipo I
(lente) a quelle di tipo II (rapide), che sono favorite
nella performance degli sport di potenza, e quindi
anche nella ginnastica artistica.
Tipo I Tipo II
34
35
36
37
38
39
40
41
42
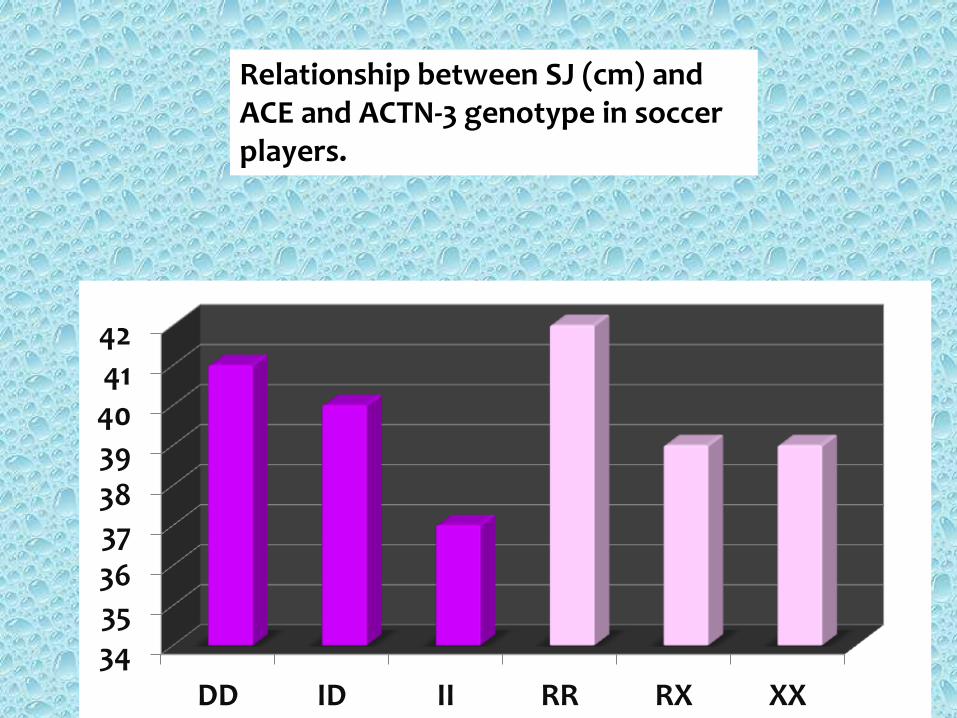
DD ID II RR RX XX
Relationship between SJ (cm) and ACE and ACTN-3 genotype in soccer players.

22%
10%
9%
59%
Competition Level ACE Genotype
ACTN-3 Genotype
Unexplained variability
Percentage of explained and unexplained variability in muscle strength of the lower limbs measured by Squat Jump (SJ) Test.

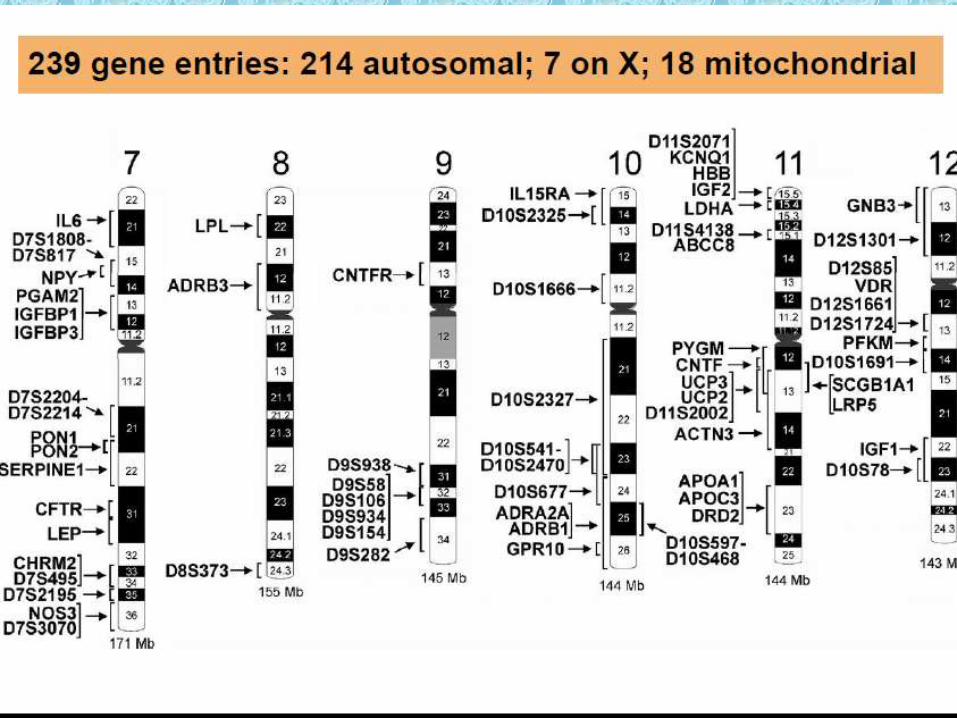
Med Sci Sports Exerc. 2009 Jan;41(1):35-73.
The human gene map for performance and health-related fitness phenotypes: the 2006-2007
update.
Bray MS1, Hagberg JM, Pérusse L, Rankinen T, Roth SM, Wolfarth B, Bouchard C.
Abstract
This update of the human gene map for physical performance and health-related fitness phenotypes
covers the research advances reported in 2006 and 2007. The genes and markers with evidence of
association or linkage with a performance or a fitness phenotype in sedentary or active people, in
responses to acute exercise, or for training-induced adaptations are positioned on the map of all
autosomes and sex chromosomes. Negative studies are reviewed, but a gene or a locus must be
supported by at least one positive study before being inserted on the map. A brief discussion on the
nature of the evidence and on what to look for in assessing human genetic studies of relevance to
fitness and performance is offered in the introduction, followed by a review of all studies published in
2006 and 2007. The findings from these new studies are added to the appropriate tables that are
designed to serve as the cumulative summary of all publications with positive genetic associations
available to date for a given phenotype and study design. The fitness and performance map now
includes 214 autosomal gene entries and quantitative trait loci plus seven others on the X
chromosome. Moreover, there are 18 mitochondrial genes that have been shown to influence fitness
and performance phenotypes. Thus,the map is growing in complexity. Although the map is exhaustive
for currently published accounts of genes and exercise associations and linkages, there are
undoubtedly many more gene-exercise interaction effects that have not even been considered thus
far. Finally, it should be appreciated that most studies reported to date are based on small sample
sizes and cannot therefore provide definitive evidence that DNA sequence variants in a given gene are
reliably associated with human variation in fitness and performance traits.


The lean, “double-muscled ” Belgian Blue Bull breed
a Mutated form of the Myostatin gene
(Sweeney, 2004)

The leg muscles of mice treated with IGF-1
(right) are bigger than the leg muscles of
untreated mice (left).

Peroxisome proliferator-activated receptor gamma,
coactivator 1 alpha, also known as PPARGC1A, PGC-1α is
a human gene.
The protein encoded by this gene is a transcriptional coactivator that
regulates the genes involved in energy metabolism.
This protein can interact with, and regulate the activities of cAMP
response element binding protein (CREB) and nuclear respiratory
factors (NRFs).
It provides a direct link between external physiological stimuli and
the control of oxidative phosphorylation and the regulation of
mitochondrial biogenesis.
This protein may be also involved in determination of muscle
fiber type, controlling blood pressure, regulating cellular
cholesterol homoeostasis, and the development of obesity.
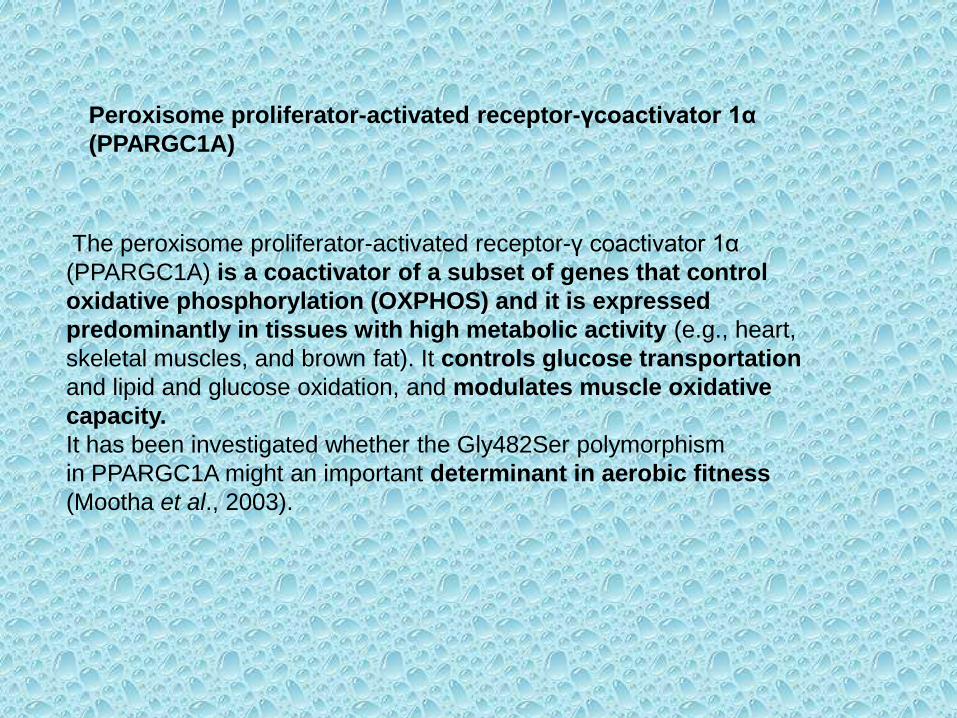
Peroxisome proliferator-activated receptor-γcoactivator 1α
(PPARGC1A)
The peroxisome proliferator-activated receptor-γ coactivator 1α
(PPARGC1A) is a coactivator of a subset of genes that control
oxidative phosphorylation (OXPHOS) and it is expressed
predominantly in tissues with high metabolic activity (e.g., heart,
skeletal muscles, and brown fat). It controls glucose transportation
and lipid and glucose oxidation, and modulates muscle oxidative
capacity.
It has been investigated whether the Gly482Ser polymorphism
in PPARGC1A might an important determinant in aerobic fitness
(Mootha et al., 2003).

Copyright ©2005 American Physiological Society
Lucia, A. et al. J Appl Physiol 99: 344-348 2005;
doi:10.1152/japplphysiol.00037.2005
PPARGC1A Ser482 allele frequency in unfit UK men (Unfit), Spanish men unselected for fitness (Unselected), fit UK men (Fit), and World-class Spanish athletes (Athletes)

CONCLUSIONI
Primi risultati: le componenti genetiche sono pienamente
coinvolte nella determinazione dei fenotipi correlati
all’attività fisico-sportiva dei ginnasti d’elite.
FUTURI SVILUPPI:
Identificazione di talenti o alla formulazione di programmi di
allenamento specifici in base alle caratteristiche genetiche
dell’atleta.
I veri benefici nella caratterizzazione genetica dell’atleta
potranno avvenire solo con una collaborazione tra genetisti
ed esperiti nel campo dell’attività motoria.
Does Gene
the only effect on
Physical Performance ?

You can never make a donkey to a
race horse...that’s why genes
matter when it comes to sport.
But By training you can make a
slow donkey to a faster one ,
Lee Sweeny, Geneticist

Importanza della composizione corporea.
Geni implicati nella determinazione della
composizione corporea

Gene localizzazione fenotipo riferimento
GDF8 2q32.2 Massa muscolare gamba
Ivey et al., 2000
ADRB2
ADRB3
5q31-q32
8p12-p11.2
Peso, BMI, circ. vita e fianchi, grasso sottocutaneo
Garenc et al,2003; Meirhaeghe et al,1999; Sakane et al.,1997
LPL 8p22 BMI, %FAT, grasso viscerale
Garenc et al., 2001
IL15RA 10p15-p14 FFM, circ. braccio e gamba
Riechman et al., 2004
UCP3 11q13 BMI, grasso sottocutaneo
Lanouette et al., 2002; Otabe et al., 2000
ACE 17q23 Peso, FFM, FAT Montgomery et al., 1999
IGF1 12q22-q23 FFM Sun et al., 1999
GNB3 12p13 FAT, %FAt Rankinen et al., 2003
CYP19A1 15q21.1 BMI, FAT, %FAT Tworoger et al., 2004
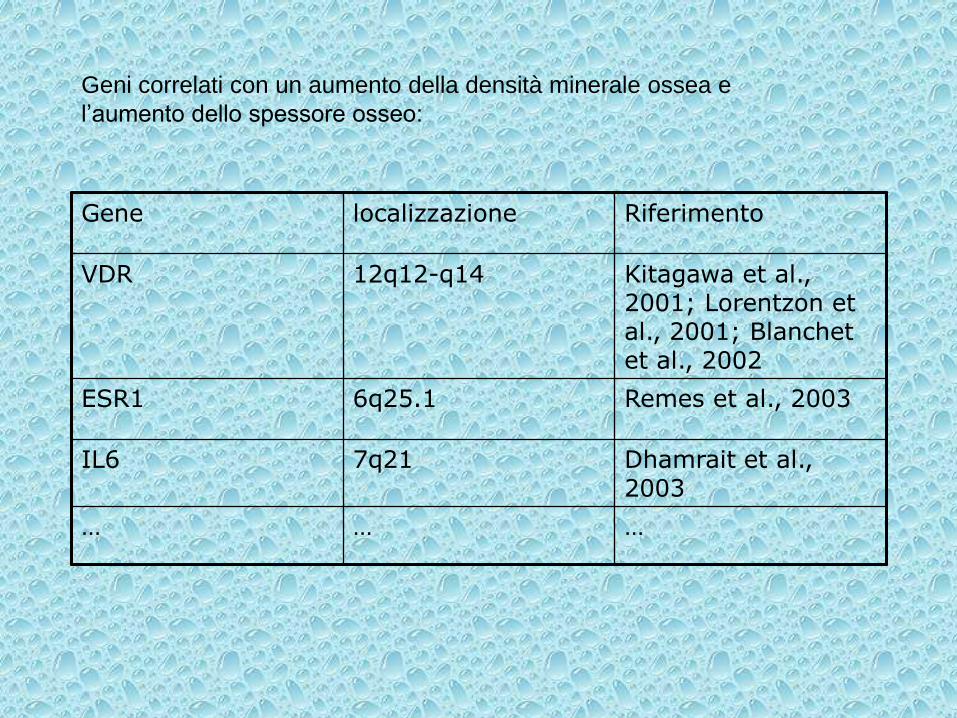
Geni correlati con un aumento della densità minerale ossea e
l’aumento dello spessore osseo:
Gene localizzazione Riferimento
VDR 12q12-q14 Kitagawa et al., 2001; Lorentzon et al., 2001; Blanchet et al., 2002
ESR1 6q25.1 Remes et al., 2003
IL6 7q21 Dhamrait et al., 2003
… … …

Altri geni che influenzano la morfologia corporea:
I recettori adrenergici alfa sembrano avere un ruolo importante nella
regolazione della lipolisi del tessuto adiposo.
I soggetti con genotipo ADRB2 Gln27Gln tendono ad aumentare di
peso e a guadagnare grasso sottocutaneo più facilmente degli individui
Glu27Glu/Gln27Glu dopo un periodo di sovralimentazione. Simili
differenze sono state trovate per i portatori e non portatori della
variante ADRB2 3.7/3.4 kb BanI.
Le variazioni genetiche nel locus ADRB2 potrebbero quindi
rappresentare uno dei fattori responsabili delle ampie differenze
individuali osservate in risposta ad alterazioni a lungo termine nel
bilancio energetico

Un polimorfismo nel gene CY19 (aromatase cytochrome P-450) è
stato trovato associato con una maggiore riduzione del BMI e
massa grassa
I polimorfismi del gene IL15RA (interleukin 15 receptor, alpha) sono
stati trovati associati con una maggiore aumento della massa
muscolare in risposta all’allenamento, e spiegano il 7,1% e il 3,5%
dell’aumento della massa magra.
I polimorfismi del gene IL15AR sono stati trovati in associazione
anche con i cambiamenti della circonferenza della gamba e delle
braccia.

Alcune problematiche …

Extract from web page
Arranging an ACTN3 Sports Gene Test There are various ways of arranging an ACTN3 Sports
Gene Test®. Testing costs $110 including GST. To
request a test kit to be sent out to you, choose from one
of the following options.
Call us
Call us on telephone +61 3 9415 7688
Website
Click here to order an ACTN3 Sports Gene Test® kit.
Write to us
Write to Genetic Technologies Limited, PO Box 115,
Fitzroy 3065, Victoria Australia.
Individuals under the age of 18 must have their parent,
or legal guardian, sign the test request form.
Visit a participating Healthclub
You can pick up an ACTN3 Sports Gene Test® kit at any
of the following healhclubs.
www.gtg.com.au/HumanDNATesting/index.asp?menuid=070.110

Gene Doping

Doping is defined as using forbidden substances or
methods in order to increase physical and/ or mental
performance.
The definition of “gene doping” is the non-therapeutic
use of genes, genetic elements and/or cells that have the
capacity to enhance athletic performance.
• Gene doping contains the insertions of artificial genes
in patients. The artificial gene produces an appropriate
RNA which synthesizes protein.
• Although gene therapies are developed for the
treatment of disease, it´s very likely that gene therapy
can increase performance if used by healthy athletes
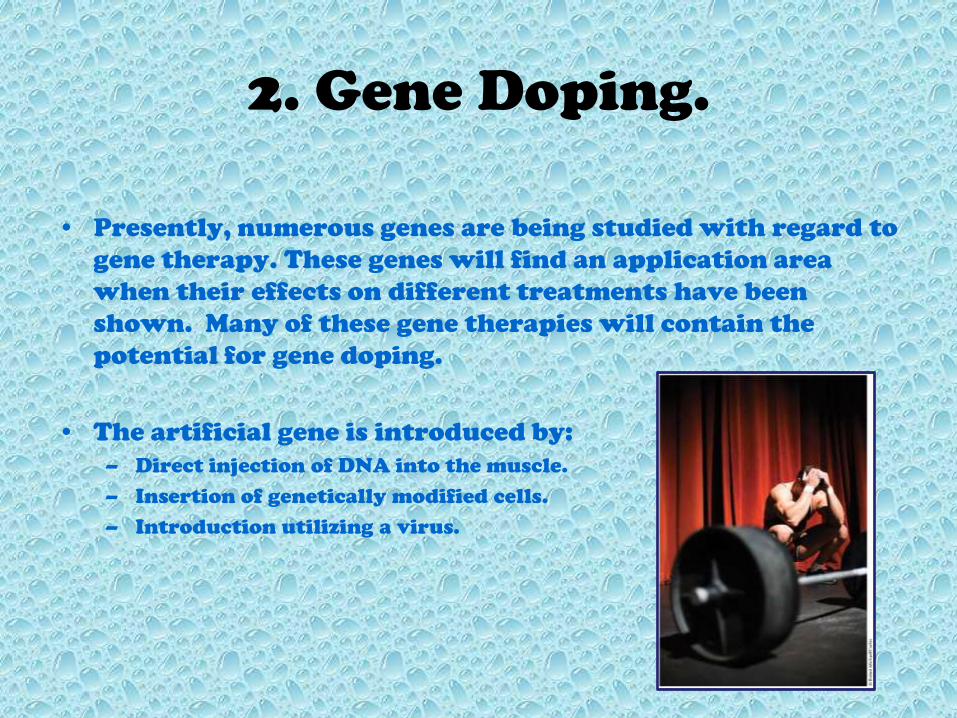
2. Gene Doping.
• Presently, numerous genes are being studied with regard to
gene therapy. These genes will find an application area
when their effects on different treatments have been
shown. Many of these gene therapies will contain the
potential for gene doping.
• The artificial gene is introduced by:
– Direct injection of DNA into the muscle.
– Insertion of genetically modified cells.
– Introduction utilizing a virus.


3.How is the Artificial Gene
Introduced? • Some of the genes used to performance enhancing are:
• Gene for Erythropoietin.
• The Insulin-like Growth Factor-1 Gene.
• The gene for Myostatin.
• The vascular Endothelial Growth Factor Gene.

Methods for gene manipulation
1. Harvest cells, manipulate ex-vivo, then re-introduce.
E.g. Method used for treating the SCID children.
2. Directly inject the viral vector into the body, either
systemically or into chosen tissue. E.g. Method used
in trials of VEGF gene injection to poorly
vascularised heart muscle in patients with heart
disease.
See next 2 slides.

From Kresina and Branch, Chapt 1, in An introduction to molecular medicine and gene
therapy, ed T.F.Kresina, 2001, Wiley

By modifying the serotype can get tissue specific transfection, e.g. just to muscle. Or
can use tissue-specific promoters.
From Kresina and Branch, Chapt 1, in An introduction to molecular medicine and gene therapy, ed
T.F.Kresina, 2001, Wiley

Methods for gene manipulation – problems/alternatives
1. Ex-vivo methods, often life of introduced cells is short
2. In-vivo, directly inject the viral vector. Immune system
attacks vector very effectively.
3. Injecting plasmid DNA, no vector, less immunogenic,
but rate of incorporation very low
4. Other approaches. Not strictly gene doping but closely
related:
1. Inhibition of promoters
2. RNA antisense sequences.

Risks of Gene Doping
The aspects of gene therapy that causes the most concern is
the know and unknow health risks
Heart attack and paralysis
Scientists emphasise that it is not the few detectable risks
that are the most dangerous aspects of gene therapy, but the
risks that are totally unknown
Tear or fractures in the muscles.

Tests to detect Gene Doping :
• A biopsy of suspected muscle tissue
• Suspicious elevations key biologic
substances that indicate gene doping by
serial monitoring of blood parameters.
• Detect abnormal gene activity: uses cutting-
edge microchip gene array technology or
nanotechnology breakthroughs
• A ‘‘protein fingerprint’’ or a ‘‘genetic map’’ of
the biochemistry of individual athletes
• Genetic barcodes

Discussion: the key issues for sport:
1. If gene therapy is used for curing disease, will it
then be used for fixing marginal insufficiencies
and for aiding recovery from injury? If so will
there be a clear enough line between these uses
and performance enhancement?
2. Can gene doping be detected, i.e. can the
authorities police its use anyway?
3. What happens when parents select/manipulate
embryos to create champions – are we going to
ban the children?
Investigation of
Differences between human populations.
Racial discriminations ?

Correlazione tra alcuni polimorfismi
genetici e infortuni muscolo tendinei
Ultimamente le analisi genetiche sono
state utilizzate nel campo degli
infortuni sportivi per verificare una
possibile correlazione tra il profilo
genetico di un individuo e gli infortuni
a cui è andato incontro.

Gli infortuni sportivi si manifestano per un interazione tra fattori intrinseci e
fattori estrinseci

Nonostante un rigoroso controllo di questi fattori, esiste un
grande range di differenze individuali nel numero e nella
gravità degli infortune, suggerendo che altri fattori, come la
variazione genetica, possa influenzare queste differenze

IMPORTANCE OF GENETICS IN INJURIES

IMPORTANCE OF GENETICS IN INJURIES
ACTN3 R577X polymorphism is associated with the incidence
and the severity of injuries in professional football players.
Massidda M.a, Voisin S.b, Culigioni C.a, Piras F.c,Cugia P.c, Yan
X.d, Eynon N.d*, C.M. Calòa* (in press)

La prevenzione degli infortuni è un fattore critico per
ottimizzare la performance di uno sport individuale o di
squadra

Polymorphism associated with musculoskeleton injuries/disorders

Negli ultimi decenni, ci sono state numerose evidenze scientifiche che
supportano la relazione tra polimorfismi del DNA e suscettibilità a
sviluppare infortune legati all’attività sportiva

INFORTUNI A LEGAMENTI E TENDINI
Incidenti da overuse includono
tendinopatie e rottre legamenti
In the last decades, new evidences supported the relationship
between polymorphisms and the susceptibility to develop
ligament and tendon injuries (Lippi et al. 2010; Maffulli et al. 2013;
Ficek et al. 2013; Pruna et al. 2014; O’Connel et al. 2015).

Polymorphism
associated with the
susceptibility to
develop ligament
and tendon injuries
(Longo et al., 2015)
INFORTUNI A LEGAMENTI E TENDINI

COL1A1
gene
A polymorphism (rs1800012) in the COL1A1 gene (GT):
The majority of people carry a G nucleotide at this
polymorphic position, and approximately 20% carry a T
nucleotide The T allele leads to increased expression of type I
collagen alpha polypeptides compared with the G allele,
which may increase the tensile strength of tendons and
ligaments.
INFORTUNI A LEGAMENTI E TENDINI

La variante genica è associata ad una riduzione dell’85% del rischio di
infortuni.

Infortuni tra i calciatori
•80 Elite Football players (Cagliari Calcio team serie A
from 2009 to 2014)
Severità:
Infortuni classificati in 4 gradi di severità
sulla base del numero di giorni di
assenza dagli allenementi:
Minimal (code 1), 1-3 days; mild (code
2), 4-7 days; moderate (code 3), 8-28
days; and severe (code 4), >28 days.
Incidenza:
Calcolata per 1000 h of attività
(allenamento e partite)

Il COL5A1 ha la funzione di codificare la catena α1 del collagene di tipo V, un collagene fibrillare che regola la fibrillogenesi. Le fibrille di collagene sono i componenti di base del tessuto connettivo fibroso come tendini, legamenti, cartilagini e di altri tessuti come i muscoli scheletrici.
Il polimorfismo preso in esame è lo SNP BstU, che sembra influenzi la funzionalità genica determinando l’insorgenza di patologie dell’ achilleo (Mokone et al., 2006).

The COL5A1 rs12722
accounted for 44% of severity
of injuries (P=0.002) (T
dominant model)
2
2.5
3
3.5
4
4.5
TT TC CC
sev
eri
ty

COL1A1 rs1800012 A/T
COL5A1 rs12722 C/T
COL12A1 rs970547 G/A
COL12A1 rs240736 T/C
COL14A1 rs4870723 A/C
MMP3 rs520540 A/G
MMP3 rs679620 A/G
MMP3 rs602128 T/C
GDF rs143383 T/C
TGFβ1 rs1800469 T/C
Correlazione tra GDF-5, TGFβ1 e COL1A1
con la predisposizione verso le lesioni
tendinee.

INFORTUNI MUSCOLARI
Interindividual differences in muscle injury severity,
recovery time, and injury rate could be explained by the
presence of (SNPs) in genes involved in the muscle
function and its mechanical property and in the
reparation and regeneration of connective tissue .
Gli infortune muscolari sono un
gruppo eterogeneo di infortune
con un’eziologia complessa e
sono influenzati da fattori
genetici e ambientali
Damage to skeletalmuscle
require
regeneration to maintain proper
muscle form and function.

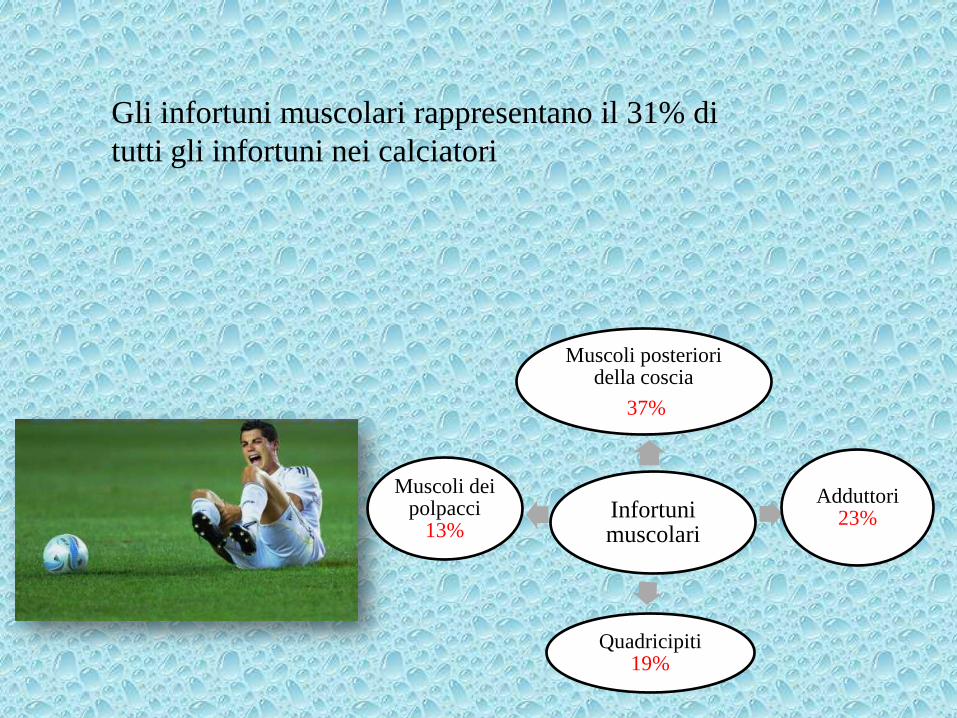
Gli infortuni muscolari rappresentano il 31% di
tutti gli infortuni nei calciatori
Infortuni muscolari
Muscoli posteriori della coscia
37%
Adduttori 23%
Quadricipiti 19%
Muscoli dei polpacci
13%

muscle injuries account for 20 to 37%
of all time loss injuries at
men’s professional level and 18 to
23% at men’s amateur level.
The understanding of the factors that
predispose players to muscle injuries is
limited and it
is still not thoroughly understood why some
athletes are at higher risk than others
under
non-contact conditions.


Alpha actinine 3
SNP Polymorphism: non sense mutation:
tranversion C-T that causes a substitutin of an
arginine into a STOP codone at position 577
(R577X).
ACTN3

Professional soccer athletes
homozygous to ACTN3XX gene are more
susceptible to eccentric damage and
present a higher catabolic
state, demonstrated by metabolic,
hormonal and immune responses post an
eccentric training, in comparison to
ACTN3RR and ACTN3RX
groups
XX individuals would need
a
longer
time of recovery between
training sessions and
differentiated
distribution of training
content
with the aim of avoiding the
overtraining and muscle
lesions.
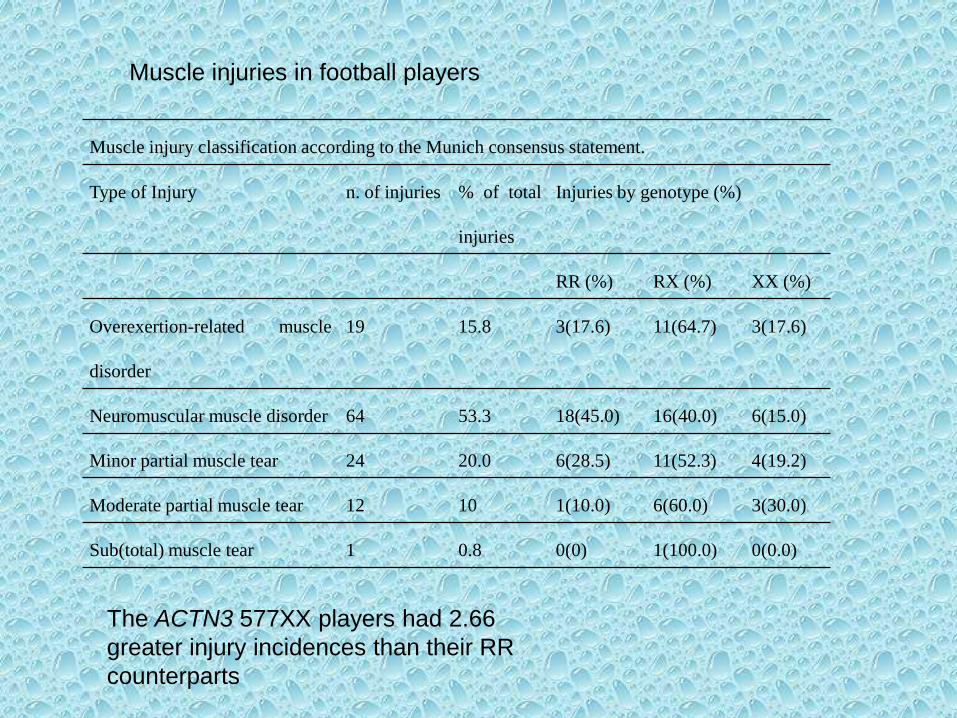
Muscle injury classification according to the Munich consensus statement.
Type of Injury n. of injuries % of total
injuries
Injuries by genotype (%)
RR (%) RX (%) XX (%)
Overexertion-related muscle
disorder
19 15.8 3(17.6) 11(64.7) 3(17.6)
Neuromuscular muscle disorder 64 53.3 18(45.0) 16(40.0) 6(15.0)
Minor partial muscle tear 24 20.0 6(28.5) 11(52.3) 4(19.2)
Moderate partial muscle tear 12 10 1(10.0) 6(60.0) 3(30.0)
Sub(total) muscle tear 1 0.8 0(0) 1(100.0) 0(0.0)
Muscle injuries in football players
The ACTN3 577XX players had 2.66
greater injury incidences than their RR
counterparts

INJURIES SEVERITY
XX = 3,64 ± 0,66, n = 13 RR = 2,91 ± 0,82, n = 24
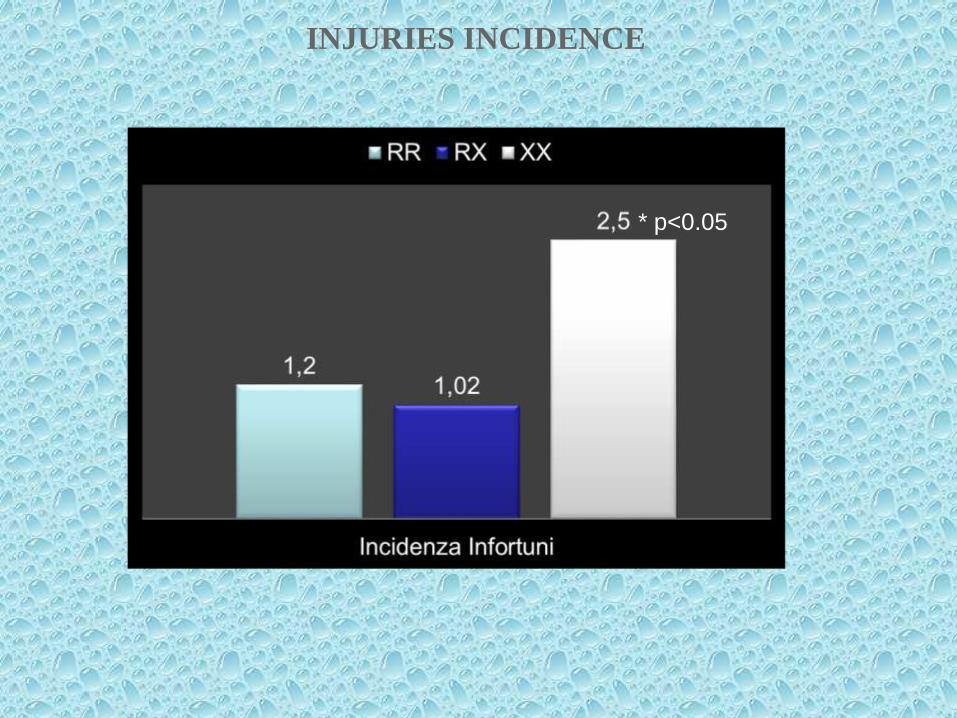
INJURIES INCIDENCE
* p<0.05
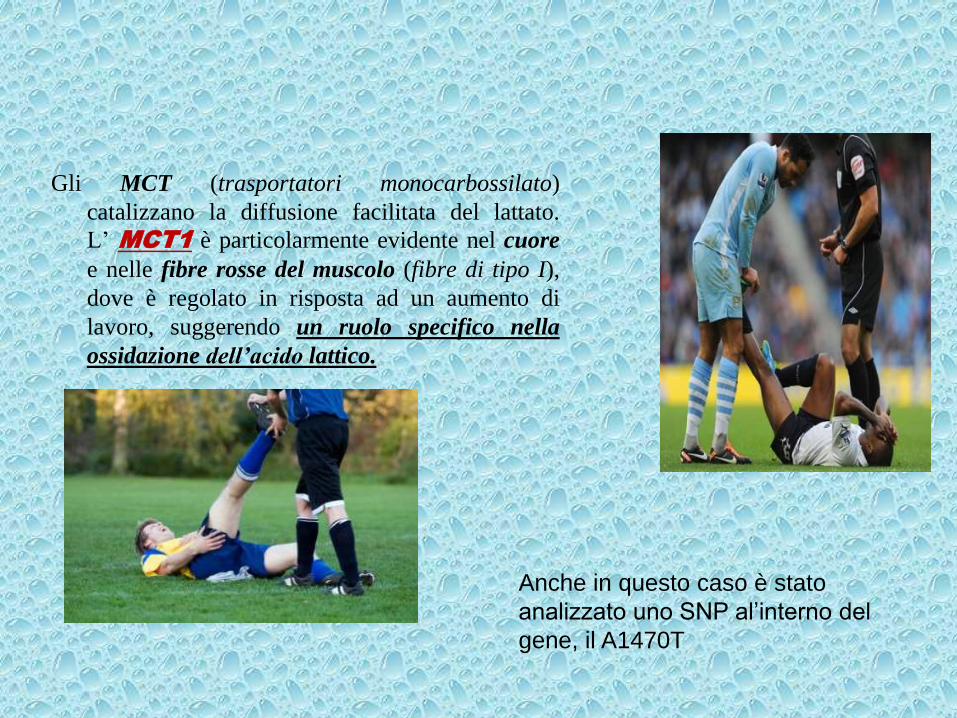
Gli MCT (trasportatori monocarbossilato)
catalizzano la diffusione facilitata del lattato.
L’ MCT1 è particolarmente evidente nel cuore
e nelle fibre rosse del muscolo (fibre di tipo I),
dove è regolato in risposta ad un aumento di
lavoro, suggerendo un ruolo specifico nella
ossidazione dell’acido lattico.
Anche in questo caso è stato
analizzato uno SNP al’interno del
gene, il A1470T

Lactate transport across the
plasma membrane is mainly
mediated by proton-linked
monocarboxylate transporters
(MCT1 and MCT4) that play a
relevant role in the intracellular pH
homeostasis
Lactic acid transport across
the plasma membrane is
fundamental for the
metabolism and pH
regulation of all cells,
removing lactic acid
produced by glycolysis.

Cupeiro et al. [2010] : association between MCT1
rs1049434 and lactate accumulation;
higher capillary lactate accumulation was noted in men
carrying T allele during high-intensity circuit training.
Cupeiro et al. [2012] published another study in which
they found a higher lactate accumulation in AA males,
which would reflect a higher release of this molecule from
the active fiber to the blood
MCT1
Hypothesizs: the presence of the T allele (associated with
greater arterial blood lactate levels) could be protective in
developing pathogenesis of indirect
muscle injuries due to the decreased transport mediated
by MCT1 proteins from arterial blood into the muscle
fibers for its oxidation

Sampling: 173 male elite football players
That have played at the Official National
Football Championship during
five consecutive seasons (2009–2014).

Injury incidence was calculated per
1000 h of training Exposure ((Σ
number of muscle injuries/Σ h
training exposure) ×1000).
Football players with
the TT genotype had
lower incidence of
muscle injuries
compared to AA
genotype carriers
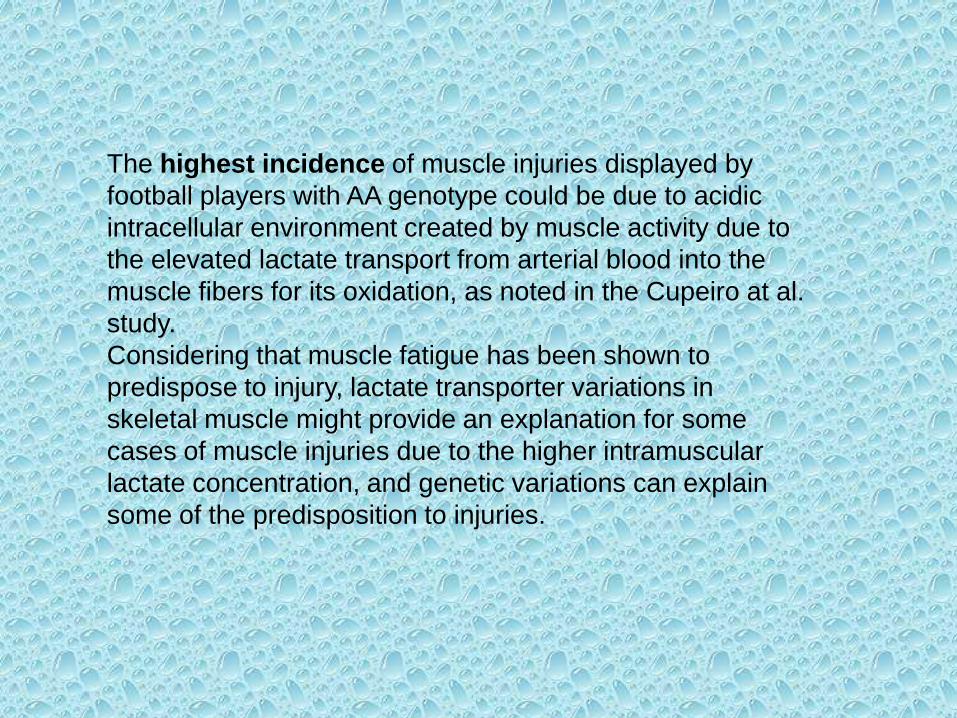
The highest incidence of muscle injuries displayed by
football players with AA genotype could be due to acidic
intracellular environment created by muscle activity due to
the elevated lactate transport from arterial blood into the
muscle fibers for its oxidation, as noted in the Cupeiro at al.
study.
Considering that muscle fatigue has been shown to
predispose to injury, lactate transporter variations in
skeletal muscle might provide an explanation for some
cases of muscle injuries due to the higher intramuscular
lactate concentration, and genetic variations can explain
some of the predisposition to injuries.
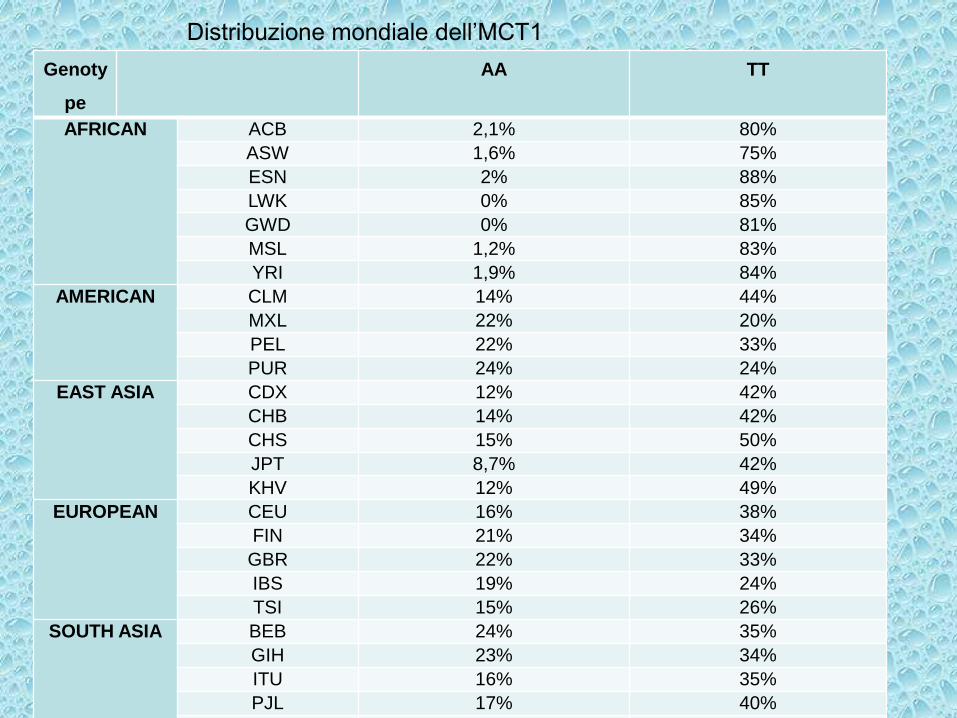
Distribuzione mondiale dell’MCT1
Genoty
pe
AA TT
AFRICAN ACB 2,1% 80%
ASW 1,6% 75%
ESN 2% 88%
LWK 0% 85%
GWD 0% 81%
MSL 1,2% 83%
YRI 1,9% 84%
AMERICAN CLM 14% 44%
MXL 22% 20%
PEL 22% 33%
PUR 24% 24%
EAST ASIA CDX 12% 42%
CHB 14% 42%
CHS 15% 50%
JPT 8,7% 42%
KHV 12% 49%
EUROPEAN CEU 16% 38%
FIN 21% 34%
GBR 22% 33%
IBS 19% 24%
TSI 15% 26%
SOUTH ASIA BEB 24% 35%
GIH 23% 34%
ITU 16% 35%
PJL 17% 40%
STU 17% 36%

T A H n.b N African
ACB 0.8906 0.1094 0.1958 96
ASW 0.8689 0.1311 0.2298 61
ESN 0.9293 0.0707 0.1321 99
LWK 0.9242 0.0758 0.1407 99
GWD 0.9071 0.0929 0.1693 113
MSL 0.9118 0.0882 0.1619 85
YRI 0.9120 0.0880 0.1612 108
American
CLM 0.6489 0.3511 0.4581 94
MXL 0.4922 0.5078 0.5038 64
PEL 0.5529 0.4471 0.4973 85
PUR 0.5000 0.5000 0.5024 104
East Asia
CDX 0.6505 0.3495 0.4571 93
CHB 0.6408 0.3592 0.4626 103
CHS 0.6762 0.3238 0.4400 105
JPT 0.6683 0.3317 0.4455 104
KHV 0.6869 0.3131 0.4323 99
European
CEU 0.6111 0.3889 0.4777 99
FIN 0.5657 0.4343 0.4939 99
GBR 0.5549 0.4451 0.4967 91
IBS 0.5280 0.4720 0.5008 107
TSI 0.5561 0.4439 0.4960 107
South Asia
BEB 0.5523 0.4477 0.4974 86
GIH 0.5534 0.4466 0.4967 103
ITU 0.5931 0.4069 0.4850 102
PJL 0.6146 0.3854 0.4762 96

Allele T of rs1049434 is the common
variant (wild type) and hence it shows
higher frequencies than the A allele
(missense variant) in all populations. The
frequencies of T range from 69% - 49% in
all geographical areas except in Africa.
Sub-Saharan populations show remarkable
high values (86% - 91%).

SNPs in HGF genes have an important role as biomarkers of
biological processes fragility within muscle
injuries related to injury rate, severity, and long recovery time.

BONE INJURIES
The genetic predisposition to develop a stress fracture is still a largely
unexplored area.
Stress fracture
injuries in
athletes
Diet
Training Environment
Biomechanics

Genetic susceptibility suggetsed by:
Monozygotes twin studies (VanMeensel and Peers, 2010)
multiple stress fractures occurring in the same individual (Lambros
and Alder, 1997)
stress fractures occurring in some individuals but not in others
undertaking identical training protocols (Lappe et al. 2001; Bennel et
al. 1999)
and a family history of stress fracture injury acting as a risk factor
(Loud et al. 2007).

Genetic factors account for
up to 50-75%of the
variability of bone mineral
density (BMD) in the
population
The few studies (limited by the small number of
subjects investigated) that have looked for
a link between specific genes and the development of
stress fractures have not produced
any conclusive results.

Only two studies are recently
focused on the relation between genetics and
stress fracture injury risk in elite athletes
Is important in the regulation of
bone turnover, with single
nucleotide polymorphisms
(SNPs) in genes within this
pathway associated with bone
phenotypic adaptations.
changes in bone mineral density
(BMD),bone cross sectional
area, osteoporotic fracture risk
and bone resorption and
formation
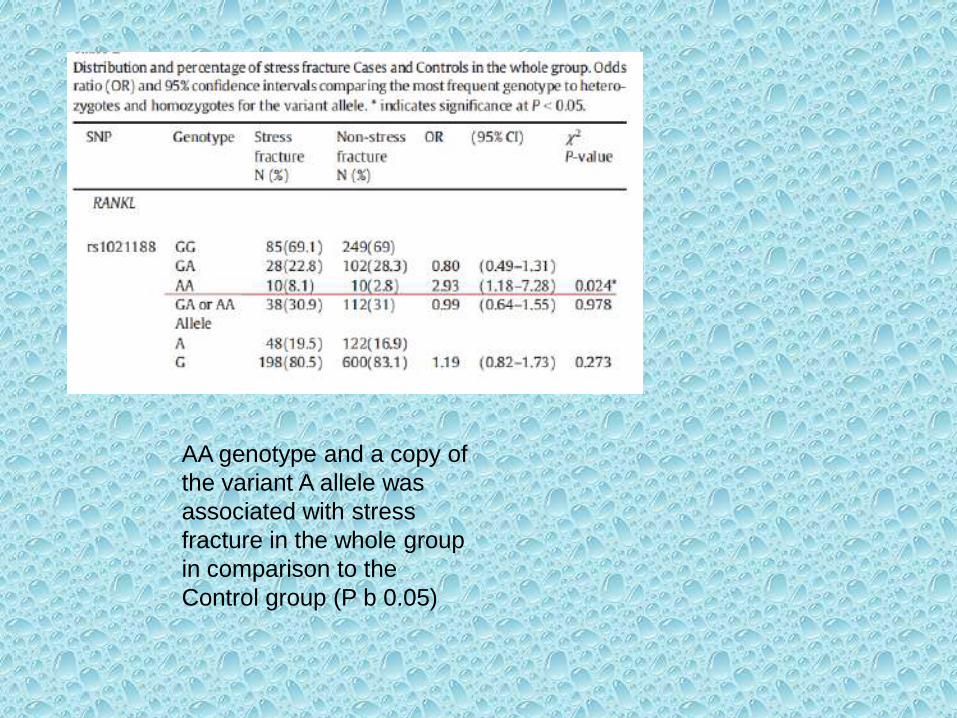
AA genotype and a copy of
the variant A allele was
associated with stress
fracture in the whole group
in comparison to the
Control group (P b 0.05)

A key regulator of
bone remodelling, is
a genetic
candidate that may
contribute to stress
fracture
predisposition
Homozygotes for the A allele of rs1718119 were present in only 2.4 %
of the multiple stress fracture cohort in comparison to 18.9 %of the
non-stress fracture group.

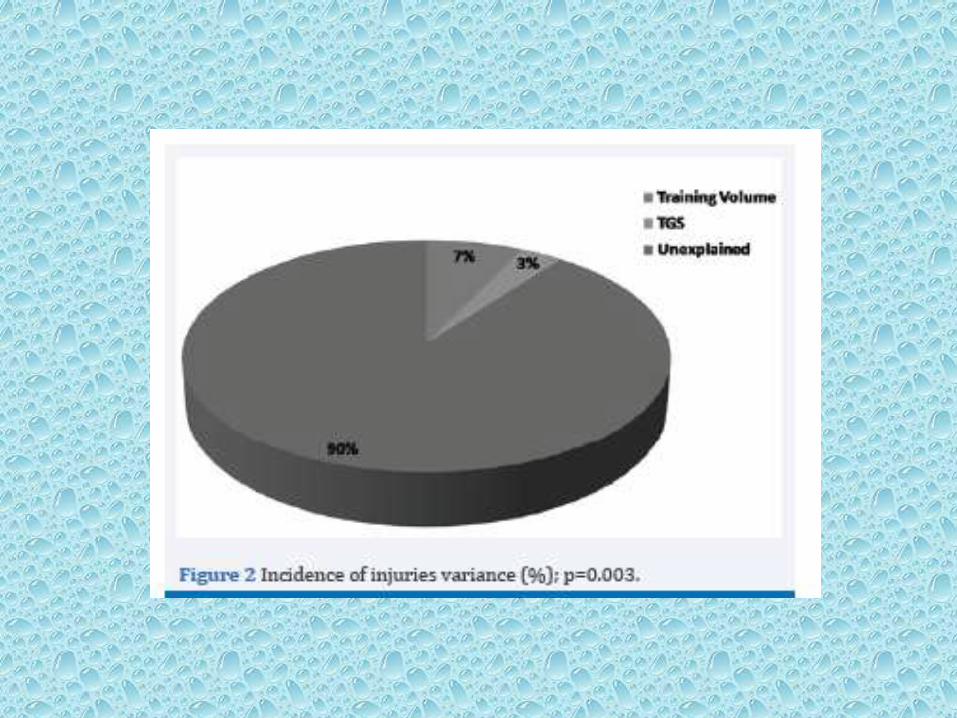
TGS
Per valutare l’influenza combinata di tutti i genotipi studiati è stato applicato il modello
proposto da Williams e Folland (2008), con il calcolo del TGS (Total Genotype
Score), che utilizza un algoritmo che consente di analizzare l’influenza combinata
di diversi geni su un carattere fenotipico.
• Incidenza lesioni (r=-0.53, p<0.05) (R2=27.74)
• Entità lesioni (r=-0.56, p<0.05) (R2=31.10)


Genetic profile could explain why some elite soccer players
are predisposed to suffer more injuries than others and why
they need more time to recover from a particular injury.
CONCLUSION
It is too early to measure the effect of genetic testing on
reducing the incidence of injuries or inducing behavioral
changes that will promote health and/or prevent injury.
Athletes, coaches, and medical practitioners can use
this information to generate personalized training
regimens for athletes.
Conclusioni
Da quanto emerso si capisce come nonostante i grandi progressi
avvenuti negli ultimi decenni in questo ambito, la relazione tra
predisposizione agli infortuni indiretti e genetica è ancora da
indagare. L’obiettivo finale di questa ricerca sarebbe quello di
lavorare in sinergia tra scienziati e esperti di attività motoria
al fine di programmare allenamenti personalizzati per
migliorare la perfomance e prevenire gli infortuni.