EVALUATION OF PHYTOREMEDIATION POTENTIAL AND PHISIOLOGICAL
125
1 Sede Amministrativa: Università degli Studi di Padova Dipartimento di Biotecnologie Agrarie SCUOLA DI DOTTORATO DI RICERCA IN : TERRITORIO, AMBIENTE, RISORSE E SALUTE INDIRIZZO: ECOLOGIA CICLO XXII EVALUATION OF PHYTOREMEDIATION POTENTIAL AND PHISIOLOGICAL RESPONSE TO ACCUMULATION OF SEVERAL METALS AND METALLOIDS BY Salix spp. , Brassica juncea, Phragmites australis AND Populus trichocarpa Direttore della Scuola : Ch.mo Prof. MARIO ARISTIDE LENZI Coordinatore d’indirizzo: Ch.mo Prof. TOMMASO ANFODILLO Supervisore :Ch.mo Prof. MARIO MALAGOLI Dottorando : MARCO PITTARELLO
Transcript of EVALUATION OF PHYTOREMEDIATION POTENTIAL AND PHISIOLOGICAL

1
Sede Amministrativa: Università degli Studi di Padova
Dipartimento di Biotecnologie Agrarie
SCUOLA DI DOTTORATO DI RICERCA IN : TERRITORIO, AMBIENTE, RISORSE E SALUTE
INDIRIZZO: ECOLOGIA
CICLO XXII
EVALUATION OF PHYTOREMEDIATION POTENTIAL AND PHISIOLOGICAL
RESPONSE TO ACCUMULATION OF SEVERAL METALS AND METALLOIDS BY
Salix spp. , Brassica juncea, Phragmites australis AND Populus trichocarpa
Direttore della Scuola : Ch.mo Prof. MARIO ARISTIDE LENZI
Coordinatore d’indirizzo: Ch.mo Prof. TOMMASO ANFODILLO
Supervisore :Ch.mo Prof. MARIO MALAGOLI
Dottorando : MARCO PITTARELLO

2
Contents
INTRODUCTION ............................................................................................................................................ 5
PHYTOREMEDIATION TRIALS ON POLLUTED SLUDGE DREDGED FROM MARGHERA HARBOR ................ 6
INTRODUCTION ......................................................................................................................................... 6
MATERIALS AND METHODS ...................................................................................................................... 8
GREENHOUSE AND OUTDOOR TRIALS .................................................................................................. 8
GROWTH CHAMBER TRIALS ................................................................................................................ 11
RESULTS .................................................................................................................................................. 15
FIGURES ................................................................................................................................................... 22
BIBLIOGRAPHY ........................................................................................................................................ 35
Comparison of the ability of two species of Astragalus, Se hyperaccumulator A. racemosus and non-
accumulator A. convallarius to accumulating several others metals and metalloids ............................ 40
INTRODUCTION ....................................................................................................................................... 40
MATHERIAL AND METHODS ................................................................................................................... 48
RESULTS AND DISCUSSION...................................................................................................................... 49
Selenium (Se) ...................................................................................................................................... 49
Chromium (Cr) ..................................................................................................................................... 49
Tellurium (Te) ...................................................................................................................................... 50
Arsenic (As) ......................................................................................................................................... 50
Nickel (Ni) ............................................................................................................................................ 50
Vanadium (V) ...................................................................................................................................... 51
Tungsten (W) ....................................................................................................................................... 51
Molybdenum (Mo) .............................................................................................................................. 51
FIGURES ................................................................................................................................................... 52
BIBLIOGRAPHY ........................................................................................................................................ 58
A LIKELY ROLE OF SELENIUM ON DROUGHT STRESS TOLERANCE IN BRASSICA JUNCEA AND STANLEYA
PINNATA ..................................................................................................................................................... 69
INTRODUCTION ....................................................................................................................................... 69

3
MATERIALS AND METHODS .................................................................................................................... 70
Drought stress simulation in hydroponics .......................................................................................... 70
Drought stress simulation in agargel .................................................................................................. 71
Experiment with Stanleya pinnata in green house ............................................................................. 71
Stanleya pinnata detached leaves ...................................................................................................... 72
RESULTS .................................................................................................................................................. 72
Drought stress simulation in hydroponic ............................................................................................ 72
Drought stress simulation in agargel .................................................................................................. 73
Drought stress applied to Stanleya pinnata in green house ............................................................... 73
Stanleya pinnata detached leaves ...................................................................................................... 73
DISCUSSION ............................................................................................................................................. 73
FIGURES ................................................................................................................................................... 74
BIBLIOGRAPHY ........................................................................................................................................ 84
Interaction of selenate and molybdate with the transport and assimilation of sulfate in B. juncea L.
Czern. .......................................................................................................................................................... 86
INTRODUCTION ....................................................................................................................................... 86
MATERIALS AND METHODS .................................................................................................................... 88
Plant material ...................................................................................................................................... 88
Elemental analysis ............................................................................................................................... 89
Sulfate content .................................................................................................................................... 89
Sulfate uptake ..................................................................................................................................... 89
Semi-quantitative RT-PCR ................................................................................................................... 90
Statistical Analysis ............................................................................................................................... 91
RESULTS .................................................................................................................................................. 91
Plant growth ........................................................................................................................................ 91
Accumulation of Se, Mo, S and sulfate in plant tissues ...................................................................... 91
Effects of Se and Mo on sulfate uptake .............................................................................................. 92
Effect of selenate, molybdate and sulfate on the transcript levels of BjSultr2;1, SBP1 and MOT1. .. 92
Effects of Se and Mo on S-containing compounds ............................................................................. 93
DISCUSSION ............................................................................................................................................. 93
FIGURES ................................................................................................................................................... 97
TABLES ................................................................................................................................................... 101

4
BIBLIOGRAPHY ...................................................................................................................................... 104
COPPER HOMEOSTASIS IN Populus trichocarpa ..................................................................................... 109
INTRODUCTION ..................................................................................................................................... 109
Role of Copper in plants. ................................................................................................................... 109
Copper proteins ................................................................................................................................ 109
miRNA ............................................................................................................................................... 110
Targets .............................................................................................................................................. 111
MATERIALS AND METHODS .................................................................................................................. 111
Poplar’s propagation ......................................................................................................................... 111
Poplar proteins extraction ................................................................................................................ 112
Bradford protein assay ...................................................................................................................... 112
Western blot ..................................................................................................................................... 112
Native gel .......................................................................................................................................... 113
Poplar RNA extraction ....................................................................................................................... 113
DNAse treatment .............................................................................................................................. 113
RNA quantification ............................................................................................................................ 113
RT PCR of Laccases DNA .................................................................................................................... 114
PCR of Laccases DNA ......................................................................................................................... 114
Primer ................................................................................................................................................ 114
RESULTS AND DISCUSSION.................................................................................................................... 115
FIGURES ................................................................................................................................................. 116
BIBLIOGRAPHY ...................................................................................................................................... 118
THANKS TO ............................................................................................................................................ 122

5
INTRODUCTION
Phytoremediation is defined as the use of green plants to remove pollutants from the
environment or to render them harmless (Cunningham et al.,1993, Raskin et al.,1994).
The basic idea that plants can be used for environmental remediation is very old and cannot be
traced to any particular source. However, a series of fascinating scientific discoveries combined
with an interdisciplinary research approach have allowed the development of this idea into a
promising, cost-effective, and environmentally friendly technology. Phytoremediation can be
applied to both organic and inorganic pollutants, present in solid substrates (e.g. soil), liquid
substrates (e.g.water), and the air. Phytoremediation is currently divided into the following
areas:
phytoextraction: the use of pollutant-accumulating plants to remove metals or organics from soil
by concentrating them in the harvestable parts;
phytodegradation: the use of plants and associated microorganisms to degrade organic pollutants;
rhizofiltration: the use of plant roots to absorb and adsorb pollutants, mainly metals, from water
and aqueous waste streams;
phytostabilization: the use of plants to reduce the bioavailability of pollutants in the
environment;
phytovolatilization: the use of plants to volatilize pollutants; and the use of plants to remove
pollutants from air.
Phytoremediation of metals is being developed as a potential cost-effective remediation solution
for thousands of contaminated sites all around the world. Its development is driven by the
prohibitively high cost of the available soil remediation methods, which mainly involve soil
removal and burial at a price of about $1 million per acre.

6
PHYTOREMEDIATION TRIALS ON POLLUTED SLUDGE
DREDGED FROM MARGHERA HARBOR
INTRODUCTION
The effectiveness of phytoremediation has been demonstrated for many classes of pollutants, like
oil hydrocarbons, polycyclic aromatic hydrocarbons (PAH), pesticides, chlorinated solvents, and
heavy metals (Aprill and Sims 1990; Anderson et al. 1994; Newman et al. 1997; Salt et al. 1997;
Chang and Corapcioglu 1998; EPA 2000; Nedunuri et al. 2000; Pivetz 2001; Schnoor 2002).
At low levels of soil pollution, phytoremediation can be the most cost-effective reclamation
strategy (Jones 1991), particularly for long term treatments. Phytoextraction is one of the
phytoremediation techniques that uses plants able to accumulate concentrations of metals from
contaminated soil in their biomass, distinguishing between hyperaccumulating species (Kumar et
al. 1995; Blaylock et al. 1997) and species with a high biomass production (Bregante et al.
2001).
Phytoextraction could also be an effective solution for the treatment of dredged sediments. The
contamination of sediments from the dredging of rivers or coastal harbours represents a problem
that has assumed a notable importance in terms of the number of cases and the quantitative and
economic extent of the necessary activities of restoration (Mulligan et al. 2001; Lors et al. 2004;
Meers et al. 2005). Due to the high quantities of sediments to be treated every year and the high
costs of traditional reclamation techniques, the conventional treatments of the sediments are not
in most cases economically sustainable (Meers et al. 2003) and phytoremediation techniques
could play an important role in these situations. Nevertheless, sediments, and particularly marine
sediments, have poor hydraulic and agronomic characteristics, so that mixing with selected
materials is probably the only way to make phytoextraction an effective remediation technique.
In Marghera harbor, inside Venice lagoon there is one of most important Italian chemical pole.
During last decades many kind of organic and non organic pollutants were dropped off onto
lagoon heavily polluting sediments. These had to be dredged in a final amount of 8 milions of
tons and classified as ―C‖ kind that means they are unable to host crops or to be used in civil
constructions. A possible solution for their remediation is phytoremediation.
In this work we were focused on seeking not only good heavy metals accumulators but also fast
high biomass producer species. Recently, driving forces behind the development of
phytoextraction have been giving emphasis on a link with short-rotation coppice (Mirck et al.,
2005; Kuzovkina and Quigley, 2005; Pulford and Dickinson, 2005). For phytoextraction
purposes, high-biomass plants with large metal concentration in shoots and high bioaccumulation
factors are required (BF = ratio of metal concentration in shoots to metal concentrations in soils).

7
Salix matsudana, S. fragilis, S. babylonica, S. alba, Phragmites australis and Brassica juncea
satisfy these characteristics and over that, they are tipical of Italian environment (or at last
established in it since a long time), and easy to be recruited , propagated and harvested.
The Salicaceae family comprises a large number of woody, high-biomass species (Pulford and
Dickinson, 2005). Some willow and poplar species have been proposed for use in remediation
(Robinson et al., 2003) of contaminated land as they showed high metal tolerance and
accumulation potential in screenings, field (Eltrop et al., 1991; Hammer et al., 2003; Klang-
Westin and Eriksson, 2003; etc.) and pot experiments (Granel et al., 2002; Rosselli et al., 2003;
Vyslouzˇilová et al., 2003). Advantages of trees include deep rooting and the establishment of
continuous vegetation cover, resulting in site stabilization, reduced risk of erosion and leaching
of contaminants, and metal extraction from deeper soil layers (Wenzel et al., 1999).
Phragmites australis is not hyperaccumulator; however, it is fast growing and high-biomass
producer, has a deep root apparatus and can tolerate and/or accumulate a range of heavy metals
in its aerial portion. Given this, it is often utilized to reduce the metal concentration of soils,
sediments and waters, in both natural and constructed wetlands (Cooper et al., 1996). Several
works report higher accumulation of heavy metals in the belowground parts of plants than in the
aerial parts (Karpiscak et al., 2001;, Stoltz et al., 2002, Peverly et al.,1995,Mays et al., 2001).
However, in the current study the content of Cr, Ni, Cu and Zn in rhizomes and stems of P.
australis plants was almost similar. The relatively low accumulation of heavy metals in foliar
tissues at most sampling times was probably due to the need of plants to prevent toxicity to the
photosynthetic apparatus as suggested by other authors (Bragato et al., 2006, Stoltz et al., 2002.,
Landberg et al.,1996). However, heavy metal accumulation in leaves increased considerably
during fall. It may be inferred that plants possess an efficient root-to-shoot translocation system,
which is activated at the end of the growing season and allows the concentration of toxic elements
in the senescent tissues. In this way, plants can eliminate heavy metals through phylloptosis
(Bragato et al., 2009).
Brassica juncea (Indian mustard) has been widely used in phytoremediation. This species is able
to take up and accumulate in its aboveground tissues appreciable quantities of heavy metals like
cadmium, copper, nickel, zinc, lead, hexavalent chromium, and selenium (Dushenkov et al.,
1995; Bañuelos et al., 2005; Le Duc and Terry, 2005).
In order to increase the efficiency of process two chelant agents were tested : EDTA coupled
with phragmites australis and EDDS coupled with S. babylonica. In indoor trials, willows grew
coupled with paspalum vaginatum, a northern American salt tolerant grass, already experimented
by Masciandaro (2008) to evaluate its tolerance to EDTA. In our experiment its ability in Na
accumulation and tolerance to EDDS were verified.
Ethylenediamine tetraacetate (EDTA) is probably the most efficient chelating agent in increasing
the solubility of heavy metals in soil solution and thus in plant tissues (Blaylock et al., 1997;
Huang et al., 1997; Ebbs et al., 1997; Wu et al., 1999). However, most syntethic chelators form
chemically and microbiologically stable complexes with heavy metals that can contaminate

8
groundwater (Alder et al., 1990; Satroutdinov et al., 2000) . those complexes have high stability
constants that are degraded slowly and, as demonstrated, they are relatively stable from a
biological point of view, even under conditions favorable to biodegradation (Hong et al., 1999 ;
Bucheli-Witschel et al., 2001). For these reasons, taking EDTA as a reference for its
performances, we tested EDDS that is a structural isomer of EDTA and has two chiral carbon
atoms and three stereoisomers (Vandevivere et al., 2001). Among them, only the (S,S) isomer is
readily biodegradable. EDDS has the potential to be a substitute of EDTA in chelant-assisted
phytoextraction as it is a strong chelators and, unlike EDTA, it is easily biodegradable. Indeed,
mineralization of EDDS in sludge-amended soil was completed in 28 d with a calculated half-life
of 2.5 d (Jaworska et al., 1999). In addition, several metal- EDDS complexes are readily
biodegradable (Vandevivere et al., 2001).
MATERIALS AND METHODS
GREENHOUSE AND OUTDOOR TRIALS
Salix spp. At the end of March 2007, branches of S. matsudana, S. alba, S. fragilis and S. babylonica, one
or two years old were were chosen in order to obtain several cuttings 10 cm long, with a
minimum of 3 buds and with an homogeneous diameter. Leaves were immediately cut off to
limit water loss and branches were enveloped in aluminum foil and transported to lab into a
plastic bag.
Only cuttings with diameter between 3.5 and 5 mm were selected. Each cutting was enveloped in
a parafilm ring at the first third of own highness to avoid the submersion of 2 of 3 buds at least.
Several 3 L plastic beckers were filled up with 2.5 L of tap water and enveloped with aluminum
foil; on the top of each beacker a gummy circular module with open bottom was inserted in order
to contain an aluminum little basin (tipically used for food preservation ). Each basin was
inserted and locked into the gummy module. With scissors 13 holes in the bottom of aluminum
basin were done (four for each larger side, two for each short side and one in the center of basin
to guarantee the right distance between cuttings). In each hole a cutting was placed and inserted
at the depth allowed by parafilm ring. All the beakers with cuttings were left in the dark for a
week to make easier root building up. Once root germination happened, tap water was replaced
by modified Hoagland nutrient solution (deionized water plus KH2PO4 40µM, KNO3 200 µM,
Ca(NO3)2*4H2O 200 µM, KCl 200 µM, CaCl2*2H2O 200 µM, MgSO4*7H2O 200 µM, H3BO3
4.6 µM, MnCl2*4H2O 0.9 µM, CuCl2*2H2O 0.036 µM, ZnCl2 0.086 µM, NaMoO4*2H2O 0.011
) and the beackers with cuttings were placed for 10 days in growth chambers settled with this
parameters : Light 16 h, T 25 °C, R.H. 60% ; Dark 8 h, T 18 °C, R.H. 80% ; light intensity : 280
µE/m2/s . In this period Hoagland solution was replaced one time and water oxygenation was

9
guaranteed by bubbles of small air pumps. Then, 15 best rooted cuttings for each species were
gently extracted from basin and placed in a 1 L plastic pot with a universal soil used for house
gardening with this characteristics: pH 5.47, TKN 809 (mg N/Kg dw), NH3 257.14 (mg
NH4+/Kg dw), TOC 7.4 (% of dw) Cl
- 707.4 (mg/Kg dw), P tot 660.5 (mg/Kg dw). Plants were
let grow for 2 more weeks.
Polluted substrate preparation : the experimental substrate was prepared by mixing sediments of
Venice lagoon with river sand (1:1 volume). The sediments were digged out from different sites
in the ―oil channel‖, a large channel connecting open sea with the chemical industrial pole of
Marghera Harbor, which is crossed daily by oil carrier ships. Mean characteristics of the
sediment are : pH 8.47, TKN 687.8 mg N/ Kg dw, NH4+
108.8 mg/Kg dw, TOC < 1 (% of dw), P
tot 1670 (mg/Kg dw). The substrate was left to dry for a week on a plastic groundsheet on the
floor of greenhouse. The substrate was then characterized: pH 8.16, TKN 34 mg/ Kg dw, NH4+
29 mg/Kg dw, TOC 10.2 (% of dw), P tot 180 mg/Kg dw. After that, eleven 50 L plastic tanks
were prepared as follows: a flexible plastic tube 50 cm long was connected to the bottom of the
tank. The tube was placed to stay bent avoiding water loss between two water sampling or
drainage . In the inner side of tube link a sackcloth filter was put to protect the tube from
clogging. The tank bottom was covered until the tube hole with a 10 cm thick layer of expanded
clay to ameliorate water drainage ; then tanks were filled up with 35 L of mixed substrate.
Willows planting : initially five individuals for each species were placed on tanks with naked
roots. Although cuttings were very gently manipulated, tey quickly died, likely due to the direct
contact with salt and pollutants plus the transplanting shock. A second series of plants were
planted with soil bulk to avoid transplanting shock and allow an acclimation of root system. This
trick permitted the surviving of S. matsudana only, and after a week, 9 more S. matsudana plants
were placed in two tanks to have a total of 14, seven for each tank. In the same period 6 S.
matsudana plants were transplanted in six 4 L pots with universal soil as controls. Indeed, the
characteristics of the soil are different from the mixed substrate, but it was thought to have an
idea of the normal development of a S. matsudana plants in comparison with stressfull growth
conditions.
Willows growth : plants were left on tanks from the end of May, until the end of vegetative
season (Mid-October). For the first 30 days tanks remained in a greenhouse, then, they were put
outdoor under a gazebo, covered on the top with a transparent plastic large sheet to avoid an
oversupply of rainy water. Modified Hoagland nutrient solution (0.5L) + tap water (0.5L) were
added once a week for each tank . During summer regular weed killing action was done around
tanks to limit danger of pest infestation and one time plants were treated successfully against
young grasshoppers invasion.
Water sampling was done four times : the first one just before plants placement, then in July,
August and September.
Willows harvesting : seven (of the starting 14) plants survived and at Mid-October were
harvested with the six control plants. Root system was gently extracted and gently washed firstly
twith tap water to remove the major part of substrate and then with deionized water for a fine

10
clean up. Roots and leaves were separated from stems and fresh weights were recorded for each
plant. Then leaves, stems and roots were put in oven for 48 h at 105 °C and dry weights were
recorded. All samples were ground with a pestle in liquid nitrogen. The samples were digested in
nitric and chloridric acid on heating plate and. analyzed with ICP-AES method to detect
concentration of Cd, Zn, Pb, Ni, Cu and Na. Analysis of each sample was repeated three times.
Phragmites australis
Thirty P. australis stems with rhizomes and thin roots were collected during March 2007 in the
Ca‘ di Mezzo wetland close to the town of Codevigo, Padova, Italy. The rhizomes were collected
with some muddy soil to maintain their moisture and put in a sealed plastic bag to transport them
to the greenhouse. Once in greenhouse rhizomes were washed with tap water and planted into
two tanks (ten for each tank) filled up with the mixed subtrate sand-sediment. Ten plants were
planted in a third tank filled up with universal soil as control. Phragmites plants, differently
from Salix spp. tolerated the direct contact with new substrate. After two months, the tanks were
put under gazebo (as described above for willow plants).
Polluted substrate preparation : substrate and its preparation are the same described for willows.
Phragmites growth : during the experiment, once a week 0.5 L of modified Hoagland nutrient
solution and twice a week 0.5 L of tap water were added to each tank. The control plants were
supplied with the same volume of tap water only. The aim of this constant water supply was to
reproduce as much as possible the conditions of soil saturation, typical of Phragmites
environment. In July, once plants health conditions were considered enough stabile (increasing
biomass production, absence of pests and chlorosis ), in one tank 1 mmol/Kg dw of Ethilene
Diammine Tetracetic Acid (EDTA) was added. EDTA was added in two times after a week
without irrigation to favorite its absorption by rhizomes. During each addiction it was diluted in
100 ml of deionized water.
Water sampling were taken once before EDTA addiction, and in August, September October and
November at the end of experiment. Only data of July, October and November were reported
because no significant changes in metals concentrations happened between July and August.
Every water sample was collected in a 50 ml falcon tube, then filtered and analyzed with ICP-
AES method to detect concentration of Cd, Zn, Pb, Ni, Cu and Na.
Phragmites harvesting : two intermediate biomass samplings were done (1 in September and 1 in
October) to detect variations in heavy metals and Na concentration in Phragmites stems (not for
control), since Phragmites plants are known to transfer from roots to shoots potential toxic
elements absorbed during the vegetative season . In November all stems and rhizomes were
harvested and cleaned up two times with tap water to remove biggest pieces of substrate and then
with deionized water for a fine clean up. Rhizomes and shoots were separated and fresh weights
were recorded for each individual. Then, shoots and roots were left in oven for 48 h at 105 °C
and dry weights were recorded. All samples were ground with a pestle in liquid nitrogen. About
two grams of samples were digested in nitric and chloridric acid on heating plate and were

11
digested by Milestone Ethos 1600 microwave mineralizer. The samples were analyzed with ICP-
AES method to detect concentration of Cd, Zn, Pb, Ni, Cu and Na. Analysis of each sample was
repeated three times.
Brassica juncea
In April 2007 seeds of Brassica juncea cv.PI 426314 were planted in 0.1 L plastic pots filled up
with universal soil (1 seed per pot) and left in greehouse. After germinations, seedlings 10 days
old were transplanted in 0.5 L pots and after 2 weeks 30 plants (15 per tank) were transplanted
with own bulk soil into the experimental substrate to minimize the double shock of transplanting
and direct contact with the salty substrate. Remaining 10 plants were transplanted in 1 L pots
(one per pot) with universal soil as control and supplied with tap water.
Polluted substrate preparation : substrate and its preparation are the same described above.
Brassica growth : plants were supplied with 0.25 L of modified Hoagland nutrient solution (as
described above) two times a week in a range between 0.25 and 0.5 L for each tanks, depending
on temperature variations.. The survival of plant wasn‘t homogeneous (11 in one tank and 4 in
the second one). .
Water sampling and drainage : because the high water retaining of substrate, and probably a
partial blockage of filter we were not able to make a regular and sufficient water sampling for
ICP analysis.
Brassica harvesting : all Indian mustards survived were harvested the last week of July, after a
life cycle of almost 3 months. Roots were washed two times with tap water and with deionized
water then separated from shoots. Roots and shoots were put in oven for 48 h at 105 °C, and dry
weights were recorded. All samples were ground with a pestle in liquid nitrogen. Two grams or
more samples were digested in nitric and chloridric acid on heating plate, smaller than 2 grams
samples like roots, were digested by Milestone Ethos 1600 microwave mineralizer. The samples
were analyzed with ICP-AES method to detect concentration of Cd, Zn, Pb, Ni, Cu and Na.
Analysis of each sample was repeated three times
GROWTH CHAMBER TRIALS
Willows hydroponic trial
Willows growth : Sampling and growing of Salix matsudana, fragilis, alba and babylonica were
the same for greenhouse and growth chamber trials, until roots germination with tap water in
dark room. For each species four beackers with 13 cuttings for each one were prepared. After
root germination, beackers were placed in growth chamber settled with the following parameters
: Light 16 h, T 25 °C, R.H. 60% ; Dark 8 h, T 18 °C, R.H. 80%. During the entire period of the

12
experiment in growth chamber, nutrients and oxygen supply were guaranteed respectively by
modified Hoagland nutrient solution, weekly replaced, and small air pumps. At the beginning of
the second week in growth chamber, experiment started.
Treatments : based on water sampling at the beginning of greenhouse trial, the concentration in
hydroponic solution of five ions (Cd, Zn, Pb, Ni, Cu) four beackers (one for each species) was :
Cd 0.1 µM as CdCl2 , Zn 0.5 µM as ZnCl2 , Cu 1 µM as CuSO4*5H2O , Pb 0.1 µM as Pb(NO3)2 ,
Ni 0.1 µM as Cl2Ni*6H2O. Four more beackers were kept as control and, since the third week of
experiment, other four beackers, previously supplied with metals cocktail, were added with
NaCl 0.05 M. NaCl concentration was increased week by week from 0.05 to 0.1 to 0.2 M, in
order to approach Na concentration detected in water collected from tanks avoiding at the same
time, to use immediately a lethal saline concentration for plants. Increasing NaCl concentration
brought plants to death 3 weeks before end of experiment.
Willows harvesting : after two months, ( 7 weeks for NaCl treated plants), willow plants were
harvested. Fresh weight of leaves, stems and roots and maximum root length were recorded. All
tissues were dried in oven for 48 h at 105 °C , then dry weights were recorded. The tissue
accumulation of Cd, Zn, Pb, Ni, Cu and Na was analyzed as described above. Analysis for each
sample was repeated three times.
Brassica juncea hydroponic trial
Brassica growth : Seeds (cv.PI 426314 ), collected from plants previously grown in greenhouse
were put in a 15 ml tube to be sterilized by 1 minute in ethanol 70% and 30 minute in bleach
30%. After that, seeds were cleaned up from bleach by five 10 minutes long washes in sterile
deionized water; during each wash tubes were put on the rocker to be gently shaked. Between
each wash, water was replaced under sterile hood. Then sterilized seeds were put in big glass
magenta boxes (50 -60 per box) under sterile hood using sterile forceps. The medium was agar
added with MS salts and vitamins MS 5519. The medium was prepared as follows : (250 ml per
box), 4.46 g/L of MS (M5519, Sigma)+ 30 g/L of sucrose + some distilled water. After all is
dissolved, pH was brought to 5.8 with diluted KOH . Than solution was brought to final volume
with distilled water. Agar gel 4 g/ L was added and the mixture put in glass boxes and then in
autoclave for 21 minutes, then boxes were put under hood to cool down to ~ 55 °C . Boxes were
put in growth chambers for 5 days; the cap was sealed with plastic foil and covered with
aluminum foil. Seven 3 L plastic beckers were filled up with 2.5 L of deionized water plus
modified Hoagland nutrient solution (as described above for willows) and a gummy circular
module was put on the top of each becker; In each module a metallic grid (light diameter = 2
mm) was inserted. Brassica seedlings were gently extracted from agar gel and, after a quick root
washing in deionized water, placed into each of seven grids with roots submerged and shoots
over the grid surface. All beackers were put into grow chamber (settled as described for
willows). Brassica seedlings were let to grow for a week.

13
Treatments : One beacker was filled up again with 2.5 L of deionized water plus modified
Hoagland nutrient solution (as described above for willows) and kept as control, two beckers
with Hoagland solution plus 1x metal cocktail (as described for willows), two beackers with
Hoagland nutrient solution plus 1x metals cocktail and NaCl 0.05 M. Experiment was 45 days
long. Nutrients and metals were replaced weekly and water was continuously oxygenated by air
pumps. NaCl concentration in metals plus NaCl treated beckers was increased week by week
from 0.05 to 0.1 to 0.2 M, in order to approach Na concentration detected in water collected from
tanks avoiding at the same time, to use immediately a lethal saline concentration for plants.
Increasing NaCl concentration brought plants to death 2 weeks before the end of experiment.
Brassicas harvesting : seedlings in control and metals added beackers were harvested after 45
days while only after 30 days the seedlings treated with metals and NaCl were harvested. Total
fresh biomass of shoots and roots for each treatment was recorded. After 48 h at 105 °C , shoot
and roots dry weights were recorded. Samples were digested by Milestone Ethos 1600
microwave mineralizer. The samples were analyzed with ICP-AES method to detect
concentration of Cd, Zn, Pb, Ni, Cu and Na. Analysis of each sample was repeated three times.
Willows on sludge trial
Cuttings collection and growth : this steps were carried on exactly as described above for
hydroponics and greenhouse trials. After hydroponic step (one week in the dark and ten days in
growth chamber with modified Hoagland solution), 15 willows were transferred on polluted
substrate.
Polluted substrate preparation : five 20 L plastic tanks were prepared removing the top with a
knife and adding a sackcloth filter (to protect the tube from clogging) in the inner side of tap,
placed in the bottom of one of shorter sides. From the bottom, tanks were filled up with a 7 cm
thick layer of fine gravel to ameliorate water drainage, 20 cm of polluted sludge mixed with sand
as described above and on surface, with a 6 cm thick layer of the same universal soil used to
grow willows and place them on sludge for greenhouse trial.
Willows planting : In each tank three willow plants were planted. One species per tank (S.
matsudana, S. alba, S. fragilis and S. babylonica). Salix Babylonica was planted in two tanks in
order to evaluate its uptake performances also with help of Ethylenediamine disuccinic acid
(EDDS). Willows were placed as a row in the middle of tank, surrounded by 8 plants of
Paspalum vaginatum planted with their 12 cm3 of universal soil. Before planting, fresh weight of
each willow was recorded to compare it with final biomass increase at the end of experiment.
Willows growth : experiment was 50 days long. Once a week plants were supplied with 150 ml
of modified Hoagland nutrient solution composed as described above. One week after planting, 3
mmol/Kg d.w. of EDDS (100ml with 30% of water) were addicted to fifth tank with second
group of Salix Babylonica.

14
Water sampling : at the end of the second, fourth and sixth week, 50 ml of drained water were
collected from each tank tap. Samples were filtered and analyzed with ICP-AES method to
detect concentration of Cd, Zn, Pb, Ni, Cu and Na. Analysis of each sample was repeated three
times.
Willows and Paspalum harvesting : After fifty days willows and Paspalum were harvested.
Fresh weight of roots, leaves and stems was recorded. All paspalum biomass was divided in
shoots and roots without distinctions between individual plants. Roots were washed two times
with tap water and deionized water. All tissues were dried in oven for 48 h at 105 °C , then dry
weights were recorded. All samples were ground with a pestle in liquid nitrogen. concentration
of Cd, Zn, Pb, Ni, Cu and Na for willows and Na only for Paspalum. Analysis of each sample
was repeated three times.
Willows root system deepening trial
Cuttings collection and growth : steps were carried on exactly as described above for
hydroponics and greenhouse trials.
Polluted substrate preparation : twenty four 2 L plastic bottles were deprived of the top with a
razor blade and a tap was added closest to bottom to drain exceeding water. Sixteen of this
bottle were filled up, from the bottom with a 4 cm thick layer of fine gravel to allow water
drainage, 20 cm of sludge mixed with sand and on the top, 4 cm of same universal soil used in
previous experiments. Other eight bottles were filled up with fine gravel, 20 cm thick layer of
soil from Experimental Farm and 4 cm of universal soil. These bottles were used as control. All
bottles were enveloped with aluminum foil against light stress for external roots.
Willows planting : one willow was planted in each bottle. For each species three willows were
planted on sludge and three on bottles kept as ―control‖.
Willows growth : bottles were left in growth chamber (settled as described above) for 50 days.
Once a week they were supplied with 50 ml of modified Hoagland nutrient solution. To avoid
water accumulation on surface, every ten days a drainage of 20-30 ml was done.
Willows harvesting : after 50 days, willows stems were harvested, leaving root system in the
bottle. After fresh weight recording, leaves and stems were put in oven at 105 °C for 48 h, then
dry weights were recorded. Bottles with substrate and root systems were put in freezer at – 20 °C
for 3 days. After freezing , bottles were sawed in four parts : the first corresponding to universal
soil layer, the second one to the more narrow bottle section filled up with sludge (from 6 to 16
cm of depth), the third to the larger section of bottle filled up with sludge (from 16 to 26 cm of
depth) and the fourth corresponding to gravel. The last section was always immediately
discarded because never explored by roots; other parts of bottle were separated from external
plastic layer, then roots, with water, were gently separated from substrate in the sink, being
careful to maintain intact as more as possible the root system, using a basin to avoid polluted
sludge dispersion. Once cleaned up, each part of root system, corresponding to a section of bottle
was put on a transparent glass with a thin layer of water and scanned by Amersham image

15
scanner. Images captured were analyzed with Image capturer and analyzer KS 300 (ZEISS-
Germany) to evaluate total root length of each layer and root diameter. After that, fresh weight
and, after 48 h in oven at 105 °C, dry weight of roots were recorded.
Statistical analysis For all experiments described, one –way ANOVA and T-TEST were performed by SPSS 17.0.
Post hoc analysis were performed with SNK test P > 0.05.
RESULTS
Willows
Some authors, comparing hydroponic results with field/pot trial results underline the
inconsistency of first one because performances in accumulations don‘t reflect real performances
in soil and over that, performances change widely, depending on kind of soil (Dos Santos &
Wenzel 2006 ). Starting from these considerations , we wanted in this work compare hydroponic
and pot trials (indoor and outdoor) to evaluate real Salix spp ability in metal accumulation and
surviving in soil characterized by high salinity. We focused on available ions contained in soil
solution to evaluate the real effectiveness of phytoextraction in this specific conditions without
paying attention to possible maximum remediation potential of species considered that are
already reported in literature. Outdoor trial was carried on with S. matsudana only because of the
quick death of other three species of willows.
Cadmium : (Fig 1, ) hydroponic trial shows that in leaves, Cd-accumulation of S. fragilis is the
most affected by Na accumulation, although concentration of this one in this tissue is the lowest
of the group. Other three species shows similar Cd concentration in high salinity conditions,
resulting less affected in Cd accumulation by Na. Trial in grow chamber in soil (Fig 4 ) shows
data similar to Hoagland plus metal plus Na treatment in hydroponic, that means for Cd
hydroponic has simulated pretty reliably conditions in soil solution. Cd concentrations in leaves
are pretty low like in hydroponic. The unique significant difference is shown by S. fragilis that
seems less affected by salinity in soil than in hydroponic.
In the stems of plants grown in hydroponic (Fig 2 PUO‘ ), no significant differences were
observed between presence and absence of Na for S. fragilis and S. babylonica , that are best
performers in Cd accumulation, while S. alba accumulated in stem roughly 5 times more Na than
in S. matsudana, fragilis and babylonica. Trial in soil (FIG 5) showed that there are no
significant differences in accumulation between S. alba, fragilis, babylonica and babylonica
EDDS- addicted. Only S. matsudana showed significantly lower level than the other ones.
Hydroponic and soil trials shows similar Cd concentration values.
In roots of all species, grown in hydroponics (3) showed Cd uptake was heavily reduced by the
presence of Na; also, every species showed similar concentrations of Cd when grown in presence
of Na, except for S. fragilis. In soil trial, S. matsudana showed the lowest Cd concentration,

16
while the other three species showed similar values. In general Cd accumulation in root was
similar in hydroponic and soil trial.
S. matsudana in outdoor trial (fig 7) shows very similar values in all tissues to matsudana grown
in grow chamber.
Nickel : in hydroponic (Fig 1B) , Ni accumulation in leaves was strongly depleted by Na
presence, except for S. babylonica. In soil trial (Picture 4 Graf B), concentrations are all closest
to zero and even not EDDS could increase performance of babylonica. Two trials shows an
easier Ni accumulation in leaves in favour of hydroponic.
For stems hydroponic (picture 2 B) shows no significant differences and very low
concentrations. We just note only S. babylonica and alba depleted their accumulation in presence
of Sodium. In soil trial too (Picture 5 Graf B) we found very low concentrations (< 0.5 mg/Kg
D.W.) so we can say hydroponic gives back us a good picture of situation.
Roots of plant grown in hydroponic (Fig 3 B) roots do not accumulate, in presence of NaCl,
more than 10 mg/Kg D.W. and values are all similar except for S. fragilis that has concentration
closest to zero. In soil trial (Fig 6 B) concentrations are low and similar to hydroponic except for
S. alba that accumulates almost 50 mg/Kg.
S. matsudana grown outdoor shows concentrations that are an average between hydroponic and
indoor trial in soil. (picture 7)
Copper : hydroponic (Picture 1 D) shows leaf Cu contents, in plus Na treatment, similar for S.
matsudana, alba and babylonica (the last two show Cu accumulation higher than control), while
fragilis is again the more suffering Na interaction. In soil trials (Picture 4 C) leaf contents are
similar for all species and comparable with hydroponic results. In this case EDDS is effective,
enhancing accumulation five time more than not EDDS addicted S. babylonica.
Plants grown in hydroponic (Fig 2 D) show no significant differences in Cu accumulation
between + Na and –Na treatments. S. babylonica shows higher concentration in +Na treatment
(15.5 mg/Kg) although not significantly different from –Na treatment. Plants grown in soil
(Picture 5 C) shows the same Cu accumulation in stems, with results very similar to hydroponic
trial. EDDS enhanced significantly (two times) accumulation in S. babylonica, bringing up
accumulation to a value comparable with +Na treatment in hydroponic.
In roots grown in hydroponic (Picture 3 Graf C) NaCl presence seems to improve significantly
Cu uptake in S. alba (360 mg/Kg) and S. matsudana, while in S. fragilis uptake is depleted and in
babylonica enhancement is not significant. Roots grown in soil (Picture 6 Graf C) shows values
similar to hydroponic treatment without NaCl. EDDS doesn‘t improve accumulation.
In outdoor trial S. matsudana (Picture 7) uptake is two times higher than indoor trial in all
tissues, while comparing it with hydroponic, roots uptake is less than 50%, while translocation to
stems and leaves shows similar behavior.
Lead : plants in hydroponic (Fig 1 C) show leaf concentrations closest to zero in + Na treatments.
In every cases Pb accumulation is very low and severely depleted by NaCl.
In plants grown in soil (Picture 4 Graf D), lead accumulation in leaves resulted completely
absent except for EDDS treated S. babylonica that shows anyway very low concentration (2.5

17
mg/Kg). Considering very low values recorded for hydroponic we can consider them reliable in
comparison with concentrations obtained in soil trial.
Plants in hydroponic show low Pb concentrations in stems (Picture 2 Graf D) with no differences
between + Na and –Na except for S. fragilis in which salt enhanced two times accumulation (5.5
mg/Kg). Values are pretty similar for soil trials (Picture 5 Graf D) and EDDS didn‘t enhance
babylonica accumulation.
In roots grown in hydroponic (Picture 3 Graf D) NaCl enhances strongly Pb uptake (190 mg/Kg
in S. alba) except in S. fragilis in which Pb uptake is anyway low. Behaviour in soil (Picture 6
Graf D) was completely different with a maximum of 8 mg/kg and without effective action by
EDDS.
Outdoor trial (Picture 7) shows a low translocation to stems and leaves and a higher uptake in
roots in comparison with indoor trial while it is lower almost two times than concentration in
hydroponic.
Zinc : in hydroponic (Picture 1 Graf E) leaves show a significantly depleted accumulation in a
range between 20 (alba and babylonica) and 30% (matsudana) while in fragilis accumulation is
severely affected by NaCl (10mg/Kg). In soil trial (Picture 4 Graf E) values are two times higher
except for alba that shows concentration similar to hydroponic and EDDS treated babylonica
increased accumulation 4 times compared with not EDDS addicted babylonica and 5 times
compared with hydroponic that shows generally concentrations half than soil trial.
Plants grown in hydroponic show in stems (Picture 2 Graf E) a slightly depleted accumulation by
Na in fragilis and alba, while in babylonica NaCl enhanced significantly Zn accumulation (130
vs 100 mg/Kg). Stems grown in soil (Picture 5 Graf E) show for babylonica and EDDS-addicted
babylonica concentrations similar to hydroponic (140 mg/Kg) and other species too performed
similar results comparing with hydroponic, but with values half time lower than babylonica.
About roots, in hydroponic (Picture 3 Graf E) only S.fragilis shows a severe depletion in Zn
uptake by NaCl while other species accumulate between 100 and 200 mg/Kg. Similar ranges of
accumulation are shown in roots grown in soil (Picture 6 Graf E). To be underlined is the
difference between matsudana root system in water (100mg/Kg) and in soil (250 mg/Kg). EDDS
doesn‘t act effectively on uptake.
Performances of S. matsudana in outdoor condition (Picture 7) are exactly the same of that ones
in indoor condition and consequently not in according with hydroponic.
Sodium : in hydroponic (Picture 1,2,3, F) S.alba looks like as best Na accumulator and
translocator from roots to leaves. All willows species are carachterized by a very high Na uptake
(until 80000mg/Kg in S. babylonica) except S. fragilis that stay below 2500 mg/Kg. In soil
(Picture 4,5,6) all species uptake and translocated many folds less Na than in hydroponic. While
in hydroponic S. alba was best accumulator and translocator, in soil S. matsudana resulted to
translocate Na to leaves more efficiently than other species.
Although leaf concentration in S. matsudana grown outdoor (Picture 7) are strongly higher
(14000mg/Kg vs 3000 mg/Kg) than indoor ones, we can see the same behavior in translocating a
great amount of Na to leaves.

18
Biometric parameters and accumulation indexes : all willows species tested in hydroponics
suffered a great depletion in fresh biomass (about 60% except for S. fragilis that shows a
depletion of 80% compared with control) caused by excess of NaCl (Picture 8). Root lengths of
S. fragilis and S.babylonica seem lightly suffering Na interaction while S.alba and S.matsudana
show a depletion in root length of 60%.(Fig. 9)
In indoor trials carried on in soil, S. alba shows the greatest dry biomass production and S.
babylonica shows to be negatively affected by EDDS addiction. BF(Bioaccumulation Factor)
and TF (Translocation Factor) suggests that EDDS in S. babylonica is effective regarding
bioaccumulation of Zn and Cu only but it increases translocation to canopy of all elements in all
Salix spp those grown indoor show good BF for Na and Cd while Cu, Ni, Pb and Zn remain
below 1. TF was high (~ 3) only for Na. Dry biomass production is similar to indoor trial.(data
not shown).
Root deepening trial : Salix alba and S. babylonica are less suffering because, as found by
Vamerali et al. 2008 (data not published), root thickness increases with deepening into sludge
layers. Root length shows an opposite behavior so root biomass is the summary of these two
opposite forces. S. matsudana and s. fragilis developed root system mainly in first layer filled up
with house gardening soil while roots was strongly shorter than control in deeper layers of bottle.
At the opposite, S. alba and S. babylonica show a behaviour similar to the control plants. (data
not shown).
S. matsudana is the most suffering because the highest root biomass in first layer and biggest
diameter in third layer coupled with a low biomass production (Fig 12). S. alba seems again the
best performer : its root system was mainly developed in third layer both for length and biomass.
Effects of EDDS on soil solution : chelant agent affects positively metal availability in soil
solution except for Cd and Zn. Na availability seems decreased by EDDS (10000mg/Kg vs 6000
mg/Kg of EDDS treated soil)
Phragmites australis Phragmites was grown only outdoor . As demonstrated by Bragato et al (2006) Phragmites at the
end of grow season excludes from rhizomes toxic elements translocating them to shoots. In this
experiment this behavior is not so clear, probably because of the low uptake of heavy metals.
EDTA affects negatively and significantly only Na accumulation in stems, cutting it off for a
50% since October (Fig 13). In rhizomes (Fig 14) the chelant agent was effective only on
accumulation of Pb and Cu while it reduced Na level considerably (500 mg/Kg vs 3500 mg/Kg).
No differences in fresh and dry biomass production between EDTA and non EDTA addicted
Phragmites plants. No differences are noted in the water leached from different tanks containing
the four willows species. Looking to bioaccumulation factor (Picture 15) it‘s clear how EDTA
causes a severe depletion of Na uptake that in turn allows a better bioaccumulations of heavy
metals although BF never pass the value 1. EDTA enhance translocation factor of Na more than
two times but the result is fake because the lower Na accumulation in rhizomes by EDTA-treated
Phragmites. Behaviour of Zn, Na and Ni in absence of EDTA and that one of Zn, Na and Cd in

19
presence of EDTA are that expected because they shows a regular increase in translocation to
shoots across months.
In soil solution EDTA increase availability only of Zn, although its concentration remains low (4
ppm vs 0.5 ppm) while Na availability was depleted more than two times ( 10000 mg/L vs
22000mg/L).
Brassica juncea
Hydroponic trial carried on for a maximum of 45 days (30 for NaCl treatments) shows no
significant differences in biomass between control, metal added solution and metal + NaCl
solution. In roots Ni and Cd levels were low, both in presence and in absence of Na
(<100mg/Kg) while Pb, Zn and Cu, in presence on Na, suffered a depletion of more than 50%
(Cu ~200mg/Kg ; Zn ~ 125 mg/Kg ; Pb ~400mg/Kg). In stems metals concentration is depleted
of a 50% by presence of Na in nutrient solution, too. Translocation to shoots both in absence and
in presence of Na does never pass ratio 1 and for Cu and Pb is lower than 0.5. Na uptake is
around 35000 mg/Kg in roots and 25000 in shoots.
In soil trial carried on outdoor, uptake of all metals is in average ten times lower than in
hydroponic : less than 20 mg/Kg for all metals considered in roots and less than 6 mg/Kg in
stems. BF in soil is impressive for Na (~25) and good for Cd (>1) while it is less than 1 for all
other metals. TF is higher than 1 only for Na (2.4) and Zn (1.2). (Data not shown)
DISCUSSION
About the general plant capacity of metals accumulation and translocation in high salinity
conditions, the hydroponic experiments give us back a reliable picture of pure phytoextraction
potential in this specific situation. Infact, although Na accumulation is usually ten times higher in
hydroponics than in soil, competition between Na and metals brings to results considered very
similar to that obtained in soil, in the majority of cases. These data allow us to make reliable
considerations on performances of the tested willows species and particularly to see the
differences between ideal remediation potential with the metal concentrations in soil solution and
real effectiveness considering the salinity action.
Considering heavy metals uptake in conditions of low salinity and metals availability reported in
literature(Pulford and Dickinson 2005 ; Dos Santos and Wenzel 2006) we can see toxic
concentrations in roots and aboveground tissues are almost never touched both in hydroponic
plus salt and in soil; the concentrations in aboveground tissues are particularly low, while in
roots, only Cu and Zn for all species and Ni for S. alba reached concentrations that could damage
plant metabolism. Certainly, further investigations can be useful to determine more accurately
the metals interactions, but, in this case, it is pretty clear the main action of sodium in depleting
accumulation performances indirectly by pH increase (pH ~ 8.5) and directly by reducing
biomass production and by competition with metals. Competition acts also in metal translocation

20
and it is clearly detected after EDDS addiction. In S.babylonica, it enhances metal translocation
to stems and mostly to leaves, although does not increase fitoextraction.
Nevertheless, having taken care all details of transplantation of willows in 50 L tanks with their
bulk of house gardening soil, only S. matsudana survived until the end of trial while S.fragilis,
S.babylonica and S.alba died quickly. It should suggest a leading line to select a
phytoremediation plant in situ for these polluted sludge : the main differences between outdoor
trials and indoor trials are the variability of T, humidity, evaporation and hours of light in
outdoor conditions. It is well known that in a soil characterized by high salinity root system
enhances Na concentration locally by both Na ions extrusion and water uptake ( Van Genuchten
1987). This phenomenon could become stronger when in a situation of water deficiency, roots
explore only certain points lowering water potential together with Na concentration increase
(Amato 1991). Considering that soil is already heterogeneous in Na concentration, S. babylonica
seems unable to survive in salty soils (Yangh et al. 2004 ; Kennedy et al., 2003), S. fragilis
needswell drained and aerated soils, and S. alba seems tolerate salinity in field conditions only
when hybridized and S. matsudana, as reported by Zhang 1998 shows high salt tolerance, we can
explane high difficult to keep alive willows in not controlled conditions in which there is
possibility of unexpected water deficiency because quick air and T variation.
Paspalum vaginatum plants showed high tolerance and accumulation of Na together with high
translocation factor. Therefore, it could, become one of possible best choice for Na extraction,
also thanks to the easy harvesting of the aerial part. because its high tolerance to cut and easy
harvesting. Over that, we found it tolerates EDDS addiction like EDTA as proven by
Masciandaro et al., (2008)
Phragmites australis plants seem to tolerate pretty well salinity and its yield and metal
accumulation performaces are not so far from data recorded in not salty wetlands (Bonanno
2009). EDTA addiction does not modify significantly metals uptake and translocation to shoots
but depletes both Na availability and uptake in favour of metal accumulation in roots. Probably
salt tolerance derived not only from the capacity of this species but also from a dilution of soil
solution given by water supply to keep wet soil in order to simulate as much as possible the
original environment of the plant species.
Brassica juncea plants show a completely different behavior between hydroponic and soil trial.
Performances in soil do not leave space for a possible use of Indian mustard on this sludge both
because low biomass production and low metals uptake.
CONCLUSIONS
Looking at the selection of a remediation plant, we are forced to decide if either start
immediately with a slow phytoremediation process because high Na concentration, or focus first
on Na extraction. The second choice appears the most proper, using Paspalum vaginatum as
best Na extractor and S. matsudana, that shows the better ability in Na translocation to shoots

21
and leaves and a good tolerance to drought stress, coupled with a good biomass production.
Since these two species occupy different ecological niches they can be used together. Once Na
concentration has become enough low to allow an effective phytoextraction, Salix babylonica
and S.fragilis, that showed good rates of metal accumulation, and S. alba that showed the best
biomass production and the most tolerant root system in well watered conditions, could be
utilized.
Phragmites australis should be a good solution considering its biomass production and salt
tolerance. Its ability to survive in a wide range of environmental conditions coupled with good
performances in pollutants uptake become it a good candidate in sludge remediation.

22
FIGURES

23

24

25

26

27

28

29

30

31
32

33

34

35
BIBLIOGRAPHY
Alder A.C., Siegrist H, Gujer W. : Behavior of NTA and EDTA in biological wastewater
treatment. Water Res. 24 (1990) 733-742
Amato M. 1991. Spatial distribution and water uptake of roots in structured soils. Ph.D. thesis.
Michigan state University, East Lansing : XIII-204
Anderson, T. A., Guthrie, E. A., & Walton, B. T. (1994). Bioremediation in the rhizosphere.
Environmental Science and Technology, 27, 2630–2636.
Aprill, W., & Sims, R. C. (1990). Evaluation of the use of prairie grasses for stimulating
polycyclic aromatic hydrocarbon treatment in soils. Chemosphere, 20, 253–265.
Bañuelos, G., N. Terry, D.L. LeDuc, E.A.H. Pilon-Smits, and B. Mackey. 2005. Field trial of
transgenic Indian mustard plants shows enhanced phytoremediation of selenium-contaminated
sediment. Environ. Sci. Technol. 39:1771–1777.
Blaylock, M. J., Salt, D. E., Dushenkov, S., Zakharova, O., Gussman, C., Kapulnik, Y., et al.
(1997). Enhanced accumulation of Pb in Indian mustard by soil-applied chelating agents.
Environmental Science and Technology, 31, 860–865.
Bonanno G., Lo Giudice R. Heavy metal bioaccumulation by the organs of Phragmites australis
(common reed) and their potential use as contamination indicators. Ecological Indicators 10
(2010) 639–645
Bragato C., Brix H. and Malagoli M., Accumulation of nutrients and heavy metals in Phragmites
australis (Cav.) Trin. ex Steudel and Bolboschoenus maritimus (L.) Palla in a constructed
wetland of the Venice lagoon watershed, Environ. Poll., 144(3) (2006), 967–975.
Bragato C., Schiavon M, Polese P, Ertani A, Pittarello M, Malagoli M. Seasonal variations of
Cu, Zn, Ni and Cr concentration in Phragmites australis (Cav.) Trin ex steudel in a constructed
wetland of North Italy Desalination 246 (2009) 35–44.
Bregante, M., Paganetto, A., Magistrelli, P., Martella, L., Gambale, F., Sacchi, G. A. et al.
(2001). Un sistema pilota per la fito-decontaminazione di suoli da piombo. ARS, 82
Novembre/Dicembre 2001.
Bucheli-Witschel M., Egli T. : environmental fate and microbial degradation of
aminopolycarboxylic acids, FEMS Microbiol. Rev. 25 (2001) 69-106.
Chang, Y. Y., & Corapcioglu, M. Y. (1998). Plant-enhanced subsurface bioremediation of non
volatile hydrocarbons. ASCE Journal of Environmental Engineering, 124, 162–169.

36
Cooper P.F., Job G.D., Green M.B. and Shutes R.B.E., Reed Beds and Constructed Wetlands
for Wastewater Treatment, WRc Swindom, 1996.
Cunningham SD, Berti WR. 1993. Remediation of contaminated soils with green plants: an
overview. In Vitro Cell. Dev. Biol. 29:207–12
Dos Santos Utmazian M. N. and Wenzel W. W. Cadmium and zinc accumulation in willow and
poplar species grown on polluted soils J. Plant Nutr. Soil Sci. 2007, 170, 265–272
Dushenkov, V., P.B.A.N. Kumar, H. Motto, and I. Raskin. 1995. Rhizofi ltration: Th e use of
plants to remove heavy metals from aqueous streams. Environ. Sci. Technol. 29:1239–1245.
Ebbs S.D., Lasat M.M., Brady D.J. , Cornish J.,Gordon R., Kochian L.V., Phytoextraction of
Cadmium and zinc from contaminated soil. J. Environ. Qual. 26 (1997) 1424-1430.
Eltrop, L., Brown, G., Joachim, O., Brinkmann, K. (1991): Lead tolerance of Betula and Salix in
the mining area of Mechernich/ Germany. Plant Soil 131, 275–285.
EPA(2000). Introduction to Phytoremediation. EPA/600/R-99/107.
Granel, T., Robinson, B., Mills, T., Clothier, B., Green, S., Fung, L. (2002): Cadmium
accumulation by willow clones used for soil conservation, stock fodder, and phytoremediation.
Aust. J. Soil Res. 40, 1331–1337.
Hammer, D., Kayser, A., Keller, C. (2003): Phytoextraction of Cd and Zn with Salix viminalis in
field trials. Soil Use Manage. 19, 187–192.
Hong P.K.A., Banerji S.K. , Regmi T. : Extraction, recovery and biostability of EDTA for
remediation of heavy metal contaminated soil. J. Soil Sediment Contam. 8 (1999) 81-103
Huang J.W., Chen J, Berti W.R., Cunningham S.D. : Phytoremediation of Lead-contaminated
soils : role of synthetic chelates in lead phytoextraction. Environ. Sci. Technol. 31 (1997) 800-
805
Jaworska, J.S., Schowanek, D., Feijtel, T.C.J., 1999. Environmental risk assessment for
trisodium [S,S]-ethylene diamine disuccinate, a biodegradable chelator used in detergent
applications. Chemosphere 38, 3597–3625.
Jones, K. C. (1991). Organic contaminants in the environment. New York, NY: Elsevier Applied
Science.
Karpiscak M.M., Whiteaker L.R., Artiola J.F. and Foster K.E., Nutrient and heavy metal uptake
and storage in constructed wetland systems in Arizona, Wat. Sci. Tech., 44(2001), 455–462.

37
Kennedy A.S.,Ganf G.G., Walker K.F. Does salinity influence the distribution of exotic willows
along the Lower River Murray ?- Marine and freshwater research (2003) 54, 825-831.
Klang-Westin, E., Eriksson, J. (2003): Potential of Salix as phytoextractor for Cd on moderately
contaminated soils. Plant Soil 249,127–137.
Kumar, P. B. A. N., Dushenkov, V., Motto, H., & Raskin, I. (1995). Phytoextraction: the use of
plants to remove heavy metals from soils. Environmental Science and Technology, 29, 1232–
1238.
Kuzovkina, Y. A., Quigley, F. Q. (2005): Willows beyond wetlands: uses of Salix L. species for
environmental projects. Water Air Soil Poll. 162, 183–204.
Landberg T. and Greger M., Differences in uptake and tolerance to heavy metal in Salix from
unpolluted and polluted areas, Appl. Geochem., 11(1996), 175–180.
Le Duc, D.L., and N. Terry. 2005. Phytoremediation of toxic trace elements in soil and water. J.
Ind. Microbiol. Biotechnol. 32:514–520.
Lors, C., Tiffreau, C.,&Laboudigue, A. (2004). Effects of bacterial activities on the release of
heavy metals from contaminated dredged sediments. Chemosphere, 56, 619–630.
Mays P.A. and Edwards G.S., Comparison of heavy metal accumulation in a natural wetland
and constructed wetlands receiving acid mine drainage, Ecol. Eng., 16(2001), 487–500.
Meers, E., Lamsal, S., Vervaeke, P., Hopgood, M., Lust, N., & Tack, F. M. G. (2005).
Availability of heavy metals for uptake by Salix viminalis on a moderately contaminated
dredged sediment disposal site. Environmental Pollution, 137, 354–364.
Meers, E., Vervaeke, P., Tack, F. M. G., Lust, N., Verloo, M., & Lesage, E. (2003). Field trial
experiment: phytoremediation with Salix sp. on a dredged sediment disposal site in Flanders,
Belgium. Remediation Journal, 13, 87–97.
Mirck, J., Isebrands, J. G., Verwijst, T., Ledin, S. (2005): Development of short-rotation willow
coppice systems for environmental purposes in Sweden. Biomass Bioenerg. 28, 219–228.
Mulligan, C. N., Yong, R. N., & Gibbs, B. F. (2001). An evaluation of technologies for the
heavy metal remediation of dredged sediments. Journal of Hazardous Materials, 85, 145–163.
Nedunuri, K. V., Banks, M. K., Schwab, A. P., & Chen, Z. (2000). Evaluation of
phytoremediation for field-scale degradation of total petroleum hydrocarbons. Journal of
Environmental Engineering, 126, 483–490.
Newman, L. A., Strand, S. E., Choe, N., Duffy, J., Ekuan, G., Pivetz, B. E. (2001).
Phytoremediation of contaminated soil and ground water at hazardous waste sites. EPA/540/S-
01/500.

38
Peverly J.H., Surface J.M. and T. Wang, Growth and trace metal absorption by Phragmites
australis in wetlands constructed for landfill leachate treatment, Ecol. Eng., 5(1995), 21–35.
Pulford, I. D., Dickinson, N. M. (2005): Phytoremediation Technologies Using Trees, in Prasad,
M. N. V., Sajwan, K. S., Naidu, R.: Trace elements in the environment. Boca Raton, Lewis,
pp.375–395.
Raskin I, Kumar PBAN, Dushenkov S, Salt DE. 1994. Bioconcentration of heavy metals by
plants. Curr. Opin. Biotechnol. 5:285–90
Robinson, B., Fernandez, J. E., Madejon, P., Maranon, T., Murillo, J. M., Green, S., Clothier, B.
(2003): Phytoextraction: an assessment of biogeochemical and economic viability. Plant Soil
249, 117–125.
Rosselli,W., Keller, C., Boschi, K. (2003): Phytoextraction capacity of trees growing on a metal
contaminated soil. Plant Soil 256, 265–272.
Ruszaj, M., Shurtleff, B. B., Wilmoth, J., Heilman, P., Gordon, M. P. (1997). Uptake and
Biotransformation ofTrichloroethylene by Hybrid Poplars. Environmental Science and
Technology, 31, 1062–1067.
Salt, D. E., Pickering, I. J., Prince, R. C., Gleba, D., Dushenkov, S., Smith, R. D., Raskin, I.
(1997). Metal Accumulation by Aquacultured Seedlings of Indian Mustard. Environmental
Science and Technology, 31, 1636–1644.
Satroutdinov A.D. , Deedhyukhina E.G., Chistyakova, Witschel M., Minkevich I.G. ,Eroshin
V.K. Egli T. : degradation of metal EDTA complexes by resting cells of the bacterial strain DSM
9103, Environ. Sci. Technol. 34 (2000) 1715-1720
Schnoor, J. L. (2002). Phytoremediation of Soil and Groundwater. Technology Evaluation
Report. GWRTAC, TE-02–01.
Stoltz E. and Greger M., Accumulation properties of As, Cd, Cu, Pb and Zn by four wetland
plant species growing on submerged mine tailings, Environ. Exp. Bot., 47(2002), 271–280.
Vandevivere, P., Saveyn, H., Verstraete, W., Feijtel, T.C.J., Schowanek, D., 2001.
Biodegradation of metal-[S,S]-EDDS complexes. Environ. Sci. Technol. 35, 1765–1770.
Van Genuchten M. Th. 1987. A numerical model for water and solute movement in and below
the root zone. Res. Report, US Salinity laboratory, Riverside, CA.

39
Vyslouzˇilová, M., Tlustoš, P., Száková, J., Pavlíková, D. (2003): As, Cd, Pb and Zn uptake by
Salix spp. clones grown in soils enriched by high loads of these elements. Plant Soil Environ. 49,
191–196.
Wenzel, W. W., Lombi, E., Adriano, D. (1999): Biogeochemical Processes in the Rhizosphere:
Role in Phytoremediation of Metal-Polluted Soils, in Prasad, N., Hagemeyer, J. (eds.): Heavy
metal stress in plants – from molecules to ecosystems. Heidelberg, Springer Verlag, pp. 273–
303.
Wu J. Hsu F.C., Cunningham S.D.. Chelate-assisted Pb phytoextraction : Pb availability, uptake
and translocation constraints, Environ. Sci. Technol. 33(1999) 1898-1904.
Yang jiading,Zhao halin,Zhang tonghui Heat and drought tolerance of two willow species, Salix
gordejevii and Salix babylonica: A comparative study. (2004)
Zhang Yujiang , Liu Peng , Yang Dewei , Ma Chenghui , Liu Gang Planting six tree species
on soda-saline-alkali soil Journal of Forestry Research, Vol. 9, No. 4, Dec. 1998

40
Comparison of the ability of two species of Astragalus, Se hyperaccumulator
A. racemosus and non-accumulator A. convallarius to accumulating several
others metals and metalloids
INTRODUCTION
Hyperaccumulators are plants with ability to accumulate extraordinarily high concentrations of
metals and metalloids, even from low external concentrations (Baker and Brooks, 1989). Usually
these plants accumulate these elements 100 or 1000 folds more than those found in other species
from the same site. Elements that can be hyperaccumulated include arsenic (As), cobalt (Co)
cadmium (Cd), copper (Cu), manganese (Mn), Nickel (Ni), Selenium (Se) and zinc (Zn); some
species are able to hyperaccumulate more than one of these elements (Reeves and Baker, 2000 ;
Guerinot and Salt 2001). At last 400 plant species in 45 plant families are hyperaccumulators and
this have been found in many different geographic locations (Reeves and Baker, 2000). In
particular Se hyperaccumulators contains greater than 1000 mg Se Kg-1
DW and tipically occur
on seleniferous soils, such as those found in the western USA (Beath et al 1939 ; Feist and
Parker 2001). Some species of Astragalus and Stanleya both native to the western USA
accumulate upwards of 1000 mg Se Kg-1
DW from soil containing 4-10 mg Se Kg-1
DW whereas
in nonaccumulators Se concentrations are usually <20 mg Kg-1
DW (Shrift 1969 ; Feist and
Parker 2001; Pickering et al. 2003).Se hyperaccumulators are characterized by a high leaf Se
concentration, a higher Se : S ratio and a higher shoot/root Se concentration (Galeas et al. 2007 ;
White et al. 2007) indicating altered regulation of sulfate transporters and presence of (more)
specific selenate transporters. Moreover Se-hyperaccumulators show a pronounced and S-
indipendent seasonal variation in Se concentration in different plant organs suggestive of Se flow
from roots to young leaves in early spring, from older to younger leaves and reproductive tissues
in summer and from shoot to roots in the fall (Galeas et al. 2007). Thus, whole plant level Se
fluxes seem to be specialized in hyperaccumulators and separate from S movement. Further
studies revealed that both hyperaccumulators and non accumulators seem to access the same
labile pools of Se in soil ; therefore, Se-hyperaccumulators might be no better at accumulating Se
from a relatively low-available-Se soil than are non accumulators and root proliferation in Se-
enriched soil (positive chemotaxis) might contribute to Se hyperaccumulation (Goodson et al,
2003). Astragalus spp : The genus Astragalus (Leguminosae) contains app. 375 species in North
America, 180 of which are located in intermountain region of western US, and approximately
1600 worldwide (Barneby 1989 ). Variable pod characteristics in intermountain species include
size, outline, thickness of pericarp , texture, colour, number of locus and composition. The genus

41
is also chemically diverse with some species highly toxic because of selenium accumulation
(Rosemfeld and Beath 1964). Astragalus racemosus, that‘s the Se-accumulator species
investigated, extents its habitat from North to South of USA, from North Dakota to Northern
Texas across Wyoming, Colorado, Nebraska, Kansas, Oklaoma ,Utah and New Mexico. It is
included in the Bisulcati group : although it frequently occurs in the same area with other
species, in this group were not documented at the same locale and this taxon does not appear to
hybridize in the wild (Heidel 2003).
Selenium (Se) :Selenate is the predominant form of Se in alkaline and well-oxidized soils with
pH from acidic to neutral. Predominantely Se exists as selenite (Elrashidi et al. 1987) Se is an
essential element for mammals (Stadman 1990) and Se- hyperaccumulating plants may be a
useful source of dietary Se (Ellis and Salt 2003; Freeman et al 2006). However, Se is toxic at
higher levels, and ingestion of hyperaccumulators is responsible for a loss of livestock valued at
$ 330 milion annually in the USA (Rosenfeld and Beath 1964 ; Wilber 1980). Selenium toxicity
is thought to result from its chemical similarity to sulfur, leading to inadvertment uptake and
replacement of S by Se in proteins and other redox-important S compounds (Stadtman 1990). It
is unlikely that Se serves an essential role in higher plants, but elevated levels of Se are toxic to
plants (Anderson 1993). As a result of its similarity to sulfate, selenate is incorporated into
selenocysteine (SeCys) via the sulfate assimilation pathway. SeCys replaces cysteine in proteins,
resulting in a loss of protein function ; this process is in part responsible of selenium toxicity
(Stadtman 1990; Anderson 1993). Se hyperaccumulators have evolved a tolerance to Se
methylating SeCys into methylselenocysteine (MeSeCys) which is not easily incorporated into
proteins (Brown and Shrift 1981).
Chromium (Cr) : Chromium is found in all phases of the environment, including air, water and
soil. Naturally occurring in soil, Cr ranges from 10 to 50 mg kg-1
depending on the parental
material. In ultramafic soils (serpentine), it can reach up to 125 g kg-1
(Adriano, 1986). In fresh
water, Cr concentrations generally range from 0.1 to 117 µg L-1
, whereas values for seawater
range from 0.2 to 50 µg L L-1
. Cr concentration varies widely in the atmosphere, from
background concentrations of 5.010-6
–1.210-3 µg m
-3 in air samples from remote areas such as
Antarctica and Greenland to 0.015–0.03 µg m-3
in air samples collected over urban areas
(Nriagu, 1988). Cr(VI) is a strong oxidant with a high redox potential in the range of 1.33–1.38
eV accounting for a rapid and high generation of ROS and its resultant toxicity (Shanker et al.,
2004a,b).
The stable forms of Cr are the trivalent Cr(III) and the exavalent Cr(VI) species, although there
are various other valence states which are unstable and shortlived in biological systems. Cr(VI)
is considered the most toxic form of Cr, which usually occurs associated with oxygen as
chromate (CrO4 ) or dichromate (Cr2O7) oxianions. Cr(III) is less mobile, less toxic and is mainly
found bound to organic matter in soil and aquatic environments (Becquer et al., 2003). The
impact of Cr contamination in the physiology of plants depends on the metal speciation, which is
responsible for its mobilization, subsequent uptake and resultant toxicity in the plant system. Cr
toxicity in plant is observed at multiples levels, from reduced yield, through effects on leaf and

42
root growth, to inhibition on enzymatic activities and mutagenesis. Although some crops are not
affected by low Cr concentration (3.8 10-4
µM) (Huffman and Allaway, 1973a,b), Cr is toxic to
most higher plants at 100 µM kg-1
DW (Davies et al. 2002). The first interaction Cr has with a
plant is during its uptake process. Cr is a toxic, nonessential element to plants; hence, they do not
possess specific mechanisms for its uptake. Therefore, the uptake of this heavy metal is trough
carriers used for the uptake of essential metals for plant metabolism. The toxic effects of Cr are
primarily dependent on the metal speciation, which determines its uptake, translocation and
accumulation. The pathway of Cr(VI) transport is an active mechanism involving carriers of
essential anions such as sulfate (Cervantes et al, 2001). Fe, S and P are known also to compete
with Cr for carrier binding (Wallace et al., 1976). About Cr in crops, Skeffington et al., (1976)
from radioactive tracer studies using 51
Cr reported that Cr mainly moved in the plants xylem.
Golovatvj et al. (1999) have shown that Cr distribution in crops had a stable character which did
not depend on soil properties and concentration of this element ; the maximum quantity of
element contaminant was always contained in roots and a minimum in the vegetative and
reproductive organs. In bean, only 0.1% of the Cr accumulated was found in the seeds as against
98% in the roots (Huffman and Allaway, 1973a). The reason of the high accumulation in roots of
the plants could be because Cr is immobilized in the vacuoles of the root cells, thus rendering it
less toxic, which may be a natural toxicity response of the plant (Shanker et al., 2004a). Since
both Cr(VI) and Cr(III) must cross the endodermis via symplast, the Cr(VI) in cells is probably
readily reduced to Cr(III) which is retained in the root cortex cells under low concentration of
Cr(VI) which in part explains the lower toxicity of Cr(III). Although higher vascular plants do
not contain Cr(VI)-reducing enzymes, they have been widely reported in bacteria and fungi
(Cervantes et al., 2001).
Arsenic (As) : with an average concentration of 5-6 ppm in the continental crust is relatively
scarce ; however, individual areas show particularly high concentrations. Anthropogenic inputs
such as smelters, mining processes, fuel utilization and pesticides are generally responsible for
the high arsenic concentrations found in those areas. ( Heikens et al. 2007). In south east of
Asia, for instance, millions of people have been exposed to high levels of arsenic in ground water
because the contamination of drilled wells (Christen 2001 ). Studies on arsenate (the dominant
form of arsenic phytoavailable in aerobic soils) toxicity have shown that plant species not
resistant to arsenic are highly stressed by exposition to arsenate with symptoms ranging from
inhibition of root growth through to death ( Macnair & Cumber 1987 ; Meharg & Macnair 1991 ;
Paliouris & Hutchinson 1991; Barrachina et al 1995). The exposure to inorganic arsenic species
results in the generation of reactive oxygen species (ROS) (Hartley-Whitaker et al, 2001a). This
probably occurs through the conversion of arsenate to arsenite, a process which readily occurs in
plants and leads to the synthesis of enzymatic antioxidants like superoxide dismutase (SOD) and
catalase and non enzymatic antioxidants, for example gluthathione and ascorbate (Alscher, 1989;
Mylona et al., 1998 ; Dat et al., 2000; Hartley-Whitaker et al., 2001a). Arsenate is toxic also
because acts as a phosphate analogue and is transported across the plasma membrane via
phosphate cotransport systems (Ullrich-Eberius et al., 1989). Once inside the cytoplasm it

43
competes with phosphate, for example replacing phosphate in ATP to form unstable ATP-As and
leads to the disruption of energy flows in cells (Meharg 1994). However, Bertolero et al. (1987)
point out that because Arsenate is rapidly reduced to arsenite in plant tissue, arsenate will not
normally so much concentrated to exert toxicity. Because Arsenate is linked with phosphate
nutrition, an increased phosphate status leads to reduced arsenate uptake, through suppression of
the high- affinity phosphate/arsenate uptake system (Meharg & Macnair 1991 1992). For the
same reason non resistant plants can become more resistant to arsenate by rising their
phosphorus status (Meharg et al. 1994b) infact the phosphate/arsenate trasporter has a higher
affinity for phosphate and if external phosphate status is high phosphate will be taken up more
efficiently than arsenate (Meharg & Macnair 1994).
Nickel (Ni) : it is the twenty second most abundant element in the earth‘s crust (Nielson 1987 ;
Sunderman et al., 1991). Generally naturally occurring concentrations of Ni in soil and surface
waters are lower than 100 and 0.005 ppm respectively (McIlveen et al. 1994 ; McGrath et al.
1995). Ni is also released into the environment by anthropogenic activities such as metal mining,
smelting, fossil fuel burning, vehicles emissions, disposals of household, municipal and
industrial wastes, fertilizer application and organic manures (Alloway 1995 ; Salt et al., 2000).
Ni2+
concentrations may reach 26000 ppm in polluted soils ( Alloway 1995 ; McGrath 1995) and
0.2 mg/L in polluted surface waters ( Amstrom et al.,1996 ; Zwolsman et al., 2007) 20 to 30
times higher than found in unpolluted areas.
Ni is essential for plants (Eskew et al., 1983 ; Ragsdale 1998) but generally the concentration in
plants is very low (0.05 to 10 mg/kg DW) (Nieminem et al.,2007). With increasing Ni pollution
toxic effects in plants for excess are more frequently reported than others linked to deficiency
(Alloway 1995 ; Salt et al., 2000) for example reduction in plant growth (Molas 2002) and
adverse effects on fruit yeld and quality (Gajewska 2006) ; Extremely high soil Ni concentrations
can forbid completely crops fruits and vegetables growth (Duarte et al., 2006). The Ni uptake in
plants is carried out mainly by root systems via passive diffusion and active transport (Seregin et
al., 2006). The ratio of uptake between active and passive transport varies with species, Ni form
and concentration in the soil or nutrient solution (Dan et al., 2002 ; Vogel-Mikus et al., 2005).
For example, soluble Ni compounds can be absorbed via the cation transport system. Since
Cu2+
and Zn2+
inhibit Ni2+
uptake competitively, these three soluble metal ions seem to be
absorbed by the same transport system (Cataldo et al., 1978 ; Kochian 1991). Over 50% of the
Ni absorbed by plants is retained in the roots (Cataldo et al., 1978). This may be due to
sequestration in the cation exchange sites of the walls of xylem parenchyma cells and
immobilization in the vacuoles of roots (Seregin et al., 2006). Furthermore over the 80% of Ni in
the roots is present in the vascular cylinder, while less than 20% is present in the cortex , maybe
due to an high Ni mobility trough the vessels (Marschner 1995 ; Page et al., 2005 ; Riesen et al.,
2005). Responses to toxicity differ according to plant species, growth stage, cultivation
conditions, Ni concentration and exposure time (Krupa et al., 1996 ; Marschner 1995; Sheoran et
al., 1990 ; Xylander et al., 1994; Kabata-pendias 2001; Assuncao et al., 2003 ). In general critical
toxicity levels are > 10 mg/kg DW in sensitive species (Kozlow 2005), > 50 mg/kg DW in

44
moderately tolerant species ( Bollard 1983; Ascher 1991) and > 1000 mg/kg DW in Ni
hyperaccumulator plants like Alyssum and Thlaspi spp. (Kupper et al., 2001 ; Pollard et al., 2002
) .In sensitive species (for example, barley, water spinach and wheat), chlorosis and necrosis of
leaves can appear after plants are treated with Ni at very low concentrations (≤ 0.2 mM or 11.74
ppm) for less than a week (Gajewska et al., 2006, Sun et al., 1998,Rahman et al., 2005). Plants
grown in Ni contaminated soil and media show various responses and toxicity symptoms
including retardation of germination (Nedhi et al., 1990), inhibition of growth (Madhava et al.,
2000 ; Gajewska et al., 2006; Boominathan et al., 2002), reduction of yield (Madhava et al., 2000
; Molas 1997; Balaguer et al., 1998 ;Pandey et al., 2002), induction of leaf chlorosis and wilting
(Gajewska et al., 2006; Pandey et al., 2002), disruption of photosynthesis (Molas 2002;
Gajewska et al., 2006; Molas 1997;Szalontai et al., 1999 ; Gajewska et al., 2007) inhibition of
CO2 assimilation (Kozlow 2005; Molas 1997), as well as reductions in stomatal conductance
(Sheoran et al., 1990 ; Bethkey et al., 1992).
As written above Ni hyperaccumulator plants can sequester high levels of Ni in tissues (from
several thousands of mg/kg up to 5% of dry biomass) without exhibiting phytotoxicity (Baker et
al., 2000; Prasad 2005 ; Milner et al. 2008). The family with the most such species is the
Brassicaceae, with more than 80 species which are capable of accumulating Ni to concentrations
as high as 3% of shoot dry biomass (Reeves et al., 2000; Brooks et al., 1979). These species have
higher requirements for Ni (e. g., up to 500 mg Ni/kg) than normal plants (Kupper et al.,
2001)Stackhousia tryonii Bailey (Stackhousiaceae), an herbaceous species from Australia, has
been shown to accumulate Ni in dry leaves at concentrations exceeding 4% (Batianoff et al.,
2002; Bathia 2003).
Vanadium (V) : V has a mean crustal abundance of 150 mg/kg, that places it as the fourteenth
most abundant element in the earth crust (Hansen 1983). V is more widely dispersed than other
elements such as Co, Zn, Cu and Mo, so it is more readily accessible by plants than those
elements which tend to be concentrated in discrete bodies. Several authors have presented a
compilations of plant tissue vanadium levels (Bengtson and Tyler 1976; Bertrand 1950; Hopkins
et al., 1977). Generally from unpolluted sources, plants accumulate V in a range between 0.5 and
2.0 µg /g DW. Elevated V concentrations has been reported from plants growing in high
mineralized soils of the Colorado plateau (USA) with plants of the genus Astragalus containing
up to 144 µg/g DW. Even some non accumulator plants were found to contain high V levels
when cultivated closest to highly mineralized soils. Brenchley (1932) in experiments on
phosphate fertilization found that fine grinding of the fertilizer tended to reduce yeld because the
presence of V. Later work indicated that levels of 1-2 µg/g of V in the nutrient solution could
produce reductions in shoot biomass. Warington (1951, 1954) demonstrated that V could relieve
symptoms of excess of Mn in soybean, but causing at the same time symptoms of V toxicity such
as apical chlorosis and abnormal root growth. A supply of 10 -4
M of vanadate to plants caused a
reduction in dry matter production (Wallace et al., 1977) ; in these experiments V tissue level
increased according to the rate of supply ; the major part of this was stocked in root system. Also

45
Hara et al. (1976) found retention of V in cabbage roots up to 2500 µg/g DW that was the 95-
98% of the total V absorbed.
Tellurium (Te) : With an abundance in the Earth's crust comparable to that of platinum, tellurium
is one of the rarest stable solid elements in the Earth's crust but is widely distributed. Its
abundance is about 1 µg/kg ; nevertheless in Ely mining district (Nevada) were found
concentrations up to 100 mg/kg of rocks (Gott and McCarthy 1966). Te is known to be
chemically similar to Se but also the behavior of this two elements once inside organisms is
similar : they tend to be methylated and / or form Se /Te amminoacids both in animals and
microorganisms ( Terry et al., 2000 ; Chasteen et al., 1990 ). About Te in plants little is known.
Beath et al. (1935) found in Atriplex nuttallii and in Opuntia polyacanta Te concentrations from
2 to 25 mg/kg DW; in addition in greenhouse experiments he found in young wheat plants, in
soil amended with 10 mg/kg of Te as Te dioxide, 11 mg/kg DW; when the same amount of Te
was added as K salt, he found up to 507 mg/kg DW. In twigs of pinus flexilus Hubert (1971)
found 0.05 mg/kg of Te and in wood 0.005 mg/kg. Duke (1970) analyzing vegetables, grains,
tuber crops and fruit eaten by panama and Colombia indigenous groups, found Te contents
ranged from 0.9 mg/kg in Phaseolus vulgaris to 0.001 mg/kg in Musa sapientium , the banana.
Based on DW, generally vegetables and grains contains more Te than crops and fruits. Cowgill
(1988) found in different species of the genus Astragalus from different locations of Nevada, Te
concentrations from 1.2 µg/kg of A. asclepiadoides to 62.1 µg/kg of A. bisulcatus. Interestingly
the higher values corresponded to species that are Se hyperaccumulators, to underline the
similarity of this two elements although the Se concentrations in hyperaccumulators was many
folds higher than Te concentrations. He found also that in those investigated Nevada locations,
vegetation fails to grow when Te soil concentration is higher than 10 mg/kg.
Molybdenum (Mo) : Molybdenum is an essential micronutrient for plants, bacteria, and animals.
Mo-deficient plants exhibit poor growth and low chlorophyll and ascorbic acid content
(Marschner, 1995). Mo is also a component of some bacterial nitrogenases, and therefore is
especially important for plants that live in symbiosis with nitrogen-fixing bacteria. The major
metabolic function for Mo in eukaryotic organisms is as an essential component of the
mononuclear Mo enzymes (Hille, 1996), which play roles in many key metabolic processes such
as sulfur detoxification, purine catabolism, nitrate assimilation, and phytohormone synthesis in
plants (Stallmeyer et al., 1999). These enzymes usually (but not always) catalyze two-electron
redox reactions that are coupled to the transfer of an oxygen atom to or from substrate and the
metal, during which the Mo cycles between the Mo(VI) and Mo(IV) oxidation states. In these
systems, Mo is bound to the dithiolene of a novel pyranopterin cofactor that is known as
molybdopterin (Hille, 1996). Although a low-Mr species containing both Mo and molybdopterin
has never been properly characterized, this complex is known as the Mo cofactor (Moco). These
enzymes are unrelated to the Mo-containing nitrogenase of nitrogen-fixing bacteria that contain a
Mo-iron-sulfur cluster.
In plants, Mo is readily mobile in xylem and phloem for long-distance transport (Kannan and
Ramani,1978), though little is known of the mechanisms involved in Mo homeostasis.

46
Molybdate competes with sulfate for uptake at the root surface, suggesting a common uptake
mechanism (Stout et al., 1951). However, it has also been suggested that molybdate is taken up
by a phosphate transporter (Heuwinkel et al., 1992).
The Mo content of plants is a direct reflection of the bioavailability of Mo in the soil. The
relation of Mo influx versus concentration is approximately linear in soil systems (Barber, 1995).
Bioavailability of Mo is positively correlated with soil pH (Karmian and Cox, 1978). In acidic
soils, Mo deficiency in plants is common.
On the other hand, in some soils of high pH, plants may accumulate enough Mo for ruminants
feeding on the plants to develop molybdenosis. Molybdenosis is caused by an imbalance of Mo
and copper in the ruminant diet, which induces a copper deficiency (Stark and Redente, 1990).
Plants supplied with adequate Mo usually contain 1 to 2 mg /kg Mo; plant material containing an
excess of 5 mg/kg Mo is sufficient to cause molybdenosis in ruminant animals (Barber, 1995).
Molybdenosis in livestock occurs in the western U.S., often in soils with poor drainage and high
organic matter (Gupta and Lipsett, 1981).
About Mo toxicity in plants, they appear quite tolerant of high soil molybdenum
concentrations. There is no record of molybdenum toxicity under field conditions. In
greenhouse studies, tomato leaves turned golden-yellow and cauliflower seedlings turned purple.
Animals fed foliage high in molybdenum may need supplemental copper to counteract the
molybdenum (Vitosh et al., 1994).
Mo pollution due to mining and stainless steel industry poses a serious environmental problem
at several locations in the U.S., including several Superfund sites (polluted sites in the U.S.
designated by the U.S. Environmental Protection Agency for high priority remediation). Plant
samples from a mining site near Empire, CO were found to contain up to 400 mg kg-1
Mo (Trlica
and Brown, 2000). Phytoremediation, the use of plants to remediate environmental pollution,
may prove to be a viable strategy for remediating Mo in these areas, either via phytoextraction
(accumulation in harvestable plant parts) or phytostabilization (in situ immobilization).
Tungsten (W) : The earth‘s crust, by far the most significant source of tungsten in the ecosphere,
is estimated to contain 0.00013% W on a mass basis(Smith, 1994), equivalent to an average
(background) W concentration of 1.3 mg kg−1
. Based on this figure, W occupies the 57th/18th
positions in the overall element/metal abundance lists. Surface rocks reportedly contain W at
levels in the range of 1.0–1.3 mg kg-1
(Penrice 1997, Krauskopf 1972). In terrestrial systems, W
exists almost exclusively in the form of oxo-rich tungstate minerals either as scheelite (CaWO4)
or wolframite ([Fe/Mn]WO4). Literature assessing background W concentration levels for soil
systems globally is not available and only a limited number of studies exist on a local scale.
Studies in the European Union have reported W concentrations in soils (0.5–83 mg kg−1
dry
mass) and surface soils (0.68–2.7 mg kg−1
dry mass) (Senesi et al., 1988,Senesi et al., 1999). The
same studies have reported W content levels (in mg kg−1
) in the lithosphere (0.1–2.4), phosphate
and phosphorite rocks (30–270), limestones and carbonate rocks (0.2–0.8), sewage sludge (1–
100), manure (8–2800) and a variety of fertilizers (ND-100). Elevated values in agricultural soils
from New Zealand (1.9–21.4 mg kg−1
) may be attributed to agrochemical practices (Quin 1972).

47
Conversely, values in the range of 0–2 mg kg−1
reported for agricultural soils in Iowa are in close
agreement with the background concentration of 1.3 mg kg−1
(Fu et al.,1988). W can be
transported to biotic systems from terrestrial, atmospheric or aquatic systems via several
mechanisms including uptake by plants, trees and vegetative matter, bioaccumulation in
microbial and animal organisms, sorption/desorption, formation of organotungsten compounds
and subsequent partitioning in organic matter, and excess metal sequestration.
Plants are known to take up (possibly in anionic form,WO42−
(Wilson et al., 1966]) and
accumulate tungsten in substantial amounts. The extent of accumulation appears to be directly
related to the W content of the soil irrespective of the source nature (natural or anthropogenic)
and varies widely depending on the plant genotype. Certain plants (e.g. tomatoes) act as
excluders of W, particularly in the presence of Mo (Kishida et al., 2004). Concentrations of 5–
100 mg kg−1
were found in trees and shrubs in the Rocky Mountains (Shacklette et al., 1978),
whereas values below 1 mg kg−1
appear to be most common in other plant types (Kabata Pendias
et al., 1992). Elevated values of W have been reported in the leaves (13.6 mg kg−1
), young stems
(2.9 mg kg−1
) and old stems (4.3 mg kg−1
) of eucalyptus trees (Eucalyptus melanophloia) in the
vicinity of an inactive wolframite mine in North Queensland, Australia compared to control
values of 0.1, 0.0 and 0.1 mg kg−1
, respectively (Pyatt et al., 2004).W detected in the leaves of
European beech trees (Fagus sylvatica) varied in the range of 7–50 mg kg−1
and was attributed
primarily to atmospheric deposition (Tyler 2007) A Czech study reported a mean W
concentration of 0.775 mg kg−1
in oak tree bark (range 0.129–4.79 mg kg−1
) (Bohm et al., 1998)
Information has been presented earlier on elevated values of W in tree ring samples taken from
Fallon, Nevada and other all struck communities (Sheppard et al., 2003) Limited literature exists
on food crops. W was detected in onions harvested in various sites (Denmark) at a mean level of
16.7_g kg−1
fresh mass (n = 64; range, 6.3–39_g kg−1
) (Bibak et al., 1998), in two wild berry
species in Sweden at levels in the range of 0.22–7.2 mg kg−1
(Roduskin et al. 1999) and in
cabbage (0.2–1.7 mg kg−1
) grown in fly ash-amended soils (Furr et al., 1976).
Although certain plants are capable of acting as W accumulators or excluders, plant toxicity has
also been reported in the literature. Accumulation and toxicity of W on rye grass was reported
recently (Stingul et al., 2005). The accumulation increased as the W soil concentration increased
from 0.1 to 10,000 mg kg−1
. At the highest soil content level, toxicity became apparent
throughout the life of the plant and resulted in death, approximately 4 weeks after germination.
Accumulation of W, investigated using three species of Brassica (fast plants, red cabbage and
Indian mustard), was attributed to anthocyanins (Kerry et al., 2002). The same study concluded
that replacement of Mo in nitrate reductase by W is a likely toxicity mechanism and that
sequestration of excess metals in the peripheral cell layers appears to be a common mechanism
of plant metal accumulation. Sequestration of metals in tissues where these substances are less
harmful to the plant, or plant defense against pathogens or herbivores are two plausible
explanations.
48
MATHERIAL AND METHODS
Plant growth : seeds of Astragalus racemosus and A. convallarius were obtained from Western
Native Seeds Co., Colorado (USA). To improve germination, seeds of A. racemosus and A.
convallarius were scarified by scratching the coat with sandpaper. After the seeds were scarified
under a microscope with a scalpel, removing piece of the seed coat to facilitate water entrance,
the seeds were put in a 15 ml tube to be sterilized by 1 minute in ethanol 70% and then 30
minute in bleach 30%. After that, seeds were rinsed five times 10 minutes in sterile deionized
water; during each wash tubes were put on the rocker to be gently shakedn. Between each wash,
water was replaced under a sterile hood. The sterilized seeds were put in magenta boxes (3 or 4
per box) under a sterile hood using sterile forceps. The medium was prepared as follows : (50 ml
per magenta box), 4.46 g/L of MS (M5519, Sigma)+ 30 g/L of sucrose + some distilled water.
After all is dissolved, pH was brought to 5.8 with diluted KOH . Than solution was brought to
final volume with distilled water. We added agar gel 4 g/ L and put the mixture in autoclave for
21 minutes, then flask was put under hood to cool down to ~ 55 °C . Before the medium was
solidified heavy metal solution were added as follows: Na2SeO4 (16 ppm), K2TeO4 (8 ppm),
KCrO4 (4 ppm), Na2HAsO4 (16 ppm), Na2WO4 (32 ppm), NiSO4∙6H2O (8 ppm), (NH4)6Mo7O24
(32 ppm) and NaVO3 (16 ppm).We prepared 3 boxes for each treatment, so , at least 10 seeds per
species per treatment. Once medium was solidified, we put on agar surface with sterile forceps
10 seeds per species per treatment, so roughly 3 seeds per box. All magenta boxes were put for 3
months in grow chamber settled as follow : 150 µmol m-2
s-1
PAR, 70% of humidity, 16 h of day
light, 24 °C. After three months, plants were kept out from agar, extracting gently roots with
forceps and/or gloves. Roots were washed for some seconds with distilled water in order to
remove pieces of agar gel and metal ions adsorbed on root surface. Then plants were placed on a
black plastic surface with a thin layer of water (avoiding roots could become dry and sticky) to
measure roots and stems length with a ruler. Finally with scissors stems and leaves were
separated from roots. For each species and treatment, the total shoot fresh weight and root fresh
weight were separately recorded. For each species and treatment some leaves of the same age
were put immediately in -80 °C freezer After that, stems of each treatment and species were
grouped in a small plastic tray and put in the oven at 55 °C for 48 h. Then the total dry weight
was recorded. We have crumbled dry stems and roots to homogenize the sampling and weighted
between 30 and 60 mg of that - depending on the amount available of plant tissues- preparing
three replicats per treatment (for each species as usual). Following Zarcinas method,(Zarcinas et
al. 1987) the crumbled tissues, with 1 ml of 95% nitric acid were put into a 30 cm long glass
tubes that were inserted in a digestor under hood. The digestion program was : 2 hours at 60 °C
and 8 hours at 120 °C. The mineralized samples were brought to 10 ml with deionized water,
than they were analyzed by ICP –AES (Inductively coupled plasma atomic emission
spectroscopy) machine to determine heavy metals concentration. XANES(X ray Absorption
Near Edge Structure): to understand if there are favorite sites of accumulation for Cr, Se, W, V
and As in Astragalus spp leaves , we have processed leaves of A. racemosus and convallarius

49
previously kept frozen in -80 freezer. The analysis was conducted by beamline 10.3.2 at the
Advanced Light Source of the Lawrence Berkeley Lab in Berkeley, California. The XANES
method consists in scanning leaf samples kept frozen at -30 °C with X-ray settled in a range
between 2.5 keV and 17 keV .
RESULTS AND DISCUSSION
Selenium (Se)
Looking at Tolerance Index (Figure1) and biomass production (Figure 3) A. racemosus, as
expected, shows higher Se accumulation and tolerance than A. convallarius. The latter shows a
root length inhibition close to 90% in comparison with the control treatment, while inhibition
was around 60% in A.racemosus. A. racemosus shows a translocation factor (TF) (figure 4) of
3.12; such a high value is typical for a hyperaccumulator. Se shoot concentration (231 mg/Kg
d.w.) is in the range of good Se accumulator, although not of a best one (figure 2). Biomass
production indicates A.convallarius is heavily affected by Se particularly at the root level; roots
were often almost absent and the shape was shorter and thicker, all symptoms of stress. The
surprisingly high Se concentration detected in roots and shoots of A. convallarius may be
explained in part by the very low amount of dry biomass used for ICP analysis because of the
low dry biomass available. At very low sample weights the concentrations tend to be
overestimated due to the large conversion factor. This insight is confirmed by XAS analysis : Se
concentration in A. racemosus seems clearly higher than in A. convallarius (Picture 1) ; Se in A.
racemosus seems also widely and homogeneously distributed in leaf tissue and in particular in
leaf tip and borders. This distribution is not only different from non accumulator A. convallarius
but also from that of hyperaccumulator A. bisulcatus which stores Se mostly in trichomes
(Freeman et al., 2006, Plant Physiology).
Chromium (Cr)
Tolerance index (Figure1) shows a severe inhibition of root growth in A. convallarius (almost
80% lower than control) while A. racemosus shows a reduction of about 45% in comparison with
its control. A. racemosus seems to have accumulated in roots 750 mg/kg d.w. but it did not
translocate to shoot in which we find only 25 mg/kg d.w. A. convallarius shows an opposite
behavior with high translocation factor (53.9) and almost 350 mg/Kg d.w. in shoots vs roughly
10 mg/kg in roots. A. racemosus seems suffer less than A. convallarius in term of root biomass
depletion while convallarius stem biomass seems increased by Cr. Because CrVI, supplied as
KCrO4, is more mobile than CrIII both in soil and inside plant, we should hypothesise that in A.
convallarius CrVI is efficiently reduced to Cr III not in roots but in stems, given that we don‘t
see any particular damages in shoots . Cr hyperaccumulators like Salsola kali and Leersia
exandra accumulate Cr VI mostly in leaves respectively up to 2900 mg/Kg (Gardea et al., 2005)

50
and 2978 mg/kg (Zhang 2009). Because of, as reported in literature, a real Cr-hyperaccumulator
stocks Cr as Cr VI mostly in leaves we should assume that A. convallarius shows the same
behavior of an hyperaccumulator. On the other side, the severe depletion of root growth leads to
concern about a passive uptake of CrVI by A. convallarius stems due to a fade filtering and
reducing action of root system.
Finally A. racemosus can be considered a secondary Cr-accumulator because its good tolerance
and Cr uptake in roots, while A. convallarius shows unclear responses. In any case, it is
intriguing to try to understand why Cr increases shoot biomass production and decreases root
biomass at the same time.
Tellurium (Te)
Several Se accumulator species of genus Astragalus are also Te accumulators and shows same
performances in accumulating Se and Te; the same is for non Se accumulator (Cowgill 1988). A.
racemosus and A. convallarius show no significant differences in tolerance index (Figure1) ,
accumulation and translocation factor ; biomass production only could indicate A. convallarius
is more suffering than A. racemosus due to a – 65% in root biomass versus – 50% of A.
racemosus and a -85% in stem biomass compared with – 55% of A. racemosus.
Te accumulators studied in Ely district (Nevada) show ranges of accumulation between 100 and
10,000 mg/Kg d.w. (Cowgill 1988) Both A. racemosus and A. convallarius stay in this range.
They can be considered good Te accumulators, although , differently from Se accumulators, they
store Te mostly in the root system, showing very low translocation factors.
Arsenic (As)
Both species considered shows a biomass depletion closest to 75%. This could mean they suffer
competition between As and P in using P transporters and in forming ATP molecules. Although
both of them accumulate impressive amount of As, only A. racemosus that accumulate in stems
7500mg/Kg d.w. with a translocation factor major than 5 could be considered a real
hyperaccumulator ( best As accumulator known is pteris vittata that accumulates up to 5131
mg/Kg in two weeks in media added with 50 ppm of arsenate). We need further investigation to
dissolve question if A. racemosus can only survive or is really an hyperaccumulator.
Nickel (Ni)
Real Ni hyperaccumulator plants, can accumulate from several thousands of mg/kg up to 5% of
dry biomass without exhibiting phytotoxicity (Baker et al.,2000; Prasad et al.,2005; Milner et
al.,2008)A. racemosus and A. convallarius don‘t accumulate more than 10 mg/kg in roots and
than 23 mg/Kg in stems. Sensitive species shows symptoms of Ni toxicity with 5-15 ppm in
medium.(111, 112, 118). Because Ni concentration used in this trial is 8 ppm, a depletion of -
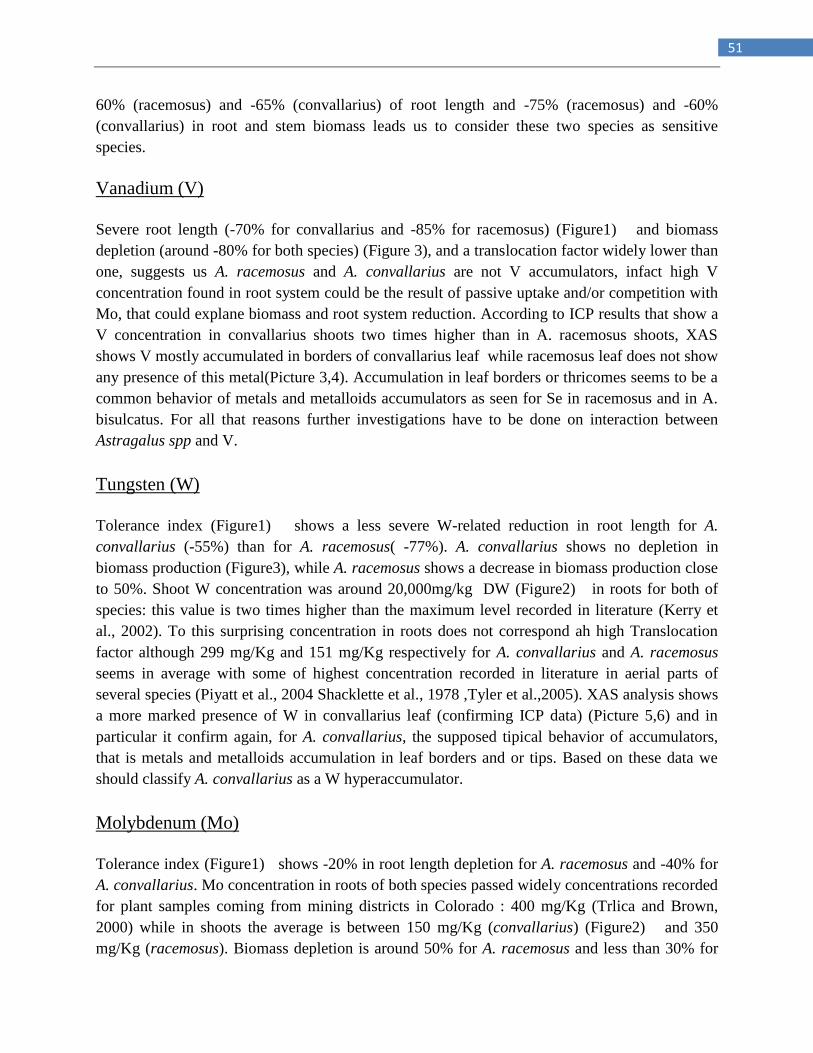
51
60% (racemosus) and -65% (convallarius) of root length and -75% (racemosus) and -60%
(convallarius) in root and stem biomass leads us to consider these two species as sensitive
species.
Vanadium (V)
Severe root length (-70% for convallarius and -85% for racemosus) (Figure1) and biomass
depletion (around -80% for both species) (Figure 3), and a translocation factor widely lower than
one, suggests us A. racemosus and A. convallarius are not V accumulators, infact high V
concentration found in root system could be the result of passive uptake and/or competition with
Mo, that could explane biomass and root system reduction. According to ICP results that show a
V concentration in convallarius shoots two times higher than in A. racemosus shoots, XAS
shows V mostly accumulated in borders of convallarius leaf while racemosus leaf does not show
any presence of this metal(Picture 3,4). Accumulation in leaf borders or thricomes seems to be a
common behavior of metals and metalloids accumulators as seen for Se in racemosus and in A.
bisulcatus. For all that reasons further investigations have to be done on interaction between
Astragalus spp and V.
Tungsten (W)
Tolerance index (Figure1) shows a less severe W-related reduction in root length for A.
convallarius (-55%) than for A. racemosus( -77%). A. convallarius shows no depletion in
biomass production (Figure3), while A. racemosus shows a decrease in biomass production close
to 50%. Shoot W concentration was around 20,000mg/kg DW (Figure2) in roots for both of
species: this value is two times higher than the maximum level recorded in literature (Kerry et
al., 2002). To this surprising concentration in roots does not correspond ah high Translocation
factor although 299 mg/Kg and 151 mg/Kg respectively for A. convallarius and A. racemosus
seems in average with some of highest concentration recorded in literature in aerial parts of
several species (Piyatt et al., 2004 Shacklette et al., 1978 ,Tyler et al.,2005). XAS analysis shows
a more marked presence of W in convallarius leaf (confirming ICP data) (Picture 5,6) and in
particular it confirm again, for A. convallarius, the supposed tipical behavior of accumulators,
that is metals and metalloids accumulation in leaf borders and or tips. Based on these data we
should classify A. convallarius as a W hyperaccumulator.
Molybdenum (Mo)
Tolerance index (Figure1) shows -20% in root length depletion for A. racemosus and -40% for
A. convallarius. Mo concentration in roots of both species passed widely concentrations recorded
for plant samples coming from mining districts in Colorado : 400 mg/Kg (Trlica and Brown,
2000) while in shoots the average is between 150 mg/Kg (convallarius) (Figure2) and 350
mg/Kg (racemosus). Biomass depletion is around 50% for A. racemosus and less than 30% for

52
A. convallarius. Finally, both species should be considered Mo accumulators but considering
that Mo is essential for plants and deficiency symptoms are more clear than toxicity symptoms,
more investigations are probably necessary to better classify the accumulation potential of these
two species.
FIGURES
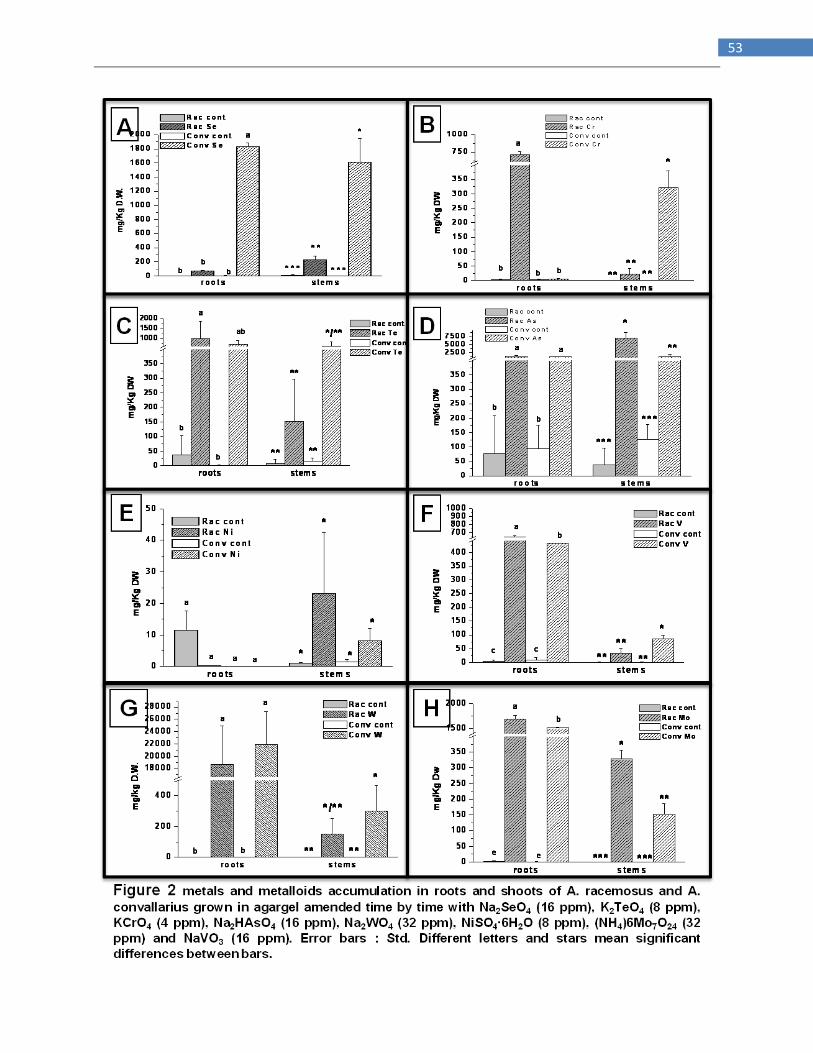
53
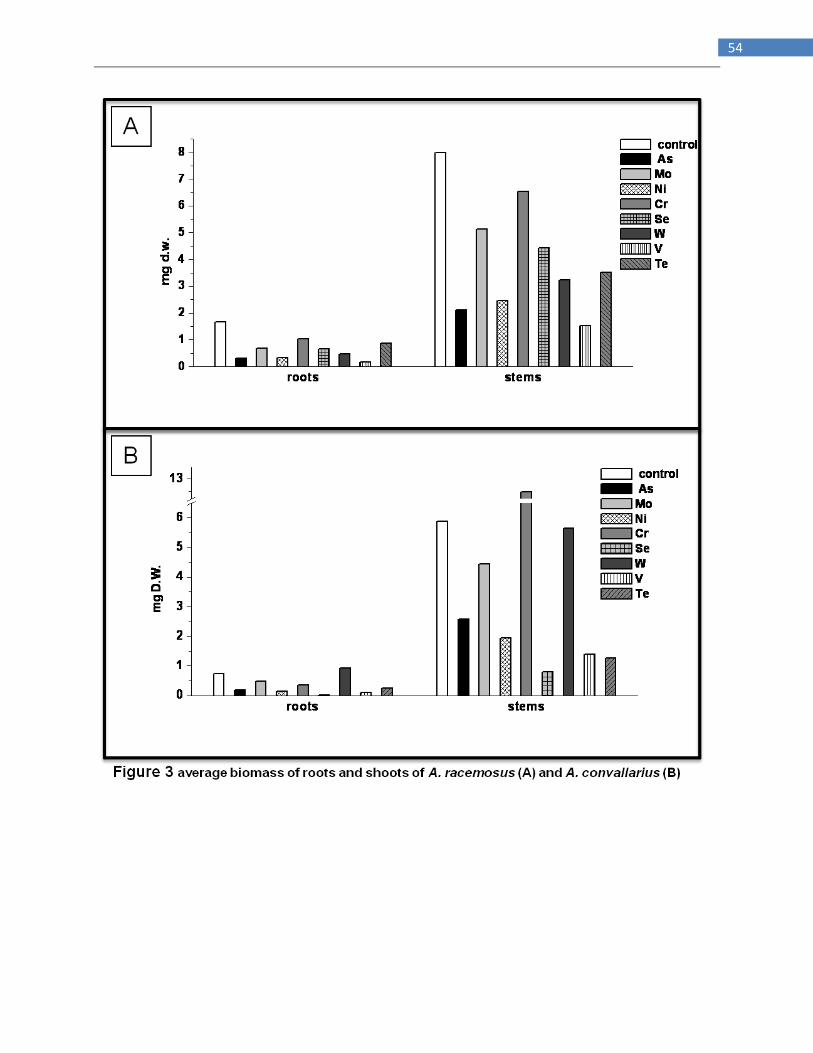
54

55

56

57

58
BIBLIOGRAPHY
Adriano DC. Trace Elements in the Terrestrial Environment. New York7 Springer Verlag; 1986.
p. 105– 23.
Alloway B. J., in Heavy Metal in Soils (Ed: B. J. Alloway), 2nd ed., Blackie Academic and
Professional, London 1995, pp. 25 – 34.
Alscher RG. 1989. Biosynthesis and antioxidant function of glutathione in plants. Physiologia
Plantarum 77: 457–464.
Asher C. J., Micronutrients in Agriculture, 2 nd ed., Soil Science Society of America,
Madison,WI, 1991, pp. 703 – 723.
Assuncao A. G. L. et al., Differential metal-specific tolerance and accumulation patterns among
Thlaspi caerulescens populations originating from different soil types, New Phytol. 2003, 159,
411 – 419.
Astrom M., Bjorklund A., Hydrogeochemistry of a stream draining sulfide bearing postglacial
sediments in Finland, Water Air Soil Pollut. 1996, 89, 233 – 246.
Baker A.J.M., McGrath S. P., Reeves R. G., in Phytoremediation of Contaminated Soil and
Water (Eds.: T. Norman, B. Gary), CRC Press, Boca Raton, FL 2000, pp. 85 – 107.
Baker AJM, Brooks RR. 1989. Terrestrial higher plants which accumulate metallic elements – a
review of their distribution, ecology and phytochemistry. Biorecovery 1: 81–126.
Baker A. J. M., McGrath S. P., Reeves R. G., in Phytoremediation of Contaminated Soil and
Water (Eds.: T. Norman, B. Gary), CRC Press, Boca Raton, FL 2000, pp. 85 – 107.
Balaguer J. et al., Tomato growth and yield affected by nickel presented in the nutrient solution,
Acta. Hort. 1998, 458, 269 – 272.
Barber SA (1995) Soil Nutrient Bioavailability: A Mechanistic Approach. John Wiley & Sons,
Inc., New York
Barneby, R.C. 1964. Atlas of North American Astragalus. Mem. N.Y. Bot. Gard 13. P. 1188.
Barneby, R.C. 1989. Fabales, Vol. 3 Part B. IN: A. Cronquist, A. H. Holmgren, N.H. Holmgren,
J.L. Reveal, and P.K. Holmgren. Vascular Plants of the Intermountain West, USA. New York
Botanical Garden, Bronx, NY. 279 pp.

59
Barrachina AC, Carbonell FB, Beneyto JM. 1995. Arsenic uptake, distribution, and
accumulation in tomato plants – effect of arsenite on plant growth and yield. Journal of Plant
Nutrition 18: 1237–1250.
Batianoff G. N., Specht R. L., in The Ecology of Ultramafic (Serpentine) Soils, Intercept Ltd.,
Andover, UK 1992, pp. 109– 128.
Bhatia N. P., PhD Thesis, Central Queensland University, Australia 2003.
Beath OA, Eppson H. F., Gilbert C.S., (1935), WY Agric. Exp. Sta. Bull., 206.
Beath OA, Gilbert CS, Eppson HF (1939a) The use of indicator plants in locating seleniferous
soils in the Western United States. I. General Am J Bot 26:257–269
Beath OA, Gilbert CS, Eppson HF (1939b) The use of indicator plants in locating seleniferous
soils in the Western United States. II. Correlation studies by states. Am J Bot 26:296–315
Becquer T, Quantin C, Sicot M, Boudot JP. Chromium availability in ultramafic soils from New
Caledonia. Sci Total Environ 2003;301: 251– 61.
Bengtsson S. And Tyler G. 1976. Vanadium in the environment. M.A.R.C. report, Chelsea College,
London.
Bertolero F, Pozzi G, Sabbioni E, Saffiotti U. 1987. Cellular uptake and metabolic reduction of
pentavalent to trivalent arsenic as determinants of cytotoxicity and morphological transformation.
Carcinogenesis 8: 803–808.
Bertrand D. 1950. The biochemistry of Vanadium. In Survey of contemporary knowledge of
biochemistry. American Museum of Natural History Bulletin 94. Washington.
Bethkey P. C., M. C. Drew, Stomatal and non-stomatal components to inhibition of photosynthesis in
leaves of Capsium annum during progressive exposure to NaCl salinity, Plant Physiol. 1992, 99, 219 –
226.
Bibak A., Behrens A., Sturup S., et al., Concentrations of 63 major and trace elements in Danish
agricultural crops measured by inductively coupled plasma mass spectrometry. 1. Onion (Allium
cepa Hysam), J. Agric. Food Chem. 46 (1998) 3139–3145.
Bollard E. G., in Encyclopedia of Plant Physiology, New Series, 15B (Eds.: A. Luchli, R. L. Bieleski),
Springer-Verlag, Berlin 1983, pp. 695 –755.
Boominathan R., Doran P. M., Ni-induced oxidative stress in roots of the Ni hyperaccumulator, Alyssum
bertolonii, New Phytol. 2002, 156, 205 – 215.
Brenchley W. 1932. The action of the growth of crops of certain metallic compounds when applied with
ordinary artificial fertilizers. Journal of Agricultural Science 22. 704-735.

60
Bohm P., Wolterbeek H., Verburg T., et al., The use of tree bark for environmental pollution
monitoring in the Czech Republic, Environ. Pollut. 102 (1998) 243–250.
Brooks R. R. et al., Hyperaccumulation of nickel by Alyssum Linnaeus (Cruciferae), Proc. R. Soc.
London Sect. B 1979, 203, 387 – 403.
Cataldo D. A., Garland T. R., Wildung R. E., Nickel in plants: I. uptake kinetics using intact
soybean seedlings, Plant Physiol. 1978, 62, 563 –565.
Cervantes C, Garcia JC, Devars S, Corona FG, Tavera HL, Torres-guzman J
Carlos, et al. Interactions of chromium with micro-organisms and plants. FEMS Microbiol Rev
2001;25:335– 47.
Chasteen, T. G.; Silver, G. M.; Birks, J. W.; Fall, R. Chromatographia
1990, 30, 181.
Christen K. 2001. The arsenic threat worsens. Environmental Science and
Technology 35: 286A–291A.
Cowgill U. M. (1988) The Tellurium content in vegetation. Biological Trace element Research,
Vol 17, 43-66.
Dan T. V., Krishnaraj S., Saxena P. K., Cadmium and nickel uptake and accumulation in scented
Geranium (Pelargonielm sp.'Frensham'), Water Air Soil Pollut. 2002, 137, 355 – 364.
Vandenabeele Dat J, Vranova S, Van Montagu E, Inze D, Van Breusegem F. 2000. Dual action
of the active oxygen species during plant stress responses. Cellular and Molecular Life Sciences
57: 779–795.
Davies FT, Puryear JD, Newton RJ, Egilla JN, Grossi JAS. Mycorrhizal fungi increase
chromium uptake by sunflower plants: influence on tissue mineral concentration, growth, and
gas exchange. J Plant Nutr 2002;25:2389– 407
Duke J. A. (1970), Econ. Bot. 24, 344.
Ellis DR, Salt DE (2003) Plants, selenium and human health. Curr Opin Plant Biol 6:273–279
Elrashidi, M.A. et al. (1987) Chemical-equilibria of seleniumin soils – a theoretical development.
Soil Sci. 144, 141–152
Eskew D. L.,.Welch R. M, Norvell W. A., Nickel, an essential micronutrient for legumes and
possibly all higher plants, Science 1983, 222, 621 – 623.

61
Feist LJ, Parker DR (2001) Ecotypic variation in selenium accumulation among populations of
Stanleya pinnata. New Phytol 149:61–69
Freeman JL, Zhang LH, Marcus MA, Fakra S, Pilon-Smits EAH (2006a) Spatial imaging,
speciation and quantiWcation of selenium in the hyperaccumulator plants Astragalus bisulcatus
and Stanleya pinnata. Plant Physiol 142:124–134
Fu M.H., Tabatabai M.A., Tungsten content of soils, plants, and sewage sludges in Iowa, USA, J.
Environ. Qual. 17 (1) (1988) 146–148.
Furr A.K., Lawrence A.W., Tong S.S.C., Multielement and chlorinated hydrocarbon analysis of
municipal sewage sludges of American cities, Environ. Sci. Technol. 10 (7) (1976) 683–687.
Gajewska E., Sklodowska M., Slaba M., Mazur J., Effect of nickel on antioxidative enzyme
activities, proline and chlorophyll contents in wheat shoots, Biol. Plant 2006, 50, 653 – 659.
Gajewska E., Sklodowska M.,, Effect of nickel on ROS content and antioxidative enzyme
activities in wheat leaves, BioMetals 2007, 20, 27 – 36.
Galeas, M.L. et al. (2007) Seasonal fluctuations of selenium and sulfur accumulation in selenium
hyperaccumulators and related nonaccumulators. New Phytol. 173, 517–525
Gardea-Torresdey J. L., de la Rosa G., Peralta-Videa J. R., Montes M., Cruz-Jimenez G. and
Cano-Aguilera I. Differential Uptake and Transport of Trivalent and Hexavalent Chromium by
Tumbleweed (Salsola kali) Archives of Environmental Contamination and Toxicology
Volume 48, Number 2, 225-232, (2005)
Golovatyj SE, Bogatyreva EN, Golovatyi SE. Effect of levels of chromium content in a soil on
its distribution in organs of corn plants. Soil Res Fert 1999;197– 204.
Goodson, C.C. et al. (2003) Soil selenium uptake and root system development in plant taxa
differing in Se-accumulating capability. New Phytol. 159, 391–401
Gott G.B., McCarthy J.H., (1966) US Geol. Surv. Circ., 535.
Guerinot M-L, Salt DE. 2001. Fortified foods and phytoremediation: two sides of the same coin.
Plant Physiology 125: 164–167.
Gupta UC, Lipsett J (1981) Molybdenum in soils, plants and amimals. Adv Agron 34: 73–115
Hansen O. 1983. Vanadate and phosphotransferases with special emphasis on Ouabain/Na,K-
ATPase interaction. Acta pharmacologica et toxicological 52 Supplement No 1 13-19
Munskgaard – Copenhagen.

62
Hartley-Whitaker J, Ainsworth G, Meharg AA. 2001a. Copper and arsenate induced oxidative
stress in Holcus lanatus L. clones with differential sensitivity. Plant, Cell & Environment. 24:
713–722.
Heikens A, Panaullah GM, Meharg AA (2007) Arsenic behaviour from groundwater and soil to
crops: impacts on agriculture and food safety. Rev Environ Contam Toxicol 189:43–87
Heuwinkel H, Kirkby EA, Bot JL, Marschner H (1992) Phosphorous deficiency enhances
molybdenum uptake by tomato plants. Plant Nutr 15: 549–568
Hille R (1996) The mononuclear molybdenum enzymes. Chem Rev 96: 2757–2816
Hopkins L.L., Cannon H.L., Miesch A.T., Welch R.M. and Nielsen F.M. 1977. Vanadium.
Geochemistry and environment 2, 93-107.
Hubert A. E. 1971, US Geol. Surv. Prof. Pap. 750-D, 162.
Huffman Jr EWD, Allaway HW. Chromium in plants: distribution in tissues, organelles, and
extracts and availability of bean leaf Cr to animals. J Agric Food Chem 1973a;21:982–6.
Huffman Jr EWD, Allaway WH. Growth of plants in solution culture containing low levels of
chromium. Plant Physiol 1973b;52:72– 5.
Kabata-Pendias A., Pendias H., Trace Elements in Soils and Plants, second ed., CRC Press Inc.,
N.W., Boca Raton, FL, 1992, ISBN 0-8493-6643-7.
Kabata-Pendias A., Pendias H., Trace Elements in Soils and Plants, 3 rd ed., CRC Press Inc.,
Boca Raton, FL, 2001, pp. 413.
Kannan S, Ramani S (1978) Studies on molybdenum absorption and transport in bean and rice.
Plant Physiol 62: 179–181
Karmian N, Cox FR (1978) Adsorption and extractability of molybdenum in relation to some
chemical properties of soils. Soil Sci Soc Am J 42: 757–761
Kerry L., Hale K.L., Tufan H.A., Pickeringb I.J., Georgeb G.N., Terryc N., Pilon M., Pilon-
Smits E.A.H., Anthocyanins facilitate tungsten accumulation in Brassica, Physiol. Plantarum 116
(2002) 351–358.
Kishida K., Okamura K., Ishibachi J., Tungsten enriched in submarine hydrothermal fluids,
Earth Planet. Sci. Lett. 222 (3–4) (2004) 819–827.
Kochian L. V., in Micronutrients in Agriculture (Eds: J. J. Mortvedt), Soil Science Society of
America Madison, WI, 1991, pp. 251 – 270.

63
Kozlow M. V., Pollution resistance of mountain birch, Betula pubescens subsp. czerepanovii,
near the copper-nickel smelter: Natural selection or phenotypic acclimation?, Chemosphere
2005, 59, 189 – 197.
Krauskopf K.B., Tungsten, in: K.H. Wedepohl (Ed.), Handbook of Geochemistry, vol. II/3,
Springer Verlag, New York, NY, 1972 (Chapter 74).
Krupa Z., Siedleka A., Maksymiec W., Baszynski T., In vivo response of photosynthetic
apparatus of Phaseolus vulgaris L. to nickel toxicity, J. Plant Physiol. 1993, 142, 664 – 668.
Kupper H. et al., Cellular compartmentation of nickel in the hyperaccumulators Alyssum
lesbiacum, Alyssum bertolonii and Thlaspi goesingense, J. Exp. Bot. 2001, 52, 2291 – 2300.
Macnair MR, Cumbes Q. 1987. Evidence that arsenic tolerance in Holcus lanatus L. is caused by
an altered phosphate uptake system. New Phytologist 107: 387–394.
Marschner H., Mineral Nutrition of Higher Plants, 2nd ed., Academic Press, London 1995, pp
889.
McGrath S. P., in Heavy Metals in Soils (Ed: B. J. Alloway), 2nd ed., Blackie Academic and
Professional, London 1995, pp. 152 – 174.
McIlveen , W. D. J. J. Negusanti, Nickel in the terrestrial environment, Sci. Total Environ. 1994,
148, 109 – 138.
Meharg AA, Macnair MR. 1991. The mechanisms of arsenate tolerance inDeschampsia
cespitosa (L.) Beauv and Agrostis capillaris L. New Phytologist 119: 291–297.
Meharg AA, Macnair MR. 1992. Suppression of the high-affinity phosphate-uptake system – a
mechanism of arsenate tolerance in Holcus lanatus L. Journal of Experimental Botany 43: 519–
524.
Madhava Rao K. V., Sresty T. V., Antioxidative parameters in the seedlings of pigeonpea
(Cajanus cajan (L.) Millspaugh) in response to Zn and Ni stresses, Plant Sci. 2000, 157, 113 –
128.
Meharg AA, Macnair MR. 1994. Relationship between plant phosphorus status and the kinetics
of arsenate influx in clones of Deschampsia cespitosa (L.) Beauv that differ in their tolerance to
arsenate. Plant and Soil 162: 99–106.
Meharg AA, Naylor J, Macnair MR. 1994b. Phosphorus-nutrition of arsenate-tolerant and non-
tolerant phenotypes of Velvetgrass. Journal of Environmental Quality 23: 234–238.

64
Milner M. J., Kochian L. V., Investigating heavy-metal hyperaccumulation using Thlaspi
caerulescens as a model system, Ann. Bot. 2008, 102, 3 – 13.
Molas J., Changes in morphological and anatomical structure of cabbage (Brassica oleracera L.)
outer leaves and in ultrastructure of their chloroplasts caused by an in vitro excess of nickel,
Photosynthetica 1997, 34, 513 – 522.
Molas, J. Changes of chloroplast ultrastructure and total chlorophyll concentration in cabbage
leaves caused by excess of organic Ni (II) complexes, Environ. Exp. Bot. 2002, 47, 115 – 126.
Mylona PV, Polidoros AN, Scandalios JG. 1998. Modulation of antioxidant responses by arsenic
in maize. Free Radical Biology and Medicine 25: 576–585.
Nedhi A., Singh L. J., Singh S. I., Effect of cadmium and nickel on germination, early seedling
growth and photosynthesis of wheat and pigeon pea, Int. J. Trop. Agr. 1990, 8, 141 – 147.
Nielson F.H., in Trace Elements in Human and Animal Nutrition (Ed: W. Mertz), Academic
Press, San Diego, CA 1987, pp. 245 – 273.
Nieminen T. M., Ukonmaanaho L., Rausch N., Shotyk W., Biogeochemistry of nickel and its
release into the environment, Met. Ions Life Sci. 2007, 2, 1 – 30.
Nriagu JO. Production and uses of chromium. Chromium in natural and human environment.
New York, USA7 John Wiley and Sons; 1988. p. 81– 105.
Page V., Feller U., Selective transport of zinc, manganese, nickel, cobalt and cadmium in the
root system and transfer to the leaves in young wheat plants, Ann. Bot. 2005, 96, 425 – 434.
Paliouris G, Hutchinson TC. 1991. Arsenic, cobalt and nickel tolerances in two populations of
Silene vulgaris (Moench) Garcke from Ontario, Canada. New Phytologist 117: 449–459.
Pandey N., Sharma C. P., Effect of heavy metals Co2+, Ni2+ and Cd2+ on growth and
metabolism of cabbage, Plant Sci. 2002, 163, 753 –758.
Penrice T.W., Tungsten, in: Kirk-Othmer Encyclopedia of Chemical Technology, John Wiley &
Sons, New York, NY, 1997, pp. 572–588.
Pickering IJ, Wright C, Bubner B, Ellis D, Persans MY, Yu EY, George GN, Prince RC, Salt DE
(2003) Chemical form and distribution of selenium and sulfur in the selenium hyperaccumulator
Astragalus bisulcatus. Plant Physiol 131:1–8
Pollard A. J., Powell K. D., Harper F. A., Smith J. A. C., The genetic basis of metal
hyperaccumulation in plants, Crit. Rev. Plant Sci. 2002, 21, 539 – 566.

65
Prasad M. N. V., Nickelophilous plants and their significance in phytotechnologies, Braz. J.
Plant Physiol. 2005, 17, 113 – 128.
Pyatt F.B., Pyatt A.J., The bioaccumulation of tungsten and copper by organisms inhabiting
metalliferous areas in North Queensland, Australia: an evaluation of potential health
implications, J. Environ. Health Res. 3 (1) (2004) 13–18.
Quin B.F., Brooks R.R., The rapid determination of tungsten in solid, stream sediments, rocks
and vegetation, Anal. Chim. Acta 58 (1972) 301–309.
Ragsdale S. W., Nickel biochemistry, Curr. Opin. Chem. Biol. 1998, 2, 208 – 215.
Reeves RD, Baker AJM. 2000. Metal-accumulating plants. In: Raskin I, Ensley BD, eds.
Phytoremediation of toxic metals: using plants to clean up the environment. New York, NY,
USA: Wiley, 193–229.
Riesen O., U. Feller, Redistribution of nickel, cobalt, manganese, zinc and cadmium via the
phloem in young and in maturing wheat, J. Plant Nutr. 2005, 28, 421 – 430.
Rodushkin I., Odman F., Holmstrom H., Multi-element analysis of wild berries from northern
Sweden by ICP techniques, Sci. Total Environ. 231 (1999) 53–65.
Rosenfeld I, Beath OA (1964) Selenium, geobotany, biochemistry, toxicity, and nutrition.
Academic, New York
Salt D. E. et al., in Phytoremediation of Contaminated Soil and Water (Eds: N. Terry, G.
Banuelos), Lewis Publishers, Boca Raton, FL, 2000, pp.189 – 200.
Senesi G.S., Baldassarre G., Senesi N., et al., Trace element inputs into soils by anthropogenic
activities and implications for human health,
Chemosphere 39 (2) (1999) 343–377.
Senesi N., Padovano G., Brunetti G., Scandium titanium tungsten and zirconium content in
commercial inorganic fertilizers and their contribution to soil, Environ. Technol. Lett. 9 (9)
(1988) 1011–1020.
Seregin I. V., Kozhevnikova A. D., Physiological role of nickel and its toxic effects on higher
plants, Russ. J. Plant Physiol. 2006, 53, 257 – 277.
Shacklette H.T., Erdman J.A., Harms T.F., Trace elements in plant foodstuffs, in: F.W. Oehme
(Ed.), Toxicity of Heavy Metals in the Environment. Part 1, Marcel Dekker, New York, 1978, p.
25.
Shanker AK, Sudhagar R, Pathmanabhan G. Growth, Phytochelatin SH and antioxidative
response of Sunflower as affected by chromium speciation. 2nd International Congress of Plant
Physiology on sustainable plant productivity under changing environment, New Delhi, India,
2003a.

66
Shanker AK, Djanaguiraman M, Pathmanabhan G, Sudhagar R, Avudainayagam S. Uptake and
phytoaccumulation of chromium by selected tree species. Proceedings of the International
Conference on Water and Environment held in Bhopal, M.P. India, 2003b.
Sheoran I. S., Singal H. R., Singh R., Effects of cadmium and nickel on photosynthesis and the
enzymes of the photosynthetic carbon reduction cycle in pigeon pea (Cajanus cajan L.),
Photosynth. Res. 1990, 23, 345 – 351.
Sheppard P.R., Witten M.L., Dendrochemistry of urban trees in an environmental exposure
analysis of childhood leukemia cluster areas, EOS Trans. AGU, 84 (46), Fall Meet. Suppl., 2003
(Abstract B12F-07).
Shrift A (1969) Aspects of selenium metabolism in higher plants. Annu Rev Plant Physiol
20:475–495
Skeffington RA, Shewry PR, Petersen PJ. Chromium uptake and transport in barley seedlings Hordeum
vulgare. Planta 1976; 132:209– 14.
Smith G.R., 1994. Materials Flow of Tungsten in the United States. United States Department of
the Interior, Bureau of Mines, Information Circular, C9388,
Stallmeyer B, Schwarz G, Schulze J, Nerlich A, Kirsh J, Mendel RR (1999) The
neurotransmitter receptoranchoring protein gephyrin reconstitutes molybdenum cofactor
biosynthesis in bacteria, plants and mammalian cells. Proc Natl Acad Sci USA 96: 1333–1338
Stark JM, Redente EF (1990) Copper fertilization to prevent molybdenosis on retorted oil shale
disposal piles. J Environ Qual 19: 50–504
Stout PR, Meagher WR, Pearson GA, Johnson CM (1951) Molybdenum nutrition of plant crops:
I. The influence of phosphate and sulfate on the absorption of molybdenum from soils and
solution cultures. Plant Soil 3: 51–87
Strigul N., Koutsospyros A., Arienti P., Christodoulatos C., Dermatas D., W. Braida, Effects of
tungsten on environmental systems, Chemosphere 61 (2) (2005) 248–258.
Sun E. J., Wu F. Y., Along-vein necrosis as indicator symptom on water spinach caused by
nickel in water culture, Bot. Bull. Acad. Sin. 1998, 39, 255 – 259.
Sunderman , F. W. A. Oskarsson, in Metals and Their Compounds in the Environment (Ed: E.
Merian), VCH, Weinheim 1991, pp. 1101 – 1126.
Szalontai B. et al., Molecular rearrangements of thylakoids after heavy metal poisoning, as seen
by Fourier transform infrared (FTIR) and electron spin resonance (ESR) spectroscopy,
Photosynth. Res. 1999, 61, 241 – 252.

67
Terry, N.; Zayed, A. M.; de Souza, M. P.; Tarum, A. S. Annu.Rev. Plant Physiol. Plant Mol.
Biol. 2000, 51, 401.
Trlica MJ, Brown LF (2000) Reclamation of URAD molybdenum tailing: 20 years of monitoring
change. In W Keammerer, ed, Proceedings of the High Altitude Revegetation Workshop, No. 14,
Fort Collins, CO. Cooperative Extension Resource Center, Colorado State University, Fort
Collins, CO, pp 82–133.
Tyler G., Changes in the concentrations of major, minor and rareearth elements during leaf
senescence and decomposition in a Fagus sylvatica forest, Forest Ecol. Manage. 206 (2005) 167–
177.
Ullrich-Eberius CI, Sanz A, Novacky AJ. 1989. Evaluation of arsenate- andvanadate-associated
changes of electrical membrane potential and phosphate transport in Lemna gibba G1. Journal of
Experimental Botany 40: 119–128.
Vitosh M. L., Warncke D. D., Lucas R. E. 1994. Secondary and Micronutrients for Vegetables
and Field Crops. Michigan State University Extension Bulletin E-486.
Vogel-Mikus K., Drobne D., Regvar M., Zn, Cd and Pb accumulation and arbuscular
mycorrhizal colonization of pennycress Thlaspi praecox Wulf. (Brassicaceae) from the vicinity
of a lead mine and smelter in Slovenia, Environ. Pollut. 2005, 133, 233 – 242.
M. Xylander, W. Braune, Influence of nickel on the green alga Haematococcus lacustris
Rostafinski in phases of its life cycle, J. Plant Physiol. 1994, 144, 86 – 93.
Wallace A, Soufi SM, Cha JW, Romney EM. Some effects of chromium toxicity on bush bean
plants grown in soil. Plant Soil 1976;44: 471– 3.
Wallace A., Alexander G.V. and Chaudry F.M. 1977. Phytotoxicity of V, Ti, Ag and Cr.
Communications in soil sciences and plant analysis 8, 751-756.
Warington K. 1951. Some interrelationships between Mn, Mo and V in the nutrition of soybean,
Flax and Oats. Annals of applied biology 38. 624-641.
Warington K. 1954. The influence of iron supply on toxic effects of Mn, Mo and V on Soybean,
Flax and Oats. Ibid 41 1-22.
Wilber GC 1980 Toxicology of selenium: a review. Clin. Toxicol. 17:171–230
Wilson D.O., Cline J.F., Removal of plutonium-239, tungsten-185, and lead-210 from soils,
Nature 209 (1966) 941–942.
White, P.J. et al. (2007) Extraordinarily high leaf selenium to sulfur ratios define ‗Se-
accumulator‘ plants. Ann. Bot. (Lond.) 100, 111–118

68
Zarcinas BA, Cartwright B, Spouncer LR. 1987. Nitric acid digestion and multi-element analysis
of plant material by inductively coupled plasma spectrometry. Communications in Soil Science
and Plant Analysis 18: 131–146.
Xuehong Zhang, Jie Liu, Dunqiu Wang, Yinian Zhu and Cheng Huet al. Bioaccumulation and
Chemical Form of Chromium in Leersia hexandra Swartz Bulletin of Environmental
Contamination and Toxicology, 2009, Volume 82, Number 3, Pages 358-362
Zwolsman J. J. G., van Bokhoven A. J., Impact of summer droughts on water quality of the
Rhine River-a preview of climate change, Water Sci. Technol. 2007, 56, 45 – 55.

69
A LIKELY ROLE OF SELENIUM ON DROUGHT STRESS TOLERANCE IN
BRASSICA JUNCEA AND STANLEYA PINNATA
INTRODUCTION
Several hypotheses have been put forward to explain the functional significance of elemental
hyperaccumulation in plants (Boyd et al., 1992; Mc Nair 2003). These include allelopathy,
drought resistance, and defense against herbivory or pathogens. Most evidence to date supports
the third, elemental defense hypothesis. Hyperaccumulated Zn was shown to protect plants from
invertebrate herbivory (Pollard et al., 1997, Jhee et al.,1999), and Ni hyperaccumulation can
protect plants from caterpillar herbivory as well as fungal and bacterial infection (Boyd et al.,
1994 ; Boyd et al. 1999, Boyd et al. 2002 ; Martens et al., 2002; Gadherian et al., 2002 ).
Selenium also protects plants from herbivory, both by vertebrates and invertebrates (Franke et
al., 1936; Freeman et al., 2006) and, for some authors it seems to have a positive role in drought
stress (Kuznetsov et al. 2003; Djanaguiraman et al. 2005). However, to our knowledge, there has
been limited effort to understand the role of Se in plants under drought condition.
In order to make clear physiological consequences of adaptation to Se accumulation and because
drought stress is considered to be one of the most important agricultural problems and is likely
increasing in the future (Chaves et al. 2002), we have further investigated a possible role of Se in
increasing drought stress tolerance in Stanleya pinnata and Brassica juncea.
Stanleya pinnata is a perennial species of Brassicaceae family and it is considered a Se
hyperaccumulator. In Colorado S. pinnata populations grow on seleniferous soil in a semiarid
environment. S. pinnata can accumulate in leaves up to 3750 mg/Kg d.w. as reported by Galeas
et al. (2007).
Brassica juncea is a secondary Se accumulator (probably because it is an avid S accumulator and
in a condition of S deficiency Se that has similar steric characteristics to that ones of S, can be
uptake by S-transporters) of family of Brassicaceae. In this class of accumulator Scientists have
placed all species that can accumulate in average up to 1000 mg/Kg of Se (Frankenberger and
Benson, 1994).
Hyperaccumulators may tolerate 1000 fold more selenium without exhibiting toxic effects than
non-accumulators. The mode for tolerance in hyperaccumulators may be by one of several
mechanisms. The first involves compartmentalization of selenate or seleno-amino acids in
vacuoles (Terry et al., 2000). : this strategy could change Ψw and Ψs inside the vacuole allowing
plant to limit water loss in a drought stress condition. Dimonstration of this hypothesis is the
target of drought stress simulation in hydroponic.
Bathia et al. (2005) demonstrated that in Stackhousia tryonii Bailey, a Nickel hyperaccumulator,
the removed green canopy is replaced with a new one characterized by Nickel concentration
directly correlated with the severity of applied drought stress. Because Stanleya pinnata is a Se
hyperaccumulator, our focus is reveal a similar behavior in Se management, removing canopy

70
and treating with three levels of drought stress (25% field capacity = no stress ; 15% f.c. ; 7%
f.c.) two groups of Stanleya grown one supplied for 15 months with selenate and a second one
grown without selenate.
To investigate accurately the likely role of Se in drought stress tolerance, a second group of
Stanleya were treated with same tre level of drought stress, leaving the original canopy and
measuring during 30 days water and osmotic potential and chlorophyl fluorescence.
MATERIALS AND METHODS
Drought stress simulation in hydroponics
Brassica juncea seeds from Coloradoan populations were put in a 15 ml tube to be sterilized by
1 minute in ethanol 70% and 30 minute in bleach 30%. After that, seeds were cleaned up from
bleach by five 10 minutes long washes in sterile deionized water; during each wash tubes were
put on the rocker to be gently shacked. Between each wash, water was replaced under sterile
hood. Then, sterilized seeds were put in magenta boxes (30 per box) under sterile hood using
sterile forceps. The medium was agar added with MS salts and vitamins MS 5519. The medium
was prepared as follows : (50 ml per magenta box), 4.46 g/L of MS (M5519, Sigma)+ 30 g/L of
sucrose + some distilled water. After all is dissolved, pH was brought to 5.8 with diluted KOH .
Than solution was brought to final volume with distilled water. We added agar gel 4 g/ L and put
the mixture in autoclave for 21 minutes, then flask was put under hood to cool down to ~ 55 °C .
Sterilized seeds were left to germinate and grow for a week in growth chamber settled as
follows: 150 µmol m-2
s-1
PAR, 70% of humidity, 16 h of day light, 24 °C. After that, plants
were removed from agar, gently extracting the roots with forceps. Roots were washed for some
seconds with distilled water to remove pieces of agargel then seedlings were gently put into a
holed table placed on a 6 L plastic tray (one seedling per hole), filled up with 1/5 strenght
Hoagland nutrient solution. Oxygen exchange was guaranteed by air pumps. Seedlings were
placed to have roots submerged and shoot over the table surface.
Plants were grown at room temperature under artificial light (150 µmol m-2
s-1
). Seventeen
seedlings were grown in nutrient solution only for first and second week and in Hoagland plus 20
µM of Na2SeO4, in the third and fourth week. Other seventeen ones were grown for a month with
Hoagland nutrient solution only. This preliminary step allowed + Se plants to accumulate Se
before drought stress trial was started.
At the beginning of fifth week, in both +Se and –Se tray polyetilenglycol (m.w. 10000- by
SIGMA-Aldrich) was added to nutrient solution in order to bring down water potential to – 0.6
MPa (considering 0.0125 g/ml to have -0.1 MPa of decreasing). Week by week water potential
was brought down until -1.3 MPa, value at which all plants wilted. At the end of each step,
water and osmotic potential (with psycrometer HR 33T by Vescor ,USA) and chlorofyll
71
fluorescence (to determine PSII efficiency at 45 µE and 450 µE with Hansatech Fluorometer
FMS2 (Hansatech Instrument,Norfolk, UK) were measured. Dried leaves (in oven at 55 °C for
48 h) were crumbled to homogenize the samples and weighted between 30 and 60 mg of that -
depending on the amount available of plant tissues- preparing three replicats per treatment.
Following Zarcinas method (Zarcinas et al. 1987), the crumbled tissues, with 1 ml of 95% nitric
acid were put into a 30 cm long glass tubes that were inserted in a digestor under hood. The
digestion program was: 2 hours at 60 °C and 8 hours at 120 °C. The mineralized samples were
brought to 10 ml with deionized water, than they were analyzed by ICP –AES (Inductively
coupled plasma atomic emission spectroscopy) machine to determine Se concentration.
The second drought stress simulation was carried on in the same way except for tray size and
drought stress increase. 6 seedlings were placed in six holes of a plastic cap on a 0.6 L plastic
tray; one tray for +Se plants and one for –Se plants. Drought stress was brought directly from 0
to -1.3, to avoid possible physiological adaptations happening at intermediate stress conditions.
Then, week by week drought stress was increased to -1.6 MPa until final wilting. All
measurements were done as described for first experiment.
Drought stress simulation in agargel
Brassica juncea seeds coming from 2 populations, one grown in a Se addicted soil and one in a
not Se addicted soil, were surface-sterilized as described for previous experiments. Six magenta
boxes were filled up with agargel plus MS salts. Four of them were added with two different
amount of PEG 10000 to obtain two drought stress levels: -0.6 MPa and -1.2 MPa. Each box
hosted 36 seeds. Boxes were placed in growth chamber (150 µmol m-2
s-1
PAR, 70% of
humidity, 16 h of day light, 24 °C) for five days. After that, root length, stem length and total
fresh biomass were recorded for each treatment. Previously, some seeds coming from same two
populations were ICP-AES analyzed to measure Se content.
Experiment with Stanleya pinnata in green house
Stanleya pinnata 15 months old plants, grown in greenhouse in gravel were recruited for this
experiment. Thirty plants were grown in Scott Peters nutrient solution supplemented with 20
µmol Se (as Na2SeO4) and thirty plants were grown without Se. Each plant grew in a 0.4 L
plastic pot. Fifteen +Se and fifteen –Se plants were deprived of green biomass, then each pot
weight plus gravel and plus stem, was recorded. +Se plants and –Se plants were divided in 3
groups corresponding to three levels of drought stress : 5 +Se plants were supplied weekly with
100 ml of nutrient solution, 5 with 60 ml and 5 with 30 ml. Second group of thirty plants were
left unclipped and divided in same groups described above with same levels of drought stress.
Experiment was eight weeks long for clipped plants (July 1st – August 29) and five weeks long
for unclipped plants (July 7-August 16). Each week, chlorophyll fluorescence (to determine PSII
efficiency at 45 µE and 450 µE with Hansatech Fluorometer FMS2 -Hansatech

72
Instrument,Norfolk, UK) and water and osmotic potential of whole plants were measured. At the
end of trial, clipped plant pots were weighed; new canopy was harvested and fresh and dry
weight were recorded; after that Se content of old and young leaves was detected by ICP-AES
machine. Unclipped plant pots were weighed. Canopy of each plant was harvested and fresh and
dry weight were measured. Se content was detected by ICP –AES method.
Stanleya pinnata detached leaves
three leaves of a 15 months old Stanleya pinnata grown in gravel and supplied with 20 µmol Se
(as Na2SeO4) addicted Scott Peters nutrient solution and three leaves of a Stanleya pinnata not
supplied with Na2SeO4 were detached from plants, weighed and left in the dark at room
temperature (26 °C, 50% R.H.) for four hours. Weight was recorded after 20 min. , 40 min., 1 h,
2 h and 4 h.
RESULTS
Drought stress simulation in hydroponic
In the first experiment of drought stress simulation by polyethilenglicol no significant
differences between + Se and – Se plants about water and osmotic potential were observed
(Figure 1 A,B). The greatest gap between +Se and –Se plants is detectable at the end of first
week of treatment at -0.6 MPa of simulated drought stress. Increasing hydroponic water
potential up to -1.3 MPa, eliminated differences completely. Se content in Selenate-added
Brassica plants increased up to 1200 mg/Kg at the end of second week of drought stress, then it
decreased to level before start of experiment (600mg/Kg) (Figure 1 graph C). Chlorophyll
fluorescence didn‘t show significant differences. Fv‘/Fm‘ (the efficiency of the open reaction
centers in the light) seemed lightly affected only close to final wilting, until the day before water
potential increased up to -1.3 MPa (Figure 2 A). NPQ (non photochemical quenching) is
significantly higher than in – Se plants in first steps of experiment, then differences became less
evident (Figure 2 B)
In the second experiment Se content decreased from about 2200 mg/Kg to 1000 mg/Kg showing
the same behavior of first experiment probably due too quick leaf turn over accelerated by
drought stress (Figure 3 C). To avoid physiological adaptation that could hiding a role of
Selenium, plants were brought up immediately to a stress level equal to -1.25 MPa, so only a
0.05 MPa less the limit recorded in the previous trial. Both + Se and –Se holded the stress and
survived some hours up to -1.6 MPa, but + Se plants wilted quicker than – Se ones, differently
from that happened in first trial in which + Se group showed at -1.3 MPa a general better
condition from a visual point of view. Both + Se and –Se shows very similar water and osmotic
potential across entire experiment, while Se concentration in + Se, despite this time
concentration was almost two time higher than that one of first trial (probably due too the week

73
of grow in Hoagland + Selenate addicted), shows the same behavior of first trial with an initial
increase and a following decrease of Se concentration. Like in previous experiment Fv‘/Fm‘
(Figure 4 A) doesn‘t show any differences both between + Se and – Se and inside groups during
the entire experiment, NPQ (Figure 4 B) shows same behavior of previous trial with an initial
higher ratio in favour of + Se group and a following arrangement to higher and similar values.
Drought stress simulation in agargel
Brassica seeds containing Se and other without Se, germinated in PEG added agar gel, shows to
suffer equally the drought stress in term of root and stem length, while in term of biomass
production +Se seedlings shows a fresh biomass 30% greater than –Se in absence of drought and
at -0.6 MPa. No differences at -1.2 MPa. (Figure 8 A,B)
Drought stress applied to Stanleya pinnata in green house
Stanleya pinnata clipped plants in +Se did not show an increase of Se concentration in new
canopy, related with severity of stress (Figure 7 B). + Se plants produced in well watered
condition 22.3% of fresh green biomass more than –Se group, while at 15% and 7% of field
capacity no differences were noted (Figure 7 graph A).
Whole plants (not clipped) did not show significant differences in water and osmotic potential
between +Se and –Se (comparison done by T test) (Figure 5 A,B,C,D,E,F). Analysis of
chlorophyll fluorescence, about Fv‘/Fm‘ did not produce significant differences between +Se and
–Se neither between start and end of trial (Figure 6 graphs A,C,E). Reguarding NPQ we can note
values in +Se plants in average higher than in –Se group in well watered and medium stress
condition, while at 7% f.c. + Se and –Se are similar (Figure 6 graphs B,D,F).
Stanleya pinnata detached leaves
From the same populations of previous experiment three leaves from +Se group and three from –
Se plants were detached and left to dry. After 4 hours –Se leaves have lost roughly 5% of their
fresh weight while +Se leaves have lost 20% (Figure 9).
DISCUSSION
Summarizing the results of all experiments we can conclude that Se accumulation has a positive
role on plant growh in well watered or light stress conditions, as reported for wheat seedlings by
Xiaoquin et al (2009). Clipped Stanleya pinnata plants grown in gravel with Se and +Se
Brassica juncea seedlings showed a fresh biomass production respectively 22.3 and 30% greater
than the same plants and seedlings grown without Se. Not clipped Stanleya pinnata plants in
green house and brassica juncea in hydroponic, seems confirm a light positive effect of

74
Selenium in mild stress conditions. We can note it in the first hydroponic experiment at -0.6 MPa
and -0.8 MPa, while in the second experiment, probably because of the severe drought stress (-
1.25 MPa), +Se and –Se plants don‘t show any significant differences. Chlorophyll fluorescence
analysis don‘t shows particular trends and differences about Fv‘/Fm‘ ratio (the efficiency of the
open reaction centers in the light) while NPQ (non photochemical quenching) could be avoided
in case of marked differences in Fv‘/Fm‘ ratio between +Se and –Se groups, but our Fv‘/Fm‘
values needs a further investigation to understand if and how much drought stress has damaged
photosynthesis. It‘s important to underline that an increase in NPQ, that is a measure of heat
dissipation, report a result either of processes that protect the leaf from light-induced damage or
the damage itself. In first hydroponic trial, although not always supported by statistic
significancy, we can see a lower vaule in fv/fm ratio in +Se plants, corresponding to a higher
NPQ value in comparison with –Se group, that could be evaluated as heavier damage to
photosystem by drought stress ; over that it‘s interesting to note how this phenomenon is more
marked before drought stress in all chlorophyll fluorescence measures (for Brassica in
hydroponic and Stanleya on soil), suggesting a possible negative effect of Se on photosynthesis.
A quantification of some carotenoids like zeaxanthyn, involved in efficiency of heat dissipation,
should be done in order to confirm or discard the hypothesis of a negative effect of Se on
photosynthesis or a positive effect of that one on heat dissipation process.
Measure of detached leaves fresh biomass, should confirm, like water and osmotic potential data,
that Se has not a positive role in cutting off water loss.
Finally we can say Se seems to be not effective in drought tolerance but seems to enhance plant
health in well watered conditions and tolerate light drought stress conditions.
FIGURES

75
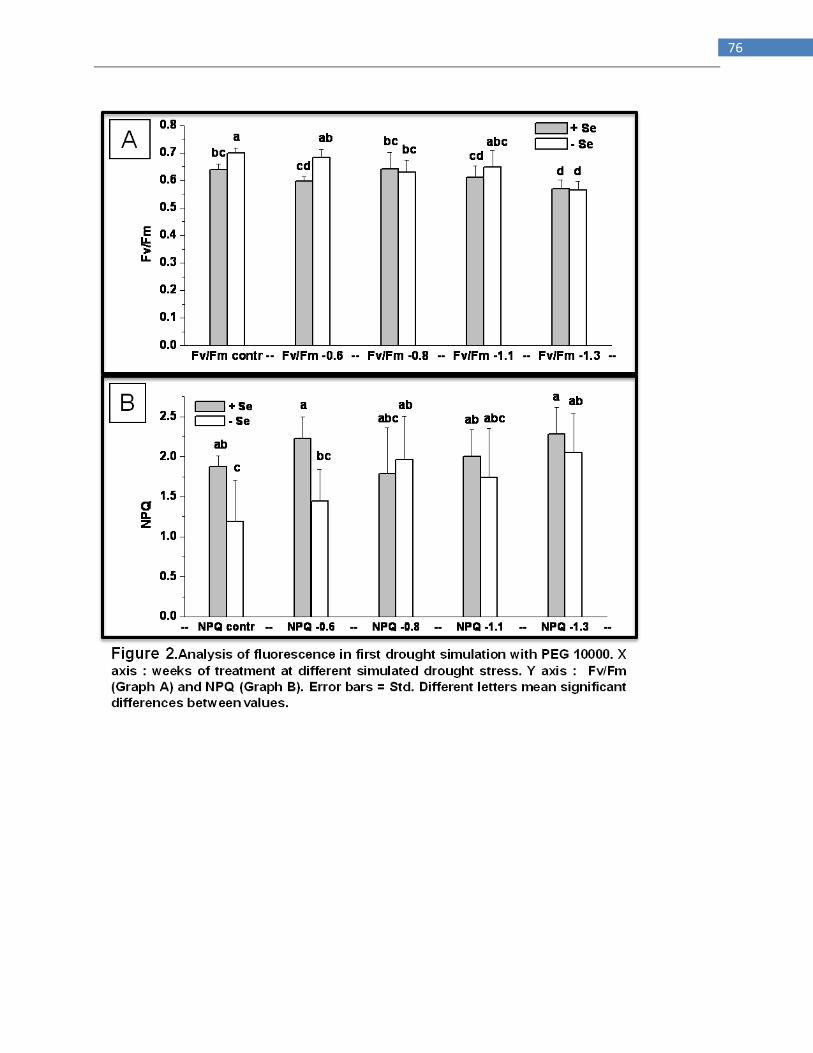
76
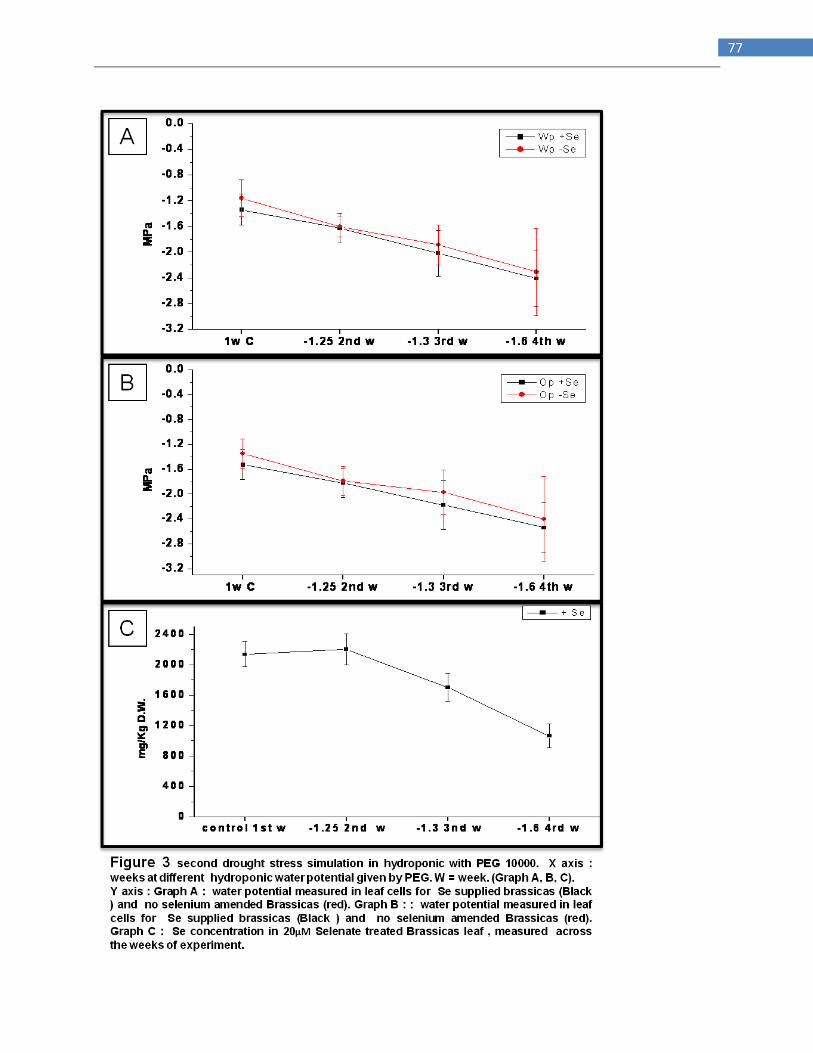
77
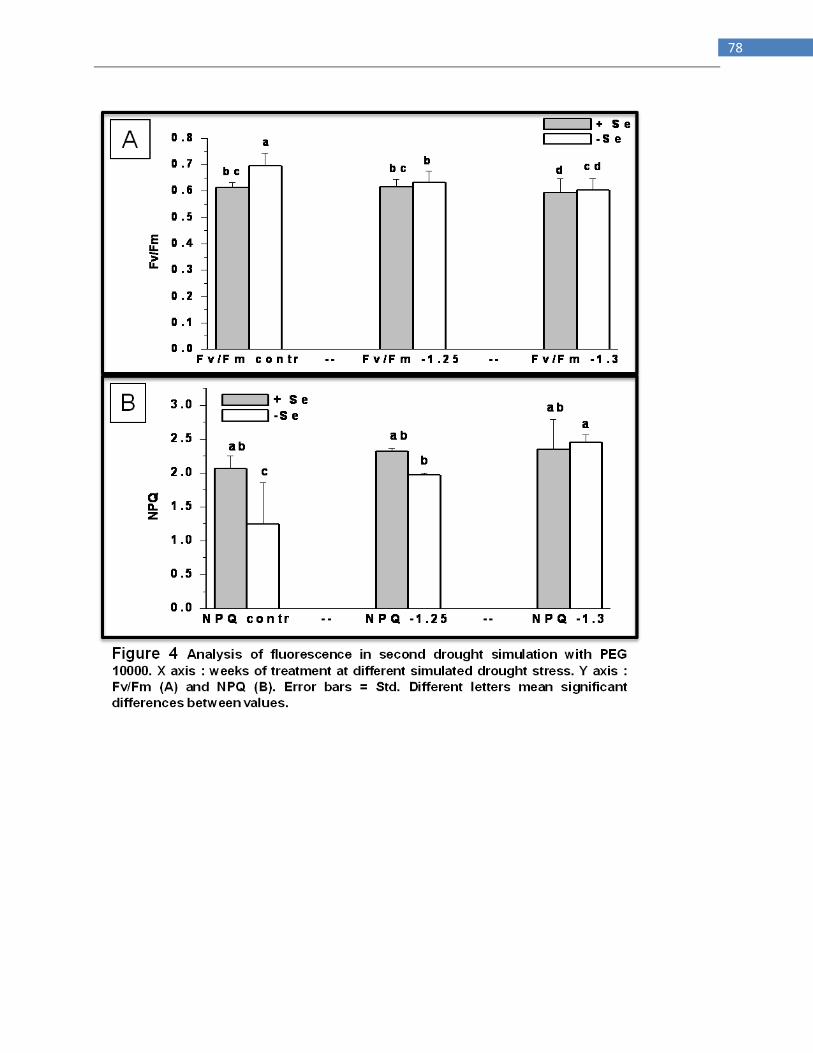
78

79

80
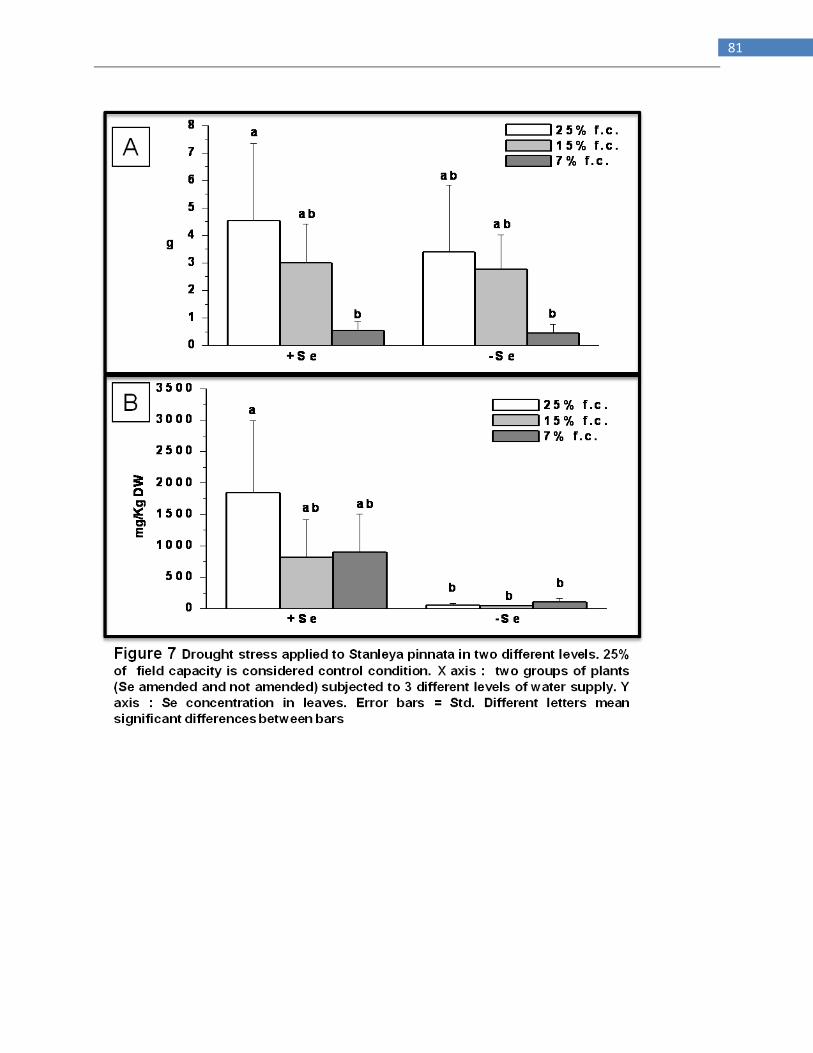
81

82

83
84
BIBLIOGRAPHY
Bhatia N P. , Baker A J. M., Walsh K. B., Midmore D. J. A role for nickel in osmotic
adjustment in drought-stressed plants of the nickel hyperaccumulator Stackhousia tryonii Bailey
Planta (2005) 223: 134–139
Boyd, R.S., and Martens, S.N. (1992). The raison d‘etre for metal hyperaccumulation by plants.
In The Vegetation of Untrafamic (Serpentine) Soils, A.J.M. Baker, J. Proctor, and R.D. Reeves,
eds. (Andover, Hampshire, UK: GB), pp. 279–289.
Boyd, R.S., Shaw, J.J., and Martens, S.N. (1994). Nickel hyperaccumulation defends
Streptanthus polygaloides (Brassicaceae) against pathogens. Am. J. Bot. 81, 294–300.
Boyd, R.S., and Moar, W.J. (1999). The defensive function of Ni in plants: Response of the
polyphagous herbivore Spodoptera exigua (Lepidoptera: Noctuidae) to hyperaccumulator and
accumulator species of Streptanthus (Brassicaceae). Oecologia 118, 218–224.
Boyd, R.S., Davis, M.A., Wall, M.A., and Balkwill, K. (2002). Nickel defends the South African
hyperaccumulator Senecio coronatus (Asteraceae) against Helix aspersa (Mollusca:
Pulmonidae). Chemoecology 12, 91–97.
Chaves MM, Pereira JS, Maroco J, Rodrigues ML, Ricardo CPP, Oso´rio ML, Carvalho I, Faria
T, Pinheiro C (2002) How plants cope with water stress in the field? Photosynthesis and growth.
Ann Bot (Lond) 89:907–916.
Djanaguiraman M, Durga D, Shanker AK, Sheeba A, Bangarusamy U (2005) Selenium—an
antioxidative protectant in soybean during senescence. Plant Soil 272:77–86.
Franke, K.W., and Potter, V.R. (1936). The ability of rats to discriminate between diets of
varying degrees of toxicity. Science 83, 330–332.
Frankenberger, Jr., W. T., Benson, S. 1994. Selenium in the Environment. Marcel
Dekker, Inc. New York, NY, USA.
Freeman J L., Quinn C. F.,3 Marcus M A., Fakra S, and Pilon-Smits E A.H. Selenium-Tolerant
Diamondback Moth Disarms Hyperaccumulator Plant Defense Current Biology 16, 2181–2192,
November 21, 2006.

85
Galeas ML, Zhang LH, Freeman JL, Wegner M, Pilon-Smits EAH (2007) Seasonal fluctuations
of selenium and sulfur accumulation in selenium hyperaccumulators and related non-
accumulators. New Phytol 173: 517–525
Ghaderian, Y.S.M., Lyon, A.J.E., and Baker, A.J.M. (2000). Seedling mortality of metal
hyperaccumulator plants resulting from damping off by Pythium spp. New Phytol. 146, 219–224.
Jhee, E.M., Dandridge, K.L., Christy, A.M., and Pollard, A.J. (1999). Selective herbivory on
low-zinc phenotypes of the hyperaccumulator Thlaspi caerulescens (Brassicaceae).
Chemoecology 9, 93–95.
Kuznetsov VV, Kholodova VP, Kuznetsov VV, Yagodin BA (2003) Selenium regulates the
water status of plants exposed to drought.
Macnair, M.R. (2003). The hyperaccumulation of metals by plants. Adv. Bot. Res. 40, 63–105.
Martens, S.N., and Boyd, R.S. (2002). The defensive role of Ni hyperaccumulation by plants: A
field experiment. Am. J. Bot. 89, 998–1003.
Pollard, A.J., and Baker, A.J.M. (1997). Deterrence of herbivory by zinc hyperaccumulation in
Thaspi caerulescens (Brassicaceae). New Phytol. 135, 655–658.
Terry, N., Zayed, A. M., de Souza, M. P., Tarun, A. S. 2000. Selenium in higher plants.
Annual Reviews of Plant Physiology and Plant Molecular Biology 51: 401-432.
Xiaoqin Yao, Jianzhou Chu, Guangyin Wang (2009). Effects of drought stress and selenium
supply on growth and physiological characteristics of wheat seedlings Acta Physiol Plant
DOI 10.1007/s11738-009-0322-3.

86
Interaction of selenate and molybdate with the transport and
assimilation of sulfate in B. juncea L. Czern.
INTRODUCTION
The uptake of heavy metals and metalloids by plants is regulated by many soil factors, which
may include the presence of competitive ions in the rhizosphere (Hopper and Parker 1999). In
particular, the accumulation of metal/loids belonging to the group VI elements, such as selenium
and molybdenum, is frequently associated with the level of sulfur fertilization (Mikkelsen et al.,
1990; Balík et al., 2006; Mackowiak and Amacher, 2008; Shinmachi et al., 2010; Stroud et al.,
2010a,b).
In many regions around the world selenium (Se) concentration in soils is generally low (<1
ppm). Increased accumulation of Se in soils can derive from industrialization, use of fertilizers
and irrigation water containing selenium (Bisbjerg, 1972). Soils with 0.5–100 ppm Se are
defined as ―seleniferous soils‖ (Dhillon and Dhillon, 2003) and some plant species growing on
them are able to accumulate selenium up to 0.1-1.5% dry weight (Brown and Shrift, 1981;
Freeman et al., 2010).
Selenium-accumulating plants may have potential as fortified food with enhanced nutritional
quality (Zhu et al., 2009) or can be used to reclaim soils in which Se is present at hazardous
levels (Pilon-Smits and LeDuc, 2009). On the other hand, plants grown on seleniferous soils
often contain more than the maximum allowed level for animal dietary intake (40 to 70 μg/d) and may pose a risk to livestock (Fessler et al., 2003; Hartikainen, 2005) and wildlife (Hamilton,
2004) health.
Although Se is an essential element for animals, including humans (Rayman, 2000), its
essentiality for higher plants has not been unequivocally established to date. Nevertheless, the
numerous beneficial effects of Se to plants are recognized (Pilon-Smits et al., 2009).
Plants take up selenium mainly as selenate (SeO42-
) (Ellis and Salt, 2003; Sors et al., 2005).
Owing its close chemical similarity to sulfate, selenate is readily transported over plasma
membranes by the activity of sulfate permeases (Terry et al., 2000; Shibagaki et al. 2002;
Yoshimoto et al. 2002; El- Kassis et al. 2007). Once absorbed by roots, selenate is delivered via
the xylem to the shoot, where it accesses the reductive sulfate assimilation pathway. Selenate is
reduced to sulfide and incorporated in analogues of the sulfur amino acids, selenocysteine (Se-
Cys) and selenomethionine (Se-Met) (Terry et al., 2000; Pickering et al., 2003; Sors et al., 2005;
Freeman et al., 2006). The non-specific insertion of such amino acids into proteins causes the
disruption of their molecular structure and loss of function, and is considered the main reason of
Se toxicity to plants (Terry et al., 2000).
Several transgenic approaches have been used to improve plant Se accumulation, tolerance and
volatilization (Pilon-smits and LeDuc, 2009). They include overexpression of sulfate transporters
and assimilation enzymes (Pilon-Smits et al., 1999), methylation of SeCys (LeDuc et al., 2004),

87
and conversion of SeCys to volatile forms of Se (Van Huysen et al., 2003) or to elemental Se
(Pilon-Smits et al., 2002). It has been proposed that in addition to S assimilation, other metabolic
pathways may be implied in a plant‘s natural capacity to accumulate and tolerate Se (White et
al., 2004), as for instance those involved in ethylene and jasmonic acid biosynthesis (Tamaoki et
al., 2008; Freeman et al., 2010). Furthermore, a Se binding protein, SBP1, has been recently
found to enhance the tolerance of A. thaliana plants to selenate (Agalou et al. 2005; Hugouvieux
et al., 2009), and a number of genes responsible for Se tolerance have been identified via
transcriptome analysis (Van Hoewyk et al., 2008).
Unlike Se, molybdenum (Mo) is an indispensable trace element for plants, being incorporated
into molybdopterin, an essential cofactor for enzymes involved in sulfite detoxification, purine
catabolism, nitrate assimilation, and abscisic acid biosynthesis (Mendel and Hänsch 2002;
Schwarz and Mendel 2006; Hänsch and Mendel, 2009; Schwarz et al., 2009; Kruse et al., 2010).
The hexavalent form (molybdate) is the most common in agricultural soils (Kaiser et al 2005),
and its bioavailability to plants and microorganisms tightly relies on the soil pH and organic
matter, concentration of adsorbing oxides, and rate of water drainage (Reddy et al., 1997). In
acidic soils, for instance, Mo tends to be unavailable to plants. This is why most Mo deficiencies
occur on acid, rather than on neutral or alkaline soils (Kaiser et al., 2005).
The concentration of Mo in soils can increase as a result of industrial, mining and agricultural
activities (Gupta, 1997), and excess Mo is known to reduce plant growth and thus productivity
(Kevresan et al. 2001; Liu and Yang 2003; Nautiyal and Chatterjee 2004).
Although Mo transport and homeostasis have been well characterized in bacteria and some
eukaryotes (Mendel and Häensch, 2002), in plants still relatively little is known about the
mechanisms of Mo transport, distribution and accumulation inside cells, and only in recent years
a high-affinity Mo transporter (MOT1) has been isolated and characterized in A. thaliana
(Tomatsu et al., 2007). Although MOT1 belongs to the sulfate transporter superfamily, it seems
not to work in sulfate transport (Tomatsu et al. 2007). MOT1 is localized to mitochondria and, in
part, to plasma membranes and to vesicles (Tomatsu et al., 2007; Baxter et al., 2008). It is mainly
expressed in roots, especially levels in endodermis and stele cells. However, its expression can
also be detected in the shoot, and for this reason MOT1 is believed to function as a regulator of
total plant Mo accumulation and homeostasis (Baxter et al., 2008; Tejada-Jiménez et al., 2009).
Plants have long been assumed to take up molybdate through sulfate transporters, as the two
anions are chemical analogues and may compete for the binding site of the same transporters
(Dudev and Lim 2004; Alhendawi et al 2005). Indeed, expression of the sulfate transporter
SHST1 from Stylosanthes hamata in a Saccharomyces cerevisiae mutant defective in sulfate
transport, YSD1, increased its capacity to take up molybdate when grown in the presence of low
Mo concentrations (Fitzpatrick et al., 2008). While sulfate did not inhibit the transport of Mo
through this transporter, molybdate reduced sulfate transport via SHST1. In addition to sulfate
transporters, phosphate transporters have been suggested as potential transporters of molybdate
across the plasma membrane (Heuwinkel et al., 1992).

88
Once inside cells, Mo can interfere with S metabolism being a substrate for the reaction
catalyzed by the enzyme ATP sulfurylase (APS). The same is true for selenate, but in contrast to
selenate, no stable Mo-containing products are formed in the reaction (Reuveny, 1977).
Overexpression of APS in B. juncea led to increased Mo accumulation, but lower tolerance. The
reduced tolerance to Mo was perhaps because APS couples ATP to Mo to form a complex that is
unstable, resulting in a loss of ATP (Wangeline et al., 2004).
The relationship between Se and S, or between Mo and S, has practical significance for crop
production as it allows the manipulation of Se and Mo accumulation and distribution in plant
tissues through S application (MacLeod et al, 1997; Balìk et al., 2006; Shinmachi et al., 2010).
The use of sulfur-containing fertilizers to correct soil S deficiency, for instance, may reduce Se
accumulation in crops (Stroud et al., 2010a,b; Shinmachi et al., 2010) and cause Mo-deficiency
(MacLeod et al., 1997). Furthermore, whether plants are used for Se and Mo phytoremediation
purposes, high S content in soil might interfere with their capacity to remove inorganic forms of
the two elements.
On account of this, the present research was intended to deeply study the interactions of S
nutrition with Mo and Se in B. juncea, sulfur‘s lover species frequently employed in
phytoremediation.
To this aim, plants were supplied with different combinations of S and Se, or S and Mo (see
Materials and Methods). Experiments were carried out over a short time period (24 h) because
selenate and molybdate were given to plants at a very high concentration (200 M), the same as
that of sulfate in the S-sufficient condition. Physiological and biochemical analyses were
performed, including measurement of plant growth and quantification of elements (Mo, Se and
S), sulfate and thiols (cysteine and glutathione) in plant tissues. In addition, the sulfate uptake
capacity of plants was assayed, as well as the transcript levels of a putative low affinity sulfate
transporter involved in sulfate xylem loading (BjSultr2;1), SBP1 and MOT1 in roots.
MATERIALS AND METHODS
Plant material
Seeds of B. juncea (L.) Czern. (Cv. PI 426314) were surface-sterilized by rinsing in 70% (v/v)
ethanol for 30 – 60 s, then in 5% (v/v) sodium hypochlorite (NaClO) for 30 min while rocking
on a platform, and washed in distilled water for 5 x10 min. The seeds were allowed to germinate
and grow for 8 d in half-strength MS agar medium (Murashige and Skoog, 1962) inside a
chamber with a 13 h light/11 h dark cycle, air temperature of 20/15 °C, relative humidity of
70/85% and at a photon flux density (PFD) of 280 mol m-2
s-1
. Subsequently, germinated
seedlings were transferred and cultivated for 4 d to 3 L plastic beakers (density = 16 plants per
beaker) containing a thoroughly aerated Hoagland modified nutrient solution with the following
composition (µM): KH2PO4 40, Ca(NO3)2 200, KNO3 200, FeNaEDTA 10, B 4.6, Cl 1.1, Mn
89
0.9, Zn 0.09, Mo 0.01. Part of the plants was supplemented with 200 µM MgSO4, and part was
grown in the absence of S. In the latter case, MgCl2 (200 µM) replaced MgSO4. The nutrient
solution in each beaker was renewed every two days.
Seedlings were then divided into 6 groups and grown for 24 h under the following conditions:
with 200 µM sulfate (+S), without sulfate (-S), with 200 µM sulfate plus 200 µM selenate
(+S+Se), no sulfate plus 200 µM selenate (-S+Se), with 200 µM sulfate plus 200 µM molybdate
(+S+Mo), no sulfate plus 200 µM molybdate (-S+Mo). In the solutions lacking sulfur, MgSO4
was replaced by 200 µM MgCl2. Selenium and molybdenum were supplied in the form of
natrium selenate (Na2O4Se) and ammonium molybdate ((NH4)6Mo7O24), respectively.
B. juncea seedlings were harvested at different time points (0, 10 min, 1 h, 6 h and 24 h),
carefully washed with distilled water to remove any Se or Mo bound to the root surface, and
dried with blotting paper. Part of the plant material was immediately frozen with liquid nitrogen
and kept at –80°C for further molecular and physiological analyses. For fresh weight
measurements, ten plants per treatment were used and weighed separately. Plant tolerance to Se
or Mo was expressed as relative fresh weight (also known as tolerance index) calculated as fresh
weight observed in the presence of the metal/loid divided by fresh weight under the control
condition (+S). The experiment was replicated three times.
Elemental analysis
Foliar and root tissues were dried for 48 h at 80° C and then digested in nitric acid as described
by Zarcinas et al. (1987). Inductively coupled plasma atomic emission spectroscopy (ICP-AES)
was used as described by Fassel (1978) to determine each digest‘s elemental concentrations.
Sulfate content
Fresh foliar and root tissues (500 mg) were ground in liquid nitrogen and extracted with 10 ml of
distilled water. The samples were incubated for 2 h in a heating block at 85°C. The extracts
obtained were filtered and analysed by HPLC using a Dionex IonPac AS11 4 mm column,
coupled to guard column AG 14. The column was eluted over a period of 18 min with 3.5 mM
Na2CO3/1 mM NaHCO3 in H2O, at a flow rate of 0.9 ml/min and at 1400 PSI pressure. Sulfate
content was expressed in mg kg-1
f. wt. and data were the means of five replicates per treatment
with fifty plants in each replicate.
Sulfate uptake
Sulfate uptake experiments were carried out as described by Quaggiotti et al. (2003), using the
radioisotope 35
S–(SO42-
) furnished by Perkin Elmer Life Sciences (Boston, MA, USA). The
sulfate uptake capacity was assayed in plants grown under the conditions +S, -S, +S+Se, -S+Se,
+S+Mo, -S+Mo. Also, to compare the effects of Se and Mo to the ones induced by S, the uptake
of sulfate was evaluated in +S and –S plants added with 200 mM sulfate (+S+S and -S+S,
respectively).

90
Sulfate uptake rates were measured at times 10 min, 30 min, 1 h, 6 h, or 24 h after the addition of
S, Se or Mo to sulfur-sufficient and sulfur-starved plants. Groups of eight plants per each
treatment were transferred for 5 min to vessels containing a complete nutrient solution buffered
with 15 mM Tris–MES, pH 5.6. Sulfate in the solutions (200 µM MgSO4) was labelled with 35
SO42-
(5 MBq mmol-1
). The temperature of the solutions was maintained at 23°C and a lamp
(OSRAM 400 W – HR) with a PFD of 280 mmol m-2
s-1
provided an adequate light supply. After
the uptake period the plants were removed and placed with their roots in ice–cold unlabelled
solution for 2 min to remove sulfate that passively entered the apoplastic root space. Shoots and
roots were harvested separately, blotted dry, weighed and digested for 24 hours with 10 ml of 0.1
N HCl at room temperature. Extract (1 ml) was added to 4 ml of liquid scintillation fluid
(Hionic-Fluor 6013319, Packard Bioscience, The Netherlands), and the radioactivity was
determined using a liquid scintillation counter (Packard Instruments, Downers grove, IL). The
experiment was replicated three times.
Semi-quantitative RT-PCR
Extraction of total RNA from frozen roots was performed using the Nucleon Phytopure kit
(Amersham-Pharmacia, UK). The RNA was analyzed spectrophotometrically (A280/A260), and
electrophoresis (1% agarose gel) was used to verify intact nucleic acid. RNA was then treated
with 10 U of Dnase RQ1 (Promega, Milano, Italy) per 50 μg RNA at 37°C for 30 min. Five μg of
RNA from each treatment were used in the reverse transcriptase reaction, using 200 U of
ImProm-II™ Reverse Transcriptase (Promega, Milano, Italy) and oligodT as primers in 20 μl
reaction mixtures. Mixtures were incubated at 37°C for 60 min, 70°C for 5 min, and 4°C for 5
min to stop the RT reaction. PCR experiments were performed using primers designed on
conserved sequences of PP2A (phosphatase 2A), MOT1 and SBP1 genes from A. thaliana, and
primers specific for BjSultr2;1 from B. juncea (Table 1). For all PCR reactions, 1 μl of the
cDNA was used in a 20 μl reaction mixture with 2 μl of a 0.025 U/μl Taq polymerase
(Amersham-Pharmacia-Biotech, Piscataway, NJ, USA). Between 14 and 30 cycles were tested to
determine the optimal number of cycles, corresponding to the exponential phase in the
amplification for each gene. The annealing temperature varied from 54°C to 61°C depending on
the gene transcript. The constitutively expressed PP2A gene was used as internal control to
normalize the obtained gene expression results. PCR products were separated by electrophoresis
in a 2% agarose gel, stained with SYBR® Safe (Invitrogen, San Giuliano Milanese, MI, Italy)
and analyzed with the ImageJ program (ImageJ 1.23 J, Wayne Rasband, National Institute of
Health). To confirm the expression analysis results, PCR reactions were carried out on cDNAs
obtained from two different RNA extractions from two independent experiments, and were
repeated at least 4 times for each cDNA.
DNA was eluted from the agarose gel with the QIAquick Gel Extraction-Kit Protocol (QIAGEN,
Valencia, CA, USA) kit. Gene sequencing was carried out at the BMC Genomics (Padova, Italy),
using the ABIPRISM original Rhodamine Terminator kit (PE Biosystems, Branchburg, NJ,

91
USA) and specific and universal primers. Gene sequences were further compared with Blastx
and Blastn (NCBI, http://www.ncbi.nlm.nih.gov/entrez/query.fcgi) (Table 2).
Statistical Analysis
Analysis of variance (ANOVA) was performed followed by pairwise post-hoc analyses to
determine which means differed significantly. Statistically significant differences (P<0.05) are
reported in the text and shown in the figures.
RESULTS
Plant growth
The effect of selenate and molybdate on plant growth (tolerance index) was evaluated in terms of
fresh weight production relative to the control treatment (+S = 100%) at the 24 h time point
(Table 2). The fresh weight of –S plants slightly decreased compared to the control, and was
more reduced in plants supplied with Se or Mo, especially in the absence of S (-14.6% and -
21.3% for –S+Se and –S+Mo, respectively). The root-to-shoot ratio was unchanged over the 24 h
in +S and -S plants, but diminished in plants supplied with Se or Mo (Table 3).
Accumulation of Se, Mo, S and sulfate in plant tissues
Selenium and Mo accumulated in plants in a similar way, as a function of time and S availability.
Both Se and Mo accumulated to a greater extent in –S plants, with the maximum values
measured after 24 h (Figure 1). While both elements were offered at the same concentration, Mo
accumulated to a higher level than Se. Specifically, after 24 h the Mo level was roughly 5- and
10-fold the concentration of Se in leaves and roots, respectively.
The S concentration in plants grown in the presence of S was almost 2-fold higher than in S-
starved plants (Figure 2). Sulfur levels decreased only in +S+Se (-25%) and +S+Mo (-31%)
plants after 24 h. At this time, the ratio S/Se was about 76 in leaves and 19 in roots of +S plants,
while in – S plants it was 22 in leaves and 12 in roots. In leaves of +S+Mo and –S+Mo plants,
the ratio S/Mo was 14 and 7, respectively. In roots the S/Mo ratio was lower, being 4 in +S
plants and 0.9 in –S plants.
The sulfate pool was steady in the +S control, whereas it slightly decreased over 24 h in leaves of
-S plants (Figure 3). When selenate was added to the nutrient solution, the sulfate content was
reduced in leaves of +S plants after 6 h (Fig 3A), while it increased in roots after 24 h (Figure 3
C). Conversely, in –S+Se plants sulfate accumulated in leaves (Figure 3 A) and concomitantly
diminished in roots (Figure 3 C). In plants supplied with molybdate, the amount of sulfate

92
diminished in both roots and leaves of S-sufficient and S-starved plants already after 1 h (Figures
3 B,D).
Effects of Se and Mo on sulfate uptake
uptake activity in B. juncea, the influx of sulfate was measured using 35
SO42–
as a tracer (Figure
4). In +S and -S plants the rates of sulfate uptake were steady over 24 h. Specifically, plants of
the -S condition exhibited sulfate uptake rates 4-fold higher than S-replete plants (3079 ± 95 vs.
754 ± 66 nmol SO42–
g-1
h-1
f.wt.).
Treating S-sufficient plants either with Se or Mo led to a considerable decrease of the sulfate
uptake capacity after 24 h (Figure 4 A). The reduction of sulfate uptake was more pronounced in
+S+Se plants (- 55%) compared to +S+Mo plants (- 30%). In +S+S plants sulfate influx was
almost linearly reduced with increasing time of exposure, and after 24 h the reduction was
approximately 75% of the +S control (Figure 4 A).
The supply of Se or Mo to –S plants resulted in a substantial decrease in sulfate uptake rate after
10 min, especially in –S+Mo plants (- 47%). At the 24 h time point the sulfate uptake rate was
drastically repressed (~ - 95%) in both –S+Se and –S+Mo plants (Figure 4 B).
Given that sulfate uptake is known to be reduced when plants grow in the presence of S, the
sulfate influx was also measured in S-deprived plants to which sulfate was restored (-S+S)
(Figure 4 B). In this way it was possible to compare the effects of sulfate addition on sulfate
uptake with the effects of the analogues selenate and molybdate. As observed for –S+Se and –
S+Mo plants, the rates of sulfate uptake were reduced after 10 min of sulfate restoration to –S
plants (- 40%), and the maximum repression was recorded at 24 h (- 87%).
Effect of selenate, molybdate and sulfate on the transcript levels of BjSultr2;1,
SBP1 and MOT1.
The effects of selenate and molybdate on sulfate transport in B. juncea were also evaluated at the
transcriptional level. The transcript level of the low affinity sulfate transporter BjSultr2;1 was
higher in –S plants compared to the +S control (Figures 5 A, B). In –S plants the BjSultr2;1
transcript abundance significantly decreased after 6 h of Se exposure, while in +S+Se plants a
reduction was observed after 24 h (Figure 5 A). When plants were grown in the presence of
molybdate, the transcript level of BjSultr2;1 did not vary in S-sufficient plants (+S+Mo), but was
strongly repressed in –S+Mo plants after 6 h (Figure 5 B).

93
The transcript level of the selenium binding protein, SBP1, was higher in –S plants than in the +S
control (Figures 5 A, B). Treating +S plants with selenate promptly enhanced SBP1 expression,
whereas in –S plants the SBP1 transcript level was reduced after 6 h (Figure 5 A). Up-regulation
of SBP1 by molybdate was evident in +S and –S plants only at the 24 h time point (Figure 5 B).
With respect to the molybdate transporter MOT1, transcript abundance was comparable in +S and
–S plants (Fig 5 A, B). After 10 min of molybdate treatment, MOT1 transcript was induced to a
similar extent in +S+Mo and –S+Mo plants, and remained unchanged within 24 h. On the
contrary, treating plants with Se had no effect on MOT1 gene expression.
The effect of sulfate restoration to S-deprived plants (-S+S) on BjSultr2;1, SBP1 and MOT1 gene
expression was further evaluated (Figure 5 C). The transcript level of BjSultr2;1 and SBP1 was
appreciably reduced by sulfate resupply, while the MOT1 transcript level was unchanged.
In +S+S plants, the transcript levels of BjSultr2;1 and SBP1 were weakly down-regulated after 24
h of extra S addition, and MOT1 transcript was unchanged (data not shown).
Effects of Se and Mo on S-containing compounds
Selenium is known to interfere with S metabolism and, like Mo, may influence the synthesis of
non-protein thiols involved in plant responses to metal stress. Therefore, the effects of selenate
and molybdate on cysteine (Cys) and glutathione (GSH) contents were evaluated. In +S and -S
plants the levels of Cys (Table 4) and GSH (Table 5) did not vary over the period of study. The
supply of selenate to S-sufficient plants significantly lowered the Cys level in roots after 10 min,
while 1 h of Mo exposure reduced Cys in both foliar and root tissues. In +S+Se plants GSH
levels decreased in roots after 1 h and in leaves after 6 h. When +S plants were grown in the
presence of Mo, the reduction of GSH was observed already after 10 min in roots and only after
24 h in leaves of +S+Mo.
In S-deficient plants treated with Se, the Cys concentration increased in roots (after 6 h) and in
leaves (after 24 h). In –S+Mo plants Cys accumulated more after 24 h of treatment in roots. The
synthesis of GSH was enhanced in roots and leaves of –S+Se plants after 6 h. In –S+Mo plants,
increased levels of GSH were observed at 1 h and 6 h after Mo supply in leaves, while no
variations was recorded in roots.
DISCUSSION
Accumulation of high levels of molybdenum and selenium in plant tissues may be desirable for
phytoremediation purposes. However, the presence of sulfur in soil may significantly influence
the distribution and accumulation of molybdenum and selenium in plants (Balìk et al., 2006;;
Shinmachi et al., 2010).
To provide new insights for the efficient use of plants in Se or Mo phytoremediation, the present
research was aimed at studying the interaction of selenate and molybdate with the transport and

94
assimilation of sulfate in B. juncea. Selenate and molybdate were given to plants at high
concentration (200 M), which was the same of sulfate in the S-sufficient condition, to compare
the effects of Se and Mo with the ones of sulfate on sulfur assimilation. The use of equimolar
concentrations of Se, Mo and S was also helpful to study the effects of sulfur on the
accumulation of Se and Mo in plant tissues.
The exposure of plants to 200 M Se or Mo concentration for 24 h caused retardation of plant
growth. The toxic effect of Se or Mo was more pronounced in S-deficient plants, although it was
significantly different from the +S condition only in plants treated with molybdate. The presence
of Se or Mo affected more root growth, as proved by the decrease of the root/shoot ratio in plants
treated either with Se or Mo. This is in accordance with Shibagaki et al. (2002) and El-Kassis et
al. (2007), who reported that root growth is the potential target of Se toxicity, and with Kevresan
et al. (2001) who observed a 50% root growth reduction in pea plants treated with Mo.
From the literature it is known that [S]/[Se] ratio in plants is more important than the Se content
alone for determining Se toxicity (White et al., 2004; El-Kassis et al., 2007; Barberon et al.,
2008). Plants that manifest toxicity symptoms in response to Se application usually have a low
[S]/[Se] ratio (White et al., 2004). In contrast, in our study the level of Se toxicity in +S and – S
plants was similar after 24 h, as no differences were measured in the tolerance index, although
the ratio S/Se was much lower in sulfur deficiency. It seems that the Se content rather than the
S/Se ratio was mainly responsible for toxicity, since a similar amount of Se was recorded in roots
of S-sufficient and S-starved plants.
The importance of [S]/[Mo] ratio as an indicator of Mo toxicity in plants has not been proven yet.
However, Mo toxicity was found to decrease in different plant species when S was added to soil,
as a result of reduced Mo uptake (McGrath et al., 2010). The ratio S/Mo resulted lower in –S
plants, as in the case of Se. However, the toxicity effect was more pronounced in –S plants than
in +S plants, as confirmed by the significant reduction of tolerance, and could be related to the
higher amount of Mo measured in the roots.
Selenate and molybdate are known to influence the assimilation of sulfate in plants by interfering
with the S transport system (White et al., 2004; Fitzpatrick et al., 2008).
The reduction of the sulfate uptake capacity in S-sufficient Brassica plants exposed to selenate or
molybdate appeared after 24 h of treatment. On the contrary, the addition of 200 M sulfate
(+S+S plants) reduced the rates of sulfate uptake already after 30 min. Sulfur has been previously
reported to decrease the sulfate uptake capacity when measured at S concentration lower than the
one at which plants were cultivated (Koralewka et al., 2007). The same effect was observed in B.
juncea plants after short-term exposure to the sulfate analogous chromate (Malagoli, unpublished
results).
Our findings indicated that molybdate and selenate do not act as sulfate or chromate in down-
regulating sulfate uptake in sulfur-sufficient plants. However, the observed Se and Mo
accumulation in the first 6 h of treatment indicate that Se and Mo are taken up by plants, likely
through transport systems different from the sulfate one. For instance, with respect to Mo, the up-
regulation of the MOT1 transporter-coding gene was observed in B.juncea plants after short

95
exposure to molybdate. For Se, specific root transporters have not been identified yet, although
their existence has been hypothesized in Se accumulators (Sors et al., 2005).
After 24 h of treatment, the sulfate uptake and the BjSultr2.1 transcript level were remarkably
reduced in +S+Se plants, whereas in +S+Mo only the sulfate uptake was partially reduced and no
variation in BjSultr2.1 transcript accumulation was observed. The stronger effect of Se on S
transport may ascribe to the replacement of S by Se in the sulfur metabolic pathways leading to
the disruption of structure and function of proteins (Pilon-Smits and LeDuc, 2009).
In -S plants sulfate uptake is repressed similarly by the three anions already after 10 min.
However, the regulation of sulfate uptake appears to be different in plants treated with Se or Mo
compared to –S+S plants. Indeed, the repression of BjSultr2.1 transcript accumulation is
consistent with the sulfate uptake reduction in -S+S plants, while in –S+Mo and –S+Se plants the
BjSultr2.1 transcript level decreased only after 6 h. It is well known that sulfate repletion down-
regulates sulfate transporters at the transcriptional level (Maruyama-Nakashita et al., 2003;
Rouached et al., 2008; Koralewska et al., 2009). To our knowledge, a similar effect on regulating
sulfate transporter genes by Se or Mo has not been reported, It may be assumed that the
immediate reduction in sulfate uptake in -S+Se and -S+Mo plants could be due to selenate or
molybdate binding to the active sites of the root plasma membrane sulfate transporters, which
was favoured by the lack of competition between sulfate and the analogues oxianions for the
transport across plasmalemma. As a consequence, the transport of molybdate and selenate
through the sulfate carriers could occur and may justify the higher Se and Mo accumulation in S-
starved plants than in +S plants, as reported in previous studies (Pezzarossa et al. 1999,
Alhendawi et al. 2005, Balìk et al. 2006, Fitzpatrick et al. 2008). In addition, Shimanchi et al
(2010) showed that enhanced expression of sulfate transporters in roots of wheat plants grown at
low S-fertilization caused a remarkable accumulation of Se and Mo.
The observation that MOT1 expression did not vary in relation to S availability indicate that this
transporter is not responsible for the higher accumulation of Mo in S-starved plants and supports
the evidence that molybdate can be taken up by other transporters, including the sulfate ones
(Fitzpatrick et al., 2008). MOT1 only partially contributes to Mo accumulation and can be
considered a transporter specific for molybdate as its transcript did not change in +Se plants.
Selenium and molybdenum influenced not only sulfate transport but also sulfur assimilation. In
+S plants, Se and Mo treatments affected the synthesis of S-compounds (Cys and GSH) likely
due to the competition of selenate and molybdate with sulfate for their access to the sulfur
metabolic pathway. This competition is known to cause the disruption of sulfur metabolism and
the reduced synthesis of sulfur-containing compounds, such as Cys and glutathione (El-Kassis et
al., 2007). In S-starved plants supplied with either Se or Mo the level of Cys and GSH increased
in most respects, although the S content did not change substantially. It may be hypothesized that
the S pool was directed towards the synthesis of S-containing stress molecules to cope the
toxicity effects caused by high Se and Mo concentration, as shown for other metals (Heiss et al.,
2001).

96
B. juncea plants could also synthesize the selenium binding protein 1 at high level in response to
Se and Mo toxocity. The expression analysis of SBP1, confirmed that its transcript is more
accumulated under S-starvation (Hugouvieux et al, 2009). However, treating –S plants with
selenate decreased the level of SBP1 transcript since 6 h treatment, likely because of higher GSH
accumulation. Indeed, glutathione has been proved to act as a negative regulator of SBP1 gene
expression when exogenously supplied to plants (Hugouvieux et al, 2009). The addition of
selenate to +S plants promptly induced the accumulation of SBP1 transcript, indicating that in B.
juncea the protein is involved in Se tolerance. A similar result was previously reported in A.
thaliana (Hugouvieux et al, 2009).
SBP1 could be also involved in Mo tolerance since SBP1 transcript significantly increased in
both +S+Mo and –S+Mo plants. However, as the increase was observed only after 24 h
treatment, it may be hypothesized that very high concentration of Mo in plants can induce SBP1
gene expression.
In conclusion, the present study provides evidence that selenate and molybdate interfere with sulfate
transport, mainly when plants grown under S-deficiency. The way through which Se and Mo can
affect S uptake and sulfate transporter gene expression is different form that one reported for sulfur,
indicating that selenate, molybdate and sulfate trigger different signals for the regulation of S
transport. Given the high values of Se and Mo accumulation in plants and the trend of sulfate uptake
in –S and +S plants, it may be evinced that Se and Mo could be taken up by plants by more than one
transport system.
Se and Mo influenced the S-assimilatory pathway by changing the content of S-metabolites and
induced the transcription of proteins involved in metal tolerance and regulated by S availability to
plants.

97
FIGURES

98

99

100

101
TABLES
Gene Forward primer 5’-3’ Reverse primer 5’-3’
PP2A TGCTATTCAGCACATTCTCCCTTGCG GCGCCAAGCTTATCGTCAAAGAAGC
BjSultr2;1 TACTTCACAAATTGAAACGAG GGACAATATATCATTTATTCTG
SBP1 TGCCGGGGCTAATCACCGACT CCGTCTTCTCCAACCGCCTTAACA
MOT1 TCTGTTGTGGCTGTGTGTAAGCTG ACCCACCACTCCTCCCACCAA
Table 1. Oligonucleotide primer name and sequence for primers of B. juncea used in RT-PCR
reactions. PP2A: protein phosphatase 2A; BjSultr2;1: sulfate transporter; SBP1: selenium binding
protein; MOT1: molybdenum transporter.
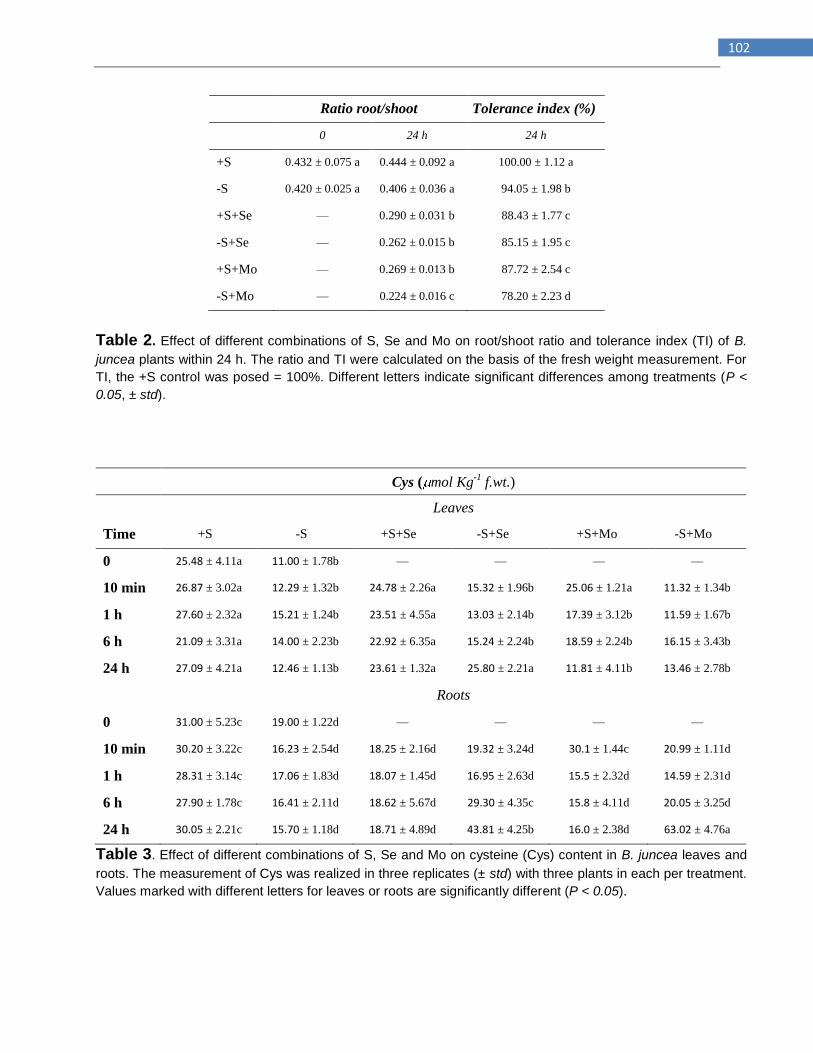
102
Ratio root/shoot Tolerance index (%)
0 24 h 24 h
+S 0.432 ± 0.075 a 0.444 ± 0.092 a 100.00 ± 1.12 a
-S 0.420 ± 0.025 a 0.406 ± 0.036 a 94.05 ± 1.98 b
+S+Se — 0.290 ± 0.031 b 88.43 ± 1.77 c
-S+Se — 0.262 ± 0.015 b 85.15 ± 1.95 c
+S+Mo — 0.269 ± 0.013 b 87.72 ± 2.54 c
-S+Mo — 0.224 ± 0.016 c 78.20 ± 2.23 d
Table 2. Effect of different combinations of S, Se and Mo on root/shoot ratio and tolerance index (TI) of B.
juncea plants within 24 h. The ratio and TI were calculated on the basis of the fresh weight measurement. For
TI, the +S control was posed = 100%. Different letters indicate significant differences among treatments (P <
0.05, ± std).
Cys ( mol Kg-1
f.wt.)
Leaves
Time +S -S +S+Se -S+Se +S+Mo -S+Mo
0 25.48 ± 4.11a 11.00 ± 1.78b — — — —
10 min 26.87 ± 3.02a 12.29 ± 1.32b 24.78 ± 2.26a 15.32 ± 1.96b 25.06 ± 1.21a 11.32 ± 1.34b
1 h 27.60 ± 2.32a 15.21 ± 1.24b 23.51 ± 4.55a 13.03 ± 2.14b 17.39 ± 3.12b 11.59 ± 1.67b
6 h 21.09 ± 3.31a 14.00 ± 2.23b 22.92 ± 6.35a 15.24 ± 2.24b 18.59 ± 2.24b 16.15 ± 3.43b
24 h 27.09 ± 4.21a 12.46 ± 1.13b 23.61 ± 1.32a 25.80 ± 2.21a 11.81 ± 4.11b 13.46 ± 2.78b
Roots
0 31.00 ± 5.23c 19.00 ± 1.22d — — — —
10 min 30.20 ± 3.22c 16.23 ± 2.54d 18.25 ± 2.16d 19.32 ± 3.24d 30.1 ± 1.44c 20.99 ± 1.11d
1 h 28.31 ± 3.14c 17.06 ± 1.83d 18.07 ± 1.45d 16.95 ± 2.63d 15.5 ± 2.32d 14.59 ± 2.31d
6 h 27.90 ± 1.78c 16.41 ± 2.11d 18.62 ± 5.67d 29.30 ± 4.35c 15.8 ± 4.11d 20.05 ± 3.25d
24 h 30.05 ± 2.21c 15.70 ± 1.18d 18.71 ± 4.89d 43.81 ± 4.25b 16.0 ± 2.38d 63.02 ± 4.76a
Table 3. Effect of different combinations of S, Se and Mo on cysteine (Cys) content in B. juncea leaves and
roots. The measurement of Cys was realized in three replicates (± std) with three plants in each per treatment.
Values marked with different letters for leaves or roots are significantly different (P < 0.05).

103
GSH ( mol Kg-1
f.wt.)
Leaves
Time +S -S +S+Se -S+Se +S+Mo -S+Mo
0 174.42 ± 27.65a 74.00 ± 8.44c — — — —
10 min 167.53 ± 23.33a 76.01 ± 8.72c 177.98 ± 3.02a 78.67 ± 4.66c 179.89 ± 1.21a 86.01 ± 14.63c
1 h 164.93 ± 31.78a 76.91 ± 7.46c 191.00 ± 2.32a 90.09 ± 13.51c 185.03 ± 3.12a 114.05 ± 24.82b
6 h 177.96 ± 18.91a 73.37 ± 7.54c 104.72 ± 3.31b 102.22 ± 14.89b 167.35 ± 2.24a 106.84 ± 3.56b
24 h 156.44 ± 14.80a 65.28 ± 8.19c 71.55 ± 4.21c 141.16 ± 33.32ab 100.43 ± 4.11b 88.31 ± 22.62bc
Roots
0 175.69 ± 21.98a 91.14 ± 4.31c — — — —
10 min 204.70 ± 22.12a 98.91 ± 3.66c 201.10 ± 10.12a 98.00 ± 5.65c 120.47 ± 18.88b 83.53 ± 6.44c
1 h 220.21 ± 14.97a 108.51 ± 6.76bc 82.62 ± 11.34c 70.72 ± 13.47cd 81.44 ± 7.62c 74.49 ± 13.08c
6 h 200.84 ± 15.11a 96.33 ± 4.81c 72.10 ± 1.38d 129.05 ± 12.38b 93.15 ± 21.09bc 79.55 ± 14.68c
24 h 208.08 ± 23.23a 93.25 ± 6.44c 78.03 ± 5.15cd 128.04 ± 16.43b 106.73 ± 15.12bc 105.34 ± 13.42bc
Table 4. Effect of different combinations of S, Se and Mo on total glutathione (GSH) content in B. juncea
leaves and roots. The measurement of GSH was realized in three replicates (± std) with three plants in each
per treatment. Values marked with different letters for leaves or roots are significantly different (P < 0.05).

104
BIBLIOGRAPHY
Agalou A, Roussis A, Spaink HP. 2005. The Arabidopsis selenium-binding protein confers
tolerance to toxic levels of selenium. Functional Plant Biology. 32: 881-890.
Alhendawi RA, Kirkby EA, Pilbeam DJ. 2005. Evidence that sulfur deficiency enhances
molybdenum transport in xylem sap of tomato plants. Journal of Plant Nutrition. 28: 1347-1353.
. 2006. The fluctuation of molybdenum
content in oilseed rape plants after the application of nitrogen and sulphur fertilizers. Plant Soil
and Environment. 52: 301–307.
Baxter I, Muthukumar B, Park HC, Buchner P, Lahner B, Danku J, Zhao K, Lee J, Hawkesford
MJ, Guerinot ML, Salt DE. 2008. Variation in molybdenum content across broadly distributed
populations of Arabidopsis thaliana is controlled by a mitochondrial molybdenum transporter
(MOT1). Plos Genetics. 4 : e1000004.
Bisbjerg, B. 1972. Studies on selenium in plants and soils, Risö Report no. 200, Danish Atomic
Energy Commission, Risö.
Brown TA, Shrift, A. 1981. Exclusion of Selenium from Proteins of Selenium-Tolerant
Astragalus Species. Plant Physiology. 67(5): 1051–1053.
Dhillon KS, Dhillon SK. 2003. Distribution and management of seleniferous soils. Advances in
Agronomy. 79: 119-184 .
El Kassis E, Cathala N, Rouached H, Fourcroy P, Berthomieu P, Terry N, Davidian JC (2007).
Characterization of a Selenate-Resistant Arabidopsis Mutant. Root Growth as a Potential Target
for Selenate Toxicity. Plant Physiol 143:1231–1241
Ellis DR, Salt DE (2003) Plant, selenium and human health. Curr Opin Plant Biol 6:273-279
Fassel VA. 1978. Quantitative elemental analyses by plasma emission spectroscopy. Science
202: 183–191.
Fessler AJ, Moller G, Talcott PA, Exon JH. 2003. Selenium toxicity in sheep grazing reclaimed
phosphate mining sites. Veterinary and Human Toxicology. 45: 294-298.
Fitzpatrick KL, Tyerman SD, Kaiser BN. 2008. Molybdate transport through the plant sulfate
transporter SHST1. FEBS Letters. 582: 1508-1513.

105
Freeman JL, Zhang LH, Marcus MA, Fakra S, McGrath SP, Pilon-Smits EAH. 2006. Spatial
imaging, speciation, and quantification of selenium in the hyperaccumulator plants Astragalus
bisulcatus and Stanleya pinnata. Plant Physiology. 142: 124-134 .
Freeman JL, Tamaoki M, Stushnoff C, Quinn CF, Cappa JJ, Devonshire J, Fakra S, Marcus MA,
McGrath S, Van Hoewyk D, Pilon-Smits EAH (2010) Molecular mechanisms of selenium
tolerance and hyperaccumulation in Stanleya pinnata. Plant Physiology 153: 1630-1652.
Gupta, U.C. 1997. Molybdenum in agricolture. Published by the Press Syndacate of the
University of Cambridge. Edited by Gupta, U.C.
Hamilton SJ (2004) Review of selenium toxicity in the aquatic food chain. Sci Total Environ 326:
1–31.
Hansch R, Mendel RR. 2009 Physiological functions of mineral micronutrients (Cu, Zn, Mn, Fe,
Ni, Mo, B, Cl). Current Opinion in Plant Biology. 12: 259-266.
Hartikainen H. 2005. Biogeochemistry of selenium and its impact on food chain quality and
human health. Journal of Trace Elements in Medicine and Biology. 18: 309-318.
Heuwinkel H, Kirby EA, Lebot J, Marschner H. 1992. Phosphorus deficiency enhances
molybdenum uptake by tomato plants. Journal of Plant Nutrition. 15: 549-568.
Hopper JL, Parker DR (1999) Plant availability of selenate and selenate as influenced by the
competing ions phosphate and sulfate. Plant Soil 210:199-207.
Hugouvieux V, Dutilleul C, Jourdain A, Reynaud F, Lopez V, Bourguignon J. 2009. Arabidopsis
Putative Selenium-Binding Protein1 Expression Is Tightly Linked to Cellular Sulfur Demand and
Can Reduce Sensitivity to Stresses Requiring Glutathione for Tolerance. Plant Physiology. 151:
768-781
Kaiser BN, Gridley KL, Ngaire BJ, Phillips T, Tyerman SD (2005) The role of molybdenum in
agricultural plant production. Ann Bot 96: 745-754.
Kevresan S, Petrovic N, Popovic M, Kandrac J. 2001. Nitrogen and protein metabolism in young
pea plants as affected by different concentrations of nickel, cadmium, lead, and molybdenum.
Journal of Plant Nutrition. 24: 1633-1644
106
Kruse T, Gehl C, Geisler M, Lehrke M, Ringel P, Hallier S, Hansch R, Mendel RR. 2010.
Identification and Biochemical Characterization of Molybdenum Cofactor-binding Proteins from
Arabidopsis thaliana. Journal of Biological Chemistry. 285: 6623-6635.
LeDuc DL, Tarun AS, Montes-Bayon M, Meija J, Malit MF, Wu CP, AbdelSamie M, Chiang
CY, Tagmount A, DeSouza M, Neuhierl B, Bock A, Caruso J, Terry N. 2004. Overexpression of
selenocysteine methyltransferase in Arabidopsis and Indian mustard increases selenium tolerance
and accumulation. Plant Physiology. 135: 377-383.
Mackowiak C. L. and Amacher M. C.. 2008. Soil Sulfur Amendments Suppress Selenium Uptake
by Alfalfa and Western Wheatgrass. J. Environ. Qual. 37:772–779.
Mendel RR, Hansch R. 2002. Molybdoenzymes and molybdenum cofactor in plants. Journal of
Experimental Botany 53: 1689-1698.
Mikkelsen RL, Wan HF (1990) The effect of selenium on sulfur uptake by barley and rice. Plant
Soil 121:151-153.
Murashige T and Skoog F (1962) A revised medium for rapid growth and bioassays with tobacco
tissue cultures. Physiol Plant 15: 473-497.
Nautiyal N, Chatterjee C. 2004. Molybdenum stress-induced changes in growth and yield of
chickpea. Journal of Plant Nutrition. 27: 173-181.
Pickering IJ, Wright C, Bubner B, Persans MW, Yu EY, George GN, Prince RC, Salt DE. 2003.
Chemical form and distribution of selenium and sulfur in the selenium hyperaccumulator
Astragalus bisulcatus. Plant Physiology 131: 1460-1467.
Pilon-Smits EAH, Hwang S, Mel Lytle C, Zhu Y, Tai JC, Bravo RC, Chen Y, Leustek T, Terry N
(1999). Overexpression of ATP sulfurylase in Indian mustard leads to increased selenate uptake,
reduction, and tolerance. Plant Physiol 119:123-132.
Pilon-Smits EAH, Garifullina GF, Abdel-Ghany S, Kato SI, Mihara H, Hale KL, Burkhead JL,
Esaki N, Kurihara T, Pilon M. 2002. Characterization of a NifS-Like chloroplast protein from
Arabidopsis. Implications for its role in sulfur and selenium metabolism. 130: 1309-1318.
Pilon-Smits, E.A. and LeDuc, D.L. 2009. Phytoremediation of selenium using transgenic plants.
Current opinion in biotechnology, 20: 207-212.

107
Pilon-Smits E.A.H, Quinn C.F., Tapken W., Malagoli M., Schiavon M. 2009. Physiological
functions of beneficial elements. Current Opinion in Plant Biology. 12: 267-274.
Quaggiotti, S., Abrahamshon, C., Malagoli, M., and Ferrari, G. (2003) Physiological and
molecular aspects of sulphate uptake in two maize hybrids in response to S-deprivation. Journal
of Plant Physiology. 160, 167–173.
Rayman MP. 2000. The importance of selenium to human health Lancet 356: 233-241.
Reuveny Z. 1977. Derepression of ATP sulfurylase by the sulfate analogs molybdate and selenate
in cultured tobacco cells. Proc Natl Acad Sci U S A. 74(2): 619-22.
Schwarz G, Mendel RR. 2006. Molybdenum cofactor biosynthesis and molybdenum enzymes.
Annual Review of Plant Biology. 57: 623-647.
Schwarz G, Mendel RR, Ribbe MW. 2009. Molybdenum cofactors, enzymes and pathways.
Nature. 460: 839-847.
Shibagaki N, Rose A, McDermott JP, Fujiwara T, Hayashi H, Yoneyama T, Davies JP. 2002.
Selenate-resistant mutants of Arabidopsis thaliana identify Sultr1,2 a sulfate transporter required
for efficient transport of sulfate into roots. Plant J 29:475-486
Shinmachi F., Buchner P., Stroud J.L., Parmar S., Zhao F-J., McGrath S.P., and Hawkesford
M.J. 2010. Influence of sulfur deficiency on the expression of specific sulfate transporters and
the distribution of sulfur, selenium, and molybdenum in wheat. Plant Physiology. 153: 327–336.
Sors TG, Ellis DR, Salt DE. 2005. Selenium uptake, translocation, assimilation and metabolic
fate in plants. Photosynth Res 86:373–389.
Tamaoki M, Freeman JL, Pilon-Smits EAH. 2008. Cooperative ethylene and jasmonic acid
signaling regulates selenite resistance in Arabidopsis. Plant Physiology. 146: 1219-1230.
Tejada-Jimenez M, Galvan A, Fernandez E, Llamas A. 2009. Homeostasis of the micronutrients
Ni, Mo and Cl with specific biochemical functions. Current Opinion in Plant Biology. 12: 358-
363.
Terry N, Zayed AM, de Souza MP, Tarun AS. 2000. Selenium in higher plants. Annual Review
of Plant Physiology and Molecular Biology. 51: 401-432.
Tomatsu H, Takano J, Takahashi H, Watanabe-Takahashi A, Shibagaki N, Fujiwara T. 2007. An
Arabidopsis thaliana high-affinity molybdate transporter required for efficient uptake of
108
molybdate from soil. Proceedings of The National Academy of Sciences of the United States of
America. 104: 18807-18812.
Van Hoewyk D, Takahashi H, Inoue E, Hess A, Tamaoki M, Pilon-Smits EAH. 2008.
Transcriptome analyses give insights into selenium-stress responses and selenium tolerance
mechanisms in Arabidopsis. Physiologia Plantarum. 132: 236-253.
Van Huysen T, Abdel-Ghany S, Hale KL, LeDuc D, Terry N, Pilon-Smits EAH. 2003.
Overexpression of cystathionine-gamma-synthase enhances selenium volatilization in Brassica
juncea. Planta. 218: 71-78.
Véronique Hugouvieux, Christelle Dutilleul, Agnès Jourdain, Florie Reynaud, Véronique Lopez
and Jacques Bourguignon 2009. Arabidopsis putative Selenium-Binding Protein1 expression is
tightly linked to cellular sulfur demand and can reduce sensitivity to stresses requiring
glutathione for tolerance. Plant physiology, 151: 768-781.
Wangeline AL, Burkhead JL, Hale KL, Lindblom S-D, Terry N, Pilon M, Pilon-Smits EAH
(2004) Overexpression of ATP Sulfurylase in Brassica juncea: Effects on Tolerance and
Accumulation of Twelve Metals. Journal of Environmental Quality 33: 54-60.
White PJ, Bowen HC, Parmaguru P, Fritz M, Spracklen WP, Spiby RE, Meacham MC, Mead A,
Harriman M, Trueman LJ, Smith BM, Thomas B, Broadley MR. 2004. Interactions between
selenium and sulphur nutrition in Arabidopsis thaliana. J Exp Bot 55:1927-1937.
Wirtz M, Droux, M, Hell R. 2004. O-acetylserine (thiol) lyase: an enigmatic enzyme of plant
cysteine biosynthesis revisited in Arabidopsis thaliana. J. Exp. Bot. 55: 1785-1798.
Zarcinas BA, Cartwright B, Spouncer LR. 1987. Nitric acid digestion and multi-element analysis
of plant material by inductively coupled plasma spectrometry. Communications in Soil Science
and Plant Analysis 18: 131–146.
Zhu YG, Pilon-Smits EAH, Zhao FJ, , Williams PN, Meharg AA. 2009. Selenium in higher
plants: understanding mechanisms for biofortification and phytoremediation. Trends in Plants
Science. 14: 436-442.
Yoshimoto N, Takahashi H, Smith FW, Yamaya Y, Saito K. 2002. Two distinct high-affinity
sulfate transporters with different inducibilities mediate uptake of sulfate in Arabidopsis roots.
Plant J. 29:465-473

109
COPPER HOMEOSTASIS IN Populus trichocarpa
INTRODUCTION
Role of Copper in plants.
In plants copper plays critical roles in photosynthetic and respiratory electron transport, oxidative
stress protection, cell wall metabolism, and ethylene perception (Marschner, H. 1995). Copper
deficiency results in changes in root, stem and leaf architecture and visible chlorosis (Marschner,
H. 1995). At the cellular level copper deficiency results in reduced photosynthetic
electron transport (Henriques F. S. 1989, Shikanai T. 2003), a reduction of plastoquinone and
pigment synthesis (Baro´n, M 1992), and a disintegration of the thylakoid membrane (Henriques,
F. S. 1989, Baszynski, T 1978). On the other hand, when copper is present in excess, plants
develop toxicity symptoms such as an inhibition of root elongation (Murphy, A., and Taiz, L.
1995). Toxicity symptoms in the shoot include decreased photosystem II function and an
inhibition of chlorophyll synthesis that is accompanied by a reduction of the thylakoid membrane
surface and generation of excess reactive oxygen species in the chloroplast (Pa¨tsikka¨et al.,
2002).
Copper proteins
The copper protein plastocyanin (PC) is one of the most abundant proteins in the thylakoid
lumen (Kieselbach, T et al. 1998, Schubert, M et al. 2002) and in plants is essential for electron
transfer between the cytochrome b6f complex and photosystem I. A class of abundant
intracellular copper proteins is formed by the Cu,Zn superoxide dismutase (SOD) enzymes,
which function to catalyze the dismutation of superoxide radicals (O2 .) into H2O2 (Asada, K.
(1999)). Three genes encode for Cu,Zn-SOD in the Arabidopsis genome (Kliebenstein, D. J. et
al., 1998); CSD1 is active in the cytosol, CSD2 is active in the chloroplast stroma, and CSD3 is
active in the peroxisome. CSD1 and CSD2 are the major isoforms in green tissue.
Much of the machinery involved in cellular copper uptake and intracellular distribution in plant
cells has now been described. Particularly, the delivery of copper to the ethylene receptors and
the photosynthetic machinery is well characterized (Pilon, M. et al., 2006; Puig, S. et al., 2007).
Copper enters plant cells via the Cu- transporters and is subsequently delivered to plastocyanin in
the thylakoid lumen and to CSD2 in the stroma by a machinery that includes two chloroplast-
localized coppertransporting P-type ATPases and a metallo-chaperone for Cu,Zn-SOD (Pilon,
M. et al 2006). In chloroplasts, another SOD called FSD1 utilizes iron as the cofactor. Copper
availability was found to regulate the expression of CCS, CSD1, CSD2, and FSD1 in
Arabidopsis and other dicot plant species (Abdel-Ghany et al. 2005 ; Abdel-Ghany et al. 2005;

110
Cohu, C. M et al., 2007). When copper levels are sufficient, the Cu,Zn-SOD proteins are
expressed, and FSD1 expression is shut-off. Conversely, when copper is limiting, CSD1 and
CSD2 expression is down-regulated, and FSD1 becomes abundant. The down-regulation of
CSD1 and CSD2 under copper limitation involves a microRNA, miR398, which is itself up-
regulated under copper limitation (Yamasaki, H. et al., 2007).
miRNA
MicroRNAs (miRNAs) are a class of gene products of ;21 nucleotides in length that are derived
from primary miRNAs transcribed from miRNA loci (Lee et al., 2002). In plants, the primary
miRNAs are cleaved by Dicer-like 1 (DCL1) (Xie et al.,2004) and possibly other proteins in the
nucleus to produce an ;60- to 300-nucleotide hairpin structure known as the miRNA precursor.
The miRNA precursor may be transported out of the nucleus by HASTY or retained in the
nucleus and further processed by DCL1 to release the stem portion of the hairpin as an
miRNA:miRNA* duplex (for reviews, see Bartel, 2004; Kidner and Martienssen, 2005). The
duplex, which comprises a mature miRNA of ;21 nucleotides and a similarly sized miRNA*
fragment on the opposing arm of the miRNA precursor, is then presumably unwound by a
helicase, releasing the singlestranded mature miRNA. The miRNA then enters the RNAinduced
silencing complex (for review, see Bartel, 2004) and guides the complex to identify target
messages for posttranscriptional gene silencing through direct target cleavage (Llave et al.,
2002a; Rhoades et al., 2002; Emery et al., 2003; Kasschau et al., 2003; Palatnik et al., 2003;
Tang et al., 2003; Achard et al., 2004; Juarez et al., 2004; Kidner and Martienssen, 2004; Laufs
et al., 2004; Mallory et al., 2004a, 2004b; McHale and Koning, 2004; Baker et al., 2005) or, in a
few cases, for translational repression (Aukerman and Sakai, 2003; Chen, 2004).
So far, a large number of miRNAs have been found in various plant species (Llave et al., 2002b;
Park et al., 2002; Reinhart et al., 2002; Palatnik et al., 2003; Bonnet et al., 2004; Floyd and
Bowman, 2004; Jones-Rhoades and Bartel, 2004; Sunkar and Zhu, 2004; Wang et al., 2004a,
2004b; Adai et al., 2005; Bedell et al., 2005). In flowering plants, miRNAs are major regulators
of developmental processes such as flower, leaf, and root development; miRNAs have also been
predicted or confirmed to regulate other processes such as pathogen invasion, mineral nutrient
homeostasis and responses to stress (Jones-Rhoades M. W. et al., 2006).
Laccase
Laccase is another Cu-enzyme that is certainly down regulated by miRNA in Arabidopsis (Pilon
et al., 2007). Laccase (p-diphenol:O2 oxidoreductase, EC 1.10.3.2), ascorbate oxidase (AAO),
and ceruloplasmin are members of a family of copper-containing metalloenzymes, commonly
referred to as the blue copper oxidases. These enzymes are unique in that they, along with
cytochrome c oxidase and the alternative oxidase found in plant mitochondria (Siedow et al.,
1995), are the only enzymes known to catalyze the four-electron reduction of O2 to H2O.
Laccase, in particular, appears to be very widely distributed, having been identified in bacteria,
fungi, plants, and insects (Dean et al., 1994). Laccases are somewhat promiscuous with regard to

111
substrate specificity, oxidizing a variety of diphenol, dinaphthol, phenylenediamine and
anthranilate-derived metabolites.
The oxidized products of these reactions often polymerize with each other or with molecules in
the surrounding extracellular matrix to form chemically resilient structures that serve to protect
the organism from various environmental stresses. Recently, five divergent laccase cDNAs (lac1,
lac2, lac3, lac90, and lac110) were characterized from Populus trichocarpa (Ranocha et al.,
1999, 2000). These genes were obtained from a xylem-enriched cDNA library and were most
highly expressed in stem tissue. At least two of the five genes, lac90 and lac110, encode proteins
that are capable of oxidizing lignin precursors in vitro.
Targets
Given that the importance of biomass production in short rotation coppice, possibily coupled
with a remediating action on polluted soils, becomes important to study the behavior of a model
high biomass producing species like Populus trichocarpa in Cu balance : in Arabidopsis , as
reported above, we can see a down regulation of Cu proteins in situation of Cu deficiency or
closest to deficiency. Probably the response in Poplar leaves is the same , but in stems it should
be different. Once investigated the Cu managing in regards to Cu chaperones and SOD, we want
to see the behavior of Laccase that is involved in cell wall construction and, for some group of
these enzymes, also in lignification (Ranocha et al., 2002).
MATERIALS AND METHODS
Poplar‘s propagation
the propagation started from 10 original tissue culture nodal cuttings of the Nisqually-1 poplar
clone (Populus trichocarpa) sent in vials from Department of Forest Ecosystems and Society of
Oregon State University (original cutting length : about 1 cm).They were transferred in agar
medium plus MS salts (M5519 by SIGMA containing 0.1 µM CuSO4) and IBA (indole butyric
acid) 0.1 mg/L in sterile magenta boxes. The transfer was done under sterile hood using sterile
forceps. After transfer, magenta boxes were put in grow chamber settled with following
parameters : 70% of humidity, 16 h of day light, 24 C.
Poplar cuttings grew for 6 weeks in growth chamber, then plants grown enough (to touch the top
of magenta box) were cut in 3 parts with sterile scissors under sterile hood : the top with
merystem and other two pieces of stem including a leaf bud ; for each part one or two leaves,

112
depending on their size, were left to allow cutting to survive during the first period before root
system development. About 50% of magenta boxes prepared for the 2nd
generation were added
with 5µ M of CuSO4 . Propagation was carried on in the same way for four generations in order
to collect a good amount of plant tissue; this plant tissue ( leaves and stems ) were stored in 15
ml tubes in -80 °C freezer.
Poplar proteins extraction
We used 2 ml microfuges Eppendorf tubes put on ice. For each sample we prepared 3 tubes : 2
of them empty and one filled with 100 µL 2 x sample buffer (with DTT). Sampling : we have
grinded very well tissue in a cold mortar with a cold pestle and liquid nitrogen 0.3-0.6 g of
leaves tissue, ~ 0.5 g of stem tissue to obtain a powder. The powder was transferred in a empty
cold tube and 400 µL of extraction buffer (1M K2HPO4,1M KH2PO4, 50 mg of ascorbate , 25 µL
of beta mercaptoethanol, 100 µL of Triton X-100 ) were added for 10 minutes vortexing each 3
minutes. After that, we have centrifuged one minute at 13200 rpm in microcentrifuge. The
supernatant was removed and 100 µL of this were added to the tube filled with the same amount
of 2 x sample buffer with DTT . The remained amount was used to determine protein
concentration with Bradford assay. Sample plus buffer was warmed up at 95 °C for 5 minutes.
Bradford protein assay
we made a standard curve with different concentrantions of BSA (bovin serum albumin) protein
red at 595 nm with spectrophotometer to determine protein concentration in poplar extracts. We
used Bradford reactive solution 1:5 diluted.
Western blot
we have run denaturated proteins in a 15% SDS page gel with Biorad electrophoresis machine at
120 V for 1 h. After that, protein bands were transferred in nitrocellulose by Biorad western blot
machine, running at 50mA for 16 h. Immunodetection procedure was developed as follows :
nitrocellulose was rinsed one minute in TBS + T, 30 minutes in 5% milk solution, then washed
in TBS + T 2 minutes.
Incubation in first antibody (antimouse and antichicken for our proteins) solution (diluted
1:1000) was 2 hours long. After that nitrocelluloses were rinsed five times in TBS+T, then
incubated 45 minutes in second antibody (antirabbit diluted 1:10000). After second incubation,
nitrocell were rinsed four times in TBS+T, one time in TBS and one time in AP buffer. Each step
was done on a rocker. Staining solution was composed as follows : 40 µL of NBT + 75 µL in 10
ml of AP buffer. Staining was carried on in dark (because all reagents are light sensitive) until
protein bands begun to be colored. At this point reaction was immediately stopped by deionized
water rinsing. After that, keeping nitrocelluloses in the dark, a picture was kept with scanner.

113
Native gel
crude proteins run in a 15% acrylamide gel without SDS to avoid their denaturation. Run was
carried on in +4 °C fridge at 100 V for 3-4 hours. After run gel was soaked 20 min in NBT/d-
water (1mg/ml) in the dark on a rocker. After that gel was rinsed off and put in untreated or
treated staining solution on the rocker for 20 minutes. Then gel was put in a tray filled with
deionized water under a strong light source (as a common lamp) and left there for 10-30 minutes
to allow gel becoming darker in the background (bands remain uncolored). Gel and reagents
must kept in the dark until end of staining.
Untreated staining solution -to resolve the activities of all SODs- was prepared as follows : 1M
K2HPO4 (1.47 ml), 1M KH2PO4 (148 µL ), Temed (145 µL). All brought up to 45 ml.
Poplar RNA extraction
Leaf and stem tissues (50-200 mg) were grinded with pre cold and sterilized mortar and pestle,
using liquid nitrogen. The fine powder obtained was put in 2 ml Eppendorf tubes with 1 ml of
Trizol. Mix was left at R.T. for 5 minutes and shacked every minute. Then tubes were
centrifuged at 12000 rpm for 10 minutes at 4 °C. Supernatant was transferred in a new tube and
200 µL of chloroform were added. Then tube was shacked for 15 seconds and left at R.T. 2-3
minutes. Then it was centrifuged 15 minutes at 12000 rpm at 4 °C.
The supernatant was transferred in a new tube, in which 0.5 ml of isopropanol was added. Mix
was left to incubate 10 minutes at R.T, then it was centrifuged for 10 minutes at 4 °C at 12000
rpm and supernatant was discarded. Pellet was washed two times (3 minutes per wash) with
ethanol 70% (1 ml) and pellet was finally dried and stored in -80 °C freezer.
DNAse treatment
pellet was dissolved in 18 µL of dd-water plus 2 µL of DNAse buffer and 1 µL of DNAse. The
mix was left to incubate at 37 °C for 30 minutes, then it was addicted with 2 µL of 25mM EDTA
and left to incubate again for 10 minutes. The reaction was stopped adding180 µL of dd-water.
After that a new RNA extraction was done following the same procedure described above, but
now using just 0.5 ml of Trizol and adjusting all following solutions. Finally DNA pellet was
resuspended in 20 µL of dd-water and left to incubate for 10 minutes at R.T.
RNA quantification
Thermo scientific Nanodrop 2000 spectrophotometer was used to quantify RNA. Measurement
was done at 260nm using 2 µL of my 20 µL RNA diluted in 198 µL of dd-water. RNA run in a
1% agarose gel . Ethidium bromide to liquid agarose was added to stain bands (1 µL / 10 ml of
gel). 1.358 µg of RNA were loaded in each well.

114
RT PCR of Laccases DNA
master mix for each sample was composed as follows : Reaction buffer 4 µL, Ribolock RNAse
inhibitor (20u/ µL) 1 µL, 10 mM dNTP mix 2 µL, MMuLV Reverse Transcriptase(20u/ µL) 2
µL , 1 µL of esameric primers and 2.5 µg of RNA. (Reagents from Fermentas First strand cDNA
synthesis). Mix was brought up to final volume (20 µL) with DEPC. Each tube was left in a
thermostatic bath at 25 °C for 5 minutes, then at 37 °C for 60 minutes. Finally reaction was
stopped warming up to 70 °C for 5 minutes.
PCR of Laccases DNA
master mix for each sample was composed as follows : buffer 2µl, dNTPs 2µl, Primer FW
0.5µl, Primer RW 0.5 µl , Taq 0.2 µl , 1µl of cDNA and 13.8 µl of DNAse free dd-water. PCR
incubator was settled as follows : 38 cycles , pre-denaturation 96 °C for 5 minutes, denaturation
96 °C for 30 s , annealing 55 °C for 30 s , extention 72 °C for 5 minutes.
Primer
poplar laccases sequences were found in NCBI gene database (http://www.ncbi.nlm.nih.gov/).
Alignment of sequences was made by BLAST ( http://blast.ncbi.nlm.nih.gov/Blast.cgi), and
primes design was made using PRIMER BLAST by NCBI
(http://www.ncbi.nlm.nih.gov/tools/primer-blast/index.cgi?LINK_LOC=NcbiHomeAd). Poplar
laccases miRNA were found on miR Base (http://microrna.sanger.ac.uk/sequences/). Primers
were designed to retrotranscript the mRNA sequence containing miRNA 397a target sequence.
The specific probes for miRNA 397a target sequences were FW: 5‘-
ATCATCGCTGAAGGATTTGG-3‘ RW 5‘-CAGTGCATTAGCCACACACC-3‘ for lac90a, FW: 5‘-
GGGGATCTCTACCCTTGCTC-3‘ RW 5‘-TCGTCGTGTTATCAAATGGC-3‘ for lac110a, FW:5‘-
CGGACTTCGCAGCGGCCATA-3‘ RW 5‘-GCTCGTCGTTGAGTGCAGCG-3‘ for lac110b, FW: 5‘-
ACCAACTCTGTATGCCAGGG-3‘ RW 5‘-GCCTCTCTGGCCTGTGATAG-3‘ for lac 1a, FW: 5‘-
AGTACGCTTGCTGGCTCCGA-3‘ RW 5‘-TTGGTGGTCTGGCCTGGGGC-3‘ for lac 1c, FW 5‘-
CTGTCTGCCTCCTCCCCGCT-3‘ RW 5‘-GTGGTCTGGCCTGGGGCAAT-3‘ for lac 1d, FW: 5‘-
TGCGCACGGGCTGGTCCGACG-3‘ RW 5‘-ACCCGGAGAAGGGCAGCCAGGA-3‘ for lac 2, FW
5‘-GAATGGTGGAAGGCTGATGT-3‘ RW 5‘- GCCCTGCAATCTTGAAGAAG-3‘ for lac 3.
As constitutive Actin was chosen : FW 5‘-GGAGCTGAGAGATTCCGTTG-3‘ RW 5‘-
GGTGCAACCACCTTGATCTT-3‘.
ptc-miR397a MIMAT0002038: 5‘- UCAUUGAGUGCAGCGUUGAUG-3', Reverse Complement
5'- CATCAACGCAGCACTCAATGA-3'.

115
RESULTS AND DISCUSSION
At 0.1 µM CuSO4 (in Murashige & Skooge standard) CSD1and CSD2 seems clearly down
regulated both in leaves and in stems compared with 5 µM CuSO4 added MS. The differences
between treatments is stronger in stems than in leaves. Particularly CSD1 in 5 µM CuSO4 is
expressed 4 times more than in 0.1 µM CuSO4 . Because poplar cuttings grew in magenta boxes,
didn‘t develop secondary wood, maintaining a green stem; This light photosintetic activity
should have downregulated Cu proteins stronger than in a woody stem. To maintain a minimal
SOD activity is expected, like in Arabidopsis thaliana, an upregulation of others SOD using
different cofactors like FSD1 and MnSOD (Yamasaki H. et al., 2007). The first one resulted
undetectable in poplar using same antibody thought for Arabidopsis probably because they aren‘t
able to recognize poplar FSD1. MnSOD expression seems not only not affected by down
regulation of Cu/Zn SODs, but it seems to follow the same behavior of CSD in condition closest
to Cu deficiency, although differences in this case aren‘t so clear as for CSD. Plastocyanin, as
easily predicted, maintained same level in both treatments and in both tissues confirming the
previous hypothesis of an affection of Cu/Zn SOD in stems because tissue was still
photosynthetizing. Two copper chaperones considered did not give clear results : CCS showed to
much weak bands (data not showed) ,maybe depending on antibodies like for FSD1, and COX II
did not showed differences between treatments (Figure 1)
Once seen that Cu homeostasis in poplar is pretty similar to Arabidopsis, Laccases expression
was investigated. Lac1, lac2, lac3, lac90, and lac110 ,characterized from Populus trichocarpa
resulted strongly expressed in stem (Ranocha et al., 1999, 2000), but differently from Ranocha et
al., we found that only lac90a is active exclusively in stem, while the other ones are more or less
strongly expressed also in leaves. Lac 90a according to Cu homeostasis in Arabidopsis (Abdel-
Ghani and Pilon 2007) is more strongly expressed in Cu replete condition.
Lac 110b in Cu replete conditions is three times more relatively expressed in stems than in
0.1µM Cu conditions, and two times in leaves. Comparing leaves and stems enzyme is more
active in stem in both conditions. Lac110a doesn‘t show a clear trend in stems were enzyme is
expressed equally in two treatments, while in leaves it appears to be downregulated in 0.1µM Cu
conditions. Lac 1a, 1d and lac 3 shows same behavior : no differences between treatments in
leaves and a clear downregulation at 0.1µM Cu in stems. An opposite behavior is shown by the
last group composed by Lac 2 and Lac 1c in which laccases is more expressed in leaves at Cu
concentration of 0.1µM Cu ; this happens particularly for lac 1c ; in stems these proteins seems
expressed very weakly in both treatments, totally in opposition with data of Ranocha et al. This
squared suggests us the need of more investigations and the comparison of these treatments in
different growth conditions, like agargel vs hydroponics for instance and at different age because
our cuttings were harvested before formation of secondary wood.

116
FIGURES

117
118
BIBLIOGRAPHY
Adai, A., Johnson, C., Mlotshwa, S., Archer-Evans, S., Manocha, V., Vance, V., and
Sundaresan, V. (2005). Computational prediction of miRNAs in Arabidopsis thaliana. Genome
Res. 15, 78–91.
Abdel-Ghany, S. E., Burkhead, J. L., Gogolin, K. A., Andres-Colas, N., Bodecker, J. R., Puig, S.,
Penarrubia, L., and Pilon, M. (2005) FEBS Lett. 579, 2307–2312
Abdel-Ghany, S. E., Muller-Moule, P., Niyogi, K. K., Pilon, M., and Shikanai, T. (2005) Plant
Cell 17, 1233–1251
Achard, P., Herr, A., Baulcombe, D.C., and Harberd, N.P. (2004). Modulation of floral
development by a gibberellin-regulated micro-RNA. Development 131, 3357–3365.
Asada, K. (1999) Annu. Rev. Plant Physiol. Plant Mol. Biol. 50, 601–639
Aukerman, M.J., and Sakai, H. (2003). Regulation of flowering time and floral organ identity by
a microRNA and its APETALA2-like target genes. Plant Cell 15, 2730–2741.
Baker, C.C., Sieber, P., Wellmer, F., and Meyerowitz, E.M. (2005). The early extra petals1
mutant uncovers a role for microRNA miR164c in regulating petal number in Arabidopsis. Curr.
Biol. 15, 303–315.
Baro´n, M., Lo´pez-Gorge´, J., Lachica, M., and Sadmann, G. (1992) Physiol. Plant. 84, 1–5
Bartel, D.P. (2004). MicroRNAs: Genomics, biogenesis, mechanism, and function. Cell 116,
281–297.
Baszynski, T., Ruszkowska, M., Kro´l, M., Tukendorf, A., and Wolinska, D. (1978) Z.
Pflanzenphysiol. 89, 207–216
Bedell, J.A., et al. (2005). Sorghum genome sequencing by methylation filtration. PLoS Biol. 3,
e13.
Bonnet, E., Wuyts, J., Rouze, P., and Van de Peer, Y. (2004). Detection of 91 potential
conserved plant microRNAs in Arabidopsis thaliana and Oryza sativa identifies important target
genes. Proc. Natl. Acad. Sci. USA 101, 11511–11516.
Chen, X. (2004). A microRNA as a translational repressor of APETALA2 in Arabidopsis flower
development. Science 303, 2022–2025.
Cohu, C. M., and Pilon, M. (2007) Physiol. Plant 129, 747–755

119
Dean, J.F.D. and Eriksson, K.-E.L. 1994. Laccase and the deposition of lignin in vascular plants.
Holzforschung 48: 21–33
(1994).
Emery, J.F., Floyd, S.K., Alvarez, J., Eshed, Y., Hawker, N.P., Izhaki, A., Baum, S.F., and
Bowman, J.L. (2003). Radial patterning of Arabidopsis shoots by class III HD-ZIP and
KANADI genes. Curr. Biol. 13, 1768–1774.
Floyd, S.K., and Bowman, J.L. (2004). Gene regulation: Ancient micro-RNA target sequences in
plants. Nature 428, 485–486.
Henriques, F. S. (1989) Plant Physiol. 135, 453–458
Jones-Rhoades, M.W., and Bartel, D.P. (2004). Computational identification of plant
microRNAs and their targets, including a stressinduced miRNA. Mol. Cell 14, 787–799.
Jones-Rhoades, M. W., Bartel, D. P., and Bartel, B. (2006) Annu. Rev. Plant Biol. 57, 19–53
Juarez, M.T., Kui, J.S., Thomas, J., Heller, B.A., and Timmermans, M.C. (2004). MicroRNA-
mediated repression of rolled leaf1 specifies maize leaf polarity. Nature 428, 84–88.
Kasschau, K.D., Xie, Z., Allen, E., Llave, C., Chapman, E.J., Krizan, K.A., and Carrington, J.C.
(2003). P1/HC-Pro, a viral suppressor of RNA silencing, interferes with Arabidopsis
development and miRNA unction. Dev. Cell 4, 205–217.
Kidner, C.A., and Martienssen, R.A. (2004). Spatially restricted microRNA directs leaf polarity
through ARGONAUTE1. Nature 428, 81–84.
Kidner, C.A., and Martienssen, R.A. (2005). The developmental role of microRNA in plants.
Curr. Opin. Plant Biol. 8, 38–44.
Kieselbach, T., Hagman, A., Andersson, B., and Schroder, W. P. (1998)
J. Biol. Chem. 273, 6710–6716
Kliebenstein, D. J., Monde, R. A., and Last, R. L. (1998) Plant Physiol. 118,
637–650
Laufs, P., Peaucelle, A., Morin, H., and Traas, J. (2004). MicroRNA regulation of the CUC
genes is required for boundary size control in Arabidopsis meristems. Development 131, 4311–
4322.
Lee, Y., Jeon, K., Lee, J.T., Kim, S., and Kim, V.N. (2002). MicroRNA maturation: Stepwise
processing and subcellular localization. EMBO J. 21, 4663–4670.

120
Llave, C., Xie, Z., Kasschau, K.D., and Carrington, J.C. (2002a). Cleavage of Scarecrow-like
mRNA targets directed by a class of Arabidopsis miRNA. Science 297, 2053–2056.
Llave, C., Kasschau, K.D., Rector, M.A., and Carrington, J.C. (2002b). Endogenous and
silencing-associated small RNAs in plants. Plant Cell 14, 1605–1619.
Mallory, A.C., Dugas, D.V., Bartel, D.P., and Bartel, B. (2004a). MicroRNA regulation of NAC-
domain targets is required for proper formation and separation of adjacent embryonic, vegetative,
and floral organs. Curr. Biol. 14, 1035–1046.
Mallory, A.C., Reinhart, B.J., Jones-Rhoades, M.W., Tang, G., Zamore, P.D., Barton, M.K., and
Bartel, D.P. (2004b). MicroRNA control of PHABULOSA in leaf development: Importance of
pairing to the microRNA 59 region. EMBO J. 23, 3356–3364.
Marschner, H. (1995) Mineral Nutrition of Higher Plants, pp. 333–347, Academic Press, Inc.,
London 6. Murphy, A., and Taiz, L. (1995) Plant Physiol. 108, 29–38
McHale, N.A., and Koning, R.E. (2004). MicroRNA-directed cleavage of Nicotiana sylvestris
PHAVOLUTA mRNA regulates the vascular cambium and structure of apical meristems. Plant
Cell 16, 1730–1740.
Palatnik, J.F., Allen, E., Wu, X., Schommer, C., Schwab, R., Carrington, J.C., and Weigel, D.
(2003). Control of leaf morphogenesis by microRNAs. Nature 425, 257–263.
Park, W., Li, J., Song, R., Messing, J., and Chen, X. (2002). CARPEL FACTORY, a Dicer
homolog, and HEN1, a novel protein, act in microRNA metabolism in Arabidopsis thaliana.
Curr. Biol. 12, 1484–1495.
Pa¨tsikka¨, E., Kairavuo, M., Sersen, F., Aro, E.-M., and Tyystja¨rvi, E. (2002)
Plant Physiol. 129, 1359–1367
Pilon, M., Abdel-Ghany, S. E., Cohu, C. M., Gogolin, K. A., and Ye, H. (2006) Curr. Opin.
Plant Biol. 9, 256–263
Puig, S., Andres-Colas, N., Garcia-Molina, A., and Penarrubia, L. (2007) Plant Cell Environ. 30,
271–290
Ranocha Ph, Goffner D, Boudet AM (2000) Plant laccases: Are they involved in lignification? In
R Savidge, J Barnett, R Napier, eds, Cell and Molecular Biology of Wood Formation. BIOS
Scientific Publishers Ltd, Oxford, pp 397–410
Ranocha Ph, McDougall G, Hawkins S, Sterjiades R, Borderies G, Stewart D, Cabanes-
Macheteau M, Boudet AM, Goffner D (1999) Biochemical characterization, molecular cloning
and expression of laccases—a divergent gene family—in poplar. Eur J Biochem 259: 485–495

121
Ranocha, P., Chabannes, M., Chamayou, S., Danoun, S., Jauneau, A., Boudet, A.-M., and
Goffner, D. Laccase Down-Regulation Causes Alterations in Phenolic Metabolism and Cell Wall
Structure in Poplar (2002) Plant Physiol. 129, 145–155
Reinhart, B.J., Weinstein, E.G., Rhoades, M.W., Bartel, B., and Bartel, D.P. (2002). MicroRNAs
in plants. Genes Dev. 16, 1616–1626.
Rhoades, M.W., Reinhart, B.J., Lim, L.P., Burge, C.B., Bartel, B., and Bartel, D.P. (2002).
Prediction of plant microRNA targets. Cell 110, 513–520.
Shikanai, T., Muller-Moule, P., Munekage, Y., Niyogi, K. K., and Pilon, M. (2003) Plant Cell
15, 1333–1346
Schubert, M., Petersson, U. A., Haas, B. J., Funk, C., Schroder, W. P., and Kieselbach, T. (2002)
J. Biol. Chem. 277, 8354–8365
Siedow, J.N., Umbach, A.L. and Moore, A.L. 1995. The active site of the cyanide-resistant
oxidase from plant mitochondria contains a binuclear iron center. FEBS Lett. 362: 10–14.
Sterky F, Regan S, Karlsson J, Hertzberg M, Rohde A, Holmberg A, Amini B, Bhalerao R,
Larsson M, Villarroel R et al. (1998) Gene discovery in the wood-forming tissues of poplar:
analysis of 5,692 expressed sequence tags. Proc Natl Acad Sci USA 95: 13330–13335
Sunkar, R., and Zhu, J.-K. (2004). Novel and stress-regulated micro-RNAs and other small
RNAs from Arabidopsis. Plant Cell 16, 2001–2019.
Tang, G., Reinhart, B.J., Bartel, D.P., and Zamore, P.D. (2003). A biochemical framework for
RNA silencing in plants. Genes Dev. 17, 49–63.
Yamasaki, H., Abdel-Ghany, S. E., Cohu, C. M., Kobayashi, Y., Shikanai, T., and Pilon, M.
(2007) J. Biol. Chem. 282, 16369–16378
Xie, Z., Johansen, L.K., Gustafson, A.M., Kasschau, K.D., Lellis, A.D., Zilberman, D., Jacobsen,
S.E., and Carrington, J.C. (2004). Genetic and functional diversification of small RNA pathways
in plants. PLoS Biol. 2, e104.
Wang, J.-F., Zhou, H., Chen, Y.-Q., Luo, Q.-J., and Qu, L.-H. (2004a). Identification of 20
microRNAs from Oryza sativa. Nucleic Acids Res. 32, 1688–1695.
Wang, X.J., Reyes, J.L., Chua, N.-H., and Gaasterland, T. (2004b). Prediction and identification
of Arabidopsis thaliana microRNAs and their mRNA targets. Genome Biol. 5, R65.

THANKS TO
Doc. Michela Schiavon (Department of Agricultural biotechnologies-
University of Padova) for technical support and precious knowledge supply.
For her efficiency, kindness and leaning in helping and sharing knowledge,
she’s can considered the best colleague for every researcher.
Prof. Elizabeth Pilon-Smits and Marinus Pilon (Biology Department-
Colorado State University) for chance given to work in a very efficient and
friendly team.
Doc. Paolo Carletti (Department of Agricultural biotechnologies-University of
Padova) for several tricks and advises given during these three years.