Esercitazionidi Genomica umana - campus.unibo.itcampus.unibo.it/307059/7/lezlab_gu_17.pdf · Scopo...
35
Esercitazioni di Genomica umana 2017
Transcript of Esercitazionidi Genomica umana - campus.unibo.itcampus.unibo.it/307059/7/lezlab_gu_17.pdf · Scopo...

Esercitazioni di Genomicaumana
2017
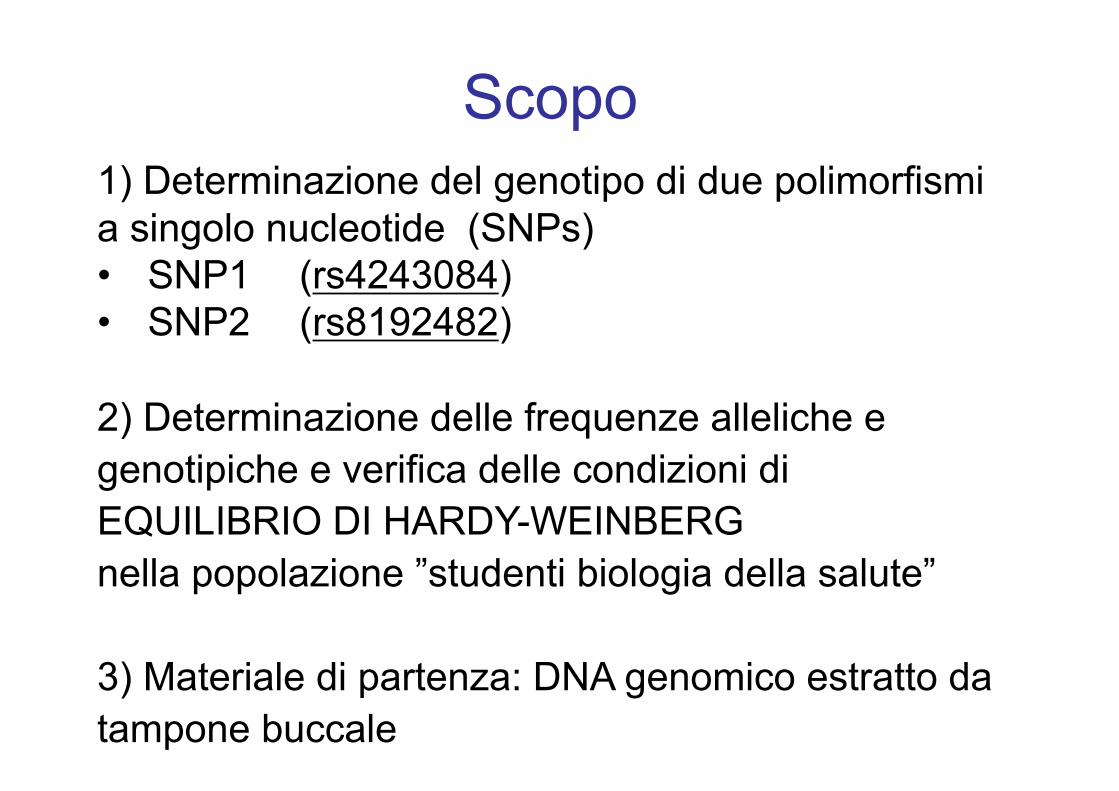
Scopo1) Determinazione del genotipo di due polimorfismi a singolo nucleotide (SNPs)• SNP1 (rs4243084)• SNP2 (rs8192482)
2) Determinazione delle frequenze alleliche e genotipiche e verifica delle condizioni diEQUILIBRIO DI HARDY-WEINBERGnella popolazione ”studenti biologia della salute”
3) Materiale di partenza: DNA genomico estratto da tampone buccale

Estrazione DNA da tampone buccale
EtOHpellet
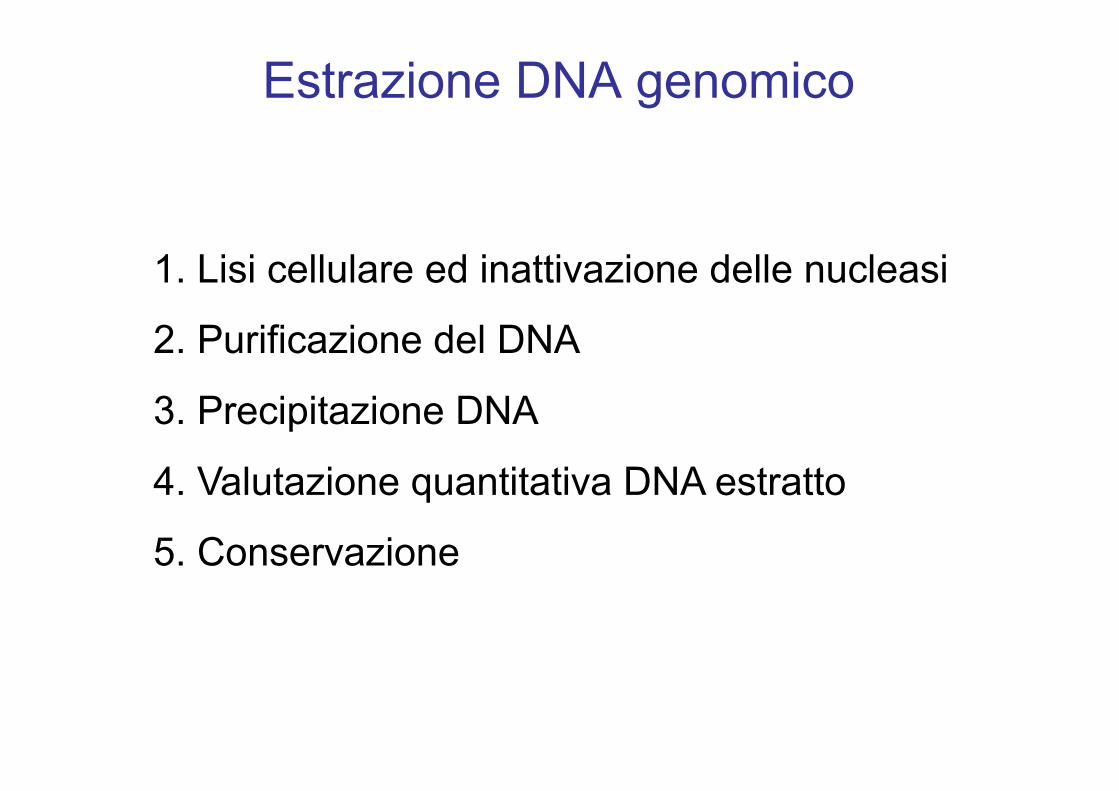
Estrazione DNA genomico
1. Lisi cellulare ed inattivazione delle nucleasi
2. Purificazione del DNA
3. Precipitazione DNA
4. Valutazione quantitativa DNA estratto
5. Conservazione
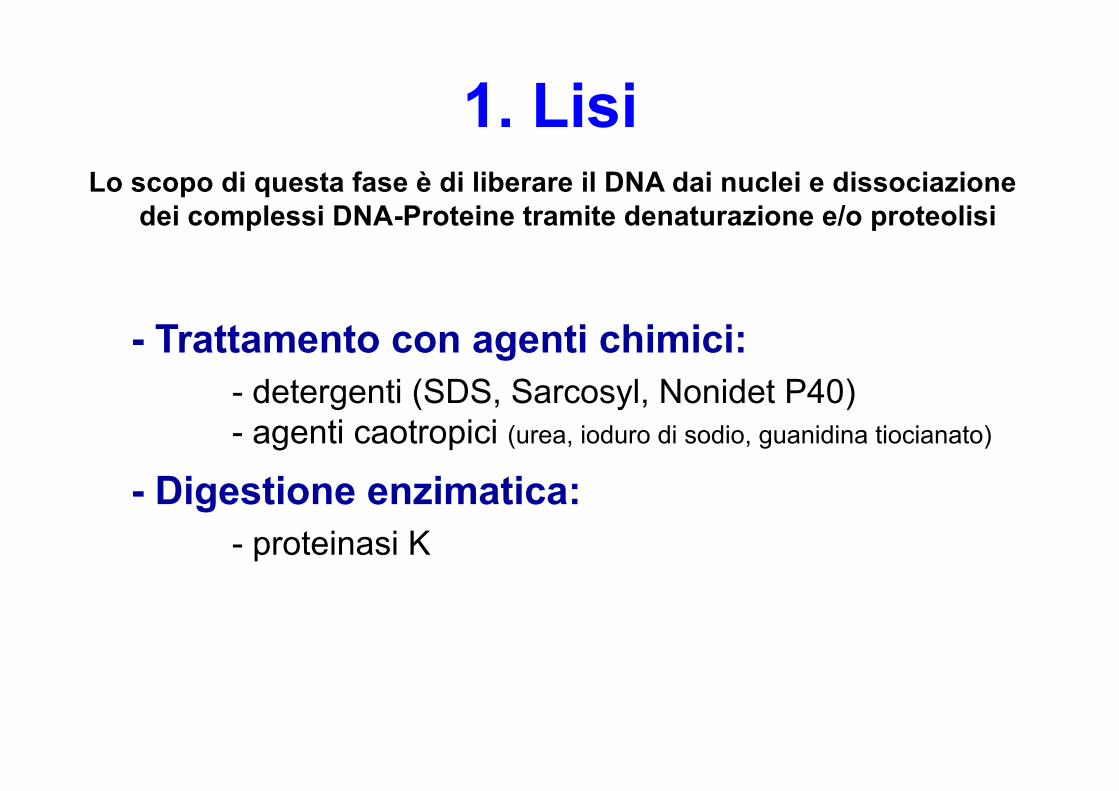
1. Lisi
- Trattamento con agenti chimici:- detergenti (SDS, Sarcosyl, Nonidet P40)- agenti caotropici (urea, ioduro di sodio, guanidina tiocianato)
- Digestione enzimatica:- proteinasi K
Lo scopo di questa fase è di liberare il DNA dai nuclei e dissociazione dei complessi DNA-Proteine tramite denaturazione e/o proteolisi
1. Lisi
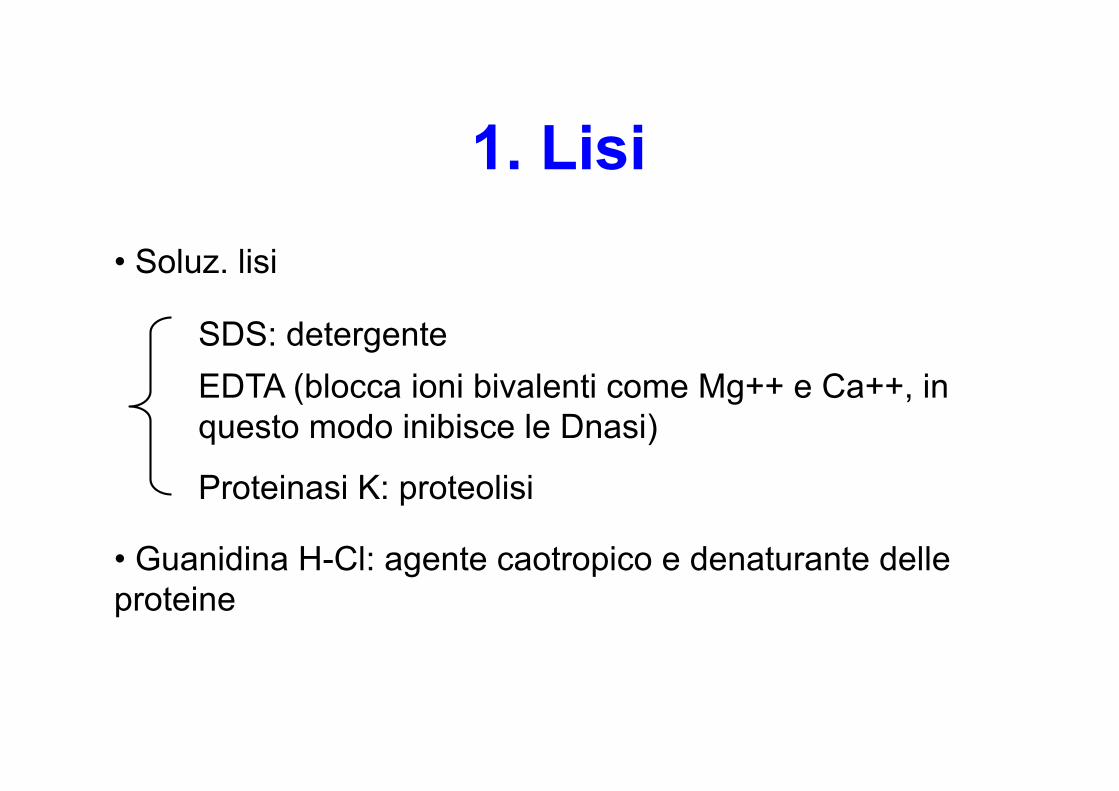
• Guanidina H-Cl: agente caotropico e denaturante delle proteine
• Soluz. lisi
SDS: detergenteEDTA (blocca ioni bivalenti come Mg++ e Ca++, in questo modo inibisce le Dnasi)
Proteinasi K: proteolisi
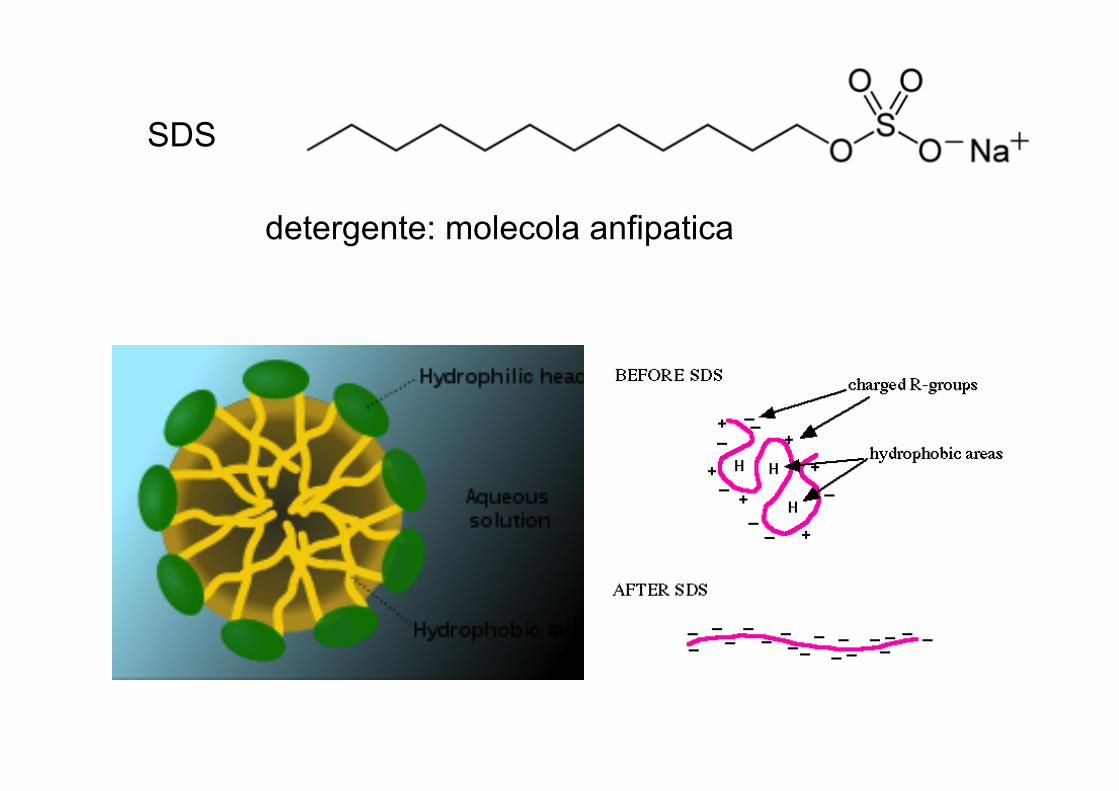
SDS
detergente: molecola anfipatica

2. Purificazione DNA
8
Lo scopo di questa fase è la separazione del DNA dalle altre macromolecole (proteine, lipidi, polisaccaridi) e detriti cellulari
- Utilizzo di solventi organiciFenolo Cloroformio
- Metodo del salting outUtilizza alte concentrazioni saline per rimuovere leproteine (NaCl 6M)
- CromatografiaA scambio anionico (matrice carica positivamente)Per adsorbimento (matrice di silice)
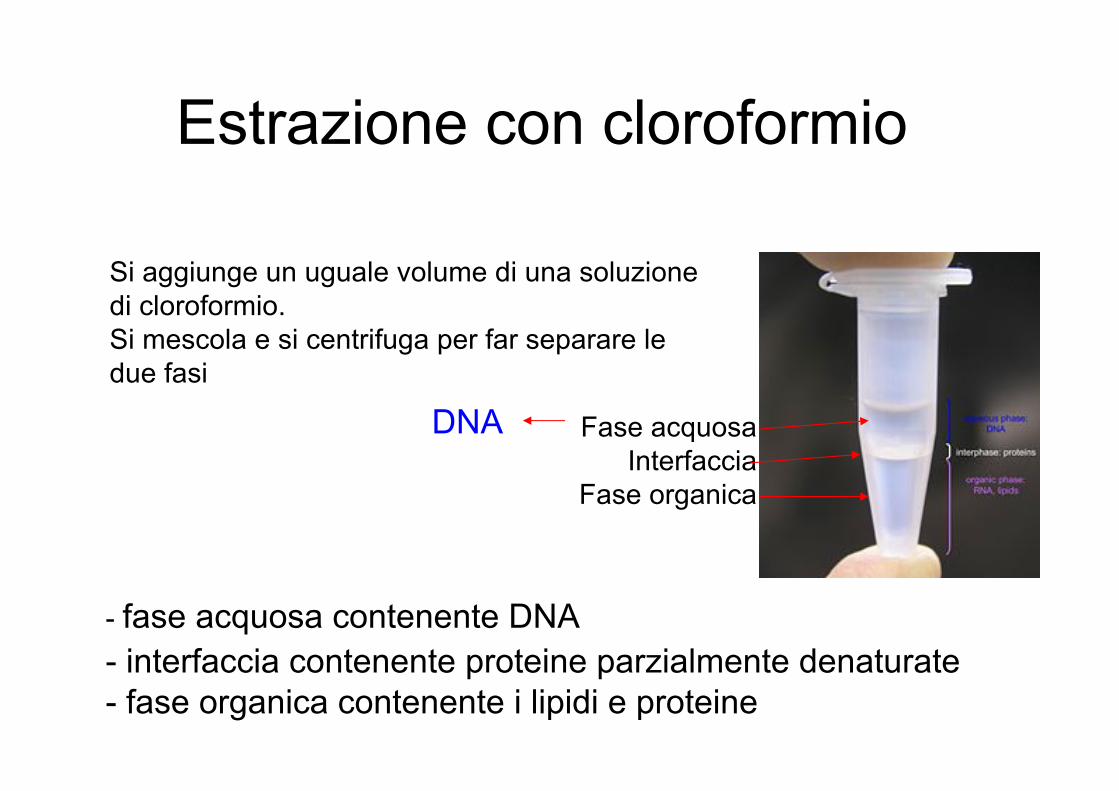
Estrazione con cloroformio
- fase acquosa contenente DNA- interfaccia contenente proteine parzialmente denaturate - fase organica contenente i lipidi e proteine
Si aggiunge un uguale volume di una soluzione di cloroformio.Si mescola e si centrifuga per far separare le due fasi
Fase acquosaInterfaccia
Fase organica
DNA

3. Precipitazione DNALo scopo di questa fase è di concentrare, desalificare e recuperare il DNA in forma solida permettendone il successivo ridiscioglimento nella soluzione desiderata
- Trattamento con alcooli- etanolo: in presenza di alte concentrazioni di sali
(sodio cloruro, sodio acetato, ammonio acetato)
- isopropanolo: non richiede alte concentrazioni salinema è meno facilmente eliminabile dell’etanolo
- Lavaggio: Etanolo 70% per eliminare i sali in eccesso- Risospensione:Il DNA viene risospeso in H2O o TE (10 mM Tris 1mM EDTA)
- Può essere conservato a +4°C per qualche settimana o a - 20 °C - 80°C per molti anni (evitare i congelamenti e scongelamenti ripetuti
che danneggiano il DNA)
4. Valutazione quantitativa DNA estratto
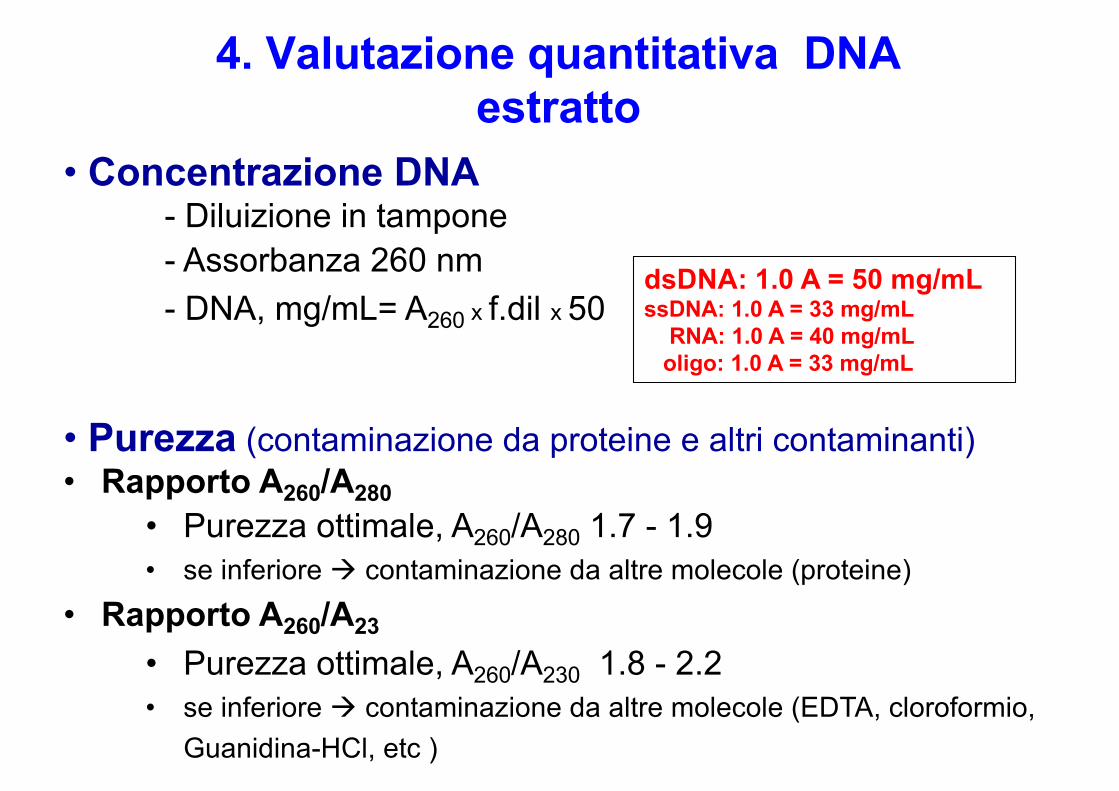
• Concentrazione DNA- Diluizione in tampone- Assorbanza 260 nm- DNA, mg/mL= A260 x f.dil x 50
• Purezza (contaminazione da proteine e altri contaminanti)• Rapporto A260/A280
• Purezza ottimale, A260/A280 1.7 - 1.9• se inferiore à contaminazione da altre molecole (proteine)
• Rapporto A260/A23
• Purezza ottimale, A260/A230 1.8 - 2.2• se inferiore à contaminazione da altre molecole (EDTA, cloroformio,
Guanidina-HCl, etc )
dsDNA: 1.0 A = 50 mg/mLssDNA: 1.0 A = 33 mg/mL
RNA: 1.0 A = 40 mg/mLoligo: 1.0 A = 33 mg/mL
Lettura al Nanodrop
Section 1-Introduction
Sample Retention Pedestal Measurements A 1 - 2 µL sample is pipetted onto a measurement pedestal. A smaller, 0.5 µL volume sample, may be used for concentrated nucleic acid and protein A280 samples. A fiber optic cable (the receiving fiber) is embedded within this pedestal. A second fiber optic cable (the source fiber) is then brought into contact with the liquid sample causing the liquid to bridge the gap between the ends of the two fibers. A pulsed xenon flash lamp provides the light source and a spectrometer utilizing a linear CCD array analyzes the light passing through the sample. The instrument is controlled by PC based software, and the data is stored in workbook files (*.twbk) on the PC. Pedestal Sample Size Requirements Although sample size is not critical, it is essential that a liquid column is formed when using the pedestal option so that the pathlength between the upper and lower measurement pedestals is bridged with sample. The dominant factor determining the surface tension of a droplet is the hydrogen bonding of the lattice of water molecules in solution. Generally, all additives (including protein, DNA, RNA, buffer salts and detergent-like molecules) can reduce the surface tension by interfering with the hydrogen bonding between water molecules. Although 1 µL volumes are usually sufficient for most sample measurements, increasing the sample size to 2 µL will ensure proper column formation for samples with reduced surface tension. Field experience indicates that the following volumes are sufficient to ensure reproducibility: Aqueous solutions of nucleic acids: 1 µL Purified protein: 2 µL Bradford, BCA, Lowry or Protein Pierce 660 nm assays: 2 µL Microbial cell suspensions: 2 µL It is best to use a precision pipettor (0-2 µL) with precision tips to ensure that sufficient sample (1-2 µL) is delivered. Lower precision pipettors (0-10 µL and larger) are not as good at delivering 1 µL volumes to the measurement pedestal. If the user is unsure about the sample characteristics or pipettor accuracy, a 2 µL sample volume is recommended. Pedestal Basic Use
1. Raise the sampling arm and pipette the sample onto the lower measurement pedestal.
2. Lower the sampling arm and initiate a spectral measurement using the software on the PC. The sample column is automatically drawn between the upper and lower pedestals and the measurement is made.
3. When the measurement is complete, raise the sampling arm and wipe the sample from both the upper and
lower pedestals using a dry, lint-free laboratory wipe. Simple wiping prevents sample carryover in subsequent measurements for samples varying by more than 1000 fold in concentration.
1-2
NanoDrop 2000/2000c Spectrophotometer V1.0 User Manual
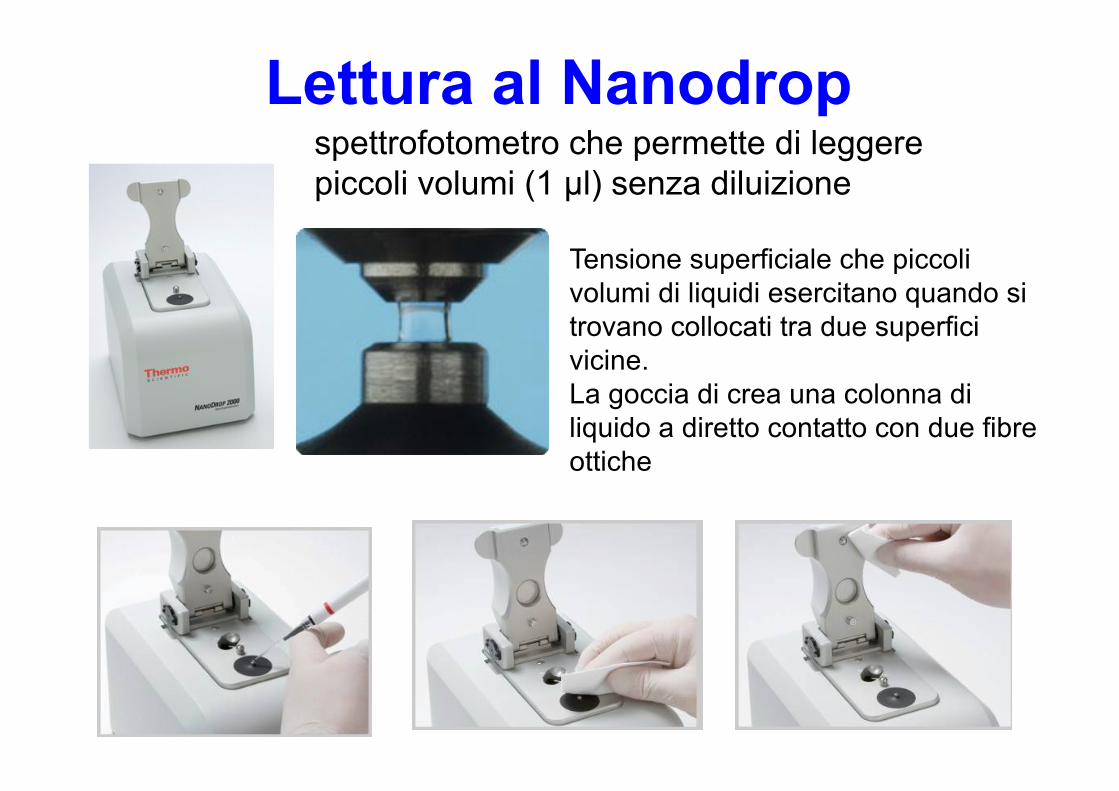
spettrofotometro che permette di leggere piccoli volumi (1 µl) senza diluizione
Tensione superficiale che piccoli volumi di liquidi esercitano quando si trovano collocati tra due superfici vicine. La goccia di crea una colonna di liquido a diretto contatto con due fibre ottiche
Lettura al Nanodrop
Section 3- Applications
Unique Screen Features The right pane displays features specific to the Nucleic Acid application. Task bars in the left pane not described below are described in “Software Overview.”
The spectral display shows data for the current sample normalized to a 10 mm path for all measurements including measurements made with any cuvette pathlength. The following features are to the right of the spectral display:
x Sample ID - field into which a sample ID is entered. The appropriate sample ID should be entered prior to each measurement.
x Type - a drop down list from which the user may select the (color-keyed) type of nucleic acid being
measured. Options include DNA-50 for dsDNA, RNA-40 for RNA, and ssDNA-33 for single-stranded DNA. Additional options include Oligo DNA and Oligo RNA which utilize the appropriate extinction coefficient based upon user-defined base sequences. The Custom option allows the user to enter an extinction coefficient between 15 and 150.
x Conc - concentration based on absorbance at 260 nm and the default or user defined extinction coefficient.
Concentration units may be selected from the adjacent drop-down box. Refer to “Nucleic Acid Calculations” for more details.
x A260 - displays absorbance at 260 nm normalized to a 10 mm pathlength.
x A280 - displays absorbance at 280 nm normalized to a 10 mm pathlength.
x 260/280 - ratio of absorbance at 260 nm and 280 nm. The ratio of absorbance at 260 and 280 nm is used to
assess the purity of DNA and RNA. A ratio of ~1.8 is generally accepted as “pure” for DNA; a ratio of ~2.0 is generally accepted as “pure” for RNA. If the ratio is appreciably lower in either case, it may indicate the presence of protein, phenol or other contaminants that absorb strongly at or near 280 nm. See “260/280 Ratio” in “Diagnostics and Troubleshooting” for more details on factors that can affect this ratio.
3-4
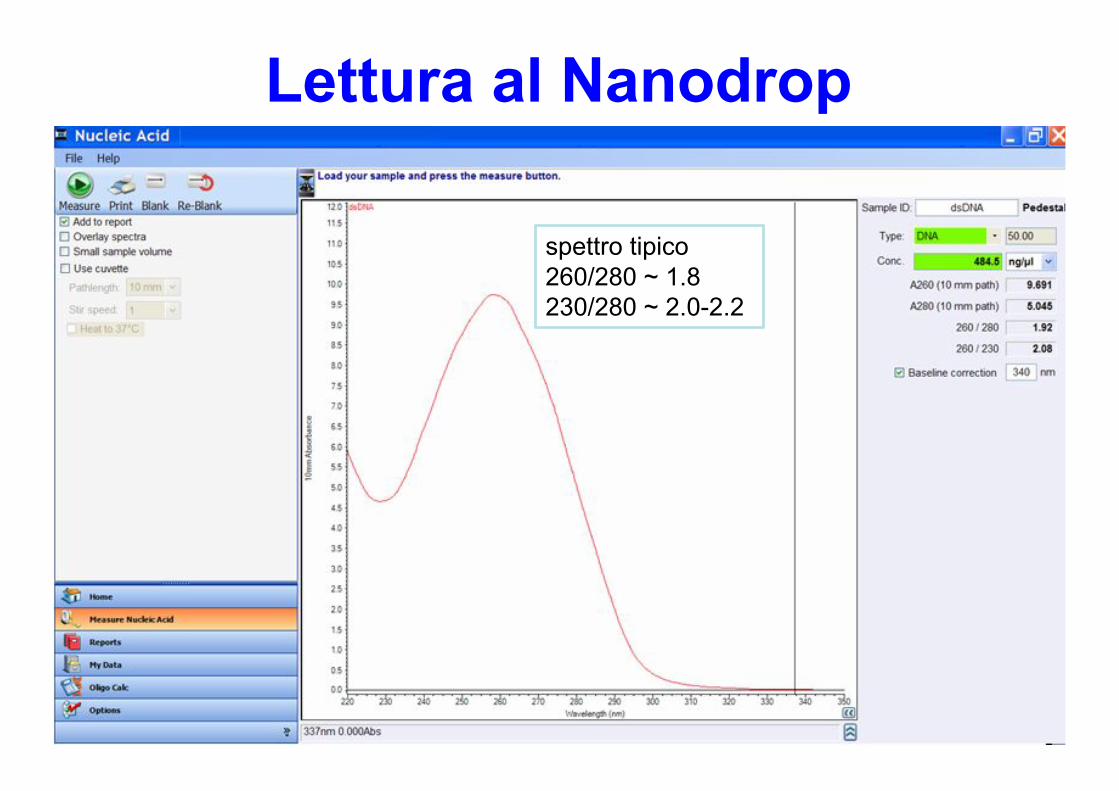
spettro tipico260/280 ~ 1.8230/280 ~ 2.0-2.2
Lettura al Nanodrop
2
Rev 3/09
Thermo Fisher Scientific - NanoDrop products Wilmington, Delaware USA Technical support: [email protected] 302-479-7707 www.nanodrop.com
T042‐TECHNICAL BULLETIN NanoDrop Spectrophotometers
Figure 1 - Typical spectral pattern for Nucleic Acid
260/230 Ratio
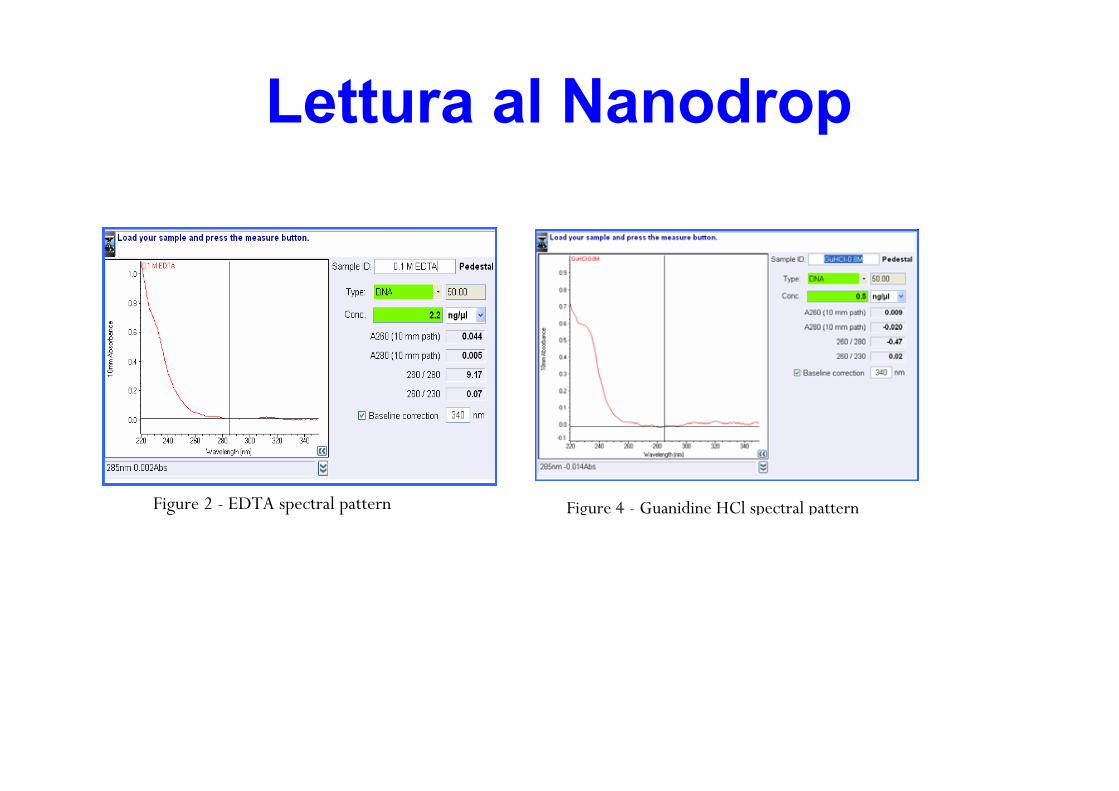
This ratio is used as a secondary measure of nucleic acid purity. The 260/230 values for “pure” nucleic acid are often higher than the respective 260/280 values. Expected 260/230 values are commonly in the range of 2.0-2.2. If the ratio is appreciably lower than expected, it may indicate the presence of contaminants which absorb at 230 nm. EDTA (Figure 2), carbohydrates and phenol all have absorbance near 230 nm. The TRIzol reagent is a phenolic solution which ab-sorbs in the UV both at 230 nm and ~270 nm (Figure 3).
Guanidine HCL used for DNA isolations will absorb at ~230 nm (Figure 4) while guanidine isothiocyanate, used for RNA isolations will absorb at ~260 nm (Figure 5).
For Technical Support contact us at 302-479-7707 or [email protected].
Figure 2 - EDTA spectral pattern Figure 3 - TRIzol spectral pattern
Figure 5 - Guanidine Isothiocyanate spectral pattern Figure 4 - Guanidine HCl spectral pattern
2
Rev 3/09
Thermo Fisher Scientific - NanoDrop products Wilmington, Delaware USA Technical support: [email protected] 302-479-7707 www.nanodrop.com
T042‐TECHNICAL BULLETIN NanoDrop Spectrophotometers
Figure 1 - Typical spectral pattern for Nucleic Acid
260/230 Ratio
This ratio is used as a secondary measure of nucleic acid purity. The 260/230 values for “pure” nucleic acid are often higher than the respective 260/280 values. Expected 260/230 values are commonly in the range of 2.0-2.2. If the ratio is appreciably lower than expected, it may indicate the presence of contaminants which absorb at 230 nm. EDTA (Figure 2), carbohydrates and phenol all have absorbance near 230 nm. The TRIzol reagent is a phenolic solution which ab-sorbs in the UV both at 230 nm and ~270 nm (Figure 3).
Guanidine HCL used for DNA isolations will absorb at ~230 nm (Figure 4) while guanidine isothiocyanate, used for RNA isolations will absorb at ~260 nm (Figure 5).
For Technical Support contact us at 302-479-7707 or [email protected].
Figure 2 - EDTA spectral pattern Figure 3 - TRIzol spectral pattern
Figure 5 - Guanidine Isothiocyanate spectral pattern Figure 4 - Guanidine HCl spectral pattern
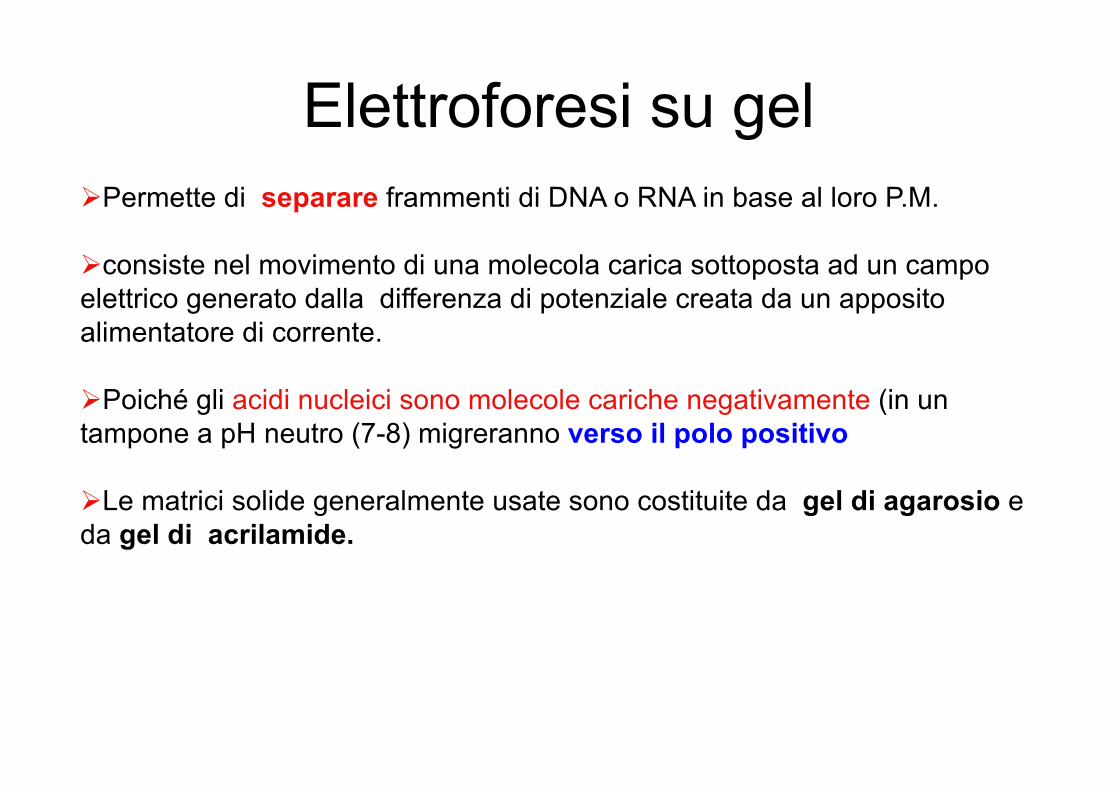
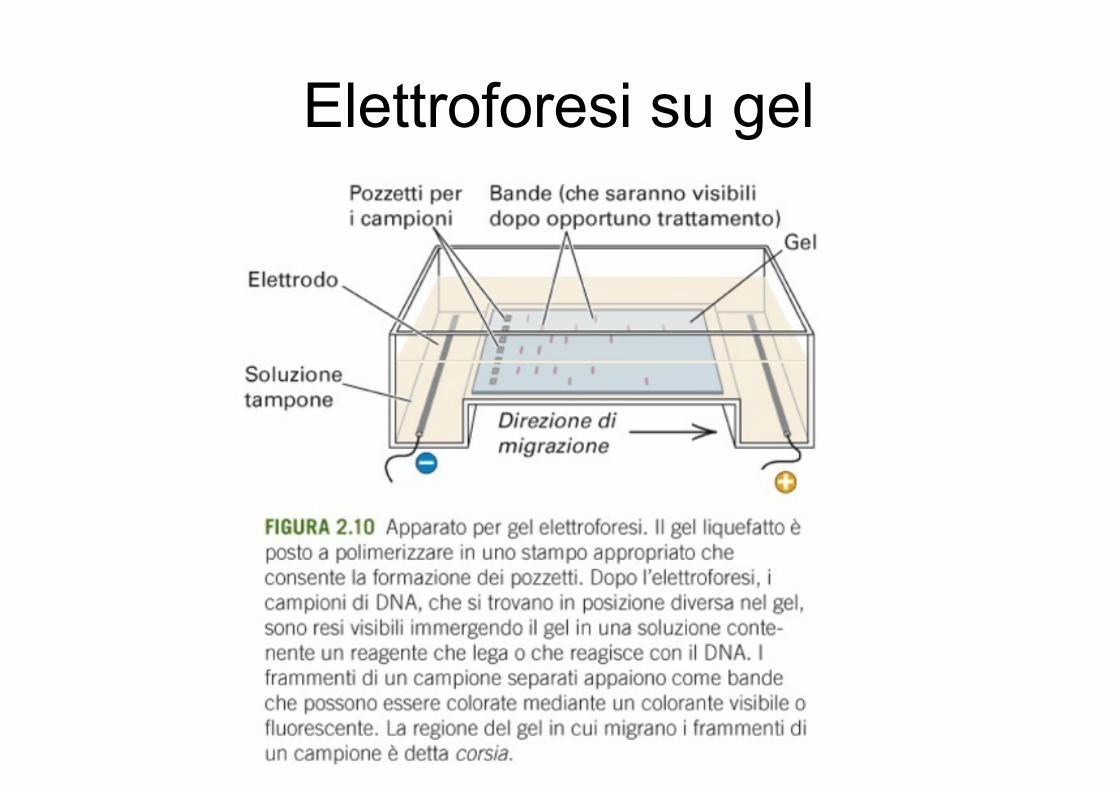
Elettroforesi su gelØPermette di separare frammenti di DNA o RNA in base al loro P.M.
Øconsiste nel movimento di una molecola carica sottoposta ad un campo elettrico generato dalla differenza di potenziale creata da un apposito alimentatore di corrente.
ØPoiché gli acidi nucleici sono molecole cariche negativamente (in un tampone a pH neutro (7-8) migreranno verso il polo positivo
ØLe matrici solide generalmente usate sono costituite da gel di agarosio e da gel di acrilamide.
Elettroforesi su gel

Elettroforesi su gel
migrazione su gel con diverse concentrazioni di agarosio
Loading buffer(per “appesantire” e
visualizzare campioni mentre si caricano)
Tampone di corsa (TBE)per mantenere l’integrità del campione e creare d.d.p.
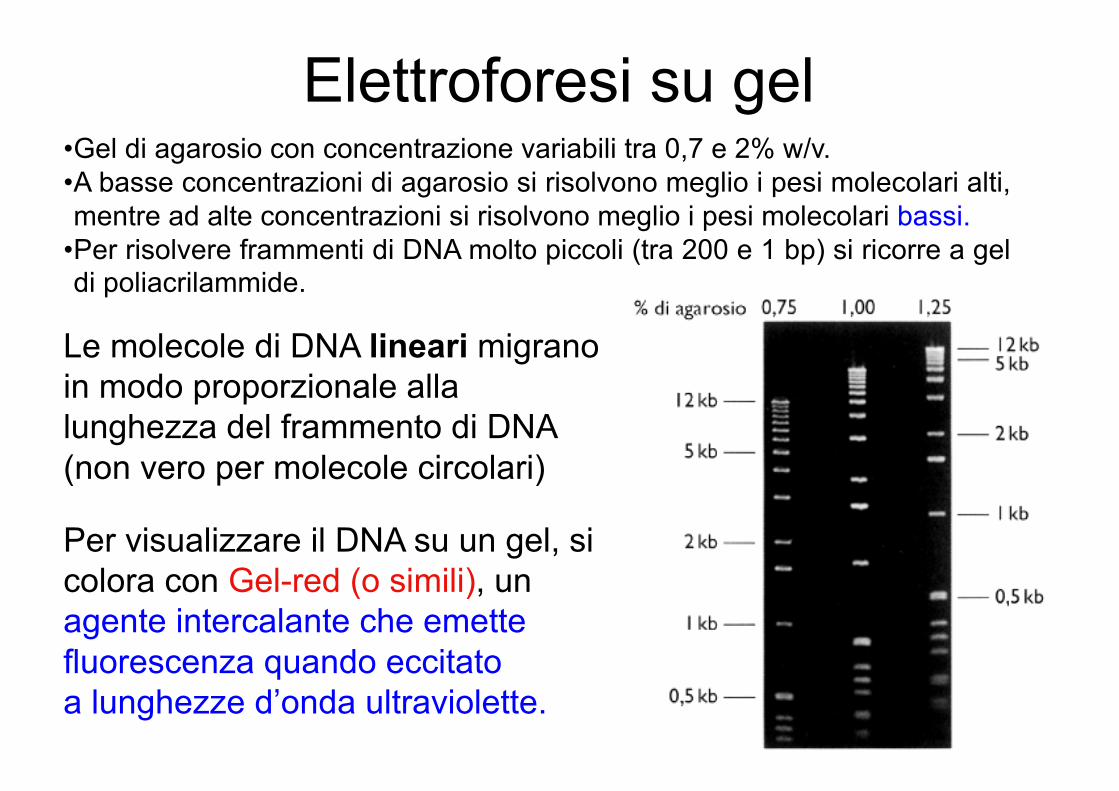
Elettroforesi su gel•Gel di agarosio con concentrazione variabili tra 0,7 e 2% w/v.•A basse concentrazioni di agarosio si risolvono meglio i pesi molecolari alti,mentre ad alte concentrazioni si risolvono meglio i pesi molecolari bassi.
•Per risolvere frammenti di DNA molto piccoli (tra 200 e 1 bp) si ricorre a geldi poliacrilammide.
Le molecole di DNA lineari migrano in modo proporzionale alla lunghezza del frammento di DNA (non vero per molecole circolari)
Per visualizzare il DNA su un gel, si colora con Gel-red (o simili), un agente intercalante che emette fluorescenza quando eccitato a lunghezze d’onda ultraviolette.
Elettroforesi su gel
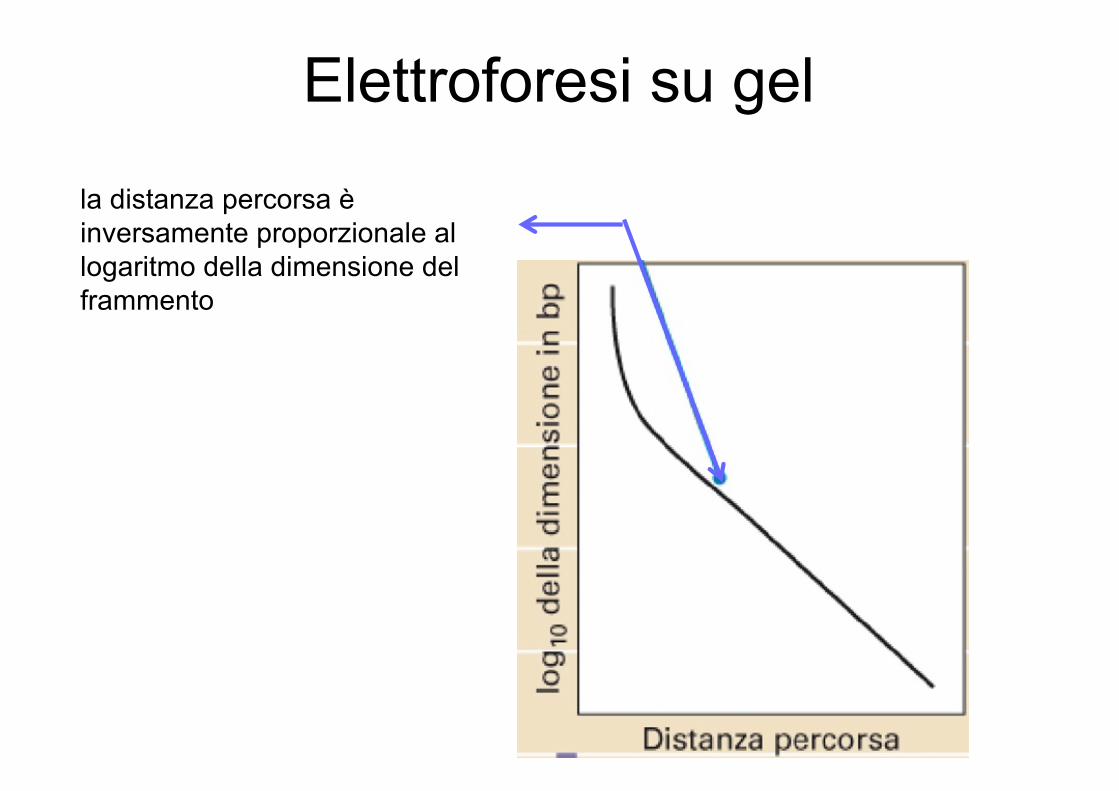
la distanza percorsa è inversamente proporzionale al logaritmo della dimensione del frammento

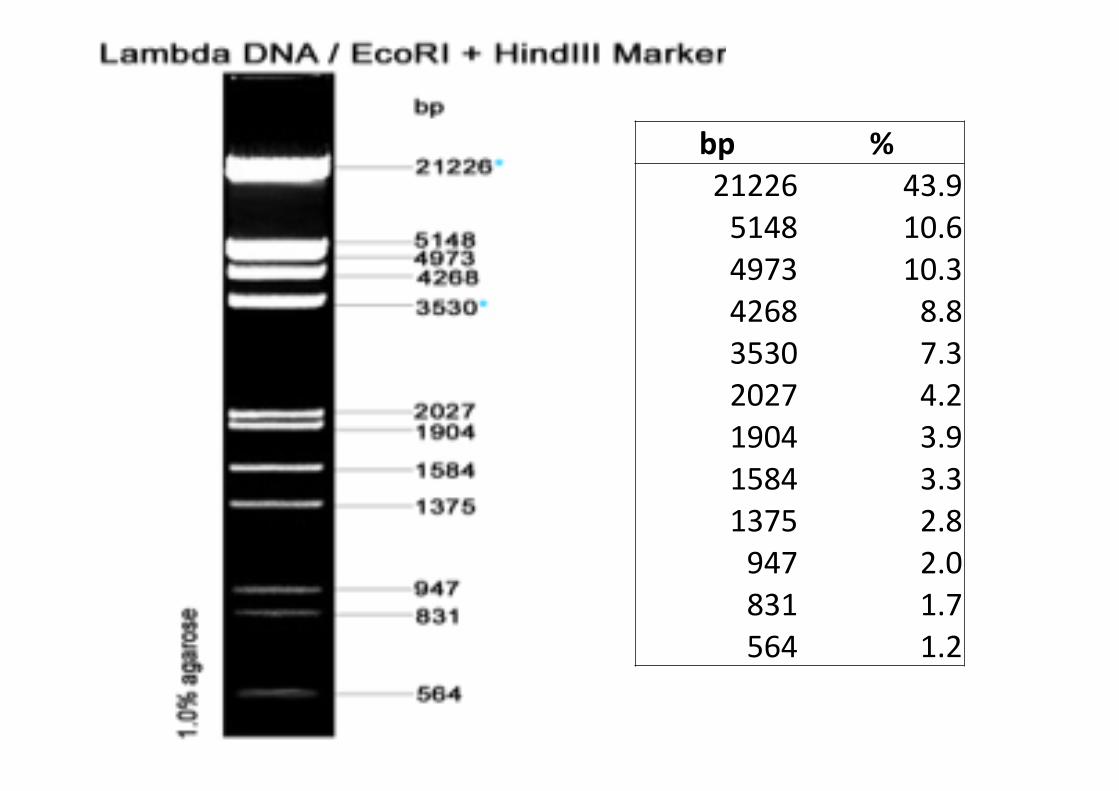
bp %21226 43.95148 10.64973 10.34268 8.83530 7.32027 4.21904 3.91584 3.31375 2.8947 2.0831 1.7564 1.2
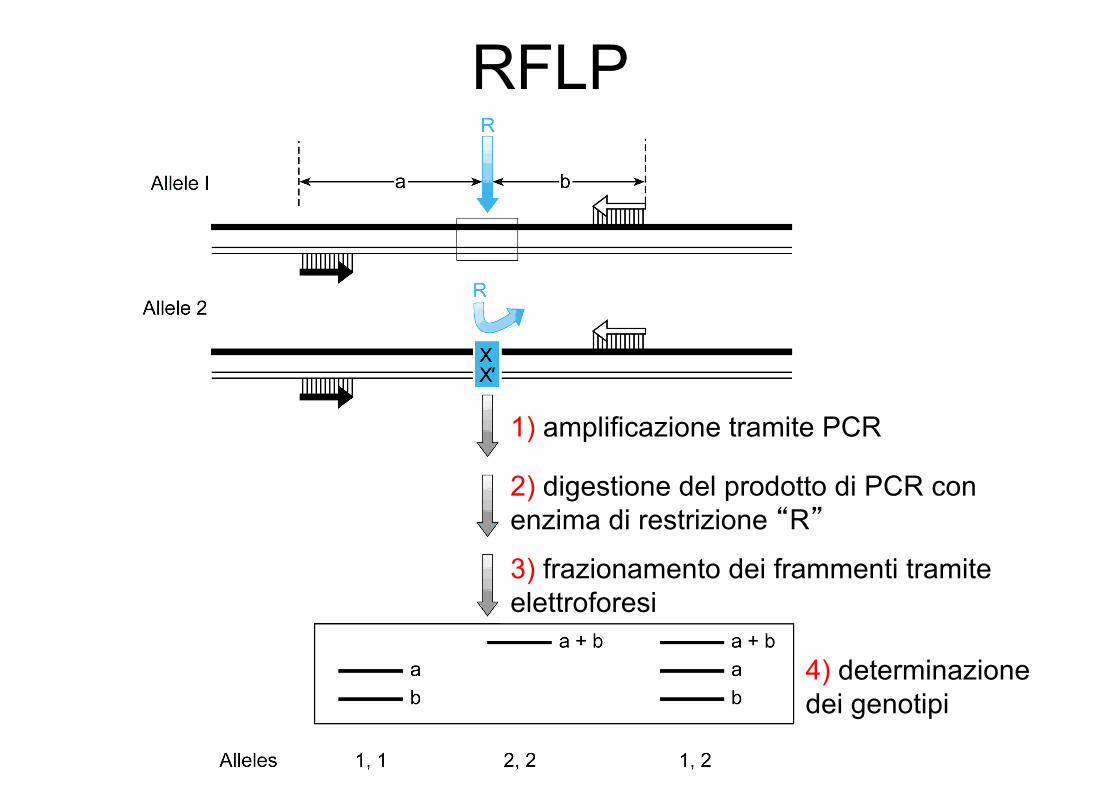
RFLP
1) amplificazione tramite PCR
2) digestione del prodotto di PCR con enzima di restrizione “R”
3) frazionamento dei frammenti tramite elettroforesi
4) determinazione dei genotipi

PCR
amplificare selettivamente DNA target da una fonte complessa di seq di DNA (tutto genoma).
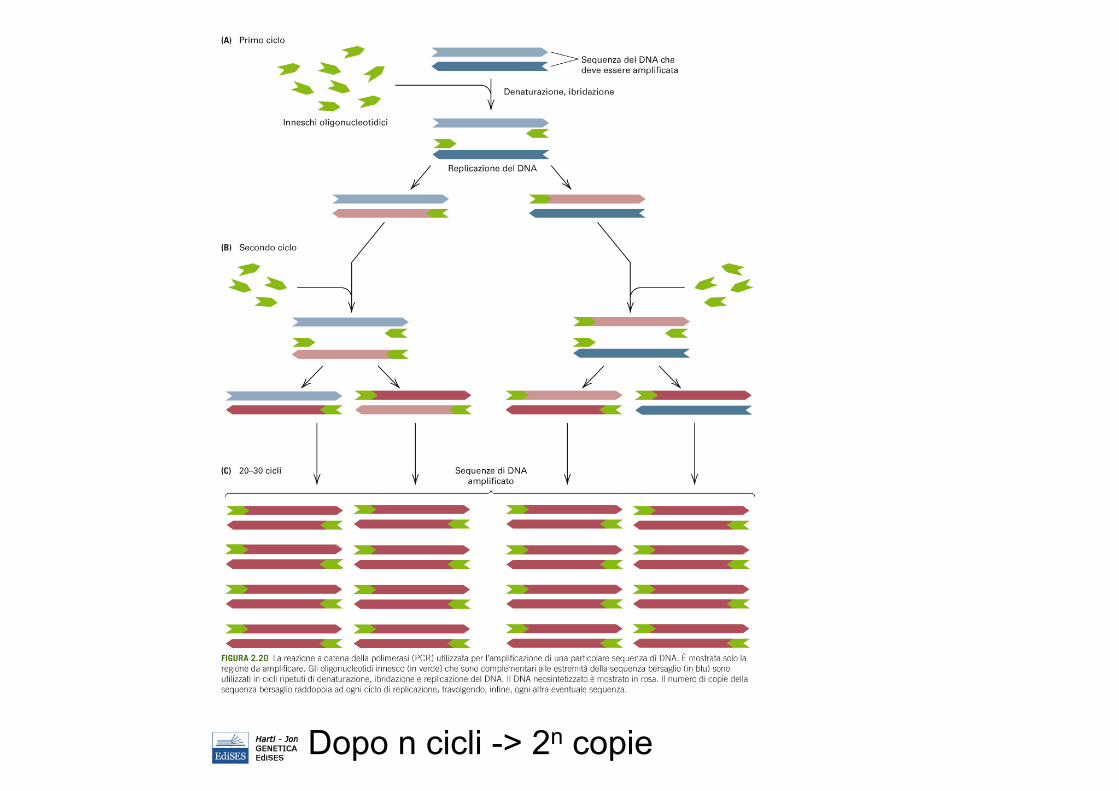
Dopo n cicli -> 2n copie
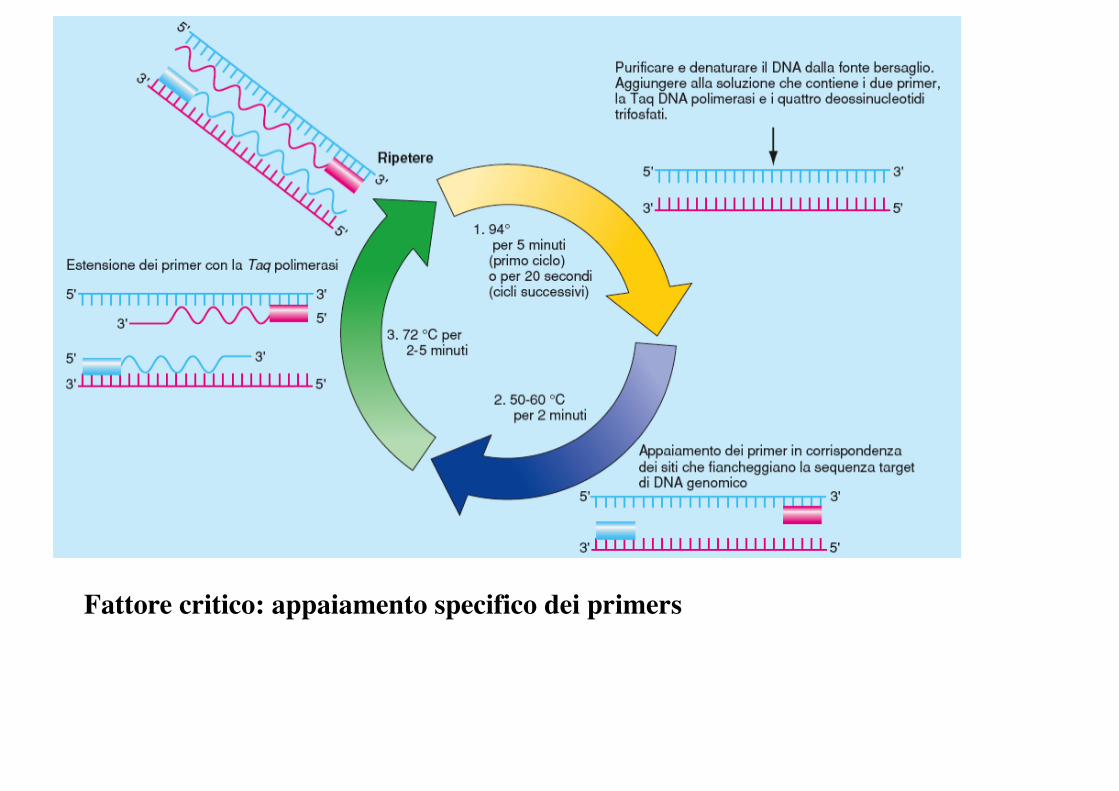
PCR
Fattore critico: appaiamento specifico dei primers

Elementi necessari alla reazione di PCR
•DNA stampo•Primers•Taq DNA Polimerasi•Desossi-Nucleotidi Trifosfati (dNTPs)•Tampone

La reazione di PCR
Log [DNA]
n° cicli
Fase Geometrica
PlateauFase Lineare

Fattori che influenzano la specificità della PCR• Scelta dei primers• Condizioni di reazione• ContaminazioneParametri di ottimizzazione della PCR:
ØDisegno dei Primers ØTemperatura di AnnealingØConcentrazione di Mg++ØConcentrazione di dNTPsØQualità e quantità di EnzimaØForza Ionica del tamponeØPresenza di CosolventiØNumero di Cicli
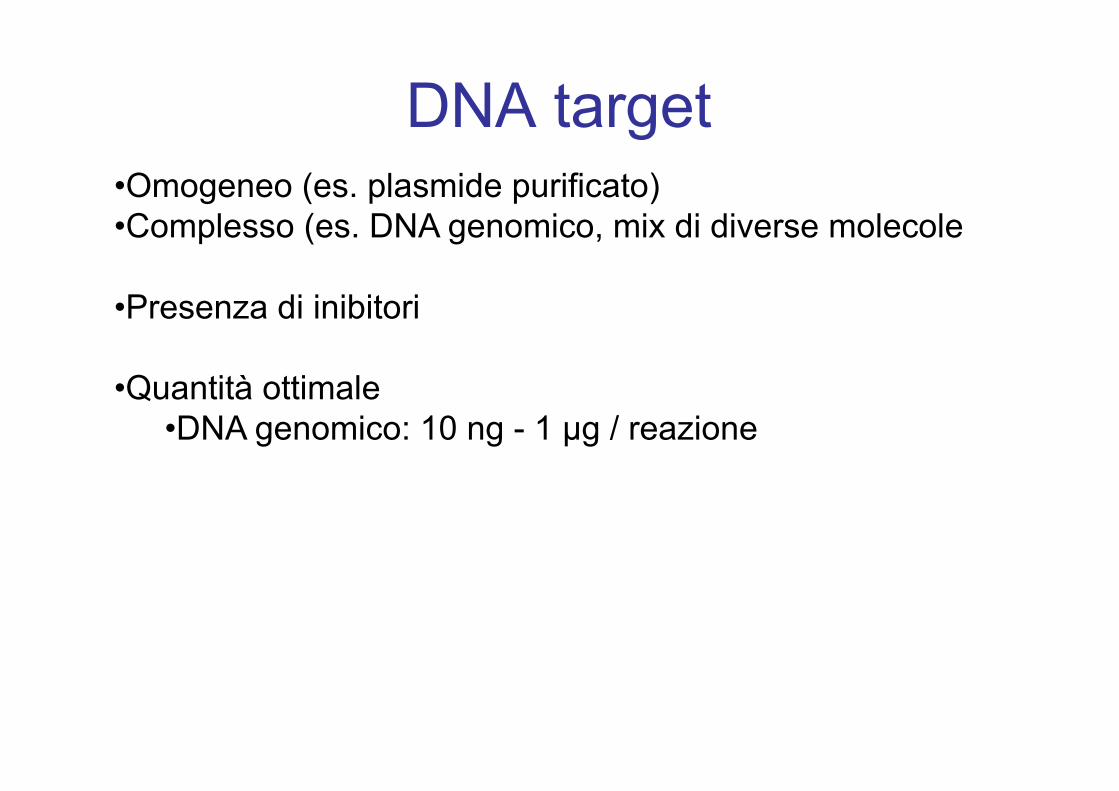
DNA target•Omogeneo (es. plasmide purificato)•Complesso (es. DNA genomico, mix di diverse molecole
•Presenza di inibitori
•Quantità ottimale•DNA genomico: 10 ng - 1 µg / reazione
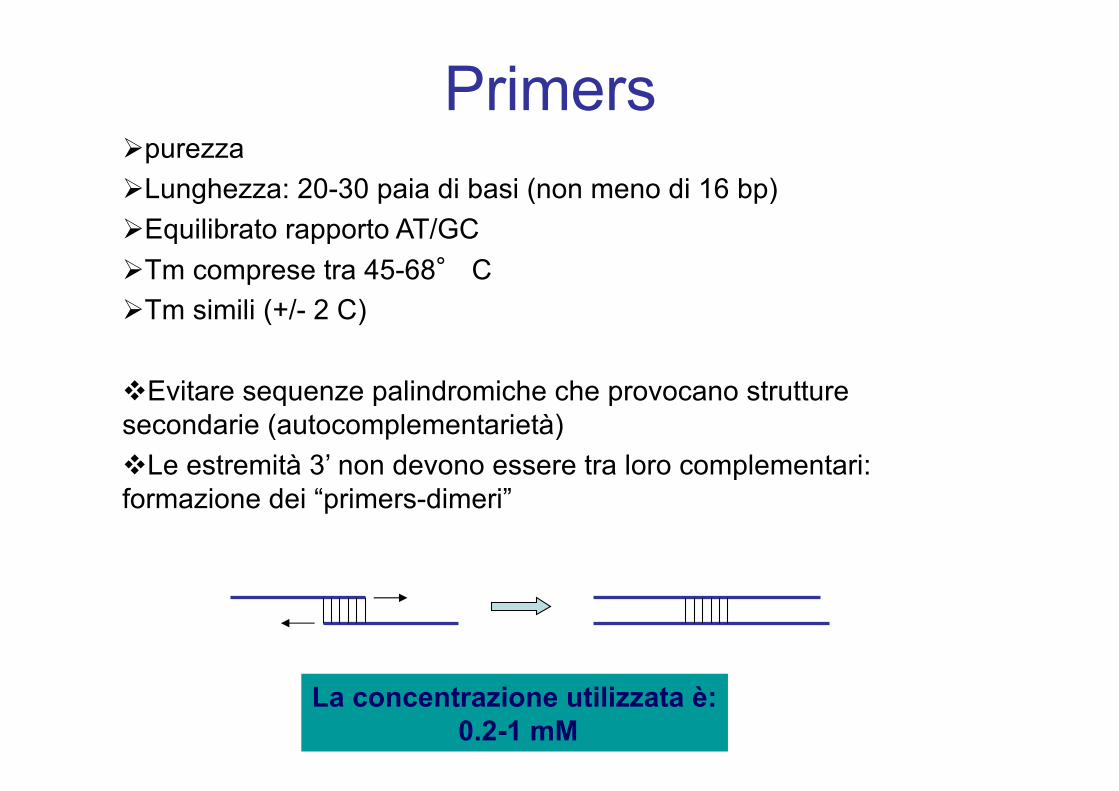
PrimersØpurezzaØLunghezza: 20-30 paia di basi (non meno di 16 bp)ØEquilibrato rapporto AT/GC ØTm comprese tra 45-68° CØTm simili (+/- 2 C)
vEvitare sequenze palindromiche che provocano strutture secondarie (autocomplementarietà)vLe estremità 3’ non devono essere tra loro complementari: formazione dei “primers-dimeri”
La concentrazione utilizzata è:0.2-1 mM
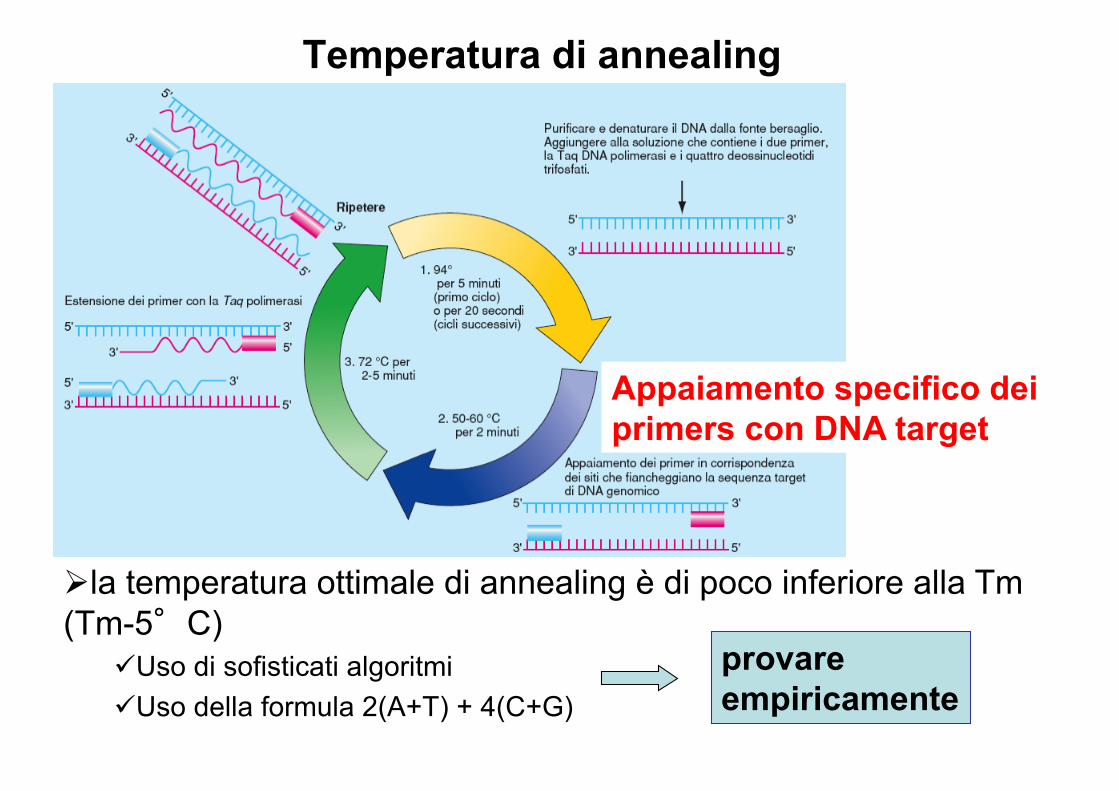
Temperatura di annealing
Appaiamento specifico dei primers con DNA target
Øla temperatura ottimale di annealing è di poco inferiore alla Tm(Tm-5°C)
üUso di sofisticati algoritmi üUso della formula 2(A+T) + 4(C+G)
provare empiricamente
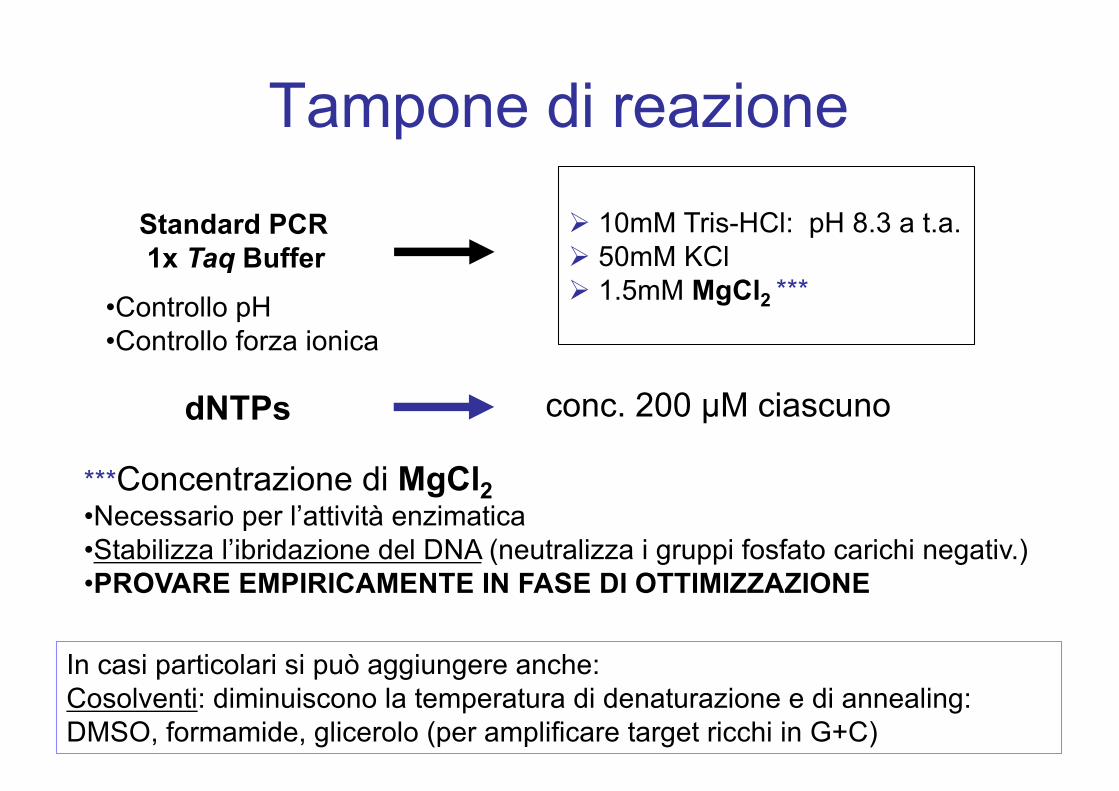
Tampone di reazione
Standard PCR1x Taq Buffer
Ø 10mM Tris-HCl: pH 8.3 a t.a.Ø 50mM KClØ 1.5mM MgCl2 ***•Controllo pH
•Controllo forza ionica
In casi particolari si può aggiungere anche:Cosolventi: diminuiscono la temperatura di denaturazione e di annealing: DMSO, formamide, glicerolo (per amplificare target ricchi in G+C)
***Concentrazione di MgCl2•Necessario per l’attività enzimatica•Stabilizza l’ibridazione del DNA (neutralizza i gruppi fosfato carichi negativ.)•PROVARE EMPIRICAMENTE IN FASE DI OTTIMIZZAZIONE
dNTPs conc. 200 µM ciascuno
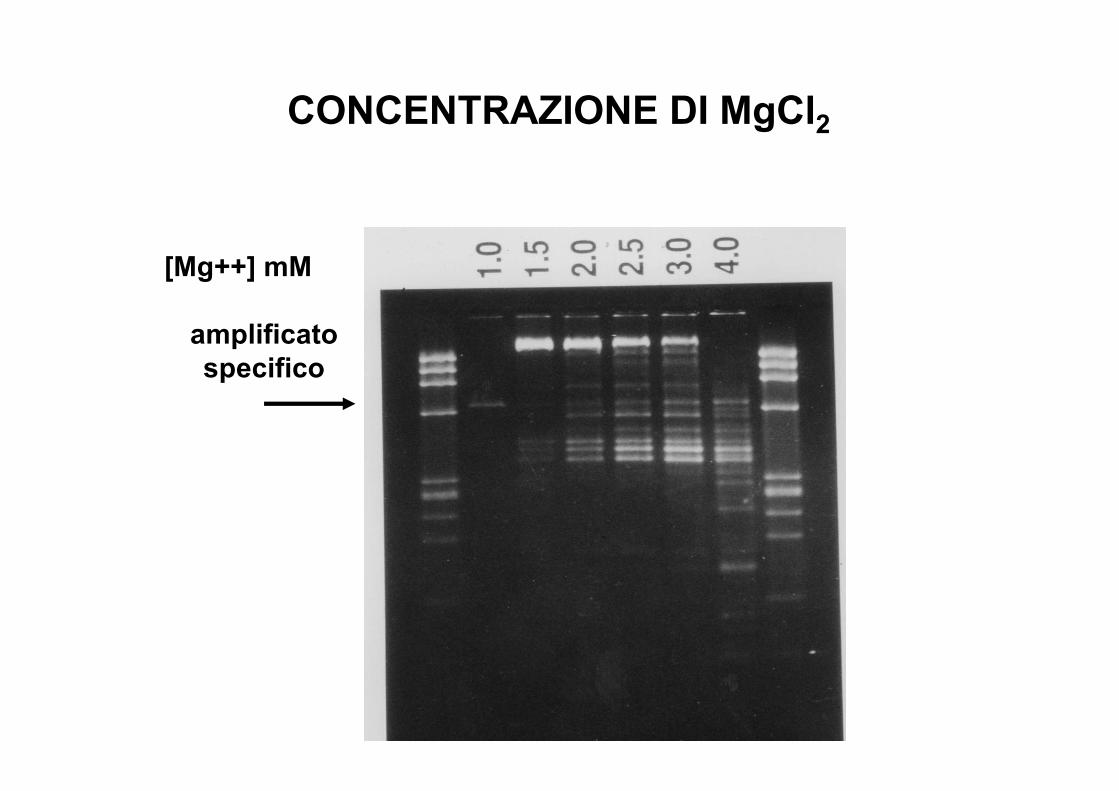
CONCENTRAZIONE DI MgCl2
[Mg++] mM
amplificatospecifico
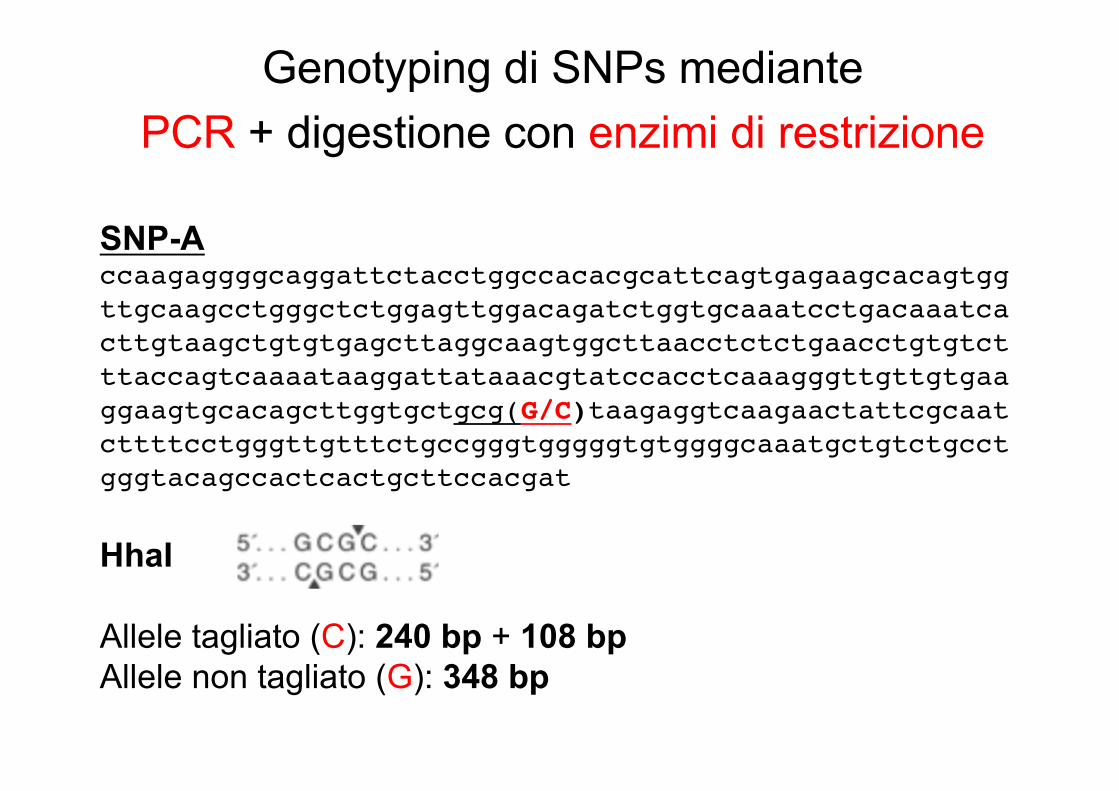
Genotyping di SNPs mediantePCR + digestione con enzimi di restrizione
SNP-Accaagaggggcaggattctacctggccacacgcattcagtgagaagcacagtggttgcaagcctgggctctggagttggacagatctggtgcaaatcctgacaaatcacttgtaagctgtgtgagcttaggcaagtggcttaacctctctgaacctgtgtctttaccagtcaaaataaggattataaacgtatccacctcaaagggttgttgtgaaggaagtgcacagcttggtgctgcg(G/C)taagaggtcaagaactattcgcaatcttttcctgggttgtttctgccgggtgggggtgtggggcaaatgctgtctgcctgggtacagccactcactgcttccacgat
HhaI
Allele tagliato (C): 240 bp + 108 bpAllele non tagliato (G): 348 bp

Genotyping di SNPs mediantePCR + digestione con enzimi di restrizione
SNP-Baaacttttctgcatttggtaaaggtatgtaaactttcctgtactcactgagtaacagctaatctttaatataatattatactgctatatttaaaaagctgactacttgatataattacttaatgtgatgcttgatataataattacttaatgtggccgggcacggtggctcacacctgtaatcccagcactttgggaggtcgaggtgggcgtatcacctgaggttgggagttcgagaccagcctgaccaa(C/T)gtggagaaaccccgtctctactaaaaatatgaaattagccagggtggtggtgcacacctgtaatcccagctacctgggaggctgcggcaggagaatcgcttgaacccaggtggcggaggttgcggtgagctgagatcacgccattgcactccagcctgggcaacaagagcaaaactcagtctcaaataataataataacaacaacttaatgtgctgctgcttttccataaccaa
HpyCH4IV
Allele tagliato (C): 250 pb + 235 bpAllele non tagliato (T): 485 bp