Errore diagnostico: revisione della letteratura e motivi di attualità · Errore diagnostico:...
29
Errore diagnostico: revisione della letteratura e motivi di attualità Workshop 2015 ”Programma regionale di screening mammografico Prevenzione Serena” Torino 2 dicembre 2015
Transcript of Errore diagnostico: revisione della letteratura e motivi di attualità · Errore diagnostico:...

Errore diagnostico: revisione della letteratura e motivi di attualità
Workshop 2015 ”Programma regionale di screening mammografico Prevenzione Serena”
Torino 2 dicembre 2015

Stima dei tumori della mammella falsi positivi da studi di accuratezza diagnostica: una revisione sistematica
Nereo Segnan, Silvia Minozzi, Antonio Ponti, Cristina Bellisario,
Sara Balduzzi, Marien González-Lorenzo, Silvia Gianola, Paola Armaroli
SCDO Epidemiologia dei tumori, CPO Piemonte, A.O.U. Città della Salute e della Scienza di Torino
Estimate of false positive breast cancer diagnoses from accuracy studies: a systematic review
Background-I
• L’istopatologia è attualmente il principale criterio per la
diagnosi di cancro.
• Gli errori di patologia diagnostica posso condurre ad un
management scorretto del paziente, inclusi ritardi nel
trattamento o trattamenti non necessari.
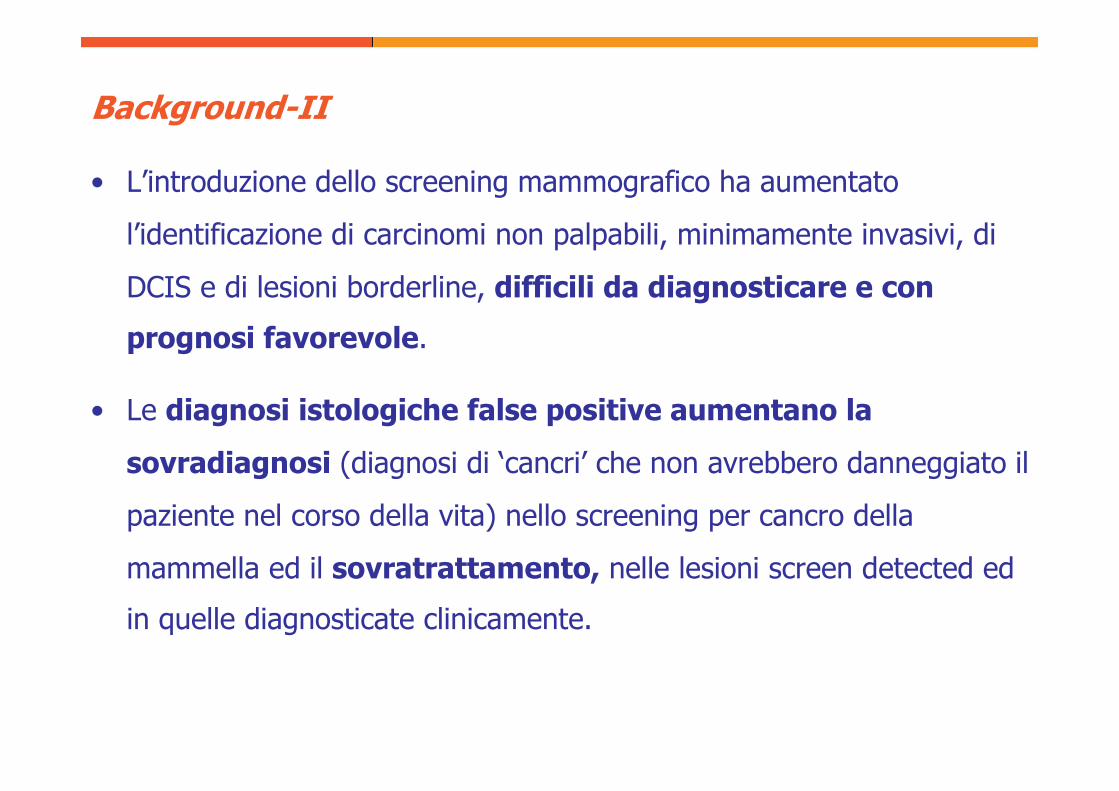
Background-II
• L’introduzione dello screening mammografico ha aumentato
l’identificazione di carcinomi non palpabili, minimamente invasivi, di
DCIS e di lesioni borderline, difficili da diagnosticare e con
prognosi favorevole.
• Le diagnosi istologiche false positive aumentano la
sovradiagnosi (diagnosi di ‘cancri’ che non avrebbero danneggiato il
paziente nel corso della vita) nello screening per cancro della
mammella ed il sovratrattamento, nelle lesioni screen detected ed
in quelle diagnosticate clinicamente.
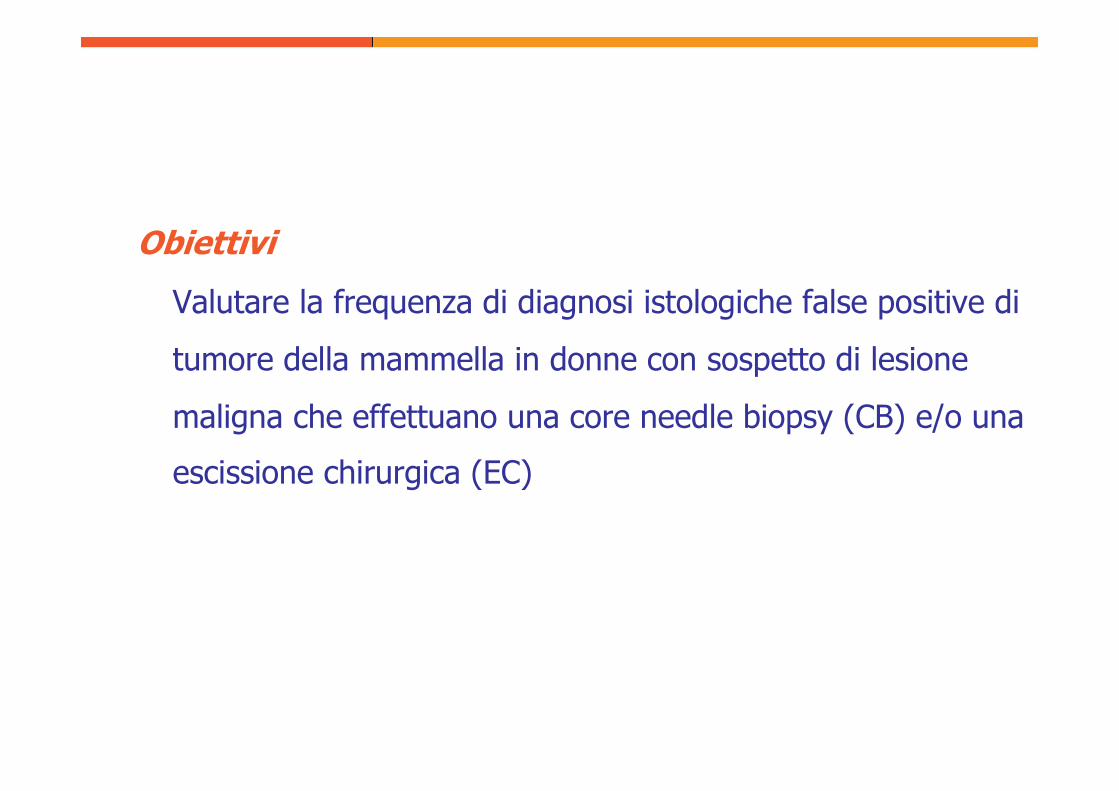
Obiettivi
Valutare la frequenza di diagnosi istologiche false positive di
tumore della mammella in donne con sospetto di lesione
maligna che effettuano una core needle biopsy (CB) e/o una
escissione chirurgica (EC)

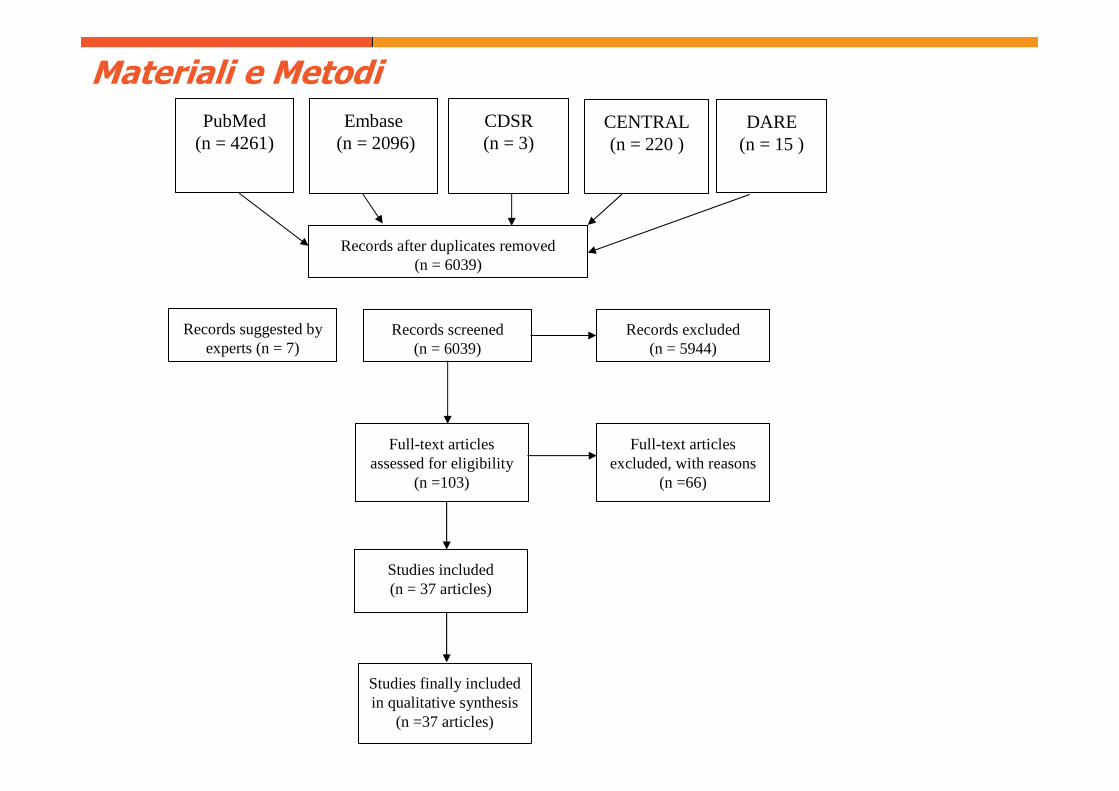
Materiali e Metodi
Revisione sistematica di studi che valutano:
-l’accuratezza diagnostica dell’esame istologico da CB confrontato con
quello del pezzo operatorio,
-e di studi di riproducibilità dei patologi nella diagnosi istologica (CB,
EC).
Ricerca effettuata su PubMed, Embase e Cochrane library entro il
1/4/2014.
Outcome: 1)tasso di falsi positivi (TFP): percentuale di diagnosi
istologiche riclassificate da maligne alla CB a benigne alla EC;
2)misclassificazione di diagnosi istologiche benigne in maligne (MBM),
e statistica K negli studi di riproducibilità
Materiali e Metodi
Records after duplicates removed(n = 6039)
Records screened(n = 6039)
Records excluded(n = 5944)
Full-text articles assessed for eligibility
(n =103)
Full-text articles excluded, with reasons
(n =66)
Studies included (n = 37 articles)
Embase(n = 2096)
CENTRAL(n = 220 )
DARE (n = 15 )
Studies finally included in qualitative synthesis
(n =37 articles)
CDSR(n = 3)
Records suggested by experts (n = 7)
PubMed(n = 4261)
RISULTATI
Sono stati inclusi complessivamente 36 studi.
Outcome 1: CB vs EC
15 studi valutano TFP dell’esame istologico da CB, in casi
diagnosticati nel 1990-2007.
In 10 studi che includono 42152 lesioni screen detected, TFP varia da
0% a 7%.
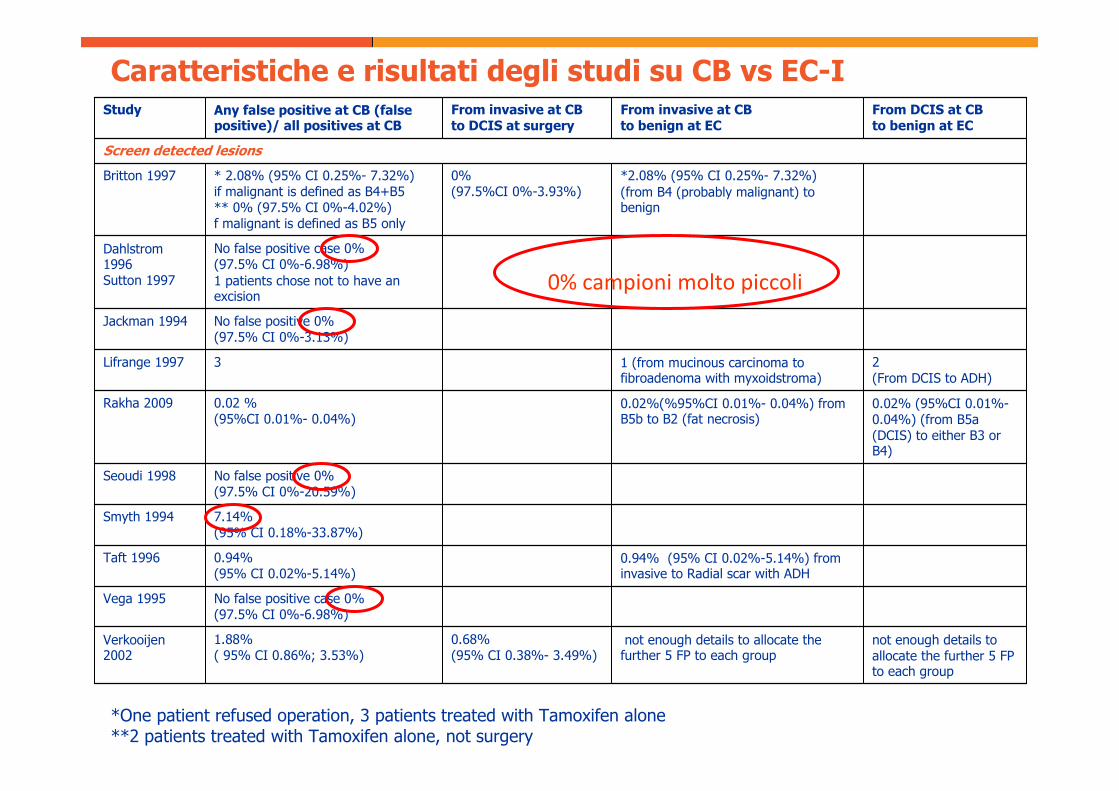
Caratteristiche e risultati degli studi su CB vs EC-I
not enough details to allocate the further 5 FP to each group
not enough details to allocate the further 5 FP to each group
0.68% (95% CI 0.38%- 3.49%)
1.88% ( 95% CI 0.86%; 3.53%)
Verkooijen2002
No false positive case 0% (97.5% CI 0%-6.98%)
Vega 1995
0.94% (95% CI 0.02%-5.14%) from invasive to Radial scar with ADH
0.94% (95% CI 0.02%-5.14%)
Taft 1996
7.14% (95% CI 0.18%-33.87%)
Smyth 1994
No false positive 0% (97.5% CI 0%-20.59%)
Seoudi 1998
0.02% (95%CI 0.01%-0.04%) (from B5a (DCIS) to either B3 or B4)
0.02%(%95%CI 0.01%- 0.04%) from B5b to B2 (fat necrosis)
0.02 % (95%CI 0.01%- 0.04%)
Rakha 2009
2 (From DCIS to ADH)
1 (from mucinous carcinoma to fibroadenoma with myxoidstroma)
3Lifrange 1997
No false positive 0% (97.5% CI 0%-3.13%)
Jackman 1994
No false positive case 0% (97.5% CI 0%-6.98%) 1 patients chose not to have an excision
Dahlstrom1996 Sutton 1997
*2.08% (95% CI 0.25%- 7.32%)(from B4 (probably malignant) to benign
0%(97.5%CI 0%-3.93%)
* 2.08% (95% CI 0.25%- 7.32%)if malignant is defined as B4+B5** 0% (97.5% CI 0%-4.02%) f malignant is defined as B5 only
Britton 1997
Screen detected lesions
From DCIS at CB to benign at EC
From invasive at CB to benign at EC
From invasive at CB to DCIS at surgery
Any false positive at CB (false positive)/ all positives at CB
Study
*One patient refused operation, 3 patients treated with Tamoxifen alone**2 patients treated with Tamoxifen alone, not surgery
0% campioni molto piccoli

RISULTATI-I
Outcome 2: MBM, statistica K
21 studi valutano la riproducibilità di 2 o più letture dello stesso vetrino.
Tra gli studi con campioni consecutivi, casuali o stratificati di tutti i
vetrini MBM alla CB varia dallo 0.25% al 1.96% (3 studi), alla EC da
0.69% a 1.17% (2 studi). K varia alla CB da 0.83 a 0.98 (4 studi), e
da 0.86 a 0.94 alla EC (3 studi).
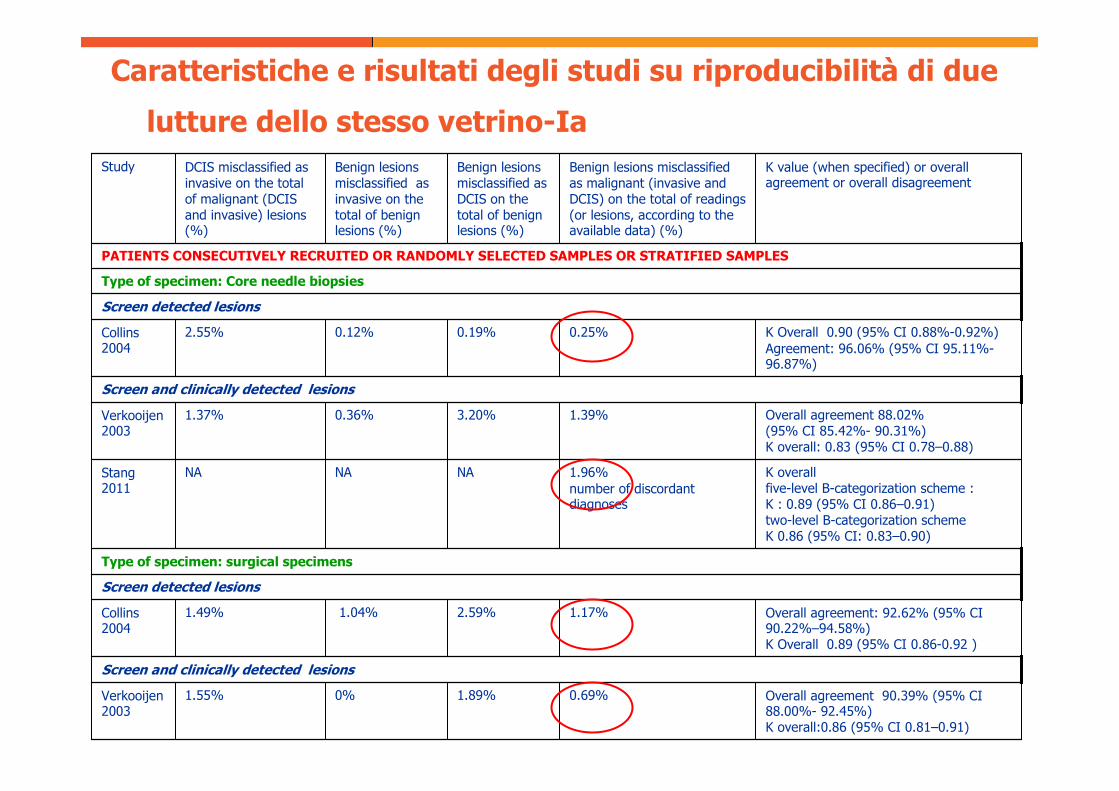
Overall agreement 90.39% (95% CI 88.00%- 92.45%)K overall:0.86 (95% CI 0.81–0.91)
0.69%1.89%0%1.55%Verkooijen2003
Screen and clinically detected lesions
Overall agreement: 92.62% (95% CI 90.22%–94.58%)K Overall 0.89 (95% CI 0.86-0.92 )
1.17%2.59%1.04%1.49%Collins 2004
Screen detected lesions
Type of specimen: surgical specimens
K overallfive-level B-categorization scheme : K : 0.89 (95% CI 0.86–0.91)two-level B-categorization scheme K 0.86 (95% CI: 0.83–0.90)
1.96%number of discordant diagnoses
NANANAStang2011
Overall agreement 88.02% (95% CI 85.42%- 90.31%)K overall: 0.83 (95% CI 0.78–0.88)
1.39%3.20%0.36%1.37%Verkooijen2003
Screen and clinically detected lesions
K Overall 0.90 (95% CI 0.88%-0.92%) Agreement: 96.06% (95% CI 95.11%-96.87%)
0.25%0.19%0.12%2.55%Collins 2004
Screen detected lesions
Type of specimen: Core needle biopsies
PATIENTS CONSECUTIVELY RECRUITED OR RANDOMLY SELECTED SAMPLES OR STRATIFIED SAMPLES
K value (when specified) or overall agreement or overall disagreement
Benign lesions misclassified as malignant (invasive and DCIS) on the total of readings (or lesions, according to the available data) (%)
Benign lesions misclassified as DCIS on the total of benign lesions (%)
Benign lesions misclassified as invasive on the total of benign lesions (%)
DCIS misclassified as invasive on the total of malignant (DCIS and invasive) lesions (%)
Study
Caratteristiche e risultati degli studi su riproducibilità di due
lutture dello stesso vetrino-Ia
RISULTATI-II
Outcome 2: MBM, statistica K
Tra gli studi con campioni arricchiti MBM varia da 1.36% a 4.39%
(5 studi), K da 0.57 a 0.86.

K Overall Between pathologist=0.66 (range 0.57-0.76)Between pathologist and the predominant diagnosis=0.786 (SE 0.27)
3.68%3.19%4.38%0%
K OverallCoordinators 0.86Non coordinators 0.78
1.36%2.23%1.05%2.31%
Giardina1998
K Overall =0.57 (value for both circulation and two borderline series combined)
First circulation= 3.33%Second circulation= 2.5%
First circulation= 4.44%Second circulation=4.17%
First circulation= 0.89%Second circulation= 0%
First circulation=0%Second circulation=0%
Beck 1985
Not specified if clinically or screen detected lesions
Sloane 1994
K Overall =0.86 (range 0.65–1.0).2.00%0%3.85%3.47 %Bianchi 1994
Screen detected lesions
Type of specimen: not reported
Kappa overall =0.61(range 0.31–0.88)
4.39% (considering as benign B2 and B3 and malignant B4-B5)
NANANABianchi 2009
Screen detected lesions
Type of specimen: Core needle biopsies
ENRICHED SAMPLES
K value (when specified) or overall agreement or overall disagreement
Benign lesions misclassified as malignant (invasive and DCIS) on the total of readings (or lesions, according to the available data) (%)
Benign lesions misclassified as DCIS on the total of benign lesions (%)
Benign lesions misclassified as invasive on the total of benign lesions (%)
DCIS misclassified as invasive on the total of malignant (DCIS and invasive) lesions (%)
Study
Caratteristiche e risultati degli studi su riproducibilità di due
lutture dello stesso vetrino-IIa
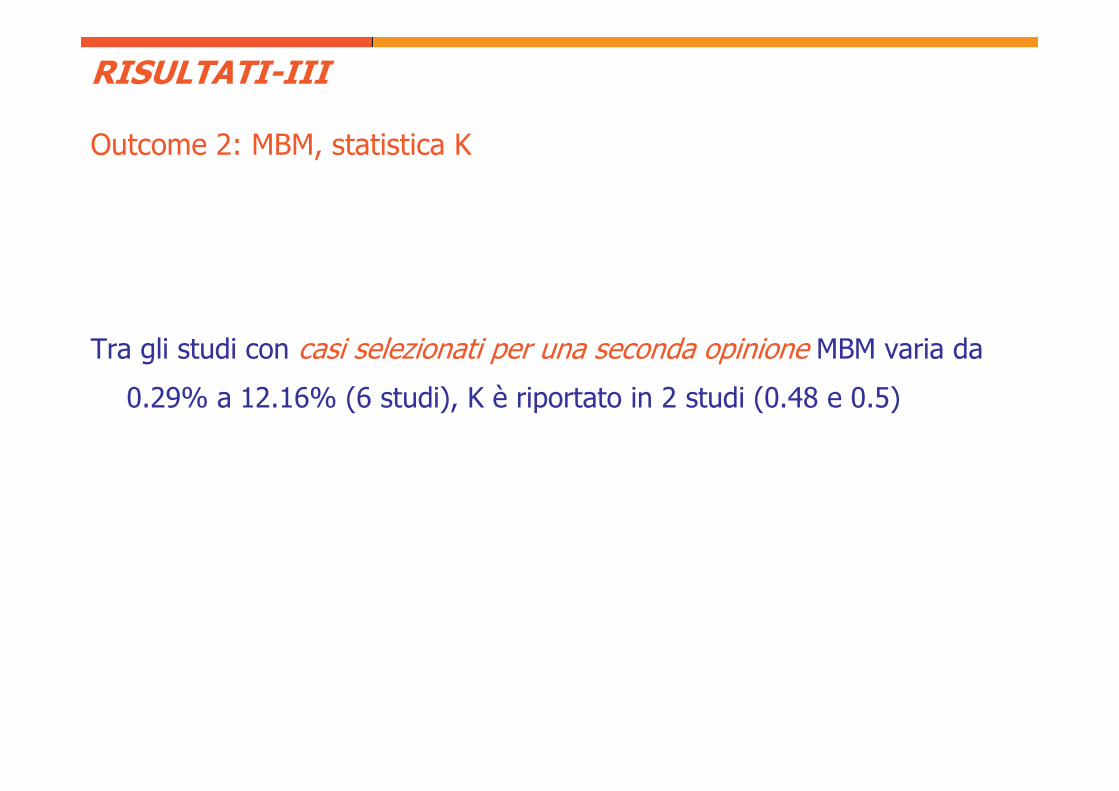
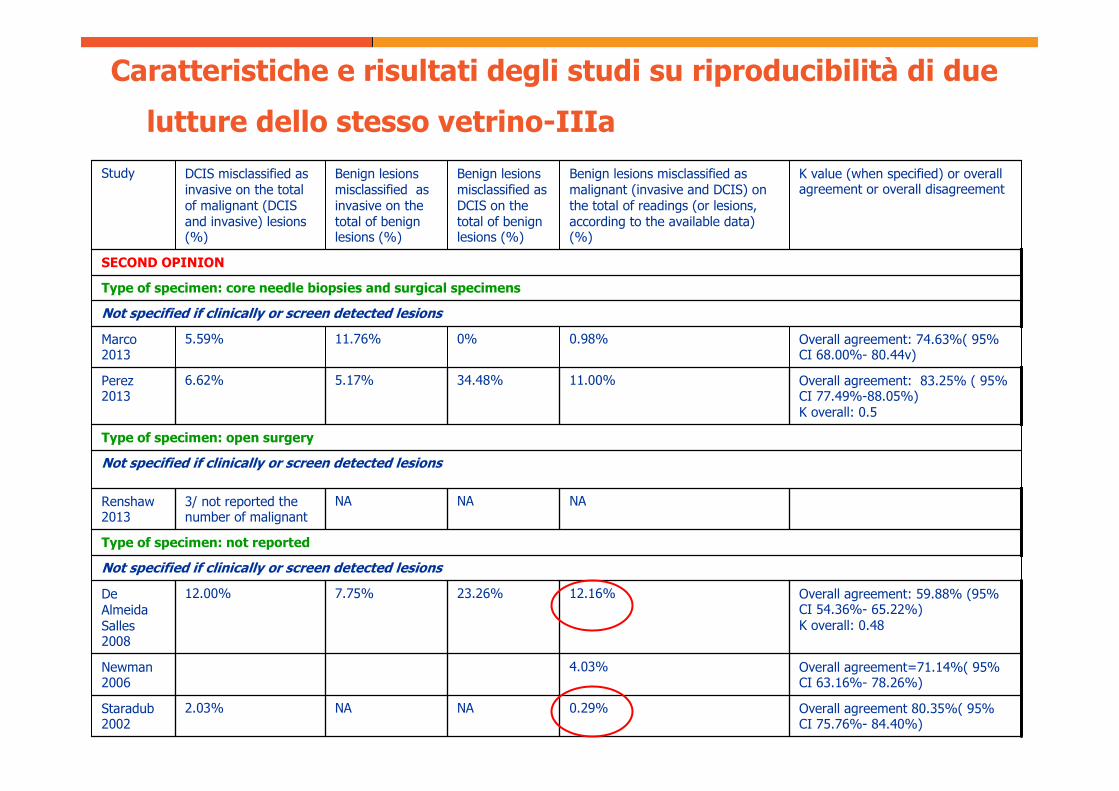
RISULTATI-III
Outcome 2: MBM, statistica K
Tra gli studi con casi selezionati per una seconda opinione MBM varia da
0.29% a 12.16% (6 studi), K è riportato in 2 studi (0.48 e 0.5)
Overall agreement=71.14%( 95% CI 63.16%- 78.26%)
4.03%Newman 2006
Overall agreement: 59.88% (95% CI 54.36%- 65.22%)K overall: 0.48
12.16%23.26%7.75%12.00%De Almeida Salles2008
Overall agreement: 83.25% ( 95% CI 77.49%-88.05%)K overall: 0.5
11.00%34.48%5.17%6.62%
Overall agreement 80.35%( 95% CI 75.76%- 84.40%)
0.29%NANA2.03%
NANANA3/ not reported the number of malignant
Staradub2002
Not specified if clinically or screen detected lesions
Type of specimen: not reported
Renshaw2013
Not specified if clinically or screen detected lesions
Type of specimen: open surgery
Perez 2013
Overall agreement: 74.63%( 95% CI 68.00%- 80.44v)
0.98%0%11.76%5.59%Marco 2013
Not specified if clinically or screen detected lesions
Type of specimen: core needle biopsies and surgical specimens
SECOND OPINION
K value (when specified) or overall agreement or overall disagreement
Benign lesions misclassified as malignant (invasive and DCIS) on the total of readings (or lesions, according to the available data) (%)
Benign lesions misclassified as DCIS on the total of benign lesions (%)
Benign lesions misclassified as invasive on the total of benign lesions (%)
DCIS misclassified as invasive on the total of malignant (DCIS and invasive) lesions (%)
Study
Caratteristiche e risultati degli studi su riproducibilità di due
lutture dello stesso vetrino-IIIa
CONCLUSIONI
TFP e MBM possono contribuire in modo non trascurabile alla
sovradiagnosi, variando TFP alla CB da 0% a 7% e MBM da 0.25%
a 12.2%. Come atteso la concordanza tra patologi si riduce in
studi con campioni arricchiti.
Prendendo in considerazione la dimensione del campione e la qualità
metologica, tra gli studi che valutano il TFP alla CB per lesioni
screen detected Verkooijen 2002 può essere considerato uno
studio informativo (TFP=1.88%).
L’impatto delle diagnosi istologiche false positive sulla sovradiagnosi
non è trascurabile ed ha una rilevanza nella pratica clinica.

AGGIORNAMENTO DELLA RICERCA
E MOTIVI DI ATTUALITÀ

AGGIORNAMENTO della RICERCA
Al 30/10/2015, Ulteriori 893 abstract, da cui sono stati selezionati per
l’inclusione ed estrazione dei dati ulteriori: 1+7 (pubblicati tra
Aprile 2014-Ottobre 2015). Tra cui

Methods
240 breast biopsy specimens (excisional or core needle) randomly identified
from a cohort of 19498 cases obtained from pathology registries in New
Hampshire and Vermont. Random, stratified sampling was used to select
cases based on the original pathologists’ diagnoses.
Participants independently interpreted slides between November 2011 and
May 2014 from 4 test sets of 60 breast biopsies (1 slide per case),
including 23 cases of invasive breast cancer, 73 ductal carcinoma in situ
(DCIS), 72 with atypical hyperplasia (atypia), and 72 benign cases without
atypia. Participants were blinded to the interpretations of other study
pathologists and consensus panel members.
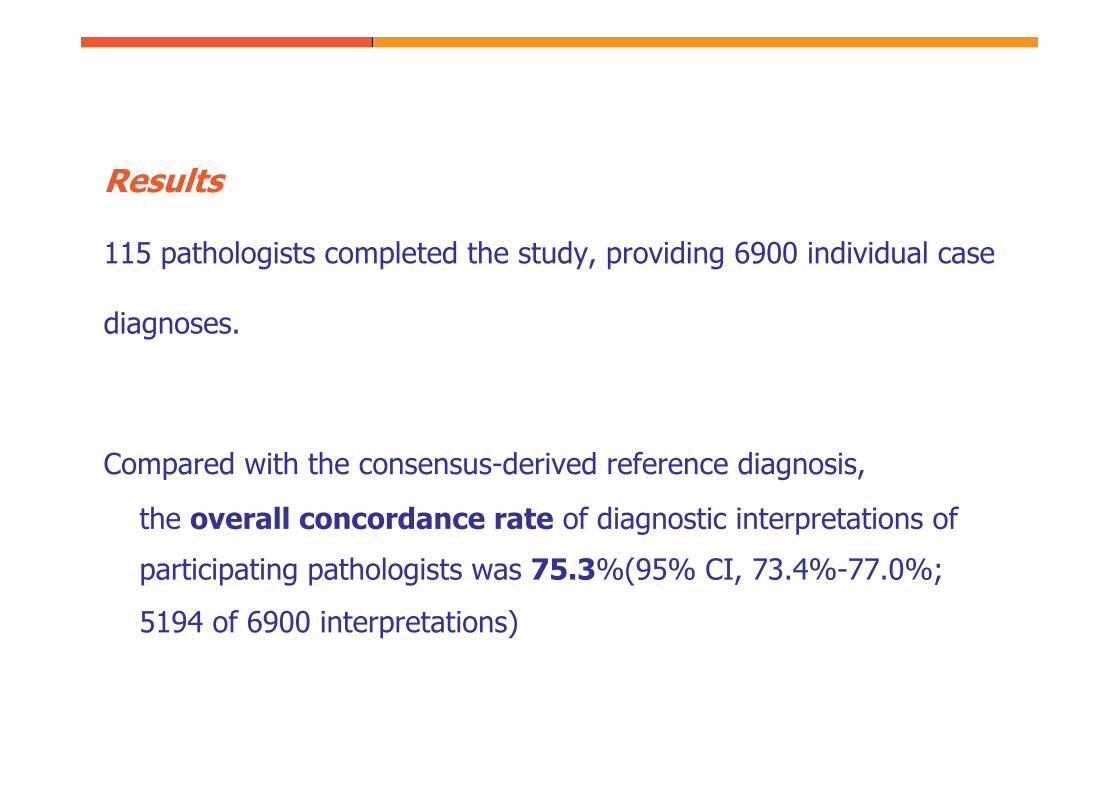
Results
115 pathologists completed the study, providing 6900 individual case
diagnoses.
Compared with the consensus-derived reference diagnosis,
the overall concordance rate of diagnostic interpretations of
participating pathologists was 75.3%(95% CI, 73.4%-77.0%;
5194 of 6900 interpretations)
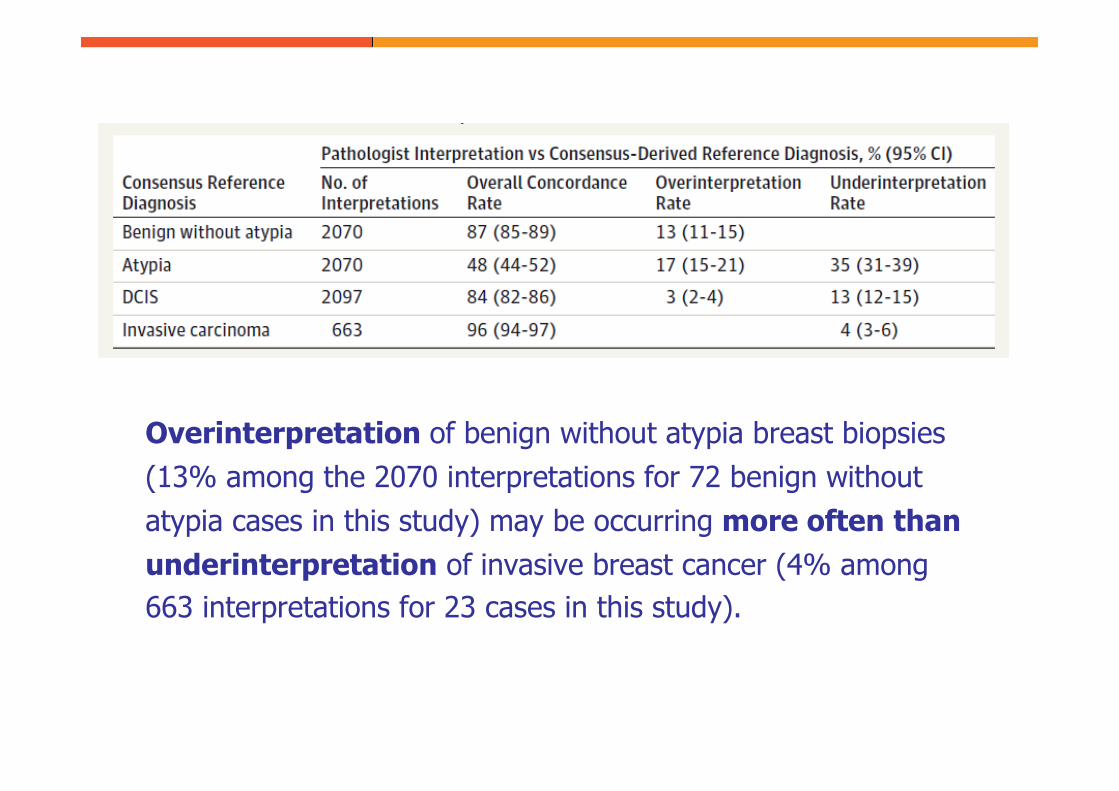
Overinterpretation of benign without atypia breast biopsies
(13% among the 2070 interpretations for 72 benign without
atypia cases in this study) may be occurring more often than underinterpretation of invasive breast cancer (4% among
663 interpretations for 23 cases in this study).
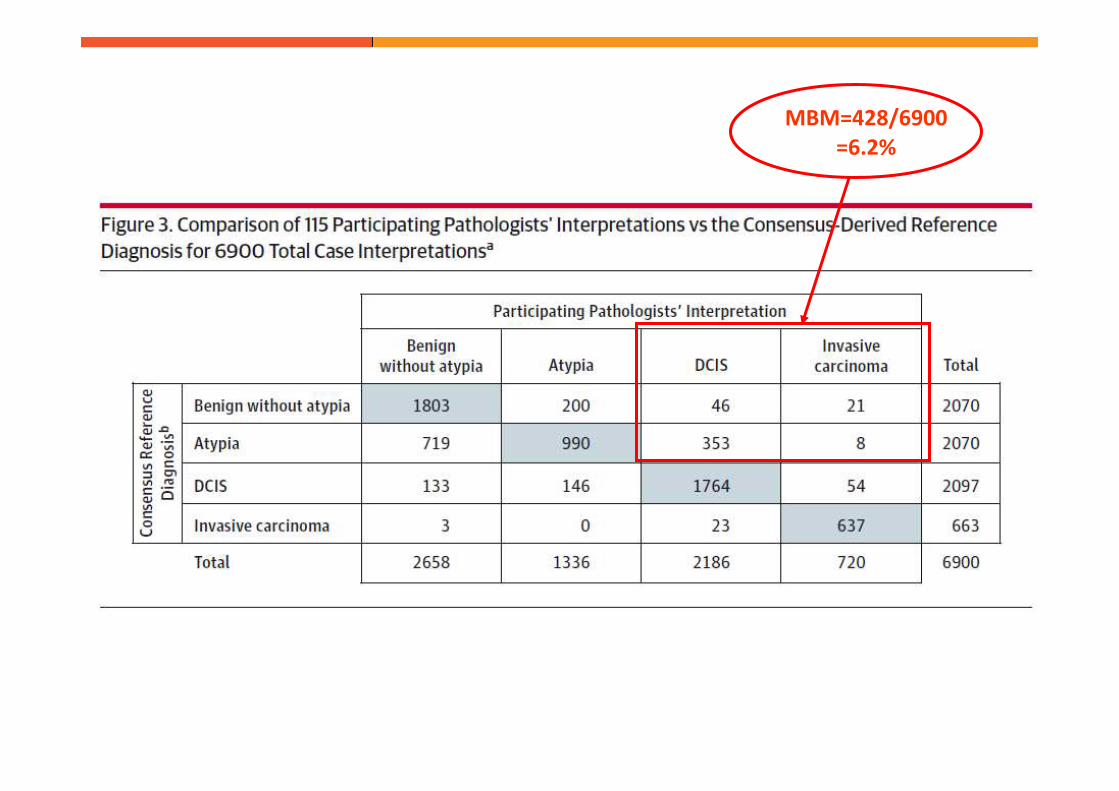
MBM=428/6900
=6.2%
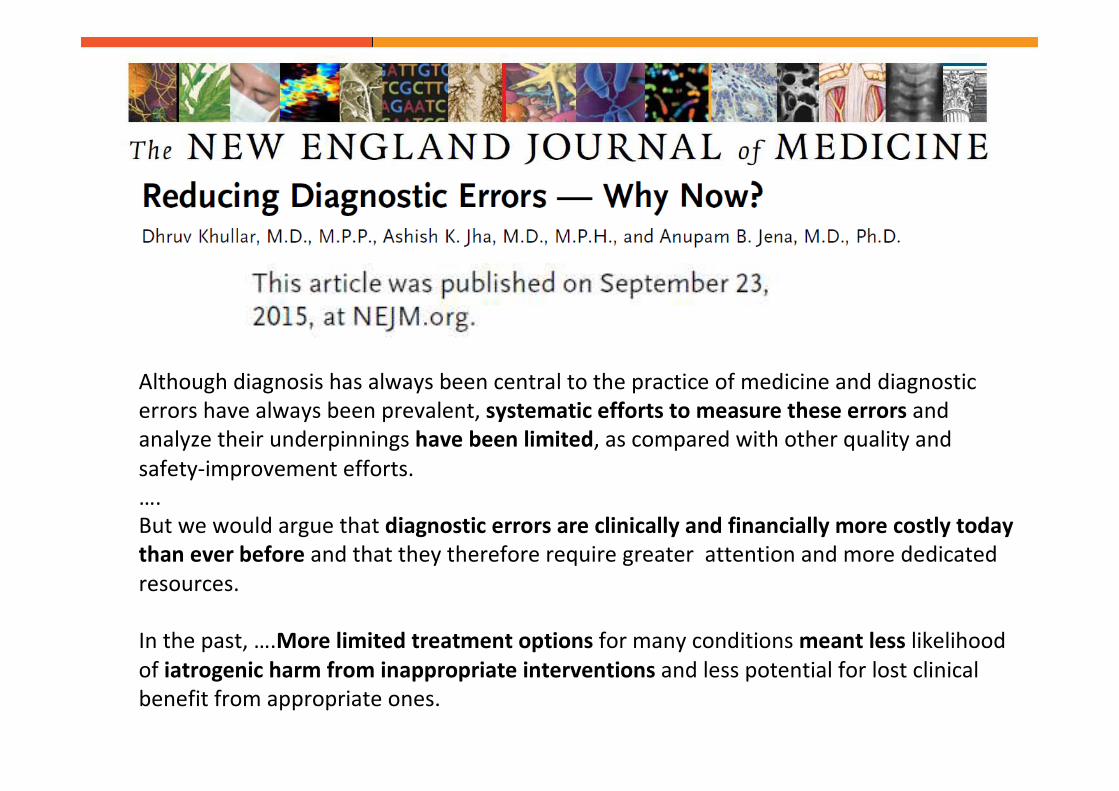
Although diagnosis has always been central to the practice of medicine and diagnostic
errors have always been prevalent, systematic efforts to measure these errors and
analyze their underpinnings have been limited, as compared with other quality and
safety-improvement efforts.
….
But we would argue that diagnostic errors are clinically and financially more costly today
than ever before and that they therefore require greater attention and more dedicated
resources.
In the past, ….More limited treatment options for many conditions meant less likelihood
of iatrogenic harm from inappropriate interventions and less potential for lost clinical
benefit from appropriate ones.
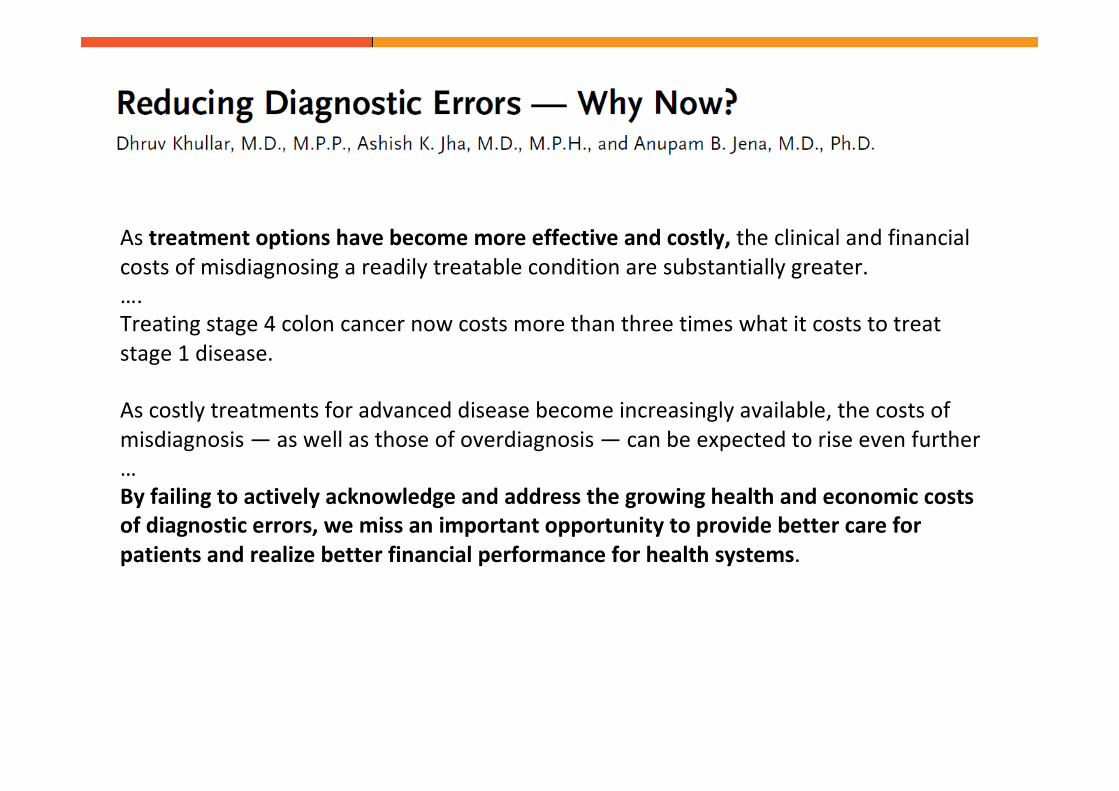
As treatment options have become more effective and costly, the clinical and financial
costs of misdiagnosing a readily treatable condition are substantially greater.
….
Treating stage 4 colon cancer now costs more than three times what it costs to treat
stage 1 disease.
As costly treatments for advanced disease become increasingly available, the costs of
misdiagnosis — as well as those of overdiagnosis — can be expected to rise even further
…
By failing to actively acknowledge and address the growing health and economic costs
of diagnostic errors, we miss an important opportunity to provide better care for
patients and realize better financial performance for health systems.


Grazie per l’attenzione!
Slideshow title, ex: Applicazione del “ukpds outcome model” alla coorte di pazienti diabetici di Casale-Monferrato: una valutazione della capacità predittiva
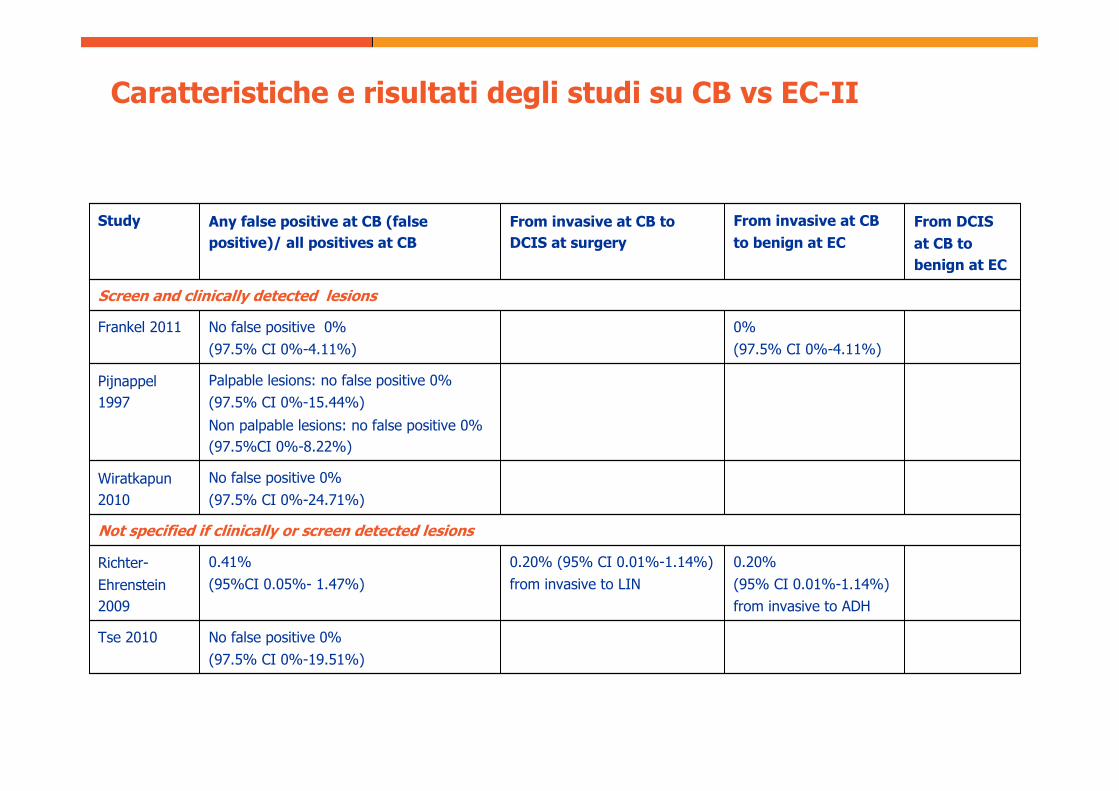
Caratteristiche e risultati degli studi su CB vs EC-II
No false positive 0%
(97.5% CI 0%-19.51%)
Tse 2010
0.20%
(95% CI 0.01%-1.14%)
from invasive to ADH
0.20% (95% CI 0.01%-1.14%)
from invasive to LIN
0.41%
(95%CI 0.05%- 1.47%)
Richter-
Ehrenstein
2009
Not specified if clinically or screen detected lesions
No false positive 0%
(97.5% CI 0%-24.71%)
Wiratkapun
2010
Palpable lesions: no false positive 0%
(97.5% CI 0%-15.44%)
Non palpable lesions: no false positive 0%
(97.5%CI 0%-8.22%)
Pijnappel
1997
0%
(97.5% CI 0%-4.11%)
No false positive 0%
(97.5% CI 0%-4.11%)
Frankel 2011
Screen and clinically detected lesions
From DCIS at CB to benign at EC
From invasive at CB to benign at EC
From invasive at CB to DCIS at surgery
Any false positive at CB (false positive)/ all positives at CB
Study