Download - Stanford University
186
Country Snapshots 9.0 (Based on PWT 9.0) (Click here for Notes) Quick Links: USA JPN GBR IRL FRA DEU ITA RUS SWE CHN IND KOR THA TUR / ARG BRA MEX / BWA ETH KEN NGA Aruba Angola Anguilla Albania U.A.E. Argentina Armenia Antigua and Barbuda Australia Austria Azerbaijan Burundi Belgium Benin Burkina Faso Bangladesh Bulgaria Bahrain Bahamas Bosnia and Herzegovina Belarus Belize Bermuda Bolivia Brazil Barbados Brunei Darussalam Bhutan Botswana Central Afr. Rep. Canada Switzerland Chile China Cote dIvoire Cameroon D.R. of the Congo Congo Colombia Comoros Cabo Verde Costa Rica Curaao Cayman Islands Cyprus Czech Republic Germany Djibouti Dominica Denmark Dominican Republic Algeria Ecuador Egypt Spain Estonia Ethiopia Finland Fiji France Gabon U.K. Georgia Ghana Guinea Gambia Guinea-Bissau Equatorial Guinea Greece Grenada Guatemala Hong Kong Honduras Croatia Haiti Hungary Indonesia India Ireland Iran Iraq Iceland Israel Italy Jamaica Jordan Japan Kazakhstan Kenya Kyrgyzstan Cambodia Saint Kitts and Nevis South Korea Kuwait Laos Lebanon Liberia Saint Lucia Sri Lanka Lesotho Lithuania Luxembourg Latvia Macao Morocco
Transcript of Download - Stanford University

Country Snapshots 9.0(Based on PWT 9.0)
(Click here for Notes)
Quick Links: USA JPN GBR IRL FRA DEU ITA RUS SWE
CHN IND KOR THA TUR / ARG BRA MEX / BWA ETH KEN NGA
Aruba
Angola
Anguilla
Albania
U.A.E.
Argentina
Armenia
Antigua and Barbuda
Australia
Austria
Azerbaijan
Burundi
Belgium
Benin
Burkina Faso
Bangladesh
Bulgaria
Bahrain
Bahamas
Bosnia and Herzegovina
Belarus
Belize
Bermuda
Bolivia
Brazil
Barbados
Brunei Darussalam
Bhutan
Botswana
Central Afr. Rep.
Canada
Switzerland
Chile
China
Cote dIvoire
Cameroon
D.R. of the Congo
Congo
Colombia
Comoros
Cabo Verde
Costa Rica
Curaao
Cayman Islands
Cyprus
Czech Republic
Germany
Djibouti
Dominica
Denmark
Dominican Republic
Algeria
Ecuador
Egypt
Spain
Estonia
Ethiopia
Finland
Fiji
France
Gabon
U.K.
Georgia
Ghana
Guinea
Gambia
Guinea-Bissau
Equatorial Guinea
Greece
Grenada
Guatemala
Hong Kong
Honduras
Croatia
Haiti
Hungary
Indonesia
India
Ireland
Iran
Iraq
Iceland
Israel
Italy
Jamaica
Jordan
Japan
Kazakhstan
Kenya
Kyrgyzstan
Cambodia
Saint Kitts and Nevis
South Korea
Kuwait
Laos
Lebanon
Liberia
Saint Lucia
Sri Lanka
Lesotho
Lithuania
Luxembourg
Latvia
Macao
Morocco

Moldova
Madagascar
Maldives
Mexico
TFYR of Macedonia
Mali
Malta
Myanmar
Montenegro
Mongolia
Mozambique
Mauritania
Montserrat
Mauritius
Malawi
Malaysia
Namibia
Niger
Nigeria
Nicaragua
Netherlands
Norway
Nepal
New Zealand
Oman
Pakistan
Panama
Peru
Philippines
Poland
Portugal
Paraguay
Palestine
Qatar
Romania
Russian Federation
Rwanda
Saudi Arabia
Sudan
Senegal
Singapore
Sierra Leone
El Salvador
Serbia
Sao Tome and Principe
Suriname
Slovakia
Slovenia
Sweden
Swaziland
Sint Maarten (Dutch part)
Seychelles
Syria
Turks and Caicos Islands
Chad
Togo
Thailand
Tajikistan
Turkmenistan
Trinidad and Tobago
Tunisia
Turkey
Taiwan
Tanzania
Uganda
Ukraine
Uruguay
United States
Uzbekistan
St. Vincent and the Grenadines
Venezuela
British V.I.
Viet Nam
Yemen
South Africa
Zambia
Zimbabwe

Country Snapshots 9.0
Charles I. Jones
Graduate School of Business
Stanford University
http://www.stanford.edu/˜chadj
April 18, 2017
Notes
• From a country page, click on the country name to return to the main index page.
• From a country page, click on (data) in order to open a xls spreadsheet file of the data for that
particular country. This file is an an older Excel format that any spreadsheet program should be
able to read (in fact, you can set up your web browser’s preferences to open the .xls file with your
spreadsheet program automatically). The notes below also apply to the data file. “NaN” in the
file denotes a missing observation.
• If clicking on the (data) hyperlink does not allow you to download the data directly, see the
instructions at http://www.stanford.edu/˜chadj/snapshots.html for a simple alternative.
• The first graph of GDP per capita and GDP per worker is drawn on a “ratio scale” (also called
a “log scale”). For all countries other than the United States, values are relative to the United
States (US=100). For the United States, these variables are reported in chained 2011 international
dollars.
• The titles to the graphs include a value for each variable in parentheses. This is the most recent
value available for each series (often corresponding to the year 2014).
• Population is reported for the most recent year available in millions next to the country name.
• The growth rate in the second graph is for per capita GDP; in the spreadsheet file, it is calculated
as the percentage change.
• In graphs with 2 data series, the title lists the name of the two series. The first title corresponds
to the solid blue line. The second title corresponds to the green dashed line.
• The ratios of investment to GDP (I/Y) and government consumption to GDP (G/Y) are based
on the current international price series in the Penn World Tables. The trade balance (NX/Y)
includes the “residual” category from the Penn World Tables. The openness measure (X+M)/Y
does not.
• All of the Penn World Tables variables (which is all other than educational attainment) are in
international prices. This means the variables will differ from the corresponding variables from
country national accounts data.
• Additional copies of this file and a history of changes may be obtained from
http://www.stanford.edu/˜chadj/snapshots.html
(continued next page)

Sources
• Data on all variables other than educational attainment are taken from the Penn World Tables:
Feenstra, Robert C., Robert Inklaar and Marcel P. Timmer (2015), ”The Next Generation of the
Penn World Table” American Economic Review, 105(10), 3150-3182, available for download at
http://www.ggdc.net/pwt. The series “rgdpo” is used for GDP.
• Data on educational attainment is from the 2016 version (2.1) of the data discussed by Barro,
Robert J. and Jong-Wha Lee, April 2010, ”A New Data Set of Educational Attainment in the
World, 1950-2010.” NBER Working Paper No. 15902. http://www.barrolee.com/

Aruba (Population = 0.1m) (data)
[40pt]
1960 1980 2000 2020
24
32
40
50
60
70
80
90100
120
GDP Per Capita ( 71.8) and Per Worker ( 69.7)
1960 1980 2000 2020
-0.5
0
0.5Growth Rate (Average is 3.76)
1960 1980 2000 2020
0
20
40
60
80
100Investment/GDP (28.3) and GovtConsump/GDP (32.8)
0 0.2 0.4 0.6 0.8 1
0
0.2
0.4
0.6
0.8
1Educational Attainment ( NaN years)
1960 1980 2000 2020
-50
0
50NetExports/GDP (-13.5) and X+M/GDP (167.9)
0
100
200
1960 1980 2000 2020
0
1
2
3
4Exchange Rate per Dollar ( 1.79)

Angola (Population = 24.2m) (data)
1960 1980 2000 2020
2
4
6
8
12
16
24
32
GDP Per Capita ( 16.9) and Per Worker ( 22.9)
1960 1980 2000 2020
-0.5
0
0.5Growth Rate (Average is 1.52)
1960 1980 2000 2020
0
20
40
60
80
100Investment/GDP (30.7) and GovtConsump/GDP (15.6)
0 0.2 0.4 0.6 0.8 1
0
0.2
0.4
0.6
0.8
1Educational Attainment ( NaN years)
1960 1980 2000 2020
-50
0
50NetExports/GDP (24.0) and X+M/GDP ( 62.6)
0
100
200
1960 1980 2000 2020
0
20
40
60
80
100Exchange Rate per Dollar ( 98.17)

Anguilla (Population = 0.0m) (data)
1960 1980 2000 2020
32405060708090
GDP Per Capita ( 39.5) and Per Worker ( 38.4)
1960 1980 2000 2020
-0.5
0
0.5Growth Rate (Average is 2.09)
1960 1980 2000 2020
0
20
40
60
80
100Investment/GDP (47.7) and GovtConsump/GDP (22.5)
0 0.2 0.4 0.6 0.8 1
0
0.2
0.4
0.6
0.8
1Educational Attainment ( NaN years)
1960 1980 2000 2020
-100
-50
0
50
100NetExports/GDP (-51.5) and X+M/GDP (181.4)
0
50
100
150
200
1960 1980 2000 2020
1
1.5
2
2.5
3Exchange Rate per Dollar ( 2.70)

Albania (Population = 2.9m) (data)
1960 1980 2000 2020
6
8
12
16
24
32
40
GDP Per Capita ( 21.2) and Per Worker ( 32.2)
1960 1980 2000 2020
-0.5
0
0.5Growth Rate (Average is 2.75)
1960 1980 2000 2020
0
10
20
30
40Investment/GDP (26.4) and GovtConsump/GDP (20.8)
1940 1960 1980 2000 2020
2
4
6
8
10Educational Attainment ( 9.8 years)
1960 1980 2000 2020
-50
-40
-30
-20
-10
0
10
20
30
40
50NetExports/GDP (-16.6) and X+M/GDP ( 39.7)
0
5
10
15
20
25
30
35
40
45
50
1960 1980 2000 2020
0
50
100
150
200Exchange Rate per Dollar ( 105.48)
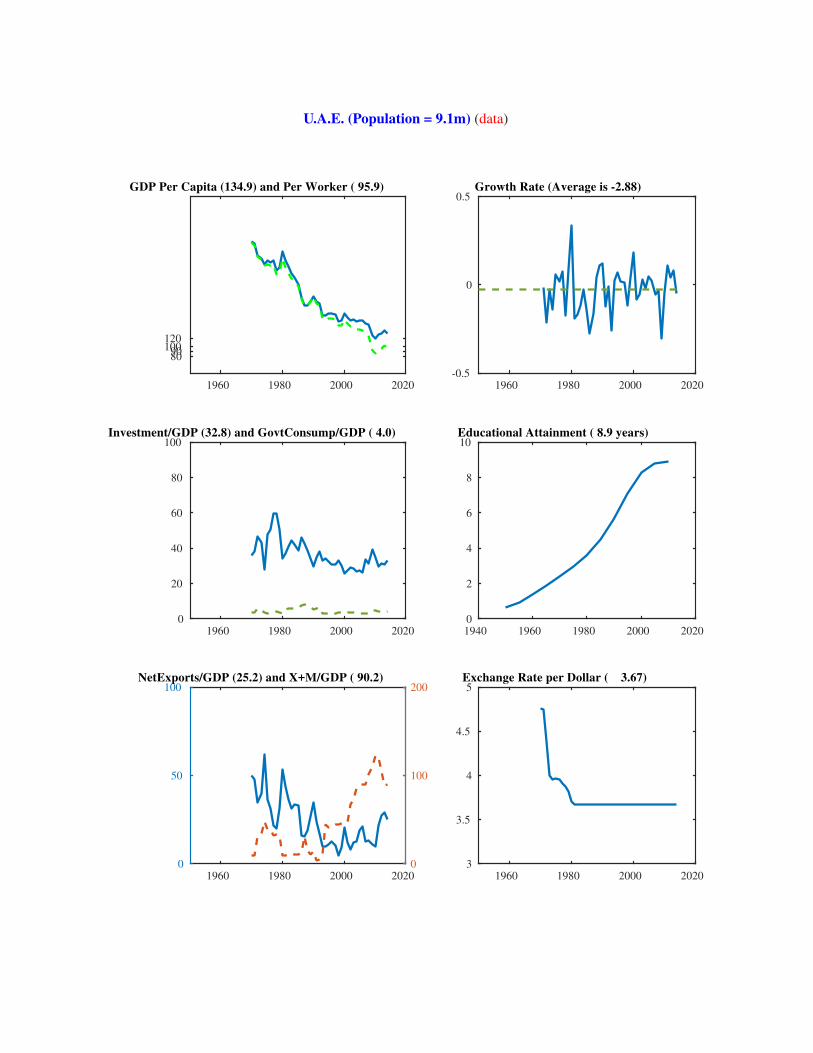
U.A.E. (Population = 9.1m) (data)
1960 1980 2000 2020
80 90
100120
GDP Per Capita (134.9) and Per Worker ( 95.9)
1960 1980 2000 2020
-0.5
0
0.5Growth Rate (Average is -2.88)
1960 1980 2000 2020
0
20
40
60
80
100Investment/GDP (32.8) and GovtConsump/GDP ( 4.0)
1940 1960 1980 2000 2020
0
2
4
6
8
10Educational Attainment ( 8.9 years)
1960 1980 2000 2020
0
50
100NetExports/GDP (25.2) and X+M/GDP ( 90.2)
0
100
200
1960 1980 2000 2020
3
3.5
4
4.5
5Exchange Rate per Dollar ( 3.67)

Argentina (Population = 43.0m) (data)
1960 1980 2000 2020
12
16
24
32
40
50
60GDP Per Capita ( 38.6) and Per Worker ( 42.6)
1960 1980 2000 2020
-0.5
0
0.5Growth Rate (Average is 3.05)
1960 1980 2000 2020
0
10
20
30
40Investment/GDP (14.7) and GovtConsump/GDP (11.2)
1940 1960 1980 2000 2020
4
5
6
7
8
9
10Educational Attainment ( 9.5 years)
1960 1980 2000 2020
-20
-10
0
10
20NetExports/GDP (-0.4) and X+M/GDP ( 21.4)
0
10
20
30
40
1960 1980 2000 2020
0
2
4
6
8
10Exchange Rate per Dollar ( 8.08)

Armenia (Population = 3.0m) (data)
1960 1980 2000 2020
4
6
8
12
16
24
GDP Per Capita ( 17.7) and Per Worker ( 20.5)
1960 1980 2000 2020
-1
-0.5
0
0.5
1Growth Rate (Average is 1.86)
1960 1980 2000 2020
0
20
40
60
80
100Investment/GDP ( 8.4) and GovtConsump/GDP (22.5)
1940 1960 1980 2000 2020
7
8
9
10
11Educational Attainment (10.9 years)
1960 1980 2000 2020
-40
-30
-20
-10
0NetExports/GDP (-15.0) and X+M/GDP ( 32.0)
0
10
20
30
40
1960 1980 2000 2020
0
200
400
600
800
1000Exchange Rate per Dollar ( 415.92)
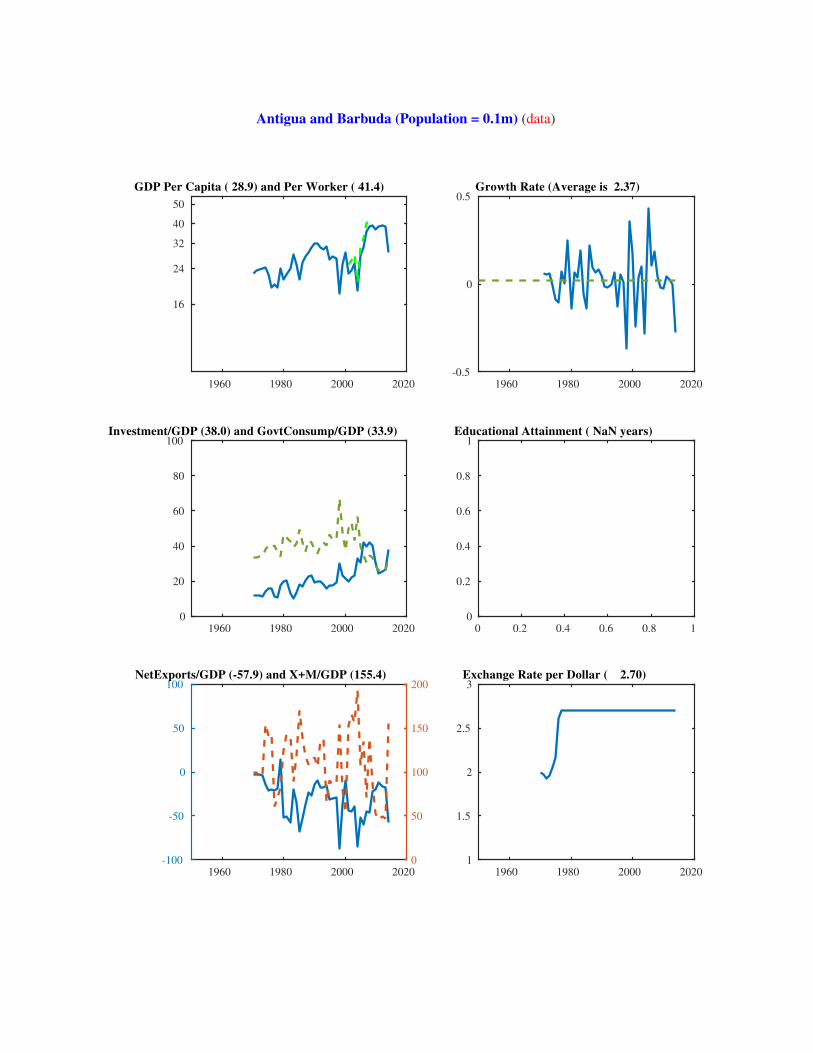
Antigua and Barbuda (Population = 0.1m) (data)
1960 1980 2000 2020
16
24
32
40
50
GDP Per Capita ( 28.9) and Per Worker ( 41.4)
1960 1980 2000 2020
-0.5
0
0.5Growth Rate (Average is 2.37)
1960 1980 2000 2020
0
20
40
60
80
100Investment/GDP (38.0) and GovtConsump/GDP (33.9)
0 0.2 0.4 0.6 0.8 1
0
0.2
0.4
0.6
0.8
1Educational Attainment ( NaN years)
1960 1980 2000 2020
-100
-50
0
50
100NetExports/GDP (-57.9) and X+M/GDP (155.4)
0
50
100
150
200
1960 1980 2000 2020
1
1.5
2
2.5
3Exchange Rate per Dollar ( 2.70)

Australia (Population = 23.6m) (data)
1960 1980 2000 2020
60
70
80
90
100GDP Per Capita ( 85.1) and Per Worker ( 78.1)
1960 1980 2000 2020
-0.2
-0.1
0
0.1
0.2Growth Rate (Average is 2.03)
1960 1980 2000 2020
0
10
20
30
40
50Investment/GDP (24.8) and GovtConsump/GDP (16.0)
1940 1960 1980 2000 2020
7
8
9
10
11
12Educational Attainment (11.8 years)
1960 1980 2000 2020
-20
0
20NetExports/GDP ( 1.7) and X+M/GDP ( 62.6)
0
50
100
1960 1980 2000 2020
0
0.5
1
1.5
2Exchange Rate per Dollar ( 1.11)

Austria (Population = 8.5m) (data)
1960 1980 2000 2020
24
32
40
50
60
70
80
90
GDP Per Capita ( 88.0) and Per Worker ( 78.8)
1960 1980 2000 2020
-0.1
-0.05
0
0.05
0.1Growth Rate (Average is 3.38)
1960 1980 2000 2020
0
10
20
30
40Investment/GDP (26.7) and GovtConsump/GDP (17.9)
1940 1960 1980 2000 2020
5
6
7
8
9
10Educational Attainment ( 9.9 years)
1960 1980 2000 2020
-10
-5
0
5
10NetExports/GDP (-1.1) and X+M/GDP (121.2)
0
50
100
150
200
1960 1980 2000 2020
0
0.5
1
1.5
2Exchange Rate per Dollar ( 0.75)
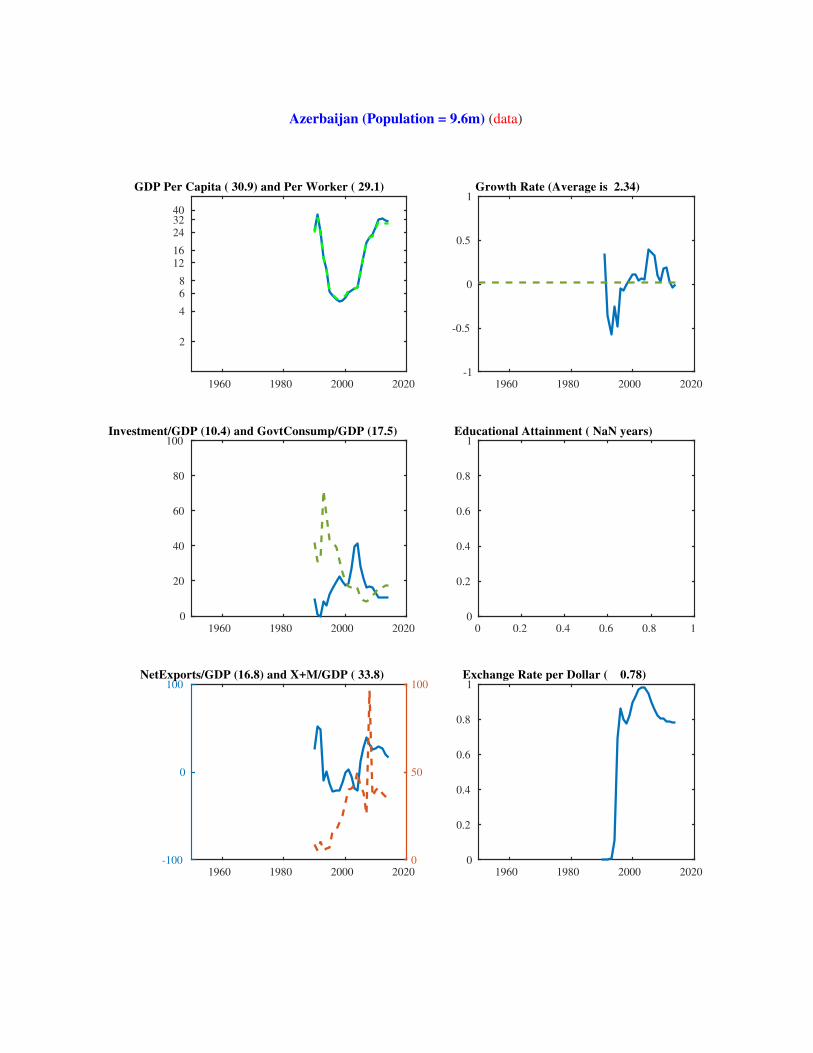
Azerbaijan (Population = 9.6m) (data)
1960 1980 2000 2020
2
4
6
8
12
16
24
3240
GDP Per Capita ( 30.9) and Per Worker ( 29.1)
1960 1980 2000 2020
-1
-0.5
0
0.5
1Growth Rate (Average is 2.34)
1960 1980 2000 2020
0
20
40
60
80
100Investment/GDP (10.4) and GovtConsump/GDP (17.5)
0 0.2 0.4 0.6 0.8 1
0
0.2
0.4
0.6
0.8
1Educational Attainment ( NaN years)
1960 1980 2000 2020
-100
0
100NetExports/GDP (16.8) and X+M/GDP ( 33.8)
0
50
100
1960 1980 2000 2020
0
0.2
0.4
0.6
0.8
1Exchange Rate per Dollar ( 0.78)

Burundi (Population = 10.8m) (data)
1960 1980 2000 2020
2
4
6
GDP Per Capita ( 1.6) and Per Worker ( 1.7)
1960 1980 2000 2020
-0.2
-0.1
0
0.1
0.2Growth Rate (Average is 0.42)
1960 1980 2000 2020
0
10
20
30
40Investment/GDP ( 9.7) and GovtConsump/GDP (25.2)
1940 1960 1980 2000 2020
0
0.5
1
1.5
2
2.5
3Educational Attainment ( 2.7 years)
1960 1980 2000 2020
-20
-10
0
10
20NetExports/GDP (-8.9) and X+M/GDP ( 18.4)
0
10
20
30
40
1960 1980 2000 2020
0
500
1000
1500
2000Exchange Rate per Dollar ( 1546.69)
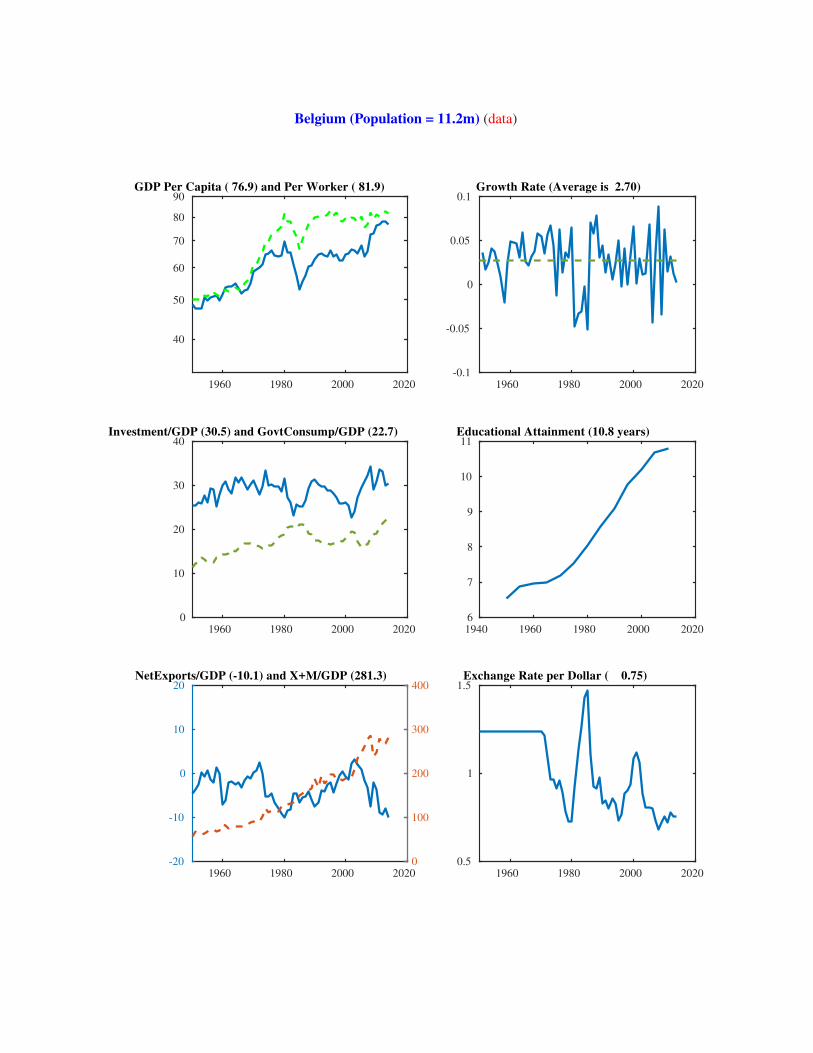
Belgium (Population = 11.2m) (data)
1960 1980 2000 2020
40
50
60
70
80
90GDP Per Capita ( 76.9) and Per Worker ( 81.9)
1960 1980 2000 2020
-0.1
-0.05
0
0.05
0.1Growth Rate (Average is 2.70)
1960 1980 2000 2020
0
10
20
30
40Investment/GDP (30.5) and GovtConsump/GDP (22.7)
1940 1960 1980 2000 2020
6
7
8
9
10
11Educational Attainment (10.8 years)
1960 1980 2000 2020
-20
-10
0
10
20NetExports/GDP (-10.1) and X+M/GDP (281.3)
0
100
200
300
400
1960 1980 2000 2020
0.5
1
1.5Exchange Rate per Dollar ( 0.75)

Benin (Population = 10.6m) (data)
1960 1980 2000 2020
1
2
4
6
8
12
GDP Per Capita ( 4.1) and Per Worker ( 4.7)
1960 1980 2000 2020
-0.5
0
0.5Growth Rate (Average is 0.61)
1960 1980 2000 2020
0
10
20
30
40Investment/GDP (20.4) and GovtConsump/GDP (17.4)
1940 1960 1980 2000 2020
0
1
2
3
4Educational Attainment ( 3.3 years)
1960 1980 2000 2020
-20
-10
0
10
20NetExports/GDP ( 1.1) and X+M/GDP ( 29.1)
0
10
20
30
40
1960 1980 2000 2020
0
200
400
600
800
1000Exchange Rate per Dollar ( 494.41)

Burkina Faso (Population = 17.6m) (data)
1960 1980 2000 2020
1
2
4
6GDP Per Capita ( 3.0) and Per Worker ( 3.8)
1960 1980 2000 2020
-0.2
-0.1
0
0.1
0.2Growth Rate (Average is 1.34)
1960 1980 2000 2020
0
10
20
30
40Investment/GDP (26.7) and GovtConsump/GDP (23.0)
0 0.2 0.4 0.6 0.8 1
0
0.2
0.4
0.6
0.8
1Educational Attainment ( NaN years)
1960 1980 2000 2020
-20
-10
0
10
20NetExports/GDP (-10.6) and X+M/GDP ( 35.5)
0
10
20
30
40
50
1960 1980 2000 2020
0
200
400
600
800
1000Exchange Rate per Dollar ( 494.41)
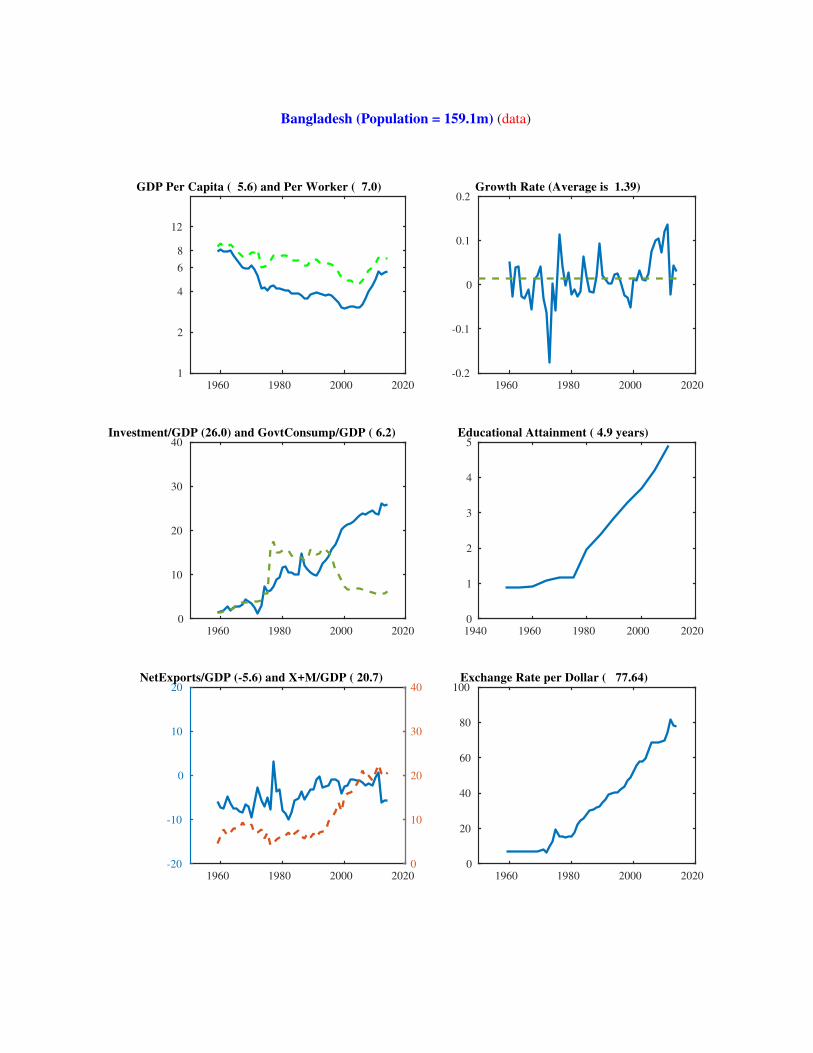
Bangladesh (Population = 159.1m) (data)
1960 1980 2000 2020
1
2
4
6
8
12
GDP Per Capita ( 5.6) and Per Worker ( 7.0)
1960 1980 2000 2020
-0.2
-0.1
0
0.1
0.2Growth Rate (Average is 1.39)
1960 1980 2000 2020
0
10
20
30
40Investment/GDP (26.0) and GovtConsump/GDP ( 6.2)
1940 1960 1980 2000 2020
0
1
2
3
4
5Educational Attainment ( 4.9 years)
1960 1980 2000 2020
-20
-10
0
10
20NetExports/GDP (-5.6) and X+M/GDP ( 20.7)
0
10
20
30
40
1960 1980 2000 2020
0
20
40
60
80
100Exchange Rate per Dollar ( 77.64)

Bulgaria (Population = 7.2m) (data)
1960 1980 2000 2020
12
16
24
32
40
50
GDP Per Capita ( 32.6) and Per Worker ( 30.6)
1960 1980 2000 2020
-0.5
0
0.5Growth Rate (Average is 3.00)
1960 1980 2000 2020
0
10
20
30
40
50Investment/GDP (17.9) and GovtConsump/GDP (25.7)
1940 1960 1980 2000 2020
2
4
6
8
10
12Educational Attainment (11.4 years)
1960 1980 2000 2020
-50
0
50NetExports/GDP (-4.4) and X+M/GDP ( 79.3)
0
50
100
1960 1980 2000 2020
0
1
2
3
4Exchange Rate per Dollar ( 1.47)

Bahrain (Population = 1.4m) (data)
1960 1980 2000 2020
24
32
40
50
60
70
80
90100
120
GDP Per Capita ( 75.3) and Per Worker ( 68.7)
1960 1980 2000 2020
-1
-0.5
0
0.5
1Growth Rate (Average is 1.53)
1960 1980 2000 2020
0
20
40
60
80
100Investment/GDP (20.1) and GovtConsump/GDP (13.6)
1940 1960 1980 2000 2020
0
2
4
6
8Educational Attainment ( 6.8 years)
1960 1980 2000 2020
-100
-50
0
50
100NetExports/GDP (21.7) and X+M/GDP (105.5)
0
100
200
300
400
1960 1980 2000 2020
0.3
0.35
0.4
0.45
0.5Exchange Rate per Dollar ( 0.38)

Bahamas (Population = 0.4m) (data)
1960 1980 2000 2020
32
40
50
60
70
80
90GDP Per Capita ( 40.8) and Per Worker ( 38.2)
1960 1980 2000 2020
-0.5
0
0.5Growth Rate (Average is 0.35)
1960 1980 2000 2020
0
10
20
30
40Investment/GDP (38.3) and GovtConsump/GDP (21.5)
0 0.2 0.4 0.6 0.8 1
0
0.2
0.4
0.6
0.8
1Educational Attainment ( NaN years)
1960 1980 2000 2020
-50
0
50NetExports/GDP (-29.6) and X+M/GDP (154.5)
100
150
200
1960 1980 2000 2020
1
1.0005
1.001
1.0015
1.002Exchange Rate per Dollar ( 1.00)

Bosnia and Herzegovina (Population = 3.8m) (data)
1960 1980 2000 2020
1
2
4
6
8
12
16
24
32405060
GDP Per Capita ( 19.5) and Per Worker ( 50.6)
1960 1980 2000 2020
-1
-0.5
0
0.5
1Growth Rate (Average is 10.32)
1960 1980 2000 2020
0
20
40
60
80
100Investment/GDP (17.4) and GovtConsump/GDP (29.4)
0 0.2 0.4 0.6 0.8 1
0
0.2
0.4
0.6
0.8
1Educational Attainment ( NaN years)
1960 1980 2000 2020
-200
-150
-100
-50
0NetExports/GDP (-25.9) and X+M/GDP ( 68.8)
0
100
200
300
400
1960 1980 2000 2020
0
1
2
3
4Exchange Rate per Dollar ( 1.47)

Belarus (Population = 9.5m) (data)
1960 1980 2000 2020
16
24
32
40
GDP Per Capita ( 38.7) and Per Worker ( 38.0)
1960 1980 2000 2020
-0.5
0
0.5Growth Rate (Average is 1.82)
1960 1980 2000 2020
0
10
20
30
40
50Investment/GDP (15.5) and GovtConsump/GDP (22.8)
0 0.2 0.4 0.6 0.8 1
0
0.2
0.4
0.6
0.8
1Educational Attainment ( NaN years)
1960 1980 2000 2020
-20
0
20NetExports/GDP (-0.1) and X+M/GDP ( 60.5)
0
50
100
1960 1980 2000 2020
0
0.5
1
1.5
210
4Exchange Rate per Dollar (10224.10)

Belize (Population = 0.4m) (data)
1960 1980 2000 2020
8
12
16
24
32
GDP Per Capita ( 15.2) and Per Worker ( 17.2)
1960 1980 2000 2020
-0.2
-0.1
0
0.1
0.2Growth Rate (Average is 2.11)
1960 1980 2000 2020
0
10
20
30
40Investment/GDP (14.3) and GovtConsump/GDP (17.3)
1940 1960 1980 2000 2020
6
7
8
9
10
11
12Educational Attainment (11.6 years)
1960 1980 2000 2020
-40
-30
-20
-10
0NetExports/GDP (-11.8) and X+M/GDP (123.1)
0
50
100
150
200
1960 1980 2000 2020
1.5
2
2.5Exchange Rate per Dollar ( 2.00)

Bermuda (Population = 0.1m) (data)
1960 1980 2000 2020
50 60 70 80 90100120
GDP Per Capita ( 71.9) and Per Worker ( 58.4)
1960 1980 2000 2020
-5
0
5Growth Rate (Average is -9.34)
1960 1980 2000 2020
-500
0
500Investment/GDP (25.5) and GovtConsump/GDP (26.3)
0 0.5 1
0
0.2
0.4
0.6
0.8
1Educational Attainment ( NaN years)
1960 1980 2000 2020
-5000
0
5000NetExports/GDP (-27.7) and X+M/GDP ( 64.2)
-5000
0
5000
1960 1980 2000 2020
0.999999999
0.9999999992
0.9999999994
0.9999999996
0.9999999998
1Exchange Rate per Dollar ( 1.00)

Bolivia (Population = 10.6m) (data)
1960 1980 2000 2020
4
6
8
12
16
24GDP Per Capita ( 11.3) and Per Worker ( 11.2)
1960 1980 2000 2020
-0.5
0
0.5Growth Rate (Average is 1.51)
1960 1980 2000 2020
0
10
20
30
40Investment/GDP (18.5) and GovtConsump/GDP (12.0)
1940 1960 1980 2000 2020
0
2
4
6
8Educational Attainment ( 7.8 years)
1960 1980 2000 2020
-50
0
50NetExports/GDP (-1.9) and X+M/GDP ( 59.3)
0
50
100
1960 1980 2000 2020
0
2
4
6
8
10Exchange Rate per Dollar ( 6.91)

Brazil (Population = 206.1m) (data)
1960 1980 2000 2020
8
12
16
24
32
GDP Per Capita ( 28.5) and Per Worker ( 25.8)
1960 1980 2000 2020
-0.2
-0.1
0
0.1
0.2Growth Rate (Average is 3.48)
1960 1980 2000 2020
0
10
20
30
40Investment/GDP (24.7) and GovtConsump/GDP (18.8)
1940 1960 1980 2000 2020
0
2
4
6
8Educational Attainment ( 7.7 years)
1960 1980 2000 2020
-10
-5
0
5
10NetExports/GDP (-3.2) and X+M/GDP ( 27.3)
0
10
20
30
40
1960 1980 2000 2020
0
1
2
3
4Exchange Rate per Dollar ( 2.35)

Barbados (Population = 0.3m) (data)
1960 1980 2000 2020
16
24
324050607080
GDP Per Capita ( 19.7) and Per Worker ( 21.0)
1960 1980 2000 2020
-0.5
0
0.5Growth Rate (Average is 0.42)
1960 1980 2000 2020
0
10
20
30
40Investment/GDP (28.4) and GovtConsump/GDP (36.4)
1940 1960 1980 2000 2020
4
5
6
7
8
9
10Educational Attainment ( 9.3 years)
1960 1980 2000 2020
-100
-50
0
50
100NetExports/GDP (-60.4) and X+M/GDP (123.5)
0
50
100
150
200
1960 1980 2000 2020
1.5
2
2.5Exchange Rate per Dollar ( 2.00)

Brunei Darussalam (Population = 0.4m) (data)
1960 1980 2000 2020
90100
120
GDP Per Capita (134.1) and Per Worker (130.0)
1960 1980 2000 2020
-0.5
0
0.5Growth Rate (Average is 0.39)
1960 1980 2000 2020
0
20
40
60
80
100Investment/GDP (25.7) and GovtConsump/GDP (25.1)
1940 1960 1980 2000 2020
0
2
4
6
8
10Educational Attainment ( 8.8 years)
1960 1980 2000 2020
-100
0
100NetExports/GDP (34.8) and X+M/GDP (103.6)
0
100
200
1960 1980 2000 2020
0
1
2
3
4Exchange Rate per Dollar ( 1.27)

Bhutan (Population = 0.8m) (data)
1960 1980 2000 2020
4
6
8
12
16
24GDP Per Capita ( 13.4) and Per Worker ( 13.4)
1960 1980 2000 2020
-0.2
-0.1
0
0.1
0.2Growth Rate (Average is 3.05)
1960 1980 2000 2020
20
30
40
50
60Investment/GDP (35.0) and GovtConsump/GDP (24.4)
0 0.2 0.4 0.6 0.8 1
0
0.2
0.4
0.6
0.8
1Educational Attainment ( NaN years)
1960 1980 2000 2020
-50
-40
-30
-20
-10
0
10
20
30
40
50NetExports/GDP (-19.1) and X+M/GDP ( 12.5)
0
5
10
15
20
25
30
35
40
45
50
1960 1980 2000 2020
0
20
40
60
80
100Exchange Rate per Dollar ( 61.03)

Botswana (Population = 2.2m) (data)
1960 1980 2000 2020
1
2
4
6
8
12
16
24
3240
GDP Per Capita ( 29.2) and Per Worker ( 31.6)
1960 1980 2000 2020
-0.5
0
0.5Growth Rate (Average is 6.70)
1960 1980 2000 2020
0
20
40
60
80
100Investment/GDP (42.7) and GovtConsump/GDP (20.5)
1940 1960 1980 2000 2020
0
2
4
6
8
10Educational Attainment ( 8.9 years)
1960 1980 2000 2020
-100
0
100NetExports/GDP (-2.3) and X+M/GDP ( 73.2)
50
100
150
1960 1980 2000 2020
0
2
4
6
8
10Exchange Rate per Dollar ( 8.98)
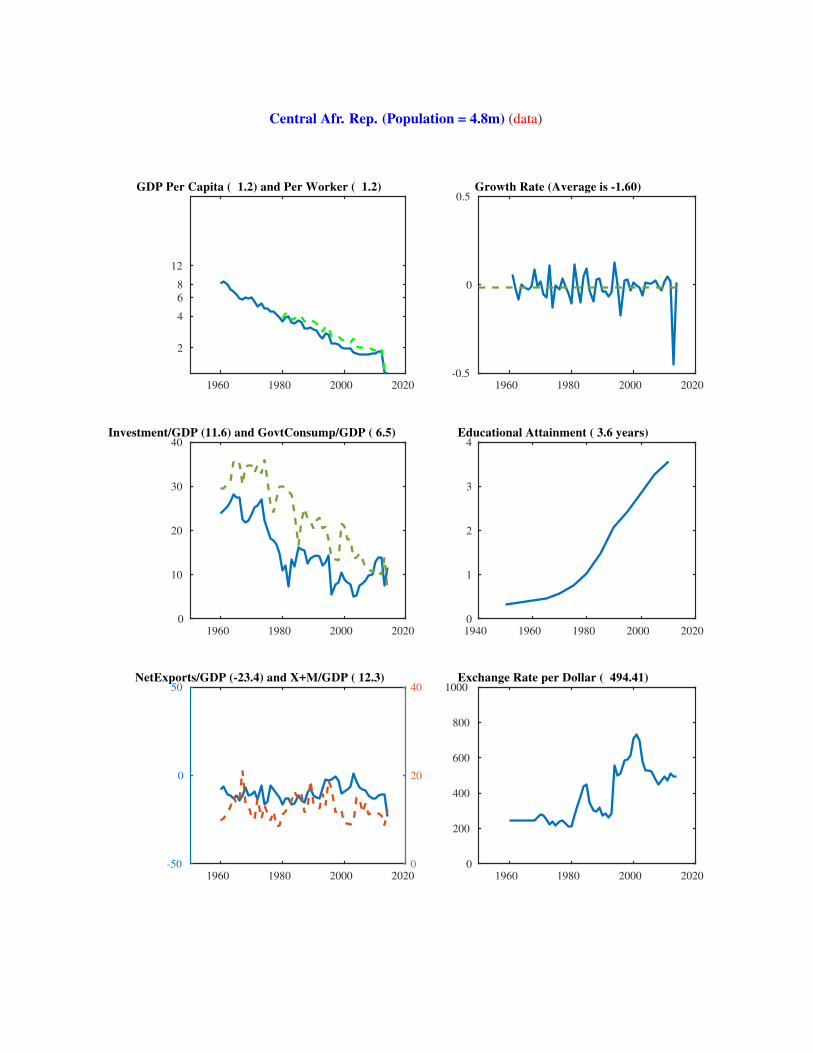
Central Afr. Rep. (Population = 4.8m) (data)
1960 1980 2000 2020
2
4
6
8
12
GDP Per Capita ( 1.2) and Per Worker ( 1.2)
1960 1980 2000 2020
-0.5
0
0.5Growth Rate (Average is -1.60)
1960 1980 2000 2020
0
10
20
30
40Investment/GDP (11.6) and GovtConsump/GDP ( 6.5)
1940 1960 1980 2000 2020
0
1
2
3
4Educational Attainment ( 3.6 years)
1960 1980 2000 2020
-50
0
50NetExports/GDP (-23.4) and X+M/GDP ( 12.3)
0
20
40
1960 1980 2000 2020
0
200
400
600
800
1000Exchange Rate per Dollar ( 494.41)

Canada (Population = 35.6m) (data)
1960 1980 2000 2020
70
80
90
GDP Per Capita ( 83.5) and Per Worker ( 73.3)
1960 1980 2000 2020
-0.2
-0.1
0
0.1
0.2Growth Rate (Average is 2.11)
1960 1980 2000 2020
0
10
20
30
40Investment/GDP (26.0) and GovtConsump/GDP (17.2)
1940 1960 1980 2000 2020
7
8
9
10
11
12
13Educational Attainment (12.6 years)
1960 1980 2000 2020
-10
0
10NetExports/GDP ( 1.1) and X+M/GDP ( 82.3)
0
50
100
1960 1980 2000 2020
0
0.5
1
1.5
2Exchange Rate per Dollar ( 1.11)

Switzerland (Population = 8.2m) (data)
1960 1980 2000 2020
70
80
90
100
120
GDP Per Capita (120.6) and Per Worker ( 91.7)
1960 1980 2000 2020
-0.1
-0.05
0
0.05
0.1Growth Rate (Average is 2.37)
1960 1980 2000 2020
0
10
20
30
40
50Investment/GDP (26.6) and GovtConsump/GDP ( 7.6)
1940 1960 1980 2000 2020
8
9
10
11
12
13
14Educational Attainment (13.4 years)
1960 1980 2000 2020
-20
-10
0
10
20NetExports/GDP (16.7) and X+M/GDP (152.1)
0
50
100
150
200
1960 1980 2000 2020
0
1
2
3
4
5Exchange Rate per Dollar ( 0.92)

Chile (Population = 17.8m) (data)
1960 1980 2000 2020
16
24
32
40
50
GDP Per Capita ( 41.0) and Per Worker ( 43.5)
1960 1980 2000 2020
-0.2
-0.1
0
0.1
0.2Growth Rate (Average is 2.60)
1960 1980 2000 2020
0
10
20
30
40Investment/GDP (21.3) and GovtConsump/GDP (16.5)
1940 1960 1980 2000 2020
4
5
6
7
8
9
10Educational Attainment ( 9.7 years)
1960 1980 2000 2020
-50
0
50NetExports/GDP ( 0.2) and X+M/GDP ( 53.9)
0
50
100
1960 1980 2000 2020
0
200
400
600
800
1000Exchange Rate per Dollar ( 570.35)

China (Population = 1369.4m) (data)
1960 1980 2000 2020
2
4
6
8
12
16
24
32
GDP Per Capita ( 24.1) and Per Worker ( 19.2)
1960 1980 2000 2020
-0.5
0
0.5Growth Rate (Average is 4.24)
1960 1980 2000 2020
0
10
20
30
40
50Investment/GDP (46.8) and GovtConsump/GDP (12.8)
1940 1960 1980 2000 2020
0
2
4
6
8Educational Attainment ( 7.5 years)
1960 1980 2000 2020
-10
-5
0
5
10NetExports/GDP ( 3.0) and X+M/GDP ( 33.6)
0
10
20
30
40
1960 1980 2000 2020
0
2
4
6
8
10Exchange Rate per Dollar ( 6.14)

Cote dIvoire (Population = 22.2m) (data)
1960 1980 2000 2020
2
4
6
8
12
16
GDP Per Capita ( 6.2) and Per Worker ( 7.8)
1960 1980 2000 2020
-0.2
-0.1
0
0.1
0.2Growth Rate (Average is 1.33)
1960 1980 2000 2020
0
10
20
30
40Investment/GDP (20.4) and GovtConsump/GDP (11.7)
1940 1960 1980 2000 2020
0
1
2
3
4
5Educational Attainment ( 4.2 years)
1960 1980 2000 2020
-20
0
20NetExports/GDP (-0.2) and X+M/GDP ( 49.5)
0
50
100
1960 1980 2000 2020
0
200
400
600
800
1000Exchange Rate per Dollar ( 494.41)

Cameroon (Population = 22.8m) (data)
1960 1980 2000 2020
2
4
6
8
12
16GDP Per Capita ( 5.2) and Per Worker ( 5.5)
1960 1980 2000 2020
-0.2
-0.1
0
0.1
0.2Growth Rate (Average is 1.45)
1960 1980 2000 2020
0
10
20
30
40Investment/GDP (16.7) and GovtConsump/GDP (10.0)
1940 1960 1980 2000 2020
0
1
2
3
4
5
6Educational Attainment ( 6.0 years)
1960 1980 2000 2020
-20
-10
0
10
20NetExports/GDP (-9.1) and X+M/GDP ( 32.5)
0
10
20
30
40
50
1960 1980 2000 2020
0
200
400
600
800
1000Exchange Rate per Dollar ( 494.41)
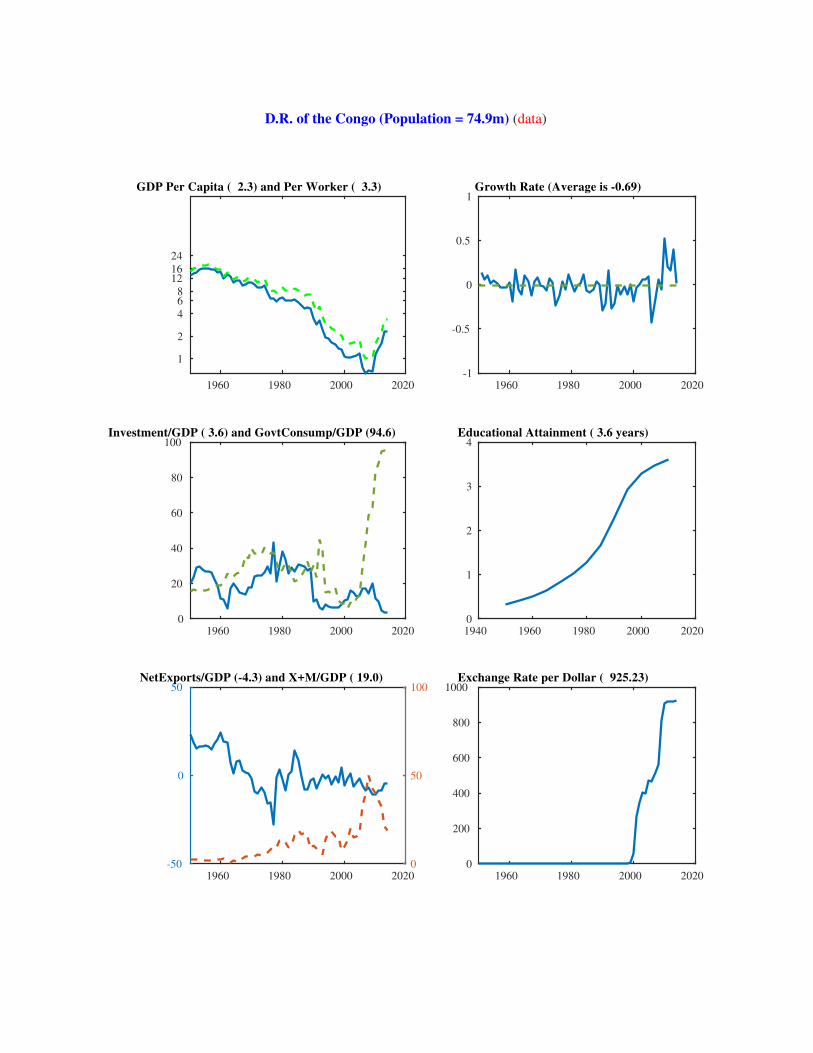
D.R. of the Congo (Population = 74.9m) (data)
1960 1980 2000 2020
1
2
4
6 8
1216
24
GDP Per Capita ( 2.3) and Per Worker ( 3.3)
1960 1980 2000 2020
-1
-0.5
0
0.5
1Growth Rate (Average is -0.69)
1960 1980 2000 2020
0
20
40
60
80
100Investment/GDP ( 3.6) and GovtConsump/GDP (94.6)
1940 1960 1980 2000 2020
0
1
2
3
4Educational Attainment ( 3.6 years)
1960 1980 2000 2020
-50
0
50NetExports/GDP (-4.3) and X+M/GDP ( 19.0)
0
50
100
1960 1980 2000 2020
0
200
400
600
800
1000Exchange Rate per Dollar ( 925.23)

Congo (Population = 4.5m) (data)
1960 1980 2000 2020
1
2
4
6
8
12
16
24GDP Per Capita ( 9.0) and Per Worker ( 11.3)
1960 1980 2000 2020
-0.5
0
0.5Growth Rate (Average is 2.45)
1960 1980 2000 2020
0
20
40
60
80
100Investment/GDP (54.4) and GovtConsump/GDP (11.2)
1940 1960 1980 2000 2020
0
1
2
3
4
5
6Educational Attainment ( 5.7 years)
1960 1980 2000 2020
-50
0
50NetExports/GDP ( 2.2) and X+M/GDP (106.6)
0
100
200
1960 1980 2000 2020
0
200
400
600
800
1000Exchange Rate per Dollar ( 494.41)

Colombia (Population = 47.8m) (data)
1960 1980 2000 2020
12
16
24
32
40GDP Per Capita ( 24.7) and Per Worker ( 22.4)
1960 1980 2000 2020
-0.2
-0.1
0
0.1
0.2Growth Rate (Average is 2.20)
1960 1980 2000 2020
0
10
20
30
40Investment/GDP (22.3) and GovtConsump/GDP (16.6)
1940 1960 1980 2000 2020
2
4
6
8
10Educational Attainment ( 8.4 years)
1960 1980 2000 2020
-20
-10
0
10
20NetExports/GDP (-3.8) and X+M/GDP ( 28.9)
0
10
20
30
40
1960 1980 2000 2020
0
1000
2000
3000
4000Exchange Rate per Dollar ( 2001.78)
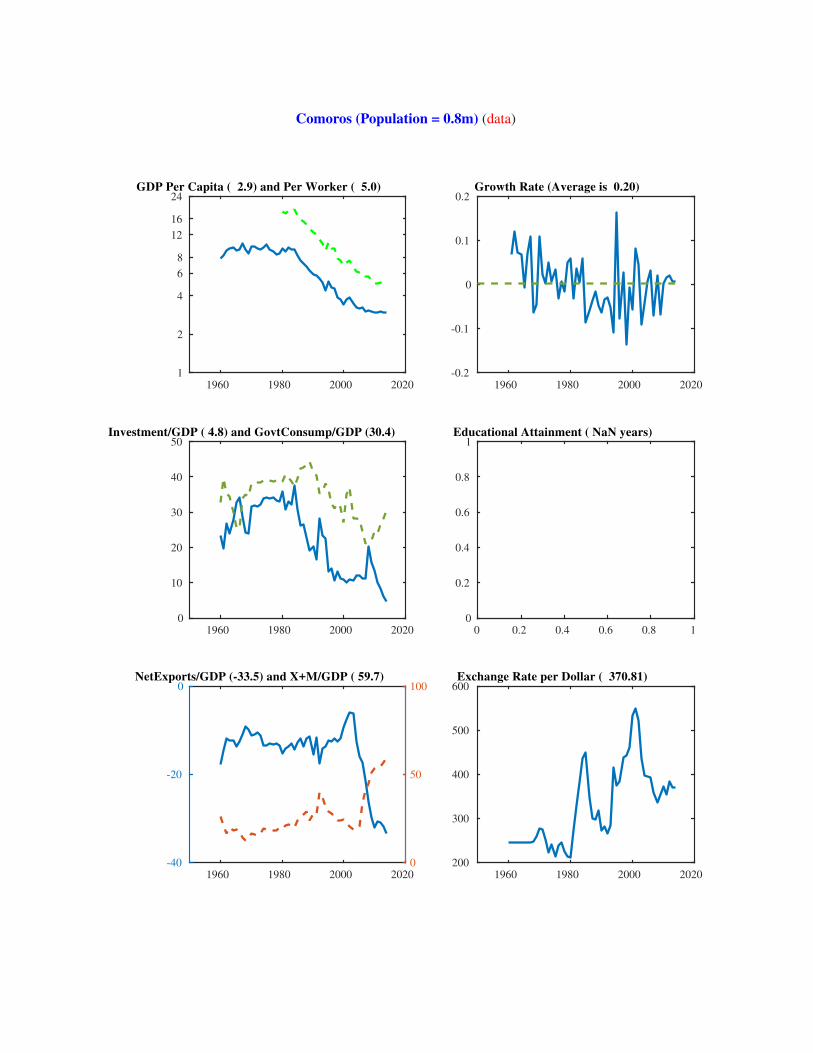
Comoros (Population = 0.8m) (data)
1960 1980 2000 2020
1
2
4
6
8
12
16
24GDP Per Capita ( 2.9) and Per Worker ( 5.0)
1960 1980 2000 2020
-0.2
-0.1
0
0.1
0.2Growth Rate (Average is 0.20)
1960 1980 2000 2020
0
10
20
30
40
50Investment/GDP ( 4.8) and GovtConsump/GDP (30.4)
0 0.2 0.4 0.6 0.8 1
0
0.2
0.4
0.6
0.8
1Educational Attainment ( NaN years)
1960 1980 2000 2020
-40
-20
0NetExports/GDP (-33.5) and X+M/GDP ( 59.7)
0
50
100
1960 1980 2000 2020
200
300
400
500
600Exchange Rate per Dollar ( 370.81)

Cabo Verde (Population = 0.5m) (data)
1960 1980 2000 2020
2
4
6
8
12
16
GDP Per Capita ( 12.6) and Per Worker ( 13.7)
1960 1980 2000 2020
-0.5
0
0.5Growth Rate (Average is 3.27)
1960 1980 2000 2020
0
20
40
60
80
100Investment/GDP (28.9) and GovtConsump/GDP (16.8)
0 0.2 0.4 0.6 0.8 1
0
0.2
0.4
0.6
0.8
1Educational Attainment ( NaN years)
1960 1980 2000 2020
-50
-40
-30
-20
-10
0NetExports/GDP (-10.8) and X+M/GDP ( 37.5)
0
20
40
60
80
100
1960 1980 2000 2020
0
50
100
150
200Exchange Rate per Dollar ( 83.11)

Costa Rica (Population = 4.8m) (data)
1960 1980 2000 2020
16
24
32
40
GDP Per Capita ( 25.9) and Per Worker ( 24.5)
1960 1980 2000 2020
-0.2
-0.1
0
0.1
0.2Growth Rate (Average is 2.23)
1960 1980 2000 2020
0
10
20
30
40Investment/GDP (19.9) and GovtConsump/GDP (15.1)
1940 1960 1980 2000 2020
3
4
5
6
7
8Educational Attainment ( 7.8 years)
1960 1980 2000 2020
-20
0
20NetExports/GDP (-7.9) and X+M/GDP ( 96.7)
0
50
100
1960 1980 2000 2020
0
200
400
600
800
1000Exchange Rate per Dollar ( 538.32)

Curaao (Population = 0.2m) (data)
1960 1980 2000 2020
40
50
60
GDP Per Capita ( 41.7) and Per Worker ( NaN)
1960 1980 2000 2020
-0.2
-0.1
0
0.1
0.2Growth Rate (Average is -2.86)
1960 1980 2000 2020
0
10
20
30
40
50Investment/GDP (47.4) and GovtConsump/GDP (25.9)
0 0.2 0.4 0.6 0.8 1
0
0.2
0.4
0.6
0.8
1Educational Attainment ( NaN years)
1960 1980 2000 2020
-100
-50
0NetExports/GDP (-74.2) and X+M/GDP (284.6)
100
200
300
1960 1980 2000 2020
0
1
2
3
4Exchange Rate per Dollar ( 1.79)

Cayman Islands (Population = 0.1m) (data)
1960 1980 2000 2020
6
8
12
16
24
32 40 50 60 70 80 90
100120
GDP Per Capita ( 8.8) and Per Worker ( 34.4)
1960 1980 2000 2020
-5
0
5Growth Rate (Average is -4.58)
1960 1980 2000 2020
0
100
200
300
400Investment/GDP (307.7) and GovtConsump/GDP (174.2)
0 0.2 0.4 0.6 0.8 1
0
0.2
0.4
0.6
0.8
1Educational Attainment ( NaN years)
1960 1980 2000 2020
-2000
-1000
0
1000
2000NetExports/GDP (-1034.8) and X+M/GDP (1463.8)
0
500
1000
1500
2000
1960 1980 2000 2020
0.75
0.8
0.85Exchange Rate per Dollar ( 0.82)

Cyprus (Population = 0.9m) (data)
1960 1980 2000 2020
16
24
324050607080
GDP Per Capita ( 47.7) and Per Worker ( 68.0)
1960 1980 2000 2020
-0.5
0
0.5Growth Rate (Average is 3.33)
1960 1980 2000 2020
0
20
40
60
80
100Investment/GDP (18.2) and GovtConsump/GDP (15.6)
1940 1960 1980 2000 2020
2
4
6
8
10
12Educational Attainment (11.1 years)
1960 1980 2000 2020
-50
0
50NetExports/GDP (-15.7) and X+M/GDP ( 61.7)
0
50
100
1960 1980 2000 2020
0.5
1
1.5Exchange Rate per Dollar ( 0.75)

Czech Republic (Population = 10.5m) (data)
1960 1980 2000 2020
40
50
60
GDP Per Capita ( 56.2) and Per Worker ( 54.3)
1960 1980 2000 2020
-0.2
-0.1
0
0.1
0.2Growth Rate (Average is 1.40)
1960 1980 2000 2020
0
10
20
30
40Investment/GDP (25.2) and GovtConsump/GDP (26.0)
1940 1960 1980 2000 2020
8
9
10
11
12
13
14Educational Attainment (13.2 years)
1960 1980 2000 2020
-10
-5
0
5
10NetExports/GDP (-1.7) and X+M/GDP (147.8)
0
50
100
150
200
1960 1980 2000 2020
0
10
20
30
40Exchange Rate per Dollar ( 20.76)

Germany (Population = 80.6m) (data)
1960 1980 2000 2020
24
32
40
50
60
70
80
90100
GDP Per Capita ( 89.5) and Per Worker ( 79.0)
1960 1980 2000 2020
-0.2
-0.1
0
0.1
0.2Growth Rate (Average is 3.60)
1960 1980 2000 2020
0
10
20
30
40
50Investment/GDP (19.5) and GovtConsump/GDP (17.8)
1940 1960 1980 2000 2020
6
8
10
12
14Educational Attainment (12.7 years)
1960 1980 2000 2020
-20
-10
0
10
20NetExports/GDP ( 7.8) and X+M/GDP (114.2)
0
50
100
150
200
1960 1980 2000 2020
0
1
2
3
4Exchange Rate per Dollar ( 0.75)

Djibouti (Population = 0.9m) (data)
1960 1980 2000 2020
4
6
8
12
16
24
32405060
GDP Per Capita ( 6.3) and Per Worker ( 18.9)
1960 1980 2000 2020
-0.5
0
0.5Growth Rate (Average is -2.20)
1960 1980 2000 2020
0
10
20
30
40
50Investment/GDP (40.7) and GovtConsump/GDP (20.8)
0 0.2 0.4 0.6 0.8 1
0
0.2
0.4
0.6
0.8
1Educational Attainment ( NaN years)
1960 1980 2000 2020
-50
0
50NetExports/GDP (-26.5) and X+M/GDP ( 74.1)
0
100
200
1960 1980 2000 2020
150
200
250Exchange Rate per Dollar ( 177.72)

Dominica (Population = 0.1m) (data)
1960 1980 2000 2020
12
16
24
32
40GDP Per Capita ( 17.7) and Per Worker ( 21.3)
1960 1980 2000 2020
-0.5
0
0.5Growth Rate (Average is 1.90)
1960 1980 2000 2020
0
20
40
60
80
100Investment/GDP (19.7) and GovtConsump/GDP (21.8)
0 0.2 0.4 0.6 0.8 1
0
0.2
0.4
0.6
0.8
1Educational Attainment ( NaN years)
1960 1980 2000 2020
-100
-50
0NetExports/GDP (-26.4) and X+M/GDP ( 65.8)
0
100
200
1960 1980 2000 2020
1
1.5
2
2.5
3Exchange Rate per Dollar ( 2.70)

Denmark (Population = 5.6m) (data)
1960 1980 2000 2020
50
60
70
80
90GDP Per Capita ( 85.5) and Per Worker ( 79.9)
1960 1980 2000 2020
-0.1
-0.05
0
0.05
0.1Growth Rate (Average is 2.45)
1960 1980 2000 2020
0
10
20
30
40Investment/GDP (23.9) and GovtConsump/GDP (24.5)
1940 1960 1980 2000 2020
4
6
8
10
12Educational Attainment (11.5 years)
1960 1980 2000 2020
-10
-5
0
5
10NetExports/GDP ( 4.4) and X+M/GDP (117.8)
0
50
100
150
200
1960 1980 2000 2020
5
10
15Exchange Rate per Dollar ( 5.61)
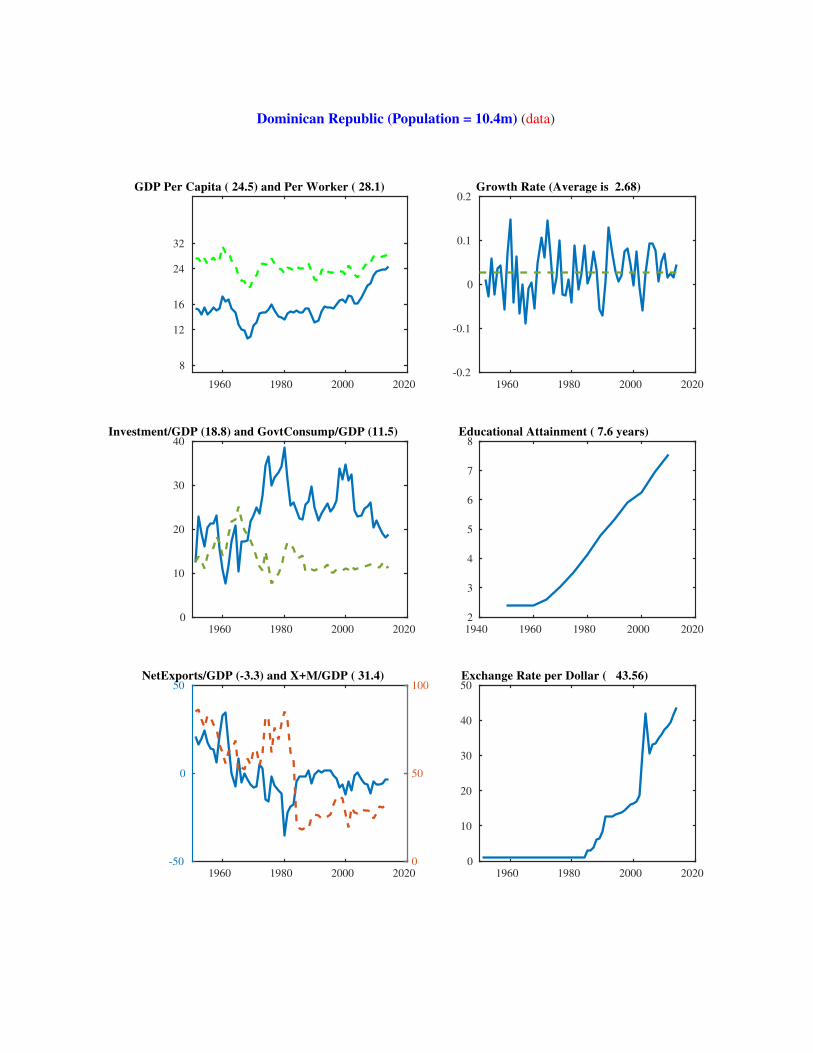
Dominican Republic (Population = 10.4m) (data)
1960 1980 2000 2020
8
12
16
24
32
GDP Per Capita ( 24.5) and Per Worker ( 28.1)
1960 1980 2000 2020
-0.2
-0.1
0
0.1
0.2Growth Rate (Average is 2.68)
1960 1980 2000 2020
0
10
20
30
40Investment/GDP (18.8) and GovtConsump/GDP (11.5)
1940 1960 1980 2000 2020
2
3
4
5
6
7
8Educational Attainment ( 7.6 years)
1960 1980 2000 2020
-50
0
50NetExports/GDP (-3.3) and X+M/GDP ( 31.4)
0
50
100
1960 1980 2000 2020
0
10
20
30
40
50Exchange Rate per Dollar ( 43.56)

Algeria (Population = 38.9m) (data)
1960 1980 2000 2020
12
16
24
32 40 50 60 70 80 90
100120
GDP Per Capita ( 25.2) and Per Worker ( 41.1)
1960 1980 2000 2020
-1
-0.5
0
0.5
1Growth Rate (Average is 0.59)
1960 1980 2000 2020
0
20
40
60
80
100Investment/GDP (33.7) and GovtConsump/GDP (32.1)
1940 1960 1980 2000 2020
0
1
2
3
4
5
6Educational Attainment ( 6.0 years)
1960 1980 2000 2020
-50
0
50NetExports/GDP (-0.4) and X+M/GDP ( 37.5)
0
50
100
1960 1980 2000 2020
0
20
40
60
80
100Exchange Rate per Dollar ( 80.58)

Ecuador (Population = 15.9m) (data)
1960 1980 2000 2020
8
12
16
24
32
40
GDP Per Capita ( 21.4) and Per Worker ( 25.7)
1960 1980 2000 2020
-0.2
-0.1
0
0.1
0.2Growth Rate (Average is 2.58)
1960 1980 2000 2020
0
10
20
30
40Investment/GDP (26.9) and GovtConsump/GDP (12.8)
1940 1960 1980 2000 2020
2
3
4
5
6
7
8Educational Attainment ( 7.4 years)
1960 1980 2000 2020
-20
-10
0
10
20NetExports/GDP (-1.1) and X+M/GDP ( 45.8)
0
10
20
30
40
50
1960 1980 2000 2020
0
0.5
1
1.5
2Exchange Rate per Dollar ( 1.00)

Egypt (Population = 89.6m) (data)
1960 1980 2000 2020
2
4
6
8
12
16
24
3240
GDP Per Capita ( 20.8) and Per Worker ( 31.1)
1960 1980 2000 2020
-0.2
-0.1
0
0.1
0.2Growth Rate (Average is 4.51)
1960 1980 2000 2020
0
20
40
60
80
100Investment/GDP ( 9.2) and GovtConsump/GDP (16.6)
1940 1960 1980 2000 2020
0
2
4
6
8Educational Attainment ( 6.5 years)
1960 1980 2000 2020
-20
-10
0
10
20NetExports/GDP ( 0.1) and X+M/GDP ( 14.8)
0
10
20
30
40
50
1960 1980 2000 2020
0
2
4
6
8
10Exchange Rate per Dollar ( 7.08)

Spain (Population = 46.3m) (data)
1960 1980 2000 2020
16
24
32
40
50
60
70
80
GDP Per Capita ( 63.2) and Per Worker ( 77.2)
1960 1980 2000 2020
-0.2
-0.1
0
0.1
0.2Growth Rate (Average is 3.52)
1960 1980 2000 2020
0
10
20
30
40Investment/GDP (25.1) and GovtConsump/GDP (18.9)
1940 1960 1980 2000 2020
2
4
6
8
10
12Educational Attainment (10.3 years)
1960 1980 2000 2020
-20
0
20NetExports/GDP (-0.9) and X+M/GDP ( 62.3)
0
50
100
1960 1980 2000 2020
0
0.5
1
1.5
2Exchange Rate per Dollar ( 0.75)

Estonia (Population = 1.3m) (data)
1960 1980 2000 2020
16
24
32
40
50
60GDP Per Capita ( 50.1) and Per Worker ( 48.4)
1960 1980 2000 2020
-0.5
0
0.5Growth Rate (Average is 3.30)
1960 1980 2000 2020
0
10
20
30
40
50Investment/GDP (29.7) and GovtConsump/GDP (25.8)
1940 1960 1980 2000 2020
6
8
10
12
14Educational Attainment (12.5 years)
1960 1980 2000 2020
-20
-10
0
10
20NetExports/GDP (-7.8) and X+M/GDP (183.1)
0
50
100
150
200
1960 1980 2000 2020
0
0.5
1
1.5
2Exchange Rate per Dollar ( 0.75)

Ethiopia (Population = 97.0m) (data)
1960 1980 2000 2020
2
4
6
GDP Per Capita ( 2.9) and Per Worker ( 2.9)
1960 1980 2000 2020
-0.2
-0.1
0
0.1
0.2Growth Rate (Average is 2.34)
1960 1980 2000 2020
0
10
20
30
40Investment/GDP (34.0) and GovtConsump/GDP (10.4)
0 0.2 0.4 0.6 0.8 1
0
0.2
0.4
0.6
0.8
1Educational Attainment ( NaN years)
1960 1980 2000 2020
-10
-5
0
5
10NetExports/GDP (-3.5) and X+M/GDP ( 26.8)
0
10
20
30
40
1960 1980 2000 2020
0
5
10
15
20Exchange Rate per Dollar ( 19.53)
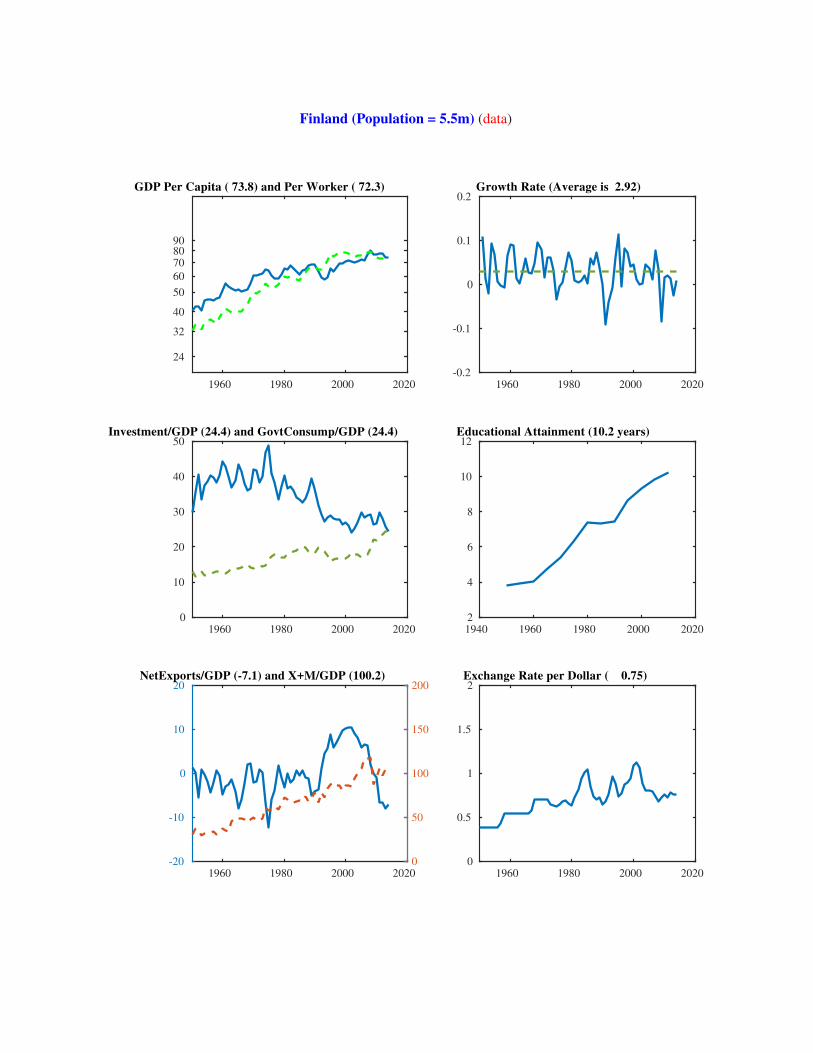
Finland (Population = 5.5m) (data)
1960 1980 2000 2020
24
32
40
50
60
70
80
90
GDP Per Capita ( 73.8) and Per Worker ( 72.3)
1960 1980 2000 2020
-0.2
-0.1
0
0.1
0.2Growth Rate (Average is 2.92)
1960 1980 2000 2020
0
10
20
30
40
50Investment/GDP (24.4) and GovtConsump/GDP (24.4)
1940 1960 1980 2000 2020
2
4
6
8
10
12Educational Attainment (10.2 years)
1960 1980 2000 2020
-20
-10
0
10
20NetExports/GDP (-7.1) and X+M/GDP (100.2)
0
50
100
150
200
1960 1980 2000 2020
0
0.5
1
1.5
2Exchange Rate per Dollar ( 0.75)

Fiji (Population = 0.9m) (data)
1960 1980 2000 2020
8
12
16
24
32
GDP Per Capita ( 13.8) and Per Worker ( 18.1)
1960 1980 2000 2020
-0.2
-0.1
0
0.1
0.2Growth Rate (Average is 1.69)
1960 1980 2000 2020
0
10
20
30
40Investment/GDP (22.9) and GovtConsump/GDP (20.1)
1940 1960 1980 2000 2020
2
4
6
8
10Educational Attainment ( 9.6 years)
1960 1980 2000 2020
-50
0
50NetExports/GDP (-15.1) and X+M/GDP (111.1)
0
100
200
1960 1980 2000 2020
0
1
2
3
4Exchange Rate per Dollar ( 1.89)
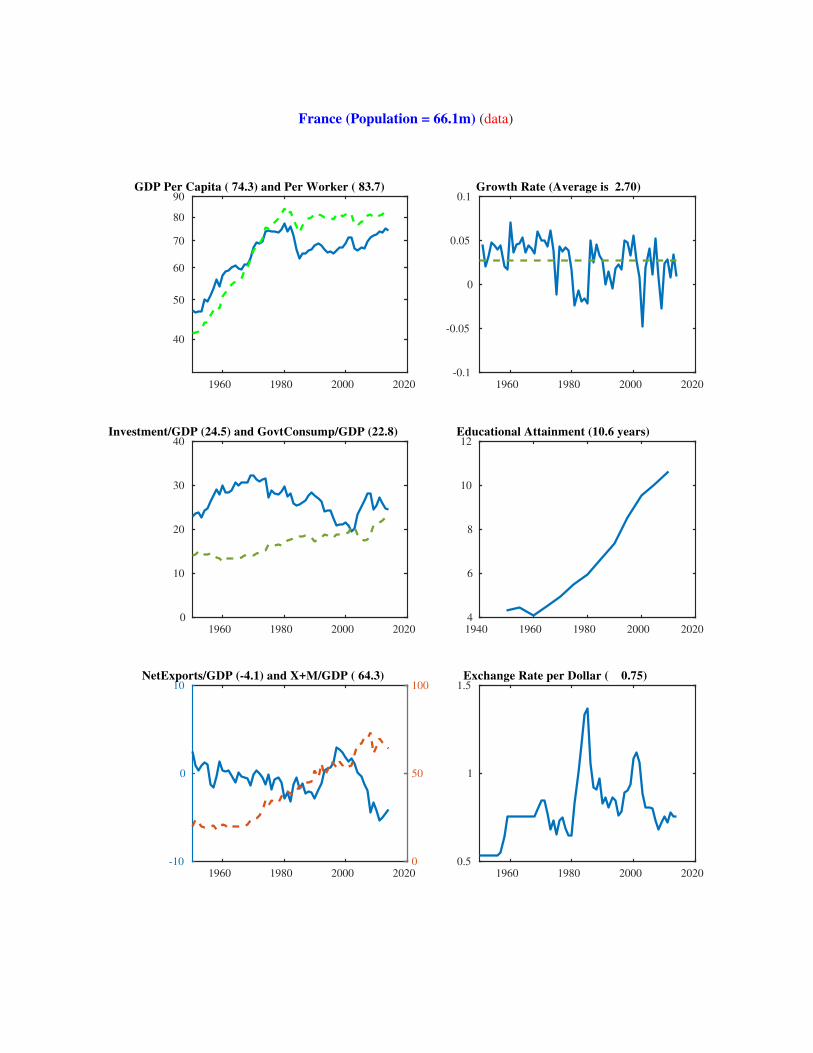
France (Population = 66.1m) (data)
1960 1980 2000 2020
40
50
60
70
80
90GDP Per Capita ( 74.3) and Per Worker ( 83.7)
1960 1980 2000 2020
-0.1
-0.05
0
0.05
0.1Growth Rate (Average is 2.70)
1960 1980 2000 2020
0
10
20
30
40Investment/GDP (24.5) and GovtConsump/GDP (22.8)
1940 1960 1980 2000 2020
4
6
8
10
12Educational Attainment (10.6 years)
1960 1980 2000 2020
-10
0
10NetExports/GDP (-4.1) and X+M/GDP ( 64.3)
0
50
100
1960 1980 2000 2020
0.5
1
1.5Exchange Rate per Dollar ( 0.75)

Gabon (Population = 1.7m) (data)
1960 1980 2000 2020
16
24
324050607080
GDP Per Capita ( 27.7) and Per Worker ( 53.3)
1960 1980 2000 2020
-1
-0.5
0
0.5
1Growth Rate (Average is 2.60)
1960 1980 2000 2020
0
10
20
30
40Investment/GDP (33.3) and GovtConsump/GDP (15.0)
1940 1960 1980 2000 2020
0
2
4
6
8Educational Attainment ( 7.6 years)
1960 1980 2000 2020
-50
0
50NetExports/GDP (16.9) and X+M/GDP ( 68.5)
0
50
100
1960 1980 2000 2020
0
200
400
600
800
1000Exchange Rate per Dollar ( 494.41)

U.K. (Population = 64.3m) (data)
1960 1980 2000 2020
50
60
70
80
90GDP Per Capita ( 74.6) and Per Worker ( 72.0)
1960 1980 2000 2020
-0.1
-0.05
0
0.05
0.1Growth Rate (Average is 2.20)
1960 1980 2000 2020
10
15
20
25
30Investment/GDP (23.4) and GovtConsump/GDP (19.4)
1940 1960 1980 2000 2020
6
8
10
12
14Educational Attainment (12.3 years)
1960 1980 2000 2020
-10
0
10NetExports/GDP (-6.2) and X+M/GDP ( 65.3)
0
50
100
1960 1980 2000 2020
0
0.2
0.4
0.6
0.8
1Exchange Rate per Dollar ( 0.61)

Georgia (Population = 4.0m) (data)
1960 1980 2000 2020
4
6
8
12
16
24
32
GDP Per Capita ( 19.9) and Per Worker ( 26.7)
1960 1980 2000 2020
-1
-0.5
0
0.5
1Growth Rate (Average is 0.07)
1960 1980 2000 2020
0
20
40
60
80
100Investment/GDP (13.4) and GovtConsump/GDP (22.0)
0 0.2 0.4 0.6 0.8 1
0
0.2
0.4
0.6
0.8
1Educational Attainment ( NaN years)
1960 1980 2000 2020
-100
-80
-60
-40
-20
0NetExports/GDP (-5.1) and X+M/GDP ( 42.3)
0
10
20
30
40
50
1960 1980 2000 2020
0
1
2
3
4Exchange Rate per Dollar ( 1.77)

Ghana (Population = 26.8m) (data)
1960 1980 2000 2020
2
4
6
8
12
16
24GDP Per Capita ( 7.1) and Per Worker ( 6.9)
1960 1980 2000 2020
-0.2
-0.1
0
0.1
0.2Growth Rate (Average is 0.72)
1960 1980 2000 2020
0
10
20
30
40Investment/GDP (24.2) and GovtConsump/GDP (20.4)
1940 1960 1980 2000 2020
0
2
4
6
8Educational Attainment ( 6.8 years)
1960 1980 2000 2020
-20
0
20NetExports/GDP ( 1.5) and X+M/GDP ( 35.9)
0
50
100
1960 1980 2000 2020
0
1
2
3
4Exchange Rate per Dollar ( 3.03)

Guinea (Population = 12.3m) (data)
1960 1980 2000 2020
1
2
4
6
8
12
16
GDP Per Capita ( 3.0) and Per Worker ( 3.1)
1960 1980 2000 2020
-0.2
-0.1
0
0.1
0.2Growth Rate (Average is -0.27)
1960 1980 2000 2020
0
5
10
15
20Investment/GDP ( 8.0) and GovtConsump/GDP (14.1)
0 0.2 0.4 0.6 0.8 1
0
0.2
0.4
0.6
0.8
1Educational Attainment ( NaN years)
1960 1980 2000 2020
-20
-10
0
10
20NetExports/GDP (-14.9) and X+M/GDP ( 38.4)
0
10
20
30
40
50
1960 1980 2000 2020
0
2000
4000
6000
8000
10000Exchange Rate per Dollar ( 7014.12)

Gambia (Population = 1.9m) (data)
1960 1980 2000 2020
2
4
6
8
12
GDP Per Capita ( 3.6) and Per Worker ( 5.8)
1960 1980 2000 2020
-0.2
-0.1
0
0.1
0.2Growth Rate (Average is 0.22)
1960 1980 2000 2020
0
10
20
30
40Investment/GDP (13.5) and GovtConsump/GDP (13.0)
1940 1960 1980 2000 2020
0
0.5
1
1.5
2
2.5
3Educational Attainment ( 2.8 years)
1960 1980 2000 2020
-50
0
50NetExports/GDP ( 1.5) and X+M/GDP ( 20.4)
0
50
100
1960 1980 2000 2020
0
10
20
30
40
50Exchange Rate per Dollar ( 41.73)
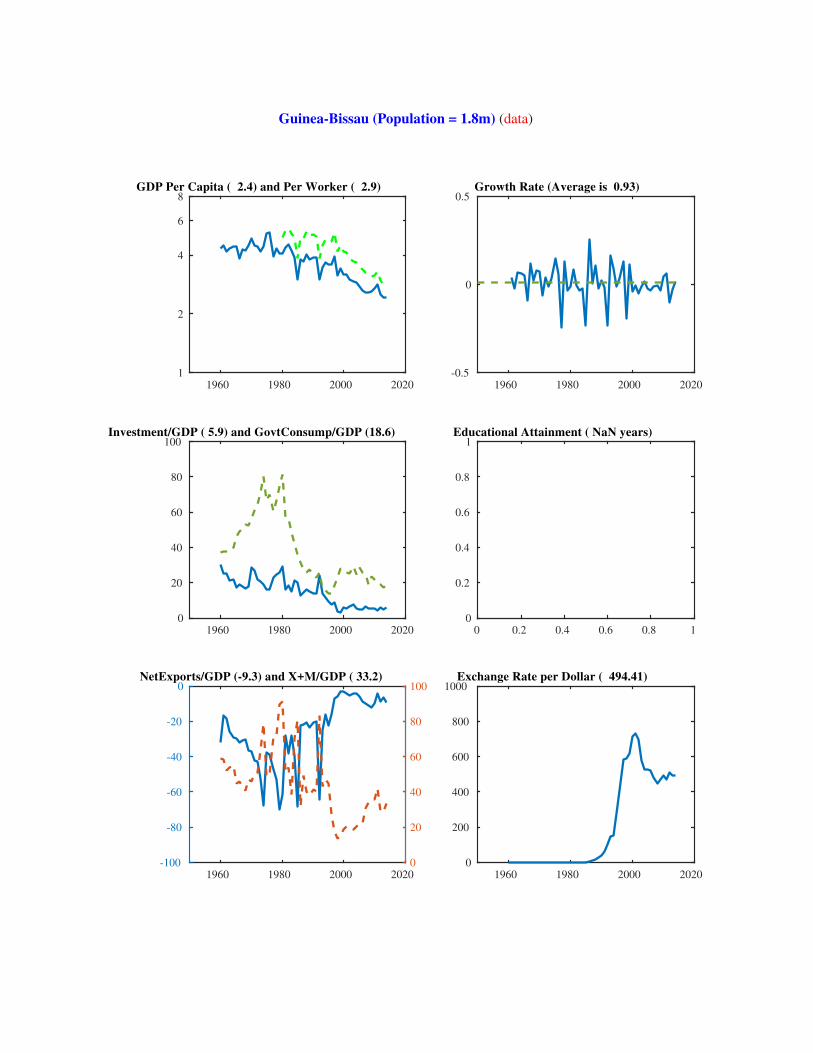
Guinea-Bissau (Population = 1.8m) (data)
1960 1980 2000 2020
1
2
4
6
8GDP Per Capita ( 2.4) and Per Worker ( 2.9)
1960 1980 2000 2020
-0.5
0
0.5Growth Rate (Average is 0.93)
1960 1980 2000 2020
0
20
40
60
80
100Investment/GDP ( 5.9) and GovtConsump/GDP (18.6)
0 0.2 0.4 0.6 0.8 1
0
0.2
0.4
0.6
0.8
1Educational Attainment ( NaN years)
1960 1980 2000 2020
-100
-80
-60
-40
-20
0NetExports/GDP (-9.3) and X+M/GDP ( 33.2)
0
20
40
60
80
100
1960 1980 2000 2020
0
200
400
600
800
1000Exchange Rate per Dollar ( 494.41)

Equatorial Guinea (Population = 0.8m) (data)
1960 1980 2000 2020
1
2
4
6
8
12
16
24
32 40 50 60 70 80 90100
120GDP Per Capita ( NaN) and Per Worker ( NaN)
1960 1980 2000 2020
0
0.2
0.4
0.6
0.8
1Growth Rate (Average is NaN)
1960 1980 2000 2020
0
20
40
60
80
100Investment/GDP (40.8) and GovtConsump/GDP ( 2.3)
0 0.2 0.4 0.6 0.8 1
0
0.2
0.4
0.6
0.8
1Educational Attainment ( NaN years)
1960 1980 2000 2020
-100
-50
0
50
100NetExports/GDP (46.2) and X+M/GDP (112.9)
0
100
200
300
400
1960 1980 2000 2020
0
200
400
600
800
1000Exchange Rate per Dollar ( 494.41)

Greece (Population = 11.0m) (data)
1960 1980 2000 2020
16
24
32
40
50
60
70
GDP Per Capita ( 47.5) and Per Worker ( 60.9)
1960 1980 2000 2020
-0.2
-0.1
0
0.1
0.2Growth Rate (Average is 3.17)
1960 1980 2000 2020
0
20
40
60
80
100Investment/GDP (15.1) and GovtConsump/GDP (22.5)
1940 1960 1980 2000 2020
2
4
6
8
10
12Educational Attainment (10.3 years)
1960 1980 2000 2020
-50
0
50NetExports/GDP (-8.9) and X+M/GDP ( 54.1)
0
50
100
1960 1980 2000 2020
0
0.5
1
1.5
2Exchange Rate per Dollar ( 0.75)

Grenada (Population = 0.1m) (data)
1960 1980 2000 2020
6
8
12
16
24
32
GDP Per Capita ( 20.5) and Per Worker ( 24.0)
1960 1980 2000 2020
-0.5
0
0.5Growth Rate (Average is 3.75)
1960 1980 2000 2020
0
10
20
30
40
50Investment/GDP (19.2) and GovtConsump/GDP (19.9)
0 0.2 0.4 0.6 0.8 1
0
0.2
0.4
0.6
0.8
1Educational Attainment ( NaN years)
1960 1980 2000 2020
-100
-50
0
50
100NetExports/GDP (-25.9) and X+M/GDP ( 31.5)
0
50
100
150
200
1960 1980 2000 2020
1
1.5
2
2.5
3Exchange Rate per Dollar ( 2.70)

Guatemala (Population = 16.0m) (data)
1960 1980 2000 2020
8
12
16
24
GDP Per Capita ( 13.3) and Per Worker ( 19.8)
1960 1980 2000 2020
-0.1
-0.05
0
0.05
0.1Growth Rate (Average is 1.81)
1960 1980 2000 2020
0
5
10
15
20Investment/GDP (12.7) and GovtConsump/GDP (10.9)
1940 1960 1980 2000 2020
1
2
3
4
5Educational Attainment ( 4.3 years)
1960 1980 2000 2020
-20
0NetExports/GDP (-9.5) and X+M/GDP ( 39.9)
0
50
1960 1980 2000 2020
0
2
4
6
8
10Exchange Rate per Dollar ( 7.73)

Hong Kong (Population = 7.2m) (data)
1960 1980 2000 2020
24
32
40
50
60
70
80
90100
120
GDP Per Capita ( 86.9) and Per Worker ( 78.3)
1960 1980 2000 2020
-0.2
-0.1
0
0.1
0.2Growth Rate (Average is 4.13)
1960 1980 2000 2020
0
10
20
30
40
50Investment/GDP (27.9) and GovtConsump/GDP ( 7.3)
1940 1960 1980 2000 2020
2
4
6
8
10
12Educational Attainment (11.0 years)
1960 1980 2000 2020
-50
-40
-30
-20
-10
0
10
20
30
40
50NetExports/GDP (-13.2) and X+M/GDP (461.5)
0
50
100
150
200
250
300
350
400
450
500
1960 1980 2000 2020
4
5
6
7
8Exchange Rate per Dollar ( 7.75)

Honduras (Population = 8.0m) (data)
1960 1980 2000 2020
6
8
12
16
24GDP Per Capita ( 8.4) and Per Worker ( 9.2)
1960 1980 2000 2020
-0.2
-0.1
0
0.1
0.2Growth Rate (Average is 1.13)
1960 1980 2000 2020
0
10
20
30
40Investment/GDP (21.0) and GovtConsump/GDP (11.7)
1940 1960 1980 2000 2020
1
2
3
4
5
6Educational Attainment ( 5.5 years)
1960 1980 2000 2020
-50
0
50NetExports/GDP (-21.1) and X+M/GDP ( 81.4)
0
50
100
1960 1980 2000 2020
0
10
20
30
40Exchange Rate per Dollar ( 21.01)

Croatia (Population = 4.3m) (data)
1960 1980 2000 2020
16
24
32
40
50
60GDP Per Capita ( 40.0) and Per Worker ( 52.7)
1960 1980 2000 2020
-0.5
0
0.5Growth Rate (Average is 1.61)
1960 1980 2000 2020
0
10
20
30
40Investment/GDP (19.6) and GovtConsump/GDP (25.2)
1940 1960 1980 2000 2020
4
6
8
10
12Educational Attainment (11.4 years)
1960 1980 2000 2020
-20
-10
0
10
20NetExports/GDP (-2.9) and X+M/GDP ( 64.6)
40
50
60
70
80
1960 1980 2000 2020
0
2
4
6
8
10Exchange Rate per Dollar ( 5.75)

Haiti (Population = 10.6m) (data)
1960 1980 2000 2020
1
2
4
6
8
12
GDP Per Capita ( 3.2) and Per Worker ( 3.7)
1960 1980 2000 2020
-0.5
0
0.5Growth Rate (Average is 0.42)
1960 1980 2000 2020
0
10
20
30
40Investment/GDP (28.0) and GovtConsump/GDP ( 7.3)
1940 1960 1980 2000 2020
0
1
2
3
4
5Educational Attainment ( 4.7 years)
1960 1980 2000 2020
-50
0
50NetExports/GDP (-26.3) and X+M/GDP ( 53.8)
0
50
100
1960 1980 2000 2020
0
10
20
30
40
50Exchange Rate per Dollar ( 45.22)

Hungary (Population = 9.9m) (data)
1960 1980 2000 2020
16
24
32
40
50
GDP Per Capita ( 43.8) and Per Worker ( 48.4)
1960 1980 2000 2020
-0.2
-0.1
0
0.1
0.2Growth Rate (Average is 3.35)
1960 1980 2000 2020
0
10
20
30
40Investment/GDP (22.5) and GovtConsump/GDP (29.1)
1940 1960 1980 2000 2020
6
8
10
12
14Educational Attainment (12.1 years)
1960 1980 2000 2020
-20
-10
0
10
20NetExports/GDP (-4.8) and X+M/GDP (148.6)
0
50
100
150
200
1960 1980 2000 2020
0
100
200
300
400Exchange Rate per Dollar ( 232.60)

Indonesia (Population = 254.5m) (data)
1960 1980 2000 2020
2
4
6
8
12
16
24GDP Per Capita ( 18.9) and Per Worker ( 19.7)
1960 1980 2000 2020
-0.5
0
0.5Growth Rate (Average is 3.74)
1960 1980 2000 2020
0
10
20
30
40Investment/GDP (36.0) and GovtConsump/GDP (10.8)
1940 1960 1980 2000 2020
0
2
4
6
8Educational Attainment ( 7.3 years)
1960 1980 2000 2020
-50
-40
-30
-20
-10
0
10
20
30
40
50NetExports/GDP (-0.7) and X+M/GDP ( 20.3)
0
5
10
15
20
25
30
35
40
45
50
1960 1980 2000 2020
0
0.5
1
1.5
210
4Exchange Rate per Dollar (11865.21)

India (Population = 1295.3m) (data)
1960 1980 2000 2020
2
4
6
8
12
16
GDP Per Capita ( 10.5) and Per Worker ( 12.4)
1960 1980 2000 2020
-0.2
-0.1
0
0.1
0.2Growth Rate (Average is 2.92)
1960 1980 2000 2020
0
10
20
30
40Investment/GDP (27.4) and GovtConsump/GDP (10.7)
1940 1960 1980 2000 2020
0
1
2
3
4
5
6Educational Attainment ( 5.4 years)
1960 1980 2000 2020
-20
-10
0
10
20NetExports/GDP ( 1.1) and X+M/GDP ( 15.0)
0
5
10
15
20
1960 1980 2000 2020
0
20
40
60
80
100Exchange Rate per Dollar ( 61.03)
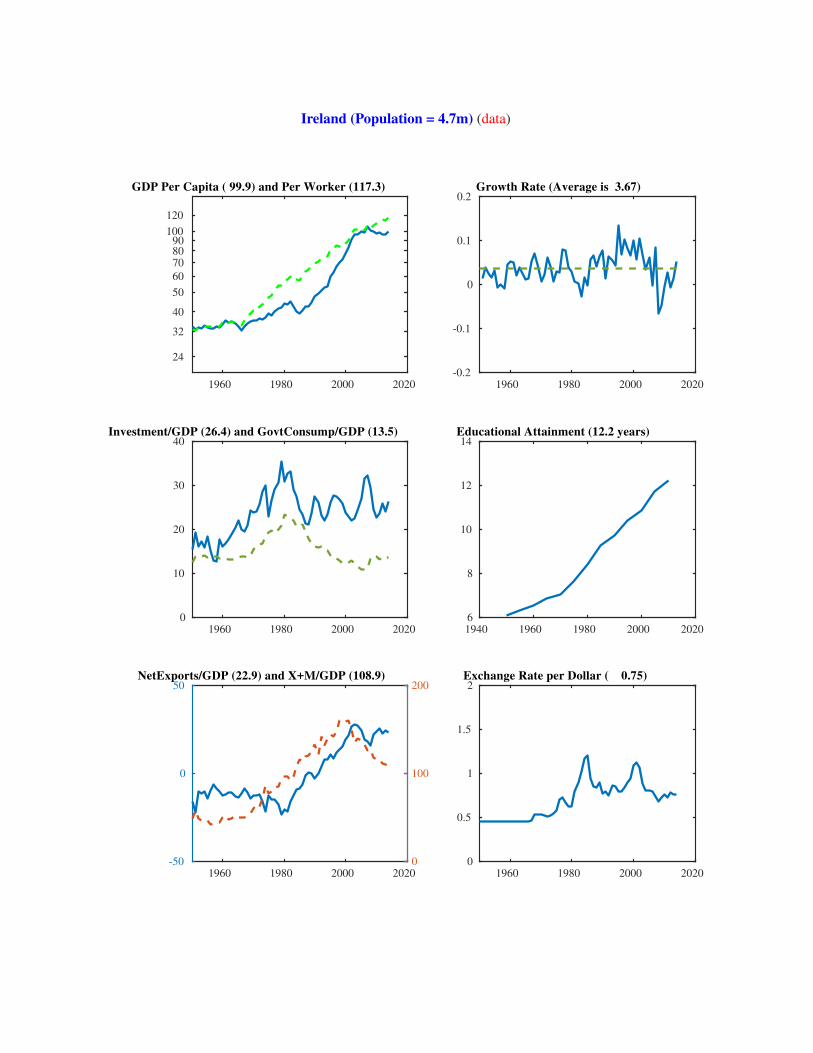
Ireland (Population = 4.7m) (data)
1960 1980 2000 2020
24
32
40
50
60
70
80
90100
120
GDP Per Capita ( 99.9) and Per Worker (117.3)
1960 1980 2000 2020
-0.2
-0.1
0
0.1
0.2Growth Rate (Average is 3.67)
1960 1980 2000 2020
0
10
20
30
40Investment/GDP (26.4) and GovtConsump/GDP (13.5)
1940 1960 1980 2000 2020
6
8
10
12
14Educational Attainment (12.2 years)
1960 1980 2000 2020
-50
0
50NetExports/GDP (22.9) and X+M/GDP (108.9)
0
100
200
1960 1980 2000 2020
0
0.5
1
1.5
2Exchange Rate per Dollar ( 0.75)

Iran (Population = 78.1m) (data)
1960 1980 2000 2020
4
6
8
12
16
24
3240506070
GDP Per Capita ( 30.0) and Per Worker ( 46.5)
1960 1980 2000 2020
-1
-0.5
0
0.5
1Growth Rate (Average is 3.00)
1960 1980 2000 2020
0
10
20
30
40
50Investment/GDP (23.7) and GovtConsump/GDP (20.7)
1940 1960 1980 2000 2020
0
2
4
6
8
10Educational Attainment ( 8.2 years)
1960 1980 2000 2020
-100
-50
0
50
100NetExports/GDP ( 3.9) and X+M/GDP ( 21.8)
0
50
100
150
200
1960 1980 2000 2020
0
1
2
3
410
4Exchange Rate per Dollar (25941.66)

Iraq (Population = 35.3m) (data)
1960 1980 2000 2020
2
4
6
8
12
16
24
32405060
GDP Per Capita ( 23.5) and Per Worker ( 50.7)
1960 1980 2000 2020
-2
-1
0
1
2Growth Rate (Average is 3.13)
1960 1980 2000 2020
0
20
40
60
80
100Investment/GDP (17.6) and GovtConsump/GDP (24.7)
1940 1960 1980 2000 2020
0
2
4
6
8Educational Attainment ( 6.4 years)
1960 1980 2000 2020
-100
0
100NetExports/GDP (15.8) and X+M/GDP ( 39.9)
0
50
100
1960 1980 2000 2020
0
1000
2000
3000
4000Exchange Rate per Dollar ( 1166.00)

Iceland (Population = 0.3m) (data)
1960 1980 2000 2020
40
50
60
70
80
90100
GDP Per Capita ( 76.4) and Per Worker ( 63.4)
1960 1980 2000 2020
-0.2
-0.1
0
0.1
0.2Growth Rate (Average is 2.44)
1960 1980 2000 2020
0
20
40
60
80
100Investment/GDP (19.1) and GovtConsump/GDP (24.9)
1940 1960 1980 2000 2020
5
6
7
8
9
10
11Educational Attainment (10.6 years)
1960 1980 2000 2020
-50
0
50NetExports/GDP (-1.5) and X+M/GDP (115.1)
0
100
200
1960 1980 2000 2020
0
50
100
150
200Exchange Rate per Dollar ( 116.77)

Israel (Population = 7.9m) (data)
1960 1980 2000 2020
24
32
40
50
60
70
80
GDP Per Capita ( 60.8) and Per Worker ( 57.2)
1960 1980 2000 2020
-0.2
-0.1
0
0.1
0.2Growth Rate (Average is 2.81)
1960 1980 2000 2020
20
30
40
50
60Investment/GDP (21.7) and GovtConsump/GDP (23.3)
1940 1960 1980 2000 2020
7
8
9
10
11
12
13Educational Attainment (12.8 years)
1960 1980 2000 2020
-50
-40
-30
-20
-10
0NetExports/GDP (-4.0) and X+M/GDP ( 80.5)
0
20
40
60
80
100
1960 1980 2000 2020
0
1
2
3
4
5Exchange Rate per Dollar ( 3.58)

Italy (Population = 59.8m) (data)
1960 1980 2000 2020
24
32
40
50
60
70
80
90100
GDP Per Capita ( 68.0) and Per Worker ( 80.1)
1960 1980 2000 2020
-0.2
-0.1
0
0.1
0.2Growth Rate (Average is 3.36)
1960 1980 2000 2020
0
10
20
30
40Investment/GDP (21.0) and GovtConsump/GDP (17.8)
1940 1960 1980 2000 2020
4
5
6
7
8
9
10Educational Attainment ( 9.5 years)
1960 1980 2000 2020
-10
0
10NetExports/GDP ( 1.3) and X+M/GDP ( 64.6)
0
50
100
1960 1980 2000 2020
0
0.5
1
1.5
2Exchange Rate per Dollar ( 0.75)

Jamaica (Population = 2.8m) (data)
1960 1980 2000 2020
8
12
16
24
32
40
GDP Per Capita ( 14.0) and Per Worker ( 16.9)
1960 1980 2000 2020
-0.2
-0.1
0
0.1
0.2Growth Rate (Average is 1.36)
1960 1980 2000 2020
0
10
20
30
40Investment/GDP (23.4) and GovtConsump/GDP (20.0)
1940 1960 1980 2000 2020
2
4
6
8
10Educational Attainment ( 9.7 years)
1960 1980 2000 2020
-50
0
50NetExports/GDP (-25.7) and X+M/GDP ( 55.0)
0
50
100
1960 1980 2000 2020
0
50
100
150
200Exchange Rate per Dollar ( 110.93)

Jordan (Population = 7.4m) (data)
1960 1980 2000 2020
6
8
12
16
24
32
40
50
GDP Per Capita ( 22.8) and Per Worker ( 43.7)
1960 1980 2000 2020
-0.5
0
0.5Growth Rate (Average is 2.69)
1960 1980 2000 2020
0
20
40
60
80
100Investment/GDP (18.1) and GovtConsump/GDP (19.2)
1940 1960 1980 2000 2020
0
2
4
6
8
10Educational Attainment ( 9.2 years)
1960 1980 2000 2020
-100
-50
0NetExports/GDP (-11.0) and X+M/GDP ( 52.7)
0
100
200
1960 1980 2000 2020
0
0.2
0.4
0.6
0.8
1Exchange Rate per Dollar ( 0.71)
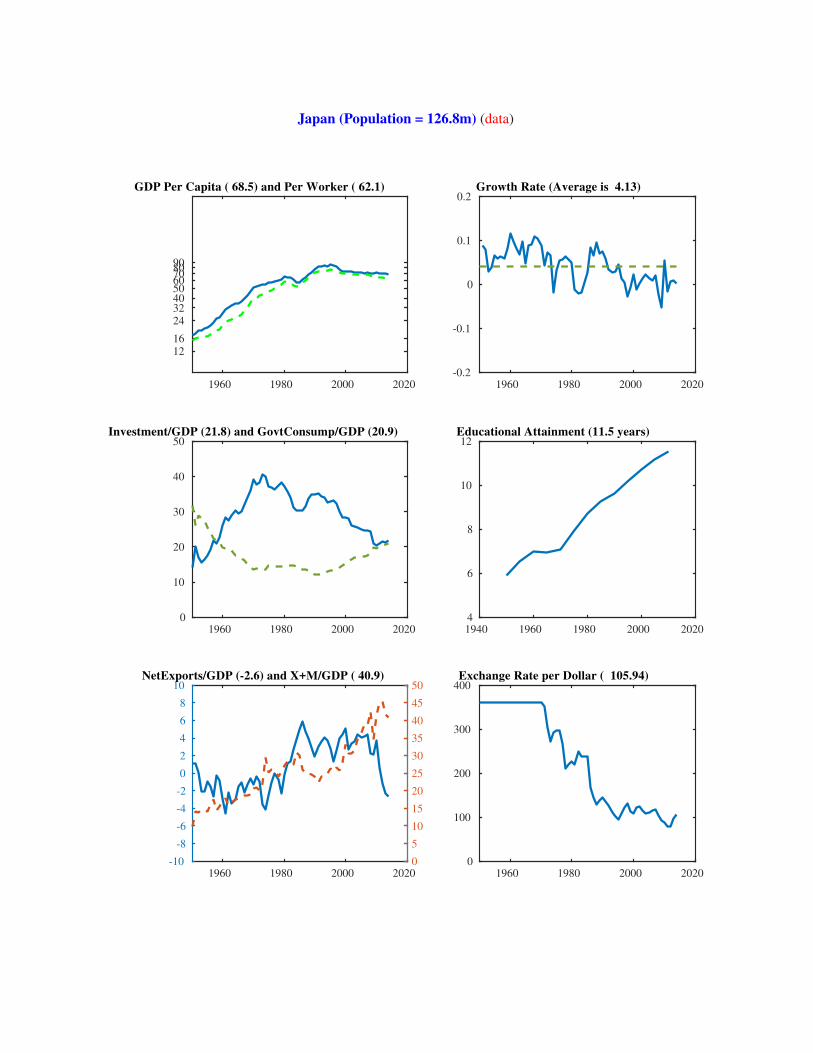
Japan (Population = 126.8m) (data)
1960 1980 2000 2020
12
16
24
32405060708090
GDP Per Capita ( 68.5) and Per Worker ( 62.1)
1960 1980 2000 2020
-0.2
-0.1
0
0.1
0.2Growth Rate (Average is 4.13)
1960 1980 2000 2020
0
10
20
30
40
50Investment/GDP (21.8) and GovtConsump/GDP (20.9)
1940 1960 1980 2000 2020
4
6
8
10
12Educational Attainment (11.5 years)
1960 1980 2000 2020
-10
-8
-6
-4
-2
0
2
4
6
8
10NetExports/GDP (-2.6) and X+M/GDP ( 40.9)
0
5
10
15
20
25
30
35
40
45
50
1960 1980 2000 2020
0
100
200
300
400Exchange Rate per Dollar ( 105.94)

Kazakhstan (Population = 17.4m) (data)
1960 1980 2000 2020
8
12
16
24
32
40
50
GDP Per Capita ( 45.3) and Per Worker ( 42.8)
1960 1980 2000 2020
-0.5
0
0.5Growth Rate (Average is 3.15)
1960 1980 2000 2020
0
10
20
30
40
50Investment/GDP (15.4) and GovtConsump/GDP (18.5)
1940 1960 1980 2000 2020
2
4
6
8
10
12Educational Attainment (11.4 years)
1960 1980 2000 2020
-50
0
50NetExports/GDP (16.0) and X+M/GDP ( 44.3)
0
50
100
1960 1980 2000 2020
0
50
100
150
200Exchange Rate per Dollar ( 179.19)

Kenya (Population = 44.9m) (data)
1960 1980 2000 2020
2
4
6
8
12
16
GDP Per Capita ( 5.7) and Per Worker ( 7.0)
1960 1980 2000 2020
-0.2
-0.1
0
0.1
0.2Growth Rate (Average is 1.06)
1960 1980 2000 2020
0
10
20
30
40Investment/GDP (16.1) and GovtConsump/GDP (12.4)
1940 1960 1980 2000 2020
0
2
4
6
8Educational Attainment ( 6.2 years)
1960 1980 2000 2020
-50
0
50NetExports/GDP (-8.3) and X+M/GDP ( 24.0)
0
20
40
1960 1980 2000 2020
0
20
40
60
80
100Exchange Rate per Dollar ( 87.92)
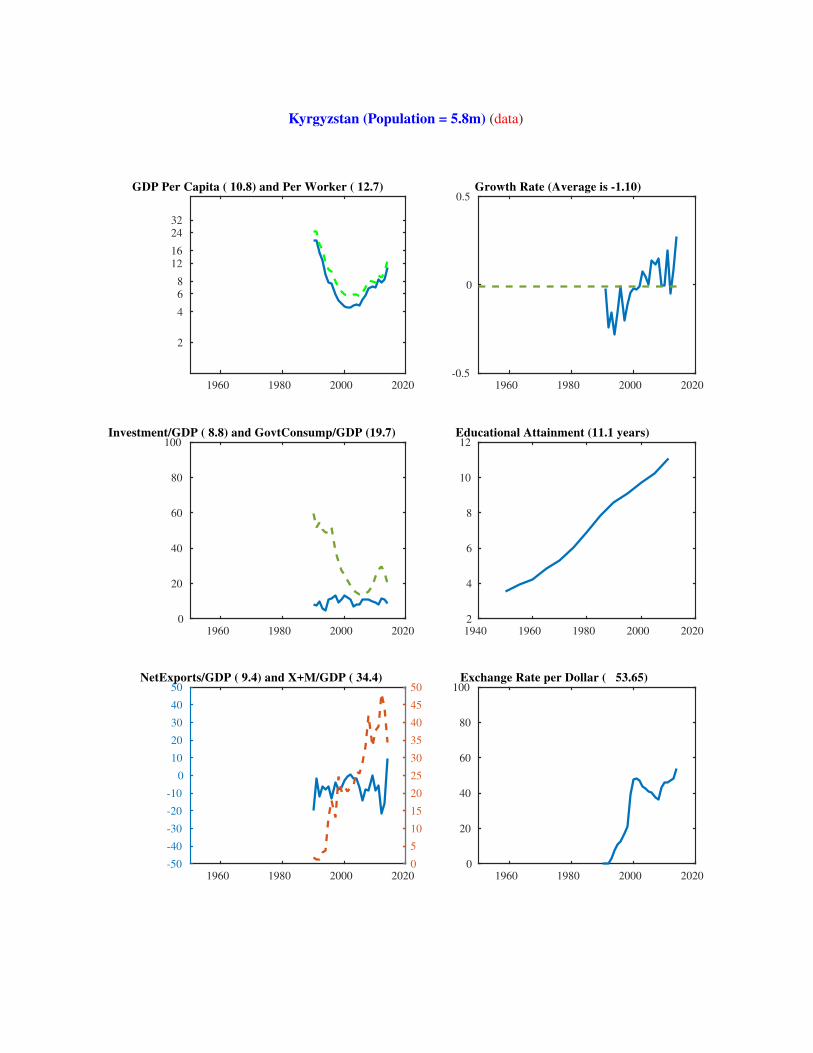
Kyrgyzstan (Population = 5.8m) (data)
1960 1980 2000 2020
2
4
6
8
12
16
24
32
GDP Per Capita ( 10.8) and Per Worker ( 12.7)
1960 1980 2000 2020
-0.5
0
0.5Growth Rate (Average is -1.10)
1960 1980 2000 2020
0
20
40
60
80
100Investment/GDP ( 8.8) and GovtConsump/GDP (19.7)
1940 1960 1980 2000 2020
2
4
6
8
10
12Educational Attainment (11.1 years)
1960 1980 2000 2020
-50
-40
-30
-20
-10
0
10
20
30
40
50NetExports/GDP ( 9.4) and X+M/GDP ( 34.4)
0
5
10
15
20
25
30
35
40
45
50
1960 1980 2000 2020
0
20
40
60
80
100Exchange Rate per Dollar ( 53.65)

Cambodia (Population = 15.3m) (data)
1960 1980 2000 2020
1
2
4
6
8
12
GDP Per Capita ( 5.8) and Per Worker ( 4.6)
1960 1980 2000 2020
-0.5
0
0.5Growth Rate (Average is 1.29)
1960 1980 2000 2020
0
10
20
30
40Investment/GDP (18.3) and GovtConsump/GDP ( 9.6)
1940 1960 1980 2000 2020
0
1
2
3
4
5Educational Attainment ( 4.1 years)
1960 1980 2000 2020
-20
0
20NetExports/GDP (-4.6) and X+M/GDP ( 72.9)
0
50
100
1960 1980 2000 2020
0
1000
2000
3000
4000
5000Exchange Rate per Dollar ( 4037.50)

Saint Kitts and Nevis (Population = 0.1m) (data)
1960 1980 2000 2020
12
16
24
32
40
50
GDP Per Capita ( 40.1) and Per Worker ( NaN)
1960 1980 2000 2020
-0.5
0
0.5Growth Rate (Average is 3.81)
1960 1980 2000 2020
0
10
20
30
40
50Investment/GDP (26.3) and GovtConsump/GDP (42.5)
0 0.2 0.4 0.6 0.8 1
0
0.2
0.4
0.6
0.8
1Educational Attainment ( NaN years)
1960 1980 2000 2020
-100
-50
0NetExports/GDP (-21.3) and X+M/GDP ( 95.3)
0
100
200
1960 1980 2000 2020
1
1.5
2
2.5
3Exchange Rate per Dollar ( 2.70)

South Korea (Population = 50.1m) (data)
1960 1980 2000 2020
4
6
8
12
16
24
3240506070
GDP Per Capita ( 67.3) and Per Worker ( 59.9)
1960 1980 2000 2020
-0.2
-0.1
0
0.1
0.2Growth Rate (Average is 5.76)
1960 1980 2000 2020
0
10
20
30
40
50Investment/GDP (30.4) and GovtConsump/GDP (15.2)
1940 1960 1980 2000 2020
2
4
6
8
10
12Educational Attainment (11.9 years)
1960 1980 2000 2020
-20
-10
0
10
20NetExports/GDP ( 5.0) and X+M/GDP (101.2)
0
50
100
150
200
1960 1980 2000 2020
0
500
1000
1500
2000Exchange Rate per Dollar ( 1052.96)

Kuwait (Population = 3.8m) (data)
1960 1980 2000 2020
24 32 40 50 60 70 80 90100120
GDP Per Capita (133.4) and Per Worker (123.8)
1960 1980 2000 2020
-1
-0.5
0
0.5
1Growth Rate (Average is -1.47)
1960 1980 2000 2020
0
50
100
150
200Investment/GDP (17.9) and GovtConsump/GDP (13.3)
1940 1960 1980 2000 2020
1
2
3
4
5
6
7Educational Attainment ( 6.3 years)
1960 1980 2000 2020
-500
0
500NetExports/GDP (40.3) and X+M/GDP ( 81.9)
0
50
100
1960 1980 2000 2020
0.2
0.25
0.3
0.35
0.4Exchange Rate per Dollar ( 0.28)

Laos (Population = 6.7m) (data)
1960 1980 2000 2020
1
2
4
6
8
12
16
GDP Per Capita ( 11.0) and Per Worker ( 10.4)
1960 1980 2000 2020
-0.2
-0.1
0
0.1
0.2Growth Rate (Average is 4.42)
1960 1980 2000 2020
0
10
20
30
40Investment/GDP (27.3) and GovtConsump/GDP (31.1)
1940 1960 1980 2000 2020
0
1
2
3
4
5Educational Attainment ( 4.6 years)
1960 1980 2000 2020
-10
-5
0
5
10NetExports/GDP ( 0.2) and X+M/GDP ( 24.2)
0
10
20
30
40
1960 1980 2000 2020
0
0.5
1
1.5
210
4Exchange Rate per Dollar ( 8048.96)

Lebanon (Population = 5.6m) (data)
1960 1980 2000 2020
6
8
12
16
24
32
40
50
60GDP Per Capita ( 27.4) and Per Worker ( 38.3)
1960 1980 2000 2020
-1
-0.5
0
0.5
1Growth Rate (Average is 1.68)
1960 1980 2000 2020
0
20
40
60
80
100Investment/GDP (29.8) and GovtConsump/GDP (19.2)
0 0.2 0.4 0.6 0.8 1
0
0.2
0.4
0.6
0.8
1Educational Attainment ( NaN years)
1960 1980 2000 2020
-200
-150
-100
-50
0NetExports/GDP (-24.5) and X+M/GDP ( 35.7)
0
50
100
150
200
1960 1980 2000 2020
0
500
1000
1500
2000Exchange Rate per Dollar ( 1507.50)
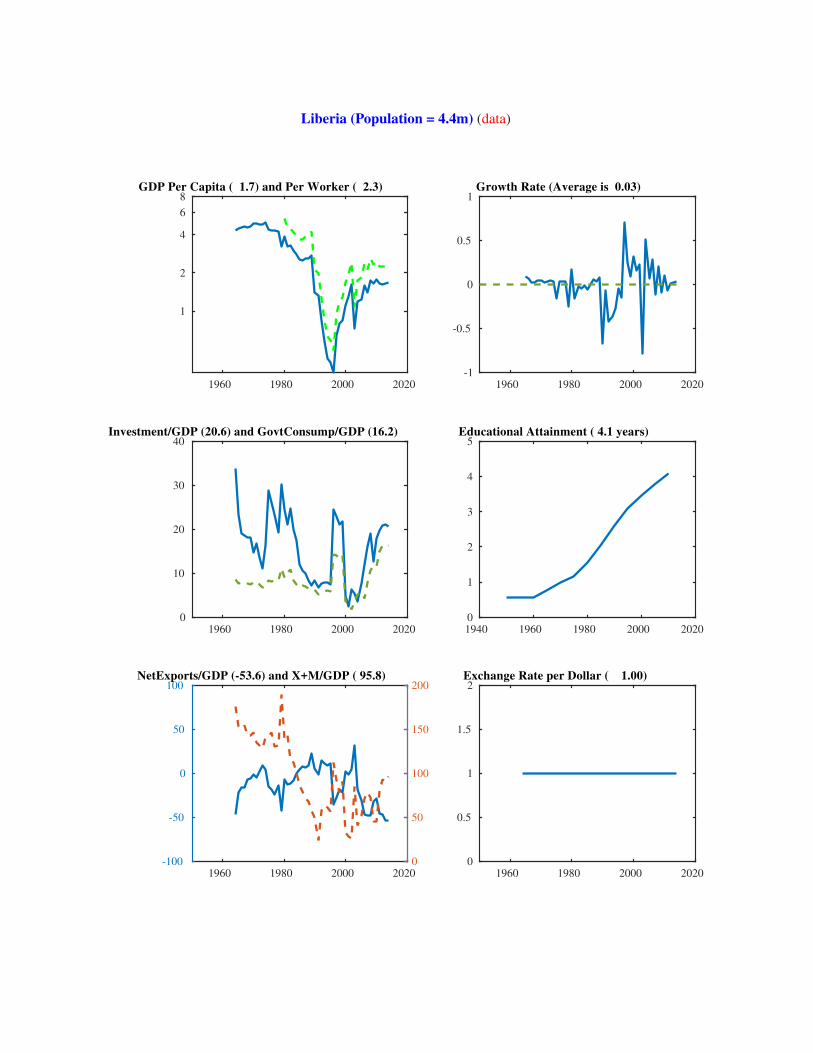
Liberia (Population = 4.4m) (data)
1960 1980 2000 2020
1
2
4
6
8GDP Per Capita ( 1.7) and Per Worker ( 2.3)
1960 1980 2000 2020
-1
-0.5
0
0.5
1Growth Rate (Average is 0.03)
1960 1980 2000 2020
0
10
20
30
40Investment/GDP (20.6) and GovtConsump/GDP (16.2)
1940 1960 1980 2000 2020
0
1
2
3
4
5Educational Attainment ( 4.1 years)
1960 1980 2000 2020
-100
-50
0
50
100NetExports/GDP (-53.6) and X+M/GDP ( 95.8)
0
50
100
150
200
1960 1980 2000 2020
0
0.5
1
1.5
2Exchange Rate per Dollar ( 1.00)

Saint Lucia (Population = 0.2m) (data)
1960 1980 2000 2020
8
12
16
24
32
GDP Per Capita ( 20.3) and Per Worker ( 21.8)
1960 1980 2000 2020
-1
-0.5
0
0.5
1Growth Rate (Average is 2.16)
1960 1980 2000 2020
0
10
20
30
40Investment/GDP (17.4) and GovtConsump/GDP (17.5)
0 0.2 0.4 0.6 0.8 1
0
0.2
0.4
0.6
0.8
1Educational Attainment ( NaN years)
1960 1980 2000 2020
-100
0
100NetExports/GDP ( 2.4) and X+M/GDP ( 89.7)
50
100
150
1960 1980 2000 2020
1
1.5
2
2.5
3Exchange Rate per Dollar ( 2.70)

Sri Lanka (Population = 20.6m) (data)
1960 1980 2000 2020
6
8
12
16
24
32
GDP Per Capita ( 20.8) and Per Worker ( 28.7)
1960 1980 2000 2020
-0.2
-0.1
0
0.1
0.2Growth Rate (Average is 2.33)
1960 1980 2000 2020
0
10
20
30
40Investment/GDP (22.6) and GovtConsump/GDP (18.8)
1940 1960 1980 2000 2020
2
4
6
8
10Educational Attainment ( 9.8 years)
1960 1980 2000 2020
-10
-5
0
5
10NetExports/GDP (-3.5) and X+M/GDP ( 20.1)
0
10
20
30
40
1960 1980 2000 2020
0
50
100
150
200Exchange Rate per Dollar ( 130.56)

Lesotho (Population = 2.1m) (data)
1960 1980 2000 2020
2
4
6
8
12
16
GDP Per Capita ( 5.5) and Per Worker ( 8.3)
1960 1980 2000 2020
-0.2
-0.1
0
0.1
0.2Growth Rate (Average is 2.78)
1960 1980 2000 2020
0
10
20
30
40Investment/GDP (25.3) and GovtConsump/GDP (28.2)
1940 1960 1980 2000 2020
2
3
4
5
6
7Educational Attainment ( 5.6 years)
1960 1980 2000 2020
-100
-50
0NetExports/GDP (-42.6) and X+M/GDP ( 81.8)
0
100
200
1960 1980 2000 2020
0
5
10
15
20Exchange Rate per Dollar ( 10.85)

Lithuania (Population = 2.9m) (data)
1960 1980 2000 2020
16
24
3240506070
GDP Per Capita ( 49.0) and Per Worker ( 60.6)
1960 1980 2000 2020
-0.2
-0.1
0
0.1
0.2Growth Rate (Average is 2.92)
1960 1980 2000 2020
0
10
20
30
40Investment/GDP (17.8) and GovtConsump/GDP (26.4)
1940 1960 1980 2000 2020
2
4
6
8
10
12Educational Attainment (11.1 years)
1960 1980 2000 2020
-50
0
50NetExports/GDP (-10.1) and X+M/GDP (157.3)
0
100
200
1960 1980 2000 2020
0
0.5
1
1.5
2Exchange Rate per Dollar ( 0.75)

Luxembourg (Population = 0.6m) (data)
1960 1980 2000 2020
60
70
80
90
100
120
GDP Per Capita (129.6) and Per Worker ( 79.3)
1960 1980 2000 2020
-0.2
-0.1
0
0.1
0.2Growth Rate (Average is 2.59)
1960 1980 2000 2020
0
10
20
30
40
50Investment/GDP (36.4) and GovtConsump/GDP (16.3)
1940 1960 1980 2000 2020
2
4
6
8
10
12Educational Attainment (11.2 years)
1960 1980 2000 2020
-50
0
50NetExports/GDP ( 3.2) and X+M/GDP (150.9)
0
200
400
1960 1980 2000 2020
0.5
1
1.5Exchange Rate per Dollar ( 0.75)

Latvia (Population = 2.0m) (data)
1960 1980 2000 2020
16
24
32
40
50
60GDP Per Capita ( 43.3) and Per Worker ( 49.7)
1960 1980 2000 2020
-0.5
0
0.5Growth Rate (Average is 1.51)
1960 1980 2000 2020
0
10
20
30
40Investment/GDP (23.0) and GovtConsump/GDP (24.1)
1940 1960 1980 2000 2020
2
4
6
8
10
12Educational Attainment (10.5 years)
1960 1980 2000 2020
-50
0
50NetExports/GDP (-8.3) and X+M/GDP (101.0)
0
100
200
1960 1980 2000 2020
0
0.2
0.4
0.6
0.8
1Exchange Rate per Dollar ( 0.75)

Macao (Population = 0.6m) (data)
1960 1980 2000 2020
16
24
32 40 50 60 70 80 90
100120
GDP Per Capita (253.8) and Per Worker (191.8)
1960 1980 2000 2020
-0.5
0
0.5Growth Rate (Average is 7.21)
1960 1980 2000 2020
0
10
20
30
40Investment/GDP (19.0) and GovtConsump/GDP ( 5.5)
1940 1960 1980 2000 2020
3
4
5
6
7
8
9Educational Attainment ( 8.1 years)
1960 1980 2000 2020
0
50
100NetExports/GDP (56.0) and X+M/GDP ( 21.2)
0
100
200
1960 1980 2000 2020
0
2
4
6
8
10Exchange Rate per Dollar ( 7.99)

Morocco (Population = 33.9m) (data)
1960 1980 2000 2020
6
8
12
16
24
32
GDP Per Capita ( 14.2) and Per Worker ( 18.2)
1960 1980 2000 2020
-0.5
0
0.5Growth Rate (Average is 2.76)
1960 1980 2000 2020
0
10
20
30
40Investment/GDP (33.8) and GovtConsump/GDP (19.3)
1940 1960 1980 2000 2020
0
1
2
3
4
5Educational Attainment ( 4.2 years)
1960 1980 2000 2020
-20
0
20NetExports/GDP (-9.4) and X+M/GDP ( 34.2)
0
50
100
1960 1980 2000 2020
0
5
10
15
20Exchange Rate per Dollar ( 8.41)

Moldova (Population = 4.1m) (data)
1960 1980 2000 2020
2
4
6
8
12
16
GDP Per Capita ( 10.4) and Per Worker ( 14.6)
1960 1980 2000 2020
-1
-0.5
0
0.5
1Growth Rate (Average is 0.38)
1960 1980 2000 2020
0
20
40
60
80
100Investment/GDP ( 9.6) and GovtConsump/GDP (26.8)
0 0.2 0.4 0.6 0.8 1
0
0.2
0.4
0.6
0.8
1Educational Attainment ( NaN years)
1960 1980 2000 2020
-50
0
50NetExports/GDP (-22.8) and X+M/GDP ( 53.4)
0
50
100
1960 1980 2000 2020
0
5
10
15
20Exchange Rate per Dollar ( 14.04)

Madagascar (Population = 23.6m) (data)
1960 1980 2000 2020
1
2
4
6
8GDP Per Capita ( 2.4) and Per Worker ( 2.6)
1960 1980 2000 2020
-1
-0.5
0
0.5
1Growth Rate (Average is 0.10)
1960 1980 2000 2020
0
20
40
60
80
100Investment/GDP (12.6) and GovtConsump/GDP (86.7)
0 0.2 0.4 0.6 0.8 1
0
0.2
0.4
0.6
0.8
1Educational Attainment ( NaN years)
1960 1980 2000 2020
-50
-40
-30
-20
-10
0NetExports/GDP (-10.0) and X+M/GDP ( 23.3)
0
20
40
60
80
100
1960 1980 2000 2020
0
1000
2000
3000
4000Exchange Rate per Dollar ( 2414.81)

Maldives (Population = 0.4m) (data)
1960 1980 2000 2020
6
8
12
16
24
32
40
50
60GDP Per Capita ( 33.0) and Per Worker ( 35.5)
1960 1980 2000 2020
-0.5
0
0.5Growth Rate (Average is 4.31)
1960 1980 2000 2020
0
10
20
30
40Investment/GDP (22.8) and GovtConsump/GDP (25.1)
1940 1960 1980 2000 2020
2.5
3
3.5
4
4.5
5Educational Attainment ( 4.4 years)
1960 1980 2000 2020
0
20
40
60
80
100NetExports/GDP (29.3) and X+M/GDP ( 54.3)
0
20
40
60
80
100
1960 1980 2000 2020
0
5
10
15
20Exchange Rate per Dollar ( 15.38)

Mexico (Population = 125.4m) (data)
1960 1980 2000 2020
16
24
32
40
50
60
70
GDP Per Capita ( 29.9) and Per Worker ( 33.9)
1960 1980 2000 2020
-0.2
-0.1
0
0.1
0.2Growth Rate (Average is 1.98)
1960 1980 2000 2020
0
10
20
30
40Investment/GDP (21.0) and GovtConsump/GDP (19.3)
1940 1960 1980 2000 2020
2
4
6
8
10Educational Attainment ( 8.3 years)
1960 1980 2000 2020
-10
0
10NetExports/GDP (-3.9) and X+M/GDP ( 56.6)
0
50
100
1960 1980 2000 2020
0
5
10
15
20Exchange Rate per Dollar ( 13.29)

TFYR of Macedonia (Population = 2.1m) (data)
1960 1980 2000 2020
12
16
24
32
40
GDP Per Capita ( 25.6) and Per Worker ( 34.0)
1960 1980 2000 2020
-0.2
-0.1
0
0.1
0.2Growth Rate (Average is 2.62)
1960 1980 2000 2020
0
10
20
30
40Investment/GDP (26.5) and GovtConsump/GDP (28.2)
0 0.2 0.4 0.6 0.8 1
0
0.2
0.4
0.6
0.8
1Educational Attainment ( NaN years)
1960 1980 2000 2020
-50
0
50NetExports/GDP (-16.5) and X+M/GDP ( 71.4)
0
50
100
1960 1980 2000 2020
0
20
40
60
80
100Exchange Rate per Dollar ( 46.44)

Mali (Population = 17.1m) (data)
1960 1980 2000 2020
2
4
6
GDP Per Capita ( 2.9) and Per Worker ( 4.2)
1960 1980 2000 2020
-0.5
0
0.5Growth Rate (Average is 1.51)
1960 1980 2000 2020
0
10
20
30
40
50Investment/GDP (16.2) and GovtConsump/GDP (20.7)
1940 1960 1980 2000 2020
0
0.5
1
1.5Educational Attainment ( 1.5 years)
1960 1980 2000 2020
-50
-40
-30
-20
-10
0
10
20
30
40
50NetExports/GDP ( 0.5) and X+M/GDP ( 21.3)
0
5
10
15
20
25
30
35
40
45
50
1960 1980 2000 2020
0
200
400
600
800
1000Exchange Rate per Dollar ( 494.41)

Malta (Population = 0.4m) (data)
1960 1980 2000 2020
2
4
6
8
12
16
24
3240506070
GDP Per Capita ( 46.2) and Per Worker ( 47.3)
1960 1980 2000 2020
-2
-1
0
1
2Growth Rate (Average is 5.76)
1960 1980 2000 2020
0
100
200
300
400Investment/GDP (24.8) and GovtConsump/GDP (28.4)
1940 1960 1980 2000 2020
2
4
6
8
10
12Educational Attainment (10.3 years)
1960 1980 2000 2020
-2000
-1500
-1000
-500
0NetExports/GDP (-23.3) and X+M/GDP (193.2)
0
500
1000
1500
2000
1960 1980 2000 2020
0.5
1
1.5Exchange Rate per Dollar ( 0.75)

Myanmar (Population = 53.4m) (data)
1960 1980 2000 2020
1
2
4
6
8
12
GDP Per Capita ( 10.8) and Per Worker ( 8.8)
1960 1980 2000 2020
-2
-1
0
1
2Growth Rate (Average is 5.74)
1960 1980 2000 2020
0
10
20
30
40Investment/GDP (23.1) and GovtConsump/GDP (33.7)
1940 1960 1980 2000 2020
1
2
3
4
5Educational Attainment ( 4.1 years)
1960 1980 2000 2020
-50
0
50NetExports/GDP ( 2.4) and X+M/GDP ( 14.2)
0
10
20
1960 1980 2000 2020
0
500
1000
1500
2000Exchange Rate per Dollar ( 984.35)
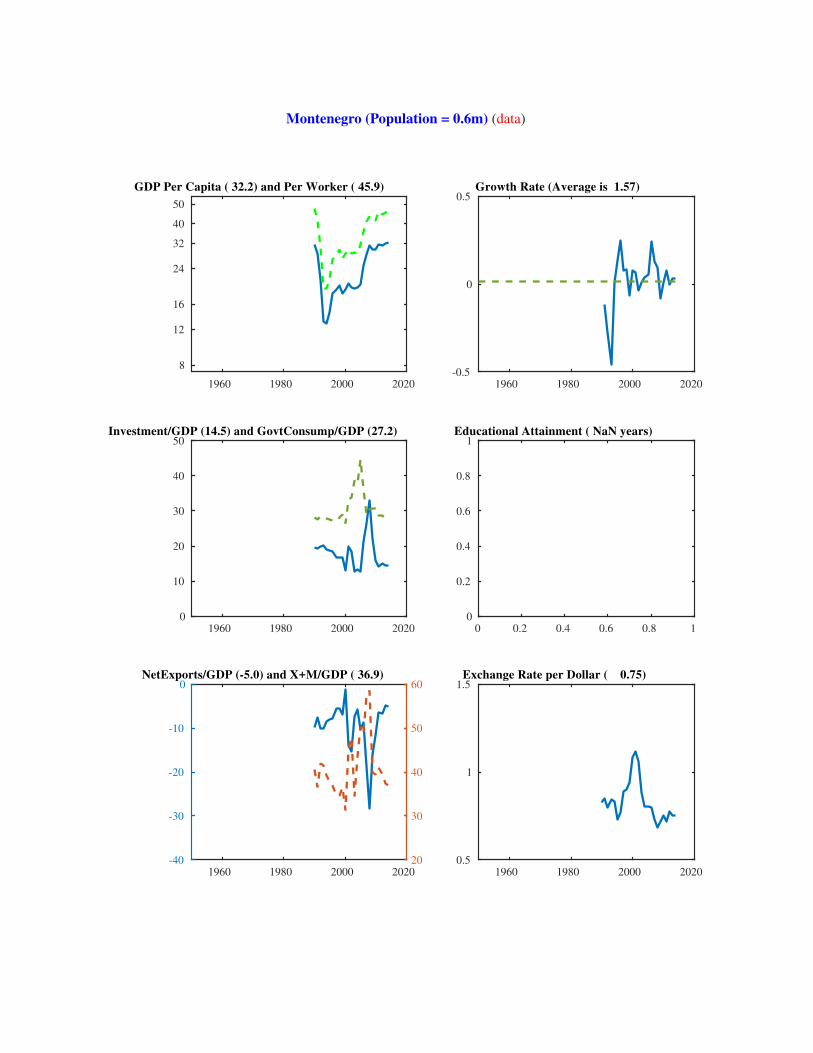
Montenegro (Population = 0.6m) (data)
1960 1980 2000 2020
8
12
16
24
32
40
50
GDP Per Capita ( 32.2) and Per Worker ( 45.9)
1960 1980 2000 2020
-0.5
0
0.5Growth Rate (Average is 1.57)
1960 1980 2000 2020
0
10
20
30
40
50Investment/GDP (14.5) and GovtConsump/GDP (27.2)
0 0.2 0.4 0.6 0.8 1
0
0.2
0.4
0.6
0.8
1Educational Attainment ( NaN years)
1960 1980 2000 2020
-40
-30
-20
-10
0NetExports/GDP (-5.0) and X+M/GDP ( 36.9)
20
30
40
50
60
1960 1980 2000 2020
0.5
1
1.5Exchange Rate per Dollar ( 0.75)

Mongolia (Population = 2.9m) (data)
1960 1980 2000 2020
2
4
6
8
12
16
24
32
GDP Per Capita ( 21.5) and Per Worker ( 24.0)
1960 1980 2000 2020
-0.5
0
0.5Growth Rate (Average is 5.08)
1960 1980 2000 2020
0
20
40
60
80
100Investment/GDP (27.9) and GovtConsump/GDP (22.9)
1940 1960 1980 2000 2020
0
2
4
6
8
10Educational Attainment ( 9.3 years)
1960 1980 2000 2020
-50
0
50NetExports/GDP (-5.5) and X+M/GDP ( 51.0)
0
50
100
1960 1980 2000 2020
0
500
1000
1500
2000Exchange Rate per Dollar ( 1817.94)

Mozambique (Population = 27.2m) (data)
1960 1980 2000 2020
2
4
GDP Per Capita ( 2.4) and Per Worker ( 2.6)
1960 1980 2000 2020
-0.5
0
0.5Growth Rate (Average is 1.73)
1960 1980 2000 2020
0
20
40
60
80
100Investment/GDP (47.3) and GovtConsump/GDP (15.1)
1940 1960 1980 2000 2020
0.2
0.4
0.6
0.8
1
1.2
1.4Educational Attainment ( 1.2 years)
1960 1980 2000 2020
-50
0NetExports/GDP (-33.4) and X+M/GDP ( 81.5)
0
200
1960 1980 2000 2020
0
10
20
30
40Exchange Rate per Dollar ( 31.35)
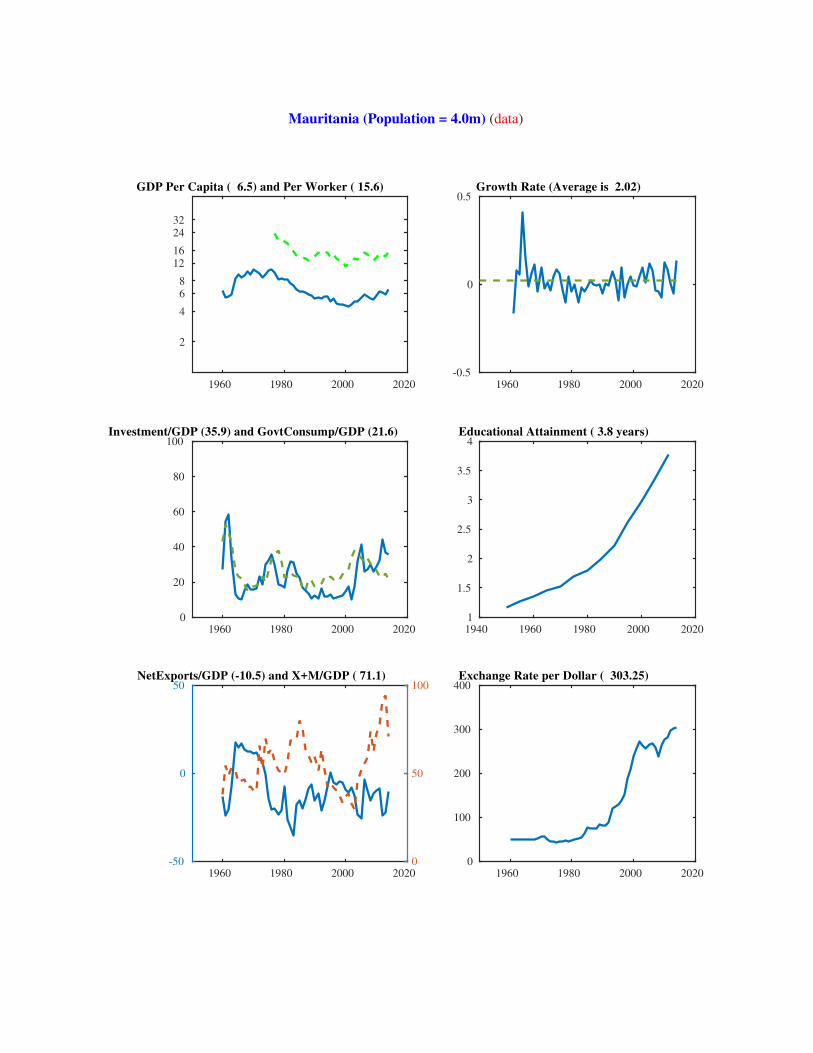
Mauritania (Population = 4.0m) (data)
1960 1980 2000 2020
2
4
6
8
12
16
24
32
GDP Per Capita ( 6.5) and Per Worker ( 15.6)
1960 1980 2000 2020
-0.5
0
0.5Growth Rate (Average is 2.02)
1960 1980 2000 2020
0
20
40
60
80
100Investment/GDP (35.9) and GovtConsump/GDP (21.6)
1940 1960 1980 2000 2020
1
1.5
2
2.5
3
3.5
4Educational Attainment ( 3.8 years)
1960 1980 2000 2020
-50
0
50NetExports/GDP (-10.5) and X+M/GDP ( 71.1)
0
50
100
1960 1980 2000 2020
0
100
200
300
400Exchange Rate per Dollar ( 303.25)

Montserrat (Population = 0.0m) (data)
1960 1980 2000 2020
24
32
40
50
60
70
80
90
GDP Per Capita ( 33.9) and Per Worker ( 53.6)
1960 1980 2000 2020
-0.5
0
0.5Growth Rate (Average is 1.25)
1960 1980 2000 2020
0
20
40
60
80
100Investment/GDP (27.5) and GovtConsump/GDP (70.9)
0 0.2 0.4 0.6 0.8 1
0
0.2
0.4
0.6
0.8
1Educational Attainment ( NaN years)
1960 1980 2000 2020
-100
-50
0
50
100NetExports/GDP (-90.8) and X+M/GDP ( 89.9)
0
50
100
150
200
1960 1980 2000 2020
1
1.5
2
2.5
3Exchange Rate per Dollar ( 2.70)

Mauritius (Population = 1.3m) (data)
1960 1980 2000 2020
12
16
24
32
40
50
GDP Per Capita ( 35.0) and Per Worker ( 36.3)
1960 1980 2000 2020
-0.5
0
0.5Growth Rate (Average is 2.22)
1960 1980 2000 2020
0
10
20
30
40Investment/GDP (26.5) and GovtConsump/GDP (17.6)
1940 1960 1980 2000 2020
2
4
6
8
10Educational Attainment ( 8.2 years)
1960 1980 2000 2020
-50
0
50NetExports/GDP (-8.6) and X+M/GDP ( 54.8)
0
50
100
1960 1980 2000 2020
0
10
20
30
40Exchange Rate per Dollar ( 30.62)
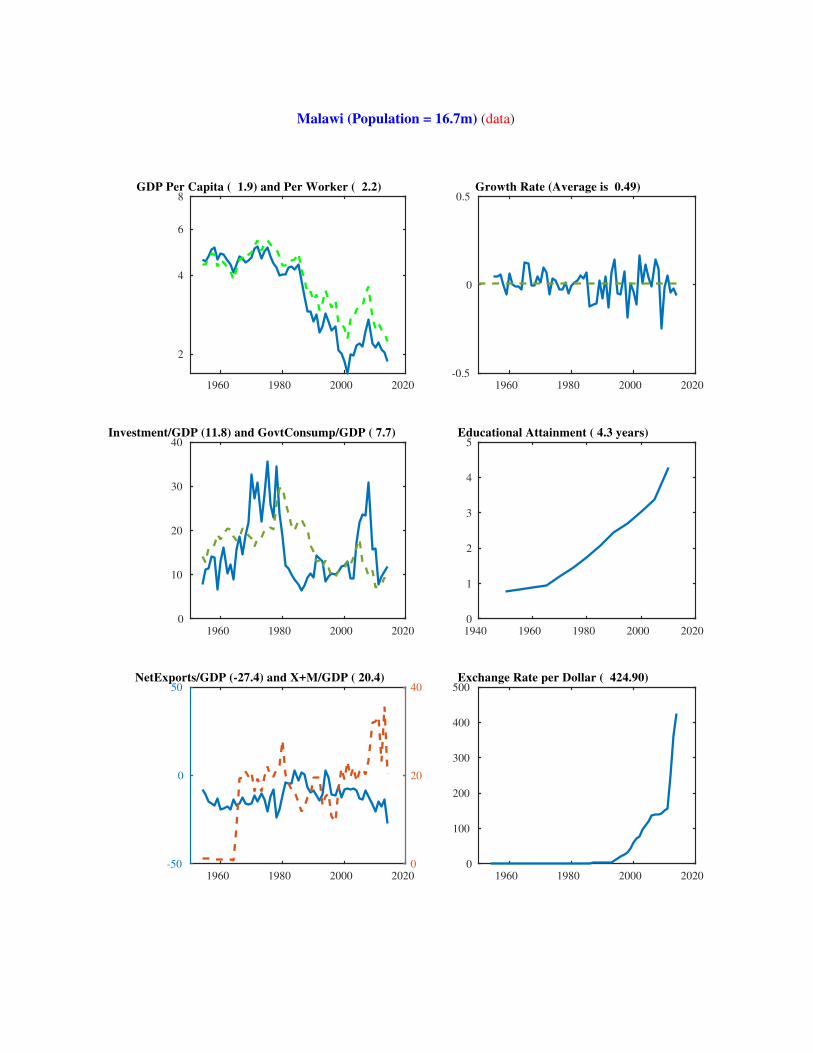
Malawi (Population = 16.7m) (data)
1960 1980 2000 2020
2
4
6
8GDP Per Capita ( 1.9) and Per Worker ( 2.2)
1960 1980 2000 2020
-0.5
0
0.5Growth Rate (Average is 0.49)
1960 1980 2000 2020
0
10
20
30
40Investment/GDP (11.8) and GovtConsump/GDP ( 7.7)
1940 1960 1980 2000 2020
0
1
2
3
4
5Educational Attainment ( 4.3 years)
1960 1980 2000 2020
-50
0
50NetExports/GDP (-27.4) and X+M/GDP ( 20.4)
0
20
40
1960 1980 2000 2020
0
100
200
300
400
500Exchange Rate per Dollar ( 424.90)
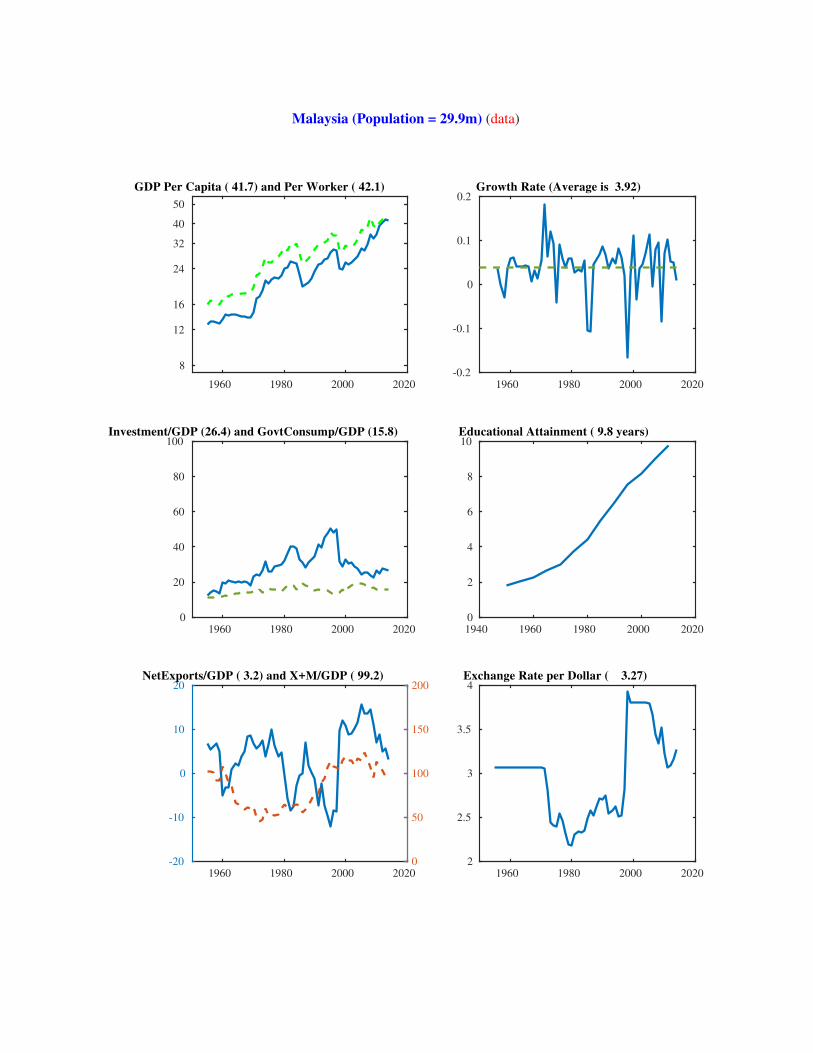
Malaysia (Population = 29.9m) (data)
1960 1980 2000 2020
8
12
16
24
32
40
50
GDP Per Capita ( 41.7) and Per Worker ( 42.1)
1960 1980 2000 2020
-0.2
-0.1
0
0.1
0.2Growth Rate (Average is 3.92)
1960 1980 2000 2020
0
20
40
60
80
100Investment/GDP (26.4) and GovtConsump/GDP (15.8)
1940 1960 1980 2000 2020
0
2
4
6
8
10Educational Attainment ( 9.8 years)
1960 1980 2000 2020
-20
-10
0
10
20NetExports/GDP ( 3.2) and X+M/GDP ( 99.2)
0
50
100
150
200
1960 1980 2000 2020
2
2.5
3
3.5
4Exchange Rate per Dollar ( 3.27)

Namibia (Population = 2.4m) (data)
1960 1980 2000 2020
8
12
16
24
32
40
GDP Per Capita ( 21.6) and Per Worker ( 36.9)
1960 1980 2000 2020
-0.2
-0.1
0
0.1
0.2Growth Rate (Average is 2.10)
1960 1980 2000 2020
0
10
20
30
40
50Investment/GDP (35.8) and GovtConsump/GDP (18.4)
1940 1960 1980 2000 2020
2
3
4
5
6
7Educational Attainment ( 6.2 years)
1960 1980 2000 2020
-50
0
50NetExports/GDP (-17.2) and X+M/GDP ( 63.1)
0
100
200
1960 1980 2000 2020
0
5
10
15
20Exchange Rate per Dollar ( 10.85)

Niger (Population = 19.1m) (data)
1960 1980 2000 2020
2
4
6
8
12
GDP Per Capita ( 1.7) and Per Worker ( 2.2)
1960 1980 2000 2020
-0.5
0
0.5Growth Rate (Average is -0.85)
1960 1980 2000 2020
0
10
20
30
40Investment/GDP (30.9) and GovtConsump/GDP (16.1)
1940 1960 1980 2000 2020
0
0.5
1
1.5Educational Attainment ( 1.4 years)
1960 1980 2000 2020
-50
0
50NetExports/GDP (-17.1) and X+M/GDP ( 27.3)
0
20
40
1960 1980 2000 2020
0
200
400
600
800
1000Exchange Rate per Dollar ( 494.41)

Nigeria (Population = 177.5m) (data)
1960 1980 2000 2020
1
2
4
6
8
12
16
24
32
GDP Per Capita ( 10.7) and Per Worker ( 15.6)
1960 1980 2000 2020
-2
-1
0
1
2Growth Rate (Average is 1.15)
1960 1980 2000 2020
0
20
40
60
80
100Investment/GDP (14.5) and GovtConsump/GDP ( 8.1)
0 0.2 0.4 0.6 0.8 1
0
0.2
0.4
0.6
0.8
1Educational Attainment ( NaN years)
1960 1980 2000 2020
-50
0
50NetExports/GDP ( 6.1) and X+M/GDP ( 21.0)
0
50
100
1960 1980 2000 2020
0
50
100
150
200Exchange Rate per Dollar ( 158.55)

Nicaragua (Population = 6.0m) (data)
1960 1980 2000 2020
6
8
12
16
24
32
GDP Per Capita ( 8.7) and Per Worker ( 9.7)
1960 1980 2000 2020
-0.5
0
0.5Growth Rate (Average is 0.50)
1960 1980 2000 2020
-50
0
50Investment/GDP (17.8) and GovtConsump/GDP (14.6)
1940 1960 1980 2000 2020
1
2
3
4
5
6Educational Attainment ( 6.0 years)
1960 1980 2000 2020
-50
0
50NetExports/GDP (-15.3) and X+M/GDP ( 67.5)
0
50
100
1960 1980 2000 2020
0
10
20
30
40Exchange Rate per Dollar ( 25.96)
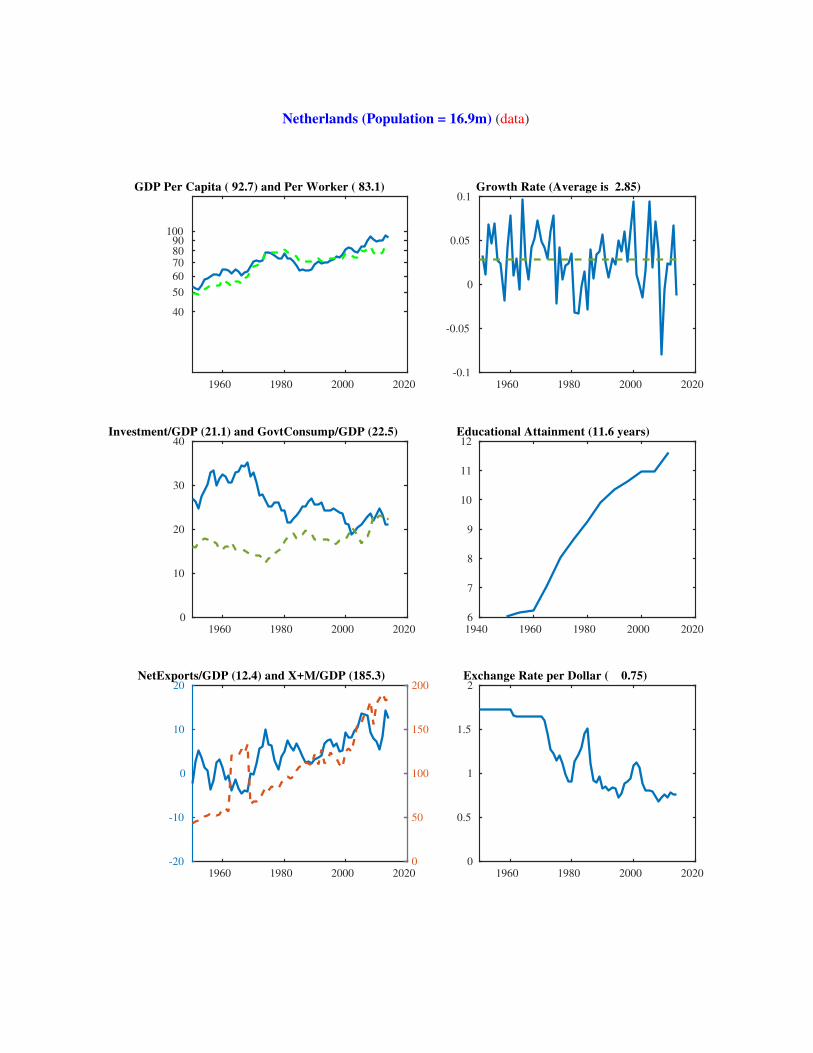
Netherlands (Population = 16.9m) (data)
1960 1980 2000 2020
40
50
60
70
80
90100
GDP Per Capita ( 92.7) and Per Worker ( 83.1)
1960 1980 2000 2020
-0.1
-0.05
0
0.05
0.1Growth Rate (Average is 2.85)
1960 1980 2000 2020
0
10
20
30
40Investment/GDP (21.1) and GovtConsump/GDP (22.5)
1940 1960 1980 2000 2020
6
7
8
9
10
11
12Educational Attainment (11.6 years)
1960 1980 2000 2020
-20
-10
0
10
20NetExports/GDP (12.4) and X+M/GDP (185.3)
0
50
100
150
200
1960 1980 2000 2020
0
0.5
1
1.5
2Exchange Rate per Dollar ( 0.75)

Norway (Population = 5.1m) (data)
1960 1980 2000 2020
50 60 70 80 90
100120
GDP Per Capita (150.7) and Per Worker (131.2)
1960 1980 2000 2020
-0.5
0
0.5Growth Rate (Average is 3.36)
1960 1980 2000 2020
0
10
20
30
40
50Investment/GDP (27.3) and GovtConsump/GDP (14.1)
1940 1960 1980 2000 2020
7
8
9
10
11
12
13Educational Attainment (11.8 years)
1960 1980 2000 2020
-50
0
50NetExports/GDP (24.1) and X+M/GDP ( 85.4)
0
100
200
1960 1980 2000 2020
0
2
4
6
8
10Exchange Rate per Dollar ( 6.30)

Nepal (Population = 28.2m) (data)
1960 1980 2000 2020
1
2
4
6
8GDP Per Capita ( 5.0) and Per Worker ( 4.4)
1960 1980 2000 2020
-0.2
-0.1
0
0.1
0.2Growth Rate (Average is 2.42)
1960 1980 2000 2020
0
10
20
30
40Investment/GDP (28.1) and GovtConsump/GDP ( 8.7)
1940 1960 1980 2000 2020
0
1
2
3
4Educational Attainment ( 3.3 years)
1960 1980 2000 2020
-20
-10
0
10
20NetExports/GDP (-8.3) and X+M/GDP ( 15.1)
0
5
10
15
20
1960 1980 2000 2020
0
20
40
60
80
100Exchange Rate per Dollar ( 99.63)

New Zealand (Population = 4.5m) (data)
1960 1980 2000 2020
40
50
60
70
80
GDP Per Capita ( 65.6) and Per Worker ( 57.9)
1960 1980 2000 2020
-0.2
-0.1
0
0.1
0.2Growth Rate (Average is 1.78)
1960 1980 2000 2020
0
10
20
30
40Investment/GDP (22.1) and GovtConsump/GDP (19.6)
1940 1960 1980 2000 2020
8
9
10
11
12Educational Attainment (11.3 years)
1960 1980 2000 2020
-20
0
20NetExports/GDP (-1.6) and X+M/GDP ( 76.0)
0
50
100
1960 1980 2000 2020
0
1
2
3
4Exchange Rate per Dollar ( 1.21)

Oman (Population = 4.2m) (data)
1960 1980 2000 2020
16
24
32
40
50
60
70
80 90
100
120
GDP Per Capita ( 73.2) and Per Worker ( 71.8)
1960 1980 2000 2020
-0.5
0
0.5Growth Rate (Average is 4.09)
1960 1980 2000 2020
0
10
20
30
40
50Investment/GDP (29.6) and GovtConsump/GDP (18.4)
0 0.2 0.4 0.6 0.8 1
0
0.2
0.4
0.6
0.8
1Educational Attainment ( NaN years)
1960 1980 2000 2020
-50
0
50NetExports/GDP (19.8) and X+M/GDP ( 79.1)
60
80
100
1960 1980 2000 2020
0.3
0.35
0.4
0.45
0.5Exchange Rate per Dollar ( 0.38)

Pakistan (Population = 185.0m) (data)
1960 1980 2000 2020
4
6
8
12
16
GDP Per Capita ( 9.3) and Per Worker ( 14.3)
1960 1980 2000 2020
-0.1
-0.05
0
0.05
0.1Growth Rate (Average is 2.08)
1960 1980 2000 2020
0
10
20
30
40Investment/GDP ( 9.3) and GovtConsump/GDP (12.7)
1940 1960 1980 2000 2020
0
1
2
3
4
5Educational Attainment ( 4.5 years)
1960 1980 2000 2020
-20
-10
0
10
20NetExports/GDP (-3.0) and X+M/GDP ( 13.0)
0
5
10
15
20
1960 1980 2000 2020
0
50
100
150
200Exchange Rate per Dollar ( 101.10)

Panama (Population = 3.9m) (data)
1960 1980 2000 2020
8
12
16
24
32
40
50
GDP Per Capita ( 38.7) and Per Worker ( 39.8)
1960 1980 2000 2020
-0.2
-0.1
0
0.1
0.2Growth Rate (Average is 3.64)
1960 1980 2000 2020
0
10
20
30
40Investment/GDP (35.9) and GovtConsump/GDP (11.1)
1940 1960 1980 2000 2020
2
4
6
8
10Educational Attainment ( 9.2 years)
1960 1980 2000 2020
-50
0
50NetExports/GDP ( 1.7) and X+M/GDP ( 27.4)
0
50
100
1960 1980 2000 2020
0.999999999
0.9999999992
0.9999999994
0.9999999996
0.9999999998
1Exchange Rate per Dollar ( 1.00)

Peru (Population = 31.0m) (data)
1960 1980 2000 2020
8
12
16
24
GDP Per Capita ( 21.0) and Per Worker ( 20.6)
1960 1980 2000 2020
-0.5
0
0.5Growth Rate (Average is 2.63)
1960 1980 2000 2020
0
10
20
30
40Investment/GDP (22.9) and GovtConsump/GDP (12.9)
1940 1960 1980 2000 2020
2
4
6
8
10Educational Attainment ( 8.7 years)
1960 1980 2000 2020
-10
-5
0
5
10NetExports/GDP (-2.2) and X+M/GDP ( 33.8)
0
10
20
30
40
1960 1980 2000 2020
0
1
2
3
4Exchange Rate per Dollar ( 2.84)
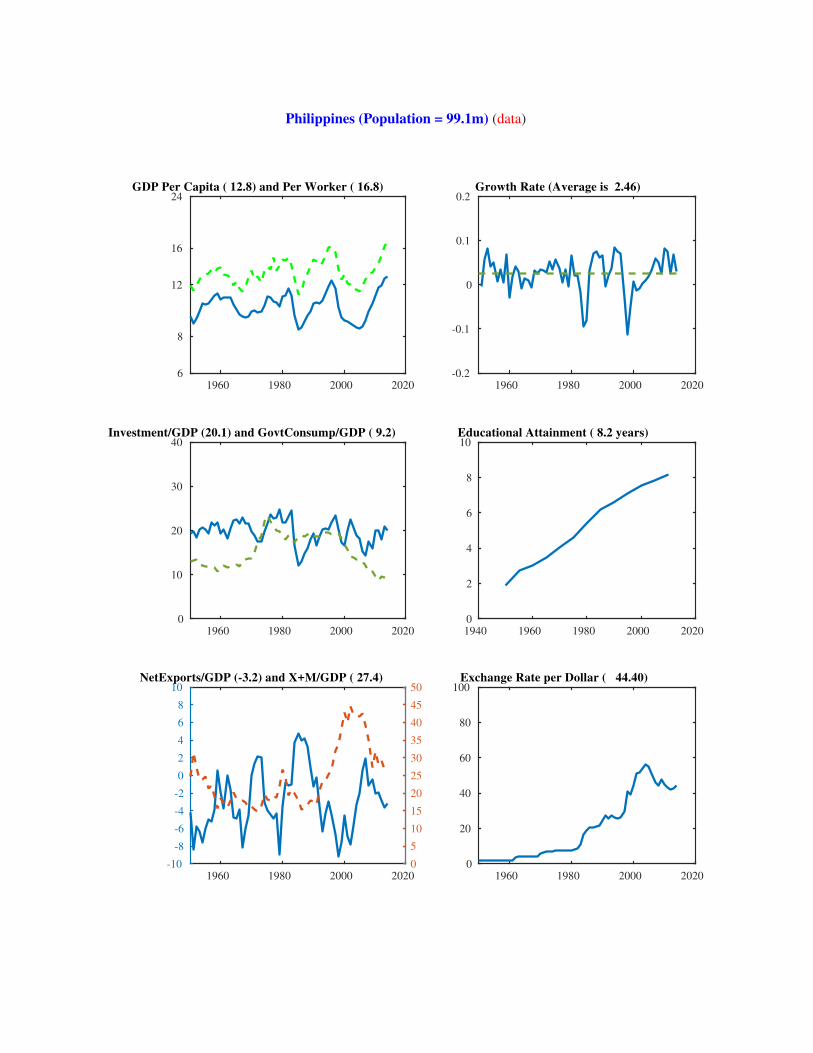
Philippines (Population = 99.1m) (data)
1960 1980 2000 2020
6
8
12
16
24GDP Per Capita ( 12.8) and Per Worker ( 16.8)
1960 1980 2000 2020
-0.2
-0.1
0
0.1
0.2Growth Rate (Average is 2.46)
1960 1980 2000 2020
0
10
20
30
40Investment/GDP (20.1) and GovtConsump/GDP ( 9.2)
1940 1960 1980 2000 2020
0
2
4
6
8
10Educational Attainment ( 8.2 years)
1960 1980 2000 2020
-10
-8
-6
-4
-2
0
2
4
6
8
10NetExports/GDP (-3.2) and X+M/GDP ( 27.4)
0
5
10
15
20
25
30
35
40
45
50
1960 1980 2000 2020
0
20
40
60
80
100Exchange Rate per Dollar ( 44.40)

Poland (Population = 38.6m) (data)
1960 1980 2000 2020
16
24
32
40
50
60GDP Per Capita ( 47.1) and Per Worker ( 53.3)
1960 1980 2000 2020
-0.2
-0.1
0
0.1
0.2Growth Rate (Average is 3.56)
1960 1980 2000 2020
10
15
20
25
30Investment/GDP (16.7) and GovtConsump/GDP (23.3)
1940 1960 1980 2000 2020
4
6
8
10
12Educational Attainment (11.4 years)
1960 1980 2000 2020
-10
0
10NetExports/GDP (-1.8) and X+M/GDP ( 64.2)
0
50
100
1960 1980 2000 2020
0
1
2
3
4
5Exchange Rate per Dollar ( 3.15)

Portugal (Population = 10.4m) (data)
1960 1980 2000 2020
16
24
32405060
GDP Per Capita ( 52.1) and Per Worker ( 58.0)
1960 1980 2000 2020
-0.2
-0.1
0
0.1
0.2Growth Rate (Average is 3.62)
1960 1980 2000 2020
0
10
20
30
40Investment/GDP (19.5) and GovtConsump/GDP (20.5)
1940 1960 1980 2000 2020
0
2
4
6
8Educational Attainment ( 7.2 years)
1960 1980 2000 2020
-20
0
20NetExports/GDP (-5.5) and X+M/GDP ( 74.0)
0
50
100
1960 1980 2000 2020
0
0.5
1
1.5
2Exchange Rate per Dollar ( 0.75)
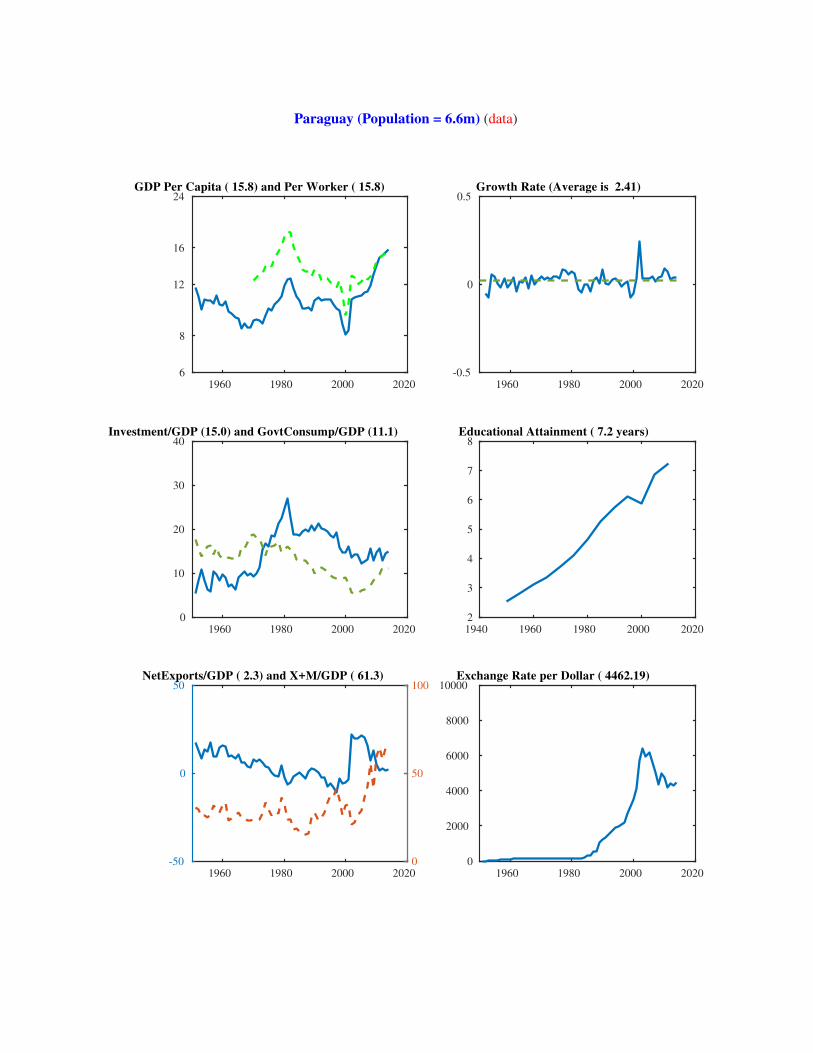
Paraguay (Population = 6.6m) (data)
1960 1980 2000 2020
6
8
12
16
24GDP Per Capita ( 15.8) and Per Worker ( 15.8)
1960 1980 2000 2020
-0.5
0
0.5Growth Rate (Average is 2.41)
1960 1980 2000 2020
0
10
20
30
40Investment/GDP (15.0) and GovtConsump/GDP (11.1)
1940 1960 1980 2000 2020
2
3
4
5
6
7
8Educational Attainment ( 7.2 years)
1960 1980 2000 2020
-50
0
50NetExports/GDP ( 2.3) and X+M/GDP ( 61.3)
0
50
100
1960 1980 2000 2020
0
2000
4000
6000
8000
10000Exchange Rate per Dollar ( 4462.19)
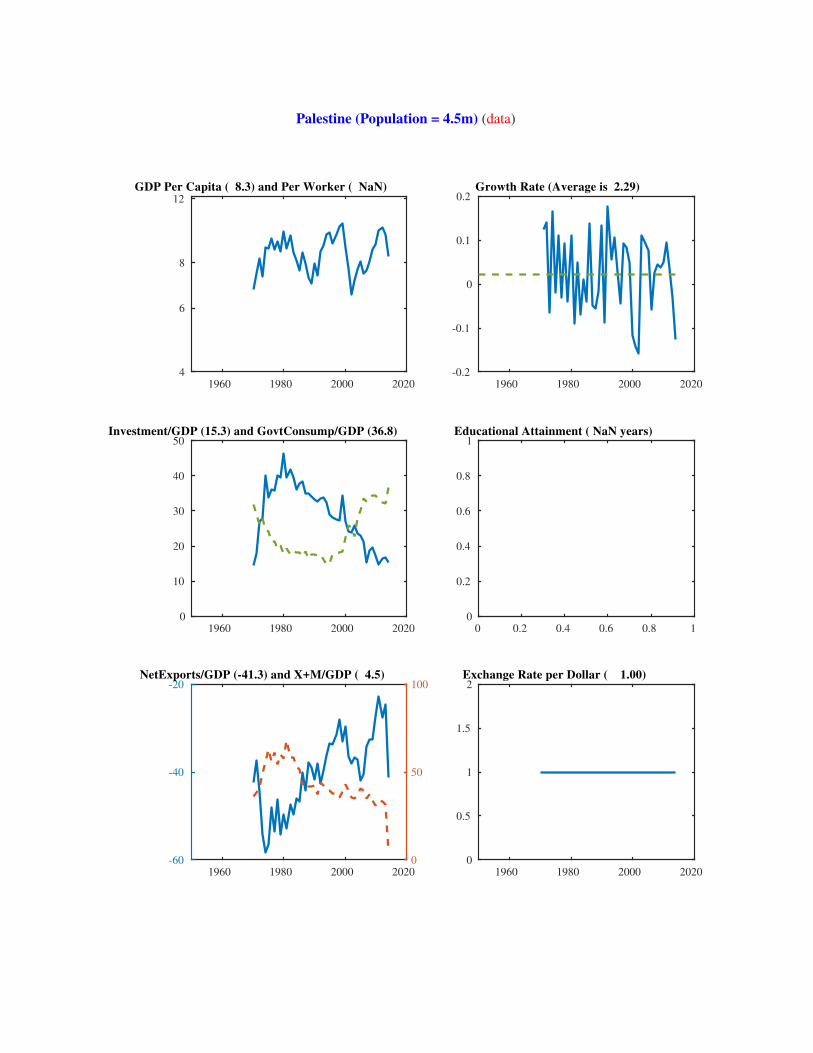
Palestine (Population = 4.5m) (data)
1960 1980 2000 2020
4
6
8
12
GDP Per Capita ( 8.3) and Per Worker ( NaN)
1960 1980 2000 2020
-0.2
-0.1
0
0.1
0.2Growth Rate (Average is 2.29)
1960 1980 2000 2020
0
10
20
30
40
50Investment/GDP (15.3) and GovtConsump/GDP (36.8)
0 0.2 0.4 0.6 0.8 1
0
0.2
0.4
0.6
0.8
1Educational Attainment ( NaN years)
1960 1980 2000 2020
-60
-40
-20NetExports/GDP (-41.3) and X+M/GDP ( 4.5)
0
50
100
1960 1980 2000 2020
0
0.5
1
1.5
2Exchange Rate per Dollar ( 1.00)

Qatar (Population = 2.2m) (data)
1960 1980 2000 2020
50
60
70
80 90
100
120
GDP Per Capita (292.1) and Per Worker (182.1)
1960 1980 2000 2020
-0.5
0
0.5Growth Rate (Average is 1.11)
1960 1980 2000 2020
0
20
40
60
80
100Investment/GDP (41.2) and GovtConsump/GDP ( 7.3)
1940 1960 1980 2000 2020
0
2
4
6
8
10Educational Attainment ( 8.4 years)
1960 1980 2000 2020
0
50
100NetExports/GDP (40.0) and X+M/GDP ( 99.1)
50
100
150
1960 1980 2000 2020
3
3.5
4
4.5
5Exchange Rate per Dollar ( 3.64)
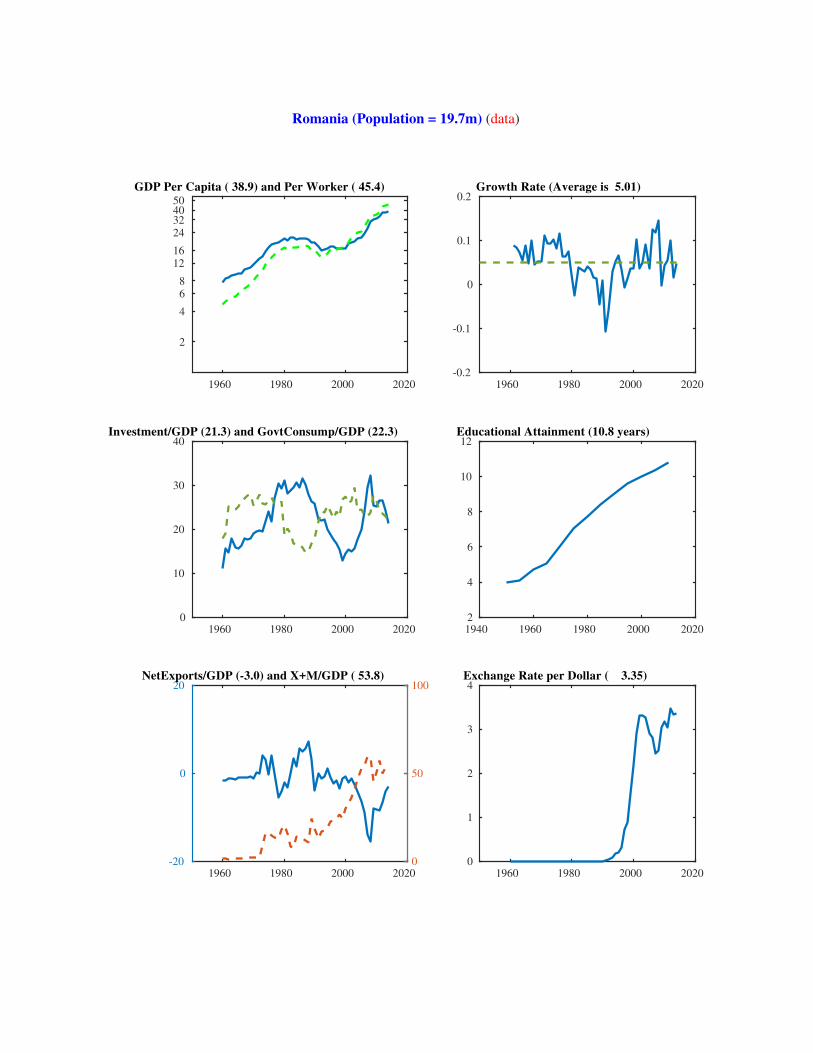
Romania (Population = 19.7m) (data)
1960 1980 2000 2020
2
4
6
8
12
16
24
324050
GDP Per Capita ( 38.9) and Per Worker ( 45.4)
1960 1980 2000 2020
-0.2
-0.1
0
0.1
0.2Growth Rate (Average is 5.01)
1960 1980 2000 2020
0
10
20
30
40Investment/GDP (21.3) and GovtConsump/GDP (22.3)
1940 1960 1980 2000 2020
2
4
6
8
10
12Educational Attainment (10.8 years)
1960 1980 2000 2020
-20
0
20NetExports/GDP (-3.0) and X+M/GDP ( 53.8)
0
50
100
1960 1980 2000 2020
0
1
2
3
4Exchange Rate per Dollar ( 3.35)
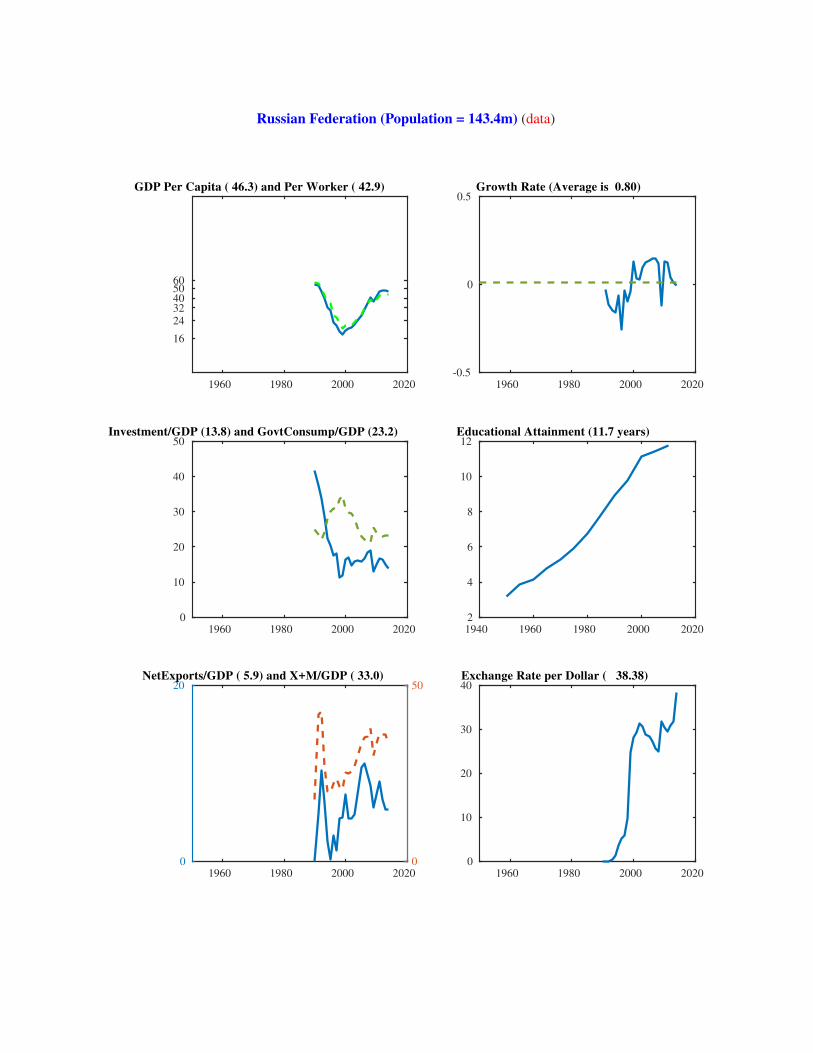
Russian Federation (Population = 143.4m) (data)
1960 1980 2000 2020
16
24
32405060
GDP Per Capita ( 46.3) and Per Worker ( 42.9)
1960 1980 2000 2020
-0.5
0
0.5Growth Rate (Average is 0.80)
1960 1980 2000 2020
0
10
20
30
40
50Investment/GDP (13.8) and GovtConsump/GDP (23.2)
1940 1960 1980 2000 2020
2
4
6
8
10
12Educational Attainment (11.7 years)
1960 1980 2000 2020
0
20NetExports/GDP ( 5.9) and X+M/GDP ( 33.0)
0
50
1960 1980 2000 2020
0
10
20
30
40Exchange Rate per Dollar ( 38.38)

Rwanda (Population = 11.3m) (data)
1960 1980 2000 2020
2
4
6
8GDP Per Capita ( 3.2) and Per Worker ( 3.0)
1960 1980 2000 2020
-1
-0.5
0
0.5
1Growth Rate (Average is 0.99)
1960 1980 2000 2020
0
10
20
30
40Investment/GDP (20.5) and GovtConsump/GDP ( 9.8)
1940 1960 1980 2000 2020
0
1
2
3
4Educational Attainment ( 3.5 years)
1960 1980 2000 2020
-100
-50
0
50
100NetExports/GDP (-11.5) and X+M/GDP ( 21.3)
0
10
20
30
40
1960 1980 2000 2020
0
200
400
600
800
1000Exchange Rate per Dollar ( 681.86)
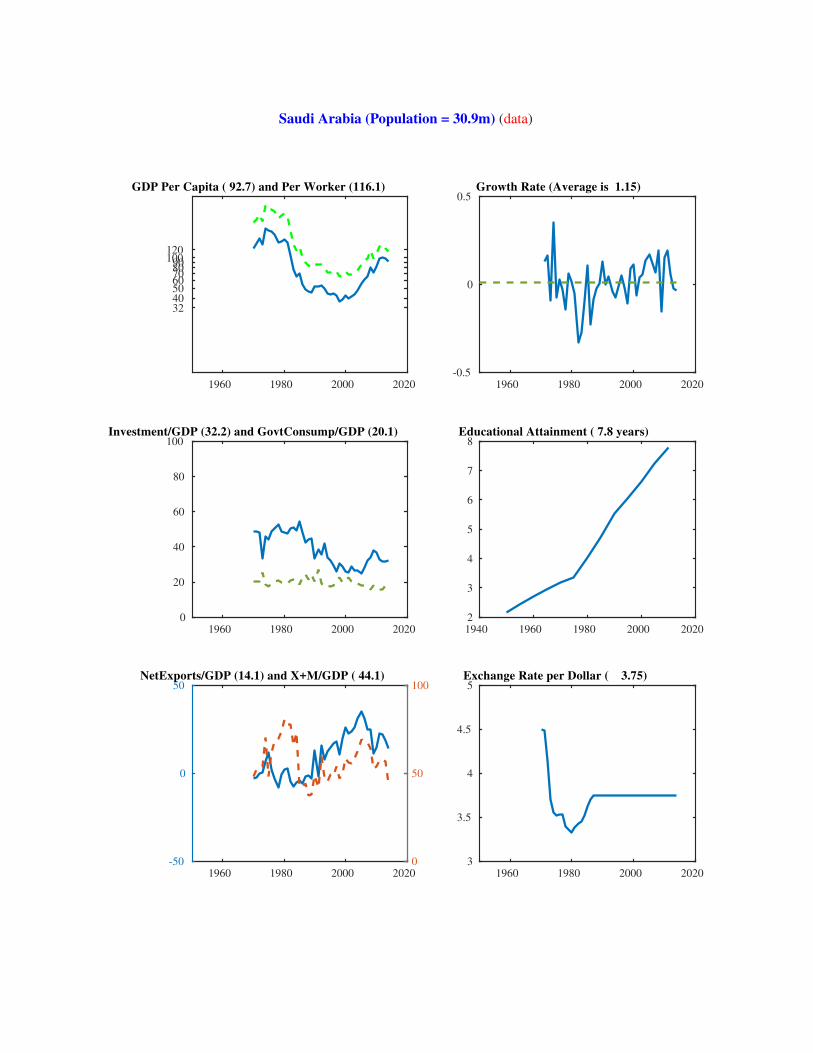
Saudi Arabia (Population = 30.9m) (data)
1960 1980 2000 2020
32 40 50 60 70 80 90
100120
GDP Per Capita ( 92.7) and Per Worker (116.1)
1960 1980 2000 2020
-0.5
0
0.5Growth Rate (Average is 1.15)
1960 1980 2000 2020
0
20
40
60
80
100Investment/GDP (32.2) and GovtConsump/GDP (20.1)
1940 1960 1980 2000 2020
2
3
4
5
6
7
8Educational Attainment ( 7.8 years)
1960 1980 2000 2020
-50
0
50NetExports/GDP (14.1) and X+M/GDP ( 44.1)
0
50
100
1960 1980 2000 2020
3
3.5
4
4.5
5Exchange Rate per Dollar ( 3.75)

Sudan (Population = 50.3m) (data)
1960 1980 2000 2020
2
4
6
8
12
16
GDP Per Capita ( 7.2) and Per Worker ( 13.6)
1960 1980 2000 2020
-0.2
-0.1
0
0.1
0.2Growth Rate (Average is 2.14)
1960 1980 2000 2020
0
10
20
30
40Investment/GDP (13.4) and GovtConsump/GDP (18.5)
1940 1960 1980 2000 2020
0
1
2
3
4Educational Attainment ( 3.1 years)
1960 1980 2000 2020
-10
0
10NetExports/GDP ( 7.0) and X+M/GDP ( 54.8)
0
50
100
1960 1980 2000 2020
0
2
4
6
8
10Exchange Rate per Dollar ( 5.74)
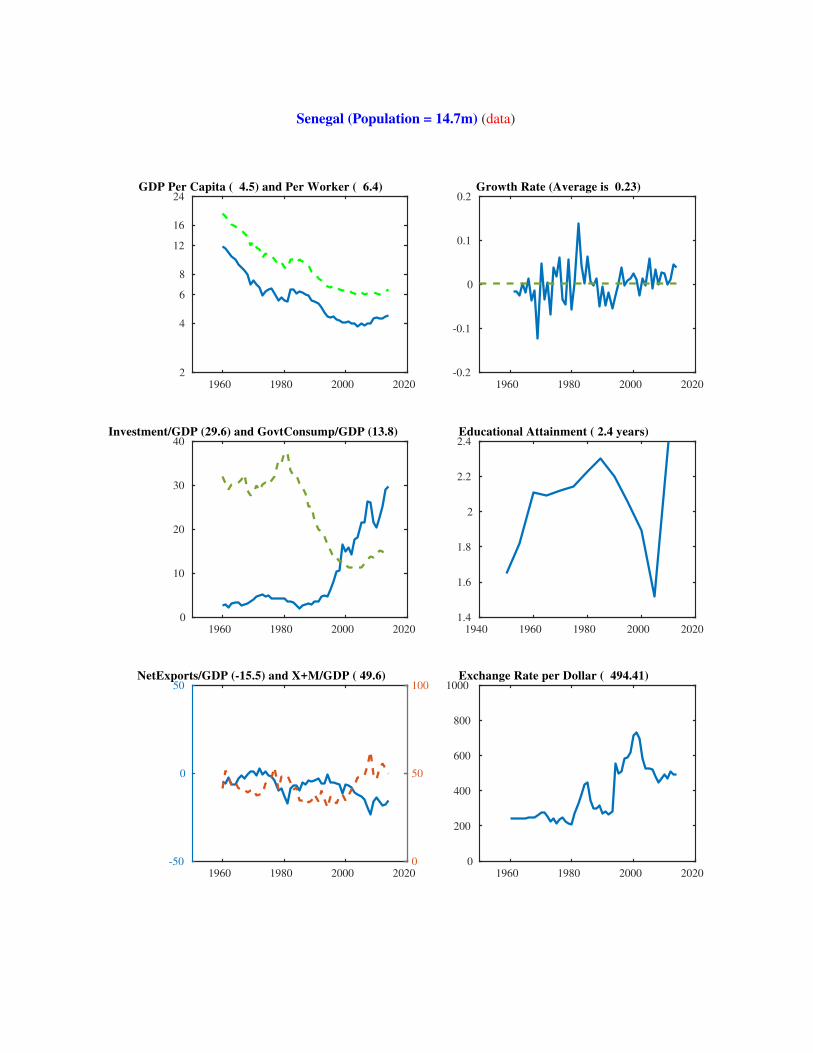
Senegal (Population = 14.7m) (data)
1960 1980 2000 2020
2
4
6
8
12
16
24GDP Per Capita ( 4.5) and Per Worker ( 6.4)
1960 1980 2000 2020
-0.2
-0.1
0
0.1
0.2Growth Rate (Average is 0.23)
1960 1980 2000 2020
0
10
20
30
40Investment/GDP (29.6) and GovtConsump/GDP (13.8)
1940 1960 1980 2000 2020
1.4
1.6
1.8
2
2.2
2.4Educational Attainment ( 2.4 years)
1960 1980 2000 2020
-50
0
50NetExports/GDP (-15.5) and X+M/GDP ( 49.6)
0
50
100
1960 1980 2000 2020
0
200
400
600
800
1000Exchange Rate per Dollar ( 494.41)

Singapore (Population = 5.5m) (data)
1960 1980 2000 2020
12
16
24
32 40 50 60 70 80 90
100120
GDP Per Capita (128.0) and Per Worker ( 96.2)
1960 1980 2000 2020
-0.5
0
0.5Growth Rate (Average is 5.97)
1960 1980 2000 2020
0
20
40
60
80
100Investment/GDP (36.6) and GovtConsump/GDP (10.0)
1940 1960 1980 2000 2020
2
4
6
8
10
12Educational Attainment (10.6 years)
1960 1980 2000 2020
-100
0
100NetExports/GDP (19.4) and X+M/GDP (282.8)
0
500
1000
1960 1980 2000 2020
0
1
2
3
4Exchange Rate per Dollar ( 1.27)

Sierra Leone (Population = 6.3m) (data)
1960 1980 2000 2020
1
2
4
6
8GDP Per Capita ( 2.6) and Per Worker ( 3.3)
1960 1980 2000 2020
-0.5
0
0.5Growth Rate (Average is 0.83)
1960 1980 2000 2020
0
10
20
30
40Investment/GDP (18.0) and GovtConsump/GDP (17.0)
1940 1960 1980 2000 2020
0
1
2
3
4Educational Attainment ( 3.1 years)
1960 1980 2000 2020
-50
0
50NetExports/GDP (-4.4) and X+M/GDP ( 69.2)
0
100
200
1960 1980 2000 2020
0
1000
2000
3000
4000
5000Exchange Rate per Dollar ( 4524.16)

El Salvador (Population = 6.1m) (data)
1960 1980 2000 2020
1
2
4
6
8
12
16
24
GDP Per Capita ( 15.4) and Per Worker ( 16.9)
1960 1980 2000 2020
-0.5
0
0.5Growth Rate (Average is 4.08)
1960 1980 2000 2020
0
10
20
30
40Investment/GDP (11.1) and GovtConsump/GDP (11.1)
1940 1960 1980 2000 2020
0
2
4
6
8Educational Attainment ( 7.7 years)
1960 1980 2000 2020
-50
0
50NetExports/GDP (-15.8) and X+M/GDP ( 54.0)
0
100
200
1960 1980 2000 2020
0
0.5
1
1.5
2Exchange Rate per Dollar ( 1.00)

Serbia (Population = 7.1m) (data)
1960 1980 2000 2020
6
8
12
16
24
32
40
50
GDP Per Capita ( 26.0) and Per Worker ( 45.9)
1960 1980 2000 2020
-0.5
0
0.5Growth Rate (Average is 2.51)
1960 1980 2000 2020
0
10
20
30
40Investment/GDP (12.7) and GovtConsump/GDP (28.7)
0 0.2 0.4 0.6 0.8 1
0
0.2
0.4
0.6
0.8
1Educational Attainment ( NaN years)
1960 1980 2000 2020
-40
-20
0NetExports/GDP (-9.8) and X+M/GDP ( 55.3)
0
50
100
1960 1980 2000 2020
0
20
40
60
80
100Exchange Rate per Dollar ( 88.41)

Sao Tome and Principe (Population = 0.2m) (data)
1960 1980 2000 2020
2
4
6
8
12
16
24GDP Per Capita ( 6.7) and Per Worker ( 10.5)
1960 1980 2000 2020
-0.5
0
0.5Growth Rate (Average is 1.03)
1960 1980 2000 2020
0
10
20
30
40
50Investment/GDP (39.8) and GovtConsump/GDP (24.9)
0 0.2 0.4 0.6 0.8 1
0
0.2
0.4
0.6
0.8
1Educational Attainment ( NaN years)
1960 1980 2000 2020
-100
0
100NetExports/GDP (-27.7) and X+M/GDP ( 42.8)
0
50
100
1960 1980 2000 2020
0
0.5
1
1.5
210
4Exchange Rate per Dollar (18466.40)

Suriname (Population = 0.5m) (data)
1960 1980 2000 2020
8
12
16
24
32
40
50
GDP Per Capita ( 28.3) and Per Worker ( 35.6)
1960 1980 2000 2020
-0.2
-0.1
0
0.1
0.2Growth Rate (Average is 2.78)
1960 1980 2000 2020
0
20
40
60
80
100Investment/GDP (40.0) and GovtConsump/GDP (18.2)
0 0.2 0.4 0.6 0.8 1
0
0.2
0.4
0.6
0.8
1Educational Attainment ( NaN years)
1960 1980 2000 2020
-50
0
50NetExports/GDP ( 1.4) and X+M/GDP ( 72.9)
0
100
200
1960 1980 2000 2020
0
1
2
3
4Exchange Rate per Dollar ( 3.30)

Slovakia (Population = 5.4m) (data)
1960 1980 2000 2020
24
32
40
50
60
GDP Per Capita ( 48.1) and Per Worker ( 55.3)
1960 1980 2000 2020
-0.5
0
0.5Growth Rate (Average is 1.72)
1960 1980 2000 2020
0
10
20
30
40Investment/GDP (21.8) and GovtConsump/GDP (27.1)
1940 1960 1980 2000 2020
8
9
10
11
12
13
14Educational Attainment (13.1 years)
1960 1980 2000 2020
-20
-10
0
10
20NetExports/GDP (-9.8) and X+M/GDP (169.9)
0
50
100
150
200
1960 1980 2000 2020
0
0.5
1
1.5
2Exchange Rate per Dollar ( 0.75)

Slovenia (Population = 2.1m) (data)
1960 1980 2000 2020
32
40
50
60GDP Per Capita ( 53.6) and Per Worker ( 53.2)
1960 1980 2000 2020
-0.1
-0.05
0
0.05
0.1Growth Rate (Average is 2.04)
1960 1980 2000 2020
0
10
20
30
40Investment/GDP (24.2) and GovtConsump/GDP (21.4)
1940 1960 1980 2000 2020
4
6
8
10
12
14Educational Attainment (12.1 years)
1960 1980 2000 2020
-20
-10
0
10
20NetExports/GDP (-1.4) and X+M/GDP (152.7)
0
50
100
150
200
1960 1980 2000 2020
0
0.5
1
1.5
2Exchange Rate per Dollar ( 0.75)

Sweden (Population = 9.7m) (data)
1960 1980 2000 2020
50
60
70
80
90GDP Per Capita ( 82.0) and Per Worker ( 77.8)
1960 1980 2000 2020
-0.1
-0.05
0
0.05
0.1Growth Rate (Average is 2.38)
1960 1980 2000 2020
0
10
20
30
40Investment/GDP (27.6) and GovtConsump/GDP (23.2)
1940 1960 1980 2000 2020
6
8
10
12
14Educational Attainment (11.9 years)
1960 1980 2000 2020
-20
-10
0
10
20NetExports/GDP (-1.1) and X+M/GDP (109.7)
0
50
100
150
200
1960 1980 2000 2020
0
5
10
15
20Exchange Rate per Dollar ( 6.86)

Swaziland (Population = 1.3m) (data)
1960 1980 2000 2020
4
6
8
12
16
24
324050
GDP Per Capita ( 14.6) and Per Worker ( 28.6)
1960 1980 2000 2020
-0.5
0
0.5Growth Rate (Average is 3.10)
1960 1980 2000 2020
0
10
20
30
40
50Investment/GDP (17.4) and GovtConsump/GDP (15.8)
1940 1960 1980 2000 2020
1
2
3
4
5Educational Attainment ( 4.0 years)
1960 1980 2000 2020
-100
-50
0
50
100NetExports/GDP (-7.2) and X+M/GDP ( 57.8)
0
50
100
150
200
1960 1980 2000 2020
0
5
10
15
20Exchange Rate per Dollar ( 10.85)

Sint Maarten (Dutch part) (Population = 0.0m) (data)
1960 1980 2000 2020
16
24
32
40
50
60
70
80
GDP Per Capita ( 52.7) and Per Worker ( NaN)
1960 1980 2000 2020
-2
-1
0
1
2Growth Rate (Average is -1.24)
1960 1980 2000 2020
0
20
40
60
80
100Investment/GDP (12.2) and GovtConsump/GDP (36.1)
0 0.2 0.4 0.6 0.8 1
0
0.2
0.4
0.6
0.8
1Educational Attainment ( NaN years)
1960 1980 2000 2020
-200
-150
-100
-50
0NetExports/GDP (-18.9) and X+M/GDP (151.9)
0
100
200
300
400
1960 1980 2000 2020
0
1
2
3
4Exchange Rate per Dollar ( 1.79)

Seychelles (Population = 0.1m) (data)
1960 1980 2000 2020
24
32
40
50
60
70
GDP Per Capita ( 47.9) and Per Worker ( 47.0)
1960 1980 2000 2020
-0.5
0
0.5Growth Rate (Average is 2.64)
1960 1980 2000 2020
0
20
40
60
80
100Investment/GDP (34.3) and GovtConsump/GDP (41.2)
0 0.2 0.4 0.6 0.8 1
0
0.2
0.4
0.6
0.8
1Educational Attainment ( NaN years)
1960 1980 2000 2020
-50
0
50NetExports/GDP (-19.9) and X+M/GDP ( 76.5)
0
100
200
1960 1980 2000 2020
0
5
10
15
20Exchange Rate per Dollar ( 12.75)

Syria (Population = 18.8m) (data)
1960 1980 2000 2020
1
2
4
6
8
12
16
24
3240
GDP Per Capita ( 8.5) and Per Worker ( 15.7)
1960 1980 2000 2020
-0.5
0
0.5Growth Rate (Average is 1.21)
1960 1980 2000 2020
0
20
40
60
80
100Investment/GDP ( 8.2) and GovtConsump/GDP (40.9)
1940 1960 1980 2000 2020
0
2
4
6
8Educational Attainment ( 6.2 years)
1960 1980 2000 2020
-50
0
50NetExports/GDP ( 4.7) and X+M/GDP ( 11.3)
0
100
200
1960 1980 2000 2020
0
50
100
150
200Exchange Rate per Dollar ( 162.30)

Turks and Caicos Islands (Population = 0.0m) (data)
1960 1980 2000 2020
1
2
4
6 8
1216
2432
GDP Per Capita ( 4.6) and Per Worker ( 11.1)
1960 1980 2000 2020
-5
0
5Growth Rate (Average is 5.67)
1960 1980 2000 2020
0
500
1000
1500
2000Investment/GDP (132.4) and GovtConsump/GDP (222.9)
0 0.2 0.4 0.6 0.8 1
0
0.2
0.4
0.6
0.8
1Educational Attainment ( NaN years)
1960 1980 2000 2020
-5000
-4000
-3000
-2000
-1000
0
1000
2000
3000
4000
5000NetExports/GDP (-617.1) and X+M/GDP (757.0)
0
500
1000
1500
2000
2500
3000
3500
4000
4500
5000
1960 1980 2000 2020
0
0.5
1
1.5
2Exchange Rate per Dollar ( 1.00)

Chad (Population = 13.6m) (data)
1960 1980 2000 2020
1
2
4
6
8
12
16
GDP Per Capita ( 3.8) and Per Worker ( 5.1)
1960 1980 2000 2020
-1
-0.5
0
0.5
1Growth Rate (Average is 0.03)
1960 1980 2000 2020
0
10
20
30
40
50Investment/GDP (14.2) and GovtConsump/GDP ( 8.8)
0 0.2 0.4 0.6 0.8 1
0
0.2
0.4
0.6
0.8
1Educational Attainment ( NaN years)
1960 1980 2000 2020
-100
-80
-60
-40
-20
0
20
40
60
80
100NetExports/GDP (-2.9) and X+M/GDP ( 23.1)
0
5
10
15
20
25
30
35
40
45
50
1960 1980 2000 2020
0
200
400
600
800
1000Exchange Rate per Dollar ( 494.41)

Togo (Population = 7.1m) (data)
1960 1980 2000 2020
1
2
4
6
8
12
GDP Per Capita ( 2.8) and Per Worker ( 3.0)
1960 1980 2000 2020
-1
-0.5
0
0.5
1Growth Rate (Average is 0.66)
1960 1980 2000 2020
0
10
20
30
40Investment/GDP (17.1) and GovtConsump/GDP (17.6)
1940 1960 1980 2000 2020
0
1
2
3
4
5Educational Attainment ( 4.3 years)
1960 1980 2000 2020
-50
0
50NetExports/GDP (-12.4) and X+M/GDP ( 72.9)
0
50
100
1960 1980 2000 2020
0
200
400
600
800
1000Exchange Rate per Dollar ( 494.41)

Thailand (Population = 67.7m) (data)
1960 1980 2000 2020
2
4
6
8
12
16
24
32
GDP Per Capita ( 26.4) and Per Worker ( 21.4)
1960 1980 2000 2020
-0.5
0
0.5Growth Rate (Average is 3.95)
1960 1980 2000 2020
0
10
20
30
40
50Investment/GDP (23.5) and GovtConsump/GDP (18.5)
1940 1960 1980 2000 2020
0
2
4
6
8Educational Attainment ( 7.3 years)
1960 1980 2000 2020
-20
0
20NetExports/GDP (-3.1) and X+M/GDP ( 66.9)
0
50
100
1960 1980 2000 2020
0
10
20
30
40
50Exchange Rate per Dollar ( 32.48)

Tajikistan (Population = 8.3m) (data)
1960 1980 2000 2020
2
4
6
8
12
16
24
32
GDP Per Capita ( 6.2) and Per Worker ( 9.8)
1960 1980 2000 2020
-1
-0.5
0
0.5
1Growth Rate (Average is -3.06)
1960 1980 2000 2020
0
20
40
60
80
100Investment/GDP ( 8.1) and GovtConsump/GDP (28.3)
1940 1960 1980 2000 2020
2
4
6
8
10
12Educational Attainment (10.9 years)
1960 1980 2000 2020
-50
0
50NetExports/GDP (-17.9) and X+M/GDP ( 23.2)
0
20
40
1960 1980 2000 2020
0
1
2
3
4
5Exchange Rate per Dollar ( 4.93)

Turkmenistan (Population = 5.3m) (data)
1960 1980 2000 2020
12
16
24
32
40
50
GDP Per Capita ( 39.5) and Per Worker ( 36.4)
1960 1980 2000 2020
-0.5
0
0.5Growth Rate (Average is 2.77)
1960 1980 2000 2020
0
10
20
30
40
50Investment/GDP (29.6) and GovtConsump/GDP (35.6)
0 0.2 0.4 0.6 0.8 1
0
0.2
0.4
0.6
0.8
1Educational Attainment ( NaN years)
1960 1980 2000 2020
-50
-40
-30
-20
-10
0
10
20
30
40
50NetExports/GDP (28.4) and X+M/GDP ( 26.2)
0
5
10
15
20
25
30
35
40
45
50
1960 1980 2000 2020
0
1
2
3
4Exchange Rate per Dollar ( 2.85)

Trinidad and Tobago (Population = 1.4m) (data)
1960 1980 2000 2020
16
24
32
40
50
60
70
80 90
100
GDP Per Capita ( 60.8) and Per Worker ( 55.4)
1960 1980 2000 2020
-0.5
0
0.5Growth Rate (Average is 2.74)
1960 1980 2000 2020
0
10
20
30
40Investment/GDP (15.1) and GovtConsump/GDP (16.3)
1940 1960 1980 2000 2020
4
6
8
10
12Educational Attainment (10.4 years)
1960 1980 2000 2020
-50
0
50NetExports/GDP (12.8) and X+M/GDP ( 79.2)
0
100
200
1960 1980 2000 2020
0
2
4
6
8
10Exchange Rate per Dollar ( 6.41)

Tunisia (Population = 11.1m) (data)
1960 1980 2000 2020
6
8
12
16
24
32
40
50
GDP Per Capita ( 20.5) and Per Worker ( 30.9)
1960 1980 2000 2020
-0.5
0
0.5Growth Rate (Average is 3.44)
1960 1980 2000 2020
0
10
20
30
40Investment/GDP (20.0) and GovtConsump/GDP (24.7)
1940 1960 1980 2000 2020
0
2
4
6
8Educational Attainment ( 6.6 years)
1960 1980 2000 2020
-20
0
20NetExports/GDP (-6.9) and X+M/GDP ( 47.3)
0
50
100
1960 1980 2000 2020
0
0.5
1
1.5
2Exchange Rate per Dollar ( 1.70)

Turkey (Population = 77.5m) (data)
1960 1980 2000 2020
16
24
32405060
GDP Per Capita ( 37.9) and Per Worker ( 55.4)
1960 1980 2000 2020
-0.2
-0.1
0
0.1
0.2Growth Rate (Average is 2.91)
1960 1980 2000 2020
0
10
20
30
40
50Investment/GDP (21.2) and GovtConsump/GDP (21.0)
1940 1960 1980 2000 2020
0
2
4
6
8Educational Attainment ( 6.6 years)
1960 1980 2000 2020
-20
-10
0
10
20NetExports/GDP (-2.2) and X+M/GDP ( 36.6)
0
10
20
30
40
50
1960 1980 2000 2020
0
1
2
3
4Exchange Rate per Dollar ( 2.19)

Taiwan (Population = 23.4m) (data)
1960 1980 2000 2020
8
12
16
24
32405060708090
GDP Per Capita ( 79.9) and Per Worker ( 77.9)
1960 1980 2000 2020
-0.2
-0.1
0
0.1
0.2Growth Rate (Average is 5.16)
1960 1980 2000 2020
0
10
20
30
40Investment/GDP (22.7) and GovtConsump/GDP (14.4)
1940 1960 1980 2000 2020
2
4
6
8
10
12Educational Attainment (10.7 years)
1960 1980 2000 2020
-20
0
20NetExports/GDP ( 5.0) and X+M/GDP ( 93.1)
0
50
100
1960 1980 2000 2020
0
10
20
30
40
50Exchange Rate per Dollar ( 30.37)

Tanzania (Population = 50.4m) (data)
1960 1980 2000 2020
1
2
4
6
8
12
GDP Per Capita ( 4.5) and Per Worker ( 4.8)
1960 1980 2000 2020
-0.5
0
0.5Growth Rate (Average is 1.26)
1960 1980 2000 2020
0
20
40
60
80
100Investment/GDP (27.8) and GovtConsump/GDP (14.7)
1940 1960 1980 2000 2020
1
2
3
4
5
6Educational Attainment ( 5.1 years)
1960 1980 2000 2020
-50
0
50NetExports/GDP (-3.6) and X+M/GDP ( 22.3)
0
20
40
1960 1980 2000 2020
0
500
1000
1500
2000Exchange Rate per Dollar ( 1654.00)
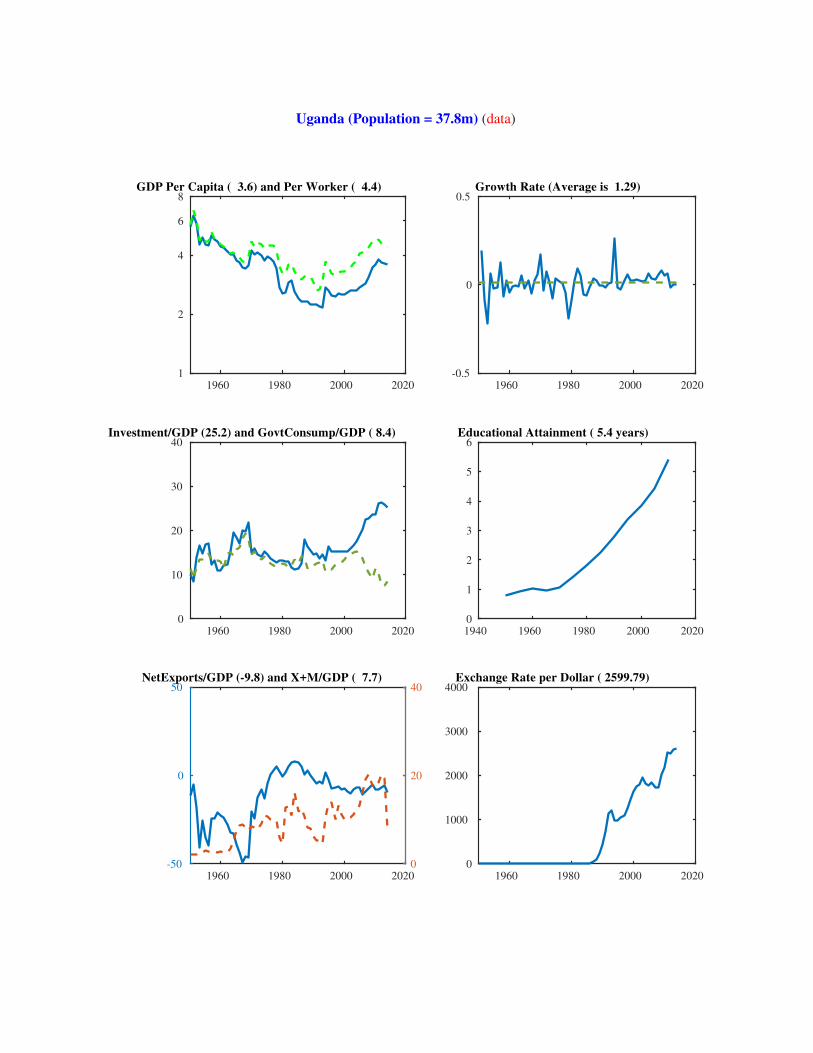
Uganda (Population = 37.8m) (data)
1960 1980 2000 2020
1
2
4
6
8GDP Per Capita ( 3.6) and Per Worker ( 4.4)
1960 1980 2000 2020
-0.5
0
0.5Growth Rate (Average is 1.29)
1960 1980 2000 2020
0
10
20
30
40Investment/GDP (25.2) and GovtConsump/GDP ( 8.4)
1940 1960 1980 2000 2020
0
1
2
3
4
5
6Educational Attainment ( 5.4 years)
1960 1980 2000 2020
-50
0
50NetExports/GDP (-9.8) and X+M/GDP ( 7.7)
0
20
40
1960 1980 2000 2020
0
1000
2000
3000
4000Exchange Rate per Dollar ( 2599.79)

Ukraine (Population = 45.0m) (data)
1960 1980 2000 2020
8
12
16
24
32
GDP Per Capita ( 19.8) and Per Worker ( 22.5)
1960 1980 2000 2020
-0.5
0
0.5Growth Rate (Average is -0.22)
1960 1980 2000 2020
0
10
20
30
40
50Investment/GDP ( 4.6) and GovtConsump/GDP (27.0)
1940 1960 1980 2000 2020
2
4
6
8
10
12Educational Attainment (11.3 years)
1960 1980 2000 2020
-10
-8
-6
-4
-2
0
2
4
6
8
10NetExports/GDP (-4.8) and X+M/GDP ( 33.1)
0
5
10
15
20
25
30
35
40
45
50
1960 1980 2000 2020
0
5
10
15
20Exchange Rate per Dollar ( 11.89)

Uruguay (Population = 3.4m) (data)
1960 1980 2000 2020
16
24
32
40
50
60GDP Per Capita ( 38.1) and Per Worker ( 36.5)
1960 1980 2000 2020
-0.2
-0.1
0
0.1
0.2Growth Rate (Average is 1.89)
1960 1980 2000 2020
0
10
20
30
40Investment/GDP (23.6) and GovtConsump/GDP (12.5)
1940 1960 1980 2000 2020
4
5
6
7
8
9Educational Attainment ( 8.1 years)
1960 1980 2000 2020
-30
-20
-10
0
10
20NetExports/GDP (-5.7) and X+M/GDP ( 44.0)
0
20
40
60
80
100
1960 1980 2000 2020
0
10
20
30
40Exchange Rate per Dollar ( 23.25)
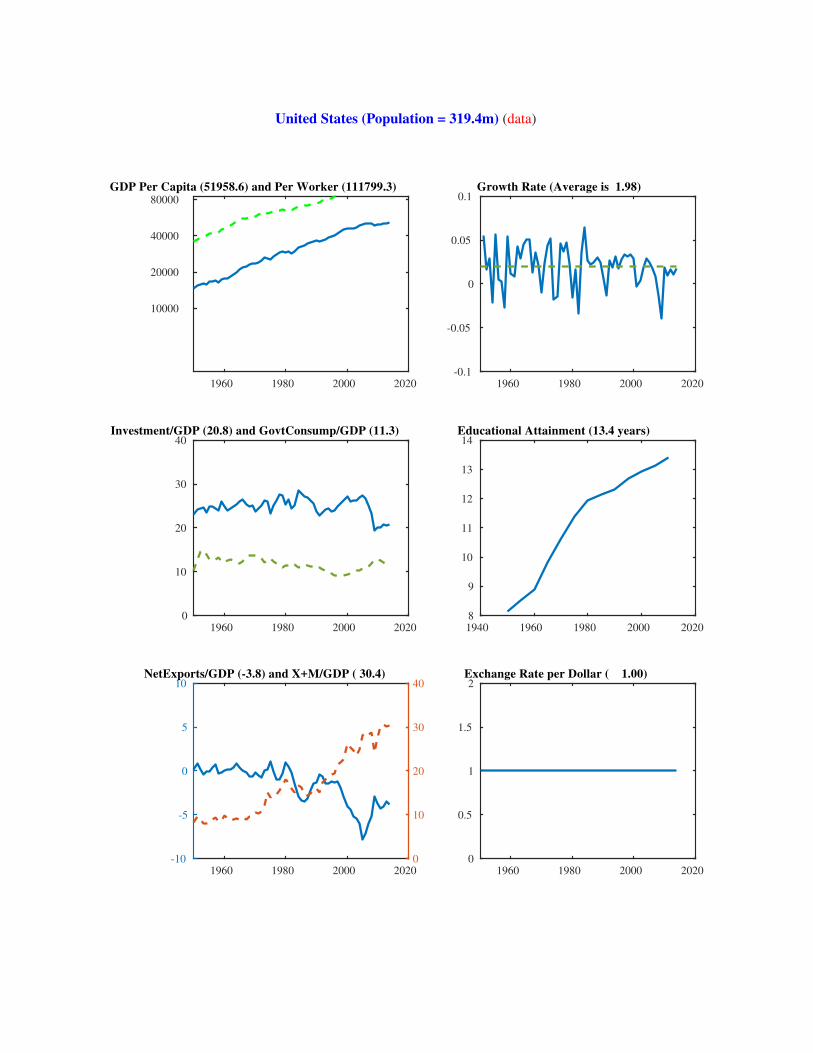
United States (Population = 319.4m) (data)
1960 1980 2000 2020
10000
20000
40000
80000
GDP Per Capita (51958.6) and Per Worker (111799.3)
1960 1980 2000 2020
-0.1
-0.05
0
0.05
0.1Growth Rate (Average is 1.98)
1960 1980 2000 2020
0
10
20
30
40Investment/GDP (20.8) and GovtConsump/GDP (11.3)
1940 1960 1980 2000 2020
8
9
10
11
12
13
14Educational Attainment (13.4 years)
1960 1980 2000 2020
-10
-5
0
5
10NetExports/GDP (-3.8) and X+M/GDP ( 30.4)
0
10
20
30
40
1960 1980 2000 2020
0
0.5
1
1.5
2Exchange Rate per Dollar ( 1.00)

Uzbekistan (Population = 29.5m) (data)
1960 1980 2000 2020
6
8
12
16
24GDP Per Capita ( 16.2) and Per Worker ( 17.0)
1960 1980 2000 2020
-0.5
0
0.5Growth Rate (Average is 1.96)
1960 1980 2000 2020
0
20
40
60
80
100Investment/GDP ( 7.6) and GovtConsump/GDP (53.2)
0 0.2 0.4 0.6 0.8 1
0
0.2
0.4
0.6
0.8
1Educational Attainment ( NaN years)
1960 1980 2000 2020
-20
0
20NetExports/GDP ( 2.7) and X+M/GDP ( 7.6)
5
10
15
1960 1980 2000 2020
0
1000
2000
3000
4000Exchange Rate per Dollar ( 2298.41)

St. Vincent and the Grenadines (Population = 0.1m) (data)
1960 1980 2000 2020
8
12
16
24
32
GDP Per Capita ( 16.6) and Per Worker ( 19.1)
1960 1980 2000 2020
-0.5
0
0.5Growth Rate (Average is 2.01)
1960 1980 2000 2020
0
10
20
30
40
50Investment/GDP (25.3) and GovtConsump/GDP (26.6)
0 0.2 0.4 0.6 0.8 1
0
0.2
0.4
0.6
0.8
1Educational Attainment ( NaN years)
1960 1980 2000 2020
-100
0
100NetExports/GDP (-46.7) and X+M/GDP ( 99.7)
50
100
150
1960 1980 2000 2020
1
1.5
2
2.5
3Exchange Rate per Dollar ( 2.70)
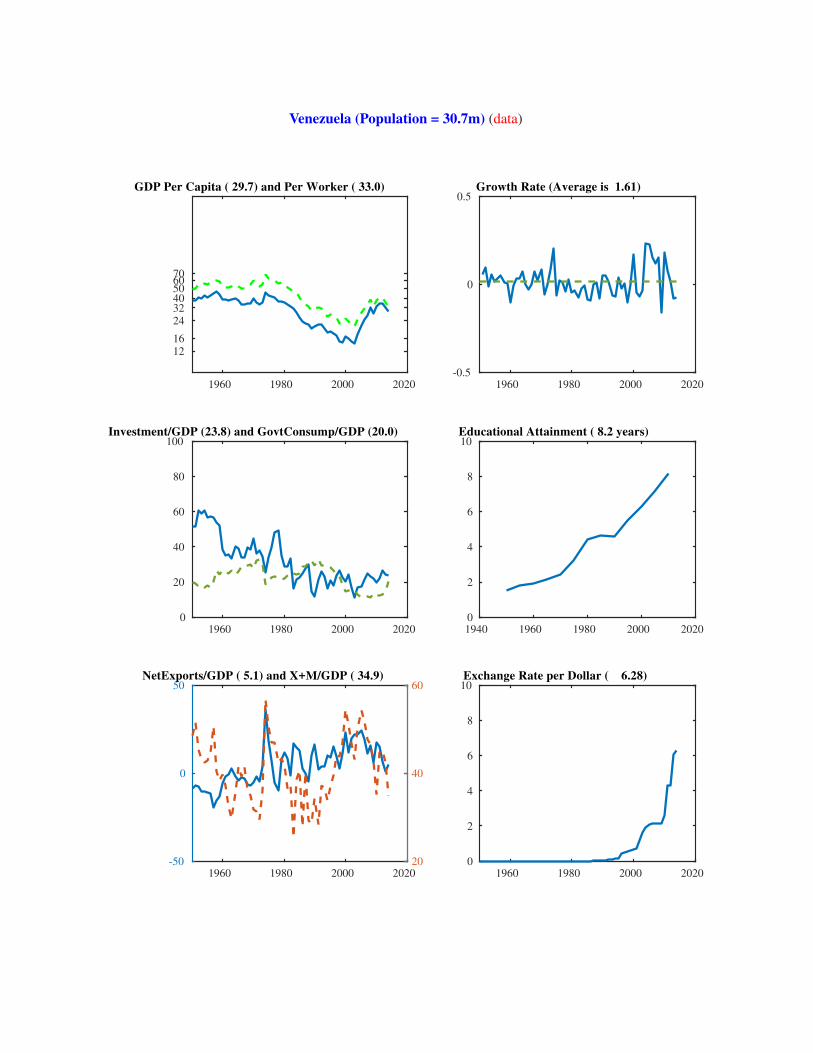
Venezuela (Population = 30.7m) (data)
1960 1980 2000 2020
12
16
24
3240506070
GDP Per Capita ( 29.7) and Per Worker ( 33.0)
1960 1980 2000 2020
-0.5
0
0.5Growth Rate (Average is 1.61)
1960 1980 2000 2020
0
20
40
60
80
100Investment/GDP (23.8) and GovtConsump/GDP (20.0)
1940 1960 1980 2000 2020
0
2
4
6
8
10Educational Attainment ( 8.2 years)
1960 1980 2000 2020
-50
0
50NetExports/GDP ( 5.1) and X+M/GDP ( 34.9)
20
40
60
1960 1980 2000 2020
0
2
4
6
8
10Exchange Rate per Dollar ( 6.28)

British V.I. (Population = 0.0m) (data)
1960 1980 2000 2020
16
24
32
40
50
60
70
8090
GDP Per Capita ( 49.0) and Per Worker ( 32.9)
1960 1980 2000 2020
-0.5
0
0.5Growth Rate (Average is 1.59)
1960 1980 2000 2020
0
50
100
150
200Investment/GDP (21.2) and GovtConsump/GDP ( 9.7)
0 0.2 0.4 0.6 0.8 1
0
0.2
0.4
0.6
0.8
1Educational Attainment ( NaN years)
1960 1980 2000 2020
-200
0
200NetExports/GDP (34.4) and X+M/GDP (308.3)
0
500
1000
1960 1980 2000 2020
0
0.5
1
1.5
2Exchange Rate per Dollar ( 1.00)

Viet Nam (Population = 92.4m) (data)
1960 1980 2000 2020
2
4
6
8
12
GDP Per Capita ( 10.5) and Per Worker ( 8.7)
1960 1980 2000 2020
-0.2
-0.1
0
0.1
0.2Growth Rate (Average is 4.26)
1960 1980 2000 2020
0
10
20
30
40Investment/GDP (24.3) and GovtConsump/GDP (11.2)
1940 1960 1980 2000 2020
0
2
4
6
8Educational Attainment ( 7.5 years)
1960 1980 2000 2020
-50
0
50NetExports/GDP ( 3.0) and X+M/GDP ( 76.7)
0
50
100
1960 1980 2000 2020
0
1
2
3
410
4Exchange Rate per Dollar (21148.00)

Yemen (Population = 26.2m) (data)
1960 1980 2000 2020
2
4
6
8
12
16
24
GDP Per Capita ( 6.8) and Per Worker ( 12.9)
1960 1980 2000 2020
-0.5
0
0.5Growth Rate (Average is 7.01)
1960 1980 2000 2020
0
10
20
30
40
50Investment/GDP (13.6) and GovtConsump/GDP (20.1)
1940 1960 1980 2000 2020
0
0.5
1
1.5
2
2.5
3Educational Attainment ( 2.6 years)
1960 1980 2000 2020
-50
0
50NetExports/GDP (-4.0) and X+M/GDP ( 25.3)
0
50
100
1960 1980 2000 2020
0
100
200
300
400Exchange Rate per Dollar ( 214.89)

South Africa (Population = 54.0m) (data)
1960 1980 2000 2020
16
24
32
40
50
60GDP Per Capita ( 23.2) and Per Worker ( 31.9)
1960 1980 2000 2020
-0.1
-0.05
0
0.05
0.1Growth Rate (Average is 1.28)
1960 1980 2000 2020
0
10
20
30
40Investment/GDP (21.0) and GovtConsump/GDP (19.1)
1940 1960 1980 2000 2020
2
4
6
8
10Educational Attainment ( 9.4 years)
1960 1980 2000 2020
-20
-10
0
10
20NetExports/GDP (-1.9) and X+M/GDP ( 41.3)
0
10
20
30
40
50
1960 1980 2000 2020
0
5
10
15
20Exchange Rate per Dollar ( 10.85)

Zambia (Population = 15.7m) (data)
1960 1980 2000 2020
1
2
4
6
8
12
16
GDP Per Capita ( 7.0) and Per Worker ( 11.8)
1960 1980 2000 2020
-0.5
0
0.5Growth Rate (Average is 1.85)
1960 1980 2000 2020
0
20
40
60
80
100Investment/GDP (38.3) and GovtConsump/GDP (12.1)
1940 1960 1980 2000 2020
1
2
3
4
5
6
7Educational Attainment ( 6.6 years)
1960 1980 2000 2020
-50
0
50NetExports/GDP ( 0.9) and X+M/GDP ( 47.8)
0
100
200
1960 1980 2000 2020
0
2
4
6
8
10Exchange Rate per Dollar ( 6.15)
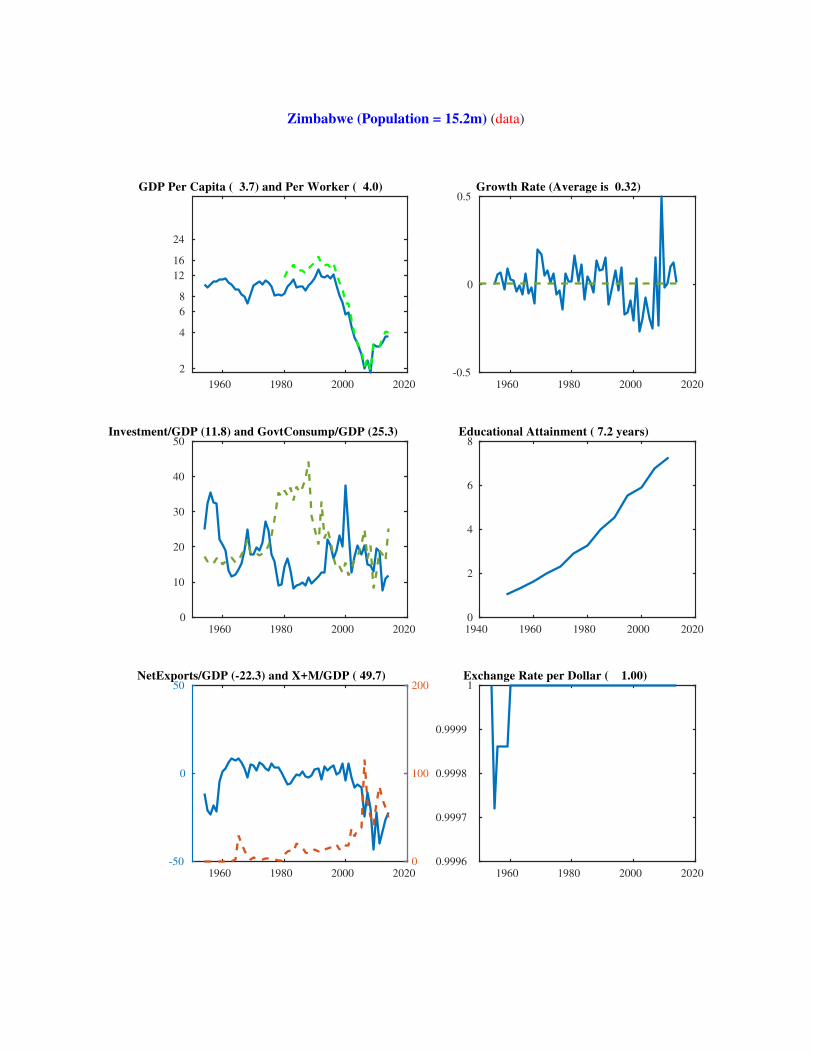
Zimbabwe (Population = 15.2m) (data)
1960 1980 2000 2020
2
4
6
8
12
16
24
GDP Per Capita ( 3.7) and Per Worker ( 4.0)
1960 1980 2000 2020
-0.5
0
0.5Growth Rate (Average is 0.32)
1960 1980 2000 2020
0
10
20
30
40
50Investment/GDP (11.8) and GovtConsump/GDP (25.3)
1940 1960 1980 2000 2020
0
2
4
6
8Educational Attainment ( 7.2 years)
1960 1980 2000 2020
-50
0
50NetExports/GDP (-22.3) and X+M/GDP ( 49.7)
0
100
200
1960 1980 2000 2020
0.9996
0.9997
0.9998
0.9999
1Exchange Rate per Dollar ( 1.00)