
DIPARTIMENTO DI SCIENZE AGRARIE, DEGLI ALIMENTI E … · gestione dell’innovazione nei sistemi...
116
DIPARTIMENTO DI SCIENZE AGRARIE, DEGLI ALIMENTI E DELL’AMBIENTE PhD Thesis May 2016 GESTIONE DELL’INNOVAZIONE NEI SISTEMI AGRO-ALIMENTARI MEDITERRANEI (XXVIII ciclo) ANGELA BARBUTO Tutor: Prof. ANTONIO LOPOLITO STRATEGIES FOR THE DIFFUSION OF SUSTAINABLE AGRICULTURAL INNOVATION: AN AGENT BASED MODEL FOR THE HORTICULTURAL SECTOR IN PROVINCE OF FOGGIA _________________________________________________________
Transcript of DIPARTIMENTO DI SCIENZE AGRARIE, DEGLI ALIMENTI E … · gestione dell’innovazione nei sistemi...

DIPARTIMENTO DI SCIENZE AGRARIE, DEGLI ALIMENTI E
DELL’AMBIENTE
PhD Thesis
May 2016
GESTIONE DELL’INNOVAZIONE NEI SISTEMI AGRO-ALIMENTARI
MEDITERRANEI (XXVIII ciclo)
ANGELA BARBUTO
Tutor: Prof. ANTONIO LOPOLITO
STRATEGIES FOR THE DIFFUSION OF SUSTAINABLE AGRICULTURAL
INNOVATION: AN AGENT BASED MODEL FOR THE HORTICULTURAL
SECTOR IN PROVINCE OF FOGGIA
_________________________________________________________

2
ACKNOWLEDGEMENTS
I would like to thank Prof. Dr. Antonio Lopolito for his great help, patience, and
advice in the course of this work. He has supported me in each choice and decision
with his valuable knowledge and experience.
I am very thankful to professor Gianluca Nardone for giving me the possibility to
grow and to improve my educational background.
Thanks to Maurizio Prosperi for his useful tips and discussions, and to all the
Economic Area of my Department for their moral support.
I want to thank my family and my friends, always ready to help me.
A special and warm thanks must go to Marco, for believing in me and in my choices,
giving me the necessary encouragement.

3
TABLE OF CONTENTS
• Chapter 1
INTRODUCTION
1.1 Relevance of the topic……………………………………………………………………..6
1.2 Objectives …………………………………........................................................................9
1.3 Structure of thesis ………………………………………………......................................10
• Chapter 2
THEORETICAL BACKGROUND
2.1 The Rogers theory of innovation diffusion……………………………………………...12
2.1.1. The innovation and its characteristics………………………………………13
2.1.2.The innovation diffusion process……………………………………………14
2.1.3 Innovativeness and adopters categories……………………………………..15
2.1.4 Rate of adoption……………………………………………………………..16
2.1.5 The social system: social and communication structure………….................17
2.1.6 The role of opinion leaders in a diffusion network………………………….21
2.2 Induced diffusion………………………………………………………………………....23
• Chapter 3
THE INNOVATION BROKER
3.1 The innovation broker’s role in the agricultural knowledge
infrastructure…………………………………………………………………………………27
3.2 Different methods for the innovation broker to carry out effective dissemination
activities……………………………………………………………………………...............30
• Chapter 4
DIFFERENT MODELS TO STUDY DIFFUSION OF INNOVATIONS
4.1 Introduction ……………………………………………………………...........................36
4.2 Aggregate models of innovation diffusion………………………………...….37
4.3 Individual level models of innovation diffusion…………………………..….40

4
4.4Agent Based modeling of innovation diffusion……………………………....41
• Chapter 5
RESEARCH AREA, DATA COLLECTION AND CASE STUDY
5.1 Description of Research Area ………………………………………………………......55
5.2 Data collection…………………………………………...................................................58
5.3 Case study………………………………………….........................................................60
• Chapter 6
METHODOLOGY
6.1 Model’s objective and assumptions……………………………………………………...66
6.2 Model description ………………………………………………………………………..68
6.3 Model calibration………………………………………………. ………………………..70
• Chapter 7
RESULTS
7.1 Introduction ……………………………………………………. ………………………..81
7.2 The baseline simulation…………………………………………………………………..81
7.3 The Degree Centrality simulation ……………………………………………………….83
7.4 The Collective Influence simulation……………………………………………………..85
7.5 The comparison between…………………………………………………………………87
• Chapter 8
CONCLUSIONS
8.1 Conclusions ………………………………………………………….............................97
REFERENCES…………………………………………………………………………….99

5
CHAPTER 1
INTRODUCTION

6
1. Introduction
1.1 Introduction
In the last years the volume of bio-waste has quickly been increasing, therefore the issue of
bio-waste valorization has captured the attention of governments, environmental and social
organizations, businesses and academics, becoming an increasingly urgent priority. The
Organic Fraction of Municipal Solid Wastes (OFMSW) is humid, therefore the
decomposition in the landfill generates leaching and fermentation phenomena and production
of bad odors. In particular, the leachate from landfills where biodegradable waste is
conferred, if not properly managed, can be a source of heavy contamination of groundwater
and water bodies. In addition, the methane produced within the body of the landfill, released
into the atmosphere, has a climate-changing effect because, as the carbon dioxide absorbs
infrared radiation emitted from the "hot" surface of the Planet. There is an abundant literature
targeting various aspects associated with bio-waste valorization, like the improvement of bio-
waste management, the conversion of bio-waste to synthetic fuels (Dermibas et al.,2011); the
issue of bio-waste biorefinery (Fava et al., 2015); different valorization pathways (Mirabella
et al., 2014 and Galanakis, 2012). Moreover, the ongoing researches are moving on the
usability of the organic fraction of municipal waste to produce biodegradable materials.
Research carried out at the University of Torino over the last 7 years for instance, has shown
that urban and agriculture wastes are source of soluble bio-based substances (SBOs) that can
be used for several applications in the fields of chemical and environmental technology,
material chemistry, biofuels production, agriculture and animal husbandry (Montoneri et al.,
2011). The SBO were studied for their performances in detergent formulations, textile
auxiliaries, fuels, plastic, photo-sensitizers, emulsifiers, forming agents, animal husbandry,
nanostructured materials. Whereas they were found effective in all cases, the most promising
performances were shown in agriculture, in animal husbandry, as modulators of anaerobic
fermentation processes, and as reagents for the synthesis biodegradable plastics, that can be
used for the production for example of mulching films. The bio plastics (Cioica et al.2008,
Pei et al.2011) currently available in the market, or already in the experimental phase, are
based on the content of biopolymers isolated from dedicated crop or obtained by
fermentation. Most commercial products are blended materials containing synthetic polymers
derived from fossil source and polymers of natural origin, the former contributing the
mechanical properties and the latter the biodegradability. So far no biodegradable plastics
7
made with bio-based chemicals isolated from bio-wastes are known. So from this point of
view SBO represent an additional opportunity for OFMSW management.
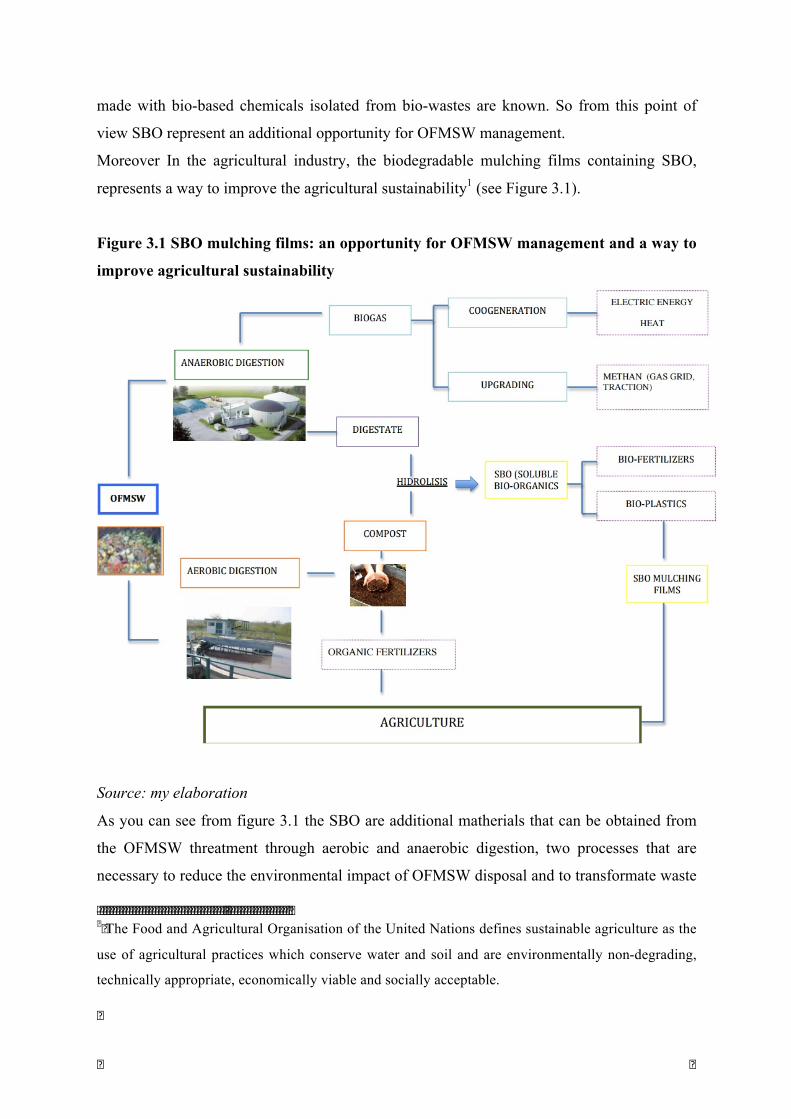
Moreover In the agricultural industry, the biodegradable mulching films containing SBO,
represents a way to improve the agricultural sustainability1 (see Figure 3.1).
Figure 3.1 SBO mulching films: an opportunity for OFMSW management and a way to
improve agricultural sustainability
Source: my elaboration
As you can see from figure 3.1 the SBO are additional matherials that can be obtained from
the OFMSW threatment through aerobic and anaerobic digestion, two processes that are
necessary to reduce the environmental impact of OFMSW disposal and to transformate waste
1 The Food and Agricultural Organisation of the United Nations defines sustainable agriculture as the
use of agricultural practices which conserve water and soil and are environmentally non-degrading,
technically appropriate, economically viable and socially acceptable.

8
in useful products for a sustainable agriculture. In particular SBO are obteined from the
compost and digestate idrolysis. The first derive from a process accelerated and controlled
by the man, predominantly aerobic, that is called composting and leads to the formation of a
solid fraction. Compost which is an organic fertilizer that can change and improve the
chemical, physical, biological and mechanical properties of the soil with numerous
environmental and agronomic benefits. Instead digestate is the result of a process accelerated
and controlled by the man, mainly anaerobic, called anaerobic digestion. The digestate is a
special waste which is not allowed spreading as such (because of the high salinity and the
high concentration of nitrogen), then it can be used as agricultural fertilizer only after being
transformed into soil amendment composted by a finishing stage aerobic made in special bio-
cells or other systems of composting, mixed with wood chips or other materials used as
structuring (straw, vegetable waste, etc.), after reducing the excess water. The compost thus
obtained, is defined by the legislative decree 75/2010 as Mixed Composted Soil Conditioner
and is able to ensure, in addition to the contribution of humified organic substance a good
fertilizing effect too, and an appreciable quantity of magnesium and iron. From the digestate
can be produced biogas that can be used for the production of electrical and thermal energy,
by means of a cogenerator. A part of the electricity produced can be used for internal
purposes; the remaining part can be sold to the grid, and the heat can be used for district
heating or to feed the heating of a greenhouse that can be placed in proximity of the biogas
plant. The biogas, in addition, can be further purified for the production of bio methane
which could be placed in the natural gas grid or used as fuel for automobiles. In fact plastic
films for soil mulching used mainly for horticultural cultivation are disposed off through land
filling, incineration and recycling while the removal of the plastic is time consuming (about
16h/ha) and, despite the use of machines still requires hand labor. Also because of high
transportation cost and landfill tipping fees, farmers consider on-site burning to be
economically more favorable (McCraw and Motes, 1991; Kasirajan and Ngouajio, 2012).
This common practice produce the release of harmful substances with the associated
obviously negative consequences to the environment (Picuno et al.,1994). Therefore the
introduction in agriculture of films produced with biodegradable raw materials, such as starch
(Bastioli et al. 1998; Lorcks et al., 1998), that can be disposed directly into the soil or into a
composting system at the end of their lifetime represents a viable solution to this problem.
Taking into account the previous discussion about bio waste valorization and the sustainable
agriculture definition I will consider mulching films containing SBO a new Sustainable

9
Agricultural Practice (SAP) which has a dual function: 1) to broaden the spectrum of
OFMSW management, and 2) to improve agricultural sustainability.
1.2 Objectives
The adoption of SAPs has a key role in improving agricultural sustainability (Reimer et al.,
2012). Many studies have attempted to understand what are the factors that influence the
adoption of SAPs. According to Baumgart-Getz et al., (2012), Tey and Brindal (2012),
Prokopy et al., (2008), Knowler and Bradshaw (2007), and Pannell et al., (2006), adoption
depends on different factors that can be divided into six dimensions: socio-economic factors;
agro-ecological factors; informational factors; psychological factors; institutional factors. The
socio-economic dimension includes factors like, gender, age, education levels, and some
farm-specific characteristics (farm size, farming experience, access to finance etc.). The
second dimension concerns variables like the practice of organic farming, duration of land
used and geographical location. Very important are informational and psychological factors
too, included in fourth and fifth dimensions, like usefulness of information, intention to
adopt, habits and the perceived attributes. The last dimension regards institutional factors, as
well as organizational membership, participation in institutional arrangements, participation
in certification programs that is farm’s presence in different social networks. A social
network is the pattern of friendship, advice, communication or support relationships existing
among the members of a social community (Knoke and Kuklinski, 1982; Burt and Minor,
1983; Wellman, 1988). There are different works that show, each with a unique theoretical
model and distinctive methodological tools, different ways in which networks influence the
adoption of an innovation. Coleman and colleagues (1966) founded that some network
variables are important predictors of innovativeness; according to Valente (1995) a
combination of external influences from cosmopolite sources and the network
interconnectedness best explain the medical doctors innovativeness in adopting a medical
innovation. Tey et al., (2010) show that social networks are particularly influential on SAPs
diffusion. In fact, the diffusion of an innovation, like a new SAP, is the process by which a
few members of a social system initially adopt an innovation, then over time more
individuals adopt until all (or most) members adopt the new idea (Ryan and Gross, 1943;
Rogers, 2003). In this context, agricultural innovations diffusion could be promoted through
different links between farmers. The network position of an actor affects the power and
influence he can exert on its immediate neighbors and on the collective behavior of the
members. This influence can be viewed as a strategic resource for innovation diffusion

10
purpose in a marketing or policy context. Policy maker can induce diffusion choosing
specific injection points (members of the network where the novelty is first inoculated) in
order to boost adoption speed and adoption level (Diaz-Reiney, 2012) that is various
according to the relational profile and location in the network of the injection points chosen.
As a consequence, the principal question for policy makers is who are the injection points to
recruit to obtain more effective diffusion results. This problem is usually faced heuristically,
identifying time after time, through a try and error process, the best injection points. From
these observations arises the fundamental research question of this thesis: R1) does it exist a
rational criterion for the choice of the injection points? Thus, the objective of my thesis is to
prove that there are specific network properties belonging to the actors that can be used like
rational criteria for the choice of the best injection points. The hypothesis related to these
criteria will be tested through an Agent Based Model (ABM) designed to simulate the social
interaction mechanisms within a social network composed by different agents.
1.3 Organization of the Thesis
The rest of the work is organized as follows. Chapter 2 depicts the theoretical background of
Rogers’ theory on innovation diffusion and of policy induced diffusion. Chapter 3 is devoted
to introduce the innovation broker’s role in the agricultural knowledge infrastructure and to
show different methods to efficiently induce diffusion. Moreover this chapter states the
fundamental hypotheses of this research. Chapter 4 portrays a review of Agent Based Model
for innovation diffusion. In chapter 5, I present the research area, the data collection and the
case study. In chapter 6 I describe the model and the simulations setting. In chapter 7 I
discuss the results of my research. Finally chapter 8 presents the conclusions of this thesis.

11
CHAPTER 2
THEORETICAL BACKGROUND

12
2.1 The Rogers theory of innovation diffusion
Innovation diffusion research seeks to understand how new ideas, products and practices
spread throughout a society over time (Rogers 2003). Diffusion research is an
interdisciplinary field with roots in anthropology (Wissler 1915), sociology (Tarde 1903),
geography (Hägerstrand 1967), political science (Walker 1969), economics (Griliches 1957),
and marketing (Arndt 1967). In particular, diffusion of innovations is a theory that seeks to
explain how, why, and at what rate new ideas and technology spread through cultures.
Everett Rogers, a professor of communication studies, popularized the theory in his book
Diffusion of Innovations; the book was first published in 1962, and is now in its fifth edition
(2003). Rogers argues that diffusion is the process by which an innovation is communicated
through certain channels over time among the participants in a social system. Therefore
according to Rogers (2003) innovation is any new idea, practice or object that is intended to
be beneficial for the adopter and its diffusion is: “the process by which an innovation is
communicated through certain channels over time among the members of a social system”,
where time is involved in the innovation-diffusion process, innovativeness, and an
innovation’s rate of adoption. (figure 2.1)
Figure 2.1 The diffusion process
Source: Rogers (2003)
Therefore the four main elements are the 1) innovation, 2) communication channels, 3) time,
and 4) the social system. They are identifiable in every diffusion research study, and in every
diffusion campaign or program.

13
2.1.1 The innovation and its characteristics
The S-curve is innovation specic and system-specific, describing the diffusion of a particular
new idea among the member units of the specific system. In fact, how Figure 2.1 shows, the
diffusion processes is different for each represented innovations (I-II-III), depending on the
distinct innovation’s characteristics. In particular, Rogers (2003), on the basis of the previous
literature on innovation diffusion, found five main attributes that influence adoption decisions
and explain the different innovation rates of adoption: 1) relative advantage; 2) compatibility;
3) complexity; 4) trialability; and 5) observability.
1) Relative advantage is the degree to which an innovation is perceived as better than the idea
it supersedes. The degree of relative advantage may be measured in economic terms, but
social-prestige factors, convenience, and satisfaction are also often important components. It
does not matter so much whether an innovation has a great deal of "objective" advantage.
What does matter is whether an individual perceives the innovation as advantageous. The
greater the perceived relative advantage of an innovation, the more rapid its rate of adoption
is going to be.
2) Compatibility is the degree to which an innovation is perceived as being consistent with
the existing values, past experiences, and needs of potential adopters. An idea that is not
compatible with the prevalent values and norms of a social system will not be adopted as
rapidly as an innovation that is compatible. The adoption of an incompatible innovation often
requires the prior adoption of a new value system. An example of an incompatible innovation
is the use of contraception in countries where religious beliefs discourage use of birth-control
techniques, as in Moslem and Catholic nations.
3) Complexity is the degree to which an innovation is perceived as difficult to understand and
use. Some innovations are readily understood by most members of a social system; others
are more complicated and will be adopted more slowly. For example, in a study carried out
in 1955, Wellin found that the villagers of a Peruvian village, Los Molinos, did not
understand germ theory, which the health worker tried to explain to them as a reason for
boiling their drinking water. In general, new ideas that are simpler to understand will be
adopted more rapidly than innovations that require the adopter to develop new skills and
understandings.
4) Trialability is the degree to which an innovation may be experimented with on a limited
basis. New ideas that can be tried on the installment plan will generally be adopted more
quickly than innovations that are not divisible. Ryan and Gross (1943) found that every one
of their Iowa farmer respondents adopted hybrid-seed corn by first trying it on a partial basis.

14
If the new seed could not have been sampled experimentally, its rate of adoption would have
been much slower. An innovation that is trialable represents less uncertainty to the individual
who is considering it for adoption, as it is possible to learn.
5) Observability is the degree to which the results of an innovation are visible to others. The
easier it is for individuals to see the results of an innovation, the more likely they are to
adopt. Such visibility stimulates peer discussion of a new idea, as friends and neighbors of an
adopter ask him or her for innovation-evaluation information about it. Solar panels on a
household's roof are highly observable, and a California survey found that the typical solar
adopter showed his equipment to about six of his peers (Rogers et al, 1979). Other consumer
innovations like home computers or videotape recorders are relatively less observable, and
thus may diffuse more slowly.
Generally, innovations that are perceived by receivers as having greater relative advantage,
compatibility, trialability, observability, and less complexity will be adopted more rapidly
than other innovations (Rogers 2003) (Figure 2.2).
2.1.2 The innovation diffusion process
According to Rogers: “The innovation-decision process is the process through which an
individual (or other decision-making unit) passes from first knowledge of an innovation to
forming an attitude toward the innovation, to a decision to adopt or reject, to implementation
of the new idea, and to confirmation of this decision”.
The Rogers innovation decision process consists of five stages:
1. Knowledge occurs when an individual (or other decision making unit) is exposed to the
innovation's existence and gains some understanding of how it functions.
2. Persuasion occurs when an individual (or other decision making unit) forms a favorable or
unfavorable attitude toward the innovation.
3. Decision occurs when an individual (or other decision-making unit) engages in activities
that lead to a choice to adopt or reject the innovation.
4. Implementation occurs when an individual (or other decision making unit) puts an
innovation into use.
5. Confirmation occurs when an individual (or other decision making unit) seeks
reinforcement of an innovation-decision already made, but he or she may reverse this
previous decision if exposed to conflicting messages about the innovation.

15
The innovation-decision process involves time in the sense that the five steps usually occur in
a time-ordered sequence of knowledge, persuasion, decision, implementation, and
confirmation. The innovation- decision period is the length of time required to pass through
the innovation-decision process.
2.1.3 Innovativeness and adopters categories
According to Rogers, adopter distributions follow a bell-shaped curve over time and
approach normality, because of the cumulatively increasing degree of influence upon an
individual to adopt or reject an innovation, resulting from the activation of peer networks
about the innovation in the social system. This influence results from the increasing rate of
knowledge and adoption or rejection of the innovation in the system. Adoption of a new idea
is the result of human interaction through interpersonal networks. If the first adopter of the
«innovation discusses it with two other members of a social system, and each of these two
adopters passes the new idea along to two peers, the resulting distribution follows a binomial
expansion, a mathematical function that follows a normal shape when plotted over a series of
successive generations. The process is similar to that of an unchecked infectious epidemic
(Bailey, 1957). Evidence supporting this statement comes from investigations of agricultural,
consumer, and other innovations in a variety of social systems, in the United States, India,
and other nations (Rogers, 1958; Bose, 1964; Ryan, 1948; Beal and Rogers, 1960; Dimit
1954; and Hamblin et al, 1973). All these researches show that S-shaped diffusion curves are
essentially normal, a conclusion that is very useful for classifying adopter categories (Rogers
2003). In particular, Rogers established five adopter categories that describe and explain
impacts of heterogeneity on adoption decisions (Mahajan et al.1990). These five categories
are distinguished by adoption timing that measures the adopter innovativeness (see Fig.2.1).
The innovativeness dimension is continuous and it is characterized by a normal distribution
that has several characteristics that are useful in classifying adopters. One of these
characteristics or parameters is the mean (x), or average, of the sample. Another parameter of
a distribution is the standard deviation (sd), a measure of dispersion about the mean.
These two statistics, the mean (x) and the standard deviation (sd), can be used to divide a
normal adopter distribution into categories. If vertical lines are drawn to mark off the
standard deviations on either side of the mean, the curve is divided into categories in a way
that results in a standardized percentage of respondents in each category (Figure 2.2).

16
The area lying to the left of the mean time of adoption minus two standard deviations
includes the first 2.5 percent of the individuals to adopt an innovation—the innovators. The
next 13.5 percent to adopt the new idea are included in the area between the mean minus one
standard deviation and the mean minus two standard deviations; they are labeled early
adopters. The next 34 percent of the adopters, called early majority, are included in the area
between the mean date of adoption and minus one standard deviation. Between the mean and
one standard deviation to the right of the mean are located the next 34 percent to adopt the
new idea, the late majority. The last 16 percent are called laggards. (Rogers 2003)
Figure 2.2. Adopter categorization on the basis of innovativness
Source: Rogers 2003
Adopters in each category differ in several characteristics, for instance in their use of
communication channels, readiness to assume risk, and social affiliation (Rogers 2003).
2.1.4 Rate of adoption
There is a third specific way in which the time dimension is involved in the diffusion of
innovations. Rate of adoption is the relative speed with which an innovation is adopted by
members of a social system. When the number of individuals adopting a new idea is plotted
on a cumulative frequency basis over time, the resulting distribution is an s-shaped curve (see
figure 2.1). At first, only a few individuals adopt the innovation in each time period (such as
a year or a month, for example); these are the innovators. But soon the diffusion curve begins
to climb, as more and more individuals adopt. Then the trajectory of the rate of adoption
begins to level off, as fewer and fewer individuals remain who have not yet adopted. Finally,

17
the s-shaped curve reaches its asymptote, and the diffusion process is finished. Most
innovations have an s-shaped rate of adoption. But there is variation in the slope of the "s"
from innovation to innovation (see figure 2.1); some new ideas diffuse relatively rapidly and
the s-curve is quite steep. Another innovation may have a slower rate of adoption, and its s-
curve will be more gradual, with a slope that is relatively lazy. One issue addressed by
diffusion research is why some innovations have a rapid rate of adoption, and why others are
adopted more slowly (Figure 2.1). The rate of adoption is usually measured by the length of
time required for a certain percentage of the members of a system to adopt an innovation.
Therefore, we see that rate of adoption is measured using an innovation or a system, rather
than an individual, as the unit of analysis. Innovations that are perceived by individuals as
possessing greater relative advantage, compatibility, and the like, have a more rapid rate of
adoption (as I pointed out previously in the section 2.1.2).
There are also differences in the rate of adoption for the same innovation in different social
systems. Clearly, there are aspects of diffusion that cannot be explained only by the nature of
individual behavior. The system has a direct effect on diffusion, and also an in direct
influence through its individual members.
2.1.5 The social system: social and communication structure
Innovation decision process cannot be explained as a result of individual and innovations
characteristics alone, but it is also fundamentally a social process (Rogers 2003). According
to Deroian, 2002 the structure of a social system can facilitate or impede the diffusion of
innovations in the system. The impact of the social structure on diffusion is of special interest
to sociologists and social psychologists, and the way in which the communication structure of
a system affects diffusion is a particularly interesting topic for communication scholars
(Rogers 2003). Katz (1961) remarked, "It is as unthinkable to study diffusion without some
knowledge of the social structures in which potential adopters are located as it is to study
blood circulation without adequate knowledge of the structure of veins and arteries."
Rogers define structure as the patterned arrangements of the units in a system. This structure
gives regularity and stability to human behavior in a social system; it allows one to predict
behavior with some degree of accuracy. Thus, structure represents one type of information in
that it decreases uncertainty. Perhaps we see an illustration of this predictability that is
provided by structure in a bureaucratic organization like a government agency where there is
a well-developed social structure consisting of hierarchical positions, giving officials in

18
higher ranked positions the right to issue orders to individuals of lower rank. Their orders are
expected to be carried out. Such patterned social relationships among the members of a
system constitute social structure, one type of structure.
An individual’s position and connectedness within a social system is important for adoption
behavior (Valente 1995). Individuals who have more direct ties to other actors are more
innovative, receive more information, and are less dependent on other individuals
(Wasserman and Faust 1994; Valente 1995). Individuals who have dense networks are
considered not to receive much information from outside. In a dense personal network, most
members are connected to each other and are thought to hear of an innovation later (Valente
1995).
In addition to social structure among, Rogers define another type of structure, the
communication structure, that exists in the interpersonal networks linking a system's
members, determining who interacts with whom to create and share information with one
another in order to reach a mutual understanding (Rogers 2003).
The interpersonal channels, involve a face-to-face exchange between two or more
individuals, and are important in persuading an individual to adopt an innovation.
The information diffuses through Mass media channels too (radio, television, newspapers and
so on) that are often the most rapid and efficient means to inform an audience of potential
adopters about the existence of an innovation (Kats and Lazarsfeld 1955; Lazarsfeld et al.
1944; Lazarsfeld and Menzel, 1963) that is, to create awareness-knowledge (Rogers 2003).
The importance of interpersonal and mass media channels in the innovation-decision process
was investigated in a series of researches with farmers, and then largely confirmed in studies
of other types of respondents. For example, Sill and Copp (1958) found that if the probability
of adoption were to be maximized, communication channels must be used in an ideal time
sequence, progressing from mass media to interpersonal channels. A farmer upsetting this
sequence in any way prejudices progress at some point in the adoption process." The greatest
thrust out from the knowledge stage was provided by the use of the mass media, while
interpersonal channels were salient in moving individuals out of the persuasion stage.
Beal and Rogers (1960) obtained data on the relative importance of interpersonal and mass-
media channels at each function in the adoption of 2,4-D weed spray from 148 Iowa farmers.
On the basis of these studies Rogers, referring to his model of the innovation-decision
process2 argues that: ” Mass media channels are relatively more important at the knowledge

19
stage and interpersonal channels are relatively more important at the persuasion stage in the
innovation decision process”.
So mass communication channels are primarily knowledge creators, whereas interpersonal
networks are more important in persuading individuals to adopt or reject.
In literature can be identified several innovation diffusion models based on the relevance of
social networks’ role in diffusion of innovations and on the assumption that people adopt an
innovation when sufficient information has reached them. One of the first diffusion
investigation based on these assumptions was the classic study of a new drug's spread among
doctors carried out by Professor James Coleman and his colleagues in 1966. In particular
they included various indicators of network communication behavior among their
independent variables of study; they found these network variables to be the most important
predictors of innovativeness. Moreover they proceeded to study the way in which
interpersonal networks explained the very nature of the diffusion process. This
methodological advance allowed Coleman et al to gain important understandings into the S-
shaped diffusion curve.
Their work stands out as a model for gaining in-depth insight into the nature of diffusion, and
their approach has attracted the later attention of various other diffusion scholars who have
probed the dynamics of diffusion networks, like for example Rogers and Kincaid (1981).
They conducted personal interviews with the sixty-nine married women in a Korean village
in order to determine the role of interpersonal networks in the diffusion of family-planning
innovations. Each respondent was asked which other women she talked with about
contraceptive methods. Spatial location of each respondent's home was a very important
predictor of who talked with whom, even though the village was extremely small (only about
two typical city blocks in diameter). But space was by no means a complete explanation of
diffusion networks links; in fact some women talked with a peer on the opposite side of the
village. Physically lengthy links were especially characteristic of opinion leaders, which
suggested that one of the important roles of such leaders was to interconnect the spatially
related cliques in the village, and thus to increase the connectedness of the village's
communication structure. Social similarity also helped to explain who was linked to whom;
women of similar social status and age were more likely to interact with each other.
A general conclusion from who-to-whom studies is that space and social distance (that is,
heterophily/homophily) are the main determinants of who talks to whom in diffusion
networks. Homophily is the degree to which pairs of individuals who interact are similar in
20
certain attributes, such as beliefs, education, social status, and the like. Although a conceptual
label— homophily—was assigned to this phenomenon only in fairly recent years by
Lazarsfeld and Merton (1964), the existence of homophilous behavior was noted a half-
century ago by Tarde (1903): "Social relations, I repeat, are much closer between individual
who resemble each other in occupation and education." Heterophily is the degree to which
pairs of individuals who interact are different in certain attributes. So Heterophily is the
opposite of homophily.
When two individuals share common meanings, beliefs, and a mutual language,
communication between them is more likely to be effective. Most individuals enjoy the
comfort of interacting with others who are quite similar.
Homophily and effective communication breed each other, instead heterophilous
communication may cause cognitive dissonance because an individual is exposed to
messages that go unheeded becouse they are inconsistent with existing beliefs, causing an
uncomfortable psychological state. But heterophilous communication has a special
informational potential, even though it may be realized only rarely. These interpersonal links
are especially important in carrying information about innovations, as is implied in
Granovetter's (1973) theory of "the-strength-of-weak-ties," so homophilous communication
may be frequent and easy but may not be so crucial as the less frequent heterophilous
communication in diffusing innovations.
Extended models include that information about the innovation is assessed towards an
individual threshold3 that can change over time and depending on the adoption rate within
the personal network of the decision-maker. Granovetter (1978) postulated that individuals
were heterogeneous in the extent to which their social system influences on them. In fact,
individuals have varying thresholds for adoption of an innovation. According to threshold
models, individuals make decisions based on the proportion of others that have already done
so (Granovetter 1978; Markus, 1987). In particular, a threshold is reached when an
individual s convinced to adopt as the result to knowing that some minimum number of other
individuals in the individual’s personal communication network have adopted and are
satisfied with innovation (Rogers 2003).
A social-psychological theory with direct applicability to diffusion networks is social
learning theory (Bandura 1977). The central idea of social learning theory is that an
3 A threshold is the number of other individuals who must be engaged in an activity before a given
individual will join the activity (Granovetter, 1978; Markus, 1987)

21
individual learns from another by means of observational modeling; that is, one observes
what another person is doing, and then does something similar. But not exactly the same
thing. That would be simple imitation or blind mimicry. But social modeling permits the
observer to extract the essential elements from an observed behavior pattern in order to create
a similar behavior.
The basic perspective of social learning theory is that the individual can learn from
observation of other people's activities, so the individual does not actually need to experience
a verbal exchange of information in order for the individual's behavior to be influenced by
the model. Thus, nonverbal communication is considered important in behavior change (as
well as verbal communication). Therefore according to this theory, the potential adopter
decision, whether or not to buy the new product, is based not only on his own preferences
but on the decisions of his neighbors in the social network, hence the adoption behaviour of
one member influences the adoption decision of another member (Rogers 1995;Valente
1995).
2.1.6 The role of opinion leaders in a diffusion network
In diffusion networks an important role is played by Opinion Leaders. Opinion leadership is
the degree to which an individual is able informally to influence other individuals’ attitudes
or overt behavior in a desired way with relative frequency . So opinion leaders are individuals
who lead in influencing others' opinions about innovations. Various studies have attempted to
understand the attributes and roles of opinion leaders (Weimann, Tustin, Vuuren, and
Joubert, 2007). Besides their central position (Berelson and Steiner, 1964; Czepiel, 1974;
Valente, 1996) other characteristics of opinion leaders, such as interpersonal influence and
innovativeness, may significantly affect their influence. Two main types of interpersonal
influence exist: informational and normative influence (Deutsch and Gerrard, 1955).
Informational influence refers to the tendency to accept information from others as evidence
of reality. For example, opinion leaders directly influence other consumers by giving them
advice and verbal directions about their search for, purchase of, and use of a product (Flynn,
Goldsmith, and Eastman, 1994). Normative influence, on the other hand, entails the
tendency to conform to the expectations of others (Burnkrant and Cousineau, 1975). Hence,
normative opinion leaders exert social pressure and social support and thereby influence
decision-making pro- cesses of the influenced consumers (Glock and Nicosia, 1964). Since
people aim to create and maintain meaningful social relationships, they often engage in

22
behaviors approved by others, such as adopting a product to appeal to other product adopters
(Cialdini and Goldstein, 2004). The product and situation determine which type of influence
is more important (Grewal, Mehta, and Kardes 2000). Privately consumed goods prioritize
the informational influence, whereas for publicly consumed goods both types of influence are
critical. Opinion leaders can accelerate the diffusion of innovation and are potentially
interesting for political issues (Deroian, 2002). Valente and Davis (1999) investigate how the
diffusion of innovations can be accelerated through opinion leader recruitment. They use
homogeneous agents that adopt once 15% of their neighbors have adopted. The formal
description of the underlying model is sketchy and the network model used, which randomly
allocates seven ties per agent, does not appear to resemble most real-world social network
structures very closely. Nevertheless, simulation results demonstrate that diffusion occurs
faster when initiated by opinion leaders rather than by random or marginal agents and that
targeting opinion leaders may therefore accelerate diffusion. Similar to Valente and Davis
(1999), Delre et al. (2010) also investigate the effectiveness of opinion leader recruitment.
Results suggest that the most important function of highly interconnected hubs is to inform
others about the new products, but that their effect on the decision making of consumers can
be often overestimated. They also find that in markets in which such hubs do not exist,
diffusion is less likely to occur. For such markets, direct to consumer advertising could be an
alternative strategy to stimulate the spreading of the new product in different areas of the
network. Finally, van Eck et al. (2011) also study the role of opinion leaders, but take into
account not only their central network position, but also the influence of personality traits and
knowledge among influential consumers. Hence all these works show that the opinion leader
can be recruited by policy makers to speed diffusion in a network of potential adopters and to
reach higher level of diffusion, in other words to induce diffusion. Induced diffusion is a
recent research area that study how regulatory interventions accelerate the adoption process
(speed) and how they increase the long term penetration rate (level). In the following section
I present a brief literature review on this new theoretical field and on patterns of diffusion
when it is induced, that are different from the conventional patterns observed when diffusion
is unaffected by policy interventions.

23
2.2 Induced diffusion
The origins of the concept of induced diffusion can be traced back to Hicks (1932) “induced
innovation” hypothesis, according to which a change in the relative prices of the factors of
production would by itself engender invention or innovation to economize the use of a factor
which has become relatively expensive. A considerable literature has been developed using
the induced innovation hypothesis within and beyond Hicks' original macroeconomic focus
on the effects of wage rises on labor saving inventions (P. Funk, 2002; D. Popp, 2002). In
particular, mounting concerns about climate change and environmental decay have led in
recent years to the development of a literature exploring the possibility of price-induced
innovation (A.B. Jaffe et al. 2002). For instance, Popp 2002 using patent data explores the
effect of rising energy prices on innovation in energy technologies, whilst Newell et al., 1999
investigate the effects of rising energy costs on improvements in the energy efficiency of
goods.
Research in this context has explored not just invention and innovation but also diffusion.
Accordingly two related concepts to induced innovation are induced adoption and induced
diffusion. The term ‘induced adoption’ appears to have first been employed by Antonelli
(1990) in an examination of the territorial distribution of fax machines and modems and
shows that their adoption is highly uneven geographically, favoring regions with higher
levels of fixed and human capital and where there are positive network externalities, such as
business clusters of service industries. These results highlight the importance of regional and
socioeconomic differences as the broader context with which to engender the adoption of
innovations. The most prominent use of the term induced diffusion was by Jaffe et al.
(2002). In fact in their widely cited review of work on environmental policy and
technological change, they explain the concern with induced diffusion, as distinct from
induced innovation, when they observe that:
“While the induced innovation literature focuses on the potential for environmental policy to
bring forth new technology through innovation, there is also a widely-held view that
significant reductions in environmental impacts could be achieved through more widespread
diffusion of existing economically-attractive technologies.”
Following from this, Diaz-Rainey in their induced diffusion literature included in a work of
2009, suggests a more formal definition of induced diffusion. In particular they define it as:
“Any intervention that aims to alter the speed and/or total level of adoption of an innovation
by directly or indirectly internalizing positive and/or negative externalities”.

24
Following this definition Diaz-Rainey represent the desired impact of induced diffusion on
diffusion speed (acceleration effect) (figure 2.3) and on diffusion level (increased saturation
effect) (figure 2.4). Depicted in both panels are cumulative normal ‘s’ shaped diffusion
curves.
Figure 2.3 Induced diffusion: acceleration
Source: Diaz-Rainey 2009
Figure 2.4 Induced diffusion: acceleration effect and increased saturation effect
Key: P = cumulative market penetration of an innovation; t = time; K = saturation
Source: Diaz-Rainey 2009

25
In Figure 2.2.1a policy interventions succeed in accelerating diffusion for a given level of
cumulative adoption P y from t+2 to t+1. In other words the diffusion curve shifts to the left.
Under this scenario, however, both curves ultimately reach the same market saturation point.
In the second panel is diffusion also accelerated, however, in this case the policy
interventions also results in a higher ‘realistic’ saturation point, K r rather K u .
Diaz-Rainey (2009), in his work, after showing graphically the effect of policy maker
intervention on speed and on level of diffusion, introduced some empirical evidence on the
efficacy of some tools available to policymakers with which induce diffusion, as well as:
trading mechanisms (Kerr and Newell, 2003); price and taxes (Baker et al., 1989; Lafferty et
al. 2001; Jaffe et al. 2002; Greene 1990; Hassett and Metcalf 1995; Jaffe and Stavins 1995;
Rose and Joskow 1990; Stoneman and Battisti 1998; Brown 2001; Golove and Eto 1996;
Sanstad and Howarth 1994; Sorrell et al. 2004); subsidies (Hassett and Metcalf 1995; Jaffe
and Stavins 1995; Soderholm and Klaassen 2007; Koefoed and Buckley 2008); command
and control instruments (Cutler and McClellan 1996; Battisti and Stoneman, 1998; Stoneman
and Battisti, 1998; Gray and Shadbegian, 1998; Stoneman and Battisti, 2000; Baker 2001;
Snyder et al., 2003; Battisiti, 2008; Mickwitz et al. 2008; Luken and Van Rompaey, 2008;
Koefoed and Buckley, 2008); information policy (Morgenstern and Al-Jurf, 1999; Howarth et
al. 2000; Anderson and Newell, 2004). Since Diaz-Rainey (2009), the research in the
emerging area of induced diffusion has grown a lot. For instance, Cantono and Silverberg
(2009) explore through Agent Based Simulation the alternative policy approaches to ‘kick-
start’ the diffusion of eco-innovations using a mixed probit and epidemic model. Further,
Higgins et al. (2011) explore various policy options for reducing the greenhouse gas
emissions from the housing stock using a decision support diffusion model applied to a case
study in Australia. Finally Rixen and Weigand (2014) simulate through an Agent Based
model the effect of different policy intervention on speed and level of Smart Meter adoption
in Germany. The previous consideration about the importance of innovation networks
(knowledge transfers among innovation potential adopters), included in the first section of
this chapter and the consideration that innovation diffusion can be induced by policy makers,
support the point of view adopted in this work and lead to the following question: how public
policy could promote this knowledge transfer (word of mouth) in the agriculture sector both
beetween research and the farmers worlds and between these last? A solution to this problem
could be the innovation broker, a new figure contemplated by EIP (European Innovation
Partnership), described in the following chapter.

26
Chapter 3
The innovation broker

27
3.1 The innovation broker’s role in the agricultural knowledge infrastructure
EIP has been established by the Commission‘s proposal for a post-2013 rural development
policy (COM 2012 79) with the aim of building a bridge and achieving synergies through
fostering exchange between research and practice. Its implementation will be channeled
through the Operational Groups (OG), as key acting entities involving different actors, such
as farmers, advisors, researchers, NGOs, enterprises, etc. (ENRD, 2013b). The agricultural
EIP adopts the interactive multi-actor model of knowledge exchange (European Commission,
2013; World Bank, 2006; Hall et al., 2006; Knickel et. Al., 2009; Mosley, 2000; Labarthe &
Laurent, 2013; Latruffe, 2010), in order to promote end user focused solutions or developing
new opportunities (ENRD, 2013a).
In the context of the agricultural EIP, the main task of the innovation broker is to help the
setting up of operational groups around concrete innovation projects through collecting
information, animating bottom-up initiatives, helping to refine innovative ideas, providing
support for finding partners and funding, as well as for preparing the project proposal work
plan.
These functions are not exhaustive of the possible activities that the innovation broker can
play in view of smoothing the innovation process (Cristiano and Proietti, 2011). In fact, the
literature describes a variety of functions performed by innovation brokers, that will be
explained in the following paragraph.
According to Klerkx and Leeuwis (2009) the formation and functioning of innovation
networks and systems can be problematic due to the existence of several gaps between actors.
In this context, there is the need for subjects whose main function is to fill these gaps by
connecting different players so as to facilitate knowledge exchange across the boundaries
between them. This task will be performed by the “innovation broker” (Herman et al.,2012;
Perèz et al., 2010; EU SCAR, 2012), meaning “ an agent or broker in any aspect of the
innovation process between two or more parties”, whose activities include helping to provide
information about potential collaborators, brokering a transaction between two or more
parties, acting as a mediator or go-between bodies or organizations that are already
collaborating, helping find advice, funding and support for the innovation outcomes of such
collaborations (Howell, 2006). As Howell observes, organizations can provide intermediary
functions as their primary or exclusive role, but also as jointly activities of research and
technical services. The role of the innovation broker is very usual in the Netherlands, since it
has emerged following the privatization of the research and extension system and a

28
paradigmatic shift in the agricultural and rural fields, as well as in innovation pathways.
Klerkx and Leeuwis (2009) give examples of the seven distinct types of agricultural
innovation brokers that can currently operate in the Netherlands:
- innovation consultants are organizations focused either on the individual farmer (type 1), or
ona collective of farmers (type 2) with a common interest, who wish to jointly develop or
implement an innovation;
- peer network brokers (type 3) are organizations involved in the setting up of peer networks
(generally with a sub-sectorial focus) concerned with informal knowledge exchange among
the farmers;
- systemic brokers (type 4) go beyond individual firms, or networks of firms, addressing
higher level innovation architectures that involve complex constellations of business,
government and societal actors, dealing with complex problems and radical innovations;
- internet portals (type 5) connect farmers with relevant information sources;
- research councils with innovation agency (type 6) are aimed at connecting relevant actors in
the agriculture value chain in order to facilitate farmer-driven research planning mechanisms;
- education brokers (type 7) link education establishments with the aim of positioning the
agricultural schools in view of responding to innovation queries from the agricultural sector.
Howell (2006) describes a detailed set of functions concerning innovation brokerage that are
primarily targeted at assisting individual firms in innovation processes, through articulating
their innovation needs and composing the network (e.g. knowledge processing, selection of
collaborative partners and network brokerage, gate-keeping and knowledge brokering, etc.).
Besides, Smits and Kuhlmann (2004) describe other functions with a more systemic focus,
aimed at interfacing with different actors and animating groups, such management of
interfaces, building and organizing (innovation) systems, stimulating demand articulation,
and so on. Klerkx and Leeuwis (2009) summarize the last functions as innovation process
management, which includes a host of facilitation tasks that ensure that networks are
sustained and become productive, e.g. through the building of trust, establishing working
procedures, fostering learning, managing conflict and intellectual property management
(Leeuwis, 2004). In the context of the agricultural EIP innovation process management is not
an expected function, as the broker’s core objective is to help the group in the elaboration of
a well-designed project plan. However, in case the project gets funded, the innovation broker
could also be involved in its implementation, as a facilitator, and even in the dissemination of
results. Despite the potential role of innovation brokers in facilitating partnerships and

29
linkage among different innovation players, several risks have been identified with particular
regard to their neutral position and possible function ambiguity, as well as, to funding
problems (Klerkx et al., 2009). Concerning neutrality, innovation brokers can reveal possible
dependence from shareholders, who may exercise pressure to compose and manage network
in order to satisfy their own interests. Therefore, there is a concrete risk that innovation
intermediaries may be used as a vehicle for realizing other parties’ objectives and
expectations. Neutrality issues seem to be particularly relevant with regard to network
brokerage roles performed by traditional research and extension providers. In these cases, it is
possible that the articulation of needs and the selection of cooperation partners may be
influenced in favor of the needs of the provider rather than those of the client. Besides,
function ambiguity tensions may arise as a consequence both of a new, and not completely
clear, mission of innovation brokers and of an overlap with intermediary functions from
research and extension services. Innovation brokers acting with insufficiently differentiation
from the role of advisory and research providers may be seen by these latter as direct
competitors. At the same time, farmers who are not aware of what they can expect from the
innovation broker, cannot have the indispensable confidence in her/his functions. Moreover,
farmers’ representatives can see the innovation broker as a threat due to a possible role of
opinion leader in performing ‘animation’ functions. According to Klerkx et al. (2009),
specialized innovation brokers may be an option to prevent neutrality tension and to act as
innovation catalysts more freely, but, on the other hand, they bear their own tensions with
regard to neutrality, function overlap and funding. A further drawback can be related to the
difficulty of recognizing the value of intermediating role among the variety of tasks
performed by a multi-actor network. This may lead innovation brokerage activities to be
economically non-self-sufficient and, thus, impossible to exist without public funding
schemes. Cristiano and Proietti (2014), in a study that aim to profile the innovation brokerage
model applied in Italy, synthesize the functions described by the European Commission and
those described by the literature in eight tasks:
! Discovering innovative ideas, identifying and articulating farmers’ needs;
! Connecting partners, identifying suitable partners from different knowledge fields;
! Supporting partners to refine the idea, articulating their demands and expectations;
! Identifying funding;
! Preparing the project proposal;
! Coordinating/ facilitating, leading the dialogue and the learning process;

30
! Running innovation, playing a role in initiating, developing and testing an
innovation;
! Communicating results, carrying out effective dissemination activities addressed to
transfer knowledge on the innovations.
Moreover Cristiano and Proietti (2014) in their work show that the implementation of
measure 124 of RDPs in Italy has driven a variety of actors belonging to AKIS (Agricultural
Knowledge and Innovation System) , innovation center, university and research centre,
farmers, LAGs, Producer Organization (PO), cooperatives, consortiums, local administration,
to self-organize themselves and establish partnerships for the specific purpose of developing,
through cooperation, innovation projects and demonstrate that the involvement, as innovation
brokers, of actors who are already part of the system and who also play a role in the
implementation of the project, lets the innovation process be more sustainable, avoiding the
risk of projects that do not necessarily address the real needs of change of the farmers or the
group, and promotes a collaborative learning environment.
Regarding to the last task described by Cristiano and Proietti (2014), how the innovation
broker should implant useful information into a farmer’s networks about a new technology so
that it reach the maximum number of individuals? The logic answer to this question is that
the innovation broker to pass information about the novelty to the maximum number of
potential adopters and to obtain the highest diffusion level should choice as injection points
the most influent actors in the farmers’ network. In social network literature have been
described different algorithms to identify influential spreaders in networks, among which
there is a recent algorithm developed by Morone and Makse (2015) that are discussed in the
following paragraph.
3.2 Different methods for the innovation broker to carry out effective dissemination activities
Localizing in a network the optimal (minimal), set of structural nodes, called influencers,
which, if activated, would cause the spread of information to the whole network (Domingos
et al. 2002) is one of the most important problems in network science (Kempe et al. 2003,
Newman 2010).
This problem has been heuristically adressed as (like) a problem that leads to the
identification of the nodes suitable for the optimal network’s fragmentation.
31
Heuristic methods quantify node’s importance in a network (Newman 2010; Kleinberg
1999), on the basis of individual’s node attributes such as: 1) Closeness Centrality; 2)
Betweenness centrality (BC); 3) Eigenvector Centrality (EC); 5) High-Degree (HD).
1) Closeness Centrality (CC) (Bavelas 1950) measures how close a vertex is to all other
vertices in the graph. More precisely CC at node i is the inverse of the average distance to all
other nodes. Nodes are ranked according to their CC from the highest to the lowest score, and
removed accordingly. A property of CC is that it tends to give high scores to individuals who
are near the center of local clusters (i.e. network communities), and hence it over-allocates
spreaders (or immunized nodes) next to each other. Moreover, it comes with a high
computational cost that prevents the application to large networks.
2) Betweenness centrality (BC) (Freeman, 1977). Betweenness centrality of node i is the sum
of the fraction of all-pairs shortest paths that pass through i. BC is a very popular tool for
network analysis, which has applications in different fields, from community detection to the
human brain. However, it comes with a high computational cost that prevents the
examination of large graphs of interest. The best algorithm for BC computations has O(NM)
time complexity for unweighted networks with N nodes and M vertices. It is not fast enough,
for example, to handle our 10+ million people network. It does not outperform other
centralities.
3) Eigenvector Centrality (EC). It is an alghoritm introduced by Straffin in a work of 1980
and it corresponds to the largest eigenvalue of the adjacency matrix. Node rank is the
corresponding entry of the eigenvector. Nodes are removed starting from the highest rank.
This method is not very powerful, especially for the case of SF networks, where most of the
weight may be carried by few nodes (hubs), while the others have vanishingly small weights,
and thus they are not properly ranked.
4) PageRank (PR) (Brin and Page 1998). It is the famous algorithm used by Google for
ranking websites. It consists in condensing every page in the World Wide Web into a single
number, its PageRank. PageRank is a global ranking of all web pages, regardless of their
content, based solely on their location in the Web's graph structure. PR can be thought of as
the most successful rank, ever. At its heart, it is another eigenvector centrality. It computes
the probability that, if someone follows links on the web at random, performing a random
walk of clicks, he/she eventually hits your website. The higher this chance, the higher the PR
of the website. Therefore, sites that get linked more are considered reputable, and, linking to
other websites, they pass that reputation along. Thus, the shortcoming with PR comes from

32
the fact that PR takes node's score into account when calculating other's scores. In other
words, a high-PR site may confer a much higher score to otherwise unpopular sites it happens
to link. Notice that in our algorithm using the non-backtracking operator this problem is
cured nicely, since the infuence is computed by "ignoring" the node you come from.
5) High-Degree (HD) (Pastor-Satorras et al. 2001, Albert et al. 2000, Cohen et al.2001).
According to this method nodes are ranked by degree, and sequentially removed starting
from the node of highest degree. One of the limitations of this method is the fact that hubs
may form tightly-knit groups called\rich-clubs" (Colizza et al. 2006, Wasserman 1994).
Strategies based on high-degree will highly rank these rich-club hubs. On the other hand, an
optimized scheme will target only one of them to avoid overlap between the already attacked
areas in the network. High Degree Adaptive (HDA) is the adaptive version where the degree
of the remaining nodes is recomputed after each node removal.
All these methods based on individual node ranking consider the influencers as isolated
entities and not the interaction with each other, so they not optmize an objective global
function of influence, this means that the removal of some nodes, based on one of the
heuristic methods described previously, doesn’t guarantee the maximum distruption on a
network. Morone and Makse (2015) face this problem by mapping the integrity of a tree-like
random network into optimal percolation (Hashimoto 1989; Karrer et al.2014) theory. From
this, they derive an energy function with a minimum that corresponds to the set of nodes that
need to be eliminated, to yield a network whose largest cluster is as small as possible. To do
this, Morone and Makse (2015) introduced the concept of collective influence, an algorithm
that allows them to efficiently dismantle networks. They define the collective influence of a
network node as the product of its reduced degree (the number of its nearest connections, k,
minus one), and the total reduced degree of all nodes at distance d from it (defined as the
number of steps from it).
CI (i) = (ki – 1) Σ (kj – 1) (3.1)
Collective influence describes how many other nodes can be reached from a given node,
assuming that nodes of high collective influence have a crucial role in the network. The
collective-influence-based algorithm then sequentially removes nodes, starting with those
that have the highest collective influence (known as influencers) and recalculating the
collective influence of the rest following each operation. The authors show that, for large

33
networks, removing the set of influencers identified by this algorithm is more effective in
fragmenting a network than removing the hubs, or than removing nodes that are identified
through other algorithms, such as degree or closeness centrality. The set of influencers
identified by the authors contains many nodes with few connections. This highlights the fact
that the importance of a node in ensuring a network’s integrity is determined not only by the
number of direct links it has to other nodes, but also by which other nodes it is connected to.
Morone and Makse concluded in their work that the influencers founded by collective
influence are more effective in destroying a network than nodes selected by other methods,
like for example the high degree method. Kovacs and Barabasi, 2015 showed an example of
this optimal network disaggregation (see Fig. 2.4.1).
Figure 3.3.1 - Optimal network demolition
Source: Kovacs and Barabasi, 2015
In the network showed in figure a), for d = 2, the red node with k = 4 has the highest
collective influence, because the total reduced degree of the nodes at d = 2 from it (green and
yellow circles) is 21. This yields a collective influence of 3 • 21 = 63. The most connected
hub, with k = 6 (yellow circle), has a collective influence of 60. Figure b), show what
happens if the 6 nodes with the highest k (white circles) are removed. This one causes
considerable damage to the network, but leaves a sub-network that contains 12 nodes
unperturbed. In figure c, by contrast, the removal of four influencer nodes (white circles)
chosen according to their collective influence lead to a fragmented network in which the
largest connected cluster that remains has only ten nodes. The major finding of the
contribution of Morone and Makse (2015) is the elaboration of an algorithm that allows
identifying the members of the network having the most capillary influence on the rest of the

34
web (influencers). In this thesis I stress that the disconnection of these influencers leads to the
optimal fragmentation of the web, regardless the overall characteristics of the network, that
is the optimal disconnection is reached both in sparse and cohesive network with many or
few members. On the basis of these observations, I expect that i) also in very dense networks
the injection points characteristics are not indifferent to the final rate of adoption; ii) the final
rate of adoption is higher if the injection points are chosen according to the CI algorithm
rather than the other centrality measures; iii) and the maximum number of adoption is
reached earlier.
From these derives the fundamental hypothesis of the present work:
Hypothesis 1: The diffusion rate reached during the diffusion campaigns is not invariant with
respect to the role and the position of the injection points chosen, even in very dense
networks.
Hypothesis 2: the diffusion rate reached in the diffusion campaigns realized using as
injection points the agents with the greater CI is higher than those reached in the diffusion
campaign realized using as injection points the actors with higher traditional network
centrality (e.g. degree centrality).
Hypothesis 3: the time taken to reach the maximum number of adopters in the dissemination
campaigns realized using as injection points the agents with the higher collective influence, is
less than the time taken to reach the maximum number of adopters in the diffusion campaigns
realized using as injection points the agents with the higher traditional network centrality
(e.g. degree centrality).
These hypothesis are tested basically comparing the diffusion performances, in the network
identified by the case study, obtained choosing the injection points with different criteria. In
particular, the first hypothesis is tested comparing the diffusion performances obtained with
CI and Degree Centrality (DC) vs. random.
Following Morone and Makse (2015) that developed their line of research comparing CI and
DC, the second and the third hypothesis are tested comparing the performance of the CI with
those of the DC. This comparison was made not on real data that do not exist on the
innovation diffusion studied in this work, but on the results of an Agent Based Model
calibrated on real world data resulting from a survey and an interviews specifically realized.
The model will be presented in the fifth chapter following, in the next chapter, the literature
review of the models that are more used to analyze the innovation diffusion.

35
CHAPTER 4
DIFFERENT MODELS TO STUDY DIFFUSION OF
INNOVATIONS

36
4.1 Introduction
Adoption and diffusion of a new technology have been widely studied from different
perspectives. Many studies in adoption and diffusion of innovation are rooted in the work of
Bass, who formalized the aggregate level of penetration of a new product emphasizing two
processes of communication: external influence via mass media and internal influence via
word-of-mouth (Bass, 1969). The decision is described as the probability of adopting a new
product and is assumed to be linearly dependent on these two communication processes and
fits very well with the real data for durable goods. While the Bass model is very useful for
forecasting the initial adoption of a product, the model assumes an homogeneous consumer
group as it does not specify micro-level decision-making. It also assumes perfect mixing in
which all consumers have the same probability of connecting with other consumers without
specifying how consumers communicate and influence each other. Social and behavioural
research, meanwhile, has focused on the micro-level drivers of adoption, which contribute to
the understanding of micro-level factors determining the adoption by individual consumers
(e.g., Rogers, 2003). These studies emphasize that technical features do not entirely explain
the diffusion dynamics of new technologies and highlight the relevance of the human factor.
Furthermore, other studies have indicated that not only agent heterogeneity (Andrews and
DeVault, 2009; Delre et al., 2007) but also social influence and network configuration
(Kuandykov and Sokolov, 2010; Bohlmann et al., 2010; Delre et al., 2010) affect diffusion of
innovation. Consequently, both social and psychological factors need to be considered when
describing and predicting the behaviour of consumers.
ABM, which is typically a bottom-up approach, in the sense that the system features emerge
as the result of the interaction of its components, is capable of capturing those factors. It
starts from modelling consumer’s decision-making and simulates the diffusion as an
aggregate process of individual adoption decisions. This is a suitable approach when
information exchange in a social network and individual heterogeneity play a role
(Rahmandad and Sterman, 2008). Despite its capability, ABM has mostly been applied as an
experimentation tool to demonstrate diffusion patterns resulting from simple decision rules
followed by different artificial agents in the system (e.g., Janssen and Jager, 2002; Andrews
and DeVault, 2009; Delre et al., 2007, 2010).
So we can group the diffusion models essentially into two categories: the aggregate models
of innovation diffusion and the individual level models of innovation diffusion, among which
there are ABMs.

37
4.1 Aggregate models of innovation diffusion
In 1969, Bass published a seminal paper on the adoption of innovations (Bass 1969). His
model was based on generalizations of empirical diffusion data for consumer durables, such
as fridges, TVs, tumble driers, and air conditioners. The General Bass Model describes
cumulative adoption as an “S”-curve. For a given innovation in general, initially there are
only a few adopters, called innovators. Others learn from the innovation from various
sources, including from the innovators, and occasionally adopt. The s-shaped adopter
distribution rises slowly at first when there are few adopters in each time period. It then
accelerates to a maximum until half of the individuals in the system have adopted. It then
increases at a gradually slower rate as the few remaining individuals finally adopt (see Figure
4.1). Two indicators measure the performance in Bass's model: Speed and level of adoption.
Figure 4.1 – Cumulative adoption as an S-curve
Source: adapted from Rixen and Weigand 2013
Consumer durables with short product lifecycles, high risk to be imitated, and/or huge
development effort rely on fast speed. Therefore, quickly attaining a critical mass of adopters
is crucial. A sufficient number of individuals needs to adopt the new product to induce a self-
sustaining continued adoption (Rogers 2003). Especially high-tech companies rely on fast
spread of their products. Level describes the innovation's penetration rate (also referred to as
saturation).
Following Rogers (1962) diffusion of innovations theory, Bass characterizes the diffusion of
an innovation as a contagious process driven by external influence (e.g. advertising, mass
media) and internal influence (e.g. word-of-mouth).

38
Based on this original formulation, a number of efforts have been made to extend and refine
the Bass framework to reflect the complexity of new product growth. One of the advantages
of this modelling paradigm is that it provides a parsimonious and analytically tractable way
to look at the whole market and interpret its behaviour. A related advantage is that these
models make use of market level data to forecast sales, which is typically more readily
available than individual-level data. Assuming that sufficient data points are available, the
model can be fitted to early sales data to obtain parameter estimates for new products. For the
Bass model, the well-researched estimation literature covers a number of estimation methods,
including ordinary least squares (Bass 1969), maximum likelihood (Schmittlein and Mahajan
1982), nonlinear least squares (Srinivasan and Mason 1986) and genetic algorithms
(Venkatesan et al. 2004). The Bass model fits many historic data on completed diffusion
processes well (cf. Sultan et al. 1990) and is excellent at backcasting.
Aggregate models are typically based on a formulation of differential equations that specify
the flow(s) between mutually exclusive and collectively exhaustive subgroups such as
adopters and non adopters (Chatterjee and Eliashberg 1990). This modeling paradigm has
produced a rich stream of literature which has been reviewed by numerous authors. Mahajan
and Muller (1979) review early contributions, Mahajan et al. (1990, 1995, 2000) provide an
overview of the Bass model, its extensions and applications, Sultan et al. (1990) meta-analyse
213 estimates of innovation and imitation parameters of the Bass model, and Parker (1994)
reviews theoretical origins, specifications, data requirements, estimation procedures and pre-
launch calibration possibilities for aggregate models. More recently, Meade and Islam (2006)
review the wealth of literature from a forecasting perspective and conclude that few research
questions have been finally resolved.
Although diffusion modelling has become a vibrant research tradition, most reported works
has consisted of refinements and extensions of the Bass diffusion model without alteration of
its basic premises (Mahajan et al. 1990; Bemmaor 1994). Most models therefore still show
the structure of the basic epidemic model introduced by Bass.
Traditional aggregate models are not behaviourally based (Goldenberg et al. 2000). It is
therefore not surprising that these models do not reproduce the complexity of real-world
diffusion patterns.
Also, while the two coefficients of Bass-type models have appealing interpretations (internal
and external influence, respectively), it is not clear whether they truly reflect the underlying
diffusion mechanisms. Hohnisch et al. (2008) therefore refer to these models as
39
“phenomenological” and thus underline that they provide empirical generalizations and do
not aim to explain the mechanisms that cause diffusion processes.
The mathematical form of the Bass model requires the assumption that the potential adopter
population is homogeneous (Tanny and Derzko 1988; Chatterjee and Eliashberg 1990;
Bemmaor 1994; Van den Bulte and Stremersch 2004), which may be considered a gross
simplification since potential adopters are typically heterogeneous in economic factors such
as income, in their individual preferences, the information they have etc., and consequently in
their propensity to adopt. The heterogeneous population argument was already used by
Rogers (1962), who defined five adopter categories based on propensity to adopt.
To consider heterogeneity in traditional diffusion models, compartmental approaches were
developed that aggregate the population into a relatively small number of states such as
unaware, aware, in the market, adopters etc. (e.g., Urban et al. 1990). However, compartment
models still assume homogeneity and perfect mixing within compartments and do not
consider heterogeneity in individual attributes and in the network structure of interactions
(Rahmandad and Sterman 2008).
Due to the parsimonious structure of aggregate models, it is also not possible to distinguish
effects of different social processes on diffusion. In the Bass model, for example, the internal
influence parameter p is often interpreted as word-of-mouth (hereafter WoM). However, it
can also capture imitation effects such as social learning, social pressures, or network effects
(Van den Bulte and Stremersch 2004). Furthermore, Bass-type models make very specific
assumptions about the structure of social interactions. The formulation implies a fully
connected social network in which everyone in the target population is directly connected to
everyone else, and can potentially influence all others (Shaikh et al. 2006). It also presumes
that the influence of adopters on non-adopters is a linear function of the number of adopters
throughout the diffusion periods. Because of these simplifying assumptions, the coefficient of
imitation cannot be expected to directly reflect the underlying social mechanisms that shape
diffusion processes.
Managers planning the introduction of a new product are interested in predicting the effects
of the decision variables at their disposal, most notably the marketing mix factors product,
price, promotion, and distribution, none of which were initially considered explicitly in early
diffusion models.
This issue has been recognized and various authors have included marketing mix variables
into aggregate diffusion models in order to better describe reality and potentially provide

40
directions for how to alter the diffusion process by manipulating those variables (Ruiz-Conde
et al. 2006). In particular, marketing mix variables considered include price (Robinson and
Lakhani 1975; Bass 1980; Feichtinger 1982; Jain and Rao 1990; Bass et al. 1994, 2000),
distribution and supply restrictions (Jones and Ritz 1991; Jain et al. 1991), and promotion and
advertising (Dodson and Muller 1978; Horsky and Simon 1983; Simon and Sebastian 1987;
Dockner and Jorgensen 1988; Bass et al. 1994).
Many of the issues and limitations outlined here can be overcome through an individual-
based modelling approach, which will be discussed in the following section.
4.3 Individual level models of innovation diffusion
One of the first micro models of innovation diffusion was introduced by Chatterjee and
Eliashberg (1990), who propose an analytic method to aggregate individual-level behavior
based on specific heterogeneity assumptions. They consider perception of the innovation,
personal preference, and the perceived reliability of information as individual-level
determinants of adoption. They also provide a closed formulation of the interface between
individual and aggregate level to link individual decision-making and aggregate dynamics.
However, the analytical tractability of the model hinges on limited analysis of aggregated
variables and consumer characteristics (Delre 2007).
The framework also cannot incorporate heterogeneity related to linkages in the social
network (Bohlmann et al. 2010). Chatterjee and Eliashberg’smodel generated much interest
on the impact of heterogeneity in diffusion models. This question has been a matter of
discussion in innovation diffusion research for a long time (cf. Rogers 1976), but due to the
limitations of aggregate models, it remained largely untackled until the advent of ABMs.
ABMs differs fundamentally from both aggregate differential equation and aggregate
simulation approaches such as system dynamics (cf. Milling 1996; Maier 1998; Milling
2002). Unlike both, it is a bottom-up, disaggregate approach and thus not limited in its
capacity to account for heterogeneity and social structure. The elementary modelling unit is
not the (complex) system, but rather the individual. In ABMs agents’ state, interaction,
internal processing, and behaviour, by contrast, tends to be more complex. and ABMs can be
based on arbitrary local interaction structures. Moreover key characteristics of agents include
autonomous behaviour, interdependency, simple rules, and adaptive behaviour (cf. Macy and
Willer 2002).
41
Finally, ABMs differ from differential equation models not only in terms of modelling
granularity, but also fundamentally in how the results are obtained. Rather than describing the
whole system directly and “phenomenologically”, macro-scale dynamics in ABMs are
emergent phenomena that arise from micro-level interactions between agents when the model
is executed.
4.4 Agent based modelling of innovation diffusion A pivotal element of agent-based diffusion models is the explicit representation of
consumers’ decision making processes, most importantly those related to the decision to
adopt an innovation (or to reject it, which, however, is not considered explicitly in most
models). A number of both deterministic and stochastic approaches have been developed to
model these decisions, ranging from simple decision rules to sophisticated psychological
models.
The most common approach to incorporate consumers’ heterogeneity is to specify it in terms
of an intrinsic “propensity to adopt”, typically through heterogeneous adoption thresholds
drawn from a distribution. One of the first micro-simulation studies to investigate
heterogeneity in this manner was conducted by Goldenberg et al. (2000). They propose a
cellular automata model in which cells are characterized by an adoption threshold that is
randomly drawn between zero and one and interpreted as a “quality expectation”. The spread
of an innovation with a certain fixed “product quality” is modelled spatially on a lattice in
which cells decide whether or not to adopt once a sufficient number of neighbouring cells
have adopted. Simulation results exhibit strong fluctuations in sales and suggest that
heterogeneity may have a strong influence on innovation diffusion.
Delre et al. (2007a,b, 2010) also use heterogeneous adoption thresholds in their models. They
interpret these thresholds as “utility aspiration levels” and specify them as weighted sums
(with heterogeneous weighting factors) of two separate threshold functions: (1) a social
utility threshold, i.e., a minimum fraction of adopters in the social neighbourhood, and (2) a
utility threshold function based on agents’ heterogeneous “quality expectation”. They find
that increasing heterogeneity accelerates diffusion because the critical mass is reached sooner
than in homogeneous populations (Delre et al. 2007b). In addition to an adoption
(“exposure”) threshold, Alkemade and Castaldi (2005) introduce an “over-exposure”
threshold to incorporate the idea that innovations tend to be considered no longer
“fashionable” once their user base becomes too large. Each agent adopts when the proportion

42
of adopters in their neighbourhood exceeds its exposure threshold, but remains below its
over-exposure threshold. Heterogeneity in both thresholds is introduced by drawing the
exposure threshold from a uniform distribution and adding a fixed value to obtain the over-
exposure threshold. While heterogeneity is incorporated in the model, the effect of varying
degrees of heterogeneity are not analysed in the paper.
A conceptually different, but structurally very similar approach is to model heterogeneity in
terms of varying individual reservation prices. Cantono and Silverberg (2009) follow this
approach and investigate the path of diffusion of a new energy technology when some
consumers are willing to pay more for goods that are perceived as “green”.
Agents adopt once any of their neighbours has adopted and the price falls below their
individual reservation price drawn from a lognormal distribution. Learning economies reduce
the price as a function of the extent of previous adoption, which may lead to delayed adoption
for a certain range of initial conditions. Results indicate that a limited subsidy policy can
trigger diffusion that would otherwise not happen when reservation prices are heterogeneous,
learning economies are in a certain range, and initial price levels are high. Hohnisch et al.
(2008) also model heterogeneous reservation prices, but draw them uniformly and
independently. Agents adopt once the price falls below their reservation price, which is
interpreted as a subjective “individual valuation”. The authors also formulate an extended
model in which these “individual valuations” are time-dependent. They explain the empirical
finding of a delayed “take-off” of a new product by a drift of the percolation dynamics from a
non-percolating regime to a percolating regime which occurs because the probability of
buying increases over time with the cumulative number of buyers. Heterogeneity in
reservation prices plays a critical role in this process and determines whether diffusion takes
place or fails.
In a comparison of agent-based and differential equation-based diffusion models, Rahmandad
and Sterman (2008) investigate the impact of heterogeneity in terms of contact frequency.
They model the spread of a contagious disease and therefore do not incorporate deliberate
adoption decisions, but rather model adoption as state changes triggered by a stochastic
processes. Nevertheless, they stress that results extend beyond epidemiology to innovation
adoption. With respect to heterogeneity in individual contact rates, they find that it causes
slightly earlier mean peak times as high-contact individuals rapidly seed the epidemic,
followed by lower diffusion levels as the high-contact individuals are removed, leaving those
with lower average transmission probability and a smaller reproduction rate. Note, however,

43
that although the authors emphasize the transferability of results, caution is required when
translating these findings to an innovation diffusion context.
A more empirically-oriented approach to represent heterogeneity in propensity to adopt is to
link it directly to individuals’ sociodemographic characteristics. While such an approach
compromises explanatory power, it has the advantage that empirical data (if available) can be
used more easily. Dugundji and Gulyás (2008) follow this approach in investigating the
impact of heterogeneity on the adoption of transportation mode alternatives and use empirical
pseudo-panel micro data to parameterize their model. They consider both observed
heterogeneity (in terms of sociodemographic characteristics, individual-specific attributes of
the choice alternatives, and the availability of alternatives) and unobserved heterogeneity (in
terms of common unobserved attributes of the choice alternatives in the error structure of
their econometric estimation model). They find that heterogeneity has a dramatic impact on
the magnitude of the transportation mode shares, on the speed of the transition to a steady
state, and very fundamentally on the number of possible observable steady-state solutions and
conclude that “heterogeneity cannot be ignored in any true empirical application”. In all of
the papers referred to above, heterogeneity is found to affect the diffusion of innovations
considerably. It may cause fluctuations in sales, delay take-off, result in irregular diffusion
patterns that deviate significantly from the typical s-shaped curve, and explain diffusion
failure, all of which are phenomena that are frequently observed in the diffusion of real
products.
ABMs offer researchers the opportunity to explicitly model the interactions that exert social
influence, and thereby allow them to take the structure of social interactions into account.
Social influence is a generic concept that can operate on multiple levels:
! Micro-level social influence is transmitted locally through pairwise communication links.
WoM is arguably the most relevant form of micro-level social influence. Evidence of its
powerful role in the diffusion of innovations is well documented in both industry market
research and scholarly research (e.g., Arndt 1967; Reingen and Kernan 1986; Brown and
Reingen 1987; Mahajan et al. 1990; Herr et al. 1991; Buttle 1998). Many of the reviewed
models incorporate positive WoM mechanisms, and few of them (Moldovan and Goldenberg
2004; Goldenberg et al. 2001; Deffuant et al. 2005) also consider negative WoM, which
evidence suggests has a much stronger effect than positive WoM (Richins 1983).
! Meso-level social influence is the influence that stems collectively from an agent’s immediate
social environment (i.e., neighborhood in the social network). Concepts associated with

44
meso-level social influence include group conformism, social comparison, herding
behaviour, local network externalities, and conspicuous consumption, which holds that the
intrinsic value of a products may be less important than the social meaning (Veblen 1899).
! Macro-level social influence can be considered as the global interactions at the level of
society as a whole. Examples for this type of influence include influence of the aggregate
network-level opinion (e.g., Deroïan 2002) or macroeconomic feedbacks (externalities) such
as learning effects, which are based on cumulative sales (e.g., Hohnisch et al. 2008).
In order to model micro- and meso-level social influence, it is necessary to define the
topology of interactions between agents. Consumer agents and the links they have with each
other form a graph that represents the social network in which interactions take place.
Whereas the Bass model formulation implies a fully-connected social network, ABMs may
use more realistic interaction topologies that resemble real-world social networks relying on
generative algorithms to systematically create graphs that reproduce characteristic features of
real-world social networks.
One of the first and most generic generative graph algorithms is the random graph model
introduced by Gilbert (1959) and, more commonly acknowledged, by Erdos and Rényi
(1960). This graph model is used prevalently in diffusion models and often serves as a
baseline for comparisons with other network structures. The diameter of the resulting random
graphs tends to be small, i.e., the largest number of links on the shortest path between any
two nodes is small, which is a characteristic the generated graphs share with most real-world
social networks (Travers and Milgram 1969). In reality, however, social networks tend to be
highly clustered, which means that the probabilities of nodes being connected are not
independent, but triadic closures are likely. More precisely, there are higher conditional
probabilities that an arbitrary pair of nodes are linked, provided both are linked to a third
node. In a social context, this means that networks tend to be “cliquish”, i.e., A being linked
to B as well as to Cimplies a strong likelihood that C is also linked to B. Networks that have a
small diameter and are also highly clustered are called small world networks and can be
generated by means of a generative algorithm developed by Watts and Strogatz (1998),
which interpolates between random and regular networks.
Finally, a notable characteristic of many social networks is the relatively high number of
nodes with a degree that greatly exceeds the average (where “degree” refers to a node’s
number of links). This corresponds to the notion that some people have a much larger number
of acquaintances than others and serve as “hubs” in the network. More specifically, many

45
(but not all) social networks exhibit the scale-freeness property, i.e., the probability P(k) that
a node in the network is connected to k other nodes decays as a power law (Barabási and
Bonabeau 2003). A network model that captures this characteristic was proposed by
Barabási and Albert (1999). It starts with a few nodes linked to each other; nodes are added
one by one and attached to existing nodes with probabilities according to the degree of the
target node. Therefore, the more connected a node is, the more likely it is to receive new
links. More works incorporate social influence either as the spread of awareness of an
innovation, positive or negative WoM, or by considering the share of adopters in the agent’s
network neighbourhood when making adoption decisions. Thiriot and Kant (2008) propose
an entirely different approach which allows them to study social representations of
innovations. They formalize beliefs and messages as associative networks that consist of
directed associations between concepts. Consumer agents embody a belief base, a list of
currently salient social objects, and are linked to an agent profile which contains the default
exposure to mass channels, background knowledge, and subjective production of knowledge.
Agents communicate and exchange messages, which contain transmissible associative
networks that may cause them to revise their beliefs.
Advances in network modelling and the development of generative algorithms for small-
world (Watts and Strogatz 1998) and scale-free (Barabási and Albert 1999) networks have
strongly stimulated research in this area. A number of authors (Alkemade and Castaldi 2005;
Delre et al. 2007b; Kocsis and Kun 2008; Martins et al. 2009; Choi et al. 2010) have analysed
diffusion in small-world networks with varying degrees of randomness.
Alkemade and Castaldi (2005) compare diffusion in regular, random, and small-world
networks and vary network density as well as “exposure” thresholds (i.e., minimum
proportion of adopters in the neighbourhood) and “over-exposure” thresholds (i.e., maximum
proportion of adopters in the neighbourhood). The latter thresholds inhibit adoption if the
proportion of adopters in the social neighbourhood is already too large for it to still be
“fashionable”. Results indicate that in a sparse network cascades occur even when
consumers’ exposure threshold is high. As the network density increases, cascades become
more unlikely and the critical exposure threshold becomes smaller. The authors find that the
critical exposure thresholds are similar for small-world and regular networks. On the random
network, no cascades occur if the density is sufficiently low, because the network becomes
disconnected.
46
Delre et al. (2007b) also compare various interpolations between regular and random
networks, but base their model on different assumptions. They do not consider
“overexposure” and model agents’ decision making by means of a threshold function that
consists of an individual utility part (obtained if the quality of the innovation exceeds a
threshold) and a social utility part (obtained if the fraction of adopters in the agent’s social
neighborhood exceeds a threshold). Results indicate that innovations diffuse faster in more
regular (i.e., clustered) networks than in random networks because individuals are exposed to
more social influence and may therefore decide to adopt sooner. As a unique contribution
among all reviewed papers, the authors also investigate how the dimension of personal
networks affects the diffusion and conclude that bigger personal networks are associated
with slower diffusion, particularly in random networks.
A different modelling approach is taken by Kocsis and Kun (2008), who focus on the
diffusion of telecommunications technology, an industry characterized by strong positive
network externalities. They develop an opinion dynamics model in which adoption decisions
depend on a cost minimization procedure that is based on the number of agents in the
personal network that decide to adopt or reject a technology. The proposed model constructs
a small-world type network starting from a square lattice topology with periodic boundary
conditions and randomly rewiring edges. The
authors vary the share of rewired edges and find that in the presence of network externalities,
rewired edges (i.e., increasing randomness) can facilitate but can also hinder diffusion,
depending on how advantageous the advanced technologies are in comparison with the lower
level ones.
In many of the reviewed models, agents’ decision to adopt is considered a signal in favour of
an innovation by neighbouring agents. An interesting approach is to also interpret
neighbours’ refusal to adopt as evidence against the product. Martins et al. (2009) formulate a
model that incorporates this idea by means of a Bayesian system. To examine the impact of
small-world effects, they conduct experiments with a regular square lattice topology and
varying degrees of random rewiring. Results
show that more rewiring (i.e., a higher degree of randomness) is associated with faster
diffusion and an increased final proportion of adopters, which contradicts results by Kocsis
and Kun (2008). This can be explained by the differing modelling assumptions.
Whereas Kocsis and Kun (2008) model only positive feedback effects due to externalities,
Martins et al. (2009) also implicitly model a “diffusion of rejection”, which may spread faster

47
in more clustered networks. The authors also study the influence of the location of early
adopters, comparing instances of clustered versus randomly scattered “seed” adopters (1% of
the population) and find that the process of innovation diffusion from an initial cluster is
much slower than in the case of randomly spread adopters.
Motivated by the question why diffusion sometimes propagates throughout the whole
population and why at other times it halts in its interim process, Choi et al. (2010) study the
diffusion of network products in random and small-world networks. They specify the
consumers’ willingness to adopt as a function of the product’s intrinsic value perceived by
each consumer (normally distributed constant) and the benefit due to local network effects
based on the proportion of adopters in the agent’s neighbourhood. In line with results of
Kocsis and Kun (2008), they find that network structure plays a moderator role for the link
between network effects (i.e., positive externalities of adoption) and innovation diffusion.
Results also suggest that a new product is less likely to reach full diffusion in random
networks than in cliquish networks because randomness in the topology makes it harder for
an innovation to build up network benefits at the initial stage. However, once the diffusion
process reaches a critical mass, diffusion is faster in a random network.
Scale-free network topologies (Barabási and Albert 1999) have also attracted considerable
interest, although somewhat less than small-world networks, which appear to be more
appropriate interaction models for many (but not all) markets. A paper that focuses
exclusively on comparing the diffusion in scale-free and random networks was put forth by
Kuandykov and Sokolov (2010). In their model, consumers adopt with a probability that is
determined by the fraction of adopters in the neighbourhood and two fitting parameters that
control time to adoption start and S-curve steepness, respectively. System behaviour and the
resulting shape of the diffusion curve are a direct consequence of the choice of these two
aggregate-level parameters. Based on (only) a single replication per condition analysed in the
paper, the authors observe faster adoption for a random network compared to a scale-free
network with the same number of nodes. However, time to full adoption in the random
network tends to grow with the number of links. Results also indicate that innovation spreads
remarkably faster through what the authors refer to as a “clustered random network” (a
network in which agents are distributed among three clusters that are then connected
sequentially) than through one uniform cluster with the same total population and the same
number of initial adopters.

48
Few authors have compared all three of the most common network topologies so far. The
first paper to compare the effect of small-world and scale-free networks on market dynamics
was put forth by Janssen and Jager (2003). They model agents’ behaviour from a social
psychology perspective and adopt the “consumat” approach (Jager et al. 2000), which
incorporates alternative assumptions on behavioural rules. The proposed model simulates
market dynamics that emerge from agents’ choice between multiple products which are
replaced as soon as they become unprofitable. It is not a dedicated diffusion model, but
results relate to innovation diffusion nonetheless. Findings indicate that a scale-free network
leads to a market dominated by far fewer products as opposed to a small-world network.
Results also show that in scale-free networks, a small proportion of consumers (hubs, or early
adopters) may have an exceptional influence on the consumptive behaviour of others.
Rahmandad and Sterman (2008), while primarily concerned with comparing stochastic agent-
based and deterministic differential equation models, also study the impact of different
network structures. In particular, they compare fully connected, random, small-world, scale-
free and lattice networks. In line with previous research, they find that higher clustering
slows diffusion to other regions, because it increases the overlap in contacts among
neighbours. In the small-world and regular lattice networks, this leads, on average, to lower
peak prevalence and higher peak times. Because the model is concerned with the spread of
contagious diseases, one should be cautious when interpreting results from an innovation
diffusion perspective.
One of the most comprehensive studies on the impact of social network topology to date was
conducted by Bohlmann et al. (2010), who compare diffusion in cellular (Moore
neighbourhood), random, small-world, and scale-free networks. Furthermore, they also study
how the strength of communication links between two market segments—an innovator
segment and a follower segment—affects diffusion. They formulate a model with
probabilistic adoption (p = 0.5) when a threshold (proportion of adopting neighbours) is
reached. By varying this adoption threshold, the authors find that it affects the likelihood of
diffusion cascades differently among the various network structures: diffusion appears more
likely in clustered networks under high adoption
thresholds. The random network exhibits more consistent peak adoption across threshold
levels. Moreover, the effect of network structure becomes more significant when agents’
adoption threshold increases. For the two-segment model with varying link strength between
innovator and follower market segments, results unsurprisingly indicate that an early

49
emphasis on innovator adoptions rather than innovator-to-follower communications can
speed market adoption when follower communications are weak.
The authors conclude that network topologies are a key factor in determining an innovation
diffusion process and its pattern and that in particular highly clustered networks can have
substantially different diffusion patterns than more randomly connected networks.
In order to model the effect of social hubs in the diffusion process, Delre et al. (2010) test the
impact of the number of contacts as well as degree and direction to which social influences
determine individual’s choice to adopt. Like in previous work (Delre et al. 2007a,b), agents’
decision making is based on heterogeneous utility thresholds defined as the sum of social and
individual utility parts. However, unlike in prior contributions, the authors use “broad-scale”
networks (Amaral et al. 2000), i.e., scale-free networks with a cut-off parameter (faster decay
of the number of links) to structure interactions and motivate this with constraints people
often have in building links with other people. Furthermore, their approach differs from prior
work in that connections can be directed and weighted. In particular, they assume that the
influence of a neighbour is proportional to the number of links it has and that the probability
of directing the link from i to j depends on the number of links that i and j have. Results
demonstrate that social influences can have a positive effect on the diffusion of the
innovation if a given critical mass is reached, but also can have a negative effect otherwise.
Social influence may decrease the chances for the diffusion to spread significantly if the
innovation is of lower quality (i.e., induces less individual utility) and thus hardly reaches the
critical mass. Uncertainty about the innovation success therefore increases in more socially
susceptible markets. These results dissent with the common intuition that fashionable markets
are easy to penetrate because consumers tend to copy each other. When the weights are
stronger for those neighbours that have more relationships, the innovation reaches higher
degrees of penetration. However, this effect is relatively small compared to other network
factors. The direction of the relationships among consumers does not substantially affect the
final market penetration. Finally, results indicate that innovations have, on average, fewer
chances to spread in markets with high social influence.
Adopting Granovetter’s “strength of weak ties” theory (Granovetter 1973), Goldenberg et al.
(2001) break down the personal communication between closer and stronger communications
that are within an individual’s own personal group (strong ties) and weaker and less personal
communications that an individual has with a wide set of other acquaintances and colleagues
(weak ties). They formulate a cellular automata model that does not explicitly represent

50
agents’ adoption decision processes, but rather models the spread of information about an
innovation by means of probabilistic state changes of passive cells. The probability of an
individual cell becoming informed is based on probabilities of becoming informed via weak-
tie WoM, strong-tie WoM and exposure to marketing efforts. In their full factorial
experimental design the authors systematically vary these three probabilities as well as the
size of each individual’s personal network and the number of weak tie contacts. Results
indicate that the influence of weak ties on information dissemination is at least as strong as
the influence of strong ties and that the process is dominated by WoM rather than by
advertising.
Summarizing results of the reviewed studies, it can be concluded that the topology of the
social network involved in consumers’ decision making is consistently found to have a large
impact on innovation diffusion. Random networks, as opposed to more regular or more
clustered ones, tend to favour the spread of information and they are therefore frequently
associated with faster diffusion and an increased share of adopters at the end of the diffusion
process. However, in markets in which positive externalities of adoption or strong meso-level
social influence (e.g., group conformism, herding behaviour etc.) exist, diffusion appears to
be both more likely and faster in more clustered networks. Social influences can have a
positive or negative effect in these markets, depending on whether a given critical mass is
reached. These markets are therefore more uncertain concerning the final success of the
innovation.
From a theory-building standpoint, the strong impact of network topologies implies that
researchers must be careful when selecting a network structure for diffusion research. One of
the concept associated with meso-level social influence is those of networks externalities.
The source of these externalities may be global or local, i.e., the utility of the innovation may
depend on the proportion of adopters in the entire social system or in the local social
neighbourhood (Goldenberg et al. 2010a).
Kocsis and Kun (2008) model local network effects in their opinion dynamics model of
telecommunications technology. However, they do not use network externalities as an
explanatory variable. Choi et al. (2010) also model the diffusion of network products, but
they focus on the role of network structure and do not study the impact of network
externalities in detail.
Goldenberg et al. (2010a), by contrast, focus specifically on the effect of network
externalities and seek to analyse their absolute impact. To this end, they formulate both an

51
agent-based and an aggregate model. In the ABM, consumers consider adoption only if the
proportion of adopters in the population exceeds an agent-specific threshold drawn from a
truncated normal distribution (this part of the formulation incorporates global network
externalities). Once this threshold is exceeded, an agent adopts with a probability determined
by two parameters, one of which controls the influence of the fraction of adopters in the
agent’s (Moore) neighbourhood on a two-dimensional lattice (incorporates local network
externalities), and the other controls the influence of “external factors” such as advertising.
The authors perform simulations with varying adoption threshold distributions and influence
parameters and demonstrate that network externalities consistently have a “chilling” effect on
the profitability of new products. They substantiate this claim by formulating an aggregate
model to which they fit empirical diffusion data on six network products and, thus, are able to
confirm the “chilling” effect of externalities.
Real-world social networks, unlike their idealized representations in most diffusion models,
are not static, but evolve over time. This may not be relevant if the speed of diffusion is faster
than changes in the social network structure and the structure of the social network is not
influenced by the innovation itself, but it may be highly relevant for certain types of
innovations. In a policy-oriented study, Deroïan (2002) therefore model the social network as
a set of relationships generated by the agents themselves. The authors thereby endogenize the
evolution of the social network as a step-by-step process based on the assumption that two
individuals are more confident in each other if they share a common opinion (i.e.,
homophily). The simulation captures the emergence of a collective evaluation of an
innovation and explains diffusion failure as the formation of a negative collective evaluation.
Unlike most other models reviewed, Deroïan uses a directed influence graph that incorporates
both positive and negative (inhibitive) influence. Drawing on ideas from the opinion
dynamics literature, the authors model adoption decisions based on individual opinions (i.e.,
continuous propensities to adopt). The formation of these opinions, as a cumulative process,
gradually increases the pressure of the whole community on individual opinions. The authors
examine the impact of receptivity and network size on opinion and diffusion dynamics.
Results confirm that the diffusion of an innovation can be affected by the state of the
influence network in the demand side and that irreversible dynamics occur in the system.
ABMs of innovation diffusion offer the potential to explicitly incorporate marketing
variables, thus allowing decision-makers to compare different scenarios and test various
strategies in what-if experiments. Promotion is by far the most widely studied marketing

52
variable in the agent-based innovation diffusion literature (Goldenberg et al. 2001; Moldovan
and Goldenberg 2004; Moldovan and Goldenberg 2004; Alkemade and Castaldi 2005;
Goldenberg et al. 2007;; Delre et al. 2007a )
An interesting promotional strategy is to leverage the important role of highly connected
individuals (i.e., “hubs” or “opinion leaders”) and use it as a marketing instrument. In a
pioneering, predominantly conceptual contribution, Valente and Davis (1999) investigate
how the diffusion of innovations can be accelerated through opinion leader recruitment. They
use homogeneous agents that adopt once 15% of their neighbours have adopted. The formal
description of the underlying model is sketchy and the network model used, which randomly
allocates seven ties per agent, does
not appear to resemble most real-world social network structures very closely. Nevertheless,
simulation results demonstrate that diffusion occurs faster when initiated by opinion leaders
rather than by random or marginal agents and that targeting opinion leaders may therefore
accelerate diffusion. Similar to Valente and Davis (1999), Delre et al. (2010) also investigate
the effectiveness of opinion leader recruitment. Results suggest that the most important
function of highly interconnected hubs is to inform others about the new products, but that
their effect on the decision making of consumers can be often overestimated. They also find
that in markets in which such hubs do not exist, diffusion is less likely to occur. For such
markets, direct-to-consumer advertising could be an alternative strategy to stimulate the
spreading of the new product in different areas of the network. Finally, van Eck et al. (2011)
also study the role of opinion leaders, but take into account not only their central network
position, but also the influence of personality traits and knowledge among influential
consumers. To this end, they extend the model developed by Delre et al. (2007a). Like in the
original model, agents’ adoption decisions are based on a utility threshold function that
includes individual preference and social influence parts. Social pressure, however, is not
modelled as a threshold, but rather as a continuum (i.e., if more neighbours adopt the product,
normative influence in favour of the product increases). Furthermore, the small-world
network used in the original model is replaced with a scale-free network to better account for
the central position of opinion leaders. The authors test critical assumptions by means of an
online survey on the WoM behaviour of children in the context of the diffusion of free
Internet games. The empirical data supports the hypotheses that opinion leaders (i) are better
at judging product quality, although they do not know more about the product, (ii) are more
innovative than followers, (iii) take more central positions in the network, and (iv) are less
53
susceptible to normative influence than followers. The authors parameterize the model
accordingly and find significant differences between networks that contain opinion leaders
and those that do not. In particular, opinion leaders increase the speed of the spread of
information, the adoption process itself, and the maximum adoption percentage. The results
indicate that targeting opinion leaders is a valuable marketing strategy not only because of
their central position, but also because of their influential power.
Overall, we can conclude that advertising can be an important driver for diffusion success,
particularly in the initial stages of information dissemination. Advertising strategies directed
at highly connected individuals can be effective in accelerating diffusion.
In the presence of negative WoM, however, too much advertising might even have an
adverse impact on innovation success. To mitigate the destructive effect of negative WoM,
firms should aim to activate opinion leaders in advance. While absence of promotional
support may lead to failure of product diffusion, optimal timing and targeting of distant,
small, and cohesive groups of consumers may accelerate diffusion. Nevertheless, the most
important role of advertising is to spread initial awareness. Adoption itself is mostly driven
by WoM, in particular after take off, rather than directly being influenced by advertising.
Besides advertising, policy interventions too can encourage the diffusion of environmental
innovations, in other words can induce diffusion.

54
CHAPTER 5
RESEARCH AREA, DATA COLLECTION AND CASE STUDY

55
5. Research area, data collection and case study
5.1 Description of Research Area
The geographic field of application for my research is the Province of Foggia (Apulia
Region, Italy) that extends for 6,966.17 square kilometres with a population of 638,041
inhabitants; it is the second largest province in Italy. According to the OECD methodology
(based on the parameter of the density of the population), the Province of Foggia is classified
as “predominantly rural”. Furthermore, this area is divided into five macro homogeneous
zones: an urban centre that coincides with the Capital Town, two low-lying rural areas with
specialized intensive agriculture (Alto and Basso Tavoliere), and two rural areas with
development problems (Subappennino Dauno and Gargano) characterized by medium
mountain (MiPAAF 2007). The interest in this area lies in three reasons.
The province of Foggia is one of the most extended agricultural area in Italy, with 495,111.10
hectares of utilized agricultural area (UAA) (3.9 per cent of national UAA) and with 48,149
firms (3% of national total) (ISTAT, 2010) and it is a land clearly intended to crops (99.9%
of the total companies) (ISTAT, 2010). Hence in this area the agricultural firms prevail
compared to the industrial and other sectors. The legal status is mostly represented by
individual ownership with a percentage of 98.4% of total enterprises accounting for 90.9% of
the UAA. Looking at the data collected by national census (ISTAT, 2010) winter cereals are
widespread with 23,775 farms and 254,693.74 UAA. On the other hand, in recent years the
provincial horticultural productions have been developing in a similar shape. Indeed, the
most significant data refers to processed tomato crop with 4% of the total UAA and 1901
farms, summing up about 19,140 hectares, which confirms its leadership at the national level
(ISTAT 2010).
Moreover it is one of five areas in Italy, where it has the highest rate of pollution resulting
from the incineration of agricultural waste (ISPRA 2013), in fact, this area has issued 10,254
Mg of carbon monoxide (CO), 473 Mg of nitrogen oxides (NOX) and 488 Mg of methane
(CH4) (ISPRA, 2013). So this is an area where it is necessary to improve the agricultural
sustainability.
The last reason but not the least is that, regarding the organic fraction of municipal solid
waste (MSW) collecting in the last years, in particular between 2011 and 2014, there were, an
increase of about 500 thousand tons (+ 9.7%) of separate collection of organic (wet + green),
like in the other Apulia province (see Figure 3.2; Figure 3.3).

� ���
Figure 5.1 - Evolution of organic fraction at provincial level, years 2011/2014
�
Source: ISPRA Waste Report 2015
�
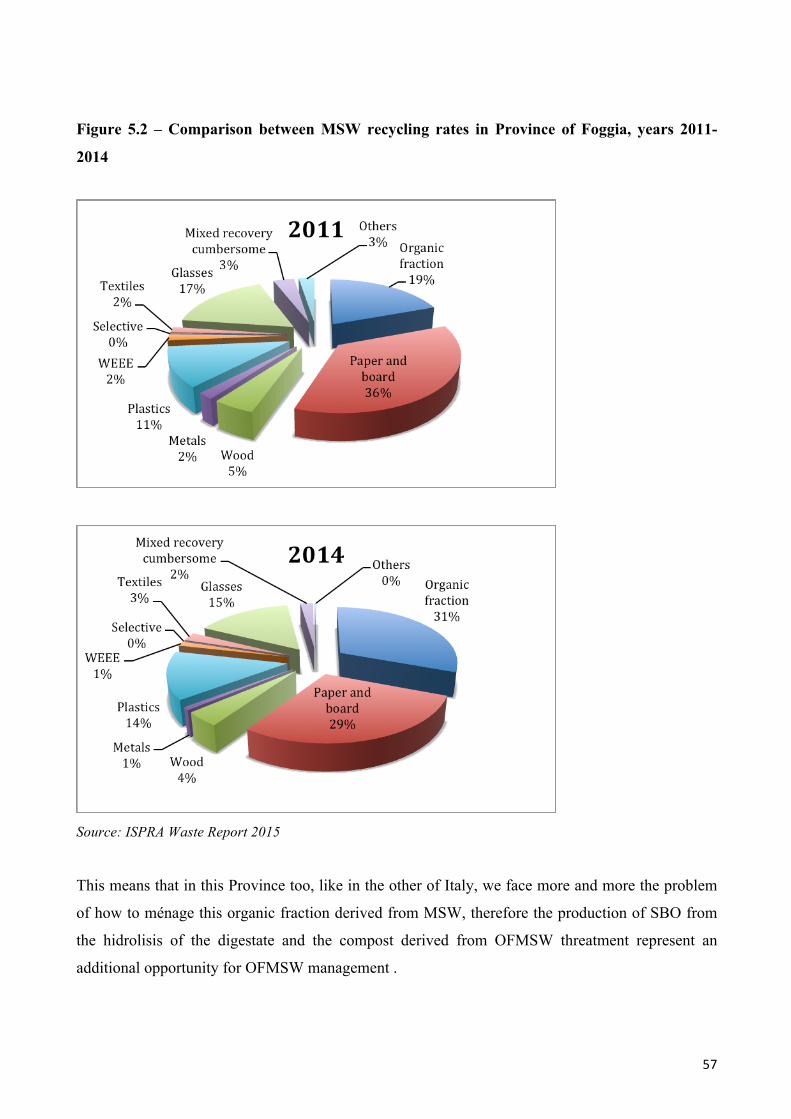
� ���
Figure 5.2 – Comparison between MSW recycling rates in Province of Foggia, years 2011-
2014
Source: ISPRA Waste Report 2015
This means that in this Province too, like in the other of Italy, we face more and more the problem
of how to ménage this organic fraction derived from MSW, therefore the production of SBO from
the hidrolisis of the digestate and the compost derived from OFMSW threatment represent an
additional opportunity for OFMSW management .

58
5.2 Data collection
To calibrate the Agent Based Model that will be described in the following chapter, I use, a dataset
of 107 farmers producing vegetable crops in the area of Foggia Province (South Italy), therefore
potentially interested in the use of a SAP represented by a SBO mulching film. This dataset derived
from a face to face survey carried out during the month of May 2014 by SAFE department of
University of Foggia, to study the diffusion of mulching technique. Sample involved farmers who
already apply mulching technique, both biodegradable and conventional films, as well as those
farmers who currently do not apply. The interviews were based on a structured questionnaire of four
sections. In the objective of the first section was to collect information about farmers' socio-
economic characteristics such as farms features (e.g. legal status, management type, land tenure,
number of workers and type of crops), environmental concern, risk propensity, social networks and
information channels. The collection of this data is necessary to examine farmers’ behaviour and
their attitudes towards the agricultural innovations (Birol et al., 2007; Prokopy et al., 2008;
Bakopoulou et al., 2010; Blazy et al., 2011; Pei-Chun, L. and Yi-Hsuan, H. 2012).
The aim of the second section was to inform respondents about potential economic and
environmental benefits of biodegradable films and to grasp farmers’ adoption attitude. The initial
question of this question is: "Have you never utilized or are you using mulch films?" (Question 24)
to distinguish between users of mulching technique from potential adopters. Then the potential
adopters were asked their general willingness to adopt the mulching technique (Question 25), and
their specific willingness to adopt biodegradable films (Question 32). At the same time, from those
who already adopt mulches films (biodegradable or not) were collected information about the
application rate, colour, market price of used films as well as current procedure for the disposal.
Finally, all current users and all respondents who are willing to adopt biodegradable films were
asked their preferences towards organic waste derived films (Question 34).
The third section was devoted to collect information about preferences for films properties, such as
Strength (mechanical resistance during the stretch out of the film in the field), Integrity (compared
to the crop duration), Mechanical harvesting (possibility of mechanical harvesting of crops),
Transparency and Disposal (minor operations for the removal and disposal of the film at the end of
cycle) and to test the potential adopters willing to pay through an auction simulation. The
questionnaire ended with some minor personal information.
Then to build the interpersonal network of each agents, following the participatory social network approach
(Edwards, G. 2010), that is based on the involvement of actors directly implicated in the network
investigated, by means of workshops or deep interviews to co-produce a representation of that network, I had
directly interviewed a local expert, who usually observed interactions among the farmers within the network,
to detect information about the presence of links between the potential adopters. So I presented a list of

59
farmers clustered into four groups according to their geographical position to the local expert who,
basing on the relationships observed, identifying two types of connections: professional (farmers
that work in the same cooperative) or social reasons (farmers that are friends or acquaintance)
Specifically, the case study area was divided into four geographical areas localized in the Province
of Foggia (see Figure 1): Northwest, Northeast, Southwest, Southeast. In the North-West zone are
clustered farms located in the municipalities of Serra Capriola, Torremaggiore, Lucera, Apricena
and Foggia. Farms located in the municipalities of Manfredonia, San Giovanni Rotondo, San Marco
in Lamis are grouped in the Northeast area. Farmers located in the municipalities of Orsara, Troia
and Foggia are included in the South- West area. Finally, farms located in Stornara, Cerignola,
Ortanova, Ordona, Trinitapoli, Ascoli Satriano and Foggia are grouped in the South-East
macroarea.
Figure 5.3 – Geographical partition of the case study area
Source: My elaboration
North-‐West
North-‐East
South-‐West South-‐East

60
To the expert I initially submitted the following two questions: 1) For this area, what are the
farmers who are members of the same cooperative? 2) In this group, what are the farmers who
have known each other? Then I have reported the answers to these questions in a dichotomous
matrix that takes the value one in the presence of one of two types of recognized relationships and
value 0 in the absence of such relations.
Finally, I investigated the existence of opinion leaders for each area. The opinion leadership is the
degree to which an individual is able informally to influence other individuals' attitudes or overt
behavior in a desired way with relative frequency. Opinion leaders are individuals who lead in
influencing others' opinions about innovations. The behavior of opinion leaders is important in
determining the rate of adoption of an innovation in a social system (Rogers, 2005). In order to
identify the opinion leader in the farmers networks I asked to the expert: " Who are the leaders in
this social system? Is there any farmer who others turn to ask for information or advice?".
The demographic data have been employed in the calibration of the model settings. The relational
data, obtained through the interview to the local expert have been used to build the network of
firms, that will be showed in the following section, representing the interaction arrangement of the
agents.
5.3 Case study
Following the research question and objective of my thesis (see chapter 1), as case study, I will
investigate how the intervention of the Innovation Broker (see chapter 3) could increase the speed
and level of SBO mulching films diffusion in a farmers network located in province of Foggia. In
particular in the context of the EIP (European Innovation Partnership), and with reference to the last
task of the innovation broker identified by Cristiano and Proietti (2014) (see chapter 3), I suppose in
my work that an Operational Group (OG), involving different farmers located in the Province of
Foggia and the University of Torino, after creating mulching films derived from SBOs and
implementing it among the farmers partners of the OG, would like to have a larger base of early
adopters in Province of Foggia who might further spread the innovation. The OG will do this
through the help of the innovation broker (a LAG in the province of Foggia) that has already help it
in the previous OG’s setting up phases.
Therefore I focus my work on the last function of the innovation broker described by Cristiano and
Proietti (2014). In this phase the objective of the innovation broker is to transfer knowledge, on the
innovation existence and implementation by OG’s farmers, to others farmers of Province of Foggia,
to form a favourable attitude towards the mulching film derived from SBOs (innovation) and
persuade them to adopt it (Rogers 2003). Following Rogers’ theory (Rogers 2003) according which
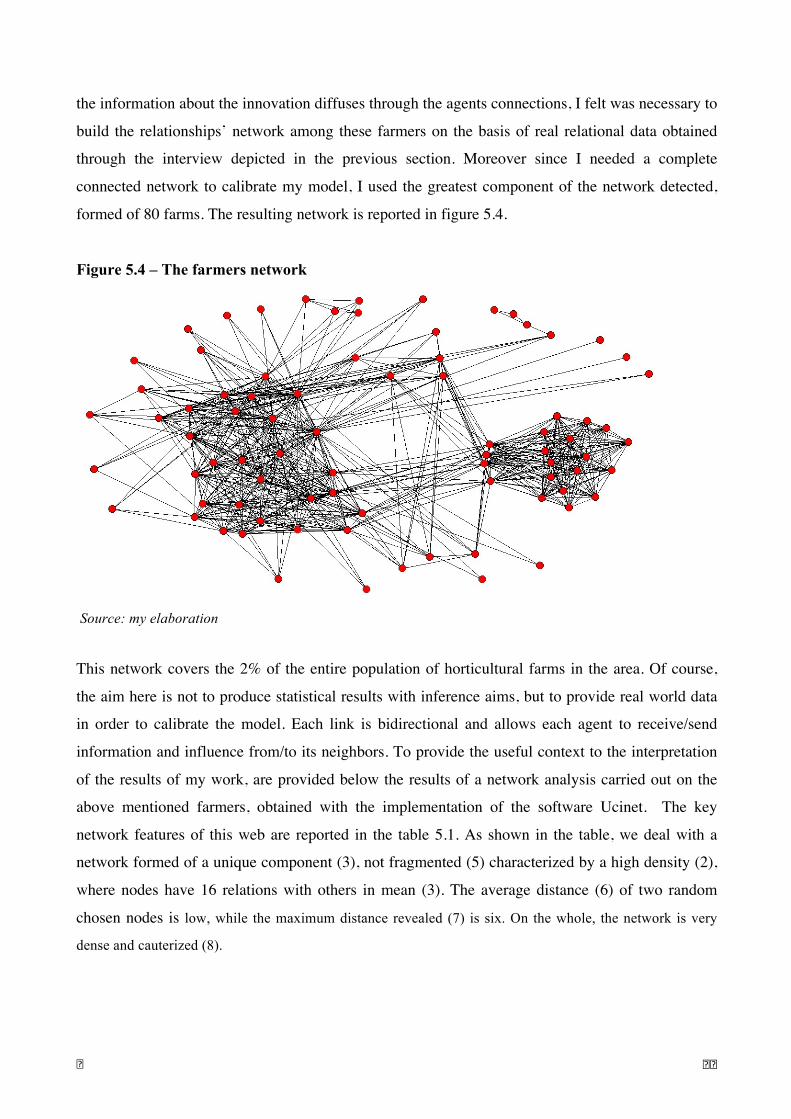
61
the information about the innovation diffuses through the agents connections, I felt was necessary to
build the relationships’ network among these farmers on the basis of real relational data obtained
through the interview depicted in the previous section. Moreover since I needed a complete
connected network to calibrate my model, I used the greatest component of the network detected,
formed of 80 farms. The resulting network is reported in figure 5.4.
Figure 5.4 – The farmers network
Source: my elaboration
This network covers the 2% of the entire population of horticultural farms in the area. Of course,
the aim here is not to produce statistical results with inference aims, but to provide real world data
in order to calibrate the model. Each link is bidirectional and allows each agent to receive/send
information and influence from/to its neighbors. To provide the useful context to the interpretation
of the results of my work, are provided below the results of a network analysis carried out on the
above mentioned farmers, obtained with the implementation of the software Ucinet. The key
network features of this web are reported in the table 5.1. As shown in the table, we deal with a
network formed of a unique component (3), not fragmented (5) characterized by a high density (2),
where nodes have 16 relations with others in mean (3). The average distance (6) of two random
chosen nodes is low, while the maximum distance revealed (7) is six. On the whole, the network is very
dense and cauterized (8).

62
Table 5.1 – Network Cohesion
Network Measures
1 Average Degree 16.2
2 Density 0.205
3 Components 1
4 Connectedness 1
5 Fragmentation 0
6 Average Distance 2.415
7 Diameter 6
8 Overall Clustering Coefficent 0.78
Source: our elaboration
This network context represents the information basis to properly interpreter the model findings.
Moreover, since the objective of this work is to find the actors able to act as effective spreaders of a
SAP within a network based on their centrality and position, following Morone and Makse (2015), I
calculated several SNA measures of the farmers. The measures adopted are:
1) the Degree Centrality, that is defined as the number of links of the single. The degree can be
conceived as the immediate potential of a node for influencing the information flowing through the
network;
2) the betweenness, that measures the number of times a node acts as a bridge along the shortest path
between two other nodes. It can be and indicator of the influence of an agent on the communication
between other agents. The betweenness of node i is calculated as the proportion of the shortest paths
of others passing through i;
3) the Closeness, that is the reciprocal of the farness of a node. The farness is the sum of the distances
of a node from all other nodes. Thus, the more close a node is the lower its total distance from all
other nodes;
4) the local Clustering Coefficient, that measures how close is the neighbours of a node to being
a completely connected.
Table 5.2 reports the descriptive analysis of these measures. And panels A-D in figure 4 shows the
frequency distribution of each index.

� ���
Table 5.2 – SNA measures
Network Measure mean st.dev Min max
1 Degree Centrality 16,20 10,10 1,00 45,00
2 Betweenness 55,87 98,27 0,00 554,08
3 Closeness 190,75 42,27 132,00 359,00
4 Local Clustering Coefficient 0,78 0,24 0,25 1,00
Source: my elaboration
The table shows that, in mean, the node as 16 ties with neighbors (1), intercept 56 shortest path
length among others (2), are close each others (3), and are very clustered (4). The frequency
distribution of these measures (fig. 4), confirms that the most part of nodes have a high degree
(panel A). On the contrary, the high average value of the betweenness is due to few actors with high
values, but the most part falls in the first class, thus the norm is a value of 15 or less (panel B). The
measures of closeness are grouped around medium values (panel C), while the clustering coefficient
is the maximum for 36 actors, with some other actors with various levels (panel D).
Figure 5.5 – Frequency distribution of the network measures
A B
C� � ��
Source: my elaboration�

64
In this kind of network, very dense and clustered for diffusion purposes, is not primarily important
how connected is the injection point and how high is its immediate influence, but how close he is to
the rest of the web by means of secondary and thirdly links. For this reason in the model simulation
that will be described in the following chapter, it will be considered, as injection point selection
criterion, the Collective Influence too, an algorithm (Morone and Makse work of 2015), that, taking
into account of these types of links, let to find the set of node in a network more effective in
fragmenting this last than removing nodes that are identified through other algorithms.

65
CHAPTER 6
METHODOLOGY
66
6.1 Model’s objective and assumptions
The model implemented in the present work is set to depict a population of economic agents
connected through social relationships used as medium for information and opinions exchange.
More specifically, it belongs to the Word of Mouth (W-o-M) models category (see chapter 5). The
agents’ network reproduce those that emerges from the relational data obtained through the
interview described in the previous chapter. Hence, it is a static representation of the reality. The
model characteristic is the presence of an activation threshold from which depends the single
agent’s decision to adopt or reject the innovation. The six basic assumption of this model are based
on the innovation diffusion theory elaborated by Rogers (2003). The “innovation–decision process”
described by Rogers is “fundamentally an information-seeking and information-processing activity
in which each agent is motivated to reduce uncertainty about advantages and disadvantages of an
innovation” (Rogers 2003, p.14). This process starts with the information that an innovation exist.
Thus, the first assumption is that:
A1: To form a positive attitude toward the innovation, a potential adopter should first become
aware of its existence, in other words should have knowledge about the innovation.
The fact that an individual knows a certain innovation does not mean that he will adopt it. In fact,
each agent has a personal idea about the innovation based on his personal beliefs. In particular
although he has awareness-knowledge about the innovation is not said that he decide to adopt it,
since he could consider the new technology not relevant or useful to his business.
A2: For the adoption to occur the agent should form a positive attitude toward the innovation, so
that persuasion can take place. At the persuasion stage, the individual becomes more
psychologically involved with the innovation.
This phase of the innovation decision process is characterized by a particular phenomenon: the
single agent need social reinforcement from his neighbors toward the innovation to reduce
uncertainty and to be adequately informed. This means that he takes into account the opinion of his
near peers based on their personal experience with the adoption of the novelty. In this phase, in fact,
potential adopters want to know the answer to the question: what are the innovation’s advantages
and disadvantages in my situation? While this type of information is completely available in
codified form for technical and scientific insiders, it is difficult to understand for economic actors
and is often available from peers whose subjective evaluation is more usable for them. On the basis
of these considerations, the third assumption is:
A3: the neighbors opinions about the novelty have a relevant role in influencing the potential
adopter persuasion process.

67
Among all the possible communication flows between the single agents which are the most
effective ones in terms of persuasion to adopt? According to an important principle of human
communication, the exchange of ideas occurs most frequently between individuals who are alike, or
homophilous. Moreover, communication between agents is more effective when they are
homophilous, that is they share common meanings, beliefs and mutual understandings. These
considerations lead to the formulation of the following sub-assumption:
A3.1: The more homiphilous the neighbors are, the more likely the communication will be influent
on the agent’s decision.
Moreover, according to Rogers, homophily occurs when two individuals are similar in certain
attributes, such as education, socioeconomic status and preferences. From this, the second sub-
assumption relative to neighbors influence is elaborated:
A3.2: The homophily degree between two agents is represented by the overlap of certain
socioeconomic farmer’s attributes, like, age, farm size, employees’ number, distance between them.
From the previous discussion, the fourth assumption is derived:
A4: the agent form its preference for the new technology on the basis of his personal opinion (A2)
and on the ones of his neighbors (A3).
This preference could be positive or negative. A positive preference for the innovation not
necessary lead to adoption decision. In fact, it is crucial for the potential adopter to try the
innovation or consider the number of other peers that have adopted and are satisfied with the
innovation. This means that each potential adopter has a certain resistance to innovate represented
by his personal threshold for adoption. Each agent in a system has a specific adoption threshold.
The existence of such a threshold one explanation for the occurrence of the S-shaped diffusion
curve. The innovators that first adopt have a very low threshold for adoption, due to their high
degree of venturesomeness. Later adopters have higher thresholds (that is stronger resistance to the
innovation), which are reached only when many other individuals in their personal network have
adopted.
The fifth assumption arises from this consideration:
A5: Each agent has a resistance to innovate, represented by a personal adoption threshold.
The threshold models (Granovetter, 1978; Macy. 1991) basic hypothesis is that the individual
decision to adopt an innovation depends on the number of other individuals in the system who have
already adopted the novelty. On the basis of this hypothesis derives the last assumption of the
model:
A6: The agent’s decision on the adoption is determined by the comparison between the agent
preference for innovation (A4) and his personal innovation threshold (A6). In particular the

68
individual decide to adopt if his preference (A4) is enough to let him to overcome his resistance to
innovate (A6).
The following section describes as the model embeds these six assumptions.
6.2 Model description According to the above discussed assumptions the model used depicts a network of farmers linked
by professionals and social relationships. Fig. 1 depicts the model dynamics. In the figure, a node
represents the single farmer, that is the decision-making unit, and the edges represent the relations
linking the farmer with its neighbors. Each link is bidirectional and allows to receive/send
information and influence from/to its ends. The process of novelty diffusion can be unpacked in
four consecutive phases.
1) An initial set of agents is endowed with the novelty. These agents are conceived as the injection
points (or spreaders) where the novelty is inoculated. The injection points are not only informed of
the new technology but are persuaded to use it, as their preference of the novelty become high
(panel A);
2) the injection points pass the information about the novelty and about their preferences toward it
to their neighbors who became aware and form their own preferences in turn (panel B);
3) the agents informed decide whether to adopt the novelty comparing the level of their preferences
with their innovation threshold (panel C);
4) in each subsequent period, the agents form or reconsider their preferences on the basis of the
information received from its neighbors (panel D).
The process described in points 3 and 4 repeats until T periods of information passing.
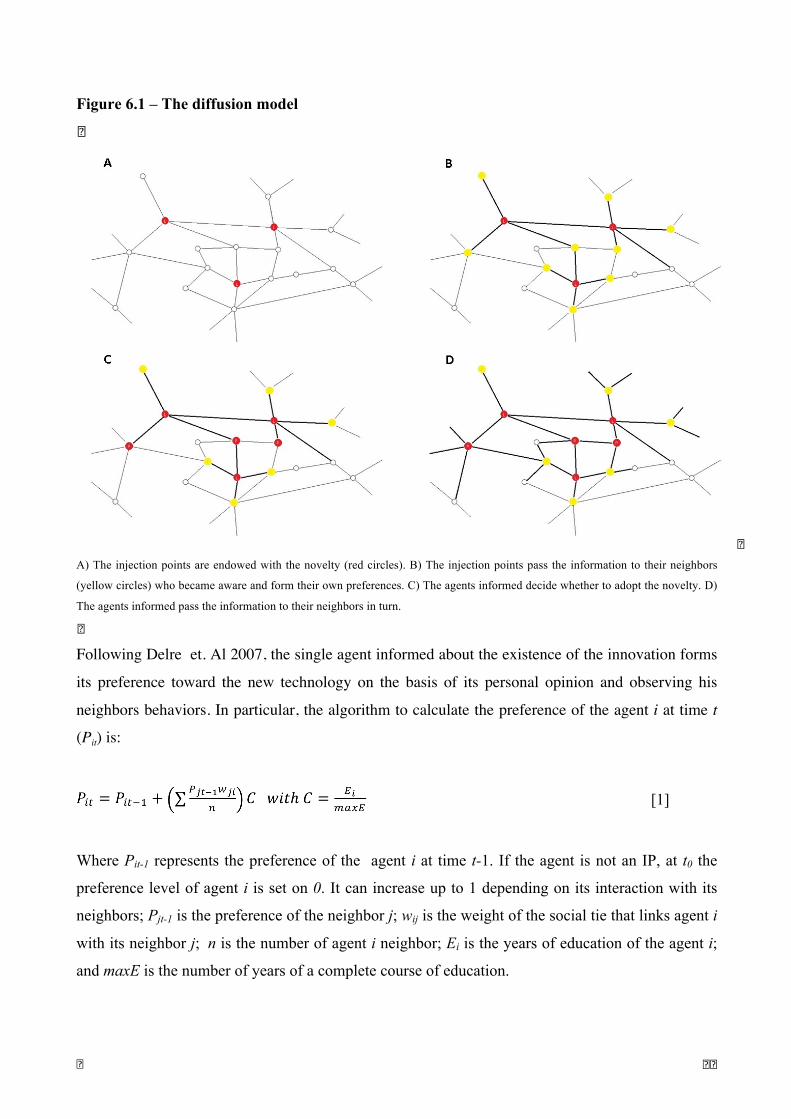
69
Figure 6.1 – The diffusion model
A) The injection points are endowed with the novelty (red circles). B) The injection points pass the information to their neighbors
(yellow circles) who became aware and form their own preferences. C) The agents informed decide whether to adopt the novelty. D)
The agents informed pass the information to their neighbors in turn.
Following Delre et. Al 2007, the single agent informed about the existence of the innovation forms
its preference toward the new technology on the basis of its personal opinion and observing his
neighbors behaviors. In particular, the algorithm to calculate the preference of the agent i at time t
(Pit) is:
[1]
Where Pit-1 represents the preference of the agent i at time t-1. If the agent is not an IP, at t0 the
preference level of agent i is set on 0. It can increase up to 1 depending on its interaction with its
neighbors; Pjt-1 is the preference of the neighbor j; wij is the weight of the social tie that links agent i
with its neighbor j; n is the number of agent i neighbor; Ei is the years of education of the agent i;
and maxE is the number of years of a complete course of education.

70
After having formed a preference about the innovation, the agent compares it with its persuasion
threshold θi. At each time step each agents decide to adopt or not on the basis of the fallowing
decision rule:
[2]
Each variable of the model has been calibrated on the basis of empirical data derived from the two
surveys described in the previous chapter.
6.3 Model calibration
The model above described contains several functional parameters. This section contains a
description of the calibration process of these parameters that can be divided in three categories i)
Global attributes; ii) Links attributes; and iii) Agents attributes (see table 6.1). The parameters were
calibrated based on real world data and simulation dynamics.
Table 6.1 – Parameter identification Parameter Symbol Description Value
Globals
Number of agents
N
It is the number of agents interacting in the
model
80
Time T It is the number of steps considered in the
simulation model
100
Links attributes
Homophily wji It represents the level of homophily of the
link’s ends
Various
[0,1]
Agents attributes
Threshold θi It is the innovation threshold Discrete
Injection Point status IPi It is a logic value: true if the agent is an
injection point Boolean
Education Ei It represents the year of education of the
agent Discrete
Adoption Adi It is a logic value: true if the agents adopt
the novelty Boolean
Source: my elaboration
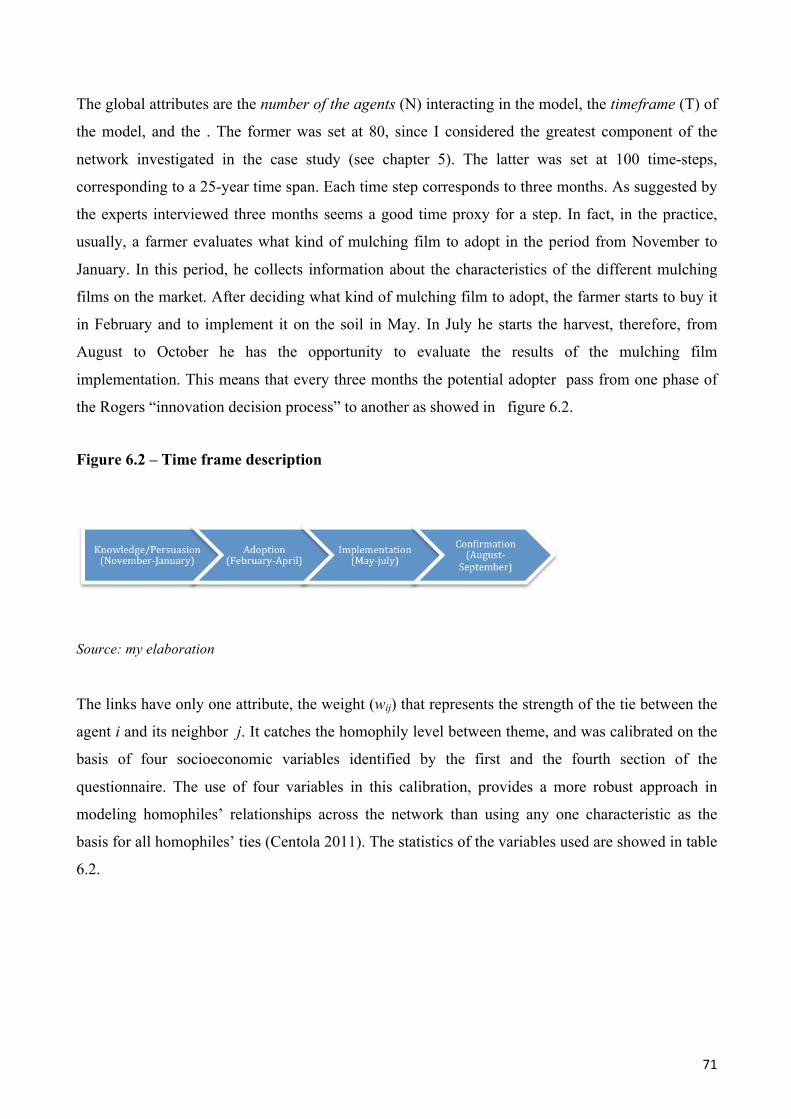
� ���
The global attributes are the number of the agents (N) interacting in the model, the timeframe (T) of
the model, and the . The former was set at 80, since I considered the greatest component of the
network investigated in the case study (see chapter 5). The latter was set at 100 time-steps,
corresponding to a 25-year time span. Each time step corresponds to three months. As suggested by
the experts interviewed three months seems a good time proxy for a step. In fact, in the practice,
usually, a farmer evaluates what kind of mulching film to adopt in the period from November to
January. In this period, he collects information about the characteristics of the different mulching
films on the market. After deciding what kind of mulching film to adopt, the farmer starts to buy it
in February and to implement it on the soil in May. In July he starts the harvest, therefore, from
August to October he has the opportunity to evaluate the results of the mulching film
implementation. This means that every three months the potential adopter pass from one phase of
the Rogers “innovation decision process” to another as showed in figure 6.2.
Figure 6.2 – Time frame description�
Source: my elaboration
�
The links have only one attribute, the weight (wij) that represents the strength of the tie between the
agent i and its neighbor j. It catches the homophily level between theme, and was calibrated on the
basis of four socioeconomic variables identified by the first and the fourth section of the
questionnaire. The use of four variables in this calibration, provides a more robust approach in
modeling homophiles’ relationships across the network than using any one characteristic as the
basis for all homophiles’ ties (Centola 2011). The statistics of the variables used are showed in table
6.2.

72
Table 6.2 - Homophily’s variables
Variable Mean
Standard
Deviation Min Max
Age (years) 45.74 11.6 24 72
Farm size (hectares) 76.96 203.71 4 1805
Employees 13.94 16.76 1 112
Distances between farmers (Kilometers) 59.77 40.92 0 198.42
Source: my elaboration
The firm size is calculated ad the sum of the hectares dedicated to vegetable crops (tomatoes,
potatoes, eggplant, peppers etc) on which potentially can be used SBO mulching films. The total
number of farm’s employees is given by the total of permanent workers, seasonal employees and
family labor. The distances between the municipality where farms are localized, were calculated
with the support of GIS (Geographic Information System) software obtaining the distance matrix
reported in Appendix A. In particular wij has a value ranging from 0 to 1, and for each ordered
couple of agents i and j, it is calculated as the average of the following four indexes:
1) Age (a)
where min aij and max aij represent respectively the minimum and the maximum age of the couple
of agents i and j, and its ends;
2) Farm size (Fs)
where min Fsij and max Fsij represent respectively the minimum and the maximum firm size of the
couple of agents i and j, and its ends;

73
3) Number of employees (Em)
where min Emij and max Emij represent respectively the minimum and the maximum
number of employees of the couple of agents i and j, and its ends;
4) Location (L)
where dij represent the distance between the couple of agents i and j, and its ends.
The Agents attributes are the innovation threshold (θi), the injection points status (Ipi), the level of
education (Ei) and the status of adoption (Adi).
To calibrate the innovation threshold (θi) for each potential adopters I used the persuasion score,
assigned on the basis of the farmers answers to the second part of the questionnaire, described in the
previous chapter. In particular farmers have been divided into six level of persuasion, according to
how far they are from adopting the SBO mulching film technique (1 most adverse – 6 most
favorable). Each level has a persuasion score to which corresponds a certain threshold (See table
6.3).
Table 6.3 – The farmers innovation threshold
Preference Level Frequency
Frequency
%
Persuasion
Score
Threshold
(θi)
1) Adverse to mulching films
13 16,25
-1
0,2
2) Willing to adopt mulching technique (conventional) but
adverse to adopt SBO films 2 2,5
-0,67
0,5
3)Adopting conventional films but adverse to adopt SBO
films 12
15
-0,33
0,33
4)Not adopting mulching technique but willing to adopt SBO
films
12
15
0,33
0,25
5)Adopting conventional and willing to adopt SBO films 16 20 0,67 0,2
6)Adopting bio-films and willing to adopt SBO films 25 31,25 1 0,16
Source: my elaboration

74
The innovation threshold represents the resistance to innovate of the potential adopters. As we can
see from Table 6.3, in correspondence of positive values of the persuasion score, the innovation
threshold decrease with the increasing of this last. In fact a potential adopter with an higher value of
persuasion has a lower resistance to innovate. Therefore a resistance even higher is in
correspondence of negative levels of persuasion.
The injection point status (IPi) was set true if the agent i is an IP, that is the agent i is the a node of
the network where innovation is firstly inoculated. It has the role to spread information in the
network to the potential adopters. The education level (Ei) was measured on the basis of the level of
schooling the farmer had completed (Primary school, secondary school, technical course, university
degree, PhD), and it is expressed in years. It ranges between 0 (the agent does not attend any
school) and 21,5 (the farmer has a PhD degree). Indeed, 21.5 is the value of maxE representing the
maximum number of years of education, including the achievement of a Ph.D. Ei and its proportion
with respect maxE is an important parameter, since it regulates the part of information the agent i is
able to process. In other words, the higher it is, the higher is its capacity to grasp its neighbor’s
knowledge. In fact, according to Rogers (2003), the level of education has a positive impact on
individuals’ innovativeness. Finally, adoption (Adi) represents the agent’s decision on novelty
adoption. If the single agent is set as injection point its Adi value at time 0 is set on true. It is set on
true also when the agent decides to adopt the innovation, elsewhere it is set on false. At time t0 only
the agents that represent IPs have an Adi set on true.
6.4 – Simulation setting
In order to test the hypothesis set in chapter three, three kind of treatments were simulated. These
represent three different innovation diffusion campaign based on different selection criteria for the
IPs, specifically:
1) Random (R), that simulates a diffusion campaign in which IPs are selected randomly;
2) Degree Centrality (DC) that represents a diffusion campaign considering as selection criteria of
the IPs the DC of the potential adopters;
3) Collective Influence (CI) that depicts a diffusion campaign based on the recruitment of IPs the
actors with the higher CI.
For the first kind of simulations, agents were selected through the Random Excel function, that
returns an evenly distributed random real number greater than or equal to 0 and less than 1. A new
random real number is returned every time the worksheet is calculated.

75
For the second and third kind of simulation, I calculate the DC and the CI of each agent. In table 6.4
are reported the nodes classification based on DC and CI. In the columns there are the agents that
occupy the twenty highest positions.

76
Table 6.4 – Selection of the IPs
Number of Ips Criteria
Position Number
1 2 3 4 5 6 7 8 9 10 11 12 13 14 15 16 17 18 19 20
1 CI "F17"
DC "F17"
2 CI "F17" "F31"
DC "F17" "F2"
3 CI "F17" "F31" "F30"
DC "F17" "F2" "F1"
4 CI "F17" "F31" "F30" "F10"
DC "F17" "F2" "F1" "F31"
5 CI "F17" "F31" "F30" "F10" "F2"
DC "F17" "F2" "F1" "F31" "F12"
6 CI "F17" "F31" "F30" "F10" "F2" "F39"
DC "F17" "F2" "F1" "F31" "F12" "F30"
7 CI "F17" "F31" "F30" "F10" "F2" "F39" "F42"
DC "F17" "F2" "F1" "F31" "F12" "F30" "F10"
8 CI "F17" "F31" "F30" "F10" "F2" "F39" "F42" "F43"
DC "F17" "F2" "F1" "F31" "F12" "F30" "F10" "F19"
9 CI "F17" "F31" "F30" "F10" "F2" "F39" "F42" "F43" "F93"
DC "F17" "F2" "F1" "F31" "F12" "F30" "F10" "F19" "F20"
10 CI "F17" "F31" "F30" "F10" "F2" "F39" "F42" "F43" "F93" "F33"
DC "F17" "F2" "F1" "F31" "F12" "F30" "F10" "F19" "F20" "F21"
11 CI "F17" "F31" "F30" "F10" "F2" "F39" "F42" "F43" "F93" "F33" "F1"
DC "F17" "F2" "F1" "F31" "F12" "F30" "F10" "F19" "F20" "F21" "F39"
12 CI "F17" "F31" "F30" "F10" "F2" "F39" "F42" "F43" "F93" "F33" "F1" "F12"
DC "F17" "F2" "F1" "F31" "F12" "F30" "F10" "F19" "F20" "F21" "F39" "F42"
13 CI "F17" "F31" "F30" "F10" "F2" "F39" "F42" "F43" "F93" "F33" "F1" "F12" "F8"
DC "F17" "F2" "F1" "F31" "F12" "F30" "F10" "F19" "F20" "F21" "F39" "F42" "F43"
14 CI "F17" "F31" "F30" "F10" "F2" "F39" "F42" "F43" "F93" "F33" "F1" "F12" "F8" "F19"
DC "F17" "F2" "F1" "F31" "F12" "F30" "F10" "F19" "F20" "F21" "F39" "F42" "F43" "F93"
15 CI "F17" "F31" "F30" "F10" "F2" "F39" "F42" "F43" "F93" "F33" "F1" "F12" "F8" "F19" "F20"
DC "F17" "F2" "F1" "F31" "F12" "F30" "F10" "F19" "F20" "F21" "F39" "F42" "F43" "F93" "F6"
16 CI "F17" "F31" "F30" "F10" "F2" "F39" "F42" "F43" "F93" "F33" "F1" "F12" "F8" "F19" "F20" "F21"
DC "F17" "F2" "F1" "F31" "F12" "F30" "F10" "F19" "F20" "F21" "F39" "F42" "F43" "F93" "F6" "F11"

77
17 CI "F17" "F31" "F30" "F10" "F2" "F39" "F42" "F43" "F93" "F33" "F1" "F12" "F8" "F19" "F20" "F21" "F6"
DC "F17" "F2" "F1" "F31" "F12" "F30" "F10" "F19" "F20" "F21" "F39" "F42" "F43" "F93" "F6" "F11" "F32"
18 CI "F17" "F31" "F30" "F10" "F2" "F39" "F42" "F43" "F93" "F33" "F1" "F12" "F8" "F19" "F20" "F21" "F6" "F35"
DC "F17" "F2" "F1" "F31" "F12" "F30" "F10" "F19" "F20" "F21" "F39" "F42" "F43" "F93" "F6" "F11" "F32" "F35"
19 CI "F17" "F31" "F30" "F10" "F2" "F39" "F42" "F43" "F93" "F33" "F1" "F12" "F8" "F19" "F20" "F21" "F6" "F35" "F36"
DC "F17" "F2" "F1" "F31" "F12" "F30" "F10" "F19" "F20" "F21" "F39" "F42" "F43" "F93" "F6" "F11" "F32" "F35" "F36"
20 CI "F17" "F31" "F30" "F10" "F2" "F39" "F42" "F43" "F93" "F33" "F1" "F12" "F8" "F19" "F20" "F21" "F6" "F35" "F36" "F33"
DC "F17" "F2" "F1" "F31" "F12" "F30" "F10" "F19" "F20" "F21" "F39" "F42" "F43" "F93" "F6" "F11" "F32" "F35" "F36" "F33"
Source: my elaborations

In each row for all positions there are reported the actors with the highest CI and with the
highest DC. Therefore, on the rows there are the packs of IPs to use in the simulations on the
basis of the two selection criteria and of the number of the IPs. For example, in the case of
two IPs it will be selected according the CI the actors “F17”, “F31”, while on the basis of D
the nodes “F17” and “F2”.
As showed in Table 6.4 the main differences between CI and DC are in the first twelve
positions, therefore I focused my attention on them and, for each kind of treatment, DC and
CI, I executed 12 different simulations, one for each number of IPs activated. The 12
injection points selected with CI criteria, in comparison with those selected according to the
DC criteria, following Morone and Makse (2015), should be the nodes that if removed from
the network will generate the best fragmentation of this one. Therefore, to test this, before
starting with the simulations, I tried to remove from the network, first the nine nodes with
highest DC and those with the highest CI. Then I compared the fragmentation obtained in this
way with those obtained after the removal of the first twelve nodes with the highest value of
each of the two criteria (DC and CI) (see Figure 6.3). As can be seen from figure 6.3, it is
obtained with the removal of nodes with the higher CI rather than those with the higher DC.
Figure 6.3 – Optimal network fragmentation
Source: my elaboration
a) b)
c) d)

79
In a), after the disconnection of nine nodes chosen through the DC the bigger component is
formed by 75 nodes while in figure b) this one consists of 63 nodes, therefore CI (b) criterion
leads, even with nine nodes, to a great networks’ disaggregation compared to those obtained
by eliminating the actors with the highest DC (a). In d) is represented the best fragmentation
obtained with the disconnection of 12 collective influencers, in fact in this case, the bigger
network consists of 59 nodes, compared to 68 nodes of the bigger network obtained with the
disconnection of 12 actors selected on the basis of DC (c).
All the simulation has been made with the support of the NetLogo 5.2 platform (Wilensky,
1999), that is a widely used agent-based simulation tool. Since simulations are usually not
deterministic, they contain several random elements, I carried out repeated simulation
experiments (batch of 100 runs) in order to identify different trajectories of model behavior.
Within the batch I took the average number of persuaded agents. Simulations results are
showed in the following chapter.

80
CHAPTER 7
SIMULATION RESULTS

81
7.1 Introduction
This chapter is devoted to test the basic ideas developed in this thesis, that are: 1) even in a
very dense network, the diffusion rate reached during a diffusion campaign is not indifferent
to the characteristics of the IPs chosen. In other words, we expect that the use of centrality
measures to choose the best IPs leads to final diffusion rates greater than those reached by
using random spreaders. The CI is the best criteria to choose effective IPs, in the sense that it
guarantees 2) higher diffusion rates, and 3) higher speed in reaching the maximum level of
diffusion, when compared with other centrality measures (i.e. DC)4. The data needed to
perform this analysis was generated simulating the diffusion process using three treatments in
the choose of the initial spreaders according to the description provided in the previous
chapter, namely the random methods (R) that represents the baseline, the CI algorithm, and
the DC methods. To test H1 I compared the baseline with the CI and DC results. Then, I
tested H2 and H3 comparing the performances of CI and DC in terms of number of adopters
and speed of adoption. The variables used to make these comparisons are 1) “level of
adoption”, expressed in absolute (number of adopters) and relative (fraction of adopters)
terms, at half (50 step) and final time (100 step), it is indicated as Ap,t,i, where p denotes the
period (half or final time), t the treatment (R, DC or CI), and i the number of IPs simulated;
2) “time max” that measures the period taken to reach the maximum number of adopters
(speed of the novelty diffusion), denoted as Tmaxt,i, where t and i have the same meaning
above5. Before the comparative analysis, the following three paragraphs reports some
descriptive statistics of each treatment.
7.2 The baseline simulation
Figure 7.1 and in figure 7.2 show the adoption level obtained with the random treatment. As
it emerges, the diffusion grows with the increase of the number of the IPs. This is true until
the use of nine IPs in correspondence of which at the final time there are 39 innovation
adopters. In other words, innovation is implemented by the 49% of the potential adopters.
After nine IPs the level of diffusion, expressed both in absolute and relative terms, decreases
to 35 adopters (44% of the sample). The differences between diffusion level at half and final
time step, as can be seen from figure 7.1 and 7.2, are always positive, except in
correspondence of nine IPs where the diffusion level at 50 steps is equal to those at 100 steps.
4 For the full description of the hypothesis, see chapter three. 5 For instance, the number of adopters at final time with seven Ip within the treatment CI is denoted as A100,CI,7
; while the time max for treatment R with 10 Ip is TmaxR,10.
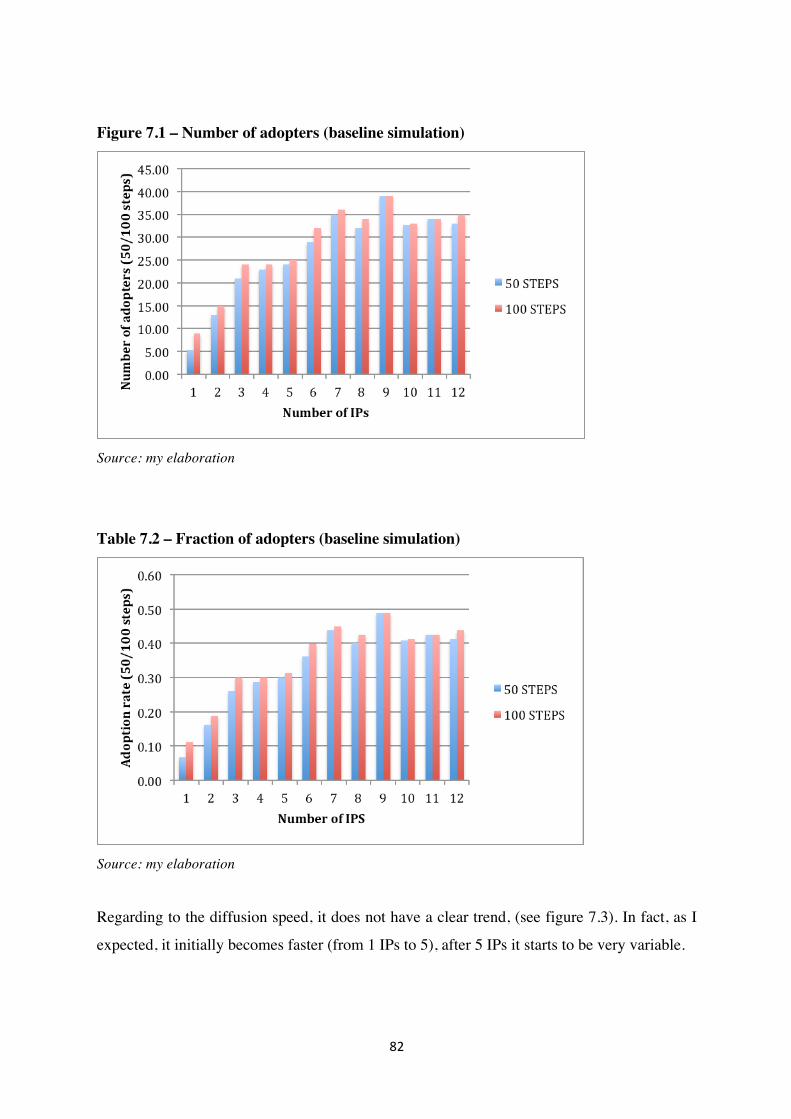
���
�
Figure 7.1 – Number of adopters (baseline simulation)
Source: my elaboration
Table 7.2 – Fraction of adopters (baseline simulation)
Source: my elaboration
Regarding to the diffusion speed, it does not have a clear trend, (see figure 7.3). In fact, as I
expected, it initially becomes faster (from 1 IPs to 5), after 5 IPs it starts to be very variable.
�
�
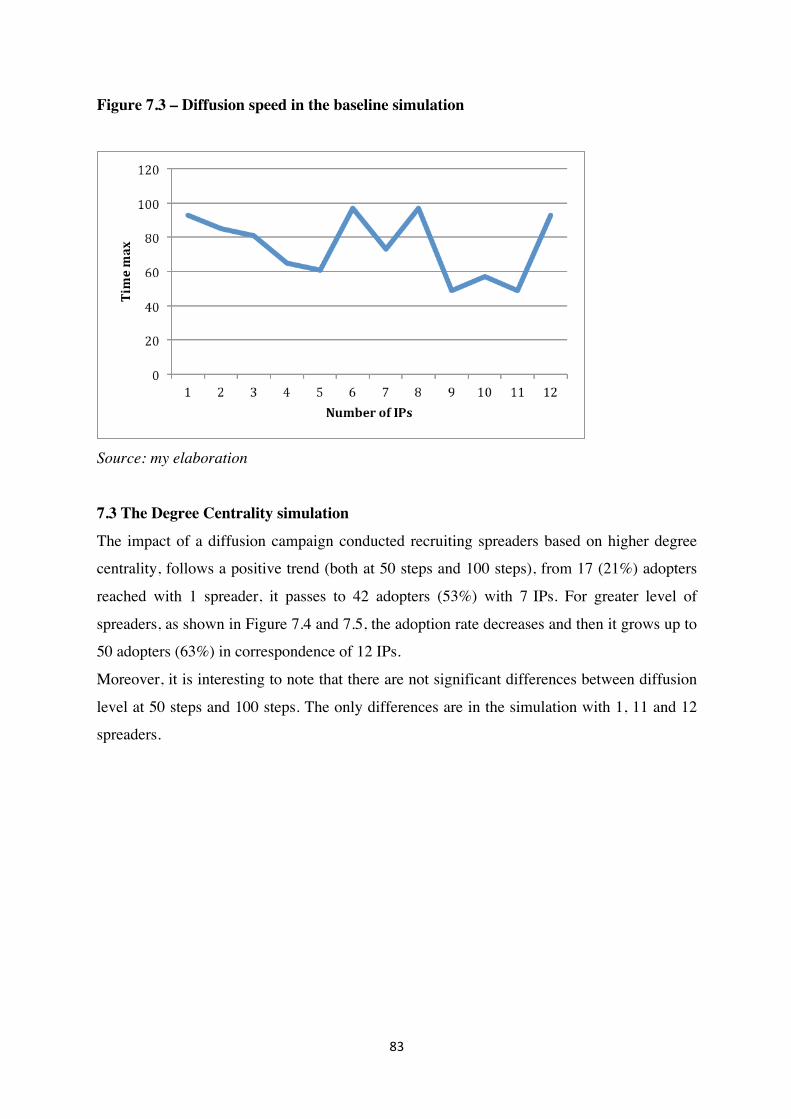
���
�
Figure 7.3 – Diffusion speed in the baseline simulation
Source: my elaboration
7.3 The Degree Centrality simulation
The impact of a diffusion campaign conducted recruiting spreaders based on higher degree
centrality, follows a positive trend (both at 50 steps and 100 steps), from 17 (21%) adopters
reached with 1 spreader, it passes to 42 adopters (53%) with 7 IPs. For greater level of
spreaders, as shown in Figure 7.4 and 7.5, the adoption rate decreases and then it grows up to
50 adopters (63%) in correspondence of 12 IPs.
Moreover, it is interesting to note that there are not significant differences between diffusion
level at 50 steps and 100 steps. The only differences are in the simulation with 1, 11 and 12
spreaders.
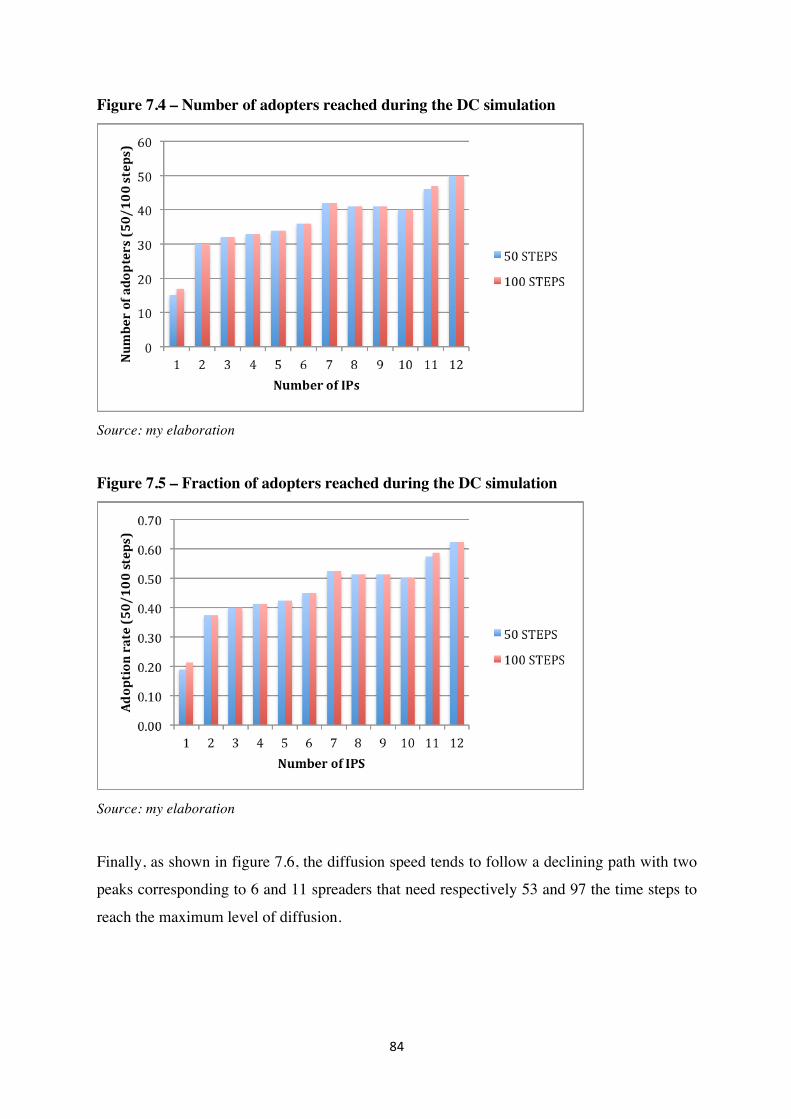
���
�
Figure 7.4 – Number of adopters reached during the DC simulation
Source: my elaboration
Figure 7.5 – Fraction of adopters reached during the DC simulation
Source: my elaboration
Finally, as shown in figure 7.6, the diffusion speed tends to follow a declining path with two
peaks corresponding to 6 and 11 spreaders that need respectively 53 and 97 the time steps to
reach the maximum level of diffusion.

���
�
Figure 7.6 – Diffusion speed in the DC simulation
Source: my elaboration
7.4 The Collective Influence simulation
Differently from the previous treatments, the CI algorithm exhibits an almost uniform
increasing trend (see figure 7.7 and 7.8). It reaches the maximum value of 54 adopters (68%)
with only eight spreaders. With nine IPs, it decreases a little, and returns to the maximum
rates for the rests of simulations (from 10 to 12 IPs). Moreover, there are not great differences
between diffusion levels at half and final steps, indeed starting from the simulation seven no
differences were observed.
Figure 7.7 – Number of adopters reached during the CI simulation
Source: my elaboration
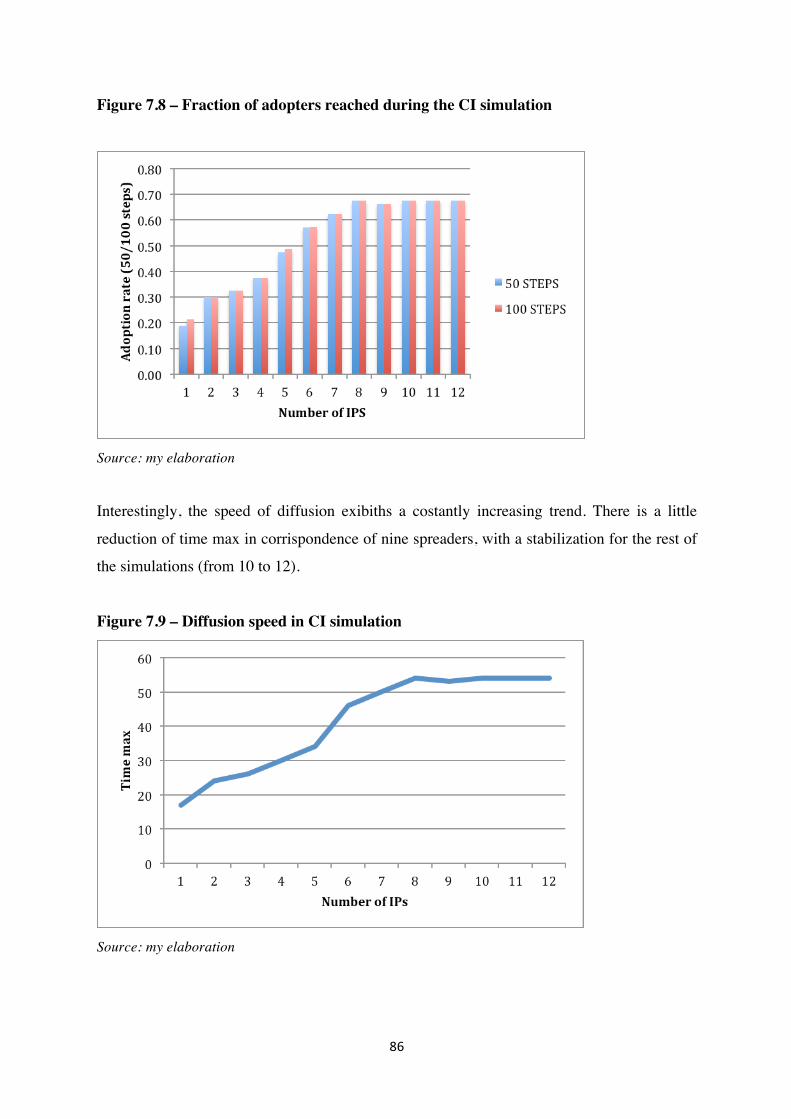
���
�
Figure 7.8 – Fraction of adopters reached during the CI simulation
Source: my elaboration
Interestingly, the speed of diffusion exibiths a costantly increasing trend. There is a little
reduction of time max in corrispondence of nine spreaders, with a stabilization for the rest of
the simulations (from 10 to 12).
Figure 7.9 – Diffusion speed in CI simulation
Source: my elaboration

87
7.5 The comparison between simulations
This section is devoted to the analysis of the differences between the performances of the
three simulated treatments. The comparison is based on Ap,t,i, and Tmaxt,i relative to each
simulation. Some descriptive statistics on these variables obtained with the three different
methods (R, DC, CI) are shown in figures 7.10 and 7.11. Figure 7.10 reports the differences
between the three treatments using a line diagram. Colors refers to the treatments: blue
represents R, red represents DC, and the green line represents CI.

���
�
Figure 7.10 Level of diffusion
�
1 IPs�
2 IPs
�
3 IPs
3 IPs
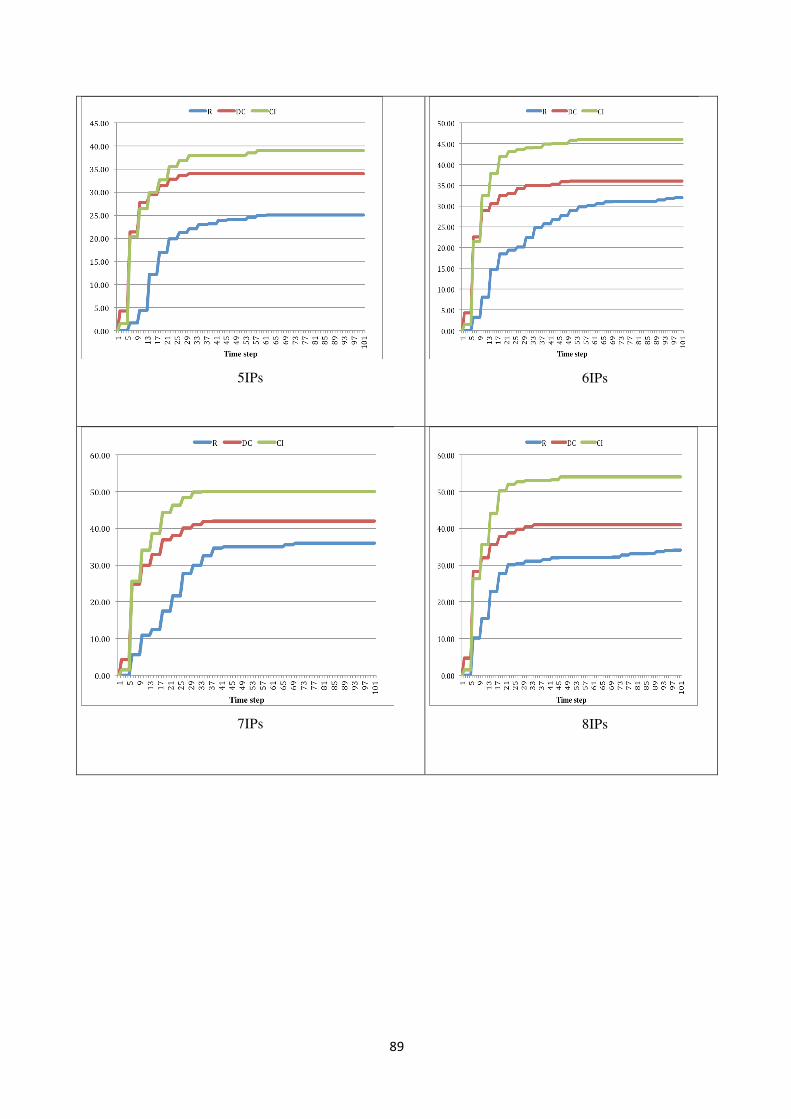
���
�
5IPs 6IPs
�
7IPs
8IPs
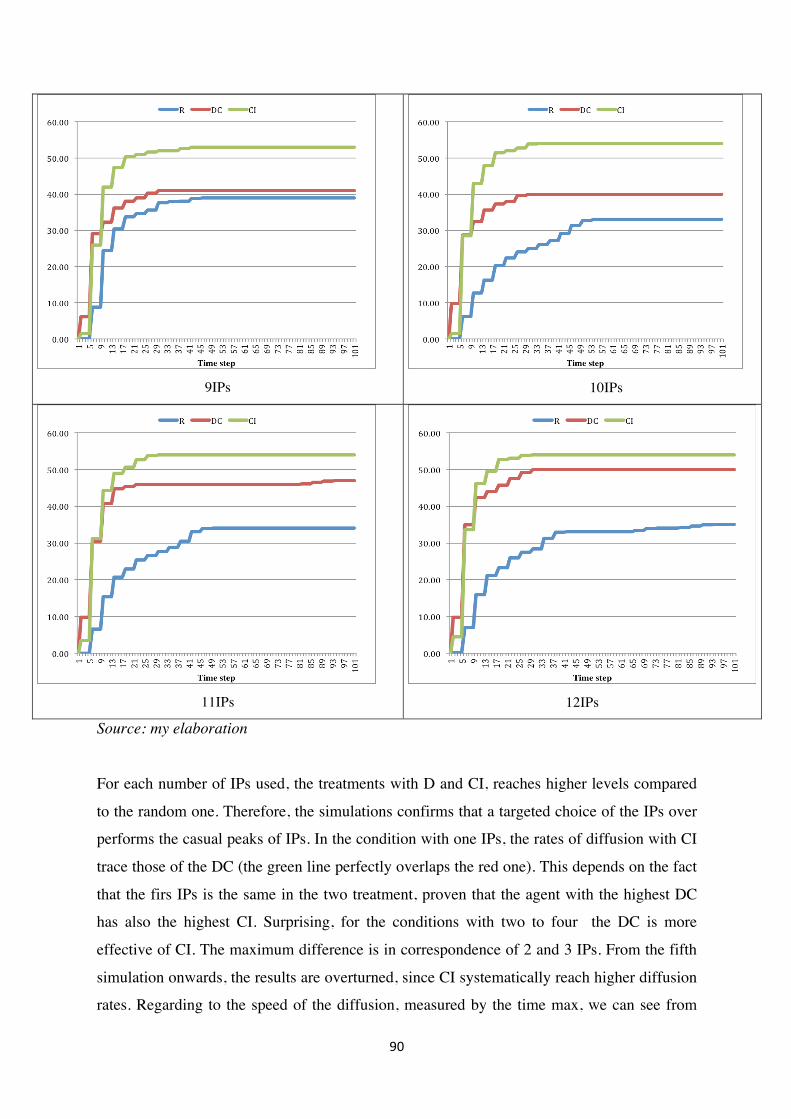
���
�
Source: my elaboration
For each number of IPs used, the treatments with D and CI, reaches higher levels compared
to the random one. Therefore, the simulations confirms that a targeted choice of the IPs over
performs the casual peaks of IPs. In the condition with one IPs, the rates of diffusion with CI
trace those of the DC (the green line perfectly overlaps the red one). This depends on the fact
that the firs IPs is the same in the two treatment, proven that the agent with the highest DC
has also the highest CI. Surprising, for the conditions with two to four the DC is more
effective of CI. The maximum difference is in correspondence of 2 and 3 IPs. From the fifth
simulation onwards, the results are overturned, since CI systematically reach higher diffusion
rates. Regarding to the speed of the diffusion, measured by the time max, we can see from
�
9IPs
10IPs
�
11IPs
12IPs

���
�
table 7.11 that 1) the rational criteria (DC and CI) are always faster than the treatment with
random method; 2) for the first six IPs the CI exhibits an higher speed (denoted by very small
bars) compared to the others two criteria, instead from the seventh simulation onwards the
DC is the fastest treatment excluded the condition with 11 spreaders.
Table 7.11 – Diffusion speed
Source: my elaboration
In order to allow the comparison among treatments, the variables Ap,t,i and Tmaxt,i were
operationalized. More in depth:
• the number of adopters per injection point at time p for the treatment t with n IPs (Np,t,i) is
calculated as:
Np,t,i = Ap,t,i/n [1];
• the standardized level of adoption obtained by treatment p with i IPs (Sp,t,i) is calculated as:
Sp,t,i = Ap,t,i/ Ap,R,i [2];
in other words, with the [2] the levels of adoption reached with DC and CI were standardized
with respect to the baseline values. This is made to remove the effect of the growing number
of the IPs;
• the standardized time max of the treatment p with injection point i (sTmaxt,i) is calculated as:
sTmaxt,i = Tmaxt,i – TmaxR,i [3];
That is the diffusion speed of the treatment with DC and CI is standardized considering the
differences of their time max with the time max of the random treatment. To test the research
hypothesis, I applied at these variables obtained with the three kind of treatments the Mann-

���
�
Whitney U test. This is a non-parametric test used to know if there are differences between
two independent groups of a study design where it is measured the same continuous or
ordinal dependent variable in two independent groups. Specifically, with this test I verify if
Np,t,i, Sp,t,i, sTmaxt,i are significantly different between the treatments. The test is performed for
each hypothesis as explained in what follows.
H1: is verified if Np,DC,i and Np,CI,i is significantly different from Np,R,i, that is the number of
adopters per Ip, obtained with DC and CI at a certain step, is significantly different from
those observed in random treatment.
As shown in figures 7.12-13 the level of adopters per injection point (Np,t,i) of DC and CI is
always higher than the one of the random treatment both at half and final time. This
difference is statistically significant.
Figure 7.12 – Comparison results between the three criteria (50 step)
Source: my elaboration

���
�
Figure 7.13 - Comparison results between the three criteria (100 step)
Source: my elaboration
Specifically, the comparison across treatments shows that the use of rational methods in the
choice of IPs significantly increase the number of adopters per IPs. This is true both for the
use of DC (P < 0.05) for the diffusion rates at half time, and for the use of CI at half (P <
0.01) and final time (P < 0.05) using the Mann-Whitney U test. Only the rate of diffusion
reached with the DC treatment at final time is not significantly higher than the random
treatment rate. Thus, the first hypothesis is largely verified, confirming that the different
choice criteria of the IPs widely affect the novelty diffusion rate.
H2: is verified if Sp,CI,i is significantly different from Sp,DC,i, in other words the standardized
number of adopters per injection point, obtained with CI at a certain step, is significantly
higher from those reached with DC.
Figures 7.14 and 7.15 shows that saved the initially little overperfomance of DC, the CI
leads always to higher diffusion rates both at half and final time.
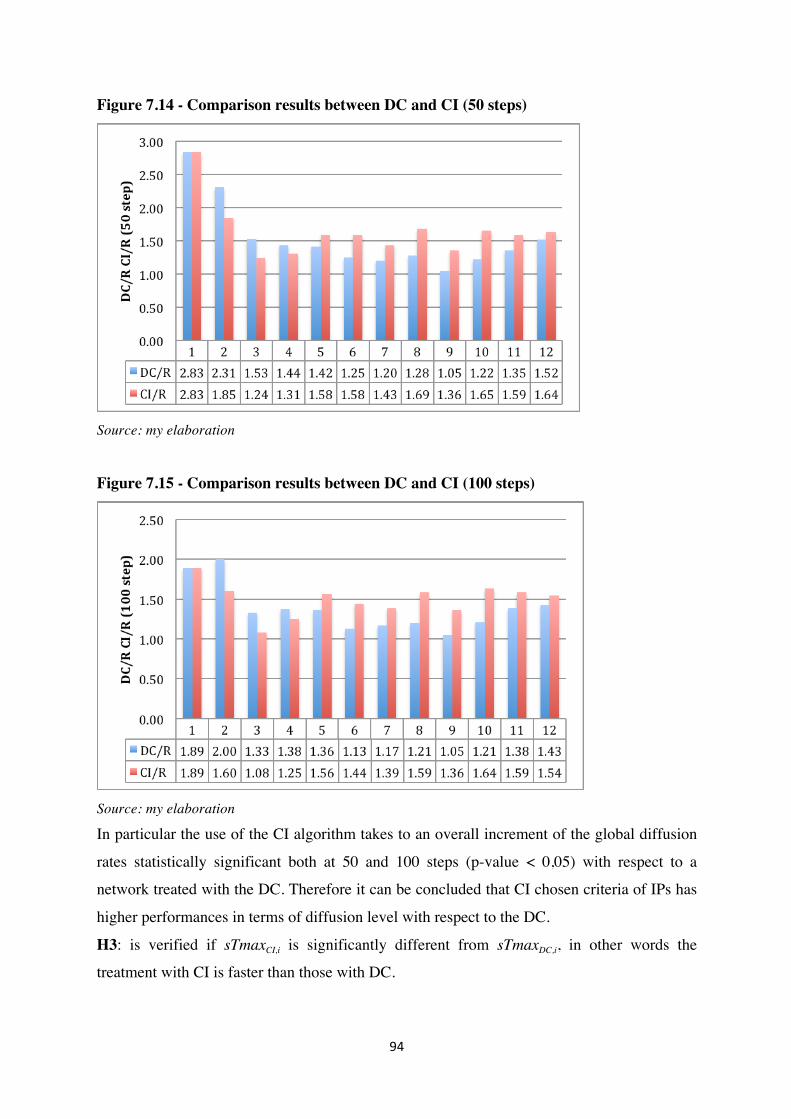
���
�
Figure 7.14 - Comparison results between DC and CI (50 steps)
Source: my elaboration
Figure 7.15 - Comparison results between DC and CI (100 steps)
Source: my elaboration
In particular the use of the CI algorithm takes to an overall increment of the global diffusion
rates statistically significant both at 50 and 100 steps (p-value < 0,05) with respect to a
network treated with the DC. Therefore it can be concluded that CI chosen criteria of IPs has
higher performances in terms of diffusion level with respect to the DC.
H3: is verified if sTmaxCI,i is significantly different from sTmaxDC,i, in other words the
treatment with CI is faster than those with DC.
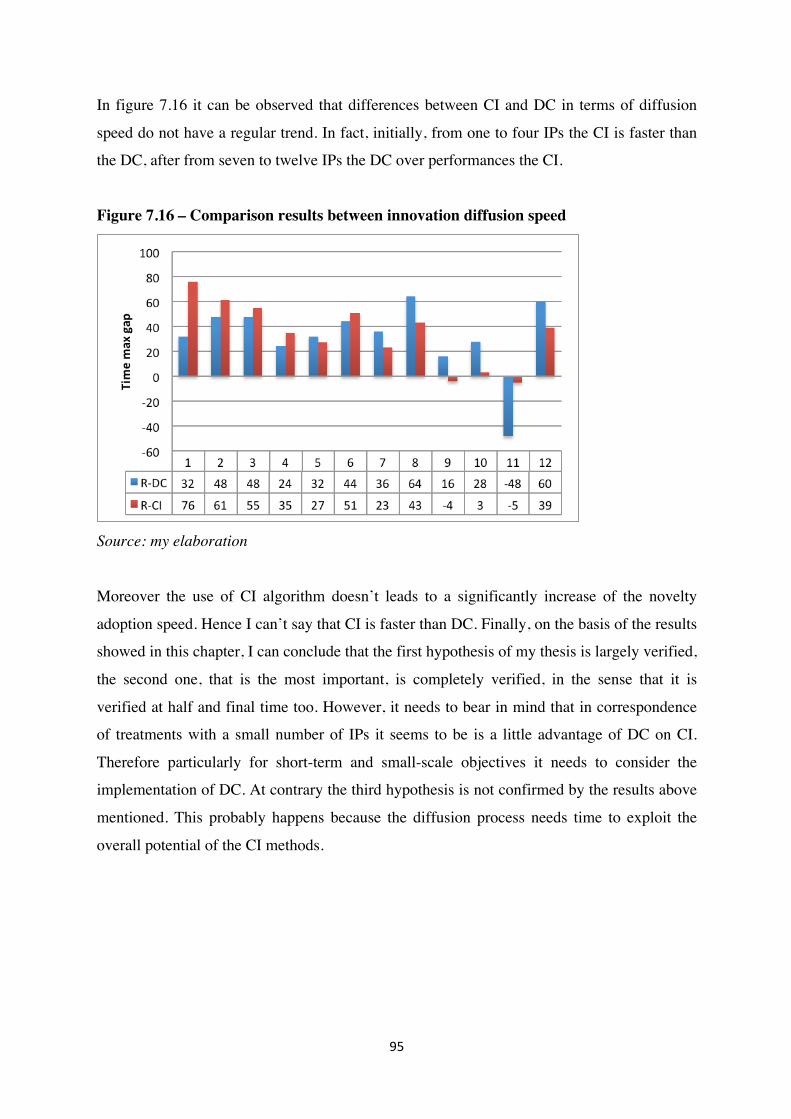
���
�
In figure 7.16 it can be observed that differences between CI and DC in terms of diffusion
speed do not have a regular trend. In fact, initially, from one to four IPs the CI is faster than
the DC, after from seven to twelve IPs the DC over performances the CI.
Figure 7.16 – Comparison results between innovation diffusion speed
Source: my elaboration
Moreover the use of CI algorithm doesn’t leads to a significantly increase of the novelty
adoption speed. Hence I can’t say that CI is faster than DC. Finally, on the basis of the results
showed in this chapter, I can conclude that the first hypothesis of my thesis is largely verified,
the second one, that is the most important, is completely verified, in the sense that it is
verified at half and final time too. However, it needs to bear in mind that in correspondence
of treatments with a small number of IPs it seems to be is a little advantage of DC on CI.
Therefore particularly for short-term and small-scale objectives it needs to consider the
implementation of DC. At contrary the third hypothesis is not confirmed by the results above
mentioned. This probably happens because the diffusion process needs time to exploit the
overall potential of the CI methods.

96
CHAPTER 8
CONCLUSIONS

97
8.1 Conclusions
In this work I developed an agent-based model aimed at investigating how innovation broker
can influence the diffusion of a new Sustainable Agricultural Practice in a farmers network
located in Province of Foggia . A large number of studies show that the decision to adopt a
novelty depends not only on individual preference of the potential adopters but on the
neighbors influence about the innovation too. Taking into account this evidence, the
innovation broker can consider this neighbors influence as a strategic resource to induce
diffusion choosing specific injection points (members of the network where the novelty is
first inoculated) in order to boost adoption speed and adoption level. The primary issue for
the innovation broker is what are the injection points to recruit to obtain more effective
diffusion results and if there are rational criteria to choose them.
Considering this question my thesis objective was to prove that there are specific network
properties belonging to the actors that can be used like rational criteria for the choice of the
best injection points.
The ABM developed in this thesis allows to operationalize some fundamental concepts of
Rogers innovation diffusion and word of mouth (W-o-M) theories. It is grounded on six basic
assumptions deriving from the theory and., The model reproduces, a typical W-o-M
innovation diffusion model used to test three different criteria with which innovation broker
can select the injection points to diffuse information about the innovation: the Random
method (R), the Degree Centrality (DC) method and the Collective Influence (CI) algorithm.
The last two criteria takes into account the agents position in the network and the number,
respectively, of direct links and undirected links. After the implementation of these influence
measures, the model was used to investigate, through repeated simulation experiments, what
is the best strategy to select the injection points, in terms of diffusion level reached at half and
final time and in terms of speed,. In particular, through the simulations and a statistical non
parametric test (Mann-Whitney test) on the results, three hypothesis on the possible diffusion
performances of the different method were tested. Simulations results confirmed two out of
three hypothesis. One interesting result is that, even in a dense network, the injection points
characteristics are not indifferent to the final rate of adoption, therefore the diffusion rate
reached during the diffusion campaigns is not invariant with respect to the role and the
position of the injection points chosen. Moreover, the CI was proven outperforming with
respect DC in terms of rate of adoption, particularly with a great number of injection points.
In this case, the results showed that the rate of diffusion is higher if the injection points are
chosen according to the CI algorithm rather than the DC measure.

98
At contrary, results showed that the third hypothesis on the dominance of the CI with respect
to DC in terms of diffusion speed cannot be confirmed. In fact, the time taken to reach the
maximum number of adopters in the dissemination campaigns realized using as injection
points the agents with the higher collective influence, is not significantly different from those
in the diffusion campaigns realized using as injection points the agents with the higher DC.
Results observed through this model simulation allowed to conclude that the innovation
broker can reach higher level of diffusion choosing injection points with CI rather than with
the DC or the R criteria, this is particularly true if he has long-term and large-scale objectives.
In fact CI is greater than DC in correspondence of an high number of injection points and of
the final time steps.
The innovation broker besides to have as objective an high level of diffusion could have as
final goal to reach the maximum level of diffusion after which the novelty diffusion becomes
self-sustaining, in a short period of time. Regarding this objective results showed that among
the two rational chosen criteria considered in the simulation model, DC and CI, there is no
clear dominance between them in terms of diffusion speed. A reason for this is that the DC is
a measure of the direct influence of a nodes on its neighbors that is exercised immediately
over all the adjacent nodes. Instead, the CI measures partly the influence exerted by the single
node on the neighbors direct linked to it and partly the influence exercised on the nodes that
are at a certain distance. Therefore this influence is not direct but it is mediated by
performances of the closely adjacent nodes. From this derives that the innovation broker
should bear in mind that the diffusion process needs a certain time to exploit all the potential
of the influence captured by the CI measure, and to program long terms diffusion campaigns.
99
References
Abrahamson E, Rosenkopf L (1997) Social network effects on the extent of innovation
diffusion: a computer simulation. Org Sci 8(3):289–309
Ajzen I (1991) The theory of planned behavior. Org Behav Hum Decis Process 50(2):179–
211.
Alkemade F, Castaldi C (2005) Strategies for the diffusion of innovations on social networks.
Comput Econ 25(1–2):3–23.
Amaral LAN, Scala A, BarthélémyM, Stanley HE (2000) Classes of small-world networks.
Proc Natl Acad Sci USA 97(21):11,149–11,152.
Anderson, ST, Newell, RG (2004). Information programs for technology adoption: the case
of energy-efficiency audits. Resource and Energy Economics, 26:1, 27-50
Antonelli, C (1990). Induced adoption and externalities in the regional diffusion of
information technology. Regional Studies, 24:1, 31-40.
Arndt J (1967) Role of product-related conversations in the diffusion of a new product. J
Mark Res 4(3): 291–295.
Axelrod R (2007) Simulation in the social sciences. In: Reynard JP (ed) Handbook of
research on nature inspired computing for economy and management. Idea Group, Hershey,
pp 90–100.
Bailey, Norman T. J. (1957), The Mathematical Theory of Epidemics, New York, Hafner.
Bandura, Albert (1977). Social learning theory. Englewood Cliffs, New Jersey, Prentice-Hall.
Bastioli, C. (1998). Properties and applications of Mater-Bi starch-based materials. Polymer
Degradation and Stability, 59(1), 263-272.
Bass FM (1969) A new product growth for model consumer durables. Manag Sci 15(5):215–
227
Bavelas, A. (1950). Communication patterns in task-oriented groups. Journal of the
acoustical society of America.
Baker, P, Blundell, R, Micklewright, J (1989). Modelling household energy expenditure
using micro-data. Economic Journal, 99:397, 720-738.
Baker, L (2001) ‘Managed care and technology adoption in health care: evidence from
magnetic resonance imaging’, Journal of Health Economics, 20:3, 395-421.
Bakopoulou, S., Polyzos, S. and Kungolos, A. (2010) ‘Investigation of farmers' willingness to
pay for using recycled water for irrigation in Thessaly region, Greece’, Desalination, Vol.
250, pp.329–334.

100
Barabási AL, Albert R (1999) Emergence of scaling in random networks. Science
286(5439):509–512
Barabási AL, Bonabeau E (2003) Scale-free networks. Sci Am 288(5):60–69
Bass FM (1969) A new product growth for model consumer durables. Manag Sci 15(5):215
227
Bass FM (1980) The relationship between diffusion rates, experience curves, and demand
elasticities for consumer durable technological innovations. J Bus 53(3):S51–S67
Bass FM, Krishnan TV, Jain DC (1994) Why the Bass model fits without decision variables.
Mark Sci 13(3):203–223
Bass FM, Jain D, Krishnan T (2000) Modeling the marketing-mix influence in new-product
diffusion. In: Mahajan V, Muller E, Wind Y (eds) New-product diffusion models. Springer,
Berlin, pp 99–122
Battisti G, Stoneman, P (1998) ‘The diffusion of unleaded petrol: an Anglo Italian
comparison’, Labour: Review of Labour Economics and Industrial Relations, 12:2, 254-278.
Battisiti, G (2008) ‘Innovations and the economics of new technology spreading within and
across users: gaps and way forward’, Journal of Cleaner Production, 16:S1, S22-S31
Baumgart-Getz A, Prokopy LS, Floress K (2012) Why farmers adopt best management
practice in the United States: a meta-analysis of the adoption literature. J Environ Manag
96:17–25.
Beal, G. M., & Rogers, E. M. (1960). The Adoption of Two Farm Practices in a Central Iowa
Community, Ames, Iowa Agricultural and Home Economics Experiment Station, Special
Report 26.Bose, Santi Priya (1964), "The Diffusion of a Farm Practice in Indian Villages,"
Rural Sociology, 29:53-66. RS(E)
Bemmaor AC (1994) Modeling the diffusion of new durable goods: word-of-mouth effect
versus consumer heterogeneity. In: Laurent G, Lilien GL, Pras B (eds) Research traditions in
marketing. Kluwer, Dordrecht, pp 201–229
Bemmaor AC, Lee J (2002) The impact of heterogeneity and ill-conditioning on diffusion
model parameter estimates. Mark Sci 21(2):209–220
Berelson, B., & Steiner, G. A. (1964). Human behavior: An inventory of scientific findings.
Berger T (2001) Agent-based spatial models applied to agriculture: a simulation tool for
technology diffusion, resource use changes and policy analysis. Agric Econ 25(2–3):245–260
Bernhardt I,Mackenzie KD (1972) Some problems in using diffusion models for new
products.Manag Sci 19(2):187–200.

101
Birol, E., Koundouri, P. and Kountouris, Y. (2007) ‘Farmers’ Demand for Recycled
Wastewater in Cyprus: A Contingent Valuation Approach’, Environmental Economy and
Policy Research Discussion Paper Series, University of Cambridge, Department of Land
Economics.
Blazy, J.M., Carpentier, A. and Thomas, A. (2011) ‘The willingness to adopt agro-ecological
innovations: Application of choice modelling to Caribbean banana planters’, Ecological
Economics, Vol. 72, pp.140-150, DOI:10.1016/j.ecolecon.2011.09.021.
Bohlmann JD, Calantone RJ, Zhao M (2010) The effects of market network heterogeneity on
innovation diffusion: an agent-based modeling approach. J Product Innov Manag 27(5):741–
760.
Bottomley PA, Fildes R (1998) The role of prices in models of innovation diffusion. J
Forecast 17(7): 539–555
Brin, S., Motwani, R., Page, L., & Winograd, T. (1998). What can you do with a web in your
pocket?. IEEE Data Eng. Bull., 21(2), 37-47.
Broekhuizen TLJ, Delre SA, Torres A (2011) Simulating the cinemamarket: how cross-
cultural differences in social influence explain box office distributions. J Product Innov
Manag 28(2):204–217
Brown, M (2001). Market failures and barriers as a basis for clean energy policies, Energy
Policy, 29:14, 1197-1207.
Brown JJ, Reingen PH (1987) Social ties and word-of-mouth referral behavior. J Consumer
Res 14(3): 350–362.
Buchta C, MeyerD, Pfister A, Mild A, TaudesA (2003) Technological efficiency and
organizational inertia: a model of the emergence of disruption. Comput Math Organ Theory
9(2):127–146.
Burnkrant, R. E., & Cousineau, A. (1975). Informational and normative social influence in
buyer behavior. Journal of Consumer research, 206-215.
Burt, R. S., Minor, M. J., & Alba, R. D. (1983). Applied network analysis: A methodological
introduction (pp. 176-194). Beverly Hills, CA: Sage Publications.
Buttle FA (1998) Word of mouth: understanding and managing referral marketing. J Strateg
Mark 6(3): 241–254.

102
Cantono, S., & Silverberg, G. (2009). A percolation model of eco-innovation diffusion: the
relationship between diffusion, learning economies and subsidies. Technological forecasting
and social change, 76(4), 487-496.
Centola, D. (2011). An experimental study of homophily in the adoption of health behavior.
Science, 334(6060), 1269-1272.
Chatterjee R, Eliashberg J (1990) The innovation diffusion process in a heterogeneous
population: a micromodeling approach. Manag Sci 36(9):1057–1079.
Chattoe E (2002) Building empirically plausible multi-agent systems: a case study of
innovation diffusion. In: Dautenhahn K, Bond A, Edmonds B (eds) Socially intelligent
agents: creating relationships with computers and robots. Springer, Berlin, pp 109–116.
Chen SH, Yang YH (2010) Agent-based social simulation: a bibliometric review. In:
Proceedings of the 3rd world congress on social simulation (WCSS 2010).
Choi H, Kim S, Lee J (2010) Role of network structure and network effects in diffusion of
innovations. Ind Mark Manag 39(1):170–177.
Cialdini, R. B., & Goldstein, N. J. (2004). Social influence: Compliance and conformity.
Annu. Rev. Psychol., 55, 591-621.
Coleman, J. S., Katz, E., & Menzel, H. (1966). Medical innovation: A diffusion study
(Second Edition). Indianapolis: Bobbs-Merrill.
Colizza, V., Barrat, A., Barthélemy, M., & Vespignani, A. (2006). The role of the airline
transportation network in the prediction and predictability of global epidemics. Proceedings
of the National Academy of Sciences of the United States of America, 103(7), 2015-2020.
Commissione Europea, DG AGRI. (2013). Regolamento (UE) N. 1305/2013 del Parlamento
Europeo e del Consiglio del 17 dicembre 2013 sul sostegno allo sviluppo rurale da parte del
Fondo Europeo agricolo per lo sviluppo rurale (FEASR) COM(2011) 627/3.
Copp, J. H., Sill, M. L., & Brown, E. J. (1958). The function of information-sources in the
farm practice adoption process. Rural Sociology, 23(2), 146-157.
Cristiano, S., Proietti, P. (2013). Farm Innovation through Rural Development Programmes:
experiences and pathways of innovation in Italy. The 21st ESEE, Antalya, Turkey, 2-6
September 2013.
Cristiano, S., & Proietti, P. (2014) Acting as Agricultural Innovation brokerage in Italy:
experiences from the Rural Development Programmes 2007-2013.

103
Cutler, DM, McClellan, M (1996). The determinants of technological change in heart attack
treatment. National Bureau of Economic Research Working Paper 5751, Cambridge,
Massachusetts.
Czepiel, J. A. (1974). Word-of-mouth processes in the diffusion of a major technological
innovation. Journal of Marketing Research, 172-180.
David PA (1985) Clio and the economics of QWERTY. Am Econ Rev 75(2):332–337.
Dawid H (2006) Agent-based models of innovation and technological change. In: Tesfatsion
L, Judd K (eds) Handbook of computational economics. North-Holland, pp 1235–1272.
DeCanio SJ, Dibble C, Amir-Atefi K (2000) The importance of organizational structure for
the adoption of innovations. Manag Sci 46(10):1285–1299.
Deffuant G, Huet S, Bousset JP, Henriot J, Amon G,Weisbuch G (2002) Agent based
simulation of organic farming conversion in Allier departement. In: Janssen MA (ed)
Complexity and ecosystem management: the theory and practice of multi-agent systems.
Edward Elgard Publishing, Arnold, pp 158–189.
Deffuant G, Huet S, Amblard F (2005) An individual-based model of innovation diffusion
mixing social value and individual benefit. Am J Sociol 110(4):1041–1069.
Delre SA(2007) Effects of social networks on innovation diffusion andmarket dynamics. PhD
Dissertation, University Groningen.
Delre SA, Jager W, Bijmolt THA, Janssen MA (2007) Targeting and timing promotional
activities: an agent-based model for the takeoff of new products. J Bus Res 60(8):826–835.
Delre SA, Jager W, Janssen MA (2007) Diffusion dynamics in small-world networks with
heterogeneous consumers. Comput Math Organ Theory 13(2):185–202.
Delre SA, JagerW, Bijmolt THA, JanssenMA (2010) Will it spread or not? The effects of
social influences and network topology on innovation diffusion. J Product Innov Manag
27(2):267–282.
Dermibas, M.F., Balat, M., Balat, H., 2011. Biowastes to biofuels. Energy Convers. Manag.
52 (1), 1815e1828.
Deroïan F (2002) Formation of social networks and diffusion of innovations. Res Policy
31(5):835–846.
Dockner E, Jorgensen S (1988) Optimal advertising policies for diffusion models of
newproduct innovation in monopolist situations. Manag Sci 34(1):119–130.
Dodson JA, Muller E (1978) Models of new product diffusion through advertising and word-
of-mouth. Manag Sci 24(15):1568–1578.

104
Dugundji ER, Gulyás L (2008) Sociodynamic discrete choice on networks in space: impacts
of agent heterogeneity on emergent outcomes. Environ Plan B Plan Des 35(6):1028–1054.
De Tarde, G. (1903). The laws of imitation. H. Holt.
Deutsch, M., & Gerard, H. B. (1955). A study of normative and informational social
influences upon individual judgment. The journal of abnormal and social psychology, 51(3),
629.
Diaz-Rainey, I. (2009). Induced diffusion: definition, review and suggestions for further
research. Review and Suggestions for Further Research .
Dimit, Robert M. (1954), Diffusion and Adoption of Approved Farm Practices in 11 Counties
in Southwest Virginia, PhD. Thesis, Ames, Iowa State University. RS(E).
Edmonds B, Moss S (2006) From KISS to KIDS: an ‘anti-simplistic’ modelling approach. In:
Davidsson P, Logan B, Takadama K (eds)Multi agent based simulation (LNAI 3415).
Springer, Berlin, pp 130–144.
Eliashberg J, Chatterjee R, Mahajan V, Wind Y (1986) Stochastic issues in innovation
diffusion models. In: Innovation diffusion models of new product acceptance. Ballinger
Publishing, pp 151–199.
Emmanouilides CJ,Davies RB (2007) Modelling and estimation of social interaction effects
in newproduct diffusion. Eur J Oper Res 177(2):1253–1274.
Erd˝os P, Rényi A (1960) On the evolution of random graphs. Publ Math Inst Hung Acad Sci
5(17):17–61.
European Network for Rural Development (2013a). Focus Group on Knowledge Transfer &
Innovation. EIP Operational Groups: Lessons and recommendations from from the 2007-
2013.Rural Development Programmes. Final draft. Bruxelles.
European Network for Rural Development (2013b). Focus Group on Knowledge Transfer &
Innovation. Towards Successful Innovation Brokerage: Insights from the 2007-2013 Rural
Development Programmes. Final draft. Bruxelles.
EU SCAR. (2012). Agricultural knowledge and innovation systems in transition – A
reflection paper. Brussels: Commissione Europea.
Evered RD (1976) A typology of explicative models. Technol Forecast Soc Change
9(3):259–277.
FaberA, Valente M, Janssen P (2010) Exploring domestic micro-cogeneration in the
Netherlands: an agentbased demand model for technology diffusion. Energy Policy
38(6):2763–2775.
105
Fava, et al., (2015). Biowaste biorefinery in Europe: opportunities and research
&development needs. New. Biotechnol. 32 (1), 100e108.
Feichtinger G (1982) Optimal pricing in a diffusion model with concave price-dependent
market potential. Oper Res Lett 1(6):236–240
Flynn, L. R., Goldsmith, R. E., & Eastman, J. K. (1996). Opinion leaders and opinion
seekers: Two new measurement scales. Journal of the Academy of Marketing Science, 24(2),
137-147.
Fourt LA, Woodlock JW (1960) Early prediction of market success for grocery products. J
Mark 25(4):31–38
Freeman, L. C. (1977). A set of measures of centrality based on betweenness. Sociometry, 35-
41.
Freeman, L.C. (1979) Centrality in Social Networks: Conceptual Clarification. Social
Networks, 1: 215–239.
Freeman, Linton C., Sue C. Freeman, and Alaina G. Michaelson (1988). "On human social
intelligence." Journal of Social and Biological Structures 11.4: 415-425.
Freeman, Linton C., Sue C. Freeman, and Alaina G. Michaelson (1989). "How humans see
social groups: A test of the Sailer-Gaulin models." Journal of Quantitative Anthropology 1.3
:229-238.
Funk, P (2002) ‘Induced innovation revisited’, Economica, 69, 155-171.
Galanakis, C.M., 2012. Recovery of high added-value components from food wastes:
conventional, emerging technologies and commercialized applications. Trends Food Sci.
Technol. 26 (2), 68e87.
Gallego B, Dunn AG (2010) Diffusion of competing innovations: the effects of network
structure on the provision of healthcare. J Artif Soc Soc Simul 13(4):8.
Garber T, Goldenberg J, Libai B,Muller E (2004) From density to destiny: using spatial
dimension of sales data for early prediction of new product success. Mark Sci 23(3):419–428.
Garcia R (2005) Uses of agent-based modeling in innovation/new product development
research. J Product Innov Manag 22(5):380–398.
Garcia R, Rummel P, Hauser J (2007) Validating agent-based marketing models through
conjoint analysis. J Bus Res 60(8):848–857.

106
GatignonH (2010) Commentary on JacobGoldenberg, Barak Libai and Eitan Muller’s “The
chilling effects of network externalities”. Int J Res Mark 27(1):16–17.
Gilbert EN (1959) Random graphs. Ann Math Stat 30(4):1141–1144.
Gilbert N (1997) A simulation of the structure of academic science. Sociol Res Online 2(2):3.
Glock, C. Y., & Nicosia, F. M. (1964). Uses of sociology in studying" consumption"
behavior. The Journal of Marketing, 51-54.
Goldenberg J, Efroni S (2001) Using cellular automata modeling of the emergence of
innovations. TechnolForecast Soc Change 68(3):293–308.
Goldenberg J, Libai B, Solomon S, Jan N, Stauffer D (2000) Marketing percolation. Phys A
Stat Mech Appl 284(1–4):335–347.
Goldenberg J, Libai B, Muller E (2001) Talk of the network: a complex systems look at the
underlying process of word-of-mouth. Mark Lett 12(3):211–223.
Goldenberg J, Libai B,Moldovan S, Muller E (2007) The NPV of bad news. Int J ResMark
24(3):186–200.
Goldenberg J, Lowengart O, Shapira D (2009) Zooming in: self-emergence of movements in
new productgrowth. Mark Sci 28(2):274–292.
Goldenberg J, Libai B,Muller E (2010) The chilling effects of network externalities. Int J Res
Mark 27(1):4–15.
Goldenberg J, Libai B, Muller E (2010) The chilling effects of network externalities:
perspectives andconclusions. Int J Res Mark 27(1):22–24.
Golove, WH, Eto, JH (1996). Market Barriers to Energy Efficiency: A Critical Reappraisal of
the Rationale for Public Policies to Promote Energy Efficiency, Energy and Environment
Division, Lawrence Berkeley National Laboratory, University of California Berkeley.
Granovetter MS (1973) The strength of weak ties. Am J Sociol 78(6):1360–1380.
Granovetter, M. (1978) Threshold Models of Collective Behavior. American Journal of
Sociology, 83: 1420–1443.
Gray, WB, Shadbegian, RJ (1998). Environmental regulation, investment timing, and
technology choice. Journal of Industrial Economics, 46:2, 235-256.
Greene, DL (1990) ‘CAFE or price?: An analysis of the effects of federal fuel economy
regulations and gasoline price on new car MPG, 1978-89’, The Energy Journal, 11:3, 37-57.
Grewal, R., Mehta, R., & Kardes, F. R. (2000). The role of the social-identity function of
attitudes in consumer innovativeness and opinion leadership. Journal of Economic
Psychology, 21(3), 233-252.

107
Griliches Z (1957) Hybrid corn: an exploration in the economics of technological change.
Econometrica 25(4):501–522.
Gu ̈nther M, Stummer C, Wakolbinger LM, Wildpaner M (2011) An agent-based simulation
approach for the new product diffusion of a novel biomass fuel. J Oper Res Soc 62(1):12–20.
Hägerstrand T (1967) Innovation diffusion as a spatial process. University of Chicago Press,
Chicago.
Hegselmann R, Krause U (2002) Opinion dynamics and bounded confidence models,
analysis, and simulation. J Artif Soc Soc Simul 5(3):2.
Hall, A., Janssen, W., Pehu, E., & Rajalahti, R. (2006). Enhancing agricultural innovation:
How to go beyond the strengthening of research systems. Washington, DC: World Bank.
Hanneman R.A. and M. Riddle (2005) Introduction to Social Network Methods. Riverside,
CA: University of California, Riverside (published in digital form at
http://faculty.ucr.edu/~hanneman/).
Hassett, KA, Metcalf, GE (1995) ‘Energy tax credits and residential conservation investment:
Evidence form panel data’, Journal of Public Economics, 57, 201-217.
Hauser JR, Tellis GJ, Griffin A (2006) Research on innovation: a review and agenda for
marketing science. Mark Sci 25(6):678–717.
Heeler RM, Hustad TP (1980) Problems in predicting new product growth for consumer
durables. Manag Sci 26(10):1007–1020.
Hermans, F., Klerkx, L., & Roep, D. (2012). Structural conditions for dynamic innovation
networks: a review of eight. Online proceedings IFSA 2012: Producing and reproducing
farming systems, The 10th European IFSA Symposium, Aarhus, Denmark, 1-4 July 2012. -
Aarhus, Denmark : IFSA, 2012, 1 - 11.
Herr PM, Kardes FR, Kim J (1991) Effects of word-of-mouth and product-attribute
information on persuasion: an accessibility-diagnosticity perspective. J Consumer Res
17(4):454–462.
HohnischM, Pittnauer S, Stauffer D (2008) A percolation-based model explaining delayed
takeoff in newproduct diffusion. Ind Corp Change 17(5):1001–1017.
Hopp WJ (2004) Tenmost influential papers of management science’s first fifty years. Manag
Sci 50(Suppl 12):1763.
Horsky D, Simon LS (1983) Advertising and the diffusion of new products. Mark Sci 2(1):1–
17.

108
Howarth, RB, Haddad, BM, Paton, B (2000) ‘The economics of energy efficiency: insights
from voluntary participation programs’, Energy Policy, 28 (6-7), 477-486.
Howells, J. (2006). Intermediation and the role of intermediaries in innovation. Research
Policy 35: 715-728
Hicks, J. R. (1932). The Theory of Wages London.
Higgins, A., Foliente, G., & McNamara, C. (2011). Modelling intervention options to reduce
GHG emissions in housing stock—A diffusion approach. Technological Forecasting and
Social Change, 78(4), 621-634.
ISPRA (Istituto Superiore per la Protezione e la Ricerca Ambientale) (2013) Italian
Greenhouse Gas Inventory, 1990-2011, National Inventory Report, available at
http://www.isprambiente.gov.it/files/pubblicazioni/rapporti/Rapporto_177_2013.
ISPRA (Istituto Superiore per la Protezione e la Ricerca Ambientale) (2015) Municipal Waste
Report - edition 2015, available at http://www.isprambiente.gov.it/en/archive/ispra-
events/year-2015/october/municipal-waste-report-edition-2015 .
ISTAT (Italian National Institute of Statistics) (2010) 6th General Census of Agriculture.
Jaffe, AB, Stavins, RN (1995) ‘Dynamic incentives of environmental regulations: The effects
of alternative policy instruments on technology diffusion’, Journal of Environmental
Economics and Management, 29:3, S43-S63.
Jaffe, AB, Newell, RG, Stavins, RN (2002) Environmental policy and technological change’,
Environmental and Resource Economics, 22, 41-69.
JagerW, Janssen MA, Vries HJMD, Greef JD, Vlek CAJ (2000) Behaviour in commons
dilemmas: Homoeconomicus and Homo psychologicus in an ecological-economic model.
Ecol Econ 35(3):357–379
Jain D, Mahajan V, Muller E (1991) Innovation diffusion in the presence of supply
restrictions. Mark Sci 10(1):83–90
Jain DC, Rao RC (1990) Effect of price on the demand for durables: modeling, estimation,
and findings.J Bus Econ Stat 8(2):163–170
JanssenMA, JagerW (2001) Fashions, habits and changing preferences: simulation of
psychological factors affecting market dynamics. J Econ Psychol 22(6):745–772
Janssen MA, Jager W (2002) Stimulating diffusion of green products. J Evolut Econ
12(3):283–306
JanssenMA, JagerW (2003) Simulating market dynamics: interactions between consumer
psychology and social networks. Artif Life 9(4):343–356
109
Jones JM, Ritz CJ (1991) Incorporating distribution into new product diffusion models. Int J
Res Mark 8(2):91–112.
Karrer, B., Newman, M. E., & Zdeborová, L. (2014). Percolation on sparse networks.
Physical review letters, 113(20), 208702.
Kasirajan, S. and Ngouajio, M. (2012) ‘Polyethylene and biodegradable mulches for
agricultural applications: a review’. Agronomy for Sustainable Development, Vol. 32, pp.501-
529, DOI 10.1007/s13593-011-0068-3.
Katz E (1961) The social itinerary of technical change: two studies on the diffusion of
innovation. Hum Organ 20(2):70–82
Katz ML, Shapiro C (1986) Technology adoption in the presence of network externalities. J
Polit Econ 94(4):822–841
Katz ML, Shapiro C (1992) Product introduction with network externalities. J Ind Econ
40(1):55–83
Katz, E. (1961). The social itinerary of technical change: two studies on the diffusion of
innovation. Human Organization, 20(2), 70-82.
Katz, E., & Lazarsfeld, P. F. (1955). Personal Influence, The part played by people in the
flow of mass communications. Transaction Publishers.
Kaufmann P, Stagl S, Franks DW (2009) Simulating the diffusion of organic farming
practices in two new EU member states. Ecol Econ 68(10):2580–2593
Kempe, D., Kleinberg, J., & Tardos, É. (2003, August). Maximizing the spread of influence
through a social network. In Proceedings of the ninth ACM SIGKDD international
conference on Knowledge discovery and data mining (pp. 137-146). ACM.
Kerr, S, Newell, RG (2003). Policy-induced technology adoption: Evidence from the US lead
phasedown. Journal of Industrial Economics, 51:3, 317-343.
Keeney RL,RaiffaH (1993) Decisions with multiple objectives: preferences and value
tradeoffs.Cambridge University Press, Cambridge
Kim S, Lee K, Cho JK, Kim CO (2011) Agent-based diffusion model for an automobile
market with fuzzy TOPSIS-based product adoption process. Expert Syst Appl 38(6):7270–
7276
Kocsis G, Kun F (2008) The effect of network topologies on the spreading of technological
developments. J Stat Mech Theory Exp 2008(10):P10,014
Kohli R, Lehmann DR, Pae J (1999) Extent and impact of incubation time in new product
diffusion. J Product Innov Manag 16(2):134–144
110
Kuandykov L, SokolovM (2010) Impact of social neighborhood on diffusion of innovation S-
curve. Decis Support Syst 48(4):531–535
Kiesling, E., Günther, M., Stummer, C., & Wakolbinger, L. M. (2012). Agent-based
simulation of innovation diffusion: a review. Central European Journal of Operations
Research, 20(2), 183-230.
Kleinberg, J. M., Kumar, R., Raghavan, P., Rajagopalan, S., & Tomkins, A. S. (1999). The
web as a graph: measurements, models, and methods. In Computing and combinatorics (pp.
1-17). Springer Berlin Heidelberg.
Klerkx, L., Hall, A., Leeuwis, C. (2009). Strengthening agricultural innovation capacity: are
innovation brokers the answer? International Journal of Agricultural Resources, Governance
and Ecology 8: 409-438
Knickel, K., Brunori, G., Rand, S., & Proost, J. (2009). Towards a better conceptual
framework for innovation proceses in agricultural and rural development: from linear models
to systemic approaches.:. Journal of Agricultural Education and Extension 15(2).
Knoke, D., & Kuklinski, J. H. (1982). Network analysis.
Knowler D, Bradshaw B (2007) Farmers’ adoption of conservation agriculture: a review and
synthesis of recent research. Food Pol 32:25–48.
Koefoed, M, Buckley, C (2008) ‘Clean technology transfer: a case study from the South
African metal finishing industry, 2000-2005’, Journal of Cleaner Production, 16:S1, S78-
S84.
Kovács, I. A., & Barabási, A. L. (2015). Network science: Destruction perfected. Nature,
524(7563), 38-39.
Kuandykov L, SokolovM (2010) Impact of social neighborhood on diffusion of innovation S-
curve. Decis Support Syst 48(4):531–535
Labarthe, P., & Laurent, C. (2013). The Importance of the Back-office for Farm Advisory
Services. Eurochoices, 12(1): 21–26.
Lafferty, R, Hunger, D, Ballard, J, Mahrenholz, G, Mead, D, Bandera, D (2001)Demand
Responsiveness in Electricity Markets, Office of Markets, Tariffs and Rates. [Online] (cited
15 May 2008) Available from:http://www.naseo.org.
Latruffe, L. (2010). Competitiveness, Productivity and Efficiency in the agricultural and
Agrifood sectors - Working Papers, No. 30 . OECD .
Lazarsfeld, P. F., & Menzel, H. (1963). Mass Media and Personal Influence In The Science
of Human Communication. Wilbur Schramm :pp. 94-115.

111
Lazarsfeld, P. F. (1944). The controversy over detailed interviews—an offer for negotiation.
Public opinion quarterly, 8(1), 38-60.
Leeuwis, C., Leeuwis, C., & Ban, A. (2004). Communication for rural innovation. Blackwell
Publishers.
Lorcks, J., Pommeranz, W., Klenke, K., Schmidt, H., & Heuer, J. (1998). U.S. Patent No.
5,770,137. Washington, DC: U.S. Patent and Trademark Office. Markus, M. L. (1987).
Toward a “critical mass” theory of interactive media universal access, interdependence and
diffusion. Communication research, 14(5), 491-511.
Pei-Chun, L. and Yi-Hsuan, H. (2012) ‘The influence factors on choice behaviour regarding
green products based on the theory of consumption values’, Journal of Cleaner Production,
Vol. 22, pp.11-18.
Little JDC (1970) Models and managers: the concept of a decision calculus. Manag Sci
16(8):466–485
Luken, R, Van Rompaey, F (2008). Drivers for and barriers to environmentally sound
technology adoption by manufacturing plants in nine developing countries. Journal of
Cleaner Production, 16:S1, S67-S77.
Macy MW, Willer R (2002) From factors to actors: computational sociology and agent-
based modeling. Annu Rev Sociol 28(1):143–166
Maienhofer D, Finholt T (2002) Finding optimal targets for change agents: a computer
simulation of innovation diffusion. Comput Math Organ Theory 8(4):259–280
Maier FH (1998) Newproduct diffusion models in innovationmanagement: a system
dynamics perspective. Syst Dyn Rev 14(4):285–308.
Mansfield E (1961) Technical change and the rate of imitation. Econometrica 29(4):741–766.
Mahajan V, Muller E (1979) Innovation diffusion and new product growth models in
marketing. J Mark 43(4):55–68.
Mahajan V, Muller E, Bass FM (1990) New product diffusion models in marketing: a review
and directions for further research. J Mark 54(1):1–26.
Mahajan, V., Muller, E., & Srivastava, R. K. (1990). Determination of adopter categories by
using innovation diffusion models. Journal of Marketing Research, 37-50.
Mahajan V, Muller E, BassFM (1995) Diffusion of newproducts: empirical generalizations
andmanagerial uses. Mark Sci 14(3):79–88.
Mahajan V, Muller E, Wind Y (2000) New-product diffusion models. Springer, Berlin.

112
Markus, M. L. (1987). Toward a “critical mass” theory of interactive media universal access,
interdependence and diffusion. Communication research, 14(5), 491-511.
Martins ACR, Pereira CdB, Vicente R (2009) An opinion dynamics model for the diffusion
of innovations. Phys A Stat Mech Appl 388(15–16):3225–3232.
McCraw, D. and Motes, J.E. (1991) Use of plastic mulch and row covers in vegetable
production, Cooperative Extension Service, Oklahoma State University. OSU Extension
Facts F-6034.
Mickwitz, P, Hyvattinen, H, Kivimaa, P (2007) ‘The role of policy instruments in the
innovation and diffusion of environmentally friendlier technologies: popular claims versus
case study experiences’, Journal of Cleaner Production, 16:S1, S162-S170.
Mirabella, N., Castellani, V., Serenella, S., (2014). Current options for the valorization of
food manufacturing waste: a review. J. Clean. Prod. 65, 28e41.
Montoneri, E., Mainero, D., Boffa, V., Perrone, D.G. and Montoneri, C. (2011)
‘Biochemenergy: a project to turn a urban wastes treatment plant into bio refinery for the
production of energy, chemicals and consumer’s products with friendly environmental
impact’, International Journal of Global Environmental Issues.
Morgenstern, RD, Al-Jurf, S (1999). Can free information really accelerate technology
diffusion. Technological Forecasting and Social Change, 61:1, 13-24.
Morone, F., & Makse, H. A. (2015). Influence maximization in complex networks through
optimal percolation. Nature.
Mosley, M. (2000). Innovation and rural development – Some Lessons from Britain and
Western Europe. Planning Practice & Research. 15.1/2, 95-115.
Newell, RG, Jaffe, AB, Stavins, RN (1999). The induced innovation hypothesis and energy-
saving technological change’, The Quarterly Journal of Economics, 114:3, 941-975.
Newman, M. (2010). Networks: an introduction. OUP Oxford.
Picuno, P., & Scarascia-Mugnozza, G. (1994, December). The management of agricultural
plastic film wastes in Italy. In Proceedings of the international agricultural engineering
conference, Bangkok (Thailand), pp. 797-808.
Pannell DJ, Marshall GR, Barr N, Curtis A, Vanclay F, Wilkinson R (2006) Understanding
and promoting adoption of conservation practices by rural landholders. Aust J Exp Agric
46:1407–1424.
Pastor-Satorras, R., & Vespignani, A. (2001). Epidemic spreading in scale-free networks.
Physical review letters, 86(14), 3200.
113
Perez, S.A., Klerkx L., Leeuwis, C. (2010). Innovation brokers and their roles in value chain
network innovation: preliminary findings and a research agenda. ISDA 2010, Montpellier,
France.
Popp, D. (2006). Innovation in climate policy models: Implementing lessons from the
economics of R&D. Energy Economics, 28(5), 596-609.
Prokopy LS, Floress K, Klotthor-Weinkauf D, Baumgart-Getz A (2008) Determinants of
agricultural best management practice adoption: evidence from the literature. J Soil Water
Conserv 63:300–311.
Rahmandad H, Sterman J (2008) Heterogeneity and network structure in the dynamics of
diffusion: comparing agent-based and differential equation models. Manag Sci 54(5):998–
1014.
Reingen PH,Kernan JB (1986) Analysis of referral networks in marketing: methods and
illustration. JMark Res 23(4):370–378.
Reimer AP, Weinkauf DK, Prokopy LS (2012) The influence of perceptions of practice
characteristics: an examination of agricultural best management practice adoption in two
Indiana watersheds. J Rural Stud 28:118–128.
Rixen, M., & Weigand, J. (2014). Agent-based simulation of policy induced diffusion of
smart meters. Technological Forecasting and Social Change, 85, 153-167.
Ryan, B., & Gross, N. C. (1943). The diffusion of hybrid seed corn in two Iowa communities.
Rural sociology, 8(1), 15.
Rogers, Everett M. (1958), "A Conceptual Variable Analysis of Technological Change,"
Rural Sociology, 23:136-145. RS (E).
Rogers EM (1962) Diffusion of innovations. Free Press, New York.
Rogers EM (1976) New product adoption and diffusion. J Consumer Res 2(4):290–301.
Rogers EM (2003) Diffusion of innovations. 5. Free Press, New York.
Rogers, E. M. (2003). Elements of diffusion. Diffusion of innovations, 5, 1-38.
Rose, N, Joskow, P (1990). The diffusion of new technologies: Evidence from the electric
utility industry’, Rand Journal of Economics, 21:3, 354-373.
Ryan B, Gross N (1943) The diffusion of hybrid seed corn in two Iowa communities. Rural
Sociol 8(1):15–24.
Sanstad, AH, Howarth, RB (1994). Normal markets, market imperfections and
energyefficiency’, Energy Policy, 22:10, 811-818.
Schelling TC (1971) Dynamic models of segregation. J Math Sociol 1(1):143–186.
114
Schwarz N, Ernst A (2009) Agent-basedmodeling of the diffusion of environmental
innovations: an empiricalapproach. Technol Forecast Soc Change 76(4):497–511.
Schwoon M (2006) Simulating the adoption of fuel cell vehicles. J Evol Econ 16(4):435–472.
ShaikhNI, Rangaswamy A, BalakrishnanA(2006) Modeling the diffusion of innovations
using small-world networks. Technical report, Penn State.
Snyder, LH, Miller, ND, Stavins, RN ‘The effects of environmental regulation on technology
diffusion: The case of chlorine manufacturing’, American Economic Review, 93:2, 431-435.
Smits, R., Kuhlmann, S., (2004). The rise of systemic instruments in innovation policy.
International Journal of Foresight and Innovation Policy 1: 4-30.
Soderholm, P, Klaassen, G (2007) ‘Wind power in Europe: A simultaneous innovation-
diffusion model’, Environmental & Resource Economics, 36, 163-190.
Sorrell, S, O'Malley, E, Schleich, J, Scott, S (2004). The Economics of Energy Efficiency:
Barriers to Cost-Effective Investment, Edward Elgar, Cheltenham.
Straffin, P. D. (1980). Linear algebra in geography: Eigenvectors of networks. Mathematics
Magazine, 53(5), 269-276.
Stremersch S, Tellis GJ, Franses PH, Binken JL (2007) Indirect network effects in new
product growth. J Mark 71(3):52–74.
Stremersch S, Lehmann DR, Dekimpe M (2010) Preface to “The chilling effects of network
externalities”.Int J Res Mark 27:1–3.
Stoneman, P, Battisti, G (1998) ‘The greening of consumer spending: unleaded petrol in
Europe’, Research Policy, 27, 187-213.
Stoneman, P, Battisti, G (2000) ‘The role of regulation, fiscal incentives and changes in tastes
in the diffusion of unleaded petrol’, Oxford Economic Papers, 52:2, 326-356.
Tanny SM, Derzko NA (1988) Innovators and imitators in innovation diffusion modelling. J
Forecast 7(4):225–234.
Thiriot S, Kant JD (2008) Using associative networks to represent adopters’ beliefs in a
multiagent modelof innovation diffusion. Adv Complex Syst 11(2):261–272.
Tey, Y. S., Li, E., Bruwer, J., Abdullah, A. M., Brindal, M., Radam, A., ... & Darham, S.
(2014). The relative importance of factors influencing the adoption of sustainable agricultural
practices: a factor approach for Malaysian vegetable farmers. Sustainability science, 9(1), 17-
29.

115
Tey YS, Brindal M (2012) Factors influencing the adoption of precision agricultural
technologies: a review for policy implications. Precis Agric 13:713–730.
Travers J,Milgram S (1969) An experimental study of the smallworld problem. Sociometry
32(4):425–443.
Valente, T. (1995) Network models of the diffusion of innovations. Cresskill, NJ, Hampton
Press.
Valente, T. W. (1996). Social network thresholds in the diffusion of innovations. Social
networks, 18(1), 69-89.
Valente, T. W., & Davis, R. L. (1999). Accelerating the diffusion of innovations using
opinion leaders. The Annals of the American Academy of Political and Social Science,
566(1), 55-67.
Van Eck, P. S., Jager, W., & Leeflang, P. S. (2011). Opinion leaders' role in innovation
diffusion: A simulation study. Journal of Product Innovation Management, 28(2), 187-203.
Valente TW, Davis RL (1999) Accelerating the diffusion of innovations using opinion
leaders. Ann Am Acad Polit Soc Sci 566(1):55–67
Valente TW, Rogers EM (1995) The origins and development of the diffusion of innovations
paradigm as an example of scientific growth. Sci Commun 16(3):242–273
Van den Bulte C, Lilien GL (1997) Bias and systematic change in the parameter estimates of
macro-level diffusion models. Mark Sci 16(4):338–353.
Van den Bulte C, Stremersch S (2004) Social contagion and income heterogeneity in new
product diffusion: a meta-analytic test. Mark Sci 23(4):530–544.
van Eck PS, Jager W, Leeflang PSH (2011) Opinion leaders’ role in innovation diffusion: a
simulation study. J Product Innov Manag 28(2):187–203.
van Vliet O, de Vries B, Faaij A, Turkenburg W, Jager W (2010) Multi-agent simulation of
adoption of alternative fuels. Transp Res Part D Transp Environ 15(6):326–342.
Veblen T (1899) The theory of the leisure class. Macmillan, New York.
Venkatesan R, Krishnan TV, Kumar V (2004) Evolutionary estimation of macro-level
diffusion models using genetic algorithms: an alternative to nonlinear least squares. Mark Sci
23(3):451–464.
Walker JL (1969) The diffusion of innovations among theAmerican states.AmPolit SciRev
63(3):880–899.
Wasserman, S. and K. Faust (1994) Social network analysis: methods and applications.
Cambridge University Press.

116
Watts DJ, Strogatz SH (1998) Collective dynamics of “small-world” networks. Nature
393(6684):440–442
Weimann, G., Tustin, D. H., Van Vuuren, D., & Joubert, J. P. R. (2007). Looking for opinion
leaders: Traditional vs. modern measures in traditional societies. International Journal of
Public Opinion Research, 19(2), 173-190.
Wellman, B., & Berkowitz, S. D. (1988). Social structures: A network approach (Vol. 2).
CUP Archive.
Windrum P, Fagiolo G, Moneta A (2007) Empirical validation of agent-based models:
alternatives and prospects. J Artif Soc Soc Simul 10(2):8.
Wissler C (1915) The diffusion of horse culture among the North American indians. Proc
Natl Acad Sci USA 1(4):254–256.
World Bank. (2006). Enhancing Agricultural Innovation: How to Go Beyond the
Strengthening of Research Systems. Washington DC: The World Bank.
Zhang T, Nuttall WJ (2011) Evaluating government’s policies on promoting smart metering
diffusion in retail electricity markets via agent-based simulation. J Product Innov Manag
28(2):169–186.
Zhang T, Gensler S, Garcia R (2011) A study of the diffusion of alternative fuel vehicles: an
agent-based modeling approach. J Product Innov Manag 28(2):152–168.