Chemical Tuning versus Microstructure Features in Solid-State Gas Sensors: LaFe 1-x Ga x O 3 , a...
9
Chemical Tuning versus Microstructure Features in Solid-State Gas Sensors: LaFe 1‑x Ga x O 3 , a Case Study Marta Maria Natile,* ,†,‡ Andrea Ponzoni, §,∥ Isabella Concina, §,∥ and Antonella Glisenti ‡ † CNR-IENI, INSTM-Padova, via F. Marzolo 1, 35131 Padova, Italy ‡ Dipartimento di Scienze Chimiche, Universita ̀ di Padova, via F. Marzolo 1, 35131 Padova, Italy § CNR-INO Sensor Laboratory, via Branze 45, 25123 Brescia, Italy ∥ Department of Information Engineering, University of Brescia, via Valotti 9, 25133 Brescia, Italy * S Supporting Information ABSTRACT: A simple and cheap wet chemical approach is exploited to synthesize LaFe 1‑x Ga x O 3 (x =0−1) crystalline perovskites. Ga doping level deeply influences not only the microstructure, but also the iron chemical features and consequently the responses to external chemicals. Sensitivity toward gases (NO 2 , CO, and ethanol), in fact, is driven by both Fe/Ga ratio and iron oxidation states, which are demonstrated playing a role much stronger than morphological parameters, such as grain size and specific surface area, usually dominating the performances of metal oxide based gas sensors. Results highlight that sensing behavior is tunable within a large extent by a simple and effective modulation of the chemical composition, obtaining sensitivities comparable with state of the art perovskite based gas sensors. ■ INTRODUCTION The development of high performance solid-state gas sensors is a topic of increasing interest, especially due to the need of facing environmental issues strictly correlated with the increase of living standards of a growing population throughout the world. In this frame, a large variety of fields is concerned with the applications of reliable gas sensors, such as for instance air quality monitoring, automotive control, food quality evaluation, citizen security, and medical diagnosis. 1−5 In recent years scientists are carrying out remarkable efforts to prepare materials featuring high sensitivity together with long-term stability for integration in smart machines. 6−8 In this contest solid-state gas sensors based on perovskite oxides are highly intriguing. Both multiple functionalities (catalytic, magnetic, electric) and chemical, thermal, and mechanical stability make perovskites excellent candidates for a wide array of applications in several technological fields ranging from abatement of pollutant emission, membranes for oxygen separation, sustainable energy production, as well as gas-sensing. 9,10 The large variety of properties displayed by perovskite oxides, ABO 3 , is due to the ability of the framework to accommodate different cations (of various sizes and valences) in a broad rage of concentrations and to the tolerance toward anionic and cationic vacancies. In particular perovskite-type oxides based on elements of the first transition series offer a wide range of defect-related phenomena. Defects in these types of oxides can arise from cation deficiency in either A (occupied by lanthanum ion) or B (occupied by metal from the first transition metal series) sites or oxygen deficiency. Moreover, both A and B cations can be partially substituted leading to A 1‑x A′ x B 1‑y B′ y O 3 oxide systems with tuned structural, catalytic, and electrical properties. Thus, by a careful selection of A and B cations, manipulation of perovskite properties devoted to a specific requirement is in principle possible. 9 Several nanocrystalline ABO 3 materials have been studied in the field of solid-state gas sensors to detect toxic and combustible gases, such as CO, NO x , alcohol, acetone, and gasoline. Particular attention has been paid to LaFeO 3 based materials, thanks to the peculiarity of iron existing in several oxidation states, depending on both the synthesis process and environmental factors, such as the temperature and oxygen partial pressure, offering the possibility to control the functional performances of the perovskite. 11−14 Gas sensing properties of LaFeO 3 prepared by thermal decomposition and by sol−gel method were investigated by Kersen 15 and Toan. 16 In particular, the former studied how the sintering in different atmospheres and conditions influences the oxygen content and consequently the NO 2 absorption. The latter evidenced that gas sensing performance increases with decrease of particle sizes and increase of specific surface area. Many authors 17−20 studied the effect of different cations in A site or the partial substitution of iron in B site 21 on sensitivity and selectivity toward toxic gases. Received: June 10, 2013 Revised: February 5, 2014 Published: February 5, 2014 Article pubs.acs.org/cm © 2014 American Chemical Society 1505 dx.doi.org/10.1021/cm4018858 | Chem. Mater. 2014, 26, 1505−1513
Transcript of Chemical Tuning versus Microstructure Features in Solid-State Gas Sensors: LaFe 1-x Ga x O 3 , a...
Chemical Tuning versus Microstructure Features in Solid-State GasSensors: LaFe1‑xGaxO3, a Case StudyMarta Maria Natile,*,†,‡ Andrea Ponzoni,§,∥ Isabella Concina,§,∥ and Antonella Glisenti‡
†CNR-IENI, INSTM-Padova, via F. Marzolo 1, 35131 Padova, Italy‡Dipartimento di Scienze Chimiche, Universita di Padova, via F. Marzolo 1, 35131 Padova, Italy§CNR-INO Sensor Laboratory, via Branze 45, 25123 Brescia, Italy∥Department of Information Engineering, University of Brescia, via Valotti 9, 25133 Brescia, Italy
*S Supporting Information
ABSTRACT: A simple and cheap wet chemical approach is exploited to synthesizeLaFe1‑xGaxO3 (x = 0−1) crystalline perovskites. Ga doping level deeply influences not onlythe microstructure, but also the iron chemical features and consequently the responses toexternal chemicals. Sensitivity toward gases (NO2, CO, and ethanol), in fact, is driven by bothFe/Ga ratio and iron oxidation states, which are demonstrated playing a role much strongerthan morphological parameters, such as grain size and specific surface area, usually dominatingthe performances of metal oxide based gas sensors. Results highlight that sensing behavior istunable within a large extent by a simple and effective modulation of the chemical composition,obtaining sensitivities comparable with state of the art perovskite based gas sensors.
■ INTRODUCTION
The development of high performance solid-state gas sensors isa topic of increasing interest, especially due to the need offacing environmental issues strictly correlated with the increaseof living standards of a growing population throughout theworld. In this frame, a large variety of fields is concerned withthe applications of reliable gas sensors, such as for instance airquality monitoring, automotive control, food quality evaluation,citizen security, and medical diagnosis.1−5 In recent yearsscientists are carrying out remarkable efforts to preparematerials featuring high sensitivity together with long-termstability for integration in smart machines.6−8
In this contest solid-state gas sensors based on perovskiteoxides are highly intriguing. Both multiple functionalities(catalytic, magnetic, electric) and chemical, thermal, andmechanical stability make perovskites excellent candidates fora wide array of applications in several technological fieldsranging from abatement of pollutant emission, membranes foroxygen separation, sustainable energy production, as well asgas-sensing.9,10 The large variety of properties displayed byperovskite oxides, ABO3, is due to the ability of the frameworkto accommodate different cations (of various sizes andvalences) in a broad rage of concentrations and to thetolerance toward anionic and cationic vacancies. In particularperovskite-type oxides based on elements of the first transitionseries offer a wide range of defect-related phenomena. Defectsin these types of oxides can arise from cation deficiency ineither A (occupied by lanthanum ion) or B (occupied by metalfrom the first transition metal series) sites or oxygen deficiency.
Moreover, both A and B cations can be partially substitutedleading to A1‑xA′xB1‑yB′yO3 oxide systems with tuned structural,catalytic, and electrical properties. Thus, by a careful selectionof A and B cations, manipulation of perovskite propertiesdevoted to a specific requirement is in principle possible.9
Several nanocrystalline ABO3 materials have been studied inthe field of solid-state gas sensors to detect toxic andcombustible gases, such as CO, NOx, alcohol, acetone, andgasoline. Particular attention has been paid to LaFeO3 basedmaterials, thanks to the peculiarity of iron existing in severaloxidation states, depending on both the synthesis process andenvironmental factors, such as the temperature and oxygenpartial pressure, offering the possibility to control the functionalperformances of the perovskite.11−14
Gas sensing properties of LaFeO3 prepared by thermaldecomposition and by sol−gel method were investigated byKersen15 and Toan.16 In particular, the former studied how thesintering in different atmospheres and conditions influences theoxygen content and consequently the NO2 absorption. Thelatter evidenced that gas sensing performance increases withdecrease of particle sizes and increase of specific surface area.Many authors17−20 studied the effect of different cations in Asite or the partial substitution of iron in B site21 on sensitivityand selectivity toward toxic gases.
Received: June 10, 2013Revised: February 5, 2014Published: February 5, 2014
Article
pubs.acs.org/cm
© 2014 American Chemical Society 1505 dx.doi.org/10.1021/cm4018858 | Chem. Mater. 2014, 26, 1505−1513
However, despite a large number of available studies, much isstill to be understood in terms of fundamental chemistry as wellas physics of these materials and their gas sensing properties,especially accounting for the high flexibility of perovskites.In general, the gas sensing performance of a material is
directly correlated with small grain size and high specific surfacearea.22 Other factors, as chemical composition, however, couldplay a key role in gas sensing performance.Few authors have already highlighted this possibility in
catalysis: strict correlation has been evidenced between catalyticactivity of iron based perovskites and the easiness of iron toexist in different oxidation states, usually Fe(III) and Fe(IV). Arecent study on Fe/ZSM-5 has evidenced that alsoheteroatoms, e.g. gallium, can play an important role in theformation of active iron species such as Fe(II).23
Borrowing inspiration by aforementioned considerations,herein the effect of different iron oxidation states, finelymodulated by gallium doping, in gas sensing performance isinvestigated.We demonstrate how the chemical composition of the sensor
device, namely the Ga/Fe ratio together with the presence ofdifferent iron oxidation states, affects the functional perform-ances much more heavily than morphological parameters, oftenpointed out as the main responsible for responses toward gases.LaFe1‑xGaxO3 species with different amounts of gallium
(LaFe0.8Ga0.2O3, LaFe0.6Ga0.4O3, LaFe0.4Ga0.6O3, La-Fe0.2Ga0.8O3) were prepared by wet chemical preparationprocedure. In addition, for comparison purposes, LaFeO3 andLaGaO3 perovskites were also synthesized. All the preparedmaterials were characterized by means of different techniques inorder to explore the effect of dopant concentrations on theLaFe1‑xGaxO3 perovskite properties. In particular, the effects ofgallium amount on the crystal structure, crystallite sizes,morphology, surface hydroxylation, surface chemical composi-tion, and iron oxidation state of the LaFe1‑xGaxO3 perovskiteswere investigated and discussed. Finally the gas sensingperformances were studied addressing the effects induced bythe iron species.
■ EXPERIMENTAL SECTIONSynthesis. All the samples were synthesized by using the citrate gel
me thod . 2 4 La (NO3) 3 ·6H2O (A ld r i ch 99 . 999%) , Ga -(CH3COCHCOCH3)3 (Strem 99.99+%), Sr(NO3)2 (Carlo Erba>98%), Fe(NO3)3·9H2O (Janssen 99%), and citric acid, C6H8O7,(Acros 99.5%) were used as the starting materials without any furtherpurification. In a typical synthesis, stoichiometric amounts of metalprecursors were carefully weighed and dissolved in deionized water.Citric acid was added as the complexing agent to this solution. Theamount of citric acid was such that the ratio of total number of molesof cations to that of citric acid was 1:1.9 The resulting aqueoussolution was slowly evaporated under stirring at about 70 °C until aviscous gel was obtained. The gel was dried at 110 °C, and theobtained spongy material was crushed and calcined in air at 900 °C for5 h.Chemical−Physical Characterization. X-ray diffraction patterns
were obtained with a Bruker D8 Advance diffractometer with Bragg−Brentano geometry using Cu Kα radiation (40 kV, 40 mA, λ = 0.154nm). The data were collected at 0.02° at a counting time of 10 s/stepin the (2θ) range from 20° to 80°. The crystalline phases wereidentified by the search-match method using the JCPDS database. Thephase compositions, structure, lattice parameters, and crystallite sizesof the powders were determined by Rietveld powder structurerefinement analysis of XRD data, by using the MAUD (MaterialAnalysis Using Diffraction) software, applying the RITA/RISTAmethod as developed by Wenk et al.25,26 The Rietveld method has
given a reasonable fit of the diffraction profiles (Rwp ≤ 5%). Therequired crystallographic data were taken from ICSD (InorganicCrystal Structure Database, version 2007, Fachinformationszentrum,Karlsruhe, Germany).
XP spectra were recorded by using a Perkin-Elmer PHI 5600 cispectrometer with a standard Al Kα source (1486.6 eV) working at250 W. The working pressure was less than 7 × 10⁻⁷ Pa. Thespectrometer was calibrated by assuming the binding energy (BE) ofthe Au 4f7/2 line to be 84.0 eV with respect to the Fermi level.Extended spectra (survey) were collected in the range 0−1350 eV(187.85 eV pass energy, 0.5 eV step, 0.025 s step−1). Detailed spectrawere recorded for the following regions: La 3d, Fe 2p, Ga 2p3/2, O 1s,and C 1s (29.35 eV pass energy, 0.1 eV step, 0.2 s step−1). Thereported binding energies (BEs, standard deviation ±0.1 eV) werecorrected for the charging effects by considering the adventitious C 1sline at 285.0 eV. The atomic percentage, after a Shirley typebackground subtraction,27 was evaluated by using the PHI sensitivityfactors.28 Samples for the XPS analysis were evacuated for 12 h at ca. 1× 10⁻³ Pa before measurements.
Field emission-scanning electron microscopy (FE-SEM) was run ona LEO 1525 equipped with an Oxford INCA x-sight X-ray detector(sampling at 15 KeV).
Temperature programmed reduction (TPR) and BET single-pointspecific surface area measurements were performed with a Micro-meritics Autochem II-2920 equipped with a TCD detector. TPRprofiles were obtained heating at 10 °C/min in H2 5%/Ar afteroutgassing with He for 30 min at RT.
The amounts of Fe(II) and total iron were determined byspectrophotometric analysis (using 1,10-phenanthroline) using aVarian CARY 5E UV−vis−NIR spectrophotometer.29,30
Gas Sensing Characterization. Gas sensors were prepared bydispersing perovskite powders in ethanol and dropping the obtainedsuspension over alumina substrates provided with interdigitated Ptelectrodes and a Pt meander acting as heating element. A fulldescription of the device layout is provided in a previous paper.31 Priorto functional tests, sensors were heated overnight at 500 °C in dry airconditions in order to desorb physi- and chemisorbed water that mayaffect the sensing performance of devices. Gas sensing measurementswere carried out by means of flow-through method, using a constantflow of 0.3 slm (standard liters per minute). Atmosphere compositionwas controlled using mass flow controllers to mix flows coming fromcertified gas bottles. The sensor signal was measured by applying aconstant bias of 1 V to the sensing layer and measuring the currentthrough it by means of a picoamperometer. According to theconvention usually adopted in gas sensing for p-type materials, sensorresponse was calculated as (GGAS − GAIR)/GAIR, hereafter shortened asΔG/G, for oxidizing gases (NO2), and as (RGAS − RAIR)/RAIR,hereafter shortened as ΔR/R, for reducing gases (CO and ethanol).
■ RESULTS
Characterization. All the samples were prepared by citrate-gel method, which was preferred to the conventional solid-stateapproach (using metal oxides and/or carbonates as startingmaterials).32,33 The wet chemical route, in fact, offers twoimportant advantages due to its chemical and processingversatility: it allows a reproducible tailoring of materialproperties (through fine control over composition, morphol-ogy, and structure) and, hence, the preparation of high addedvalue functional materials; it is energy saving operating atrelatively lower temperature with respect to solid-stateapproach. All the samples regardless of the composition arecharacterized by a single-phase perovskite type structure(Figure 1): no reflections of minor phases are present. Thenarrow reflections confirm that all samples are well-crystallizedafter the calcination at 900 °C. Both LaFeO3 and LaGaO3 arecharacterized by orthorhombic symmetry that is also retained inall the LaFe1‑xGaxO3 samples.
34 Moreover, the inset in Figure 1
Chemistry of Materials Article
dx.doi.org/10.1021/cm4018858 | Chem. Mater. 2014, 26, 1505−15131506
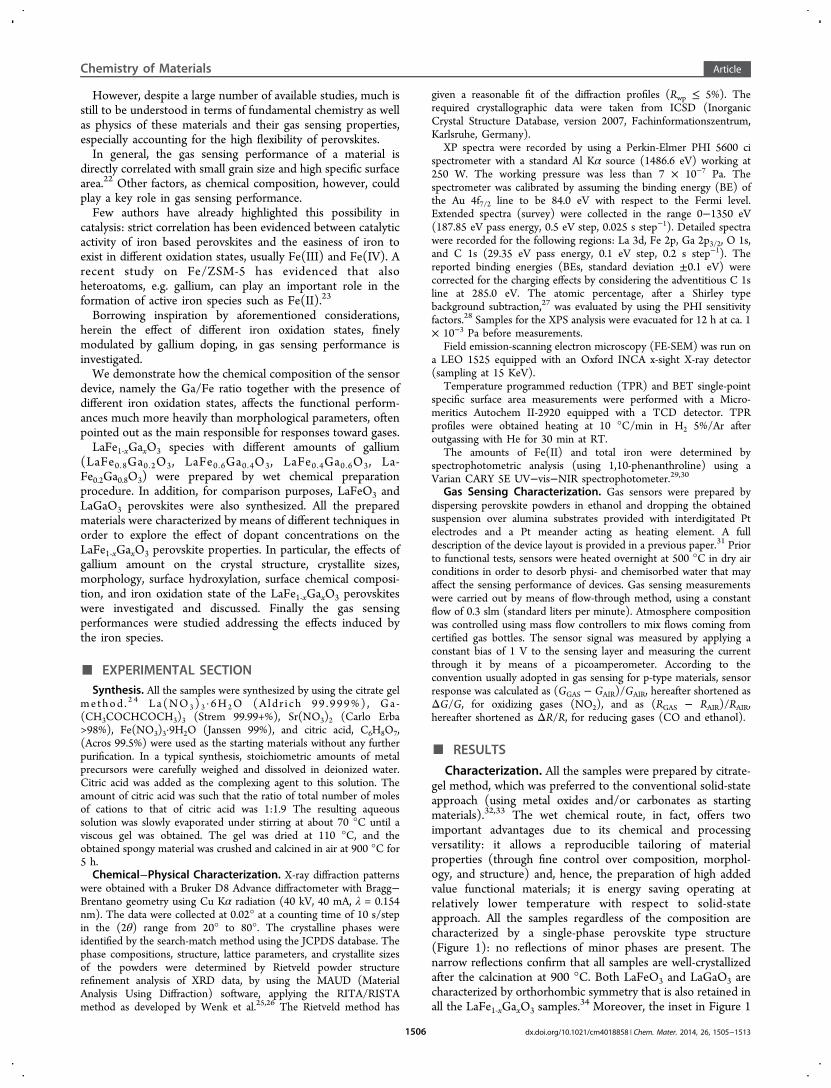
clearly shows that, by going from LaFeO3 to LaGaO3 throughLaFe1‑xGaxO3 samples, a notable shift of the diffraction peakstoward higher 2θ values is evident: the unit cell parametersdecrease with the increase of gallium amount, as furthercorroborated by the structure refinement obtained using theRietveld method, as listed in Table 1. The ionic radius ofGa(III) (r = 76 pm), in fact, is lower than that of Fe(III) ions (r= 78.5 pm), which is the main iron species.35,36 A clear trend ofcrystallite sizes is recognized (Table 1, Figure 2): increasing ingallium doping determines a systematic increase in crystallitesizes, while both LaFeO3 and LaGaO3 present the largest sizes,the latter possessing the biggest size within the series.The decrease of crystallite size with iron amount, already
observed in another iron containing perovskite,24 confirms thatthe compositional complexity of a system influencing thenucleation and growth from a thermodynamic and kinetic pointof view seems to stabilize smaller crystallites.37,38
The crystallite trend shows a perfect inverse correlation withspecific surface area (Figure 2), which increases with decreasingof crystallite size.With the final purpose of shining light on gas sensing
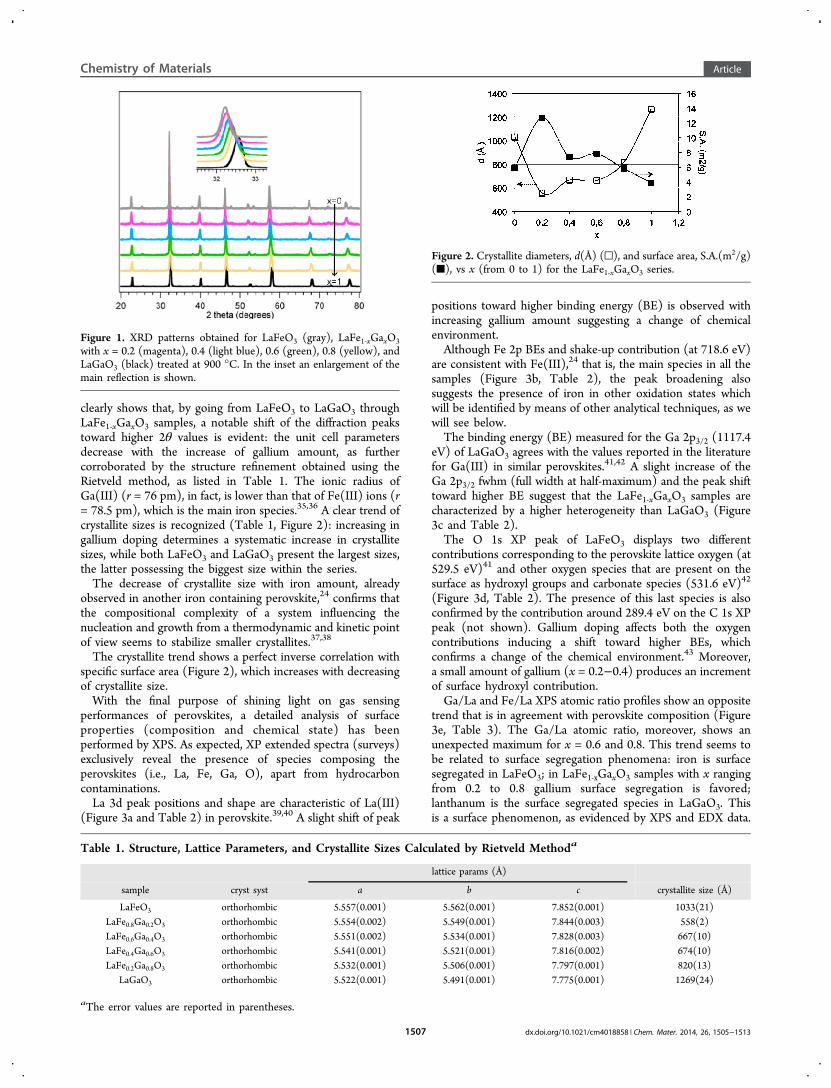
performances of perovskites, a detailed analysis of surfaceproperties (composition and chemical state) has beenperformed by XPS. As expected, XP extended spectra (surveys)exclusively reveal the presence of species composing theperovskites (i.e., La, Fe, Ga, O), apart from hydrocarboncontaminations.La 3d peak positions and shape are characteristic of La(III)
(Figure 3a and Table 2) in perovskite.39,40 A slight shift of peak
positions toward higher binding energy (BE) is observed withincreasing gallium amount suggesting a change of chemicalenvironment.Although Fe 2p BEs and shake-up contribution (at 718.6 eV)
are consistent with Fe(III),24 that is, the main species in all thesamples (Figure 3b, Table 2), the peak broadening alsosuggests the presence of iron in other oxidation states whichwill be identified by means of other analytical techniques, as wewill see below.The binding energy (BE) measured for the Ga 2p3/2 (1117.4
eV) of LaGaO3 agrees with the values reported in the literaturefor Ga(III) in similar perovskites.41,42 A slight increase of theGa 2p3/2 fwhm (full width at half-maximum) and the peak shifttoward higher BE suggest that the LaFe1‑xGaxO3 samples arecharacterized by a higher heterogeneity than LaGaO3 (Figure3c and Table 2).The O 1s XP peak of LaFeO3 displays two different
contributions corresponding to the perovskite lattice oxygen (at529.5 eV)41 and other oxygen species that are present on thesurface as hydroxyl groups and carbonate species (531.6 eV)42
(Figure 3d, Table 2). The presence of this last species is alsoconfirmed by the contribution around 289.4 eV on the C 1s XPpeak (not shown). Gallium doping affects both the oxygencontributions inducing a shift toward higher BEs, whichconfirms a change of the chemical environment.43 Moreover,a small amount of gallium (x = 0.2−0.4) produces an incrementof surface hydroxyl contribution.Ga/La and Fe/La XPS atomic ratio profiles show an opposite
trend that is in agreement with perovskite composition (Figure3e, Table 3). The Ga/La atomic ratio, moreover, shows anunexpected maximum for x = 0.6 and 0.8. This trend seems tobe related to surface segregation phenomena: iron is surfacesegregated in LaFeO3; in LaFe1‑xGaxO3 samples with x rangingfrom 0.2 to 0.8 gallium surface segregation is favored;lanthanum is the surface segregated species in LaGaO3. Thisis a surface phenomenon, as evidenced by XPS and EDX data.
Figure 1. XRD patterns obtained for LaFeO3 (gray), LaFe1‑xGaxO3with x = 0.2 (magenta), 0.4 (light blue), 0.6 (green), 0.8 (yellow), andLaGaO3 (black) treated at 900 °C. In the inset an enlargement of themain reflection is shown.
Table 1. Structure, Lattice Parameters, and Crystallite Sizes Calculated by Rietveld Methoda
lattice params (Å)
sample cryst syst a b c crystallite size (Å)
LaFeO3 orthorhombic 5.557(0.001) 5.562(0.001) 7.852(0.001) 1033(21)LaFe0.8Ga0.2O3 orthorhombic 5.554(0.002) 5.549(0.001) 7.844(0.003) 558(2)LaFe0.6Ga0.4O3 orthorhombic 5.551(0.002) 5.534(0.001) 7.828(0.003) 667(10)LaFe0.4Ga0.6O3 orthorhombic 5.541(0.001) 5.521(0.001) 7.816(0.002) 674(10)LaFe0.2Ga0.8O3 orthorhombic 5.532(0.001) 5.506(0.001) 7.797(0.001) 820(13)
LaGaO3 orthorhombic 5.522(0.001) 5.491(0.001) 7.775(0.001) 1269(24)
aThe error values are reported in parentheses.
Figure 2. Crystallite diameters, d(Å) (□), and surface area, S.A.(m2/g)(■), vs x (from 0 to 1) for the LaFe1‑xGaxO3 series.
Chemistry of Materials Article
dx.doi.org/10.1021/cm4018858 | Chem. Mater. 2014, 26, 1505−15131507
Indeed, EDX analysis is in excellent agreement with nominalcomposition (within the experimental error) due to itssampling depth (around 1 μm vs 50−100 Å for XPS).
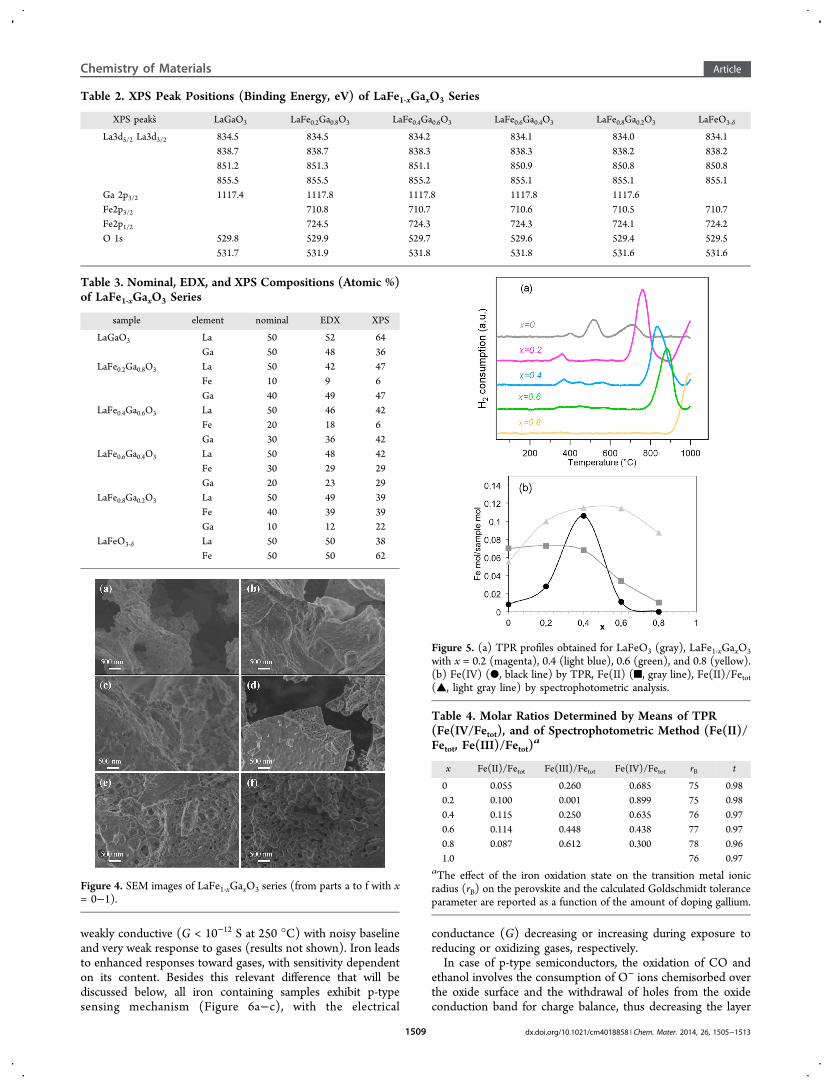
SEM images point out that gallium doping deeply affects alsothe assembly and porosity of the materials (Figure 4). LaFeO3shows a compact microstructure, while introduction of galliumleads to a more porous microstructure, which becomes morepronounced with the increase in gallium content. In theextreme case, i.e., a complete iron substitution (LaGaO3sample), dendritic structures forming a highly porous micro-structure composed by sheet-like fragments are evident. Allsamples show micrometric aggregates that are constituted bysmaller particles of average sizes below 150 nm.With the aim to investigate in more details the oxidation state
of iron species, temperature programmed reduction andspectrophotometric analysis were also carried out on theperovskite series to check the existence of Fe(IV) and/or Fe(II)species, respectively, which could affect the sensing perform-ance.TPR profile of the LaFeO3 (Figure 5a) shows the presence of
three signals at 400, 580, and 750 °C. The comparison withliterature data suggests their attribution to the reduction ofFe(IV) to Fe(III) (signal at 400 °C) and to the reduction ofFe(III) to Fe(II) (signals at 580 and 750 °C).12 Introduction ofgallium induces a shift toward higher temperatures of the signaldue to the reduction of Fe(III) (from 580 to about 1000 °C inthe gallium richest perovskite). Moreover, the signal corre-sponding to the reduction of Fe(IV) becomes slightly moreintense. Hydrogen consumption indicates that only a small partof the iron is reduced in the investigated conditions. Thisbehavior is consistent with literature data reporting thatreduction of Fe(III) to Fe(II) and of Fe(II) to Fe(0) is ratherdifficult to be obtained and has been rarely observed.44,45
Evaluation of the Fe(IV) amount, as determined by TPR, as afunction of gallium amount (Figure 5b), is consistent with amaximum trend with the highest value corresponding to thesample LaFe0.6Ga0.4O3.Fe(II) cations were revealed for the first time in iron based
perovskite oxides by spectrophotometric analysis (Figure 5b).The same method was also used to determine the total iron
amount. It is observed that a small amount of gallium causesthe existence of the Fe(II) species, whose presence becomesless important at high gallium content.As mentioned in the Introduction, such a correlation
between Ga(III) and Fe(II) was already observed andinterpreted in terms of spin exchange correlation.23 The Fe(II)amount can be also explained taking into account the ionic radiiof these species. Fe(II) is usually present in compounds as ahigh spin species with a ionic radii significantly higher than thatof perovskite cations [rFe(II)HS = 92 pm; rFe(III) = 78.5 pm; rFe(IV)= 72.5 pm; rGa(III) = 76 pm], and this could limit the totalamount of Fe(II) accepted by the perovskitic structure.36 Table4 reports the effect of relative amount of Fe(IV), Fe(III), andFe(II) with respect to total iron on Goldshmidt tolerancefactor, confirming that Fe(II) does not have a significant effect.
Gas Sensing Performance. Functional performances ofLaFe1‑xGaxO3 as gas sensors have been investigated in a dry airbackground toward both reducing (CO and ethanol) andoxidizing (NO2) gases at different temperature between 250and 500 °C.The sensing mechanism is based on the modulation of the
oxide conductance by means of redox interaction occurringbetween gases and the material surface.46
As expected, amount and oxidation states of iron would playa critical role in driving the responses toward gases: pureLaGaO3 revealed, indeed, unsuited for this application, showing
Figure 3. (a−d) La 3d, Fe 2p, Ga 2p3/2, O1s XP spectra obtained forLaFeO3 (gray), LaFe1‑xGaxO3 with x = 0.2 (magenta), 0.4 (light blue),0.6 (green), 0.8 (yellow), and LaGaO3 (black). (The spectra arenormalized with respect to their maximum value.) (e) XPS Fe/La(▲), Ga/La (○) atomic ratios profiles as a function of composition(x) for the LaFe1‑xGaxO3 samples.
Chemistry of Materials Article
dx.doi.org/10.1021/cm4018858 | Chem. Mater. 2014, 26, 1505−15131508
weakly conductive (G < 10−12 S at 250 °C) with noisy baselineand very weak response to gases (results not shown). Iron leadsto enhanced responses toward gases, with sensitivity dependenton its content. Besides this relevant difference that will bediscussed below, all iron containing samples exhibit p-typesensing mechanism (Figure 6a−c), with the electrical
conductance (G) decreasing or increasing during exposure toreducing or oxidizing gases, respectively.In case of p-type semiconductors, the oxidation of CO and
ethanol involves the consumption of O− ions chemisorbed overthe oxide surface and the withdrawal of holes from the oxideconduction band for charge balance, thus decreasing the layer
Table 2. XPS Peak Positions (Binding Energy, eV) of LaFe1‑xGaxO3 Series
XPS peaks LaGaO3 LaFe0.2Ga0.8O3 LaFe0.4Ga0.6O3 LaFe0.6Ga0.4O3 LaFe0.8Ga0.2O3 LaFeO3‑δ
La3d5/2 La3d3/2 834.5 834.5 834.2 834.1 834.0 834.1838.7 838.7 838.3 838.3 838.2 838.2851.2 851.3 851.1 850.9 850.8 850.8855.5 855.5 855.2 855.1 855.1 855.1
Ga 2p3/2 1117.4 1117.8 1117.8 1117.8 1117.6Fe2p3/2 710.8 710.7 710.6 710.5 710.7Fe2p1/2 724.5 724.3 724.3 724.1 724.2O 1s 529.8 529.9 529.7 529.6 529.4 529.5
531.7 531.9 531.8 531.8 531.6 531.6
Table 3. Nominal, EDX, and XPS Compositions (Atomic %)of LaFe1‑xGaxO3 Series
sample element nominal EDX XPS
LaGaO3 La 50 52 64Ga 50 48 36
LaFe0.2Ga0.8O3 La 50 42 47Fe 10 9 6Ga 40 49 47
LaFe0.4Ga0.6O3 La 50 46 42Fe 20 18 6Ga 30 36 42
LaFe0.6Ga0.4O3 La 50 48 42Fe 30 29 29Ga 20 23 29
LaFe0.8Ga0.2O3 La 50 49 39Fe 40 39 39Ga 10 12 22
LaFeO3‑δ La 50 50 38Fe 50 50 62
Figure 4. SEM images of LaFe1‑xGaxO3 series (from parts a to f with x= 0−1).
Figure 5. (a) TPR profiles obtained for LaFeO3 (gray), LaFe1‑xGaxO3with x = 0.2 (magenta), 0.4 (light blue), 0.6 (green), and 0.8 (yellow).(b) Fe(IV) (●, black line) by TPR, Fe(II) (■, gray line), Fe(II)/Fetot(▲, light gray line) by spectrophotometric analysis.
Table 4. Molar Ratios Determined by Means of TPR(Fe(IV/Fetot), and of Spectrophotometric Method (Fe(II)/Fetot, Fe(III)/Fetot)
a
x Fe(II)/Fetot Fe(III)/Fetot Fe(IV)/Fetot rB t
0 0.055 0.260 0.685 75 0.980.2 0.100 0.001 0.899 75 0.980.4 0.115 0.250 0.635 76 0.970.6 0.114 0.448 0.438 77 0.970.8 0.087 0.612 0.300 78 0.961.0 76 0.97
aThe effect of the iron oxidation state on the transition metal ionicradius (rB) on the perovskite and the calculated Goldschmidt toleranceparameter are reported as a function of the amount of doping gallium.
Chemistry of Materials Article
dx.doi.org/10.1021/cm4018858 | Chem. Mater. 2014, 26, 1505−15131509
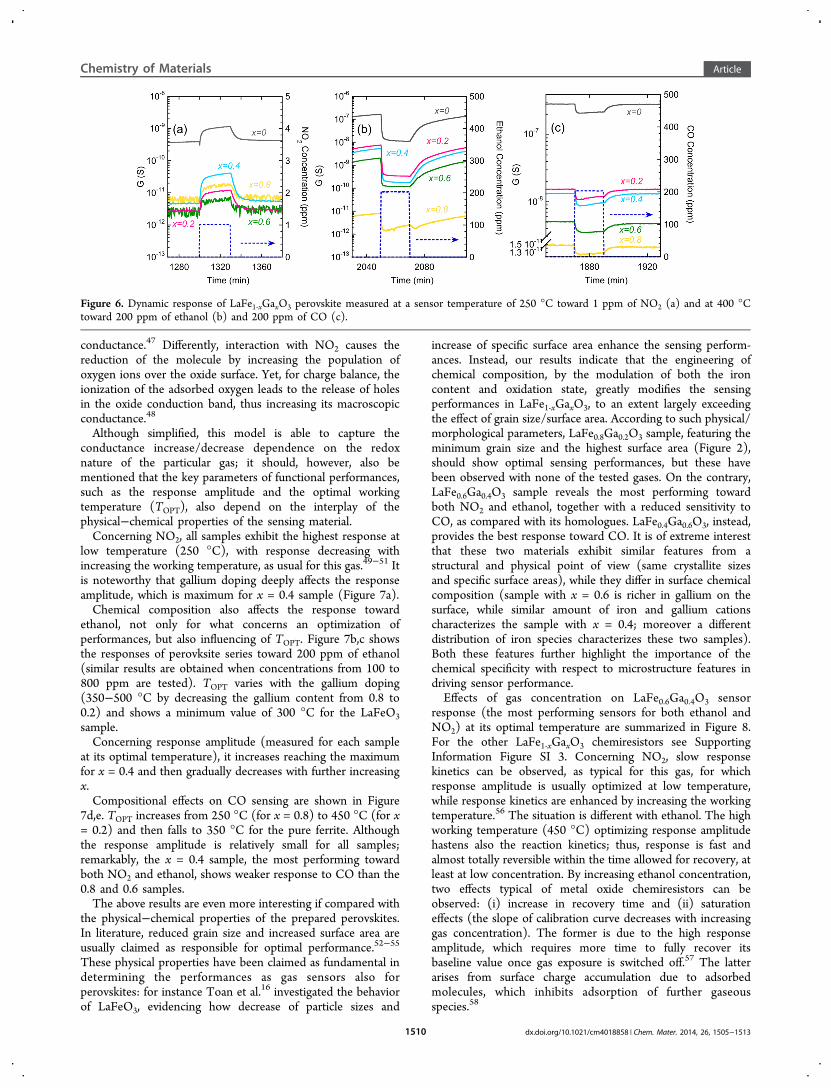
conductance.47 Differently, interaction with NO2 causes thereduction of the molecule by increasing the population ofoxygen ions over the oxide surface. Yet, for charge balance, theionization of the adsorbed oxygen leads to the release of holesin the oxide conduction band, thus increasing its macroscopicconductance.48
Although simplified, this model is able to capture theconductance increase/decrease dependence on the redoxnature of the particular gas; it should, however, also bementioned that the key parameters of functional performances,such as the response amplitude and the optimal workingtemperature (TOPT), also depend on the interplay of thephysical−chemical properties of the sensing material.Concerning NO2, all samples exhibit the highest response at
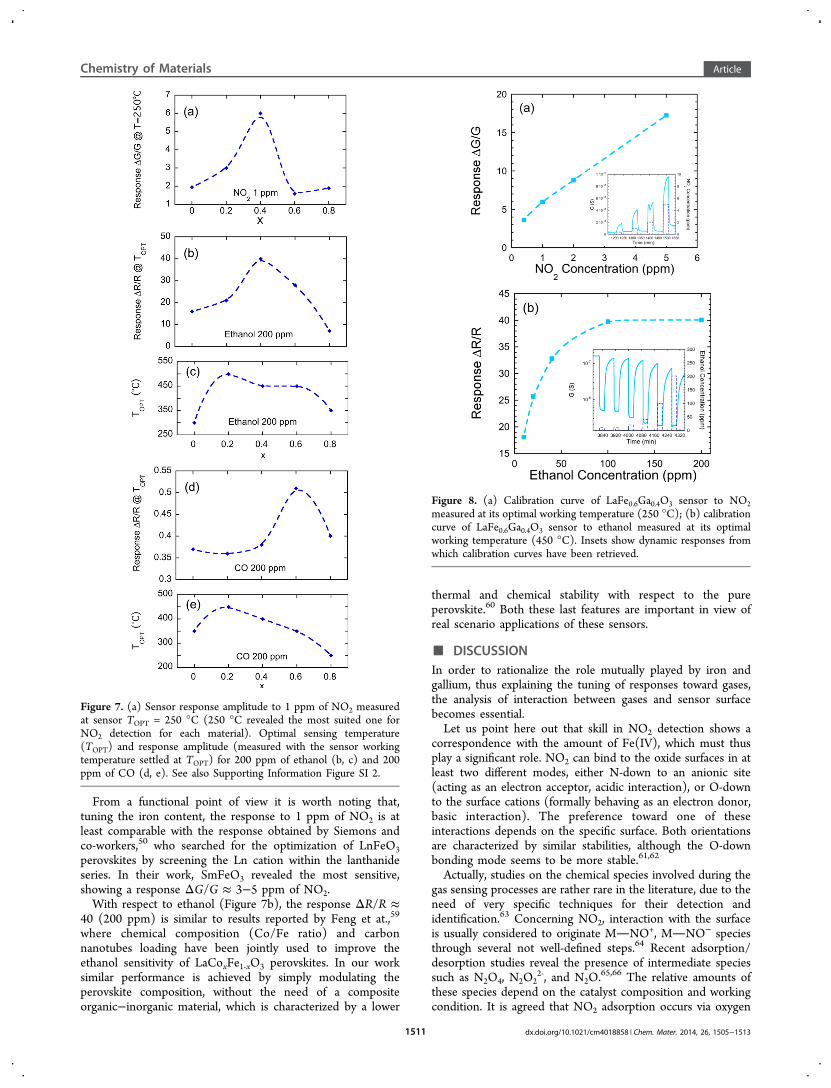
low temperature (250 °C), with response decreasing withincreasing the working temperature, as usual for this gas.49−51 Itis noteworthy that gallium doping deeply affects the responseamplitude, which is maximum for x = 0.4 sample (Figure 7a).Chemical composition also affects the response toward
ethanol, not only for what concerns an optimization ofperformances, but also influencing of TOPT. Figure 7b,c showsthe responses of perovksite series toward 200 ppm of ethanol(similar results are obtained when concentrations from 100 to800 ppm are tested). TOPT varies with the gallium doping(350−500 °C by decreasing the gallium content from 0.8 to0.2) and shows a minimum value of 300 °C for the LaFeO3sample.Concerning response amplitude (measured for each sample
at its optimal temperature), it increases reaching the maximumfor x = 0.4 and then gradually decreases with further increasingx.Compositional effects on CO sensing are shown in Figure
7d,e. TOPT increases from 250 °C (for x = 0.8) to 450 °C (for x= 0.2) and then falls to 350 °C for the pure ferrite. Althoughthe response amplitude is relatively small for all samples;remarkably, the x = 0.4 sample, the most performing towardboth NO2 and ethanol, shows weaker response to CO than the0.8 and 0.6 samples.The above results are even more interesting if compared with
the physical−chemical properties of the prepared perovskites.In literature, reduced grain size and increased surface area areusually claimed as responsible for optimal performance.52−55
These physical properties have been claimed as fundamental indetermining the performances as gas sensors also forperovskites: for instance Toan et al.16 investigated the behaviorof LaFeO3, evidencing how decrease of particle sizes and
increase of specific surface area enhance the sensing perform-ances. Instead, our results indicate that the engineering ofchemical composition, by the modulation of both the ironcontent and oxidation state, greatly modifies the sensingperformances in LaFe1‑xGaxO3, to an extent largely exceedingthe effect of grain size/surface area. According to such physical/morphological parameters, LaFe0.8Ga0.2O3 sample, featuring theminimum grain size and the highest surface area (Figure 2),should show optimal sensing performances, but these havebeen observed with none of the tested gases. On the contrary,LaFe0.6Ga0.4O3 sample reveals the most performing towardboth NO2 and ethanol, together with a reduced sensitivity toCO, as compared with its homologues. LaFe0.4Ga0.6O3, instead,provides the best response toward CO. It is of extreme interestthat these two materials exhibit similar features from astructural and physical point of view (same crystallite sizesand specific surface areas), while they differ in surface chemicalcomposition (sample with x = 0.6 is richer in gallium on thesurface, while similar amount of iron and gallium cationscharacterizes the sample with x = 0.4; moreover a differentdistribution of iron species characterizes these two samples).Both these features further highlight the importance of thechemical specificity with respect to microstructure features indriving sensor performance.Effects of gas concentration on LaFe0.6Ga0.4O3 sensor
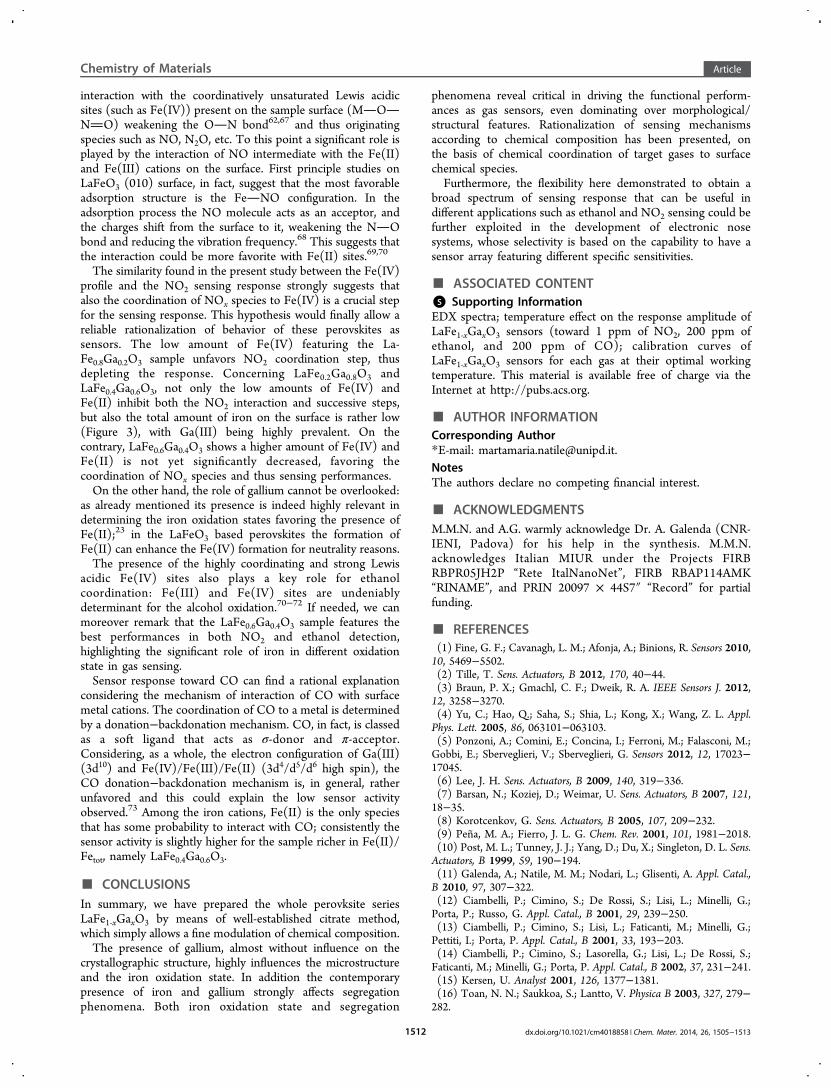
response (the most performing sensors for both ethanol andNO2) at its optimal temperature are summarized in Figure 8.For the other LaFe1‑xGaxO3 chemiresistors see SupportingInformation Figure SI 3. Concerning NO2, slow responsekinetics can be observed, as typical for this gas, for whichresponse amplitude is usually optimized at low temperature,while response kinetics are enhanced by increasing the workingtemperature.56 The situation is different with ethanol. The highworking temperature (450 °C) optimizing response amplitudehastens also the reaction kinetics; thus, response is fast andalmost totally reversible within the time allowed for recovery, atleast at low concentration. By increasing ethanol concentration,two effects typical of metal oxide chemiresistors can beobserved: (i) increase in recovery time and (ii) saturationeffects (the slope of calibration curve decreases with increasinggas concentration). The former is due to the high responseamplitude, which requires more time to fully recover itsbaseline value once gas exposure is switched off.57 The latterarises from surface charge accumulation due to adsorbedmolecules, which inhibits adsorption of further gaseousspecies.58
Figure 6. Dynamic response of LaFe1‑xGaxO3 perovskite measured at a sensor temperature of 250 °C toward 1 ppm of NO2 (a) and at 400 °Ctoward 200 ppm of ethanol (b) and 200 ppm of CO (c).
Chemistry of Materials Article
dx.doi.org/10.1021/cm4018858 | Chem. Mater. 2014, 26, 1505−15131510
From a functional point of view it is worth noting that,tuning the iron content, the response to 1 ppm of NO2 is atleast comparable with the response obtained by Siemons andco-workers,50 who searched for the optimization of LnFeO3perovskites by screening the Ln cation within the lanthanideseries. In their work, SmFeO3 revealed the most sensitive,showing a response ΔG/G ≈ 3−5 ppm of NO2.With respect to ethanol (Figure 7b), the response ΔR/R ≈
40 (200 ppm) is similar to results reported by Feng et at.,59
where chemical composition (Co/Fe ratio) and carbonnanotubes loading have been jointly used to improve theethanol sensitivity of LaCoxFe1‑xO3 perovskites. In our worksimilar performance is achieved by simply modulating theperovskite composition, without the need of a compositeorganic−inorganic material, which is characterized by a lower
thermal and chemical stability with respect to the pureperovskite.60 Both these last features are important in view ofreal scenario applications of these sensors.
■ DISCUSSIONIn order to rationalize the role mutually played by iron andgallium, thus explaining the tuning of responses toward gases,the analysis of interaction between gases and sensor surfacebecomes essential.Let us point here out that skill in NO2 detection shows a
correspondence with the amount of Fe(IV), which must thusplay a significant role. NO2 can bind to the oxide surfaces in atleast two different modes, either N-down to an anionic site(acting as an electron acceptor, acidic interaction), or O-downto the surface cations (formally behaving as an electron donor,basic interaction). The preference toward one of theseinteractions depends on the specific surface. Both orientationsare characterized by similar stabilities, although the O-downbonding mode seems to be more stable.61,62
Actually, studies on the chemical species involved during thegas sensing processes are rather rare in the literature, due to theneed of very specific techniques for their detection andidentification.63 Concerning NO2, interaction with the surfaceis usually considered to originate MNO+, MNO− speciesthrough several not well-defined steps.64 Recent adsorption/desorption studies reveal the presence of intermediate speciessuch as N2O4, N2O2
2‑, and N2O.65,66 The relative amounts of
these species depend on the catalyst composition and workingcondition. It is agreed that NO2 adsorption occurs via oxygen
Figure 7. (a) Sensor response amplitude to 1 ppm of NO2 measuredat sensor TOPT = 250 °C (250 °C revealed the most suited one forNO2 detection for each material). Optimal sensing temperature(TOPT) and response amplitude (measured with the sensor workingtemperature settled at TOPT) for 200 ppm of ethanol (b, c) and 200ppm of CO (d, e). See also Supporting Information Figure SI 2.
Figure 8. (a) Calibration curve of LaFe0.6Ga0.4O3 sensor to NO2measured at its optimal working temperature (250 °C); (b) calibrationcurve of LaFe0.6Ga0.4O3 sensor to ethanol measured at its optimalworking temperature (450 °C). Insets show dynamic responses fromwhich calibration curves have been retrieved.
Chemistry of Materials Article
dx.doi.org/10.1021/cm4018858 | Chem. Mater. 2014, 26, 1505−15131511
interaction with the coordinatively unsaturated Lewis acidicsites (such as Fe(IV)) present on the sample surface (MONO) weakening the ON bond62,67 and thus originatingspecies such as NO, N2O, etc. To this point a significant role isplayed by the interaction of NO intermediate with the Fe(II)and Fe(III) cations on the surface. First principle studies onLaFeO3 (010) surface, in fact, suggest that the most favorableadsorption structure is the FeNO configuration. In theadsorption process the NO molecule acts as an acceptor, andthe charges shift from the surface to it, weakening the NObond and reducing the vibration frequency.68 This suggests thatthe interaction could be more favorite with Fe(II) sites.69,70
The similarity found in the present study between the Fe(IV)profile and the NO2 sensing response strongly suggests thatalso the coordination of NOx species to Fe(IV) is a crucial stepfor the sensing response. This hypothesis would finally allow areliable rationalization of behavior of these perovskites assensors. The low amount of Fe(IV) featuring the La-Fe0.8Ga0.2O3 sample unfavors NO2 coordination step, thusdepleting the response. Concerning LaFe0.2Ga0.8O3 andLaFe0.4Ga0.6O3, not only the low amounts of Fe(IV) andFe(II) inhibit both the NO2 interaction and successive steps,but also the total amount of iron on the surface is rather low(Figure 3), with Ga(III) being highly prevalent. On thecontrary, LaFe0.6Ga0.4O3 shows a higher amount of Fe(IV) andFe(II) is not yet significantly decreased, favoring thecoordination of NOx species and thus sensing performances.On the other hand, the role of gallium cannot be overlooked:
as already mentioned its presence is indeed highly relevant indetermining the iron oxidation states favoring the presence ofFe(II);23 in the LaFeO3 based perovskites the formation ofFe(II) can enhance the Fe(IV) formation for neutrality reasons.The presence of the highly coordinating and strong Lewis
acidic Fe(IV) sites also plays a key role for ethanolcoordination: Fe(III) and Fe(IV) sites are undeniablydeterminant for the alcohol oxidation.70−72 If needed, we canmoreover remark that the LaFe0.6Ga0.4O3 sample features thebest performances in both NO2 and ethanol detection,highlighting the significant role of iron in different oxidationstate in gas sensing.Sensor response toward CO can find a rational explanation
considering the mechanism of interaction of CO with surfacemetal cations. The coordination of CO to a metal is determinedby a donation−backdonation mechanism. CO, in fact, is classedas a soft ligand that acts as σ-donor and π-acceptor.Considering, as a whole, the electron configuration of Ga(III)(3d10) and Fe(IV)/Fe(III)/Fe(II) (3d4/d5/d6 high spin), theCO donation−backdonation mechanism is, in general, ratherunfavored and this could explain the low sensor activityobserved.73 Among the iron cations, Fe(II) is the only speciesthat has some probability to interact with CO; consistently thesensor activity is slightly higher for the sample richer in Fe(II)/Fetot, namely LaFe0.4Ga0.6O3.
■ CONCLUSIONSIn summary, we have prepared the whole perovksite seriesLaFe1‑xGaxO3 by means of well-established citrate method,which simply allows a fine modulation of chemical composition.The presence of gallium, almost without influence on the
crystallographic structure, highly influences the microstructureand the iron oxidation state. In addition the contemporarypresence of iron and gallium strongly affects segregationphenomena. Both iron oxidation state and segregation
phenomena reveal critical in driving the functional perform-ances as gas sensors, even dominating over morphological/structural features. Rationalization of sensing mechanismsaccording to chemical composition has been presented, onthe basis of chemical coordination of target gases to surfacechemical species.Furthermore, the flexibility here demonstrated to obtain a
broad spectrum of sensing response that can be useful indifferent applications such as ethanol and NO2 sensing could befurther exploited in the development of electronic nosesystems, whose selectivity is based on the capability to have asensor array featuring different specific sensitivities.
■ ASSOCIATED CONTENT*S Supporting InformationEDX spectra; temperature effect on the response amplitude ofLaFe1‑xGaxO3 sensors (toward 1 ppm of NO2, 200 ppm ofethanol, and 200 ppm of CO); calibration curves ofLaFe1‑xGaxO3 sensors for each gas at their optimal workingtemperature. This material is available free of charge via theInternet at http://pubs.acs.org.
■ AUTHOR INFORMATIONCorresponding Author*E-mail: [email protected] authors declare no competing financial interest.
■ ACKNOWLEDGMENTSM.M.N. and A.G. warmly acknowledge Dr. A. Galenda (CNR-IENI, Padova) for his help in the synthesis. M.M.N.acknowledges Italian MIUR under the Projects FIRBRBPR05JH2P “Rete ItalNanoNet”, FIRB RBAP114AMK“RINAME”, and PRIN 20097 × 44S7″ “Record” for partialfunding.
■ REFERENCES(1) Fine, G. F.; Cavanagh, L. M.; Afonja, A.; Binions, R. Sensors 2010,10, 5469−5502.(2) Tille, T. Sens. Actuators, B 2012, 170, 40−44.(3) Braun, P. X.; Gmachl, C. F.; Dweik, R. A. IEEE Sensors J. 2012,12, 3258−3270.(4) Yu, C.; Hao, Q.; Saha, S.; Shia, L.; Kong, X.; Wang, Z. L. Appl.Phys. Lett. 2005, 86, 063101−063103.(5) Ponzoni, A.; Comini, E.; Concina, I.; Ferroni, M.; Falasconi, M.;Gobbi, E.; Sberveglieri, V.; Sberveglieri, G. Sensors 2012, 12, 17023−17045.(6) Lee, J. H. Sens. Actuators, B 2009, 140, 319−336.(7) Barsan, N.; Koziej, D.; Weimar, U. Sens. Actuators, B 2007, 121,18−35.(8) Korotcenkov, G. Sens. Actuators, B 2005, 107, 209−232.(9) Pena, M. A.; Fierro, J. L. G. Chem. Rev. 2001, 101, 1981−2018.(10) Post, M. L.; Tunney, J. J.; Yang, D.; Du, X.; Singleton, D. L. Sens.Actuators, B 1999, 59, 190−194.(11) Galenda, A.; Natile, M. M.; Nodari, L.; Glisenti, A. Appl. Catal.,B 2010, 97, 307−322.(12) Ciambelli, P.; Cimino, S.; De Rossi, S.; Lisi, L.; Minelli, G.;Porta, P.; Russo, G. Appl. Catal., B 2001, 29, 239−250.(13) Ciambelli, P.; Cimino, S.; Lisi, L.; Faticanti, M.; Minelli, G.;Pettiti, I.; Porta, P. Appl. Catal., B 2001, 33, 193−203.(14) Ciambelli, P.; Cimino, S.; Lasorella, G.; Lisi, L.; De Rossi, S.;Faticanti, M.; Minelli, G.; Porta, P. Appl. Catal., B 2002, 37, 231−241.(15) Kersen, U. Analyst 2001, 126, 1377−1381.(16) Toan, N. N.; Saukkoa, S.; Lantto, V. Physica B 2003, 327, 279−282.
Chemistry of Materials Article
dx.doi.org/10.1021/cm4018858 | Chem. Mater. 2014, 26, 1505−15131512
(17) Martinelli, G.; Carotta, M. C.; Ferroni, M.; Sadaoka, Y.;Traversa, E. Sens. Actuators, B 1999, 55, 99−110.(18) Aono, H.; Sato, M.; Traversa, E.; Sakamoto, M.; Sadaoka, Y. J.Am. Ceram. Soc. 2001, 84, 341−347.(19) Suo, H.; Wu, F.; Wang, Q.; Liu, G.; Qiu, F.; Xu, B.; Zhao, M.Sens. Actuators, B 1997, 45, 245−249.(20) Niu, X.; Du, W.; Du, W. Sens. Actuators, B 2004, 99, 399−404.(21) Dutta, A.; Nishiguchi, H.; Takita, Y.; Ishihara, T. Sens. Actuators,B 2005, 108, 368−373.(22) Yamazoe, N. Sens. Actuators, B 1991, 5, 7−19.(23) Xia, H.; Sun, K.; Fan, F.; Sun, K.; Su, W.; Feng, Z.; Ying, P.; Li,C. J. Catal. 2008, 259, 269−275.(24) Natile, M. M.; Poletto, F.; Galenda, A.; Glisenti, A.; Montini, T.;De Rogatis, L.; Fornasiero, P. Chem. Mater. 2008, 20, 2314−2327.(25) Wenk, H. R.; Matthies, S.; Lutterotti, L. Mater. Sci. Forum 1994,157, 473−479.(26) Ferrari, M.; Lutterotti, L. J. Appl. Phys. 1994, 76, 7246−7255.(27) Shirley, D. A. Phys. Rev. B 1972, 5, 4709−4714.(28) Moulder, J. F.; Stickle, W. F.; Sobol, P. E.; Bomben, K. D. InHandbook of X-ray Photoelectron Spectroscopy; Chastain, J., Ed.; PhysicalElectronics: Eden Prairie, MN, 1992.(29) Tarafder, P. K.; Thakur, R. Microchem. J. 2005, 80, 39−43.(30) Maxwell, J. A. In Rock and Mineral Analysis; Wiley: New York,1968; p 424.(31) Krivetskiy, V.; Ponzoni, A.; Comini, E.; Badalyan, S.;Rumyantseva, M.; Gaskov, A. Electroanalysis 2010, 22, 2809−2816.(32) Leonidov, I. A.; Kozhevnikov, V. L.; Mitberg, E. B.; Patrakeev,M. V.; Kharton, V. V.; Marques, F. M. B. J. Mater. Chem. 2001, 11,1201−1208.(33) Tsuruta, Y.; Todaka, T.; Nisiguchi, H.; Ishiara, T.; Takita, Y.Electrochem. Solid State Lett. 2001, 4, E13−E15.(34) Lerch, M.; Boysen, H.; Hansen, T. J. Phys. Chem. Solids 2001,62, 445−455.(35) Mori, K.; Shibata, K.; Sagehashi, H.; Ishigaki, T.; Hoshikawa, A.;Harjo, S.; Kamiyama, T.; Itoh, K.; Fukunaga, T. Physica B 2004, 350,E1031−E1034.(36) Shannon, R. D. Acta Crystallogr., Sect. A 1976, 32, 751−767.(37) Bernardi, M. I. B.; Feitosa, C. A. C.; Paskocimas, C. A.; Longo,E.; Paiva-Santos, C. O. Ceram. Int. 2009, 35, 463−466.(38) Pal, M.; Pal, U.; Jimenez, J. M. G. Y.; Perez-Rodriguez, F.Nanoscale Res. Lett. 2012, 7, 1−12.(39) Burroughs, P.; Hamnett, A.; Orchard, A. F.; Thornton, G. J.Chem. Soc., Dalton Trans. 1976, 17, 1686−1698.(40) Vasquez, R. P. Phys. Rev. B 1996, 54, 14938−14941.(41) Shkerin, S. N.; Kuznetsov, M. V.; Kalashnikova, N. A. Russ. J.Electrochem. 2003, 39, 591−599.(42) Galenda, A.; Natile, M. M.; Krishnan, V.; Bertagnolli, H.;Glisenti, A. Chem. Mater. 2007, 19, 2796−2808.(43) Datta, P.; Majewski, P.; Aldinger, F. Mater. Res. Bull. 2008, 43,1−8.(44) Tejuca, L. G. J. Less-Common Met. 1988, 146, 261−270.(45) Tascon, J. M. D.; Fierro, J. L. G.; Tejuca, L. G. J. Chem. Soc.,Faraday Trans. 1 1985, 81, 2399−2407.(46) Barsan, N.; Weimar, U. J. Electroceram. 2001, 7, 143−167.(47) Moseley, P. T.; Norris, J. O. W.; Williams, D. E. In Techniquesand Mechanism in Gas Sensing; Adam Hilger: Bristol, U.K., 1991;Chapter 4.(48) Gurlo, A.; Barsan, N.; Ivanovskaya, M.; Weimar, U.; Gopel, W.Sens. Actuators, B 1998, 47, 92−99.(49) Polleux, J.; Gurlo, A.; Barsan, N.; Weimar, U.; Antonietti, M.;Niederberger, M. Angew. Chem., Int. Ed. 2006, 45, 261−265.(50) Siemons, M.; Leifert, A.; Simon, U. Adv. Funct. Mater. 2007, 17,2189−2197.(51) Epifani, M.; Andreu, T.; Arbiol, J.; Diaz, R.; Siciliano, P.;Morante, J. R. Chem. Mater. 2009, 21, 5215−5221.(52) Ferroni, M.; Guidi, V.; Martinelli, G.; Nelli, P.; Sberveglieri, G.Sens. Actuators, B. 1997, 44, 499−502.
(53) Rumyantseva, M.; Kovalenko, V.; Gaskov, A.; Makshina, E.;Yuschenko, V.; Ivanova, I.; Ponzoni, A.; Faglia, G.; Comini, E. Sens.Actuators, B 2006, 118, 208−214.(54) Panchapakesan, B.; DeVoe, D. L.; Widmaier, M. R.; Cavicchi,R.; Semancik, S. Nanotechnology 2001, 12, 336−349.(55) Franke, M. E.; Koplin, T. J.; Simon, U. Small 2006, 2, 36−50.(56) Ponzoni, A.; Comini, E.; Ferroni, M.; Sberveglieri, G. Thin SolidFilms 2005, 490, 81−85.(57) Balouria, V.; Kumar, A.; Singh, A.; Samanta, S.; Debnath, A. K.;Mahajan, A.; Bedi, R. K.; Aswal, D. K.; Gupta, S. K.; Yakhmi, J. V. Sens.Actuators, B 2011, 157, 466−472.(58) Morrison, S. R. In The Chemical Physics of Surfaces; PlenumPress: New York, 1978; Chapter 2.(59) Feng, C.; Ruan, S.; Lib, J.; Zou, B.; Luo, J.; Chen, W.; Dong, W.;Wu, F. Sens. Actuators, B 2011, 155, 232−238.(60) Valentini, L.; Armentano, I.; Kenny, J. M.; Cantalini, C.; Lozzi,L.; Santucci, S. Appl. Phys. Lett. 2003, 82, 961−963.(61) Di Valentin, C.; Figini, A.; Pacchioni, G. Surf. Sci. 2004, 556,145−158.(62) Prades, J. D.; Cirera, A.; Morante, J. M. Sens. Actuators, B 2009,142, 179−184.(63) Gurlo, A.; Riedel, R. Angew. Chem., Int. Ed. 2007, 46, 3826−3848.(64) Tamaki, J.; Nagaishi, M.; Teraoka, Y.; Miura, N.; Yamazoe, N.Surf. Sci. 1989, 221, 183−196.(65) Yu, J. J.; Jiang, Z.; Zhu, L.; Hao, Z. P.; Xu, Z. P. J. Phys. Chem. B2006, 110, 4291−4300.(66) Weiss, B. M.; Caldwell, K. B.; Iglesia, E. J. Phys. Chem. C 2011,115, 6561−6570.(67) Eid, Kh. M.; Ammar, H. Y. Appl. Surf. Sci. 2012, 258, 7689−7698.(68) Sun, L.; Hu, J.; Gao, F.; Zhang, Y.; Qin, H. Physica B 2011, 406,4105−4108.(69) Pirngruber, G. D.; Grunwaldt, J.-D.; van Bokhoven, J. A.;Kalytta, A.; Reller, A.; Safonova, O. V.; Glatzel, P. J. Phys. Chem. B2006, 110, 18104−18107.(70) Kung, H. H. In Transition Metal Oxides: Surface Chemistry andCatalysis; Elsevier: Amsterdam, 1989.(71) Natile, M. M.; Glisenti, A. Chem. Mater. 2002, 14, 3090−3099.(72) Suda, Y.; Morimoto, T.; Nagao, M. Langmuir 1987, 3, 99−104.(73) Cotton, F. A.; Wilkinson, G.; Murillo, C. A.; Bochmann, M.Advanced Inorganic Chemistry; Wiley: New York, 1999.
Chemistry of Materials Article
dx.doi.org/10.1021/cm4018858 | Chem. Mater. 2014, 26, 1505−15131513

![elaborato Edoardo Redaelli - Politecnico di Milano · 2018. 11. 30. · 32/,7(&1,&2 ', 0,/$12 á ä ä ä ä í / v ] o o ( ] p µ x x x x x x x x x x x x x x x x x x x x x x x x](https://static.fdocumenti.com/doc/165x107/60bae4920c4a610dfc477d7b/elaborato-edoardo-redaelli-politecnico-di-milano-2018-11-30-32712.jpg)
![ဦ · u v v / v ] w zd ' e z > x x x x x x x x x x x x x x x x x x x x x x x x x x x x x x x x x x x x x x x x x x x x x x x x x x x x x x x x x x x x x x x x x x x x x x x ...](https://static.fdocumenti.com/doc/165x107/5e436548d273ae1ad25e8202/-u-v-v-v-w-zd-e-z-x-x-x-x-x-x-x-x-x-x-x-x-x-x-x-x-x-x-x-x-x-x-x-x-x.jpg)


![Ats brochure tecnica [modalità compatibilità] brochure tecnica.pdf · 2016-06-30 · The process utilizes an alloy characterized by a globular microstructure. (a ... HPDC *vacuum](https://static.fdocumenti.com/doc/165x107/5b2576217f8b9a0e308b832b/ats-brochure-tecnica-modalita-compatibilita-brochure-tecnicapdf-2016-06-30.jpg)