BRAND VALUES DRIVERS AND PERFORMANCES -...
142
Sede Amministrativa: Università degli studi di Padova Dipartimento di Scienze Economiche “Marco Fanno” SCUOLA DI DOTTORATO DI RICERCA IN ECONOMIA E MANAGEMENT CICLO XXII BRAND VALUE DRIVERS AND PERFORMANCES: EVIDENCE FROM THE FOOD INDUSTRY Direttore della Scuola: Ch.mo Prof. Guglielmo Weber Supervisore: Ch.mo Prof. Francesco Favotto Dottorando: Nebojša St. Davčik 31.01.2010
Transcript of BRAND VALUES DRIVERS AND PERFORMANCES -...
Sede Amministrativa: Università degli studi di Padova
Dipartimento di Scienze Economiche “Marco Fanno”
SCUOLA DI DOTTORATO DI RICERCA IN ECONOMIA E MANAGEMENT
CICLO XXII
BRAND VALUE DRIVERS AND PERFORMANCES:
EVIDENCE FROM THE FOOD INDUSTRY
Direttore della Scuola: Ch.mo Prof. Guglielmo Weber
Supervisore: Ch.mo Prof. Francesco Favotto
Dottorando: Nebojša St. Davčik
31.01.2010


PPrroossppeerrii ttaass eesstt ii tt iinneerriiss,,
nnoonn eesstt ddeessttiinnaattuumm

v
Contents
Abstract ix
Prefazione xi
Acknowledgements xiii
Chapter 1 – An overall research design 1
1. Thesis introduction 3
1.1. Brand management 4
1.1.1. A brand 4
1.1.2. The value of a brand – the brand equity (BEq) concept 8
1.1.3. Sources of the brand equity determinants 11
1.2. Enriched food 15
1.3. Research problem 21
1.4. Methodology 23
1.4.1. Survey research indicators and reliability measures 25
1.4.1.1. Composite reliability – Cronbach’s Alpha 25
1.4.1.2. Common method bias 27
1.4.2. Regression analysis 27
1.4.3. Cluster analysis 29

vi
Chapter 2 – Brand success and its factors: a case of the enriched-food industry
31
2.1. Introduction 33
2.2. Successful brand and underlying factors 35
2.3. A proposed model 40
2.3.1. Sample and data collection 40
2.3.2. Instrument development 42
2.3.3. Measures 43
2.4. Modelling procedure and results 44
2.5. Conclusions, future research & limitations 53
2.5.1. Recommendations for future research 55
2.5.2. Limitations 57
2.6. Appendix A 58
Chapter 3 – Marketing modelling: dimensions of brand value 63
3.1. Introduction 65
3.2. Literature review 66
3.3. Conceptual framework 70
3.4. Research problem 73
3.5. The model 76
3.5.1. Brand equity estimations 78
3.6. Data collection 78
3.7. Results and interpretation 80
3.8. Discussion 82
3.9. Conclusion 84
3.9.1. Limitations of the study 85
3.9.2. Suggestions for further research 85
3.10 Appendix B 87

vii
Chapter 4 – Brand differentiation: a driver of the brand performance outputs
89
4.1. Introduction 91
4.2. Marketing performance outputs – price premium and brand (market) share 93
4.3. Literature review 95
4.4. Hypotheses 97
4.5. Dataset 101
4.6. The model 104
4.7. Results 105
4.8. Conclusions 113
References 117

viii

ix
ABSTRACT
The main objective of this thesis is to enhance the knowledge about brand
value within different stakeholders in the food market. This is an attempt to
enlighten the role of brand value in marketing strategy of different food producers,
by applying complex multivariate research approach. Studies were conducted in
different countries (Italy and Sweden), we have applied different research
methodologies (self-reporting study and scanner data analysis) as well as different
research instruments (multivariate data analysis, regression and cluster analysis).
Chapter 1 represents an overview of the major theoretical approaches and
concepts that are employed in the branding theory and enriched-food industry. We
have described and defined the most important approaches and different
theoretical nuances regarding brand value, branding and brand management. The
enriched-food industry has been discussed in details.
The goal of the Chapter 2 is to identify factors that influence the brand and
also to determine which factors correlate the brand more, in order to develop more
effective business strategies. Our main question is how the factors in a proposed
model contribute to brand value in the food industry. An adductive theory
approach has been adopted and food managers from Italy and Sweden were
questioned. We have used data set of 58 enriched-food brands in the Italian and
Swedish markets. The measurement scales have been constructed using theory or
suggestions from industry. We have modelled the nine constructs as nine
correlated first-order factors. The model includes eight independent variables
x
(consumer orientation, brand differentiation, brand knowledge, new brand
development, values, organization, consumer perception, strategy) and the
dependent variable brand success. All variables contain four to six items. This
chapter provides insight and empirical evidences on the development and
enhancement of brand success. The findings can be employed as more effective
brand strategies in a sector that has been under-investigated in academic literature
and practice.
A model of the brand value dimensions, measured by brand equity, has been
presented in the Chapter 3. The goal of this research is to establish which dimensions
and in which way influence the brand equity performance in the researched industry
in order to help development of more effective business strategies. We have studied
an aggregate data set for various food brands in the Italian market. We found out that
marketing investment, price, revenues and perceived quality were highly associated
with brand equity. The managerial implications of presented models were discussed
as well as possible future research enhancements.
There is no clear answer in marketing literature on how the brand paradigm
influences firm strategy in marketing performance context. The Chapter 4 is an
attempt to highlight the influence of brand differentiation on branding strategy as
well as the impact of innovation on proposed brand framework. We have studied
an aggregate data set of 764 enriched-food brands in the Italian market. We found
out that brand equity, brand volume, innovation and company type are highly
associated with the brand performance outputs. Using cluster analyses, we found
out that market share and price are significantly associated with the innovation and
company type in the food industry. We have discussed the managerial implication
of the presented model, the results of the cluster analyses as well as possible
research enhancements.

xi
PREFAZIONE
L’obiettivo principale di questa tesi è di approfondire la conoscenza sul valore
del brand per i diversi stakeholders presenti nel mercato dei beni alimentari. Essa
rappresenta, pertanto, il tentativo di evidenziare il ruolo del valore del brand nella
strategia di marketing di diversi produttori di beni alimentari, attraverso
l’applicazione di un approccio di ricerca multivariato e complesso. Gli studi presentati
sono stati condotti in diversi paesi (Italia e Svezia), e con l’utilizzo di diverse
metodologie di indagine (studi con dati self-reported e scanner data analisi) così come
con l’utilizzo di diversi strumenti di ricerca (multivariate data analisi, regressioni e
cluster analisi).
Il capitolo 1 presenta una rassegna dei principali approcci teorici e dei concetti
chiave utilizzati nella teoria branding e nell’ industria enriched-food. Sono definiti e
analizzati gli approcci più importanti e le diverse sfumature riguardanti il valore del
brand, il branding e il brand management. Un’analisi dettagliata riguarda l’ industria
enriched-food.
Il capitolo 2 si pone l’obiettivo di identificare i fattori in grado di influenzare il
brand e di determinare quelli che vi sono maggiormente correlati, al fine di sviluppare
delle strategie commerciali (business) più efficaci. La domanda di ricerca principale è
affrontata attraverso l’analisi di un modello empirico che studia i fattori che
contribuiscono a rafforzare il valore del brand nell’industria alimentare. I manager
dell’industria alimentare italiana e svedese sono stati intervistati applicando un approccio
teorico. L’analisi empirica condotta utilizza dati di 58 brands di enriched-food presenti
nel mercato italiano e svedese. Le scale di misurazione sono state costruite utilizzando la
teoria e i suggerimenti da parte dei managers. Abbiamo modellato i nove costrutti come
nove fattori di primo ordine. Il modello analizza il successo del brand (variabile
indipendente) attraverso 8 variabili indipendenti (orientamento dei consumatori,

xii
differenziazione del brand, conoscenza del brand, sviluppo del nuovo brand, valori,
organizzazione, percezione dei consumatori, strategia). Tutte le variabili contengono
dalle 4 alle 6 dimensioni. Questo capitolo contiene suggerimenti ed evidenze
empiriche sullo sviluppo e il rafforzamento del successo del brand. I risultati possono
essere utilizzati per definire strategie di brand più efficaci in un settore che è stato non
adeguatamente analizzato in ambito accademico sia teorico che empirico.
Il capitolo 3 presenta un modello che analizza le dimensioni del valore del
brand, misurato dalla brand equità. La domanda di ricerca a cui questo capitolo cerca
di rispondere riguarda l’individuazione di quali dimensioni influenzano la perfomance
della brand equità nell’industria alimentare, nonché di studiare in che modalità esse
operano, al fine di promuovere lo sviluppo di strategie di brand più efficaci. L’analisi
è condotta su un dataset aggregato per diversi brand di beni alimentari nel mercato
italiano. Gli investimenti in marketing, il prezzo, i ricavi e la qualità percepita risultano
essere fortemente associati alla brand equità. Sono discussi le implicazioni
imprenditoriali dei modelli ed anche i possibili sviluppi di ricerca futura.
Nella letteratura di marketing non esiste, ad oggi, una risposta chiara su come
il paradigma del brand sia in grado di influenzare la strategia dell’impresa nella
performance di marketing. Il capitolo 4 rappresenta un tentativo di sottolineare
l’influenza della differenziazione dei brand sulla strategia di brand e in particolare
l’impatto dell’innovazione su un dato contesto brand. Il capitolo presenta uno studio
effettuato su 764 enriched-food brands nel mercato italiano. L’evidenza empirica ci
permette di affermare che il brand equità, la quantità di beni venduti per un dato brand,
l’innovazione e la tipologia organizzativa sono fortemente associate con il risultato della
brand performance. Utilizzando il cluster analisi si evidenzia che la quota di mercato e il
prezzo sono associati in maniera statisticamente significativa con l’innovazione e la
tipologia organizzativa nell’industria alimentare. Le implicazioni gestionali del modello,
i risultati della cluster analisi e i possibili percorsi di ricerca futura sono discussi.

xiii
ACKNOWLEDGEMENTS
One would say that finishing the thesis is the end of a long and exciting
journey. When I look back, I see many open questions and dilemmas, many
unanswered questions and creative solutions; but also many wins and obstacles, hard
work, sleepless nights and joy.
This journey would be impossible without all those people from my past that
had imposed me many obstacles and bitterness; this journey would not be possible
without people that had not helped me when I needed their help, but in the same time,
they had not made me any new obstacles and problems – they did nothing! I am
grateful to these people because they made me stronger, more persistent and
successful.
All my love and lifetime gratitude goes to my family, friends and colleagues
that helped me to cross many obstacles, to bear unbearable, to enjoy in my journey…
My deepest gratitude goes to mu supervisor, Prof. Francesco Favotto and co-
tutor, Prof. Giacomo Boesso, for imposing me high expectations and research
standards, for support and difficult questions.
I am also thankful to kind and supporting people at the Department of
Economic Sciences “Marco Fanno” at University of Padova. I especially want to
thank to my fellows from XXII ciclo (Natalia, Michela, Francesco S., Francesco M.

xiv
and Davide), for their support in hard days and caffè sessions. Without you, this
journey would be no journey.
This thesis would be impossible (or at least would be much different) without
support, inspiring discussions and help from Mr. Jonas Rundquist, Ph.D. and all kind
people from the School of Business and Engineering at Halmstad University, Sweden.
I also want to thank to Davide Raggi (University of Bologna) for useful
comments on econometrics as well as to Alessandro Bucciol (University of
Amsterdam) and Loretti Isabella Dobrescu (The University of New South Wales) on
earlier draft of this manuscript.
I had had invaluable help from Ms. Laura Zanatta and Ms. Maddalena Sisto
during the data acquisition from the Italian companies.
Very valuable proofreading help had come from Mrs. Ljiljana Tikvicki, Mrs.
Aleksandra Mester and Ms. Marija Bradaš.
I am grateful to participants of the Academy of Marketing’s Brand special
interest group conference in Cambridge, UK, 2009 for useful suggestions and
comments on material from chapters 2 and 3. I also wish to express my thankfulness
to participants of the 5th Thought Leaders International Conference on Brand
Management, Athens, 2009. Portions of the chapter 4 in old version, which are related
to the premium price discussion, were presented at this conference under following
reference: Davcik, N. St., Boesso, G. and Favotto, F., “Innovation Drives
Differentiation: Functional, Organic & Wellness Food in Italy”.

- 1 -
CHAPTER 1
AN OVERALL RESEARCH DESIGN

- 2 -

- 3 -
AN OVERALL RESEARCH DESIGN
1. Thesis introduction
odern civilization would not exist without branding. Electricity
is engine of our societies, computer bits are veins in civilization
“body”, but our lives are marked and framed with goods that we consume – with
their names, symbolism, true or fake promises. Branding is pivotal social concept
because today is practically nothing unbranded. For instance, salt is packaged in
branded containers, juices are branded with private whole sellers labels, fruit and
vegetables are branded with producer’s or trader’s name – Dole pineapples,
Chiquita bananas, etc. (Kotler and Armstrong, 1999).
A brand is an entity that provides to its stakeholders added value based on
factors beyond its functional characteristics. These added values, or brand values
(Knox, 2000), differentiate a product toward competition and provides a
milestone that should satisfy customer preferences and to create loyalty. A
modern marketing theory and practice are seeking to provide and describe how
brands are managed in order to create higher value for its stakeholders.
Unfortunately, growing literature in last decades has not provided straightforward
answer on this matter. It is silent on issues of brand creation and brand value in
food industry. Branding in the enriched-food industry is underestimated issue in
marketing literature and with vague application solutions in practice. This thesis
is an attempt to provide insight on branding in the food industry.
M

- 4 -
We identified two pillars of the thesis: i) brand management, in which we
will highlight the brand paradigm and brand value, represented with the brand
equity concept, as our academic cornerstones; ii) the enriched-food industry is
described in details, as phenomena as well as in subgroups such as functional
food, organic food, etc. These two pillars were described in sections one and two,
respectively. In section three of this chapter we present research problems
addressed in the thesis with major research questions underlined. In the following
section we describe basic methods and methodologies applied in the thesis.
1.1. Brand Management
1.1.1. A brand
product is an organizational offering that may satisfy consumer’s
need or wishes. It is hard to find a product these days that has no
name, certain design, packaging, or does not bear in itself certain symbolism.
Specific products might be sorted in the brand line extension holding brand
and/or producer name and bears different product characteristics. In a given
product category, under the same brand/producer name, exists additional items,
such as new flavours, packaging, forms, size, taste, colours, name adds-on, added
ingredients, etc. (Kotler & Armstrong, 1999)
The origin of the word “brand” comes from the Old Norse word “brandr”.
The brandr means to fire or burning, that originate from a livestock marking with
an owner’s seal. The first usage of this word, according to the Oxford English
Dictionary (Oxford, 2009), was taken down in 1552. In this way was established
the custom that distinguishes the livestock from those of neighbours; in other
A

- 5 -
words, it is established the way how easily to identify ownership or an origin of
the product.
One of the first records, which can frame basic brand theory as we
understand and perceive today (Ambler, 1997), can be traced back to St.
Augustine of Hippo (Aurelius Augustinus Hipponensis) in the fifth century A.D.
The importance of the St. Augustine work lies in the fact that he was the first to
make the distinction among functional utility, as the criterion of value (Jevons,
2007), and the psychological benefits (Ambler, 1997) using the idea of
differentiation. These two concepts, the constraint of need (functional utility) and
the attraction of desire (benefits of ownership), are similar to modern concepts of
needs and wants (Jevons, 2007). San Bernadino of Siena (XV c. A.D.) had made
differences in his sermons among virtuositas (functionality), raritas (scarcity)
and complacibilitas (psychological benefits); merchants were allowed to take all
three in account when setting the price (justum pretium – “just”, fair price) of
commodities (Ambler, 1997; Jevons, 2007).
One among the first discussions on a brand and its importance in business
literature came from Gardner & Levy (1955). According to them, a brand is
embedded with a complex symbolism that represents a variety of attributes and
ideas, because brand name is much more than the label that differentiates among
products. Gardner & Levy (1955) have argued that brands bear sets of ideas,
feelings and attitudes that consumer has about brands; consumer will makes
choice by picking one or a few elements from these sets that they find most
appropriate.
Gabbott and Jevons (2009) have argued that the term “brand” is a highly
contextualized entity of diverse contemporary approaches and understandings;
and therefore, never-ending theory development process. The definition

- 6 -
development process in social science has a tendency “to be an endless spiralling
of ambiguities of language” (Gabbott and Jevons, 2009: 120). This process can
be discussed from the nominal and the real distinct form. The nominal form of a
thing (quid nominis) defines its name, but essence can be determinate only if we
know the real form (quid rei) of the thing (Gabbott and Jevons, 2009). Stern
(2006) has argued that term brand, used as a verb, has dual valence with positive
implication – proof of ownership, signal of quality, etc., and negative connotation
– to stigmatize, to mark with infamy, etc.
Therefore, it is highly unlikely that we can define one and generally
accepted definition of the brand. Gabbott and Jevons (2009: 121) have
underlined that here never will be a unifying definition of “brand”, only “a
constantly evolving series of contexts or lenses through which the phenomenon is
viewed”. They conclude that in the rich, context-laden environment, can exist
great number of different “brand” definitions, understandings and approaches.
Two approaches has been established in the literature (e.g. Ambler &
Styles, 1997) to define a brand. Traditional approach, also known as “product
plus” (Ambler & Styles, 1997) view a brand as an addition to the product. In
other words, a brand is an identifier of the product. The second approach is the
holistic view in which focus is on the brand itself. According to Ambler & Styles
(1997), holistic approach stands for the bundles of attributes that satisfy a
consumer; in the same time, these attributes can be tangible and / or intangible,
real or fake, rational and / or emotional, etc. A brand is defined, according to
American Marketing Association (AMA, 2009), as a feature (name, term, design,
symbol) that identifies one seller’s product as distinct from those of other sellers.
A brand is defined offering from a known source to consumer (Kotler, 1999). A
brand might be a name, term, design, symbol, sign (Kotler, 1999) or any other

- 7 -
feature that identifies one offerer's product as distinct from those of another. The
suppliers attempt to signal their bona fides to the market. Keller & Lehmann
(2006) have suggested that a brand serves as a distinguishing symbol of a firm
offering at their most canonical form. A brand may identify one item, a family of
items, or all items from an offerer. Thus, a brand signals to the consumer the
source of the product and should protect consumer and producer from
competitors who would attempt to provide identical product (Aaker, 1991). For
instance, a brand name helps consumers to identify products that might benefit
and fit them best. Buyers who always buy the same brands know (expect) that
they will get the same features, benefits and quality each time they buy that
product (Kotler and Armstrong, 1999). There are also benefits for seller. The
brand name becomes the basis on which a whole image can be built about a
product’s characteristics and values. The seller’s brand name and trademark
provide legal protection for unique product features that otherwise might be
copied and misused by competitors (Kotler and Armstrong, 1999; Kotler, 1999).
Kotler (1999) has advocated that the branding challenge is how to create
and manage a deep set of associations for the brand. The brand is not a name of a
product. In its essence, a brand is an offerer’s promise that will delivers
continuously a declared features, specific quality, benefits and convenience to a
consumer. A brand bears complex symbolism and meaning. Literature suggests
six levels of brand meanings (Kotler, 1999): (i) attributes, a brand always bears
certain attributes level, (ii) benefits, because attributes must be transformed into
functional and / or emotional benefits to a consumer, (iii) a brand always
represent offerer’s values, (iv) culture, a brand might bear cultural values and / or
image, (v) a brand in many occasions project consumer’s personality, (vi) user, a
brand may represent a type of consumer that uses a product.

- 8 -
Modern approach to branding includes a comprehensive list of elements
that overlap traditional understanding of brand as feature differentiated by name,
colour, or any other visible characteristics but also include intangibles such as
brand value or consumer subjectivism. Modern brand paradigm is based on
consumer attitudes, loyalty, perception, etc., as well as on organization’s
marketing investments in a brand. Key elements of a larger brand paradigm, from
strategic point of view, are differentiation and pricing. Brand equity is defined as
the value of the brand which is based on the high brand loyalty, perceived quality,
name awareness, strong brand associations as well as the assets such as
trademarks, patents, advertising, distribution channels (Kotler, 1999; Kotler &
Armstrong, 1999; Aaker, 1991) and innovation type.
1.1.2. The value of a brand – The brand equity (BEq) concept
odern marketing theory and practice recognize brand equity
(BEq) paradigm as a key business strategic asset of the
company. Keller & Lehmann (2006) have argued that a brand represents its
influence at three primary market levels: customer, product and financial market;
a value accrued by these markets can be named brand equity. The brand equity
paradigm has been discussed to a great extent in marketing literature and many
researchers offered definition for the brand equity concept (Aaker, 1991;
Farquhar, 1989; Sriram et al., 2007) as well as different viewpoints on the factors
that influence it. A widely used definition in marketing literature defines the
brand equity as the value added by the brand name to a product without that
brand name (Farquhar, 1989; Sriram et al., 2007). More comprehensive
definition of brand equity characterizes it as the value of the brand, which is
based on the high brand loyalty, perceived quality, name awareness, strong brand
M

- 9 -
associations as well as the assets such as trademarks, patents and distribution
channels (Kotler, 1999; Kotler & Armstrong, 1999; Aaker, 1991). Similar
definition offers Temporal (2002) in which brand equity refers to the descriptive
aspects of a brand where symbols, imagery, consumer associations and
perceptions have an important role. Widely accepted BEq definition in the
literature has came from Aaker (1991, p.15) who defined it as “a set of brand
assets and liabilities linked to a brand, its name and symbol that add to or
subtract from the value provided by a product or service to a firm and/or to that
firm’s customers”. Ambler et al. (2002: pp. 23) have suggested that brand equity
describes the asset created by marketing effort of a company that will “drive
future cash flows from the sales of that brand”. In the brand equity concept the
brand has been considered as an asset, which can be sold or bought for a certain
price (Aaker et al., 2004). This term is partially misleading because the word
“equity” has financial origin (Temporal, 2002), but in its core has a subjective
view and held intangible values for the consumer. For instance, Ambler et al.
(2002) have argued that BEq represents the customer mind-set with respect to a
brand, which include perceptions, thoughts, experiences, attitudes, images, etc.
Brand equity should be formally measured, but searching for a single
financial performance measure, the silver metric indicator, is misleading
approach (Ambler, 2008). Financial performance measures are generally short
time oriented and not include intangible brand assets, measured by brand equity
(Ambler, 2008), and using only this type of brand performance assessment may
jeopardize long-term business performance (Collins & Porras, 2000). In other
words, the brand measurement must include non-financial measures, such as
consumer loyalty, which reflects consumer willingness to pay premium price
(Ambler, 2008), market share, brand awareness, purchase intentions, etc. (Keller,
1993; Park & Srinivasan, 1994; Lehmann & Reibstein, 2006).

- 10 -
In a general sense, brand equity is considered as a positive marketing
outcome because of the presence of a certain brand name, i.e., that marketing
outcome would not occur if the same product does not have that name (Farquhar,
1989; Keller, 1993), i.e., if it is unbranded.
We believe that this view limits this theory and disables further research.
Each consumer – brand encounter occurs when a consumer has the knowledge on
brand name, logo, packaging or use of the product. In these situations, as it is
suggested by Raggio and Leone (2007), consumers automatically generate
perceptions and associations about the brand. Therefore, it is not possible for a
brand to have no brand equity.
It is obsolete idea to compare branded vs. unbranded products these days,
for two reasons:
1. There are no unbranded products in industrial markets. Each product, which
is legally in the market, has a certain level of packaging and a name. Even a
food at the green market is traded under the name of producer, has a product
traceability and consumers buy it from a legal trading firm.
2. Some researchers have used comparison between branded products and
private labeled brands (Ailawadi et al., 2003; Choi & Coughlan, 2006), e.g.,
brands created for retailers and wholesalers, for their studies. Private brands
compete on price, usually discounts, and perceived quality guaranteed by the
owner of the brand name (Kotler and Armstrong, 1999; Choi & Coughlan,
2006). Nowadays it is obsolete to think comparing branded vs. private labels
because these products have name, attributes and perceived quality – so, they
are not unbranded. Second, several products in the same category is on a
shelf and only one retailer’s which suggest biased brand comparison. Third
reason is that private labels are clearly favoured by owners, in comparison
with other brands, in sense of placement on a shelf, dispose of quantity, what

- 11 -
will be featured in internal circulars (Kotler and Armstrong, 1999), price
(Davcik et al., 2009) and sales promotion.
Despite numerous conceptual and operational definitions and models of
BEq, there are a limited number of quantitative researches examining its
constructs that are based on solid empirical data (Atilgan et al., 2005). Our
standing is that, in order to enhance further research in the field, it is necessary to
take into consideration more comprehensive BEq definition as well as to
establish dimensions that influence BEq performance. In order to investigate in
more details this paradigm, it is necessary to test dimensions and their factors
within the industry, i.e., within existing branded products as well as to observe
possible differences among BEq factors and implications for the theory and
marketing practice.
1.1.3. Sources of the brand equity determinants
he brand equity concept can be discussed from different
perspectives – the investor, the manufacturer, the retailer and the
consumer (Cobb-Walgren et al., 1995). The investor is more interested in the
financial side of this paradigm (Cobb-Walgren et al., 1995), manufacturers are
interested in strategic application of the concept (Keller, 1993) in order to
achieve targeted marketing and financial goals, while retailers are dominantly
interested in the marketing implications of the BEq concept. It is important to
investigate sources of the brand equity determinants from an organizational point
of view, because it is the subject that creates and manage the offer. The complex
BEq research demands multi-research approach that will also take into
consideration importance of consumer behaviour and buying consequences.
T

- 12 -
Little conceptual developments or empirical researches have addressed
which marketing activities create brand equity (Barwise, 1993; Yoo et al., 2000)
in academic literature. Despite tremendous interest of the researchers in the brand
management theory, particularly in the brand equity concept, the dominant focus
has been on the measurement issues of BEq, not on its sources or partial
elements.
In table 1.1 has been presented the main brand equity concepts, research
focuses on brand value and its exemplars. Taxonomy describes the various
models and brand value approaches on different brand equity concepts and its
determinants – either if they were conceptualised, establish metric concept or
determinants sources of brand equity.
The conceptual approach in defining the BEq concept is annotated with
letter C. Concepts that are investigating the brand equity metrics are annotated
with M, and studies that explore the source of brand equity determinants are
marked with DS. Presented conclusions are summaries of employed studies with
remained open questions and dilemmas on brand equity creation and
management.
The extant academic literature does not provide an appropriate
measurement method that will allow better understanding the sources of the
brand equity concept (Park and Srinivasan, 1994).

- 13 -
Table 1.1: Taxonomy of brand value: main concepts, research focuses and exemplars
No. Exemplars Type of the brand
value model Taxonomy notation
Research focus Conclusion Open questions and dilemmas
1 Farquhar (1989)
marketing management
C strategic aspects and
leveraging brand equity
- Brand endows a product - Brand equity is the added value - Development of a strong brand is imperative
- What is a proper strategy for leveraging brand equity? - What are determinants of brand value?
2 Aaker (1991) customer-based brand
equity C consumers
- A management of brand equity and brand portfolio is a guardian of the brand value
- Defines underlying assets of the brand equity
- How to identify specific features that constitute underlying brand assets?
- How brand can serve as a tool for long-term vs. short-term business strategy?
3 Keller (1993) customer-based brand
equity: conceptual framework
C individual consumers
- Implications for sales, market share and profits - A brand has a positive customer-based brand
equity if consumers are attached to the brand
- What are valid benchmarks? - What are the affects of brand equity dimensions on business
strategies? - How marketers can create value for a brand?
4 Simon & Sullivan (1993)
financial market-based approach
M financial aspect of
brand value
- The value of brand equity is extracted from the value of the firm’s assets.
- Not applicable on non public companies - Aggregated macro approach not applicable on
brand-level data (individual brands)
- More refined measures of market share and advertising are needed, in order to estimate brand equity more accurate.
- Which factors should be included to improve brand equity estimations?
5 Yoo, Donthu & Lee (2000)
marketing management
C, DS marketing mix
- The interaction effect of marketing mix on brand equity
- Sales has influence on brand equity - Price is related to quality; consumers use it as a
proxy for the quality
- Has limited marketing efforts from a long-term perspective of brand management
- Comprehensive research on the interaction effect of brand equity dimensions on brand equity is needed.
- The role of brand equity in the firm’s success need to be investigated.
6 Ailawadi, Lehmann & Neslin (2003)
revenue premium M financial contribution of
brand value
- Lack of insight into “the consumer-based sources of brand equity” (pp.15)
- Additional brand building investment (e.g., advertising) in the brand raise the brand value.
- What is the identification of the benchmark brand? - What are structural relationships in the development process of high-
equity brands?
7 Ambler (2008)
financial marketing metrics
M determination of silver
metrics for performance assessment
- Financial performance measures are necessary, but not sufficient in valuing brand equity.
- What is the silver metric for brand equity? - “…should brand valuation be limited to the additional value of
branding compared to the profit stream from the equivalent unbranded product?” (pp. 417)
8 Keller & Lehmann (2003, 2006)
the brand value chain (BVC)
C, M, DS brand value creation
- The financial marketplace creates strategic implications for the brand value
- The BVC measurement approaches are based on the customer mindset, product and financial market
- From managerial point of view, the BVC suggest where and how value is created for the brand.
- The relative success or failure of a brand programme is based on recognising the uncontrollable nature of factors that influence a brand value creation.
- How much the value reported in the performance of a brand transforms to shareholder value?
- How much is the value creation dependent from established and executed marketing programme?
- How is determinate the interdependence between factors that inhibit a brand value creation?
Note: C – BEq conceptualization approach; M – BEq metrics approach; DS – Sources of the BEq determinants approach

- 14 -
Academic community has to pay more attention on the development of more
“system view” of brands and products (Shocker et al., 1994), in order to develop
more comprehensive theoretical approaches and business techniques, which will
includes relationships among pricing, promotion activities, distribution decision,
strategic implications within the BEq concept as well as possible buyer decision
process. We believe that further investigations in this field are needed.
Undoubtedly, further research should investigate a brand value focusing on the
consumer and company domain as well as to enlighten the domain of financial
and marketing constructs of the brand value concept.
Figure 1-1: Brand value concepts position matrix
Note: 1 – Farquhar (1989); 2 – Aaker (1991); 3 – Keller (1993); 4 – Simon & Sullivan (1993); 5 - Yoo et al. (2000); 6 – Ailawadi et al. (2003); 7 – Ambler (2008); Keller & Lehmann (2003, 2006)
We have created figure 1-1 by applying above presented taxonomies and
concepts. This figure represents positions of the main brand value concepts
within the consumer and company domain as well as with the financial and
marketing domain. The consumer-marketing dimension is positioned in the

- 15 -
upper-right part of the matrix. This dimension is dominantly driven by marketing
approach in explaining brand value, focusing on consumer-based studies. The
financial-company dimension is positioned in the lower-left part of the matrix.
This dimension is driven by financial approach, with focus on company actions,
in explaining the brand value determinants.
Our study intends to be positioned in the centre of this multi-research
crossing, which applies different focuses and approaches, because in our focus
are companies and consumers and we take into account complex financial and
marketing phenomena. Our approach is in line with the suggestion from Keller &
Lehmann (2003, 2006) that conceptualise and test the model in a reduced form:
marketing activities => product-market results => financial impact; adapted and
“localized” within brands and enriched-food case.
1.2. Enriched food
have witnessed the scientific and technological progress as
well as a great increase of people on our planet in the last
century. Agricultural industrialization brought about specialized production,
which, with the help of chemically synthesized substances, concentrates, new
assortment types pushing the original characteristics of the product into the
background, and large amounts of energy, has only one aim—to produce more.
Because of the high quantity imperative and economic profitability, conventional
agriculture completely distanced itself from the basic biological processes. In
case that soil conditions are not satisfactory, new artificially created types (GMO
types) are created with the intensive use of pesticides and mineral fertilizers
which, paradoxically, results in an even greater degradation of the soil and water
We

- 16 -
systems, and subsequently leads to an even greater need for pesticides and
fertilizers. In order to meet the new paradigm in the food industry –rising of the
food quality standards, raises the life quality standards and values – it is
necessary to make shift from quantitative to qualitative approach in food
management. A saturation of the traditional markets as well as changes in
consumers’ preferences in the developed countries can obtain new market
possibility by creating new products in the food industry.
The modern human (average) food consumption is consisted from high
level of synthetic chemical elements (pesticide residues, additives, preservatives,
hormones, artificial colours, etc), which is one of the basic reasons for modern
mankind illnesses, such as: cancer, allergies, cardiovascular diseases, etc. (Dich
et al., 1997). According to the World Health Organization (WHO, 2009)
statistical data, more than 30 million food poisoning cases have been registered
every year in which more than 100.000 cases have resulted in dead. Consumption
of organic and functional food has many advantages versus conventional food
(Davcik, 2004): better organoleptic quality, higher dry content level, richer in
vitamins, minerals and enzymes; organic food has bigger energy power which is
directly responsible for human organism solidity and vitality.
This thesis investigates the enriched-food brands (EFB). Under this
reference, we understand brands that have added value or characteristics different
from conventional food. This food category represents a food with added value,
such as vitamins for instance, functional as well as organic foods. In this
approach might be embedded a broad categories of healthy products, such as
dietary, organic, functional, integrative, etc., in which each of these specific sub-
groups have been characterized by a specific functional ingredient or trait
(Boesso et al., 2009a). For instance, the health enhancing food might be defined

- 17 -
as natural or processed food or food ingredients that bear health enhancing
benefits beyond their primary nutritional functions (Bogue & Sorenson, 2001). In
this subgroup can be included functional and organic foods.
The food industry is highly regulated and internationalized industry in
which monitoring and control of food safety and quality standards in the market
were traditionally responsibility of government bodies and bureaucracy
apparatus. The globalization of the agrifood system, production and distribution
introduced private retail standards as well as international food related standards
such as ISO and HACCP (Unnevehr and Jensen, 1999), and shifted this task to
the third – party certifiers (TPC) (Crespi and Marette, 2001; Hatanaka et al.,
2005). In the context of this research, we address the value-added products, in
comparison to conventional products, such as: functional food, organic and
wellness products. Regulations in the food industry can be taken into account
from the point of (i) national (or international) law as well as production and
distribution standards, and (ii) internationally recognized food standards, as
already mentioned, ISO, HACCP, etc. In the organic food industry a legal
framework for all subjects are national and international standards (Schmidt,
2004). Due to the different levels of development and ways of improving organic
production, there came into being three types of standards: national, made by
each country individually (NOP in USA, JAS in Japan, etc.), multinational (such
is the case of European Union and regulations EN 2092/91 and 45011 which
make standards for organic products/inspectional organizations), and
international standards, which, for example, are set by IFOAM1 and represent
private standards (Willer, 2005).
Appearance of the organic food production concept came about as respond
to enormous usage of chemicals in primary production, devastation of
1 Further readings on the IFOAM standards and legislation might be found at: www.ifoam.org

- 18 -
biodiversity and great number of reported cases of human poisoning by
conventional food usage (Davcik, 2004). This completely new concept, and
developed methodology, is known in different regions and languages as:
ecological (eco), biological (bio), organic food – and represents synonyms for
biologically value added food, produced under certain international (or national)
standards, strictly controlled production conditions and recognizable organoleptic
quality. The usage of synthetic chemical products for plant protection
(pesticides), synthetic fertilizers, GMO products, artificial additives and colours
are excluded in organic production. Today we can discuss about wide variety of
organic products that are produced according to specific production methodology
and national or international standards – such as: food for human usage,
seedlings, animal food, every day products from genuine materials2, etc.
The most visible difference between these two food production
approaches is in opposing quality concept. In the conventional food production
there is, so called, retroactive or static quality concept which is based on a final
product production and then, on samples, company detect its biological and
physical – chemical attributes. In organic food production there is, so called,
proactive or dynamic quality concept, which is based on control of every phase
in food production. This methodology is based on control and detection of
biological and physical – chemical attributes, processing according to defined
standards for organic agriculture, detailed book keeping as well as product
traceability (Davcik, 2004).
The World's market of organic food amounted to 26,5 billion dollars (20,2
billion euros) in 2004, and from this the European Union induced about 11
billion euros (Willer, 2005). Primary organic products covered 26 million
hectares of land, plus 14,5 million of wild population, which altogether makes
2 For instance: pillows, wood chairs, cosmetics, clothing, etc.

- 19 -
over 40 million hectares of organically certified land. In 2004, 558.449 organic
farmers were registered in the whole world. It is anticipated that during the year
2007 the market of organic products in the U.S.—with its average five-year
growth of 21,4 % between 2002 and 2007—will amount to 30, 7 billion
American dollars (Willer, 2005). At the rate it is going now, in 2010 the sale of
organic food will make 10% of all the food consumption in USA.
In the functional food industry is evident lack of an official law in EU
(Mark-Herbert, 2002; Castellini et al., 2002) as well as internationally accepted
standards (as we have seen in case of organic food industry) which will unify this
industry. Some countries (Canada, USA, Japan) adopted their own national
legislation, but included in this class different products (Castellini et al., 2002).
Due to the different, sometimes controversial, definitions on functional food we
will accept approach which this problem tackles from narrower and broader point
of view. A general definition says that the functional foods are those foods in
which have been added additional health – value (Menrad, 2003; Boesso et al.,
2009a). From a narrower point of view, we understand the functional food as
foods in which are added bacteria that provides health benefits to host. From a
broader point of view, all foods that bear additional ingredients that improve their
basic nutrient value, such as added vitamins, “less fat” claims, “more fibres”
claims and similar, we will call wellness products.
The functional food group is consisted by probiotics, prebiotics and
synbiotics products. A probiotics are microorganisms that actively interact in the
intestine and exert positive health effects on human organism. In the market exist
numerous probiotic microorganisms, such as Lactobacillus rhamnosus GG, L.
reuteri, bifidobacteria, etc., that are used in a probiotic food, in most cases in
dairy and juice products. Basic mechanisms of probiotics are benefits attributed
- 20 -
to probiotic bacteria, the (transient) modulation of the intestinal micro flora and
“the capacity to interact with the immune system directly or mediated by the
autochthonous micro flora” (de Vrese & Schrezenmeir, 2008). A prebiotics are
"a selectively fermented ingredient that allows specific changes, both in the
composition and/or activity in the gastrointestinal micro flora that confers
benefits upon host well being and health" (de Vrese & Schrezenmeir, 2008). The
synbiotics concept represents a product with prebiotics and probiotics
characteristics. Danone Activia yoghurt is well known example because contains
inulin, which has fat replacement characteristics, despite the fact that marketing
approach is focused on the ability of the Bifidus Digestivum, which improve
natural digestive transition3.
According to several researches and reports (Menrad, 2003; Hilliam,
2000), the global functional food market is estimated to 33 billion US$. In USA,
the annual turnover is around 15 billion US$, with a market share of
approximately 2% in the whole US market. In Japan, estimated turnover is nearly
14 billion US$ (Hilliam, 2000). European functional food turnover is around 8
billion US$ (Hilliam, 2000), that represents around 1% of the whole food market
(Menrad, 2003).
Menrad (2003) advocates that the growth limit of the functional foods is 5
% of the whole food market in Europe, in next 10 years. Therefore, functional
food industry will not develop to a mass market but will rather represent
heterogeneous multi-niche market that will be characterized with different
product segments and diversified brand categories.
3 Further readings and additional information on: www.activia.com

- 21 -
1.3. Research problem
he successful application of brand management might fully exploit
the organization resources and boost additional benefits to its
stakeholders. Brand management has drawn considerable attention in academic
community and practice in last two decades. The reasons for these shifts are the
high costs that are related to the launching of new brands, the high failure rates of
new products (Crawford, 1993; Pappu et al., 2005), high cost of advertising as
well as very high costs of attracting and keeping new consumers.
Aaker (1989) has advocated that brand might develops sustainable and
long-term competitive advantage for organization if consumer perceives a brand
as more valuable than competitors. Importance of successful brand building has
been discussed in academic literature (Pappu et al., 2005), because it can protect
an organization from the turbulent changes in environment (King, 1991), it
develops stronger competitive position against the power of retails (Park &
Srinivasan, 1994) as well as defending market position against competition and
building market share (Adams, 1995). Managing a successful brand that is
differentiated and consumer oriented can provide a comprehensive competitive
advantage. Factors that influence the brand have been under investigated in
academic literature and practice. Major question that investigates this relation is;
RQ1: How is a successful brand determined?
It is conventional wisdom that an organization has to manage the brand,
i.e., to invest in its brand portfolio. However, the literature and practice offers
limited knowledge and solutions on strategies and determinants of the brand
value. One reason might be very heterogeneous knowledge on a very broad
T

- 22 -
number of industries and countries, which implies lack of generalizability in
theory or business solutions. Second reason might be no existence of general
theory on a brand value, which is applicable in all or at least in most of industry
cases. The extant literature review (Temporal, 2002; Ailawadi et al., 2003;
Aaker, 1991; Yoo et al., 2000) has strongly suggested that great number of
variables, such as marketing investment in the brand, sales volume, price,
revenue, quality, etc., have been a key success factors in developing brand value.
Brand value might be understood as the amount that a brand bears in terms of
consumer loyalty, income, market reputation, etc. This literature review offers
very heterogeneous solutions for creation, measure and management of brand
value. Our research question, based on these premises is; RQ2: What are the
determinants of brand value in the enriched-food industry?
There is no clear answer in marketing literature on how brand influence
brand strategy. Literature is also silent on determinants of the applied brand
strategy in the market. It is also very vague how brand can be successful in the
market, especially in the specific industrial subsector. Success of a firm has been
described with several marketing performance measures in modern business
practice; of which, premium price and market share are most often used. The
brand performance outputs are not used only to describe a firm position in a
market or the current status of the brand portfolio, but also to signal future
performances and business endeavours. In marketing literature exist a very few
researches on application and managerial implication of brand strategy on pricing
(Duke, 1994; Shocker et al., 1994) or market share in foods. We want to address
this issue with the following research question; RQ3: How does brand value
shapes a company performance in the enriched-food market?

- 23 -
1.4. Methodology
applied multi-research approach in this thesis. Motivation
for such a complex and demanding methodological
approach lies in fact that the brand value issue has the great importance for the
market-oriented organization and has many organizational, social and business
layers.
We conducted an online survey research in order to enlighten the
determinants of a successful brand (RQ1). In this survey, we questioned Italian
and Swedish managers about their opinions and attitudes toward factors that
influence the brand success. One may question this approach because we base
our approach on subjective and self-report research. Applying the perceptual
approach in the brand success study, instead of studying archive and objective
data, has been conducted from two reasons. First is due to the impossibility to
obtain such data from companies because of proprietary and confidentially
issues. Second reason is that this approach is well known and established in
theory and academic community (Venkatraman & Ramanujam, 1987; Jaworski
& Kohli, 1993; Singh & Ranchhod, 2004). Strong correlation and
interdependence has been found between perceptual data from managers and
objective performance statistics (Venkatraman & Ramanujam, 1987; Singh &
Ranchhod, 2004).
The complex nature of the branding studies require deeper and thorough
understanding of phenomenon such as brand value and its determinants (RQ2) as
well as evidences on branding results in the market (RQ3); i.e., what are the
We

- 24 -
drivers of the brand performance outputs. In order to enlighten these issues we
conducted two statistical approaches – namely, regression and cluster analyses –
and we used two different archive data – AC NIELSEN panel data and AIDA
data on company financial statements.
One source is market-based data from AC Nielsen research on the food
buying patterns that investigated 20.000 Italian households. These data has been
obtained from ACNielsen Italy employing the Consumer Panel Solutions (CPS)
as well as Homescan® panel tool (ACNielsen, 2008). The CPS obtains consumer
– centric marketing solutions that allow better understanding purchase
behaviours, demographic profiles, etc. This broad sample size longitudinal panel
provides key consumer patterns in 28 countries based on consumer purchase
information from more than 300.000 household worldwide (ACNielsen, 2008).
Nielsen Homescan® is a multi – outlet panel that captures all consumer purchase
information. The Homescan® consumer panel has been established as a leading
consumer purchase panel in the world, providing consumer insights in 27
countries and consumer purchase info from over 260.000 households
(ACNielsen, 2008). Our second source is data from the Bureau Van Dijk
Electronic Publishing AIDA financial statements database (AIDA, 2008) that
have the information on 940.000 Italian companies. The AIDA database includes
company accounts, ratios and financial activities of the companies included. The
accounts are in a detailed format and include 50 financial ratios.

- 25 -
1.4.1. Survey research indicators and reliability measures
he scale development paradigm has been established by
Churchill’s (1979) work in the marketing measurement literature
(Finn & Kayande, 1997). This marketing measurement paradigm has been
investigated and improved by numerous research studies and researchers, with
special emphasize on the reliability and validity of a survey research indicators
and measures. However, Finn & Kayande (1997) have suggested that the
composite reliability, based on so-called Cronbach’s Alpha indicator, cannot be
solely assessment indicator because it is limited by its scope only on the scaling
of person, rather on the scaling of objects such as firms, advertisements, etc.
They proposed, so called G-theory, measured by G-factor that includes wider
marketing facets. This measure has not wider application in marketing academia
due to robust measurement metrics and its high cost. There are evidences in the
literature (e.g. Finn & Kayande, 1997) that a piece of research, with 200
respondents, may cost app. 10.000 US$ (in 1995 prices).
We present two most important survey research indicators in following
subsections.
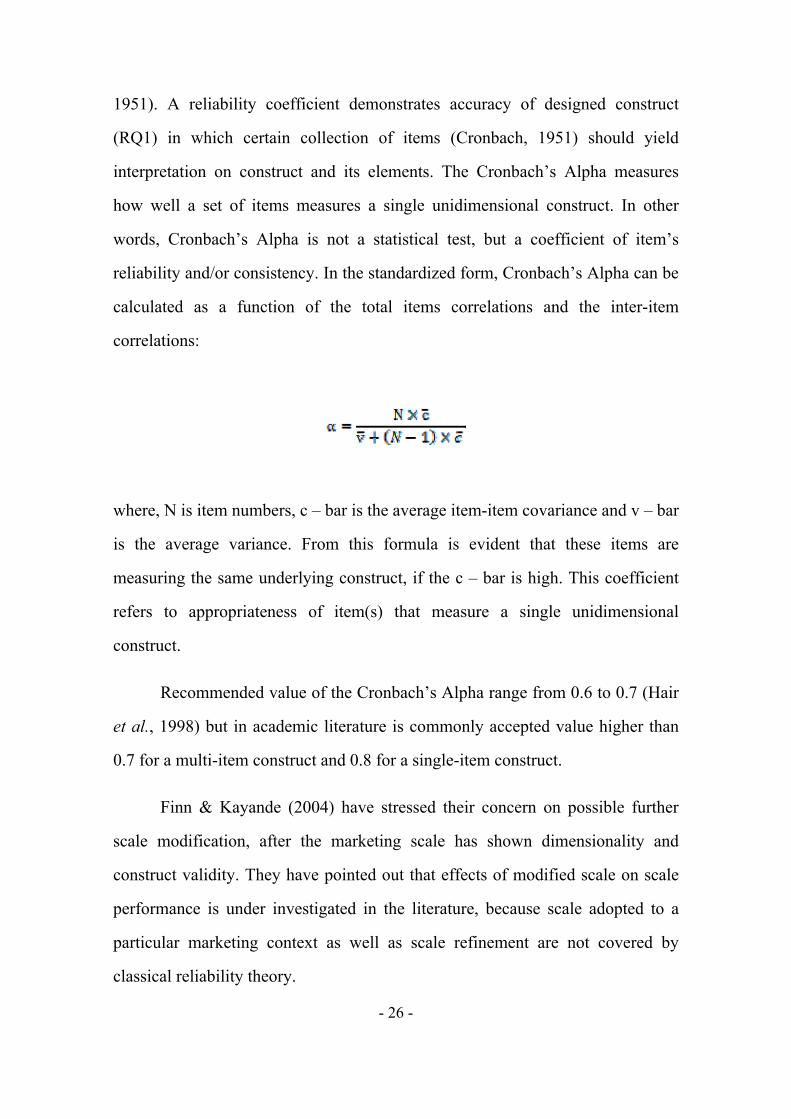
1.4.1.1. Composite reliability – Cronbach’s Alpha
ost likely that no other statistic has been reported more
frequently as a quality indicator of test scores in the literature
than Cronbach’s (1951) Alpha coefficient (Sijtsma, 2009). Any quantitative
research must be based on accuracy and reliability of measurement (Cronbach,
T
M
- 26 -
1951). A reliability coefficient demonstrates accuracy of designed construct
(RQ1) in which certain collection of items (Cronbach, 1951) should yield
interpretation on construct and its elements. The Cronbach’s Alpha measures
how well a set of items measures a single unidimensional construct. In other
words, Cronbach’s Alpha is not a statistical test, but a coefficient of item’s
reliability and/or consistency. In the standardized form, Cronbach’s Alpha can be
calculated as a function of the total items correlations and the inter-item
correlations:
where, N is item numbers, c – bar is the average item-item covariance and v – bar
is the average variance. From this formula is evident that these items are
measuring the same underlying construct, if the c – bar is high. This coefficient
refers to appropriateness of item(s) that measure a single unidimensional
construct.
Recommended value of the Cronbach’s Alpha range from 0.6 to 0.7 (Hair
et al., 1998) but in academic literature is commonly accepted value higher than
0.7 for a multi-item construct and 0.8 for a single-item construct.
Finn & Kayande (2004) have stressed their concern on possible further
scale modification, after the marketing scale has shown dimensionality and
construct validity. They have pointed out that effects of modified scale on scale
performance is under investigated in the literature, because scale adopted to a
particular marketing context as well as scale refinement are not covered by
classical reliability theory.

- 27 -
1.4.1.2 Common method bias
any of the academic findings that are disseminated in the
marketing community are based on self-report research studies
(Podsakoff and Organ, 1986). Problems with self-reporting arise because the
subject is asked to express specific opinion and attitude that can be questioned
and changeable during the time and in different environment. In other words, as
discussed by Podsakoff and Organ (1986), we ask from subjects to go beyond
their higher-order cognitive process. Problem may arise when one interpret
correlation among variables. This problem is known in the literature as a
common method variance. Research measures might be contaminated, because
all measures come from the same respondent; with presumption that source
answers in same fashion and way of thinking (Podsakoff and Organ, 1986);
which might be the case in our research operationalization in RQ1. This problem
is (usually) tackled using Harman’s one-factor test (Harman, 1967) in order to
control for common method variance (Podsakoff and Organ, 1986). All variables
are entered into a factor analysis in this procedure. The unrotated factor solution
results are examined in order to determine the number of factors that account for
the variance in examined variables (Podsakoff and Organ, 1986); applying
commonly accepted threshold for the eigenvalue above value 1.
1.4.2. Regression analysis
esting the determinants of brand value (RQ2) might be addressed
with the single – equation linear models that are widely used in
M
T

- 28 -
marketing applications. Except in some special cases, these models are estimated
with ordinary least squares (OLS) method.
The basic population model is linear in its parameters (Wooldridge, 2001):
y = βo + β1x1 + β2x2 + βkxk + u
where y is observable, dependent (e.g., brand value, price, market share,
etc.), random scalar, x1, x2,..., xk are observable, independent (e.g., sales,
marketing investment in the brand, price, etc.), random scalars, u is the
unobservable error term, and βo, β1, β2,..., βk are the estimated parameters. The β
coefficients measure the marginal effects of the presented independent variables
on the presented dependent variable y.
The statistical properties of OLS for estimating the parameters
(Wooldridge, 2002) in a population model are established with following six
assumptions: i) the multiple linear regression model (MLR) is linear in
parameters; ii) the model has a random sample of n observations; iii) the error
term u has zero conditional mean; iv) in the population model none of
independent variables has a constant value, in other words there is no perfect
collinearity among them; v) Important theoretical assumption in the ordinary
least square method is that the variance of the error term u, conditional on
regressors, is constant. Violation of this assumption is well known as
heteroskedasticity; vi) normality assumption states that unobserved error term is
normally distributed in the population model.

- 29 -
The primary importance for a researcher is to estimate model’s goodness-
of-fit. In other words, a researcher wishes to measure how well the independent
variable x explains the dependent variable y (Ezekiel, 1941; Wooldridge, 2002).
The R-squared of the regression (R2), also known as the coefficient of
determination, represent the ratio of the explained variation compared to the total
variation (Wooldridge, 2002). This value range from 0.0 to 1.0, where 1
represents perfect model fit.
1.4.3. Cluster Analysis
esting a company performance (RQ3) can be undertaken with
application of the clustering concept that is widely discussed in
management literature. Clustering is the classification of objects into different
groups, e.g., the partitioning of data set into subset (clusters), so that the data in
each subset dominantly share common trait. In a currently available management
literature clusters are discussed from their geographical traits, so it is common
practice to treat and to name this topic only as geographical clusters (Porter,
1998a). Cluster, according to Porter’s theory of competitiveness, also include
organizations in downstream industries, complementary products, government,
standard-setting agencies as well as specialized organizations that provide
training, education, information, research and technical support (Porter, 1998a;
Porter, 1998b). Having all said in mind, cluster might be defined as a system of
interconnected firms and organizations whose value as whole is greater than the
sum of its parts (Porter, 1998a). Within this thought, we want to follow idea that
in cluster concept exists other important and interconnected links and traits. In
the context of this research, common traits will be innovation and company type.
In this manner, we want to define innovation type clusters as a relevant measure
T

- 30 -
of brand difference among food producers within mega-cluster, as Italy
undoubtfully is. This mega-cluster can be “narrowed” to the three northern Italian
regions: Veneto, Lombardia and Emilia Romagna; because most of the producers
are from these regions. Due to the facts that in our focus are not geographical
traits or factors / variables that influence food cluster, we want to emphasize
innovation type clusters from (i) production and (ii) marketing point of view.
This view can be seen as further development of Porter’s view on
complementarities (Porter, 1998a). He states that a cluster can enhance
productivity by facilitating complementarities between the activities of cluster
participants and the parts of the cluster which are often mutually dependent; in
other words, lack in performance by one part of this chain of a cluster can
jeopardize the success of others (Porter, 1998a; Porter, 1998b). Rare in the
literature, and good example of the cluster operationalization using innovation
and company strategy, might be the work from Boesso et al. (2009b) that have
studied new product development initiatives on pricing and sales.
The SPSS TwoStep Clustering Component is a scalable analysis method
designed to handle large data sets (SPSS TwoStep, 2009). This method can
handle both continuous variables, such as brand price, and categorical variables,
such as innovation and company type in this study. This method is applied in two
steps: i. pre-clustering the records into small sub-clusters; ii. clustering the sub-
clusters into the desired number of clusters (SPSS TwoStep, 2009). The desired
number of clusters may be defined by user, otherwise TwoStep Component will
does it automatically. In the pre-cluster step is applied a sequential clustering
approach that scans the data one by one and decides if the current record should
be merged with the previously formed clusters or starts a new cluster based on
the distance criterion (SPSS TwoStep, 2009). In the second step, the TwoStep

- 31 -
Component takes sub-clusters from the first step as inputs and groups them into
the defined number of clusters (SPSS TwoStep, 2009).
CHAPTER 2
BRAND SUCCESS AND ITS FACTORS: A CASE OF THE ENRICHED-FOOD INDUSTRY

- 32 -

- 33 -
BRAND SUCCESS AND ITS FACTORS: A CASE OF THE
ENRICHED-FOOD INDUSTRY
2.1. Introduction
he organizational resources can boost additional value to its
stakeholders if brand management is successfully used and
exploited. Brand management has attracted considerable attention in academic
and business community during the last two decades. The reasons for this
increased awareness are the high cost of new brands launching, the high failure
rates of new products (Crawford, 1993; Pappu et al., 2005), raising cost of
promotional activities as well as very high costs of attracting and keeping new
consumers.
If consumers perceive that a product with a specific brand adds more value
than the competitors brands, this might develops sustainable and long-term
competitive advantage for organization (Aaker, 1989; Agres & Dubitsky, 1996).
Importance of successful brand building has been discussed in academic
literature (Pappu et al., 2005; Agres & Dubitsky, 1996). If a brand is successful,
T

- 34 -
it can protect an organization from an unstable environment (King, 1991), it can
develop a stronger negotiating position to its retailers (Park & Srinivasan, 1994)
as well as help defending market position against competition and boosting
market shares (Adams, 1995).
We can adapt famous Jaworski & Kohli (1993) question in: Why are some
organizations more successful than others? Why their brands are more favourable
and expensive than others?; we can add. These are just a few questions that have
been raised by many managers every day, but there is no clear answer or theory.
Our motivation to conduct this study is based on the need to provide a better
understanding of factors affecting brand effectiveness in the enriched-food
industry. Development and management of an effective brand strategy in this
industry has been under-investigated in the business practice and academic
literature. One may ask: why it is important or relevant to study the enriched-
food industry? This industry has been chosen as a case because it has strong
growing rate, it is highly differentiated in a comparison to conventional foods
(Boesso et al., 2009a), it is a mainstream food industry segment, includes high
level of innovativeness and comprehensive marketing efforts in maintaining
differentiation strategies.
Our intention is to contribute to the existing literature on branding in
several ways. First of all, an industry-specific branding scale has been developed
and tested empirically in two countries. Second, the characteristics of underlying
factors of brand success in the enriched-food industry were examined. Third, this
study has avoided the conventional focus on single-authored measures (e.g.,
Singh & Ranchhod, 2004) as well as with added operationalization adjustments
from an industry, as we use a multifaceted approach to branding. Instead of

- 35 -
focusing on a single perspective (e.g. financial, customer oriented), this approach
includes internal, external as well as interactive items in each variable.
A brief overview of marketing literature on successful brand building and
its applicability will be presented in the following section. Background
information on the industry context, the sample and data collection will be
presented in section 3, together with measures and modelling procedure. In this
section, varieties of statistical techniques are employed to confirm the reliability
of the brand success scale. In section 4, the findings of the study will be
discussed. The study concludes with a discussion of managerial implications of
the findings and some suggestions for further research directions are examined.
2.2. Successful brand and underlying factors
rand management is considered, by theory and practice, as a
concept that can fully exploit the assets of an organization as well
as generate additional value from the brand investments (Pappu et al., 2005).
Advantages of successful brand building have been widely discussed in the
literature (Pappu et al., 2005; King, 1991; Park & Srinivasan, 1994; Adams,
1995), but only a few conceptual and quantitative studies on its antecedents took
place.
The discussion that follows presents a brief explanation of the factors
employed in this study to measure brand success. The items construct in table
2.5. reflects an attempt to offer a solution for a brand management application in
a business framework, as well as a starting point for future discussions and
further research.
B

- 36 -
Brand success cannot be achieved without appropriate marketing
performance audit and activity measurement. Clark & Ambler (2001: 231) have
defined marketing performance measurement as the assessment of “the
relationship between marketing activities and business performance”. O’Sullivan
& Abela (2007) advocated that marketing performance measurement research
has the three important streams: i) measurement of brand equity, ii) measurement
of marketing productivity, and iii) identification of metrics in use. We will focus
on a brand equity approach, because it is beyond the scope of this study to
describe and discuss all streams. It is widely accepted that brand equity
represents the value of the brand (Aaker, 1991; Aaker et al., 2004; Kotler, 1999;
Kotler & Armstrong, 1999), which is a cornerstone for brand success in the
market. Price premium and market share have been recognized as the value
delivered to a consumer that represents effectiveness-oriented concept of firm
performance (Sandvik & Sandvik, 2003). This is in line with de Chernatony &
Cottam (2006), who have argued that there is no one (unique, the silver metrics)
comprehensive methodology to define and/or to measure a brand success. They
have defined a successful brand performance using a great range of measures
such as: market share, consumer perception; managers’ opinions on a brand
value, future financial trends and premium price likelihood, etc. (de Chernatony
& Cottam, 2006).
These lead us to our first proposition:
P1: Brand success can be measurable by marketing efficiency indicators,
such as premium price, market share, return on investment, brand value, higher
profit margin and brand loyalty.

- 37 -
The business strategy literature (e.g. Porter, 1996; Porter, 1998) advocate
four basic competitive positioning strategies that can be followed by companies –
three winning (overall cost leadership, differentiation, focus on segment) and a
losing one (middle-of-the-roaders). Kotler (1999: 287) has defined differentiation
as “…the act of designing a set of meaningful differences to distinguish the
company’s offering from competitors’ offerings”. There are evidences in the
literature (Narver & Slater, 1990) that company which employ differentiation
strategy is more market oriented than those that employ cost-leadership strategy.
This is the case because differentiators compete on brands that gain higher prices
in the market, while cost leaders are more oriented on low price competition
(Sandvik & Sandvik, 2003, Davcik et al., 2009). Agres & Dubitsky (1996) have
concluded, in their study on successful brand building strategy, that delivering
differentiating brand benefits are more appealing and successful strategy than
improving product quality.
Agres & Dubitsky (1996) have argued that knowledge is not a media
consequence, but the results of a communication process between an
organization and its stakeholders. Literature and practice recognises many
examples of such stakeholders – suppliers, consumers, competitors as well as
knowledge sources; as universities or consultancy. It is important for the
organization to find information from all these stakeholders in order to be able to
load the brand with relevant content. In this study such knowledge from
stakeholders is termed brand knowledge. Many operationalizations on knowledge
and its consequences exist in general marketing literature. Unfortunately, there
are very few operationalizations on knowledge that influences the brand success.
Development of a successful brand occurs if consumers perceive the brand as
differentiated, if it is relevant for them, if it has developed the consumer’s

- 38 -
attachment to the brand and if consumer has the knowledge about the brand
(Agres & Dubitsky, 1996; Erdem et al., 1999).
Consumer orientation represents a capability to understand the
consumer’s needs (current and/or latent) that shall be satisfied in an efficient and
timely manner. Deng & Dart (1994) have argued that consumer orientation
represents the extent to which marketers succeed to increase long-term consumer
satisfaction. The marketing concept, and its operationalisation side – market
orientation, are based on a premise that all organizational activities must be
focused on satisfaction of client’s need (Kotler, 1999; Deng & Dart, 1994).
A value plays a crucial role in any marketing activity (Holbrook, 1999). In
the literature (Kotler, 1999; Holbrook, 1999) have been argued that marketing, as
managerial process, facilitate the exchange of interest as a transaction between
two parties in the process where each of them offers some value in return for a
greater value. In its essence, consumer value represents the evaluation of an
object offered by organization. The complexity of this concept lies in fact that
“object” is multi-dimensional “effect” framed by shape, name, (in)tangibles,
colours, promises, experiences, etc. – it has each of these constructs or a very few
of them. Consumer value can be, literally, everything – future promise, taste,
emotional attachment, physical characteristics, etc. It can be advocated that brand
value is represented by appealing quality attributes that frame brand’s promise
defined by offerer.
There are a large number of scientific approaches and theories on most
effective and state-of-the-art organizational design, but the most intricate
organizational paradigm in last two decades is related to the contingency factors
approach. This research approach is based on congruence hypothesis, e.g., that
effective organizational structuring requires a fit between contingency factor and

- 39 -
design parameter (Mintzberg, 1980). Lawrence and Lorsch (1967) have found
clear relations between external variables, organizational design and
organizational performance. Cyert & March (1963) have suggested that a
business organization is constrained by the uncertainty of its environment.
Organizations have problems to maintain a viable coalition and have limitations
with its capacities for assembling, storing and utilizing information. As a result, a
company can be characterized as an adaptively rational system rather than an
omnisciently rational system. Because of that, organization must obtain
information from environment because it wants to reduce uncertainty with more
information. New information from the environment – new brands, market
results, competitors’ actions, etc. – gives new sense to an organization. Weick et
al. (2005) have advocated that an organization must develop its capacity to make
sense of events in order to construct meaning and establish organizational
actions.
Knox (2000) has argued that brands are strategic management tools
because they represent the company (e.g. its reputation and values). According to
him, branding has proved to be the critical factor in all marketing processes, as
well as a common denominator to business success. Porter (1996) defines
strategy as a process, in which a unique and valuable position is created
involving a different set of activities. In other words, strategic positioning
represents “…performing different activities from rivals’ or performing similar
activities in different ways” (Porter, 1996: 62).
Brand success, as discussed above, has a positive affect on business
performance. In order to reach brand success, new brand development is
important. This is valid for service industries (e.g. Berry, 2000) as well as for
goods producing industries (e.g. Wong & Merrilees, 2005). New brand
- 40 -
development is highly relevant also in food industry, as Nevo (2001) argued that
a firm’s growth in cereal industry was driven by “aggressive marketing, rapid
introduction of new brands and fuelled by vitamin fortification, pre-sweetening
and the surge of interest in natural cereals” (Nevo, 2001: 310). John et al. (1998)
have shown that development of new brands are a strong complement to brand
extension, as brand extensions may dilute the original brand and decrease profit.
New brands can create new markets that do not affect established brands and
erode existing markets. It can therefore be assumed that new brand development
is positively associated with brand success.
A preceding discussion leads us to the second proposition:
P2. Numerous factors contribute to brand success performance; of which,
the most prominent are: consumer orientation, brand differentiation, brand
knowledge, new brand development process, values, organization, consumer
perception and creation of the brand strategy.
An overall correlation structure of the possible relationships amongst the
constructs (Wong & Merrilees, 2005), that can facilitate future quantitative
(multivariate data analysis) approach, has been framed by propositions P1 and
P2.
2.3. A proposed model
2.3.1. Sample and data collection

- 41 -
he data were collected from Italian and Swedish companies that
manage enriched-food brands at their respective markets. We
collected the questionnaire responses through an online survey, using
Quicksearch software. The advantages of an online survey are (i) easy to use in
the statistical software, such as SPSS, STATA, LISREL, etc.; Rundquist (2009)
advocates that (ii) respondents fill out a form faster than with interviews or in
return mail envelopes, (iii) the results are directly stored in a database, (iv) it is
immediately registered when respondent answer the survey, and (v) it allows
respondents to answer in their spare time or at home in a less stressful situation.
Each respondent could choose to answer in English, Italian or Swedish language.
We identified 125 brands from this industry group; 45 in Italy and 80 in
Sweden. We obtained 58 answers; 21 from Italy and 37 from Sweden (response
rate 46.4% of total sample; 47% in Italy and 46% in Sweden). This response rate
is satisfactory if we have in mind that acceptable rates for cross-sectional samples
have ranges between 12% and 20% (Churchill & Iacobucci, 2009; O’Sullivan &
Abela, 2007).
We collected survey responses over a period of six weeks in March 2009.
After initial email request with a link to a questionnaire on the Internet, we sent
two additional email reminders on a two-week basis, with a possibility for a
respondent to be removed from the list and the survey on request. The
Quicksearch software allowed us to “force” respondents to answer on all
questions from the questionnaire, in a manner that they could not pass to the next
question if they do not answer on previous, which provide us with no missing
values in our data set. In order to avoid the creation of common method variance
that may defile construct relationships, respondents were not informed about
specific goal of the research (Sousa & Bradley, 2009).
T

- 42 -
2.3.2. Instrument development
he measures employed in this study are based on literature, adapted
and/or adopted when it was necessary, and industry. Preliminary
versions of the survey were tested with three senior academics in marketing /
management field. Their feedbacks were included in the final pre-test version of
the survey that was tested by four marketing executives in food industry. The
pre-test respondents were precluded from participation in the final survey.
Results of the pre-test showed necessary adaptation of the constructs and
clarification of the questions and items included. The factor constructs and items
were revised accordingly. All items in the survey are statement style and
measured on the Likert scale from 1 (strongly disagree) to 7 (strongly agree).
We employ a perceptual approach in this study, as opposed to objective
financial data, due to the impossibility in obtaining objective data from
companies. An objective research approach cannot be applied due to the
proprietary data and confidentiality issues. The subjective approach is well
known in the literature (e.g. Jaworski & Kohli, 1993; Singh & Ranchhod, 2004)
and significant correlation between the two approaches has been reported. For
instance, Venkatraman and Ramanujam (1987: 118) have drawn the conclusion
that “perceptual data from senior managers … can be employed as acceptable
operationalizations of business economic performance”. Their conclusion is
based on the results from asking senior executives to rate their firm’s
performance relative to that of major competitors using a number of criteria,
including sales growth, net income growth and ROI, and comparing their
answers with objective performance statistics. In this study, marketing managers
T

- 43 -
were questioned from each organization in order to obtain senior executive
information.
2.3.3. Measures
rand Success. We measured brand success with items adopted
from various resources (e.g. O’Sullivan & Abela, 2007; Singh &
Ranchhod, 2004; de Chernatony & Cottam, 2006). We developed item constructs
within a branding framework using the success performance outcomes (e.g.
profitability, market share, ROI) by de Chernatony & Cottam, 2006 and
O’Sullivan & Abela (2007) and higher brand loyalty as surrogate for the
customer satisfaction idea by Singh & Ranchhod (2004). The Brand
differentiation item constructs are inspired by Porter (1996; 1998) and Sandvik &
Sandvik (2003), but adapted according to the suggestions from the industry
managers. The Brand knowledge items construct have been inspired by
Frishammar (2002) and McDonald et al. (2007), and have been improved with
suggestions from the industry. The Consumer orientation items construct are
adapted from Deng & Dart (1994) and Singh & Ranchhod (2004). The idea for
the New brand development items construct came from Kotler’s (1999)
discussion on brand challenges and advantages, and was refined with suggestions
from industry managers. The values items were inspired by Holbrook (1999) and
adapted to the study with suggestions from the industry. The organization items
B

- 44 -
construct was inspired by seminal works of Mintzberg (1980), Lawrence &
Lorsch (1967), Cyert & March (1963) and Weick et al. (2005) with necessary
item adaptation for this study. We measure the creation of the competitive
strategy with items adopted from Singh & Ranchhod (2004) and Jaworski &
Kohli (2003). We could not find appropriate items construct for the consumer
perception in available literature and we have developed it for this study in
cooperation with the industry.
Control variables. In our study, we included two control variables –
annual turnover and number of employees. In marketing and strategy literature,
these two variables are recognized and commonly accepted as variables for firm
size, which are used as a proxy that determines company performance. Several
authors (e.g. Harrison & Torres, 1988; O’Sullivan & Abela, 2007) have
suggested that indicators, such as sales, assets and number of employees, are
equally acceptable measures of a firm size.
2.4. Modelling procedure and results
assessing our model, we applied an approach suggested by Hair
et al. (1998) and Anderson & Gerbing (1988), estimating a
measurement model before the assessment of the multivariate model
construction. The justification of this approach needs an accurate assessment of
the reliability of the indicators. Hair et al. (1998) advocate that the best approach
is a single-step analysis with simultaneous analysis of measurement models.
In order to assess the fit of the model and its estimates we used SPSS 15 to
analyse the data, and controlled with STATA 10.
In

- 45 -
Anderson and Gerbing (1988) have recommended examination of the item
scales for unidimensionality and reliability as a first step in survey data analysis.
The corrected item-item and item-total correlations were examined for each
factor in order to reach unidimensionality. This process used one scale at a time
within each multi-item construct. If the coefficient alpha was lower than 0.7
within multi-item scale the item(s) with the lowest item-total correlation were
eliminated from the scale until reaching the preferred 0.7 level for the multi-item
scale. Evidences on unidimensionality and composite reliability are presented in
table 2.1.
In the column “Initial number of items” has been presented the initial
number of items in factor’s construct. The remained numbers of items are the
items that survived improvement of the reliability procedure in order to raise the
value of Cronbach’s Alpha. Lowest item-item (LIIC) and item-total correlation
(LITC) represent the lowest level of correlation among the used constructs. LITC
range between .156 and .529; LIIC range from .137 to .321.
Evidences of internal model consistency provided by composite reliability
measured by Cronbach’s Alpha (1951) are presented in table 2.1. This measure
of reliability is the most commonly used for a set of multi-construct indicators
(Hair et al., 1998) and widely used in the multivariate data research. From the
table 2.1. it is showed that all constructs, except new brand development and
consumer perception, satisfy reliability minimum level (>.700). The consumer
perception failed to satisfy minimum reliability level (.614) as well as the new
brand development that has the value of .641, and these factors will be excluded
from further analysis.
After the composite reliability analysis, we examined our results for
offending estimates. No offending estimates were found in our construct – e.g.,

- 46 -
negative variances, non-significant error variances, and not positive defined
covariance / correlation matrices as well as correlations larger than 1.
Because data was collected in the same period of time and all measures
were based on similar construction procedure there is a risk of common method
bias. We used Harman's test (Harman, 1967; Podsakoff and Organ, 1986) to test
it and an un-rotated solution in the exploratory factor analysis gave eleven
components with an eigenvalue above 1.000. The first factor accounted for
25.03% of the variance and eleven factors together accounted for 76.64% of the
variance. Therefore, we conclude that common method bias is not likely to have
a significant impact on this study.
Table 2.1: Unidimensionality and composite reliability
Constructs Initial No. of items
Remained items
Lowest item-total
correlation
Lowest item-item correlation
Cronbach’s Alpha
Brand Success 6 6 .156 .256 .761
Consumer orientation 5 5 .255 .137 .702
Brand knowledge 6 6 .443 .237 .744
New brand development 5 5 .271 .138 .641
Values 5 5 .404 .321 .736
Brand differentiation 5 4 .408 .188 .768
Organization 5 4 .384 .148 .700
Consumer perception 5 4 .344 .137 .614
Strategy 5 5 .529 .312 .809

- 47 -
Descriptive statistics has been presented in table 2.2. Mean values range
between 3.63 and 5.82, standard deviation has range from 0.7687 to 0.9889. The
strength of the multi-item intercorrelations may affect the stability of the
indicator coefficients (Diamantopoulos & Winklhofer, 2001; Buil et al., 2009).
The Variance inflation factors (VIF) show no multicollinearity amongst
the 7 constructs. The brand success construct does not contain redundant
information because the variance inflation factors range from 1.297 to 2.371,
which is far below the accepted boundary level of 5 (Hair et al., 1998; Buil et al.,
2009).
The scale values correspond to the Likert scale values from 1 to 7. The
factor number 1 is brand success that has mean value 4,845; the factor 2 is brand
knowledge (3,626); number 3 is consumer orientation (5,497); the factor 4 is
values (5,293); number 5 is brand differentiation (5,819); organization (4,651)
and strategy (5,593) are factors 6 and 7, respectively.
Table 2.2: Descriptive and measurement statistics (N=58)
No Constructs Mean SD AVE VIF
1 Brand success 4.8448 .9229 67,891 ---
2 Consumer orientation 5.4966 .8577 69,144 2.371
3 Brand differentiation 5.819 .8242 59,571 2.016
4 Brand knowledge 3.6264 .7687 59,718 1.485
5 Values 5.2931 .9575 72,821 2.032
6 Organization 4.6509 .9889 53,134 1.297
7 Strategy 5.5931 .8633 57,334 2.274

- 48 -
Note: SD – Standard deviation; VIF – Variance inflation factor; AVE – Average Variance Extracted
Figure 2-1: Mean values of the underlying brand success factors
In figure 2-1 have been represented the underlying brand success factors
mean values, using histogram representation.
Figure 2-2: Premium price frequencies

49
Figure 2-3: Higher profit frequencies
Figure 2-4: Brand loyalty frequencies
Figure 2-6: Market share frequencies
Figure 2-5: Brand value frequencies
Figure 2-7: ROI frequencies

- 50 -
Mean value constructs reveal how underlying factors were evaluated by
managers in Italy and Sweden. High average grades were taken by brand
differentiation, strategy, consumer orientation and values. Factors, such as brand
success, organization and brand knowledge, have the medium importance for
managers in food industry.

- 50 -
In focus of this research is brand success. The structure of the brand
success relative importance for the respondent can be assessed from the
respondents’ frequencies by each item in the brand success construct. This
structure is represented with figures from figure 2-2 to figure 2-7.
The discriminant validity test has been reported in table 2.2. Average
variance extracted (AVE) exceed recommended 0.5 level (Hair et al., 1998). In
addition, the shared variance among constructs in the model, measured by the
square of their intercorrelations, is smaller than the AVE for each construct
(Fornell & Larcker, 1981; Podsakoff & Organ, 1986), which means that
discriminant validity is not a concern.
The estimated correlation matrix used to test the brand success model
construction is shown in table 2.3. As we expected, brand success in enriched-
food industry has been correlated with all factors, even though we have found
that the three factors organization (.122) and brand strategy (.151) have the small
level of correlation (Ezekiel, 1941).
Notably, very high correlations exist between the factors brand
differentiation and consumer orientation as well as with strategy. The only factor
with a major correlation to the performance variable (brand success) is brand
knowledge (.372). This correlation indicates that an active search for new
knowledge about the industry (i.e., supply chain, consumers, competitors)
(Frishammar and Hörte, 2005) as well as actively use of consultants and
academia for new knowledge (Czellar, 2003) is important for the firm. That is
not enough. The firm must also integrate acquired knowledge with in-house

- 51 -
capacities to be able to use it, or to be able to load the brand with the right values
to reach success (Guenzi and Troilo, 2006).
The correlation results of values factors suggest that this factor is highly
correlated with all factors, which is in line with available literature (Holbrook,
1999). The importance of this finding is that managers in the enriched-food
industry recognize the importance and inter-connectability of brand values with
other factors in a successful brand development. In our sample of food industry,
competitive strategy is not highly correlated with brand success (.151), but it is
highly correlated with consumer orientation (.674), brand differentiation (.600)
and values (.570). These three factors are all in the range of a differentiation
strategy. Consumer orientation as well as brand differentiation supports a
strategy for differentiation. Organizational values are also an important source
for differentiation. Brand success can, however, be achieved without a focus on
differentiation, and therefore it could be explained why strategy does not affect
brand success.
We also examined the correlation relationships of organizational factor to
another factors in our model. This factor is highly correlated with the factors
values and strategy, which constitutes strategic dimension of an organization
rather than factors that are more oriented on specifics of a brand.
The Wald test, for the Italian and Swedish factors, is presented in table
2.4. (Appendix A). The important differences between the national samples exist
within the four factors: success, brand knowledge, organization and values. There
is no significant difference between the national samples regarding the three
factors consumer orientation, differentiation and strategy.

- 52 -
In this test, we also included control variables. One would expect that
company size has no significant influence between two countries, as it is usual
expectation in marketing literature.
Table 2.3: Correlation matrix♣
1 2 3 4 5 6 7
SUCCESS 1 .761
CONSUMER ORIENTATION 2
.242 .702
BRAND DIFFERENTIATION
3 .228 .658 .768
BRAND KNOWLEDGE
4 .372 .469 .429 .744
VALUES 5 .280 .479 .489 .499 .736
ORGANIZATION 6 .122 .215 .268 .273 .462 .700
COMPETITIVE STRATEGY
7 .151 .674 .600 .371 .570 .204 .809
♣ Diagonal elements in bold contain Cronbach’s Alpha values; off-diagonal elements are correlations among constructs.
We found that number of employees (t = 4.1562, meanI = 3.47, meanS = 2.46) has
significant difference between the two groups but, in contrary, brand annual
turnover (t = 0.6309, meanI = 3.47, meanS = 3.33) has no significant difference
between two countries.
The strategic dimension of our study reveals that there is no difference
between Italian and Swedish companies. In other words, as it is presented in table
2.4, 85.56 % of Italian and Swedish companies have same consumer orientation
and 38.08 % of the companies in both countries apply the same branding
strategy. Brand differentiation is similar to 51.51 % of the analysed companies.
These results are somewhat intuitive because they reveal that managers in these

- 53 -
two countries apply the same marketing logic that leads to very similar strategy
and consumer orientation in the two countries.
The results of our control variables attract some attention. There is a
significant difference between the two countries regarding size (number of
employees) as Italian companies are mostly medium sized or large players in the
enriched-food market. In contrary, Swedish companies are dominantly small or
medium sized enterprises in this industry that are specialized in a “healthy”
business. Because of this finding, it is not surprising that brand annual turnover,
as a control variable, has no statistical difference. This is the case due to the lack
of specialization and focus on a healthy market segment within Italian
companies.
Factors’ descriptions with items scales and their significances are
presented in table 2.5. (Appendix A). It is straightforward that all analyzed
factors have important statistical significance. Evidences on very high
significance we have found in brand success (χ2 = 33.161, p = .000), consumer
orientation (χ2 = 23.880, p = .000), differentiation (χ2 = 24.598, p = .000), brand
knowledge (χ2 = 116.788, p = .000), organization (χ2 = 17.141, p = .001) and
values (χ2 = 42.881, p = .000). The strategy factor (χ2 = 10.170, p = .038) has
some limited significance.
2.5. Conclusions, future research & limitations
have made a first attempt to determine the underlying
factors of brand success as well as to make the connection
between them. The study makes a conceptual contribution, based on empirical
analysis, in further refinement of the nine constructs that have not been well
We
- 54 -
specified and investigated in marketing literature. In order to achieve such a
comprehensive goal several aims and results have arisen.
The first aim of this study was to develop a concise industry-specific
brand success scale. This scale was developed in an interactive process
combining theory and empirical frameworks from other industries with opinions
and Delphi-studies among marketing managers. The scale developed contributes
as a benchmark for future studies on brand success in food industry.
A second aim was to investigate basic factors that may constitute
successful brand development. Our findings suggest that there are six underlying
factors that are significantly related to the brand success. These factors were
labelled as consumer orientation, differentiation, brand knowledge, values,
organization and competitive strategy. Brand knowledge was strongest correlated
with brand success, indicating the importance of intelligence and knowledge
assessment in a globalized and turbulent environment.
The Wald test has been employed to analyse the difference and
significance between Italian and Swedish companies. The test findings are
consistent with our expectation that there is significant difference among factors
in two countries, namely with brand success, importance in a brand knowledge
sources, company values as well as a brand influence on organization. However,
we also have found that the factors consumer orientation, brand differentiation
and strategy priorities have no statistical significance across the groups. At first
glance, this result can be rather strange and confusing, as it could be expected
that there are significant differences across markets and business practices. We
believe that these results indicate an important message. These three factors are
related to the strategic side of the brand management process, rather than tactical
and operational, and can represent the strategic orientation of the companies.

- 55 -
This finding indicates similar marketing logic, applied marketing strategies and
consumer orientation between Italian and Swedish companies.
Finally, this study has contributed with a multifaceted scale to measure
factors with effect on brand success. In contrast to other measuring scales our
measures take a wider grip and are therefore more applicable in practical
situation as well as useful in research. The influence of the scales from our
Delphi group of managers has also contributed to the usefulness of the scales.
The results of our control variables attract some attention. There is
significant difference between two countries in a number of employees because
Italian companies are mostly medium and large players in the enriched-food
market. In contrary, Swedish companies are mostly SME’s that are focused or
strictly specialized in a “healthy” business, which implied with finding that brand
annual turnover has no significant statistical effect. Such a drastic difference is
the case due to the lack of specialization and focus on a “healthy” market within
Italian companies.
2.5.1. Recommendations for future research
he results from this study have therefore opened a few new doors
for future research. First, the finding that brand knowledge is of the
highest importance for brand success brings new theoretical challenges.
Knowledge needed to develop the brand value is resident in many sources as
suppliers, institutes or just general trend or demographic knowledge.
Alternatively, as Hunt and Derozier (2004) emphasize; the capability of
anticipating and envisioning future trend in the customer needs and wants is
crucial for successful brand management. It is well known where such
T

- 56 -
knowledge can be found, but previous studies have pointed out the problem of
bringing acquired knowledge to use in development processes. These issues have
been addressed in the context of product development, but the transformation of
models to a brand development context and the testing in industry specific
context would contribute to theoretical understanding as well as in offering
important practices for managers.
Second, the enriched-food industry as a context is only one of many
contingencies discussed in the literature (Lawrence and Lorsch, 1967). It is
known that firm internal contingencies as size and degree of decentralization, as
well as external factors as market turbulence or technological turbulence in an
industry has a major impact on factors of importance. A future study with a
model including moderating factors as environmental turbulence or organization
properties will contribute with an enhanced understanding for the correlation
between underlying factors and brand success.
Third, enriched-food industry is characterized by contingencies as, for
example, high industry growth, premium price target segment, and high R&D
intensity. The factors identified as important in our rather homogeneous sample,
might not be of importance with other contingencies.
A forth suggestion for future research is the development of a model(s)
using a two-step multivariate model(s) construction approach applying the
confirmatory factorial analysis suggested by Hair et al. (1998) and Anderson and
Gerbing (1988), in order to determine the causal effects (Singh & Ranchhod,
2004) of these factors on a brand success. This is motivated with a fact that
causality effects of the model can be assessed by structural equation modelling,
but this complex and demanding quantitative approach can be applied only on a

- 57 -
specific theory (Hair et al., 1998). This study is a first step in achieving that
ultimate goal.
2.5.2. Limitations
nfortunately, there is no academic study without limitations, so
that is the case with this one, too. Clear limitation is relatively
small respondent sample, even though it satisfy statistical and research standards.
This is the case due to relatively narrow industry segment of the enriched-food
industry. It will be valuable to expand this research on other food segments, to
replicate this study in other countries and to adjust it for other industries with
attempt to validate current findings and to create more general conclusions on a
brand success and its antecedents. One of the limitations might be the fact that
we employ subjective research approach due to impossibility to obtain objective
financial data. These responds from managers are subject of personal bias and
possible judgmental errors (Singh & Ranchhod, 2004). However, as we argued in
section 3.2., there are substantial evidences in marketing literature that subjective
approach highly correlates with objective approach (Jaworski & Kohli, 1993;
Singh & Ranchhod, 2004).
U
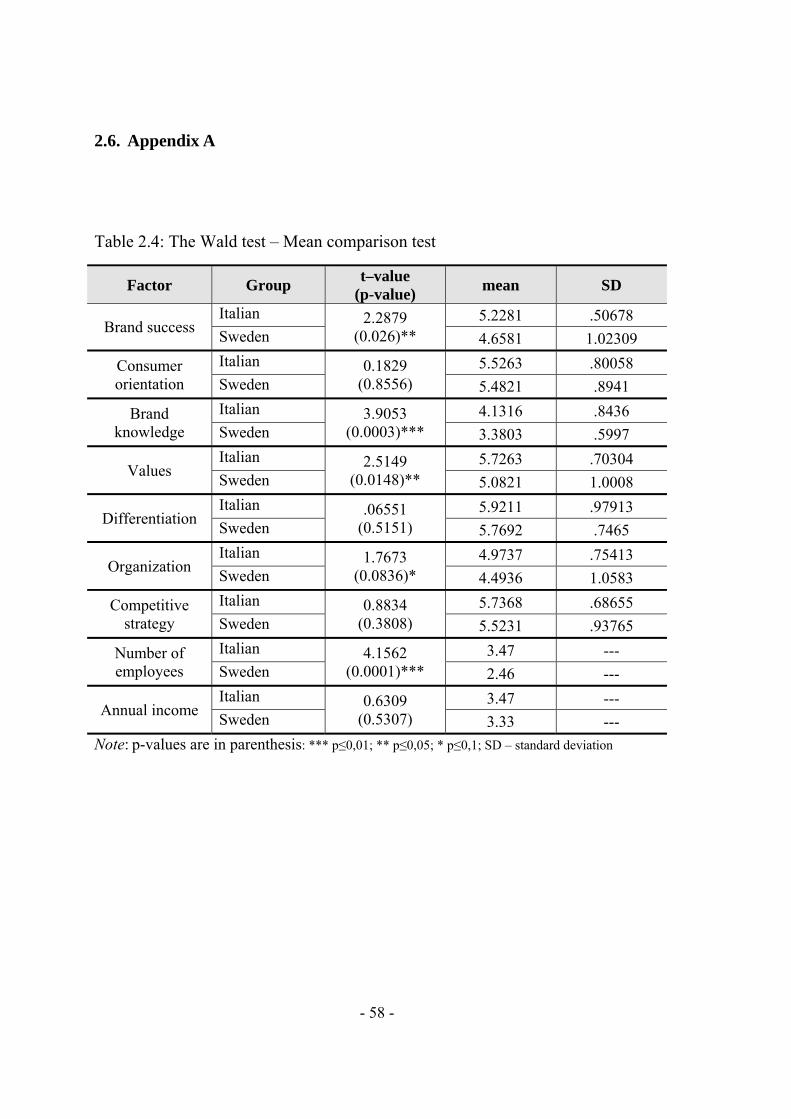
- 58 -
2.6. Appendix A
Table 2.4: The Wald test – Mean comparison test
Factor Group t–value
(p-value) mean SD
Brand success Italian 2.2879
(0.026)** 5.2281 .50678
Sweden 4.6581 1.02309
Consumer orientation
Italian 0.1829 (0.8556)
5.5263 .80058 Sweden 5.4821 .8941
Brand knowledge
Italian 3.9053 (0.0003)***
4.1316 .8436 Sweden 3.3803 .5997
Values Italian 2.5149
(0.0148)** 5.7263 .70304
Sweden 5.0821 1.0008
Differentiation Italian .06551
(0.5151) 5.9211 .97913
Sweden 5.7692 .7465
Organization Italian 1.7673
(0.0836)* 4.9737 .75413
Sweden 4.4936 1.0583
Competitive strategy
Italian 0.8834 (0.3808)
5.7368 .68655 Sweden 5.5231 .93765
Number of employees
Italian 4.1562 (0.0001)***
3.47 --- Sweden 2.46 ---
Annual income Italian 0.6309
(0.5307) 3.47 ---
Sweden 3.33 ---
Note: p-values are in parenthesis: *** p≤0,01; ** p≤0,05; * p≤0,1; SD – standard deviation

- 59 -
Table 2.5: Item scales
Scale Scale items
Cronbach’s Alpha; Friedman’s Chi-square; significance (p value in
parenthesis)
Brand success (Relative to
competitors…)
1. Our brand has achieved a premium price position in the market.
.761
33,161
.000**
2. In relation to our competitors, our brand has contributed to a higher profit margin
3. Our brand performance makes satisfactory market share
4. Our brand has built higher brand loyalty than our competitors
5. Returns on investments are better than for our competitors
6. Our brand value is higher than our direct competitors
Consumer orientation
(We serve consumers’ best interests
delivering the brand that…)
1. Is created according to highest technological standards in industry
.702
23.885
.000**
2. Obtain best organoleptic characteristics of our product without any artificial ingredients
3. In our communication efforts with consumers (advertisement, internet, product package, etc.) we always deliver accurate and consumer-friendly information
4. Is beyond consumers expectations
5. Is seen by consumers as creative and value driven
Brand differentiation
(The most important variables for
successful brand differentiation are…)
1. Consumer's perception of our brand
.768
24.598
.000**
2. Unique product with strong brand personality
3. Consumer's experience with a brand (satisfaction/dissatisfaction, loyalty, etc.)
4. Communication with consumers (advertising, packaging, free phone line, web, etc.)
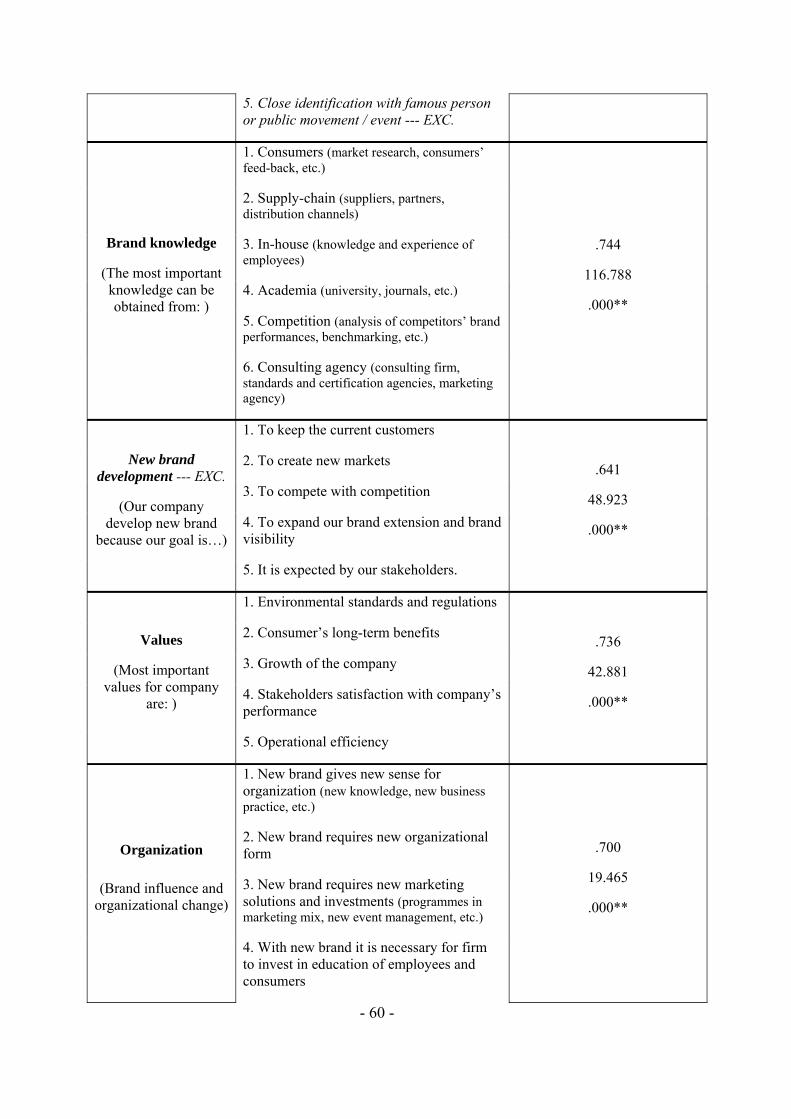
- 60 -
5. Close identification with famous person or public movement / event --- EXC.
Brand knowledge
(The most important knowledge can be obtained from: )
1. Consumers (market research, consumers’ feed-back, etc.)
.744
116.788
.000**
2. Supply-chain (suppliers, partners, distribution channels)
3. In-house (knowledge and experience of employees)
4. Academia (university, journals, etc.)
5. Competition (analysis of competitors’ brand performances, benchmarking, etc.)
6. Consulting agency (consulting firm, standards and certification agencies, marketing agency)
New brand development --- EXC.
(Our company develop new brand
because our goal is…)
1. To keep the current customers
.641
48.923
.000**
2. To create new markets
3. To compete with competition
4. To expand our brand extension and brand visibility
5. It is expected by our stakeholders.
Values
(Most important values for company
are: )
1. Environmental standards and regulations
.736
42.881
.000**
2. Consumer’s long-term benefits
3. Growth of the company
4. Stakeholders satisfaction with company’s performance
5. Operational efficiency
Organization
(Brand influence and organizational change)
1. New brand gives new sense for organization (new knowledge, new business practice, etc.)
.700
19.465
.000**
2. New brand requires new organizational form
3. New brand requires new marketing solutions and investments (programmes in marketing mix, new event management, etc.)
4. With new brand it is necessary for firm to invest in education of employees and consumers

- 61 -
5. It is best to fit new brand within existing organizational forms and business strategies --- EXC.
Consumer perception--- EXC.
(What influence the consumer’s perception
of your brand: )
1. Packaging and brand colours
.614
23.270
.000**
2. Technical quality of product --- EXC.
3. Ethical and environmentally friendly values
4. Name of brand / producer (e.g., consumer’s identification with brand name)
5. Advertisement (Promotional campaign, created message, etc.)
Brand strategy
(The priorities in creating your
competitive strategy are: )
1. Pricing toward competition
.809
10.170
.038*
2. Distribution channels
3. Consumer’s long-term benefits
4. Technical quality of the product
5. Operational efficiency
Note: p-values are in parenthesis, ** significant at 0.01 level, * significant at 0.05 level; EXC – excluded during the composite reliability refinement.

- 62 -

- 63 -
CHAPTER 3
MARKETING MODELLING: DIMENSIONS OF BRAND VALUE

- 64 -
- 65 -
MARKETING MODELLING: DIMENSIONS OF BRAND VALUE
3.1. Introduction
brand equity (BEq) paradigm is recognized as a key business
strategic asset of the company in a modern marketing theory and
practice. Many researchers offered different standings on the variables and
dimensions that influence this paradigm. It has been discussed to a great extent in
marketing literature and many definitions for the brand equity concept have
appeared in last two decades (Farquhar, 1989; Aaker, 1991, Sriram et al., 2007;
Ambler, 2008).
Ambler (2008: 414) has stated that the BEq measuring is the biggest obstacle in
the assessment of marketing performance, because a quest “for a single performance
indicator (the silver metrics) is misguided”; and there is no agreement in academic
community on a general BEq constructs. In this academic area exist a limited
number of quantitative researches that examine brand equity constructs which are
based on solid empirical data (Atilgan et al., 2005), despite numerous conceptual
definitions and models of BEq. In order to investigate in more details this
paradigm, it is necessary to research dimensions and its sources in a specific
industry context. In other words, it is necessary to conduct a study that will test
relationships, among existing branded products, which may have implications for
theory and marketing practice.
This article has the purpose to propose and validate dimensions that
influence the brand equity performance in the enriched-food industry. We
A

- 66 -
describe variables and compute it for various enriched-food brands in the Italian
market.
The following section provides a literature review on existing theoretical
models in marketing literature from which we extract the dimensions for our
brand equity model. Subsequently, we present conceptual framework that relates
proposed dimensions and BEq concept. Then we present research proposition
and a model in which we want to establish the brand equity dimensions. The next
section describes the collected data and provides a description of our data. We
then describe and interpret the results of the study and we conclude with
implications for practitioners as well as with some directions for further research
in the field.
3.2. Literature review
eterogeneity of approaches makes this field rather confusing and
vague. In order to shed light onto the problem of the brand value
paradigm we conduct quantitative analyses in order to estimate relative and
quantitative influence of the brand equity dimensions. These conceptual frontiers
should be understood as relative, and not as absolute categories, i.e. the borders
of these dimensions are porous for different entrants and incumbents. This
section should help us to determine major, but not all, elements that create and/or
influence a brand value based on previous academic findings.
In this section, the major models that are employing the brand equity
dimensions approach in academic literature will be presented. The major
intersection of dimensions and its elements are presented in table 3.1.
Temporal (2002) has suggested key aspects of brand performance that
includes: price, satisfaction, perceived quality, brand personality, brand
H

- 67 -
awareness, market share and distribution coverage. This mix of different
attitudinal, behavioural and market measures of brand equity should be the focus
of the brand management. According to Temporal this mixture represents drivers
of brand value and brand equity. Unfortunately, Temporal’s approach is not
methodologically precise, it is very widely defined and the influences of the BEq
drivers are not depicted.
Ailawadi et al. (2003) have suggested, in their study on the revenue
premium brand equity model, in the theoretical basis, that equity is influenced by
sales, created by the marketing mix company and competitors brand. They state
some strategic implications (2003: 3) “equity is created (…) by the firm’s
previously existing strength from its corporate image, product line, R&D, and
other capabilities”. Unfortunately, authors have not paid more attention on
dimensions that constitutes brand equity, and therefore we have limited
knowledge on their view on different marketing and strategic issues, rather they
focused in discussing the measurements of BEq. The measurements that are
based on price/revenue premia are intuitively appealing but they can result in
biased estimates of BEq, because premia approach captures only one dimension
of brand equity and neglects the brand equities ability to reduce the marketing
costs of existing and/or future brands (Simon and Sullivan, 1993). Raggio and
Leone (2007) have disagreed with revenue premium concept and suggested that
there might be a potential outcome for pioneering brands that establish a new
brand category. Revenue premium approach cannot be widely accepted as
theoretical framework, because of vague identification of the benchmark brand,
i.e., identification of the brand without equity. The limitation of this approach lies
in fact that it expresses only financial sides of the brand equity paradigm without
any depiction of marketing strategy.

- 68 -
Keller (1993) has a different goal and approach in analysing BEq. He
defined and proposed ways how to develop and measure customer-based BEq
which is based on the individual consumer preferences. He suggested a
conceptual model of brand equity, defined as (Keller, 1993: 2) “the differential
effect of brand knowledge on consumer response to the marketing of the brand”.
Brand knowledge is consisted of brand awareness (brand recall and recognition
performance) and brand image (associations that consumer has towards brand).
He argued that customer-based BEq approach can be enhanced if a company
creates (Keller, 1993: 9) “favourable response to pricing, distribution,
advertising, and promotion activity for the brand” as well as with licensing,
because it can influence positive brand image. Customer-based equity occurs
when a consumer is already familiar with the brand and already has some
favourability and/or strong and unique brand associations (Keller, 1993).
Aaker (1991) has defined five categories of assets that are basis of brand
equity: brand loyalty, name awareness, perceived quality, brand associations,
other proprietary brand assets such as patents, distributional channels and
trademarks. The Aaker’s BEq model implies that brand equity creates values for
both the company and the consumer (Aaker, 1991; Aaker et al., 2004). The brand
loyalty of the consumers reduce the vulnerability to competition action, raise
greater trade leverage, keep existing and attract new consumers, etc. Brand
awareness sustains familiarity with the brand, it is a signal of company business
commitment, etc. Often customers have no prior knowledge on product quality,
and perceived quality may directly influence purchase decision, especially when
a buyer has no possibility to conduct detailed analysis (Aaker, 1991).

- 69 -
Table 3.1: Comparing the dimensions of brand equity with existing models
Type of the model
Exemplars Marketing investment (service expenses
for advertising, licenses, etc.) revenue price perceived quality brand ownership
Temporal’s dimensions
of BEq
Temporal (2002)
Yes (brand attitude, is a product of brand
communications) No Yes Yes No
Revenue premium
model
Ailawadi, Lehmann
and Neslin (2003)
Yes Yes Yes No No
Aaker’s BEq model
Aaker (1991)
Yes No No Yes Yes
(proxy for the brand awareness)
Keller’s BEq model
Keller (1993) Yes
Yes (indirectly in the
favourable consumption
response context)
Yes No No
Marketing mix elements
and BEq
Yoo, Donthu, Lee
(2000) Yes No Yes Yes
Yes (as a signal of
quality, proxy for the brand
awareness)
Dimensions of BEq
current study Yes Yes Yes Yes Yes

- 70 -
The brand name is often based on specific and distinct associations linked to it or
its values. The fifth category represents proprietary brands assets such as
trademarks, patents, distribution channels, etc. (Aaker, 1991).
Yoo et al. (2000) have investigated the relationships between selected
marketing mix elements and the creation of brand equity. They proposed the
model, which is an extension of the Aaker’s (1991) model, extended applying
assumption that there are significant effects on the dimensions of brand equity
(Yoo et al., 2000). In their study, they focus on a few key elements, particularly
on price, storage image, distribution, advertising expenditures and price
promotions or deals from the elements of marketing mix.
3.3. Conceptual framework
hen consumer – brand encounter occurs a consumer has the
knowledge of a brand name, logo, packaging of the consumed
product or use of the product. As it is advocated by Raggio and Leone (2007)
these situations provide consumers moments of truth that automatically generate
perceptions and associations about the brand. Therefore, it is not possible for a
brand to have no brand equity (Raggio and Leone, 2007).
The lack of consensus and generally accepted framework that supports
brand equity construct has been presented in the numerous measures and
theoretical approaches, despite years of debate and research. The academic
debate is still intensive over the pales, essence and measures of brand equity.
For instance, a consensus has not appeared on whether brand equity refers
to the value of a brand name or the value of a brand that is marked with a brand
name (Park et al., 2008). The same problem appears with creation of the
appropriate theoretical and measurement approach due to numerous researches
W

- 71 -
that defined different, sometimes even opposite approaches: customer-based,
product market-based, financial marketplace-based, etc4.
The brand equity construct is dependent on various dimensions of the
brand equity, which directly influence a market performance of the brand. Yoo et
al. (2000) have proposed the conceptual framework, which is an extension of the
Aaker's (1991) model, which partially has some elements that are applied in this
model. They extended the Aaker model in two ways. First, they placed the brand
equity construct between the dimensions of brand equity and the value for the
customer and company. Second, they added antecedents of brand equity –
marketing activities – with assumption of significant effects on the dimensions of
brand equity (Yoo et al., 2000).
This study is based on a view that states that brand concept is meaningless
if the brand has no meaning to a consumer (Keller, 1993; Erdem et al., 1999). It
starts employing the fact that we observe the results of the brand at the market.
We do not, and our intention is not to observe and study purely the qualitative
side of this problem, but to try enhancing academic discussions from the
manufacturer’s side and to make solid framework for future studies in this area.
Even though we employ manufacturer’s side, we also observe consumer side in
indirect way analysing consumer consumption using the AC Nielsen data (AC
Nielsen, 2008). Our approach is based on conducting a quantitative study and
adding a qualitative meaning to our research.
Brand equity is a multidimensional construct (Aaker, 1991) and each
measure on it can have different dimensions (Ailawadi et al., 2003). Our first
stepping-stone is based on the approach that the brand equity measurement is
4 For further reading on this issue: Keller 1993, Ailawadi et al. 2003, Yoo et al. 2000

- 72 -
taken upon the customer evaluation of the brand name (Aaker, 1991) which is
measured by customer preferences, attitudes or intent to purchase. We partially
modify this approach studying and proposing quantitative brand equity
framework rather than solely qualitative approach. We observe purchases that
had been made by the consumer, e.g., consumer consumption among existing
brands at the market with well-known brand name and product characteristics to
a consumer (AC Nielsen, 2008). In our analysis we will apply a deductive
approach with assumption that consumers have certain attitudes, level of loyalty,
brand awareness, preferences, because they have the prior knowledge on the
brand and are able to make consumer choices among different varieties of well-
known (existing) brands. Broniarczyk & Gershoff (2003) underlined that brand
knowledge represents set of associations in the consumers mind regarding the
brand features, benefits, uses, overall attitude – similarly as Aaker (1991) and
Keller (1993) – and stated that this knowledge on brand is (2003: 163) “a result
of prior brand marketing activities and investments in advertising and
promotion”.
Our second stepping-stone is based on the study of Simon and Sullivan
(1993) and their view of financial measurements significance as well as on
importance of promotional efforts, such as advertising expenditures, patents,
sales force and marketing research expenditures. They apply methodology on the
brand equity estimation that has the three important features (p. 29): (i) brand
equity is treated as an asset of the company, (ii) brand equity is measured in a
forward-looking way, nevertheless, we do not study only public companies and
this feature is a limitation for non-public and SME companies, (iii) the value of a
company’s brand changes as new information becomes available in the market.
This information might be new brand investments, promotional activities, new
advertising campaign, etc. This methodology uses objective market-based

- 73 -
measures (Simon & Sullivan, 1993), which allows comparison during the time as
well as across companies and industries. They also suggested that this technique
implicitly incorporates the effect of market size and growth as well as the
revenue-enhancing and the cost-reducing capabilities of the brand equity (Simon
and Sullivan, 1993: 30). They have justified their approach presenting examples
of the public companies and investigated the market value of the firm’s
securities. In their study, they researched BEq problem on the Coca-Cola and
Pepsi brands. Unfortunately, this approach is not applicable to the non-public
companies or the small and medium enterprises. Using their methodological
approach as a valuable starting point, we modify it in extent that the BEq is not
influenced only by financial or limited marketing actions (such as advertising
campaigns) but with a comprehensive list of financial, strategic and marketing
activities.
Study of the brand equity dimensions linkage is the focus of this research.
As a rare study of this kind, this article provides a solid starting point for further
research on the linkage between various dimensions with the brand equity
concept.
Further discussion on the brand equity dimensions will be conducted in
the following section.
3.4. Research problem
he main objective of this study is to investigate the relationships
between the brand equity dimensions and brand value, measured by
brand equity (BEq). It is possible to generate brand value, by strengthening the
dimensions of brand equity (Yoo et al., 2000). Numerous researchers (Ailawadi
et al., 2003; Aaker, 1991; Temporal, 2002; Keller, 1993; Yoo et al., 2000) created
T

- 74 -
different brand equity constructs. Despite decades of academic debate, there is no
consensus over the boundaries and measures of brand equity (Park et al., 2008).
Strategic implication of brand equity is under estimated in academic literature.
There are a very few researches that directly or indirectly tackles this issue. For
instance, Keller (1993: 18) has suggested that “effective strategies for integrating
marketing communications in terms of advertising, promotion, publicity, direct
marketing, and package design are especially needed.”.
With every purchase, the buyer has the moment of truth with its own
expectations and observations within the brand. Marketing investments (MI) in
the brand, measured by service expenditures related to the advertising,
promotional activities, patents, licenses, etc., might have a long-term affect on
sales and value of the product. As suggested by Simon and Sullivan (1993)
lagged advertising expenditures will generate returns in subsequent periods as
well as it may enhance brand value. Surri et al. (2002) have shown that boundary
condition for consumer assessment of higher brand value is case when the brand
promotion is based on a high price.
Price (PR) represents the amount of money that consumers have to pay to
obtain the product. More broad definitions depict price as “the sum of all the
values that consumers exchange for the benefits of having or using the product or
service” (Kotler & Armstrong, 1999: 302). Surri et al. (2002) have shown that a
higher brand value is associated with higher prices if those prices are associated
with higher quality.
Revenues (REV) represent the unit volume sold at certain price. In our
model we use the gross revenue variable, instead of the adjusted revenue variable
(Ailawadi et al., 2003), because we do not have reliable data for the variable
costs at the firm’s level due to the proprietary characteristics of the data.
Ailawadi et al. (2003) have suggested that gross revenue might be a more

- 75 -
appropriate measure because it depicts in a more comprehensive way, general
consumer demand rather than the company’s production costs.
Modern food industry is based on sophisticated technological applications
that allow consumers to consume high quality products in long periods of time
and under different consuming conditions. Technological aspect of the
consumption in the juice industry is especially important because producers can
create different brand groups as well as to apply a wide variety of technological
applications, such as: juice drinks, nectars, 100% juices; or production
technologies, such as: conventional, organic and functional juices. A great array
of brands in dairy industry is based on added value, such as beneficial bacteria,
organic based production, etc. Perceived quality (mop) can be understood as a
consumer’s subjective judgment about a product’s excellence (Zeithaml, 1988).
Subjective judgment of quality is based on personal product experience, unique
needs and consumption situations (Yoo et al., 2000). Farquhar (1989: 27) has
advocated that “quality is the cornerstone of a strong brand” which leads to
higher brand equity. In order to achieve a positive evaluation by consumer, a
company must create a brand that delivers “superior performance to the
consumer” (Farquhar, 1989: 27).
We have used brand ownership (bo) as a control variable. We control for
the difference between the Italian and foreign food producers.
We have included all brand value performance variables in creating a
model of estimation (e.g., Shepherd, 1972):
(3.1.) BEq = f (MI, PR, REV, mop, bo)
- 76 -
This thought leads us to the following proposition:
P1: The brand equity paradigm is driven by a variety of dimensions, of
which service expenses in the brand, prices, revenues, perceived quality and
brand ownership are most prominent.
3.5. The model
it is clearly noted from previous discussions, the BEq
paradigm is defined in different ways, usually depending on
the researchers approach to the problem and research goals. The aim of this
article is to establish which dimensions influence BEq performance in the
researched industry and in which way, in order to help the development of more
effective business strategies.
The primary advantage of this approach is to allow decision makers in the
organizations to improve the value and competitive advantage of their brands.
Though the major goal of any branding programme is to enhance the value of the
brand, the second advantage might be a possible better understanding of the role
of specific brand value dimensions, which depend on different brand strategies
created by organizations.
In table 3.2. (Appendix B), we have presented dependent, independent and
quality independent variables. Our dependent variable is brand equity that
represents an asset that is constituted by research costs, patents, advertising
efforts, licenses, etc. We derive this variable from accounting position B. I.,
intangible assets, in the companies’ balance sheets (AIDA, 2008). In order to set
down this phenomenon on a brand level, we have calculated the single brand
share in a company brand portfolio. In this way, we allocated brand equity, from
company level, to a specific (single) brand. Independent variable marketing
As
- 77 -
investments represent service expenses that are intended to increase the quality
and the reputation of the product. Due to the fact that we observe this variable
from the position of the brand paradigm, we can understand that the firm makes
this investment to improve the characteristics of the specific brand. We observe
the value of this variable from accounting position b7- services, in the company’s
income statement (AIDA, 2008). Similarly to the brand equity share, we used
that procedure to allocate marketing investments on single brand. Price
represents the average brand price per kilogram, which is obtained in observed
period. Due to the possible presence of endogeneity issues between revenues and
prices, we have calculated variable revenue as the brand revenue share in the
company brand portfolio.
Brand ownership is a quality independent variable that represents brand
owners according to the qualitative values: 1 for Italian food producers and 0 for
other offerer in the Italian market. Perceived quality represents a type of the
brand according to the mode of production, e.g., applied technology in the
production of the brand. Value 1 represents conventional brands with added
value, value 2 represents organic brands, and functional brands are marked with
3. In order to extract an information about the applied technology behaviour, we
will use dummy variables that will estimate relationships of the organic and
functional brands in comparison with conventional brands. Using the AC Nielsen
data (AC Nielsen, 2008), we can assume that consumers are well informed about
existing brands in the market and have certain attachment to brands.
The research instrument has been created in order to provide estimation of
the brand equity dimensions, using the above presented theoretical framework.
This approach is presented in the formal econometric fashion with the model 1.
These estimations have been obtained by the Stata™ 10 SE statistical
software.

- 78 -
3.5.1. Brand equity estimations
estimate the relationship of the brand dimensions with the
brand value, as measured by brand equity. Our model,
namely BM1, is estimated through standard ordinary least squares (OLS). We
report R-Squared and adjusted R-Squared values to provide goodness-of-fit
indicators of the regression. In order to face for some eventual heteroskedasticity
problems we compute robust standard errors.
Our basic model at the aggregate level (BM1) is
(3.2.) Ybrand equityb = c + δ1 dummy brand ownershipb + δ2 dummy perceived
quality – organicb + δ3 dummy perceived quality – functionalb + β1marketing investmentb + β2priceb + β3revenuesb + ub
where b=1,…,B (brands). In the BM1, the β and δ are the parameters that will be
estimated and we assume that the variance of the error term u, conditional on
regressors, is constant. The β coefficients measure the marginal effects of the
presented independent variables on brand equity. Similarly, the δ coefficients
measure the marginal effects of the presented quality independent variables on
brand equity.
3.6. Data collection
have used several data sources in this study. As our primary
source, we use a market-based data from AC Nielsen
research on food buying patterns of 10.282 Italian households, which were
collected in the period June 2005 – June 2007. The data is obtained from
ACNielsen Italy using the Consumer Panel Solutions (CPS) as well as
Homescan® panel tool (ACNielsen, 2008).
We
We

- 79 -
We supplement this data with information and variable constructs (see for
details table 3.2) using the data from the Bureau Van Dijk Electronic Publishing
AIDA financial statements database (AIDA, 2008) on 940.000 Italian companies.
We have expanded our framework with quality independent variables that have
been defined and created as a combination of existing empirical data and
observed quality characteristics.
We use brands, rather than individuals, as units of observations in this
study, which is in line with approach that aggregates consumer behaviour to
produce results for the branding paradigm (Chaudhuri & Holbrook, 2001).
Chaudhuri and Holbrook (2001) suggested that this approach avoid the pitfalls in
experimental manipulations, examining a very few cases across consumers, and
gives greater managerial significance to practitioners, because of the decision
effects on individual brands.
This study is based on “enriched-food” brands. We have, from mode of
production point of view, conventional food with added value, such as vitamins
for instance, functional as well as organic food brands in our sample. This
approach might be embedded into a broader category of healthy products, such
as dietary, organic, functional, integrative, etc., in which each of these specific
sub-groups have been characterized by a specific functional ingredient or trait
(Boesso et al., 2009a).
The data provided from AC Nielsen database were created as a panel data
set. In our empirical application, we consider the marginal mean across time, in
order to take into account time variability.
(3.3.)

- 80 -
, where T indicates 24 monthly observations starting from June 2005 to June
2007.
Aggregating in this way, we have obtained a sample of 91 brands in the
enriched-juice industry, 361 brands in yogurt brand sample, 312 in milk brand
sample, which in total represents 764 brands of the enriched-food brand sample.
Descriptive statistics of the independent variables used with enriched-food
brand sample is presented in table 3.3. All independent variables are presented
with their names, mean value, standard deviation as well as with minimum /
maximum values. Correlation analysis, presented in table 3.4., reveals no major
correlation among estimated variables.
3.7. Results and interpretation
order to assess information on brand value, we regress brand
equity on marketing investments (service expenses) in brand,
price, revenues, perceived quality and brand ownership. Our benchmark model
M1, in formal econometric model is described in equation (3.2.), in section 3.5.
The results of these estimations are reported in table 3.5.
The main question of our analysis is which, if any, of the brand equity
dimensions explain the brand value. The BM1 results in table 3.5. are represented
by three models. The model 1 represents enriched-juice sample (N=91); the
model 2 represents enriched-yogurt sample (N=361); in the model 3 are
represented enriched-milk brands (N=312), the model 4 represents the whole
enriched-food brand industry sample (N=764). The M1 results reports that
variables – marketing investment in brand and revenues – have significant
statistical effect on brand value. Other variables have negligible statistical effects.
In

- 81 -
Table 3.5: Estimations of variables in the model 1, 2, 3 and 4
Variables
Model 1 (juice)
Model 2 (yogurt)
Model 3 (milk)
Model 4 (EFI)
marketing investment
0.34218***
(12.73)
6.6107*** (5.40)
0.2949*** (9.55)
1.377*** (14.27)
price 22339 (0.64)
294556 (0.80)
177353** (1.95)
1095929*** (3.42)
revenues -3283748*** (2.62)
-1950000*** (4.23)
-2534435** (2.33)
-7830299** (2.01)
dummy brand ownership
-0.5493 (0.79)
0.8801*** (8.16)
-0.1325*** (2.93)
0.2747** (2.02)
dummy perceived quality – organic
-0.2345 (0.08)
0.1915** (2.02)
-0.891* (1.62)
-0.2585* (1.74)
dummy perceived quality – functional
0.3686 (0.17)
0.2789 (1.18)
-0.783 (1.72)
-0.4527*** (2.90)
R2 0.6695 0.1815 0.3385 0.2377 adjusted R2 0.6501 0.1676 0.3277 0.2317 Prob > F 0.0000 0.0000 0.0000 0.0000 N 91 361 312 764
*** significant at 1% (p < .01); ** significant at 5% (p < .05); *significant at 10% (p < .1); Notes: t-statistics appear in parenthesis
The M2 results reports that variables – marketing investment, revenues, brand
ownership and perceived quality (organic) – have significant statistical effect on
brand value. Variables price and perceived quality (functional) have no statistical
effects. The model M3 reveals that marketing investment, price, revenues, brand
ownership and perceived quality (organic) have high significant effect on brand
value. The model M4 represents whole enriched-food industry and results reports
that all variables are statistically significant, only the perceived quality (organic)
dummy variable has limited statistical effect.

- 82 -
The goodness – of – fit test for the M1 shows that adjusted R-Squared
value is 0.6501, and R-Squared value is 0.6695; for the M2 shows that adjusted
R-Squared value is 0.1676, and R-Squared value is 0.1815; for the M3 shows that
adjusted R-Squared value is 0.3277, and R-Squared value is 0.3385; the overall
enriched-food industry, presented by M4, has adjusted R-Squared value of
0.2317, and R-Squared value is 0.2377.
All analyzed estimations have been presented in synthesized fashion with
relation to the research proposition P1, presented in section 3.4., in table 3.5.;
applying different food samples.
3.8. Discussion
he extensive literature review, presented in table 3.1., has strongly
suggested that marketing investment in brand (or, service expenses
for advertising, licenses, etc.), price, revenues, brand ownership (as a signal of
quality and brand awareness) and perceived quality have been a key success
dimensions in developing the brand value. In general, our brand model (BM1)
strongly supports this viewpoint, only the perceived quality (organic) dummy
variable has limited statistical effects.
The theory has high level of concord that marketing investment in brand is
pivotal dimension of brand value enhancement. Our results strongly support this
view. As we have presented with the model BM1, operationalised with M1, M2,
M3 and M4, marketing investment has high statistical significance in all three
presented models.
Revenue, as the potential variable that creates brand value, was identified
by Ailawadi et al. (2003) and by Keller (1993), who suggested it indirectly in the
T

- 83 -
favourable consumption response context. Our data does support this approach,
because there is evidence of statistical significance in all models.
Theory is unison in suggesting that price is an important variable in
creation of the brand value. Our models strongly support this view, because this
variable is statistically significant in models M3 and M4. Importance and
qualitative variability of the price for the management studies is doubtless, but it
is beyond our research approach to go into construct details in this study, because
we observe and analyze this issue as an aggregate variable across the brand
paradigm.
We have found out that perceived quality is statistically significant
variable in models. In the literature, this standing point was suggested by Aaker
(1991), Temporal (2002) and Yoo et al. (2000). Zeithaml (1988) has identified
perceived quality as a component of brand value and concluded that high-
perceived quality would lead consumers to buy the brand. If the degree of the
brand quality perceived by consumer is higher, it will increase the brand equity
(Yoo et al., 2000).
Researchers have not paid a lot of attention on the relevance of the brand
ownership and its implications on brand value. In the literature, this variable was
used as a proxy for the brand awareness (Aaker, 1991; Yoo et al., 2000), as a
certain signal of the brand quality “guaranteed” with the fact that the brand is
manufactured by a (well) known producer. We have found that brand ownership
has limited relevance in constructed models, because it is not significant in juice
segment.

- 84 -
3.9. Conclusion
his study presents the results of empirical analysis to determine the
dimensions of brand equity. We have controlled for six predictors
(i.e., marketing investments, price, revenues, perceived quality [organic and
functional] and brand ownership) while estimating the impact of the brand equity
dimensions on brand value. In order to enlighten this approach we have
formulated model and have estimated it using standard and robust OLS
procedure. From the standard OLS procedure, we have reported adjusted R-
Squared value, while from robust OLS procedure we have reported R-Squared
value. The model has been constructed to determine the dimensions of brand
value in brand strategy. In general, our estimated results on the variables that
have impact on brand value are in line with what has been reported in the
literature.
It is conventional wisdom that the firm has to invest in the brand. We have
presented different layers of the brand paradigm and have shown possible outputs
for the managers and how their actions in managing the brand might influence
business strategy.
It is unlikely, if not impossible, for the single model of brand equity to
satisfy all expectations of a general, or widely applicable business model, for
managers or researchers. We believe that our model contributes to the theory and
practice suggesting which business dimensions create a brand value and what
type of brand strategy a firm can apply in order to create a brand value. In
practice, there are many different business focuses and applications in the brand
management. We have presented what managers can expect in the enriched-food
industry if their marketing focus is on brand value. We believe that managers can
T

- 85 -
use this approach as a guide but not as a general prescription for the creation of
brand strategy, due to the objective limitations of the study.
3.9.1. Limitations of the study
clear limitation is the fact that we have only studied one industry
(food), one industry segment (enriched-food) and one country
(Italy). Limitation from the point of the strategic decision-making is something
that we cannot distinguish among a wide variety of technological issues, such as
value-added characteristics, mode of production, possible target market, etc. Our
approach and data has allowed us to observe only indirectly the consumer
attitudes and choices, excluding cognitive or behavioural aspects of the market.
3.9.2. Suggestions for further research
would be valuable to expand this model on a wider sector (e.g.
conventional food industry) in order to obtain data that are more
comprehensive. Otherwise, there might be limited knowledge on brand equity
phenomenon and its constructs.
This approach would be more appealing if it would be possible to show
that price, as an important construct of BEq, can achieve price premia. There are
two possible approaches. The first one is related to the special products, as our
sample is, where variability of data, as well as some variables in the model, are
low, and studying qualitative differences (price, technology application, etc.) is a
demanding task. The second approach might be related to the application of this
model with more comprehensive data, which (in case of juice or food industry)
would include a wide range of the brands in the market (not only “special” ones,
A
It

- 86 -
but also conventional, “ordinary” ones which we can reach, as consumers, more
often) as well as a detailed study of distribution channels.
Valuable extension of this approach would be the study of the distribution
channels importance and how the BEq paradigm would fit into the different
distribution channels. Due to the fact that we study “special” products, it would
be important to study creation and change of BEq through the distribution
channels.
Logical continuation of this approach, certain (necessary) enhancement,
must be a deeper study of the researched industry from the consumer point of
view. That research should prove theoretical frameworks suggested by Aaker
(1991) and Keller (1993) as well as to depict qualitative side of the research
problem. There are few open questions, tackled by Aaker (1991), that do not have
adequate responses in academic literature, neither in this model, such as
switching cost, trade leverage, market share possibilities, etc. In other words, that
future research should enlighten the problem of consumer response and market
performance in our model.

- 87 -
3.10. Appendix B
Table 3.2: Variables of the Brand Equity Dimensions Model
Variable
Name
Value Description
Resource
Brand equity BEq NL
BEq value represents asset that is constituted by research costs, patents,
advertising efforts, licenses, etc. (position B. I – intangible assets in the company Balance sheets ) allocated on a brand
CFS
Marketing investments in
brand MI NL
service expenses are intended to increase the quality and the reputation of the brand
(position b7- services, in the company income statement) allocated on a brand
CFS
Price PR NL price represents paid amount of money for
a product by consumers
Nielsen
Revenue share REV NL
revenue share represents share of brand revenue in sample
AR
Perceived quality
mop 1,2,3
perceived quality represents a type of the brand according to the mode of
production, 1 – conventional with added value, 2 – organic and 3 - functional
QIV (Nielsen)
Brand ownership
bo 0, 1
brand ownership represent difference among brands owned by Italian food producers (=1) and brands owned by
international producers that have branches in Italy (=0)
QIV (Nielsen)
Legend: AR – Author’s research, CFS – Company financial statements (balance sheet data and/or income statement), Nielsen – data from the AC Nielsen research, QIV – Quality independent variable; NL – not limited

- 88 -
Table 3.3: Descriptive statistics
Variables Descriptive statistics
mean standard deviation
min values max values
brand equity 2.470.000 18.400.000 488.833 268.000.000
marketing investment
2.650.000 6.750.000 2575.488 85.600.000
revenues 0,088 0,169 0,001 1
price 3,952 1,985 0,202 11,91
dummy perceived quality - conventional
0,394 0,489 0 1
dummy perceived quality - organic
0,298 0,458 0 1
dummy perceived quality - functional
0,308 0,462 0 1
brand ownership 0,724 0,447 0 1
Table 3.4 – Correlation values
1 2 3 4 5 6 7
Brand equity 1 1
marketing investment 2 0.4433 1
price 3 0.0914 -0.1428 1
revenues 4 0.089 0.4109 -0.2154 1
dummy2 - organic 5 -0.0777 -0.1615 0.0272 -0.0442 1
dummy3 – functional 6 -0.0324 0.2078 -0.342 0.2441 -0.4347 1
brand ownership 7 0.0135 -0.0268 -0.1091 0.059 0.1853 0.0945 1

- 89 -
CHAPTER 4
BRAND DIFFERENTIATION: A DRIVER OF THE BRAND PERFORMANCE OUTPUTS

- 90 -

- 91 -
BRAND DIFFERENTIATION: A DRIVER OF THE BRAND PERFORMANCE OUTPUTS
4.1. Introduction
ach organization has several marketing performance measures that
describe success of a firm. Market share and price premium –
maybe ROI and ROA – are most often used to depict a firm position in a market
as well as indicators of competing competences and future performances.
Pricing strategies and tactics form an important role in the firm’s
marketing strategy (Kotler & Armstrong, 1999). However, brand managers have
no guidelines how to choose the appropriate pricing strategy to target specific
consumer characteristics as well as different organizational goals. Pricing has
received some attention in academic community but application of this type of
research to practice has not been developed as some other marketing phenomena
(Duke, 1994; Christopher, 2000). Sousa and Bradley (2009) have pointed out that
pricing decisions are very often based on intuition and working experience of
managers (Samiee, 1987; Cavusgil, 1996), because scholars have not researched
deeper the pricing problem (Myers et al., 1996). In other words, as it has been
pointed out by Christopher (2000), there is considerable controversy in the
literature how the pricing decision should be made by organization. Another
E

- 92 -
valuable brand performance output is brand (market) share. There are evidences
that market share may enhance the firm profitability (Shepherd, 1972; Gale,
1972) and, from marketing point of view, signals higher value for a consumer
(O’Regan, 2002) that improves brand portfolio status.
There is no clear answer on the problem how brand paradigm influence
the company’s competitive strategy in brand performance context. The aim of
this research is to highlight how brand management paradigm interacts with
marketing phenomena, such as price and market share, in order to develop more
effective business strategies.
This study has the two purposes. The first is to study the elements of the
brand paradigm in price and market share differentiation framework. Second, to
analyze the influence of innovation on proposed brand performance framework.
We describe variables and estimate them for various food brands in the Italian
market.
The contribution of this paper to the existing literature is threefold. First,
we investigate the drivers of the brand performance outputs, price premium and
market share, in the enriched-food industry. Second, we present a model that
empirically tests the influence of brand value, brand volume, marketing
investment in brand, price and different innovation applications on price and
brand share. The literature urge for overall and empirically based solutions on
relationships among brand price, brand value and applied innovation (Duke,
1994; Christopher, 2000; Sousa & Bradley, 2009). Third, we analyze the
consequences of brand differentiation, based on applied innovation, on price
concept and market share. To the best of our knowledge, a framework that
investigates the link between brand performance outputs and brand

- 93 -
differentiation that is based on applied innovation in enriched-food industry has
not yet been reported in the literature.
The following section provides a literature review on marketing
performance outputs, section three review existing theoretical framework in
marketing literature from which we extract the background for our brand share
and pricing model. Subsequently, we present research hypotheses and a two-stage
model in which we want to establish (i) brand share and pricing estimations and
(ii) differences in business strategy based on technology and company types
using cluster analysis. The next section describes the collected data. We then
describe and interpret the results of the study and we conclude with implications
for practitioners.
4.2. Marketing performance outputs – price premium and brand (market)
share
mbler et al. (2002: pp. 16) have argued that price premium and
market share are outcomes of the brand performance in the market
because they represent “the aggregate of individual customer actions regarding
their amount of purchase and the price that they pay”.
Price represents the amount of money that consumers have to pay to
obtain the product. A broader definition depicts price as the total of all the values
that consumers exchange for the benefits of possessing or using a product (Kotler
and Armstrong, 1999). In the study on appropriate pricing strategy, Duke (1994)
has suggested that sales may influence price strategy, because firms tend to
enhance profitability and success by raising sales of volume products. Alpert et
A

- 94 -
al. (1993) have suggested that a premium pricing strategy might be successful if
higher price, as signal of quality, is accompanied with some other premium-
quality signals, such as advertising, packaging, etc. In other words, advertising as
a main component of the brand equity, may influence the pricing strategy. There
are evidences in the literature (Suri et al., 2002) that boundary condition in
obtaining price premium is the role of promotion in the process of the consumer
overall assessment of higher brand quality, because higher prices suggest higher
quality.
The pricing controversy is based on the importance of the role that costs
play in setting the price (Christopher, 2000). The price is determinate according
to different inputs such as the costs associated with marketing efforts, added
mark-up that represents wished profitability and production process. The cost-
based approach has many flows (Christopher, 2000): (i) it is difficult to identify
true cost of a single product or a brand in practice, (ii) this approach ignores
demand side. In its essence, a consumer wants to acquire certain benefits from a
brand and it is ready to pay a certain price for it. In other words, the price
decision should be made upon the values that brand bears for a consumer. The
costs become irrelevant for the pricing decision because they can influence only
profitability. Christopher (2000: 151) has concluded: “costs determine profits,
not price”.
The pricing decision is crucial issue in the business decision process. The
impact of the pricing will be reflected in the quantity of the product sold, the
contribution to profits (Christopher, 2000) as well as on the strategic position of
the single product and/or brand in the market. Pricing always has multi-decision
consequences. The price decision taken on one brand will have implications on
another brand (Christopher, 2000) within same strategic domain in a multi-brand

- 95 -
organization. The same happens in the marketplace where competing brands are
interconnected like water tanks. The change in one tank immediately influences
another one – if one organization low/raise prices, introduces new enhancements
or advertising campaign – it will affect also confronting brands.
Market share is considered in management literature as one of the most
important indicators of a firm success (O’Regan, 2002). It has been argued in the
literature that many firms see market share as an important organizational and
strategic goal (O’Regan, 2002), because it influences the organizational goals and
strategic decision-making. The importance of higher market share, by the
neoclassical theory, lies in fact that yields the firm higher profitability (Shepherd,
1972; Gale, 1972). In general terms, larger market share is a reward for providing
a better value for consumers (O’Regan, 2002), and this relation has been
recognized by literature and practitioners, too. Kay (1993) has argued that market
share causes profitability and brand success, instead of being result of them.
4.3. Literature review
odern approach to branding includes a comprehensive list of
elements that overlap traditional understanding of brand as
feature differentiated by name, colour, or any other visible characteristics but also
include intangibles such as brand value or consumer subjectivism. Modern brand
paradigm is based on consumer attitudes, loyalty, perception, etc., as well as on
organization’s marketing investments in a brand. Key elements of a larger brand
paradigm, from strategic point of view, are differentiation and pricing.
Brand equity is defined as the value of the brand that is based on the high
brand loyalty, perceived quality, name awareness, strong brand associations as
M

- 96 -
well as the assets such as trademarks, patents, advertising, distribution channels
(Kotler, 1999; Kotler & Armstrong, 1999; Aaker, 1991) and innovation type.
The literature suggests (e.g. Ambler et al., 2002) that a firm’s brand
success is associated with a strong brand, i.e. to its ability to achieve a premium
price. “Strong – success” correlation arise because of a customer perception that
a brand reduce the risk associated with consumption (Ambler et al., 2002) as well
as the loyalty switching cost, which appears because of higher level of
relationships and networking between a firm and consumer. In order to gain the
lucrative benefits of branding and premium pricing (Knox, 2000), an
organization has to manage its brand portfolio so that a consumer easily identify
unique brand values that are differentiated and sustained in longer period of time.
Differentiation involves creating product that is perceived as unique
(Porter, 1996; Porter, 1998a; Kotler & Armstrong, 1999). Differentiation can be
defined as the act of creating a set of meaningful differences to make distinction
between firm’s offers from competitors’ offerings (Kotler, 1999). Kotler (1999)
has suggested that value proposition from a company, such as quality, reliability,
time, etc., can create image of brands (and claims, as in examples of Volvo,
Perdue and Domino’s pizza) that can earn 10-20% price premium. Research
findings (Knox, 2000) show that brands can reach higher prices if differentiation
is successfully applied. Successful brands are characterized with high brand
value differentiation versus less distinctive brands (Knox, 2000). In same matrix
relation, brands with high level of differentiation obtain high price
differentiation, which is opposite to brands with lower brand value that gain
lower prices. As a dominant positioning instrument of marketing strategy price
has been used to differentiate a brand (Yoo et al., 2000). In other words, brand
value may increase if consumers relate price to brand quality and use price as a
proxy for the signal of quality (Yoo et al., 2000).

- 97 -
It is widely discussed a concept of clustering in management literature
(Porter, 1998a/b; Aaker et al., 2004). Clusters are usually discussed from their
geographical traits, because it is common practice to treat and to name this topic
only as geographical clusters in a currently available management literature
(Porter, 1998a). According to Porter’s theory of competitiveness, cluster also
include organizations in downstream industries, complementary products,
government, standard-setting agencies as well as specialized organizations that
provide training, education, information, research and technical support (Porter,
1998a; Porter, 1998b). Boesso et al. (2009b) have empirically studied new
product development initiatives on pricing and sales, using the clustering
procedure that is centered over innovation and company type differences.
4.4. Hypotheses
he goal of this research is to determine which elements are
influencing certain marketing phenomenon, such as prices, brand
market share, etc., and to study how those elements behave with each other
driven by the brand management paradigm. In other words, we want to study
how different aspects of marketing management paradigm are ruling the food
market in the context of competitive strategies.
Misra and Trivedi (1997) have suggested that popular technique for
estimating such relationships are ordinary least square (OLS) or regression
approach. They have also underlined the importance of studying the relationship
between demand and marketing phenomena such as price, advertising and
promotions. Kotler (1999) has suggested that technology and quality are among
most important factors in obtaining competitive advantage for a firm (mop, bo).
T

- 98 -
He has put these factors in the context of the value propositions demand states
and marketing tasks that establish relationship between brand value proposition
and price premium. In same context, Duke (1994) and Ailawadi et al. (2003)
have advocated that brand value (BEq) enhance pricing strategy (PR). Literature
recognizes price premium, as well as market share and capacity utilization
(Sandvik & Sandvik, 2003), as the value delivered to consumer that represents
effectiveness-oriented concept of firm performance. Alpert et al. (1993) have
found that premium-pricing strategy cannot be applied successfully if price is the
only variable used. They have found that premium price can be obtained if the
higher price is accompanied with other premium-quality signals, such as
advertising, packaging, technology, etc. (mop, bo). In general, a firm tends to
enhance profitability by raising the sales (BV), which, consequently, influence a
firm’s price strategy (Duke, 1994). There are evidences that consumers are
willing to pay 30-50% price premia for the functional foods in comparison to
conventional foods (Menrad, 2003; Boesso et al., 2009b); this range is reported
in food segments like functional dairy products and ACE drinks. Furthermore,
brand differentiation does influence the brand’s higher relative price (Chaudhuri
& Holbrook, 2001, Knox, 2000).
In order to estimate the price model, we synthesize the price model as a
function of variables:
(4.1.) PR = f (BV, BEq, mop, bo)
Accordingly, business dominant status might be explained by brand price
strategy, measured by price premium.
H1: Business dominant status, as measured by price premium, is driven by
distinctive differentiation.

- 99 -
It is reported in the literature (e.g., O’Regan, 2002) that market share (MS)
can be increased by enhancing the perceived value of the brands or by reducing
the price. Enhancements of the perceived value can be achieved with higher
brand equity (BEq) and marketing investments in brand value (MI); for instance,
as argued by O’Regan (2002), with investments in new or improved brands.
Shepherd (1972) has found that advertising-intensity in products highly inter-
correlate with market share and, consequently, with firm’s profitability.
According to him, advertising-intensity represents marketing oriented investment
by a firm in the higher brand and organizational values. This inter-correlation is
result of higher product differentiation due to lagged marketing investments in
brands, which, consequently, creates entry barrier against competition. Marketing
investment in brand value will protect a firm’s brand against losses of brand
share (Shepherd, 1972).
Price (PR) reductions might be only a short-term measure that will
increase market share, because it is very likely to be followed by competitors
(O’Regan, 2002). Lower price strategy can be effective in longer term only with
a private labeled (store brands), because increased price “act as incentive for the
consumer to acquire store brands” (Rubio & Yague, 2009).
It has been suggested in the literature (Shepherd, 1972; Jacobson & Aaker,
1985; Laverty, 2001; Rubio & Yague, 2009) that a product quality (e.g., applied
technology and innovation) and company efforts (such as company culture,
strategy, size, etc.) are important variables that influence both market share and
profitability (mop, bo).
In composing a model for estimation, we include all brand performance
variables (e.g., Shepherd, 1972):
(4.2.) MS = f (BEq, MI, PR, mop, bo)

- 100 -
Thus, we hypothesized:
H2: Brand success, as measured by high market share, is driven by
distinctive differentiation.
Market rewards for companies that successfully introduce new brand
values are capacity utilization (Sandvik & Sandvik, 2003), bigger market share
and premium price. Hanna & Dodge (1995) have advocated that if company
successfully applies innovativeness, the more the pricing strategy will hold
existing price level and / or a monopoly. More innovative brands have more
distinctive differentiation in comparison to competitors, which leads to situation
in which company can maintain its dominant position longer and requires more
resources for competitors to fill the market and / or innovation gap. In contrary,
less innovative brands are preferred by consumers that expect lower level of
innovativeness for lower price level (Sandvik & Sandvik, 2003). In food
industry, a brand differentiation might be pursued by application of the different
innovation types as well as with distinctive firm strategy for which we use
company types. Importance of the successful innovation lies in fact that creates
added value for a consumer, but practice shows that added value cannot be
created without distinctive technological innovation (Doyle, 2000). We use
innovation and company type for common traits. In this way, we defined
technology clusters as a relevant measure of brand difference among food
producers.
H3: Differentiation in food industry can be grouped according to
innovation types.
- 101 -
4.5. Dataset
everal data sources we have used in this study. We have used the
data from AC Nielsen research on the food buying patterns of
20.000 Italian households for different variables. These data were collected in the
period June 2005 – June 2007. The Consumer Panel Solutions (CPS) and
Homescan® panel tool (ACNielsen, 2009) have been used to obtain the data
from ACNielsen Italy. In order to make in-depth analysis of purchase behaviours,
demographic profiles, etc., the CPS obtains consumer – centric marketing
solutions have been applied.
We have used information from the Bureau Van Dijk Electronic
Publishing AIDA financial statements database (AIDA, 2009) on the 940.000
Italian companies as our second data source. The research framework has been
expanded with quality independent variables according to observed brand quality
characteristics.
Description of the variables used in our brands sample is presented in
table 4.1. Our dependent variable is price that represents the amount of money
that consumers have to pay to obtain the brand. Brand volume is independent
variable that represents consumer purchase in volume. Brand equity represents
asset that is constituted by research costs, patents, advertising efforts, licenses,
etc. We read this value from the position “B.I.”, intangible assets, in the company
balance sheets. This variable has been calculated using the single brand share
indicator in order to allocate the brand equity value on specific brand.
S

- 102 -
Table 4.1.: Variables of the brand performance model (M1)
Variable Name Description Value Source
price PR
represents the amount of money that consumers have to pay to obtain the brand.
NL
Nielsen
market share MS
represents allocated brand share in company brand portfolio; i.e. brand sales share in relation to the total company sales
NL Nielsen
brand volume BV represents consumer purchase in volume (kg)
NL Nielsen
brand equity BEq
represents asset that is constituted by research costs, patents, advertising efforts, licenses, etc. (position B. I – intangible assets in the company balance sheets ) allocated to the single brand in company brand portfolio.
NL
AIDA
company type bo
represents difference among private labelled brands (=1), brands owned by the Italian SME producers (=2) and brands owned by MNC producers that have branches in Italy (=3)
1, 2, 3
QIV
innovation type mop
represents type of a brand according to the applied technology: wellness food (=1), organic food (=2) and functional food (=3)
1, 2, 3
QIV
Legend: AIDA – Company financial statements (balance sheet data), Nielsen – data from the AC Nielsen research, QIV – Quality independent variable; NL – Not limited
Quality independent variables are company and innovation type. Company
type represents difference among private labelled brands (=1), brands owned by
the Italian SME producers (=2) and brands owned by MNC companies that have
branches in Italy (=3). Innovation type represents brand type according to the

- 103 -
applied technology: wellness food (=1), organic food (=2) and functional food
(=3). We use dummy variables in order to study the behaviour of applied
technology. That is possible to achieve with the behaviour estimations of the
organic and functional brands in comparison to conventional brands.
We have used single brand, rather than individual consumers as units of
observations in this study. This approach is in line with Chaudhuri & Holbrook
(2001) who have suggested that aggregated consumer behaviour produce results
for the branding paradigm. Chaudhuri and Holbrook (2001) have suggested that
this approach avoids the pitfalls in experimental manipulations and gives more
important managerial implications, because decision makes effects on individual
brands.
This study refers to the “enriched-food” brands. The enriched-food brands
have added value or characteristics different from conventional food. From the
innovation type point of view our data set is consisted by conventional juices,
milk and yogurts with added value, such as vitamins for instance, functional as
well as organic foods. Boesso et al. (2009a) have suggested that this approach
might be embedded into a broader category of healthy products, such as organic,
functional, wellness, etc. According to Bogue & Sorenson (2001) health
enhancing food has been defined as food that provides health benefits beyond
their primary nutritional functions.
We have expanded our framework with quality independent variables that
have been defined and created as combination of existing empirical data and
observed brand quality characteristics. Our food industry sample (juices, milks
and yogurts) has 764 brands.

- 104 -
4.6. The model
order to explain possible business dominant status, which is in
line with our hypothesis H1, we introduce the brand price as
proxy and study effects of different elements on it. We regress brand price on
brand equity, consumer purchase in volume, company and innovation types.
Our first brand performance model at the aggregate level (M1) is
(4.3.) Ypriceb = c + δ1dummy company's type - italianb + δ2dummy company's
type – foreignb + δ3dummy innovation type – organicb + δ4dummy innovation type – functionalb + β1brand volumeb + β2brand equityb + ub
where b=1,...,B (brands). In the M1, the β and δ are the parameters, which
will be estimated, and we assume that the variance of the error term u,
conditional on regressors, is constant. The β coefficients measure the marginal
effects of the presented independent variables on the brand price. Similarly, the δ
coefficients measure the marginal effects of the presented quality independent
variables on the brand price.
Brand performance output, such as higher market share, is often used in
theory and practice to determine brand success (Shepherd, 1972; Gale, 1972;
Kay, 1993; O’Regan, 2002). In order to explain high brand share, which is in line
with our hypothesis H2, we regress brand share on brand equity, marketing
investment in brand, price, company and innovation types.
Our second brand performance model at the aggregate level (M2) is
(4.4.) Ymarket shareb = c + δ1company's type - italianb + δ2company's type – foreignb + δ3dummy innovation type – organicb + δ4dummy innovation type – functionalb + β1brand equityb + β2marketing investmentb + β3priceb + ub
where b=1,...,B (brands). Above presented assumptions on the β and δ
parameters in the M1 apply equally here, too.
The models are estimated with standard ordinary least squares (OLS). We
In

- 105 -
report R-Squared and adjusted R-Squared values to provide goodness-of-fit
indicators of the regression. In order to face for some eventual heteroskedasticity
problems we compute robust standard errors.
In order to explain brand differentiation, which is in line with our
hypothesis H3, we introduce and study innovation effects as well as influence of
company type on brand price with the cluster analysis. We applied the SPSS
TwoStep Clustering Component method, which is a scalable analysis method
designed to handle large data sets (SPSS TwoStep, 2009) and to produce results
on data grouping. Our approach is in line with Boesso et al. (2009b) that have
studied possibilities for the success of the innovation activities, measured by
price and sales, the size of the firm and geographical scope.
4.7. Results
regress price on brand volume, brand equity, company and
innovation type, in order to assess information on price
relevance related to brand paradigm. Our basic model has been described in
formal econometric fashion with equation 4.3. and 4.4., in section 4.6. The
results of these estimations are reported in table 4.2.
The main questions of our analyses are which, if any, and how brand’s
paradigm variables explain the brand price behaviour.
The results in the M1 reports that all variables – brand volume, brand
equity, company and innovation type – have significant statistical effect on brand
price, except the organic brands. The presented variables are statistically
significant at 1%, except the brand equity that is significant at 5% level. The
goodness – of – fit tests show that R – Squared value is 0,4365 and adjusted R –
Squared value is 0,4320.
We

- 106 -
The model 2 shows acceptable fit between variables. The results indicates
that brand equity, price, marketing investment in a brand and innovation type
have high statistical effect on market share (p<.01). Smaller importance, but still
significant (p<.1), on market share have Italian brands. The goodness – of – fit
tests show that R – Squared value is 0,3610 and adjusted R – Squared value is
0,3550.
Table 4.2.: Estimations of the variables in the brand performance model
Variables
Model 1
Model 2
price Dependent
brand (market) share Dependent
brand volume -0.6895***
(17.65)
brand equity 0.00726**
(2.45)
-0.00077*** (2.29)
marketing investment 0.0116***
(15.77)
price -0.0132***
(5.47)
dummy company type – Italian
0.743*** (4.94)
0.0206* (1.72)
dummy company type – foreign
1.6264*** (8.34)
0.0184 (1.16)
dummy innovation type – organic
-0.0041 (0.03)
0.0415*** (3.73)
dummy innovation type – functional
-0.9387*** (6.79)
0.0464*** (4.12)
R2 0.4365 0.3610
adjusted R2 0.4320 0.3550
Prob > F 0.0000 0.0000
N 764 764
*** significant at 1% (p < .01); ** significant at 5% (p < .05); * significant at 10% (p < .1) Notes: t-statistics appear in parenthesis

- 107 -
The cluster analysis explains how quality independent variables are related
to our dependent variable. The price cluster profiles for the innovation type,
presented in the table 4.3b, indicates that exist 3 clusters in the enriched-food
market, presented in table 4.3a. The combined price mean is 3,95 €/kg, in cluster
1 it is 2,93 €/kg, in clusters 2 and 3 are 4,04 €/kg and 4,68 €/kg, respectively.
These results suggest that cluster 3 obtains the premium price in the market, and
cluster 2 is little bit over the average price. The cluster 1 obtains the minimum
price in the market.
Table 4.3a: Price cluster profiles for the innovation type
Centroids
price
Mean Std. deviation
Cluster 1 2,9341 1,97828
2 4,0349 1,88594
3 4,6839 1,70895
Combined 3,9520 1,98474
The price frequencies for innovation type, presented in the table 4.3b,
suggests that the premium price, in the Italian enriched food market, has been
taken by the functional brands that represents 39,4% of the brands in this market.
The above average price has been taken by the organic brands that represents
29,8% of the market.

- 108 -
Table 4.3b: Price frequencies for the innovation type
Innovation type
functional organic wellness Combined
Frequency Percent Frequency Percent Frequency Percent Frequency Percent
Cluster 1 0 0,0% 0 0,0% 235 100,0% 235 30.8%
2 0 0,0% 228 100,0% 0 0,0% 228 29.8%
3 301 100,0% 0 0,0% 0 0,0% 301 39.4%
Combined 301 39.4% 228 29.8% 235 30.8% 764 100%
The price cluster profiles for the company type, presented in the table
4.4a, suggests that there are 4 clusters in the enriched-food market. The
combined price mean is 3,95 €/kg, in cluster 1 it is 4,99 €/kg, in clusters 2 is 2,96
€/kg, in cluster 3 is 1,84 €/kg and in cluster 4 is 5,14 €/kg. These results strongly
suggest that the premium price has been taken by cluster 4, cluster 1 is above
average price. The clusters 2 and 3 are below the average price in the enriched-
food industry.
The price frequencies for the company type, presented in the table 4.4b,
indicates that the premium price, in Italian enriched-food market, has been taken
by 62,8% of the Italian SMEs’ that represents 41,1% of the brands in this market.
The above average price has been taken by multinational brands that represents
18,2% of the market.

- 109 -
Table 4.4a: Price cluster profiles for the company type
Centroids
price
Mean Std. deviation
Cluster 1 4,9900 2,16013
2 2,9580 1,38930
3 1,8414 0,61139
4 5,1385 1,27563
Combined 3,9520 1,98474
Table 4.4b: Price frequencies for the company type
Company type
private label SME MNC Combined
Frequency Percent Frequency Percent Frequency Percent Frequency Percent
Cluster 1 0 0,0% 0 0,0% 139 100,0% 139 18.2%
2 125 100,0% 0 0,0% 0 0,0% 125 16.4%
3 0 0,0% 186 37,2% 0 0,0% 186 24.3%
4 0 0,0% 314 62,8% 0 0,0% 314 41.1%
Combined 125 16.4% 500 65.4% 139 18.2% 764 100%

- 110 -
The private label brands have obtained below average price with 16,4% of the
market. The minimum price has been taken by 37,2% of the Italian SMEs’ that
represents 24,3% of the brands in this market.
The brand share cluster profiles for the innovation type, presented in the
table 4.5b, indicates that exist 4 clusters in the enriched-food market, presented in
table 4.5a. The brand share sample has 764 brands, in cluster 1 there are 266
brands, in cluster 2 are 44, in clusters 3 and 4 there are 227 brands, in each.
These results suggest that cluster 1 has highest brand share, even though we
cannot assess information on profitability of these brands due to proprietary data.
Table 4.5a: Brand share cluster profiles for the innovation type
Cluster distribution
Brand share
No. of brands % Std. deviation
Cluster 1 266 34,8 0,41
2 44 5,8 2,60
3 227 29,7 0,15
4 227 29,7 0,33
Combined 764 1 1,22
In table 4.5b, is presented brand share frequencies according to the
innovation type. The biggest cluster group represent functional brands with
39,4% brands in the enriched-food sector, in the same time organic and wellness

- 111 -
brands have same brand share of 29.7%, each. These results indicate that
functional brands represent biggest brand share group in the Italian market.
Table 4.5b: Brand share frequencies for the innovation type
Innovation type
functional organic wellness Combined
Frequency Percent Frequency Percent Frequency Percent Frequency Percent
Cluster 1 266 88,4% 0 0,0% 0 0,0% 266 34,8%
2 35 11,6% 1 0,4% 8 3,4% 44 5,8%
3 0 0,0% 227 99,6% 0 0,0% 227 29,7%
4 0 0,0% 0 0,0% 227 96,6% 227 29,7%
Combined 301 39.4% 228 29.8% 235 30.8% 764 100%
The brand share cluster profiles for the company type, presented in the
table 4.6b, indicates that exist 4 clusters in the enriched-food market, presented in
table 4.6a. The brand share sample has 764 brands, in cluster 1 there are 490
brands, in clusters 2 are 42, in cluster 3 and 4 there are 123 and 109 brands,
respectively.

- 112 -
Table 4.6a: Brand share cluster profiles for the company type
Cluster distribution
Brand share
No. of brands % Std. deviation
Cluster 1 490 64,1 0,30
2 42 5,5 2,61
3 123 16,1 0,26
4 109 14,3 0,52
Combined 764 1 1,22
Table 4.6b: Brand share frequencies for the company type
Company type
private label SME MNC Combined
Frequency Percent Frequency Percent Frequency Percent Frequency Percent
Cluster 1 0 0,0% 490 98,0% 0 0,0% 490 64,1%
2 2 1,6% 10 2,0% 30 21,6% 42 5,5%
3 123 98,4% 0 0,0% 0 0,0% 123 16,1%
4 0 0,0% 0 0,0% 109 78,4% 109 14,3%
Combined 125 16.4% 500 65.4% 139 18.2% 764 100%

- 113 -
In table 4.6b, is presented brand share frequencies according to the company
type. The biggest cluster group represents the Italian SMEs with 65,4% brands in
the enriched-food sector, in the same time private labeled and MNC brands have
small brand share of 16.4% and 18.2%, respectively. From above presented
tables it is obvious that Italian SME represent biggest brand share group in the
Italian market.
4.8. Conclusions
he brand performance outputs, such as higher market share and
premium price, are often used to determine brand success and its
profitability (Shepherd, 1972; Gale, 1972; Kay, 1993; O’Regan, 2002). We have
confirmed theoretical assumptions, based on the extensive literature review, on
variables that creates higher market share and premium price. Additionally, we
have also confirmed that innovation plays important role in managing the brand
performance outputs.
With this study we have shown that the brand framework influences the
pricing strategy of the company in the market. The price premium is closely
related to the applied brand paradigm. Moreover, with brand differentiation based
on the innovation type, it is possible to obtain the price premium in the consumer
good market. Similarly, highest market share cluster group is consisted by 98%
of the Italian SME, which is consisted with our finding with premium price
“winners” in the Italian enriched-food market.
This manuscript presents the results of empirical analysis to determine the
variables of the brand performance outputs in food branding context. We have
controlled for four predictors – brand volume, brand equity, company and
innovation type – while estimating the impact of the variables on the brand
T

- 114 -
pricing strategy. We have found out that all presented variables are important for
explanation of a company pricing strategy. In other words, as we hypothesized in
H1, a company can reach business dominant status in the market, as measured by
a larger price premium, by distinctive brand differentiation. This approach has
been conducted formulating econometric model (M1). The variables estimations,
that have impact on the brand pricing strategy, are in line with the literature
overview (Aaker, 1991; Alpert et al., 1993; Duke, 1994; Suri et al., 2002; Boesso
et al., 2009b).
We have applied the model M2 in order to estimate and determine
variables of higher market share in food branding context. We have controlled for
five predictors – brand equity, marketing investment, price, company and
innovation type – using them to estimate the impact on brand share. As we have
hypothesized in H2, a firm can gain higher brand share and potentially enjoy in
benefits such as profitability and brand success (Shepherd, 1972; Gale, 1972;
Kay, 1993; O’Regan, 2002).
These two models (M1 and M2) have been estimated using standard and
robust OLS procedure. Adjusted R – Squared value have been reported from the
standard OLS procedure, while we have reported R – Squared value from robust
OLS procedure.
This study provides better understanding of the brand value role, measured
by brand equity, for the brand performance outputs. The relevance and
importance of the brand value for the creation of business strategy is very often
underestimated in marketing literature and practice. Analyses have shown that
this variable is significant and positively related to pricing strategy. We provide
evidences that brand value plays important role in setting the brand price, which
is our contribution to the discussion on pricing controversy. In contrary, setting
the price according to the cost-based approach, which is in centre of the pricing

- 115 -
controversy, has many practical and methodological flows (Christopher, 2000).
Our finding confirms theoretical suggestions by Knox (2000), who has argued
that brands provides customers with added value beyond its functional
performance, because this added value differentiates products and determine
consumer preferences. The model 2 empirical findings on brand value may cause
some controversy. One would expect that raising the brand value would raise
market share of “special” brands. Possible explanation might be that consumers
have inverse expectation from special brands – small decrease of brand value
may signal less special and less expensive brand; more affordable from financial
and consumption point of view. This is in line with finding, and theoretical
suggestion, that with price decrease can be boosted the brand share.
Second relevant finding is that a sale, measured by brand volume, is
negatively related to the pricing. However, Duke (1994) has suggested that brand
volume has positive and significant importance on pricing. Our finding is,
howbeit, a logical relationship because we are investigating special and
differentiated food brands. Competing on further volume raise leads to the
detoriation of the brand price, because a brand is less special and important for a
consumer.
Finally, the results of our cluster analysis strongly support the hypothesis
H3 that the brand differentiation can be grouped according to innovation type.
We found out that higher levels of innovation driven by differentiation, such as
functional food brands in our study, may obtain higher market share and
premium price in the market; which is in line with theoretical suggestions (Knox,
2000; Boesso et al., 2009b). Moreover, in order to find out which type of the
company obtains that premium price, we combine our findings with the company
type. This approach lead us to the conclusion that the premium price is taken by
Italian SME´s managed brands, in contrary to the MNC or private labeled brands.

- 116 -
The study provides straightforward implication that the organic food
brands reached saturated position in the food market and from the point of the
price strategy there is small space for further enhancements. The functional food
brands are in a conceptual and market expansion, still not bounded by the
regulations and market limits. We provide evidences that the private labels
compete on low prices and higher volumes, but this strategy does not provide
higher price markup.
We believe that our paper contributes to the literature with offering better
understanding of forces that shape the branding paradigm in the brand
performance context. Academic literature has not offered synthesized and
consistent overview in this matter so far. Our study is an attempt in that research
direction.

- 117 -
REFERENCES
Aaker, David A. (1989), “Managing assets and skills: the key to a sustainable competitive advantage”, California Management Review, vol. 31, No. 2, pp. 91-106
Aaker, David. A. (1991), Managing Brand Equity, The Free Press, New York, NY
Aaker, David. A., Kumar, V. and Day, G. (2004), Marketing Research, 8th edition, John Wiley & Sons, New York, NY
Adams, J. (1995), “Brands at the crossroads”, American Advertising, vol. 11, No. 3, pp. 18-20
AC Nielsen (2008), last update: N/A, “Consumer Panel Solutions (CPS)”, online. Available: http://www2.acnielsen.com/products/cps.shtml (accessed 2008, November 11)
Agres, Stuart J. and Tony M. Dubitsky (1996), “Changing Need for Brands”, Journal of Advertising Research, Jan/Feb, pp. 21-30
AIDA (2008), last update: N/A, “Bureau Van Dijk Electronic Publishing AIDA financial statements database”, online. Available: https://aida.bvdep.com/ (accessed 2008, December 20)
Ailawadi, K., Lehmann, D. and Neslin, S. (2003), “Revenue Premium as an Outcome Measure of Brand Equity”, Journal of Marketing, vol. 67 (October), pp. 1-17
Alpert, F., Wilson, B. And Elliott, M.T. (1993), “Price Signaling: Does it Ever Work?”, Journal of Product and Brand Management; 2 (1), pp. 29-41
AMA – American Marketing Association (2009), last update: N/A. “Marketing Dictionary”, online. Available: http://www.marketingpower.com/_layouts/Dictionary.aspx?dLetter=B (accessed 2009, February 11)
Ambler, Tim (1997), “Do brands benefit consumers?” International Journal of Advertising, vol. 16, No. 3, pp. 167-198

- 118 -
Ambler, Tim (2008), “Marketing metrics”, in The Marketing Book, Michael J. Baker and Susan J. Hart, ed., 6th edition, Butterworth-Heinemann, Oxford
Ambler, Tim, C.B. Bhattacharya, Julie Edell, Kevin Lane Keller, Katherine N. Lemon and Vikas Mittal (2002), “Relating Brand and Customer Perspectives on Marketing Management”, Journal of Service Research, vol. 5, No. 1, August, pp. 13-25
Ambler, Tim and Chris Styles (1997), “Brand development versus new product development: towards a process model of extension decision”, Journal of product and brand management, vol. 6, No. 1, pp. 13-26
Anderson, James C. And David W. Gerbing (1988), “Structural Equation Modeling in Practice: A Review and Recommended Two-Step Approach”, Psychological Bulletin, vol. 103, No. 3, pp. 411-423
Atilgan, E., Safak A. and Serkan A. (2005), “Determinants of the brand equity: A verification approach in the beverage industry in Turkey”, Marketing Intelligence & Planning, vol. 23 No. 3, pp. 237-248
Barwise, Patrick (1993), “Brand Equity: Snark or Boojum?”, International Journal of research in Marketing, vol. 10 (March), pp. 93-104
Berry, L. (2000). “Cultivating Service Brand Equity.” Journal of the Academy of Marketing Science, vol. 28, No. 1, pp. 128-137
Boesso, Giacomo, Nebojsa St. Davcik and Francesco Favotto (2009a), “Health-enhancing Products in the Italian Food Industry: Multinationals and SMEs Competing on Yogurt”, Journal of Agrobiotechnology Management and Economics, vol. 12, No. 2, pp. 155-166
Boesso, Giacomo, Francesco Favotto, Andrea Menini and Kamalesh Kumar (2009b), “Strategic innovativeness of SMEs vs. large MNEs: functional yogurts in Italy”, Rivista Piccola Impresa/Small Business, No. 2, pp. 29-49
Bogue, Joe and Sorenson, Douglas (2001), "An exploratory study of consumers' attitudes towards health-enhancing foods", Agribusiness Discussion Paper, No. 36, Department of Food Business & Development, University College Cork, Cork,
Broniarczyk, S. M. and Gershoff, A. D. (2003), “The Reciprocal Effects of Brand Equity and Trivial Attributes”, Journal of Marketing Research, Vol. XL (May), pp. 161-175

- 119 -
Buil, Isabel, Eva Martinez and Leslie de Chernatony (2009), “Brand Equity: A Higher-order Formative Measure”, 5th Thought Leaders International Conference on Brand Management, University of Glasgow Business School, The Centre for Research in Brand Marketing at University of Birmingham and The Athens Institute of Education and Research (ATINER), 6-7th April 2009, Athens
Castellini, A., Canavari, C., Pirazzoli, C., (2002), “Functional foods in the European Union: an overview of the sector’s main issues”, CIFAP Working paper WP02-12, University of Minnesota, USA
Cavusgil, S.T. (1996), “Pricing for global markets”, The Columbia Journal of World Business; 31(4), pp. 66-78
Chaudhuri, A. and Holbrook, M. B. (2001), “The Chain of Effects from Brand Trust and Brand Affect to Brand Performance: The Role of Brand Loyalty”, Journal of Marketing, 65 (April), pp. 81-93
de Chernatony, Leslie and Susan Cottam (2006), “Internal brand factors driving successful financial services brands”, European Journal of Marketing, vol. 40, No. 5/6, 2006, pp. 611-633
Christopher, M. (2000), “Pricing strategy”, In: Marketing Management: A Relationship Marketing Perspective, Cranfield School of Management. MacMillan Press Ltd., London
Choi, S. Chan and Anne T. Coughlan (2006), “Private label positioning: Quality versus feature differentiation from the national brand”, Journal of Retailing, vol. 82, No. 2, pp. 79-93
Churchill, Gilbert A. (1979), “A Paradigm for Developing Better Measures of Marketing Constructs”, Journal of Marketing Research, vol. XVI, February, pp. 64-73
Churchill, Gilbert A. and Dawn Iacobucci (2009), Marketing Research: Methodological Foundations, 10th ed., South-Western College Pub, Cincinnati, Ohio
Clark, Bruce H. and Tim Ambler (2001), “Marketing Performance Measurement: Evaluation of Research and Practice”, International Journal of Business Performance Management, vol. 3, Winter, pp. 231-244
Cobb-Walgren, C. J., Ruble, C. A. and Donthu, N. (1995), “Brand Equity, Brand Preference, and Purchase Intent”, Journal of Advertising, vol. XXIV, No. 3, Fall, pp. 25-40

- 120 -
Collins, J.C. and Porras, J.I. (1995), Built to last: Successful Habits of Visionary Companies, Random House, London
Crawford, M. (1993), New Products Management, Irwin, Homewood, IL
Crespi, J. M., Marette, S., (2001). “How Should Food Safety Certification Be Financed?” American Journal of Agricultural Economics, 83(4), pp. 852-861.
Cronbach, Lee J. (1951), “Coefficient Alpha and the Internal Structure of Tests”, Psychometrika, vol. 16 (September), No. 3, pp. 297-334
Czellar, S. (2003), “Consumer attitude toward brand extensions: An integrative model and research propositions”. International J. Research in Marketing, vol. 20, March, pp. 97-115.
Cyert, Richard and James March (1963), A Behavioral Theory of the Firm, Blackwell Publishers, Massachusetts
Davcik, Nebojsa St. (2004), “Strategies: Ecological – efficient Solutions in Agricultural Production, Distribution and Consumption”, Terra Madre World Meeting, Torino, Italy
Davcik, Nebojsa St., Giacomo Boesso and Francesco Favotto (2009), “Innovation Drives Differentiation: Functional, Organic & Wellness Food in Italy”, 5th Thought Leaders International Conference on Brand Management, Organisers: University of Glasgow Business School, The Centre for Research in Brand Marketing at University of Birmingham and The Athens Institute of Education and Research (ATINER), 6-7 April 2009, Athens
Deng, Shengliang and Jack Dart (1994), “Measuring Market Orientation: A Multi-factor, Multi-item Approach”, Journal of Marketing Management, vol. 10, No. 8, pp. 725-742
Diamantopoulos, Adamantios and Heidi M. Winklhofer (2001), “Index Construction with Formative Indicators: An Alternative to Scale Development”, Journal of Marketing Research, vol. XXXVIII, May, pp. 269-277.
Dich, Jan, Shelia H. Zahm, Annika Hanberg, and Hans-Olov Adami (1997), “Pesticides and cancer”, Cancer Causes and Control, vol. 8, pp. 420-433 Doyle, P. (2000), Value-based Marketing, John Wiley & Sons, Chichester

- 121 -
Duke, C.R. (1994), “Matching Appropriate Pricing Strategy with markets and Objectives”, Journal of Product & Brand Management, vol. 3 (2), pp. 15-27
Erdem, Tulin, Joffre Swait, Susan Broniarczyk, Dipankar Chakravarti, Jean-Noel Kapferer, Michael Keane, John Roberts, Jan-Benedict Steenkamp and Florian Zettelmeyer (1999), “Brand Equity, Consumer Learning and Choice”, Marketing Letters, vol. 10, No. 3, pp. 301-318
Ezekiel, Mordecai (1941), Methods of Correlation Analysis, 2nd ed., John Willey & Sons, Inc., New York
Farquhar, Peter H. (1989), “Managing Brand Equity”, Marketing Research, 1 (September), pp. 24-33
Ferris, P., Olver, J. and de Kluyver, C. (1989), “The Relationship Between Distribution and Market Share”, Marketing Science, 8(2), pp. 107-127
Finn, Adam and Ujwal Kayande (1997), “Reliability Assessment and Optimization of Marketing Measurement”, Journal of Marketing Research, vol. XXXIV, May, pp. 262-275
Finn, Adam and Ujwal Kayande (2004), “Scale modification: alternative approaches and their consequences”, Journal of Retailing, vol. 80, pp. 37-52
Fornell, Claes and David F. Larcker (1981), “Evaluating Structural Equation Models with Unobservable Variables and Measurement Error”, Journal of marketing Research, vol. XVIII, February, pp. 39-50
Frishammar, J. (2002), “Characteristics in information processing approaches”, International journal of information management, Vol. 22, pp. 143-156.
Frishammar, J. and S.A. Hörte (2005), “Managing external information in manufacturing firms: The impact on innovation performance”, Journal of Product Innovation Management, vol. 22, No. 3, pp. 251-266.
Gabbott, Mark and Colin Jevons (2009), “Brand community in search of theory: An endless spiral of ambiguity”, Marketing Theory, vol. 9(1), pp. 119-122
Gale, B.T. (1972), “Market Share and the Rate of Return”, Review of Economics and Statistics, 54, November, pp. 412-423
Gardner, Burleigh B. and Sidney J. Levy (1955), “The Product and the Brand”, Harvard Business Review, March-April, pp. 33-39

- 122 -
Guenzi, P. and G. Troilo (2006), “Developing marketing capabilities for customer value creation through Marketing–Sales”, Industrial Marketing Management, vol. 35, No. 8, pp. 974-988
Hair, Joseph F., Rolph E. Anderson, Ronald L. Tatham and William C. Black (1998), Multivariate Data Analysis, 5th ed., Prentice Hall, Upper Saddle River, NJ
Hanna, N. and Dodge, H.R. (1995), Pricing, policies and procedures, University Press, New York
Harman, H. (1967), Modern factor analysis, 2nd ed., University of Chicago Press, Chicago
Harrison, Richard J. and David L. Torres (1988), “The Changing of the Guard: Turnover and Structural Change in the Top Management Positions”, Administrative Science Quarterly, vol. 33, June, pp. 22-33.
Hatanaka, M., Bain C. and Busch, L. (2005). “Third-party certification in the global agrifood system”, Food Policy, vol. 30, pp. 354-369.
Hilliam, M. (2000), “Functional food – How big is the market”, The World of Food Ingredients, vol. 12, pp. 50-52
Holbrook, Morris B. ed. (1999), Consumer value: a framework for analysis and research, Routledge, London Hunt, Shelby D. and Caroline Derozier (2004), "The Normative Imperatives of Business and Marketing Strategy: Grounding Strategy in Resource-Advantage Theory", Journal of Business & Industrial Marketing, Vol. 19, No. 1, pp. 5-22.
Jacobson, Robert and David A. Aaker (1985), “Is Market Share All That It’s cracked Up To Be?”, Journal of Marketing, 49, Fall, pp. 11-22
Jaworski, Bernard J. and Ajay K. Kohli (1993), “Market Orientation: Antecedents and Consequences”, Journal of Marketing, vol. 57, July, pp. 53-70
Jevons, Colin (2007), “Towards an integrated definition of “brand””, in: de Chernatony, L. (ed.), 2007 Thought Leaders’ International Conference on Brand Management, Birmingham Business School, UK

- 123 -
John, Deborah R., Loken, B. and Joiner, C. (1998), “The negative impact of extensions: Can flagship products be diluted?”, Journal of Marketing, vol. 62, No. 1, pp. 19–32.
Kay, J. (1993), Foundations of Corporate Success: How Business Strategies Add Value, Oxford University Press, Oxford
King, S. (1991), “Brand-building in the 1990s”, Journal of Consumer Marketing, vol. 8, No. 4, pp. 43-52
Keller, Kevin L. (1993), “Conceptualizing, Measuring, and Managing Customer-Based Brand Equity”, Journal of Marketing, 57 (January), pp. 1-22
Keller, Kevin L. and Donald R. Lehmann (2003), “How Do Brands Create Value”, Marketing Management, May/June, pp. 26-31
Keller, Kevin L. and Donald R. Lehmann (2006), “Brands and Branding: Research Findings and Future Priorities”, Marketing Science, vol. 25, Nov.-Dec., pp. 740-759 Knox, Simon (2000), “Branding and positioning”, in Marketing Management: A Relationship Marketing Perspective by Cranfield School of Management, MacMillan Press Ltd., London
Kotler, Philip (1999) Marketing Management; The Millennium Edition, Prentice Hall International, New Jersey Kotler, Philip and Armstrong, G. (1999), Principles of Marketing; 8th edition, Prentice Hall International, New Jersey Laverty, Kevin J. (2001), “Market share, profits and business strategy”, Management Decision, 39(8), pp. 607-617
Lawrence, Paul R. and Jay W. Lorsch (1967), “Differentiation and Integration in Complex Organizations”, Administrative Science Quarterly, vol. 12, No. 1, June, pp. 1-47
Lehmann, D.R. and Reibstein, D.J. (2006), “Marketing Metrics and Financial Performance”, Marketing Science Institute, Cambridge, Mass.
Mark-Herbert, C. (2002), Functional food for added value. Developing and marketing a new product category, Doctoral dissertation, Swedish University of Agricultural Sciences, ISBN 1401-6249.

- 124 -
McDonald, G.; Killerby, S.; Maplesden, F. and Rolland D. (2007), “Developing a stakeholder analysis to aid bio-based product innovation”, Journal of Product & Brand Management, Vol. 16, No. 6, pp. 386-400.
Menrad, Klaus (2003), “Market and marketing of functional food in Europe”, Journal of Food Engineering, vol. 56, pp. 181-188
Mintzberg, Henry (1980), "Structure in 5'S: A Synthesis of the Research on Organization Design", Management Science, vol. 26, No. 3, March, pp. 322-341
Misra, S.R. and Trivedi M. (1997), “A cointegration analysis of demand: implications for pricing”, Pricing Strategy & Practice; 5 (4), pp. 156-163
Myers, M.B., Cavusgil, S.T. and Diamantopoulos, A. (2002), “Antecedents and actions of export pricing strategy: a conceptual framework and research propositions”, European Journal of Marketing, 36(1/2), pp. 159-188
Narver, J.C. and S. Slater (1990), “The Effect of a Market Orientation on Business Profitability”, Journal of Marketing, vol. 54, October, pp. 20-35
Nevo, A. (2001). “Measuring Market Power in the Ready-to-Eat Cereal Industry.” Econometrica, vol. 69, pp. 307-342.
Oxford (2009), last update: N/A. “Oxford English Dictionary: The definitive record of the English language”, online. Available: www.oed.com (accessed 2009, December 11)
O’Regan, Nicholas. (2002), “Market share: the conduit to future success?”, European Business Review, 14(4), pp. 287-293
O’Sullivan, Don and Andrew V. Abela (2007), “Marketing Performance Measurement Ability and Firm Performance”, Journal of Marketing, vol. 71, April, pp. 79-93
Pappu, Ravi, Pascale G. Quester, and Ray W. Cooksey (2005), “Consumer-based brand equity: improving the measurement – empirical evidence”, Journal of Product & Brand Management, vol. 14(3), pp. 143-154
Park, C. S. and Srinivasan, V. (1994), “A Survey-Based Method for Measuring and Understanding Brand Equity and Its Extendibility”, Journal of Marketing Research, vol. XXXI (May), pp. 271-288

- 125 -
Podsakoff, Phillip M. and Organ, Dennis W. (1986), “Self-reports in organizational research: Problems and prospects”, Journal of Management, Vol. 12, winter, pp. 531-544
Porter, Michael E., (1996), “What is Strategy?”, Harvard Business Review, Nov-Dec, pp. 61-77
Porter, Michael. E. (1998a), On Competition, Harvard Business School Press, Boston
Porter, Michael. E. (1998b), “Clusters and the new economics of competition”, Harvard Business Review, Nov-Dec, pp. 77-90
Raggio, R. D. and Leone, R. P. (2007), “The theoretical separation of brand equity and brand value: Managerial implications for strategic planning”, Brand Management, vol. 14, May, No. 5, pp. 380-395
Rubio, Natalia and Maria Jesus Yague (2009), “Alternative panel models to evaluate the store brand market share: Evidence from the Spanish market”, European Journal of Marketing, 43(1/2), pp. 110-138
Rundquist, Jonas (2009), “Effects of knowledge integration on innovation performance: a framework and empirical study”, 16th International Product Development Management Conference, 8-9th June, 2009, Einschede
Samiee, S. (1987), “Pricing in marketing strategies of US and foreign based companies”, Journal of Business Research, 15(1), pp. 17-30
Sandvik, Izabela L. and Kare Sandvik (2003), “The impact of market orientation on product innovativeness and business performance”, International Journal of Research in Marketing, vol. 20, pp. 355-376
Schmidt, Otto et al. (2004), Organic Marketing Initiatives and Rural Development: A Guide to Successful Organic Marketing Initiatives; FiBL, Frick, Switzerland
Shepherd, William G. (1972), “The Elements of Market Structure”, Review of Economics and Statistics, 54, February, pp. 25-37
Shocker, A. D., Srivastava, R. K. and Ruekert, R. W. (1994), “Challenges and Opportunities Facing Brand Management: An Introduction to the Special Issue”, Journal of Marketing Research, Vol. XXXI (May), pp. 149-158

- 126 -
Sijtsma, Klaas (2009), “On the use, the misuse, and the very limited usefulness of Cronbach’s Alpha”, Psychometrika, vol. 74, No. 1, pp. 107-120 Simon, C. J. and Sullivan, M. W. (1993), "The Measurement and Determinants of Brand Equity: A Financial Approach", Marketing Science, vol. 12, No.1, Winter, pp. 28-52
Singh, Satyendra and Ashok Ranchhod (2004), “Market orientation and customer satisfaction: Evidence from British machine tool industry”, Industrial Marketing Management, vol. 33, pp. 135-144
Sousa, Carlos M.P. and Frank Bradley (2009), “Price adaptation in export markets”, European Journal of Marketing, vol. 43, No. 3 / 4, pp. 438-458
SPSS TwoStep Cluster Component. White paper – technical report. TCSWP-0101. Online. Available: ftp://ftp.spss.com/pub/web/wp/TSCWP-0101.pdf (accessed 2009, January 25)
Sriram,S., Subramanian B. and Manohar U. K. (2007), “Monitoring the Dynamics of Brand Equity Using Store-Level Data”, Journal of Marketing, vol. 71, April, pp. 61-78
Stern, Barbara (2006), “What Does Brand Mean? Historical-Analysis Method and Construct Definition”, Journal of the Academy of Marketing Science, vol.34, No. 2, pp. 216-223
Suri, Rajneesh, Rajesh V. Manchanda and Chiranjeev S. Kohli (2002), “Comparing fixed price and discounted price strategies: the role of affect on evaluations”, Journal of Product & Brand Management, vol. 11, No. 3, pp. 160-173
Temporal, P. (2002), Advanced Brand Management: From Vision to Valuation, John Wiley & Sons (Asia), Singapore
Unnevehr, J., Jensen, H. H. (1999), “The economic implications of using HACCP as a food safety regulatory standard”, Food Policy, vol. 24, p. 625-635.
Weick, Karl E., Kathleen M. Sutcliffe and David Obstfeld (2005), "Organizing and the Process of Sensemaking", Organization Science, vol. 16, No. 4, July-August, pp. 409-421
- 127 -
Venkatraman, N. and Vasudevan Ramanujam (1987), “Measurement of business economic performance: an examination of method convergence”, Journal of Management, vol. 13, No. 1, pp. 109-122
de Vrese, Michael and Schrezenmeir, J. (2008), “Probiotics, prebiotics, and synbiotics”, Advances in Biochemical Engineering / Biotechnology, vol. 111, pp 1-66
Willer, H. (2005), The World of Organic Agriculture: Statistics and Emerging Trends; 7th revised edition, IFOAM & FIBL, Bonn
WHO – World Health Organization (2009), last update: , “Data and statistics: highlights”, online. Available: http://www.who.int/research/en/ (accessed 2009, June 17)
Wong, Ho Y., and Bill Merrilees (2005), “A brand orientation typology for SMEs: A case research approach”, Journal of Product and Brand Management, vol. 14, No. 3, pp. 155-162
Wooldridge, Jeffrey M. (2001), Econometric Analysis of Cross Section and Panel Data, The MIT Press, Cambridge, Massachusetts
Wooldridge, Jeffrey M. (2002), Introductory Econometrics: A modern approach, 2 ed., South-Western College Publ., Cincinnati, Ohio
Yoo, B., Donthu, N. and Lee, S. (2000), "An Examination of Selected Marketing Mix Elements and Brand Equity", Journal of the Academy of Marketing Science, vol. 28, No. 2, Spring, pp. 195-211
Zeithaml, V. A. (1998), “Consumer Perceptions of Price, Quality, and Value: A Means-End Model and Synthesis of Evidence”, Journal of Marketing, vol. 52 (July), pp. 2-22
Internet links
International Federation of Organic Agriculture Movements (IFOAM) –
www.ifoam.org
Danone Activia yogurt – www.activia.com