Very-high-energy gamma astrophysics
59
DOI 10.1393/ncr/i2008-10032-2 RIVISTA DEL NUOVO CIMENTO Vol. 31, N. 4 2008 Very-high-energy gamma astrophysics A. De Angelis( 1 )( 2 )( 3 )( 4 ), O. Mansutti( 1 )( 3 ) and M. Persic( 2 )( 3 ) ( 1 ) Dipartimento di Fisica, Universit` a di Udine - Via delle Scienze 208, I-33100 Udine, Italy ( 2 ) INAF, Sezione di Trieste - Via G.B. Tiepolo 11, I-34143 Trieste, Italy ( 3 ) INFN, Sezione di Trieste and Gruppo Collegato di Udine - Udine, Italy ( 4 ) Instituto Superior T´ ecnico - Av. Rovisco Pais, 1049-001 Lisboa, Portugal (ricevuto il 15 Aprile 2008) Summary. — High-energy photons are a powerful probe for astrophysics and for fundamental physics under extreme conditions. During the recent years, our knowl- edge of the most violent phenomena in the Universe has impressively progressed thanks to the advent of new detectors for high-energy γ-rays. Observation of γ- rays gives an exciting view of the high-energy universe thanks to the satellite-based telescopes (AGILE, GLAST) and to the ground-based detectors like the Cherenkov telescopes (H.E.S.S. and MAGIC in particular), which recently discovered more than 60 new very-high-energy sources. The progress achieved with the last generation of Cherenkov telescopes is comparable to the one drawn by EGRET with respect to the previous γ-ray satellite detectors. This paper reviews the present status of high-energy gamma astrophysics, with emphasis on the recent results and on the experimental developments. PACS 95.55.Vj – Neutrino, muon, pion, and other elementary particle detectors; cosmic ray detectors. PACS 95.85.Pw – γ-ray. PACS 96.50.S – Cosmic rays. 188 1. Introduction 191 2. Production processes of gamma-rays 191 2 . 1. Photons from gravitational collapses 196 2 . 2. Production from self-annihilation of dark matter 198 2 . 3. Top-down mechanisms 198 3. Propagation of γ-rays 202 4. Detection techniques 202 4 . 1. Atmospheric transparency and processes of interaction 204 4 . 2. Satellites 207 4 . 3. Ground-based detectors 207 4 . 3.1. EAS detectors 210 4 . 3.2. Cherenkov telescopes 217 4 . 4. Resum´ e c Societ` a Italiana di Fisica 187
Transcript of Very-high-energy gamma astrophysics
DOI 10.1393/ncr/i2008-10032-2
RIVISTA DEL NUOVO CIMENTO Vol. 31, N. 4 2008
Very-high-energy gamma astrophysics
A. De Angelis(1)(2)(3)(4), O. Mansutti(1)(3) and M. Persic(2)(3)(1) Dipartimento di Fisica, Universita di Udine - Via delle Scienze 208, I-33100 Udine, Italy(2) INAF, Sezione di Trieste - Via G.B. Tiepolo 11, I-34143 Trieste, Italy(3) INFN, Sezione di Trieste and Gruppo Collegato di Udine - Udine, Italy(4) Instituto Superior Tecnico - Av. Rovisco Pais, 1049-001 Lisboa, Portugal
(ricevuto il 15 Aprile 2008)
Summary. — High-energy photons are a powerful probe for astrophysics and forfundamental physics under extreme conditions. During the recent years, our knowl-edge of the most violent phenomena in the Universe has impressively progressedthanks to the advent of new detectors for high-energy γ-rays. Observation of γ-rays gives an exciting view of the high-energy universe thanks to the satellite-basedtelescopes (AGILE, GLAST) and to the ground-based detectors like the Cherenkovtelescopes (H.E.S.S. and MAGIC in particular), which recently discovered more than60 new very-high-energy sources. The progress achieved with the last generation ofCherenkov telescopes is comparable to the one drawn by EGRET with respect tothe previous γ-ray satellite detectors. This paper reviews the present status ofhigh-energy gamma astrophysics, with emphasis on the recent results and on theexperimental developments.
PACS 95.55.Vj – Neutrino, muon, pion, and other elementary particle detectors;cosmic ray detectors.PACS 95.85.Pw – γ-ray.PACS 96.50.S – Cosmic rays.
188 1. Introduction191 2. Production processes of gamma-rays191 2
.1. Photons from gravitational collapses
196 2.2. Production from self-annihilation of dark matter
198 2.3. Top-down mechanisms
198 3. Propagation of γ-rays202 4. Detection techniques202 4
.1. Atmospheric transparency and processes of interaction
204 4.2. Satellites
207 4.3. Ground-based detectors
207 4.3.1. EAS detectors
210 4.3.2. Cherenkov telescopes
217 4.4. Resume
c© Societa Italiana di Fisica 187

188 A. DE ANGELIS, O. MANSUTTI and M. PERSIC
218 5. The emerging HE and VHE gamma-ray sky
219 5.1. Galactic cosmic-ray accelerators
220 5.1.1. Supernova remnants
220 5.1.2. Pulsars and Pulsar Wind Nebulae
223 5.1.3. Binary systems
224 5.1.4. The centre of the Milky Way
226 5.1.5. Mystery sources and Cygnus region
228 5.2. Extragalactic sources of VHE γ-rays
228 5.2.1. Satellites of the Milky Way
228 5.2.2. Star-forming galaxies
228 5.2.3. Active Galactic Nuclei
234 5.2.4. Gamma-Ray Bursts
236 6. The future
236 6.1. The future of present detectors
236 6.2. The Cherenkov Telescope Array
239 6.3. Large EAS
240 7. Conclusions
1. – Introduction
A flow of high-energy particles reaches the Earth. About one century ago, two pio-neering works by Victor Hess [1] (who for this was awarded the Physics Nobel Prize in1936), and by Domenico Pacini [2] (who unfortunately died before 1936: his fundamentalwork is less known, although it was performed at the same time as Hess’, independently,and with different techniques) proved that such particles were of extraterrestrial origin:they were thus called cosmic rays [3]. Since their energies far exceed the temperaturesordinarily encountered in astronomical objects, cosmic rays are messengers of the non-thermal universe.
Excluding neutrinos, cosmic rays mainly consist of charged particles, such as protons(∼ 90%), helium nuclei (< 10%), ionized heavier elements (< 1%), and electrons (< 1%),while only 0.1–1% of the total radiation consists of photons with energy > 1 MeV; forhistorical reasons these are called γ-rays.
The energy of cosmic rays covers more than 10 orders of magnitude, from tens of MeVup to 1020 eV and higher(1). The dependence of the flux on the energy E of the particlecan be approximated by a power law
dN
dE∝ E−α,
(1) A theoretical upper limit on the energy of cosmic rays from distant sources exists. Thislimit was computed in 1966 by Greisen, Kuzmin and Zatsepin [4], and it is called today the GZKcut-off. Protons with energies above a threshold of about 1020 eV suffer a resonant interactionwith the cosmic microwave background photons to produce pions (p + γ → Δ → N + π). Thiscontinues until their energy falls below the production threshold. Because of the mean pathassociated with the interaction, extragalactic cosmic rays from distances larger than 50 Mpcfrom the Earth and with energies greater than this threshold energy should not be observedon Earth, and there are no known sources within this distance that could produce them. TheAuger experiment recently confirmed the existence of the GZK cut-off [5].

VERY-HIGH-ENERGY GAMMA ASTROPHYSICS 189
Fig. 1. – Energy spectrum of cosmic rays.
where the spectral index α has typical values between 2.5 and 3. The energy dependencecan be explained in first approximation due to shock acceleration mechanisms [6].
Figure 1 shows the energy spectrum for cosmic rays. The region around 1015.5 eV isreferred as the “knee”, for its spectral steepening (from a spectral index of about 2.7to about 3), while the region around 1018.5 eV, where a spectral flattening occurs, iscalled the “ankle” of the spectrum. It is generally believed that cosmic rays below theknee have a galactic origin and that they have been confined inside our Galaxy for atleast 107 years (this can be expected from the value of the magnetic field in the galaxy,which is of the order of 1μG) [7]. The particles above 1017 eV are believed to be mostlyof extragalactic origin, since the galactic magnetic field is not able to trap them in ourGalaxy. Recently the Auger Collaboration has announced that cosmic rays of energiesabove 1019 eV appear to come from Active Galactic Nuclei (AGN) located within 75 Mpcfrom our Galaxy [8]. The clustering of arrival directions around the sky positions ofthose AGNs has enabled to indicate a value of the order of 0.5 nG for the extragalacticmagnetic field, at least within a radius of 75 Mpc from the solar system [9].
Although protons are the most abundant component of cosmic rays, their origin isvery difficult to determine, since the deflection radius for a proton of energy E crossinga magnetic field of intensity B is
R
1 pc� 0.01
E/1TeVB/1μG
.

190 A. DE ANGELIS, O. MANSUTTI and M. PERSIC
Fig. 2. – Flux of diffuse extra-galactic photons [10]. The cosmic microwave radiation peak isvisible.
The directional information of a photon coming from the galactic centre, at a distanceof 8 kpc from the Earth, is thus lost below an energy of 300 PeV.
Magnetic fields do not deflect photons, so that they point with very good approxi-mation to the position of the emission source. Since in a hadronic cascade photons canreach some 10% of the energy of the proton originating it, high-energy photons can be agood instrument to study the production of cosmic rays also of hadronic origin.
γ-rays are probably the most interesting part of the spectrum of photon emissionfrom astrophysical sources (fig. 2). During the recent years, a new window has beenopened in the observation of γ-rays above 20 MeV (essentially, the photons above thethreshold for pair production, plus some energy phase space), thanks to the availability ofnew photon detectors coming from technologies typical of experimental particle physics.We shall call such photons, i.e. the photons above 20 MeV, High-Energy (HE) γ-rays.Excellent reviews of high-energy gamma-ray astrophysics are available; see, for example,refs. [11-14].
Although arbitrary, the definition of high-energy γ-rays reflects profound astrophysicaland experimental arguments:
– the emission is non-thermal, and dominated by the conversion of gravitationalenergy into electromagnetic energy;
– it is impossible to concentrate the photons, which leads to telescopes radicallydifferent form the ones dedicated to observations of larger wavelengths;
– large quantity of background events are produced by charged cosmic particles.
High-energy γ-rays today are further classified; such a classification is of course ar-bitrary. In this paper the energy ranges associated to the definition of low-mediumenergy, High-Energy (HE), Very-High-Energy (VHE), Ultra-High-Energy (UHE) andExtremely-High-Energy (EHE) γ-rays, inspired with small modifications from [15], are

VERY-HIGH-ENERGY GAMMA ASTROPHYSICS 191
the following:
low-medium energy 0.1 MeV–20 MeV,HE 20 MeV–30 GeV,VHE 30 GeV–30 TeV,UHE 30 TeV–30 PeV,EHE 30 PeV–no limit.
The upper limits on EHE γ-rays come from the heavy reduction of the fluxes as the energyof the observed photons increases (at 30 PeV you expect no more than 1 photon/km2 perday from the most powerful sources).
High-energy γ-rays can be detected even if they come from very far distances, sincethe detection efficiency is good and the mean free path at those energies is large: regionsof the sky which are opaque in other energy bands can be transparent to X- and γ-rays,providing us a key to some fundamental physics phenomena.
2. – Production processes of gamma-rays
The source of high-energy photons from astrophysical objects is mainly gravitationalenergy released by collapses towards a central massive object. In the presence of angularmomentum, the dynamics of such a collapse can manifest itself in an accretion disk, withthe presence of jets of plasma outflowing the accretion plane. In addition, one could havecharacteristic photon signals also from annihilation/decay of heavy particles.
At the origin of the production of gamma-rays there is mostly the photon radiationoff charged particles, in general electrons. Such a radiation might happen due to
– Bremsstrahlung. An electron in an external field radiates due to bremsstrahlung.The characteristic spectrum of bremsstrahlung is proportional to 1/E, where E isthe energy of the emitted photon. The fractional energy loss due to bremsstrahlungafter crossing a distance d is (1 − e−d/X0), where X0 is called the radiation lengthof the material. 1/X0 is proportional to the density of the material.
– Synchrotron radiation. An electron moving in a magnetic field radiates due asynchrotron radiation strongly beamed into a cone of angle α ∼ me/E, where me
is the electron mass. Relativistic electrons in a typical galactic magnetic field emitsynchrotron radiation at Eγ � 0.05( Ee
TeV )2( B3 μG ) eV. For ultra-relativistic electrons
(typically encountered in astrophysical situations), the emission spectrum is power-law. High-energy synchrotron radiation can only originate in regions of very strongmagnetic field, e.g., close to a neutron star surface (where B � 1012 G).
Alternatively, primary photons can originate from nuclear transition, or decay of π0
in a hadronic environment.
2.1. Photons from gravitational collapses. – The basic interpretation for the produc-tion of high-energy photons from gravitational collapses is the so-called Self-SynchrotronCompton (SSC) mechanism. Synchrotron emission from ultra-relativistic electrons ac-celerated in a magnetic field generates photons with an energy spectrum peaked in theinfrared/X-ray range. Such photons in turn interact via Compton scattering with theirown parent electron population: since electrons are ultrarelativistic (with a Lorentz factorγe ∼ 104−5), the energy of the upscattered photon gets boosted by a factor � γ2
e .

192 A. DE ANGELIS, O. MANSUTTI and M. PERSIC
Fig. 3. – Differential energy spectrum of photons in the SSC model.
The upscattering of low-energy photons by collisions with high-energy electrons is theInverse Compton (IC) scattering. This mechanism is very effective for increasing thephoton energy (for this reason it is called “inverse”), and is important in regions of highsoft-photon energy density and energetic-electron number density.
For a power law population of relativistic electrons with spectral index q and a black-body population of soft photons at a temperature T , mean photon energies and energydistributions can be calculated for electron energies in the Thomson regime and in therelativistic Klein-Nishina regime:
〈Eγ〉 �43γ2
e 〈η〉 for γeη � mec2 (Thompson limit),(1)
� 12〈Ee〉 for γeη � mec
2 (Klein-Nishina limit),(2)
dNγ
dEγ∝ E
− q+12
γ for γeη � mec2 (Thompson limit),(3)
∝ E−(q+1)γ ln(Eγ) for γeη � mec
2 (Klein-Nishina limit),(4)
where Eγ denotes the scattered photon’s energy, Ee denotes the parent electron’s en-ergy, and η denotes the seed photon’s energy. A useful approximate relation link-ing the electron’s energy and the Comptonized photon’s energy is given by: Eγ �6.5( Ee
TeV )2( ηmeV ) GeV.
The Compton component can peak at GeV–TeV energies; the two characteristic syn-chrotron and Compton peaks are clearly visible on top of a general E−2
γ dependence.Figure 3 shows the resulting energy spectrum. This behavior has been verified with highaccuracy on the Crab Nebula, a steady VHE gamma emitter in the Milky Way whichis often used to calibrate VHE gamma instruments. If in a given region the photons bythe synchrotron radiation can be described by a power law with spectral index p, in a

VERY-HIGH-ENERGY GAMMA ASTROPHYSICS 193
Jet
ObscuringTorus
BlackHole
Narrow LineRegion
Broad LineRegion
AccretionDisk
Fig. 4. – Schematic diagram for the emission by an AGN [18].
first approximation the tails at the highest energies from both the synchrotron and theCompton mechanisms will have a spectral index p.
Alternative and complementary models of VHE emission involve two electron popu-lations, one—primary—accelerated within the jet and the other—secondary—generatedby cascades initiated by primary protons/nuclei that had been accelerated in the jet [16];or a population of extremely energetic protons [17]. In such cases, the energy of the pri-mary protons is expected by the physics of hadronic cascades to be one or two orders ofmagnitude larger than the energy of gammas, since the dominant mechanism for photonproduction is the decay of secondary π0-mesons into γγ. The study of γ-rays can thusprovide insights on the production of charged cosmic rays.
The case of AGN is particularly relevant. Supermassive black holes of ∼ 106–109 solarmasses (M�) and beyond reside in the cores of most galaxies; their fueling by infallingmatter produces a spectacular activity. The black hole is surrounded by an accretiondisk and by fast-moving clouds, which emit Doppler-broadened lines [18, 19]. In about10% of all AGN, the infalling matter turns on powerful collimated jets that shoot out inopposite directions, likely perpendicular to the disk, at relativistic speeds (see fig. 4).
If a relativistic jet is viewed at small angle to its axis the observed jet emission isamplified by relativistic beaming(2) and dominates the observed emission; in this casethe “quasi-stellar” (quasar) source is called blazar.
(2) Defining the relativistic Doppler factor as δ ≡ [γj(1 − βj cos θj)]−1 (with βj = vj/c the jet
speed normalized to the speed of light, γj = 1/q
(1 − β2j ), and θj the angle between the jet’s
direction and the line of sight), the observed and intrinsic luminosities at a given frequencyf are related by Lobs
f = δpLemf with p ∼ 2–3, and the variability timescales are related by
Δtobs = δ−1Δtem. For θ ∼ 0◦ and δ ∼ 2 γj the observed luminosity can be amplified by factors∼ 400–104 (for, typically, γj ∼ 10 and p ∼ 2–3); whereas θj ∼ 1/γj implies δ ∼ γj , with aluminosity amplification of ∼ 102–103.

194 A. DE ANGELIS, O. MANSUTTI and M. PERSIC
Fig. 5. – The active galactic nuclei sequence [21].
Given the compactness of blazars (as suggested by their observed short variabilitytimescales, which can be as low as a couple of minutes for doubling the flux), all GeV/TeVphotons would be absorbed through pair-producing γγ collisions with target X-ray/IRphotons. Beaming ensures the intrinsic radiation density to be much smaller than theobserved one, so that γ-ray photons encounter a much lower γγ opacity and hence man-age to leave the source: reversing the argument, γ-ray detection is a proof of stronglyanisotropic (e.g., beamed) emission.
The spectral energy distributions of blazars are generally characterized by two broadhumps, peaking at, respectively, infrared/X-ray and GeV-TeV frequencies [20]. Analysesof the spectral energy distribution of blazars [21,22] have suggested (see fig. 5) that:
1) higher/lower-luminosity objects have both humps peaking at lower/higher frequen-cies (they are called, respectively, LBLs and HBLs);
2) the luminosity ratio between the high- and low-frequency humps increases withluminosity;
3) at the highest luminosities the γ-ray output dominates the total luminosity.
Depending on the relative efficiency of the relativistic particles’ cooling through scat-tering with photon fields that are internal to jet or external to it, the synchrotron andCompton components can also peak at IR/optical and MeV–GeV energies (external-IC,or EIC, scheme, see ref. [23]). Hybrid SSC/EIC models have also been proposed [22].
The emitting particles are accelerated within the relativistic jets which carry energyfrom the central black hole outwards [24]. In the SSC framework this process is ap-proximated with a series of relativistically moving homogeneous regions (blobs), whereparticle acceleration and radiation take place (e.g., ref. [25]). The X-ray and γ-ray emis-sions, with their extremely fast and correlated multi-frequency variability, indicate that

VERY-HIGH-ENERGY GAMMA ASTROPHYSICS 195
often a single region dominates the emission; such a region appears to be close to thecentral engine.
A cornerstone prediction from a pure SSC model is a definite correlation between theyields from synchrotron radiation and from IC during a flare (it would be difficult toaccommodate in the theory an “orphan flare”, i.e. a flare in the IC region not accompa-nied by a flare in the synchrotron region). Evidence of neutrinos in a flare would be asmoking gun for the presence of a hadronic component.
Finally, another very important extragalactic source of γ-rays is given by Gamma-Ray Bursts (GRBs). GRBs are the most luminous events occurring in the universe sincethe Big Bang. The duration of a GRB is typically a few seconds, but it can rangefrom a few milliseconds to minutes, and the initial burst is usually followed by a longer-lived “afterglow”. Most of them are thought to come from a hypernova, or core-collapsesupernova, a cataclysmic event resulting from the internal collapse and violent explosionof a massive star (the mass of the star needs to be at least 8 times the solar mass toundergo this process). There is a prevailing consensus that the basic mechanism of GRBemission is an expanding relativistic fireball [26-28], with the beamed radiation due tointernal/external shocks (prompt/afterglow phase, respectively).
In the fireball shock framework, several models have predicted VHE emission duringboth the prompt and afterglow phases of the GRB (e.g., ref. [29]). This can occur as aresult of electron self-IC emission from the internal shock or the external forward/reverseshock. Seed photons can be produced locally (through synchrotron, or be the leftoverof the initial radiation content responsible for the acceleration of the fireball) or can beproduced in, e.g., the shell of a previously exploded supernova. In the latter case, thephotons emitted by the supernova may also act as targets for the γγ absorption, andin this case the VHE emission could be severely dimmed. If the emission processes areindeed synchrotron and IC, then a blazar-like spectral energy distribution is predicted,with a double-peak shape extending into the VHE band. In such theoretical freedom,VHE observations of GRBs could help constraining GRB models.
Fig. 6. – Simulated signals of the WIMPs self-annihilation: a narrow peak or a continuum belowthe mass of the WIMP [34].

196 A. DE ANGELIS, O. MANSUTTI and M. PERSIC
2.2. Production from self-annihilation of dark matter . – Evidence for the departureof cosmological motions from the predictions of Newtonian dynamics based on visiblematter, interpreted as due to the presence of dark matter, is well established—from galaxyscales (e.g., [30]) to galaxy-cluster scales (e.g., [31]) to cosmological scales (e.g., [32]).
Dark-matter particle candidates should be weakly interacting with ordinary matter(and hence neutral), otherwise they would have been already found. The theoreticallyfavored ones are heavier than the proton, and they are called Weakly Interacting MassiveParticles (WIMPs); the present experimental limits from accelerators indicate a minimummass of about 50 GeV [33]. WIMPs should be long-lived enough to have survived fromtheir decoupling from radiation in the early universe into the present epoch.
The main field of research for dark matter in the γ-ray energy range is related tothe detection of photons emitted by the self-annihilation of WIMPs. In particular, insupersymmetric models the lightest supersymmetric neutral particle, the neutralino, ispredicted to be a Majorana particle, and is thus a natural candidate for such a WIMP.
The self-annihilation of a heavy WIMP χ can generate photons (fig. 6) in three mainways:
a) directly via annihilation into a photon pair (χχ → γγ) or into a photon–Z-bosonpair (χχ → γZ) with Eγ = mχ or Eγ = (mχ − mZ)2/(4mχ), respectively; theseprocesses give a clear signature at high energies, being the energy monochromatic,but the process is suppressed at one loop, so the flux is expected to be very faint;
b) via annihilation into a quark pair which produces jets emitting in turn a large num-ber of γ photons (qq → jets → many photons); this process produces a continuumof gammas with energies below the WIMP mass; the flux can be large but thesignature might be difficult to detect;
c) via internal bremsstrahlung [35]; also in this case one has an excess of low energygammas with respect to a background which is not so well known.
The γ-ray flux from the annihilation of dark-matter particles of mass mDM can beexpressed as the product of a particle physics component times an astrophysics compo-nent:
(5)dN
dE=
14π
〈σv〉m2
DM
dNγ
dE︸ ︷︷ ︸Particle Physics
×∫
ΔΩ−l.o.s.
dl(Ω)ρ2DM︸ ︷︷ ︸
Astrophysics
.
The particle physics factor contains 〈σv〉, the velocity-weighted annihilation cross-section(there is indeed a possible component from cosmology in v), and dNγ/dE, the differentialγ-ray spectrum summed over the final states with their corresponding branching ratios.The astrophysical part corresponds to the squared density of the dark-matter distributionintegrated over line of sight (l.o.s.) in the observed solid angle.
It is clear that the expected flux of photons from dark-matter annihilations, and thusits detectability, depends crucially on the knowledge of the annihilation cross-section σ(which even within SUSY has uncertainties of one-two orders of magnitude for a givenWIMP mass) and of ρDM, which is even more uncertain, and enters in the calculationsquared. A cuspy dark matter profile, or even the presence of local clumps, could makethe detection easier by enhancing ρDM. The experimental data about the centre of the
VERY-HIGH-ENERGY GAMMA ASTROPHYSICS 197
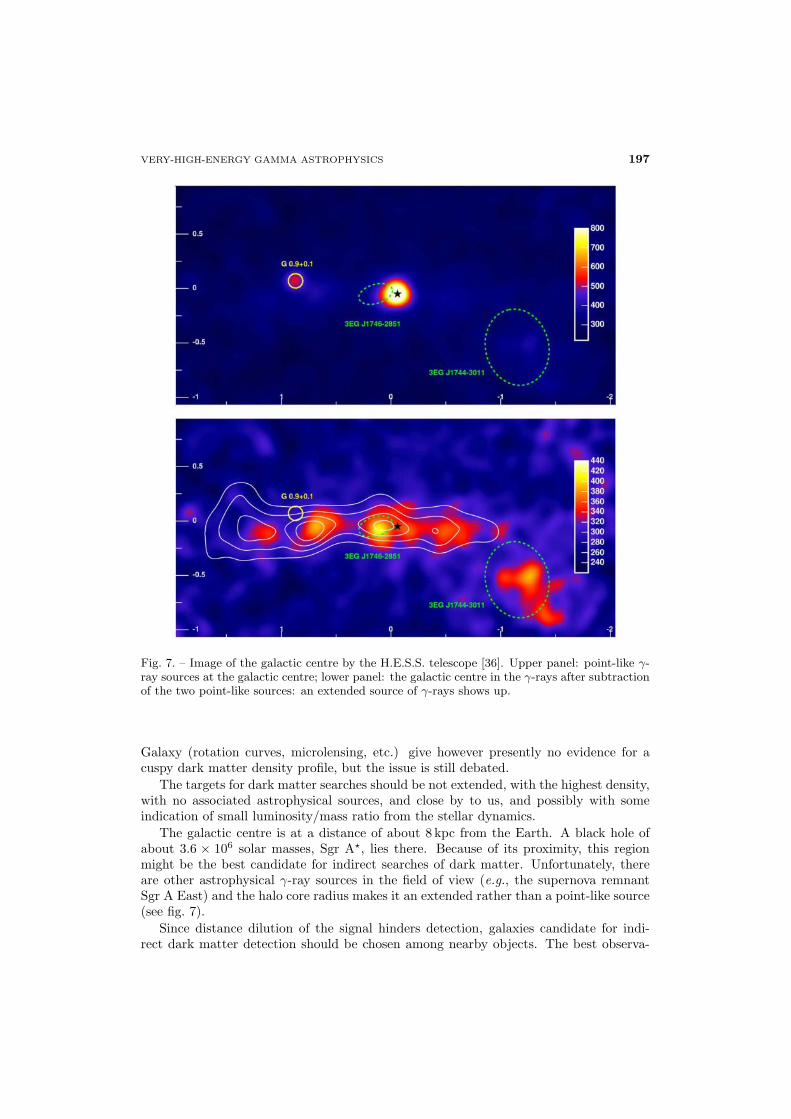
Fig. 7. – Image of the galactic centre by the H.E.S.S. telescope [36]. Upper panel: point-like γ-ray sources at the galactic centre; lower panel: the galactic centre in the γ-rays after subtractionof the two point-like sources: an extended source of γ-rays shows up.
Galaxy (rotation curves, microlensing, etc.) give however presently no evidence for acuspy dark matter density profile, but the issue is still debated.
The targets for dark matter searches should be not extended, with the highest density,with no associated astrophysical sources, and close by to us, and possibly with someindication of small luminosity/mass ratio from the stellar dynamics.
The galactic centre is at a distance of about 8 kpc from the Earth. A black hole ofabout 3.6 × 10⁶ solar masses, Sgr A�, lies there. Because of its proximity, this regionmight be the best candidate for indirect searches of dark matter. Unfortunately, thereare other astrophysical γ-ray sources in the field of view (e.g., the supernova remnantSgr A East) and the halo core radius makes it an extended rather than a point-like source(see fig. 7).
Since distance dilution of the signal hinders detection, galaxies candidate for indi-rect dark matter detection should be chosen among nearby objects. The best observa-
198 A. DE ANGELIS, O. MANSUTTI and M. PERSIC
0.01
0.1
1
10
100
1000
E (eV)
IR/O
MBR
Radio
a
b
c
1
2
3
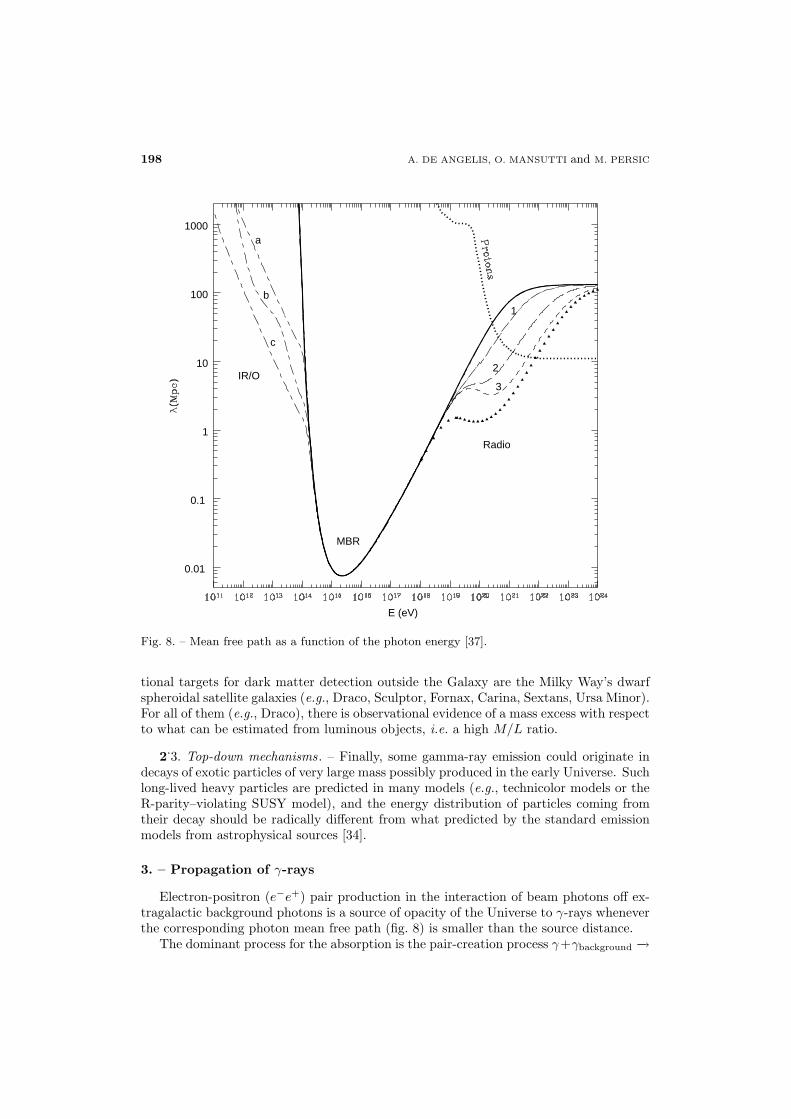
Fig. 8. – Mean free path as a function of the photon energy [37].
tional targets for dark matter detection outside the Galaxy are the Milky Way’s dwarfspheroidal satellite galaxies (e.g., Draco, Sculptor, Fornax, Carina, Sextans, Ursa Minor).For all of them (e.g., Draco), there is observational evidence of a mass excess with respectto what can be estimated from luminous objects, i.e. a high M/L ratio.
2.3. Top-down mechanisms. – Finally, some gamma-ray emission could originate indecays of exotic particles of very large mass possibly produced in the early Universe. Suchlong-lived heavy particles are predicted in many models (e.g., technicolor models or theR-parity–violating SUSY model), and the energy distribution of particles coming fromtheir decay should be radically different from what predicted by the standard emissionmodels from astrophysical sources [34].
3. – Propagation of γ-rays
Electron-positron (e−e+) pair production in the interaction of beam photons off ex-tragalactic background photons is a source of opacity of the Universe to γ-rays wheneverthe corresponding photon mean free path (fig. 8) is smaller than the source distance.
The dominant process for the absorption is the pair-creation process γ+γbackground −→
VERY-HIGH-ENERGY GAMMA ASTROPHYSICS 199
e+ + e−, for which the cross-section is described by the Bethe-Heitler formula [38]:
(6) σ(E, ε) � 1.25 × 10⁻²⁵(1 − β2) ×[2β(β2 − 2) + (3 − β4) ln
(1 + β
1 − β
)]cm2,
where β =√
1 − (mec2)2
E ε , me being the value of the electron mass, E is the energy of the(hard) incident photon and ε is the energy of the (soft) background photon. Notice thatonly QED, relativity and cosmology arguments are involved in the previous formula.
The cross-section in eq. (6) is maximized when ε � 500GeVE eV. Hence if E = 1 TeV
the interaction cross-section is maximal if ε � 0.5 eV (corresponding to a near-infraredsoft photon). In general, for very-high-energy photons the γγ → e+ + e− interactionbecomes important with optical/infrared photons, whereas the interaction with the cos-mic microwave background becomes dominant at E ∼ 1 PeV. Therefore, the backgroundcomponent relevant for interaction with VHE photons is the optical/infrared backgroundradiation. This is called extragalactic background light (EBL) [40].
The EBL consists of the sum of starlight emitted by galaxies throughout their wholecosmic history, plus possible additional contributions, like, e.g., light from hypotheticalfirst stars that formed before galaxies were assembled. Therefore, in principle the EBLcontains important information both the evolution of baryonic components of galaxiesand the structure of the Universe in the pre-galactic era.
The attenuation suffered by observed VHE spectra can thus be used to derive con-straints on the EBL density [41]. First limits on the EBL were obtained in ref. [42],while recent determinations from the detection of distant VHE sources are reportedin [43,44]. Figure 9 shows the estimated photon number density of the background pho-tons as composed by the radio background, the cosmic microwave background, and theinfrared/optical/ultraviolet background (EBL).
Specifically, the probability for a photon of observed energy E to survive absorptionalong its path from its source at redshift z to the observer plays the role of an attenuationfactor for the radiation flux, and it is usually expressed in the form
(7) e−τ(E,z).
The coefficient τ(E, z) is called optical depth.To compute the optical depth of a photon as a function of its observed energy E and
the redshift z of its emission one has to take into account the fact that the energy Eof a photon scales with the redshift z as (1 + z) [45]; thus when using eq. (6) we musttreat the energies as function of z and evolve σ(E(z), ε(z), θ) for E(z) = (1 + z)E andε(z) = (1+z)ε, where E and ε are the energies at redshift z = 0. The optical depth is thencomputed [40] by convolving the photon number density of the background photon fieldwith the cross-section between the incident γ-ray and the background target photons,and integrating the result over the distance, the scattering angle and the energy of the(redshifted) background photon:
(8) τ(E, z) =∫ z
0
dl(z)∫ 1
−1
d cos θ1 − cos θ
2
∫ ∞
2(mec2)2E(1−cos θ)
dε(z) nε(ε(z), z) σ(E(z), ε(z), θ),
where θ is the scattering angle, nε(ε(z), z) is the density for photons of energy ε(z) at the

200 A. DE ANGELIS, O. MANSUTTI and M. PERSIC
Fig. 9. – Photon number density of the intergalactic radiation field at z = 0 as developedby Lee [39], composed by the radio background (short dashed line), the cosmic microwavebackground (dense dotted line), and the infrared/optical/ultraviolet background (EBL) (longdashed line).
redshift z, and l(z) = cdt(z) is the distance as a function of the redshift, defined by [46]
(9)dl
dz=
c
H0
1
(1 + z) [(1 + z)2(ΩM z + 1) − ΩΛ z(z + 2)]12
.
In the last formula H0 is the Hubble constant, ΩM is the matter density (in units ofthe critical density, ρc) and ΩΛ is the “dark energy” density (in units of ρc); therefore,since the optical depth depends also on the cosmological parameters, its determinationconstrains the values of the cosmological parameters [47] if the cosmological emission ofgalaxies is known.
The energy dependence of τ leads to appreciable modifications of the observed sourcespectrum (with respect to the spectrum at emission) even for small differences in τ ,due to the exponential dependence described in eq. (7). Since the optical depth (andconsequently the absoption coefficient) increases with energy, the observed flux resultssteeper than the emitted one.
The horizon (e.g., ref. [47, 48]) or attenuation edge (e.g., ref. [49]) for a photon ofenergy E is defined as the distance corresponding to the redshift z for which τ(E, z) = 1,that gives an attenuation by a factor 1/e (see fig. 10).
Other interactions than the one just described might change our picture of the atten-uation of γ-rays, and they are presently subject of thorough studies, since the presentdata on the absorption of photons are hardly compatible with the pure QED picture. For

VERY-HIGH-ENERGY GAMMA ASTROPHYSICS 201
Fig. 10. – Gamma-ray horizon compared with the lower energy limit of some gamma detectors:the MAGIC and H.E.S.S. telescopes; the curves of the photon energy vs. horizon are computedfor different background evolution models by Blanch and Martinez in the second citation inref. [47].
Best fit (Kneiske et al.) →
↓ Lowest EBL
↓ DA.R.Ma average
Ob
serv
ed f
lux
(%)
Photon energy (GeV)100 500 1000
0.001
0.002
0.005
0.01
0.02
0.05
0.1
0.2
0.5
1
2
5
10
20
50
100
Fig. 11. – The two lowest lines give the fraction of photons surviving from a source at thesame distance of 3C 279 without the oscillation mechanism, for the “best-fit model” of EBL(dashed line) and for the minimum EBL density compatible with cosmology [53]. The solid linerepresents the prediction in the DARMA model [51], with an uncertainty represented by thegray band.

202 A. DE ANGELIS, O. MANSUTTI and M. PERSIC
Fig. 12. – Transparency of the atmosphere for different photon energies and possible detectiontechniques [56].
example, γ-rays might interact with (possibly quintessential) very light axion-like parti-cles, which might change the absorption length [50, 51]. In particular, in the DARMAmodel [51], such contribution might enhance the photon flux via a regeneration mecha-nism (see fig. 11). Such an interaction would be mediated by the (intergalactic) magneticfields [9]. A similar mechanism invokes the conversion of photons into axion-like particlesat the emission source [52].
Finally, mechanisms in which the absorption is changed through violation of theLorentz invariance as in ref. [54] are also under test; such models are particularly appeal-ing within scenarios inspired to quantum gravity [55].
4. – Detection techniques
The detection of high-energy photons is complicated by the absorption by the atmo-sphere, and by the faintness of the signal, in particular when compared to the corre-sponding charged particles of similar energy.
4.1. Atmospheric transparency and processes of interaction. – Photons above theUltra-Violet (UV) region are shielded by the Earth’s atmosphere (see fig. 12).
Photons interact with matter mostly due to the Compton mechanism and to thephotoelectric effect at energies up to about 20 MeV, while e+e− pair production domi-nates above about 20 MeV. Above about 50 GeV the production of atmospheric showerstakes place, dominated by the pair production and the bremsstrahlung mechanisms: anenergetic photon scatters on an atmospheric nucleus and produces a pair, which emitssecondary photons via bremsstrahlung; such photons produce in turn a e+e− pair, and

VERY-HIGH-ENERGY GAMMA ASTROPHYSICS 203
Fig. 13. – Longitudinal shower development [12]. The parameter s describes the shower age,being 0 at the first interaction, 1 at the maximum and 2 at the death [57].
so on, giving rise to a shower of charged particles and photons. The process is describede.g. in [57,58].
The longitudinal development of typical photon-induced extensive air showers isshown in fig. 13 for different values of the primary energies. The maximum showersize occurs approximately ln(E/ε0) radiation lengths(3) into the atmosphere, generallywell above ground (the critical energy ε0, about 80 MeV in air, is the energy at which theionization energy loss starts dominating the energy loss by bremsstrahlung). Anyway, alarge number of shower particles may reach the ground, especially at mountain altitudes.
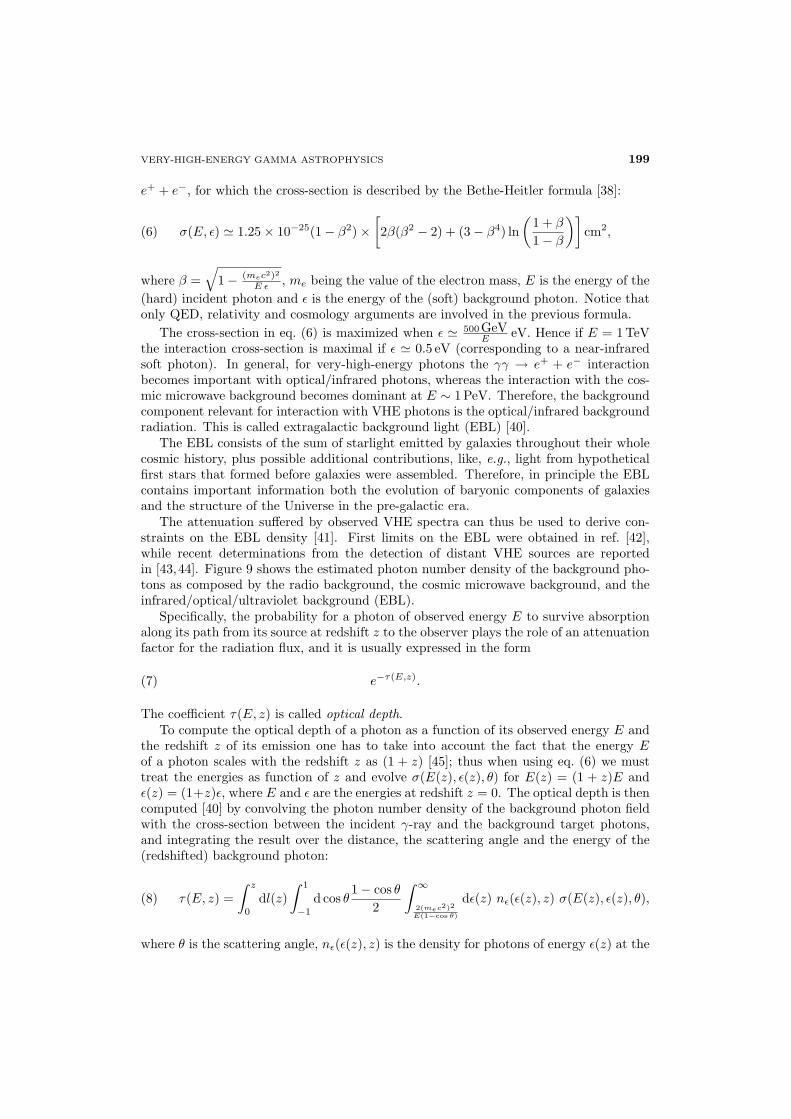
The dominant high-energy hadrons, protons and nuclei, also interact high in theatmosphere. The process characterizing hadronic showers is not dissimilar (fig. 14).The hadronic interaction length in air is about 61 g/cm2 for protons, being shorter forheavier nuclei. The transverse development of hadronic showers is in general wider thanfor electromagnetic showers, and fluctuations are larger.
At sea level the thickness of the atmosphere corresponds to about 28 radiation lengths.This means that only satellite-based detectors can detect primary X/γ-rays. Since thefluxes of high-energy photons are low and decrease rapidly with increasing energy, VHEad UHE gammas can be detected only from the atmospheric showers they produce, i.e.by means of ground-based detectors; such detectors should be placed at high altitudes,where atmospheric dimming is lower.
Let us now examine the characteristics of the satellite-based and ground-based detec-tors for high-energy photons.
(3) The radiation length X0 is both the mean distance over which a high-energy electron losesall but 1/e of its energy by radiation, and 7/9 of the mean free path for pair production by ahigh-energy photon. The radiation length for air is about 37 g/cm2.
204 A. DE ANGELIS, O. MANSUTTI and M. PERSIC
e+
e+
e-
primary γ
e–
e+
e+e–e+
e–
e–
e–
e–
e+ e+
+
+π –π
+-K , etc.nucleons,
+-K , etc.nucleons,
0π
π+0π
μ–
_
γγ
μ
γ
γ
μν
μν
cosmic ray (p, α, Fe ...)
γ γ
γγ
atmospheric nucleus
EM shower
EM shower
EM showeratmospheric nucleus
Fig. 14. – Schematic representation of two atmospheric showers initiated by a photon (left) orby a cosmic ray (right) [59].
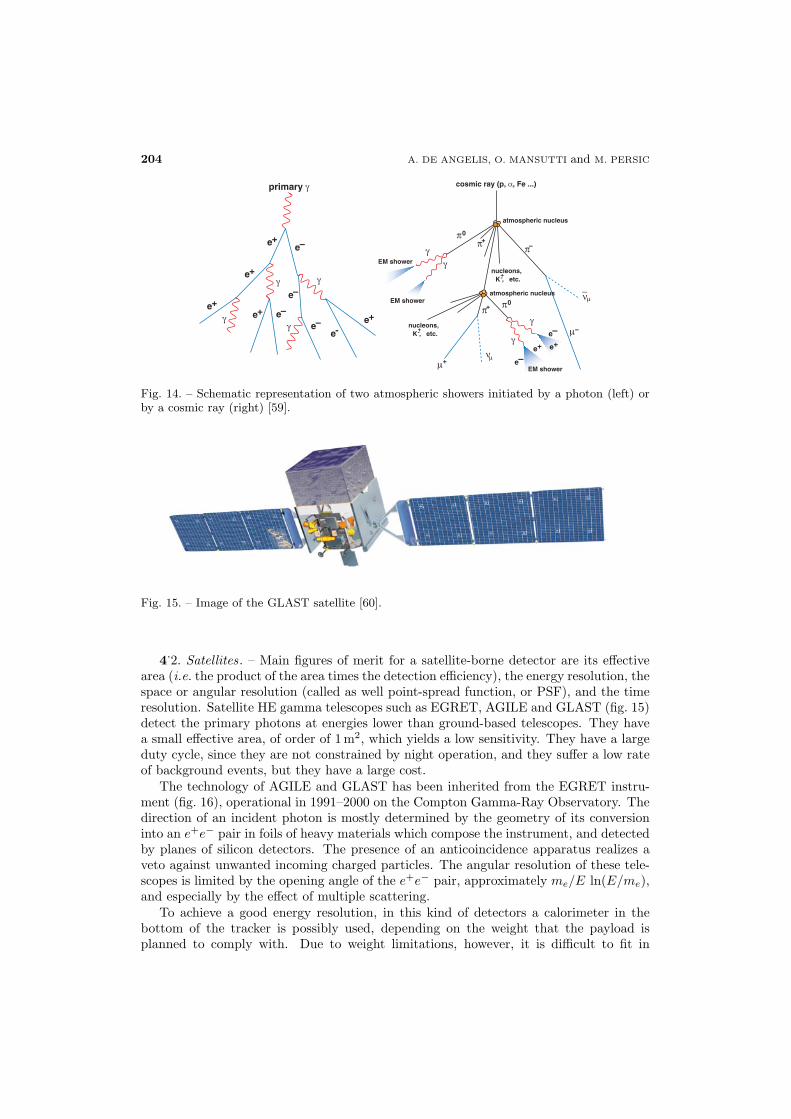
Fig. 15. – Image of the GLAST satellite [60].
4.2. Satellites. – Main figures of merit for a satellite-borne detector are its effectivearea (i.e. the product of the area times the detection efficiency), the energy resolution, thespace or angular resolution (called as well point-spread function, or PSF), and the timeresolution. Satellite HE gamma telescopes such as EGRET, AGILE and GLAST (fig. 15)detect the primary photons at energies lower than ground-based telescopes. They havea small effective area, of order of 1 m2, which yields a low sensitivity. They have a largeduty cycle, since they are not constrained by night operation, and they suffer a low rateof background events, but they have a large cost.
The technology of AGILE and GLAST has been inherited from the EGRET instru-ment (fig. 16), operational in 1991–2000 on the Compton Gamma-Ray Observatory. Thedirection of an incident photon is mostly determined by the geometry of its conversioninto an e+e− pair in foils of heavy materials which compose the instrument, and detectedby planes of silicon detectors. The presence of an anticoincidence apparatus realizes aveto against unwanted incoming charged particles. The angular resolution of these tele-scopes is limited by the opening angle of the e+e− pair, approximately me/E ln(E/me),and especially by the effect of multiple scattering.
To achieve a good energy resolution, in this kind of detectors a calorimeter in thebottom of the tracker is possibly used, depending on the weight that the payload isplanned to comply with. Due to weight limitations, however, it is difficult to fit in

VERY-HIGH-ENERGY GAMMA ASTROPHYSICS 205
calorimeter
γ ray
e+ e-
particle- tracking detectors
conversion foils
charged-particle anticoincidence shield
pair-
Fig. 16. – Pair-production in the typical structure of a satellite detector after an incident γ-rayenters the telescope [61].
Fig. 17. – Example of a region of space explored by AGILE in a single pointing; the Field ofView (FoV) is indicated [62].
a calorimeter that completely holds the showers; this leakage downgrades the energyresolution. Since at low energies the multiple scattering is the dominant process, theoptimal detector design is a tradeoff between small radiation length (which decreasesthe conversion efficiency) and large number of samplings (which increases the powerconsumption, limited by the problems of heat dissipation in space).
AGILE is a completely Italian satellite launched in April 2007. Its structure is verysimilar to GLAST, but its effective area is about one order of magnitude smaller. Thephysics runs of AGILE (see fig. 17) started on September 1st, 2007, but many remarkablephysics results were observed already during commissioning. Several sources, some ofwhich new, have already been found at > 1 GeV.

206 A. DE ANGELIS, O. MANSUTTI and M. PERSIC
Fig. 18. – On the first row, the two GLAST instruments: the Large Area Telescope (LAT)and the GLAST Burst Monitor (GBM) [63]. On the second row, a picture of the GLASTsatellite [64]. On the third row, the first gamma conversion detected by GLAST [60].

VERY-HIGH-ENERGY GAMMA ASTROPHYSICS 207
Fig. 19. – GLAST LAT performance compared with EGRET [65].
The GLAST observatory, launched in June 2008, is composed by the spacecraft andby two instruments: the Large Area Telescope (LAT) and the GLAST Burst Monitor(GBM). The two instruments are integrated and they work as a single observatory. Thestructure of the LAT consists mainly in a tracker, an anticoincidence apparatus and acalorimeter (see fig. 18). Its energy range goes from 20 MeV to about 300 GeV, while theenergy range explored by the GMB is 10 keV–25 MeV. The GLAST LAT outperformsEGRET by two orders of magnitude thanks to its effective area that approaches 1 m2 (tobe compared to 0.15 m2 from EGRET) and its time resolution of 10μs; a comparison isshown in fig. 19. Figure 20 shows a simulation of the HE γ-ray sky emerging from oneyear of scanning-mode observation by GLAST.
4.3. Ground-based detectors. – Ground-based VHE telescopes such as MILAGRO,ARGO, CANGAROO, H.E.S.S., MAGIC and VERITAS detect the secondary particles ofthe atmospheric showers produced by primary photons and cosmic rays of energy higherthan the primaries observed by satellites. The two kinds of detectors are complementary(see fig. 2). Such ground-based detectors have a huge effective area, so their sensitivityis high; they detect a huge amount of background events, and they have low cost.
There are two main classes of ground based HE gamma detectors: the Extensive AirShower arrays (EAS) and the Cherenkov telescopes (see fig. 21).
4.3.1. EAS detectors. The EAS detectors, such as MILAGRO and ARGO, are madeby a large array of detectors sensitive to charged secondary particles generated by theatmospheric showers. They have high duty cycle and a large FoV, but a low sensitivity.Since the maximum of a photon-initiated shower at 1 TeV typically occurs at 8 km a.s.l.,the energy threshold of such detectors is rather large.

208 A. DE ANGELIS, O. MANSUTTI and M. PERSIC
Fig. 20. – One-year simulation of the sources that GLAST will detect [60]; the red color corre-sponds to photons at an energy in the range 0.1–0.4 GeV; green corresponds to the energy range0.4–1.6 GeV and blue to more than 1.6 GeV.
Fig. 21. – Sketch of the operation of Cherenkov telescopes and of EAS [66].
Direct sampling of the charged particles in the shower can be achieved:
– Either by using an array of sparse scintillator-based detectors, as for example inthe Tibet AS instrument (located at 4100 m a.s.l. to reduce the threshold). For anenergy of 100 TeV there are about 50 000 electrons at mountain-top altitudes, sosampling is possible.
– Or by effective covering of the ground to ensure efficient collection and hence lowerenergy threshold.
– The ARGO-YBJ detector (see fig. 22 [67]) at the Tibet site follows this ap-proach. It is made of an array of resistive plate counters. Its energy thresholdlies in the 0.5 TeV–1 TeV range. The first results show that ARGO can detectthe Crab Nebula with a significance of about 5 standard deviations (σ) in50 days of observation.

VERY-HIGH-ENERGY GAMMA ASTROPHYSICS 209
Fig. 22. – View of the laboratory of the ARGO detector [67].
Fig. 23. – The MILAGRO detector [68].
– MILAGRO (see fig. 23) is a water-Cherenkov based instrument near LosAlamos (about 2600 m altitude). It is made of photomultipliers in water.It detects the Cherenkov light(4) produced by the secondary particles of theshower when they pass through the water. MILAGRO can detect the CrabNebula with a significance of about 5σ in 100 days of observation, at a medianenergy of about 20 TeV.
The energy threshold of EAS detectors is at best in the 0.5 TeV–1 TeV range, andit also depends on where the first interaction of the atmospheric shower occurred, so
(4) The Cherenkov light is a radiation produced in a medium by charged particles which travelfaster than the speed of light in that medium; since its differential probability is proportional to(1/λ) in the visible, it peaks on the blue. Cherenkov photons are emitted at an angle θC suchthat cos(θC) = 1
βn, where n is the refractive index of the medium in which the phenomenon
takes place, and β is the speed of light in units of c.

210 A. DE ANGELIS, O. MANSUTTI and M. PERSIC
200 m100 m
1000
100
10
1
1 TeV
300 GeV
100 GeV
30 GeV
Ph
oto
ns/
m 2
R
Fig. 24. – Density per square meter of Cherenkov photons between 300 and 600 nm as a functionof the distance R from the shower impact point for various photon energies as seen at 2 km a.s.l.for vertical showers.
such detectors are built to detect UHE photons as well as the most energetic VHEgammas. At such energies fluxes are small, so they need to have large surfaces, of orderof 104 m2. EAS detectors are possibly provided with a muon detector devoted to hadronrejection; otherwise the discrimination from the background can be done based on thereconstructed shower shape. The direction of the detected primary particles is computedby taking into account their arrival times, and the angular precision is about 1 degree.Energy resolution is also poor. The calibration can be performed by studying the shadowin the reconstructed directions caused by the presence of the Moon.
4.3.2. Cherenkov telescopes. Imaging Atmospheric Cherenkov Telescopes (IACTs),such as CANGAROO III, H.E.S.S., MAGIC and VERITAS, detect the Cherenkov pho-tons produced in air by charged, locally superluminal particles in atmospheric showers.For reasons explained below, they have a low duty cycle and a small FoV, but they havea high sensitivity and a low energy threshold.
At sea level, the value of the Cherenkov angle θC in air for β = 1 is about 1.3◦, whileat 8 km a.s.l. it is about 1◦. The energy threshold at sea level is 21 MeV for a primaryelectron and 44 GeV for a primary muon.
Half of the emission occurs within 21 m of the shower axis (about 70 m for a protonshower).
Since the intrinsic angular spread of the charged particles in an electromagnetic showeris about 0.5 degrees, the opening of the light cone is dominated by the Cherenkov angle.As a consequence, the ground area illuminated by Cherenkov photons from a showerof 1 TeV (the so-called “light pool” of the shower) has a radius of about 120 m. Theheight of maximal emission for a primary of 1 TeV of energy is approximately 8 km a.s.l.,and about 150 photons per m2 arrive at 2000 m a.s.l. in the visible frequencies. Thisdependence is not linear, being the yield of about 10 photons per square meter at 100 GeV

VERY-HIGH-ENERGY GAMMA ASTROPHYSICS 211
Top of atmosphere
Cherenkov light emissionunder characteristic angle θC
First interaction with nuclei ofatmosphere at about 20 km height
Primary particle
≈10
km
a.s
.l.
≈20m
≈10km
Camera (cleaned event)
Cherenkov Telescope
Fig. 25. – The observational technique adopted by the Imaging Atmospheric Cherenkov Tele-scopes (IACTs) [59].
(fig. 24). The shower has a duration of a few (about 2 to 3) ns at ground; this durationis maintained by an isochronous (parabolic) reflector.
The observational technique used by the IACTs is to project the Cherenkov lightcollected by a large optical reflecting surface onto a camera made by an array of photo-multiplier tubes, with typical quantum efficiency of about 30%, in the focal plane of thereflector (see fig. 25). The camera has a typical diameter of about 1 m, which correspondsto a FoV of 5◦ × 5◦. The signal collected by the camera is analogically transmitted totrigger systems, similar to the ones used in high-energy physics. The events which passedthe trigger levels are sent to the data acquisition system, which typically operates at afrequency of a few hundreds Hz. The typical resolution on the arrival time of a signal ona photomultiplier is better than 1 ns.
Since, as discussed above, about 10 photons per square meter arrive in the light poolfor a primary photon of 100 GeV, a light collector of area 100 m2 is sufficient to detectgamma-ray showers if placed at mountain-top altitudes. Due to the faintness of thesignal, data can typically be taken only in moonless time, or with moderate moonlight,and without clouds, which limits the total observation time to some 1500 hours per year.
In the GeV–TeV region the background from charged particles is three orders ofmagnitude larger than the signal. Hadronic showers, however, have a different topologywith respect to electromagnetic showers, being larger and more subject to fluctuations.One can thus separate showers induced by gamma-ray from the hadronic ones on thebasis of the shower shape.
Most of the present identification techniques rely on a technique pioneered by Hillasin the 80’s [69]; the discriminating variables are called “Hillas parameters”. Severalnew techniques have been proposed to improve these results [70]; a recent review on

212 A. DE ANGELIS, O. MANSUTTI and M. PERSIC
Fig. 26. – Development of vertical 1 TeV proton and photon showers in the atmosphere. Theupper panels show the positions in the atmosphere of all shower electrons above the Cherenkovthreshold; the lower panels show the resulting Cherenkov images in the focal plane of a 10 mreflecting mirror when the showers fall 100 m from the detector (the center of the focal plane isindicated by a star) [12].
the problem of background subtraction is published in [71]. The intensity (and area) ofthe image produced is an indication of the shower energy, while the image orientation isrelated to the shower direction. The shape of the image is different for different primaryparticles, in such a way that its characteristics are used to distinguish between eventsproduced by photons and by other particles, and to reject the background from chargedparticles (fig. 26). Since the signal points to a given source, while the background isexpected to be uniformly distributed, the image is circular for a shower falling directlyon the detector, becoming more elliptical as the incoming photon displays a nonzeroimpact parameter. For a photon coming from the source, the angle α in fig. 27 should

VERY-HIGH-ENERGY GAMMA ASTROPHYSICS 213
Fig. 27. – Left: imaging parameters used by air Cherenkov telescopes to reject the hadroniccosmic-ray background: α, width, and length. The ellipse represents the outline of the showerimage in the focal plane of the telescope. Right: an “α-plot” of the signal from the Crab Nebula,by the MAGIC telescope.
be close to zero, while it should not peak to zero for hadrons, since their direction doesnot come from a single source.
The time structure of Cherenkov images provides an additional discriminator againstthe hadronic background [72], which can be used by isochronous detectors (with parabolicshape) and with a signal integration time smaller than the duration of the shower (i.e.better than 1–2 GHz).
Two pointing modes can be used for the observation: the on-off mode and the wobblemode.
– For the on-off mode, in the “on” phase the source is located in the camera center;in a different time a similar sky region without sources is pointed, and this mea-surement (called “off”) is used to estimate the background. Since this cannot bedone at the same time, conditions (weather, night sky background, etc.) can bedifferent: thus an appropriate scaling of the background measurement is needed.
– Instead of observing the source in the center of the camera, the telescope can bepointed to a sky position slightly off-source. The background can then be extractedfrom a so called anti-source position symmetrical with respect to the camera center.This observation mode is called wobble mode. Wobble mode has in general thedisadvantage of a slighly worse sensitivity, but it saves observation time.
Systems of more than one Cherenkov telescope provide a better background rejection,and a better angular and energy resolution (see fig. 28) than a single telescope.
There are four large operating IACTs: CANGAROO III, H.E.S.S., MAGIC and VER-ITAS (see fig. 29), two located in the southern hemisphere and two in the northernhemisphere.
– CANGAROO (the present set-up is called CANGAROO III) is a Japanese andAustralian observatory placed near Woomera (Australia). In its final design it willbe a system of four telescopes with a surface of 57 m2 each. The third telescope hasbeen completed in 2004; its precursors, CANGAROO (single telescope) and CAN-GAROO II (two telescopes), started their activity in 1992 and 1999, respectively.

214 A. DE ANGELIS, O. MANSUTTI and M. PERSIC
Fig. 28. – A system of more than one Cherenkov telescope [73].
Fig. 29. – Location of the four big IACTs [74].
– The H.E.S.S. observatory (fig. 30) is composed by four telescopes with surfaceof 108 m2 each, working since early 2003, while the first of these telescopes isoperating since summer 2002. It is located in the Khomas highlands of Namibia,and it involves several countries, Germany and France in particular. In the futureanother telescope with a surface of about 600 m2 will be placed in the center ofthe present array. Among the present detectors, it has the best sensitivity (about1% Crab at 5 standard deviations in 50 hours of observation) and the best angular
VERY-HIGH-ENERGY GAMMA ASTROPHYSICS 215
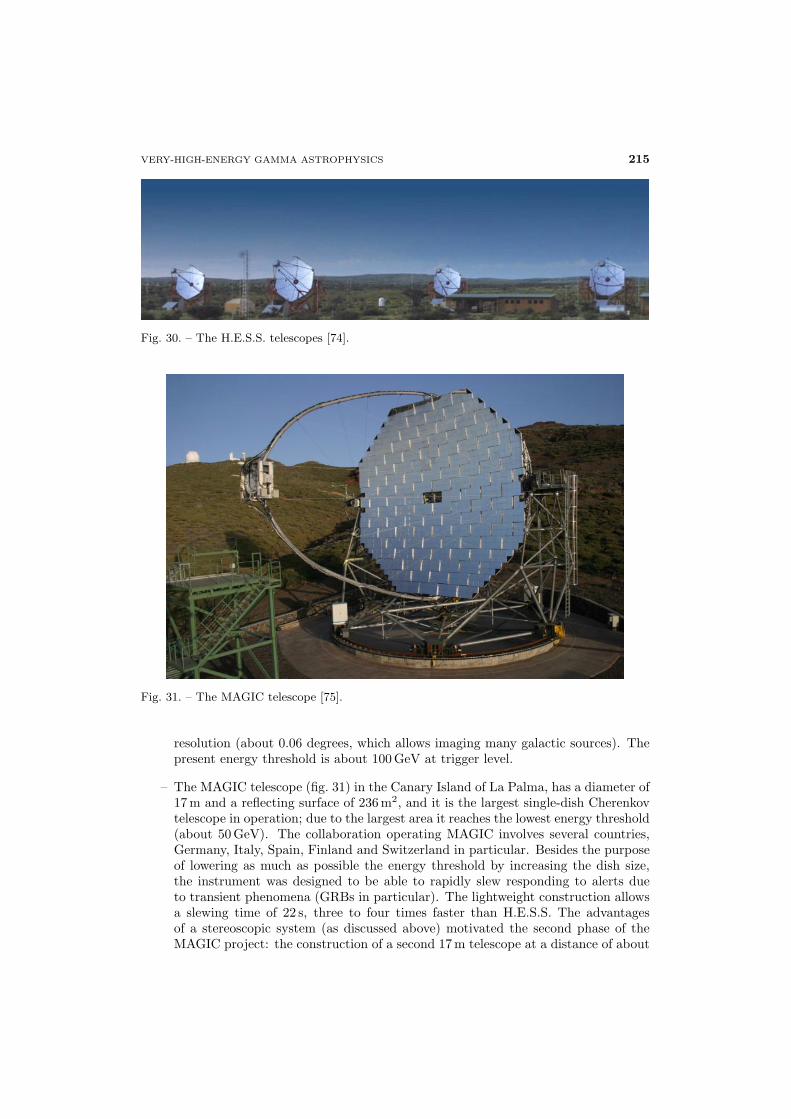
Fig. 30. – The H.E.S.S. telescopes [74].
Fig. 31. – The MAGIC telescope [75].
resolution (about 0.06 degrees, which allows imaging many galactic sources). Thepresent energy threshold is about 100 GeV at trigger level.
– The MAGIC telescope (fig. 31) in the Canary Island of La Palma, has a diameter of17 m and a reflecting surface of 236 m2, and it is the largest single-dish Cherenkovtelescope in operation; due to the largest area it reaches the lowest energy threshold(about 50 GeV). The collaboration operating MAGIC involves several countries,Germany, Italy, Spain, Finland and Switzerland in particular. Besides the purposeof lowering as much as possible the energy threshold by increasing the dish size,the instrument was designed to be able to rapidly slew responding to alerts dueto transient phenomena (GRBs in particular). The lightweight construction allowsa slewing time of 22 s, three to four times faster than H.E.S.S. The advantagesof a stereoscopic system (as discussed above) motivated the second phase of theMAGIC project: the construction of a second 17 m telescope at a distance of about
216 A. DE ANGELIS, O. MANSUTTI and M. PERSIC
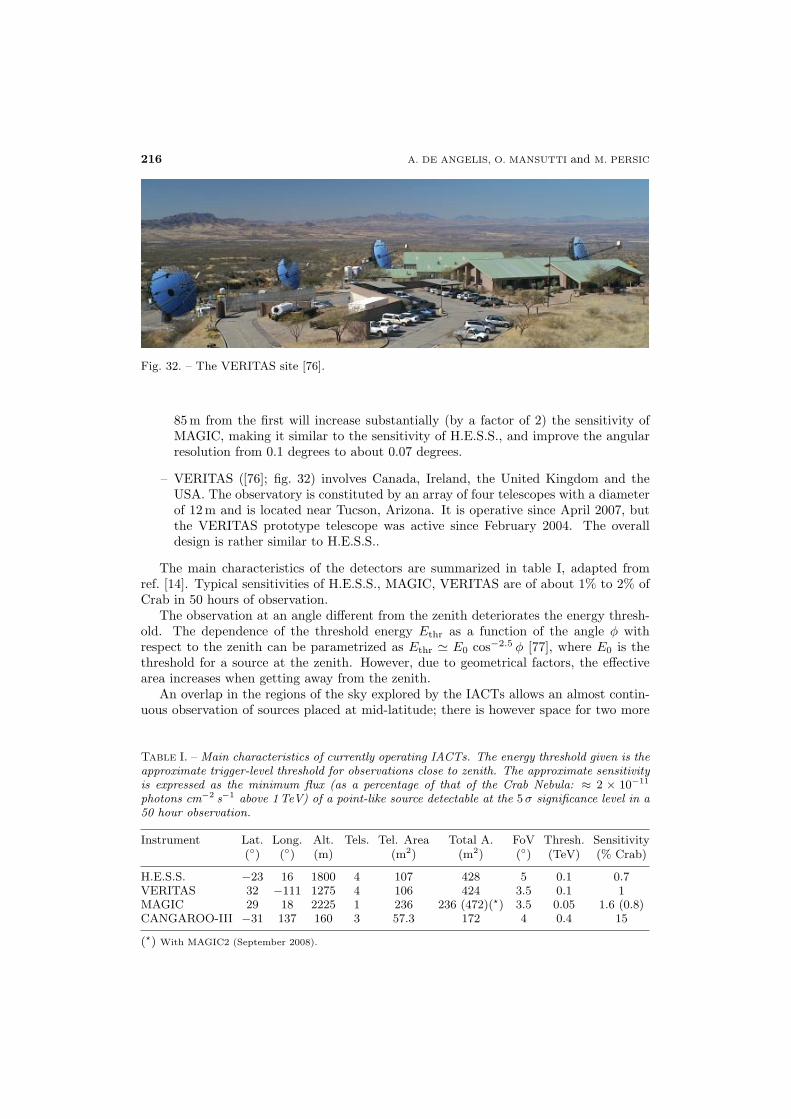
Fig. 32. – The VERITAS site [76].
85 m from the first will increase substantially (by a factor of 2) the sensitivity ofMAGIC, making it similar to the sensitivity of H.E.S.S., and improve the angularresolution from 0.1 degrees to about 0.07 degrees.
– VERITAS ([76]; fig. 32) involves Canada, Ireland, the United Kingdom and theUSA. The observatory is constituted by an array of four telescopes with a diameterof 12 m and is located near Tucson, Arizona. It is operative since April 2007, butthe VERITAS prototype telescope was active since February 2004. The overalldesign is rather similar to H.E.S.S..
The main characteristics of the detectors are summarized in table I, adapted fromref. [14]. Typical sensitivities of H.E.S.S., MAGIC, VERITAS are of about 1% to 2% ofCrab in 50 hours of observation.
The observation at an angle different from the zenith deteriorates the energy thresh-old. The dependence of the threshold energy Ethr as a function of the angle φ withrespect to the zenith can be parametrized as Ethr � E0 cos−2.5 φ [77], where E0 is thethreshold for a source at the zenith. However, due to geometrical factors, the effectivearea increases when getting away from the zenith.
An overlap in the regions of the sky explored by the IACTs allows an almost contin-uous observation of sources placed at mid-latitude; there is however space for two more
Table I. – Main characteristics of currently operating IACTs. The energy threshold given is theapproximate trigger-level threshold for observations close to zenith. The approximate sensitivityis expressed as the minimum flux (as a percentage of that of the Crab Nebula: ≈ 2 × 10⁻¹¹
photons cm−2 s−1 above 1TeV) of a point-like source detectable at the 5 σ significance level in a50 hour observation.
Instrument Lat. Long. Alt. Tels. Tel. Area Total A. FoV Thresh. Sensitivity(◦) (◦) (m) (m2) (m2) (◦) (TeV) (% Crab)
H.E.S.S. −23 16 1800 4 107 428 5 0.1 0.7VERITAS 32 −111 1275 4 106 424 3.5 0.1 1MAGIC 29 18 2225 1 236 236 (472)(�) 3.5 0.05 1.6 (0.8)CANGAROO-III −31 137 160 3 57.3 172 4 0.4 15
(�) With MAGIC2 (September 2008).

VERY-HIGH-ENERGY GAMMA ASTROPHYSICS 217
Table II. – A comparison of the characteristics of GLAST, the IACTs and of the EAS particledetector arrays.
Quantity GLAST IACTs EAS
Energy range 20MeV–200GeV 100 GeV–50 TeV 400GeV–100TeVEnergy resolution 5–10% 15–25%(∗) ∼ 50%Duty Cycle 80% 15% > 90%FoV 4π/5 5 deg × 5 deg 4π/6Resolution(PSF) 0.1 deg 0.07 deg 0.5 degSensitivity(∗∗) 1% Crab (1 GeV) 1% Crab (0.5 TeV) 0.5 Crab (5 TeV)
(∗) Decreases to 15% after cross-calibration with GLAST [78].
(∗∗) Computed over one year for GLAST and the EAS, and over 50 hours for the IACTs.
Fig. 33. – Sensitivities of some present and future HE gamma detectors [79], measured as theminimum intensity source detectable at 5 σ. The performance for EAS and satellite detector isbased on one year of data taking; for Cherenkov telescopes it is based on 50 hours of data. Thesensitivity curve for VERITAS is between MAGIC and MAGIC2.
installations, one in South America and one (MACE, already scheduled for construction)in India.
Negotiations towards a Memorandum of Understanding is ongoing to balance compe-tition and cooperation among the present IACTs.
4.4. Resume. – A simplified comparison of the characteristics of the GLAST LATsatellite detector, of the IACTs and of the EAS detectors (ground-based) is given intable II. The sensitivities of the above described high-energy detectors are shown infig. 33.

218 A. DE ANGELIS, O. MANSUTTI and M. PERSIC
Fig. 34. – Third EGRET catalog (1999) at energies greater than 100MeV [80].
o-180o+180
o+90
o-90
-ray sourcesγVHE
Blazar (HBL)Blazar (LBL)
Flat Spectrum Radio QuasarRadio Galaxy
Pulsar Wind NebulaSupernova RemnantBinary System
Open Cluster
Unidentified
-ray Sky MapγVHE >100 GeV)γ(E
2008-04-30 - Up-to-date plot available at http://www.mppmu.mpg.de/~rwagner/sources/
Fig. 35. – Known sources in the VHE sky in 2008 [81].
5. – The emerging HE and VHE gamma-ray sky
More than one half of the 271 sources detected at energies > 100 MeV in the thirdEGRET catalog of 1999 (see fig. 34) are still unidentified.
Thanks mostly to Cherenkov telescopes, a large amount of VHE sources has beendetected and identified (see fig. 35). When this review has been written (May 2008),

VERY-HIGH-ENERGY GAMMA ASTROPHYSICS 219
Fig. 36. – Known galactic VHE sources from the survey of the galactic plane by the H.E.S.S.telescope between 2004 and 2007 [83].
76 VHE sources had been detected, which operate as cosmic particle accelerators, andthe γ-rays they emit trace information on the primary electrons or nuclei. Therefore,it is important to determine the nature of the primary particles and their spatial andmomentum distribution. Among these sources, 8 are supernova remnants (SNRs), 14 arePulsar Wind Nebulae (PWNe), one is the galactic centre, 4 are binary systems, one is aVHE pulsar, 25 are unidentified galactic sources, and 23 are active galactic nuclei.
5.1. Galactic cosmic-ray accelerators. – The recent dramatic growth (by a factor of∼ 10) in the number of known galactic VHE sources is largely a consequence of the surveyof the galactic plane conducted with the southern-located H.E.S.S. between 2004 and2007 [82]. Figure 36 shows the current extent of this scan, which now covers essentiallythe whole inner Galaxy: −85◦ < l < 60◦, −2.5◦ < b < 2.5◦ [83]. Further galacticsources, accessible from the northern hemisphere, were subsequently observed with theMAGIC telescope (e.g., ref. [84]), and even more by H.E.S.S. Proposed counterparts ofsuch galactic VHE sources include supernova remnants, PWNe, and accreting binaries.Whatever their detailed nature, it is expected that galactic VHE sources are relatedto evolutionary endproducts of massive, bright, short-lived, stellar progenitors. Hence,these galactic VHE sources are immediate tracers of the current star formation.
About half of the currently known galactic TeV sources remain unidentified. This isin part due to the difficulty of identifying extended sources with no clear sub-structure.Nonetheless, several methods of identification have been successfully applied and the

220 A. DE ANGELIS, O. MANSUTTI and M. PERSIC
situation is much more favourable than that in the GeV band where only one galacticsource class (pulsars) has been unambiguously identified.
5.1.1. Supernova remnants. Galactic cosmic rays have long been suspected to be pro-duced at supernova shock fronts via diffusive acceleration. If the observed VHE γ-rayswere found to be generated through the hadronic channel, via π0 decay following pp inter-action with the dense molecular clouds embedding the short-lived supernova progenitor,then the acceleration by supernovae of nuclei to energies of the order of the knee in thecosmic-ray spectrum would be proven (e.g., ref. [85]). However, it is difficult to disen-tangle the hadronic VHE component from the leptonic one, produced by IC scatteringof interstellar radiation field photons (in the inner Galaxy) or cosmic microwave back-ground photons (in the outer Galaxy) off ultrarelativistic electrons (e.g., ref. [86]), bymeasuring γ-rays over only a decade or so in energy. The VHE data of RX J1713.7-3946can be explained in terms of either channel, leptonic/hadronic if the relevant magneticfield is low/high (B ∼ 10/100 μG [87, 88]). Data in the ∼ 0.1–100 GeV band, such asthose to be provided by AGILE and GLAST, are clearly needed to discriminate betweenthe two channels. (For Cas A the high magnetic field, B ∼ 1 mG, suggests a mostlyhadronic [89] VHE emission [90].) The complementarity between AGILE and GLASTon one side and the IACTs on the other side might be the key for important discoveriesin the future [91].
Whatever the details, the detection of photons with E � 100 TeV from RXJ1713.7-3946 is a proof of the acceleration of primary particles in supernova shocks to energieswell above 1014 eV. The differential VHE spectral index is ∼ 2.1 all across this SNR,suggesting that the emitting particles are ubiquitously strong-shock accelerated, up toenergies ∼ 200/100 TeV for primary cosmic protons/electrons if the hadronic/leptonicchannel is at work [92]. This is getting close to the knee of the cosmic-ray spectrum;this fact might signal the high-energy end of the galactic cosmic-ray distribution (e.g.,ref. [93]).
Circumstantial evidence supports a hadronic origin for at least part of the VHE emis-sion. In several expanding SNRs the X-ray brightness profile behind the forward shockis best explained as synchrotron emission from energetic electrons in strong magneticfields, B ∼ O(102) μG, i.e. ∼ 100 times larger than typical interstellar medium values.Such a large amplified magnetic field disfavors the IC interpretation of the VHE data.Furthermore, in the remnant HESS J1834-087, the maximum of the extended VHE emis-sion correlates with a maximum in the density of a nearby molecular cloud [94]—whichsuggests hadronic illumination of the target molecular cloud. A similar situation holdsfor IC 443 [95] and W 28 [96], both of which appear to have emission correlated withavailable target material rather than with the radio/X-ray emission of the SNR itself,suggesting that the VHE emission may arise from hadronic interactions in/around theSNR.
5.1.2. Pulsars and Pulsar Wind Nebulae. Pulsars are understood as rapidly spinningneutron stars (with periods between about 1 ms and 1 s) with extremely strong magneticfields. (Neutron stars are stellar remnants of supernova explosions.) Pacini [97] arguedthat such stellar remnants could power SNRs like the Crab nebula, and predicted thatthey could be observable at radio frequencies. Rotation generates an induced electric fieldthat overcomes gravity, so charges are pulled out from the neutron star surface (where alayer of plasma still survives), in the form of a relativistic wind that carries most of thepulsar’s rotational energy, filling the (corotating) magnetosphere with plasma. Electron-

VERY-HIGH-ENERGY GAMMA ASTROPHYSICS 221
positron pairs originate in the magnetosphere via interaction with the magnetic field;they may escape through the polar cap regions in the form of a wind that eventuallyterminates in the surrounding interstellar medium.
Gamma-ray radiation from rotation-powered pulsars can be produced through severalradiation mechanisms in three physically distinct regions: magnetosphere, relativisticwind, and the surrounding nebula. As for the latter, the pair-wind termination shockinto the circumstellar medium establishes a standing reverse shock: this leads to theformation of a nonthermal (synchrotron and Compton) nebula whose spectrum extendsfrom radio to VHE gamma-rays.
To date there is no wide consensus on the physical mechanism for magnetosphericemission. Objects emitting at X-ray to γ-ray energies are critical to this scope, becausethis energy band is where most of the radiative luminosity is observed and it is linkedwith the pair wind that is the dominant mode of energy deposition in the circum-pulsarenvironment. The most crucial issue about this high-energy emission of pulsars is thelocation of the acceleration region in the magnetosphere: is it in the outer gap (e.g.,refs. [98, 99]; review by [100]) or in the polar cap (e.g., ref. [101]; review by [102]).Different radiative signatures are predicted in the two cases.
The key difference between the two models is the location of the acceleration zone:near the pulsar surface, i.e. at the magnetic poles (polar-cap model), or further out fromthe star surface, where the local field is reduced by several orders of magnitudes withrespect to the field at the star’s surface (outer-gap model). In terms of observables,this distinction translates into the manifestation (or lack thereof) of extremely strongmagnetic fields.
In polar-cap models, for strong values of the magnetic field (1011 G � B � 4×10¹³ G),the conversion of photons into e+e− pairs generates cascades that strongly attenuatesupra-GeV emission in Crab-like or Vela-like (“canonical”) pulsars, generating steeper-than-exponential (“super-exponential”) cutoffs in the 10 MeV–10 GeV band(5). In outer-gap models pair creation is obtained through the γγ → e+e− process involving surfacethermal X-rays as targets, and the absorption of γ-rays in the magnetic field is notsufficient for the development of pair cascades and does not significantly distort theemitted spectrum.
Discrimination between different polar-cap vs. outer-gap models of pulsar magneto-spheric emission is one clear goal of VHE astrophysics.
The current observational situation is exemplified by the cases of the PSR B1951+32and Vela pulsars [103, 104]. In the latter case upper limits to the pulsed emission implya cutoff energy Ec < 32 GeV. In both, Vela and PSR B1951+32, IC emission at TeVenergies as predicted by outer-gap models is severely constrained, although not all outer-gap models are ruled out. Deeper sensitivities can test the models further, and certainlyno test of these models in the range 10–100 GeV has yet been achieved.
Millisecond pulsars, that have lower magnetic fields, in polar-cap models could havea cutoff at ∼ 100 GeV (i.e. Ec ∝ B−1), hence their (pulsed) VHE emission could berelevant. Detecting it would be a test of the polar-cap theory [105].
The Crab Nebula was the first VHE source to be discovered [15]. It still is thebrightest steady emitter in the VHE sky, that is used as a calibration candle. Theγ-ray emission from the Crab is dominated by the pulsed emission from the rotating
(5) For magnetars, pulsars with still higher fields, B > 4 × 10¹³ G, no emission is predictedabove > 100 MeV.

222 A. DE ANGELIS, O. MANSUTTI and M. PERSIC
Energy [GeV]
-110 1 10 210 310 410 510
-1 s-2
TeV
m d
F/d
E
× 2E
-810
-710
-610
EGRETWhippleHEGRACANGAROOCelesteStaceeTibetH.E.S.S.Aharonian et al. (2004)MAGIC
Fig. 37. – The spectrum of the Crab Nebula in the HE region [106].
pulsar below GeV energies, and by the steady emission from the nebula above GeVenergies. Its broad-band spectrum is double-peaked (see fig. 37), a feature commonto all pulsar wind nebulae: the two components are usually attributed to synchrotronradiation and its Compton scattering off the parent relativistic electrons that emerge fromthe termination shock of the pulsar wind. Its spectral energy density decreases in the GeVregion, but it has a turnover and starts to be again visible at about 100 GeV. The CrabNebula has been observed extensively from the radio energy range up to about 70 TeV.No pulsed (magnetospheric) VHE emission was originally found in MAGIC data fromprevious observational campaigns, that implies Ec < 50 GeV [106]. The steady nebularspectrum, measured in the about 0.03–30 GeV range by EGRET and in the about 0.06–70 TeV by several IACTs, shows a bump that starts to dominate at about 1 GeV andpeaks at about 50 GeV: this component results from IC scattering, by the synchrotron-emitting electrons, of softer photons in the shocked wind region—i.e. synchrotron, farinfrared/millimeter or cosmic microwave background photons. In spite of its detected ICγ-ray emission, however, the Crab Nebula is not an effective IC emitter as a consequenceof its high nebular magnetic field (B ∼ 0.4 mG).
Very recently, the MAGIC Collaboration has reported on the detection of the Crabpulsar [107]. The source was observed from October 2007 until February 2008 for 40hours, of which 22 hours of data were recorded at optimal weather condition and smallzenith angles. The observation took place after the installation of a new trigger systemwhich lowered the threshold from 50–60 GeV down to 25 GeV. The analysis reveals apulse profile that shows a very clear signal at a 6.4σ level coinciding also with an opticalsignal concurrently recorded by a special photosensor in the camera center. Both peaksin the light curve, the main pulse and the interpulse, are of about equal intensity. Both
VERY-HIGH-ENERGY GAMMA ASTROPHYSICS 223
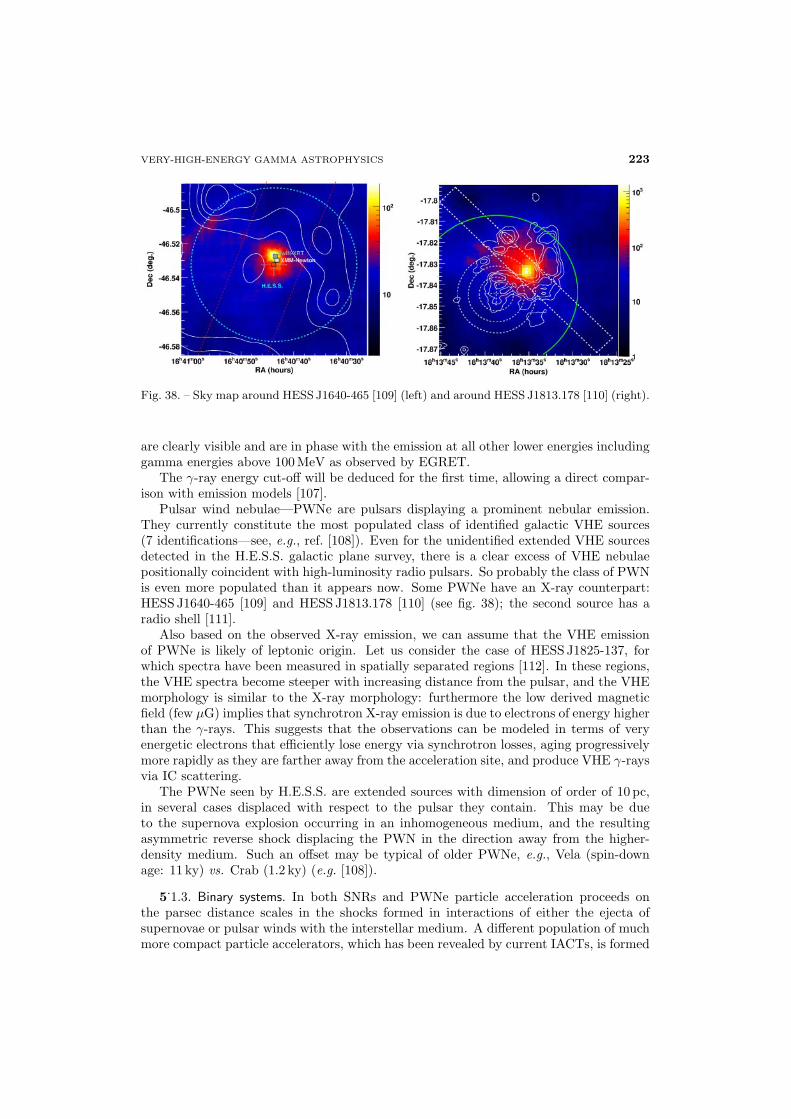
Fig. 38. – Sky map around HESS J1640-465 [109] (left) and around HESS J1813.178 [110] (right).
are clearly visible and are in phase with the emission at all other lower energies includinggamma energies above 100 MeV as observed by EGRET.
The γ-ray energy cut-off will be deduced for the first time, allowing a direct compar-ison with emission models [107].
Pulsar wind nebulae—PWNe are pulsars displaying a prominent nebular emission.They currently constitute the most populated class of identified galactic VHE sources(7 identifications—see, e.g., ref. [108]). Even for the unidentified extended VHE sourcesdetected in the H.E.S.S. galactic plane survey, there is a clear excess of VHE nebulaepositionally coincident with high-luminosity radio pulsars. So probably the class of PWNis even more populated than it appears now. Some PWNe have an X-ray counterpart:HESS J1640-465 [109] and HESS J1813.178 [110] (see fig. 38); the second source has aradio shell [111].
Also based on the observed X-ray emission, we can assume that the VHE emissionof PWNe is likely of leptonic origin. Let us consider the case of HESS J1825-137, forwhich spectra have been measured in spatially separated regions [112]. In these regions,the VHE spectra become steeper with increasing distance from the pulsar, and the VHEmorphology is similar to the X-ray morphology: furthermore the low derived magneticfield (few μG) implies that synchrotron X-ray emission is due to electrons of energy higherthan the γ-rays. This suggests that the observations can be modeled in terms of veryenergetic electrons that efficiently lose energy via synchrotron losses, aging progressivelymore rapidly as they are farther away from the acceleration site, and produce VHE γ-raysvia IC scattering.
The PWNe seen by H.E.S.S. are extended sources with dimension of order of 10 pc,in several cases displaced with respect to the pulsar they contain. This may be dueto the supernova explosion occurring in an inhomogeneous medium, and the resultingasymmetric reverse shock displacing the PWN in the direction away from the higher-density medium. Such an offset may be typical of older PWNe, e.g., Vela (spin-downage: 11 ky) vs. Crab (1.2 ky) (e.g. [108]).
5.1.3. Binary systems. In both SNRs and PWNe particle acceleration proceeds onthe parsec distance scales in the shocks formed in interactions of either the ejecta ofsupernovae or pulsar winds with the interstellar medium. A different population of muchmore compact particle accelerators, which has been revealed by current IACTs, is formed

224 A. DE ANGELIS, O. MANSUTTI and M. PERSIC
Energy (TeV)1 10
)-1
s-2
dN
/dE
(T
eV c
m× 2
E
-1310
-1210
-1110
2004 (H.E.S.S.)2003 (H.E.S.S.)MSSMKK
-τ+τ, 30% b70% b
Fig. 39. – Differential gamma spectrum from the galactic centre [120].
by the TeV binaries. These systems contain a compact object—either a neutron star ora black hole—that accretes, or interacts with, matter outflowing from a companion star:hence they are VHE-loud X-ray binaries. Four TeV binaries have been detected so far:PSR B1259-63 [113], LS 5039 [114,115], LS I +61 303 [116], and Cyg X-1 [117].
PSR B1259-63 is powered by the rotation energy of its young 48 ms pulsar, and strongVHE emission is observed from this system in pre- and post-periastron phases whenthe relativistic pulsar wind collides with the dense equatorial wind blowing from thecompanion star, which displays a rapid rotation.
LS I +61 303 and LS 5039 may share a similar structure. The former is composedof a compact object and a rapidly rotating star in a highly eccentric orbit. Its VHEemission, whose variability constrains the emitting region of LS I +61 303 to be largerthan the size of the binary system, appears correlated with the radio emission and doesnot peak at periastron, where the rate M of the transferred mass is expected to be largest.This picture favors an IC origin of VHE emission, as probably the most efficient at therelatively large scales of the system at peak emission. LS 5039 clearly shows periodicityof 3.9 days from the gamma-ray data alone (in agreement with the optical): the VHEspectrum varies as a function of phase, getting softer when the compact object is hiddenby the companion, that may indicate photon-photon absorption or cascading.
The emission from Cyg X-1 (for which there is evidence with a significance � 4σ)is point-like and excludes the nearby radio nebula powered by the relativistic jet. Ifconfirmed, Cyg X-1 is the first stellar-mass (∼ 13M�) black hole, and hence the firstestablished accreting binary, established as a VHE source.
5.1.4. The centre of the Milky Way. The possibility of indirect dark-matter detectionthrough its annihilation into VHE γ-rays has aroused interest to observe the centre of theMilky Way. H.E.S.S. and MAGIC observed the galactic centre, measuring a steady fluxconsistent with a differential power law wiyh a spectral index of about 2.2 (see fig. 39),up to energies of about 20 TeV with no apparent cutoff [118, 119]. The γ-ray source issteady even during X-ray flares and behaves like a point source. Within the error circleof the measurement of the central source HESS J1745-290 (the position of the centre ofthe Milky Way is determined within a systematic error of 6′′ and a statistical error of 6′′,too) there are three compelling candidates for the origin of the VHE emission: the shell-type SNR Sgr AEast, the newly discovered PWN G 359.95-0.04, and the supermassive
VERY-HIGH-ENERGY GAMMA ASTROPHYSICS 225
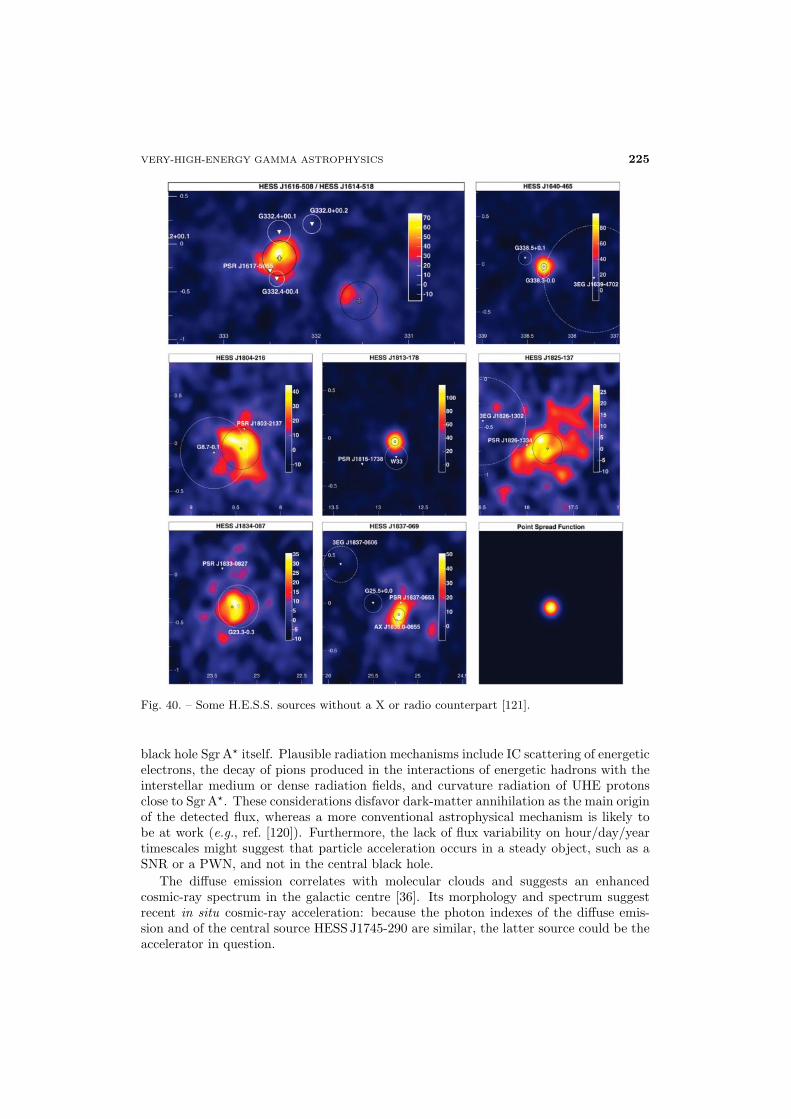
Fig. 40. – Some H.E.S.S. sources without a X or radio counterpart [121].
black hole Sgr A� itself. Plausible radiation mechanisms include IC scattering of energeticelectrons, the decay of pions produced in the interactions of energetic hadrons with theinterstellar medium or dense radiation fields, and curvature radiation of UHE protonsclose to Sgr A�. These considerations disfavor dark-matter annihilation as the main originof the detected flux, whereas a more conventional astrophysical mechanism is likely tobe at work (e.g., ref. [120]). Furthermore, the lack of flux variability on hour/day/yeartimescales might suggest that particle acceleration occurs in a steady object, such as aSNR or a PWN, and not in the central black hole.
The diffuse emission correlates with molecular clouds and suggests an enhancedcosmic-ray spectrum in the galactic centre [36]. Its morphology and spectrum suggestrecent in situ cosmic-ray acceleration: because the photon indexes of the diffuse emis-sion and of the central source HESS J1745-290 are similar, the latter source could be theaccelerator in question.

226 A. DE ANGELIS, O. MANSUTTI and M. PERSIC
20.520.6
40.5
41
41.5
42
42.5
43
2
3
4
5
6
7
8
RA (J2000) [ hrs ]
Dec
(J2
000)
[ d
eg ]
Cygnus OB2 Field: HEGRA CT-System
Exc
ess
sign
ific
ance
Cyg-OB2 Core Circle
3EG J2033+4118
Cyg X-3
GeV J2026+4124
GeV J2035+4214
Src1 (ASCA)Src2 (ASCA)
Src3 (ASCA)
AX J2027.6+4116
TeV J2032+4130
Fig. 41. – The source TeVJ2032+4130 as seen by HEGRA [124].
5.1.5. Mystery sources and Cygnus region. There are examples of galactic VHE sourceswhich do not have a counterpart in the X or radio energy bands (see fig. 40). This situ-ation is the likely outcome of experimental and physical considerations. As an exampleof the former, extended sources may have different morphologies at different frequencies;as for the latter, sources my emit substantially in the GeV–TeV range and negligiblyin other spectral bands (“dark accelerators”), e.g., TeV J2032+4130. Whatever theirdetailed nature, a reasonable expectation is that these sources, too, are related to com-pact stellar endproducts and descend from massive, bright, short-lived, progenitor stars.Hence, these dark accelerators would still be linked to current star-formation activity.
MAGIC, HEGRA and Whipple observed the source TeV J2032+4130 (see fig. 41).Whipple detected it at 6.1σ with a flux corresponding to 8% of the Crab flux [122];MAGIC observed it at 6σ with a flux 4% of the Crab flux, a size of 6′ and a spectralindex of 1.8 [123], while HEGRA detected it at 7σ with a flux 5% of the Crab flux, asize of 6′ and a spectral index of 1.9 [124].
The MILAGRO telescope discovered the three sources MGRO J2031+41, MGROJ2019+37, and MGRO J1908+06 [125] (see fig. 42). The second source was seen alsoby the EAS detector TIBET AS-γ [126]. The source MGRO J1908+06 is still unidenti-fied; the H.E.S.S. observations in its direction are shown in fig. 43.
Explanations for these unidentified sources range from exotic to conventional. One ofthe former type is that these sources originate from the annihilation of dark matter inlocalised clumps, i.e. subhalos within the Galaxy’s halo. A more conventional explana-tion is that they originate from the collision of cosmic hadrons (pp interaction), which

VERY-HIGH-ENERGY GAMMA ASTROPHYSICS 227
Fig. 42. – The sources MGRO J2031+41 and MGRO J2019+37 as seen by MILAGRO (picturefrom the first paper cited in ref. [125]).
Galactic Longitude (deg.)
Gal
acti
c L
atit
ud
e (d
eg.)
-2
-1.5
-1
-0.5
0
0.5
0
50
100
150
200
250
300
350
394041
GRO J1908+0556
3EG 1903+0550
SNR G40.5-0.5
MGRO J1908+06
HESS J1908+063
Fig. 43. – The source MGRO J1908+06 [127].

228 A. DE ANGELIS, O. MANSUTTI and M. PERSIC
entails emission mostly in the VHE band—contrary to electrons which typically producecomparable fluxes by synchrotron emission. However, even in this conventional scenario,the acceleration site for these hadrons remains unknown (see [128,129]).
5.2. Extragalactic sources of VHE γ-rays
5.2.1. Satellites of the Milky Way. Outlooks for WIMP annihilation detection in Dracoby current IACTs are not very promising: for a neutralino mass mχ = 100 GeV anda variety of annihilation modes, and in the favorable case of a maximal (cuspy) innerhalo profile, VHE detection can occur with 40 h by a IACT if the average value of theneutralino cross-section times the velocity is 〈σv〉 � 10−25 cm3 s−1, which is somewhatlarger than the maximum value for a thermal relic with a density equal to the measured(cold) dark matter density. The prospects are better in the HE range with GLAST(100 MeV–10 GeV): for a maximal (cuspy) halo, 1 y of GLAST observation should beable to yield a detection if mχ � 500 GeV and 〈σv〉 ∼ 3 × 10⁻²⁵ cm3 s−1 [130].
No evidence of dark-matter annihilation γ-rays has been unambiguously claimed sofar [131]. An apparently extended signal from the direction of NGC 253 has been defi-nitely interpreted as due to hardware malfunction [132].
5.2.2. Star-forming galaxies. Diffuse γ-ray emission from pp interactions of cosmic-raynuclei with target interstellar medium photons makes up about 90% of the > 100 MeVluminosity of the Milky Way [133]. However, the VHE flux from a galaxy like theMilky Way located 1 Mpc away would be well below current IACT sensitivities. Indeed,only loose upper limits on the VHE flux from normal galaxies have been obtained, evenfor local galaxies and for the VHE-bright starburst galaxies (e.g., ref. [134]). Detailedmodels of VHE emission from NGC 253 [135-137] and for Arp 220 [134] are only slacklyconstrained by current upper limits [138, 139]. The increasingly deep upper limit, evenfor the more prominent star-forming galaxies, suggest that non-beamed emission fromextragalactic distances may be beyond detection for current IACTs and possibly withinreach for upcoming and future instruments [141].
5.2.3. Active Galactic Nuclei. Synchrotron-Compton models have long provided themainstream theoretical framework to model AGN emission [25]. VHE data have beencrucial to close the model, initially introduced to explain the radio-to-X-ray data thatwere interpreted as synchrotron radiation. For example, let us consider the simplestscheme of blazar emission, where one blob of magnetized nonthermal plasma, movingrelativistically towards the observer, emits via synchrotron and Compton mechanisms(the latter, scattering synchrotron off their parent electrons). The observed synchrotronemission shows a degeneracy between the value of the magnetic field and the electronnumber density; the Compton emission provides the second condition needed to break thedegeneracy. In general, knowledge of the whole spectral energy distribution is requiredfor a complete description of the emitting electrons’ distribution and environment (e.g.,ref. [140]). As is clear from basic knowledge of the synchrotron and Compton radiationmechanism, the parameters that specify the properties of the emitting plasma in the SSCmodel are the electron spectrum, the magnetic field, and the size and Lorentz factor ofthe plasma itself. Truly, a simultaneous spectral energy distribution provides us with asnapshot of the emitting population of particles at a given time.
The VHE emission of blazars has also been interpreted as due to accelerated hadrons.This possibility is particularly exciting in view of the recently claimed association of thearrival directions ultra-high-energy cosmic rays with the sky position of nearby AGNs [8].

VERY-HIGH-ENERGY GAMMA ASTROPHYSICS 229
At high energy, the 3rd EGRET catalogue [142] includes more than 130 sources knownto be extragalactic (e.g., ref. [19]), all of which are AGN (except the Large MagellanicCloud), and about 97% of which are blazars. Of these, about 93% are low-frequency-peaked blazars (LBLs) and only about 3% are high-frequency-peaked blazars (HBLs).Therefore, blazars—mostly of the LBL type—dominate EGRET’s extragalactic HE sky.Blazars dominate the extragalactic VHE sky, too. However, these are mostly HBLs—atpresent, only 1/16 is of the LBL type. The HBL dominance descends from a selectionbias: for a given HE flux, HBLs have a higher VHE flux than LBLs, because both spectralhumps are shifted to higher frequencies.
Blazar observations have been a top priority for VHE astrophysics ever since thediscovery of TeV emission from Mrk 421 [143]. To date, firm VHE detections of AGNinclude about 20 blazars (see ref. [144]), the quasar 3C 279, and the radio galaxy M 87(ref. [151]).
After concluding that the extragalactic HE γ-ray sky is dominated by blazars, onecomment is in order. Given their peculiar orientation, blazars are rare. Assuming thatthe maximum angle with respect to the line of sight an AGN jet can have for a sourceto be called a blazar is about 15◦, only about 3% of all radio-loud AGN, and thereforeabout 0.3% of all AGN, are blazars. Assuming that about 1% of the galaxies host anAGN, this implies that only 1 out of about 30 000 galaxies is a blazar. Hence, the factthat the GeV and TeV skies are dominated by blazars is surprising. The explanationstems of course from the blazars’ defining characteristics:
– high-energy electrons: in some blazars the synchrotron emission peaks in theX-ray range: this suggests the presence of high-energy electrons that can produceHE/VHE radiation via Compton scattering;
– strong non-thermal (jet) component : HE/VHE emission is clearly non-thermal andrelated to the jet: the stronger the latter, the stronger the former; and
– relativistic beaming : in sources as compact as blazars (as suggested by their shortvariability timescales) all GeV photons, would be absorbed through pair-producingγγ collisions with target X-ray photons.
Beaming ensures the intrinsic radiation density to be much smaller than the observedone, so that VHE photons encounter a much lower γγ opacity and hence manage to leavethe source. Furthermore, relativistic beaming causes a strong amplification of the jet’sobserved flux, so providing a powerful bias toward blazar detection.
The known TeV blazars are variable in flux in all wavebands. Even simple one-zonehomogeneous SSC modeling predicts the X-ray and TeV flux variability to be closelycorrelated, both emissions being linked to the same electron population. Observationalevidence, although still statistically limited, supports this prediction (e.g., ref. [146]).Blazar variability, both in flux and spectrum, has been observed at VHE frequencies downto minute timescales. For Mkn 501, observed with the MAGIC telescope at > 100 GeVduring 24 nights between May and July 2005, the integrated flux and the differential pho-ton spectra could be measured on a night-by-night basis [147]. During the observationalcampaign, the flux variations (from about 0.4 to about 4 Crab units) were correlatedwith the spectral changes (i.e. harder spectra for higher fluxes), and a spectral peakshowed up during the most active phases. A rapid flare occurred on the night of July10th, 2005, showing a doubling time as short as about 2 minutes and a delay of about 3minutes as a function of energy of the emitted photons.

230 A. DE ANGELIS, O. MANSUTTI and M. PERSIC
One further aspect of TeV spectra of blazars is that they can be used as probes of theEBL. The TeV photons emitted by a blazar interact with the EBL photons and are likelyabsorbed via pair production. Whatever its intrinsic shape at emission, after travelingthrough the EBL-filled space, a blazar spectrum will reach the observer distorted byabsorption. The strength of the absorption is measured by the optical depth τ(E, z) forthe attenuation between the blazar, located at a distance redshift z, and the Earth [148,42]. Usually, either i) the shape and intensity of EBL(z) is assumed, and the TeVspectrum is corrected before the SSC modeling is performed (e.g., ref. [149, 53]); orii) based on assumptions on the intrinsic VHE spectrum, EBL(z) is solved for: e.g.,based on analysis of the observed hard VHE spectra of the distant blazars 1ES 1101-232and H2359-309, a low EBL energy density at z � 0.2 has been derived [43]. The twoapproaches can be used in combination to estimate the distance to the VHE source [150].Based on the inferred attenuation of blazar VHE emission by the EBL, and in particularon the detection of the distant (z = 0.536) quasar 3C 279 (see below), the transparencyof the Universe at VHE γ-rays is deduced to be maximal, at the level implied by theknown cosmic evolution of the stellar populations of galaxies.
Table III. – Detected AGN at TeV energies [144].
Source z αγ Fγ IACT References
M 87 0.0044 H [151]Mrk 421 0.031 2.33 ± 0.08 1.03(±0.03) × 10−10 M [152]Mrk 501 0.034 2.28 ± 0.05 1.71(±0.11) × 10−11 M [147]
2.45 ± 0.07 3.84(±1.00) × 10−12 M1ES2344+514 0.044 2.95 ± 0.12 1.21(±0.10) × 10−11 M [153]Mrk 180 0.045 3.30 ± 0.70 8.46(±3.38) × 10−12 M [154]1ES 1959+650 0.047 2.72 ± 0.14 3.04(±0.35) × 10−11 M [155]BLLacertae 0.069 3.60 ± 0.50 3.28(±0.26) × 10−12 M [156]PKS 0548-322 0.069 2.80 ± 0.30 3.3(±0.7) × 10−12 H [157]PKS 2005-489 0.071 4.00 ± 0.40 3.32(±0.48) × 10−12 H [158,159]RGBJ0152+017 0.080 2.95 ± 0.36 4.43(±1.24) × 10−12 H [160,161]W Comae 0.102 V [162]PKS 2155-304 0.116 3.37 ± 0.07 2.89(±0.18) × 10−11 H [163]1ES 1426+428 0.129 3.55 ± 0.46 2.53(±0.43) × 10−11 W [164,165]1ES 0806+524 0.138 V [166]1ES 0229+200 0.139 2.50 ± 0.19 4.46(±0.71) × 10−12 H [167-169]H 2356-309 0.165 3.09 ± 0.24 2.55(±0.68) × 10−12 H [170,171]1ES 1218+304 0.182 3.00 ± 0.40 1.01(±0.26) × 10−11 M [172]1ES 1101-232 0.186 2.94 ± 0.20 4.35(±0.69) × 10−12 H [173]1ES 0347-121 0.188 3.10 ± 0.23 3.86(±0.73) × 10−12 H [174]1ES 1011+496 0.212 4.00 ± 0.50 6.40(±0.32) × 10−12 M [175]PG 1553+113 >0.25 4.20 ± 0.30 5.24(±0.87) × 10−12 M,H [176]3C 279 0.536 4.1 ± 0.7 2.9(±0.5) × 10−11 M [177]S5 0716+714 ? ∼ 10−11 M [178]
The observed photon spectral index αγ between 0.2TeV and 2TeV (0.6TeV for 3C 279: the absolute valueof the spectral index between 0.2TeV and 2TeV for this source might be larger) and the flux Fγ observed
at energy > 0.2TeV (in erg cm−2 s−1), for blazars observed at different redshift z. The errors indicate thestatistical uncertainty; the corresponding systematic uncertainties on the spectral index are typically about0.1 for H.E.S.S. and about 0.2 for MAGIC. In the column IACT, the Cherenkov telescope with which the datahave been collected: symbols stand for H = H.E.S.S., M = MAGIC, V = VERITAS, W = Whipple. In the lastcolumn, the references.

VERY-HIGH-ENERGY GAMMA ASTROPHYSICS 231
Fig. 44. – Observed spectral indexes for AGN in the VHE region.
More than 20 AGN have been detected as VHE sources (see table III) by the timethis review is written (June 2008). The AGN observed at VHE are uniformly distributedin the high galactic latitude sky. Measured spectral indices are plotted vs. redshift infig. 44.
Currently, the most distant established VHE source is 3C 279, with z = 0.536. ThisAGN is a Flat Spectrum Radio Quasar (FSRQ) that was observed by EGRET to bestrongly flaring (see fig. 45). The VHE spectrum of 3C 279 has been observed by MAGICat 6.1σ for energies lower than 220 GeV and at 5.2σ within 220 and 600 GeV [179].
The very well studied sources M 87, Mkn 421, and Mkn 501 (fig. 46) show a strongtemporal variability. These sources, which are monitored by all IACTs, show correlationsbetween TeV and X-ray emission. During the flares, the spectral features change, andthe IC peak shifts to higher frequencies (fig. 46). The highlight of these observationsis the detection of very fast (few minutes timescale) variability with some time delaybetween photons of different energy. Such lags are a potentially powerful diagnostics ofacceleration and energy loss processes, whereas the short timescales involved can placetight limits to the size of the emitting regions and the Lorentz factor of the jet. TheH.E.S.S. observations of PKS 2155-304 (located at z = 0.116), showed a very fast fluxvariability: on the night of July 28th, 2006 it had a peak flux about 50 times its averageflux (and about 15 times the Crab flux), and rapidly doubled it in four successive episodes(in 67± 50 s, 116± 50 s, 173± 50 s, and 178± 50 s, respectively). As for M 87, this sourceis not a blazar but a radio galaxy that harbors the most massive known black hole inthe nearby universe and whose jet is ∼ 30◦ from the line of sight to the observer: hencethe two-day timescale measured by H.E.S.S. [145] is remarkable.
The variability of the AGN in the VHE region can provide information about possibleviolations of the Lorentz invariance by means of the light dispersion expected in somequantum gravity models [55]. The velocity of light in such models is given by the formula
V = c
[1 + ξ
(E
EQG
)+ ξ2
(E
EQG
)2
+ . . .
],
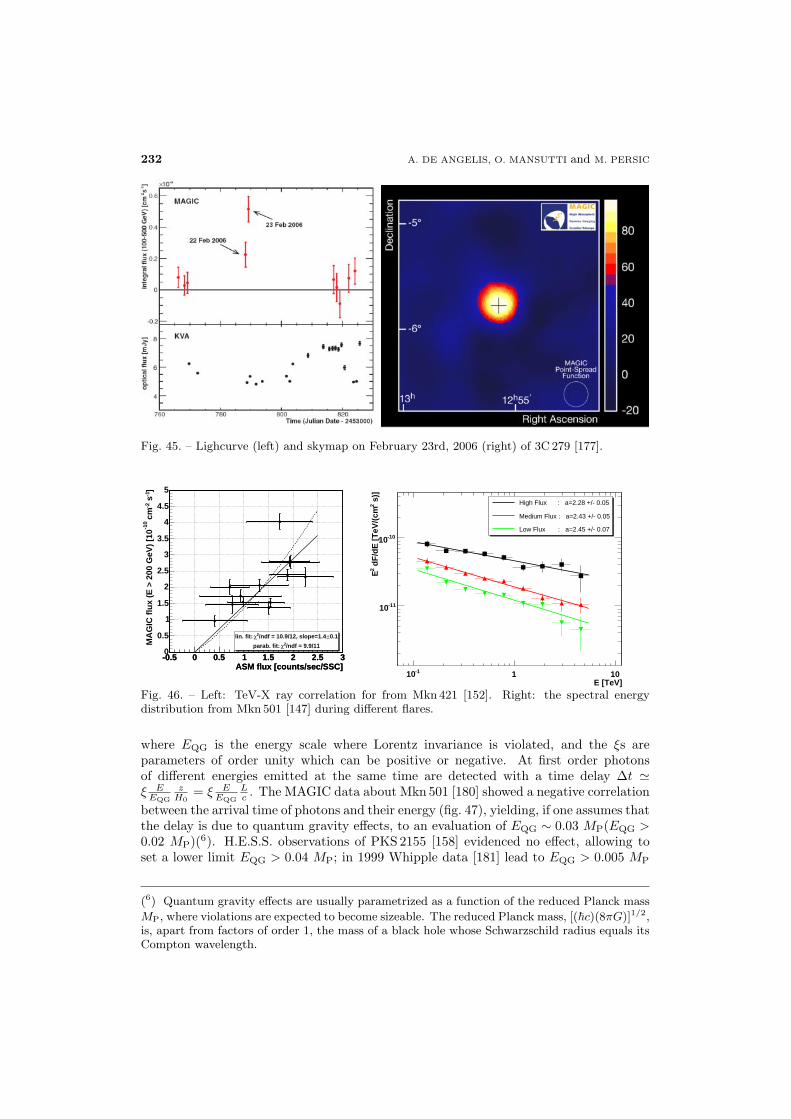
232 A. DE ANGELIS, O. MANSUTTI and M. PERSIC
Fig. 45. – Lighcurve (left) and skymap on February 23rd, 2006 (right) of 3C 279 [177].
ASM flux [counts/sec/SSC]-0.5 0 0.5 1 1.5 2 2.5 3
ASM flux [counts/sec/SSC]-0.5 0 0.5 1 1.5 2 2.5 3
]-1
s-2
cm
-10
MA
GIC
flu
x (E
> 2
00 G
eV)
[10
0
0.5
1
1.5
2
2.5
3
3.5
4
4.5
5
0.1±/ndf = 10.9/12, slope=1.42χlin. fit:
/ndf = 9.9/112χparab. fit:
E [TeV]-110 1 10
s)]
2 d
F/d
E [
TeV
/(cm
2E
-1110
-1010
High Flux : a=2.28 +/- 0.05
Medium Flux : a=2.43 +/- 0.05
Low Flux : a=2.45 +/- 0.07
Fig. 46. – Left: TeV-X ray correlation for from Mkn 421 [152]. Right: the spectral energydistribution from Mkn 501 [147] during different flares.
where EQG is the energy scale where Lorentz invariance is violated, and the ξs areparameters of order unity which can be positive or negative. At first order photonsof different energies emitted at the same time are detected with a time delay Δt �ξ E
EQG
zH0
= ξ EEQG
Lc . The MAGIC data about Mkn 501 [180] showed a negative correlation
between the arrival time of photons and their energy (fig. 47), yielding, if one assumes thatthe delay is due to quantum gravity effects, to an evaluation of EQG ∼ 0.03 MP(EQG >0.02 MP)(6). H.E.S.S. observations of PKS 2155 [158] evidenced no effect, allowing toset a lower limit EQG > 0.04 MP; in 1999 Whipple data [181] lead to EQG > 0.005 MP
(6) Quantum gravity effects are usually parametrized as a function of the reduced Planck mass
MP, where violations are expected to become sizeable. The reduced Planck mass, [(�c)(8πG)]1/2,is, apart from factors of order 1, the mass of a black hole whose Schwarzschild radius equals itsCompton wavelength.

VERY-HIGH-ENERGY GAMMA ASTROPHYSICS 233]
-1 s
-2F
(0.
15-0
.25
TeV
) [
cm
0
0.2
0.4
0.6
0.8
1
1.2
-910×
Crab Nebula
]-1
s-2
F (
0.25
-0.6
0 T
eV)
[cm
0
0.2
0.4
0.6
0.8
-910×
]-1
s-2
F (
0.60
-1.2
TeV
) [
cm
0
0.05
0.1
0.15
0.2
0.25
-910×
21:50 22:00 22:10 22:20 22:30
]-1
s-2
F (
1.2-
10 T
eV)
[cm
0
0.05
0.1
0.15
0.2
0.25
-910×
Fig. 47. – Integral flux of Mkn 501 detected by MAGIC in four different energy ranges [147].

234 A. DE ANGELIS, O. MANSUTTI and M. PERSIC
[s]0T-T-50 0 50 100 150 200 250 300
BA
T [
cou
nt/
s]
0
0.1
0.2
0.3
0.4
0.5 SWIFT-BAT: E = 15-350 keVMAGIC: E > 175 GeV
MA
GIC
exc
ess
rate
[H
z]
-0.6
-0.4
-0.2
0
0.2
0.4
0.6
Energy [keV]1 10 210 310 410 510 610 710 810 910
Energy [keV]1 10 210 310 410 510 610 710 810 910
]-2
cm
-1d
N/d
E [
erg
s2
E
-1210
-1110
-1010
-910
-810
-710
-610
SWIFT + Konus-Wind
90 s prompt emissionMAGIC 95% C.L. Upper Limits
GRB050713a
-2.5E∝dEdN
Fig. 48. – Plots of the MAGIC data about the GRB 050713a [182]: up, excess event rate com-pared with SWIFT-BAT observations; down: upper limits on the spectrum.
and the X-ray limits from gamma-ray bursts give EQG > 0.01 MP.In most quantum gravity scenarios violations to the universality of the speed of light
happen at order larger than 1: Δt � (E/EQG)ν with ν > 1. In this case the VHEdetectors are even more sensitive with respect to other instruments; for ν = 2 the datafrom PKS 2155 give EQG > 3 · 10−9 MP.
5.2.4. Gamma-Ray Bursts. Gamma-Ray Bursts (GRBs) are widely interpreted as orig-inating in relativistic “fireballs” following the core-collapse of massive stars and/or the
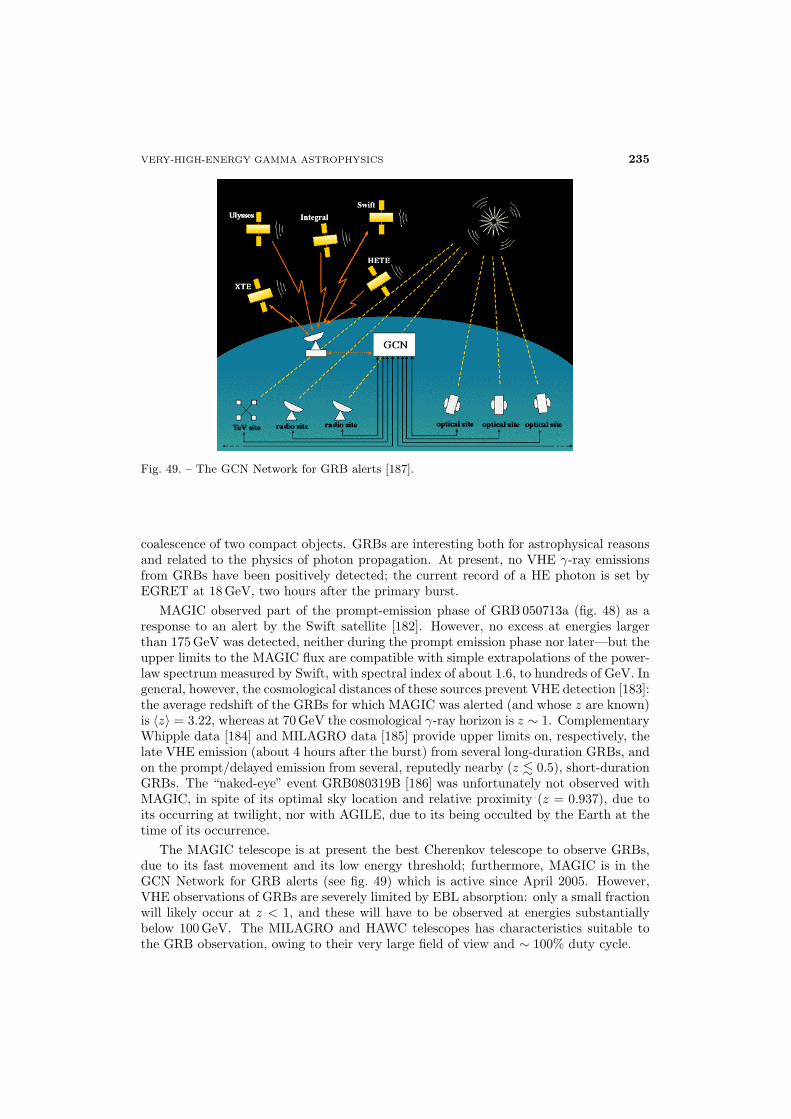
VERY-HIGH-ENERGY GAMMA ASTROPHYSICS 235
Fig. 49. – The GCN Network for GRB alerts [187].
coalescence of two compact objects. GRBs are interesting both for astrophysical reasonsand related to the physics of photon propagation. At present, no VHE γ-ray emissionsfrom GRBs have been positively detected; the current record of a HE photon is set byEGRET at 18 GeV, two hours after the primary burst.
MAGIC observed part of the prompt-emission phase of GRB 050713a (fig. 48) as aresponse to an alert by the Swift satellite [182]. However, no excess at energies largerthan 175 GeV was detected, neither during the prompt emission phase nor later—but theupper limits to the MAGIC flux are compatible with simple extrapolations of the power-law spectrum measured by Swift, with spectral index of about 1.6, to hundreds of GeV. Ingeneral, however, the cosmological distances of these sources prevent VHE detection [183]:the average redshift of the GRBs for which MAGIC was alerted (and whose z are known)is 〈z〉 = 3.22, whereas at 70 GeV the cosmological γ-ray horizon is z ∼ 1. ComplementaryWhipple data [184] and MILAGRO data [185] provide upper limits on, respectively, thelate VHE emission (about 4 hours after the burst) from several long-duration GRBs, andon the prompt/delayed emission from several, reputedly nearby (z � 0.5), short-durationGRBs. The “naked-eye” event GRB080319B [186] was unfortunately not observed withMAGIC, in spite of its optimal sky location and relative proximity (z = 0.937), due toits occurring at twilight, nor with AGILE, due to its being occulted by the Earth at thetime of its occurrence.
The MAGIC telescope is at present the best Cherenkov telescope to observe GRBs,due to its fast movement and its low energy threshold; furthermore, MAGIC is in theGCN Network for GRB alerts (see fig. 49) which is active since April 2005. However,VHE observations of GRBs are severely limited by EBL absorption: only a small fractionwill likely occur at z < 1, and these will have to be observed at energies substantiallybelow 100 GeV. The MILAGRO and HAWC telescopes has characteristics suitable tothe GRB observation, owing to their very large field of view and ∼ 100% duty cycle.

236 A. DE ANGELIS, O. MANSUTTI and M. PERSIC
6. – The future
6.1. The future of present detectors. – The next years will be very exciting for theobservations of the γ-ray sky. The GLAST satellite telescope is in orbit since June 2008.A second MAGIC telescope, at a distance of 85 m from the first one, starts operatingin September 2008 (see fig. 50); it will increase substantially the sensitivity of MAGICand improve the angular resolution to about 0.07 degrees. With this new telescope,MAGIC enters in phase 2 (MAGIC 2). The H.E.S.S. Collaboration has started theconstruction of a large telescope, which will be inaugurated after 2009 (see fig. 50) andwill lead the instrument into its phase 2 (H.E.S.S. 2). With its diameter of 28 m, thenew telescope, located in the middle of the four existing telescopes, will be the largestCherenkov telescope in the world, and it should decrease the trigger threshold to some30 GeV.
What next? Given the present space technology and the progress that one can rea-sonably foresee, space instruments beyond GLAST are forbidden for the next some 30years—the cost of space technology forbidding enterprises at a scale one-two orders ofmagnitude larger than GLAST. The future will then be for ground-based instruments.
When designing a new instrument to detect VHE sources, we must learn from ex-perience. H.E.S.S. and MAGIC have explored with enormous success most of the sky,including the galactic plane and most EGRET sources, and we learned that
– extensive air shower detectors need to increase their sensitivity by a factor of about10 to stay in the market; they should become larger and collect a flux of about 1%Crab per year or less;
– to further improve the IACTs, it is needed to build instruments with a larger fieldof view by using new geometries or by replicating the present Cherenkov instru-ments, maybe with some improvements such as adopting silicon photomultipliers(cheaper, lighter and smaller, with advantages on the weight and the engineeringof the camera) or adopting new technologies for mirrors. The cost of telescopes ispresently dominated by mechanics, mirrors, and camera.
Two longer-term projects for ground telescopes are under discussion: the CherenkovTelescope Array (CTA) [190], and an EAS detector called High Altitude Water Cherenkov(HAWC) [191].
6.2. The Cherenkov Telescope Array . – The CTA facility is a European project meantto explore the sky in the energy range from 10 GeV to 100 TeV and it is designed tocombine guaranteed science with significant discovery potential. It is designed to be builtusing demonstrated technologies, i.e. being a replica of present Cherenkov telescopes.The CTA is a cornerstone towards a multi-messenger exploration of the universe.
In the most ambitious and expensive scheme, for which the cost foreseen is of theorder of 100-150 million euros, the array layout will be composed by 3 zones (see fig. 51),with different types of telescopes.
– The low-energy section, which is the innermost part, is covered with a sampling of10% by large telescopes with medium-field cameras; its radius will be about 70 mand its energy threshold will be of about 10 GeV.
– The medium-energy section will be covered with a sampling of 1% by mid-sizetelescopes; its radius will be 250 m in addition to the low-energy section and itsenergy threshold will be of about 100 GeV.

VERY-HIGH-ENERGY GAMMA ASTROPHYSICS 237
Fig. 50. – The telescopes MAGIC 2 (real view) [188] and H.E.S.S. 2 (artist view) [189].
– The high-energy section will be covered at 0.05% by small telescopes with wide-field cameras; its radius will be few kilometers in addition to the medium-energysection and its energy threshold will be of about 1 TeV.
The field of view increases from 4-5 degrees in the inner region to 8-10 degrees in theouter sections.
In such a scenario, the CTA will operate in four different modes:
– deep wide-band mode, when all the telescopes track the same source;
– survey mode, when the telescopes survey the sky using a staggered pattern of fieldsof view;
– search and monitoring mode, when subclusters of telescopes track different sources;

238 A. DE ANGELIS, O. MANSUTTI and M. PERSIC
Fig. 51. – A possible layout for the CTA [190].
– narrow-band mode, when halo telescopes accumulate high-energy data, while thecore telescopes hunt for pulsars.
Two sites are foreseen for the CTA: one in the northern and one in the southernhemisphere.
At the 30th International Cosmic Ray Conference (2007), a board of scientists affil-iated to institutions from USA presented a white paper [192] about the status and thefuture of ground-based γ-ray astronomy, in which they propose some baselines for thedevelopment of the future instruments. In particular, they identify some requirementsthat the future instruments should meet, among which are the following:
– one order of magnitude better sensitivity by means of a footprint area on the orderof 1 km2;
– enlargement of the explored energy range;
– improvement of the angular resolution;
– a factor 2 of increase of the field of view.
The technology they propose is an array of mid-size IACTs (5–15 m diameter) coupledto an array of water Cherenkov detectors, the latter to provide a large field of view anda high duty-cycle. For what concerns the IACTs themselves, they suggest to
– reduce the construction and operational costs;
– move from the present Davies-Cotton or parabolic optics to Cassegrain optics, inorder to increase the field of view;
– design the readout and triggering electronics, choose the photodetector and themirror fabrication technique in such a way to improve the sensitivity and cut downthe expenses.

VERY-HIGH-ENERGY GAMMA ASTROPHYSICS 239
Fig. 52. – The “Kifune plot” which shows the number of detected sources as a function of timefrom year 1960, with an extrapolation to the next future. The plot has been updated in [13].
The future Cherenkov arrays will observe many new sources at low energies, butmaybe very exciting new discoveries will come from the few expected new sources in thehigh energy region, which could generate important new physics.
Finally, research has started for large field-of-view imaging atmospheric Cherenkovtelescopes with Fresnel optics [193], which could combine the precision and the sensitivityof IACTs with a field of view as large as 40 degrees.
An intermediate model for the CTA, for which the cost could be dropped to some 20million euros or less, would be to stage the final detector by building a third MAGICtelescope and several H.E.S.S. 1 detectors, all with advanced high-efficiency cameras. Inthis case the overall sensitivity would improve by a factor of 2 to 3 instead than thefinal design factor of 10, but this would give the time to explore the potential of theobservations by the joint collaboration with a subsstancial increase in sensitivity andwith limited funding.
6.3. Large EAS . – The High Altitude Water Cherenkov (HAWC) observatory, thesuccessor of MILAGRO, will be located at the extreme altitude of 4100 m in the SierraNegra (Mexico). Such an altitude will allow lowering the threshold, by intercepting alarger amount of charged secondaries. It will incorporate new design solutions like placingthe photomultipliers in isolated tanks, and adopting a larger spacing between them. Itwill have a 22500 m2 sensitive area (to be compared with the 4000 m2 of MILAGRO)and since it will reuse in the beginning the MILAGRO photomultipliers and electronicsit will cost only about 10 to 20 million dollars to complete the detector (to be comparedto the about 150 million euros foreseen for the “full version” of the CTA). HAWC willimprove the sensitivity of MILAGRO by at least one order of magnitude: it will detectthe Crab Nebula in one day at 5σ and collect four times the Crab flux in 15 minutes,being suitable for γ-ray bursts observations. HAWC will probably have a lower energythreshold at 200 GeV.
240 A. DE ANGELIS, O. MANSUTTI and M. PERSIC
The capability of the HAWC observatory to perform a highly sensitive all-sky surveywill enable the monitoring of the known sources and yield to the discovery of new sourcesof known types and new classes of TeV sources. Furthermore, HAWC can investigate theorigin and propagation of cosmic rays above the TeV—tens of TeV region.
7. – Conclusions
High-energy photons are a powerful probe of fundamental physics under extremeconditions, since they are produced in the highest-energy phenomena, they often travelthrough large distances, and their interactions display large boosts towards the center ofmass.
Observation of X- and γ-rays gives an exciting view of the HE universe thanks tothe satellite-based telescopes (AGILE, GLAST) and to the ground-based detectors likethe IACTs, which discovered more than 60 new VHE sources in the last 3 years and aregoing on this way. This large population of VHE-γ-ray sources, which are often unknownsources, poses questions on the transparency of the Universe at these energy ranges; thismight indicate the existence of new physics.
The plot in fig. 52, usually referred to as “Kifune plot”, shows how the amount ofdetected X-ray, γ-ray and VHE-γ-ray sources varied and an extrapolation to the future;the contribution from the different observatories is highlighted. In this plot we can seethat the advent of the IACTs like MAGIC and H.E.S.S. increased by a factor of 10 theknown VHE-γ-ray source population. The progress achieved with the latest generationof IACTs is comparable with the one drawn by EGRET with respect to the previousγ-ray satellite detectors.
This exciting scenario gives handles for the study of new mechanisms about the VHE-γ-ray origin and propagation, and many astrophysical constraints are feeding the theories.So far no clear sources above about 50 TeV have been detected, but it is still uncertainwhether they do not exist or there is just a technological limit on detecting them with thecurrent facilities; the future instruments will tell. The exploration of the VHE sourceshas just started and in the next three years (2008/2010) a factor of 10 improvement inthe GeV range is expected by the AGILE and GLAST observations, while a factor 2-3improvement in the TeV range will be reached by H.E.S.S. 2, MAGIC 2 and VERITAS.
To go beyond the TeV energies the best solution comes from the combination providedby the CTA and HAWC observatories, and possibly from new concepts of large-field ofview facilities.
∗ ∗ ∗The authors thank A. Moralejo, B. De Lotto, C. Pittori, F. Tavecchio,
F. Gobel, M. Roncadelli, R. Wagner for comments and suggestions. A specialacknowledgement goes to the anonymous referee who helped in improving the paper.
REFERENCES
[1] Hess V., Phys. Z., 13 (1913) 1084.[2] Pacini D., Nuovo Cimento, 3 (1912) 93.[3] Rossi B., High-Energy Particles (Prentice-Hall, New York) 1952; Cosmic Rays (McGraw-
Hill, New York) 1964.[4] Greisen K., Phys. Rev. Lett., 16 (1966) 748; Zatsepin G. T. and Kuzmin V. A., J.
Exp. Theor. Phys. Lett., 4 (1966) 78.

VERY-HIGH-ENERGY GAMMA ASTROPHYSICS 241
[5] Yamamoto T. for the Pierre Auger Collaboration, Proc. 30th Intl. Cosmic RayConf. (ICRC 2007), in press (arXiv:0707.2638).
[6] Fermi E., Phys. Rev., 75 (1949) 1169.[7] See, for example, Zwiebel E. and Heiles C., Nature, 385 (1997) 131.[8] The Pierre Auger Collaboration, Science, 318 (2007) 938.[9] De Angelis A., Roncadelli M. and Persic M., Mod. Phys. Lett. A, 23 (2008) 315.
[10] Ressell M. T. and Turner M. S., Comments Astrophys., 14 (1990) 323.[11] Aharonian F. A., Very High Energy Cosmic Gamma Radiation (World Scientific,
Singapore) 2004.[12] Hoffman C. M., Sinnis C., Fleury P. and Punch M., Rev. Mod. Phys., 71 (1999)
897.[13] Hinton J., Proc. 30th Intl. Cosmic Ray Conf. (ICRC 2007), in press (arXiv:0712.3352).[14] Hinton J., New J. Phys. in press (arXiv:0803.1609).[15] Weekes T. C. et al., Astrophys. J., 342 (1989) 379.[16] Mannheim K., Astron. Astrophys., 269 (1993) 76.[17] Aharonian F. A., New Astron., 5 (2000) 377.[18] Urry C. M. and Padovani P., Publ. Astron. Soc. Pac., 107 (1995) 803.[19] Padovani P., Am. Inst. Phys. Conf. Proc., 921 (2007) 19.[20] Ulrich M. H. et al., Annu. Rev. Astron. Astrophys., 35 (1997) 445.[21] Fossati G. et al., Mon. Not. R. Astron. Soc., 299 (1998) 433.[22] Ghisellini G. et al., Mon. Not. R. Astron. Soc., 301 (1998) 451.[23] Dermer C. and Schlickeiser R., Astrophys. J., 416 (1993) 458.[24] Rees M. J., Mon. Not. R. Astron. Soc., 137 (1967) 429.[25] Maraschi L., Ghisellini G. and Celotti A., Astrophys. J., 397 (1992) L5.[26] Rees M. J. and Meszaros P., Mon. Not. R. Astron. Soc., 258 (1992) 41.[27] Meszaros P. and Rees M. J., Astrophys. J., 405 (1993) 278.[28] Sari R. et al., Astrophys. J., 497 (1998) L17.[29] Meszaros P., Rep. Prog. Phys., 69 (2006) 2259.[30] van Albada T. S. et al., Astrophys. J., 295 (1985) 305.[31] Sarazin C., Rev. Mod. Phys., 58 (1986) 1.[32] Spergel D. N. et al., Astrophys. J. Suppl., 148 (2003) 175.[33] Yao W.-M. et al., J. Phys. G, 33 (2006) 1 and 2007 partial update for 2008.[34] GLAST Science Brochure (March 2001), http://glast.gsfc.nasa.gov/science.[35] Bringmann T., Bergstrom L. and Edsjo J., J. High Energy Phys., 01 (2007) 049.[36] Aharonian F. A. et al., Nature, 439 (2006) 695.[37] Coppi P. and Aharonian F. A., Astrophys. J., 487 (1997) L9.[38] Heitler W., The quantum theory of radiation (Oxford University Press, Oxford) 1960.[39] Lee S., Phys. Rev. D, 58 (1998) 043004.[40] Gould R. J. and Schreder G. P., Phys. Rev., 155 (1967) 1408.[41] Stecker F. W., Int. Astron. Union Symp., 204 (2001) 135.[42] Stecker F. W., De Jager O. C. and Salomon M. H., Astrophys. J., 390 (1992) L49.[43] Aharonian F. A. et al., Nature, 440 (2006) 1018.[44] Mazin D. and Raue M., Astron. Astrophys., 471 (2007) 439.[45] Peebles P. J. E., Principles of Physical Cosmology (Princeton University Press,
Princeton) 1993.[46] Padmanabhan T., Theoretical Astrophysics, Vol. III: Galaxies and Cosmology
(Cambridge University Press, Cambridge) 2002.[47] Blanch O., Lopez J. and Martinez M., Astropart. Phys., 19 (2003) 245; Blanch O.
and Martinez M., Astropart. Phys., 23 (2005) 588; Blanch O. and Martinez M.,Astropart. Phys., 23 (2005) 598; Blanch O. and Martinez M., Astropart. Phys., 23(2005) 608.
[48] Mannheim K., Rev. Mod. Astron., 12 (1999) 167.[49] Primack J. R. et al., Astropart. Phys., 11 (1999) 93; Primack J. R. et al., AIP Conf.
Proc., 558 (2001) 463.[50] De Angelis A., Mansutti O. and Roncadelli M., Phys. Lett. B, 659 (2008) 847.

242 A. DE ANGELIS, O. MANSUTTI and M. PERSIC
[51] De Angelis A., Roncadelli M. and Mansutti O., Phys. Rev. D, 76 (2007) 121301.[52] Simet M., Hooper D. and Serpico P., Phys. Rev. D, 77 (2008) 063001.[53] Kneiske T. M. et al., Astron. Astrophys., 413 (2004) 807.[54] Kifune T., Astrophys. J., 518 (1999) L21.[55] Amelino-Camelia G. et al., Nature, 393 (1998) 763.[56] De Angelis A. and Peruzzo L., Sterne Weltraum, 8 (2007) 26.[57] Rossi B. and Greisen K., Rev. Mod. Phys., 13 (1941) 240.[58] Nishimura J. and Kamata K., Prog. Theor. Phys., 7 (1952) 185; Greisen K., Rev.
Mod. Phys., 13 (1960) 240.[59] Wagner R. M., Ph.D. thesis, 2006, Technische Universitat Munchen, MPP-2006-245.[60] GLAST Gallery, http://www-glast.sonoma.edu/resources/multimedia/gallery/.[61] CGRO Science Support Center Image Gallery, http://cossc.gsfc.nasa.gov/docs/
cgro/images/epo/gallery/glast/.[62] AGILE, Astro-rivelatore Gamma a Immagini Leggero, http://agile.asdc.asi.it/.[63] Goddard Space Flight Center, NASA, The GLAST Instruments, http://glast.
gsfc.nasa.gov/public/instruments.html.[64] Goddard Space Flight Center news, NASA, http://www.nasa.gov/centers/
goddard/news/topstory/2007/GlastLaunch prt.htm.[65] Stanford Linear Accelerator Center, GLAST LAT Performance, http://www-
glast.slac.stanford.edu/software/IS/.[66] The MILAGRO Gamma-Ray Observatory, LANL, The Detection of Cosmic Rays,
http://www.lanl.gov/milagro/detecting.shtml
[67] INFN Roma 3, The Argo-YBJ Experiment, http://193.204.162.110/∼nucleare/
argo/argo.html.[68] The MILAGRO Gamma-Ray Observatory, LANL, http://www.lanl.gov/milagro/.[69] Hillas A. M., Proc. 19th Intl. Cosmic Ray Conf. (ICRC 1985), La Jolla, USA, Vol. 3,
p. 445; Space Sci. Rev., 75 (1996) 17.[70] Piron F. et al., Astron. Astrophys., 374 (2001) 895; de Naurois M., arXiv:astro-
ph/0607247v1; Lemoine-Goumard M., Degrange B. and Tluczykont M., Astropart.Phys., 25 (2006) 195.
[71] Berge D., Funk S. and Hinton J., Astron. Astrophys., 466 (2007) 1219.[72] Chitnis V. R. and Bhat P. N., Astropart. Phys., 15 (2001) 29; Raducci S., Thesis
at the Universita di Udine, 2004; Tescaro D., Thesis at the Universita di Padova,2005; Mirzoyan R. et al., Astropart. Phys., 25 (2006) 342; Tescaro D. et al.,arXiv:0709.1410v1 [astro-ph]; Cabras G. et al., arXiv:0804.3896v1 [astro-ph].
[73] Max Plank Institute, The H.E.S.S. Telescopes, http://www.mpi-hd.mpg.de/hfm/
HESS/public/telescope/hn telescopes.htm.[74] University of Hamburg, H.E.S.S. overview, http://www-hess.desy.de/pages/
hes overview.html.[75] Max-Plank-Institut fur Physik, Munich, MAGIC Picture Gallery, http://www.
magic.mppmu.mpg.de/gallery/.[76] VERITAS Homepage, http://veritas.sao.arizona.edu.[77] Moralejo A., private communication.[78] Bastieri D. et al., Astropart. Phys., 23 (2005) 572[79] Institut fur Theoretische Physik und Astrophysik, Fakultat fur Physik
und Astronomie, Universitat Wurzburg, Observations with the MAGIC Telescope,http://www.astro.uni-wuerzburg.de/mphysics/.
[80] http://cossc.gsfc.nasa.gov/docs/cgro/cossc/egret/3rd EGRET Cat.html orref. [142].
[81] http://www.mppmu.mpg.de/∼rwagner/sources/.[82] Aharonian F. A. et al., Astrophys. J., 636 (2006) 777.[83] Hoppe S. et al., Proc. 30th Intl. Cosmic Ray Conf. (ICRC 2007), in press
(arXiv:0710.3528).[84] Albert J. et al., Astrophys. J., 664 (2006) L87.[85] Torres D. F. et al., Phys. Rep., 382 (2003) 303.

VERY-HIGH-ENERGY GAMMA ASTROPHYSICS 243
[86] Porter T. A. et al., Astrophys. J., 648 (2006) L29.[87] Aharonian F. A. et al., Astron. Astrophys., 449 (2006) 223.[88] Berezhko E. G. and Volk H. J., Astron. Astrophys., 451 (2006) 98.[89] Berezhko E. G. et al., Astron. Astrophys., 400 (2003) 971.[90] Ona-Wilhelmi E. et al., Astron. Astrophys., 474 (2007) 937.[91] Persic M., De Angelis A., Longo F. and Tavani M., Proc. 30th Intl. Cosmic Ray
Conf. (ICRC 2007), in press (arXiv:0709.1881).[92] Aharonian F. A. et al., Astron. Astrophys., 464 (2007) 235.[93] Blasi P., Mod. Phys. Lett., A20 (2005) 3055.[94] Albert J. et al., Astrophys. J., 643 (2006) L53.[95] Albert J. et al., Astrophys. J., 664 (2007) L87.[96] Aharonian F. et al., Astron. Astrophys., 481 (2008) 401.[97] Pacini F., Nature, 216 (1967) 567.[98] Cheng K. S. et al., Astrophys. J., 300 (1986) 500.[99] Romani R. W., Astrophys. J., 470 (1996) 469.
[100] Hirotani K., Adv. Space Res., 35 (2005) 1085.[101] Daugherty J. K. and Harding A., Astrophys. J., 252 (1982) 337; Daugherty J. K.
and Harding A., Astrophys. J., 458 (1996) 278.[102] Baring M. G., Adv. Space Res., 33 (2004) 552.[103] Aharonian F. A. et al., Astron. Astrophys, 448 (2006) L43.[104] Albert J. et al., Astrophys. J., 669 (2007) 1143.[105] Harding A. K., Usov V. V. and Muslimov A. G., Astrophys. J., 622 (2005) 531.[106] Albert J. et al., Astrophys. J., 674 (2008) 1046.[107] Teshima M. for the MAGIC Collaboration, ATel, 1491 (2008).[108] Gallant Y., Astrophys. Space Sci., 309 (2007) 197.[109] Funk S. et al., Astrophys. J., 662 (2007) 517.[110] Funk S. et al., Astron. Astrophys., 470 (2007) 249.[111] Helfand D. J., Becker R. H. and White R. L., arXiv:astro-ph/0505392; Brogan
C. L. et al., Astrophys. J., 629 (2005) L105; Helfand D. J. et al., Astrophys. J., 665(2007) 1297.
[112] Aharonian F. A. et al., Astron. Astrophys., 460 (2006) 365.[113] Aharonian F. A. et al., Astron. Astrophys., 442 (2005) 1.[114] Aharonian F. A. et al., Science, 309 (2005) 746.[115] Aharonian F. A. et al., Astron. Astrophys., 460 (2006) 743.[116] Albert J. et al., Science, 312 (2006) 1771.[117] Albert J. et al., Astrophys. J., 665 (2007) L51.[118] Aharonian F. A. et al., Astron. Astrophys., 425 (2004) L13.[119] Albert J. et al., Astrophys. J., 638 (2006) L101.[120] Aharonian F. A. et al., Phys. Rev. Lett., 97 (2006) 221102.[121] Aharonian F. A. et al., Science, 307 (2005) 1938.[122] Konopelko A. et al., Astrophys. J., 658 (2007) 1062.[123] Albert J. et al., Astrophys. J., 675 (2008) L25.[124] Aharonian F. A. et al., Astron. Astrophys., 431 (2005) 197.[125] Abdo A. et al., Astrophys. J., 658 (2007) L33; Abdo A. et al., Astrophys. J., 664 (2007)
L91.[126] Amenomori M. et al., Proc. 30th Intl. Cosmic Ray Conf. (ICRC 2007), in press
(arXiv:0710.2757).[127] H.E.S.S. Source of the Month, August 2007: Confirming MGRO1908+06, http://www.
mpi-hd.mpg.de/hfm/HESS/public/som/Som 8 07.htm.[128] Salvati M. and Sacco B., Astron. Astrophys., 485 (2008) 527.[129] Drury L. and Aharonian F. A., Astropart. Phys. (2008), in press (arXiv:0802.4403).[130] Bergstrom L. and Hooper D., Phys. Rev. D, 73 (2006) 063510.[131] Albert J. et al., Astrophys. J., 679 (2008) 428.[132] Itoh C. et al., Astron. Astrophys., 462 (2007) 67.[133] Strong A. W. et al., Astrophys. J., 537 (2000) 763.

244 A. DE ANGELIS, O. MANSUTTI and M. PERSIC
[134] Torres D. F., Astrophys. J., 617 (2004) 966.[135] Volk H. et al., Space Sci. Rev., 75 (1996) 279.[136] Paglione T. A. D. et al., Astrophys. J., 460 (1996) 295.[137] Domingo-Santamarıa E. and Torres D., Astron. Astrophys., 444 (2005) 403.[138] Aharonian F. A. et al., Astron. Astrophys., 442 (2005) 177.[139] Albert J. et al., Astrophys. J., 658 (2007) 245.[140] Tavecchio F. et al., Astrophys. J., 509 (1998) 608.[141] Persic M., Rephaeli Y. and Arieli Y., Astron. Astrophys. (2008), in press
(arXiv:0802.0818).[142] Hartman R. C., Astrophys. J. Suppl., 123 (1999) 79.[143] Punch M. et al., Nature, 358 (1992) 477.[144] Persic M. and De Angelis A., Astron. Astrophys., 83 (2008) 1.[145] Lenain J.-Ph., Rev. Mex A. A., in press (arXiv:0709.1366).[146] Pian E. et al., Astrophys. J., 492 (1998) L17.[147] Albert J. et al., Astrophys. J., 669 (2007) 862.[148] Fazio G. G. and Stecker F. W., Nature, 226 (1970) 135.[149] de Jager O. C. and Stecker F. W., Astrophys. J., 566 (2002) 738.[150] Mazin D. and Goebel F., Astrophys. J., 655 (2007) L13.[151] Aharonian F. et al., Astron. Astrophys., 403 (2003) L1.[152] Albert J. et al., Astrophys. J., 663 (2007) 125.[153] Albert J. et al., Astrophys. J., 662 (2007) 892.[154] Albert J. et al., Astrophys. J., 648 (2006) L105.[155] Albert J. et al., Astrophys. J., 639 (2006) 761.[156] Albert J. et al., Astrophys. J., 666 (2007) L17.[157] Superina G. et al., Proc. 30th Intl. Cosmic Ray Conf. (ICRC 2007), in press
(arXiv:0710.4057,138).[158] Aharonian F. A. et al., Astron. Astrophys., 442 (2005) 895.[159] Perlman E. S. et al., Astrophys. J., 523 (1999) L11.[160] Aharonian F. A. et al., Astron. Astrophys. (2008), in press (arXiv:0802.4021v2).[161] Donato D. et al., Astron. Astrophys., 375 (2001) 739.[162] Swordy S. for the VERITAS Collaboration, ATel, 1422 (2008).[163] Aharonian F. A. et al., Astron. Astrophys., 436 (2005) L17.[164] Horan D. et al., Astrophys. J., 571 (2002) 753.[165] Sambruna R. M. et al., Astrophys. J., 483 (1997) 774.[166] Swordy S. for the VERITAS Collaboration, ATel, 1415 (2008).[167] Aharonian F. A. et al., Astron. Astrophys., 475 (2007) L9.[168] Perlman E. S. et al., Astrophys. J. S., 104 (1996) 251.[169] Donato D., Sambruna R. M. and Gliozzi M., Astron. Astrophys., 433 (2005) 1163.[170] Aharonian F. A. et al., Astron. Astrophys., 455 (2006) 461.[171] Wood K. S. et al., Astrophys. J. S., 56 (1984) 507.[172] Albert J. et al., Astrophys. J., 642 (2006) L119.[173] Aharonian F. A. et al., Astron. Astrophys., 470 (2007) 475.[174] Aharonian F. A. et al., Astron. Astrophys., 473 (2007) L25.[175] Albert J. et al., Astrophys. J., 667 (2007) L21.[176] Albert J. et al., Astrophys. J., 654 (2007) L119.[177] Albert J. et al., Science, 320 (2008) 1752.[178] Teshima M. for the MAGIC Collaboration, ATel, 1500 (2008).[179] Teshima M. et al., Proc. 30th Intl. Cosmic Ray Conf. (ICRC 2007), in press
(arXiv:0709.1475).[180] Albert J. et al., submitted to Phys. Rev. B (arXiv:0708.2889).[181] Biller S. D. et al., Phys. Rev. Lett., 83 (1999) 2108.[182] Albert J. et al., Astrophys. J., 641 (2006) L9.[183] Albert J. et al., Astrophys. J., 667 (2007) 358.[184] Horan D. et al., Astrophys. J., 655 (2007) 396.[185] Abdo A. A. et al., Astrophys. J., 666 (2007) 361.

VERY-HIGH-ENERGY GAMMA ASTROPHYSICS 245
[186] Bloom J. S. et al., Astrophys. J., (2008), in press (arXiv:0803:3215).[187] Goddard Space Flight Center, NASA, GCN: The Gamma-ray bursts Coordinates
Network, http://gcn.gsfc.nasa.gov/.[188] MAGIC picture gallery, http://wwwmagic.mppmu.mpg.de/gallery/pictures/.[189] Horns D., J. Phys.: Conf. Ser., 60 (2007) 119.[190] http://www.mpi-hd.mpg.de/hfm/CTA/.[191] See for example: Smith A. J., J. Phys., 60 (2007) 131.[192] Krawczynski H. et al. for the White Paper Team, Proc. 30th Intl. Cosmic Ray Conf.
(ICRC 2007), in press (arXiv:0709.0704).[193] Cusumano G. et al., Proc. 30th Intl. Cosmic Ray Conf. (ICRC 2007), in press
(arXiv:0707.4541).