Venerdì 5 febbraio 2016
64
+
Transcript of Venerdì 5 febbraio 2016

+

Venerdì5febbraio2016
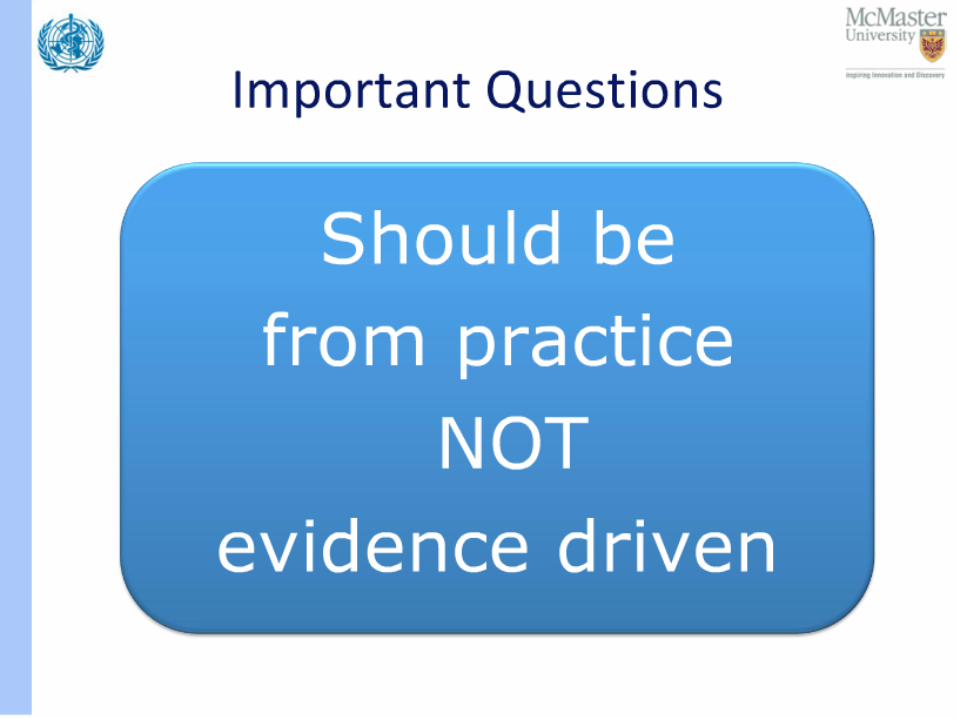
• Ilquesitoclinicocomeprimummovensdiognidecisioneterapeu<ca
• Confidenceü rischiodibiasü analisiperso>ogruppi
ü imprecisionedelles<meü eterogeneitàdelleevidenze
• Directnessü adeguatezzadelleevidenzealquesito
P.I.C.O.ü confron<indireF,networkmeta-
analysis
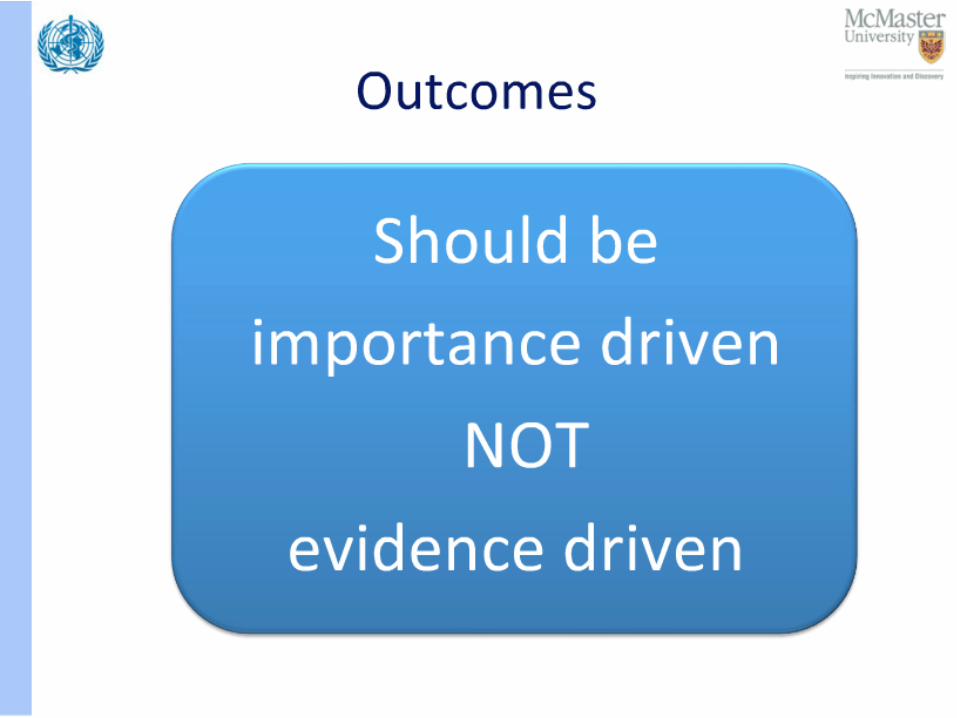
• Relevanceü iltargetdirilevanzaclinica

Venerdì5febbraio2016
• Ilquesitoclinicocomeprimummovensdiognidecisioneterapeu4ca
• Confidenceü rischiodibiasü analisiperso>ogruppi
ü imprecisionedelles<meü eterogeneitàdelleevidenze
• Directnessü adeguatezzadelleevidenzealquesito
P.I.C.O.ü confron<indireF,networkmeta-
analysis
• Relevanceü iltargetdirilevanzaclinica


P NeiPazien<con…Specifichecara>eris<chedimalaFa(stadio,classedirischio,ecc.)
I l’Intervento… Interventoterapeu<coogge>odelquesitoclinico
C(èsusceFbilediimpiego)inConfrontocon…
Tra>amentoaltrimen<consi-derabileinalterna<vaall’inter-ventoinesame
OriguardoagliOutcomedibeneficio/danno…
Parametriclinico-laboratoris<ciritenu<essenzialiperladecisio-neterapeu<ca
Stru9urazionedelQuesitoClinicosec.modelloP.I.C.O.
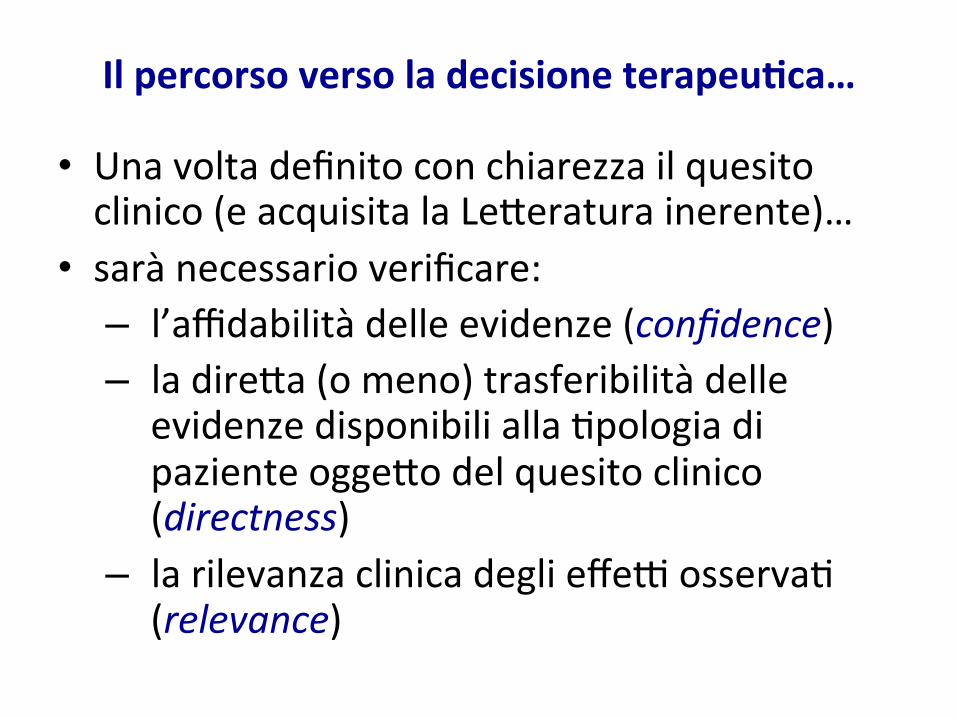
Ilpercorsoversoladecisioneterapeu4ca…
• Unavoltadefinitoconchiarezzailquesitoclinico(eacquisitalaLe>eraturainerente)…
• sarànecessarioverificare:– l’affidabilitàdelleevidenze(confidence)– ladire>a(omeno)trasferibilitàdelle
evidenzedisponibilialla<pologiadipazienteogge>odelquesitoclinico(directness)
– larilevanzaclinicadeglieffeFosserva<(relevance)

Venerdì5febbraio2016
• Ilquesitoclinicocomeprimummovensdiognidecisioneterapeu<ca
• Confidenceü rischiodibiasü analisiperso>ogruppi
ü imprecisionedelles<meü eterogeneitàdelleevidenze
• Directnessü adeguatezzadelleevidenzealquesito
P.I.C.O.ü confron<indireF,networkmeta-
analysis
• Relevanceü iltargetdirilevanzaclinica

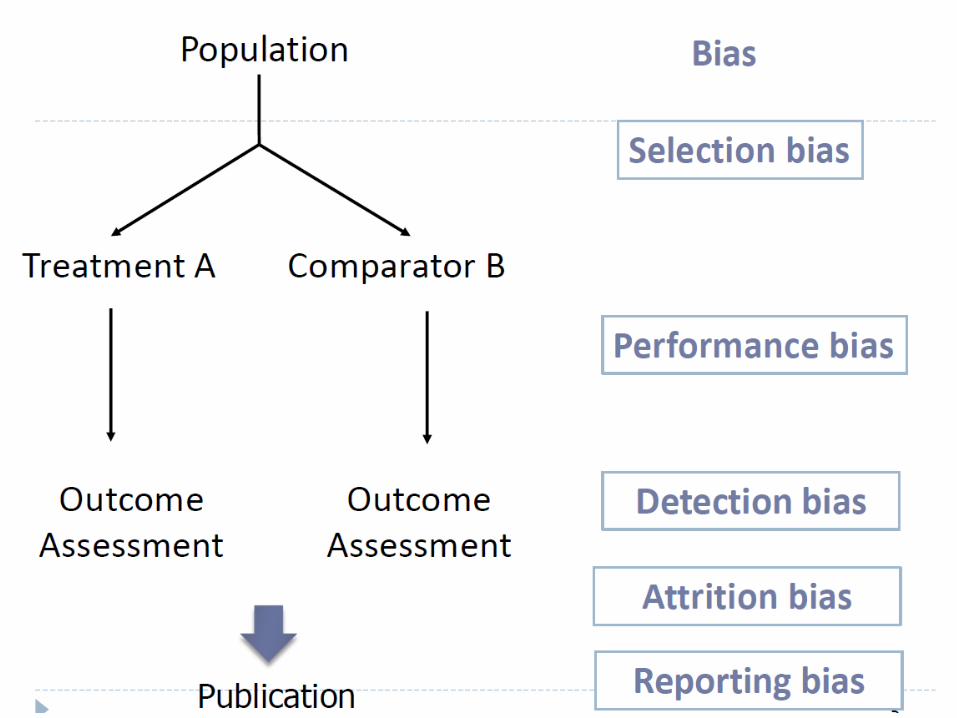
Rischio di bias
Ivan Moschetti
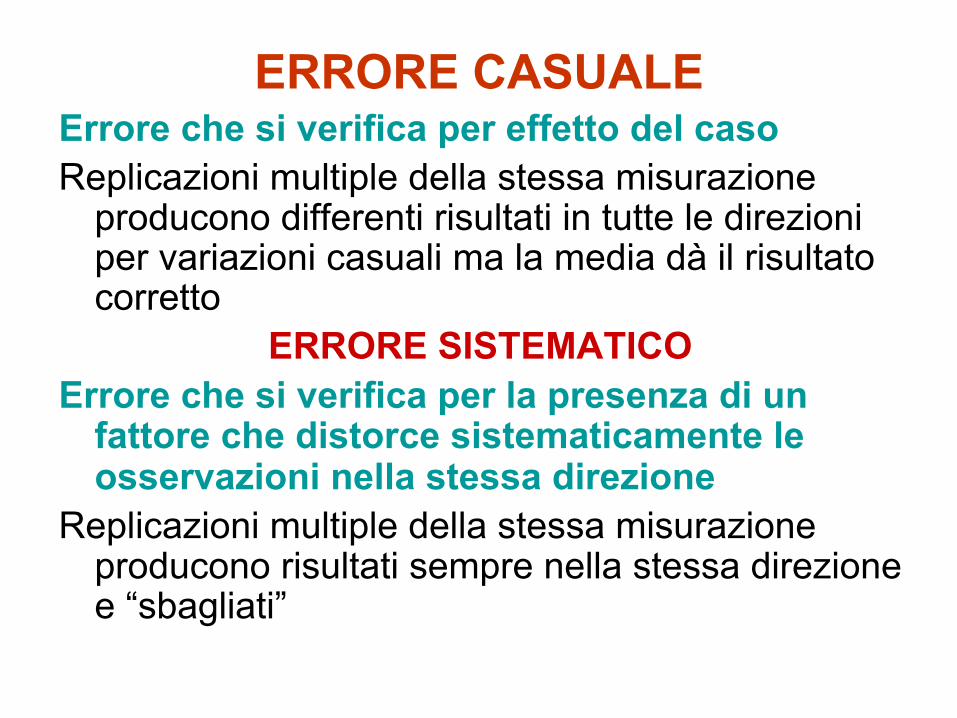
ERRORE CASUALE Errore che si verifica per effetto del caso Replicazioni multiple della stessa misurazione
producono differenti risultati in tutte le direzioni per variazioni casuali ma la media dà il risultato corretto
ERRORE SISTEMATICO Errore che si verifica per la presenza di un
fattore che distorce sistematicamente le osservazioni nella stessa direzione
Replicazioni multiple della stessa misurazione producono risultati sempre nella stessa direzione e “sbagliati”

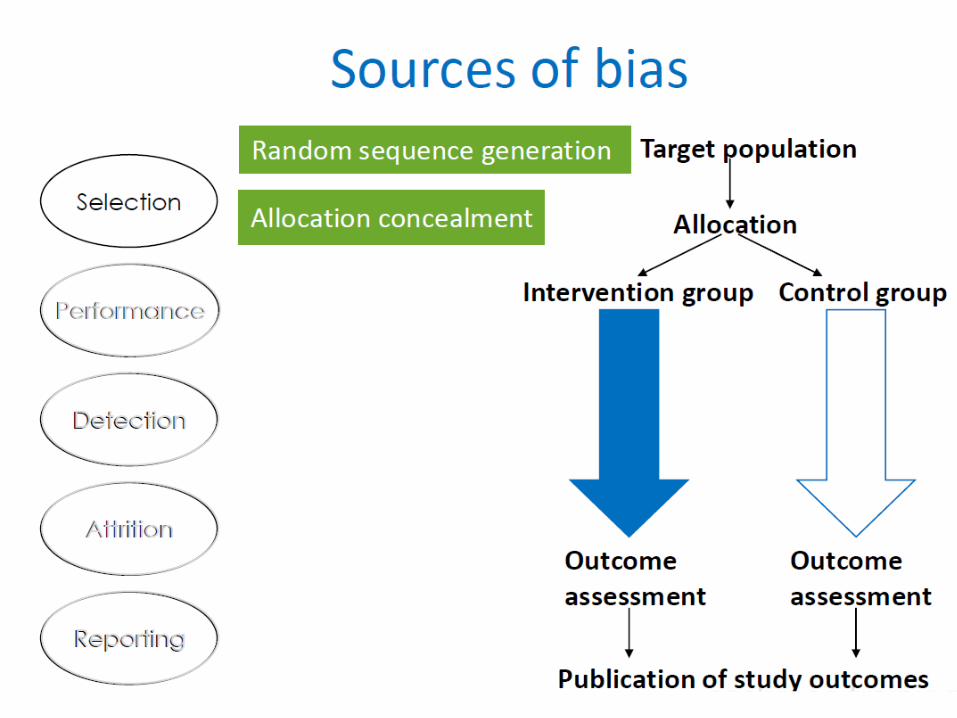

Randomizzazione

Why randomise? End of a clinical trial • We find a difference in outcomes between intervention and control groups
• Possible explanations:
– the intervention exhibits a real effect
– the outcome difference is due to chance
– there is a systematic difference (or bias) between the groups due to factors other than the intervention
• Randomisation prevents the third possibility
Randomisation ensures similar levels of all risk factors (known and unknown)

Item Descriptor
Sequence generation
Method used to generate the random allocation sequence, including details of any restriction (eg, blocking, stratification)
Allocation concealment
Method used to implement the random allocation sequence (eg, numbered containers or central telephone), clarifying whether the sequence was concealed until interventions were assigned
Implementation Who generated the allocation sequence, who enrolled participants, and who assigned participants to their groups
RANDOMIZATION COMPONENTS

Randomisation (coin-toss, computer)
Allocation schedule
Allocation
Intervention Control
Alternate, days of week, record number
Allocation
Intervention Control
? Pre-vedibili
RANDOMIZATION BIAS
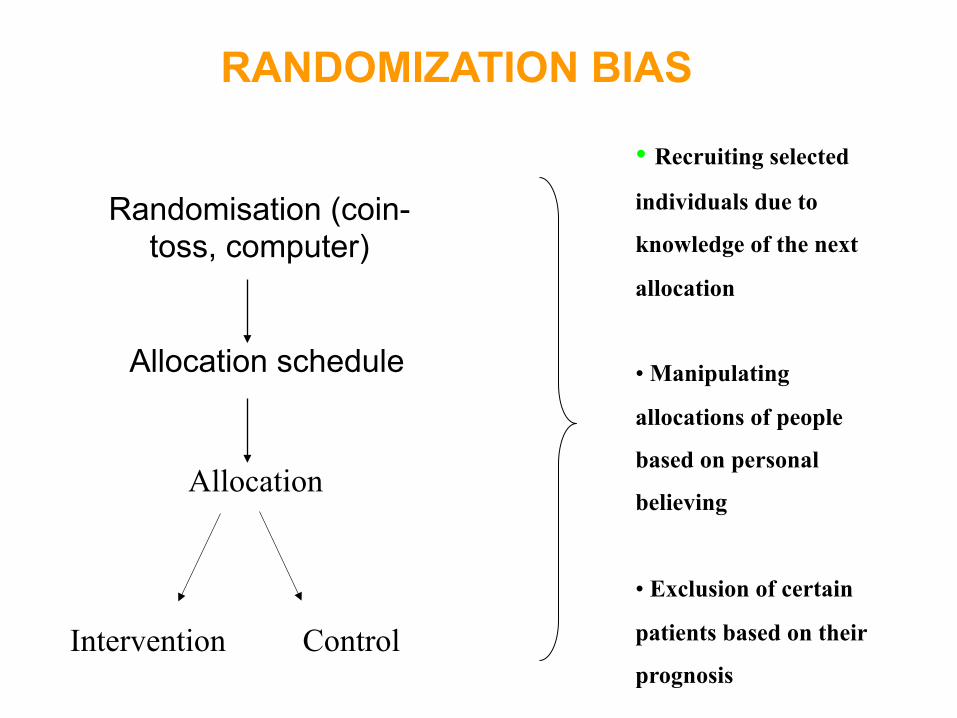
Allocation schedule
Allocation
Intervention Control
• Recruiting selected
individuals due to
knowledge of the next
allocation
• Manipulating
allocations of people
based on personal
believing
• Exclusion of certain
patients based on their
prognosis
Randomisation (coin-toss, computer)
RANDOMIZATION BIAS

Criteria for a judgment of ‘YES’ (i.e. low risk of bias) The investigators describe a random component in the sequence generation process such as:
-referring to a random number table; -using a computer random number generator; -coin tossing; -shuffling card or envelopes; -throwing dice; -drawing of lots; -minimization
Criteria for a judgment of ‘NO’ (i.e. high risk of bias) The investigators describe a non-random component in the sequence generation process. Usually,
the description would involve some systematic, non-random approach such as: -sequence generated by odd or even date of birth; -sequence generated by some rule based on date (or day) of admission; -sequence generated by some rule based on hospital or clinical record number.
Other non-random approaches involve judgment or some non-random classification of participants:
-allocation by judgment of the clinician; -allocation by preference of the participant; -allocation based on the result of a laboratory test; -allocation by availability of the intervention.
Criteria for a judgment of ‘UNCLEAR’ (uncertain risk of bias) Insufficient information about the sequence generation process to permit judgment of “Yes” and
“No”
Sequence generation
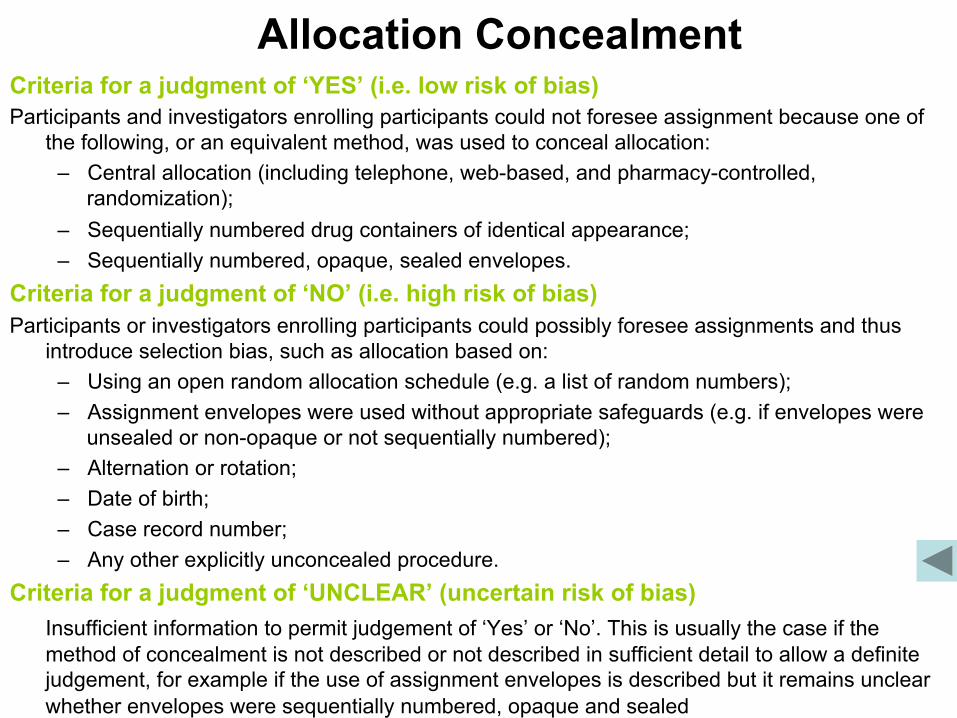
Criteria for a judgment of ‘YES’ (i.e. low risk of bias) Participants and investigators enrolling participants could not foresee assignment because one of
the following, or an equivalent method, was used to conceal allocation: – Central allocation (including telephone, web-based, and pharmacy-controlled,
randomization); – Sequentially numbered drug containers of identical appearance; – Sequentially numbered, opaque, sealed envelopes.
Criteria for a judgment of ‘NO’ (i.e. high risk of bias) Participants or investigators enrolling participants could possibly foresee assignments and thus
introduce selection bias, such as allocation based on: – Using an open random allocation schedule (e.g. a list of random numbers); – Assignment envelopes were used without appropriate safeguards (e.g. if envelopes were
unsealed or non-opaque or not sequentially numbered); – Alternation or rotation; – Date of birth; – Case record number; – Any other explicitly unconcealed procedure.
Criteria for a judgment of ‘UNCLEAR’ (uncertain risk of bias) Insufficient information to permit judgement of ‘Yes’ or ‘No’. This is usually the case if the method of concealment is not described or not described in sufficient detail to allow a definite judgement, for example if the use of assignment envelopes is described but it remains unclear whether envelopes were sequentially numbered, opaque and sealed
Allocation Concealment
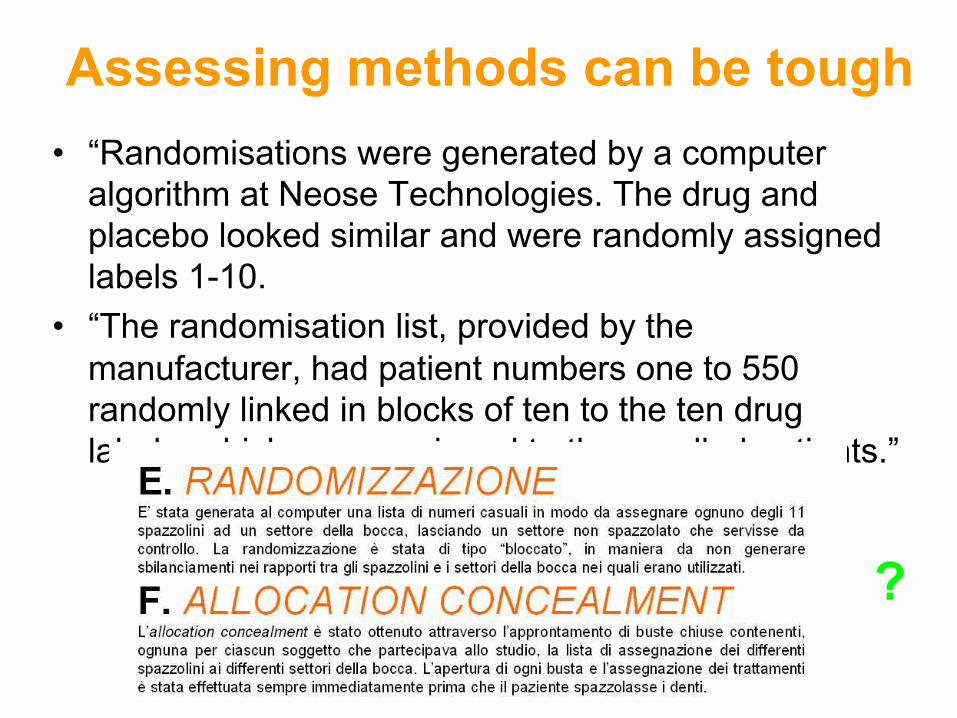
Assessing methods can be tough • “Randomisations were generated by a computer
algorithm at Neose Technologies. The drug and placebo looked similar and were randomly assigned labels 1-10.
• “The randomisation list, provided by the manufacturer, had patient numbers one to 550 randomly linked in blocks of ten to the ten drug labels, which were assigned to the enrolled patients.”
?

Ratios of odds ratios comparing estimates of intervention effects 532 trials with inadequate or unclear allocation concealment versus 272
trials with adequate concealment
Wood, L. et al. BMJ 2008;336:601-605
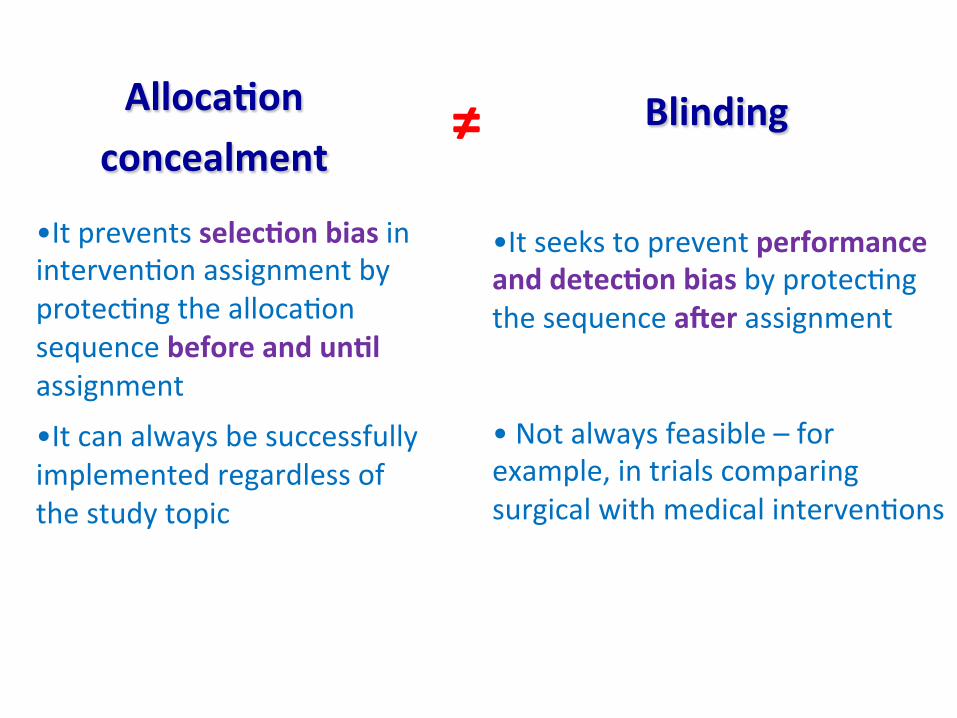
Alloca4onconcealment
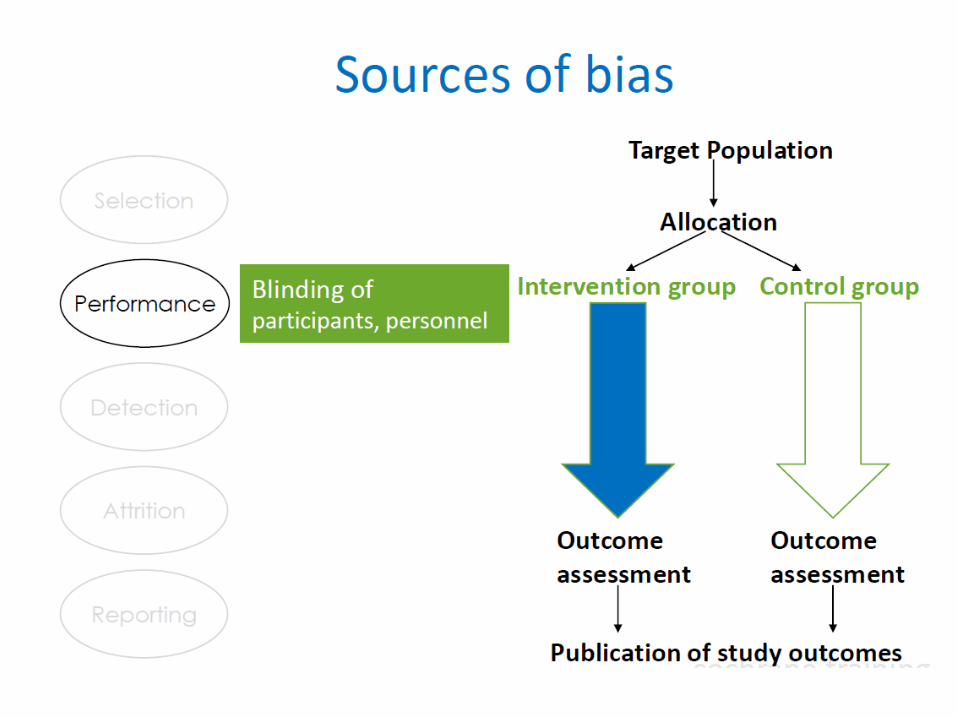
Blinding
≠
• Itpreventsselec4onbiasininterven<onassignmentbyprotec<ngthealloca<onsequencebeforeandun4lassignment
• Itcanalwaysbesuccessfullyimplementedregardlessofthestudytopic
• Itseekstopreventperformanceanddetec4onbiasbyprotec<ngthesequenceaDerassignment• Notalwaysfeasible–forexample,intrialscomparingsurgicalwithmedicalinterven<ons

CECITA’


6 ragioni per introdurre la cecità
• Se dite al paziente che è stato randomizzato al placebo, non è contento
• Se dite alle persone che l’efficacia del trattamento è dovuto all’effetto placebo, si arrabbiano
• Se dite al clinico che il paziente prende il trattamento, il clinico vedrà un miglioramento (anche in assenza di cambiamento)
• Se dite al paziente che non si dovrebbe grattare, si gratta uguale, ma vi dice che si gratta di meno (Effetto Rosenthal)
• Illusione di specifici effetti come le tradizioni millenarie sono molto radicate (agopuntura nei meridiani vs a caso)
• Avete inventato la panacea che, ogni volta che la somministrate, fallisce miseramente… cercate cercate fino a analizzare il beneficio su 100 variabili…(così funziona la statistica)
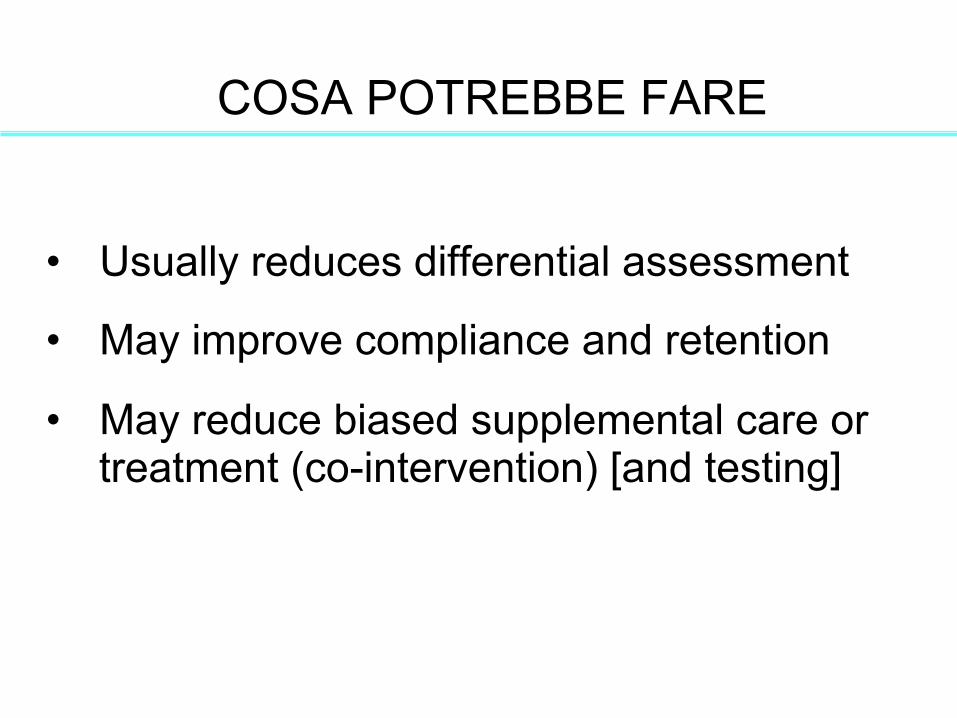
COSA POTREBBE FARE
• Usually reduces differential assessment
• May improve compliance and retention
• May reduce biased supplemental care or treatment (co-intervention) [and testing]


Criteria for a judgment of ‘YES’ (low risk of bias) Any one of the following:
– No blinding, but the review authors judge that the outcome and the outcome measurement are not likely to be influenced by lack of blinding;
– Blinding of participants and key study personnel ensured, and unlikely that the blinding could have been broken;
– Either participants or some key study personnel were not blinded, but outcome assessment was blinded and the non-blinding of others unlikely to introduce bias
Criteria for a judgment of ‘NO’ (high risk of bias) Any one of the following:
– No blinding or incomplete blinding, and the outcome or outcome measurement is likely to be influenced by lack of blinding;
– Blinding of key study participants and personnel attempted, but likely that the blinding could have been broken;
– Either participants or some key study personnel were not blinded, and the non-blinding of others likely to introduce bias.
Criteria for a judgment of ‘UNCLEAR’ (uncertain risk of bias) Insufficient information to permit judgment of ‘Yes’ or ‘No’, or the study did not
address this outcome.
Blinding
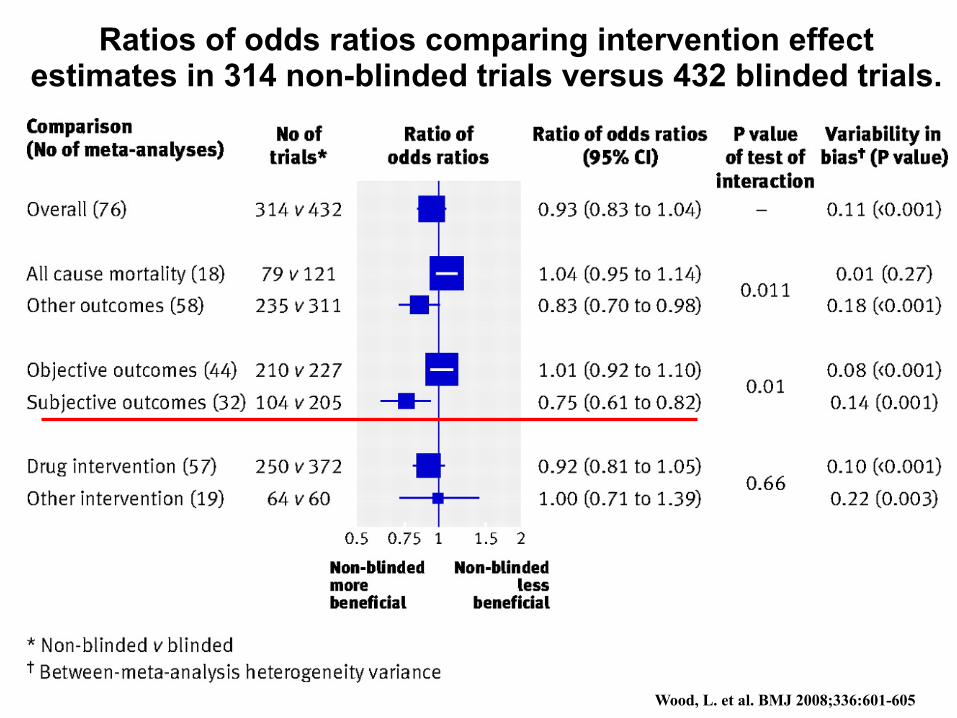
Ratios of odds ratios comparing intervention effect estimates in 314 non-blinded trials versus 432 blinded trials.
Wood, L. et al. BMJ 2008;336:601-605

Blinding: take home messages
Detection bias – • Blinding? Double blinding? Triple blinding?
• Who needs to be blinded?
• Is the outcome sensitive to blinding?
– Blinding: clearly very difficult in many intervention trials (i.e. surgical)
– Solution: Blinded assessors should be used routinely for measuring outcome


ATTRITION
Attrition bias - • Systematic differences between groups in losses of
participants from the study Systematic ≠ Random differences

!!!!!!!!!!!!!!!!
""""""""""""""
####
$$$$$$$$
Patients eligible for my trial
High risk
R !!!!!!!! """""" ## $$$$
!!!!!!!! """""" ## $$$$

Perfect Randomisation = Perfect Balance R
!!! !!!!! "" """" # # $ $$$
!!! !!!!! "" """" ## $$$$
7/20 7/20
High risk

Attrition R
7/20
6/17
7/20
3/14
!!!!!!!! """""" ## $$$$
!!!!!!!! """""" ## $$$$
= ≠
Lost to FU

Losses R
In totale:
9 pazienti persi su 40 randomizzati 23%
!!!!!!!! """""" ## $$$$
!!!!!!!! """""" ## $$$$
=
Lost to FU
E’ tanto?
La perdita è sbilanciata tra i due gruppi?
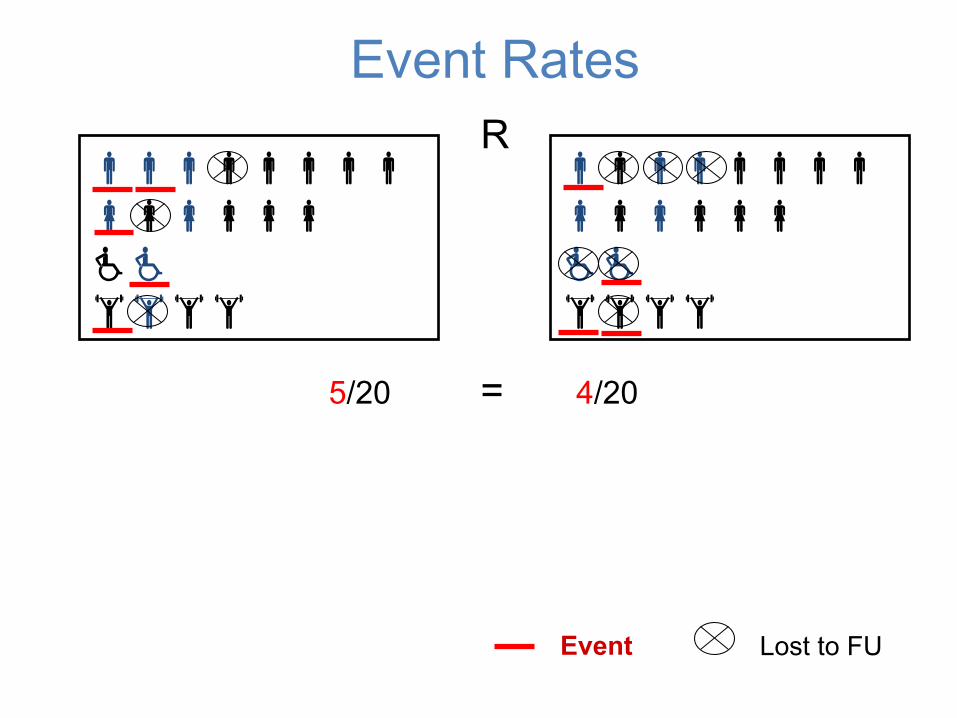
Event Rates R
5/20 4/20 =
Event
!!!!!!!! """""" ## $$$$
!!!!!!!! """""" ## $$$$
Lost to FU
R
5/17 2/14
Event
!!!!!!! """"" ## $$$
!!!!! """""" $$$
Lost to FU
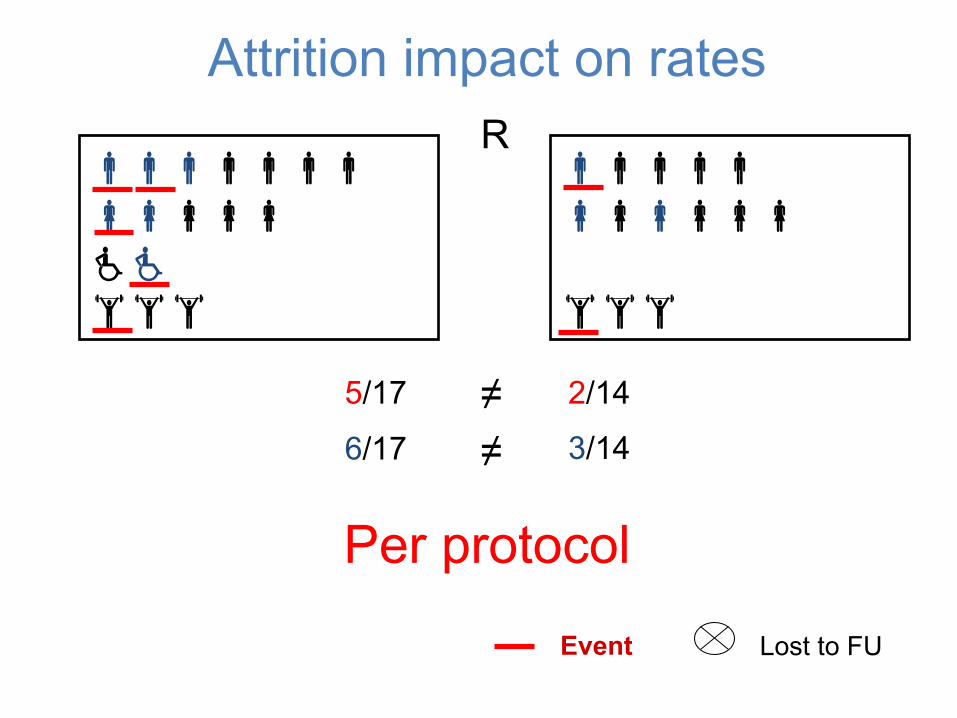
Attrition impact on rates
≠ ≠ 3/14 6/17
Per protocol
R
Event
!!!!!!!! """""" ## $$$$
!!!!!!!! """""" ## $$$$
Lost to FU
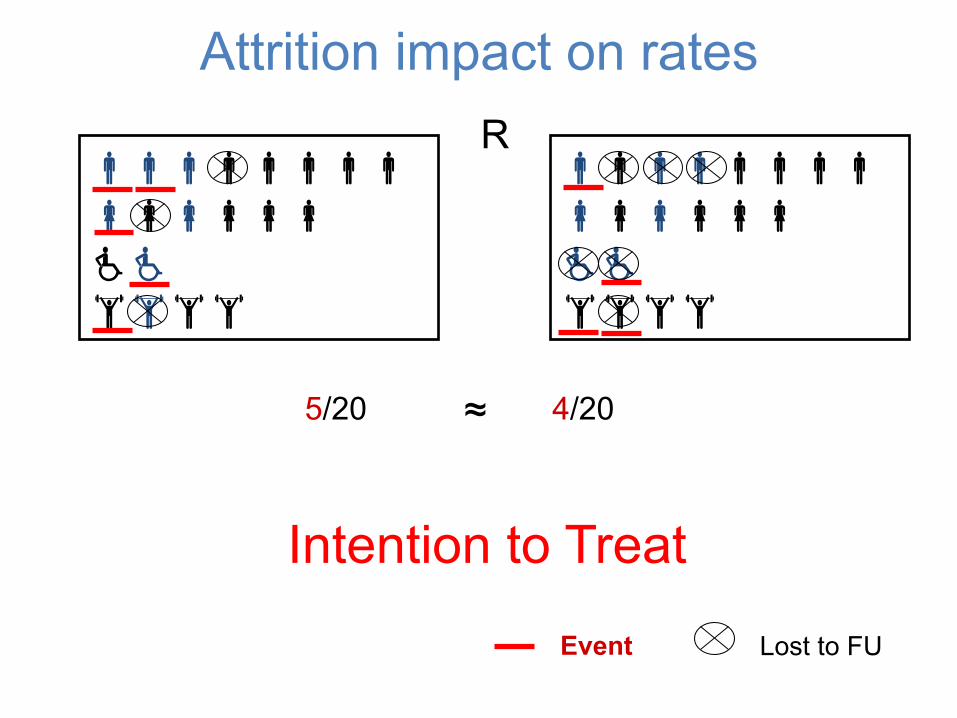
Attrition impact on rates
Intention to Treat
5/20 4/20 ≈
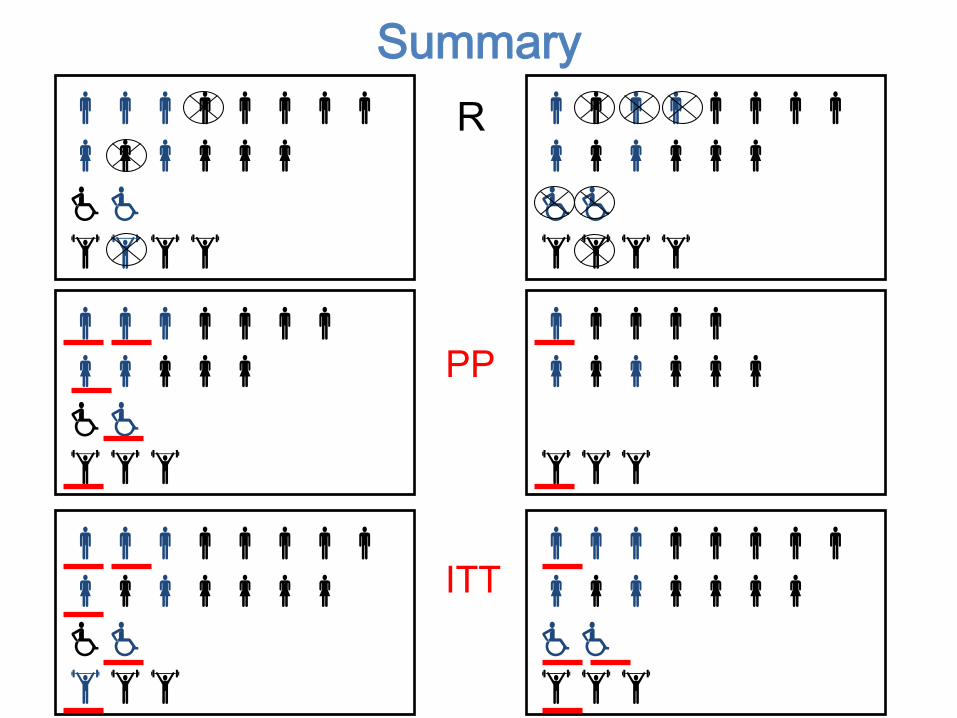
Summary R
!!!!!!!! """"""" ## $$$
!!!!!!!! """"""" ## $$$
!!!!!!!! """""" ## $$$$
!!!!!!!! """""" ## $$$$
!!!!!!! """"" ## $$$
!!!!! """""" $$$
PP
ITT
Tassonomia Le esclusioni dopo la randomizzazione non
sono tutte uguali

Attrition bias - • Systematic differences between groups in losses of
participants from the study Look at withdrawals, cross-over, drop-outs and losses to follow up

§ Exclusions people who are screened as potential participants for randomized trial but who do not meet all of the entry criteria and, therefore are not randomized [spesso il termine è utilizzato per esclusioni dopo la randomizzazione]
§ Withdrawals are participants who have been randomized but are deliberately not included in the analysis [eg, ineligibility, no adherence, poor quality data, and occurrence of competing events]
§ Lost to follow up investigator unable to assess the occurrence of the event in some participant
Participant adherence to studies

Participant adherence to studies
§ Cross over participant although assigned to the control follows the intervention or assigned to the intervention follows the control
§ Drop in particular case of cross over, unidirectional, assigned to the control, begins following the intervention
§ Drop out assigned to an intervention fails to comply with the intervention (if the control is placebo or no intervention drop out equivalent to a cross over)
§ Drop out sometimes referred to participants who are unwilling or unable to return for follow-up visits
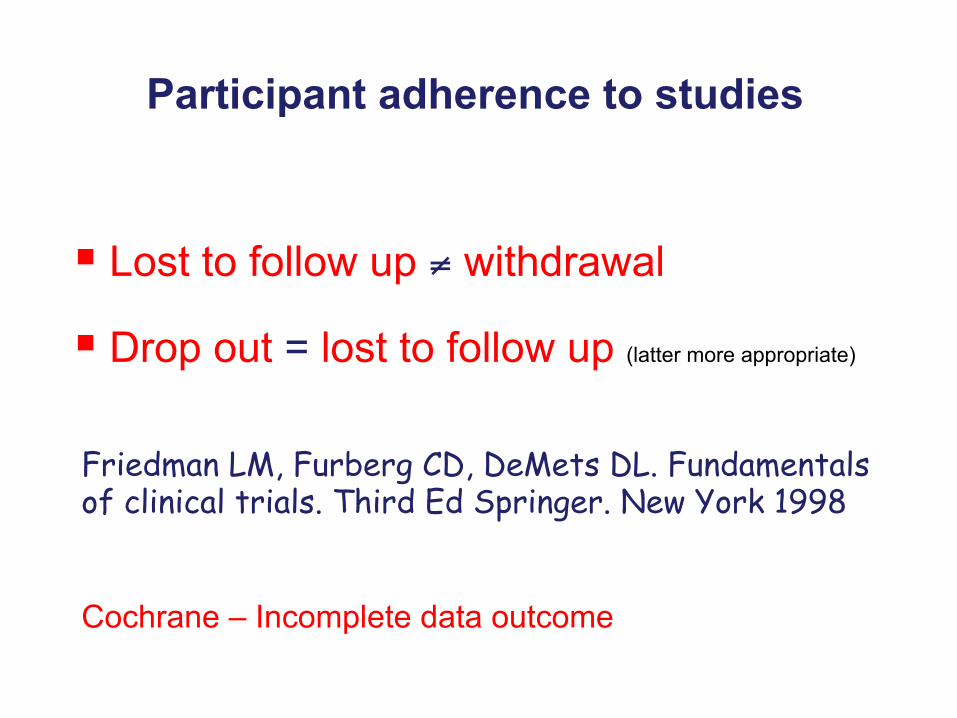
§ Lost to follow up ≠ withdrawal
§ Drop out = lost to follow up (latter more appropriate)
Participant adherence to studies
Friedman LM, Furberg CD, DeMets DL. Fundamentals of clinical trials. Third Ed Springer. New York 1998
Cochrane – Incomplete data outcome

• Keep participants in the intervention groups o which they were randomised, regardless of the intervention they actually received CONSENSUS
• measure outcome data on all participants IMPOSSIBLE • include all randomised participants in the analysis CONTENTIOUS (can
inflate precision [if events are many] or involves imputing of data)
Intention to treat analysis
Per protocol analysis Analysis of the results of only those participant who completed the trial and who complied with their allocated intervention (overestimate effects) Available case analysis Data are analysed for every participants for whom the outcome was obtained

Criteria for a judgment of ‘YES’ (low risk of bias) Any one of the following:
– No missing outcome data;
– Reasons for missing outcome data unlikely to be related to true outcome (for survival data, censoring unlikely to be introducing bias);
– Missing outcome data balanced in numbers across intervention groups, with similar reasons for missing data across groups;
– For dichotomous outcome data, the proportion of missing outcomes compared with observed event risk not enough to impact to any clinically relevant extent on the intervention effect estimate;
– For continuous outcome data, plausible effect size (difference in means or standardized difference in means) among missing outcomes not enough to impact to any clinically relevant extent on observed effect size

Criteria for a judgment of ‘NO’ (high risk of bias) Any one of the following:
– Reason for missing outcome data likely to be related to true outcome, with either imbalance in numbers or reasons for missing data across intervention groups;
– For dichotomous outcome data, the proportion of missing outcomes compared with observed event risk enough to induce clinically relevant bias in intervention effect estimate;
– For continuous outcome data, plausible effect size (difference in means or standardized difference in means) among missing outcomes enough to induce clinically relevant bias in observed effect size;
– ‘As-treated’ analysis with substantial departure of the intervention received from that assigned at randomization;
– Potentially inappropriate application of simple imputation

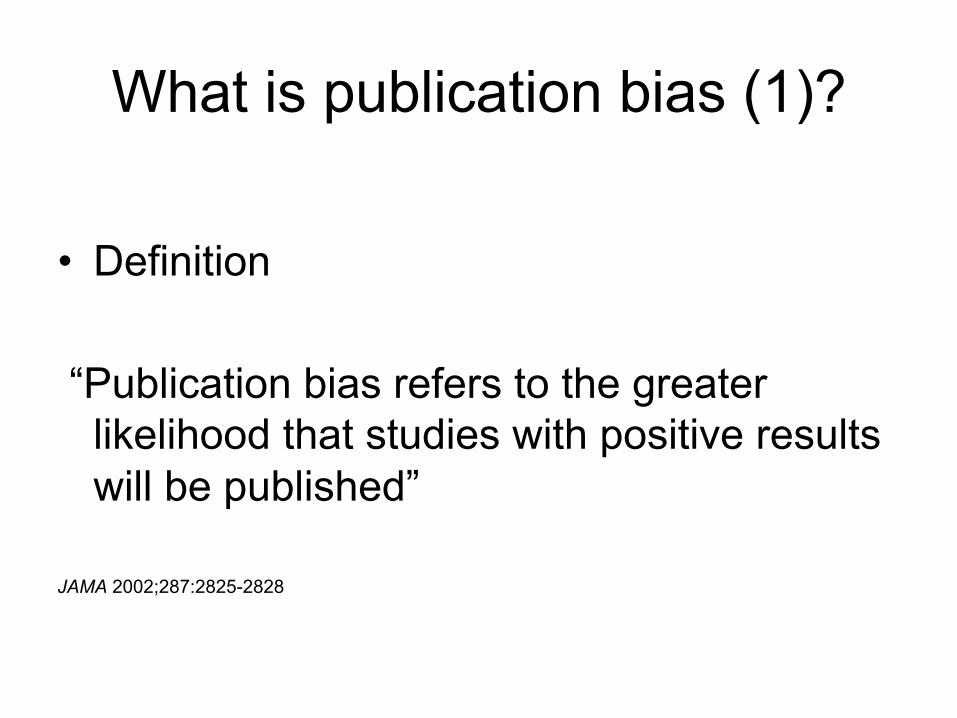
What is publication bias (1)?
• Definition
“Publication bias refers to the greater likelihood that studies with positive results will be published”
JAMA 2002;287:2825-2828

What is publication bias (2)? • An alternative definition:
Publication bias is the selective or multiple publication or suppression of trial results so that the scientific record is distorted
Extension: applied to trial parts - outcomes,
subgroups, adverse events REPORTING BIAS The likelihood of finding studies is related to the
results of those studies (positive vs negative/detrimental)
Why does it matter? • Distorts the scientific record • Hides the “truth” • Influences doctors’ decision making • Misleads policy makers • Causes harm to patients • Costly for the health service • A form of scientific and research misconduct
• TO U: It will matter if the studies you don’t find differ systematically from the ones you have found
• You might arrive at different answers, or even THE WRONG ANSWER

Publication of All Trials

Publication Bias
Asymmetrical appearance of the funnel plot with a gap in a bottom corner of the graph
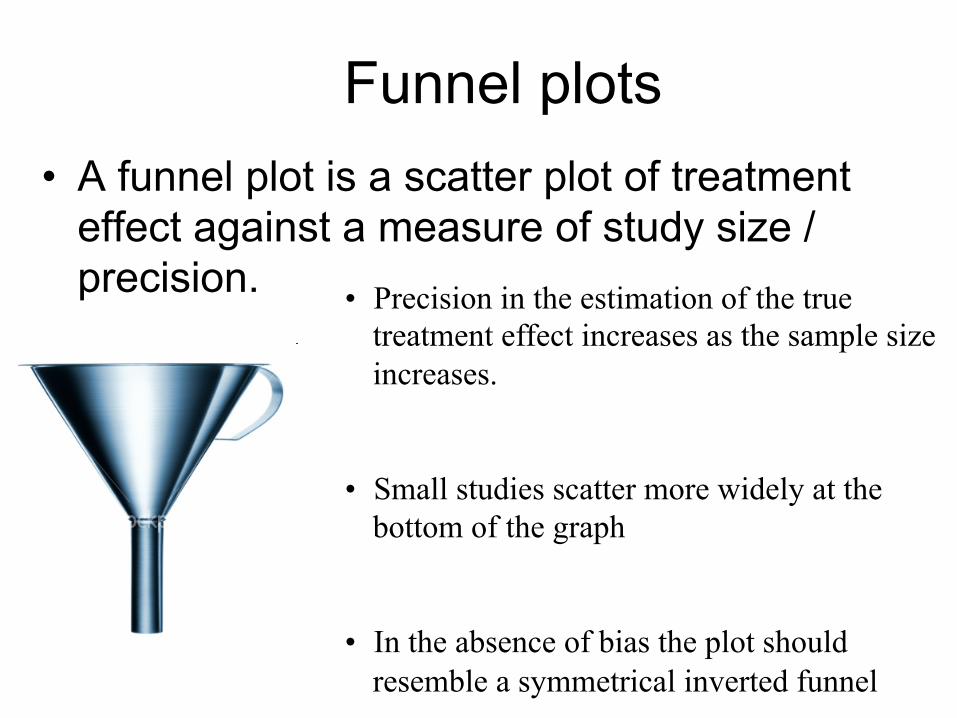
Funnel plots • A funnel plot is a scatter plot of treatment
effect against a measure of study size / precision. • Precision in the estimation of the true
treatment effect increases as the sample size increases.
• Small studies scatter more widely at the bottom of the graph
• In the absence of bias the plot should resemble a symmetrical inverted funnel

Publication Bias
• In this situation the effect calculated in a meta-analysis will overestimate the treatment effect
• The more pronounced the asymmetry, the more likely it is that the amount of bias will be substantial.

Outcome reporting bias

Reporting bias is selection bias
• Reporting bias is perhaps the greatest source of selection bias
• Originally defined as the publication or non-publication of studies depending on the direction and statistical significance of the results
• Is a complex phenomenon

Full Partial Qualitative
Unreported
n and effect size, plus precision / p-
value for continuous data
Effect size or precision
(± n or p-value)
p-value
Reported outcomes
Incompletely
reported outcomes
Hierarchy of the levels of outcome reporting (Chan, 2004)