
Università degli Studi di Trieste - openstarts.units.it da... · Università degli Studi di...
119
Università degli Studi di Trieste PhD program in MOLECULAR MEDICINE PhD Thesis TOWARDS MOLECULAR MEDICINE: OPTIMIZATION OF THE METHODS FOR GENE EXPRESSION ANALYSIS IN CLINICAL SAMPLES Isabella Dotti Anno Accademico 2005-2007 (XX ciclo)
Transcript of Università degli Studi di Trieste - openstarts.units.it da... · Università degli Studi di...
Università degli Studi di Trieste
PhD program in MOLECULAR MEDICINE
PhD Thesis
TOWARDS MOLECULAR MEDICINE: OPTIMIZATION OF THE METHODS FOR GENE EXPRESSION ANALYSIS
IN CLINICAL SAMPLES
Isabella Dotti
Anno Accademico 2005-2007 (XX ciclo)

TABLE OF CONTENTS
INTRODUCTION page 1. TOWARDS MOLECULAR MEDICINE ..........................................................1
2. MOLECULAR MEDICINE IN HUMAN CLINICAL SAMPLES.................2
2.1 Biological liquids.............................................................................................3
2.2 Tissues........................................................................................................... ..3
3. METHODS FOR DNA, RNA AND PROTEIN ANALYSIS......................... ..5
4. BIOMARKERS ................................................................................................... ..9
4.1 Definition of biomarker .............................................................................. ..9
4.2 Types of biomarkers................................................................................... ..9
4.3 Biomarker discovery .................................................................................. 11
4.4 Biomarker validation ................................................................................. 12
4.5 Biomarkers in oncology drug development ............................................. 13
5. EXAMPLES OF CLINICAL APPLICATION OF MOLECULAR............ 15
METHODS IN HUMAN SAMPLES
5.1 Breast carcinoma ......................................................................................... 15
5.2 Adrenal gland tumor................................................................................... 16
AIM OF THE STUDY...................................................................................... 18
MATERIALS AND METHODS 1. SAMPLE COLLECTION ............................................................................... 19
1.1 Samples for technical optimization ............................................................ 19
1.2 Breast cancer case study.............................................................................. 19
1.3 Adrenal gland tumor case study................................................................. 20
2. HISTOLOGIC REVISION, MICRODISSECTION AND IHC ................... 21
3. MOLECULAR METHODS FOR GENE EXPRESSION............................. 22
ANALYSIS IN URINE
3.1 Technical optimization ................................................................................ 22
3.1.1 RNA extraction ....................................................................................... 22
3.1.2 Quantitative end-point PCR.................................................................. 23
3.1.3 PCR product detection............................................................................ 25

4. MOLECULAR METHODS FOR GENE EXPRESSION............................. 27
ANALYSIS IN ARCHIVAL TISSUES
4.1 Technical optimization ................................................................................. 27
4.1.1 Starting procedures............................................................................... 27
4.1.1.1 Fixation ............................................................................................. 27
4.1.1.2 RNA extraction ................................................................................ 28
4.1.1.3 RNA quantification.......................................................................... 28
4.1.1.4 RNA integrity assessment ............................................................... 28
4.1.1.5 DNase treatment .............................................................................. 28
4.1.1.6 Reverse transcription ..................................................................... 29
4.1.1.7 Quantitative realtime PCR ............................................................. 29
4.1.2 Compared procedures .......................................................................... 31
4.1.2.1 Fixation ............................................................................................. 31
4.1.2.2 RNA extraction ................................................................................ 32
4.1.2.3 RNA quantification.......................................................................... 32
4.1.2.4 RNA integrity assessment ............................................................... 33
4.1.2.5 DNase treatment .............................................................................. 34
4.1.2.6 Reverse transcription ...................................................................... 35
4.1.2.7 Quantitative realtime PCR ............................................................. 36
4.2 Application of molecular methods to gene expression analysis................ 37
in two archival case studies
5. STATISTICAL ANALYSIS ............................................................................... 42
RESULTS 1. TECHNICAL OPTIMIZATION OF MOLECULAR METHODS................ 44
FOR GENE EXPRESSION ANALYSIS IN URINE
1.1 RNA extraction ............................................................................................ 44
1.2 PCR product detection ................................................................................. 46
2. MOLECULAR METHODS FOR GENE EXPRESSION............................... 50
ANALYSIS IN ARCHIVAL TISSUES
2.1 Technical optimization ................................................................................. 50
2.1.1 Fixation .................................................................................................. 50
2.1.2 RNA quantification ............................................................................... 54
2.1.3 RNA integrity assessment..................................................................... 55
2.1.4 DNase treatment................................................................................... 60
2.1.5 Reverse transcription........................................................................... 61
2.1.6 Quantitative realtime PCR.................................................................. 63
2.2 Application of molecular methods to gene expression analysis................ 64
in two archival case studies
2.2.1 Breast cancer case study...................................................................... 65
2.2.2 Adrenal gland tumor case study ......................................................... 68
DISCUSSION 1. CHALLENGES OF MOLECULAR MEDICINE ........................................... 74
2. MOLECULAR METHODS FOR GENE EXPRESSION ANALYSIS.......... 75
IN URINE
2.1 Technical optimization ................................................................................. 76
3. MOLECULAR METHODS FOR GENE EXPRESSION ............................... 78
ANALYSIS IN ARCHIVAL TISSUES
3.1 Technical optimization ................................................................................. 82
3.1.1 Pre-analytical treatment of tissues ...................................................... 82
3.1.2 Analytical phase .................................................................................... 86
3.2 Future perspectives....................................................................................... 91
3.3 Application of molecular methods to gene expression analysis................ 92
in two archival case studies
3.3.1 Breast cancer case study....................................................................... 92
3.3.2 Adrenal gland tumor case study .......................................................... 95
CONCLUSIONS................................................................................................. 99
ACKNOWLEDGEMENTS ...........................................................................103
REFERENCES...................................................................................................104

ABSTRACT The advent of molecular “-omics” technologies enabled an unprecedented view into the
inner molecular mechanisms of cancer and enhanced optimism towards a patient-tailored
vision of medicine. The successful application of these molecular approaches in the
discovery of candidate biomarker has accelerated the shift towards personalization of
medicine. Indeed, biomarkers hold great promise for refining our ability to establish early
diagnosis and prognosis, and to predict response to therapy. The develoment of clinically
useful biomarkers would be impossible without access to human biological specimens and
associated patient data, since they complete the molecular information gained from
laboratory research. Furthermore, with the advances of sensitive molecular technologies,
human bio-specimens can be now successfully used for wide analysis at all molecular
levels (DNA, RNA and proteins), in addition to conventional cytologic and histologic
investigations.
However, despite the hundreds of reports on tumor markers, only a few markers have
proven clinically useful. The insufficient experience in clinical application of molecular
methods combined with the high complexity of clinical material represent the major
obstacles for the development of clinically useful biomarkers.
Thanks to the possibility to have access to the fresh and archival samples from the hospital,
our laboratory can investigate the potential of technological innovations and the current
technical pitfalls directly on clinical material. The work in my thesis is strictly correlated to
this activity. In particular, the first part is focused on the technical optimization of
molecular methods for gene expression analysis in biological fluids and especially in urine
samples. In this context we validated a new experimental kit for total RNA extraction from
urine samples and tested the potential of a colorimetric approach for PCR product
detection. The major part of the study is focused on the technical optimization of molecular
methods for gene expression analysis in archival material. This activity is in step with one
of the main objectives of the European project called “Archive tissues: improving
molecular medicine research and clinical practice-IMPACTS”, in which my laboratory and
other 20 European centres are directly involved. In this phase the comparison of the
experiences between laboratories and their active collaboration are essential for a more
rapid validation of protocols dedicated to RNA (but also DNA and protein) analysis. In
particular, we investigated some molecular aspects involved in the pre-analytical phase
(tissue fixation procedures) and analytical phase (RNA extraction, RNA quantification and
integrity assessment, qRT-PCR) of tissue processing.

The final objective of this activity will be the definition of common technical guidelines
for a reliable quantification of molecular biomarkers for diagnosis, prognosis and therapy
directly in human archival samples. Finally, my thesis includes the clinical application of
molecular methods for the quantification of candidate biomarkers in two archival case
studies (a breast cancer and an adrenal gland cancer case study). In the breast cancer case
study we showed that a panel of seven genes (involved in different cell pathways) is
associated to patients’ survival. The adrenal gland tumor case study is part of a preliminary
study about the angiogenetic process in rare human cancers.

LIST OF PAPERS Bonin, S., Brunetti, D., Benedetti, E., Dotti, I., Gorji, N., and Stanta, G. (2008). Molecular characterisation of breast cancer patients at high and low recurrence risk. Virchows Arch.

LIST OF ABBREVIATIONS ACTB: Actin, beta AKT3: Protein Kinase b, gamma AMV: Avian Myeloblastosis Virus Reverse Transcriptase ATP5B: ATP synthase, H+ transporting, mitochondrial F1 complex, beta subunit BTA: in vitro immunoassay for the qualitative detection of bladder tumor antigen in urine CDC25a: Cell Division Cycle 25a CDK2, CDK4, CDK6: Cyclin-Dependent Kinase 2,4,6 CK8, CK20: Cytokeratin 8, 20 Ct: threshold cycle DPD: dihydropyrimidine dehydrogenase ELOSA: Enzyme-Linked Oligosorbent Assay EGFR: Epidermal Growth Factor Receptor (ERBB1,HER1) ERK1: Mitogen-Activated Protein Kinase 1 ER: Estrogen Receptor FLT-4: Fms-Like Tyrosine kinase 4 (VEGFR3) FFPE: formali-fixed paraffin-embedded tissue GAPDH: glyceraldehyde-3-phosphate dehydrogenase HER2: v-ERB-B2 Avian Erythroblastic Leukemia Viral Oncogene Homolog 2 (ERBB2) HKG: housekeeping gene HPRT: Hypoxanthine Guanine Phosphoribosyltransferase 1 hTR: human Telomerase RNA hTRT: human Telomerase Reverse Transcriptase IHC: Immunohistochemistry k-RAS: Kirsten Murine Sarcoma Virus 2 MGB probe: 3’-minor groove binder-DNA (TaqMan) probe MMLV: Moloney Murine Leukemia Virus Reverse Transcriptase MVD: Vascular Microvessel Density NM23: Non-Metastatic cells 1 NMP22; Bladder Tumor Antigen (NMP22) Test Kit p16: Cyclin-Dependent Kinase Inhibitor 2A PI3K: Phosphatidylinositol 3 kinase qRT-PCR: quantitative reverse transcriptase-polymerase chain reaction (realtime) RAF-1: v-RAF-1 Murine Leukemia Viral Oncogene Homolog 1 RB: Retinoblastoma RB2: Retinoblastoma 2 RT-PCR: reverse transcriptase-polymerase chain reaction SEL-1L: Suppressor of Lin12-Like TP: Thymidine Phosphorylase TS: thymidylate synthetase VEGFC: Vascular Endothelial Growth Factor C VEGFD: Vascular Endothelial Growth Factor D VEGFR2: Vascular Endothelial Growth Factor Receptor 2
Introduction
INTRODUCTION
Translation of molecular techniques to clinical application is one of the more demanding
steps for molecular medicine, as reported from the major world organizations working in
this field as FDA (Food and Drug Administration, http://www.fda.gov) in the States and
IMI (Innovative Medicine Initiative, http://imi.europa.eu/index_en.html) in Europe.
This fact is connected with a high number of factors and bottlenecks. Especially he
availability of human tissues and the huge complexity of these tissues heavily affect the
efficiency of the methods used in molecular analysis.
1. TOWARDS MOLECULAR MEDICINE
“Molecular medicine” is commonly referred to a rapidly growing multidisciplinary field. It
deals with the problem of using the molecular methods to study the disease processes at the
cellular and molecular level. These molecular information will be used to promote health
and prevent, diagnose, cure and treat diseases. The inter-exchange of molecular and
clinical records between researchers and clinicians is critical to fully realize this vision.
In clinical cancer research it has been recently seen an acceleration towards molecular
medicine to solve the limitations deriving from the standard diagnostic approaches and the
progressive decrease of new drug introduction (Phillips et al., 2006).
Conventional diagnostic and prognostic approaches for human tumors are currently based
on a combination of histopathology and immunohistology, closely connected with clinical
data. This strategy, in most cases, provides precise information on tissue origin, tumor
type, stage and grade as well as information on the completeness of surgical tumor removal
(Dietel and Sers, 2006). An international classification system based on these conventional
approaches has been established, the UICC-TNM system (Sobin, 2003). However, because
of the different molecular features of tumor cells, two patients harboring the “same” type
of tumor with “identical” stage could show different clinical outcome with respect to
survival and therapy response. Since the histopathological classification is not sufficient to
predict the outcome in these cases, new techniques are being developed to better describe
the clinical behaviour of the different neoplasms.
A patient-specific disease prediction based on tissue examination would be extremely
useful to improve this unsatisfactory situation.
Pitfalls in conventional diagnostic approaches are also reflected in the reduced
development of successful anti-cancer drugs. In the last decade indeed the number of drugs
1

Introduction
per year submitted for FDA approval has dramatically declined in comparison with the
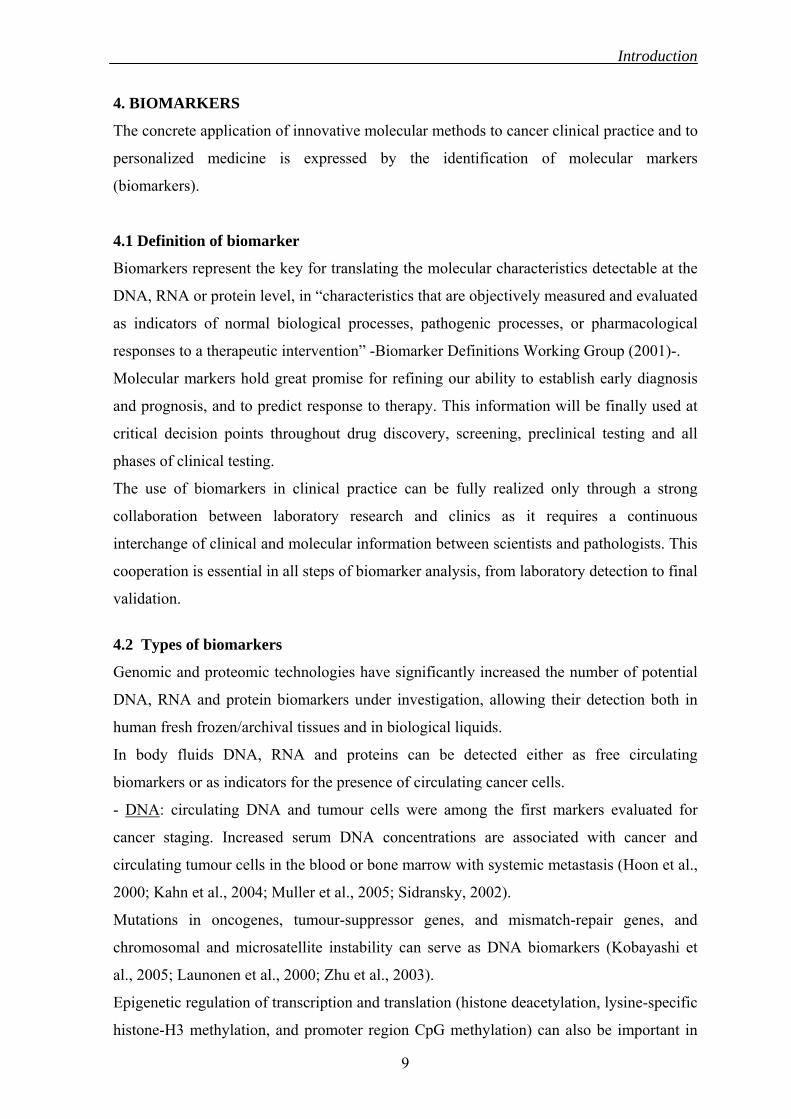
expenditures for the pharmaceutical research as reported in Fig. 1. Many drugs fail because
are tested in inappropriate patient populations or setted with unreachable clinical endpoint
(Kelloff et al., 2004). The main reason for this is related again to the molecular differences
in the same type of tumor, in fact the same kind of therapy could not be equally successful
in all affected patients. To treat the cancer more effectively new molecular tools have to be
included in the diagnosis and prognostication.
Fig. 1: trends in major drug and biological products submissions to FDA and concomitant expenditures (taken from Goldberg, R., Pitts, P. (2006) “The critical path to drug development-A working paper for the 21th century FDA task force”)
Recent technical advances in “-omics” molecular sciences (genomics, epigenomics,
proteomics..) through their application in human clinical samples (cells, tissues, fluids)
have further accelerated the progress towards molecular medicine.
The precious molecular information, combined with clinical data included in medical
records, could be used to discover the molecular features of neoplastic disease as well as to
determine the most powerful biomarkers that may predict disease outcome, prognosis or
progression and increase the relevance of tissue-based examinations by integrating these
technologies into standard diagnostic procedures.
Finally, the definition of successful biomarkers will play a crucial role in a more rapid
development of more effective and patient-designed drugs, also referred as personalized
medicine.
2. MOLECULAR MEDICINE IN HUMAN CLINICAL SAMPLES
Recent progress in the field of molecular biology, genetics and pathology presents
extraordinary research opportunities to better understand the molecular bases of diseases
2
Introduction
and for subsequent prevention and treatment. This progress would be impossible without
access to human biological specimens and associated patient data.
Specifically, in molecular medicine research human specimens can be used to:
• Identify novel therapeutic targets for drug discovery (such as specific genes or gene
products)
• Identify the molecular pattern of normal cells and cells in various stages of disease
progression
• Develop biomarkers for diagnostic and prognostic purposes included surrogate
endpoints for efficacy studies and clinical trials
• Define group of patients based on their genetic characteristics and likelihood of
positive response, for new drugs testing.
• Define group of patients based on the “biomarkers” of their disease to determine which
treatment is appropriate
Human clinical samples used for research may be obtained from autopsies, from patients or
from healthy people. Some human material is donated by volunteers specifically for
research (e.g. blood sample), but tissues removed during surgical treatment and surgical
left overs can also be useful sources.
There are two main categories of human material that can be used in molecular medicine
research: biologic liquids and tissue specimens.
2.1 Biological liquids: body fluids (serum, plasma..), proximal fluids (urine, cerebrospinal
fluid, pleural effusion, ascites..) and feces are low invasive material sources. They are
commonly used in cytologic studies and in molecular analysis from a variety of tissues
(Rifai et al., 2006). They can be used for identification studies and for clinical prospective
validation studies. Blood is the preferred material for a final diagnostic test (more than 100
protein-detecting assays are being used in diagnostics now) but complexity of plasma
proteome and the relatively low abundance of candidate biomarkers makes protein
discovery largely unsuccessful (Rifai et al., 2006). Many factors, such as tissue type, time
of collection, containers used, additives, transport, extraction and analysis of data must be
considered to ensure the quality of the samples and the reliability of the subsequent
analyses (Holland et al., 2003).
2.2 Tissues: fresh-frozen and archival tissues can be used both for histologic analysis and
for molecular studies on DNA, RNA and proteins. The recent introduction of the laser
capture microdissection (LCM) has greatly increased the reproducibility and accuracy of
the molecular analyses on these samples because it offers a rapid and precise method of
3

Introduction
isolating and removing specific cells (normal, peritumoral, tumoral as an example) from
complex tissues (Aoyagi et al., 2003; Shi et al., 2003).
Fresh tissues are the golden source for prospective molecular analysis because of the
intactness of macromolecules. The use of these specimens is mandatory in microarray-
based gene expression profiling, where high quality RNA is essential.
On the other hand, formalin-fixed and paraffin-embedded tissues (FFPEs) are a valuable
resource for retrospective diagnostic and investigative studies. FFPE is the most widely
available material for clinical retrospective studies. In combination with the potential of the
new molecular techniques on nucleic acids, these tissues represent an invaluable resource
for elucidation of disease mechanism and validation of gene expression pattern as novel
therapeutic targets or prognostic indicators. The main importance of paraffin embedded
tissues is that all bioptical, surgical or autopsy tissues are routinely fixed, paraffin
embedded and stored in Pathology department archives for decades. Another advantage in
employing these tissues is that the procedures of formalin fixation and paraffin embedding
are similar in most of the hospitals all over the world. These facts give evidence of the
importance of this type of tissues in studying rare diseases and for retrospective analyses.
Paraffin embedded tissues allows also to reach a large number of human tissues with any
kind of lesion without the need of a research specific collection (see Table 1).
The use of paraffin embedded tissues could be the solution for quantitative analysis in
clinical samples with long follow-up periods. This new methodology that has been
developed by our group could be an important tool for detecting reliable indications on the
expression of genes and correlations among them that could be useful also for therapeutical
purposes.
Given the wide availability of the paraffin-embedded tissue blocks along with the clinical
histories of the patients, both common and rare disease can be studied retrospectively;
furthermore, the cell architecture and morphology are excellently preserved, which is a
prerequisite for exact histopathological diagnosis.
Nevertheless, molecular studies still have some limitations, due to extensive degradation of
macromolecules before and during formalin fixation (Macabeo-Ong et al., 2002).
4

Introduction
FFPE TISSUES FRESH-FROZEN TISSUES Number High number Limited number Clinical information
Retrospective long-term clinical information
Often short-time clinical information only
Morphology High level Low level Microdissection Accurate Less accurate Variability range Representative of large
clinical variation Low level of variability for the limited number of cases
Follow-up Very long Often very short DNA Degraded, but can be
analyzed Very well preserved
RNA Degraded, but can be analyzed
Very well preserved
Proteins Cross-linked Very well preserved Table 1: comparison between FFPE and fresh-frozen tissues 3. METHODS FOR DNA, RNA AND PROTEIN ANALYSIS
Fueled by the complete genomic data acquired from the Human Genome Project and the
clinical need of comprehensive analytical tools to study the cancer biology, the “-omics”
technologies (high-throughput methods) started to join the more conventional molecular
approaches (low-throughput methods), accelerating the discoveries in clinical cancer
research (Chung et al., 2007). These discoveries include mechanistic understanding of
cancer biology as well as the identification of biomarkers supporting molecular
classification of tumors, early detection, prognosis, treatment response and clinical
outcome.
With the advances in these high-throughput “-omics” technologies, human bio-specimens
can be successfully used for wide analysis at all molecular levels (DNA, RNA and
proteins) (Table 2). In particular, technologies such as DNA microarrays and tissue arrays,
analyzing large number of variables simultaneously and in great detail, have moved from
hypothesis-based to successful discovery-based research, in which large quantities of data
can be analysed in a single experiment without a specific hypothesis (Canevari et al., 2006;
Ransohoff, 2004).
Furthermore, the association of these technologies to the innovative laser-capture
microdissection procedure allows selective analysis of DNA, mRNA or proteins from
precise locations within a tumour and thereby allows the definition of the molecular pattern
specific for the malignant cells. Microdissection for example enhanced expression
profiling of breast (Wulfkuhle et al., 2001) and ovarian cancer (Jones et al., 2002).
5

Introduction
FUNCTIONAL GENOMICS EPIGENOMICS PROTEOMICS METABOLOMICS GENOMICS
IHC Sequencing MSP Northern blot NMR Low thr. western blot Southern blot Cobra RPA PET immunoprecipitation CGH microSAGE ELISA LC/MS Mid thr. MethyLight FISH RT-PCR Mass spectrometry SKY qRT-PCR PCR Protein arrays microarrays
MALDI-TOF HPLC-PDA mCGH TMA High thr. microarrays GC-MS genomic array SELDI RLGS analysis 2D gel Table 2: comparative throughput of molecular approaches
The advent of innovative molecular techniques did not supplant the traditional approaches,
on the contrary, they still represent precious tools for molecular investigation in clinical
cancer research.
The following list summarizes the conventional and the new promising methods for DNA,
mRNA and protein analysis.
GENOMICS: the comprehensive evaluation of the genetic changes in cancer gives the
possibility of developing diagnostic/prognostic markers and tools. PCR-based approaches,
FISH (in situ hybridization) (Strefford et al., 2001) and CGH (Kallioniemi et al., 1994) are
technologies dedicated to the identification of either large or small deletions,
translocations, duplications of a given gene as well as regions of amplification. Recently
the high resolution microarray comparative genomic hybridization (mCGH) (Wang et al.,
2004) was developed, this technique enables a high throughput assessment of changes in
DNA sequence number at higher resolution without using metaphase chromosomes.
Another important advance in cytogenetics has come through the use of spectral
karyotyping (SKY) analysis (Veldman et al., 1997), which has increased the accuracy of
classification of rearrangements and translocations.
EPIGENOMICS: CpG islands are found in promoter regions of about half of the
cellular genes and are normally associated with gene silencing. As a consequence of the
aberrant DNA methylation patterns found in cancer cells, these epigenetic modifications
could be important targets for the development of new therapies and specific approaches to
reverse silencing of tumor suppressor genes or other genes involved in drug response in
cancer patients.
There are three main strategies for methylation detection: the digestion of DNA by a
methylation-sensitive or -insensitive restriction endonuclease; the chemical modification of
DNA by sodium bisulfite [MSP (Herman et al., 1996), COBRA (Xiong and Laird, 1997)]
and immunoprecipitation of 5-methylcytosine. Recently, all three approaches have been
6

Introduction
coupled to high-throughput technologies [realtime PCR (Trinh et al., 2001), microarrays
(Ching et al., 2005) and restriction landmark genome scanning (Hatada et al., 1991)].
An alternative detection platform is MALDI-TOF mass spectrometry, which can read a
single nucleotide at very high throughput (Jurinke et al., 2004).
miRNAomics: in recent years, further levels of biological complexity have been
identified: one of them is miRNAome, which represent the milieu of non coding RNAs
that is in part responsible of gene expression regulation. Among human diseases, it has
been shown that miRNA are aberrantly expressed in cancer, suggesting that they could
play a role as a novel class of oncogenes or tumor suppressor genes (Takamizawa et al.,
2004). Recently, with the development of dedicated micorarrays the entire miRNAome has
been analysed and the feasibility of human cancer profiling has been demonstrated in
different oncotypes (Lu et al., 2005).
FUNCTIONAL GENOMICS: Northern blot or RNase protection assay (RPA) are not
the most suitable approaches for gene expression analysis in biological samples as they are
not sensitive enough and require large amounts of intact RNA. The PCR-based techniques,
which detect even small quantities of degraded RNA, has allowed determination of single-
transcript expression levels of known markers as well as of additional markers in tissues
and circulating cancer cells, serum, urine etc (Woude et al., 2004). The further progress in
realtime chemistry has improved sensitivity, reproducibility and reliability of gene
expression analysis.
The field of functional genomics has developed rapidly due in part to microarray
technology, which allows the expression analysis of thousands of genes in a given tissue
sample in a single experiment (gene expression profiling).
This technique made possible the identificaction of gene subsets expressed in B-
lymphocytes which are able to predict aggressiveness of large B-cell lymphomas and the
patient survival (Shipp et al., 2002). Similarly a gene expression profile has been identified
for good prognosis breast cancer patients (van de Vijver et al., 2002). Furthermore, SAGE
technique (Velculescu et al., 1995) is capable of measuring global gene expression values
even from minute amounts of mRNA [micro-SAGE (Datson et al., 1999)].
PROTEOMICS: proteomics refers to the comprehensive study of proteins including
detection, identification, measurement of protein concentration, detection and
characterization of modifications, characterization of protein-protein interaction and
regulation. Conventional methods such as ELISA, IHC, Western blot and
immunoprecipitation, are limited by the evaluation of single proteins at the time, but they
7

Introduction
are still the standard assays for the detection of well known serum markers such as
carcinoembryonic antigen (CEA), human chorionic gonadotrophin, alfa feto protein
(HCGA) and prostate specific antigen (PSA). They are now joined by other large-scale
technologies [tissue and protein microarrays (Kononen et al., 1998), 2D-mass
spectrometry approach (Gygi et al., 2000), SELDI (Seibert et al., 2004)] that enable the
simultaneous detection of proteins in a single experiment (protein expression profiling).
METABOLOMICS: both gene expression and protein activity have consequences in
metabolic profile (metabolome). Molecular imaging methods (PET, NMR) have been
applied to patients’ serum as a potential novel strategy for early ovarian cancer detection
(Odunsi et al., 2005), and to in vitro cell lines to identify candidate biomarkers as clinical
diagnostic indicators. Much work have been published employing mass spectrometry (gas
chromatography-mass spectrometry, high performance liquid chromatography-mass
spectrometry(Dunn et al., 2005)
These techniques can directly follow the path and quantitative changes of an administered
molecule or the molecule’s target, allowing the study of drug distribution and
pharmacokinetics. As a consequence they could discriminate between responders and
nonresponders to a given drug. Imaging can also play a key role in measuring response to
therapy (angiogenesis responsiveness, cell apoptosis, resistance to chemotherapy) (Woude
et al., 2004).
Even if the above-cited methods have generated an interesting list of candidate biomarkers,
their functions are not still clearly related to tumor progression needing to be validated.
Obstacles in the concrete use of these methodologies for biomarker discovery are due in
part to the current limited accession to human specimens and to biobanks. Indeed, these
data repositories would represent the concrete interface between tissue donors and
scientists performing biomedical research; however their development is still faced with
many ethical, legal, scientific challenges.
Technical reproducibility and standardization processes are expected to be performed
directly on clinical material, which can only be achieved by the interdisciplinary
communication and collaboration among molecular biologists and pathologists.
8
Introduction
4. BIOMARKERS
The concrete application of innovative molecular methods to cancer clinical practice and to
personalized medicine is expressed by the identification of molecular markers
(biomarkers).
4.1 Definition of biomarker
Biomarkers represent the key for translating the molecular characteristics detectable at the
DNA, RNA or protein level, in “characteristics that are objectively measured and evaluated
as indicators of normal biological processes, pathogenic processes, or pharmacological
responses to a therapeutic intervention” -Biomarker Definitions Working Group (2001)-.
Molecular markers hold great promise for refining our ability to establish early diagnosis
and prognosis, and to predict response to therapy. This information will be finally used at
critical decision points throughout drug discovery, screening, preclinical testing and all
phases of clinical testing.
The use of biomarkers in clinical practice can be fully realized only through a strong
collaboration between laboratory research and clinics as it requires a continuous
interchange of clinical and molecular information between scientists and pathologists. This
cooperation is essential in all steps of biomarker analysis, from laboratory detection to final
validation.
4.2 Types of biomarkers
Genomic and proteomic technologies have significantly increased the number of potential
DNA, RNA and protein biomarkers under investigation, allowing their detection both in
human fresh frozen/archival tissues and in biological liquids.
In body fluids DNA, RNA and proteins can be detected either as free circulating
biomarkers or as indicators for the presence of circulating cancer cells.
- DNA: circulating DNA and tumour cells were among the first markers evaluated for
cancer staging. Increased serum DNA concentrations are associated with cancer and
circulating tumour cells in the blood or bone marrow with systemic metastasis (Hoon et al.,
2000; Kahn et al., 2004; Muller et al., 2005; Sidransky, 2002).
Mutations in oncogenes, tumour-suppressor genes, and mismatch-repair genes, and
chromosomal and microsatellite instability can serve as DNA biomarkers (Kobayashi et
al., 2005; Launonen et al., 2000; Zhu et al., 2003).
Epigenetic regulation of transcription and translation (histone deacetylation, lysine-specific
histone-H3 methylation, and promoter region CpG methylation) can also be important in
9

Introduction
carcinogenesis. Pharmacogenomic effects of methylation silencing, with implications for
choice of therapy, have also been shown (Esteller et al., 2000; Palmisano et al., 2000;
Rosas et al., 2001; Yamaguchi et al., 2003). To our knowledge, epigenetic factors have not
yet been used in formal staging, but their application to predict response to treatment can
be expected in the future (Esteller, 2005).
Particular single-nucleotide polymorphisms have been associated with increased cancer
risk (Bonnen et al., 2002; Chang et al., 2003a; Hoque et al., 2003; Janne et al., 2004), but
SNPs are not currently used for formal cancer staging and grading.
RNA- : as for DNA, also RNA markers can be evaluated individually (Bonin et al., 2008;
Bonin et al., 2006; Siracusano et al., 2005), even though many high-throughput
technologies have been developed to assess mRNA expression comprehensively. Most
RNA-based biomarkers undergoing clinical evaluation consist of multi-gene molecular
patterns or 'fingerprints'. Although such patterns can be more accurate than single-
molecule markers, the choice of the genes to include in the pattern efforts the problem of
the statistical complexity, prompting new developments in biostatistics, bioinformatics and
data visualization.
Expression profiling has been associated to differences in survival, prognostic capability,
predicted response to neoadjuvant therapy, prediction of metastasis in lymph-node
negative patients (Bittner et al., 2000; Chang et al., 2003b; Ramaswamy et al., 2003;
Sotiriou et al., 2003; van de Vijver et al., 2002). The transcriptional levels of enzymes have
been used pre-clinically for predicting the response to chemotherapy (Rosell et al., 2004;
Salonga et al., 2000). Extensive validation studies will be required to transfer those
developments from clinical research to standard practice in staging. In fact these and other
RNA-based markers have not yet undergone rigorous, prospective clinical validation and
they have not still been approved by the FDA.
- Proteins: as quantity by itself might not be the salient parameter for protein biomarkers,
molecular tests for protein detection focus more on the cellular location and on protein
function that depends on post-translational modifications such as phosphorylation or
glycosylation (Godovac-Zimmermann and Brown, 2001; Nishizuka et al., 2003). Recently
protein expression profiling has joined the individual protein detection (Liotta et al., 2003;
Matikainen et al., 1999): this high-throughput expression analysis may outperform DNA
and RNA profiling as these profiles do not necessary correlate with protein expression,
while protein is the ultimate reflection of gene function (Zhang et al., 2004). These
approaches however remain in the developing stage. -
10

Introduction
Circulating cells: epithelial cancer cells are easily detectable in blood using specific cell
surface markers (cytokeratins). They have been found to correlate with disease status and
in patients with liver (Yang et al., 2008) and breast cancer (Cristofanilli et al., 2004),
suggesting their use as biomarkers for drug response and disease progression (Beerepoot et
al., 2004). In addition to fully differentiated endothelial cells, immature circulating
endothelial progenitor cells derived from bone marrow also exhibit potential as a surrogate
marker for tumor angiogenesis (Woude et al., 2004).
4.3 Biomarker discovery
DNA, RNA and proteins represent the targets of biomarker research. The first step that
allows identification of candidate biomarkers is the discovery process. It can be based on
model systems or different human biological materials. The design of this research and is
usually a simplified, binary comparison between diseased and normal samples.
Human cell lines are genetically homogeneous systems providing an important source for
basic research biomarker discovery as they are powerful tools to describe many cellular
processes. However, the use of clinical specimens is in any case necessary to completely
characterize molecular alterations involved in human diseases (Gillespie et al., 2002).
Research that proposes the use of human cell lines available from the American Type
Culture Collection or a similar repository is not considered human subject research because
the cells are publicly available and all of the information known about the cell lines is also
publicly available.
The molecular research on disease-associated clinical samples is the best tool to discover
the genetic basis of neoplastic disease as well as to find out the biomarkers. The flow of
this reseach can take two directions (Fig. 2). The first direction, from the laboratory bench
to the patient’s bedside, is taken by the translational research that acts to turn the laboratory
data into novel therapeutics and diagnostics. The second opposite direction, from the
patient’s bedside to the laboratory bench, corresponds to molecular analysis/reverse
translational research that interrogates clinical samples for a variety of biomolecules.
11

Introduction
BIOMARKER DISCOVERY
BIOMARKER DISCOVERY
Fig. 2: Illustration of the circular flow connecting the lab bench to the bedside (adaped from Molecular Profiling Initiative by the National Cancer Institute and the Center for Information Technology)
The products of this phase are lists of candidate biomarkers that can be supplemented with
(or substituted with) candidates drawn from the literature (Rifai et al., 2006).
4.4 Biomarker validation
Depending on the purpose of the biomarker, the objective of the validation –such as
specificity, sensitivity, and reproducibility of assays for diagnostic purposes- will be
different.
In any case, it is possible to define common steps from discovery to validation. After
biomarker discovery, a qualification step is necessary. First, it confirms that the candidate
biomarker observed in discovery is seen using alternative methods. Second, qualification
confirms the candidate biomarker in simplified comparisons of diseased and normal human
bodily fluids, if discovery was not initially performed in this material. In this phase,
sensitivity is usually emphazised over specificity (Rifai et al., 2006). In verification step,
the analysis is extended to a large number of samples, now incorporating a broader range
of cases and controls with their environmental, genetic and biological variations. Thus in
verification of candidate biomarker, sensitivity is affirmed and specificity begins to be
assessed. The few candidate biomarkers that perform well in verification then move
through assay optimization to validation, in which a research grade of the final assay is
tested against many samples that precisely reflect the full variation of the targeted
population.
12

Introduction
In all these steps the correct acquisition and interpretation of molecular data and the proper
collection of clinical material are essential to accelerate the process.
Table 3 reports the cancer biomarkers that have been approved by FDA for their clinical
use. Most of them are single proteins, and the majority of these protein biomarkers has
been detected in serum (Ludwig and Weinstein, 2005).
Table 3: US Food and Drug Administration-approved cancer biomarkers. See (Ludwig and Weinstein, 2005).
4.5 Biomarkers in oncology drug development
The application of biomarkers in the field of molecular targeted cancer therapies can be
seen as the final goal of molecular medicine.
Indeed, biomarkers have many potential uses in all phases of the drug development
process, from target discovery and validation through pivotal clinical trials for drug
registration (Park et al., 2004). Biomarkers can also be used to screen and optimize
candidate agents, enhance mechanistic understanding of drug or drug combinations,
identify optimal target populations and predict response, resistance and toxicity (Park et
al., 2004).
13
Introduction
It is clear that the translation of the molecular insights into useful therapeutic approaches is
highly complex as traditional paradigms of drug development are not well suited to these
new challenges and may not fully exploit the potential of molecular advances. Instead, an
integrated and collaborative effort is needed among pharmaceuticals, biotechnology and
clinics to translate laboratory insights into rationally designed agents (Ransohoff, 2004).
The first step in the application of
biomarkers in drug development is
considering their impact on the
evaluation to therapeutic
intervention. When a biomarker is
likely to predict clinical benefit or
risk, it may achieve the status of surrogate (“to substitute for”) endpoint. In this
circumstances, this biomarker is able to substitute the corresponding clinical endpoint that
the conventional diagnostics normally uses in the assessment of a specific therapeutic
intervention- Biomarker Definitions Working Group (2001)-.
BIOMARKER: a characteristic that is objectively measured and evaluated as an indicator of normal biological processes, pathogenic processes, or pharmacologic responses to a therapeutic intervention CLINICAL ENDPOINT: a characteristic or variable that reflects how a patient feels, functions or survives SURROGATE ENDPOINT: a biomarker that is intended to substitute for a clinical endpoint. It is expected to predict clinical benefit based on epidemiologic, therapeutic, pathophysiologic, or other scientific evidence
Although all surrogate endpoints can be considered biomarkers, only a few biomarkers will
achieve surrogate endpoint status. The use of surrogate endpoints to establish therapeutic
efficacy in registration trials is an established concept that has been addressed in regulation
that enables FDA to grant accelerated marketing approval for certain therapeutics.
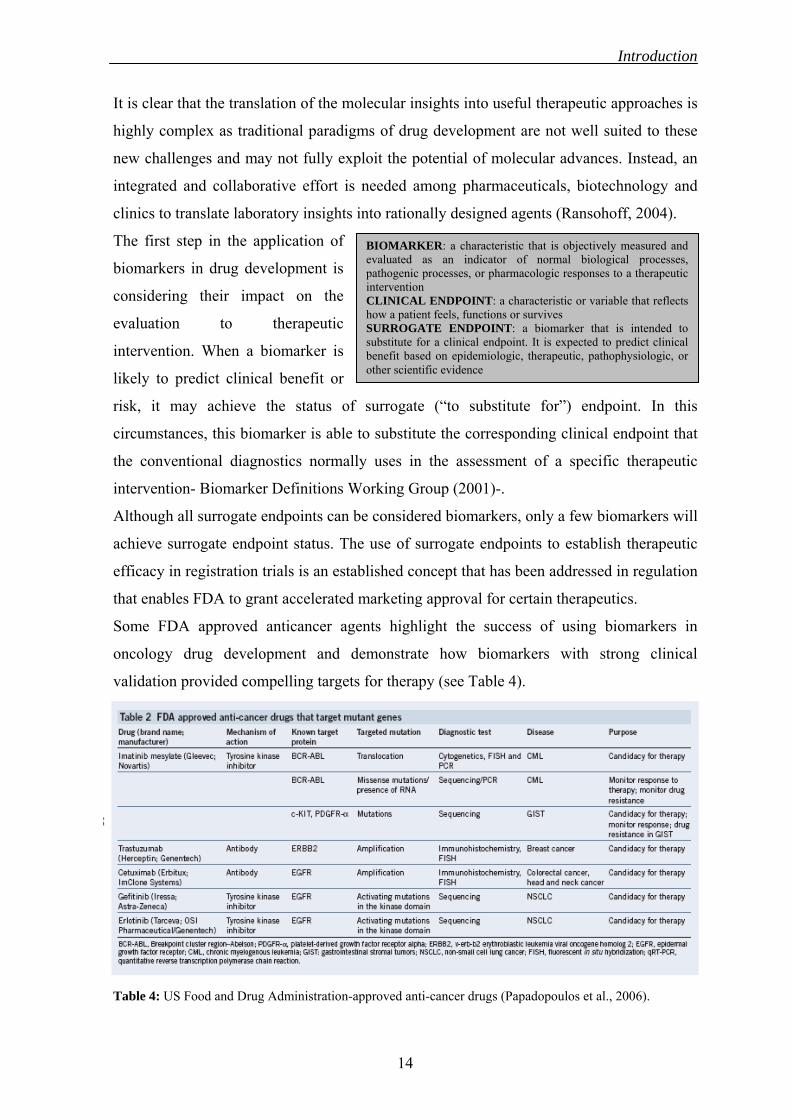
Some FDA approved anticancer agents highlight the success of using biomarkers in
oncology drug development and demonstrate how biomarkers with strong clinical
validation provided compelling targets for therapy (see Table 4).
Table 4: US Food and Drug Administration-approved anti-cancer drugs (Papadopoulos et al., 2006).
14

Introduction
However, despite high interest and investments in this field, few novel biomarkers are
effectively introduced in the clinical practice every year (Rifai et al., 2006). Many agents,
despite promising scientific rationale, have shown disappointing efficacy in clinical trials,
or clinical studies have revealed benefit in some trials but not others (Park et al., 2004).
The reasons for this disjunction reflect the long and difficult path from candidate
biomarker discovery to the clinical assay and the lack of coherent and comprehensive
guidelines for biomarker development (Anderson, 2005).
5. EXAMPLES OF CLINICAL APPLICATION OF MOLECULAR METHODS IN
HUMAN SAMPLES
In this chapter, two examples of clinical case studies are reported. The first neoplasia to be
considered is breast cancer. It’s very frequent in industrialized countries
(http://www.cancer.gov/). Many reports about new candidate biomarkers in these cancers
have been published so far.
The second cathegory of human cancers involves the adrenal gland. It can be affected by
rare tumors that involve both the adrenal cortex than the inner medullary part. Due to their
rarity, few studies succeeded in characterizing them from a molecular point of view
(Stratakis, 2003).
5.1 Breast carcinoma
Breast cancer is the leading cause of death among women in developed countries
(Yankaskas, 2005). Despite important advances in therapy, more than half of the affected
patients undergo relapses (Paredes et al., 2007). Several clinical and pathological factors
have been proposed to predict the recurrence of breast cancer. However, at the present time
it is not possible to predict recurrence versus no recurrence at an individual level. It is
commonly accepted that the different clinical courses of patients characterized by the same
histology and stage are the result of molecular differences among cancers. Different single
molecular markers have been assessed in the past 20 years, but failed to be considered for
clinical use for various reasons (Pusztai et al., 2006). Microarrays studies for example have
identified expression profiles and gene sets that are prognostic or predictive (van de Vijver
et al., 2002) but comparison of the lists of genes derived from these studies shows only a
slight overlap probably due to differences in the cohorts of patients, microarray platforms
and mathematical methods of analysis (Fan et al., 2006).
15

Introduction
The selective detection of expression level of a well-defined panel of genes involved in the
maintenance/abrogation of the cell senescence machinery should represent a valid
alternative hypothesis-based approach that allows to investigate the progression of breast
carcinoma using archival material.
5.2 Adrenal gland tumor
Adrenal gland cancers are rare tumors (approximately 1 out of 1 million people worldwide
develop adrenal cancer for unknown causes) that can affect both the adrenal cortex and the
inner medulla and are characterized by the production and secretion of excessive amount
of hormones.
Adrenocortical tumors, that arise from human adrenal cortex, represent a group of
heterogeneous lesions that produce excess secretion of steroid hormones and aldosterone.
Most are benign adenoma, but in rare occasions they can progress to carcinoma, which is
characterized by a highly aggressive behaviour (Sidhu et al., 2003). Often the progression
towards malignancy is diagnoseable only in presence of a clear evidence of local invasion
and metastasis.
Pheochromocytoma is a rare tumor that in 90% of cases originates from the adrenal glands'
chromaffin cells, causing overproduction of catecholamines (Bravo, 1994). Approximately
10% of pheochromocytomas are malignant. One of the main difficulties in its menagement
is the absence of reliable criteria for distinguishing malignant from benign tumors.
Adrenal gland, as well as other endocrine organs, requires physiologically adequate
vasculature to promote access of hormones products to circulation. It is suggested that a
different angiogenetic pattern might also condition the secretory status of these adrenal
cancers. Several experimental and clinical studies showed that cancer growth and its
metastatic spread are closely related to angiogenesis (Ellis and Fidler, 1996). This
association is based on studies that have evaluated the tumor angiogenic phenotype,
including microvessel density (MVD) (Bono et al., 2002; de Jong et al., 2000) and the
expression level of angiogenic factors (VEGFs) (Kurahara et al., 2004; Mohammed et al.,
2007). VEGFC and VEGFD and their receptor VEGFR2 seem to have a crucial role in
vasodilatation, endothelial cell migration and proliferation in blood vessels (Risau, 1997).
VEGFC and VEGFD are also ligands of FLT-4 (Achen et al., 1998; Joukov et al., 1996),
where they seem to be important regulators of lymph vessels growth and also enhancers of
lymphatic metastasis in different tumors (Mandriota et al., 2001; Stacker et al., 2001).
16

Introduction
Due to the rarity of these adrenal gland tumors, few studies in the literature have
comprehensively evaluated the angiogenetic process and its role in the molecular
characterization of these cancers.
17
AIM OF THE STUDY
The aim of the study was to define which are the most appropriate molecular methods for
gene expression analysis in clinical practice.
In order to explore the potential of conventional and innovative molecular approaches in
clinical cancer research, two main biological fields were considered: biological liquids and
archival tissues.
1. BIOLOGICAL LIQUIDS: in this part of the study we focused on the use of urine
samples for mRNA biomarker detection and tried to optimize some molecular approaches
dedicated to this type of analysis.
2. ARCHIVAL TISSUES: Most part of this project of thesis is connected to the work that
is performed in our laboratory about application of molecular approaches in archival
tissues.
This part of the work in fact is developed in the context of the European project called
“Archive tissues: improving molecular medicine research and clinical practice-
IMPACTS”. This project involves the collaboration of many researchers in our laboratory
and in other 20 centres spread in 11 European countries. This complex and multilaboratory
project gives reason of the different experiences that I developed in these last three years.
My work, in fact, must be combined with that of many other researchers that are involved
in other parts of this project.
In this part of the study, we explored several home-made molecular approaches that can
limit the use of archival tissues for gene expression analysis in clinical practice and
investigated the potential of some technological innovations. The optimization of these
molecular approaches involved in pre-analytical (tissue transport, fixation time, type of
fixative..) and analytical (RNA extraction, qualitative and quantitative RNA detection..)
treatment of archive material was performed in both human cell lines and clinical samples.
In this context we analyzed 2 examples of clinical application of molecular methods in
breast and adrenal gland cancer to detect quantitatively specific mRNA biomarkers.
18
Materials and Methods
MATERIALS AND METHODS
1. SAMPLE COLLECTION
The clinical samples can be divided in two groups. The first one includes human cancer
cell lines (A375, T24), various formalin-fixed paraffin-embedded samples of different
origin and human urine samples, that were used for technical optimization experiments.
The second group includes two indipendent clinical case studies from archival tissues that
were used to study candidate biomarkers.
1.1 Samples for technical optimization
- A375 (malignant melanoma) cell line was used for technical optimization in archival
tissues, while T24 (transitional cell carcinoma) cell line was used for technical
optimization in urine samples. Cells were cultured at confluence in 150mm plates in RPMI
medium supplemented with 10% fetal calf serum. After trypsinization the cell pellet was
washed twice in PBS and the cell count was performed using a conventional Burker
chamber. Pellets were then submitted to following analysis (RNA extraction or fixation).
- Voided urine samples from bladder cancer patients and non tumoral controls were
provided by the Department of Urology of Cattinara Hospital of Trieste; they were used for
the optimization of methods for gene expression analysis in biological fluids.
- Clinical formalin-fixed and paraffin-embedded samples deriving from breast, adrenal
gland and colon cancer archived in the Cattinara Hospital of Trieste were collected from
case studies analyzed in our laboratory and were used for the optimization of methods for
gene expression analysis in archival tissues.
1.2 Breast cancer case study
To investigate the progression of breast carcinomas, we have analysed the level of
expression of a well-defined panel of genes involved in the maintenance/abrogation of the
cell senescence machinery in primary breast cancers.
Eighty women resident in the Northeastern Italian province of Trieste, whose first primary
cancer was unilateral invasive breast carcinoma, were selected from the data base of the
Surgical Pathology Department of the University of Trieste. Seventy-three patients
belonging to this cohort were also part of a previous study (Bonin et al., 2006). Cancers
were diagnosed at the age of 34 or older, between 1971 and 1989, and only treated with
Halsted radical mastectomy and complete axillary dissection. Carcinomas were
19

Materials and Methods
histologically graded according to Elston and Ellis (Elston and Ellis, 1991) and grouped in
stages according to the TNM Classification of Malignant Tumours, 6th edition (Singletary
et al., 2003). Clinical information is reported in Table 1.
Table 1: Characteristics of the 80 breast carcinomas by stage, grading and patients age at diagnosis
The cohort of women was followed through the general popμlation-based Friμli-Venezia
Giμlia Cancer Registry from diagnosis of breast cancer to death or 31 December 2006.
During the observation period, 69 women died and all of them underwent complete
autopsy at the Surgical Pathology Department of the University of Trieste.
Formalin fixed paraffin embedded specimens from primary breast cancer were used to
isolate and quantify the RNA. RNA was then submitted to gene expression investigations.
1.3 Adrenal gland tumor case study
To elucidate the role of angiogenesis and lymphangiogenesis in aggressiveness and
progression of different types of adrenal gland cancers, formalin-fixed and paraffin
embedded samples from 15 adenomas, 9 carcinomas and 10 benign pheochromocytomas
between 2000 and 2006 were chosen. Such 34 patients were selected from the data base of
the Surgical Pathology Department of the University of Padova (Table 2).
Table 2: Characteristics of the 34 adrenal gland tumors by grading and patients age at diagnosis
GRADING Years of age at diagnosis STAGING
G1 G2
N° of cases
G3 Mean Range
I 14 15 4 33 65 38-79
IIA 7 14 5 26 63 35-87
IIB 1 4 1 6 56 48-63
IIIA 3 6 2 11 57 34-76
IIIC 0 3 1 4 70 47-90
All stages 25 42 13 80 61 34-90
GRADING Years of age at diagnosis TUMOR
G1 G2
N° of cases
G3 Mean Range
ADENOMA - - - 15 56 31-77
CARCINOMA 2 2 3 9 49 37-66
PHEOCHROM. - - - 10 44 23-61
20

Materials and Methods
Formalin fixed paraffin embedded specimens were used to isolate and quantify the RNA.
RNA was then submitted to gene expression investigations.
2. HISTOLOGIC REVISION, MICRODISSECTION AND IHC
- For hematoxylin-eosin (H&E) staining 3μm-thick sections were cut and mounted on a
glass slide. The standard staining procedure was followed (Melis, M., “Compendio di
tecnica istopatologica”, Lombardo Editore, 1975) and analysis of the morphological aspect
was performed by a pathologist.
- When both peritumoral (or normal tissue) and tumor tissue were present on the same
paraffin block, or when the peri-tumoral component was also necessary for the following
molecular analysis, manual microdissection was performed.
Areas for microdissection were first marked on the original hematoxylin-eosin-stained
slide and then a manual microdissection was performed by sectioning directly the paraffin
block.
- Immunohistochemistry (IHC) was performed on tissue sections when histopathological
analysis was required to confirm the molecular resμlts.
Specifically for adrenal gland tumor case study, immunohistochemistry using the anti-
CD31 (Ventana Medical System) was performed in order to determine the microvessel
density (MVD), which is an index of angiogenetic pattern (Hlatky et al., 2002; Pusztaszeri
et al., 2006).
Briefly, for every specimen two consecutive 3μm-thick sections were dried at 60-65°C for
1hour. Immunohistochemical detection was achieved on an automated immunostainer
(Ventana Medical System) according to the manufacturer’s protocols.
CD31-stained sections were evaluated for MVD by two indipendent investigators.
Each section was first scanned at low-power magnification (10x-25x) to select the areas
containing the highest number of capillaries and small venules (neovascular “hot spots”);
three hot spots were selected and evaluated at 250x field (ocular lens, 10x; objective lens,
25x; field area, 0.74mm2). This was made in order to include the maximum number of
microvessels. Single immunoreactive endothelial cells, or endothelial cell clusters, with or
withour lumen and separate from adjacent structures, were counted as individual
microvessels.
MVD was calculated as the average of the three counts.
21

Materials and Methods
3. MOLECULAR METHODS FOR GENE EXPRESSION ANALYSIS IN URINE
This part was dedicated to the technical optimization of molecular methods for gene
expression analysis in biological fluids, especially in urine. The research was focused on
the investigation of alternative molecular approaches that could substitute the more
expensive (realtime PCR), time-consuming (Chomczynski and Sacchi extraction protocol),
hazardous (radioactive-based detection protocols) procedures in clinical practice.
3.1 Technical optimization In this section the applicability and reliability of several molecular approaches for gene
expression analysis in urine were tested. Both a cell line (T24) and voided urine samples
were used.
3.1.1 RNA extraction: Total RNA from T24 cell line was used for this experiment. RNA
was extracted by means of .the Chomczynski and Sacchi protocol (Chomczynski and
Sacchi, 2006), with some modifications, and by means of a spin column-based
experimental kit, in order to compare sensitivity and efficiency of the 2 methods.
The kit was developed in our laboratory through a collaboration with a company devoted
to the molecular diagnostics (R&D Lab of Macrochip, Trieste, Italy). This kit is an
experimental vacuum-based system that allows a rapid filtration and collection of the cells
on a filter membrane. The filter is then directly incubated in the lysis solution and RNA
extraction is the performed using a spin-column based protocol. In this kit, the colums is
filled with diatomaceous earth (consisting fossilized diatoms, a type of hard-shelled algae)
that, in the presence of highly concentrated chaotropic agents, is able to selectively retain
the RNA.
For this comparison experiment five 2-fold dilutions of T24 cell line were used, starting
from 2*106 cells. Each quantity was previously resuspended in 50ml PBS (to reproduce the
conditions of cells as they were in 50ml of urine) and two parallel protocols were followed.
The test was repeated three times in the same conditions.
- According to the first protocol, the T24 cell samples in PBS were centrifuged at 1200g
and the cell pellet resuspended in 500μl of digestion solution (“D solution”: 4M
guanidinium thiocyanate, 25mM sodium citrate, pH 7.0, 0.5% N-lauroylsarcosine and
0.1M 2-mercaptoethanol). RNA extraction was performed by adding to this solution an
equal volume of an acid phenol/chloroform 50:50 mixture. The upper, acqueous phase was
recovered and RNA was overnight precipitated by adding 3 volumes of absolute ethanol
and 14.5μl glicogen 1mg/ml. Total RNA was resuspended in 15μl DEPC H 0. 2
22

Materials and Methods
Quantification and quality determination of total RNA was performed by
spectrophotometer reading at 260nm and 280nm. Purified RNA was stored at -80°C.
- According to the second kit protocol, the T24 cell samples resuspended in PBS were
filtered through a vacuum filter system. Cells were collected on a filter membrane, put
directly into 450μl of lysis solution for 30’ (4M guanidinium thiocyanate, 25mM sodium
citrate, 0.5% N-lauroyl sarcosine). The filter could be stored at this point of the extraction
at -20°C for a maximum period of 1 month. One-hundred μl of 4% diatomaceous earth in
potassium acetate were added to the lysis solution and was loaded on the spin column.
After a cycle of washings, the bound RNA was eluted in a fixed volume of 50μl of pre-
heated DEPC H20. All the procedure required 1 hour of work. Quantification and quality
determination of total RNA was performed by spectrophotometer reading at 260nm and
280nm. Purified RNA was stored at -80°C.
3.1.2 Quantitative end-point PCR: an end-point PCR was used for the quantification of
the mRNA transcriptional levels instead of the realtime PCR in order to keep low the costs
of the research.
Before reverse transcription step, a DNase treatment was performed to remove
contaminating gDNA from RNA solution. 2μg of total RNA were resuspended in 1x
DNaseI Buffer, 80 units of Rnase inhibitor (Ambion), 10 units of DNaseI (Amersham).
Reaction was left to proceed at 37°C for 20 minutes. To purify RNA from DNaseI an
extraction with phenol-H20/chloroform was carried out. RNA was precipitated with
isopropanol using 5μl glycogen 1mg/ml as a carrier. Quantification of total RNA was
performed again and purified RNA was stored at -80°C.
Three target genes were tested: hTRT, CK20 and CD4, which present highly variable
levels of expression in urothelial cells. To correct for errors depending on differences in
sample to sample RNA quality, GAPDH expression was introduced as normalization
factor.
For every target gene intron-spanning primers and a probe were designed in order to meet
specific criteria of length (between 15 and 25 bases), G/C content (around 50%), similar
melting temperatures, low self-primer and hetero-primer formation, amplicon length
(between 60 and 90 base pairs). The specific genes studied and the corresponding
oligonucleotide sequences are described in Table 3 (Siracusano et al., 2005). The specific
probes were then used for PCR product detection using two alternative approaches (see
3.1.3).
23
Materials and Methods
For all the tested genes optimal annealing was defined as the temperature (T°a) 5°C below
the lower of the PCR primer melting temperatures; optimal hybridization was defined as
the temperature (T°hybr) 12-15°C below the melting temperature of the probe.
Optimal conditions of amplification were determined experimentally for each mRNA
target sequence by reverse transcribing and amplifying equivalent amounts of RNA over
various cycles of the PCR and by reverse transcribing and amplifying dilutions of RNA
over the same number of PCR cycles (Stanta et al., 1998c).
Table 3 describes the optimal conditions in terms of starting amount of RNA and number
of cycles for every tested gene.
Table 3: primer/probe sequences, length of the amplicons and optimal PCR and hybridization conditions .
Total RNA was reverse transcribed in a final volume of 10μl using AMV-RT associated
with the reverse specific primer.
RT solution contained 1x AMV-RT buffer, 1mM dNTPs, 15pmol of specific reverse
primer, 2 units AMV-RT, 4 units Rnase inhibitor and total RNA to a final volume of 10 μl.
The reaction took place at 42°C for 60’.
The whole reverse transcription product was used as a template for the PCR reaction.
Amplification was performed in a final volume of 50μl by adding 5μl of the 10x PCR
buffer (500 mM KCl, 100 mM Tris pH 8.3, without MgCl2), 15pmol specific forward
primer and 2.5units Taq Polymerase. The solution was denatured for 3’ at 94°C, subjected
to 5 cycles of 1’ at 94°C, 1’ at the specific annealing temperature of the primer pair and 1’
at 72°C followed by a variable number of cycles of 30” at 94°C, 30” at the specific
annealing temperature of the primer pair and 30” at 72°C.
PCR AND HYBRIDIZATION CONDITIONS
GENE OLIGO SEQUENCES PCR ng RNA Length T°a T°i cycles for RT
Sense: CCAAGGTCATCCATGACA GAPDH 90bp 50°C 40 50°C Antisense: CATCCACAGTCTTCTGGGT 50ng
Probe:ACTGTGGTCATGAGTCCTTCCACGA Sense:CAAGGCTGGGAGGAACAT
hTRT 90bp 55°C 45 50°C Antisense: AGGCTGTTCACCTGCAAAT 150ng Probe: CTGTGACACTTCAGCCGCAAGACC Sense: GGCGTCATCATGAATGAA
CK20 Antisense:CAGAACTGCAGTCTGTCTCT 100bp 52°C 45 46°C 500ng Probe:AAGGTTCTTCTGGGCCATGACTTCA Sense: CGGCAAGGCCACAATGAA
300ng CD4 Antisense: TTTCCCTGAGTGGCTGCT 90bp 55°C 45 50°C Probe: GCAGCACCAGAAGCAAGTGCCTA
24
Materials and Methods
3.1.3 PCR product detection: for PCR product detection two different methods were
compared: dot-blot hybridization with a radiolabelled probe and a colorimetric approach
with a phosphorilated probe, that could reduce the risks connected with the use of
radioactive material.
- According to the first protocol, 20μl of each amplification product were first mixed with
30μl of 20x SSC denaturing solution and then spotted on a positively-charged
nitrocellulose membrane. Membrane was air-dried and crosslinked. Probes (see Table 3)
were radiolabelled with γ32P-ATP using T4 polynucleotide kinase, while membrane was
pre-hybridized at T°hybr in a 6x SSC solution containing 0.5% milk-powder. Hybridization
was performed by adding the probe solution and incubating the membrane overnight.
Washings were performed in progressively stringent conditions using SSC and 0.1% SDS.
Membranes were kept in contact overnight with a radiosensible plate and the radioactive
signal was detected by the Cyclone instrument. The expression levels were quantified as
counts per minute (cpm) by the software.
- The second quantification approach, an ELISA-like method called ELOSA (Enzyme-
Linked Oligosorbent Assay), was performed using commercial 96-well NucleoLink Strips
from Nunc as a support. The protocol used was an adaptation of the suggested DIAPOPS
procedure (Detection of Immobilized Amplified Products in a One Phase System) as
amplification was performed in solution and following hybridazion was carried out using
the immobilized probe.
Plates were first prepared according to the manufacturer’s instruction. Briefly, for each
gene forward primers and probes described in Table 3 were ordered with some
modifications: the forward primer was 5’-biotinilated and the probe was 5’-phosphorilated
(see Table 4). PCR reaction of the target genes was run as above-mentioned (3.1.2). Probes
were covalently linked to the well surface by a carbodiimide mediated condensation by an
incubation at 50°C for 5 hours.
25

Materials and Methods
GENE PRIMER SEQUENCES
Sense: b*-CCAAGGTCATCCATGACA GAPDH Antisense: CATCCACAGTCTTCTGGGT Probe:P^-ACTGTGGTCATGAGTCCTTCCACGA
Sense:b-CAAGGCTGGGAGGAACAT hTRT Antisense: AGGCTGTTCACCTGCAAAT Probe:P- CTGTGACACTTCAGCCGCAAGACC Sense: b-GGCGTCATCATGAATGAA
CK20 Antisense:CAGAACTGCAGTCTGTCTCT Probe:P-AAGGTTCTTCTGGGCCATGACTTCA Sense: b-CGGCAAGGCCACAATGAA
CD4 Antisense: TTTCCCTGAGTGGCTGCT Probe: P-GCAGCACCAGAAGCAAGTGCCTA
Table 4: optimal hybridization conditions in the ELOSA approach. *b, biotinilated; ^P, phosphorilated.
After blocking of non specific sites, amplification products were denatured and incubated
with the specific probe at 50°C for 2 hours. A streptavidin-alkaline phosphatase complex
and the PNPP substrate (p-Nitrophenyl Phosphate, Disodium Salt) were then added. After
incubation for 30’ the colorimetric reaction was detected by an ELISA reader. The
expression level values were read at 405nm and were expressed as optical density (OD)
values.
Optimized quantity of probe and amplicon were defined for each target sequence
combining different quantities of probe (50, 100, 250, 500, 750ng per well) and PCR
product (5-10μl per well) using 3 urine samples that showed variable expression levels of
the considered genes.
The dynamic range of the detection reaction was tested using progressive dilutions of a
previously amplified PCR product corresponding to each target sequence. Briefly, a PCR
product corresponding to each tested gene was run on an agarose gel, the bands of interest
were excised and an electroeluition was performed to purify the products. After
spectrophotometric quantification, the purified PCR products, expressed as fmoles, were
diluted to test the linearity conditions of each of the four systems.
In order to compare this colorimetric quantification method with the radiolabelled probe-
based detection, a parallel quantification with both methods was performed using a panel
of 20 urine samples (showing variable expression levels for the target genes) and
expression values, expressed in cpm and OD, were compared.
26

Materials and Methods
4. MOLECULAR METHODS FOR GENE EXPRESSION ANALYSIS IN
ARCHIVAL TISSUES
In the second part we we performed a gene expression analysis in two indipendent
formalin-fixed and paraffin-embedded case studies.
4.1 Technical optimization
In this part of the study limits and potential of several technical approaches for gene
expression analysis were explored to optimize their application in human archival tissues.
Depending on the optimization protocol, either archival tissue specimens or cell line-based
model system were used (in the latter case some slight modifications were applied to the
protocols to adapt them to the cell line system).
3 differently expressed housekeping genes were chosen to perform this comparative
analysis: ACTB (high expression) ATP5B (intermediate expression) and HPRT (low
expression).
Primer sequences resulted from a Custom Gene Expression Assays previously used in
combination with TaqMan chemistry (see Table 5).
Gene Primer sequences Length
Sense:CGGCCCCTCCATCGT ACTB 66bp Antisense: AAAGGGTGTAACGCAACTAAGTCAT Sense: AAGGCAGGGAGACCAGACT ATP5B 89bp Antisense:GCCTTCTGTACCATCCATAGCAATA Sense: GTGTCATTAGTGAAACTGGAAAAGCA HPRT 91bp Antisense:CGATGTCAATAGGACTCCAGATGTT
Table 5: Primer sequences used in optimization experiments
4.1.1 Starting procedures
The following list describes the standard procedures that were used as reference protocols
for the technical comparison with other protocols dedicated to gene expression analysis.
They were defined on the basis of the procedures that we commonly use in our laboratory,
combined with the experience reported in the literature. These protocols were tested both
on cell lines (A375) and FFPE sections. When cell line was used, protocols were slightly
adapted.
4.1.1.1 Fixation: fixation is a critical step for tissue preservation. Formalin is the most
used fixative as, although toxic, it is able to preserve many tissutal components. This
fixative was used as the reference solvent. Tissue fixation was performed in 4-10%
buffered formalin immediately after removal. Fixation time depended on the tissue
dimensions but usually takes a maximum of 24 hours. The volume of formalin was almost
27

Materials and Methods
20 times the volume of the tissue (Melis, M., “Compendio di tecnica istopatologica”,
Lombardo Editore, 1975).
4.1.1.2 RNA extraction: a proteinase K-based protocol to extract RNA from 6-8μm
human tissue histological sections was used (Stanta et al., 1998b). Proteinase K action is
essential to free the RNA that is trapped in the protein matrix produced by formalin.
For every paraffin embedded block ten 6-8μm-thick histologic sections were
deparaffinized with xylene and rehydrated with ethanol. When the peritumoral component
was necessary, a manual microdissection was performed by sectioning the paraffin block
and collecting the two components in two separate tubes.
Samples were then digested in 150-400μl of proteinaseK 6mg/ml diluted in RNA digestion
buffer (1.12 M Guanidine thiocyanate, 20 mM Tris HCl pH 7.5, 0.5% N-Lauroyl
Sarcosine, 40 mM β-mercaptoethanol) at 45°C overnight. Total RNA was isolated by acid
phenol/chloroform extraction followed by ethanol precipitation. Total RNA was
resuspended in the appropriate volume of DEPC H20 (between 15 and 30μl, depending on
the amount of starting tissue). Purified RNA was stored at -80°C.
4.1.1.3 RNA quantification: spectrophotometer reading is the most common
quantification approach of total RNA. 1-2μl of each sample were diluted in 500μl H2O and
absorbances at 260, 230 and 280nm were acquired using the Amersham GeneQuant
instrument. The formula derived from the Beer-Lambert law was used to determine total
RNA concentration at 260nm, while the 260nm/230nm and 260nm/280nm ratios were used
to evaluate the level of contamination (by co-purified organic compounds, phenol,
proteins…) of the RNA solution.
4.1.1.4 RNA integrity assessment: the evaluation of the degradation levels of RNA is
important as they can affect the outcome of the subsequent gene expression analysis. The
denaturing 1% agarose gel electrophoresis (followed by ethidium bromide staining) is the
most commonly used procedure to assess RNA integrity. 5μg of each RNA were loaded on
the gel.
After the run, the gel was checked under the UV light and the clear presence of two main
bands, corresponding to 28S and 18S rRNA, was considered an index of intact RNA; the
presence of a smear or the absence of these bands was defined as an index of RNA
degradation.
4.1.1.5 DNase treatment: this treatment is essential to completely remove the
contaminating genomic DNA from the RNA solution prior RT-PCR amplification. It
results even more important if the target mRNA presents pseudogenes at DNA level or
28

Materials and Methods
primers set are not intron-spanning. For each formalin-fixed and paraffin embedded sample
4μg of total RNA were digested in 1x DNaseI Buffer and 10 units of DNaseI. Reaction
was incubated for 15’ at 25°C.
Enzyme inactivation was performed by heating the RNA solution for 10’ at 65°C with the
addition of 2μl of 25mM EDTA. Concentration of the new RNA solution was determined
taking into account the spectrophotometric reading before treatment and the new final
volume of reaction.
4.1.1.6 Reverse transcription: this step is one of the major sources of variability in gene
expression analysis. As “reference” procedure for cDNA synthesis a MMLV-based
reaction was used (Godfrey et al., 2000). Briefly, 800ng of total digested RNA were
reverse transcribed in a final volume of 20μl using 250units MMLV reverse transcriptase
in the manufacturer’s buffer (Invitrogen) containing 40units RNase inhibitor, 250ng
random hexamers, 4.5mM MgCl2, 1mM dNTPs and 10mM DTT. The reaction was carried
out at 37°C for 60’, followed by 70°C for 15’ and 4°C for 5’.
4.1.1.7 Quantitative realtime PCR: the realtime-based approach was chosen for gene
expression analysis because it allows a more sensitive detection of PCR products, is more
reproducible and offers a higher dynamic range od detection. Real-time quantitative RT-
PCR analyses for ACTB, ATP5B and HPRT were performed in the MasterCycler ep
RealPlex (Eppendorf) using the SybrGreen approach.
In order to optimize the performance of each assay (in terms of efficiency of amplification,
sensitivity, primer-dimer formation, nonspecific sequence production), T° annealing, T°
denaturation, primer concentration and fluorescence reading temperature were adjusted
(see Table 6), using a standard curve for each tested sequence. To this purpose, intact
cDNA from A375 cell line was amplified and cloned into the TopoVector using the TA
cloning Kit (Invitrogen). Efficiency and linear range of amplification were checked setting
up a serial dilutions of this standard DNA, ranging from 106-107 to 102-10
molecules/reaction: each dilution was PCR amplified and the recorded Ct values plotted
against the log of the dilution. A linear regression line was fitted through the points and
efficiency was defined as 10^(-1/slope) (Rasmussen, R.P. 2001. Quantification on the
LightCycler, p.31-34.In "Rapid Cycle Real-time PCR, Methods and Applications.Springer
Press, Heilderberg. ) (Table 6)
Optimal conditions of amplifications were then used for construction of standard curves
with 5-fold fixed serial dilutions of the sample cDNA (40ng-64pg cDNA).
29

Materials and Methods
For simplicity we supposed that reverse transcription yield was 100% and ng of cDNA
corresponded to ng of input RNA. All reactions were run in duplicate.
Table 6: optimal realtime PCR conditions for SybrGreen chemistry approach determined by standard curve run using a cloned sequence. No MgCl2 optimization was necessary because the PCR buffer is specially formμlated to auto-adjust it. Optimal T°a, primer concentration and reading temperatures were defined by melting curve analysis.
Standard curves were analysed according to the general guidelines proposed by Nolan et
al. (Nolan et al., 2006). As a reproducibility limit of the replicates an SD <0.5 was
considered as acceptable and the limits of the dynamic range of the amplification were
considered in order to define the range of dilution values in which the standard curve was
linear. The threshold cycle (Ct) was then determined with the support of the “Noiseband”
software (provided by Eppendorf). This algorithm was used for automatic determination of
the threshold (here threshold is 10 times the standard deviation above the noise of the
baseline); the optimum baseline (“noise” from the background fluorescent signal) was
defined manually for each sample. The baseline fluorescence and the threshold were
automatically associated to a Ct (threshold cycle) value (see the example of a standard
curve reported in Fig.1). The Ct value of the first or second dilution of the sample was then
used for the following comparative gene expression analysis since these values where
always within the linear range of the standard curve. It was considered reliable only when
efficiencies between samples and genes were similar; a maximum of 10% of mismatch was
tolerated.
REALTIME CONDITIONS GENE
T°a T° den. Primer conc.
Reading T°
R2 efficiency Dynamic range
ACTB 60°C 95°C 300nM 77°C 107-102 0,998 99%
ATP5B 60°C 93°C 300nM 80°C 107-102 0,995 98%
HPRT 62°C 96°C 300nM 74°C 108-103 0,995 98%
30

Materials and Methods
Threshold
Baseline Efficiency Coefficient of
determination Fig. 1: example of a standard curve obtained from a 10-fold dilutions of cloned ATP5B sequence. Analysis performed by MasterCycler ep RealPlex Software. (SybrGreen chemistry).
PCR was performed in the RealMasterMix SYBR ROX buffer (5 PRIME) using cDNA
template/plasmid standard DNA, 1x SybrGreen (5 PRIME) and forward and reverse
primers at the defined optimal concentration in a 25-50μl-final reaction mixture. The
solution was then splitted in the required number of replicates. Samples were denatured at
95°C for 1’30”, and the following general program was used: 45 cycles of denaturation at
the defined denaturation temperature for 30”, annealing at the optimal temperature for 30”,
extension at 72°C for 30” and reading for 30”; additional extension at 72°C for 10’; default
melting curve program (95°C for 15”, 60°C for 15”, linear temperature transition to 95°C
at 0.1°C/second, 95°C for 15”).
4.1.2 Compared procedures
In this part the “reference” protocols described in 4.1.1 are compared with other
procedures that often are reported in literature as methods for gene expression analysis in
archival material.
4.1.2.1 Fixation: a A375 cell line-based homogeneous
model was used to compare over time the effects of
formalin against two other fixatives on RNA quality and
quantity. The protocol was slightly modified to be applied
to this cell line-based model.
The following alcoholic fixatives were used: neutral
buffered formaldehyde 10% (NBF), a home-made methacarnoy (60% methanol, 30%
chloroform and 10% glacial acetic acid) and FineFix, a new commercial alcohol-based
fixative (Milestone).
FIXATION
RNA EXTRACTION
RNA QUANTIFICATION
RNA INTEGRITY ASSESSMENT
DNase TREATMENT
REVERSE TRANSCRIPTION
QUANTITATIVE REALTIME PCR
31

Materials and Methods
5 fixation times were considered for each fixative, and a mean of 2.5-3x10⁶ cells were
intended for each time. After count, two aliquots were isolated for direct extraction of
RNA (to be used as a positive control), the others aliquots, containing the same number of
cells were pelleted and resuspended in the fixative; the fixation process was carried out for
1, 3, 6, 12 and 24 hours at room temperature in a rotor. At each determined time, fixed
cells were pelleted and washed with PBS.
Total RNA from non fixed cells (about 2.5-3x10⁶ cells) was isolated using 500μl Trizol
reagent according to the manifacturer’s instructions, and resuspended in 30 μl DEPC H 0. 2
RNA from fixed cells was extracted using the proteinaseK-based protocol for archival
tissues, with some modifications (see 4.1.1.2 for the original protocol). Briefly, cell pellets
were well resuspended in 400-500μl of proteinaseK 6mg/ml diluted in RNA digestion
buffer at 45°C for 3 hours. RNA was isolated by acid phenol/chloroform extraction
followed by ethanol precipitation. Total RNA was resuspended in 19μl DEPC H20, and
purified RNA was stored at -80°C. RNA quantification was performed by conventional
spectrophotometer (4.1.1.3) and integrity was determined by denaturing gel
electrophoresis. (4.1.1.4).
2μg of total RNA were treated with DNaseI followed by heat-inactivation (4.1.1.5) and
800ng of RNA were reverse transcribed using the MMLV-based protocol described in
4.1.1.6. Expression levels of ACTB and ATP5B were quantitatively analysed by means of
a SybrGreen-based realtime PCR. A standard curve was run for each fixed and not treated
sample using five 1:5 dilutions starting from 40ng cDNA and Ct values were defined
(4.1.1.7). For each fixative and time of fixation, the Ct values (second dilution) of ACTB
and ATP5B were directly compared. The Ct values of the not-treated cells were used as the
“golden standard” condition.
4.1.2.2 RNA extraction: the various protocols associated to this procedure have not been
investigated yet, but the effects of the time and the temperature of digestion on RNA
recovery will be soon considered, as defined in the last recent European meeting..
4.1.2.3 RNA quantification: the cell line system used for
the fixation assessment was then used also for comparing
different approaches for total RNA quantification.
After cell fixation and nucleic acid extraction by proteinase
K-based method (see 4.1.2.1), conventional RNA
spectrophotometric quantification was compared against
two more recent alternative approaches. The first one was the use of Nanodrop, a new
FIXATION
RNA EXTRACTION
RNA QUANTIFICATION
RNA INTEGRITY ASSESSMENT
DNase TREATMENT
REVERSE TRANSCRIPTION
QUANTITATIVE REALTIME PCR
32
Materials and Methods
sensitive spectrophotometric approach (ND-1000, NanoDrop Technologies, USA), in
which 1μl of each sample is sufficient to yield a reading value at 260, 230 and 280nm.
The second one was the use of Agilent Bioanalyzer (Agilent Technologies). This
instrument employs a fluorescent intercalanting agent to detect RNA concentration. In this
experiment the Agilent RNA 6000 Nano Kit was used and 1μl of each sample was
employed. Samples and chips were prepared following the manufacturer’s protocol. The
coefficient of determination (R2) was obtained comparing the concentration values,
expressed as ng/μl, obtained with these three methods.
4.1.2.4 RNA integrity assessment: The cell line
system (A375) used for fixation assessment was then
used also for comparing different approaches total RNA
degradation levels assessment. After cell fixation and
extraction by proteinase K-based method (see 4.1.2.1),
total RNA was quantified using spectrophotometric
reading. The conventional denaturing gel electrophoresis analysis was then compared with
two alternative methods.
FIXATION
RNA EXTRACTION
RNA QUANTIFICATION
RNA INTEGRITY ASSESSMENT
DNase TREATMENT
REVERSE TRANSCRIPTION
QUANTITATIVE REALTIME PCR
- The first approach was the Agilent Bioanalyzer combined with the reagents in the RNA
6000 Nano LabChip kit. With this microfluidic capillary electrophoresis system three types
of data analysis were used: the simple electropherogram analysis, the“Ratio method” (we
defined a 28S/18S ribosomal ratio from 0,7 to 2,5 as an index of good quality RNA) and
the “RNA Integrity Number (RIN) method” (Schroeder et al., 2006) [we considered values
equal or greater to 6 to represent good RNA (Strand et al., 2007)]. Smear analysis was also
performed in order to evaluate the percentage of fragments present in each interval of
length. 10 intervals were used: 50-100, 50-100, 100-150,150-200, 200-300, 300-500, 500-
1000, 1000-2000, 2000-3000, 3000-4000, 4000-5000 bases.
- The second approach used an RT-PCR amplification of fragments of increasing length.
This RT-PCR assay involved the amplification of ACTB mRNA using primers designed to
amplify 5-6 fragments of progressive length (reverse primer was kept fixed whenever
possible); the range of fragments was between 77 and 651 bases (Table 7). After DNaseI
digestion followed by heat inactivation (4.1.1.5). 800ng total RNA were reverse
transcribed in a final volume of 20μl using MMLV-based protocol (4.1.1.6). PCR reaction
was carried out using 2μl of each cDNA in a final volume of 25μl containing 2.5μl of the
10x PCR buffer (500mM KCl, 100 mM Tris pH 8.3, 150mM MgCl ), 15pmol specific 2
33

Materials and Methods
forward and reverse primer and 2.5units Taq Polymerase. Primer design followed the rules
described in 3.1.2.
For all the designed amplicons, a common amplification protocol was used: denaturation
for 3’ at 94°C, 1’ at 94°C, 1’ at the specific annealing temperature and 1’ at 72°C for 5
cycles, 30” at 94°C, 30” at the specific annealing temperature and 30” at 72°C for the
optimal number of cycles and 5’ at 72°C as a final extension. Primer sequences and
optimal amplification conditions were used as previously reported (Stanta et al., 2006).
RNA integrity was then assessed checking the amplicon bands in a 8% acrylamide gel
stained with ethidium bromide.
Gene Primer sequence Length T°a Cycles
Sense: ATCACTGCCCTGGCACCCA ACTB 77bp 60
30 Antisense: CCGATCCACACGGAGTACTTG Sense:CTGGACTTCGAGCAAGAGAT ACTB 177bp 58 40 Antisense: GAAGGTAGTTTCGTGCATCG Sense:CGGGACCTGACTGACTACCT ACTB 291bp 57 45 Antisense: the same primer used for beta actin 170bp Sense:GTTGCTATCCAGGCTGTGCT ACTB 438bp 57 45 Antisense: the same primer used for beta actin 170bp
Sense:GGCATCCTCACCCTGAAGTA ACTB 651bp 58 45 Antisense: the same primer used for beta actin 170bp
Table 7: primer sequences and optimal amplification conditions of beta actin fragments of progressive length
In order to compare the reliability of these methods in the prediction of real mRNA
accessibility to the subsequent gene expression analysis, total RNA from each fixed and
not fixed sample was reverse trascribed using again the MMLV-based protocol described
in 4.1.1.6. The gene expression analysis on ATP5B and HPRT was then performed using
the SybrGreen-based protocol, as already described (4.1.1.7). Briefly, a standard curve
(40ng-64pg cDNA) for each fixed and not treated sample was run and Ct values were
directly compared.
4.1.2.5 DNase treatment: Optimization of this protocol
was performed using six different paraffin embedded
sections from breast cancer samples.
After proteinaseK-based RNA extraction (4.1.1.2) and
spectrophotometric quantification (4.1.1.3), the DNase
digestion followed by heat inactivation (4.1.1.5) was
compared with the digestion followed by phenol/chloroform extraction.
FIXATION
RNA EXTRACTION
RNA QUANTIFICATION
RNA INTEGRITY ASSESSMENT
DNase TREATMENT
REVERSE TRANSCRIPTION
QUANTITATIVE REALTIME PCR
According to this protocol, 2μg total RNA were resuspended in 1x DNAseI Buffer, 80
units of RNase inhibitor (Ambion), 10 units of DNaseI (Amersham). Reaction was left to
proceed at 37°C for 20 minutes. To purify RNA from DNaseI an extraction with phenol-
34

Materials and Methods
H20/chloroform was carried out. RNA was then precipitated with isopropanol using 5ul
glycogen 1mg/ml as precipitation carrier. Spectrophotometric quantification of total RNA
was performed again and purified RNA was stored at -80°C.
800ng of treated RNA with these alternative methods were then reverse transcribed using
the MMLV-based protocol (4.1.1.6) and the transcriptional levels of ACTB mRNA were
assessed by means of the SybrGreen-based protocol, as already described (4.1.1.7).
Briefly, a standard curve (40ng-64pg cDNA) for all the six samples was run in parallel
after treatment with these two approaches and sensitivity, efficiency and coefficient of
determination were calculated.
4.1.2.6 Reverse transcription: Analysis of this protocol
was performed using a pool of RNA extracted from colon
cancer formalin-fixed paraffin embedded sections. After
RNA extraction (4.1.1.2) and DNase digestion (4.1.1.5)
total RNA was submitted to different cDNA synthesis
protocols, using the procedure described in 4.1.1.6 as a
template.
FIXATION
RNA EXTRACTION
RNA QUANTIFICATION
RNA INTEGRITY ASSESSMENT
DNase TREATMENT
REVERSE TRANSCRIPTION
QUANTITATIVE REALTIME PCR
The comparative protocols used different combinations of reverse transcriptase enzymes
(MMLV or AMV) and priming strategy (random hexamers, random 15-mers and a mix of
specific primers) (Table 8). Each RT was run in triplicate. Both random 6-mers and
random 15-mers were used in two equimolar combinatios: the first one was
0.167nmol/reaction, and corresponded to what is normally used in literature and in our
laboratory (Specht et al., 2002). The second one was 3.35nmol/reaction, and corresponded
to what was recently found in a report (Stangegaard et al., 2006). The cDNA synthesis
performed using AMV and a “mix” of reverse primers consisted of a mixture of all the
specific reverse primers in the same RT solution (“multiplex” reverse transcription).
12pmol/reaction of each primer were used because they were consistent with the quantity
of the forward primer used in the following PCR reaction. Exceptionally for this
experiment a gene expression analysis of TS (69bp), TP (69bp) and DPD (69bp) was
performed, in addition to the already used ACTB (66pb). Optimization of reaction
conditions for each gene were previously determined (data not shown).
35

Materials and Methods
PRIMING STRATEGY ENZYME 6-mers 15-mers Mix reverse
primers (nmol/reaction) (nmol/reaction) (pmol/reaction)
MMLV (250units)
_ 3.35nmol 3.35nmol
0.167nmol 0.167nmol AMV 12pmol of each
reverse primer (4units) 3.35nmol 3.35nmol
Table 8: schematic representation of the reverse transcription setting using different combinations of 2 reverse transcriptases associated with different priming strategies.
Each reverse transcription was performed in 20μl using 800ng digested RNA. For MMLV-
based protocols the conditions described in 4.1.1.6 were followed. For AMV-based
protocol, the RT solution contained 1x AMV-RT buffer, 1mM dNTPs, 12pmol of each
specific reverse primer or 3.35nmol of random primers per reaction, 4 units AMV-RT, 8
units RNase inhibitor and total RNA to a final volume of 20 μl. The reaction took place at
42°C for 60’.
The reactions containing MMLV and both random primers were carried out at 37°C for
60’, followed by 70°C for 15’ and 4°C for 5’; the reactions containing AMV were carried
out at 42°C for 60’.
Gene expression analysis of ACTB, TS, TP and DPD was performed using the SybrGreen-
based reatime PCR (4.1.1.7).
Briefly, for every condition tested, sensitivity was evaluated as the mean Ct of the triplicate
and reproducibility as its standard deviation. The most sensitive and reproducible
approaches were used for standard curve construction in order to evaluate the efficiency
and the linear range of RT-PCR.
4.1.2.7 Quantitative realtime PCR (qRT-PCR): we
evaluated which was the most reliable approach for
quantitative gene expression analysis of ATP5B and
HPRT comparing the SybrGreen method described
4.1.1.7 to the TaqMan probe chemistry.
For the comparison between the two procedures, the
previously described primers were used (Table 5) but for the TaqMan approach further
internal MGB probes were ordered. For ATP5B: 5’-(6-FAM) CTCTCACCCAAATGCT-
MGB 3’; for HPRT: 5’-(6-FAM) CAAACTCAACTTGAACTCTC-MGB 3’).
FIXATION
RNA EXTRACTION
RNA QUANTIFICATION
RNA INTEGRITY ASSESSMENT
DNase TREATMENT
REVERSE TRANSCRIPTION
QUANTITATIVE REALTIME PCR
The optimal conditions of amplification (T°annealing and MgCl2 concentration) were
preliminarly determined on a purified cloned sequence containing the target of interest.
36
Materials and Methods
Ten-fold serial dilutions of 107-108 copies of cloned ATP5B and HPRT were amplified and
the recorded Ct values were plotted against the log of the dilution. A linear regression line
was fitted through the points and coefficients of dermination (R2) and efficiencies were
calculated, as it was performed for SybrGreen chemistry (4.1.1.7) (Table 9).
Table 9: optimal realtime PCR conditions for TaqMan chemistry approach determined by standard curve run using a cloned sequence. Both methods were then used for testing the expression levels of ATP5B and HPRT genes
in a panel of six adrenal gland tumors paraffin-embedded samples that were previously
reverse transcribed using the MMLV-based protocol (4.1.1.6).
A standard curve (40ng-64pg cDNA) for all the six samples was run in parallel using both
the SybrGreen and TaqMan probe approaches and a mean value of sensitivity (intended as
the mean values of the six first dilution Ct values), efficiency and coefficient of
determination were calculated.
According to the TaqMan-based protocol, PCR was performed in the ReadyMix Taq
(Sigma) in a 25-50 μl-final reaction mixture volume containing cDNA template/plasmid
standard DNA, reference dye (ROX), adjusted MgCl2 and the Custom TaqMan Gene
Expression Assay (Applied Biosystems); this latter contains an optimized mix of forward
and reverse primer and a MGB probe labelled with FAM dye.
Samples were denatured at 95°C for 10’, and the following recommended two-step
program was used: 45 cycles of denaturation at 95°C for 1’ and annealing/extension at
60°C for 15”.
4.2 Application of molecular methods to gene expression analysis in two archival case
studies
In this second part of the study molecular methods for gene expression analysis were tested
to detect quantify candidate biomarkers in two clinical case studies.
The breast cancer case study was collected in order to define if the expression levels of
some selected genes could have a prognostic role in recurrence (see 1.2 for clinical
information).
REALTIME CONDITIONS
GENE T°a [MgCl2]
R2Dynamic
range
Efficiency
ATP5B 60°C 1.5mM 107-102 0,999 97%
HPRT 60°C 3mM 108-103 0,998 95%
37
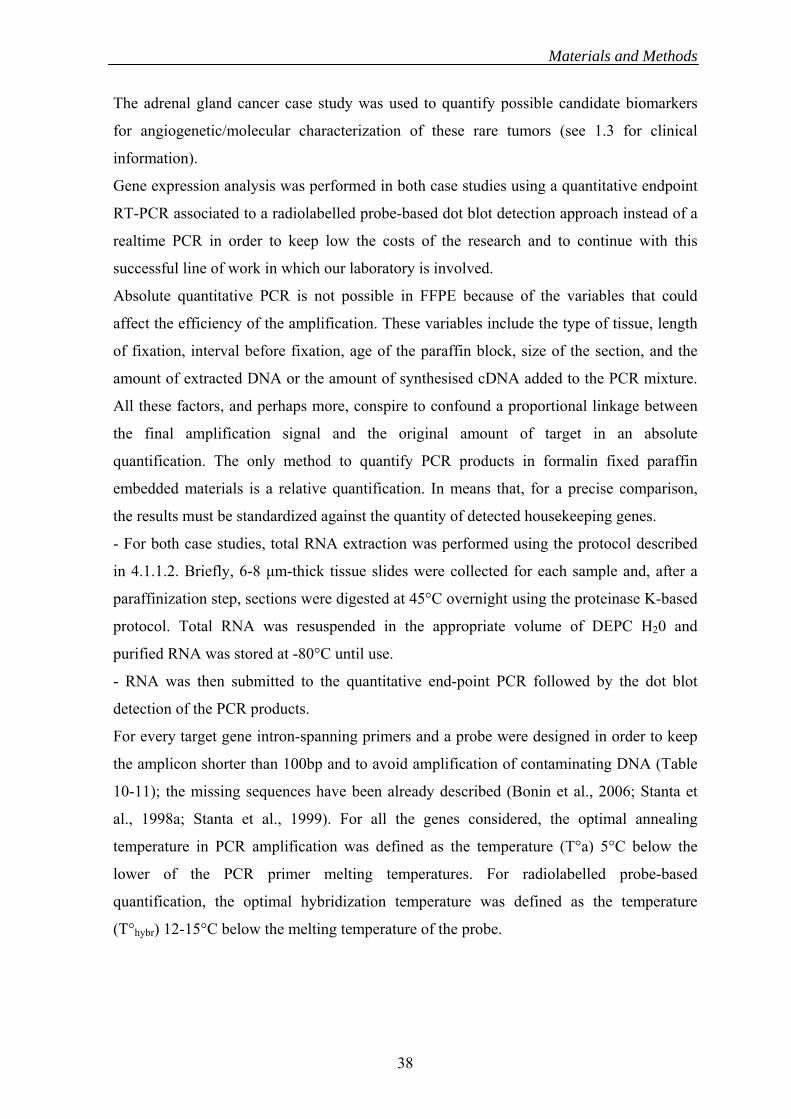
Materials and Methods
The adrenal gland cancer case study was used to quantify possible candidate biomarkers
for angiogenetic/molecular characterization of these rare tumors (see 1.3 for clinical
information).
Gene expression analysis was performed in both case studies using a quantitative endpoint
RT-PCR associated to a radiolabelled probe-based dot blot detection approach instead of a
realtime PCR in order to keep low the costs of the research and to continue with this
successful line of work in which our laboratory is involved.
Absolute quantitative PCR is not possible in FFPE because of the variables that could
affect the efficiency of the amplification. These variables include the type of tissue, length
of fixation, interval before fixation, age of the paraffin block, size of the section, and the
amount of extracted DNA or the amount of synthesised cDNA added to the PCR mixture.
All these factors, and perhaps more, conspire to confound a proportional linkage between
the final amplification signal and the original amount of target in an absolute
quantification. The only method to quantify PCR products in formalin fixed paraffin
embedded materials is a relative quantification. In means that, for a precise comparison,
the results must be standardized against the quantity of detected housekeeping genes.
- For both case studies, total RNA extraction was performed using the protocol described
in 4.1.1.2. Briefly, 6-8 μm-thick tissue slides were collected for each sample and, after a
paraffinization step, sections were digested at 45°C overnight using the proteinase K-based
protocol. Total RNA was resuspended in the appropriate volume of DEPC H20 and
purified RNA was stored at -80°C until use.
- RNA was then submitted to the quantitative end-point PCR followed by the dot blot
detection of the PCR products.
For every target gene intron-spanning primers and a probe were designed in order to keep
the amplicon shorter than 100bp and to avoid amplification of contaminating DNA (Table
10-11); the missing sequences have been already described (Bonin et al., 2006; Stanta et
al., 1998a; Stanta et al., 1999). For all the genes considered, the optimal annealing
temperature in PCR amplification was defined as the temperature (T°a) 5°C below the
lower of the PCR primer melting temperatures. For radiolabelled probe-based
quantification, the optimal hybridization temperature was defined as the temperature
(T°hybr) 12-15°C below the melting temperature of the probe.
38
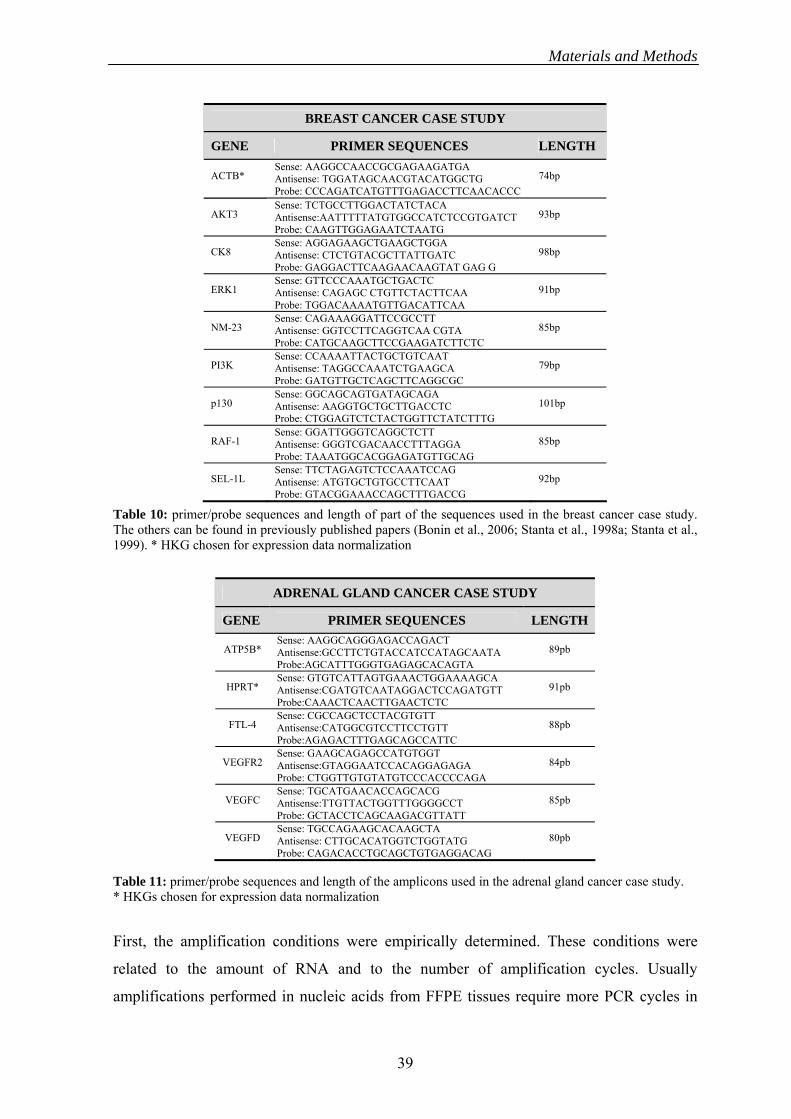
Materials and Methods
BREAST CANCER CASE STUDY
GENE PRIMER SEQUENCES LENGTH Sense: AAGGCCAACCGCGAGAAGATGA
ACTB* 74bp Antisense: TGGATAGCAACGTACATGGCTG Probe: CCCAGATCATGTTTGAGACCTTCAACACCC Sense: TCTGCCTTGGACTATCTACA AKT3 93bp Antisense:AATTTTTATGTGGCCATCTCCGTGATCT Probe: CAAGTTGGAGAATCTAATG
Sense: AGGAGAAGCTGAAGCTGGA CK8 98bp Antisense: CTCTGTACGCTTATTGATC
Probe: GAGGACTTCAAGAACAAGTAT GAG G Sense: GTTCCCAAATGCTGACTC ERK1 91bp Antisense: CAGAGC CTGTTCTACTTCAA Probe: TGGACAAAATGTTGACATTCAA
Sense: CAGAAAGGATTCCGCCTT NM-23 85bp Antisense: GGTCCTTCAGGTCAA CGTA
Probe: CATGCAAGCTTCCGAAGATCTTCTC Sense: CCAAAATTACTGCTGTCAAT PI3K 79bp Antisense: TAGGCCAAATCTGAAGCA
Probe: GATGTTGCTCAGCTTCAGGCGC Sense: GGCAGCAGTGATAGCAGA
p130 101bp Antisense: AAGGTGCTGCTTGACCTC Probe: CTGGAGTCTCTACTGGTTCTATCTTTG Sense: GGATTGGGTCAGGCTCTT RAF-1 85bp Antisense: GGGTCGACAACCTTTAGGA
Probe: TAAATGGCACGGAGATGTTGCAG Sense: TTCTAGAGTCTCCAAATCCAG
SEL-1L 92bp Antisense: ATGTGCTGTGCCTTCAAT Probe: GTACGGAAACCAGCTTTGACCG
Table 10: primer/probe sequences and length of part of the sequences used in the breast cancer case study. The others can be found in previously published papers (Bonin et al., 2006; Stanta et al., 1998a; Stanta et al., 1999). * HKG chosen for expression data normalization ADRENAL GLAND CANCER CASE STUDY
GENE PRIMER SEQUENCES LENGTH Sense: AAGGCAGGGAGACCAGACT
ATP5B* 89pb Antisense:GCCTTCTGTACCATCCATAGCAATA Probe:AGCATTTGGGTGAGAGCACAGTA Sense: GTGTCATTAGTGAAACTGGAAAAGCA HPRT* 91pb Antisense:CGATGTCAATAGGACTCCAGATGTT Probe:CAAACTCAACTTGAACTCTC
Sense: CGCCAGCTCCTACGTGTT FTL-4 88pb Antisense:CATGGCGTCCTTCCTGTT
Probe:AGAGACTTTGAGCAGCCATTC Sense: GAAGCAGAGCCATGTGGT VEGFR2 84pb Antisense:GTAGGAATCCACAGGAGAGA
Probe: CTGGTTGTGTATGTCCCACCCCAGA Sense: TGCATGAACACCAGCACG
VEGFC 85pb Antisense:TTGTTACTGGTTTGGGGCCT Probe: GCTACCTCAGCAAGACGTTATT Sense: TGCCAGAAGCACAAGCTA VEGFD 80pb Antisense: CTTGCACATGGTCTGGTATG
Probe: CAGACACCTGCAGCTGTGAGGACAG Table 11: primer/probe sequences and length of the amplicons used in the adrenal gland cancer case study. * HKGs chosen for expression data normalization
First, the amplification conditions were empirically determined. These conditions were
related to the amount of RNA and to the number of amplification cycles. Usually
amplifications performed in nucleic acids from FFPE tissues require more PCR cycles in
39

Materials and Methods
comparison with fresh tissues because of the presence of inhibents and degraded starting
material. In average the suggested number of cycles is 40-45.
A linear relationship exists between the log of the quantity of RNA and the log of the
specific amplified gene product being examined. This relationship is valid in a specific
range, defined with the quantity of starting nucleic acid and the number of cycles of the
PCR (Stanta et al., 1998c). These variables, known as linearity conditions, change with
target genes, starting material (type of samples, fresh or FFPE tissues), but also with PCR
primer sets. To search for the linearity conditions, first of all a constant amount of RNA
(200ng) was amplified varying the cycles number from 30 to 50, with increment of 5
cycles for each variation. The proper number of cycles was determined by the middle point
in the calibration curve that plotted the log of PCR products vs the number of cycles. The
second step to determine the linearity condition consisted in the repetion of the
amplification with chosen number of cycles and with increasing quantities of RNA (50ng-
500ng). Again the optimal conditions were chosen for the quantity related to the middle
point in the calibration curve. At this point, it was possible to analyse the whole case study
using the previous chosen linearity conditions. The linearity conditions search were
performed for both target and housekeeping genes.
Tables 12 and 13 describe the optimal conditions in terms of starting amount of RNA and
number of cycles for every tested gene in each case study.
PCR CONDITIONS HYBRIDIZATION CONDITIONS
GENE T°a RNA for
RT PCR cycles T°hybr % form.
ACTB 50°C 50ng 30 50°C 0.0
AKT3 50°C 125ng 45 52°C 3.0 BREAST CK8 50°C 500ng 50 46°C 0.0 CANCER CASE STUDY ERK1 50°C 30ng 35 52°C 3.0
NM23 50°C 100ng 40 50°C 0.0
PI3K 50°C 60ng 30 52°C 8.0
p130 (RB2) 55°C 250ng 55 45°C 0.0
RAF-1 55°C 120ng 40 52°C 4.2
SEL-1L 51°C 15ng 45 45°C 0.0 Table 12: Optimal amplification and hybridization conditions of genes in the breast cancer case study
40
Materials and Methods
PCR CONDITIONS HYBRIDIZATION CONDITIONS
GENE
T°a RNA quantity
PCR cycles T°hybr % form.
ATP5B 60°C 40ng 30 51.8°C 0.0
ADRENAL 0.0 HPRT 50°C 60°C 20ng 35 GLAND CANCER FTL-4 55°C 80ng 35 46.5°C 0.0 CASE STUDY
0.0 VEGFR2 55°C 80ng 55°C 40 0.0 VEGFC 58°C 50ng 50°C 45 0.0 VEGFD 54°C 100ng 55°C 45
Table 13: Optimal amplification and hybridization conditions of genes in the adrenal gland cancer case study
The choice of the appropriate housekeeping genes was carried out preliminarly analysing
in about ten cases (5 tumoral and 5 peri-tumoral if they were available) the expression of 5
candidate housekeeping genes (found in the literature or already validated in previous
studies) and selecting for the case study one to three of them that showed the lower
expression variability among samples.
For the breast cancer case study ACTB was chosen, while for adrenal gland tumor case
study a combination of ATP5B and HPRT resulted the best choice.
In practice, after DNase digestion followed by phenol/chloroform extraction, the optimized
concentrations of RNA (see Tables 12-13) were reverse transcribed in a final volume of
10μl using AMV-RT associated with the reverse specific primer.
Solution contained AMV-RT buffer, 1mM dNTPs, 15pmol specific reverse primer, 2units
AMV-RT, 4 units RNase inhibitor and total RNA to a final volume of 10μl. The reaction
took place at 42°C for 60’.
The whole reverse transcription product was used as a template for the PCR reaction.
Amplification was performed in a final volume of 50μl by adding the PCR buffer (500 mM
KCl, 100 mM Tris pH 8.3, without MgCl2), 15pmol specific forward primer and 2.5units
Taq Polymerase. The solution was denatured for 3’ at 94°C, subjected to 5 cycles of 1’ at
94°C, 1’ at the specific annealing temperature of the primer pair and 1’ at 72°C followed
by a variable number of cycles of 30” at 94°C, 30” at the specific annealing temperature of
the primer pair and 30” at 72°C.
Detection of PCR products were carried out by radioactive-base dot blot hybridization
(already described in 3.1.3), using the radiolabelled probes described in Table 11-12 in the
optimized conditions (Tables 12-13) and the expression data normalization was then
performed (against ACTB for breast cancer case study and against ATP5B and HPRT for
41
Materials and Methods
adrenal gland tumor case study) by submitting the raw quantification data (expressed as
cpm) to the following formula:
Value norm= NF * value sample
Valuenorm is the normalized quantification value (expressed in cpm) of the target gene, NF
is the ratio between the mathematical mean of the reference gene/panel of reference genes
expression values in all the samples and the reference gene expression value referred to the
investigated sample, Valuesample is the raw expression of the target gene.
Normalized expression data were then submitted to the statistical analysis.
5. STATISTICAL ANALYSIS
Statistical analyses were performed with the package Stata/SE 9.0 (Stata Corp College
Station, TX, USA).
- In the optimization experiments basic statistics was used: mean, standard deviation,
Pearson’s linear correlation.
- In the breast cancer case study T-test analysis was applied to compare the mean value of
expression of each gene in the group of patients that had recurrencies to the mean value in
the group that had not. To estimate the joint effects of the analysed covariates on patients’
survival, the data were analysed by fitting the Cox proportional hazards regression model
as previously reported(Bonin et al., 2006). Cox proportional-hazards analysis included age
at diagnosis, stage and grade of the tumours and the complete set of the molecular markers.
In this analysis, tumors with expression of molecular markers lower or higher than the
mean value were classified as low or high status of expression, respectively.
To investigate possible associations among the genes detected by Cox regression analysis
we chose pairs of molecular markers involved in opposite or conflicting functions. For
these pairs of markers we considered groups defined by: high expression status of one
marker and low expression status of the other one and the opposite situation. The chosen
pairs of genes were: HER2 and Cytokeratin 8 as dedifferentiation/differentiation markers,
CDK2 and RB as markers of cell cycle progression/senescence, PI3K and RAF1 as
markers of the main branches of RAS pathways, PI3K and AKT3 as markers of cell
proliferation. The Log-rank test was used to compare the survival between the above
mentioned groups.
- In the adrenal gland tumor case study the one-way ANOVA test combined with Sheffè
testing was used to evaluate the differences in the expression levels of the four markers
42

Materials and Methods
(VEGFC, VEGFD, VEGFR2 and FLT-4) and of the microvessel density in the four
groups of the case study (peri-tumoral, adenomas, carcinomas, pheochromocytomas).
Pearson’s correlation was used for the determination of the coupled relationships between
the 4 tested genes in the 4 groups of the case study and between gene expression values
and the MVD.
Statistical difference was accepted at p value less than 0.05. p values between 0.06-0.07
were considered “borderline”.
43
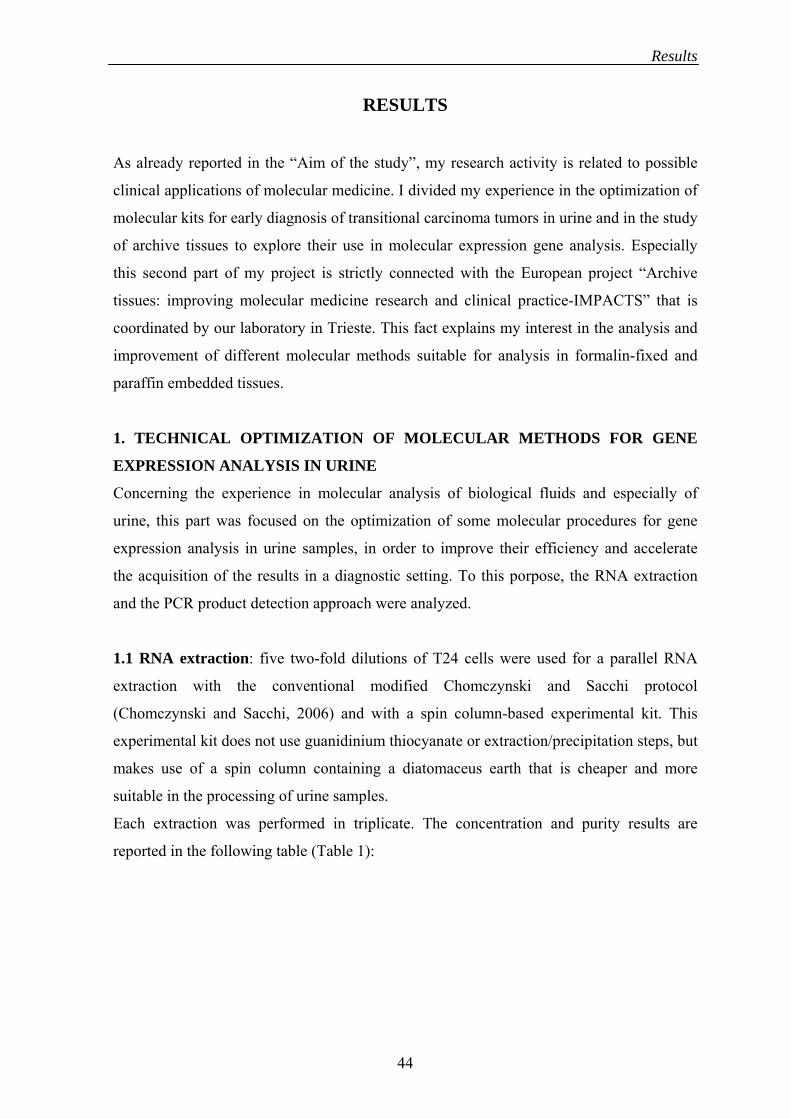
Results
RESULTS
As already reported in the “Aim of the study”, my research activity is related to possible
clinical applications of molecular medicine. I divided my experience in the optimization of
molecular kits for early diagnosis of transitional carcinoma tumors in urine and in the study
of archive tissues to explore their use in molecular expression gene analysis. Especially
this second part of my project is strictly connected with the European project “Archive
tissues: improving molecular medicine research and clinical practice-IMPACTS” that is
coordinated by our laboratory in Trieste. This fact explains my interest in the analysis and
improvement of different molecular methods suitable for analysis in formalin-fixed and
paraffin embedded tissues.
1. TECHNICAL OPTIMIZATION OF MOLECULAR METHODS FOR GENE
EXPRESSION ANALYSIS IN URINE
Concerning the experience in molecular analysis of biological fluids and especially of
urine, this part was focused on the optimization of some molecular procedures for gene
expression analysis in urine samples, in order to improve their efficiency and accelerate
the acquisition of the results in a diagnostic setting. To this porpose, the RNA extraction
and the PCR product detection approach were analyzed.
1.1 RNA extraction: five two-fold dilutions of T24 cells were used for a parallel RNA
extraction with the conventional modified Chomczynski and Sacchi protocol
(Chomczynski and Sacchi, 2006) and with a spin column-based experimental kit. This
experimental kit does not use guanidinium thiocyanate or extraction/precipitation steps, but
makes use of a spin column containing a diatomaceus earth that is cheaper and more
suitable in the processing of urine samples.
Each extraction was performed in triplicate. The concentration and purity results are
reported in the following table (Table 1):
44

Results
Table 1: comparison between classical and experimental kit RNA extraction according to RNA concentration and 260/280nm purity. Values are means of triplicate±standard deviations.
The classical and the new method of RNA extraction presented similar results for higher
RNA concentrations, while at lower concentrations our kit gave better results (it resulted
six-fold more efficient than classical extraction using 2.5*105 cells and allowed a higher
sensitivity with a RNA recovery even in the last dilution of 1.25*105 cells).
These results are summarized in a graphical representation (Fig.1).
Fig. 1: sensitivity and efficiency of the two compared RNA extraction methods
The purity results according to the 260/280nm ratio (that indicates the level of co-purified
phenolic and protein contaminants) seemed to be very similar between the two methods
but an increased RNA quality at lower concentrations was observed for the new extraction
method (Table 1).
CLASSICAL NEW KIT EXTRACTION EXTRACTION n° of
cells Conc. μg/ul
Conc. A260/280nm A260/280nm μg/ul 62*10 1.04±0.05 1.86±0.04 1.06±0.05 1.7±0.03
61*10 0.46±0.07 1.5±0.05 0.56±0.08 1.6±0.04
55*10 0.09±0.25 1.4±0.05 0.28±0.08 1.65±0.04
2.5*105 0.02±0.3 1.25±0.07 0.12±0.1 1.6±0.04
1.25*105 - 0.0 0.06±0.2 1.55±0.05
y = 0,5357x + 0,0008R2 = 0,9983
y = 0,6046x - 0,1675R2 = 0,9922
0
0,2
0,4
0,6
0,8
1
1,2
0 0,25 0,5 0,75 1 1,25 1,5 1,75 2 2,25
n° of cells (*106)
ug/u
l
classical extraction
new kit extraction
45
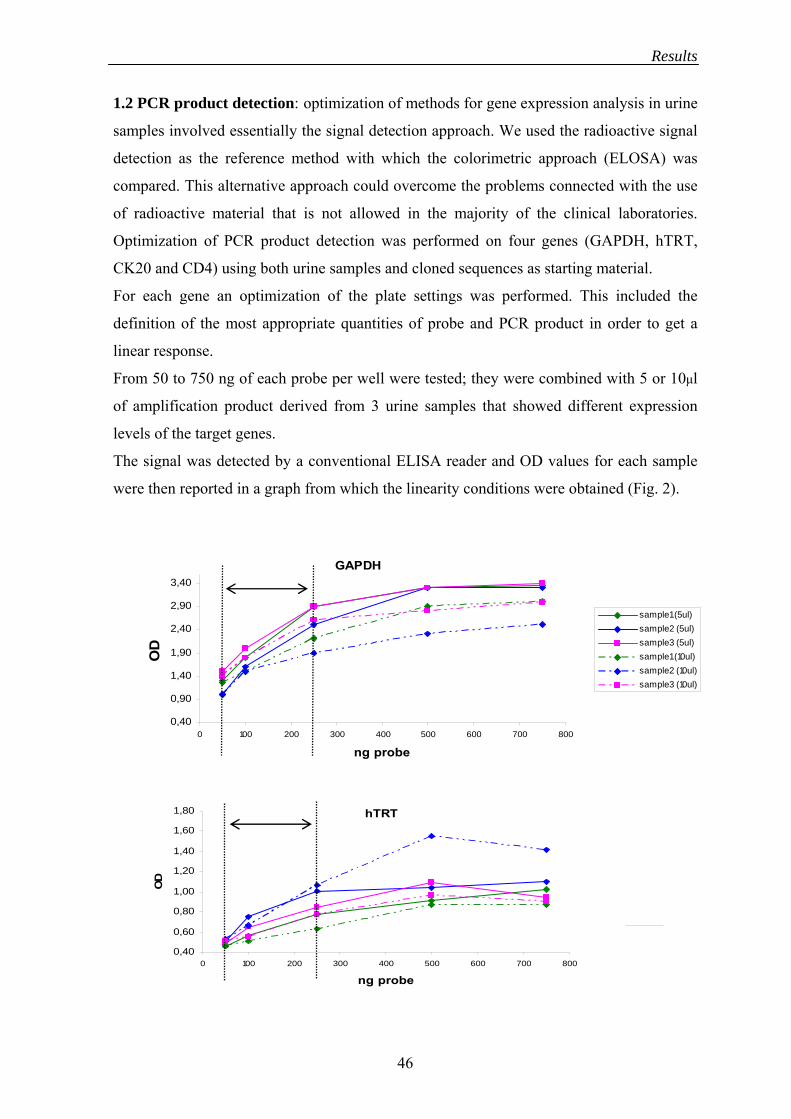
Results
1.2 PCR product detection: optimization of methods for gene expression analysis in urine
samples involved essentially the signal detection approach. We used the radioactive signal
detection as the reference method with which the colorimetric approach (ELOSA) was
compared. This alternative approach could overcome the problems connected with the use
of radioactive material that is not allowed in the majority of the clinical laboratories.
Optimization of PCR product detection was performed on four genes (GAPDH, hTRT,
CK20 and CD4) using both urine samples and cloned sequences as starting material. For each gene an optimization of the plate settings was performed. This included the
definition of the most appropriate quantities of probe and PCR product in order to get a
linear response.
From 50 to 750 ng of each probe per well were tested; they were combined with 5 or 10μl
of amplification product derived from 3 urine samples that showed different expression
levels of the target genes.
The signal was detected by a conventional ELISA reader and OD values for each sample
were then reported in a graph from which the linearity conditions were obtained (Fig. 2).
sample1 (5ul)sample2 (5ul)sample3 (5ul)sample1 (10ul)sample2 (10ul)sample3 (10ul)
0,40
0,90
1,40
1,90
2,40
2,90
3,40
0
OD
GAPDH
0,40
0,90
1,40
1,90
2,40
2,90
3,40
0 100 200 300 400 500 600 700 800
ng probe
OD
hTRT
0,40
0,60
0,80
1,00
1,20
1,40
1,60
1,80
0 100 200 300 400 500 600 700 800
ng probe
OD
46

Results
CK20
0,40
0,90
1,40
1,90
2,40
2,90
3,40
0 100 200 300 400 500 600 700 800
ng probe
OD
CD4
0,40
0,90
1,40
1,90
2,40
2,90
3,40
0 100 200 300 400 500 600 700 800ng probe
OD
Fig. 2: graphical representation of OD values of the 4 genes according to the quantity of both PCR product (5-10μl) and probe (50ng, 100ng, 250ng, 500ng, 750ng). The vertical lines define the linear range determined experimentally for each gene.
The limits of the dynamic range were defined in order to meet the linearity conditions of
all the target genes. As reported in the four graphs of Fig.2, the concentrations of probes
that give the best quantitative results are those between 100 and 250ng per well. If we look
in this range it is possible to see that for GAPDH, hTRT and CK20 a better hybridization
kinetic is connected on the average with the lower amplicon concentration (5μl). In these
genes it seems that a higher concentration (10μl) of amplicon determines an inhibitory
effect on signal detection. We could find a different behaviour for CD4, in which higher
concentrations of amplicon (10μl) resulted to be the most efficient. In all the genes studied
the OD signal increased up to 250ng of probe per well; higher quantities of probe did not
improve the detection signal.
47
Results
The following table summerizes the hybridization conditions that were finally chosen
(Table 2):
HYBRIDIZATION
CONDITIONS GENE ng probe ul amplicon
5μl GAPDH 100ng
Table 2: optimal hybridization conditions in the ELOSA method.
These optimized conditions were then checked with progressive dilutions (calculated in
fmol) of previously amplified fragments for each of the four genes, for the definition of the
linear quantitative range of detection. In this interval, it is present a linear relationship
between the log of the quantity of the target sequence and the corresponding OD values.
The dynamic range (OD dr) was defined as the range in which it was possible to fit a
straight line across the points (Fig. 3).
Fig. 3: Dynamic range (OD dr) of the signal detection using progressive dilutions of an amplified fragment corresponding to the 4 target genes.
For every gene considered, the OD dynamic range corresponded, with minimal variations,
to an interval between 5*102 and 4*103 fmol of amplified target.
hTRT 100ng 5μl
CK20 150ng 5μl
CD4 100ng 10μl
GAPDH
00,5
11,5
22,5
33,5
4
0 1 2 3 4 5
log fmol GAPDH
OD
hTRT
0
0,5
1
1,5
2
2 2,5 3 3,5 4 4,
log fmol hTRT
OD
5
CD4
0
0,5
1
1,5
2
2,5
0 1 2 3 4 5
log fmol CD4
OD
CK20
0
0,5
1
1,5
2
2,5
3
2 2,5 3 3,5 4 4,5
log fmol CK20
OD
OD dr =1.1-3.1 OD dr =0.5-1.7
OD dr =0.9-1.5 OD dr =1-2
48
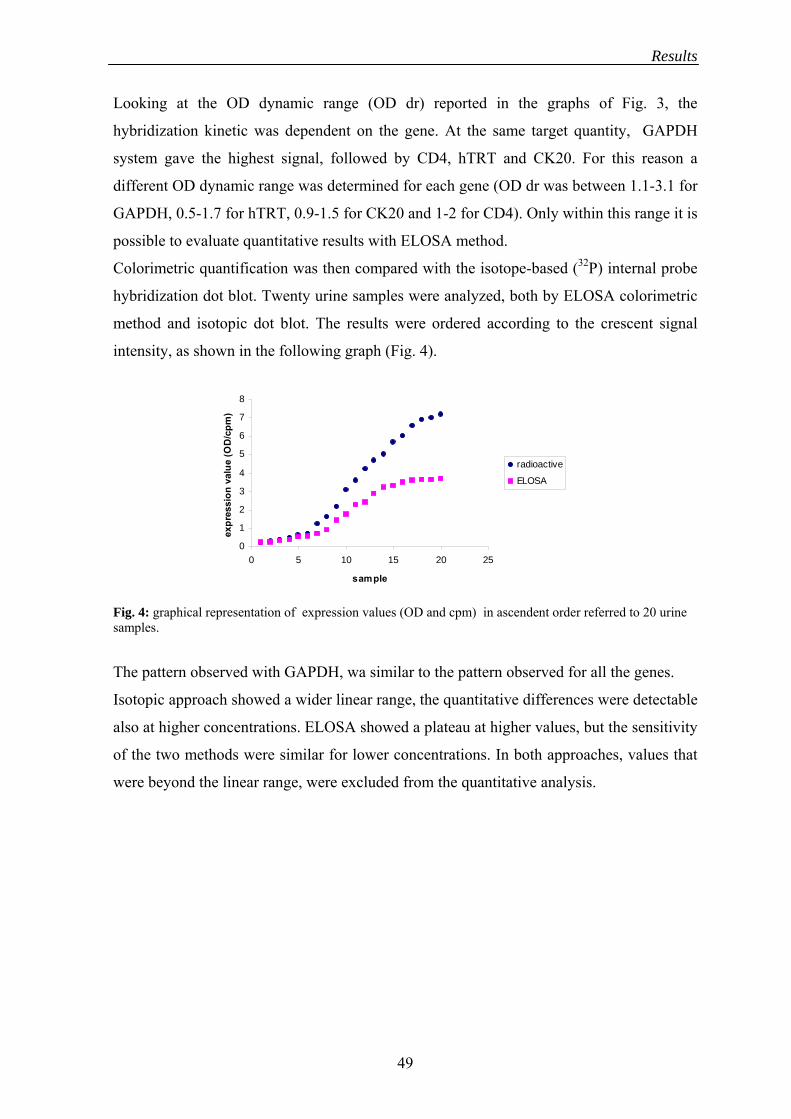
Results
Looking at the OD dynamic range (OD dr) reported in the graphs of Fig. 3, the
hybridization kinetic was dependent on the gene. At the same target quantity, GAPDH
system gave the highest signal, followed by CD4, hTRT and CK20. For this reason a
different OD dynamic range was determined for each gene (OD dr was between 1.1-3.1 for
GAPDH, 0.5-1.7 for hTRT, 0.9-1.5 for CK20 and 1-2 for CD4). Only within this range it is
possible to evaluate quantitative results with ELOSA method.
Colorimetric quantification was then compared with the isotope-based (32P) internal probe
hybridization dot blot. Twenty urine samples were analyzed, both by ELOSA colorimetric
method and isotopic dot blot. The results were ordered according to the crescent signal
intensity, as shown in the following graph (Fig. 4).
0
1
2
3
4
5
6
7
8
0 5 10 15 20 25
sample
expr
essi
on v
alue
(OD
/cpm
)
radioactive
ELOSA
Fig. 4: graphical representation of expression values (OD and cpm) in ascendent order referred to 20 urine samples.
The pattern observed with GAPDH, wa similar to the pattern observed for all the genes.
Isotopic approach showed a wider linear range, the quantitative differences were detectable
also at higher concentrations. ELOSA showed a plateau at higher values, but the sensitivity
of the two methods were similar for lower concentrations. In both approaches, values that
were beyond the linear range, were excluded from the quantitative analysis.
49

Results
2. MOLECULAR METHODS FOR GENE EXPRESSION ANALYSIS IN
ARCHIVAL TISSUES
The major interest of our laboratory is to optimize reproducible methods for molecular
analysis in archive tissues (in most of the cases formalin-fixed and paraffin-embedded
tissues, FFPE). The goal of our European project, in fact, is to validate methods that can be
then standardized and used for clinical analysis for prognostication and therapy prediction
by the use of specific biomarkers. The first part of this study was focused on the
optimization of some “home-made” molecular procedures for gene expression analysis in
archival material. The second part was focused on the application of the methods on
clinical case studies of breast cancer and adrenal gland tumors to detect quantitatively
specific biomarkers at mRNA level.
2.1 Technical optimization
The technical optimization involved both the fixation step of tissues and the different
phases of the molecular analysis, such as extraction, quantification, integrity assessment,
cDNA synthesis and realtime amplification. In this part of my work, as already reported in
“Material and methods” section, I compared in most of the cases standard procedures with
new and alternative types of molecular approaches.
2.1.1 Fixation: A375 cell line was used as based biological material to study different
types of fixatives. This was done to obtain a reproducible and constant type of substrate for
the analysis. Three fixatives were compared: conventional buffered formalin (NBF), a
commercial fixative (FineFIX) and a home-made methacarnoy fixative.
Although highly toxic, formalin still remains the most widely used fixative because it
preserves a wide range of tissue components. However, formalin is a cross-linking agent
that alters and fragments nucleic acids.
FineFIX and methacarnoy fixatives are two alcohol-based solvents. Commercial FineFIX
(Milestone) is a completely non toxic fixative and recently its preservative properties on
macromolecules have been highlighed (Stanta et al., 2006). Methacarnoy is an eccellent
fixative for preserving tissue DNA, RNA and proteins, but is toxic (it contains methanol
and chloroform).
The three fixation procedures were analyzed after fixation for 1-3-6-12-24 hours. Total
RNA was extracted with the modified proteinase K-based protocol. A non fixed aliquot of
cells was used as positive control (C+) of quantity and quality of RNA.
50

Results
Concentrations were assessed by a conventional spectrophotometer analysis at 260nm (Fig.
5).
For concentration values by type of fixative, we found that formalin fixation was the most
aggressive on RNA recovery and even after 3 hours the yield was reduced to more than
50% if compared to RNA from fresh cells.
FineFIX fixation was the most conservative (RNA recovery was approximately 65% of
that obtained from not treated cells even after 24 hours of fixation); methacarnoy fixation
was approximately 50% less conservative than FineFIX treatment but it seemed to improve
RNA recovery until the 12 hour-fixation.
0
200
400
600
800
1000
1200
1400
1600
1800
FRESH FORMALIN FINEFIX METHACARNOY
ng/μ
l
C+ 1h
Fig. 5: quantity of total RNA recovered from cells fixed with formalin, FineFIX and methacarnoy after 1, 3, 6, 12 and 24 hours.
Purity of the extracted RNA was defined by the 260/230nm (indicator of co-purified
organic contaminants) and 260/280nm (indicator of phenol/protein contaminants) ratios
and a mean value was calculated for each group (Table 3). Table 3: purity of total RNA at 230 and 280nm as measured by the spectrophotometer. C+ quantification was repeat in triplicate.
The ratio at 260/230nm was lower for formalin-fixed samples (1.29), followed by
methacarnoy (1.42) and FineFIX-fixed samples (1.74). As a good level of purity is
Conventional spectrophotometer Fixative 260/230nm 260/280nm
Formalin 1.29±0.4 1.61±0.14
FineFIX 1.74±0.16 1.53±0.04
Methacarnoy 1.42±0.2 1.53±0.02
Fresh (C+) 1.91±0.01 1.47±0.02
1h
1h
3h
3h
3h 6h
6h 12h 24h
12h
24h 6h
12h 24h
tot
ng
51
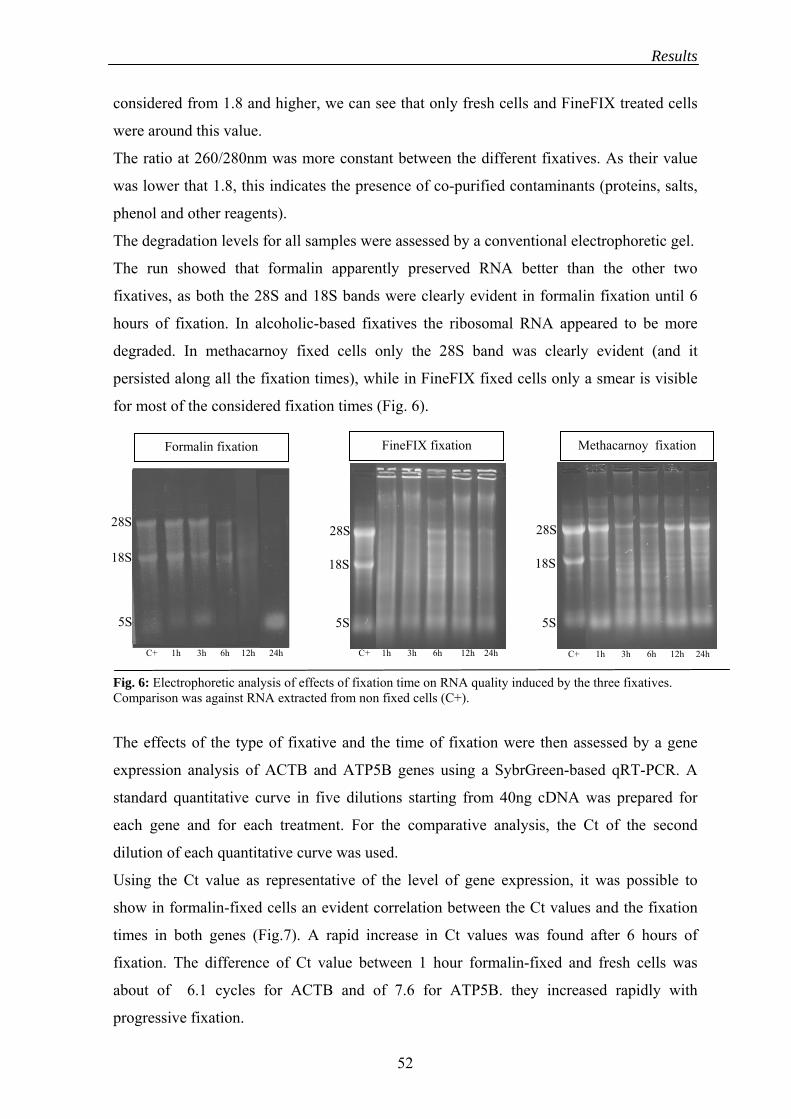
Results
considered from 1.8 and higher, we can see that only fresh cells and FineFIX treated cells
were around this value.
The ratio at 260/280nm was more constant between the different fixatives. As their value
was lower that 1.8, this indicates the presence of co-purified contaminants (proteins, salts,
phenol and other reagents).
The degradation levels for all samples were assessed by a conventional electrophoretic gel.
The run showed that formalin apparently preserved RNA better than the other two
fixatives, as both the 28S and 18S bands were clearly evident in formalin fixation until 6
hours of fixation. In alcoholic-based fixatives the ribosomal RNA appeared to be more
degraded. In methacarnoy fixed cells only the 28S band was clearly evident (and it
persisted along all the fixation times), while in FineFIX fixed cells only a smear is visible
for most of the considered fixation times (Fig. 6).
Fig. 6: Electrophoretic analysis of effects of fixation time on RNA quality induced by the three fixatives. Comparison was against RNA extracted from non fixed cells (C+).
The effects of the type of fixative and the time of fixation were then assessed by a gene
expression analysis of ACTB and ATP5B genes using a SybrGreen-based qRT-PCR. A
standard quantitative curve in five dilutions starting from 40ng cDNA was prepared for
each gene and for each treatment. For the comparative analysis, the Ct of the second
dilution of each quantitative curve was used.
Using the Ct value as representative of the level of gene expression, it was possible to
show in formalin-fixed cells an evident correlation between the Ct values and the fixation
times in both genes (Fig.7). A rapid increase in Ct values was found after 6 hours of
fixation. The difference of Ct value between 1 hour formalin-fixed and fresh cells was
about of 6.1 cycles for ACTB and of 7.6 for ATP5B. they increased rapidly with
progressive fixation.
FineFIX fixation Methacarnoy fixation Formalin fixation
28S 28S 28S
18S 18S 18S
5S 5S 5S
C+ 1h 3h 6h 12h 24h C+ 1h 3h 6h 12h 24h C+ 1h 3h 6h 12h 24h
52

Results
For ATP5B (which physiologically presents lower expression levels) the degradative
effects did not allowed the detection of gene expression after 6 hours of fixation.
In FineFIX and methacarnoy treated cells the RNA integrity was affected in the same way
in comparison with fresh cells. The difference of Ct value between 1 hour-fixed and fresh
cells was about of 4.4 cycles for ACTB and of 3.5 for ATP5B. The degradation level was
constant for any fixation time.
Fresh
Formalin
FineFIX
Methacarnoy
ATP5B
18
23
28
33
38
not f ixed 1h 3h 6h 12h 24h
Fixation time
Ct
No signal
ATP5BACTB
18
23
28
33
38
not f ixed 1h 3h 6h 12h 24h
Fixation time
Ct
Fig. 7: correlation between Ct for ACTB and ATP5B and fixation times for the three fixatives; Ct are referred to the second dilution of each sample.
For formalin fixation these results agree with those found by electrophoretic run, while
completely contrasting results were found for FineFIX and methacarnoy fixation.
A comparative gene expression analysis was also performed in order to assess how fixation
procedure can alter the ratios between different mRNA species (Fig. 8). The ΔCt for
ACTB and ATP5B were compared; their values were plotted in the following graph,
according to the type of fixative and the fixation time.
-1,5
-0,5
0,5
1,5
2,5
3,5
4,5
not f ixed 1h 3h 6h 12h 24h
Ct A
TP5B
-Ct A
CTB
not fixed
Formalin
FineFIX
Methacarnoy
Fig. 8: graphical representation of ΔCt values between Ct values of ATP5B and ACTB according to the fixative and fixation time.
53
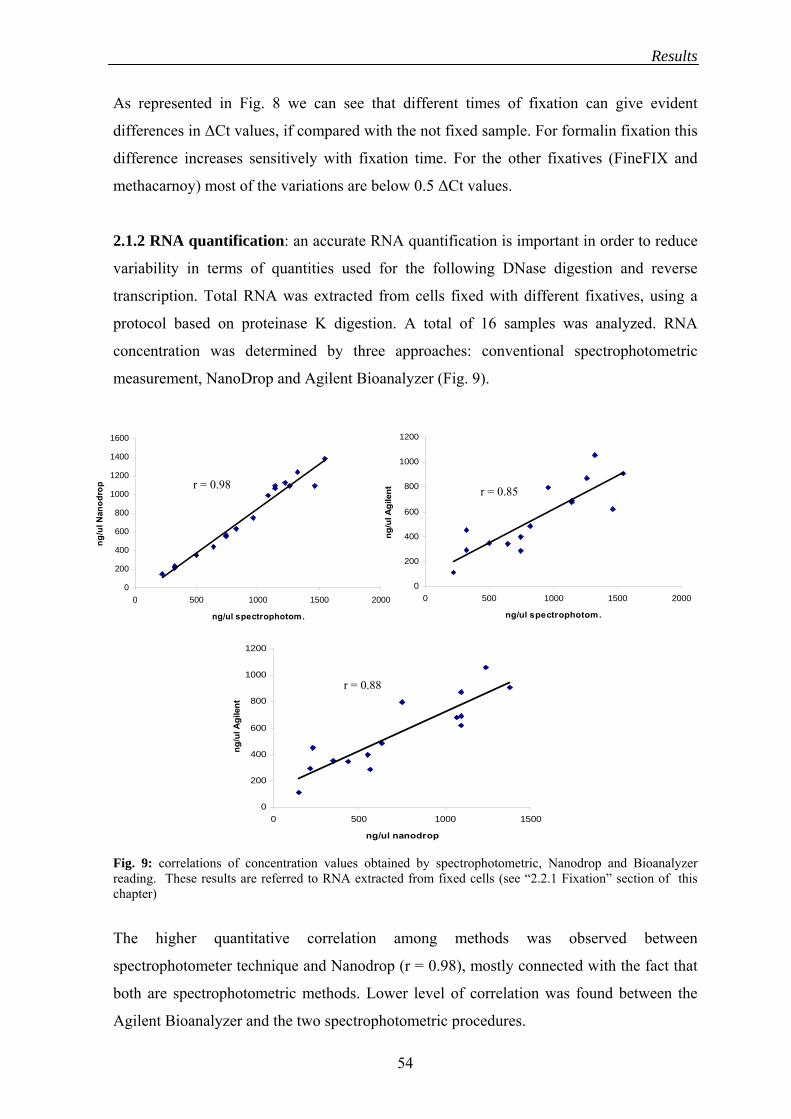
Results
As represented in Fig. 8 we can see that different times of fixation can give evident
differences in ΔCt values, if compared with the not fixed sample. For formalin fixation this
difference increases sensitively with fixation time. For the other fixatives (FineFIX and
methacarnoy) most of the variations are below 0.5 ΔCt values.
2.1.2 RNA quantification: an accurate RNA quantification is important in order to reduce
variability in terms of quantities used for the following DNase digestion and reverse
transcription. Total RNA was extracted from cells fixed with different fixatives, using a
protocol based on proteinase K digestion. A total of 16 samples was analyzed. RNA
concentration was determined by three approaches: conventional spectrophotometric
measurement, NanoDrop and Agilent Bioanalyzer (Fig. 9).
Fig. 9: correlations of concentration values obtained by spectrophotometric, Nanodrop and Bioanalyzer reading. These results are referred to RNA extracted from fixed cells (see “2.2.1 Fixation” section of this chapter)
The higher quantitative correlation among methods was observed between
spectrophotometer technique and Nanodrop (r = 0.98), mostly connected with the fact that
both are spectrophotometric methods. Lower level of correlation was found between the
Agilent Bioanalyzer and the two spectrophotometric procedures.
y = 0,9504x - 100,98
0
0
0
600
0
1000
1200
1400
1600
0 500 1000 1500
ng/ul spectrophotom.
ng/u
l Nan
odro
p
2000
y = 0,543xR2 = 0,9641
20
40
80
+ 80,332R2 = 0,7265
0
200
400
600
800
1000
1200
0 500 1000 1500 2000
ng/ul spectrophotom.
ng/u
l Agi
lent
r = 0.98 r = 0.85
y = 0,5929x0,78
+ 127,22R
0
200
400
600
800
1000
1200
0 500 1000 1500
ng/ul nanodrop
ng/u
l bio
anal
yzer
2 = 74
r = 0.88
ng/u
l Agi
lent
54

Results
For Nanodrop measurement, purity of the extracted RNA was defined by the 260/230nm
and 260/280nm ratios and a mean value was calculated for each group (Table 4a).
Table 4: purity of total RNA as 260/230nm and 260/280nm ratios comparing Nanodrop (a) and conventional spectrophotometer (b) measurements.
If compared with the spectrophotometric results (see 2.1.1), a good correlation between the
two methods was found for the 260/230nm ratio; on the contrary, the 260/280nm ratios
were higher for Nanodrop measurement. This was more evident for the non fixed sample
(1.93 vs 1.47).
2.1.3 RNA integrity assessment: the comparison between different approaches for RNA
integrity assessment was performed to determine the most accurate method for a reliable
prediction of mRNA accessibility for subsequent gene expression analysis. In this
experiment the RNA integrity detection employed the same cell line system that was used
for fixation evaluation (2.1.1). RNA from fresh cells was used again as positive control. In
particular, the denaturing gel electrophoresis results, reported in the 2.1.1 section, were
compared with those obtained with two alternative methods.
The RNA integrity was first assessed using an Agilent 2100 Bioanalyzer. RNA
degradation levels were evaluated by the analysis of the electropherogram, the “Ratio
method” and the “RNA Integrity Number” (RIN). In Fig.10 the electropherograms for both
fresh and fixed cells aree compared with the corresponding 28S/18S ribosomal ratios
(“Ratio method”) and RIN value for each sample. For the intact positive control, the
corresponding 5S, 18S and 28S peaks are also indicated.
Conventional spectrophotometer Fixative 260/230nm 260/280nm
Formalin 1.29±0.4 1.61±0.14
FineFIX 1.74±0.16 1.53±0.04
Methacarnoy 1.42±0.2 1.53±0.02
Fresh (C+) 1.91±0.01 1.47±0.02
Nanodrop b) a)
Fixative 260/230nm 260/280nm
Formalin 1.16±0.46 1.84±0.12
FineFIX 1.61±0.23 1.95±0.02
Methacarnoy 1.42±0.22 1.95±0.05
Fresh (C+) 1.92±0.01 1.93±0.01
55

Results
28S 18S
5S
C+ Methacarnoy fixation Formalin fixation FineFIX fixation Fig. 10: electropherograms of the cells fixed with the three fixatives for different times. RIN and rRNA ratios are also reported. Non fixed cells (C+) were used for the comparison.
The electropherograms reproduced the pattern of electrophoretic results previously
reported (see 2.1.1). In formalin fixation a rapid decrement with time of rRNA bands was
followed by a progressive increase of low molecular weight fragments (5S). In FineFIX
fixation the rRNA peaks disappeared immediately after the first hour of fixation. In
56
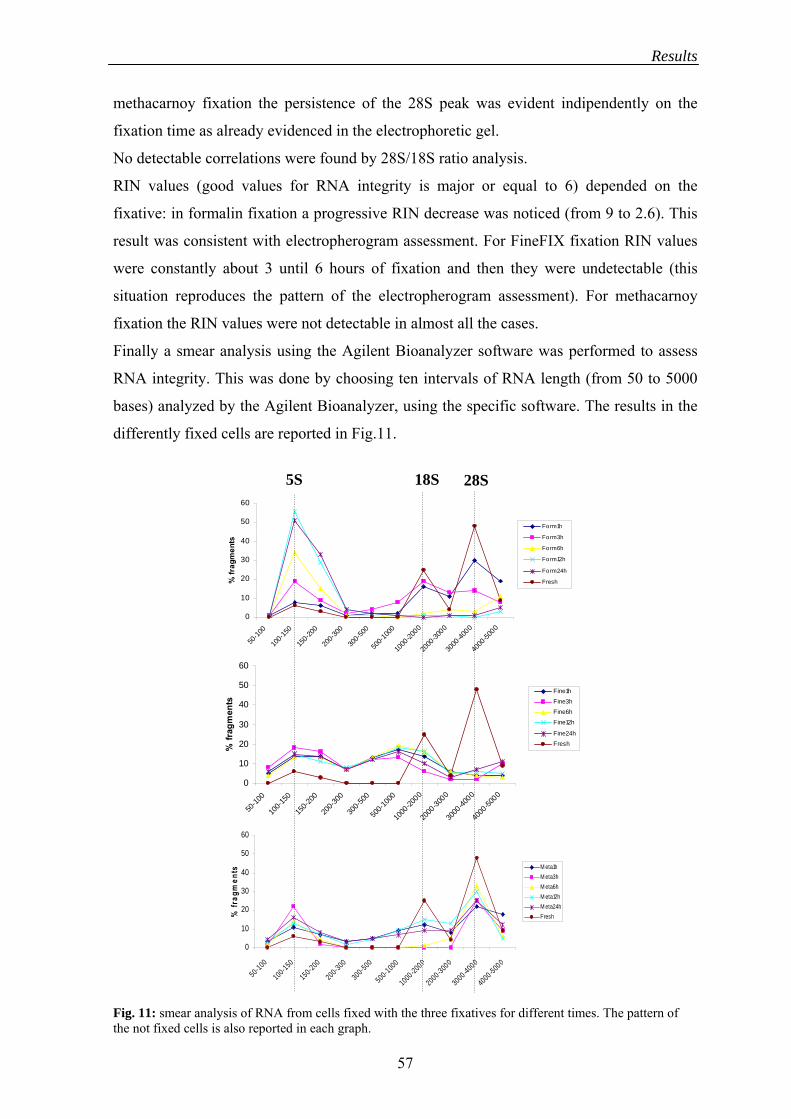
Results
methacarnoy fixation the persistence of the 28S peak was evident indipendently on the
fixation time as already evidenced in the electrophoretic gel.
No detectable correlations were found by 28S/18S ratio analysis.
RIN values (good values for RNA integrity is major or equal to 6) depended on the
fixative: in formalin fixation a progressive RIN decrease was noticed (from 9 to 2.6). This
result was consistent with electropherogram assessment. For FineFIX fixation RIN values
were constantly about 3 until 6 hours of fixation and then they were undetectable (this
situation reproduces the pattern of the electropherogram assessment). For methacarnoy
fixation the RIN values were not detectable in almost all the cases.
Finally a smear analysis using the Agilent Bioanalyzer software was performed to assess
RNA integrity. This was done by choosing ten intervals of RNA length (from 50 to 5000
bases) analyzed by the Agilent Bioanalyzer, using the specific software. The results in the
differently fixed cells are reported in Fig.11.
Fig. 11: smear analysis of RNA from cells fixed with the three fixatives for different times. The pattern of the not fixed cells is also reported in each graph.
0
10
20
30
40
50
60
50-10
0
100-1
50
150-2
00
200-3
00
300-5
00
500-1
000
1000
-2000
2000
-3000
3000
-4000
4000
-5000
% fr
agm
ents
Form1h
Form3h
Form6h
Form12h
Form24h
Fresh
5S 18S 28S
0
10
20
30
40
50
60
50-10
0
100-1
50
150-2
00
200-3
00
300-5
00
500-1
000
1000
-2000
2000
-3000
3000
-4000
4000
-5000
% fr
agm
ents
Fine1h
Fine3hFine6h
Fine12h
Fine24hFresh
0
10
20
30
40
50
60
50-100
100-150
150-200
200-300
300-500
500-1000
1000 -2000
2000 -3000
3000 -4000
4000 -5000
% fr
agm
ents M eta1h
M eta3hM eta6hM eta12hM eta24hFresh
57

Results
Smear analysis stressed the percentage of fragments that were available in each interval of
length after fixation.
After 3 hours of formalin fixation 50% of the fragments were still present between 2000
and 6000 bases, but after 6 hours 70-80% of the fragments were between 100 and 300
bases. With FineFIX fixation the degradation seemed to be constant for the different times,
40% of the fragments were between 100 and 300 and 40% between 500 and 3000 bases.
With methacarnoy fixation a persistence of high molecular weights fragments
(corresponding to 28S rRNA) was seen even after 24 hours of fixation: in this time 40-60%
of the fragments were still between 3000 and 5000 bases; during fixation however, a
progressive increment of the 5S peak was also shown.
Integrity assessment on both fresh (C+) and fixed cells was finally performed by end-point
reverse transcription using the MMVL-based protocol and amplification of 5 beta-actin
fragments in a range between 77 and 651 bp. Results were visualized in an acrylamide gel
stained with ethidium bromide (Fig.12).
77 base pair
METHACARNOY
77 bp -
1h 3h 6h 12h 24h C+ C- FORMALIN FINEFIX
77 bp -
1h 3h 6h 12h 24h 1h 3h 6h 12h 24h
177 base pair
METHACARNOY
177 bp -
1h 3h 6h 12h 24h C+ C-
1h 3h 6h 12h 24h FORMALIN FINEFIX
177 bp -
1h 3h 6h 12h 24h
58
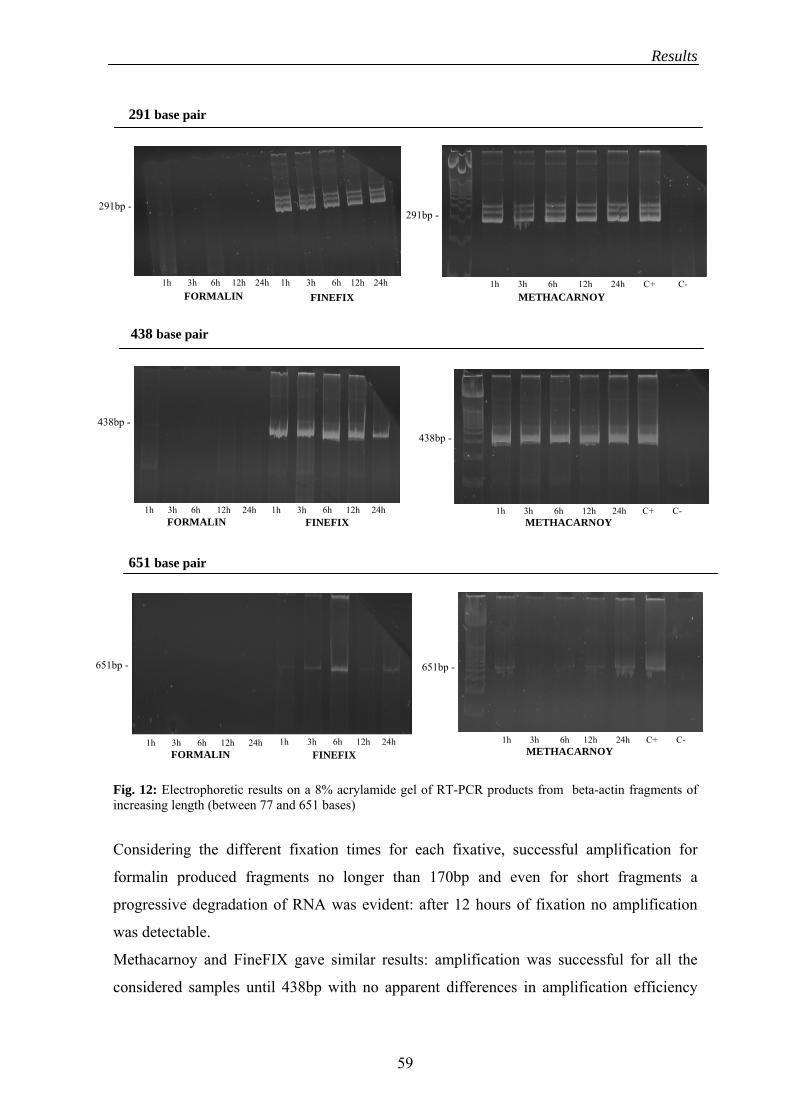
Results
291 base pair
Fig. 12: Electrophoretic results on a 8% acrylamide gel of RT-PCR products from beta-actin fragments of increasing length (between 77 and 651 bases)
Considering the different fixation times for each fixative, successful amplification for
formalin produced fragments no longer than 170bp and even for short fragments a
progressive degradation of RNA was evident: after 12 hours of fixation no amplification
was detectable.
Methacarnoy and FineFIX gave similar results: amplification was successful for all the
considered samples until 438bp with no apparent differences in amplification efficiency
438 base pair
651 base pair
FORMALIN FINEFIX
291bp -
1h 3h 6h 12h 24h 1h 3h 6h 12h 24h
291bp -
METHACARNOY 1h 3h 6h 12h 24h C+ C-
438bp -
FORMALIN FINEFIX 1h 3h 6h 12h 24h 1h 3h 6h 12h 24h
438bp -
METHACARNOY 1h 3h 6h 12h 24h C+ C-
651bp -
METHACARNOY 1h 3h 6h 12h 24h C+ C-
651bp -
FORMALIN FINEFIX 1h 3h 6h 12h 24h 1h 3h 6h 12h 24h
59

Results
between 1 and 24 hours of fixation. The amplification of the longest fragment (651bp) was
still detectable but not in all samples and it was not correlated with fixation time.
The results obtained with the RT-PCR seemed to correlate with those obtained with
electrophoretic run and Agilent methods for formalin treated cells.
However, when RT-PCR results were compared with electrophoretic run,
electropherogram, rRNA ratio and RIN, contrasting results were seen for FineFIX fixation
during prolonged fixation. None of these methods could in fact predict the successful RT-
PCR results that were obtained even for longer fragments. For methacarnoy fixation the
identification of 28S peak by electropherogram assessment could someway explain the
good amplification results.
The results obtained with the RT-PCR seemed to correlate best with the smear analysis
supplied by Agilent Bioanalyzer. For all the fixed samples, in fact, the distribution of the
fragment ranges reproduced the pattern of the RT-PCR results.
The results by endpoint PCR agree with the previously reported analysis by the realtime
PCR (see 2.1.1), that confirmed that FineFIX and methacarnoy fixation preserves mRNA
from degradation and leaves it accessible for subsequent amplification.
2.1.4 DNase treatment: in all the protocols analyzing RNA from tissues it is suggested to
eliminate DNA contamination using a DNase treatment. This is because the presence of
pseudogenes can give aspecific results. Otimization of this protocol was performed using
six different formalin fixed and paraffin embedded breast cancer samples. After
deparaffinization and total RNA extraction by the proteinase K-based protocol, the samples
were submitted to two parallel DNase treatments. In the first one the DNase digestion was
followed by heat inactivation, in the second one DNase digestion was followed by
phenol/chloroform extraction. RNA quantification was repeated only in the latter case. The
effects of these two approaches were tested by a realtime-based gene expression analysis
on ACTB gene. A standard quantification curve was prepared for each sample and the
mean value of sensitivity (defined as a mean of the second dilution Ct values of the six
samples), coefficient of determination (R2) and PCR efficiency (E) were used for the
comparison (Table 5). This step was performed to determine if the presence of the
denaturated enzyme and the other components could affect the procedure of amplification.
60
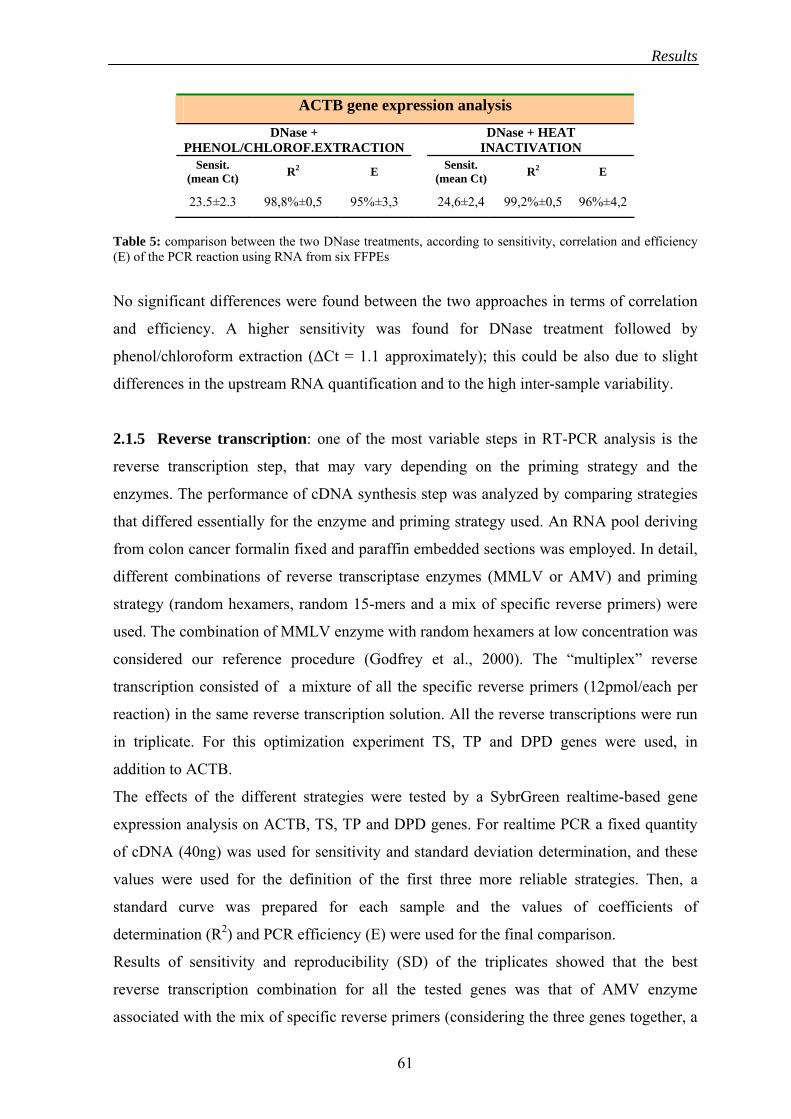
Results
ACTB gene expression analysis
DNase + PHENOL/CHLOROF.EXTRACTION
DNase + HEAT INACTIVATION
Sensit. (mean Ct) R2 E Sensit.
(mean Ct) R2 E
23.5±2.3 98,8%±0,5 95%±3,3 24,6±2,4 99,2%±0,5 96%±4,2
Table 5: comparison between the two DNase treatments, according to sensitivity, correlation and efficiency (E) of the PCR reaction using RNA from six FFPEs
No significant differences were found between the two approaches in terms of correlation
and efficiency. A higher sensitivity was found for DNase treatment followed by
phenol/chloroform extraction (ΔCt = 1.1 approximately); this could be also due to slight
differences in the upstream RNA quantification and to the high inter-sample variability.
2.1.5 Reverse transcription: one of the most variable steps in RT-PCR analysis is the
reverse transcription step, that may vary depending on the priming strategy and the
enzymes. The performance of cDNA synthesis step was analyzed by comparing strategies
that differed essentially for the enzyme and priming strategy used. An RNA pool deriving
from colon cancer formalin fixed and paraffin embedded sections was employed. In detail,
different combinations of reverse transcriptase enzymes (MMLV or AMV) and priming
strategy (random hexamers, random 15-mers and a mix of specific reverse primers) were
used. The combination of MMLV enzyme with random hexamers at low concentration was
considered our reference procedure (Godfrey et al., 2000). The “multiplex” reverse
transcription consisted of a mixture of all the specific reverse primers (12pmol/each per
reaction) in the same reverse transcription solution. All the reverse transcriptions were run
in triplicate. For this optimization experiment TS, TP and DPD genes were used, in
addition to ACTB.
The effects of the different strategies were tested by a SybrGreen realtime-based gene
expression analysis on ACTB, TS, TP and DPD genes. For realtime PCR a fixed quantity
of cDNA (40ng) was used for sensitivity and standard deviation determination, and these
values were used for the definition of the first three more reliable strategies. Then, a
standard curve was prepared for each sample and the values of coefficients of
determination (R2) and PCR efficiency (E) were used for the final comparison.
Results of sensitivity and reproducibility (SD) of the triplicates showed that the best
reverse transcription combination for all the tested genes was that of AMV enzyme
associated with the mix of specific reverse primers (considering the three genes together, a
61

Results
mean difference of 7.3 Cts was found between this combination and that formed by
MMLV plus random hexamers at low concentration). The second and third more sensitive
strategies were those of MMLV enzyme combined with both 6-mers and random 15-mers
at high concentrations: a mean difference of 0.18 Ct was found between them. A mean
difference of 3.6 Cts was shown between MMLV plus random primers at high
concentrations and AMV plus the mix of specific reverse primers (Table 6).
GENE
Table 6: Sensitivity and standard deviations (SD) of realtime amplifications using different combinations of reverse transcriptases and priming strategy. A pool of RNA from colon cancer specimens was used. Sensitivity was referred to the Ct obtained from 40ng cDNA; SD was determined by comparing the triplicates of the RT). In bold font the most sensitive combinations are indicated.
When efficiencies (E) and coefficients of determination (R2) were studied for these three
combinations (MMLV plus both 6-mers and random 15-mers at high concentrations, and
AMV plus the mix of specific reverse primers), it was found that the best method resulted
the combination of MMLV with random 6-mers, followed immediately by MMLV with
random 15-mers (Table 7). On the contrary, AMV gave for all the target genes the lower
efficiency and correlation values (for example the efficiency for DPD was 32%).
ACTB TS TP DPD PRIMING STRATEGY
Primer conc. ENZYME (mol/reaction) Sensit. (Ct)
SD Sensit. SD Sensit. SD Sensit. SD (Ct) (Ct) (Ct)
0.167nmol 25.03 0.24 36.54 1.4 31.77 0.21 35.08 0.5 6-mers
21.66 32.38 29.33 31.86 3.35nmol 0.17 0.30 0.11 0.21
0.167nmol 24.22 0.22 34.37 0.18 31.37 0.18 33.16 0.35
MMLV (250units)
15-mers 21.5 31.27 29.57 31.72 3.35nmol 0.29 0.38 0.28 0.36
- - - - - - - - - 6-mers
3.35nmol 27.83 0.18 38.39 0.26 34.07 0.1 37.2 0.25
- - - - - - - - - AMV 15-mers
3.35nmol 29.31 1.36 38.02 0.68 35.76 1.24 36.49 0.26 (4units)
Mix of 20.12 29.49 26.83 24.89 12pmol each 0.17 0.27 0.009 0.19 primers
62
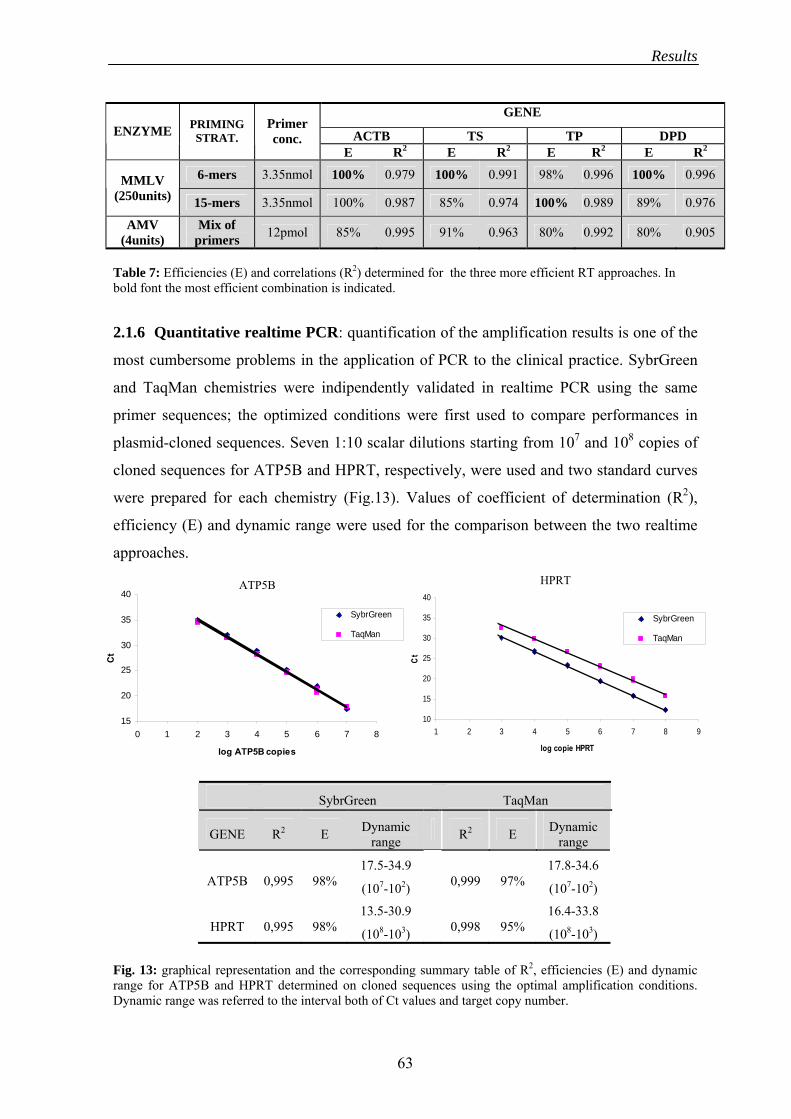
Results
GENE
Table 7: Efficiencies (E) and correlations (R2) determined for the three more efficient RT approaches. In bold font the most efficient combination is indicated.
2.1.6 Quantitative realtime PCR: quantification of the amplification results is one of the
most cumbersome problems in the application of PCR to the clinical practice. SybrGreen
and TaqMan chemistries were indipendently validated in realtime PCR using the same
primer sequences; the optimized conditions were first used to compare performances in
plasmid-cloned sequences. Seven 1:10 scalar dilutions starting from 107 and 108 copies of
cloned sequences for ATP5B and HPRT, respectively, were used and two standard curves
were prepared for each chemistry (Fig.13). Values of coefficient of determination (R2),
efficiency (E) and dynamic range were used for the comparison between the two realtime
approaches.
Fig. 13: graphical representation and the corresponding summary table of R2, efficiencies (E) and dynamic range for ATP5B and HPRT determined on cloned sequences using the optimal amplification conditions. Dynamic range was referred to the interval both of Ct values and target copy number.
ACTB TS TP DPD Primer PRIMING ENZYME STRAT. conc.
E R2 E R2 E R2 E R2
6-mers 100% 100% 100% 3.35nmol 0.979 0.991 98% 0.996 0.996 MMLV (250units) 100% 15-mers 100% 3.35nmol 0.987 85% 0.974 0.989 89% 0.976
AMV Mix of 12pmol 85% 0.995 91% 0.963 80% 0.992 80% 0.905 (4units) primers
log HPRTcopies
15
20
25
30
35
40
0 1 2 3 4 5 6 7 8
log ATP5B copies
Ct
ATP5B TaqMan vs SybrGreen
y = -3,6058x + 41,165R2 = 0,9991
y = -3,4141x + 43,518R2 = 0,9953
10
15
20
25
30
35
40
1 2 3 4 5 6 7 8 9
log copie HPRT
Ct
HPRT
SybrGreen
TaqMan
SybrGreen
TaqMan
SybrGreen TaqMan
GENE R2 E Dynamic range Dynamic R2 E range
17.5-34.9 17.8-34.6 ATP5B 0,995 98% 0,999 97% (107-102) (107-102)
13.5-30.9 16.4-33.8 HPRT 0,995 98% 0,998 95% (108-103) (108-103)
63
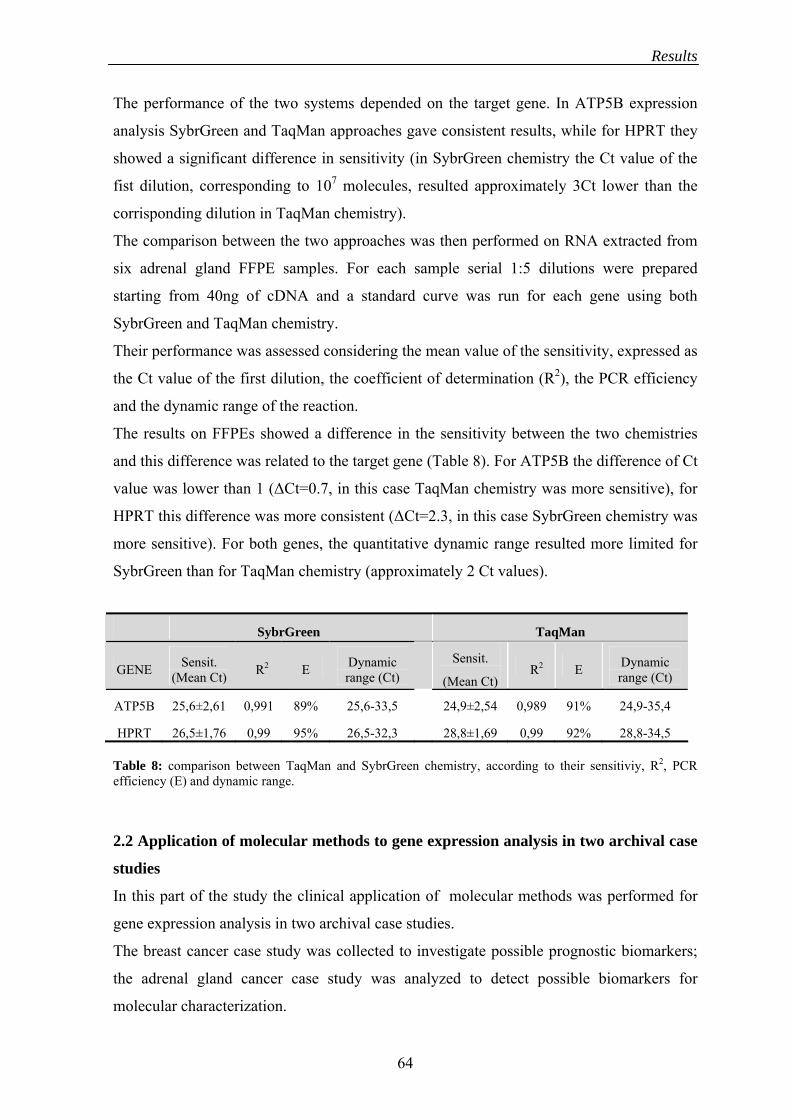
Results
The performance of the two systems depended on the target gene. In ATP5B expression
analysis SybrGreen and TaqMan approaches gave consistent results, while for HPRT they
showed a significant difference in sensitivity (in SybrGreen chemistry the Ct value of the
fist dilution, corresponding to 107 molecules, resulted approximately 3Ct lower than the
corrisponding dilution in TaqMan chemistry).
The comparison between the two approaches was then performed on RNA extracted from
six adrenal gland FFPE samples. For each sample serial 1:5 dilutions were prepared
starting from 40ng of cDNA and a standard curve was run for each gene using both
SybrGreen and TaqMan chemistry.
Their performance was assessed considering the mean value of the sensitivity, expressed as
the Ct value of the first dilution, the coefficient of determination (R2), the PCR efficiency
and the dynamic range of the reaction.
The results on FFPEs showed a difference in the sensitivity between the two chemistries
and this difference was related to the target gene (Table 8). For ATP5B the difference of Ct
value was lower than 1 (ΔCt=0.7, in this case TaqMan chemistry was more sensitive), for
HPRT this difference was more consistent (ΔCt=2.3, in this case SybrGreen chemistry was
more sensitive). For both genes, the quantitative dynamic range resulted more limited for
SybrGreen than for TaqMan chemistry (approximately 2 Ct values).
SybrGreen TaqMan
Table 8: comparison between TaqMan and SybrGreen chemistry, according to their sensitiviy, R2, PCR efficiency (E) and dynamic range.
2.2 Application of molecular methods to gene expression analysis in two archival case
studies
In this part of the study the clinical application of molecular methods was performed for
gene expression analysis in two archival case studies.
The breast cancer case study was collected to investigate possible prognostic biomarkers;
the adrenal gland cancer case study was analyzed to detect possible biomarkers for
molecular characterization.
GENE Sensit. (Mean Ct) R2 E
Sensit. Dynamic Dynamic range (Ct) R2 E range (Ct) (Mean Ct)
ATP5B 25,6±2,61 0,991 89% 25,6-33,5 24,9±2,54 0,989 91% 24,9-35,4
HPRT 26,5±1,76 0,99 95% 26,5-32,3 28,8±1,69 0,99 92% 28,8-34,5
64

Results
In both cases a quantitative end-point analysis was used instead of a realtime PCR to lower
the costs of the research and to continue a long experience of our laboratory in this type of
investigation that gives similar quantitative results.
2.2.1 Breast cancer case study
A cohort of 80 women affected by infiltrating ductal carcinoma of the breast with long
follow-up periods was considered. The axillary lymph nodes were tumour-negative in 43
patients, while they were positive in 37 patients at the time of diagnosis of the primary
tumor During the period of observation, 42 patients developed distant metastases.
By using quantitative “end-point” RT-PCR, it was looked at the mRNA expression level of
22 genes belonging to RAS pathway (EGFr1 and 2, k-RAS, RAF-1, ERK1, PI3K, AKT3),
to cell cycle regulation/senescence (Cyclin A, D1 and E1, CDK2, CDK4, CDK6, p16,
RB2, RB, CDC25a), to telomerase complex [(mRNA coding for catalytic component
(hTRT) and RNA component (hTR)] and differentiation/metastasis suppression genes such
as NM23, SEL-1L and CK8. Genes were selected according to their known links to
malignant cell behaviour in breast cancer and their importance in major cancer hallmarks,
such as cell senescence/proliferation and survival.
Total RNA was extracted using the conventional protein K-based protocol (see 4.1.1.2 of
“Materials and methods” section). Then, total RNA was converted to cDNA using the
AMV-based protocol (see 4.2 of “Materials and methods” section), using one preparation
for each considered gene, and amplification was performed using a semi-quantitative
conventional RT-PCR assay. ACTB was used as normalization factor. PCR products were
detected by radioactive-based hybridization assay and normalized data were statistically
interpreted. The level of expression was defined as high or low according if it was higher
or lower of the mean value.
The following results have been recently published (Bonin et al., 2008).
This study confirms our previous findings on CDC25A (p=0.01), CDK2 (p=0.01) and
CDK4 (p=0.03) higher expression in the groups of patients who developed recurrences in
comparison with patients that did not(Bonin et al., 2006).
From the results of the Cox proportional hazard regression analysis, an independent
influence on cancer specific death was detected for AKT3 (p= 0.01), RAF-1 (p= 0.05)
CDK2 (p= 0.04), cytokeratin 8 (p= 0.04), Retinoblastoma (p= 0.03) and HER2 (p= 0.02)
was shown. A borderline influence on patients’ survival was detected for PI3K (p= 0.06).
Conversely, tumour stage and grade, patients’ age at diagnosis and the remaining
65

Results
molecular markers analysed did not show an effect on survival. After dividing the stage
into lymph node status (positive or negative for metastasis) and tumor dimension (diameter
expressed in centimetres) the results of Cox proportional hazard regression analysis were
restated. In this case study, lymph node status and tumor diameter did not affect patients’
survival (p= 0.1 and p= 0.5 respectively).
Among the genes related to survival, AKT3, CK8 and RB seem to have a protective effect.
Higher expression levels were indeed associated with better prognosis (Fig.14).
a) b)
c)
Fig. 14: Survival curves related to Cox proportional hazard regression with respect to: a) AKT3 expression level in the subgroups of low AKT3 or high AKT3; b) CK8 expression level in the subgroups of low CK8 or high CK8; c) RB expression level in the subgroups of low RB or high RB. Conversely, CDK2, HER2, PI3K and RAF-1 showed a worse effect on patient survival
(Fig.15).
b)
a)
66

Results
c)
d)
Fig. 15: Survival curves related to Cox proportional hazard regression with respect to: a) CDK2 expression level in the subgroups of low CDK2 or high CDK2; b) HER2 expression level in the subgroups of low HER2 or high HER2; c) PI3K expression level in the subgroups of low PI3K or high PI3K; d) RAF-1 expression level in the subgroups of low RAF-1 or high RAF-1
Moreover, groups of patients with high expression status of RB, but low expression status
of CDK2 showed a longer disease-free survival in comparison to the group characterised
by low RB status and high CDK2 status (p= 0.001) as described in Figure16a. A border-
line significance (p= 0.07) was detected when pairing cytokeratin 8 and HER2 status
(Figure 16b). The associations RAF1-PI3K and PI3K-AKT3 as well as the pairing between
RAF1 and AKT3 did not show to be related to patients’ survival (p= 0.9 and p= 0.7
respectively).
a) b)
Fig. 16: Kaplan-Meier survival curves for patients with respect to RB and CDK2 expression level in the subgroups of high RB and low CDK2 or low RB and high CDK2 status (a) and CK8 and HER2 expression level in the subgroups of high CK8 and low HER2 or low CK8 and high HER2 status (b).
Seventy-three percent of patients belonging to the group with low RB and high CDK2
status died during the first 5 years of follow-up. A similar pattern was found for the group
described by low CK8 and high HER2, in which 47% of patients died within the 5th year of
follow-up. Moreover, the groups described by these two couples did not share any patients.
Conversely, breast cancer patients described by high RB and low CDK2 showed a 5 and a
67
Results
10 year survival of 77% and 68%, respectively. Similarly, the survival of patients with
high CK8 and low HER2 was 81% and 69% at 5 and 10 years, respectively. These two
groups overlapped for 3 patients. The 4 groups identified by these couples of markers
included 45 of the 80 patients (56%).
2.2.2 Adrenal gland tumor case study
The role of angiogenesis was investigated in a small case study of adrenal gland tumors.
To elucidate the isolate and combined role of VEGFR2 and FLT-4 (cell surface receptors
of angiogenesis and lymphangiogenesis respectively), and their ligands, VEGFC and
VEGFD in different types of adrenal gland tumors, paraffin embedded sections from 15
adenomas, 9 carcinomas, 10 benign pheochromocytomas (total of 34 cases) were collected.
For 5 tumoral specimens (1 carcinoma, 3 pheochromocytomas and 1 adenoma)
microdissection was necessary and the peritumoral component was also considered. A
gene expression analysis on these four genes was performed at mRNA level and the results
were compared to immunohistochemical investigations using CD31 antibody (normally
used for the vascular microvessel density count).
The case study was then divided in 4 main groups, consisting of the following specimens:
15 adenomas, 9 carcinomas, 10 pheochromocytomas and 5 peri-tumoral tissues.
Expression analysis was performed by taking into account the histological classification.
Total RNA was extracted using the conventional protein K-based protocol.
In a preliminary study for HKG validation we found that in our specific experimental
conditions ATP5B and HPRT were the most stable genes and they were included in the
relative gene expression analysis as reference genes for data normalization.
Total RNA was converted to cDNA using AMV and specific reverse primer, and
amplification for the 2 HKGs and the 4 markers was performed using a semi-quantitative
endpoint RT-PCR assay. PCR products were detected by radioactive-based hybridization
dot blot and normalized data, expressed as cpm values, were statistically interpreted.
Quantitative analysis of the 4 target genes in the three tumoral groups:
Mean, range and median for each normalized target genes are reported in the following
table (Table 9):
68

Results
NORMALIZED FLT-4 mRNA EXPRESSION (cpm)
NORMALIZED VEGFR2 mRNA EXPRESSION (cpm) TYPE OF
TUMOR CASES Mean Range Median Mean Range Median
Peri-tumoral 5 8.51±4.4 6.1-13.2 8.1 7.35±4.6 8.23-18.5 11.6 Adenoma 15 12.47±5.96 2.06-24.9 11.94 16.1±6.17 7.49-27.4 15.11
Carcinoma 9 6.3±5.17 1.25-16.9 4.63 8.52±5.72 3.63-22.6 7.26 Pheochrom. 10 6.21±4.6 0.08-17.2 6.19 12.1±6.47 3.58-27.7 10.79
NORMALIZED VEGFC mRNA EXPRESSION (cpm)
NORMALIZED VEGFD mRNA EXPRESSION (cpm) TYPE OF
TUMOR CASES Mean Range Median Mean Range Median
Peri-tumoral 5 4.25±1.82 3.06-7.32 3.19 8.47±4.63 4.63-16.47 6.61 Adenoma 15 8.19±6.14 1.04-18 6.5
6.27±3.77 0.39-14.2 5.17
Carcinoma 9 5.04±6.78 0-20.36 2.24 2.97±2.69 0.57-7.85 1.96
Pheochrom. 10 2.97±2.53 0.65-9.62 2.33 2.94±2.7 0.13-7.76 1.81
Table 9: mean, range and median values for each normalized target gene expression according to the three tumoral groups and in the peri-tumoral component.
FLT-4 expression was significantly different between adenomas and pheochromocytomas
(p=0.045), and borderline between carcinomas and adenomas (p=0.06) (Fig.17).
VEGFR2 showed statistically significant differences in the expression levels between the
groups of adenomas and carcinomas (p=0.04).
VEGFC did not show significant differences in the expression levels in the 4groups.
Statistically significant differences in expression levels of VEGFD were detected between
peri-tumoral samples and pheochromocytomas (p=0.049), while “borderline” differences
were shown between peri-tumoral samples and carcinomas (p=0.056).
510
1520
2530
Normalized VEGFR2 mRNA levels Normalized FLT-4 mRNA levels
05
1015
2025
1 2 3 41 2 3 4 Peri-tum. Adenoma Carcinoma Pheochrom. Peri-tum. Adenoma Carcinoma Pheochrom.
69

Results
normalized FLT-4 normalized VEGFR2 mRNA levels mRNA levels
ADEN. CA Peritum. ADEN. CA Perit. p=0.06
Fig. 17: graphical representation and p values associated with the differential expression levels of FLT-4,VEGFR2, VEGFC and VEGFD in the three tumoral groups and the peri-tumoral component. In bold the significant p values are indicated.
Correlations between the 4 markers in the 4 groups of the case study:
The correlation between the 4 angiogenetic factors was analysed separately in the 3
tumoral groups and in the peri-tumoral component.
Correlation coefficient values (r) were obtained by comparing couples of normalized
expression levels of the 4 target genes, expressed as cpm (Table 10).
Considering the peri-tumoral component, direct correlations were found between VEGFR2
with both the ligands (r=+0.63 and r=0.71 between VEGFR2 and VEGFC and VEGFD,
respectively), while inverse correlations were found between FLT-4 and the other genes
(r=-0.72, r=-0.62 and r=-0.59 between FLT-4 and VEGFR2, VEGFC and VEGFD
respectively). However, p value resulted not significant due to the low number of
CA p=0.04 Peritum. p=0.45 p=0.81 p=0.35 p=0.46
p=0.045 PHEOCHR. p=0.92 p=0.61 p=0.45 p=0.629 p=0.55
05
1015
20
1 2 3 4
Normalized VEGFC mRNA levels
Peri-tum. Adenoma Carcinoma Pheochrom.
Normalized VEGFD mRNA levels
05
1015
20
1 2 3 4 Peri-tum. Adenoma Carcinoma Pheochrom.
normalized VEGFC normalized VEGFD mRNA levels mRNA levels
ADEN. CA Peritum. ADEN. CA Perit. CA p=0.573 p=0.35
Peritum. p=0.31 p=0.28 p=0.48 p=0.056 PHEOCHR. p=0.136 p=0.865 p=0.56 p=0.57 p=0.38 p=0.049
70

Results
considered samples. Conversely, the correlation between VEGFC and VEGFD resulted
very high (r=0.91) and statistically significant (p=0.02).
In adrenal cortex adenoma, correlations of VEGFD with other genes were lost but a
discrete positive correlations was maintained between the two receptors (r=+0.68) and
between VEGFC and the receptors (r=0.58 and r=0.52 with FLT-4 and VEGFR2
respectively).
In adrenal cortex carcinoma, a strong positive correlation between the two receptors was
still present (r=0.92) but VEGFC correlations were lost. Strong positive correlations were
found between VEGFD and the two receptors (r=0.85 and r=0.76 with FLT-4 and
VEGFR2 respectively).
In medullary pheochromocytoma, a strong correlation was found between the two
receptors (r=+0.93).
Table 10: Pearson’s correlations, expressed as r value, among the normalized gene expression of the tested genes in each group of the case study. In bold the significant correlations are indicated.
A summarizing graphical representation was supposed on the basis of the significant
correlations that were found among the four genes in the 4 groups (Fig.18).
ADENOMA
VEGFR2 VEGFC VEGFD
FLT-4 +0.68 p=0.005
+0.58 p=0.021
+0.18 p=0.505
VEGFR2 +0.55 p=0.03
-0.189 p=0.5
VEGFC +0.31 p=0.24
PERI-TUMORAL TISSUE
VEGFR2 VEGFC VEGFD -0.72 -0.62 -0.59 FLT-4 p=0.17 p=0.27 p=0.29
+0.63 +0.71 VEGFR2 p=0.25 p=0.18 +0.91 VEGFC p=0.02
PHEOCHROMOCYTOMA
VEGFR2 VEGFC VEGFD
FLT-4 +0.93 p<0.001
+0.23 p=0.52
+0.18 p=0.62
VEGFR2 +0.28 p=0.43
-0.03 p=0.93
VEGFC -0.21
p=0.55
CARCINOMA
VEGFR2 VEGFC VEGFD +0.92 +0.85 -0.03 FLT-4 p<0.001 p=0.0038 p=0.94
VEGFR2 -0.06 +0.76 p=0.02 p=0.88
-0.1 VEGFC p=0.78
71

Results
PERI TUMORAL
ADENOMA CARCINOMA
PHEOCHROMOCYTOMA
Fig. 18: schematic representation of the gene expression correlations among the four target genes in the four groups. Red lines and (-) correspond to an inverse correlation; black arrows and (+) correspond to a positive correlation
Correlations between MVD and angiogenetic/lymphangiogenetic factors:
Angiogenesis was quantified by visual microvessel density count, using CD31 antibody as
a marker for vascular endothelium (Fig.19).
Microvessel density for each sample was determined as the mean number of microvessels
recorded in three “hot spots” at 250x power field.
Fig. 19: Example of CD31 protein staining of two pheochromocytomas with low (a) and high (b) microvessel density (250x power field)
a) b)
72

Results
The following table summerizes the mean value, range and median of the MVD results for
each group (Table 11). MVD was expressed as the mean value of the microvessel count in
the three most vascularized areas of each sample.
Number of cases GROUP Mean Range Median
Adenoma 15 77±55 30-214 58
Carcinoma 9 120±96 25-363 88
Pheochrom. 10 142±74 49-248 130
Peri-tumoral 5 55±41 11-105 57 Table 11: Mean, range and median of microvessel density values found in each group of the case study.
Correlation coefficient values (r) were obtained by comparing the normalized expression
levels of the 4 target genes with MVD values of each group (Table 12).
MVD GENE PERI-TUMORAL ADENOMA CARCINOMA PHEOCHROM.
+0.88 +0.23 +0.01 +0.469 FLT-4 p=0.034 p=0.46 p=0.85 p=0.15 +0.93 -0.01 -0.219 -0.38 VEGFR2 p=0.005 p=0.75 p=0.68 p=0.24 +0.12 +0.356 +0.15 -0.097 VEGFC p=0.66 p=0.26 p=0.5 p=0.8
+0.79 +0.28 +0.15 -0.216 VEGFD p=0.02 p=0.46 p=0.56 p=0.65 Table 12: Pearson’s correlations between MVD and the four tested genes in each group of the case study. In bold the significant correlations are indicated. Strong correlations between microvessel density and both the two receptors and VEGFD
were found in the group of carcinoma samples.
No significant associations between angiogenesis and mRNA expression levels of the
tested genes were found in the other groups.
73

Discussion
DISCUSSION
1. CHALLENGES OF MOLECULAR MEDICINE
The “one drug fits all” paradigm of drug discovery has been the standard for many years,
but in the last decades medicine is shifting towards “the right drug at the right dose in the
right patient”, also known as personalized medicine. The optimism towards a concrete
development of this field has been promoted by advancements in molecular methodologies
that offer the opportunity to assess genetic alterations comprehensively and rapidly in
routinely acquired samples. This will enable pathologists to use them as part of the routine
process of cancer diagnostics adding the predictive information that conventional histo-
morphological diagnosis cannot reveal for successful targeted cancer therapy.
The recent advances in molecular pathology enabled discovery of hundreds of candidate
biomarkers with potential clinical value before cancer diagnosis (in risk assessment and
screening), at diagnosis, and after diagnosis (in monitoring therapy, selecting therapy and
detecting recurrences). Paradoxically, however, a concomitant progressive decrease in
biomarker approval has been shown (Fig.1). This was recently noticed especially for
plasma proteins (Anderson and Anderson, 2002).
Fig. 1: Numbers of publications on biomarkers and FDA approval of biomarkers. Triangles and the associated trend line (green) represent the number of FDA-approved plasma-protein markers per year. Red squares and circles indicate publications under the Medline medical subject heading 'biomarker' and text word 'biomarker', respectively. (Ludwig and Weinstein, 2005).
Furthermore, almost none of the few FDA-approved biomarkers are used in standard
clinical practice, and only two of them have made it into the TNM staging guidelines
(HER2 (Wolff et al., 2007) and ER (Anderson et al., 2002)). None of them were
discovered through the new high-throughput genomic or proteomic technologies.
An acceleration in the development of useful biomarkers is possible if an integration of
molecular and clinical data is fully realized: human biospecimens and the correlated
74

Discussion
clinical data represent in fact the ideal source for biomarker discovery as they complete the
molecular information derived from the laboratory research.
As it has been highlighted by FDA (Food and Drug Administration) and IMI (Innovative
Medicine Initiative), the major obstacles in this bidirectional flow of information are
represented by insufficient expertise in the translation of molecular methods to clinical
practice and by the high heterogeneity of human specimens that are collected for molecular
studies.
This scarce experience involves not only the emerging molecular technologies but affects
also the more conventional approaches, that lack in sufficient standardization and
optimization level for a reliable use in clinical practice.
Thanks to the possibility to have access to the fresh and archival samples from the hospital,
our laboratory can investigate these technical problems directly on clinical material, and
exploit them in several molecular analysis on clinical case studies.
The work of my thesis is strictly correlated to this activity. In particular, most of my PhD
thesis developed in the context of a European project called “Archive tissues: improving
molecular medicine research and clinical practice-IMPACTS”. This project represents the
collaboration of many researchers within our laboratory and in the other 20 centres spread
in 11 European countries. Most of my work must be combined with that of many other
researchers that developed other aspects of the project, and this gives reason for the
different experiences that I acquired in this multilaboratory project. This work involved a
technical optimization step followed by their clinical application for candidate biomaker
discovery directly in human case studies.
Another part of my PhD thesis was focused on the technical optimization of molecular
methods for expression analysis in biological fluids and especially in urine samples.
All the optimization steps were performed through the direct comparison in clinical
material of protocols validated in our laboratory or normally reported in literature with
alternative procedures (that are already used in literature but need validation in biological
specimens, or represent a technological innovation for molecular studies).
2. MOLECULAR METHODS FOR GENE EXPRESSION ANALYSIS IN URINE
Our laboratory is involved in several projects on human biological samples; as an example
we are currently performing molecular investigations on blood, to detect tumor cells in
patients with melanoma and breast cancer.
75

Discussion
My work specifically focused on the technical optimization of molecular methods in urine
samples. This study was possible for our collaboration with the Department of Urology of
Cattinara Hospital of Trieste that provided the clinical samples.
At present the cytologic diagnosis of transitional cell carcinoma of the bladder is based on
investigations prompted by the discovery of hematuria or the presence of atypical cells in
the urine. However these abnormalities can also occur in association with banal
inflammatory conditions, giving false positive results. On the other side, low-grade tumors
may produce false negative results in voided urinary cytology between 25 and 70% of the
cases.
Recents findings (Gelmini et al., 2007; Okegawa et al., 2003; Weikert et al., 2005) showed
that RNA from urothelial cells shed in the urine can be used as a precious source for gene
expression analysis. Total RNA extracted from urothelial cells in fact is not completely
degraded but results accessible to extraction and to subsequent quantitative detection.
Our preliminary experiments in which progressive dilutions of exogenous T24 cells were
added to healthy donor urine samples and incubated in reproduced physiological
conditions (37°C for 1-3-6 hours) showed that a consistent reduction of RNA yield from
urine samples was not due to a loss in nucleic acid integrity but to the lysis of cells
followed by the release of RNA in the urine.
2.1 Technical optimization
The first optimization tests were performed to develop a rapid and efficient extraction
approach that could replace the more time-consuming guanidinium-based protocol
(Chomczynski and Sacchi, 2006).
The development of the new experimental extraction kit was in collaboration with
Macrochip company, dedicated to the research in molecular diagnostics.
Our experimental spin-column based approach meets the requirements of improved
sensitivity and efficiency that are essential requisites for a wider application even in
clinical practice.
We found, in fact, that our extraction method is more sensitive than the classical protocol
when few cells are used; this is effectively the most common situation when urothelial
cells are collected from voided urine of patients. Nevertheless, this new approach is clearly
faster because reduces the time for urine processing (one day vs two days).
Furthermore, complemetary experiments in our laboratory showed that the diatomaceous
earth-based RNA extraction is absolutely comparable in terms of efficiency and sensitivity
76

Discussion
to extraction performed by means of the more expensive silica gel or other resins. This is
another critical aspect that makes our experimental prototype a valid approach for the
standard diagnostics. This experimental kit was successfully used in a clinical study that
was published in collaboration with the Department of Urology of Cattinara Hospital
(Siracusano et al., 2005). In this study total RNA extracted by this procedure was used for
gene expression analysis of three candidate biomarkers (hTRT, CK20 and CD4) for
detection of bladder cancer recurrences. The gene expression analysis showed that the
molecular detection of multiple tumor markers in voided urine cells could represent a good
complementary test for non-invasive diagnosis of bladder cancer.
The next optimization step involved the development and validation of an alternative
mRNA expression detection method that could overcome the problems associated to the
use of radioactive material for clinical use.
Radioactive-based detection methods are very sensitive but they present some risks
associated with the use of radiolabelled material. Besides, the use of radioactive material
is not allowed in the majority of the medical centres. For the reported problems the
application of molecular analyses to the clinic environment need to develop methods
available in every hospital. As several diagnostic kits exploit a modified ELISA
colorimetric quantification (ELOSA), we tried to optimize this approach in our laboratory
using the above-mentioned panel of three target genes (Siracusano et al., 2005).
Telomerase is the ribonucleoprotein enzyme responsible for the production of telomeres
and for protection of their integrity during DNA replication (de Lange, 1994). The catalytic
component of telomerase (hTRT) is totally repressed in most somatic human cells and is
present at very low levels in high replicating normal cells, but it’s newly expressed in
several human tumors (Gelmini et al., 2000; Lee et al., 1998).
CK20, constituent of the intermediate filaments of epithelial cells, is expressed in
gastrointestinal epithelium, as well as in normal urothelium (Inoue et al., 2001). In
neoplastic urothelial cells this restriction is lost, and CK20 mRNA expression can be found
in all layers (Harnden et al., 1995). For this reason recent studies tried to detect the
expression of this gene in exfoliated uro-epithelial cells in the voided urine of patients with
transitional cell carcinoma (Christoph et al., 2004; Inoue et al., 2001; Rotem et al., 2000).
CD4 antigen is specific for tumor infiltrating lymphocytes and it has been demonstrated
that infiltrating T cells play an important role in tumor related immunity (Mumberg et al.,
1999).
77

Discussion
In our preliminary experiments we found that ELOSA method could be a good substitute
to the radioactive detection method, especially for the sensitivity. For these experiments we
used both a cell line system and voided urine from hospital patients.
Each gene system required a “personalized” analysis but we found a common behavior for
the detection of all the target genes. In particular we noticed that a high amount of target
inhibited the signal detection, as well as higher probe concentrations (superior to 250 ng
per well) did not improve the sensitivity.
Due to its high sensitivity at lower mRNA concentrations, ELOSA method may represent
in the next future a good substitute for the radioactive approach and a good compromise to
be used in detection of genes in biological fluids.
The colorimetric approach gave however a limited linear range: this clearly reduces the
spectrum of quantification data that can be used.
Another limitation in the use of ELOSA plates is due to the rapid expiration of the
reagents, in particular the phosphorilated probes, both in solution and linked to the well
surface. This problem, if not properly considered, may give false negative results in
quantification signal.
In conclusion, this non-radioactive approach may represent a promising solution for gene
expression analysis but further experiments or implementations in the technique are
necessary for supporting its use, first in clinical research and then in clinical practice.
3. MOLECULAR METHODS FOR GENE EXPRESSION ANALYSIS IN
ARCHIVAL TISSUES
The second and more consistent part of my study was focused on the technical
optimization and clinical application of molecular methods for gene expression analysis in
archival material. This work meets one of the main objectives of the IMPACTS
(Integration of Molecular Pathology And Cell and Tissues Structure) European Project in
which my laboratory is directly involved.
The IMPACTS Coordination Action in functional genomics research (see website:
http://www.impactsnetwork.eu/ for more details), developed within the European “Sixth
Framework Program”, could give a consistent solution to the difficulties and complexities
found in the clinical approval of molecular markers through the definition of common
guidelines for a reliable clinical application of molecular approaches to archival material.
In this context, the large group of 20 European centres headed by pathologists from 11
78
Discussion
countries represents the ideal dynamic interface to translate molecular pathology research
into clinical practice through the use of archived tissues.
The histopathology archive represent a vast, well-characterized historical collection
covering virtually every disease and thus optimal for retrospective studies (Lewis et al.,
2001). Furthermore, these precious archives have become in the last decades widely used
for molecular analyses on DNA and, more recently, on RNA and proteins thanks to the
rapid advances of molecular approaches.
In the clinical practice a large number of tissue samples are routinely taken from patients
during surgical interventions, bioptic examination or autopsy.
These specimens are fixed (usually in formalin) as soon as possible to avoid autolysis and
putrefaction and then paraffin-embedded to be cut for the histological examination. After
few sections are cut, most of the tissues are stored for decades in the hospital pathology
archives and for this reason they are called “archive tissues”. Fixation and embedding of
tissues guarantee their preservation at room temperatures over years.
It is possible to estimate that in the last twenty years at least half billion cases were stored
in the European hospitals, and in most of those multiple tissue samples are stored.
The great availability of specimens with clinical data and long follow-up times, associated
with the advent of molecular methods that allow efficient extraction of DNA, RNA and
proteins make the archival tissues the ideal material for clinical and molecular
retrospective analysis. This event can accelerate the process of translation of the basic
knowledge in molecular cancer biology to molecular medicine.
The main objectives of this Coordination Action correlated to a comprehensive use of
archival material, are:
A- To analyze the present knowledge and use about molecular analysis in archive’s human
tissues in Europe and to propose method validation and standardization: The objective is
to explore the range of technical availability and reproducibility of these new methods for
research in functional genomics and clinical application. To establish a more organized
European research effort the European scientists working in this field are meeting in order
to compare the different experiences. There are not common protocols for some of these
molecular analysis in AT (archive tissues) and every laboratory has its own experience.
After this it will follow the final decision about the technical protocols for DNA, RNA and
proteins to test for intra- ed inter-laboratories comparison. (this objective is described in
more detail in the next paragraph).
79

Discussion
B- To disseminate in European laboratories validated and standardized methods with
good practice rules: The validated protocols will be collected and disseminated in
European pathology laboratories. This dissemination is a prerequisite for multicentric
future researches and more diffuse clinical application.
C- To point out future perspectives of functional genomics and proteomics at research and
at clinical level: now functional genomics studies are often performed in cell lines or
animal models. To speed up the introduction of the wide molecular knowledge in the
clinical practice it is useful the translational research working directly with human tissues,
especially with AT that are present in very large collection in the archives of every
European hospital. The future of medicine is oriented to a personalized type of therapy and
archive tissues are the best material to study disease outcomes with very long follow-up
time. Even more, these tissues are part of the clinical routine for histopathology
examination to obtain a final diagnosis. Only after this it could be possible rising questions
that can be solved with molecular analysis allowing a personalized type of diagnosis,
prognosis and therapy. This will ensure a very rapid application of advanced genomics
research results to the clinics for the health of European citizens.
D- To establish bioethical guidelines for the correct use of human archive tissues in
research and clinical practice: A group of international bioethics experts will be invited to
discuss the issue with pathologists, clinicians and other stakeholders. Comparing different
bioethical national laws, their usual application and new orientation is of pivotal
importance for European research on human tissues. The final goal is to propose guidelines
for multicentric studies.
E- To explore the possibilities to organize archive's tissues banks for future researches: the
already existing archives can be organized to obtain a sufficient number of cases for future
multicentric translational researches on specific diseases (homogeneous stage tumours
case-study, rare tumours …).
F- To promote technology innovation in archive tissues molecular analysis in
collaboration with biotechnology industries: in the near future new knowledge will be
disseminated and translated into new therapy protocols and clinical practice, that will also
stimulate collaboration with biotechnological and pharmaceutical companies. It is also
necessary to simplify and to increase specificity and sensitivity of the technology, which
means multidisciplinary collaboration with specialized research centres and companies
involvement. Specific biomarkers for diseases prognosis and therapy will be defined and
80

Discussion
validated in the future research programs proposed by the action participants. These
biomarkers will be the base for the next generation diagnostic kits.
The confirmation for the urgent need of a standardization and technical optimization of
commonly used molecular procedures applied to archival material (objective A) came from
the first IMPACTS meeting held in Trieste the last year. In this occasion some concrete
problems in the application of molecular approaches to archival samples emerged. They
were associated in particular to the extreme variability of protocols that each European
laboratory uses for tissue processing (pre-analytical phase) and the subsequent molecular
analysis on DNA, RNA and proteins (analytical phase). It also emerged that many
technical problems are exacerbated by tissue-dependent factors (limited tissue availability,
tissue composition, type of tissue...), that should always be taken into account.
The combination of these critical operator-dependent and indipendent problems may
deeply affect the performance of the molecular investigations and prevent the reliable
comparison of results between laboratories, resulting in a consistent loss of precious
molecular information.
One of the most debated aspect on which my PhD thesis focused was the quantitative
mRNA expression analysis
The gene expression pattern of a cell or tissue determines structure and function. Gene
expression is a dynamic process which reflects both temporal and lasting changes in the
biological state of cells, organs and organisms. Thus, it’s clear that gene expression
analysis may be an important complement to the traditional methods of laboratory
medicine and it can be used as an approach for biomarker detection.
A number of studies have shown that archival material is amenable to the analysis of
mRNA and several protocols have been established for the retrival of mRNA from
routinely processed FFPE tissues (Lehmann and Kreipe, 2001; Macabeo-Ong et al., 2002;
Specht et al., 2001; Stanta et al., 1998b); however no standardized methods have been
defined and the more recent high throughput technologies did not give yet consistent
clinical results.
As an example, cDNA microarrays allowed the detection of expression profiles and gene
sets that are prognostic and/or predictive of outcome of many cancer (Hayes et al., 2006;
van de Vijver et al., 2002) but, unfortunately, genes identified by these studies show only
slight overlap. The major concern related to the use of microarrays platform is the
requirement of high-quality RNA, generally derived from frozen samples. A recent paper,
81
Discussion
by Penland et al, demonstrated that only a minority of FFPE blocks could be analysed by
microarray (Penland et al., 2007)
In contrast with microarray-based gene expression analysis, quantification of expression
levels of individual genes using endpoint or realtime RT-PCR (qRT-PCR) in archival
material is now well developed. PCR-based methods in fact can tolerate even extensive
degradation, as long as the extraction technique is properly adjusted and the amplicon sizes
are kept small. Furthermore, as the required amounts of input RNA are small, also
microdissected specimens can be successfully used (Specht et al., 2002; Specht et al.,
2001).
A concrete clinical application of realtime PCR in FFPE is offered by Oncotype DXTM, a
realtime PCR-based assay that includes 16 breast-cancer related genes and 5 reference
genes (http://www.genomichealth.com/oncotype/default.aspx). This prognostic approach,
resulting highly reproducible and quantitative, is a significant improvement over classical
immunohistochemical technique (Paik et al., 2004).
3.1 Technical optimization
The following discussion referred to gene expression analysis reports the critical points
from tissue processing to data acquisition, that were talked over during the meeting and
explains in more detail which of them were subsequently investigated in our laboratory.
3.1.1 Pre-analytical treatment of tissues
Pre-analytical treatment of tissues is one of the most variable and debated questions in
molecular analysis of tissues because many factors are integrally involved (Srinivasan et
al., 2002) and no common guidelines between laboratories have been defined yet. Pre-
analytical treatment is related to the lapse of time between ablation of tissues and tissue
fixation, to fixation procedures and to the post-fixation effects.
• Pre-fixation time
Fixation procedure is usually rapid but not immediate. The pre-fixation time involves both
the interval of time during intervention and organ removal, and the lapse of time from the
surgical table to the pathology laboratory. The major problem in this whole lapse of time
is related to the hypoxic conditions of the tissue, that in surgical specimens, because of the
closure of the blood vessels during the surgical treatment, can also start before the ablation
of tissues. Thirty minutes are usually considered, by convention, the limit for a
conservative treatment of the tissues before fixation or freezing (Huang et al., 2001).
Anyway, as significant biochemical alterations occur in tissues within 10 minutes after
82

Discussion
anoxia, the prefixation time should be kept at the minimum to minimize nucleic acid and
protein degradation. Changes in local pH, the size of the tissues and the time for reduction
of tissues to small fragments for the histological examination are to be considered as pre-
fixation variables.
• Fixation step
Among the different fixatives that have been developed and tested throughout the years,
formaldehyde as a 10% neutral buffered formalin solution, although highly toxic and
carcinogenic, still remain the most widely used fixative because it preserves a wide range
of tissue components. However, formalin is a cross-linking agent that alters and fragments
nucleic acids, thus impairing extraction efficiency and quality of nucleic acids (Srinivasan
et al., 2002). Only 3% of FFPE derived RNA in fact is considered accessible to reverse
transcription (Godfrey et al., 2000). Besides, the overall rate of formalin-induced
modification of nucleic acids is dependent on changes in the concentration, temperature
and pH of the fixative (Cross et al., 1990; Douglas and Rogers, 1998).
The time of fixation with formalin has not been definitively standardized. During the week
infact, the histopathology lab procedures are quite standardized but any variation can
double the time of fixation and this fact is not usually reported. For formalin fixation this
variable is especially important as its penetration changes during time and the number of
crosslinks among proteins increases with the time of fixation.
Alternative fixatives have been introduced to overcome the problems met with formalin,
maintaining a good tissue morphology, but also good preservation of macromolecules.
Among them there are the home-made fixatives, such as the alcoholic fixatives [ethanol
(Perlmutter et al., 2004) and methanol], mixtures of fixatives [(Carnoy’s, methacarnoy
(Lee et al., 2006), acetone, , Bouin(Gloghini et al., 2004), tannic acid], zinc-based fixatives
(Lykidis et al., 2007) and commercial patented fixatives [FineFIX (Stanta et al., 2006),
UMFIX (Vincek et al., 2003), RCL-2 (Delfour et al., 2006)] and HOPE (Olert et al.,
2001)]. For some fixatives, fixation can be sensitively improved in a microwave assisted
processing (Barrett et al., 2004; Cox et al., 2006).
- In the present work we analyzed three different fixatives and assessed their effects on
RNA quality and quantity by realtime quantification.
We compared the commonly used formalin with two alcohol-based fixatives, one toxic
home-made fixative (methacarnoy) and one completely non-toxic new commercial fixative
(FineFIX, by Milestone). For this comparative experiment we used an homogeneous cell
line-based system, as already performed by others (Koch et al., 2006). Because RNA
83

Discussion
submitted to these three fixations derived from the same culture bottle, qualitative and
quantitative changes in RNA reflected only the differences between the selected fixatives.
It must be noticed that the same “artificial” system was also used to investigate the
performance of some of the most used methods for RNA quantification and integrity
assessment. This part will be discussed later.
We found that each fixative determines different effects on RNA quality and quantity.
Quantitatively, it seems that formalin fixation is the most aggressive with the respect of
RNA yield, reducing drastically its recovery since after 3 hours of fixation. On the other
hand the two alcoholic-fixatives seem to be more conservative, especially FineFIX. This
behaviour agrees with other reports (Shibutani and Uneyama, 2002; Stanta et al., 2006).
The use of alcoholic fixatives, and in particular FineFIX, seems to be important in case
RNA has to be extracted from microdissected sections or from small biopsies.
The gel electrophoretic results clearly show that the three fixatives determine different
degradation patterns. Visual observation of the rRNA bands seem to indicate that in
formalin fixation a rapid decrease of RNA quantity is joined by a progressive reduction of
RNA integrity. In the other two cases data interpretation is more difficult: FineFIX fixation
in fact seems to be the least conservative as very weak rRNA bands are present even after
1 hour of fixation, while methacarn fixation seems to preserve only 28S rRNA. This
contrasts with what is generally found for rRNA degradation process, where a more rapid
degradation of larger subunit is usually observed (Strand et al., 2007).
The following real-time gene expression analysis for the two housekeeping genes clearly
showed that the integrity results are consistent with the concomitant decrease of PCR
signal only for formalin fixed samples.
On the contrary, rRNA degradation seems not to correlate with mRNA integrity when cells
are fixed with the two alcohol-based fixatives. This result shows that conventional integrity
assessment approaches that rely on rRNA ratio are not reliable at all to predict the effective
accessibility of mRNA subpopulation to following analysis. This is consistent with what
was found by others (Imbeaud et al., 2005) who demonstrated the inconsistency of the
28S:18S ratio to assess RNA quality.
If we compare the effects of fixation on quantitative ratios, we notice that formalin fixation
determine a progressive overestimation of ATP5B and HPRT gene expression risults if
compared with the not-treated sample. Alterations in the quantitative ratio were already
observed (Godfrey et al., 2000; von Smolinski et al., 2005). These progressive Ct
differences may prevent the possibility to correlate the expression levels between genes in
84

Discussion
different samples because the detected differences could be the result of the fixation time
and not of real gene expression variations.
These differences could be due to increasing alterations determined by formalin at the
adenine level of the target sequence (Masuda et al., 1999). Moreover, it is conceivable that
in formalin fixation the progressive alterations of quantitative ratios are also determined by
the consistent loss of target mRNA. The low abundance of target mRNA, in fact, increases
the probability of random annealing of the primer to its template (“Montecarlo effect”)
(Bustin and Nolan, 2004).
This means that we can compare gene expression levels in material fixed in formalin for
different times only after a standardization of the degradation levels by means of a reliable
HKGs (Tricarico et al., 2002). In particular, it would be recommended to choose the
HKG/panel of HKGs on the basis of the expression levels of the target genes (Thellin et
al., 1999). This may reduce the quantitative alterations induced by the Montecarlo effect.
Although non crosslinking fixation should avoid sequence alterations, a modification in the
quantitative ratios was observed even for FineFIX and methacarnoy fixation. However
these alterations seem to be not correlated to the fixation time. This aspect could be
exploited when comparative gene expression analysis is performed between archival
samples of unknown or variable origin.
Furthermore, the interesting results found in this homogeneous model needs to be validated
in archival tissues. These experiments are in progress in our laboratory. In order to remove
operator variability during the fixation process, we are performing tissue fixation (with
formalin, FineFIX and methacarnoy) by ourselves applying the same prefixation
conditions. Tissues are collected in ice from the surgical theatre immediately after the
excision and then fixed. These specimens are then submitted to molecular analysis.
• Post-fixation
Even if few studies have deeply investigated this problem, it’s conceivable that oxidation
of tissue sections may decrease antigen recognition and may also have a similar effect on
nucleic acid recovery or retrival (Srinivasan et al., 2002). A recent work in fact showed
that RNA fragmentation in FFPE tissue continue to occur after specimens are dehydrated
and embedded in wax (Cronin et al., 2004). In our opinion this phenomenon could be
dependent on the quality of paraffin used for embedding, but the possibility of a partial
reactivation of endogenous RNases before embedding cannot be excluded. At the moment
experiments on very old blocks examined in comparison with recent inclusions can be
85
Discussion
performed only on formalin and methacarnoy fixed tissues because FineFIX has been
entering in the routinely hisotological practice in some institutions since 6-7 years.
3.1.2 Analytical phase
The analytical phase includes all the procedures that move from the cut of paraffin blocks
to the acquisition of molecular data.
• RNA extraction
If we refer to home-made procedures, no common protocols for RNA extraction (but even
for DNA and proteins) are used on FFPE tissues and every laboratory brings its own
experience, making the inter-laboratory comparison of results very difficult.
Even though all laboratories agree in the use of proteinase K-based protocol for RNA
estraction (Koch et al., 2006). The use of proteinase K is essential for a complete
solubilization of FFPE sections as this enzyme destroys proteins and allows the release of
RNA from the cross-linked matrix (Lewis et al., 2001; Masuda et al., 1999). Differences
are related to the time (from 12 to 72 hours) and temperature of digestion (45°C-65°C),
and for nucleic acid purification (classical phenol/chloroform ectraction or spin-column
based extraction). Perchè prot K(Lewis et al., 2001)
This specific technical problem will be handled in the next future by a comparison of the
methods among different laboratories of the IMPACTS group.
• RNA quantification
An accurate quantification of input RNA is essential when a reference gene validation
experiment must be performed before the gene expression analysis(Huggett et al., 2005).
In fact many reports have demonstrated that even the classic reference genes can vary
extensively depending on the specific experimental conditions (Dheda et al., 2004;
Tricarico et al., 2002), and the choice of an inappropriate reference gene can result in
unreal findings (Dheda et al., 2005). This is particularly worrying when gene expression
analysis is performed on clinical samples.
For this reason we compared three commonly used methods for total RNA quantification,
two spectrophotometric approaches and one fluorescent method. For this analysis the
already described cell line-based system was used.
From this experiments we deduced that the method of choice for quantification of RNA
from archived samples resulted the spectrophotometric approach. On the contrary, Agilent
Bioanalyzer results did not correlate with the others, for this reason we not consider it a
reliable quantification method.
86

Discussion
Besides, Nanodrop resulted more reliable than standard spectrophotometric method for
purity assessment: this is deduced looking at the 260/280nm ratio referred to the fresh
sample extracted with Trizol. As it was considered the “golden standard” specimen, a high
260/280nm value (>1.8) was expected in any case: this value was confirmed only by
Nanodrop measurement (1.93).
For all these reasons, in our opinion Nanodrop resulted the best choice. Furthermore, it’s
the most practical method and requires very low sample amount (1μl), which is very useful
when using FFPE and it’s very reproducible because no sample dilutions are necessary.
• Assessment of RNA degradation levels
Determining the integrity of RNA starting material is a critical step in gene expression
analysis, as RNA integrity may have a significant impact on expression results (Fleige et
al., 2006). Conventional electrophoretic methods, however, are often not sensitive enough
and disposed to interferences from contaminants present in the sample (Imbeaud et al.,
2005). The classical gel electrophoresis is highly sample consuming (this represents a
crucial problem when low amount of RNA is avalable, such as for microdissected samples
or small biopsies) and the visual assessment of 28S/18S bands is often subjective and
inaccurate.
In agreement with other reports (Dumur et al., 2004; Schoor et al., 2003; Schroeder et al.,
2006; Skrypina et al., 2003), our results on differentially fixed cells show that the mere
integrity analysis of total RNA from fixed samples by observation of 28S/18S subunits is
not informative about the effective accessibility of mRNA subpopulation. In our
experiments it was evident especially for alcoholic fixation.
In order to define the most accurate method for assessment of RNA degradation we
compared the results of the conventional electrophoretic gel with those obtained with
Agilent Bioanalyzer using RNA derived from non fixed and fixed cells.
Agilent results by rRNA “ratio method” gave results consistent with the electrophoretic
pattern, but not with the expression of the genes. For this reason we do not consider it a
reliable approach. Agilent results by visual and RIN methods were consistent with those
obtained with conventional gel electrophoresis, confirming the different patterns of
degradation for the different fixatives. This agrees with Nolan et al., who analysed
successfully RNA with unavailable RIN number even for long stretches of amplification
(Nolan et al., 2006). The authors reported in fact that the relationship between RIN number
and transcript quantity (by RT-PCR) was different for different tissues and there was not a
predictable relationship between these factors.
87

Discussion
Finally, the smear analysis correlated with the visual assessment but gave further useful
information about fragment distribution that were not easily derivable from the
electropherogram analysis. For this reason we consider this smear analysis the method of
choice to predict the performance of the following real-time quantitative PCR analysis.
This analysis in fact highlighted the real presence (even after prolonged fixation), of
fragments between 100 and 300 and between 500 and 3000 bases for FineFIX fixation and
between 3000 and 5000 bases for methacarnoy fixation. On the contrary, it confirmed the
strong degrading effects of formalin.
These hypotheses were also confirmed by the endpoint PCR-based approach that, together
with smear analysis, resulted the most suitable method for RNA degradation assessment.
Successful PCR amplification of long fragments (more than 600bp) in fact demonstrated
that RNA from cells treated with alcoholic fixatives is effectively more intact than that
extracted from formalin.
• DNase treatment
A frequent cause of false positives in RT-PCR is the amplification of contaminant genomic
DNA (gDNA) in RNA preparations. Because of the sensitivity of PCR technique, a single
copy of a genomic sequence can be theoretically detected; this phenomenon is exacerbated
when tested genes present non-functional pseudogenes at DNA level. Their sequences are
similar to mRNA, for this reason DNA removal by DNAse digestion is often a necessary
step.
In our experience we found that DNase treatment followed by heat inactivation in specific
conditions can be a good substitute to the more common phenol/chloroform extraction.
In our opinion it represents the method of choice when RNA is extracted from small or
microdissected samples because the precipitation step, with its low yield, is skipped
allowing a greater recovery of RNA.
We noticed that the presence of the inactivated DNase enzyme, its buffer and EDTA (at
low concentration) does not affect the subsequent RT-PCR analysis, as demonstrated by
the amplification curves.
The slight differences in Ct values obtained by the two methods may be due to the different
approaches that were used for the upstream quantification. The spectrophotometric
measurement of RNA after DNase treatment followed by heat inactivation was excluded as
the presence of the enzyme and buffer was shown to interfere with the reading.
Concentration in this case was determined taking into account the spectrophotometric
reading before treatment and the new final volume of reaction.
88

Discussion
• Reverse transcription
cDNA synthesis from RNA is a critical step in gene expression analysis and it’s a major
source of variability for all RT-PCR assays. Reverse transcription yields can vary up to
100-fold depending on reverse transcriptase (Stahlberg et al., 2004b), priming strategy
(Stahlberg et al., 2004a) and quantity of RNA used (Chandler et al., 1998), and the
variation can be also gene dependent (Stahlberg et al., 2004a; Stahlberg et al., 2004b). In
the use of RNA from FFPE samples this technical variability is further exacerbated by
intrinsic tissue heterogeneity, by the presence of inhibitory co-purified components (Nolan
et al., 2006) and by variable degradation pattern of extracted RNA. All these variables
explain the huge and contradictory results reported by different research groups working
on supposedly similar samples.
For all these reasons the use of the same extraction and RT strategy combined with the
same amount of starting material is important to obtain more comparable and reproducible
results.
In this study we tested the reproducibility and sensitivity of some reverse transcription
protocols in order to define the most efficient and reproducible approach for RT-PCR for
both high and low expressed genes in archive specimens.
The template protocol that we used for the comparison was taken from Godfrey at al
(Godfrey et al., 2000) as this procedure gave in our opinion a sensitive improvement of the
RT-PCR results. We think that the additional MgCl2 required by this protocol represents a
good expedient when previous DNase treatment was stopped by heat inactivation because
it compensates the kelating effects on Mg2+ by the residual EDTA in the RNA solution.
This priming strategy, involving the random hexamers, was compared with a new strategy
involving the random pentadecamers (Stangegaard et al., 2006). It has been shown in fact
that substitution of random hexamers with random pentadecamers can yield at least 2-fold
increment of cDNA in comparison with 6-mers use. In order to validate this hypothesis on
FFPE, we used low (0.167nmol/reaction, corresponding to the usual concentration of
random hexamers) and high (3.35 nmol/reaction, corresponding to the proposed
concentration of random pentadecamers) equimolar quantities of both random primers.
These combinations were finally compared with a “multiplex” AMV-based protocol, in
which a mix of specific reverse primers was used. It is well known that target specific
primers are the most specific and sensitive method to convert mRNA into cDNA (Lekanne
Deprez et al., 2002; Nolan et al., 2006), for this reason we included this strategy in our
experiment. However, the association of AMV with a single reverse primer requires
89

Discussion
separate priming reactions for each target genes. This could represent a problem if RNA
quantity is a limiting factor in the analysis as in FFPE tissues. For this reason we decided
to performe a variant of this approach using a mix of reverse primers. Our results
combining the sensitivity, efficiency and correlation confirmed that the best solution for
cDNA synthesis is the association of MMLV with both random primers. This finding also
shows that the higher sensitivity of the RT is not achieved by the use of random
pentadecamers but exclusively by the use of 20-fold more concentrated primers (both 6-
mers and 15-mers). Furthermore, this technical improvement is not gene-dependent (better
results were seen for the four target genes) but is strategy-dependent. This contrasts with
the results by Stahlberg et al (Stahlberg et al., 2004a), who found a high dependence of the
priming strategy efficiency on the tested gene. The low efficiency found for the
combination of AMV with the mix of specific primers could be due to an inhibitory effect
determined by this priming strategy. The same reaction, performed using four separate
reverse transcriptions (one specific primer per reaction) did not show this inhibition (data
not shown).
The use of random primers (at high concentration) instead of specific primers represent is
then recommended because the same reverse transcription reaction can be used for the
detection of several genes in the same sample. This is very convenient when starting
amount of RNA is very low, as in the case of FFPE or small biopsies.
• Quantification
Among the various methods for qRT-PCR, TaqMan assays with the dual-labeled
fluorescent probes are the most widely used, although SybrGreen assays have also been
successfully employed on FFPE (Abrahamsen et al., 2003). TaqMan chemistry is
considered the best choice for gene expression analysis in FFPE tissues because the use of
a specific probe reduces problems associated with nonspecific amplification and primer
dimer formation, and allows expression detection even when the target concentration is
very low (<1000 copies) (Nolan et al., 2006).
In this study we wanted to demonstrate whether a validated SybrGreen chemistry may be
used as a more economic substitute to TaqMan probe-based approach. This should be very
convenient when performing analysis on large case studies.
In order to reduce the variability between the two methods, the same primer sequences for
ATP5B and HPRT were used. A critical parameter was the amplicon length, that was
rigorously kept between 60 and 100bp for all the target genes. In these conditions in fact
90
Discussion
the amplification efficiency and sensitivity in FFPE are similar to those found in fresh
material (Lewis et al., 2001; Specht et al., 2001).
For SybrGreen chemistry, a strong validation of amplification conditions was performed. It
involved not only the primer concentration and the annealing temperature but also the
denaturation temperature of the whole PCR reaction (we noticed in our systems that
approximately 0.5 Ct can be gained once it’s optimized) and the fluorescence reading
temperature (the inclusion of this fourth step in PCR program considerably reduced the
primer dimer formation).
From this preliminary experiment, we can speculate that SybrGreen chemistry can
substitute TaqMan-based approach in gene expression analysis: the two methods overlap in
terms of efficiency, as already seen by others (Schmittgen et al., 2000), and in one case
SybrGreen chemistry is even more sensitive (see the results for HPRT gene). The lower
sensitivity of TaqMan approach in HPRT gene expression analysis may be due to aspecific
interactions of the probe with primer dimers, which reduces its availability for the specific
target amplification. However the wider dynamic range for TaqMan chemistry seems to
confirme that it remains the best choice when a reliable detection of even low copy number
genes (with Ct > 34) is required.
3.2 Future perspectives
The second IMPACTS meeting was organized in February 2008 in Munich.
In that occasion the results of the above-mentioned “home-made” protocols and the
experience of the other 20 laboratories have been deeply discussed from which the
preliminary guidelines of the most appropriate and reliable molecular methods on archival
material were proposed.
In this occasion other critical processes were discussed. For the pre-analytical treatment of
tissues, it has been decided to validate the procedure about the transportation of surgical
specimens from surgery to pathology in vacuum bag (Bussolati et al., 2008).
For the analytical phase, it has been proposed to uniform and validate the DNA and RNA
extraction protocols, as too many contrasting experiences emerged about these procedures.
Finally Prof. Giorgio Stanta, coordinator of the European project suggested starting with
the second and third part of the guidelines by collecting the list of the commercial kits from
all the laboratories, in order to compare their real effectiveness in archival material with
the reliability of the corresponding “home-made” protocols.
91
Discussion
3.3 Application of molecular methods to gene expression analysis in two archival case
studies
In this section of the study two archival case studies were collected for the quantification
of candidate biomarkers using the molecular approaches for gene expression analysis.
3.3.1 Breast cancer case study
Several clinical and pathological factors have been proposed to predict the recurrence of
breast cancer. However, at the present time it is not possible to predict recurrence versus
no recurrence at an individual level.. Different single molecular markers have been
assessed in the past 20 years, but failed to be considered for clinical use for various reasons
(Pusztai et al., 2006). Microarrays studies have identified expression profiles and gene sets
that are prognostic or predictive, or both for patients with breast cancer. Comparison of the
lists of genes derived from these studies shows only a slight overlap probably due to
differences in the cohorts of patients, microarray platforms and mathematical methods of
analysis (Fan et al., 2006). In the present study, carried out on 80 women with infiltrating
duct carcinoma of the breast, quantitative endpoint RT-PCR was performed for a set of 22
genes involved in cell senescence, malignant transformation and tumor suppression. This
study confirms our previous findings on the expression level of CDK2, CDK4 and
CDC25a in breast cancer progression (Bonin et al., 2006) (Bonin et al., 2006) and their
correlation with recurrences. As previously reported (Bonin et al., 2006), CDK2 over-
expression seems to have an influence on patient’s survival both by uni- and multi-variate
analysis, while data on CDC25a and survival were confirmed only by univariate analysis.
In our study, Cox proportional hazard analysis did not identify tumor stage as significantly
affecting survival in these patients (p= 0.1). Patients’ survival was analyzed by the Cox
proportional hazard regression method. Here only those genes that showed a significant
level of survival between the two groups are discussed.
Cox proportional hazard analysis identified different molecules involved in patients’
survival. In particular, our results showed that patients with a higher expression level of
HER2 and/or PI3K, and a lower expression level of AKT seem to have the worst outcome.
Our data agree with previous reports: it is well known that alteration in the PI3K/AKT
signalling cascade is common in human cancers and results in hyper-activation of the
pathway that leads to tumor progression (Fresno Vara et al., 2004). In particular, our data
associate a worse outcome to patients over-expressing HER2 and/or PI3K but not AKT.
The association of higher AKT3 mRNA expression level with better prognosis shown in
92

Discussion
our study is discordant with a previous paper (Tokunaga et al., 2006). A possible
explanation of this discrepancy is related to methodological issues, since Totunaka et al.,
detected AKT in its activated status, ie the expression of phosphorylated AKT by IHC.
Our results show that patients with high RAF-1 status had a decreased disease survival.
These data agree with previous findings by Mewani et al. (Mewani et al., 2006).
It is well documented that RB pathway plays a critical role in cell cycle progression (Sherr
and McCormick, 2002). Our latest results on RB expression level and survival indicate a
protective role of this molecule in breast cancer progression. Patients with high RB seem to
have a longer survival time. Our findings agree with Derenzini et al. (Derenzini et al.,
2007).
Moreover our data show that the CDK2 and RB expression levels, when combined
together are well able to predict patients’ survival. The fact that patients characterized by
high status of CDK2 and low status of RB presented a worse prognosis agrees with the role
of these molecules in progression of the cell cycle through the G1/S phase and even
indicated overcoming of this control checkpoint.
CK8 is characteristically present in luminal cells of a normal mammary gland. A wide
range of cytokeratin expression is often seen in invasive breast cancer, which may be
caused by loss of differentiation of the tumor cells (Su et al., 1996). In our study, higher
expression levels of CK8 were associated in Cox multivariate analysis with better
prognosis and CK8 has a protective influence on patients’ survival. Our data are
concordant with the investigation by Fuchs et al. (Fuchs et al., 2002) based on IHC in
breast carcinomas and breast cancer cell lines. In our case study, CK8 (at high expression
status) in association with HER2 (low expression status) identifies a group of patients with
better prognosis. In this group of patients the oestrogen receptor (ER) status was analysed
by RT-PCR as previously reported (Nardon et al., 2003). The group characterised by high
expression level of CK8 and low expression levels of HER2 were all positive for ER at
mRNA level. On the contrary, the other group, defined by the opposite pattern of the two
markers (high HER2 and low CK8 levels), presented very low or no expression levels of
the oestrogen receptor. These data agree with the recently reported molecular classification
of breast cancer (Perreard et al., 2006).
Of the 22 markers analysed in our study, 15 genes did not show influence on patients’
survival. Among them, telomerase components need a comment. This enzyme catalyzes
the de novo synthesis of telomere repeats, which is necessary for unlimited cellular
proliferation. The telomerase reverse transcriptase hTRT was detected at mRNA levels
93
Discussion
both in normal breast and breast cancer tissues (Hines et al., 2005). Recently, Salhab and
co-workers investigated the expression level of the key telomere related genes in human
breast cancer and found that hTRT levels predicted the patients’ overall survival (Salhab et
al., 2007). In our study we did not find any association among telomerase components
(hTR, the RNA template and hTRT, the catalytic component), pathological parameters and
patients’ survival. One possible explanation is the normalization methodology used by
Salhab. Indeed, the authors normalised the expression levels of the telomerase genes
against cytokeratin 19 (CK19) and not against one or more reliable housekeeping genes.
This could modify the expression level of the telomerase machinery according to level of
CK19 expressed in cancer epithelial cells. From our study it seems that telomerase
expression could be a prerequisite for the early phase of tumorigenesis rather than a
mechanism connected with progression. The presence and relative abundance of epithelial
cells expressing telomerase within normal breast tissues could suggest that breast tumors
arise from these highly expressing telomerase epithelial cells (Hines et al., 2005).
The molecular tumor progression analysed in the present study shows the natural history of
the disease, because the enrolled patients were only treated with the same type of surgical
therapy. Our findings strongly demonstrate that the combination of two pairs of
functionally conflicting markers (RB and CDK2 on one side, CK8 and HER2 on the other)
may be divided into subgroups that cover over 50% of the patients and these pairs of
markers are able to identify subgroups of patients with shorter relapse free and survival
times from those with long survival without recurrences. Groups characterised by low RB
and high CDK2 (27% of survival at 5 years and 14% at 10 years) as with low CK8 and
high HER2 (53% of survival at 5 years and 33% at 10 years) have a higher risk of early
recurrence and death, suggesting that breast cancer progression in these patients could be
related to these markers. Moreover, the recognition of these subgroups of patients with
higher risk of early relapse could have further relevance for the selection of patients to
submit to therapy against HER2 or also against CDK2 as possible therapy targets. On the
contrary, those with low CDK2 expression and high RB (68% of survival after 15 years),
and those with high CK8 and low HER2 (69% of survival after 15 years) present a very
good prognosis.
These promising results are preliminary because the real predictive value of these double
biomarker groups could result only from larger retrospective and prospectively randomised
studies. For this reason we recently enlarged this case study selecting further 200 duct
breast carcinomas from the Cattinara Hospital archives. From one point of view, this
94

Discussion
enriched case study will be useful to confirm the above-mentioned results on candidate
biomarker discovery. Meantime, the parallel use of the conventional approaches and the
technical advancements directly on large archival case studies will be critical to validate
their effective applicability in clinical practice.
Moreover, a possible use of IHC markers as surrogates for the reported genes could
represent a further simplification with the prospective of introducing them into routine
tumor management.
3.3.2 Adrenal gland tumor case study
Up to now, few clinical studies have accurately characterized the genetic and
histopathological backgrounds of cortical and medullary tumors because of their rarity. In
most cases, very limited case studies have been submitted to molecular investigations
(Lombardi et al., 2006; Slater et al., 2006; Thouennon et al., 2007)and results were not
comparable between different studies (Bernini et al., 2002).
With the collaboration with the Surgical Pathology Department of the University of
Padova, we collected 34 paraffin embedded samples deriving from 15 adenomas, 9
carcinomas and 10 benign pheochromocytomas. Manual microdissection was also
performed to isolate the peritumoral component from 5 of these samples.
Our preliminary study was focused on the examination of the angiogenetic pattern of these
tumors in order to elucidate its possible role in tumor classification. The impact of
angiogenesis on tumor progression of endocrine tumors is almost unknown (Favier et al.,
2002; Sasano et al., 1998). However, the hypothesis of its influence on their activity is
clearly supported by the fact that these endocrine tumors base most of their function on the
release of hormones into the vasculature.
In the first part of this preliminary study a gene expression analysis was performed on four
critical factors involved in the angiogenetic process in order to define the angiogenetic
pattern in these tumors, compared with the pattern in the healthy counterpart.
VEGFC and VEGFD ligands were included in our molecular analysis because they are
important regulators both for hematogenous and lymphatic metastasis, depending on their
interaction with VEGFR2 or FLT-4, respectively (Plate, 2001).
Our first results about the angiogenetic characterization of the adrenal gland tumors
showed that lower expression levels of the two receptors were present in carcinomas if
compared with adenomas. Conversely, adenomas show a wider range of expression levels
for all the considered genes, indicating probably that these two receptors do not have a
95
Discussion
critical role in the angiogenetic behaviour of this benign tumors. Furthermore, these
findings stress the hypothesis that a contribution of both receptors is essential for tumor
progression towards malignancy. These results contrast however with the
immunohistochemical data a recent report (Bernini et al., 2002), that described a higher
level of positive cells for FLT-4 in carcinoma if compared to adenoma. This may be due to
differences in the molecular approach used, considering the difficulty to evaluate
quantitatively the immunohistochemical results.
The level of expression of VEGFC is not different among the analysed group, so we
believe that it has not a critical role in tumoral neoangiogenesis. Conversely, VEGFD
could be an important factor in the progression towards malignancy, as significant
differences in its expression levels where detected in pheochromocytomas and carcinomas
when compared with the healthy counterpart.
From the expression analyses, pheochromocytomas presented a different pattern only from
the peritumoral component the benign adenoma. Significant differences were in fact
detected for FLT-4 and VEGFD when compared with adenomas and healthy component,
respectively. These results highlight a similar angiogenetic pattern between medullary
tumors and adrenocortical carcinomas.
When the expression levels of the four genes were correlated in the different pathological
groups of the case study a fine equilibrium was detected only in the peri-tumoral tissues. In
this group all the four target genes were reciprocally correlated (direct correlations were
found between VEGFR2 and VEGFC and VEGFD, r=+0.63 and r=0.71 respectively, while
inverse correlations were found between FLT-4 and EGFR2, VEGFC and VEGFD, r=-
0.72, r=-0.62 and r=-0.59, respectively; a strong direct correlation was found between
VEGFC and VEGFD). The negative correlation detected between FLT-4 and the two
ligands (VEGFC and VEGFD) could be explained with a negative effect on FTL-4 mRNA
expression from both the ligands. This is in disagreement with previous results (Roy et al.,
2006). This could be related to the complexity of the angiogenesis regulation process that
involves the coordinated interaction of many other inhibitory and stimulating factors. On
the contrary, both ligands seems to have a positive effect on VEGFR2 because of the
positive correlation detected. This fact agrees with the data reported in a recent
review(Olsson et al., 2006).
In the tumoral groups the previously reported equilibrium was completely lost, indicating
an effective alteration of the angiogenetic pattern. In particular, both in adenomas and
carcinomas a positive role in angiogenesis seemed to be played by the two receptors.
96

Discussion
However, their function seemed to be enhanced by either VEGFC, in adenomas, or
VEGFD, in carcinomas. It seemed that progression towards benign neoplasia was
promoted by the acquisition of a new positive interaction between VEGD and FLT-4.
Progression towards malignancy seems to require another molecular environment: in
carcinoma, in fact, the molecular pattern of the receptors seems to be mediated by the other
ligand, VEGFC. Both in adenomas and carcinomas the two receptors are the final positive
effectors. In pheochromocytomas the contribution of the two ligands is lost but a positive
correlation between the two receptors is still present. This stresses the critical role played
by these two candidate markers in the tumoral angiogenetic process in both the medullary
and adrenocortical tissue.
In order to elucidate if the altered gene expression levels of these angiogenetic factors may
have real contribution on the angiogenetic pattern, we compared the mRNA expression
levels of the four genes with the microvessel density. Recent studies have demonstrated
that MVD may be used as biomarker for detection of tumor recurrences or as surrogate
biomarker for the efficacy of the antiangiogenetic therapy (O'Byrne et al., 2000; Singhal et
al., 1999). However, the extreme variability of the procedures used for MVD count,
prevent its reliable use in clinical practice (Choi et al., 2005). For MVD count we used the
most common procedure found in literature, consisting of a first inspection of the slide at
low-power magnification, followed by the vessel count in the three most vascularized areas
(“hot spots”) at high-power magnification (Mohammed et al., 2007).
A strong correlation between MVD and the transcriptional levels of three angiogenetic
factors (with the exception of VEGFC) was found only in the carcinoma group, showing
that an abnormal activation of these factors is apparently necessary in adrenocortical
cancer for the progression towards malignancy. In the other tumoral groups the absence of
correlations between the angiogenetic factors and the vessel density could be due to the
secondary role that angiogenesis play in the development of these benign tumors.
Our results strongly demonstrate the presence of differences in the expression pattern of
the analysed genes in the different groups analysed. Our data highlighted that there is a
different behaviour at the mRNA level for the angiogenetic markers in the difeerent
pathologies of the adrenal gland. Moreover in the carcinoma group the molecular findings
correlated also with the MVD measurement. Our findings, however, need to be confirmed
by the analysis of a greater amount of samples, that for these rare pathologies is really
difficult to recruit. In any case our study agree with a previous report (Chrisoulidou et al.,
97

Discussion
2007) that stressed the importance for these tumors to combine immunohistochemical and
molecular markers for a sound earlier diagnosis.
98
Conclusions
CONCLUSIONS
Diagnostic and prognostic approaches in traditional medicine are not sufficient to predict
the clinical behaviour of tumors with the same stage and grade.
An appropriate application of molecular methods to study cancer processes at cellular and
at molecular level, also known as molecular medicine, could overcome these limitations.
Clinically useful biomarkers represent the successful application of molecular methods to
clinical practice, opening the door to a more personalized vision of medicine. However,
insufficient expertise at clinical level in the use of molecular methods, the high complexity
of human biospecimens and their inappropriate collection for clinical studies prevent a
significant introduction of biomarkers in the clinical practice.
Our laboratory, thanks to the possibility to access the fresh and archival samples from
hospitals, can investigate these technical problems directly on clinical material, and can use
them in several molecular analysis on clinical case studies. My PhD thesis is connected
with this line of research. The thesis can be divided into three parts.
1. The first part is focused on the validation of alternative molecular methods of RNA
extraction and PCR product detection for expression analysis directly in biological fluids
and especially in urine samples.
• We developed an experimental spin column-based RNA extraction kit that, because of
its higher sensitivity and efficiency, could be able to replace the more time-consuming
guanidinium-based protocol.
• We found that it can be used also as a more economic alternative to the commercial
silica-based kit. These evidences could make our experimental prototype a valid
approach for the standardized diagnostics.
• The next step involved the validation of a colorimetric approach that could overcome
the problems associated to the use of radioactive material for PCR product detection
after a conventional end-point PCR. We found that the so-called ELOSA method, due
to its high sensitivity at low mRNA concentrations, may represent a good substitute for
the isotope-based approach in gene expression analysis. Technical limitations
connected with the narrow dynamic range of this detection approach and the rapid
target gene-dependent expiration of probes make further experiments to validate its use
in clinical practice necessary.
99

Conclusions
2. The second part of my thesis is developed in the context of the European project called
“Archive tissues: improving molecular medicine research and clinical practice-
IMPACTS”. My work is focused on the exploration and optimization of several molecular
approaches for gene expression analysis (from pre-analytical to analytical treatment of
FFPE) that can limit the use of archival tissues in clinical practice.
• Formalin fixation has detrimental effects on both quantity and quality of RNA. With
prolonged fixation, a rapid decrement in RNA yield is observed, followed by a
progressive RNA degradation that involves both rRNA and mRNA species. These
effects on RNA are confirmed by gene expression experiments, in which the levels of
degradation are time-dependent and either prevent detection of low expressed genes or
alter significantly the quantitative ratios between different target mRNA. Therefore,
when formalin is used for fixation, a rigorous normalization with the proper set of
HKGs is required. Alcoholic fixatives (FineFIX and methacarnoy) are quantitatively
and qualitatively more conservative than formalin. This is more evident for mRNA,
while rRNA seems to undergo a rapid degradation. This is evident from the gene
expression analysis, where alterations of gene expression ratios are not time-dependent.
For this reason they can be considered the best choice when small clinical samples
have to be used for a reliable gene expression analysis.
• The most accurate method for total RNA quantification is Nanodrop. Its results are in
line with those of the conventional spectrophotometer but it’s more sensitive, practical
and reproducible. Furthermore, it’s also more accurate for quality assessment. These
are very important requirements when a large number of clinical sample have to be
quantified.
• The use of the smear analysis by Agilent Bioanalyzer and the endpoint RT-PCR on
fragments of increasing length is recommended for the detection of RNA degradation
levels when tissues are fixed both in formalin and alcoholic fixatives. For formalin
fixation, the approaches that base their analysis on the evaluation of the rRNA ratio are
not valid because the good quality of rRNAs overestimate the real accessibility of
mRNA for the subsequent gene expression analysis. Conversely, for alcoholic fixation
the rRNA ratio method may underestimate the effective availability of mRNA for
successful amplifications.
• DNase treatment followed by heat inactivation can be used as a valid alternative for the
more classical extraction-based approach. It gives good results in gene expression
100
Conclusions
analysis but avoids the loss of RNA during the extraction step. It’s the best choice
when small amounts of RNA are available.
• The use of MMLV enzyme with random primers (both 6-mers and 15-mers) at high
concentration represent the most efficient and sensitive combination for the reverse
transcription step. This is an optimal method when using small clinical samples
because the same cDNA solution can be used for more than one amplification.
• SybrGreen chemistry can be used as a substitute of the TaqMan probe-based approach
for gene expression analysis because of its high sensitivity and reproducibility.
However, when very low expression levels must be detected (Ct>34) TaqMan
approach still remain the best choice.
• The further inter-laboratory validation and standardization of these molecular
approaches for gene expression analysis in archival tissues will be essential for the
definition of the European guidelines for a reliable and reproducible use of molecular
methods in clinical practice.
3. The third part of my thesis is focused on the clinical application of molecular approaches
for quantification of candidate biomarkers in two archival case studies.
• In the breast cancer case study we found that a panel of 7 genes is associated to
patients’ survival, while the combination of two couples of genes is able to define
short and long living cohorts of patients. In particular, we found that RB and CDK2 on
one side and CK8 and HER2 on the other may affect the clinical course of the disease
in 56% of patients. Groups characterised by low RB and high CDK2 as with low CK8
and high HER2 have a higher risk of recurrences and death in five years. The
identification of these subgroups of patients with higher risk of early relapse could
have further involvement in the selection of the cases to submit to therapy against
HER2 or CDK2 as possible therapy target.
• In the rare adrenal gland tumor case study, composed by 34 specimens, we found that
adenoma and carcinoma are molecularly different, and these differences are determined
by the presence of the angiogenetic receptors. Pheochromocytoma seems to be
molecularly more similar to the adrenal carcinoma. The fine equilibrium among the
angiogenetic factors has a key role in the maintenance of a physiologic angiogenetic
pattern only in peritumoral tissues. In the progression towards malignancy this
equilibrium is lost, but the two receptors remain important in tumor malignancy.
Tumoral neoangiogenesis seems to be connected to a deregulation of the VEGF
101

Conclusions
pathway only in the adrenocortical carcinoma, while in the other tumoral groups it
seems to play a secondary role.
102

ACKNOWLEDGEMENTS
First of all I would like to thank my Supervisor, Prof. Giorgio Stanta, for giving me the
opportunity of working in his lab and for encouraging me in this motivating research area.
Thank you to my “old” and brand new collegues. I’m especially grateful to Serena and
Ermanno for providing me they constant support during the preparation of the thesis, and
to Elena, Francesca, Giorgio, Mari, Stefano and Vale for offering me a stimulating
environment in which to grow.
Finally I have to say thank you to my family and to all my friends for supporting me during
these years.
103
References
REFERENCES (2001). Biomarkers and surrogate endpoints: preferred definitions and conceptual framework. Clin Pharmacol Ther 69, 89-95. Abrahamsen, H.N., Steiniche, T., Nexo, E., Hamilton-Dutoit, S.J., and Sorensen, B.S. (2003). Towards quantitative mRNA analysis in paraffin-embedded tissues using real-time reverse transcriptase-polymerase chain reaction: a methodological study on lymph nodes from melanoma patients. J Mol Diagn 5, 34-41. Achen, M.G., Jeltsch, M., Kukk, E., Makinen, T., Vitali, A., Wilks, A.F., Alitalo, K., and Stacker, S.A. (1998). Vascular endothelial growth factor D (VEGF-D) is a ligand for the tyrosine kinases VEGF receptor 2 (Flk1) and VEGF receptor 3 (Flt4). Proc Natl Acad Sci U S A 95, 548-553. Anderson, N.L. (2005). The roles of multiple proteomic platforms in a pipeline for new diagnostics. Mol Cell Proteomics 4, 1441-1444. Anderson, N.L., and Anderson, N.G. (2002). The human plasma proteome: history, character, and diagnostic prospects. Mol Cell Proteomics 1, 845-867. Anderson, W.F., Chatterjee, N., Ershler, W.B., and Brawley, O.W. (2002). Estrogen receptor breast cancer phenotypes in the Surveillance, Epidemiology, and End Results database. Breast Cancer Res Treat 76, 27-36. Aoyagi, K., Tatsuta, T., Nishigaki, M., Akimoto, S., Tanabe, C., Omoto, Y., Hayashi, S., Sakamoto, H., Sakamoto, M., Yoshida, T., et al. (2003). A faithful method for PCR-mediated global mRNA amplification and its integration into microarray analysis on laser-captured cells. Biochem Biophys Res Commun 300, 915-920. Barrett, C., Brett, F., Grehan, D., and McDermott, M.B. (2004). Heat-accelerated fixation and rapid dissection of the pediatric brain at autopsy: a pragmatic approach to the difficulties of organ retention. Pediatr Dev Pathol 7, 595-600. Beerepoot, L.V., Mehra, N., Vermaat, J.S., Zonnenberg, B.A., Gebbink, M.F., and Voest, E.E. (2004). Increased levels of viable circulating endothelial cells are an indicator of progressive disease in cancer patients. Ann Oncol 15, 139-145. Bernini, G.P., Moretti, A., Bonadio, A.G., Menicagli, M., Viacava, P., Naccarato, A.G., Iacconi, P., Miccoli, P., and Salvetti, A. (2002). Angiogenesis in human normal and pathologic adrenal cortex. J Clin Endocrinol Metab 87, 4961-4965. Bittner, M., Meltzer, P., Chen, Y., Jiang, Y., Seftor, E., Hendrix, M., Radmacher, M., Simon, R., Yakhini, Z., Ben-Dor, A., et al. (2000). Molecular classification of cutaneous malignant melanoma by gene expression profiling. Nature 406, 536-540. Bonin, S., Brunetti, D., Benedetti, E., Dotti, I., Gorji, N., and Stanta, G. (2008). Molecular characterisation of breast cancer patients at high and low recurrence risk. Virchows Arch. Bonin, S., Brunetti, D., Benedetti, E., Gorji, N., and Stanta, G. (2006). Expression of cyclin-dependent kinases and CDC25a phosphatase is related with recurrences and survival in women with peri- and post-menopausal breast cancer. Virchows Arch 448, 539-544. Bonnen, P.E., Wang, P.J., Kimmel, M., Chakraborty, R., and Nelson, D.L. (2002). Haplotype and linkage disequilibrium architecture for human cancer-associated genes. Genome Res 12, 1846-1853. Bono, A.V., Celato, N., Cova, V., Salvadore, M., Chinetti, S., and Novario, R. (2002). Microvessel density in prostate carcinoma. Prostate Cancer Prostatic Dis 5, 123-127. Bravo, E.L. (1994). Evolving concepts in the pathophysiology, diagnosis, and treatment of pheochromocytoma. Endocr Rev 15, 356-368. Bussolati, G., Chiusa, L., Cimino, A., and D'Armento, G. (2008). Tissue transfer to pathology labs: under vacuum is the safe alternative to formalin. Virchows Arch 452, 229-231. Bustin, S.A., and Nolan, T. (2004). Pitfalls of quantitative real-time reverse-transcription polymerase chain reaction. J Biomol Tech 15, 155-166. Canevari, S., Gariboldi, M., Reid, J.F., Bongarzone, I., and Pierotti, M.A. (2006). Molecular predictors of response and outcome in ovarian cancer. Crit Rev Oncol Hematol 60, 19-37. Chandler, D.P., Wagnon, C.A., and Bolton, H., Jr. (1998). Reverse transcriptase (RT) inhibition of PCR at low concentrations of template and its implications for quantitative RT-PCR. Appl Environ Microbiol 64, 669-677. Chang, B.L., Zheng, S.L., Isaacs, S.D., Turner, A., Hawkins, G.A., Wiley, K.E., Bleecker, E.R., Walsh, P.C., Meyers, D.A., Isaacs, W.B., et al. (2003a). Polymorphisms in the CYP1A1 gene are associated with prostate cancer risk. Int J Cancer 106, 375-378. Chang, J.C., Wooten, E.C., Tsimelzon, A., Hilsenbeck, S.G., Gutierrez, M.C., Elledge, R., Mohsin, S., Osborne, C.K., Chamness, G.C., Allred, D.C., et al. (2003b). Gene expression profiling for the prediction of therapeutic response to docetaxel in patients with breast cancer. Lancet 362, 362-369.
104
References
Ching, T.T., Maunakea, A.K., Jun, P., Hong, C., Zardo, G., Pinkel, D., Albertson, D.G., Fridlyand, J., Mao, J.H., Shchors, K., et al. (2005). Epigenome analyses using BAC microarrays identify evolutionary conservation of tissue-specific methylation of SHANK3. Nat Genet 37, 645-651. Choi, W.W., Lewis, M.M., Lawson, D., Yin-Goen, Q., Birdsong, G.G., Cotsonis, G.A., Cohen, C., and Young, A.N. (2005). Angiogenic and lymphangiogenic microvessel density in breast carcinoma: correlation with clinicopathologic parameters and VEGF-family gene expression. Mod Pathol 18, 143-152. Chomczynski, P., and Sacchi, N. (2006). The single-step method of RNA isolation by acid guanidinium thiocyanate-phenol-chloroform extraction: twenty-something years on. Nat Protoc 1, 581-585. Chrisoulidou, A., Kaltsas, G., Ilias, I., and Grossman, A.B. (2007). The diagnosis and management of malignant phaeochromocytoma and paraganglioma. Endocr Relat Cancer 14, 569-585. Christoph, F., Muller, M., Schostak, M., Soong, R., Tabiti, K., and Miller, K. (2004). Quantitative detection of cytokeratin 20 mRNA expression in bladder carcinoma by real-time reverse transcriptase-polymerase chain reaction. Urology 64, 157-161. Chung, C.H., Levy, S., Chaurand, P., and Carbone, D.P. (2007). Genomics and proteomics: emerging technologies in clinical cancer research. Crit Rev Oncol Hematol 61, 1-25. Cox, M.L., Schray, C.L., Luster, C.N., Stewart, Z.S., Korytko, P.J., KN, M.K., Paulauskis, J.D., and Dunstan, R.W. (2006). Assessment of fixatives, fixation, and tissue processing on morphology and RNA integrity. Exp Mol Pathol 80, 183-191. Cristofanilli, M., Budd, G.T., Ellis, M.J., Stopeck, A., Matera, J., Miller, M.C., Reuben, J.M., Doyle, G.V., Allard, W.J., Terstappen, L.W., et al. (2004). Circulating tumor cells, disease progression, and survival in metastatic breast cancer. N Engl J Med 351, 781-791. Cronin, M., Pho, M., Dutta, D., Stephans, J.C., Shak, S., Kiefer, M.C., Esteban, J.M., and Baker, J.B. (2004). Measurement of gene expression in archival paraffin-embedded tissues: development and performance of a 92-gene reverse transcriptase-polymerase chain reaction assay. Am J Pathol 164, 35-42. Cross, S.S., Start, R.D., and Smith, J.H. (1990). Does delay in fixation affect the number of mitotic figures in processed tissue? J Clin Pathol 43, 597-599. Datson, N.A., van der Perk-de Jong, J., van den Berg, M.P., de Kloet, E.R., and Vreugdenhil, E. (1999). MicroSAGE: a modified procedure for serial analysis of gene expression in limited amounts of tissue. Nucleic Acids Res 27, 1300-1307. de Jong, J.S., van Diest, P.J., and Baak, J.P. (2000). Hot spot microvessel density and the mitotic activity index are strong additional prognostic indicators in invasive breast cancer. Histopathology 36, 306-312. de Lange, T. (1994). Activation of telomerase in a human tumor. Proc Natl Acad Sci U S A 91, 2882-2885. Delfour, C., Roger, P., Bret, C., Berthe, M.L., Rochaix, P., Kalfa, N., Raynaud, P., Bibeau, F., Maudelonde, T., and Boulle, N. (2006). RCL2, a new fixative, preserves morphology and nucleic acid integrity in paraffin-embedded breast carcinoma and microdissected breast tumor cells. J Mol Diagn 8, 157-169. Derenzini, M., Montanaro, L., Vici, M., Barbieri, S., Ceccarelli, C., Santini, D., Taffurelli, M., Martinelli, G.N., and Trere, D. (2007). Relationship between the RB1 mRNA level and the expression of phosphorylated RB protein in human breast cancers: their relevance in cell proliferation activity and patient clinical outcome. Histology and histopathology 22, 505-513. Dheda, K., Huggett, J.F., Bustin, S.A., Johnson, M.A., Rook, G., and Zumla, A. (2004). Validation of housekeeping genes for normalizing RNA expression in real-time PCR. Biotechniques 37, 112-114, 116, 118-119. Dheda, K., Huggett, J.F., Chang, J.S., Kim, L.U., Bustin, S.A., Johnson, M.A., Rook, G.A., and Zumla, A. (2005). The implications of using an inappropriate reference gene for real-time reverse transcription PCR data normalization. Anal Biochem 344, 141-143. Dietel, M., and Sers, C. (2006). Personalized medicine and development of targeted therapies: The upcoming challenge for diagnostic molecular pathology. A review. Virchows Arch 448, 744-755. Douglas, M.P., and Rogers, S.O. (1998). DNA damage caused by common cytological fixatives. Mutat Res 401, 77-88. Dumur, C.I., Nasim, S., Best, A.M., Archer, K.J., Ladd, A.C., Mas, V.R., Wilkinson, D.S., Garrett, C.T., and Ferreira-Gonzalez, A. (2004). Evaluation of quality-control criteria for microarray gene expression analysis. Clin Chem 50, 1994-2002. Dunn, W.B., Bailey, N.J., and Johnson, H.E. (2005). Measuring the metabolome: current analytical technologies. Analyst 130, 606-625. Ellis, L.M., and Fidler, I.J. (1996). Angiogenesis and metastasis. Eur J Cancer 32A, 2451-2460. Elston, C.W., and Ellis, I.O. (1991). Pathological prognostic factors in breast cancer. I. The value of histological grade in breast cancer: experience from a large study with long-term follow-up. Histopathology 19, 403-410. Esteller, M. (2005). DNA methylation and cancer therapy: new developments and expectations. Curr Opin Oncol 17, 55-60. Fan, C., Oh, D.S., Wessels, L., Weigelt, B., Nuyten, D.S., Nobel, A.B., van't Veer, L.J., and Perou, C.M. (2006). Concordance among gene-expression-based predictors for breast cancer. N Engl J Med 355, 560-569.
105

References
Favier, J., Plouin, P.F., Corvol, P., and Gasc, J.M. (2002). Angiogenesis and vascular architecture in pheochromocytomas: distinctive traits in malignant tumors. Am J Pathol 161, 1235-1246. Fleige, S., Walf, V., Huch, S., Prgomet, C., Sehm, J., and Pfaffl, M.W. (2006). Comparison of relative mRNA quantification models and the impact of RNA integrity in quantitative real-time RT-PCR. Biotechnol Lett 28, 1601-1613. Fresno Vara, J.A., Casado, E., de Castro, J., Cejas, P., Belda-Iniesta, C., and Gonzalez-Baron, M. (2004). PI3K/Akt signalling pathway and cancer. Cancer Treat Rev 30, 193-204. Fuchs, I.B., Lichtenegger, W., Buehler, H., Henrich, W., Stein, H., Kleine-Tebbe, A., and Schaller, G. (2002). The prognostic significance of epithelial-mesenchymal transition in breast cancer. Anticancer research 22, 3415-3419. Gelmini, S., Crisci, A., Salvadori, B., Pazzagli, M., Selli, C., and Orlando, C. (2000). Comparison of telomerase activity in bladder carcinoma and exfoliated cells collected in urine and bladder washings, using a quantitative assay. Clin Cancer Res 6, 2771-2776. Gelmini, S., Quattrone, S., Malentacchi, F., Villari, D., Travaglini, F., Giannarini, G., Della Melina, A., Pazzagli, M., Nicita, G., Selli, C., et al. (2007). Tankyrase-1 mRNA expression in bladder cancer and paired urine sediment: preliminary experience. Clin Chem Lab Med 45, 862-866. Gillespie, J.W., Best, C.J., Bichsel, V.E., Cole, K.A., Greenhut, S.F., Hewitt, S.M., Ahram, M., Gathright, Y.B., Merino, M.J., Strausberg, R.L., et al. (2002). Evaluation of non-formalin tissue fixation for molecular profiling studies. Am J Pathol 160, 449-457. Gloghini, A., Canal, B., Klein, U., Dal Maso, L., Perin, T., Dalla-Favera, R., and Carbone, A. (2004). RT-PCR analysis of RNA extracted from Bouin-fixed and paraffin-embedded lymphoid tissues. J Mol Diagn 6, 290-296. Godfrey, T.E., Kim, S.H., Chavira, M., Ruff, D.W., Warren, R.S., Gray, J.W., and Jensen, R.H. (2000). Quantitative mRNA expression analysis from formalin-fixed, paraffin-embedded tissues using 5' nuclease quantitative reverse transcription-polymerase chain reaction. J Mol Diagn 2, 84-91. Godovac-Zimmermann, J., and Brown, L.R. (2001). Perspectives for mass spectrometry and functional proteomics. Mass Spectrom Rev 20, 1-57. Gygi, S.P., Corthals, G.L., Zhang, Y., Rochon, Y., and Aebersold, R. (2000). Evaluation of two-dimensional gel electrophoresis-based proteome analysis technology. Proc Natl Acad Sci U S A 97, 9390-9395. Harnden, P., Allam, A., Joyce, A.D., Patel, A., Selby, P., and Southgate, J. (1995). Cytokeratin 20 expression by non-invasive transitional cell carcinomas: potential for distinguishing recurrent from non-recurrent disease. Histopathology 27, 169-174. Hatada, I., Hayashizaki, Y., Hirotsune, S., Komatsubara, H., and Mukai, T. (1991). A genomic scanning method for higher organisms using restriction sites as landmarks. Proc Natl Acad Sci U S A 88, 9523-9527. Hayes, D.N., Monti, S., Parmigiani, G., Gilks, C.B., Naoki, K., Bhattacharjee, A., Socinski, M.A., Perou, C., and Meyerson, M. (2006). Gene expression profiling reveals reproducible human lung adenocarcinoma subtypes in multiple independent patient cohorts. J Clin Oncol 24, 5079-5090. Herman, J.G., Graff, J.R., Myohanen, S., Nelkin, B.D., and Baylin, S.B. (1996). Methylation-specific PCR: a novel PCR assay for methylation status of CpG islands. Proc Natl Acad Sci U S A 93, 9821-9826. Hines, W.C., Fajardo, A.M., Joste, N.E., Bisoffi, M., and Griffith, J.K. (2005). Quantitative and spatial measurements of telomerase reverse transcriptase expression within normal and malignant human breast tissues. Mol Cancer Res 3, 503-509. Hlatky, L., Hahnfeldt, P., and Folkman, J. (2002). Clinical application of antiangiogenic therapy: microvessel density, what it does and doesn't tell us. J Natl Cancer Inst 94, 883-893. Holland, N.T., Smith, M.T., Eskenazi, B., and Bastaki, M. (2003). Biological sample collection and processing for molecular epidemiological studies. Mutat Res 543, 217-234. Hoon, D.S., Bostick, P., Kuo, C., Okamoto, T., Wang, H.J., Elashoff, R., and Morton, D.L. (2000). Molecular markers in blood as surrogate prognostic indicators of melanoma recurrence. Cancer Res 60, 2253-2257. Hoque, M.O., Lee, C.C., Cairns, P., Schoenberg, M., and Sidransky, D. (2003). Genome-wide genetic characterization of bladder cancer: a comparison of high-density single-nucleotide polymorphism arrays and PCR-based microsatellite analysis. Cancer Res 63, 2216-2222. Huang, J., Qi, R., Quackenbush, J., Dauway, E., Lazaridis, E., and Yeatman, T. (2001). Effects of ischemia on gene expression. J Surg Res 99, 222-227. Huggett, J., Dheda, K., Bustin, S., and Zumla, A. (2005). Real-time RT-PCR normalisation; strategies and considerations. Genes Immun 6, 279-284. Imbeaud, S., Graudens, E., Boulanger, V., Barlet, X., Zaborski, P., Eveno, E., Mueller, O., Schroeder, A., and Auffray, C. (2005). Towards standardization of RNA quality assessment using user-independent classifiers of microcapillary electrophoresis traces. Nucleic Acids Res 33, e56. Inoue, T., Nakanishi, H., Inada, K., Hioki, T., Tatematsu, M., and Sugimura, Y. (2001). Real time reverse transcriptase polymerase chain reaction of urinary cytokeratin 20 detects transitional cell carcinoma cells. J Urol 166, 2134-2141.
106
References
Janne, P.A., Li, C., Zhao, X., Girard, L., Chen, T.H., Minna, J., Christiani, D.C., Johnson, B.E., and Meyerson, M. (2004). High-resolution single-nucleotide polymorphism array and clustering analysis of loss of heterozygosity in human lung cancer cell lines. Oncogene 23, 2716-2726. Jones, M.B., Krutzsch, H., Shu, H., Zhao, Y., Liotta, L.A., Kohn, E.C., and Petricoin, E.F., 3rd (2002). Proteomic analysis and identification of new biomarkers and therapeutic targets for invasive ovarian cancer. Proteomics 2, 76-84. Joukov, V., Pajusola, K., Kaipainen, A., Chilov, D., Lahtinen, I., Kukk, E., Saksela, O., Kalkkinen, N., and Alitalo, K. (1996). A novel vascular endothelial growth factor, VEGF-C, is a ligand for the Flt4 (VEGFR-3) and KDR (VEGFR-2) receptor tyrosine kinases. EMBO J 15, 290-298. Jurinke, C., Oeth, P., and van den Boom, D. (2004). MALDI-TOF mass spectrometry: a versatile tool for high-performance DNA analysis. Mol Biotechnol 26, 147-164. Kahn, H.J., Presta, A., Yang, L.Y., Blondal, J., Trudeau, M., Lickley, L., Holloway, C., McCready, D.R., Maclean, D., and Marks, A. (2004). Enumeration of circulating tumor cells in the blood of breast cancer patients after filtration enrichment: correlation with disease stage. Breast Cancer Res Treat 86, 237-247. Kallioniemi, O.P., Kallioniemi, A., Piper, J., Isola, J., Waldman, F.M., Gray, J.W., and Pinkel, D. (1994). Optimizing comparative genomic hybridization for analysis of DNA sequence copy number changes in solid tumors. Genes Chromosomes Cancer 10, 231-243. Kelloff, G.J., Bast, R.C., Jr., Coffey, D.S., D'Amico, A.V., Kerbel, R.S., Park, J.W., Ruddon, R.W., Rustin, G.J., Schilsky, R.L., Sigman, C.C., et al. (2004). Biomarkers, surrogate end points, and the acceleration of drug development for cancer prevention and treatment: an update prologue. Clin Cancer Res 10, 3881-3884. Kobayashi, S., Boggon, T.J., Dayaram, T., Janne, P.A., Kocher, O., Meyerson, M., Johnson, B.E., Eck, M.J., Tenen, D.G., and Halmos, B. (2005). EGFR mutation and resistance of non-small-cell lung cancer to gefitinib. N Engl J Med 352, 786-792. Koch, I., Slotta-Huspenina, J., Hollweck, R., Anastasov, N., Hofler, H., Quintanilla-Martinez, L., and Fend, F. (2006). Real-time quantitative RT-PCR shows variable, assay-dependent sensitivity to formalin fixation: implications for direct comparison of transcript levels in paraffin-embedded tissues. Diagn Mol Pathol 15, 149-156. Kononen, J., Bubendorf, L., Kallioniemi, A., Barlund, M., Schraml, P., Leighton, S., Torhorst, J., Mihatsch, M.J., Sauter, G., and Kallioniemi, O.P. (1998). Tissue microarrays for high-throughput molecular profiling of tumor specimens. Nat Med 4, 844-847. Kurahara, H., Takao, S., Maemura, K., Shinchi, H., Natsugoe, S., and Aikou, T. (2004). Impact of vascular endothelial growth factor-C and -D expression in human pancreatic cancer: its relationship to lymph node metastasis. Clin Cancer Res 10, 8413-8420. Launonen, V., Mannermaa, A., Stenback, F., Kosma, V.M., Puistola, U., Huusko, P., Anttila, M., Bloigu, R., Saarikoski, S., Kauppila, A., et al. (2000). Loss of heterozygosity at chromosomes 3, 6, 8, 11, 16, and 17 in ovarian cancer: correlation to clinicopathological variables. Cancer Genet Cytogenet 122, 49-54. Lee, D.H., Yang, S.C., Hong, S.J., Chung, B.H., and Kim, I.Y. (1998). Telomerase: a potential marker of bladder transitional cell carcinoma in bladder washes. Clin Cancer Res 4, 535-538. Lee, K.Y., Shibutani, M., Inoue, K., Kuroiwa, K., U, M., Woo, G.H., and Hirose, M. (2006). Methacarn fixation--effects of tissue processing and storage conditions on detection of mRNAs and proteins in paraffin-embedded tissues. Anal Biochem 351, 36-43. Lehmann, U., and Kreipe, H. (2001). Real-time PCR analysis of DNA and RNA extracted from formalin-fixed and paraffin-embedded biopsies. Methods 25, 409-418. Lekanne Deprez, R.H., Fijnvandraat, A.C., Ruijter, J.M., and Moorman, A.F. (2002). Sensitivity and accuracy of quantitative real-time polymerase chain reaction using SYBR green I depends on cDNA synthesis conditions. Anal Biochem 307, 63-69. Lewis, F., Maughan, N.J., Smith, V., Hillan, K., and Quirke, P. (2001). Unlocking the archive--gene expression in paraffin-embedded tissue. J Pathol 195, 66-71. Liotta, L.A., Espina, V., Mehta, A.I., Calvert, V., Rosenblatt, K., Geho, D., Munson, P.J., Young, L., Wulfkuhle, J., and Petricoin, E.F., 3rd (2003). Protein microarrays: meeting analytical challenges for clinical applications. Cancer Cell 3, 317-325. Lombardi, C.P., Raffaelli, M., Pani, G., Maffione, A., Princi, P., Traini, E., Galeotti, T., Rossi, E.D., Fadda, G., and Bellantone, R. (2006). Gene expression profiling of adrenal cortical tumors by cDNA macroarray analysis. Results of a preliminary study. Biomed Pharmacother 60, 186-190. Lu, J., Getz, G., Miska, E.A., Alvarez-Saavedra, E., Lamb, J., Peck, D., Sweet-Cordero, A., Ebert, B.L., Mak, R.H., Ferrando, A.A., et al. (2005). MicroRNA expression profiles classify human cancers. Nature 435, 834-838. Ludwig, J.A., and Weinstein, J.N. (2005). Biomarkers in cancer staging, prognosis and treatment selection. Nat Rev Cancer 5, 845-856. Lykidis, D., Van Noorden, S., Armstrong, A., Spencer-Dene, B., Li, J., Zhuang, Z., and Stamp, G.W. (2007). Novel zinc-based fixative for high quality DNA, RNA and protein analysis. Nucleic Acids Res 35, e85.
107

References
Macabeo-Ong, M., Ginzinger, D.G., Dekker, N., McMillan, A., Regezi, J.A., Wong, D.T., and Jordan, R.C. (2002). Effect of duration of fixation on quantitative reverse transcription polymerase chain reaction analyses. Mod Pathol 15, 979-987. Mandriota, S.J., Jussila, L., Jeltsch, M., Compagni, A., Baetens, D., Prevo, R., Banerji, S., Huarte, J., Montesano, R., Jackson, D.G., et al. (2001). Vascular endothelial growth factor-C-mediated lymphangiogenesis promotes tumour metastasis. EMBO J 20, 672-682. Masuda, N., Ohnishi, T., Kawamoto, S., Monden, M., and Okubo, K. (1999). Analysis of chemical modification of RNA from formalin-fixed samples and optimization of molecular biology applications for such samples. Nucleic Acids Res 27, 4436-4443. Matikainen, M.P., Schleutker, J., Morsky, P., Kallioniemi, O.P., and Tammela, T.L. (1999). Detection of subclinical cancers by prostate-specific antigen screening in asymptomatic men from high-risk prostate cancer families. Clin Cancer Res 5, 1275-1279. Mewani, R.R., Tian, S., Li, B., Danner, M.T., Carr, T.D., Lee, S., Rahman, A., Kasid, U.N., Jung, M., Dritschilo, A., et al. (2006). Gene expression profile by inhibiting Raf-1 protein kinase in breast cancer cells. International journal of molecular medicine 17, 457-463. Mohammed, R.A., Green, A., El-Shikh, S., Paish, E.C., Ellis, I.O., and Martin, S.G. (2007). Prognostic significance of vascular endothelial cell growth factors -A, -C and -D in breast cancer and their relationship with angio- and lymphangiogenesis. Br J Cancer 96, 1092-1100. Muller, V., Stahmann, N., Riethdorf, S., Rau, T., Zabel, T., Goetz, A., Janicke, F., and Pantel, K. (2005). Circulating tumor cells in breast cancer: correlation to bone marrow micrometastases, heterogeneous response to systemic therapy and low proliferative activity. Clin Cancer Res 11, 3678-3685. Mumberg, D., Monach, P.A., Wanderling, S., Philip, M., Toledano, A.Y., Schreiber, R.D., and Schreiber, H. (1999). CD4(+) T cells eliminate MHC class II-negative cancer cells in vivo by indirect effects of IFN-gamma. Proc Natl Acad Sci U S A 96, 8633-8638. Nardon, E., Buda, I., Stanta, G., Buratti, E., Fonda, M., and Cattin, L. (2003). Insulin-like growth factor system gene expression in women with type 2 diabetes and breast cancer. Journal of clinical pathology 56, 599-604. Nishizuka, S., Charboneau, L., Young, L., Major, S., Reinhold, W.C., Waltham, M., Kouros-Mehr, H., Bussey, K.J., Lee, J.K., Espina, V., et al. (2003). Proteomic profiling of the NCI-60 cancer cell lines using new high-density reverse-phase lysate microarrays. Proc Natl Acad Sci U S A 100, 14229-14234. Nolan, T., Hands, R.E., and Bustin, S.A. (2006). Quantification of mRNA using real-time RT-PCR. Nat Protoc 1, 1559-1582. O'Byrne, K.J., Koukourakis, M.I., Giatromanolaki, A., Cox, G., Turley, H., Steward, W.P., Gatter, K., and Harris, A.L. (2000). Vascular endothelial growth factor, platelet-derived endothelial cell growth factor and angiogenesis in non-small-cell lung cancer. Br J Cancer 82, 1427-1432. Odunsi, K., Wollman, R.M., Ambrosone, C.B., Hutson, A., McCann, S.E., Tammela, J., Geisler, J.P., Miller, G., Sellers, T., Cliby, W., et al. (2005). Detection of epithelial ovarian cancer using 1H-NMR-based metabonomics. Int J Cancer 113, 782-788. Okegawa, T., Kinjo, M., Horie, S., Nutahara, K., and Higashihara, E. (2003). Detection of mucin 7 gene expression in exfoliated cells in urine from patients with bladder tumor. Urology 62, 182-186. Olert, J., Wiedorn, K.H., Goldmann, T., Kuhl, H., Mehraein, Y., Scherthan, H., Niketeghad, F., Vollmer, E., Muller, A.M., and Muller-Navia, J. (2001). HOPE fixation: a novel fixing method and paraffin-embedding technique for human soft tissues. Pathol Res Pract 197, 823-826. Olsson, A.K., Dimberg, A., Kreuger, J., and Claesson-Welsh, L. (2006). VEGF receptor signalling - in control of vascular function. Nat Rev Mol Cell Biol 7, 359-371. Paik, S., Shak, S., Tang, G., Kim, C., Baker, J., Cronin, M., Baehner, F.L., Walker, M.G., Watson, D., Park, T., et al. (2004). A multigene assay to predict recurrence of tamoxifen-treated, node-negative breast cancer. N Engl J Med 351, 2817-2826. Papadopoulos, N., Kinzler, K.W., and Vogelstein, B. (2006). The role of companion diagnostics in the development and use of mutation-targeted cancer therapies. Nat Biotechnol 24, 985-995. Paredes, J., Lopes, N., Milanezi, F., and Schmitt, F.C. (2007). P-cadherin and cytokeratin 5: useful adjunct markers to distinguish basal-like ductal carcinomas in situ. Virchows Arch 450, 73-80. Park, J.W., Kerbel, R.S., Kelloff, G.J., Barrett, J.C., Chabner, B.A., Parkinson, D.R., Peck, J., Ruddon, R.W., Sigman, C.C., and Slamon, D.J. (2004). Rationale for biomarkers and surrogate end points in mechanism-driven oncology drug development. Clin Cancer Res 10, 3885-3896. Penland, S.K., Keku, T.O., Torrice, C., He, X., Krishnamurthy, J., Hoadley, K.A., Woosley, J.T., Thomas, N.E., Perou, C.M., Sandler, R.S., et al. (2007). RNA expression analysis of formalin-fixed paraffin-embedded tumors. Lab Invest 87, 383-391. Perlmutter, M.A., Best, C.J., Gillespie, J.W., Gathright, Y., Gonzalez, S., Velasco, A., Linehan, W.M., Emmert-Buck, M.R., and Chuaqui, R.F. (2004). Comparison of snap freezing versus ethanol fixation for gene expression profiling of tissue specimens. J Mol Diagn 6, 371-377.
108

References
Perreard, L., Fan, C., Quackenbush, J.F., Mullins, M., Gauthier, N.P., Nelson, E., Mone, M., Hansen, H., Buys, S.S., Rasmussen, K., et al. (2006). Classification and risk stratification of invasive breast carcinomas using a real-time quantitative RT-PCR assay. Breast Cancer Res 8, R23. Phillips, K.A., Van Bebber, S., and Issa, A.M. (2006). Diagnostics and biomarker development: priming the pipeline. Nat Rev Drug Discov 5, 463-469. Plate, K. (2001). From angiogenesis to lymphangiogenesis. Nat Med 7, 151-152. Pusztai, L., Mazouni, C., Anderson, K., Wu, Y., and Symmans, W.F. (2006). Molecular classification of breast cancer: limitations and potential. Oncologist 11, 868-877. Pusztaszeri, M.P., Seelentag, W., and Bosman, F.T. (2006). Immunohistochemical expression of endothelial markers CD31, CD34, von Willebrand factor, and Fli-1 in normal human tissues. J Histochem Cytochem 54, 385-395. Ramaswamy, S., Ross, K.N., Lander, E.S., and Golub, T.R. (2003). A molecular signature of metastasis in primary solid tumors. Nat Genet 33, 49-54. Ransohoff, D.F. (2004). Rules of evidence for cancer molecular-marker discovery and validation. Nat Rev Cancer 4, 309-314. Rifai, N., Gillette, M.A., and Carr, S.A. (2006). Protein biomarker discovery and validation: the long and uncertain path to clinical utility. Nat Biotechnol 24, 971-983. Risau, W. (1997). Mechanisms of angiogenesis. Nature 386, 671-674. Rosell, R., Danenberg, K.D., Alberola, V., Bepler, G., Sanchez, J.J., Camps, C., Provencio, M., Isla, D., Taron, M., Diz, P., et al. (2004). Ribonucleotide reductase messenger RNA expression and survival in gemcitabine/cisplatin-treated advanced non-small cell lung cancer patients. Clin Cancer Res 10, 1318-1325. Rotem, D., Cassel, A., Lindenfeld, N., Mecz, Y., Sova, Y., Resnick, M., and Stein, A. (2000). Urinary cytokeratin 20 as a marker for transitional cell carcinoma. Eur Urol 37, 601-604. Roy, H., Bhardwaj, S., and Yla-Herttuala, S. (2006). Biology of vascular endothelial growth factors. FEBS Lett 580, 2879-2887. Salhab, M., Jiang, W.G., Newbold, R.F., and Mokbel, K. (2007). The expression of gene transcripts of telomere-associated genes in human breast cancer: correlation with clinico-pathological parameters and clinical outcome. Breast Cancer Res Treat. Salonga, D., Danenberg, K.D., Johnson, M., Metzger, R., Groshen, S., Tsao-Wei, D.D., Lenz, H.J., Leichman, C.G., Leichman, L., Diasio, R.B., et al. (2000). Colorectal tumors responding to 5-fluorouracil have low gene expression levels of dihydropyrimidine dehydrogenase, thymidylate synthase, and thymidine phosphorylase. Clin Cancer Res 6, 1322-1327. Sasano, H., Ohashi, Y., Suzuki, T., and Nagura, H. (1998). Vascularity in human adrenal cortex. Mod Pathol 11, 329-333. Schmittgen, T.D., Zakrajsek, B.A., Mills, A.G., Gorn, V., Singer, M.J., and Reed, M.W. (2000). Quantitative reverse transcription-polymerase chain reaction to study mRNA decay: comparison of endpoint and real-time methods. Anal Biochem 285, 194-204. Schoor, O., Weinschenk, T., Hennenlotter, J., Corvin, S., Stenzl, A., Rammensee, H.G., and Stevanovic, S. (2003). Moderate degradation does not preclude microarray analysis of small amounts of RNA. Biotechniques 35, 1192-1196, 1198-1201. Schroeder, A., Mueller, O., Stocker, S., Salowsky, R., Leiber, M., Gassmann, M., Lightfoot, S., Menzel, W., Granzow, M., and Ragg, T. (2006). The RIN: an RNA integrity number for assigning integrity values to RNA measurements. BMC Mol Biol 7, 3. Seibert, V., Wiesner, A., Buschmann, T., and Meuer, J. (2004). Surface-enhanced laser desorption ionization time-of-flight mass spectrometry (SELDI TOF-MS) and ProteinChip technology in proteomics research. Pathol Res Pract 200, 83-94. Sherr, C.J., and McCormick, F. (2002). The RB and p53 pathways in cancer. Cancer Cell 2, 103-112. Shi, X., Kleeff, J., Zhu, Z.W., Schmied, B., Tang, W.H., Zimmermann, A., Buchler, M.W., and Friess, H. (2003). Gene-expression analysis of single cells-nested polymerase chain reaction after laser microdissection. World J Gastroenterol 9, 1337-1341. Shibutani, M., and Uneyama, C. (2002). Methacarn: a fixation tool for multipurpose genetic analysis from paraffin-embedded tissues. Methods Enzymol 356, 114-125. Shipp, M.A., Ross, K.N., Tamayo, P., Weng, A.P., Kutok, J.L., Aguiar, R.C., Gaasenbeek, M., Angelo, M., Reich, M., Pinkus, G.S., et al. (2002). Diffuse large B-cell lymphoma outcome prediction by gene-expression profiling and supervised machine learning. Nat Med 8, 68-74. Sidhu, S., Gicquel, C., Bambach, C.P., Campbell, P., Magarey, C., Robinson, B.G., and Delbridge, L.W. (2003). Clinical and molecular aspects of adrenocortical tumourigenesis. ANZ J Surg 73, 727-738. Sidransky, D. (2002). Emerging molecular markers of cancer. Nat Rev Cancer 2, 210-219. Singhal, S., Mehta, J., Desikan, R., Ayers, D., Roberson, P., Eddlemon, P., Munshi, N., Anaissie, E., Wilson, C., Dhodapkar, M., et al. (1999). Antitumor activity of thalidomide in refractory multiple myeloma. N Engl J Med 341, 1565-1571.
109

References
Singletary, S.E., Allred, C., Ashley, P., Bassett, L.W., Berry, D., Bland, K.I., Borgen, P.I., Clark, G.M., Edge, S.B., Hayes, D.F., et al. (2003). Staging system for breast cancer: revisions for the 6th edition of the AJCC Cancer Staging Manual. Surg Clin North Am 83, 803-819. Siracusano, S., Niccolini, B., Knez, R., Tiberio, A., Benedetti, E., Bonin, S., Ciciliato, S., Pappagallo, G.L., Belgrano, E., and Stanta, G. (2005). The simultaneous use of telomerase, cytokeratin 20 and CD4 for bladder cancer detection in urine. Eur Urol 47, 327-333. Skrypina, N.A., Timofeeva, A.V., Khaspekov, G.L., Savochkina, L.P., and Beabealashvilli, R. (2003). Total RNA suitable for molecular biology analysis. J Biotechnol 105, 1-9. Slater, E.P., Diehl, S.M., Langer, P., Samans, B., Ramaswamy, A., Zielke, A., and Bartsch, D.K. (2006). Analysis by cDNA microarrays of gene expression patterns of human adrenocortical tumors. Eur J Endocrinol 154, 587-598. Sobin, L.H. (2003). TNM: evolution and relation to other prognostic factors. Semin Surg Oncol 21, 3-7. Sotiriou, C., Neo, S.Y., McShane, L.M., Korn, E.L., Long, P.M., Jazaeri, A., Martiat, P., Fox, S.B., Harris, A.L., and Liu, E.T. (2003). Breast cancer classification and prognosis based on gene expression profiles from a population-based study. Proc Natl Acad Sci U S A 100, 10393-10398. Specht, K., Kremer, M., Muller, U., Dirnhofer, S., Rosemann, M., Hofler, H., Quintanilla-Martinez, L., and Fend, F. (2002). Identification of cyclin D1 mRNA overexpression in B-cell neoplasias by real-time reverse transcription-PCR of microdissected paraffin sections. Clin Cancer Res 8, 2902-2911. Specht, K., Richter, T., Muller, U., Walch, A., Werner, M., and Hofler, H. (2001). Quantitative gene expression analysis in microdissected archival formalin-fixed and paraffin-embedded tumor tissue. Am J Pathol 158, 419-429. Srinivasan, M., Sedmak, D., and Jewell, S. (2002). Effect of fixatives and tissue processing on the content and integrity of nucleic acids. Am J Pathol 161, 1961-1971. Stacker, S.A., Caesar, C., Baldwin, M.E., Thornton, G.E., Williams, R.A., Prevo, R., Jackson, D.G., Nishikawa, S., Kubo, H., and Achen, M.G. (2001). VEGF-D promotes the metastatic spread of tumor cells via the lymphatics. Nat Med 7, 186-191. Stahlberg, A., Hakansson, J., Xian, X., Semb, H., and Kubista, M. (2004a). Properties of the reverse transcription reaction in mRNA quantification. Clin Chem 50, 509-515. Stahlberg, A., Kubista, M., and Pfaffl, M. (2004b). Comparison of reverse transcriptases in gene expression analysis. Clin Chem 50, 1678-1680. Stangegaard, M., Dufva, I.H., and Dufva, M. (2006). Reverse transcription using random pentadecamer primers increases yield and quality of resulting cDNA. Biotechniques 40, 649-657. Stanta, G., Bonin, S., Losi, L., and Eusebi, V. (1998a). Molecular characterization of intraductal breast carcinomas. Virchows Arch 432, 107-111. Stanta, G., Bonin, S., Niccolini, B., Raccanelli, A., and Baralle, F. (1999). Catalytic subunit of telomerase expression is related to RNA component expression. FEBS Lett 460, 285-288. Stanta, G., Bonin, S., and Perin, R. (1998b). RNA extraction from formalin-fixed and paraffin-embedded tissues. Methods Mol Biol 86, 23-26. Stanta, G., Bonin, S., and Utrera, R. (1998c). RNA quantitative analysis from fixed and paraffin-embedded tissues. Methods Mol Biol 86, 113-119. Stanta, G., Mucelli, S.P., Petrera, F., Bonin, S., and Bussolati, G. (2006). A novel fixative improves opportunities of nucleic acids and proteomic analysis in human archive's tissues. Diagn Mol Pathol 15, 115-123. Strand, C., Enell, J., Hedenfalk, I., and Ferno, M. (2007). RNA quality in frozen breast cancer samples and the influence on gene expression analysis--a comparison of three evaluation methods using microcapillary electrophoresis traces. BMC Mol Biol 8, 38. Stratakis, C.A. (2003). Genetics of adrenocortical tumors: gatekeepers, landscapers and conductors in symphony. Trends Endocrinol Metab 14, 404-410. Strefford, J.C., Lillington, D.M., Young, B.D., and Oliver, R.T. (2001). The use of multicolor fluorescence technologies in the characterization of prostate carcinoma cell lines: a comparison of multiplex fluorescence in situ hybridization and spectral karyotyping data. Cancer Genet Cytogenet 124, 112-121. Su, L., Morgan, P.R., and Lane, E.B. (1996). Expression of cytokeratin messenger RNA versus protein in the normal mammary gland and in breast cancer. Human pathology 27, 800-806. Takamizawa, J., Konishi, H., Yanagisawa, K., Tomida, S., Osada, H., Endoh, H., Harano, T., Yatabe, Y., Nagino, M., Nimura, Y., et al. (2004). Reduced expression of the let-7 microRNAs in human lung cancers in association with shortened postoperative survival. Cancer Res 64, 3753-3756. Thellin, O., Zorzi, W., Lakaye, B., De Borman, B., Coumans, B., Hennen, G., Grisar, T., Igout, A., and Heinen, E. (1999). Housekeeping genes as internal standards: use and limits. J Biotechnol 75, 291-295. Thouennon, E., Elkahloun, A.G., Guillemot, J., Gimenez-Roqueplo, A.P., Bertherat, J., Pierre, A., Ghzili, H., Grumolato, L., Muresan, M., Klein, M., et al. (2007). Identification of potential gene markers and insights into the pathophysiology of pheochromocytoma malignancy. J Clin Endocrinol Metab 92, 4865-4872.
110
References
Tokunaga, E., Kimura, Y., Mashino, K., Oki, E., Kataoka, A., Ohno, S., Morita, M., Kakeji, Y., Baba, H., and Maehara, Y. (2006). Activation of PI3K/Akt signaling and hormone resistance in breast cancer. Breast Cancer 13, 137-144. Tricarico, C., Pinzani, P., Bianchi, S., Paglierani, M., Distante, V., Pazzagli, M., Bustin, S.A., and Orlando, C. (2002). Quantitative real-time reverse transcription polymerase chain reaction: normalization to rRNA or single housekeeping genes is inappropriate for human tissue biopsies. Anal Biochem 309, 293-300. Trinh, B.N., Long, T.I., and Laird, P.W. (2001). DNA methylation analysis by MethyLight technology. Methods 25, 456-462. van de Vijver, M.J., He, Y.D., van't Veer, L.J., Dai, H., Hart, A.A., Voskuil, D.W., Schreiber, G.J., Peterse, J.L., Roberts, C., Marton, M.J., et al. (2002). A gene-expression signature as a predictor of survival in breast cancer. N Engl J Med 347, 1999-2009. Velculescu, V.E., Zhang, L., Vogelstein, B., and Kinzler, K.W. (1995). Serial analysis of gene expression. Science 270, 484-487. Veldman, T., Vignon, C., Schrock, E., Rowley, J.D., and Ried, T. (1997). Hidden chromosome abnormalities in haematological malignancies detected by multicolour spectral karyotyping. Nat Genet 15, 406-410. Vincek, V., Nassiri, M., Nadji, M., and Morales, A.R. (2003). A tissue fixative that protects macromolecules (DNA, RNA, and protein) and histomorphology in clinical samples. Lab Invest 83, 1427-1435. von Smolinski, D., Leverkoehne, I., von Samson-Himmelstjerna, G., and Gruber, A.D. (2005). Impact of formalin-fixation and paraffin-embedding on the ratio between mRNA copy numbers of differently expressed genes. Histochem Cell Biol 124, 177-188. Wang, J., Meza-Zepeda, L.A., Kresse, S.H., and Myklebost, O. (2004). M-CGH: analysing microarray-based CGH experiments. BMC Bioinformatics 5, 74. Weikert, S., Christoph, F., Schrader, M., Krause, H., Miller, K., and Muller, M. (2005). Quantitative analysis of survivin mRNA expression in urine and tumor tissue of bladder cancer patients and its potential relevance for disease detection and prognosis. Int J Cancer 116, 100-104. Wolff, A.C., Hammond, M.E., Schwartz, J.N., Hagerty, K.L., Allred, D.C., Cote, R.J., Dowsett, M., Fitzgibbons, P.L., Hanna, W.M., Langer, A., et al. (2007). American Society of Clinical Oncology/College of American Pathologists guideline recommendations for human epidermal growth factor receptor 2 testing in breast cancer. J Clin Oncol 25, 118-145. Woude, G.F., Kelloff, G.J., Ruddon, R.W., Koo, H.M., Sigman, C.C., Barrett, J.C., Day, R.W., Dicker, A.P., Kerbel, R.S., Parkinson, D.R., et al. (2004). Reanalysis of cancer drugs: old drugs, new tricks. Clin Cancer Res 10, 3897-3907. Wulfkuhle, J.D., McLean, K.C., Paweletz, C.P., Sgroi, D.C., Trock, B.J., Steeg, P.S., and Petricoin, E.F., 3rd (2001). New approaches to proteomic analysis of breast cancer. Proteomics 1, 1205-1215. Xiong, Z., and Laird, P.W. (1997). COBRA: a sensitive and quantitative DNA methylation assay. Nucleic Acids Res 25, 2532-2534. Yang, Z.F., Ngai, P., Ho, D.W., Yu, W.C., Ng, M.N., Lau, C.K., Li, M.L., Tam, K.H., Lam, C.T., Poon, R.T., et al. (2008). Identification of local and circulating cancer stem cells in human liver cancer. Hepatology 47, 919-928. Yankaskas, B.C. (2005). Epidemiology of breast cancer in young women. Breast Dis 23, 3-8. Zhang, Z., Bast, R.C., Jr., Yu, Y., Li, J., Sokoll, L.J., Rai, A.J., Rosenzweig, J.M., Cameron, B., Wang, Y.Y., Meng, X.Y., et al. (2004). Three biomarkers identified from serum proteomic analysis for the detection of early stage ovarian cancer. Cancer Res 64, 5882-5890. Zhu, W., Qin, W., Ehya, H., Lininger, J., and Sauter, E. (2003). Microsatellite changes in nipple aspirate fluid and breast tissue from women with breast carcinoma or its precursors. Clin Cancer Res 9, 3029-3033.
111