
Università degli Studi di Padova -...
173
Università degli Studi di Padova Dipartimento di Scienze Cardiologiche, Toraciche e Vascolari ___________________________________________________________ SCUOLA DI DOTTORATO DI RICERCA IN SCIENZE MEDICHE, CLINICHE E SPERIMENTALI INDIRIZZO: METODOLOGIA CLINICA, SCIENZE ENDOCRINOLOGICHE E DIABETOLOGICHE CICLO: XXV NEURORETINAL ACTIVATION IN DIABETES MELLITUS Direttore della Scuola: Ch.mo Prof. Gaetano Thiene Coordinatore d’indirizzo: Ch.mo Prof. Roberto Vettor Supervisori: Ch.mo Prof. Angelo Avogaro Ch.mo Prof. Edoardo Midena Dottoranda: dott.ssa Stela Vujosevic
Transcript of Università degli Studi di Padova -...

Università degli Studi di Padova
Dipartimento di Scienze Cardiologiche, Toraciche e Vascolari
___________________________________________________________
SCUOLA DI DOTTORATO DI RICERCA IN SCIENZE MEDICHE,
CLINICHE E SPERIMENTALI
INDIRIZZO: METODOLOGIA CLINICA, SCIENZE ENDOCRINOLOGICHE
E DIABETOLOGICHE
CICLO: XXV
NEURORETINAL ACTIVATION IN DIABETES MELLITUS
Direttore della Scuola: Ch.mo Prof. Gaetano Thiene
Coordinatore d’indirizzo: Ch.mo Prof. Roberto Vettor
Supervisori: Ch.mo Prof. Angelo Avogaro
Ch.mo Prof. Edoardo Midena
Dottoranda: dott.ssa Stela Vujosevic


CONTENTS
SUMMARY ........................................................................................................ 31
ABSTRACT ......................................................................................................... 5
INTRODUCTION ................................................................................................. 7
1.1. Impact of diabetes mellitus on global health ............................................. 7
1.1.1. Epidemiology of diabetes mellitus ....................................................... 7
1.2.1. Epidemiology of diabetic retinopathy ................................................... 8
1.2. Retinal glial cells and the physiology of aqueous humour ........................ 10
1.2.1. Retinal glial cells ............................................................................... 10
1.2.1.1. Müller cells ................................................................................. 12
1.2.1.2. Astrocytes .................................................................................. 14
1.2.1.3. Microglial cells ............................................................................ 15
1.2.3. Characteristics and physiology of the aqueous humour .................... 16
1.3. Classification of diabetic retinopathy........................................................ 17
1.4. Metabolic pathways involved in retinal damage during the course of
diabetes mellitus ............................................................................................ 20
1.5. Clinical progression of retinal damage during the course of diabetes
mellitus ........................................................................................................... 26
1.6. Physiopathology of retinal damage during the course of diabetes mellitus
....................................................................................................................... 29
1.6.1.Damage of retinal neuronal cells ........................................................ 32
1.6.2. Damage of retinal glial cells .............................................................. 34
1.6.2.1. Alteration of Müller cells ............................................................. 36
1.6.2.2. Astrocytes alteration .................................................................. 38
1.6.2.3. Alteration of microglial cells ........................................................ 40
1.7. Biomarkers of glial activation during the course of diabetic pathology ..... 43
1.7.1. Aquaporins ....................................................................................... 43
1.7.2. Glial fibrillary acidic protein (GFAP) .................................................. 49
1.7.3. Inflammatory molecules .................................................................... 50
1.7.4. Glutamate and GABA (gamma-aminobutyric acid) ............................ 52
1.7.5. Renin-angiotensin system (RAS) ...................................................... 53
1.7.6. Reactive oxygen species (ROS) ....................................................... 56
1.7.7. Advanced glycation end products (AGEs) ......................................... 56
1.7.8. Neuroprotective factors ..................................................................... 58
1.8. Spectral Domain OCT (SD-OCT) ............................................................ 62
1.8.1. Comparison between Time Domain OCT (TD-OCT) and Spectral
Domain OCT (SD-OCT) .............................................................................. 62
1.8.2. Importance of OCT during the course of diabetic pathology .............. 66
PURPOSE OF THE STUDY .............................................................................. 69
MATERIALS AND METHODS ........................................................................... 70
3.1. Bibliographic research ............................................................................. 70
3.2. Study population ...................................................................................... 70
3.3. OCT Exam .............................................................................................. 72
3.4. Collection, conservation and analysis of the aqueous humour ................. 75
3.4.1. Quantitative determination of total proteins ....................................... 77
3.4.2. GFAP, AQP1 and AQP4 analysis using the ELISA test..................... 78
3.4.3. Inflammatory profile analysis with protein array ................................. 80
3.5. Statistical analysis ................................................................................... 85
RESULTS .......................................................................................................... 88
4.1. Population ............................................................................................... 88
4.2. Protein analysis ....................................................................................... 91
4.3. Thickness analysis of the retinal layers ................................................. 111
DISCUSSION .................................................................................................. 119
CONCLUSIONS .............................................................................................. 130
BIBLIOGRAPHY .............................................................................................. 131
1
SUMMARY
Study premises: Diabetic retinopathy (DR), one of the leading causes of
blindness in developed countries, represents the most common microvascular
complication of diabetes mellitus. Recent studies have shown that the alteration
of glial cells and the resulting loss of neuronal cells occur before the vascular
lesions become clinically detectable.
Study purpose: The purpose of the study is to find the early biomarkers of glial
activation in the aqueous humour of diabetic subjects, both in presence and the
absence of clinically detectable DR signs.
Materials and methods: During cataract surgery, samples of the aqueous
humour have been collected in 34 patients, divided as follows: 12 healthy
subjects, 11 diabetic patients without diabetic retinopathy and 11 patients with
the non proliferative diabetic retinopathy (5 without macular edema-ME and 6
with ME). Before intervention, every patient has undergone a complete
ophthalmic examination and the spectral domain optical coherence tomography
(SD-OCT) (Spectralis HRA+OCT, Heildeberg Engineering). In 34 samples, the
quantification of total proteins has been carried out using the Bradford method, of
GFAP, AQP1 and AQP4 using the ELISA test, and of 40 inflammatory cytokines
using the protein array. In addition, the segmentation of the retinal layers has
been carried out using the SD-OCT scans.
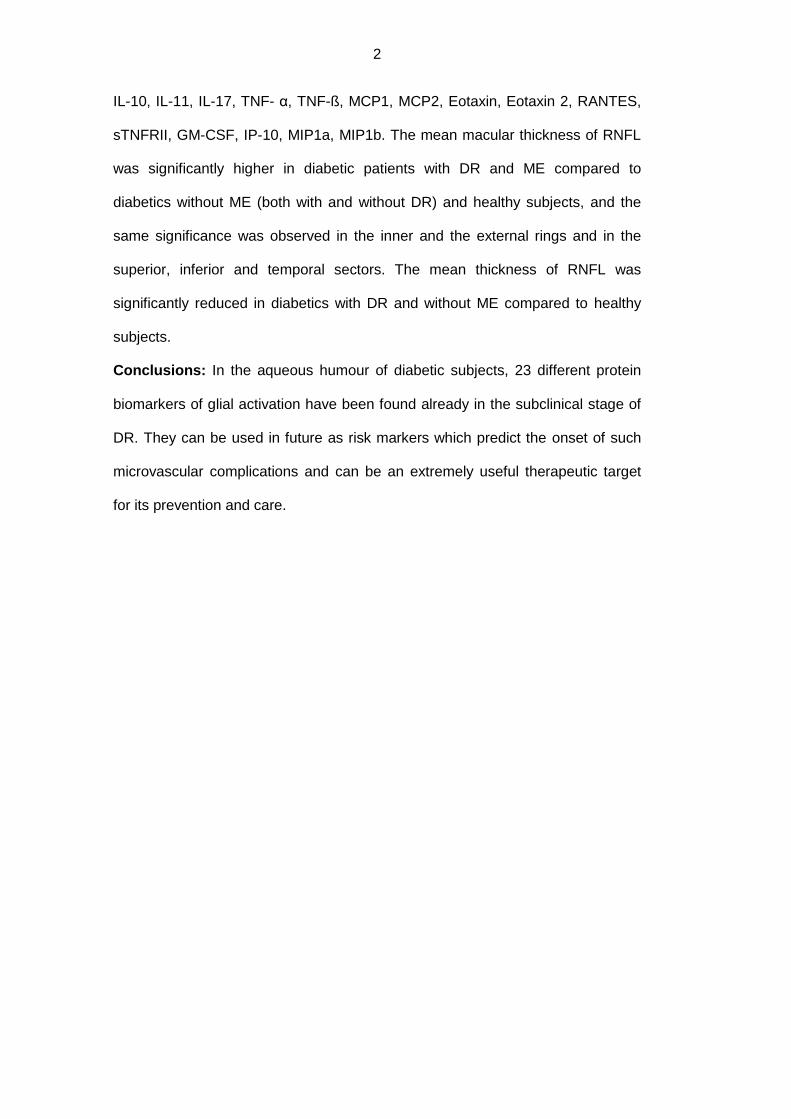
Results: Mean concentration of GFAP, AQP1 e AQP4 was significantly
increased in diabetics versus controls (p<0.05). GFAP showed an approximate
0.8 fold increase, AQP1 1.1 fold increase, whereas AQP4 about 24 folds increase
in diabetic patients versus controls. When we separately evaluated DR-no ME
eyes vs DR-ME eyes, there was a significant decrease in GFAP, AQP1 e AQPR
in DR-ME eyes versus DR-no ME eyes, (Tukey Kramer post hoc p<0.05).
Following cytokines were increased in diabetic patients (with or without DR)
compared to healthy subjects: GFAP, AQP1, AQP4, IFNy, IL-1a, IL-1b, IL-3, IL-4,
2
IL-10, IL-11, IL-17, TNF- α, TNF-ß, MCP1, MCP2, Eotaxin, Eotaxin 2, RANTES,
sTNFRII, GM-CSF, IP-10, MIP1a, MIP1b. The mean macular thickness of RNFL
was significantly higher in diabetic patients with DR and ME compared to
diabetics without ME (both with and without DR) and healthy subjects, and the
same significance was observed in the inner and the external rings and in the
superior, inferior and temporal sectors. The mean thickness of RNFL was
significantly reduced in diabetics with DR and without ME compared to healthy
subjects.
Conclusions: In the aqueous humour of diabetic subjects, 23 different protein
biomarkers of glial activation have been found already in the subclinical stage of
DR. They can be used in future as risk markers which predict the onset of such
microvascular complications and can be an extremely useful therapeutic target
for its prevention and care.
3
RIASSUNTO
Presupposti dello studio: La retinopatia diabetica (RD), una delle principali
cause di cecità nei paesi sviluppati, costituisce la più comune complicanza
microvascolare del diabete mellito. Recenti studi hanno dimostrato che
l’alterazione delle cellule gliali e la conseguente perdita di quelle neuronali si
verificano prima che le lesioni vascolari siano clinicamente rilevabili.
Scopo dello studio: Lo scopo dello studio è quello di ricercare biomarkers
precoci di attivazione gliale nell’umore acqueo di soggetti diabetici non solo in
presenza di segni clinicamente rilevabili di RD, ma anche in loro assenza.
Materiali e metodi: In corso di intervento di cataratta, sono stati raccolti i
campioni di umore acqueo di 34 pazienti così suddivisi: 12 soggetti sani, 11
pazienti diabetici senza retinopatia diabetica e 11 con retinopatia diabetica non
proliferante (di cui 5 senza edema maculare e 6 con edema maculare-ME). Prima
dell’intervento, tutti i pazienti sono stati sottoposti a visita oftalmologica completa
e tomografia a coerenza ottica di tipo spectral domain (SD-OCT) (Spectralis
HRA+OCT, Heildeberg Engineering). Nei 34 campioni è stata effettuata la
quantificazione delle proteine totali con metodo Bradford, di GFAP, AQP1 ed
AQP4 con test ELISA e di 40 citochine infiammatorie con protein array. E’ stata,
inoltre, effettuata la segmentazione degli strati retinici sulle scansioni SD-OCT.
Risultati: I valori medi delle concentrazioni di GFAP, AQP1 e AQP4 nell’umore
acqueo sono risultati significativamente più elevati nei soggetti diabetici rispetto
ai controlli sani (p<0.05). L’incremento di GFAP e’ stato di circa 0.8 volte, di
AQP1 di 1.1 volte e di AQP4 di circa 24 volte nei soggetti diabetici rispetto ai
controlli. Le concentrazioni di GFAP, AQP1 e AQP4 sono risultate
significativamente ridotte nei soggetti diabetici con ME rispetto ai diabetici senza
ME, (Tukey Kramer post hoc, p<0.05). La concentrazione nell’umore acqueo, è
risultata significativamente maggiore nei pazienti diabetici (con e senza RD)
rispetto ai soggetti sani per le seguenti citochine: GFAP, AQP1, AQP4, IFNy, IL-
4
1a, IL-1b, IL-3, IL-4, IL-10, IL-11, IL-17, TNF- α, TNF-ß, MCP1, MCP2, Eotaxin,
Eotaxin 2, RANTES, sTNFRII, GM-CSF, IP-10, MIP1a, MIP1b. Lo spessore
maculare medio di RNFL è risultato significativamente maggiore nei pazienti
diabetici con RD e ME rispetto ai diabetici senza ME (con e senza RD) ed ai
soggetti sani; lo stesso rapporto è stato osservato negli anelli interno ed esterno
e nei settori superiore, inferiore e temporale. Lo spessore maculare medio di
RNFL è risultato significativamente ridotto nei diabetici con RD e senza ME
rispetto ai soggetti sani.
Conclusioni: Sono stati riconosciuti nell’umore acqueo di soggetti diabetici 23
diversi biomarkers proteici di attivazione gliale presenti sin dallo stadio subclinico
della RD. Questi potranno essere utilizzati in futuro come marcatori di rischio per
l’insorgenza di tale complicanza microvascolare e costituire degli utili bersagli
terapeutici per la sua prevenzione e cura.
5
ABSTRACT
Background: Diabetic retinopathy (DR), one of the leading causes of blindness
in developed countries, is the major microvascular complication of diabetes
mellitus. Recent studies have demonstrated that the alteration of glial cells and
the consequent loss of retinal neuronal cells occur before the vascular lesions are
clinically detectable.
Purpose: To find early biomarkers of glial activation in the aqueous humor (AH)
of diabetic patients both in presence and in absence of clinically detectable signs
ofDR.
Materials and methods: During cataract surgery, 34 patients’ AH samples were
collected as follows: 12 healthy subjects, 11 diabetic patients without DR and 11
diabetic patients with nonproliferative diabetic retinopathy (5 without macular
edema-ME and 6 with ME). Before surgery, full ophthalmic examination and
Spectral-Domain Optical Coherence Tomography (SD-OCT) (Spectralis
HRA+OCT, Heildeberg Engineering) were performed in all eyes. The samples
were analyzed for the quantification of total proteins by Bradford method, of
GFAP, AQP1 and AQP4 by ELISA and of 40 inflammatory cytokines by protein
array. Segmentation of retinal layers was also performed.
Results: Mean concentration of GFAP, AQP1 e AQP4 was significantly
increased in diabetics versus controls (324.44±262.54 pg/µg vs 182.34±114.44
pg/µg for GFAP; 105.72±15.69 pg/µg vs 50.92±20.36 pg/µg for AQP1; and
852.03+103.24 pg/µg vs 33.58±21.20 pg/µg for AQP4, p<0.05). GFAP showed
an approximate 0.8 fold increase, AQP1 1.1 fold increase, whereas AQP4 about
24 folds increase in diabetic patients versus controls. When we separately
evaluated DR-no ME eyes vs DR-ME eyes, there was a significant decrease in
GFAP, AQP1 e AQPR in DR-ME eyes versus DR-no ME eyes, (Tukey Kramer
post hoc p<0.05). GFAP and AQP1 showed even a slight fold decrease versus
controls. AQP4/AQP1 concentration showed weak and non significant correlation
6
(Tau=0.21, p=0.3) between these biomarkers, despite the trend in increase.
Following cytokines were increased in diabetic patients (with or without DR)
compared to healthy subjects: GFAP, AQP1, AQP4, IFNy, IL-1a, IL-1b, IL-3, IL-4,
IL-10, IL-11, IL-17, TNF- α, TNF-ß, MCP1, MCP2, Eotaxin, Eotaxin 2, RANTES,
sTNFRII, GM-CSF, IP-10, MIP1a, MIP1b. RNFL mean thickness was significantly
higher in diabetic patients with DR and ME compared to diabetics without ME
(both with and without DR) and healthy subjects (respectively 37.3 μm vs 24.3μm
vs 26μm 5μm vs 26.8μm), and the same significance was observed in the inner
(33.4μm vs 22.0μm vs 25.0μm 24.3μm) and the external (54.7μm vs 36.7μm
34.6μm 38.1μm) rings and in the superior (40.3μm vs. 26.1μm vs 29.2μm vs
29.5μm), inferior (44.3μm vs 27.2μm vs 29.1μm vs 30.1μm) and temporal
(26.3μm vs 16.8μm vs 18.9μm vs 18.0μm) sectors. RNFL mean thickness was
significantly reduced in diabetics with DR and without ME compared to healthy
subjects.
Conclusions: 23 different biomarkers of glial activation have been recognized in
the AH of diabetic patients even with subclinical DR. These proteins could be
used in the future as risk markers of occurrence of DR and could provide useful
therapeutic targets for its prevention and therapy.
7
INTRODUCTION
1.1. Impact of diabetes mellitus on global health
1.1.1. Epidemiology of diabetes mellitus
Diabetes and its complications constitute one of the major health problems in the
economically developed countries, and the exponential growth of its prevalence
in the recent years has prompted the experts to describe it as a ‘global
epidemic’.[1] Based on the data from 2010, its prevalence in the world is
confirmed by approximately 284 million individuals with diabetes (about 6.4% of
the global population), and the estimates show that in 2030 the number will rise
to 439 million (about 7.7% of the global population); such increase will mainly
concern the adult subjects in the developing countries, with an increase of 73%
compared to the 20% increase in the developed countries.[2, 3]
The prevalence of diabetes rises with age, reaching the 15.8% in the population
over 65 years, and 18.8% in those over 75 years of age, without significant
differences between the two sexes. [4] The recent estimates of the WHO (World
Health Organization), moreover, show that diabetes is responsible for 2% of
world deaths, causing more than 1 million deaths a year (a value, however, which
is considered an underestimate).[5] If we focus on the situation in Italy, the ISTAT
(The National Institute for Statistics) has estimated in 2008 the existence of
known diabetes in 2.9 million of individuals (about 4.8% of the population), with
an increase in the future years in accordance with the global trends. Such
prevalence results greater in the South and in the islands, with about 5.8%
individuals afflicted, followed by the center with 5.3% and the North with 3.9%.[5]
The 2008 estimates show that in the Veneto region there are about 230 thousand
subjects with known diabetes and that there is an average annual increase of 4-
5% of the total number of patients. [6]

8
1.2.1. Epidemiology of diabetic retinopathy
Diabetic retinopathy (DR), one of the most common and severe diabetic vascular
complications, constitutes the first cause of visual impairment and blindness in
the adult working-age population in the developed countries.[1] It afflicts about 93
million people in the world (about 2-3% of the global population) and is
responsible for about 2.4 million cases of blindness. [7] In Europe, it afflicts about
3% of individuals, with greater prevalence among people aged 60 and over in
France and Germany.[7, 8] Italy and the Veneto region conform to these values.
[9]
According to the global estimates in 2012, 34.6% of diabetic patients present
retinopathy, 7% of which in a proliferative stage, and 6.8% with macular edema.
The prevalence is greater for Type 1 diabetes mellitus (DM) and the insulin-
treated Type 2 DM, and rises with the duration and the values of HbA1c, arterial
pressure and cholesterolemia. [7, 9]
While in patients with Type 1 DM the clinical symptoms of DR are present in 15-
20% of the cases 5 years after the diagnosis, in 50-60% of the cases 10 years
after the diagnosis, and virtually in all the patients 30 years after the diagnosis, in
patients afflicted by Type 2 DM such symptoms are present in 15-30% at the
moment of diagnosis, in 50-70% 10 years after the diagnosis and in 90% after 30
years. This can be explained by the fact that Type 2 DM is generally diagnosed
much later compared to Type 1 DM , when its negative effects have had a longer
period to act unobserved.[10]
In the last thirty years, however, the incidence and the progression risk of such
complications during the course of DM have diminished from values superior to
90% to values inferior to 50%, thanks to stricter controls of the glycemia, the
pressure and the cholesterolemia: recent American studies show that the

9
percentage of Type 2 diabetic patients who reach normative values for these
three parameters has risen from 30% to 50% between the years 2000 and 2006.
Thanks to all this, the percentage of diabetic patients confronted with proliferative
retinopathy, macular edema and visual deficit has significantly diminished in
time.[11]
Calculations show that if proliferative retinopathy is not treated, 50% of patients
with retinal new-vessels are destined to become blind within 5 years, and 50% of
patients with new-vessels of the optic disc become blind within 2 years.[11] The
three greatest risk factors for the appearance and the progression of DR are
hyperglycemia, hypertension and dyslipidemia; to which one can add the duration
of diabetes, pregnancy, genetic factors, cigarette smoke, alcohol, obesity and
anemia. Antonetti et al. have recently suggested an association, uncertain as it
might be, with serum prolactin levels, adiponectin and homocysteine,
nonalcoholic steatohepatitis and the nocturnal apnea syndrome.[11]
A singular aspect is represented by the fact that myopia, especially if high,
appears to be a protection factor with respect to DR: the reduced blood flow in
the myopic eye would, in fact, reduce the hematic extravasation of inflammatory
molecules.[12]
Even though retinopathy is the main ocular diabetic complication, it is not the only
one. There are numerous studies, in fact, which demonstrate that, among the
diabetic population, there is an increase in cataract incidence and its fast
progression; such concept is valid for the cortical and subcortical posterior forms,
while the association with nuclear forms appears to be without foundation. [10,
13] In addition, there is an increase in the incidences of glaucoma, retinal
hemorrhages, transient visual blurring and refraction defects.[14]
10
1.2. Retinal glial cells and the physiology of aqueous
humour
1.2.1. Retinal glial cells
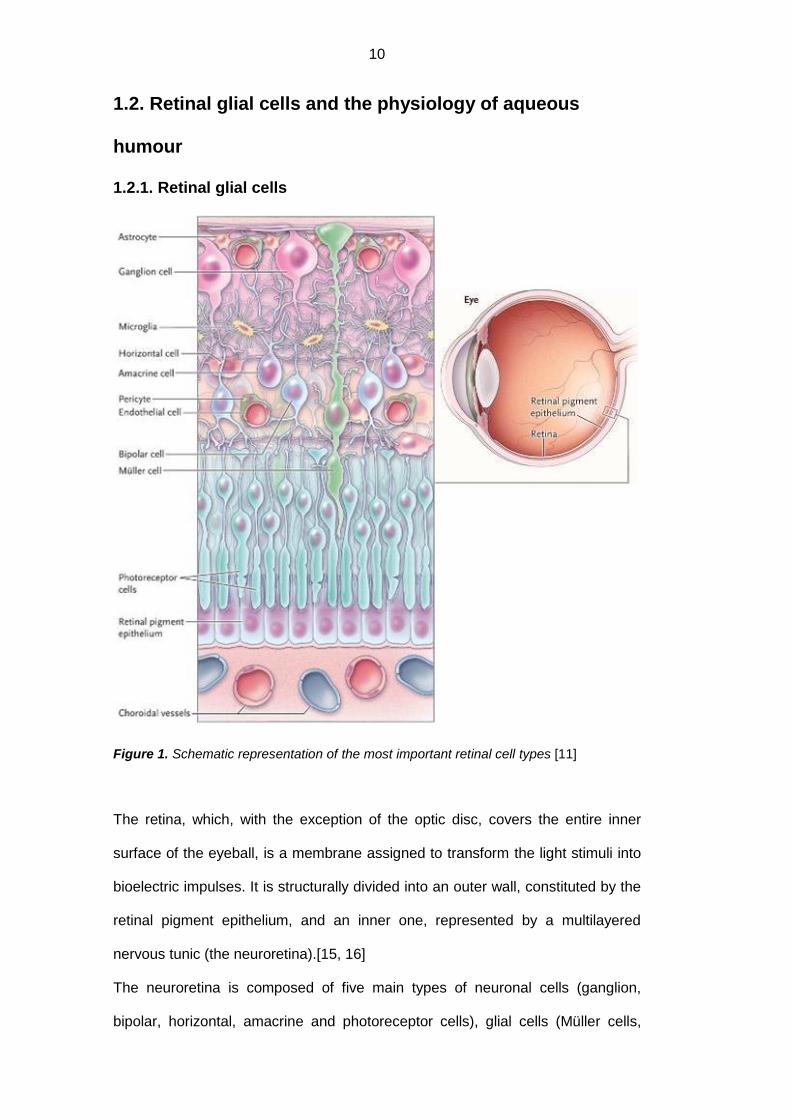
Figure 1. Schematic representation of the most important retinal cell types [11]
The retina, which, with the exception of the optic disc, covers the entire inner
surface of the eyeball, is a membrane assigned to transform the light stimuli into
bioelectric impulses. It is structurally divided into an outer wall, constituted by the
retinal pigment epithelium, and an inner one, represented by a multilayered
nervous tunic (the neuroretina).[15, 16]
The neuroretina is composed of five main types of neuronal cells (ganglion,
bipolar, horizontal, amacrine and photoreceptor cells), glial cells (Müller cells,
11
astrocytes and microglia) and vascular cells (pericytes and endothelial cells).[16,
17]
The retinal glial cells comprise the macroglia, which in turn comprises the Müller
cells and astrocytes, and the microglia. They function as neuronal structural
support cells and represent connection elements between the neurons and the
vascular cells, hence regulating neuronal nutrition, development and metabolism;
they contribute, moreover, to the local inflammatory response. [17] Consequently,
it is possible to understand how the glia, though it represents only one part of the
retina, can influence the physiology of neurons and retinal vessels. Each cell
underclass it includes, moreover, is markedly distinct from the others in
distribution, morphology and physiology. [18]
Retinal blood vessels are surrounded in its entirety by the glial cells’ processes:
the deepest ones (located at the inner and the outer margins of the inner nuclear
layer) are surrounded exclusively by the Müller cells, while the surface vessels
(located at the interface between the vitreous humor and the retina, and in the
ganglion cell layer) are surrounded both by Müller cells processes and the
astrocytary ones. In both cases, glial and endothelial cells are separated by the
basement membrane. [17]
12
1.2.1.1. Müller cells
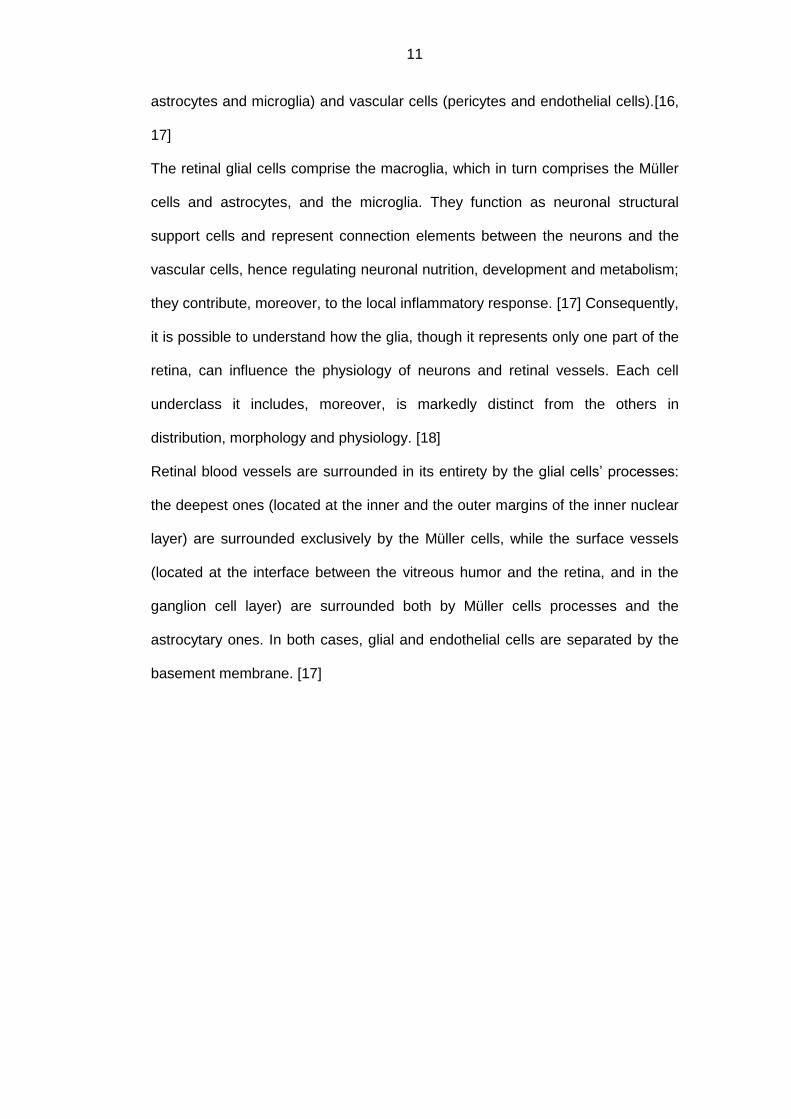
Figure 2. Müller cell in the human retina, as seen with an optical microscope. (A) Photographed immediately after isolation; (B) thawed after 12 months of cryopreservation.[19]
Müller cells, present exclusively at the retinal level representing the main glial
component of the area, extend almost through the entire thickness of the nervous
retina, from the photoreceptor inner segments to the border with the vitreous.
They fill out almost completely the extracellular space between the neuronal
elements, and they constitute a great part of the total retinal volume, enveloping
and separating different neurons, with the exception of synaptic junctions. Their
cellular bodies, located in the inner nuclear layer (INL), develop a thick fiber
directed towards the outside and one directed towards the inside. The first one,
developing lateral processes which branch out in the outside plexiform layer
(OPL), ends in the external limiting membrane (ELM), from which, for a very brief
time, it develops microvilli in the space between the inner segments of rods and
cones (called the fiber basket); their aim is to increase the cellular surface and to
regulate the exchange of metabolites and ions between the cells and the
subretinal space. The second fiber extends into the retinal nerve fiber layer

13
(RNFL), terminating in a process which comes into contact with the limiting glial
cells in order to form the inner limiting membrane (ILM) between the retina and
the vitreous humour. [16-18, 20-22]
Müller cells are connected to blood vessels, astrocytes and neurons, and thanks
to the fusion of the basal lamina on which they rest with perivascular cells and
with the vascular endothelium, they participate in the formation of the blood-
retinal barrier and regulate its characteristics. They express different ion channels
and co-transporters which rapidly remove ions, carbon dioxide and other
metabolites released by neurons into synaptic spaces, which appear to be
responsible for the association between neuronal activity and the blood flow
regulation. These cells maintain the stability of the retinal extracellular space and
cell plasma membranes through the regulation of retinal ion concentration (in
particular potassium), the deactivation and the recycling of neurotransmitters,
detritus removal, the regulation of glucose uptake through GLUT transporters, the
glycogen storage and its conversion into lactate, the participation in the
glutamate/glutamine cycle and the protection from glutamate excitotoxicity, and
the retinoic acid synthesis starting with retinol. Finally they contribute to the
development, metabolism and synaptic functioning of neurons, as well as to the
mechanical support and the inflammatory response of the retina.[16-18, 20-22]
14
1.2.1.2. Astrocytes
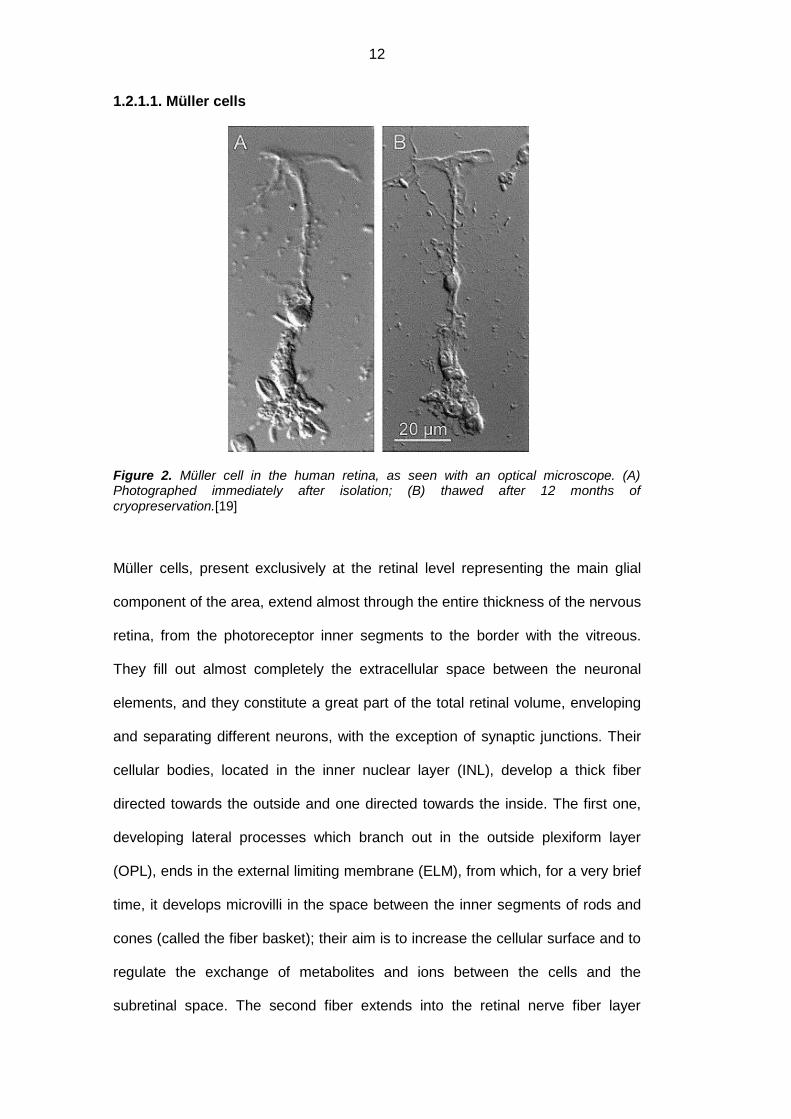
Figure 3. Human retinal astrocyte as seen on fluorescence microscope.[23]
The astrocytes, getting their name because they are characteristically star-
shaped, are ubiquitous components of the central nervous system (CNS). At the
retinal level, their cellular bodies are located inside the RNFL, while their
processes envelop the neuronal cells of the ganglion cell layer (GCL).
These cells almost certainly originate in a migratory process starting from the
optic nerve, and, maintaining the same function, they constitute support elements
for the axons of the ganglion cells. Their close association with the blood vessels
of the inner retina hints at their participation in the constitution of the blood-retinal
barrier and in its regulation. The endfeet of their processes come in contact with
the adjacent capillaries, probably to allow the substance transport between the
local circulation and the neurons. [16-18, 20]
It is generally considered that the astrocytes carry out significant roles in the
regulation of synaptic functions, e.g. in the extracellular ion regulation (particularly
potassium), glycogen deposition, neurotransmitter capture and inactivation, the
contribution to the inflammatory response and the regulation of ganglion axon
growth. The astrocytes usually contain the particular proteins of the intermediate
filaments: the immature ones are composed mainly of vimentin, while
15
subsequently the cells become rich in glial fibrillary acidic protein (GFAP).
Different ionic channels for potassium, sodium and calcium are located on their
surface, in order to maintain the equilibrium in the extracellular matrix, and they
are able to produce proinflammatory cytokines and to replace the damaged nerve
tissue. [16-18, 20]
1.2.1.3. Microglial cells
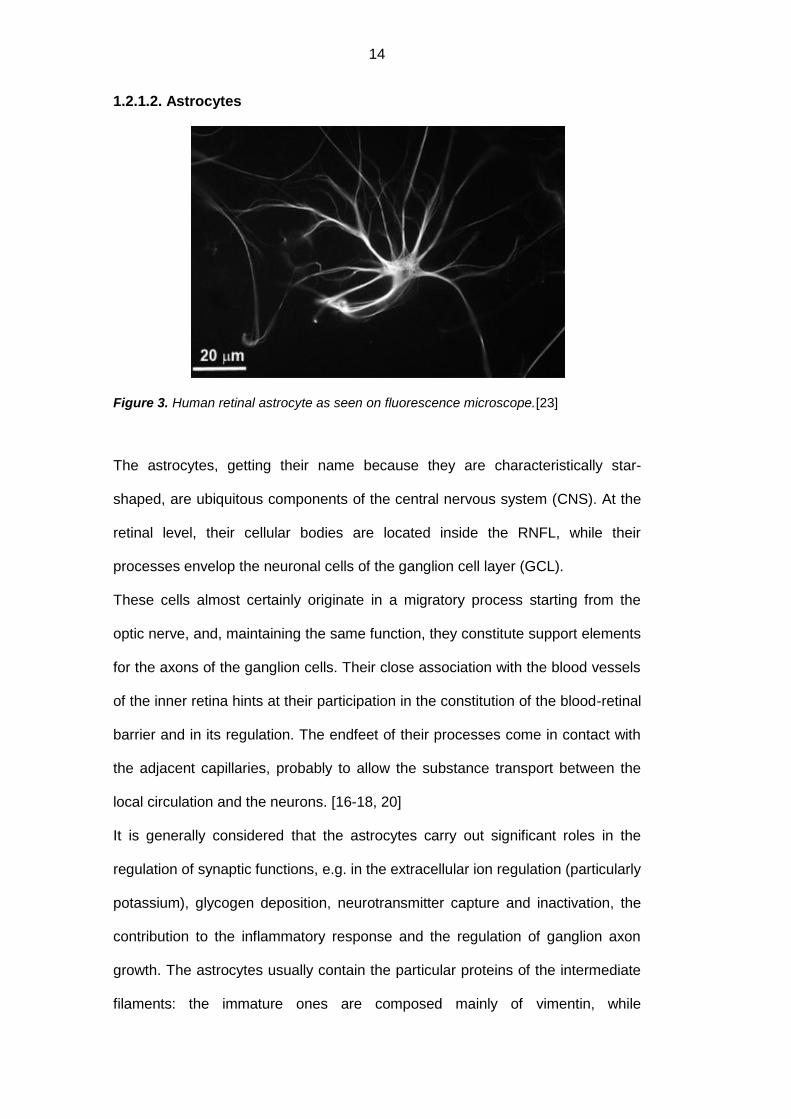
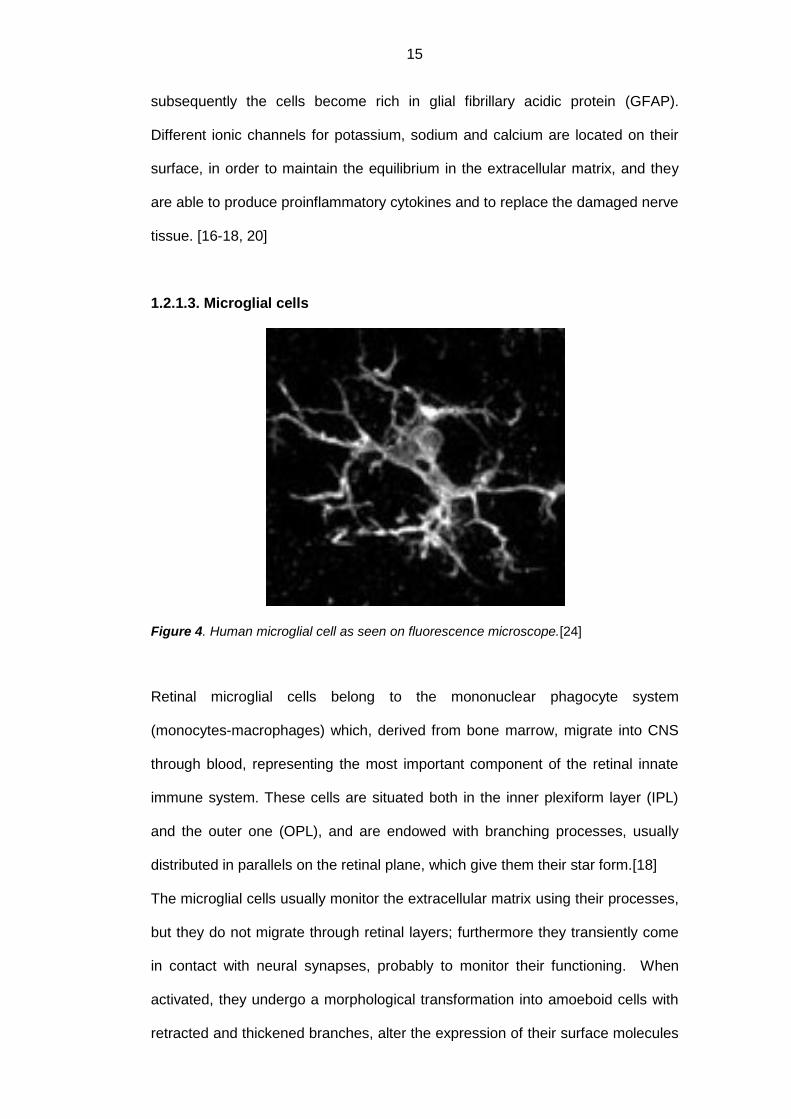
Figure 4. Human microglial cell as seen on fluorescence microscope.[24]
Retinal microglial cells belong to the mononuclear phagocyte system
(monocytes-macrophages) which, derived from bone marrow, migrate into CNS
through blood, representing the most important component of the retinal innate
immune system. These cells are situated both in the inner plexiform layer (IPL)
and the outer one (OPL), and are endowed with branching processes, usually
distributed in parallels on the retinal plane, which give them their star form.[18]
The microglial cells usually monitor the extracellular matrix using their processes,
but they do not migrate through retinal layers; furthermore they transiently come
in contact with neural synapses, probably to monitor their functioning. When
activated, they undergo a morphological transformation into amoeboid cells with
retracted and thickened branches, alter the expression of their surface molecules

16
and become mobile, migrating into damaged areas of the retina where they
participate in the phagocytosis of the degenerating neurons and the cellular
detritus, in the secretion of growth factors and cytokines and in the active
remodeling of neurons and synapses. [16, 18, 20, 25, 25] The microglia,
therefore, helps contrast the retinal stress, but if the stress perseveres, they can
cause a damaging and persistent inflammatory response.[21]
1.2.3. Characteristics and physiology of the aqueous humour
Figure 5. Schematic representation of the hydrodynamics of the aqueous humour. Produced by the nonpigmented ciliary epithelium (3), it leaves the anterior chamber through the trabecular meshwork and Schlemm’s canal (1) and in minimal part through the uvea (2).[26]
The aqueous humour (AH) is a clear, transparent liquid located in the anterior
and the posterior chambers of the eye: while most of it (the four fifths) is located
in the anterior chamber, a fifth is found in the posterior chamber where it is
produced, at a velocity of about 2.2μl/min during the day and of about 1.2μl/min
during the night, by the nonpigmented ciliary epithelium. However, as
demonstrated by the qualitative and quantitative differences of proteins, ions and
other solutes with respect to the plasma, the AH is not formed exclusively for a
simple process of diffusion and filtration, but also for the active secretion
operated by intraocular tissues, in particular by the ciliary epithelium. From the
posterior chamber, the AH flows into the anterior chamber passing between the
17
iris and the crystalline lens, and from here a major part (85%) is drained, through
the trabecular meshwork, into the Schlemm’s canal, to enter the blood flow
through the episcleral venous plexus (trabecular pathway or the usual one); a
small quantity (15%), however, reaches the choroid venous vessels through the
uveal trabeculae (sclerouveal pathway).[15, 16]
This ocular fluid plays an important role in maintaining certain functions, e.g. the
ocular refraction, form and pressure; in addition, it supplies nutritive substances
and the oxygen to the cornea, the crystalline lens and the trabecular meshwork,
and it removes waste substances; finally, it contributes to the constitution of the
local immune system.[27]
From the physical point of view, the AH presents a specific weight which varies
from 1003 to 1012, a refraction index between 1132 and 1137, and inferior
viscosity and superior surface tension compared to the plasma. [26]
From the chemical point of view, the AH is constituted by a complex mix of
electrolytes, organic solutes, growth factors, cytokines and proteins which satisfy
the metabolic needs of the nonvascularized tissues of the anterior eye segment.
Among all of its components, it is important to remember sodium, potassium,
chlorine, bicarbonate, glucose, urea, ureic acid, creatinine, enzymes such as
cholinesterase, amylase, hyaluronidase, glycosidase and aldolase, as well as
hyaluronic, ascorbic and lactic acids. The protein component is minimal, and it
seems to derive from plasmatic filtration through fenestrated capillaries in the
ciliary body.[16, 26]
1.3. Classification of diabetic retinopathy
In order to arrive at a successful treatment capable of significantly reducing the
risk of severe visual loss, there is a strong need for an international classification
system which would allow the proper assessment of the severity of DR and of the
diabetic macular edema (DME). The classification suggested by the Early

18
Treatment of Diabetic Retinopathy Study (ETDRS), based on the photographs of
the ocular fundus, has resulted useful when applied in clinical trials, researches
and publications, but is rather difficult to use in the everyday clinical practice.
This is the reason for which, after several attempts by the single countries, the
American Academy of Ophtalmology (AAO) has in 2001 initiated a project,
concluded in 2003, which has enabled the creation of a new classification system
of the severity of DR. [28]
According to this international classification, diabetic retinopathy is divided in 5
stages: absent, non proliferative mild, moderate, severe and proliferative (Table
I). It may or may not be associated with macular edema which, if present, is
classified in 3 stages: mild, moderate and severe (Table II): [28]
Table I. International classification of diabetic retinopathy (AAO).[28]
DR ABSENT Absence of retinal lesions
DR NON PROLIFERATIVE
MILD Microaneurysms only
MODERATE More than only microaneurysms, but less lesions compared to severe NPDR
SEVERE
At least one of the following:
More than 20 intraretinal hemorrhages in each of the 4 retinal quadrants
Definite venous beading in at least two quadrants
Intraretinal microvascular anomalies in at least 1 quadrant
No sign of proliferative retinopathy
DR PROLIFERATIVE
At least one of the following:
Neovascularization
Vitreous/preretinal hemorrhage
19
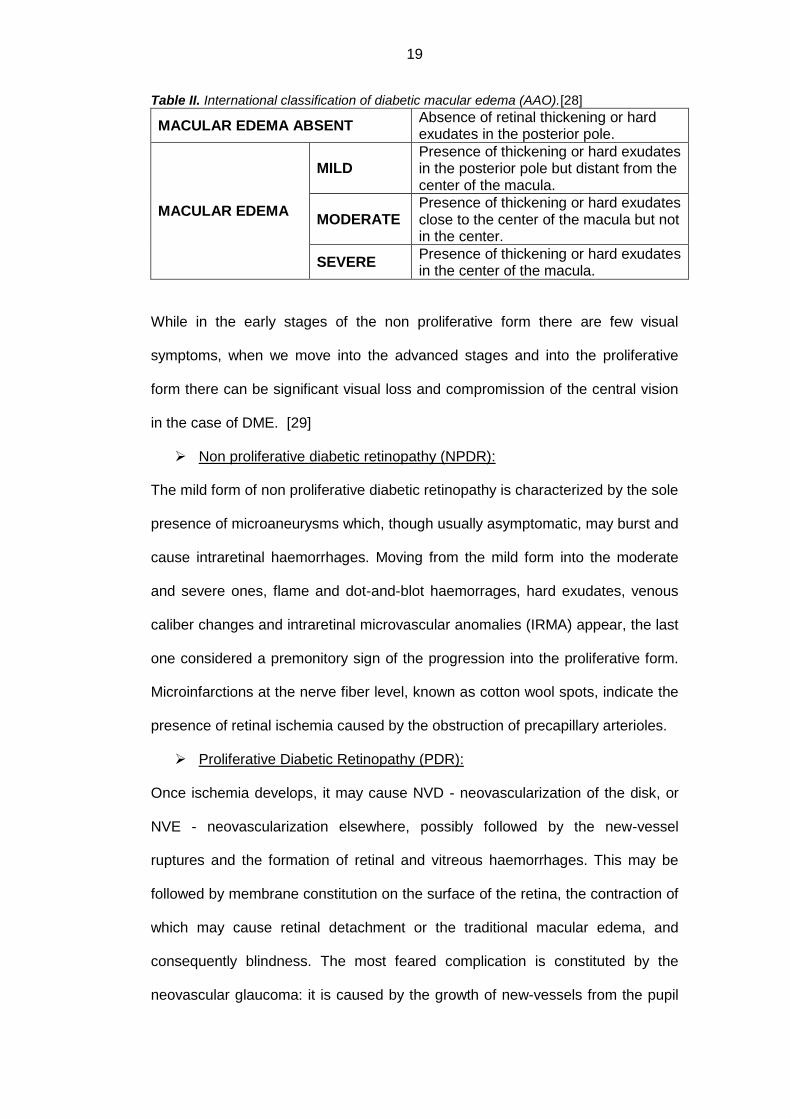
Table II. International classification of diabetic macular edema (AAO).[28]
MACULAR EDEMA ABSENT Absence of retinal thickening or hard exudates in the posterior pole.
MACULAR EDEMA
MILD Presence of thickening or hard exudates in the posterior pole but distant from the center of the macula.
MODERATE Presence of thickening or hard exudates close to the center of the macula but not in the center.
SEVERE Presence of thickening or hard exudates in the center of the macula.
While in the early stages of the non proliferative form there are few visual
symptoms, when we move into the advanced stages and into the proliferative
form there can be significant visual loss and compromission of the central vision
in the case of DME. [29]
Non proliferative diabetic retinopathy (NPDR):
The mild form of non proliferative diabetic retinopathy is characterized by the sole
presence of microaneurysms which, though usually asymptomatic, may burst and
cause intraretinal haemorrhages. Moving from the mild form into the moderate
and severe ones, flame and dot-and-blot haemorrages, hard exudates, venous
caliber changes and intraretinal microvascular anomalies (IRMA) appear, the last
one considered a premonitory sign of the progression into the proliferative form.
Microinfarctions at the nerve fiber level, known as cotton wool spots, indicate the
presence of retinal ischemia caused by the obstruction of precapillary arterioles.
Proliferative Diabetic Retinopathy (PDR):
Once ischemia develops, it may cause NVD - neovascularization of the disk, or
NVE - neovascularization elsewhere, possibly followed by the new-vessel
ruptures and the formation of retinal and vitreous haemorrhages. This may be
followed by membrane constitution on the surface of the retina, the contraction of
which may cause retinal detachment or the traditional macular edema, and
consequently blindness. The most feared complication is constituted by the
neovascular glaucoma: it is caused by the growth of new-vessels from the pupil

20
area to the chamber angle and may lead to blindness. Another possible
complication is constituted by the rubeosis iridis.
Diabetic macular edema (DME):
Macular edema may appear in any stage of diabetic retinopathy. The ETDRS has
established that it may be considered clinically significant when one of the
following occurs: 1) it presents a retinal thickening at or within 500μm of center of
macula; 2) when there are hard exudates present in the same area associated
with adjacent retinal thickening; or 3) when there is retinal thickening greater than
1 or more disc diameter in size present which is within 1 disc diameter from the
center of the macula.[30]
1.4. Metabolic pathways implicated in retinal damage
during the course of diabetes mellitus
Figure 6. Metabolic pathways implicated in retinal damage during the course of diabetes mellitus. They damage both the neural and the vascular components of the retina.[31]

21
Even though the clinical studies “Diabetes Control and Complications Trials”
(DCCT) and “UK Prospective Diabetes Study” (UKPDS) have recognized
hyperglycemia as the motivating factor for diabetic retinopathy, the mechanism
through which the glucose provokes microvascular damages has not been
entirely clarified.[32] There are different metabolic pathways involved: inside the
cells, high glucose levels appear to stimulate polyol pathways, advanced
glycation endproducts (AGEs), protein kinase C (PKC), poly-ADP-ribose
polymerase (PARP), hexosamines, renin-angiotensin-aldosteron system (RAS),
reactive oxygen species (ROS), inflammation and growth factors. [31, 32]
Polyol Pathway
Usually a small fraction of glucose is metabolized through this pathway controlled
by aldose-reductase enzymes (AR), which reduce glucose to sorbitol, and by
sorbitol-dehydrogenase (SDH), which reduces sorbitol into fructose. In
hyperglycemic conditions, such fraction increases, and, using the NADPH
(nicotine adenine dinucleotide phosphate) as a cofactor, provokes a glutation
decrease and an increase in oxidative stress, which in turn cause retinal
damage.[31, 33-35]
AGEs Pathway
Non enzymatic glycosylation consists in a chemical reaction which causes the
glucose to bind to proteins, lipids and nucleic acids, and which, through a series
of complex reactions, causes the formation of AGEs. Goh et al. have noticed in
retinal vessels, in vitreous humour and in human serum, an increase of AGEs
levels associated with the gravity of DR.[36] Stitt et al. have moreover
demonstrated that the accumulation of AGEs in retinal pericytes, very important
for microvascular homeostasis, is implicated in endothelial damage and in blood-
retinal barrier damage.[37] Finally, the Yamagishi group has shown how the

22
AGEs on one part increase, through ROS generation (free radicals/reactive
oxygen species), the levels of VEGF (vascular endothelial growth factor), of
MCP-1 (monocyte chemotactic protein-1) and of ICAM-1 (intercellular adhesion
molecule-1) and, on the other, how they activate NF-kB (nuclear factor-kappaB)
and NADPH-oxydase with the consequent ROS increase and the apoptosis of
pericytes and other cells.[38-43] The AGEs disturb microvascular homeostasis
through the interaction with their own receptors (RAGE), and they hold a central
role in the inflammation, the neurodegeneration and the microvascular
dysfunction.[31]
Protein Kinase C Pathway (PKC)
Hyperglycemia induces the PKC pathway activation by increasing diacylglycerol
(DAG) synthesis and other mechanisms. This leads to an increase in blood flow
and vascular permeability, to the reduction in density of the basement membrane,
to an expansion of extracellular matrix, to cellular apoptosis, angiogenesis,
leucocyte adhesion and cytokine activation. [31, 32]
Poly-ADP-ribose polymerase (PARP) activation
Drel et al. have noticed that when the nuclear enzyme PARP is activated in
diabetic animal retina, it causes the DNA to rupture and it exacerbates the
oxidative and nitrosative stress. In fact, the PARP activation provokes NAD+
(nicotinamide adenine dinucleotide) consumption, G3PD (glyceraldehyde 3-
phosphate dehydrogenase) inhibition and NFkB activation, all elements that
induce an increase in ROS and nitrogen production, responsible for the retinal
damage. [31, 44]

23
Hexosamine pathway
Giacco et al. have demonstrated that the hexosamine content in retinal tissue,
both human and animal, is higher in diabetic subjects.[45] This is an extremely
important result if we consider that Nakamura group had shown that the
hexosamines alter the insulin signaling, contributing to the onset of DR.[46]
Renin-angiotensin system (RAS)
The renin-angiotensin system, which regulates blood pressure and fluid balance,
appears altered in diabetic patients, leading to microvascular dysfunctions.[47]
Various studies have analyzed the components of these systems at the retinal
level (Ang I -angiotensin I-, Ang II -angiotensin II-, prorenin, renin, ACE -
angiotensin-converting enzyme-, AT1R -angiotensin type 1 receptor-, AT2R -
angiotensin type 1 receptor-) and they have registered an increase in prorenin,
renin and Ang II levels in the vitreous of the patients with proliferative diabetic
retinopathy and with diabetic macular edema. [48-50] In addition to being a
growth factor and to promoting cellular differentiation, apoptosis and extracellular
matrix deposition, Ang II reinforces the harmful effects of the AGEs inducing
RAGEs expression (AGEs’ receptors) in hypertensive eye: this points to a
connection between the two systems.[31]
Oxidative stress
Hyperglycemia causes the oxidative stress and determines cellular damage at
the level of the retina. In the diabetic subject’s retina, the sources of reactive
oxygen species have not been completely clarified yet, even though different
studies evidence an increase in lactate, pyruvate, tricarboxylic acid and
nitrotyrosine, in the consumption of cytosolic NADPH and in the stimulation of the
glycolitic, AGEs, polyol, hexosamine and PKC pathways.[50, 51] Ulterior studies
point at the participation of lipoproteic metabolism, the excess of excitatory amino
acids, the alteration of growth factors, the activation of NADPH oxidase, the
xantine-oxidase and the decrease of glutathione and antioxidant enzymes. [51-

24
56] Apart from creating a vicious circle responsible for the production of ulterior
EOS, the oxidative stress activates the other metabolic pathways responsible for
the retinal damage. It is not entirely clear, however, if it has a primary role in the
pathogenesis of diabetic complications in the early stages, or if it is only
consequential of the tissue damage.[31]
Inflammation
Different molecular and cellular alterations typical of inflammation processes
have been found out in the retinas of diabetic animals and patients. Different
evidence supports the idea according to which the DR is a manifestation of a
chronic low-level inflammation in which different effectors, e.g. the cytokines and
the leukocytes, are responsible for retinal damage.[31] Diabetic retinopathy
presents many similarities to chronic inflammatory diseases: increase in vascular
permeability, edema, infiltration of inflammatory cells, tissue destruction,
neovascularization and retinal expression of inflammatory cytokines. Recent
publications present strong evidence of an important inflammatory involvement
even in the early stages of DR.[57-60] In addition, it has been demonstrated that,
in both animals and patients with diabetes, the leukocytes, including monocytes-
macrophages (microglia), neutrophils and a certain number of lymphocytes
adhere to retinal vascular endothelium. This temporally coincides with the
compromission of the blood-retinal barrier, with the capillary occlusion and with
the death of endothelial cells. The expression of adhesion molecules, particularly
of ICAM-1 (intracellular adhesion molecule-1) and VCAM-1 (vascular cell
adhesion molecule-1), appears increased in the diabetic subject’s retina and is
connected to the increased leukocyte adhesion and the leukostasis.[61]
If, in the healthy subject, the neurons express molecules which negatively
regulate microglial activation, in diabetic subjects such regulation does not take
25
place, and the activated microglia produces cytokines and inflammatories. In
addition, the high complement and the acute phase protein levels as well as the
low levels of complement inhibitors represent a key moment in the damaged
neurons’ phagocytosis.[11, 21]
At the retinal level of diabetic mice and patients, different alterations have been
identified: an increase in iNOS (inducible nitric oxide synthase), NO (nitric oxide),
COX2 (cyclooxygenase-2), lipoxygenase, eicosanoids (including prostaglandins
and leukotrienes), ICAM-1 and VCAM-1 on the surface of endothelial cells, PDGF
(platelet-derived growth factor), VEGF, in IL-1, IL-6, IL-8, IL-13, MCP-1
(monocyte chemotactic protein-1), MIP-1α (macrophage inflammatory protein-
1α), IP-10 (interferon gamma-induced protein 10), endothelin-1, TNF-α (tumor
necrosis factor-α), RANTES (regulated normal T-cell expressed and secreted)
and SDF-1α (stromal cell-derived factor-1). Furthermore, there was an increase
in complement components such as C3, C5b and C9, and in molecules such as
prothrombin, α1-antitrypsin, antithrombin III, coagulation factor XIII, Ang II,
RAGEs (AGEs receptors) and NF-kB, while the PEDF (pigment epithelium-
derived factor) resulted decreased. All these alterations have a proinflammatory
effect and they entail an increase of leukocyte adhesion and leukostasis, as well
as a damage of the blood-retinal barrier and death of endothelial cells.[11, 58,
62-67]
This data, therefore, suggests that inflammation contributes to the development
and the progression of retinopathy, as it is demonstrated by the fact that the
intravenous administration of glucocorticoids and anti-VEGF improve the clinical
picture.[11]

26
Growth factors, neurotrophic factors and hormones
Altered levels of certain molecules have been found in the diabetic subject,
among which insulin, IGF-1 (insulin-like growth factor-1), aldosterone,
adrenomedullin, GH (growth hormon), endothelin, VEGF, PEDF, FGF (fibroblast
growth factor) and TGF-β (transforming growth factor-β). These elements are all
responsible for both the structural changes of retinal vascularization
(angiogenesis, ischemia, and increase in vessel permeability) and the
progression of DR.[31] Neurotrophic factors such as insulin, PEDF, CNTF (ciliary
neurotrophic factor), NGF (nerve growth factor), GDNF (glial cell line-derived
neurotrophic factor) and BDNF (brain-derived growth factor), all of which appear
altered in the diabetic subject, are responsible for retinal neuronal damage.[31]
1.5. Clinical Progression of Retinal Damage during the
Course of Diabetes Mellitus
In the preclinical stage of DR, one witnesses the damage of endothelial cells,
responsible for the integrity of the blood-retinal barrier, which are confronted by
an accumulation of sorbitol with the consequent loss of osmotic equilibrium and
of tight intercellular junctions; this leads to an increase in vascular permeability
and the accumulation of extracellular fluid.[26, 68] The noteworthy rarefaction of
intramural pericytes, which have the capacity to synthesize TGF-β and to inhibit
the proliferation and migration of endothelial cells, leads not only to the failed
regulation of capillary perfusion and the partial weakening, but also to a
neovascularization typical of the proliferative form.[68, 69] The thickening of the
basement membrane and the increase of deposition of the extracellular matrix
components are probably caused by the glycosylation of its constitutive
molecules and/or by the reduction in production of proteoglycans, which
27
contribute to the hemodynamic alteration of retinal capillaries.[26, 68] The
hematic and hemorheological alterations, on the other hand, consist in the
increase in viscosity, caused by the reduced deformability of red blood cells, and
in hypercoagulability, caused by the increase in platelet aggregation, fibrinogen,
certain coagulation factors (VII and VIII), α2-globulin, and by the reduction of
antithrombin III.[26] At this stage, first the autoregulation mechanisms are
triggered, which subsequently they oppose the hypoxia caused by vascular wall
lesions and other hemorheological alterations: among these, the first sign of
compensation is constituted by vasodilation, more evident when found in macular
circulation. With the advancing of the illness, nevertheless, the autoregulation
capacities are no longer sufficient for the compensation of retinal metabolic
necessities, and the already precarious conditions of the vessel wall are further
aggravated. This leads to an ulterior thickening and structural alteration of the
basement membrane, to the reduction of endothelial cells with tight junction
rupture and to the disappearance of intramural pericytes.[26, 39, 70]
The clinical stage of the illness therefore begins with the appearance of
microaneurysms, hard exudates, vascular alterations and capillary occlusions.
The microaneurysms are capillary dilatations caused by the swelling of their
weakened walls or by endothelial gems which attempt to revascularize the retina;
they can be identified as small red dots, are usually temporal with respect to the
macula and can be saccular or fusiform in structure. Hard exudates, identified as
yellowish white deposits in the external plexiform layer, are accumulations of
lipids, proteins and microphages (microglia), which phagocytize such material
and are the result of their extravasal precipitation, through capillary incontinence,
beginning in the blood flow. The intraretinal hemorrhages are caused by the
rupture of weakened capillaries and have different morphologies depending on
their topographic localization: the surface ones are typically flame-shaped, as
they are located between the axons within the nerve fiber layer, while the deeper

28
ones are dot-and-blot shaped due to the cell disposition just about perpendicular
to the retinal surface. The pre-capillary arteriolar occlusion may cause retinal
microinfarctions with consequent formation in the nerve fiber layer of cotton wool
spots; the latter, blurred and off-white in colour, are caused by the swelling of
nerve fiber terminations which follows the axonal flow halt determined by retinal
ischemia. Capillary occlusions may also cause the intraretinal microvascular
anomalies (IRMA), usually at the medium to extreme peripheral level of the
retina, on the border with ischemic areas; they are represented both by retinal
new-vessels and the dilatation of preexistent vessels, and would constitute a
compensation attempt implemented through the opening of shunts with not yet
occluded capillaries. Venous alterations are represented by irregularities and
lumen duplications, and can assume a characteristic rosary-bead shape.[26, 70,
71]
Figure 7. Photograph of the ocular fundus of a patient afflicted by NPDR. Hard exudates (yellow
arrow), microaneurysms (red arrow), cotton wool nodules (white arrow) and retinal hemorrhages
(green arrow) are visible.[72]
29
From the established ischemic areas, VEGF, IGF-1 and FGF are liberated, and
they determine a vascularization of the no longer perfused retinal zones. It initially
concerns only the retinal thickness, but later on it can concern also the vitreous
space, and more frequently the optic disc, due to the natural interruption of the
inner limiting membrane. Newly formed vessels present an anomalous wall
constituted only by the endothelium, without a valid junction system or pericytes,
and therefore tend to bleed frequently. Initially the new-vessels lack connective
support, but in a brief time they become enveloped by a fibrous support tissue.
Precisely for this reason the new-vessels bleed easily, but after the constitution of
the fibrous component, there is a tendency towards closure and complications,
e.g. the retinal detachment. [26]
In each DR stage, the macular region may be involved, with edema,
hemorrhages and hard exudates, which can lead to diabetic maculopathy.
Macular edema, of particular danger to the visual prognosis when it strikes the
foveal region, may be diffused through the entire thickness of the retina, or it may
converge into lodges at the external plexiform layer level provoking the cystoid
macular edema. It is caused by the loss of function of the blood-retinal barrier,
with significant leakage of fluids, proteins and lipids into the sensory retina.
Ischemic maculopathy is an ulterior aspect of the macular compromission,
caused by capillary occlusion surrounding the fovea and leading to an extremely
bad visual prognosis.[26, 30, 70]
1.6. Physiopathology of Retinal Damage during the Course
of Diabetes Mellitus
For a long period of time, DR has been considered primarily a microvascular
pathology caused by the direct effects of hyperglycemia and by the metabolic
30
pathways it activates.[73] Some recent studies have nevertheless demonstrated
that retinal neurodegeneration, the result of a negative balance between the
neuroprotector and neurotoxic factors, is present even before the development of
microvascular damages detectable clinically in ophthalmoscopic examination,
which proves its participation in their appearance. It would therefore constitute an
early event in the pathogenesis of DR and would anticipate the onset of
microvascular alterations.[11, 21, 73-76]
Already in 1961, Wolter et al. have observed in autoptic reports of diabetic
subject the atrophy of ganglion cells and the degeneration of the inner nuclear
layer, advancing the hypothesis according to which DR would not be solely a
vascular pathology, but would precociously involve the neurons and the glia.[77]
In 1962, the Bloodworth group described, in a study of 295 cadaver eyes, the
degeneration of the inner plexiform layer and the ganglion cell layer, evidencing
the presence of pyknosis and nuclear fragmentation, characteristics which are
today widely recognized as typical of apoptosis.[78] In 1986, Scott et al.
identified, in a study of the optic nerve in rats treated for 12 months with
streptozotocin (a substance which induces diabetes), a reduction in the number
of nerve fibers and an increase in the number of glial cells. [79] Lastly, in a study
from 1998, the Barber group demonstrated, both in mice and in diabetic subjects,
a high level of caspase-3 apoptosis mediated by the retinal neuronal cells,
without noticing a similar significance in endothelial cells.[80]
Neuronal damage and microvascular damage are interdependent and they
strengthen one another’s effects: while the vascular hyperpermeability and
occlusion compromise the integrity of neuronal and glial cells due to the
penetration of inflammatory and cytotoxic molecules into the retina, the loss of
function of the glial barrier and its increased expression of inflammatory cytokines
and free radicals compromise the vascular functionality.[21] This relationship is
explained by the fact that the vascular and the neuroglial components of the
31
retina come together to form the so-called ‘neurovascular unity’ of the retina,
which is altered during the course of DM. It refers to the physical and biochemical
relationship which exists between the neurons, the glia and the capillaries and to
the close interdependence of these structures which permits the regulation of
neuronal energy homeostasis and of neurotransmission. In addition, the
interaction between the glial cells, neurons, endothelial cells and pericytes
promotes the formation of the blood-retinal barrier which controls the passage of
fluids and blood metabolites inside the nervous system parenchyma.
In the internal retina, the neurovascular unity includes astrocytes, Müller cells,
amacrine and ganglion cells, all placed in proximity of capillaries, a source of
oxygen and nutrients, inside the GCL and on the borders of INL: the close
connection of these structures is shown by the retinal blood flow regulation by the
glial cells and by cellular metabolites. The neurovascular unity of the external
retinal, instead, sees the photoreceptors and Müller cells paired metabolically in
order to support the visual function through the diffusion of oxygen and nutrients
by the choroidal vessels through the EPR.[11]
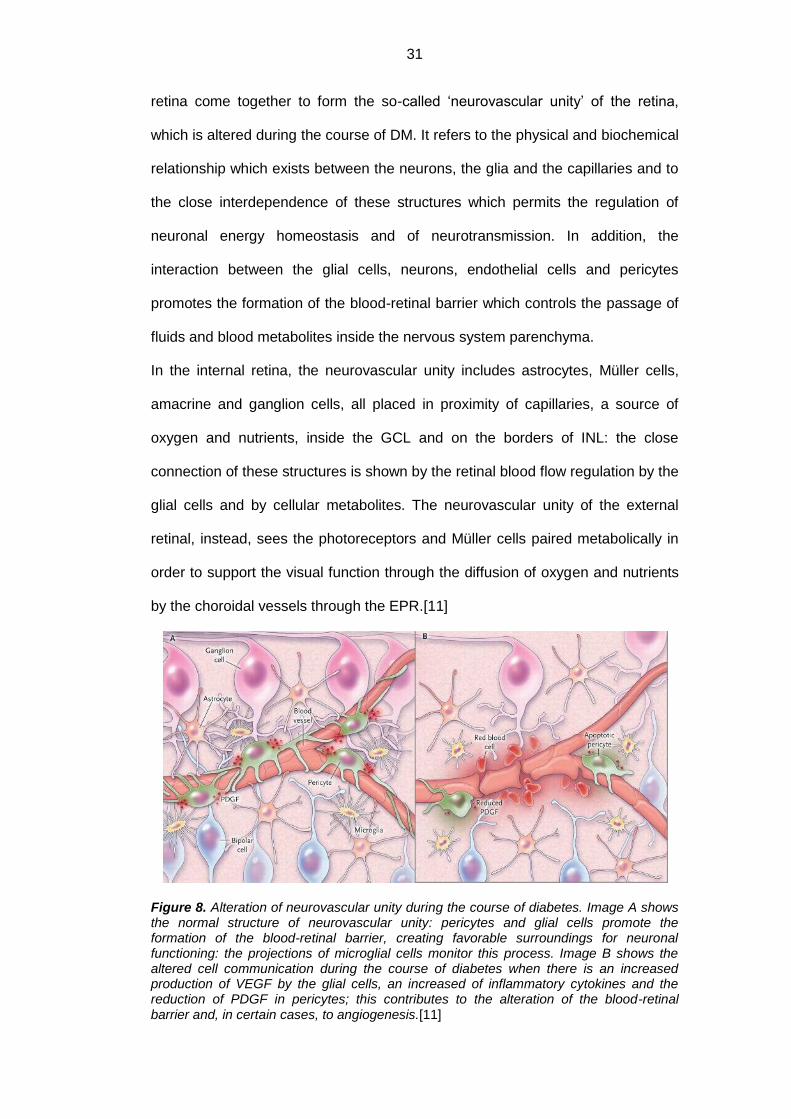
Figure 8. Alteration of neurovascular unity during the course of diabetes. Image A shows the normal structure of neurovascular unity: pericytes and glial cells promote the formation of the blood-retinal barrier, creating favorable surroundings for neuronal functioning: the projections of microglial cells monitor this process. Image B shows the altered cell communication during the course of diabetes when there is an increased production of VEGF by the glial cells, an increased of inflammatory cytokines and the reduction of PDGF in pericytes; this contributes to the alteration of the blood-retinal barrier and, in certain cases, to angiogenesis.[11]
32
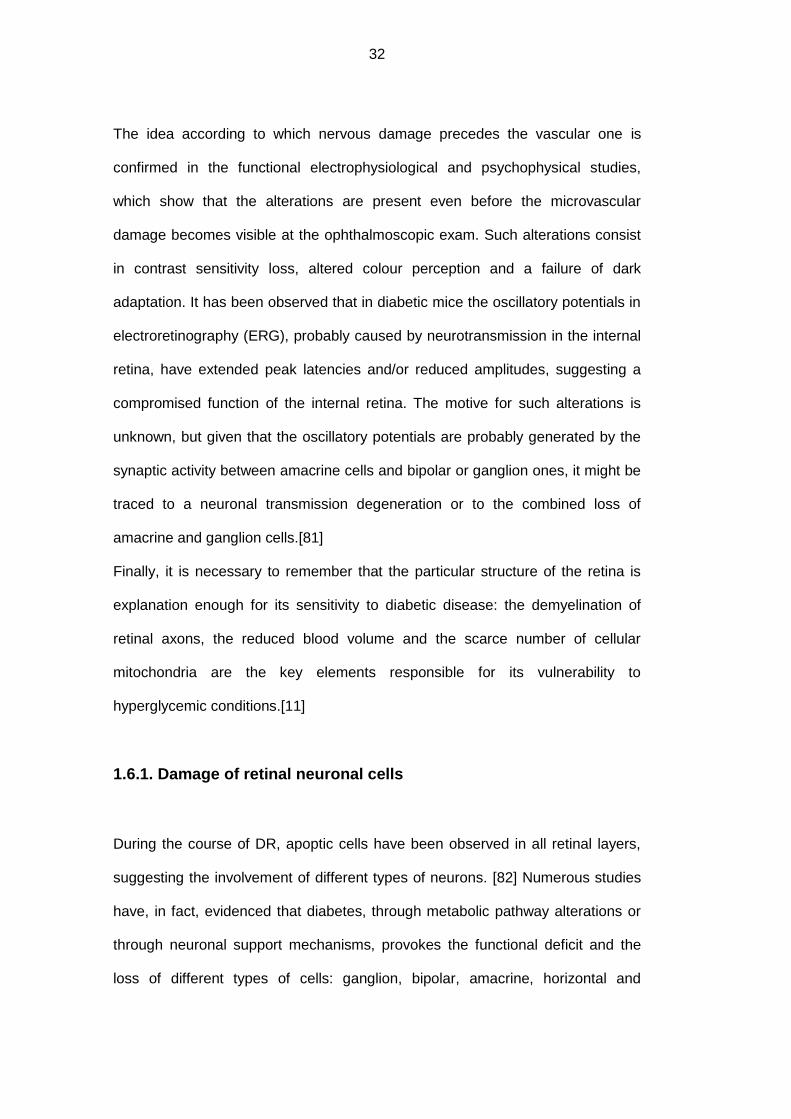
The idea according to which nervous damage precedes the vascular one is
confirmed in the functional electrophysiological and psychophysical studies,
which show that the alterations are present even before the microvascular
damage becomes visible at the ophthalmoscopic exam. Such alterations consist
in contrast sensitivity loss, altered colour perception and a failure of dark
adaptation. It has been observed that in diabetic mice the oscillatory potentials in
electroretinography (ERG), probably caused by neurotransmission in the internal
retina, have extended peak latencies and/or reduced amplitudes, suggesting a
compromised function of the internal retina. The motive for such alterations is
unknown, but given that the oscillatory potentials are probably generated by the
synaptic activity between amacrine cells and bipolar or ganglion ones, it might be
traced to a neuronal transmission degeneration or to the combined loss of
amacrine and ganglion cells.[81]
Finally, it is necessary to remember that the particular structure of the retina is
explanation enough for its sensitivity to diabetic disease: the demyelination of
retinal axons, the reduced blood volume and the scarce number of cellular
mitochondria are the key elements responsible for its vulnerability to
hyperglycemic conditions.[11]
1.6.1. Damage of retinal neuronal cells
During the course of DR, apoptic cells have been observed in all retinal layers,
suggesting the involvement of different types of neurons. [82] Numerous studies
have, in fact, evidenced that diabetes, through metabolic pathway alterations or
through neuronal support mechanisms, provokes the functional deficit and the
loss of different types of cells: ganglion, bipolar, amacrine, horizontal and
33
photoreceptor. The data generally demonstrates an early dysfunction of the inner
retina, followed by subsequent effects on the outer retina.[83]
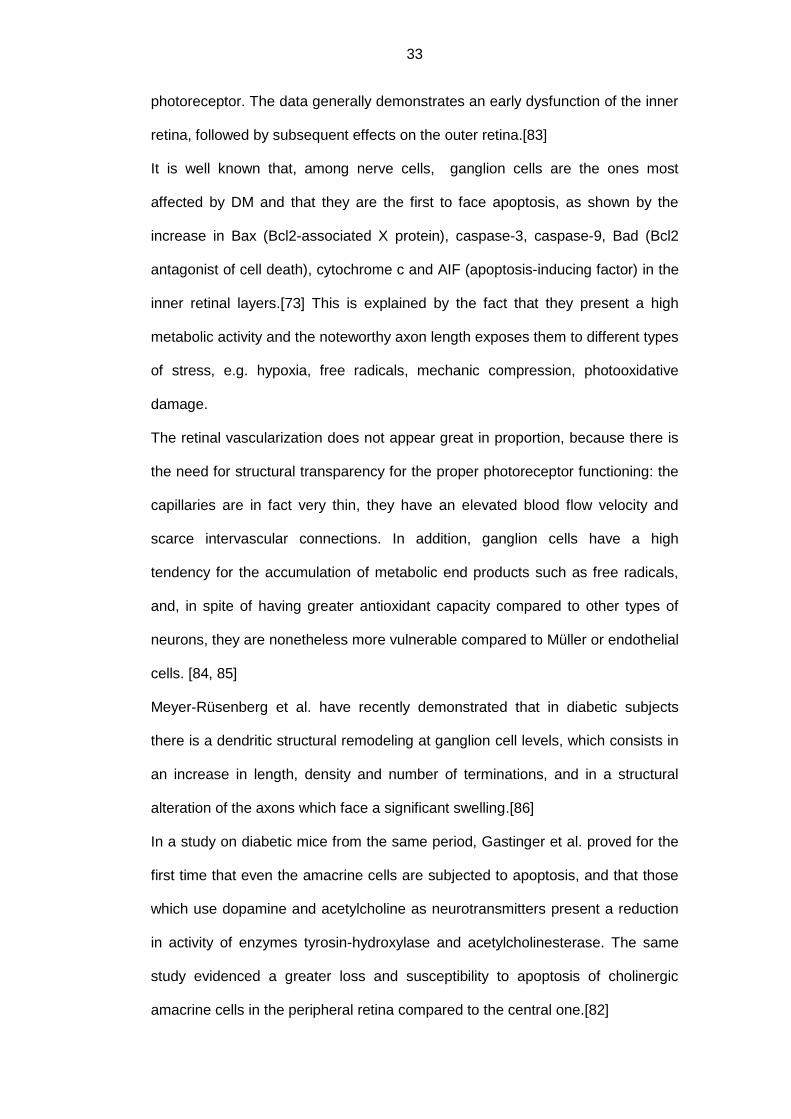
It is well known that, among nerve cells, ganglion cells are the ones most
affected by DM and that they are the first to face apoptosis, as shown by the
increase in Bax (Bcl2-associated X protein), caspase-3, caspase-9, Bad (Bcl2
antagonist of cell death), cytochrome c and AIF (apoptosis-inducing factor) in the
inner retinal layers.[73] This is explained by the fact that they present a high
metabolic activity and the noteworthy axon length exposes them to different types
of stress, e.g. hypoxia, free radicals, mechanic compression, photooxidative
damage.
The retinal vascularization does not appear great in proportion, because there is
the need for structural transparency for the proper photoreceptor functioning: the
capillaries are in fact very thin, they have an elevated blood flow velocity and
scarce intervascular connections. In addition, ganglion cells have a high
tendency for the accumulation of metabolic end products such as free radicals,
and, in spite of having greater antioxidant capacity compared to other types of
neurons, they are nonetheless more vulnerable compared to Müller or endothelial
cells. [84, 85]
Meyer-Rüsenberg et al. have recently demonstrated that in diabetic subjects
there is a dendritic structural remodeling at ganglion cell levels, which consists in
an increase in length, density and number of terminations, and in a structural
alteration of the axons which face a significant swelling.[86]
In a study on diabetic mice from the same period, Gastinger et al. proved for the
first time that even the amacrine cells are subjected to apoptosis, and that those
which use dopamine and acetylcholine as neurotransmitters present a reduction
in activity of enzymes tyrosin-hydroxylase and acetylcholinesterase. The same
study evidenced a greater loss and susceptibility to apoptosis of cholinergic
amacrine cells in the peripheral retina compared to the central one.[82]
34
Park et al. have observed that even the photoreceptors face apoptosis during the
course of diabetic pathology, with the consequent alteration in colour
distinguishing and a reduced blue-yellow contrast sensitivity. Given that the latter
characteristic is also common in Parkinson’s disease, it would appear that it
caused by a dopamine deficit.[82, 87] Photoreceptor apoptosis is exacerbated by
the iNOS hyperexpression on behalf of the bipolar cells through a vicious circle
involving glutamate-mediated exitotoxicity.[88]
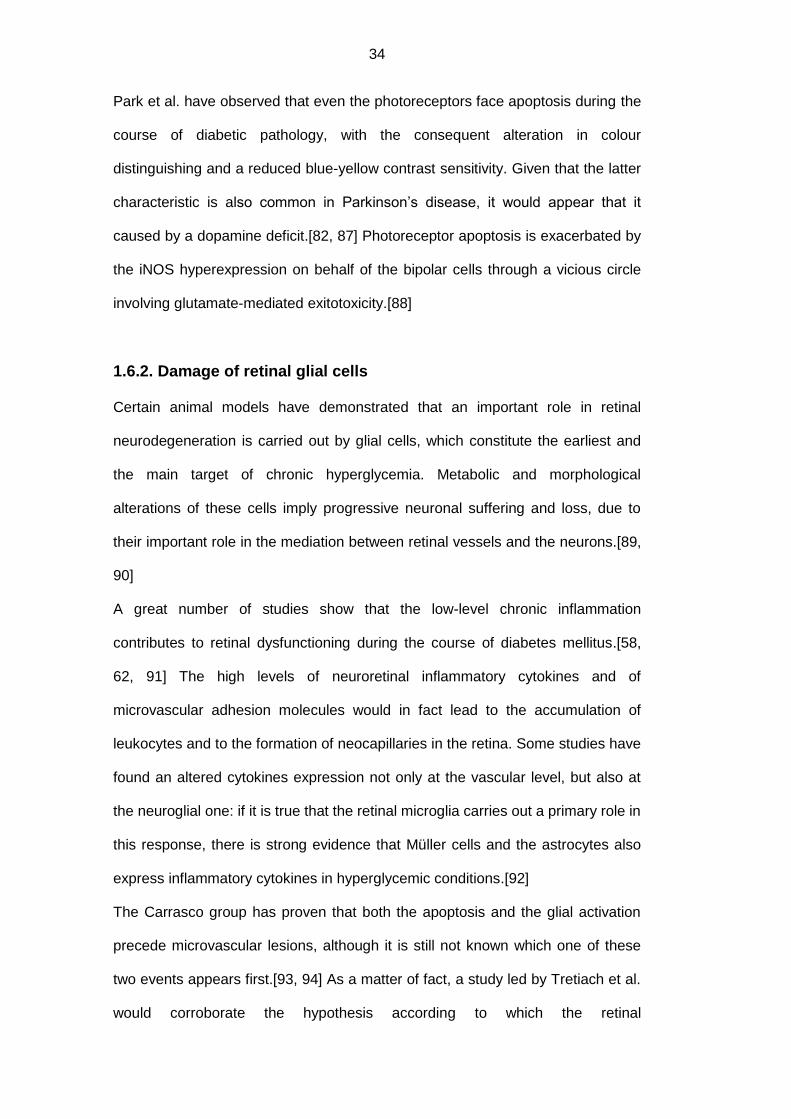
1.6.2. Damage of retinal glial cells
Certain animal models have demonstrated that an important role in retinal
neurodegeneration is carried out by glial cells, which constitute the earliest and
the main target of chronic hyperglycemia. Metabolic and morphological
alterations of these cells imply progressive neuronal suffering and loss, due to
their important role in the mediation between retinal vessels and the neurons.[89,
90]
A great number of studies show that the low-level chronic inflammation
contributes to retinal dysfunctioning during the course of diabetes mellitus.[58,
62, 91] The high levels of neuroretinal inflammatory cytokines and of
microvascular adhesion molecules would in fact lead to the accumulation of
leukocytes and to the formation of neocapillaries in the retina. Some studies have
found an altered cytokines expression not only at the vascular level, but also at
the neuroglial one: if it is true that the retinal microglia carries out a primary role in
this response, there is strong evidence that Müller cells and the astrocytes also
express inflammatory cytokines in hyperglycemic conditions.[92]
The Carrasco group has proven that both the apoptosis and the glial activation
precede microvascular lesions, although it is still not known which one of these
two events appears first.[93, 94] As a matter of fact, a study led by Tretiach et al.
would corroborate the hypothesis according to which the retinal
35
neurodegeneration and, more particularly, the Müller cell damage would activate
certain metabolic pathways which participate in microangiopathic processes and
in malfunctioning of the hemato-retinal barrier, crucial elements of the
pathogenesis of diabetic retinopathy.[95]
Since both glial cells and the vascular endothelial cells are found in close
association, Barber et al. suggested that the reactivity of the first ones is a direct
consequence of the infiltration of glucose and the inflammatory blood agents into
the nervous system parenchyma, and that, in its turn, the increased vascular
permeability is supported by the release of certain glial factors with the
consequent integrity loss by the hemato-retinal barrier.[96]
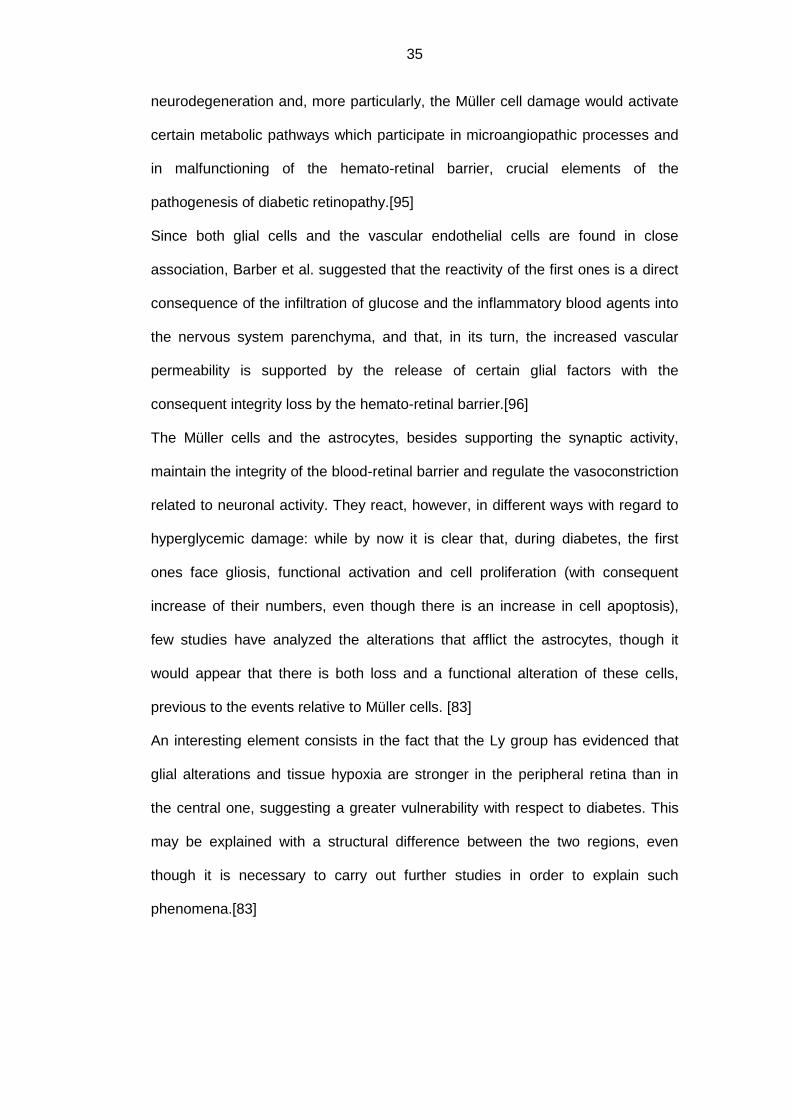
The Müller cells and the astrocytes, besides supporting the synaptic activity,
maintain the integrity of the blood-retinal barrier and regulate the vasoconstriction
related to neuronal activity. They react, however, in different ways with regard to
hyperglycemic damage: while by now it is clear that, during diabetes, the first
ones face gliosis, functional activation and cell proliferation (with consequent
increase of their numbers, even though there is an increase in cell apoptosis),
few studies have analyzed the alterations that afflict the astrocytes, though it
would appear that there is both loss and a functional alteration of these cells,
previous to the events relative to Müller cells. [83]
An interesting element consists in the fact that the Ly group has evidenced that
glial alterations and tissue hypoxia are stronger in the peripheral retina than in
the central one, suggesting a greater vulnerability with respect to diabetes. This
may be explained with a structural difference between the two regions, even
though it is necessary to carry out further studies in order to explain such
phenomena.[83]
36
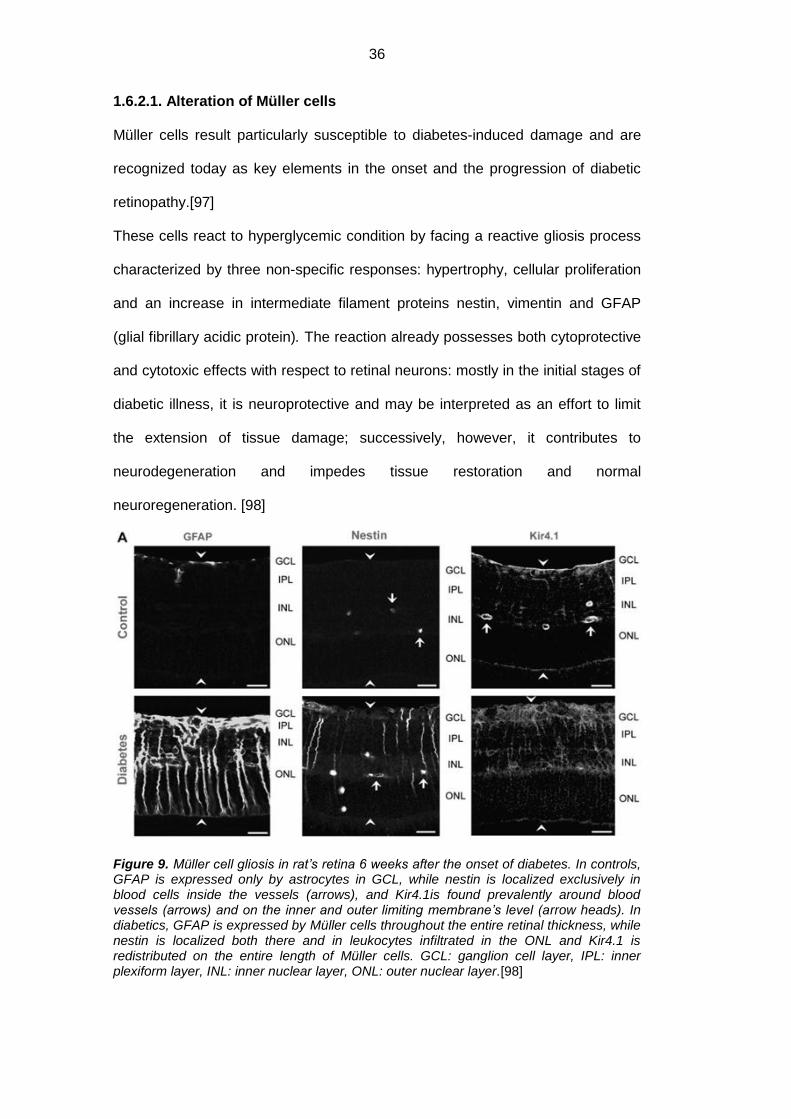
1.6.2.1. Alteration of Müller cells
Müller cells result particularly susceptible to diabetes-induced damage and are
recognized today as key elements in the onset and the progression of diabetic
retinopathy.[97]
These cells react to hyperglycemic condition by facing a reactive gliosis process
characterized by three non-specific responses: hypertrophy, cellular proliferation
and an increase in intermediate filament proteins nestin, vimentin and GFAP
(glial fibrillary acidic protein). The reaction already possesses both cytoprotective
and cytotoxic effects with respect to retinal neurons: mostly in the initial stages of
diabetic illness, it is neuroprotective and may be interpreted as an effort to limit
the extension of tissue damage; successively, however, it contributes to
neurodegeneration and impedes tissue restoration and normal
neuroregeneration. [98]
Figure 9. Müller cell gliosis in rat’s retina 6 weeks after the onset of diabetes. In controls, GFAP is expressed only by astrocytes in GCL, while nestin is localized exclusively in blood cells inside the vessels (arrows), and Kir4.1is found prevalently around blood vessels (arrows) and on the inner and outer limiting membrane’s level (arrow heads). In diabetics, GFAP is expressed by Müller cells throughout the entire retinal thickness, while nestin is localized both there and in leukocytes infiltrated in the ONL and Kir4.1 is redistributed on the entire length of Müller cells. GCL: ganglion cell layer, IPL: inner plexiform layer, INL: inner nuclear layer, ONL: outer nuclear layer.[98]

37
The neuroprotective effect involves different mechanism which entail the
alteration of potassium channels, excess glutamate re-uptake, antioxidant
release (e.g. glutathione, pyruvate, α-ketoglutarate, mettallothionein, lysozyme,
ceruloplasmin, and heme-oxygenase), production of growth factors and
neurotrophic factors (in particular GDNF, FGF, VEGF, PEDF and TGF-β),
cytokine and erythropoietin secretion, ascorbate reduction and the
dedifferentiation of Müller cells in stem cells.[98]
Nevertheless, with the protraction of detrimental stimuli, Müller cells increase the
expression of growth factors, which become harmful, and secrete
proinflammatory cytokines, which recruit the monocytes/macrophages (microglial
cells) and neutrophiles in the damaged area, which in turn release the oxygen
reactive species and cytotoxic cytokines.[99] Other alterations involve those of
aquaporins, carbonic anhydrase and glutamine-synthetase and of the production
of proteins involved in glycolysis; this comprises the damages of glia-neuron
interaction and acid-base and ion homeostasis, contributing to the development
of edema, neuronal hyperexcitability, glutamate toxicity and the increase in
sensitivity with respect to stress stimuli, along with neuronal dysfunction and
loss.[98]
Müller cells, having the ability to dedifferentiate themselves into cells which show
similar characteristics to pluripotent retinal progenitors, or into stem cells, cause
an instability in the removal of neurotransmitters and in the homeostasis of
potassium and water, with the consequent functional decoupling with respect to
neurons. Müller cells’ lack of support, moreover, may have an additional effect on
neuronal dysfunction and loss, increasing the susceptibility to stress stimuli in
pathological retina: these cells have a leading role in the regulation of osmotic
equilibrium, one of the main mechanisms involved in the development of diabetic
macular edema, regulating the water and potassium flows through cellular
membranes through AQP4 and Kir4.1,.[98, 100]
38
Müller cells may reenter the proliferative cycle, developing glial scarring, which
impedes tissue repair and neuroregeneration through inhibitory molecule
expression on the surface of reactive glial cells,.[99]
Diabetes, furthermore, induces the activation of the apoptotic cascade in these
cells, as well as their swelling caused not only by the alteration of potassium
channels but also by the alteration of proinflammatory enzymes. [101, 102]
Finally, it is necessary to consider that the compromission of the hemato-retinal
barrier consequent to the malfunctioning of Müller cells entails an increase of
vascular permeability as well as the extravasation into the perivascular space of
numerous sieric components, which stimulate the proliferation of the cells.[100]
1.6.2.2. Astrocyte alteration
Rungger-Brändle et al. have noticed that, during the course of diabetes mellitus,
the retinal astrocytes, even though gliosis alters them morphologically so that
they divide and extend their processes, reduce in number through apoptosis,
contrary to what happens to the Müller cells.[103] In spite of the fact that the two
types of cells share certain functions, the opposite reaction to hyperglycemic
conditions emphasizes the differences inherent in the process of their activation
and in their metabolism: it has been observed, in fact, that the expression of
sodium bicarbonate cotransporters is different and that the elective glycogen
accumulation in Müller cells expresses a different reworking of this molecule.
[104, 105] Since the astrocytes are preferentially in contact with ganglion cells
and retinal vessels, it is moreover possible that they are influenced by their
extracellular surroundings in a different way compared to Müller cells, which in
turn extend through the entire retina. [103]
A recent study carried out by the Bringmann group indicates that astrocyte
alterations usually take place early in course of diabetic pathology and are
accompanied by the inner retinal hypoxia and by the dysfunction of ganglion
39
cells, while the Müller cell gliosis and the compromission of nerve cells appear
later.[98] Since astrocytes are usually recognized as the modulators of neuronal
and vascular function, they seem to carry out a significant role in the
development of tissue hypoxia, in vascular alterations and in the dysfunction of
ganglion cells. Their close proximity to retinal vessels and to the ganglion cell
layer, as well as their role in the formation of blood vessels, neurovascular
coupling and the modulation of pathological neovascularization, makes them
critical modulators of early retinal changes during the course of diabetes.[83]
Mogi et al. have in fact demonstrated that the reduced astrocyte communication
and the diminished expression of proteins forming the retinal tight junctions,
characteristic for hyperglycemic conditions, seem to be connected to neuronal
dysfunction.[106]
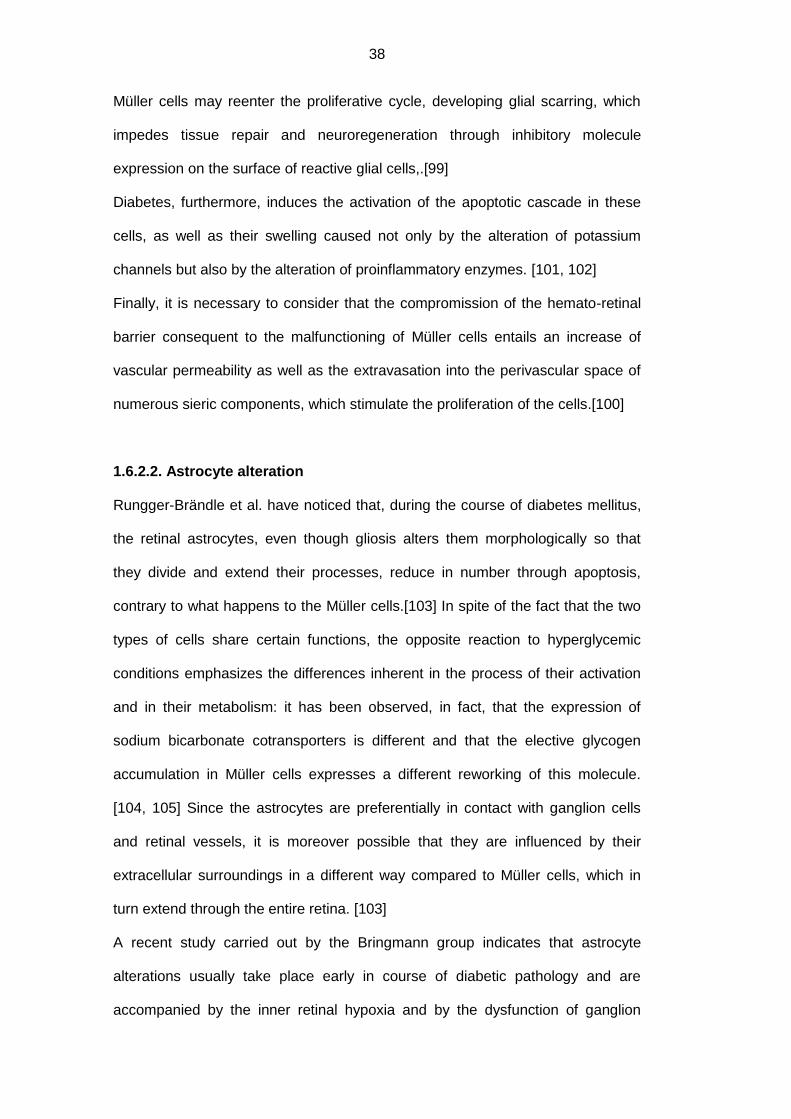
Ly et al. have recently observed that, in the periferal retina of mice, already four
weeks after the onset of diabetes, a connexin reduction can be found. This would
not only reflect a reduction in the formation of tight junctions and the consequent
compromission of astrocyte communication, but also the reduction of the
apoptosis-facing astrocytes. They have, moreover, evidenced that the early
astrocyte loss is accompanied by the reduced GFAP expression by these
cells.[83]
Figure 10. Alteration in the number and expression of GFAP and connexin in rat with early diabetes (4 weeks after the onset). The astrocytes, seen with the fluorescence
40
microscope, have been marked with antibodies for connexin-43 (in green) and for GFAP (in red): notice the reduction in cell number and expression of the two proteins in diabetics (B) compared to healthy controls (A). The bar corresponds to 50 μm.[83]
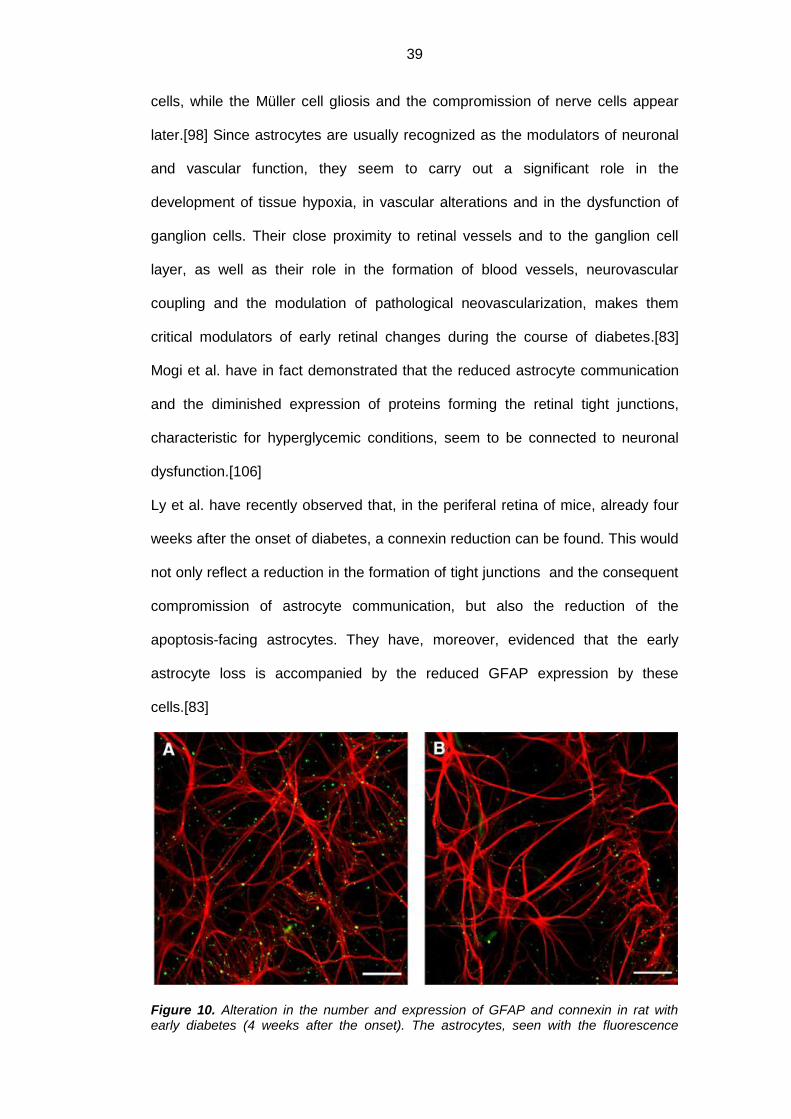
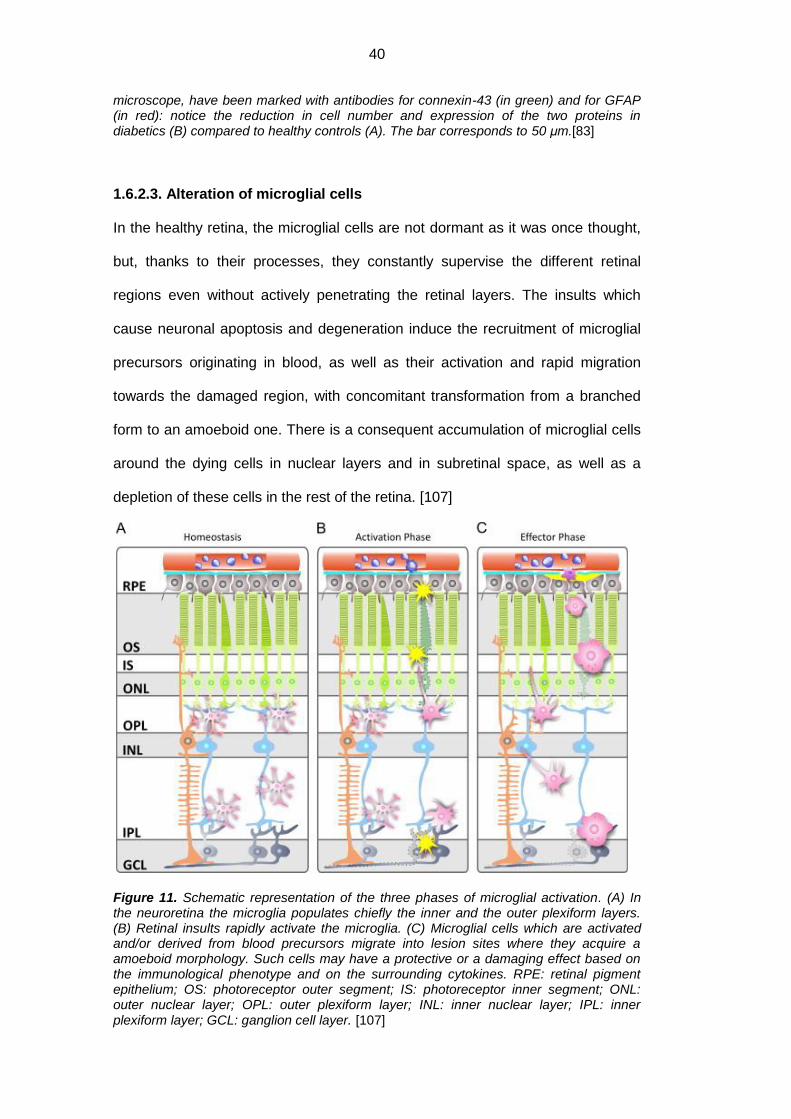
1.6.2.3. Alteration of microglial cells
In the healthy retina, the microglial cells are not dormant as it was once thought,
but, thanks to their processes, they constantly supervise the different retinal
regions even without actively penetrating the retinal layers. The insults which
cause neuronal apoptosis and degeneration induce the recruitment of microglial
precursors originating in blood, as well as their activation and rapid migration
towards the damaged region, with concomitant transformation from a branched
form to an amoeboid one. There is a consequent accumulation of microglial cells
around the dying cells in nuclear layers and in subretinal space, as well as a
depletion of these cells in the rest of the retina. [107]
Figure 11. Schematic representation of the three phases of microglial activation. (A) In the neuroretina the microglia populates chiefly the inner and the outer plexiform layers. (B) Retinal insults rapidly activate the microglia. (C) Microglial cells which are activated and/or derived from blood precursors migrate into lesion sites where they acquire a amoeboid morphology. Such cells may have a protective or a damaging effect based on the immunological phenotype and on the surrounding cytokines. RPE: retinal pigment epithelium; OS: photoreceptor outer segment; IS: photoreceptor inner segment; ONL: outer nuclear layer; OPL: outer plexiform layer; INL: inner nuclear layer; IPL: inner plexiform layer; GCL: ganglion cell layer. [107]

41
Certain studies have shown that the retinal inflammation during the course of
diabetes mellitus is a relatively early event, and that is precedes the vascular
dysfunction and the neuronal degeneration. 108] Microglial activation has been
recognized as the main responsible for the initial inflammatory response, even
though the exact mechanism through which it releases inflammatory cytokines
remains in the dark.[109]
The activated microglia secretes cytokines and other proinflammatory molecules
used for the phagocytosis and the destruction of damaged cells, as well as for the
triggering of reparation processes which lead to the formation of glial scars. If it
remains in an activated state, however, the cytokines may damage the
neighbouring cells, particularly the neuronal and the vascular ones, leading to the
onset of other retinal pathologies, such as the retinal degeneration and the
glaucoma.[109] In compliance with this thesis, numerous histopathological
studies done on both animals and humans have evidenced the activation of
microglial cells, as well as the presence of different inflammatory molecules
secreted by the microglia, usually associated with neuronal and endothelial
death. [103, 110-113]
Despite the fact that the mechanisms at the base of microglial activation remain
unknown, it has been supposed that the glycated albumin, accumulated in the
inner retinal layers due to increased vascular permeability, and probably partially
produced on local level, can provoke these cells to produce inflammatory
molecules. This would induce the TNF-α secretion in microglia as well as the
localized secretion of proinflammatory cytokines, growth factors and other
bioactive molecules through the connection to different cellular types and various
metabolic pathways, carrying out important roles in the onset and the progression
of diabetic retinopathy.[109, 114]
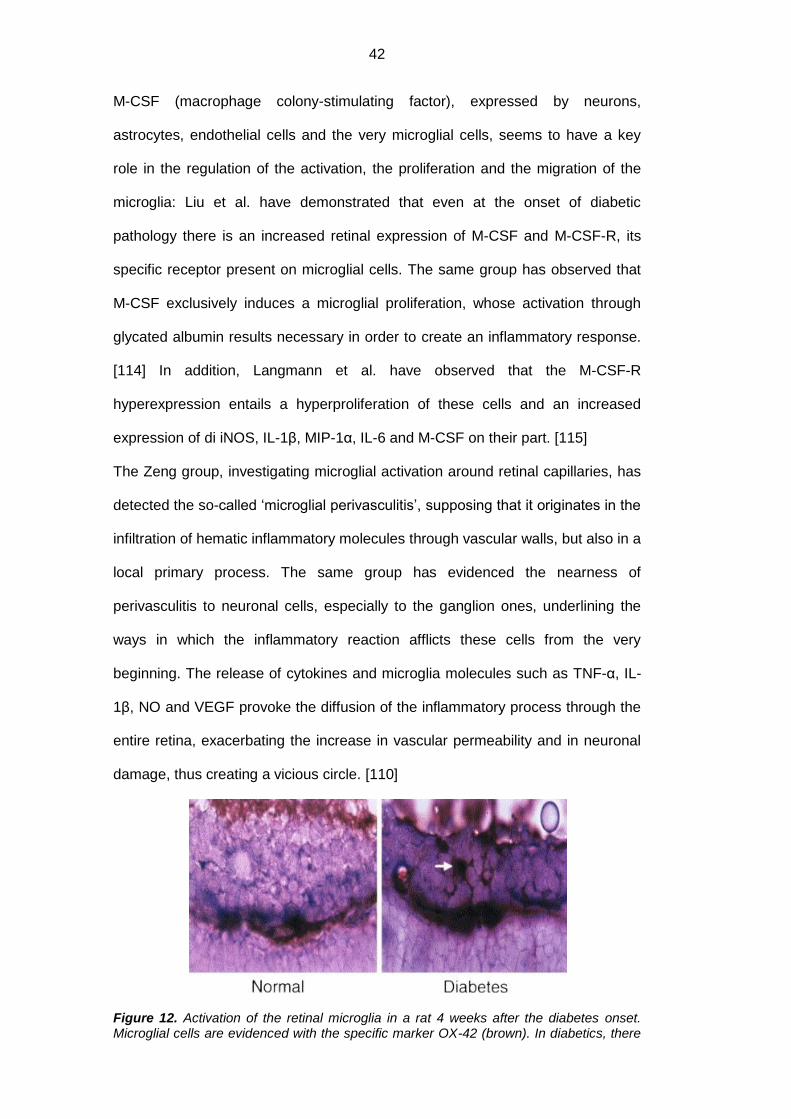
42
M-CSF (macrophage colony-stimulating factor), expressed by neurons,
astrocytes, endothelial cells and the very microglial cells, seems to have a key
role in the regulation of the activation, the proliferation and the migration of the
microglia: Liu et al. have demonstrated that even at the onset of diabetic
pathology there is an increased retinal expression of M-CSF and M-CSF-R, its
specific receptor present on microglial cells. The same group has observed that
M-CSF exclusively induces a microglial proliferation, whose activation through
glycated albumin results necessary in order to create an inflammatory response.
[114] In addition, Langmann et al. have observed that the M-CSF-R
hyperexpression entails a hyperproliferation of these cells and an increased
expression of di iNOS, IL-1β, MIP-1α, IL-6 and M-CSF on their part. [115]
The Zeng group, investigating microglial activation around retinal capillaries, has
detected the so-called ‘microglial perivasculitis’, supposing that it originates in the
infiltration of hematic inflammatory molecules through vascular walls, but also in a
local primary process. The same group has evidenced the nearness of
perivasculitis to neuronal cells, especially to the ganglion ones, underlining the
ways in which the inflammatory reaction afflicts these cells from the very
beginning. The release of cytokines and microglia molecules such as TNF-α, IL-
1β, NO and VEGF provoke the diffusion of the inflammatory process through the
entire retina, exacerbating the increase in vascular permeability and in neuronal
damage, thus creating a vicious circle. [110]
Figure 12. Activation of the retinal microglia in a rat 4 weeks after the diabetes onset. Microglial cells are evidenced with the specific marker OX-42 (brown). In diabetics, there
43
is an increase in brown stains and in digitiform protrusions inside the ganglion cell layer (marked by the arrow) [90]
1.7. Biomarkers of glial activation during the course of
diabetic pathology
1.7.1. Aquaporins
The aquaporins (AQPs) are a family of integral membrane proteins with low
molecular weight (about 30kDa/monomer) arranged in tetramers, which mediate
the transcellular flow of free water and in some cases of gas and solutes. The
isoforms 3, 7 and 9 are called ‘aquaglyceroporins’ because of their ability to
transport also glycerol and other small solutes, such as ions, urea and lactate.
The aquaporins have a crucial task in the preservation of the ion- and osmotic
equilibrium inside the CNS, neuroretina included, in response to different osmotic
gradients and hydrostatic pressures. [116]
Tenckhoff et al. have demonstrated that the human retina expresses the mRNA
of all the 13 isoforms (AQP0-12) identified in mammals. [117] The
immunohistochemical studies carried out so far, however, have confirmed the
expression of only few aquaporins in the eye of a healthy mammal (mouse, pig,
horse, rabbit and man):
AQP0: in the lens epithelium and in neuroretina (at bipolar cell, amacrine
cell and ganglion cell levels);
AQP1: in the endothelium of the cornea and the iridocorneal trabecular
meshwork, in the epithelium of the cilliary body, the lens and the iris, in
the RPE and in the neuroretina (in amacrine cells and photoreceptors);
AQP3: in the conjunctival and the corneal epitheliums and in RPE;
AQP4: in the ciliary epithelium, the lachrymal gland epithelium and the
neuroretina (in Müller cells and astrocytes);
44
AQP5: in epitheliums of lachrymal glands, the conjunctiva and the lens.
AQP6: in the neuroretina (Müller cells);
AQP9: in the neuroretina (amacrine and ganglion cells).
It is therefore understood that so far only some isoforms (AQP0, AQP1, AQP4,
AQP6, AQP9) have been detected in the neuroretinal level of a healthy
mammal.[118-130] The presence of these proteins has been confirmed in most
cases inside the human eye as well. [131-141] Among the various aquaporins,
AQP1 and AQP4 have received the greatest attention, because it has been
demonstrated that, in the CNS, they not only facilitate the bidirectional flow of free
water through the cerebral parenchyma, but that they also modulate the neuronal
excitability and potentiate the astrocyte migration; lastly, they seem to be involved
in the production of aqueous humour. [116]
In normal conditions, the fluids that accumulate inside the neuroretina and in
subretinal space are reversed into the blood via transcellular transport
osmotically coupled with the flow of various molecules, especially ions, at the
level of the retinal pigment epithelium, of Müller cells and of astrocytes. The
aquaporins facilitate the transcellular water flow: AQP1 in RPE and AQP4 in
astrocytes and Mϋller cells. The last two cell types regulate the flow of potassium
released by active neurons, which would, if present in excess on the extracellular
level, induce neuronal hyperexcitability.
Above all, Müller cells express different channels for this ion, the most important
ones being the Kir2.1 (inwardly rectifying potassium 2.1), expressed in the parts
of the membrane contiguous to neuronal cells, and the Kir4.1 (inwardly rectifying
potassium 4.1), expressed in the parts surrounding the blood vessels, in both
retinal membranes and in the parts facing the vitreous (i.e. in terminal parts of
thick fibers). Kir2.1 mediates a unidirectional potassium flow directed at the inside
of Müller cells, while the Kir4.1 mediates bidirectional currents between the
extraretinal tissue and the cells themselves. The co-localization of Kir4.1 and
45
AQP4 around the vessels, at the retinal limiting membrane level and at the border
with the vitreous, and the co-localization of Kir2.1 and AQP4 at the border with
the neuronal cells, indicate the coupling of the free water transport with the
potassium transport, through which Müller cells maintain the homeostasis inside
the inner retinal layers. [102, 140, 142, 143] It is, therefore, supposed that the
aquaporins and the potassium channels cooperate at maintaining the balance of
this ion inside the retina: during elevated neuronal activity, these molecules would
mediate the potassium and water uptake by the Müller cells, as well as the
successive outflow into the vitreous and into the vessels. Nagelhus et al. have
moreover observed that the microvilli are the only parts of these cells in which the
two types of channels show a clear difference of expression, a fact which seems
to have great functional importance: the combination of a low water permeability
and a high potassium permeability would, in fact, protect the subretinal space
from the inappropriate changes in volume. [142] Recent studies conducted on
mice have demonstrated that diabetes alters not only the expression but also the
localization of aquaporins.
The Iandiev group has observed that, in healthy mice, the AQP4 expressed by
Müller cells and astrocytes, is present in the most internal layers of the retina,
mainly around retinal vessels (both surface and deep ones), while the AQP1,
expressed by amacrine cells, photoreceptors and RPE, is located in more
external retinal layers. In diabetic mice, however, a strong additional expression
of AQP1 has been noticed inside the Müller cells in the internal layers, as well as
the aquaporin conversion from isoform 4 to isoform 1 in the portion of the
membrane surrounding the surface vessels in the retina, while the AQP4 remains
expressed in the portions adjacent to more profound vessels. The significance of
this change remains uncertain, although the presence of a similar alteration in the
retina after a transitory ischemia suggest that it may well mirror the conditions of
scarce profusion in diabetic mice.[126] Considering the total expression levels of

46
the two aquaporins in diabetic mice, various studies agree on the increase of
AQP1, while there are contrasting opinions with respect to AQP4. [116, 121, 144,
145] While the Zhang and Cui groups claim that AQP4 has increased, probably in
response to the edema, the Curtis group and the Fukuda group affirm that there
is a reduction of this channel, and the Gerhardinger group has not noticed any
variation.[97, 121, 146-148]
Figure 13. The alterated expression of AQP4 and Kir4.1 provoked by diabetes in the mouse retina. (a) In controls Kir4.1 and AQP4 are expressed at the membrane level by the Müller cells which surround the vessels (arrows) and in both limiting membranes (arrow heads); AQP4 is moreover localized in Müller cell membranes in both plexiform layers and in the ganglion cell layer. (b) In diabetic mice, the expression of Kir4.1 around the vessels and the limiting membranes results absent. (c) Deep vascular plexus inside the inner nuclear layer. The vessels are surrounded by AQP4 and Kir4.1 in controls and only by AQP4 in diabetic animals. GCL: ganglion cell layer; IPL: inner plexiform layer; INL inner nuclear layer; ONL: outer nuclear layer. [102]
The Bringmann and the Iandiev groups have observed that, when Müller cells’
damage is present, in the initial phases there is a failure in the coupling of water
47
and potassium channels in the inner layers caused by the redistribution and the
down-regulation of Kir4.1 at the levels of the vessels, the limiting membranes and
those confining the vitreous, while there are unchanged expressions of AQP4
and Kir2.1 at the interface with neuronal cells. This causes an unchanged
potassium uptake by the Müller cells but a compromission of its release, with
consequent accumulation and increase of the osmolarity of cytoplasm and the
glial swelling which could contribute to the neuronal death and the retinal edema.
[100, 102, 126] The AQP1 hyperexpression could therefore be explained as a
compensation attempt for the osmotic gradient between the blood and the retinal
tissue, a hypothesis that seem to be supported by the contemporaneous increase
in GFAP and the creation of apoptotic ganglion cells. [116, 126]
The reduced Kir4.1 expression in Müller cells would therefore be the responsible
for the massive retinal neuronal loss. In addition, ion imbalances caused by the
potassium channel alteration would contribute to the glutamate accumulation in
the extrasynaptic ambient due to its failed removal, and this would lead to the
compromission of the normal negative membrane potential.[100]
The Cui group, however, has recently observed an increased AQP4 expression
in diabetic mice 48 hours after the streptozotocin injection. The same group has
highlighted the ways in which the suppression of this channel’s expression
worsens the retinopathy through the aggravation of the inflammatory response
and the increase of proinflammatory molecules such as IL-1β, IL-6, ICAM-1 and
VEGF, and the increase of leukostasis. [147]
It has been recently suggested that even the AQP4-AQP1 shift in the astrocytes
may lead to the imbalance of water and other solutes between the astrocytes and
the ganglion cells, with consequent increase of the apoptosis of the latter. [121]
The Iandiev and Holborn group have observed that AQP6 is selectively
expressed in the membranes of Müller cells surrounding the synapse at the OPL
level. [122, 144] The second group has furthermore noticed a reduced

48
expression of this channel in diabetic mice, which is similar to what happens in
the blue-light-induced damage. Given that the AQP6 has a low permeability with
respect to the water, and that it prevalently functions as a passage channel for
ions and hydrophilic molecules such as glycerol and urea, it has been speculated
that it regulates the ion concentrations on the level of the OPL synapses: its
reduced expression would therefore imply an altered synaptic activity and the
consequent alteration in retinal functionality. [144]
In addition, Hollborn et al. have evidenced the expression in diabetic mice of
AQP5, AQP9, AQP11 and AQP12 inside the RPE, usually not located there.
AQP5, AQP11 and AQP12 could potentiate the water transport through the RPE,
in an attempt to contrast the subretinal edema. The AQP9, able to transport
water, ions and small solutes like lactate and glycerol, could facilitate the
elimination of the excess lactate; it has to be noted, however, that its expression
at the neuroretinal level remains unchanged during the course of diabetes.[144]
Figure 14. Variation of mRNA expression of different aquaporins in the diabetic rat retina determined by the RT-PCR. Significant difference between diabetic rats and the controls: *p<0.05; **p<0.01. Significant difference between the neuroretina and the RPE: •p<0.05; ••p<0.01.RPE: Retinal pigment epithelium. [144]
Lastly, Fukuda et al. have demonstrated an increased AQP0 expression in the
ganglion cells’ axons in the diabetic mice retina. The fact that such alteration has
not been registered either during the course of ischemia or during the course of
49
glaucoma, seems to suggest that it is specific to diabetes, even though further
studies need to be conducted in order to confirm this theory. [121]
1.7.2. Glial Fibrillary Acidic Protein (GFAP)
The GFAP (glial fibrillary acidic protein) is usually expressed only by astrocytes,
and is therefore detectable only in RNFL and GCL, while it results completely
absent in Müller cells. [83, 97-99, 101] The GFAP increase, a common marker for
reactive gliosis, is an early sensor for retinal stress preceding the microvascular
damage. [99, 149]
While it has been ascertained by now that Müller cells face an increased GFAP
production during the course of diabetes, there are some works which express
contrasting opinions regarding the GFAP expression in the astrocytes. [92, 150]
In past, the Lieth group had shown that there was an increased production of
such protein in both cell types, while the Rungger-Brändle group had not found
significant differences in the astrocyte numbers and the GFAP production in
diabetic mice compared to the healthy ones.[103, 151]
Subsequently, however, Barber et al. have demonstrated that in diabetic mice
there is an increased GFAP production only in Müller cells, and that this event is
preceded by its reduced expression on the part of the astrocytes: in this way, the
immunoreactivity of this protein is no longer limited exclusively to the RNFL and
GCL layers, but it extends through the entire thickness of the neuroretina. The
same authors have detected that the remarkable reduction of this protein in
astrocytes disappears soon after the administration of insulin. [96]
The data presented by the Barber group is considered the most correct today,
since he used immunohistochemical techniques applied to fresh histological
samples and not to frozen ones (in which the tissue structure is changed): this
has allowed for a more accurate cellular distinction.[96]

50
In addition, the recent demonstration by Kumar et al. of the GFAP increase and
cellular hyperplasia in astrocytes in the early stages of diabetic retinopathy can
be explained by the fact that the apoptosis and the dysfunction of these cells are
still not enough to reduction of the levels of this protein. [152]
Figure 15. Variation of GFAP expression in astrocytes and Müller cells in rat retina 4 months after the onset of diabetes, with or without the 48 hour insulin treatment.(A) Intensely GFAP immunofluorescent astrocytes in the healthy mouse. (B) The immunofluorescence for GFAP is almost imperceptible in the diabetic mouse. (C) The immunofluorescence for GFAP is elevated 48 hours after the insulin treatment. (D) Müller cells in the healthy mouse do not have immunofluorescence for GFAP. (E) Müller cells in the diabetic mouse are intensely immunoreactive for GFAP. (F) after the 48 hour insulin treatment, the immunoreactivity for GFAP is reduced. The bar corresponds to 50 μm.[96]
1.7.3. Inflammatory Molecules
Müller cells, astrocytes and microglia are the cells of the local innate immune
system. Under stress, they become active and produce proinflammatory
cytokines and growth factors in order to reconstruct the tissue homeostasis, but
in chronic pathologies like diabetic retinopathy, the persistent inflammatory
response leads to cellular death or damage.
Liou et al. have recently confirmed that the microglia faces the activation already
at beginning of diabetic pathology, producing a wide range of proinflammatory
cytokines, such as IL-1β, IL-3, IL-6, TNF-α, and other inflammation mediators like

51
ROS, glutamate, VEGF, lymphotoxins, metalloproteinase and NO. These
mediators induce the expression of adhesion molecules (I-CAM and V-CAM) in
vascular cells for lymphocytes and monocyte-macrophages, cellular apoptosis,
leukocyte infiltration and the weakening of the hemato-retinal barrier. [59]
The Langmann group has detected that the microglial cells are the responsible
for an increased retinal production of iNOS, IL-1β, MIP-1α, IL-6 and M-CSF.[115]
In addition, Shelton et al. have evidenced an increase in IL-1β, IL-6, IL-8, IL-13,
IP-10, ICAM-1 and NO in Müller and endothelial cells during the course of
diabetes, confirming their participation in the inflammatory process. [153]
Led by the fact that IL-1β is the main cytokine to trigger the neuroinflammatory
cascade, Liu et al. have also considered its role in the amplification of the
inflammation itself. This study has, in fact, highlighted that the IL-1β secretion
begins in the vascular endothelium as the direct consequence of chronic
hyperglycemia, which stimulates the endothelial, macroglial and microglial cells
via the autocrine and the paracrine pathways, which do not respond only with
activation signals, but also with the strengthening of IL-1β synthesis, thus exalting
the inflammatory process. [154]
Besides the already mentioned inflammatory mediators, it is well known that
many other mediators are expressed inside the retinal tissue during the course of
diabetes, since it is clear by now that inflammation has an essential role in
diabetic retinopathy. [62] It is generally thought that the microglial cells also
indirectly intervene in their production, due to their ability, via the production of
mentioned molecules, to behave as chemioattractants towards the other
leukocytes, especially the neutrophils and lymphocytes, which can strengthen the
inflammatory process. The analysis of retinal tissue, aqueous humor and the
vitreous have in fact detected the presence of other molecules besides those
already mentioned, such as TNF-α, MCP-1, RANTES, IL-10, IL-12, MCP-1, MIP-
1β, PDGF e SDF-1α.[62, 155, 156]
52
1.7.4. Glutamate and GABA (gamma-aminobutyric acid)
By now it determined that glial cells have an essential role in the regulation of
nerve activity and in the synaptic transmission in the retina thanks so the release
of so-called gliotransmitters, which have both an excitatory and an inhibitor effect
on the surrounding neurons. Among the various neuroactive molecules released,
glutamate and GABA have the task ofmodulating the neuronal activity in cellular
products: the excitation is mediated especially by glutamate, while GABA causes
neuronal inhibition. [157, 158]
In the healthy retina, Müller cells have an important role in the degradation of the
glutamate and GABA neurotransmitters, contributing to the proper functioning of
synaptic terminations: the glutamate, released on the extracellular level by the
neurons, is caught by Müller cells through the GLAST transporter (glutamate
aspartate transporter); here it is rapidly converted into glutamine and led back to
the neurons as a precursor of glutamate and GABA. [158]
Glutamate, despite being the main excitatory mediator in the retina and though it
permits the nerve signal transmission from the photoreceptors to bipolar cells and
then to ganglion cells, can result damaging if present in excessive doses at the
extracellular level: it in fact provokes the so-called excitotoxicity, i.e. a nerve
damage caused by hyperexcitation. It is the result of the hyperactivation of post-
synaptic receptors NMDA (n-methyl-d-aspartate) which provoke the opening of
the calcium channels on neuronal membranes; the consequent high intracellular
levels of this ion trigger a signal cascade leading to caspase-3 or AIF-mediated
cell death, and, stimulating the phospholipase, promote the release of cytotoxic
fatty acids into neurons and the extracellular space. [159, 160]
The excessive glutamate concentration in the retina is probably caused both by
the insufficient glutamine synthetase activity and the reduction in GLAST
transporters. [161] It would moreover seem that the high extracellular glutamate
53
levels induce the neuronal and glial swelling, with the consequent reduction of
extracellular space and neuronal hyperexcitability. [157]
A second fundamental function of Müller cells consists in the inactivation of the
inhibitory neurotransmitter GABA (gamma-aminobutyric acid). After its release by
the inhibitory interneurons, GABA is channeled into this type of glial cells and
then deviated into the Krebs cycle through the degradation carried out by GABA-
transaminase. The Ishikawa group has detected an increase in GABA levels in
diabetic rats’ Müller cells, caused either by the reduction of GABA-transaminase
activity or, more probably, by the compromission of the citric acid cycle: such an
increase would concur with the neuronal dysfunction. [162]
1.7.5. The Renin-Angiotensin System (RAS)
In the standard renin-angiotensin system (RAS), responsible on the systemic
level for the control of blood pressure, salt absorption and aldosterone formation,
the angiotensinogen is cleaved by the enzyme renin in order to form Ang I, which
is activated by Ang II of the ACE enzyme. Ang II acts through two receptors
AT1R and AT2R, the first of which seem to mediate most of the RAS functions.
[163]
In the recent years, many studies have shown that alongside the systemic RAS,
there are local RAS in different organs including the retina, where, besides
exercising nerve and vascular functions, it contributes to the regulation of the
aqueous humour pressure. Mice models have evidenced the presence of all RAS
components in the retina and a higher Ang I and Ang II concentration in the
anterior uvea, the retina, the retinal pigment epithelium and the choroid with
respect to the plasma, confirming the presence of a local system. Since it has
been observed that the most conspicuous RAS component is found on the level
of capillaries, neurons, the inner retinal layers’ glia, it is generally thought that
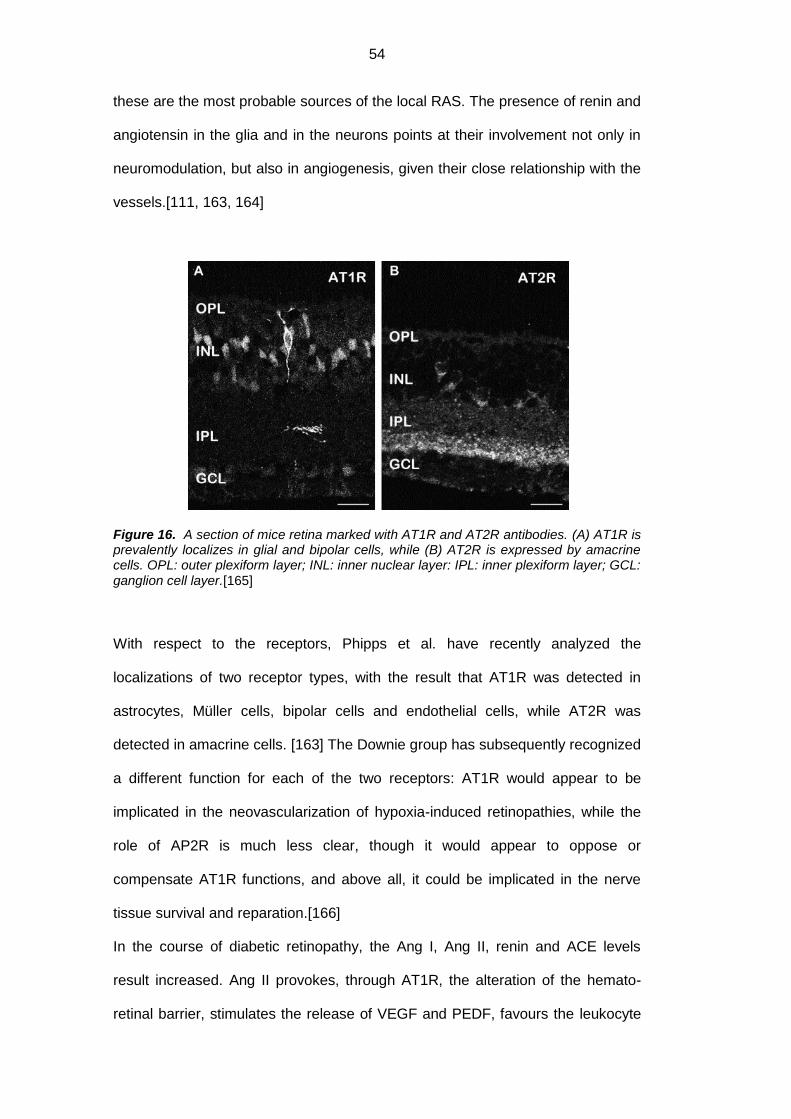
54
these are the most probable sources of the local RAS. The presence of renin and
angiotensin in the glia and in the neurons points at their involvement not only in
neuromodulation, but also in angiogenesis, given their close relationship with the
vessels.[111, 163, 164]
Figure 16. A section of mice retina marked with AT1R and AT2R antibodies. (A) AT1R is prevalently localizes in glial and bipolar cells, while (B) AT2R is expressed by amacrine cells. OPL: outer plexiform layer; INL: inner nuclear layer: IPL: inner plexiform layer; GCL: ganglion cell layer.[165]
With respect to the receptors, Phipps et al. have recently analyzed the
localizations of two receptor types, with the result that AT1R was detected in
astrocytes, Müller cells, bipolar cells and endothelial cells, while AT2R was
detected in amacrine cells. [163] The Downie group has subsequently recognized
a different function for each of the two receptors: AT1R would appear to be
implicated in the neovascularization of hypoxia-induced retinopathies, while the
role of AP2R is much less clear, though it would appear to oppose or
compensate AT1R functions, and above all, it could be implicated in the nerve
tissue survival and reparation.[166]
In the course of diabetic retinopathy, the Ang I, Ang II, renin and ACE levels
result increased. Ang II provokes, through AT1R, the alteration of the hemato-
retinal barrier, stimulates the release of VEGF and PEDF, favours the leukocyte
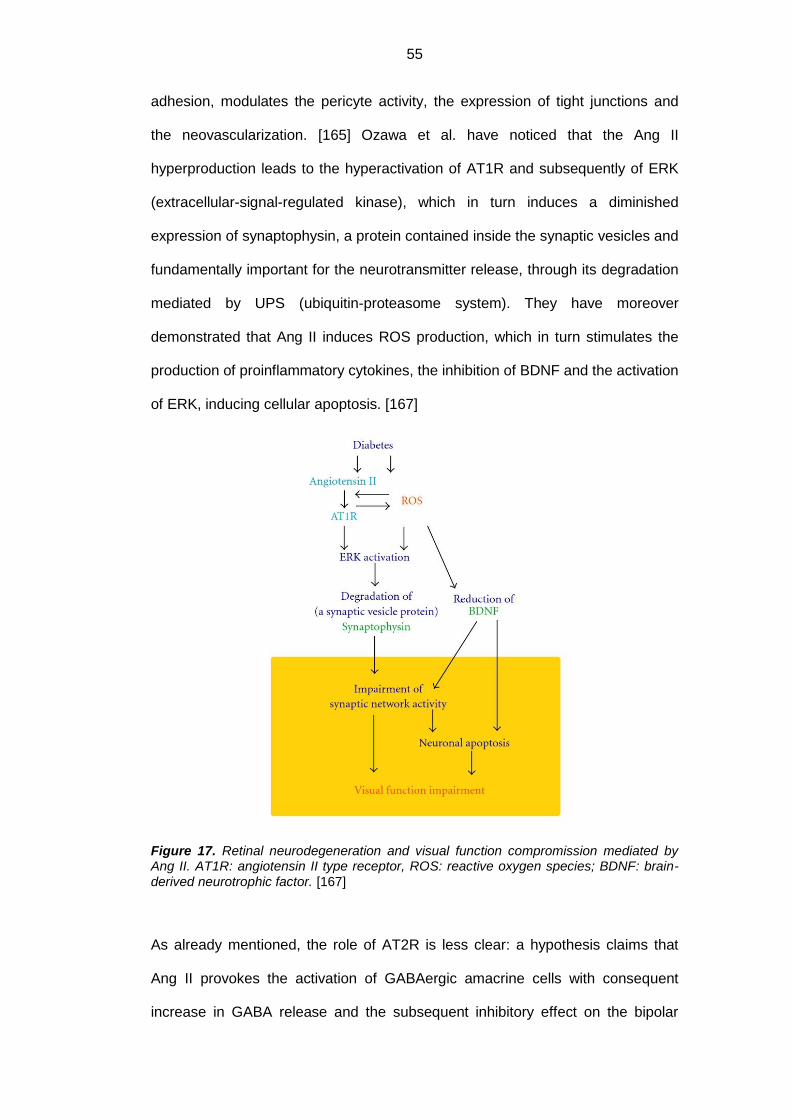
55
adhesion, modulates the pericyte activity, the expression of tight junctions and
the neovascularization. [165] Ozawa et al. have noticed that the Ang II
hyperproduction leads to the hyperactivation of AT1R and subsequently of ERK
(extracellular-signal-regulated kinase), which in turn induces a diminished
expression of synaptophysin, a protein contained inside the synaptic vesicles and
fundamentally important for the neurotransmitter release, through its degradation
mediated by UPS (ubiquitin-proteasome system). They have moreover
demonstrated that Ang II induces ROS production, which in turn stimulates the
production of proinflammatory cytokines, the inhibition of BDNF and the activation
of ERK, inducing cellular apoptosis. [167]
Figure 17. Retinal neurodegeneration and visual function compromission mediated by Ang II. AT1R: angiotensin II type receptor, ROS: reactive oxygen species; BDNF: brain-
derived neurotrophic factor. [167]
As already mentioned, the role of AT2R is less clear: a hypothesis claims that
Ang II provokes the activation of GABAergic amacrine cells with consequent
increase in GABA release and the subsequent inhibitory effect on the bipolar

56
cells in rods.[165] The hyperactivation of AT1R and AT2R would therefore have
an overall inhibitory effect on neuronal transmission, which would lead to
apoptosis.[31]
1.7.6. Reactive Oxygen Species (ROS)
Oxidative stress is another key factor of the neuroretinal damage during the
course of diabetes mellitus: it has been, in fact, observed in diabetic mice that the
administration of lutein, an antioxidant able to reduce local ROS, allows for the
normalization of the electroretinography (ERG) and the levels of synaptophysin,
as well as for the prevention of neuronal prevention.
The ROS cause the NO reduction in diabetic subject’s retina, a consequent
increase in peroxynitrite and the subsequent reduction of the NGF and BDNF,
responsible for the reduced neuronal growth and apoptosis, as well as the
compromission of synaptic activity.
The oxidative stress also provokes the damage of Müller cells, through the down-
regulation of Kir4.1 and AQP4 channels and the reduction of MMP-7 (matrix
metalloproteinase-7) which converts the pro-NGF, toxic for the neurons, into the
neuroprotector NGF. [167]
1.7.7. Advanced Glycation End-products (AGEs)
AGEs (advanced glycation end products) and ALEs (advanced lipoxidation end-
products) concur at the onset of retinal damage during the course of diabetes
mellitus. While it is generally acknowledged that the AGEs contribute to the
dysfunction of the hemato-retinal barrier, to the thickening of the capillary
basement membrane and to microvascular degeneration, the contribution of
ALEs is less clear, although it is known that both of them accumulate especially
inside Müller cells and that they are connected to the ROS generation and the
activation of proinflammatory and proapoptotic pathways. [97]
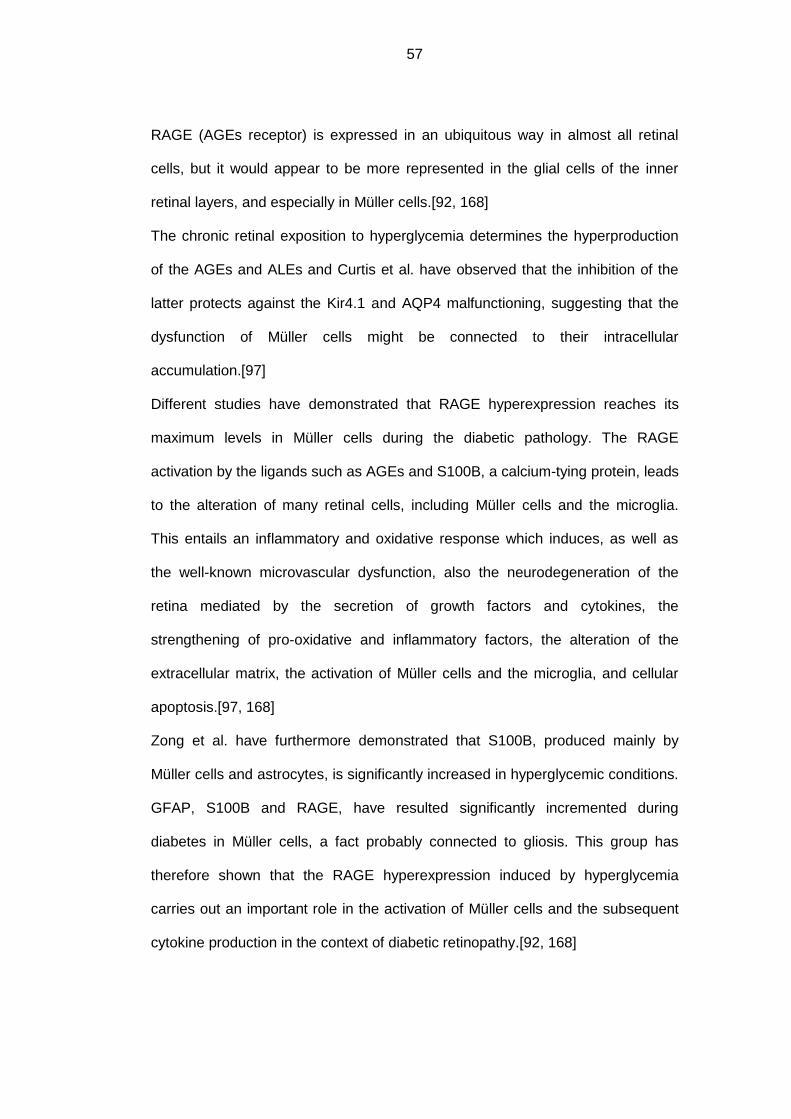
57
RAGE (AGEs receptor) is expressed in an ubiquitous way in almost all retinal
cells, but it would appear to be more represented in the glial cells of the inner
retinal layers, and especially in Müller cells.[92, 168]
The chronic retinal exposition to hyperglycemia determines the hyperproduction
of the AGEs and ALEs and Curtis et al. have observed that the inhibition of the
latter protects against the Kir4.1 and AQP4 malfunctioning, suggesting that the
dysfunction of Müller cells might be connected to their intracellular
accumulation.[97]
Different studies have demonstrated that RAGE hyperexpression reaches its
maximum levels in Müller cells during the diabetic pathology. The RAGE
activation by the ligands such as AGEs and S100B, a calcium-tying protein, leads
to the alteration of many retinal cells, including Müller cells and the microglia.
This entails an inflammatory and oxidative response which induces, as well as
the well-known microvascular dysfunction, also the neurodegeneration of the
retina mediated by the secretion of growth factors and cytokines, the
strengthening of pro-oxidative and inflammatory factors, the alteration of the
extracellular matrix, the activation of Müller cells and the microglia, and cellular
apoptosis.[97, 168]
Zong et al. have furthermore demonstrated that S100B, produced mainly by
Müller cells and astrocytes, is significantly increased in hyperglycemic conditions.
GFAP, S100B and RAGE, have resulted significantly incremented during
diabetes in Müller cells, a fact probably connected to gliosis. This group has
therefore shown that the RAGE hyperexpression induced by hyperglycemia
carries out an important role in the activation of Müller cells and the subsequent
cytokine production in the context of diabetic retinopathy.[92, 168]
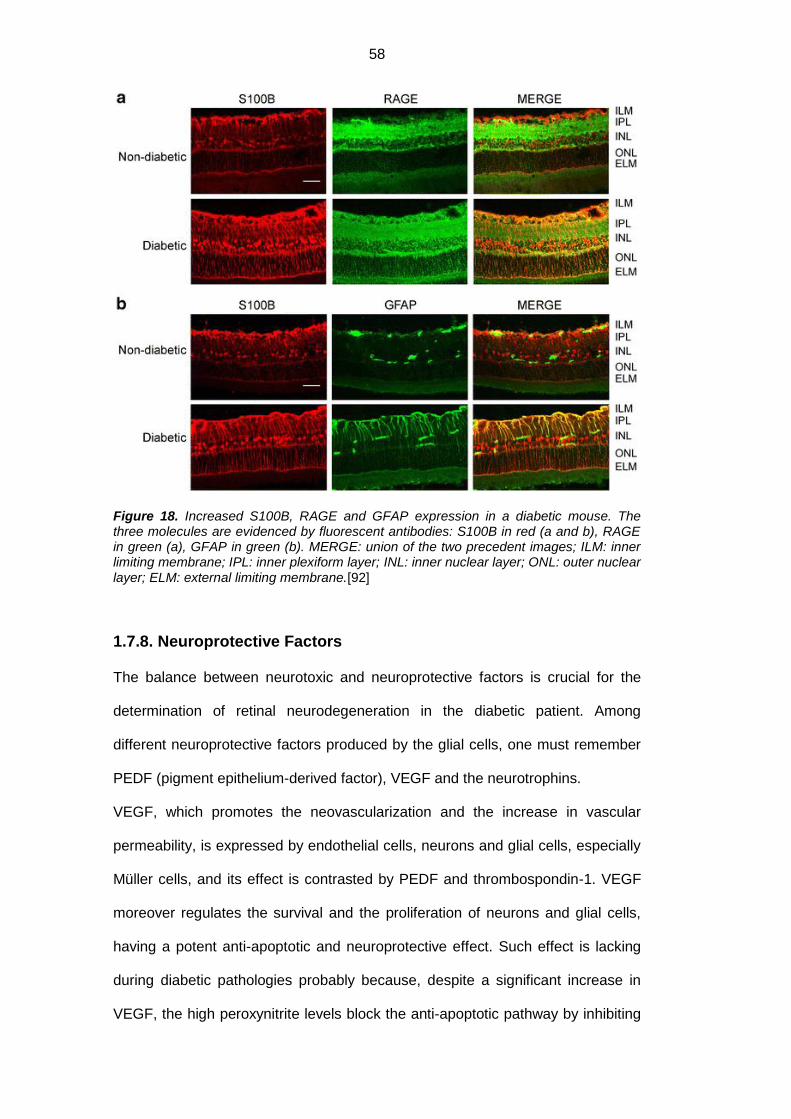
58
Figure 18. Increased S100B, RAGE and GFAP expression in a diabetic mouse. The three molecules are evidenced by fluorescent antibodies: S100B in red (a and b), RAGE in green (a), GFAP in green (b). MERGE: union of the two precedent images; ILM: inner limiting membrane; IPL: inner plexiform layer; INL: inner nuclear layer; ONL: outer nuclear layer; ELM: external limiting membrane.[92]
1.7.8. Neuroprotective Factors
The balance between neurotoxic and neuroprotective factors is crucial for the
determination of retinal neurodegeneration in the diabetic patient. Among
different neuroprotective factors produced by the glial cells, one must remember
PEDF (pigment epithelium-derived factor), VEGF and the neurotrophins.
VEGF, which promotes the neovascularization and the increase in vascular
permeability, is expressed by endothelial cells, neurons and glial cells, especially
Müller cells, and its effect is contrasted by PEDF and thrombospondin-1. VEGF
moreover regulates the survival and the proliferation of neurons and glial cells,
having a potent anti-apoptotic and neuroprotective effect. Such effect is lacking
during diabetic pathologies probably because, despite a significant increase in
VEGF, the high peroxynitrite levels block the anti-apoptotic pathway by inhibiting
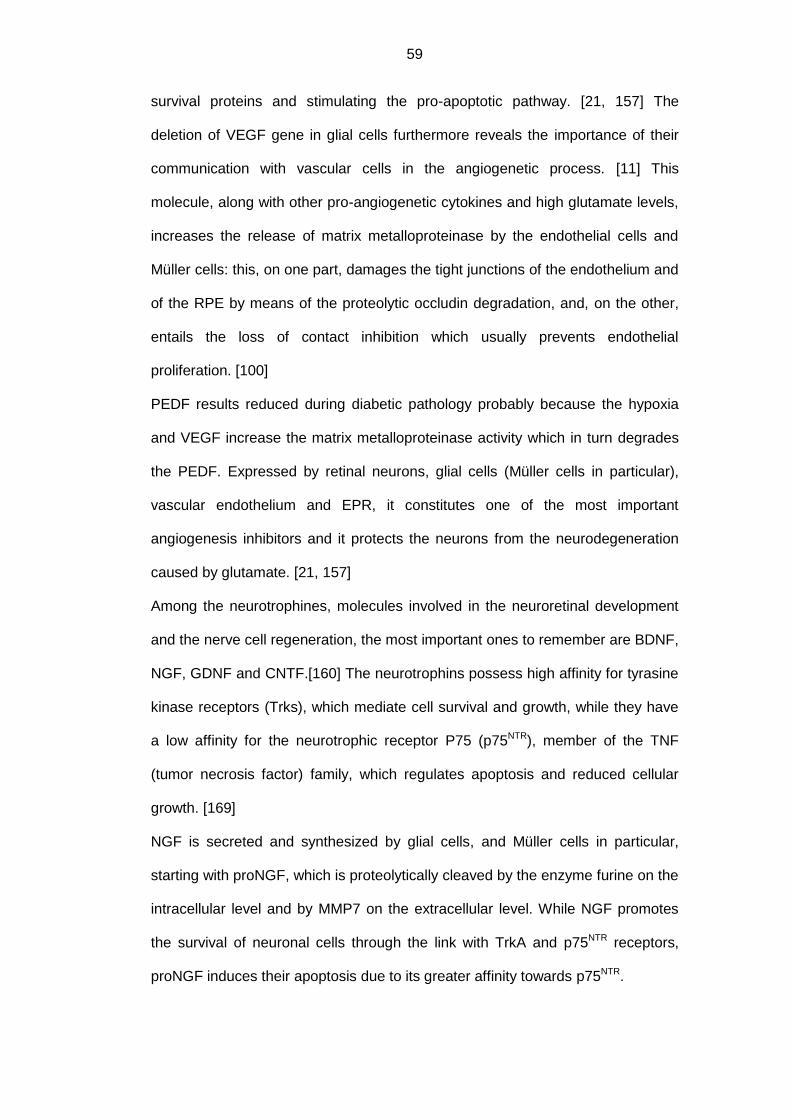
59
survival proteins and stimulating the pro-apoptotic pathway. [21, 157] The
deletion of VEGF gene in glial cells furthermore reveals the importance of their
communication with vascular cells in the angiogenetic process. [11] This
molecule, along with other pro-angiogenetic cytokines and high glutamate levels,
increases the release of matrix metalloproteinase by the endothelial cells and
Müller cells: this, on one part, damages the tight junctions of the endothelium and
of the RPE by means of the proteolytic occludin degradation, and, on the other,
entails the loss of contact inhibition which usually prevents endothelial
proliferation. [100]
PEDF results reduced during diabetic pathology probably because the hypoxia
and VEGF increase the matrix metalloproteinase activity which in turn degrades
the PEDF. Expressed by retinal neurons, glial cells (Müller cells in particular),
vascular endothelium and EPR, it constitutes one of the most important
angiogenesis inhibitors and it protects the neurons from the neurodegeneration
caused by glutamate. [21, 157]
Among the neurotrophines, molecules involved in the neuroretinal development
and the nerve cell regeneration, the most important ones to remember are BDNF,
NGF, GDNF and CNTF.[160] The neurotrophins possess high affinity for tyrasine
kinase receptors (Trks), which mediate cell survival and growth, while they have
a low affinity for the neurotrophic receptor P75 (p75NTR), member of the TNF
(tumor necrosis factor) family, which regulates apoptosis and reduced cellular
growth. [169]
NGF is secreted and synthesized by glial cells, and Müller cells in particular,
starting with proNGF, which is proteolytically cleaved by the enzyme furine on the
intracellular level and by MMP7 on the extracellular level. While NGF promotes
the survival of neuronal cells through the link with TrkA and p75NTR receptors,
proNGF induces their apoptosis due to its greater affinity towards p75NTR.
60
The inflammation and the oxidative stress observed during the course of diabetes
induce a ROD increase in the neuroretina which leads to a reduced NO
biodisponibility, despite its increased production, and to the formation of
peroxynitrite. High peroxynitrite levels cause the pro-NGF hyperproduction on the
part of activated Müller cells and they prevent its maturation into NGF through
MMP-7 inhibition: this leads to pro-NGF accumulation and NGF reduction with
consequent death of neuronal and endothelial cells and as well as the
compromission of the hemato-retinal barrier. The neurodegeneration is promoted
also by receptor alterations: although TrkA expression remains unchanged, its
activity is compromised, while the hyperexpression of p75NTR causes the
prevalence of apoptosis. [169-171] The increase of pro-NGF in the intraocular
tissue would hence signify an attempt by the cells to stimulate the inhibited
pathway, even though it results inefficient due to the alteration of receptor
pathways. [170]
BDNF is expressed in many retinal cells, including Müller cells and neuronal
cells, and is fundamental for the survival of ganglion and amacrine cells and for
the synaptic functionality, since BDNF protects the neurons from cellular death
via the tyrosine-kinase receptor TrkB. [172] BDNF levels are regulated also by
the neuronal synaptic activity, suggesting that their maintenance might involve
the preservation of synaptophysin. It has been stated that in the diabetic subject’s
retina the BDNF levels result reduced both in ganglion cells and in the Müller
cells. [173]
GDNF is usually expressed by photoreceptors, to a lesser extent when compared
to the Müller cells and the astrocytes. It induces a FGF increment in Müller cells,
and favours photoreceptor survival, protecting the ganglion cells from glutamate-
mediated apoptosis through the increased uptake of the latter by GLAST. Zhu et
al. have recently demonstrated that in hyperglycemic conditions there is an
hyperexpression of GDNF and its receptors GFRα1 and GFRα2 on the part of

61
Müller cells, suggesting that it might be a protective reaction directed toward the
nerve and glial cells. [98, 174]
Less known is the role of CNTF, which promotes the survival of photoreceptors
and ganglion cells. The levels of such molecule, produced by the Müller cells, the
asctrocytes and the RPE, increase the rate of retinal degeneration, which is quite
possibly also what happens in diabetic pathology.[98]
62
1.8. Spectral Domain OCT (SD-OCT)
Figure 19. Photo of SD-OCT HRA+OCT (Heidelberg Engineering, Heidelberg, Germany).
1.8.1. Comparison between Time Domain OCT (TD-OCT) and Spectral
Domain OCT (SD-OCT)
The optical coherence tomography (OCT) is a non invasive technique which
provides high resolution images of cross-sections of the retina in vivo. Compared
to CAT scans and ophtalmoscopy, it has a greater spatial resolution, an inferior
acquisition time, and it does not need direct contact with the ocular surface. [175]
Its use allows to obtain more precise distinctions of retinal layers compared with
the histological method, thanks to the system’s high definition. [20]
The OCT is based on the ‘low coherence interferometry’ technology, initially
applied in ophthalmology for the in vivo measurement of the ocular axial length.
The procedure is analogous to the CAT scan, but, because it uses light waves in
place of sound waves, it allows to measure the intensity and the delay time of the
light reflected echo pulses. [20]
63
The oldest type of Time Domain OCT (TD-OCT) emits, via a superluminescence
diode, a low-coherence light beam directed towards the retina with the
wavelength similar to the infrared (843 nm) one. This beam crosses a partially-
reflecting mirror which splits it in two beams: the reference beam and the sample
one. While the sample beam is directed towards the analyzed eye and is
reflected by the ocular tissues according to their distance and their characteristics
of density and thickness, the reference beam is reflected by a longitudinally
oscillating mirror. Both beams return to the partially-reflecting mirror around the
same time, recombine in the interferometer are transmitted to photosensitive
detector. The constructive interference between the light impulses reflected by
retinal structures and the reference mirror happens only if these impulses reach
the interferometer at the same time and only then it is possible to detect the
resulting signal and intensity.
The interferometer, therefore, detects, elaborates and memorizes the delay
schemes of the echoes coming from the retina and this operation is repeated in
the whole duration of the scan. The obtained bidimensional image (tomogram)
represents a cross-section of the tissue analyzed by the light beam, and the
difference, in terms of the frequencies absorbed by the tissues, is translated into
a number to which a colour or a shade of grey is assigned according to the
difference in reflectivity of the layers at different depths: the highly reflective
structures are visualized in brilliant colours like white or red (nerve fiber layer and
RPE), the low reflective structures are represented with darker colours like black
or blue (photoreceptor layer and the inner and the outer nuclear layers), while the
moderately reflecting structures appear grey-white or green (inner and outer
plexiform layers). The intensity of the signal depends on the optical properties if
the examined tissues’ structures and on different preretinal factors, e.g. media
opacity. [20, 175-178]
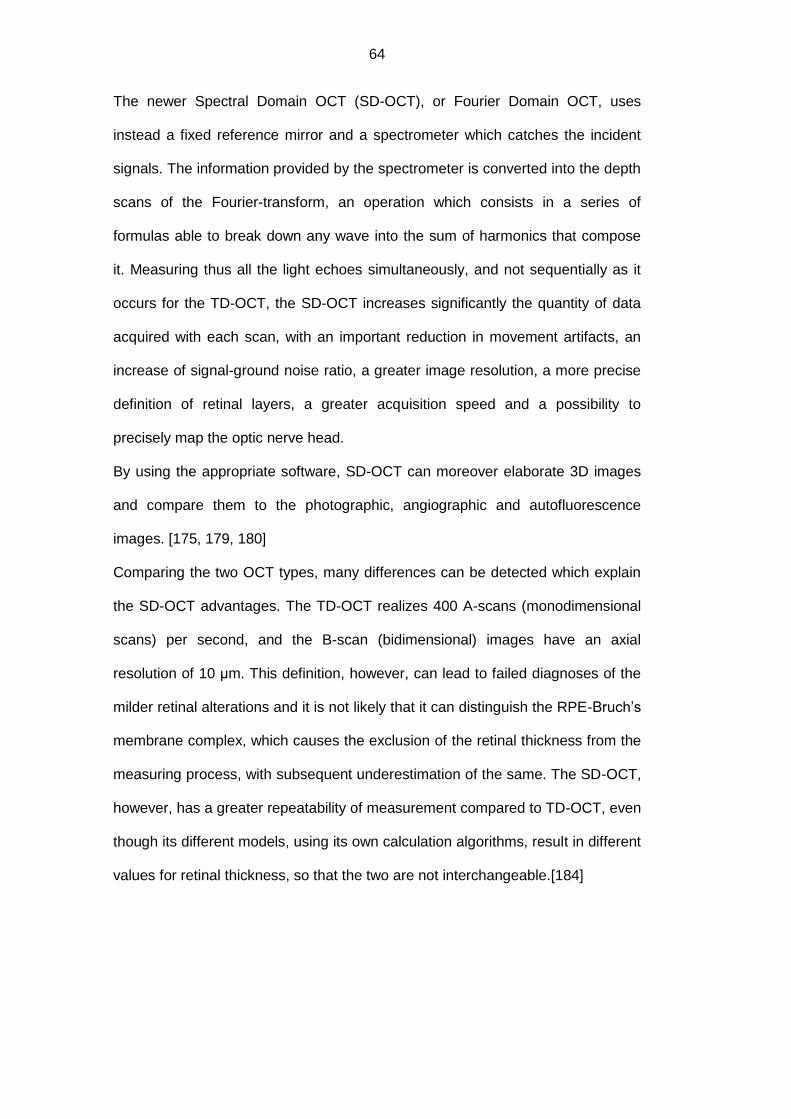
64
The newer Spectral Domain OCT (SD-OCT), or Fourier Domain OCT, uses
instead a fixed reference mirror and a spectrometer which catches the incident
signals. The information provided by the spectrometer is converted into the depth
scans of the Fourier-transform, an operation which consists in a series of
formulas able to break down any wave into the sum of harmonics that compose
it. Measuring thus all the light echoes simultaneously, and not sequentially as it
occurs for the TD-OCT, the SD-OCT increases significantly the quantity of data
acquired with each scan, with an important reduction in movement artifacts, an
increase of signal-ground noise ratio, a greater image resolution, a more precise
definition of retinal layers, a greater acquisition speed and a possibility to
precisely map the optic nerve head.
By using the appropriate software, SD-OCT can moreover elaborate 3D images
and compare them to the photographic, angiographic and autofluorescence
images. [175, 179, 180]
Comparing the two OCT types, many differences can be detected which explain
the SD-OCT advantages. The TD-OCT realizes 400 A-scans (monodimensional
scans) per second, and the B-scan (bidimensional) images have an axial
resolution of 10 μm. This definition, however, can lead to failed diagnoses of the
milder retinal alterations and it is not likely that it can distinguish the RPE-Bruch’s
membrane complex, which causes the exclusion of the retinal thickness from the
measuring process, with subsequent underestimation of the same. The SD-OCT,
however, has a greater repeatability of measurement compared to TD-OCT, even
though its different models, using its own calculation algorithms, result in different
values for retinal thickness, so that the two are not interchangeable.[184]

65
Figure 20. OCT images of the same non-pathologic macula made by (a) first generation TD-OCT (Stratus OCT), (b) second generation TD-OCT (Cirrus HD-OCT) and (c) SD-OCT (Spectralis HRA+OCT). Note the progressive improvement in image definition. [185]
In order that the OCT may be used for the qualitative evaluation of the structural
retinal pathologies caused by other ocular pathologies, e.g. diabetic retinopathy,
it is necessary to carry out a segmentation of different retinal layers, which
permits the individuation and the evaluation of thicknesses. There are, however,
two problems regarding the automatic segmentation: the first one consists in the
fact that the pathologic retina usually presents substantial alterations which can
affect the results of the procedure, and the second one consists in the fact that
the transparency loss of the dioptric media creates an unclear image with spotted
areas which hamper with the procedure. For these reasons, there is usually the
need for an operator to manually correct the automatic segmentation, thus
correcting the errors caused by accumulations of liquids in the retina. [186, 187]

66
1.8.2. The importance of OCT during the course of diabetic pathology
By now, it has been generally acknowledged that the OCT constitutes a valid
instrument for the diagnosis of diabetic macular edema. Forooghian et al. have
demonstrated that measurements of macular thickness and volume when carried
out by SD-OCT result significantly more precise compared those measured by
TD-OCT. [185, 188] Beside the central retinal thickening, in the case of macular
edema, the OCT can also show the intraretinal cysts, subretinal fluids and signs
of vitreofoveal traction. [175]
A number of studies have evidenced that the OCT is able to detect the retinal
thickness’ anomalies already in diabetic patients with no signs of retinopathy and
in those with mild, moderate or severe retinopathy without clinically significant
edemas, reporting, however, contrasting results. Most of these studies have used
TD-OCT.
Schaudig et al. have described an increased macular thickness of the superior
quadrant in diabetic subjects with DR compared to those without DR and to
healthy controls. [189] The Pires and the Sànchez-Tocino groups have also
detected a thickening in certain macular areas in the early stages of DR. [190,
191] Conforming to this data, Oshitari et al. have noticed an increase in macular
thickness and a reduction in RNFL thickness in patients with initial stages of
diabetic retinopathy, suggesting that they might be caused by neuronal
degeneration and the increase of vascular permeability. [192] The Lattanzio
group has moreover evidenced a macular thickening in diabetic patients without
retinopathy when compared to healthy controls. [193] Sng et al. have instead
detected an increase in the foveal and the external temporal macular area
thickness in patients with moderate or severe retinopathy without DME, while
there was no significant difference between diabetic patients with mild and
normal retinopathy. [194]
67
By contrast, the Massin, Alkuraya and Bressler group have not reported
significant differences in macular thickness in patients without or with mild
retinopathy with respect to healthy controls. [195-197]
On the other hand, in two independent studies, the Biallosterski and the Nilsson
groups have noticed a significant reduction in macular thickness in diabetic
patients with mild retinopathy, suggesting that it may be caused by the loss of
nerve tissue. [198, 199] Asefzadeh et al. have observed that macular thickness is
significantly inferior in subjects without or with mild retinopathy compared to
subjects which present one of the more advanced forms of this condition.[200]
Lastly, the Verma group has noticed a reduction of the macular thickness in
diabetic patients without retinopathy and a proportional reduction of retinal
sensitivity, detected via microperimetry. [181]
Such differences in the measurements of total macular thickness may be
explained in various ways: for example, certain works have completely excluded
subjects with macular edema, while others have not; some have considered
exclusively subjects affected by type 1 diabetes, others only the type 2 diabetic
subjects, while certain works have considered both types; usually the used
instruments were different; and, lastly, in many cases, the studied population was
not divided according to the characteristics which affect the measurements, such
as age, gender, ethnicity and myopia.
Van Dijk et al. have recently noticed, this time using the SD-OCT on patients with
mild retinopathy and afflicted by type 1 diabetes mellitus, a thinning of GCL in
pericentral macular area and in RNFL in more peripheral macula. GCL is afflicted
in an earlier stage, and is compromised in direct proportion to the duration of
diabetes, while RNFL is afflicted only subsequently, since the axonal
degeneration follows the cellular body degeneration. [201, 202] Contemporarily,
Cabrera et al. have observed that the RNFL and the GCL+IPL appear thinner in
diabetic subjects with or without mild diabetic retinopathy, resulting therefore
68
more susceptible to the initial damage. [184] The Peng group has also detected
the RNFL thinning in the superior quadrant of diabetic patients without
retinopathy. [203] Finally, a recent study by Araszkiewicz et al. has evidenced a
reduced thickness of RNFL, GCL and of the total macula in diabetic patients with
RD and without DME, compared to patients without RD. [204] In accordance with
these results, two studies which have used SLP (scanning laser polarimetry)
have pointed at RNFL thinning especially in superior quadrants of diabetic
patients. [205, 206]
Lastly, two recent works presented at the ARVO (Association for Research in
Vision and Ophthalmology), which have used the most recent SD-OCT
technology, have evidenced certain morphological alterations in vivo on the retina
of diabetic subjects: in the first study, a significant increase of ILM, IPL, INL
thicknesses has been observed as well as a decrease of GCL and RNFL
thickness in patients with non proliferative retinopathy, while the second one has
detected a thickening of the INL+IPL complex and the presence of
microaggregates in ILM and RNFL, which indicate an activated microglia.[207,
208]
Considering the concepts explored so far, it can be understood how in diabetic
patients the OCT has shown itself to be a very useful instrument not only
regarding the patients with diabetic retinopathy but also regarding the ones who
do not present such complication, demonstrating the ways in which neuronal
damages precede the vascular damage.

69
PURPOSE OF THE STUDY
The objective of this study is to investigate the eventual differences, both
qualitative and quantitative, in the expression of specific proteins inside the
aqueous humour sampled both in healthy subjects and in diabetic patients with or
without retinopathy. The purpose is to identify the possible biomarkers of glial
activation, implicated in the degenerative neovascular process and to put them in
relation with the stage of the retinal compromission. We have chosen to analyze
the aqueous humour because the collection of samples results less invasive
compared to the analyses of the vitreous (the object of study of most published
papers), while the information provided by its analysis is equally useful for the
understanding of the onset and progression of diabetic retinopathy.
70
MATERIALS AND METHODS
3.1. Bibliographic research
As regards the selection of molecules to investigate, a bibliographic research has
been conducted on PubMed, with no year limit, inserting and associating in
different ways the key words: “diabetic retinopathy, diabetes, neurodegeneration,
retinal degeneration, neural apoptosis, neuroprotection, physiopathology,
ganglion cell, glia, Müller cell, astrocyte, microglia, glial activation, inflammation,
aqueous humor, vitreous, tear fluid, ELISA, protein array, protein, proteomics,
aquaporin, GFAP, cytokine, neurotrophins, renin angiotensin system, reactive
oxygen species, glutamate, advanced glycation end products, oxidative stress,
biomarkers”.
A list of proteins has therefore been defined as the object of study of the aqueous
humour, based on which a more elaborate study has been conducted.
3.2. Study Population
34 eyes of the same number of patients of legal age have been studied at the
Eye Clinic of the University of Padua, from January till July 2012.
The study population has been selected in such a way that it forms four groups:
Control group: 12 subject not affected by diabetes mellitus
Study group: 22 subjects affected by type 1 or 2 diabetes mellitus. This
group has been further divided in three subgroups according to the
presence of non proliferative diabetic retinopathy (NPDR) and macular
edema (ME):
11 diabetic patients without clinical signs of NPDR.
11 diabetic patients with clinical signs of NPDR of which 5 without
ME and 6 with ME.

71
In every subject the cataract diagnosis was present, with indications for the
phacoemulsification and the intraocular lens implantation intervention. An
informed consent was obtained from each patient and the research has been
carried out in accordance with the Declaration of Helsinki regarding the
experimentation involving human tissue, and has been approved by the Local
Ethics Committee.
The diagnostic criteria used for the inclusion of patients in the group of diabetics,
valid for both sexes and for every age, have been established in 2011 by the
WHO (World Health Organization): glycated hemoglobin>6.5% in two occasions,
or glycemia ≥126 mg/dl after at least 8 of fasting in two occasions, or glycemia
≥200 mg/dl after 2 hours from a oral glucose tolerance test to be confirmed by a
fasting test, or casual glicemia ≥ 200 mg/dl in presence of typical symptoms
(polyuria, polydipsia, weight loss). [209]
The study has not taken into consideration patients affected by
neurodegenerative disease (e.g. Alzheimer’s, Parkinson’s, dementia), neoplasia
in the central nervous system or other nerve pathologies which affect sight and
unrelated to diabetes; subjects who systematically took steroid treatments and/or
anti-VEGF therapies and/or medicines treating the central nervous system or with
neuroprotective effects in the three months preceding the intervention; patients
afflicted by poorly controlled systemic pathologies. In addition, the study has
excluded patients whose studied eye presented: intraocular pressure greater or
equal to 22 mmHg or with a history of glaucoma; other ocular pathologies of
vascular, degenerative or inflammatory nature not ascribable to diabetes; topical
therapies with ocular antihypertensive drugs, cortisone drugs, FANS or anti-
VEGF drugs in the 30 days before intervention; eye surgery history in the three
months before intervention; subjects who, in ophtalmoscopy or OCT exams,
presented significant vitreo-retinal tractions which could affect retinal thickness;
excessive opacity of the dioptric media which prevented ophtalmoscopic
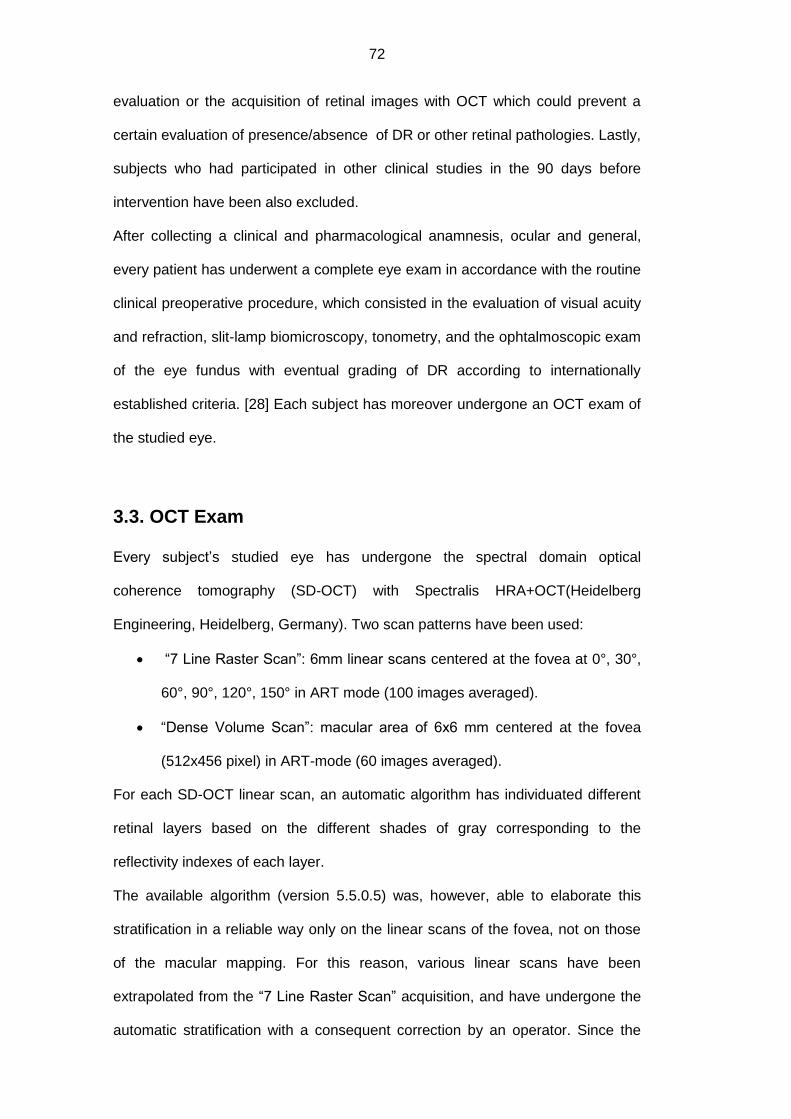
72
evaluation or the acquisition of retinal images with OCT which could prevent a
certain evaluation of presence/absence of DR or other retinal pathologies. Lastly,
subjects who had participated in other clinical studies in the 90 days before
intervention have been also excluded.
After collecting a clinical and pharmacological anamnesis, ocular and general,
every patient has underwent a complete eye exam in accordance with the routine
clinical preoperative procedure, which consisted in the evaluation of visual acuity
and refraction, slit-lamp biomicroscopy, tonometry, and the ophtalmoscopic exam
of the eye fundus with eventual grading of DR according to internationally
established criteria. [28] Each subject has moreover undergone an OCT exam of
the studied eye.
3.3. OCT Exam
Every subject’s studied eye has undergone the spectral domain optical
coherence tomography (SD-OCT) with Spectralis HRA+OCT(Heidelberg
Engineering, Heidelberg, Germany). Two scan patterns have been used:
“7 Line Raster Scan”: 6mm linear scans centered at the fovea at 0°, 30°,
60°, 90°, 120°, 150° in ART mode (100 images averaged).
“Dense Volume Scan”: macular area of 6x6 mm centered at the fovea
(512x456 pixel) in ART-mode (60 images averaged).
For each SD-OCT linear scan, an automatic algorithm has individuated different
retinal layers based on the different shades of gray corresponding to the
reflectivity indexes of each layer.
The available algorithm (version 5.5.0.5) was, however, able to elaborate this
stratification in a reliable way only on the linear scans of the fovea, not on those
of the macular mapping. For this reason, various linear scans have been
extrapolated from the “7 Line Raster Scan” acquisition, and have undergone the
automatic stratification with a consequent correction by an operator. Since the
73
error of the instrument consisted in the inexact identification of the border lines
between retinal layers, the manual correction consisted in the repositioning into
proper place of the incorrectly placed points, in order to redefine the retinal
profile.
Figure 21. Visualization screen at the SD-OCT exam with Spectralis HRA+OCT. On top left there is an infrared image of the eye fundus with the localization and the direction of the scanning; on top right, the scan image with the identification of RNFL (between the two dividing lines); on bottom left, the middle value of the considered layer in different distance intervals from the fovea; on bottom right, the graph representing the thicknesses of the considered layer in different intervals.
For each of the 6 scans, 6 retinal layers of interest have been segmented, which,
from inside to out, were:
Retinal nerve fiber layer (RNFL): from the inner limiting membrane (ILM)
to the border with the ganglion cell layer;
Ganglion cell layer (GCL): from the border with the nerve fiber layer to the
border with the inner plexiform layer;
Inner plexiform layer (IPL): from the border with the ganglion cell layer to
the border with the inner nuclear layer;
74
Inner nuclear layer (INL): from the border with the inner plexiform layer to
the border with the outer plexiform layer;
Outer plexiform layer (OPL): from the border with the inner nuclear layer
to the border with the outer nuclear layer;
Outer nuclear layer (ONL): from the border with the outer plexiform layer
to the border with the external limiting membrane (ELM).
For each layer of each linear scan (at 0°, 30°, 60°, 90°, 120°, 150°), the algorithm
has automatically calculated the average thickness of 0.5mm side intervals
starting from the fovea, the so-called ‘point 0’, up to 2.5 mm away from it (for the
total length of 5mm). In this way, 5 intervals have been defined on each side (10
in total) starting from the point 0, which were: -2.5/-2mm, -2/-1.5mm, -1.5/-1mm, -
1/-0.5mm, -0.5/0mm, 0/+0.5mm, +0.5/+1mm, +1/+1.5mm, +1.5/+2mm,
+2/+2.5mm (the negative and positive values have been attributed based on the
orientation with respect to the fovea). Each interval of each scan has been
identified by the arbitrarily assigned progressive numbering (from 1 to 60),
resulting in a diagram which has helped create a map of analyzed points (figure
22).

75
Figure 22. Representation of the intervals considered (60 in total) in the analyzed scans. Spatial positioning with respect to the fovea: S: superior; N: nasal; I: inferior; T: temporal.
The intervals have been compared in various patients considering the right eye
as reference, while the relative points of the left eye have been analyzed
according to the way in which the comparison of the areas in ETDRS chart
functions.
3.4. Collection, conservation and analysis of aqueous
humour
All patients have undergone the normal preoperative preparations for the
phacoemulsification surgery and the intraocular lens insertion: disinfection of
periocular skin with povidone-iodine 5%, instillation of sterile lidocaine, irrigation
of the conjunctival sac with povidone-iodine 5% and abundant washing out of the
eye with BSS (balanced salt solution).
A quantity of aqueous humor (between 150 and 200 μl) has been aspirated from
the anterior chamber of the eye, carrying out a parecentesis under microscope

76
with a 30 gauge needle and an insulin syringe (1 ml), and avoiding all contact
with the intraocular tissues, since they are possible sources of sample
contamination.
Immediately after the aspiration of AH, the first operator has carried out the
subsequent surgical maneuvers according to normal surgery procedure, while a
second operator has handled the division and the conservation of material.
The collected sample has been divided into two 50μl aliquots which were placed
into conical test tubes of 1.7ml each, previously numbered in a progressive way
and conserved at temperature of +4°C.
Each of these contained 50μl of RIPA buffer (RadioImmunoPrecipitation Assay
buffer) which was modified (25mM Tris-buffer, 150mM NaCl, 0.1% Tween20,
1mM EDTA -EthyleneDiamineTetraacetic Acid-, 10% glycerol, 0.1% SDS -
Sodium Dodecyl Sulfate-, 10mM NaF e 1mM PMSF -Phenylmethanesulfonyl
Fluoride-; ph=7.5) and to which 50µL T-PER (Protein Extraction Reagent)
supplemented with a cocktail of protease inhibitors (code #0078510; Pierce
Biotechnology, Rockford, IL) was added. The excess material was placed into a
third empty test tube.
After closing and delicately shaking the test tubes in order to favor the complete
mixing of the sample with the conservation medium, on each test tube only and
exclusively the reference “PT: ID code” (Patient: identification code of the study
subject) was added.
Within an hour from the collection, the samples were transported in portable
thermal containers from the OR to the refrigeration cell where they were frozen at
-20°C and conserved.
After having collected all the samples, they were shipped to the IRCCS (Institute
for Recovery and Care of Scientific Characteristics), G.B. Bietti Foundation for
Study and Research in Ophthalmology (Rome), in accordance with the
international regulations regarding the transport of biological material.
77
In the laboratory unit, the samples were conserved at the temperature of -70°C.
After the quality/quantity analyses of total protein, and before the subsequent
protein analyses (ELISA and protein array), the AH has been treated sonically
(VibraCell, Sonics, Newton, CT) in order to effectively extract cell protein (to
share DNA/RNA), and then clarified by centrifugation.
3.4.1. Quantitative determination of total protein
According to the study design, the sampling of AH was carried out dividing the
total collected amount in two different buffers (T-PER and RIPA) which allow
specific analysis.
For RIPA sampling, the quantification of total protein was carried out according to
the Bradford method. In brief, 2μl of AH were diluted with 18μl of ddw (water
DirectQ5; millipore.com) and mixed with 200μl of a prediluted solution (code 500-
0006; Biorad, bio-rad.com). After a brief incubation of 5 minutes at room
temperature, 3μl of each sample and of a reference standard curve (0-1000μg/ml
BSA; sigma-aldrich.com) were acquired at the digital spectrophotometer with the
appropriate Bradford option (Nanodrop ND1000 UV-Vis Spettrofotometer;
nanodrop.com). The protein concentration was calculated based on the
linearized standard curve (BSA) as provided by the program.
For T-PER sampling, 3µL samples were directly evaluated by digital
spectrophotometer, using the A280 option with comparison to a standard (IgG),
as provided by the manufacturers. Both evaluations were carried out after blank
options, both against ddw and appropriate buffer. The data was used to evaluate
possible variations in total protein content between groups and to normalize the
samples before loading in the specific assay.

78
This analysis allowed the evaluation of the potential variations in total protein
concentrations between and within different groups, and the normalization of the
samples before proteomic analyses.
Figure 23. Protein quantification with Bradford method: from left to right we notice the increasing protein concentrations.
3.4.2. GFAP, AQP1 and AQP4 Analyses with ELISA test
The ELISA tests used to quantify GFAP, AQP4 and AQP1 were the following:
GFAP-NS830 (millipore.com), AQP1-MBS700396 (mybiosource.com), AQP4-
MBS705290 (mybiosource.com).
This double-sandwich ELISA is a solid phase assay which uses 96well-plastic
pre-coated plates, which permits to contemporarily assay a high number of
samples (up to 40 samples in duplicate) from different patients in order to analyze
the same molecule. As in the protocol provided by the manufacturer, for every
specific ELISA, both prediluted samples and standard curve, prepared in TBS
buffer (20mM Tris-Cl and 150mM NaCl, containing 3% of BSA, 5mM EDTA and
1x protease inhibitor cocktail) were applied to the pre-coated plates appropriately
pre-absorbed. Standard curves (range) and limit detections were as follows:
GFAP, 1.5-100ng/mL and 1.5ng/mL; AQP4, 15.6-1000pg/mL and less than
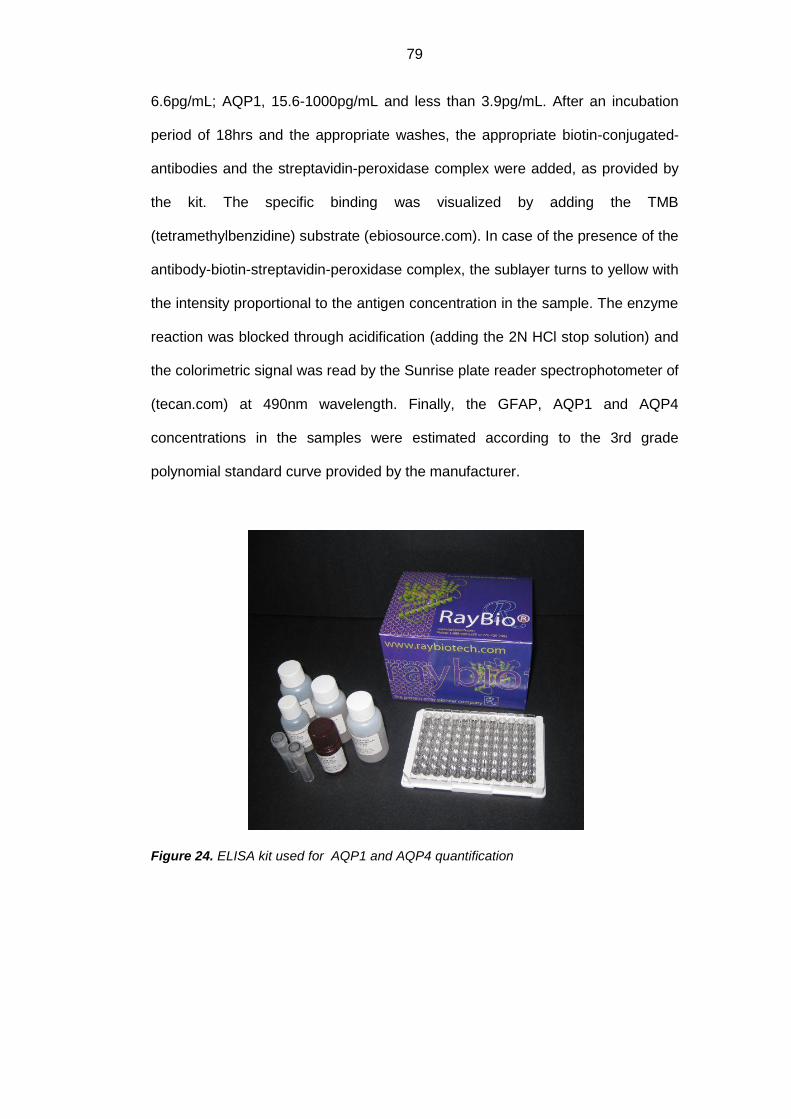
79
6.6pg/mL; AQP1, 15.6-1000pg/mL and less than 3.9pg/mL. After an incubation
period of 18hrs and the appropriate washes, the appropriate biotin-conjugated-
antibodies and the streptavidin-peroxidase complex were added, as provided by
the kit. The specific binding was visualized by adding the TMB
(tetramethylbenzidine) substrate (ebiosource.com). In case of the presence of the
antibody-biotin-streptavidin-peroxidase complex, the sublayer turns to yellow with
the intensity proportional to the antigen concentration in the sample. The enzyme
reaction was blocked through acidification (adding the 2N HCl stop solution) and
the colorimetric signal was read by the Sunrise plate reader spectrophotometer of
(tecan.com) at 490nm wavelength. Finally, the GFAP, AQP1 and AQP4
concentrations in the samples were estimated according to the 3rd grade
polynomial standard curve provided by the manufacturer.
Figure 24. ELISA kit used for AQP1 and AQP4 quantification

80
3.4.3. Inflammatory profile analysis with protein-array
The protein array was conducted using the RayBiotech technology established by
the manufacturer (raybiotech.com). This method offers the advantage of
contemporary evaluation, for every single sample, of a significant number of
proteins, depending on the precostumized array. Both membrane (array series
with 4 pre-spotted membranes) and glasschips (G series comprising 1 slide with
4 or 8 identical subarrays) were used in this study. Normalizations,
Positive/Negative and Internal controls were carried out according to the
procedure.
Membrane-based arrays: All the samples were analyzed using the inflammatory
array kit (#AAH-INF-3), providing all reagents suitable for analysis. As
established by the manufacturer, the membranes were equilibrated in buffer
solution and incubated with 300ng/ml of protein extract appropriately diluted in
lysis buffer containing the protease-inhibiting cocktail. After an 18-hour incubation
and the appropriate washes, the antigen-antibody binding was recognized by
adding a cocktail of specific secondary biotin-conjugated antibodies, followed by
the incubation with streptavidin conjugated to peroxidase. After further washes
and the addition of the luminal substrate (ECL; SuperSignal West Pico Trial;
pierce.com), the specific signals were acquired by Kodak Image working station
equipped with the 1D Kodak Image Analysis software (Kodak 550, Eastman
Kodak Company, Sci. Imaging Systems, Rochster, NY). The chemiluminescent
signals (spots) were quantified using the single spot densitometry mode provided
by the NIH 1D ImageJ software (Image J v1.43; http://rsb.info.nih.gov/ij/). The
data was normalized according to the suggestion provided by the manufacturer
and have subsequently been statistically confronted.
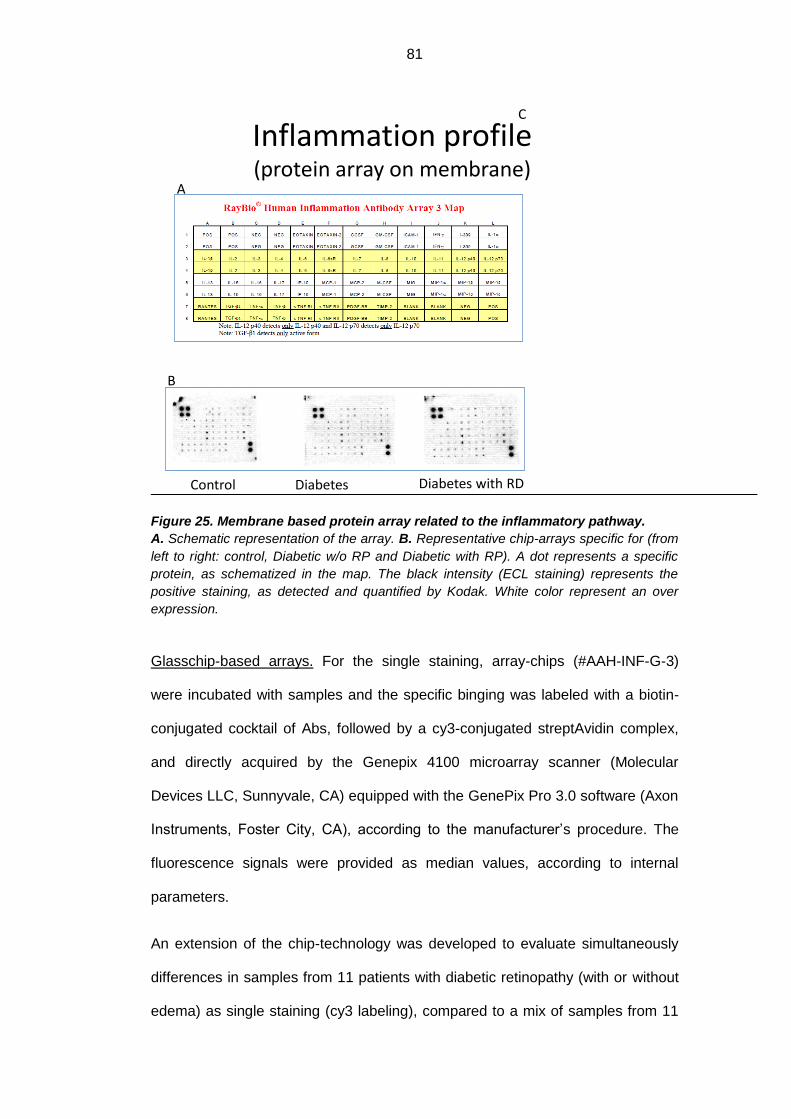
81
Figure 25. Membrane based protein array related to the inflammatory pathway.
A. Schematic representation of the array. B. Representative chip-arrays specific for (from
left to right: control, Diabetic w/o RP and Diabetic with RP). A dot represents a specific
protein, as schematized in the map. The black intensity (ECL staining) represents the
positive staining, as detected and quantified by Kodak. White color represent an over
expression.
Glasschip-based arrays. For the single staining, array-chips (#AAH-INF-G-3)
were incubated with samples and the specific binging was labeled with a biotin-
conjugated cocktail of Abs, followed by a cy3-conjugated streptAvidin complex,
and directly acquired by the Genepix 4100 microarray scanner (Molecular
Devices LLC, Sunnyvale, CA) equipped with the GenePix Pro 3.0 software (Axon
Instruments, Foster City, CA), according to the manufacturer’s procedure. The
fluorescence signals were provided as median values, according to internal
parameters.
An extension of the chip-technology was developed to evaluate simultaneously
differences in samples from 11 patients with diabetic retinopathy (with or without
edema) as single staining (cy3 labeling), compared to a mix of samples from 11
Inflammation profile(protein array on membrane)
Control(pt.7/vial14)
Diabetes(pt. 13/vial 26)
Diabetes with RD(pt. 10/vial 20)
A
B
C
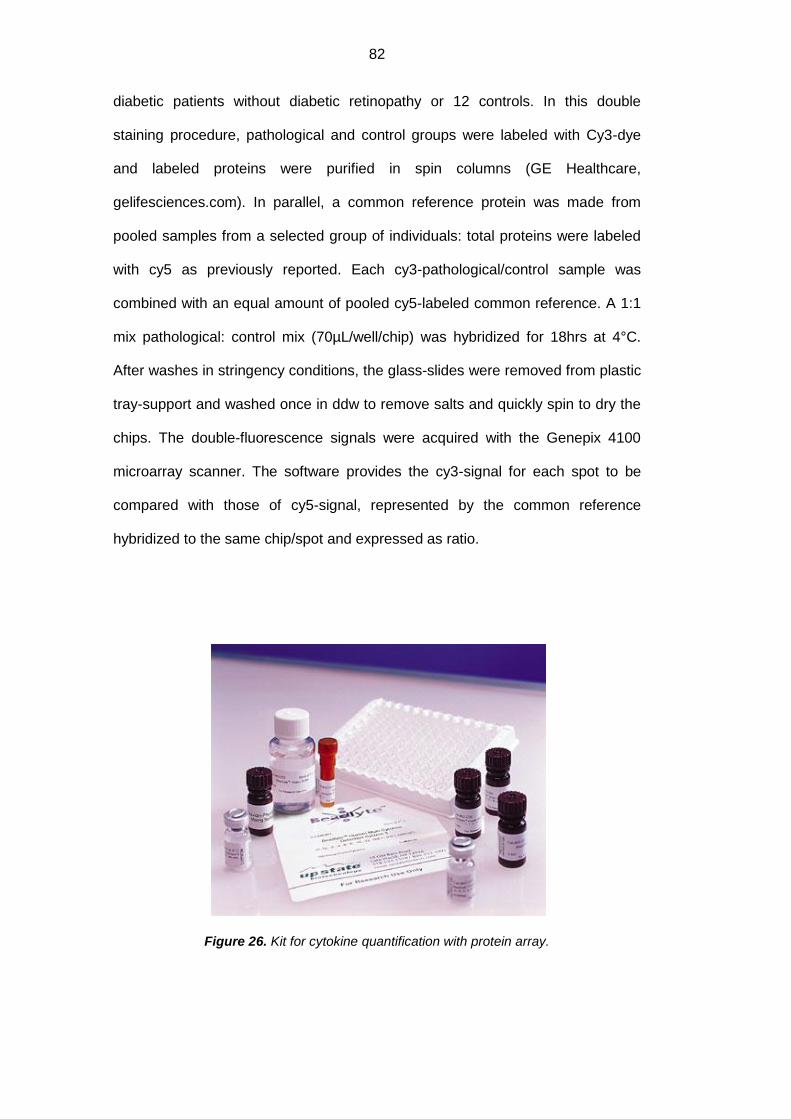
82
diabetic patients without diabetic retinopathy or 12 controls. In this double
staining procedure, pathological and control groups were labeled with Cy3-dye
and labeled proteins were purified in spin columns (GE Healthcare,
gelifesciences.com). In parallel, a common reference protein was made from
pooled samples from a selected group of individuals: total proteins were labeled
with cy5 as previously reported. Each cy3-pathological/control sample was
combined with an equal amount of pooled cy5-labeled common reference. A 1:1
mix pathological: control mix (70µL/well/chip) was hybridized for 18hrs at 4°C.
After washes in stringency conditions, the glass-slides were removed from plastic
tray-support and washed once in ddw to remove salts and quickly spin to dry the
chips. The double-fluorescence signals were acquired with the Genepix 4100
microarray scanner. The software provides the cy3-signal for each spot to be
compared with those of cy5-signal, represented by the common reference
hybridized to the same chip/spot and expressed as ratio.
Figure 26. Kit for cytokine quantification with protein array.
83
Array data analysis. Both chemiluminescence and fluorescence signals were
analyzed and compared by NIH and StatView softwares. Normalization was
carried out according to the instructions provided by the manufacturer. In the
array approach, all comet tails were ignored and only median signal values were
used for the identification of any biomarker variation. Particularly, the Internal
Control (spiking-in proteins with no cross-reactivity with the samples) allows to
normalize and compare signal intensities from array membranes and chips in
different experiments/times. Only median signal values obtained after the
acquisition with the same PMT settings, were used for the comparative analysis.
Inter- and intra-assay CV≤10% was considered in the study and any ≥1.5-fold
increase or ≤0.65 fold decrease in signal intensity, was considered to guarantee
specific signals above background. A significance level of .05 was selected to
limit the number of false-negative results.
To acquire the spot signals, hand-made circle was drawn around the spot of the
membrane-array image (35-bit tiff image), permitting the software to quantify the
chemioluminescent signal and express it as optical density (OD). Data is
provided as pathologic OD/control OD ratio. In the chip-array, the genepix
software directly circles and evaluates the fluorescence signal inside each spot
and provides a ratio value (MF) as pathological/ referring signal),which served for
the normalization calculations. This approach would imply that the chip-based
array is more precise than the membrane-based array. In order to minimize the
intra- and the inter-assay variability, only the chip-based array data was used for
the final statistical evaluation. The single tester handled all the material and
followed all the phases of the experiment.
The clusters of antibodies used for both arrays are as follows: eotaxin, eotaxin-2,
G-CSF (granulocyte colony-stimulating factor), GM-CSF (granulocyte-
macrophage colony-stimulating factor), ICAM-1 (intercellular adhesion molecule-

84
1), IFN-γ (interferon-γ), I-309 (chemokine (C-C motif) ligand 1), IL-1α (interleukin-
1α), IL-1β (interleukin-1β), IL-2 (interleukin-2), IL-3 (interleukin-3), IL-4
(interleukin-4), IL-6 (interleukin-6), IL-6sr (interleukin-6 soluble receptor), IL-7
(interleukin-7), IL-8 (interleukin-8), IL-10 (interleukin-10), IL-11 (interleukin-11), IL-
12p40 (interleukin-12p40), IL-12p70 (interleukin-12p70), IL-13 (interleukin-13), IL-
15 (interleukin-15), IL-16 (interleukin-16), IL-17 (interleukin-17), IP-10 (interferon
gamma-induced protein 10), MCP-1 (monocyte chemotactic protein-1), MCP-2
(monocyte chemotactic protein-1), M-CSF (macrophage colony-stimulating
factor), MIG (monokine induced by gamma interferon), MIP-1α (macrophage
inflammatory protein-1α), MIP-1β (macrophage inflammatory protein-1β), MIP-1δ
(macrophage inflammatory protein-1δ), RANTES (regulated and normal T cell
expressed and secreted), TGF-β1 (transforming growth factor-β1), TNF-α (tumor
necrosis factor-α), TNF-β (tumor necrosis factor-β), sTNF-R1 (soluble tumor
necrosis factor-receptor1), sTNF-R2 (soluble tumor necrosis factor-receptor2),
PDGF-BB (platelet-derived growth factor) and TIMP-2 (tissue inhibitor of
metalloproteinases-2).
Although membrane-array and chip-array techniques are both the
semiquantitative methods of proteomic evaluation, the membrane-array
technique consists in manual tester evaluation of the chemioluminescent signal
versus control signal, whereas in the chip-array the genepix instrument directly
evaluates the fluorescence signal of the spot versus control signal (which served
for the normalization calculations). Therefore, in the chip-based array, the optical
density values are displayed by the instrument. In order to minimize intra- and
inter-assay variability, only the chip-based array data was used for the final
statistical evaluation. The single tester handled all the material and followed all
the phases of the experiment.

85
Figure 27. Protein array on glass-chip: the left one contains 4 chips, the right one 8
chips. According to the chip-based glass array, 40 inflammatory proteins were analyzed
and quantified by GenePix platform. The schematic representation of the array is
reported below. Each protein is assayed in duplicate. The chip also contains positive and
negative controls, IC1, IC2 and IC3 which serve for identification of the normalization
factor at the end of the analysis: thereafter, the computer calculates data based on the
normalization factor.
3.5. Statistical Analysis
In this study four groups of patients were confronted: controls, diabetics without
DR, diabetics with diabetic retinopathy (DR), and diabetics with DR and macular
edema.
The concentration in the AH of total protein, GFAP, AQP1 and AQP4 was
quantitatively expressed in reference units (mg/ml, or pg/µg) and, for descriptive
purposes, the results were reported in terms of mean ± standard deviation. The
difference in mean protein concentration between the groups was confronted with
unpaired T-test analysis. The difference in GFAP, AQP1 and AQP4 concentration
between the groups was confronted using the ANOVA test which, in the case of a
Array chipprotein array on glass-chip
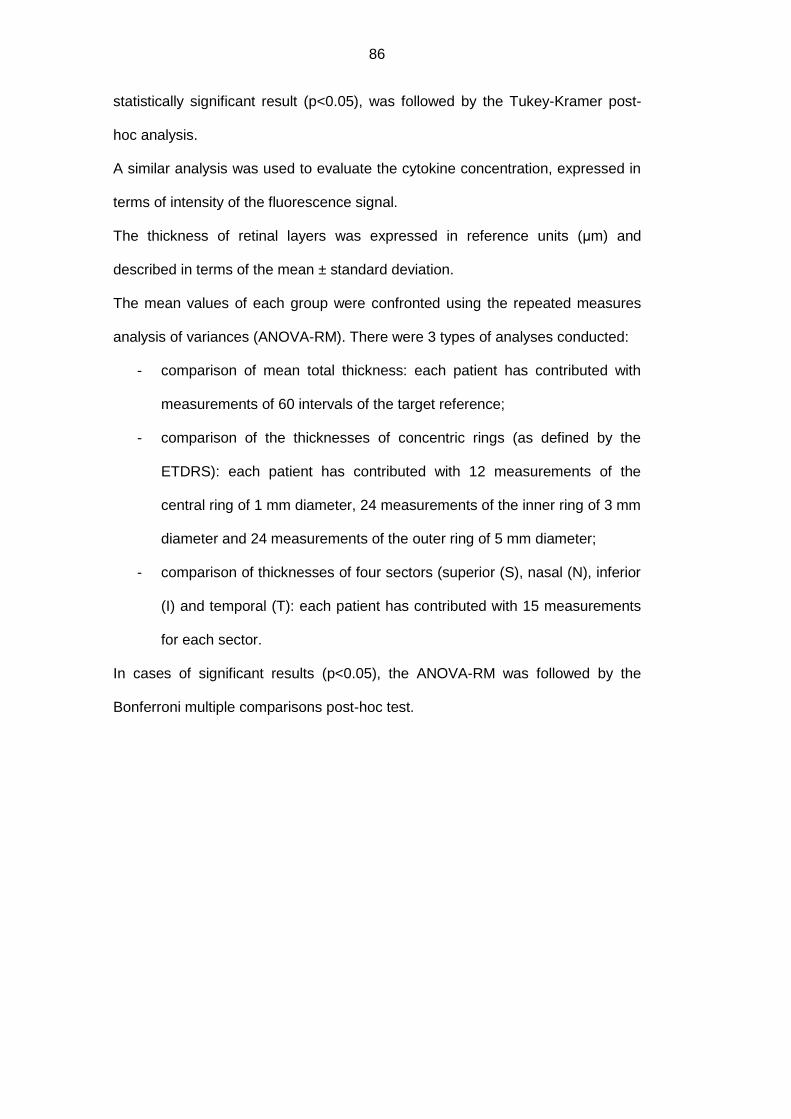
86
statistically significant result (p<0.05), was followed by the Tukey-Kramer post-
hoc analysis.
A similar analysis was used to evaluate the cytokine concentration, expressed in
terms of intensity of the fluorescence signal.
The thickness of retinal layers was expressed in reference units (μm) and
described in terms of the mean ± standard deviation.
The mean values of each group were confronted using the repeated measures
analysis of variances (ANOVA-RM). There were 3 types of analyses conducted:
- comparison of mean total thickness: each patient has contributed with
measurements of 60 intervals of the target reference;
- comparison of the thicknesses of concentric rings (as defined by the
ETDRS): each patient has contributed with 12 measurements of the
central ring of 1 mm diameter, 24 measurements of the inner ring of 3 mm
diameter and 24 measurements of the outer ring of 5 mm diameter;
- comparison of thicknesses of four sectors (superior (S), nasal (N), inferior
(I) and temporal (T): each patient has contributed with 15 measurements
for each sector.
In cases of significant results (p<0.05), the ANOVA-RM was followed by the
Bonferroni multiple comparisons post-hoc test.
87
RINGS
SECTORS
Figure 24. Charts of the division of the macular area in rings, sector of the macular area. Position in space with respect to the fovea: S, superior; N, nasal; I, inferior; T, temporal, CSF, central subfield.
The ANOVA model has also enabled the evaluation of the average profile trend
of the thicknesses in different patient groups in different retinal areas considered.
The statistical analysis has been carried out using the SAS® v.9.2 software on a
personal computer.
88
RESULTS
4.1. Population
The data collected refers to 34 eyes of 34 patients hence divided: 12 normal
subjects (controls), 11 diabetic patients without DR and 11 diabetic patients with
DR (further divided in 5 patients without DME and 6 with DME). All the patients
with DR presented non proliferative diabetic retinopathy (NPDR).
The control group was composed of 5 males and 7 females, between 66 and 87
years of age (mean age: 75.4±6.4 years), the group of diabetics without DR was
formed by 3 males and 8 females, between 56 and 86 years of age (mean age
73.9±9.0 years), while the group of diabetics with DR consisted in 6 males and 5
females, between 49 and 83 years of age (mean age 69.9±11.4 years), ultimately
divided in diabetics with DR and without macular edema and diabetics with DR
and macular edema (tables III and IV).
Among the diabetic patients without DR, the duration of diabetes mellitus (DM)
was between 2 and 15 years (mean 7.7±5.1 years), and in all case it was type 2
DM; among the diabetic patients with DR, the duration was between 10 and 40
years (mean 20.1±9.8 years); mean duration of DM was 13.4+9.6 years in DR
without ME and 21.8+11.1 years in DR with ME; and there was 1 case of type 1
DM, while in the remaining 10 cases it was type 2 DM. In the first group (diabetics
without DR), 1 patient was in therapy with oral hypoglycemic agents and insulin,
7 with only the oral hypoglycemic agents, 2 with only the dietary control, while 1
patient did not assume any preventive action; in the second group (diabetics with
DR and without ME), 1 patient was in therapy with oral hypoglycemic agents and
insulin, 1 only with oral hypoglycemic agents, 2 only with insulin, while 1 patient
limited himself to dietary control; in the third group (diabetics with DR and with
ME), 1 patient was in therapy with oral hypoglycemic agents and insulin, 1 only
with oral hypoglycemic agents, 4 only with insulin.

89
In the control group, there were 8 right eyes and 4 left eyes analyzed, with an
intraocular pressure (IOP) between 12 and 20 mmHg (mean 16.3±2.3 mmHg),
and a best corrected visual acuity (BCVA) between +1.0 and +0.15 logMar (mean
0.41±0.22 logMar) in the studied eye; in the group of diabetics without DR, 4 right
eyes and 7 left eyed were studied, with an IOP comprised between 14 and 22
mmHg (mean 17.5±2.4 mmHg) and BCVA between +1.0 and +0.1 logMar (mean
0.58±0.52 logMar) in the studied eye; in the group of diabetics with DR (both
without and with ME), 6 right eyes and 5 left eyes were studied, with IOP
comprised between 11 and 18 mmHg (mean 15.7±2.6 mmHg) and BCVA
between +1.52 and +0.15 (mean 0.63±0.51 logMar) in the studied eye. In the last
group, 2 patients presented mild NPDR, 8 moderate NPDR and 1 severe NPDR;
Table IV shows separate data for DR without ME and DR with ME.
In all 34 cases, the collection of the AH was successful, without contamination by
blood or by tissues from the anterior chamber of the eye. In average, the quantity
of the AH collected was superior to 150 μl (150-200 μl). No intra-operative
complication was registered, and the post-operative management was regular in
all cases. For every sample, the test tube collection, the freezing, the
conservation and the dispatch to the laboratory for analysis took place without
problems.
Table III. Characteristics of subjects pertaining to four groups. Diabetics w/o RD: diabetics without DR; Diabetics w/RD: diabetics with DR; Diabetics w/RD and edema: diabetics with DR and macular edema.

90
Table IV. Characteristics of studied eyes in the four groups. Diabetics w/o RD: diabetics without DR; Diabetics w/RD: diabetics with DR; Diabetics w/RD and edema: diabetics with DR and macular edema.
PARAMETERS Controls (N=12)
Diabetics w/o DR (N=11)
Diabetics w/DR ME- (N=5)
Diabetics w/DR ME+ (N=6)
Studied eye (RE:LE)
8:4 4:7 2:3 4:2
Mean intraocular pression±SD (mmHg)
16.3±2.3 17.5±2.4 15.5±2.7 16.2±2.4
Visual acuity±SD (logMar)
0.41±0.22 0.58±0.52 0.60±0.38 0.63±0.49
N° pt with DR
Mild NPDR - - 1 1
Moderate NPDR - - 4 4
Severe NPDR - - 0 1
PDR - - 0 0
PARAMETERS Controls (N=12)
Diabetics w/oDR (N=11)
Diabetics w/DR ME- (N=5)
Diabetics w/DR ME+ (N=6)
Mean age ± SD (yrs)
75.4 ± 6.4 73.9 ± 9.0 75.8 ± 9.8 62.0 ± 8.6
Sex (M:F) 5:7 3:8 4:1 2:4
Mean duration ± SD DM (yrs)
n.a. 7.7 ± 5.1 13.4 ± 9.6 21.8 ± 11.1
Type DM (DM1:DM2)
n.a. 0:11 0:5 1:5
DM Treatment
Oral Hypoglycemics + insulin
n.a. 1 1 1
Oral Hypoglycemics n.a. 7 1 1
Insulin n.a. 0 2 4
Diet n.a. 2 1 0
No treatment n.a. 1 0 0
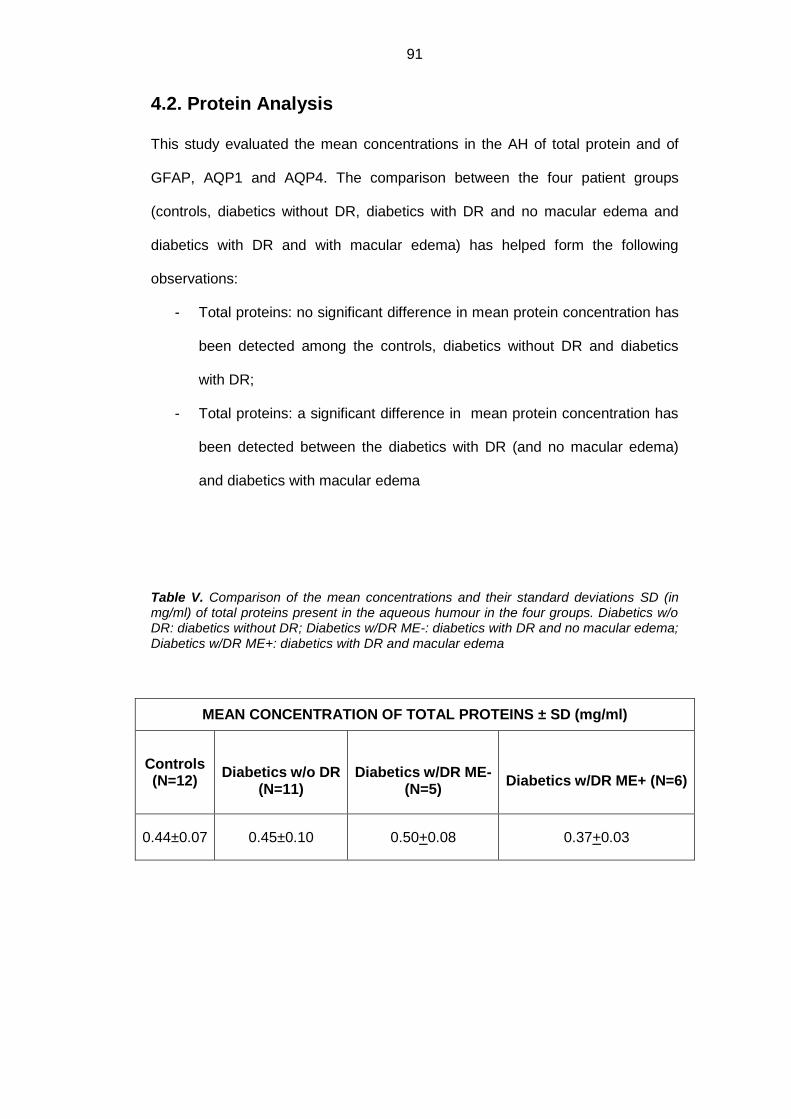
91
4.2. Protein Analysis
This study evaluated the mean concentrations in the AH of total protein and of
GFAP, AQP1 and AQP4. The comparison between the four patient groups
(controls, diabetics without DR, diabetics with DR and no macular edema and
diabetics with DR and with macular edema) has helped form the following
observations:
- Total proteins: no significant difference in mean protein concentration has
been detected among the controls, diabetics without DR and diabetics
with DR;
- Total proteins: a significant difference in mean protein concentration has
been detected between the diabetics with DR (and no macular edema)
and diabetics with macular edema
Table V. Comparison of the mean concentrations and their standard deviations SD (in mg/ml) of total proteins present in the aqueous humour in the four groups. Diabetics w/o DR: diabetics without DR; Diabetics w/DR ME-: diabetics with DR and no macular edema; Diabetics w/DR ME+: diabetics with DR and macular edema
MEAN CONCENTRATION OF TOTAL PROTEINS ± SD (mg/ml)
Controls (N=12)
Diabetics w/o DR
(N=11)
Diabetics w/DR ME-
(N=5)
Diabetics w/DR ME+ (N=6)
0.44±0.07 0.45±0.10 0.50+0.08 0.37+0.03

92
Figure 25. Mean concentrations of total proteins (in mg/ml) present in the aqueous humour of the four groups as detected by Bradford microarray and Nanodrop specific evaluation (2uL/595nm; BSA as referring protein). Diab w/o RD: diabetics without DR; Diab w/RD: diabetics with DR; Diab w/RD and edema: diabetics with DR and macular edema.
- GFAP: the mean concentration is significantly increased in diabetic
patients with DR compared both to the controls (324.44 pg/µg vs 182.34
pg/µg; Tukey-Kramer post-hoc test p<0.05) and diabetics without DR
(324.44 pg/µg vs 165.61 pg/µg; Tukey-Kramer post-hoc test p<0.05);
- AQP1: the mean concentration is significantly increased in diabetic
patients with DR compared both to the controls (105.72 pg/µg vs 50.92
pg/µg; Tukey-Kramer post-hoc test p<0.05) and diabetics without DR
(105.72 pg/µg vs 28.84 pg/µg; Tukey-Kramer post-hoc test p<0.05); it is
significantly increased in diabetic subjects with retinopathy and without
macular edema compared to those with macular edema (105.72pg/µg vs
37.09pg/µg).
- AQP4: the mean concentration is significantly increased in diabetic
patients without DR compared to controls (206.87pg/µg vs 33,58 pg/µg,
Tukey-Kramer post-hoc test p<0.05); it is significantly increased in
Total protein analysis
0
0,1
0,2
0,3
0,4
0,5
0,6
0,7
controls diab w/o RD diab w/RD diab w/RD and Edema
mea
n v
alu
ep<.05 total protein mg/mL SD
controls 0,44 0,07
diabetics 0,45 0,10
diabetics with RD 0,50 0,08
diabetics with RD and Edema 0,37 0,03
-,005 20 -,113 ,9113
-,063 24 -1,396 ,1756
,063 16 1,509 ,1509
-,057 22 -1,116 ,2764
,069 14 1,336 ,2029
,126 18 2,406 ,0271
Mean Diff. DF t-Value P-Value
A, control, B, Diabetes no RD
A, control, C, Diabetes w ith RD
A, control, D, Diabetes w ith RD and Edema
B, Diabetes no RD, C, Diabetes w ith RD
B, Diabetes no RD, D, Diabetes w ith RD and Edema
C, Diabetes w ith RD, D, Diabetes w ith RD and Edema
Unpaired t-test for Total proteins
Grouping Variable: Column 1
Hypothesized Difference = 0
12 ,437 ,010 ,099 ,029
10 ,442 ,015 ,122 ,039
14 ,499 ,016 ,125 ,033
6 ,373 ,001 ,028 ,011
Count Mean Variance Std. Dev. Std. Err
A, control
B, Diabetes no RD
C, Diabetes w ith RD
D, Diabetes w ith RD and Edema
Group Info for Total proteins
Grouping Variable: Column 1
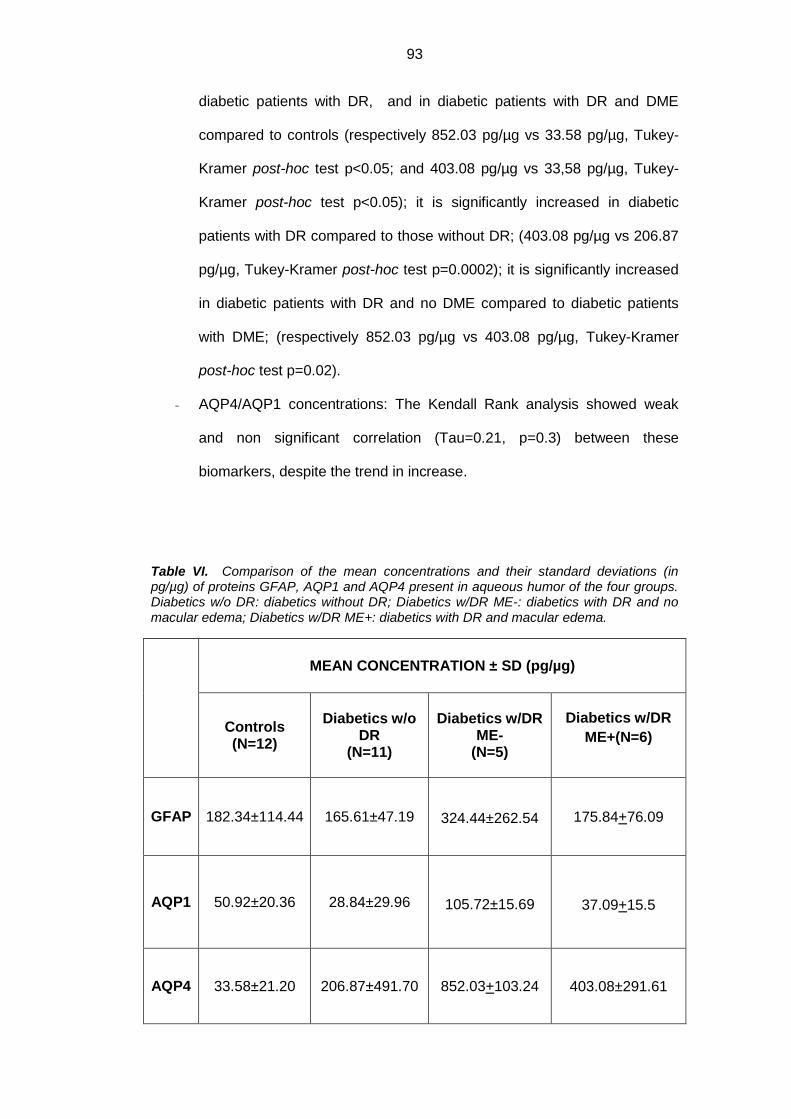
93
diabetic patients with DR, and in diabetic patients with DR and DME
compared to controls (respectively 852.03 pg/µg vs 33.58 pg/µg, Tukey-
Kramer post-hoc test p<0.05; and 403.08 pg/µg vs 33,58 pg/µg, Tukey-
Kramer post-hoc test p<0.05); it is significantly increased in diabetic
patients with DR compared to those without DR; (403.08 pg/µg vs 206.87
pg/µg, Tukey-Kramer post-hoc test p=0.0002); it is significantly increased
in diabetic patients with DR and no DME compared to diabetic patients
with DME; (respectively 852.03 pg/µg vs 403.08 pg/µg, Tukey-Kramer
post-hoc test p=0.02).
- AQP4/AQP1 concentrations: The Kendall Rank analysis showed weak
and non significant correlation (Tau=0.21, p=0.3) between these
biomarkers, despite the trend in increase.
Table VI. Comparison of the mean concentrations and their standard deviations (in pg/µg) of proteins GFAP, AQP1 and AQP4 present in aqueous humor of the four groups. Diabetics w/o DR: diabetics without DR; Diabetics w/DR ME-: diabetics with DR and no macular edema; Diabetics w/DR ME+: diabetics with DR and macular edema.
MEAN CONCENTRATION ± SD (pg/µg)
Controls (N=12)
Diabetics w/o DR
(N=11)
Diabetics w/DR
ME- (N=5)
Diabetics w/DR
ME+(N=6)
GFAP 182.34±114.44 165.61±47.19 324.44±262.54 175.84+76.09
AQP1 50.92±20.36 28.84±29.96 105.72±15.69
37.09+15.5
AQP4 33.58±21.20 206.87±491.70 852.03+103.24 403.08±291.61
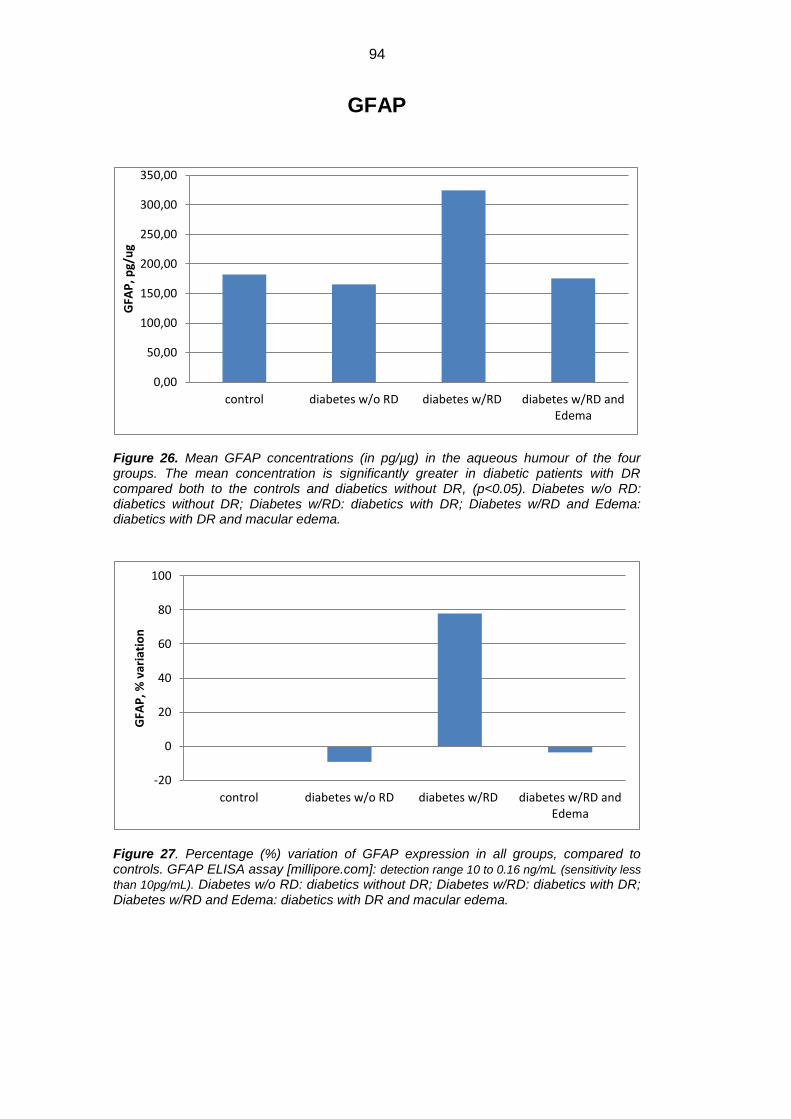
94
GFAP
Figure 26. Mean GFAP concentrations (in pg/µg) in the aqueous humour of the four groups. The mean concentration is significantly greater in diabetic patients with DR compared both to the controls and diabetics without DR, (p<0.05). Diabetes w/o RD: diabetics without DR; Diabetes w/RD: diabetics with DR; Diabetes w/RD and Edema: diabetics with DR and macular edema.
Figure 27. Percentage (%) variation of GFAP expression in all groups, compared to controls. GFAP ELISA assay [millipore.com]: detection range 10 to 0.16 ng/mL (sensitivity less
than 10pg/mL). Diabetes w/o RD: diabetics without DR; Diabetes w/RD: diabetics with DR; Diabetes w/RD and Edema: diabetics with DR and macular edema.
0,00
50,00
100,00
150,00
200,00
250,00
300,00
350,00
control diabetes w/o RD diabetes w/RD diabetes w/RD andEdema
GFA
P, p
g/u
g
-20
0
20
40
60
80
100
control diabetes w/o RD diabetes w/RD diabetes w/RD andEdema
GFA
P, %
var
iati
on

95
Figure 28. Fold changes of GFAP expression in all groups compared to controls. Positive fold changes means increase in concentration; negative fold changes means decrease in concentration. Diabetes w/o RD: diabetics without DR; Diabetes w/RD: diabetics with DR; Diabetes w/RD and Edema: diabetics with DR and macular edema.
AQP1
Figure 29. Mean AQP1 concentrations (in pg/µg) in the aqueous humour of the four groups. The mean concentration is significantly greater in diabetic patients with DR compared both to the controls and diabetics without DR, (p<0.05); it is significantly increased in diabetic subjects with retinopathy and without macular edema compared to those with macular edema. Diabetes w/o RD: diabetics without DR; Diabetes w/RD: diabetics with DR; Diabetes w/RD and Edema: diabetics with DR and macular edema.
-0,2
0
0,2
0,4
0,6
0,8
1
control diabetes w/o RD diabetes w/RD diabetes w/RDand Edema
GFA
P, f
old
var
iati
on
-20
0
20
40
60
80
100
120
140
�control �Diabetes w/o RPDiabetes w/RP
�Diabetes w/RP andEdema
AQ
P1
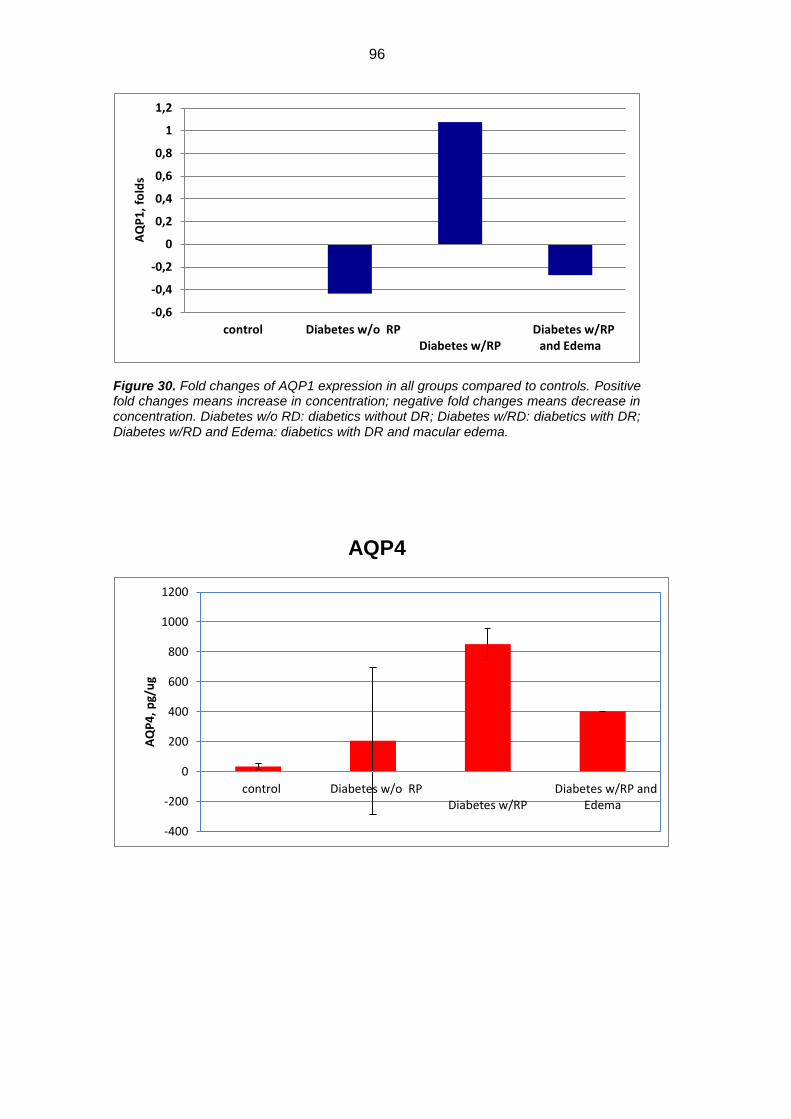
96
Figure 30. Fold changes of AQP1 expression in all groups compared to controls. Positive fold changes means increase in concentration; negative fold changes means decrease in concentration. Diabetes w/o RD: diabetics without DR; Diabetes w/RD: diabetics with DR; Diabetes w/RD and Edema: diabetics with DR and macular edema.
AQP4
-0,6
-0,4
-0,2
0
0,2
0,4
0,6
0,8
1
1,2
�control �Diabetes w/o RPDiabetes w/RP
�Diabetes w/RPand Edema
AQ
P1
, fo
lds
-400
-200
0
200
400
600
800
1000
1200
�control �Diabetes w/o RPDiabetes w/RP
�Diabetes w/RP andEdema
AQ
P4
, p
g/u
g
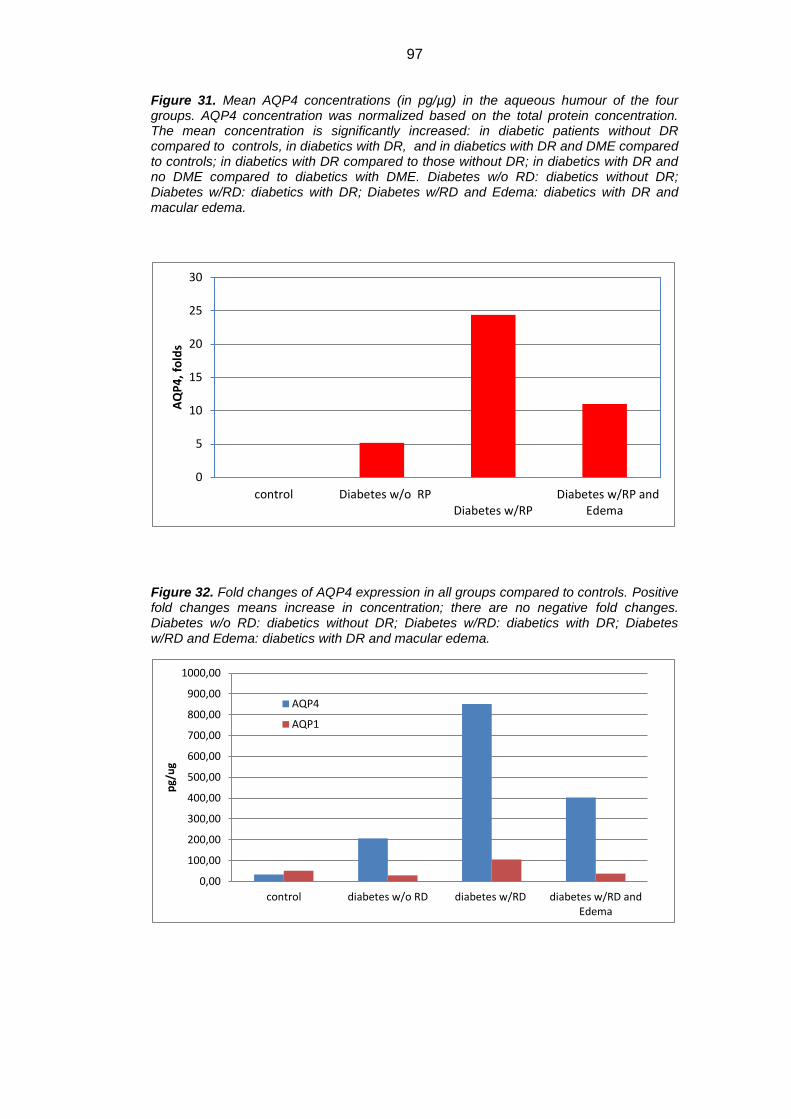
97
Figure 31. Mean AQP4 concentrations (in pg/µg) in the aqueous humour of the four groups. AQP4 concentration was normalized based on the total protein concentration. The mean concentration is significantly increased: in diabetic patients without DR compared to controls, in diabetics with DR, and in diabetics with DR and DME compared to controls; in diabetics with DR compared to those without DR; in diabetics with DR and no DME compared to diabetics with DME. Diabetes w/o RD: diabetics without DR; Diabetes w/RD: diabetics with DR; Diabetes w/RD and Edema: diabetics with DR and macular edema.
Figure 32. Fold changes of AQP4 expression in all groups compared to controls. Positive fold changes means increase in concentration; there are no negative fold changes. Diabetes w/o RD: diabetics without DR; Diabetes w/RD: diabetics with DR; Diabetes w/RD and Edema: diabetics with DR and macular edema.
0
5
10
15
20
25
30
�control �Diabetes w/o RPDiabetes w/RP
�Diabetes w/RP andEdema
AQ
P4
, fo
lds
0,00
100,00
200,00
300,00
400,00
500,00
600,00
700,00
800,00
900,00
1000,00
control diabetes w/o RD diabetes w/RD diabetes w/RD andEdema
pg/
ug
AQP4
AQP1

98
Figure 33. Mean AQP4 and AQP1 concentrations (in pg/µg) in the aqueous humour of the four groups. The Kendall Rank analysis showed weak and non significant correlation (Tau=0.21, p=0.3) between these biomarkers, despite the trend in increase. Diabetes w/o RD: diabetics without DR; Diabetes w/RD: diabetics with DR; Diabetes w/RD and Edema: diabetics with DR and macular edema.
Figure 34. AQP4/AQP1 ratio in all groups. Diabetes w/o RD: diabetics without DR; Diabetes w/RD: diabetics with DR; Diabetes w/RD and Edema: diabetics with DR and macular edema.
For the different cytokines analyzed, the intensity of the fluorescent signal was
confronted and the values are represented in table VII.
Table VII. Mean intensity and statistical significance of the fluorescent signal (optical density values F532-B532) of the cytokines present in the aqueous humour of the four groups in all patients. Significant values are in bold (*p, 0.05, **p, 0.001, ***p,0.0001 (ANOVA followed by Tukey-Kramer post-hoc). Diabetics w/oDR: diabetics without DR; Diabetics w/DR ME-: diabetics with DR and no macular edema; Diabetics w/DR ME+: diabetics with DR and with macular edema; monocytochemotactic protein-1 (MCP-1); granulocyte colony-stimulating factor (G-CSF), granulocyte/macrophage colony-stimulating factor (GM-CSF),interferon (IFN)-, interferon-inducible 10-kDa protein(IP-10), macrophage inflammatory protein-1 alpha (MIP-1a), MIP-1b, platelet-derived growth factor (PDGF)-BB, regulated upon activation, normal T cell expressed and secreted, tumor necrosis factor alpha (TNF-a), intercellular adhesion molecule-1 (ICAM-1).
0
2
4
6
8
10
12
control diabetes w/o RD diabetes w/RD diabetes w/RD andEdema
rate
exp
ress
ion
A
QP
4/A
QP
1
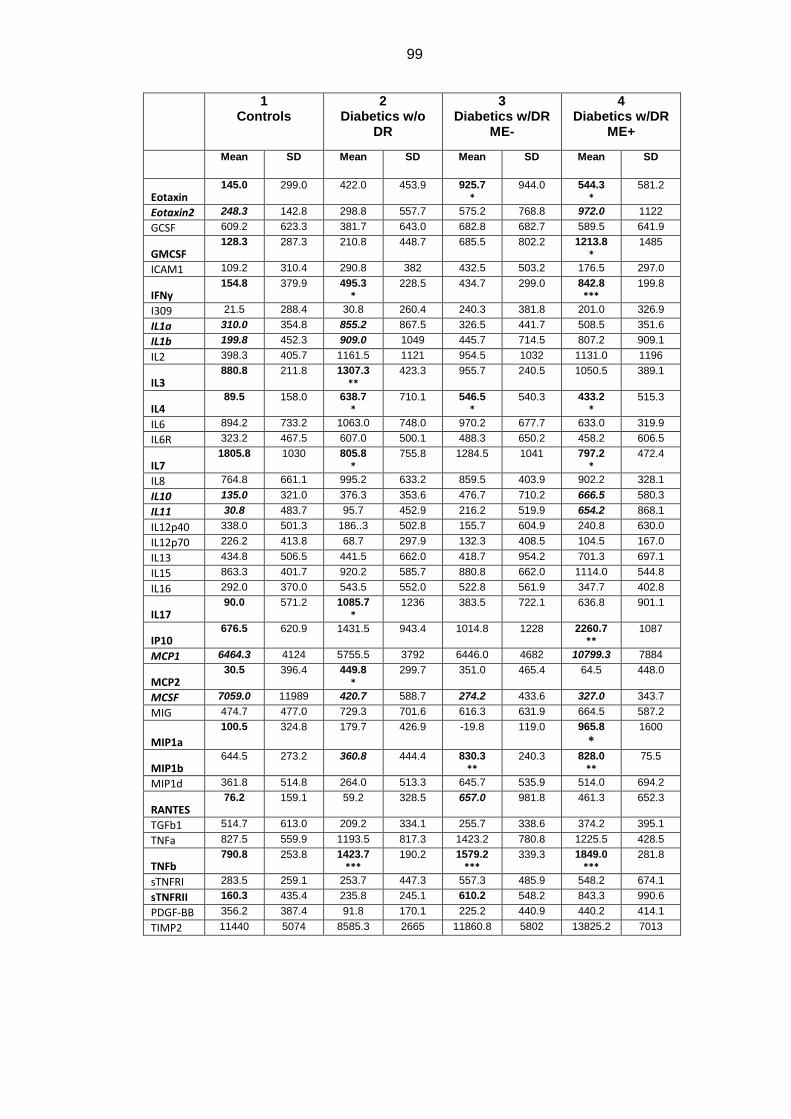
99
1 Controls
2 Diabetics w/o
DR
3 Diabetics w/DR
ME-
4 Diabetics w/DR
ME+
Mean SD Mean SD Mean SD Mean SD
Eotaxin 145.0 299.0 422.0 453.9 925.7
*
944.0 544.3
*
581.2
Eotaxin2 248.3 142.8 298.8 557.7 575.2 768.8 972.0 1122
GCSF 609.2 623.3 381.7 643.0 682.8 682.7 589.5 641.9
GMCSF 128.3 287.3 210.8 448.7 685.5 802.2 1213.8
*
1485
ICAM1 109.2 310.4 290.8 382 432.5 503.2 176.5 297.0
IFNy 154.8 379.9 495.3
* 228.5 434.7 299.0 842.8
*** 199.8
I309 21.5 288.4 30.8 260.4 240.3 381.8 201.0 326.9
IL1a 310.0 354.8 855.2 867.5 326.5 441.7 508.5 351.6
IL1b 199.8 452.3 909.0 1049 445.7 714.5 807.2 909.1
IL2 398.3 405.7 1161.5 1121 954.5 1032 1131.0 1196
IL3 880.8 211.8 1307.3
**
423.3 955.7 240.5 1050.5 389.1
IL4 89.5 158.0 638.7
* 710.1 546.5
* 540.3 433.2
* 515.3
IL6 894.2 733.2 1063.0 748.0 970.2 677.7 633.0 319.9
IL6R 323.2 467.5 607.0 500.1 488.3 650.2 458.2 606.5
IL7 1805.8
1030 805.8
*
755.8 1284.5 1041 797.2
*
472.4
IL8 764.8 661.1 995.2 633.2 859.5 403.9 902.2 328.1
IL10 135.0 321.0 376.3 353.6 476.7 710.2 666.5 580.3
IL11 30.8 483.7 95.7 452.9 216.2 519.9 654.2 868.1
IL12p40 338.0 501.3 186..3 502.8 155.7 604.9 240.8 630.0
IL12p70 226.2 413.8 68.7 297.9 132.3 408.5 104.5 167.0
IL13 434.8 506.5 441.5 662.0 418.7 954.2 701.3 697.1
IL15 863.3 401.7 920.2 585.7 880.8 662.0 1114.0 544.8
IL16 292.0 370.0 543.5 552.0 522.8 561.9 347.7 402.8
IL17 90.0 571.2 1085.7
*
1236 383.5 722.1 636.8 901.1
IP10 676.5 620.9 1431.5 943.4 1014.8 1228 2260.7
** 1087
MCP1 6464.3 4124 5755.5 3792 6446.0 4682 10799.3 7884
MCP2 30.5 396.4 449.8
*
299.7 351.0 465.4 64.5 448.0
MCSF 7059.0 11989 420.7 588.7 274.2 433.6 327.0 343.7
MIG 474.7 477.0 729.3 701.6 616.3 631.9 664.5 587.2
MIP1a
100.5 324.8 179.7 426.9 -19.8 119.0 965.8
*
1600
MIP1b 644.5 273.2 360.8 444.4 830.3
**
240.3 828.0
**
75.5
MIP1d 361.8 514.8 264.0 513.3 645.7 535.9 514.0 694.2
RANTES 76.2 159.1 59.2 328.5 657.0 981.8
461.3 652.3
TGFb1 514.7 613.0 209.2 334.1 255.7 338.6 374.2 395.1
TNFa 827.5 559.9 1193.5 817.3 1423.2 780.8 1225.5 428.5
TNFb 790.8 253.8 1423.7
*** 190.2 1579.2
*** 339.3 1849.0
*** 281.8
sTNFRI 283.5 259.1 253.7 447.3 557.3 485.9 548.2 674.1
sTNFRII 160.3 435.4 235.8 245.1 610.2 548.2 843.3 990.6
PDGF-BB 356.2 387.4 91.8 170.1 225.2 440.9 440.2 414.1
TIMP2 11440 5074 8585.3 2665 11860.8 5802 13825.2 7013
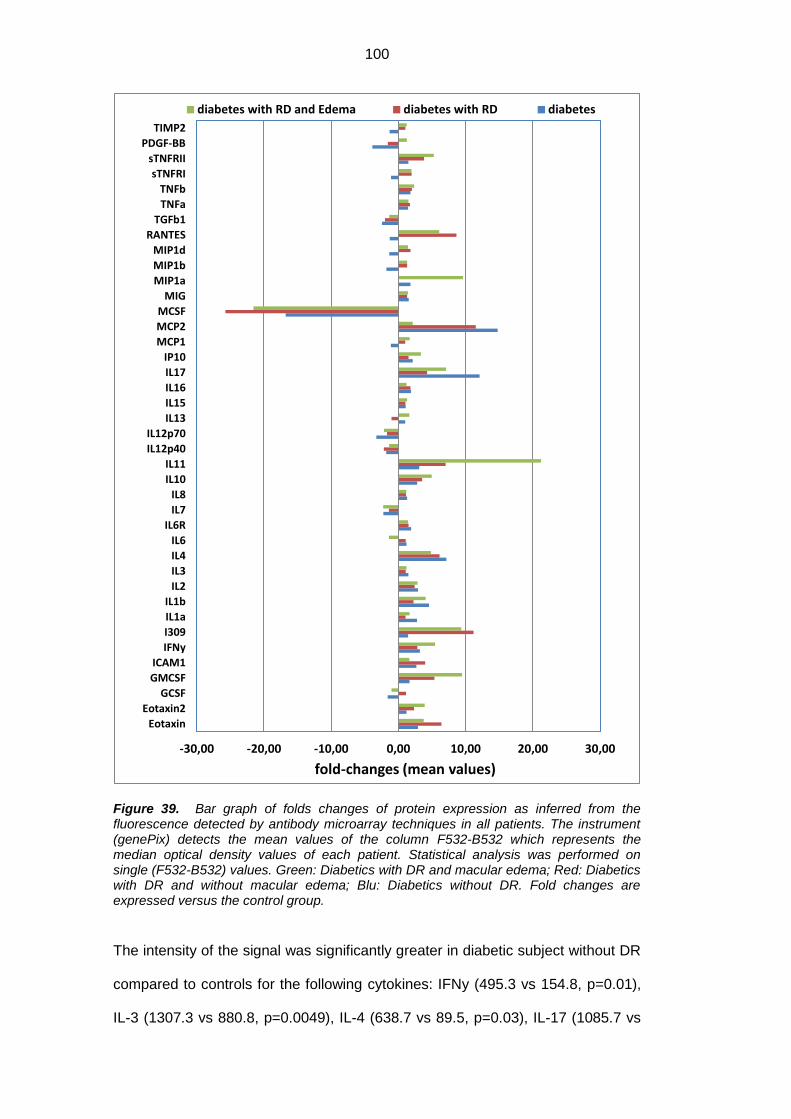
100
Figure 39. Bar graph of folds changes of protein expression as inferred from the fluorescence detected by antibody microarray techniques in all patients. The instrument (genePix) detects the mean values of the column F532-B532 which represents the median optical density values of each patient. Statistical analysis was performed on single (F532-B532) values. Green: Diabetics with DR and macular edema; Red: Diabetics with DR and without macular edema; Blu: Diabetics without DR. Fold changes are expressed versus the control group.
The intensity of the signal was significantly greater in diabetic subject without DR
compared to controls for the following cytokines: IFNy (495.3 vs 154.8, p=0.01),
IL-3 (1307.3 vs 880.8, p=0.0049), IL-4 (638.7 vs 89.5, p=0.03), IL-17 (1085.7 vs
-30,00 -20,00 -10,00 0,00 10,00 20,00 30,00
Eotaxin
Eotaxin2
GCSF
GMCSF
ICAM1
IFNy
I309
IL1a
IL1b
IL2
IL3
IL4
IL6
IL6R
IL7
IL8
IL10
IL11
IL12p40
IL12p70
IL13
IL15
IL16
IL17
IP10
MCP1
MCP2
MCSF
MIG
MIP1a
MIP1b
MIP1d
RANTES
TGFb1
TNFa
TNFb
sTNFRI
sTNFRII
PDGF-BB
TIMP2
fold-changes (mean values)
diabetes with RD and Edema diabetes with RD diabetes
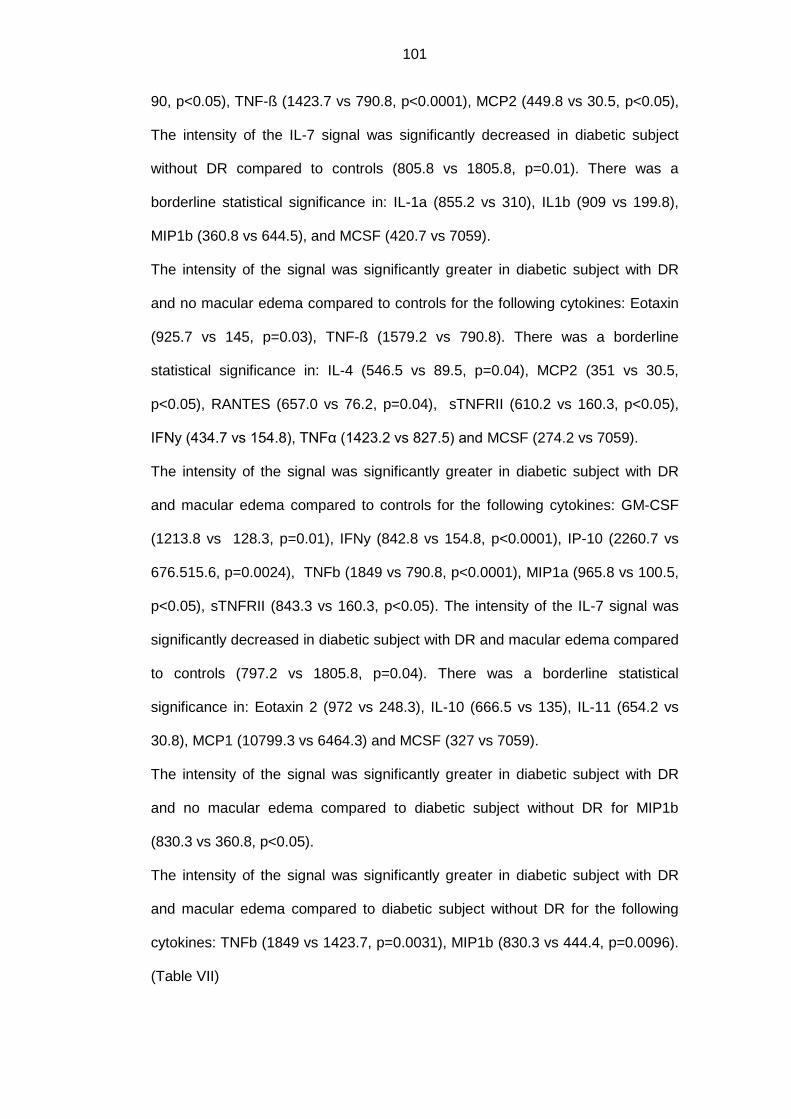
101
90, p<0.05), TNF-ß (1423.7 vs 790.8, p<0.0001), MCP2 (449.8 vs 30.5, p<0.05),
The intensity of the IL-7 signal was significantly decreased in diabetic subject
without DR compared to controls (805.8 vs 1805.8, p=0.01). There was a
borderline statistical significance in: IL-1a (855.2 vs 310), IL1b (909 vs 199.8),
MIP1b (360.8 vs 644.5), and MCSF (420.7 vs 7059).
The intensity of the signal was significantly greater in diabetic subject with DR
and no macular edema compared to controls for the following cytokines: Eotaxin
(925.7 vs 145, p=0.03), TNF-ß (1579.2 vs 790.8). There was a borderline
statistical significance in: IL-4 (546.5 vs 89.5, p=0.04), MCP2 (351 vs 30.5,
p<0.05), RANTES (657.0 vs 76.2, p=0.04), sTNFRII (610.2 vs 160.3, p<0.05),
IFNy (434.7 vs 154.8), TNFα (1423.2 vs 827.5) and MCSF (274.2 vs 7059).
The intensity of the signal was significantly greater in diabetic subject with DR
and macular edema compared to controls for the following cytokines: GM-CSF
(1213.8 vs 128.3, p=0.01), IFNy (842.8 vs 154.8, p<0.0001), IP-10 (2260.7 vs
676.515.6, p=0.0024), TNFb (1849 vs 790.8, p<0.0001), MIP1a (965.8 vs 100.5,
p<0.05), sTNFRII (843.3 vs 160.3, p<0.05). The intensity of the IL-7 signal was
significantly decreased in diabetic subject with DR and macular edema compared
to controls (797.2 vs 1805.8, p=0.04). There was a borderline statistical
significance in: Eotaxin 2 (972 vs 248.3), IL-10 (666.5 vs 135), IL-11 (654.2 vs
30.8), MCP1 (10799.3 vs 6464.3) and MCSF (327 vs 7059).
The intensity of the signal was significantly greater in diabetic subject with DR
and no macular edema compared to diabetic subject without DR for MIP1b
(830.3 vs 360.8, p<0.05).
The intensity of the signal was significantly greater in diabetic subject with DR
and macular edema compared to diabetic subject without DR for the following
cytokines: TNFb (1849 vs 1423.7, p=0.0031), MIP1b (830.3 vs 444.4, p=0.0096).
(Table VII)
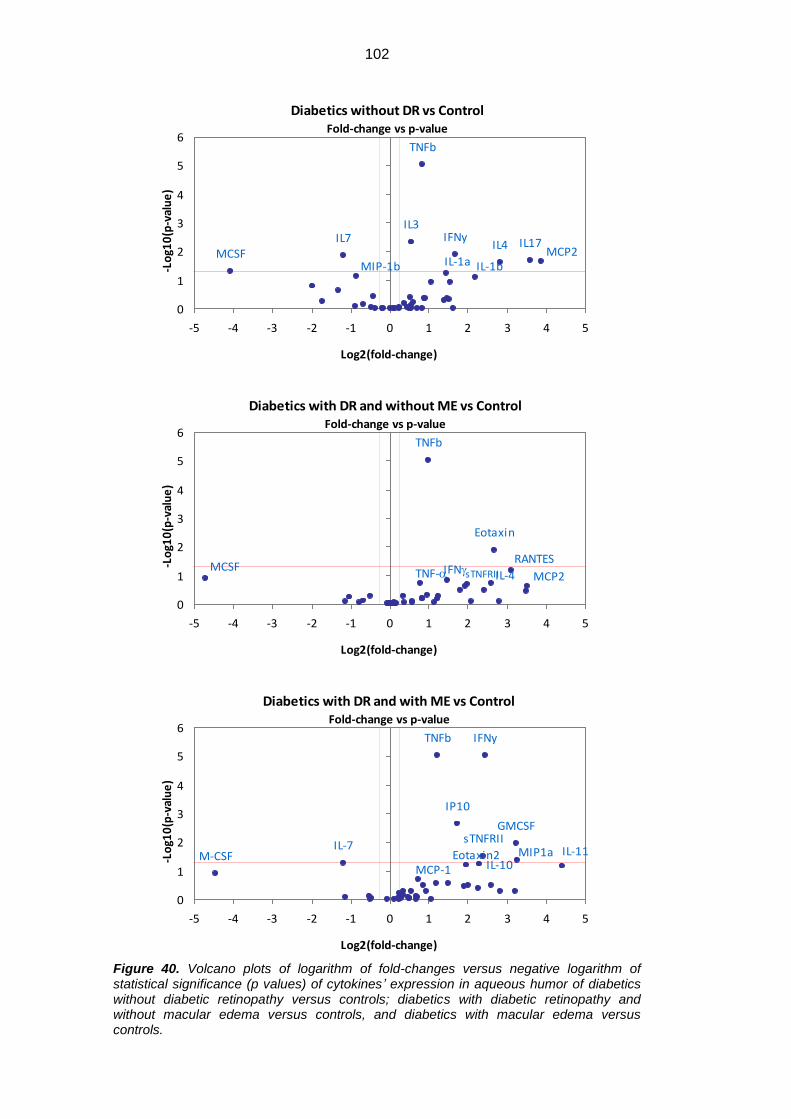
102
Figure 40. Volcano plots of logarithm of fold-changes versus negative logarithm of statistical significance (p values) of cytokines’ expression in aqueous humor of diabetics without diabetic retinopathy versus controls; diabetics with diabetic retinopathy and without macular edema versus controls, and diabetics with macular edema versus controls.
Diabetics without DR vs ControlFold-change vs p-value
IFNy
IL-1a IL-1b
IL3
IL4IL7 IL17
MCP2MCSFMIP-1b
TNFb
0
1
2
3
4
5
6
-5 -4 -3 -2 -1 0 1 2 3 4 5
Log2(fold-change)
-Lo
g10
(p-v
alu
e)
Diabetics with DR and without ME vs ControlFold-change vs p-value
Eotaxin
IFNg IL-4 MCP2MCSF
RANTESTNF-a
TNFb
sTNFRII
0
1
2
3
4
5
6
-5 -4 -3 -2 -1 0 1 2 3 4 5
Log2(fold-change)
-Lo
g10
(p-v
alu
e)
Diabetics with DR and with ME vs ControlFold-change vs p-value
Eotaxin2
GMCSF
IFNy
IL-7
IL-10IL-11
IP10
MCP-1M-CSF MIP1a
TNFb
sTNFRII
0
1
2
3
4
5
6
-5 -4 -3 -2 -1 0 1 2 3 4 5
Log2(fold-change)
-Lo
g10
(p-v
alu
e)
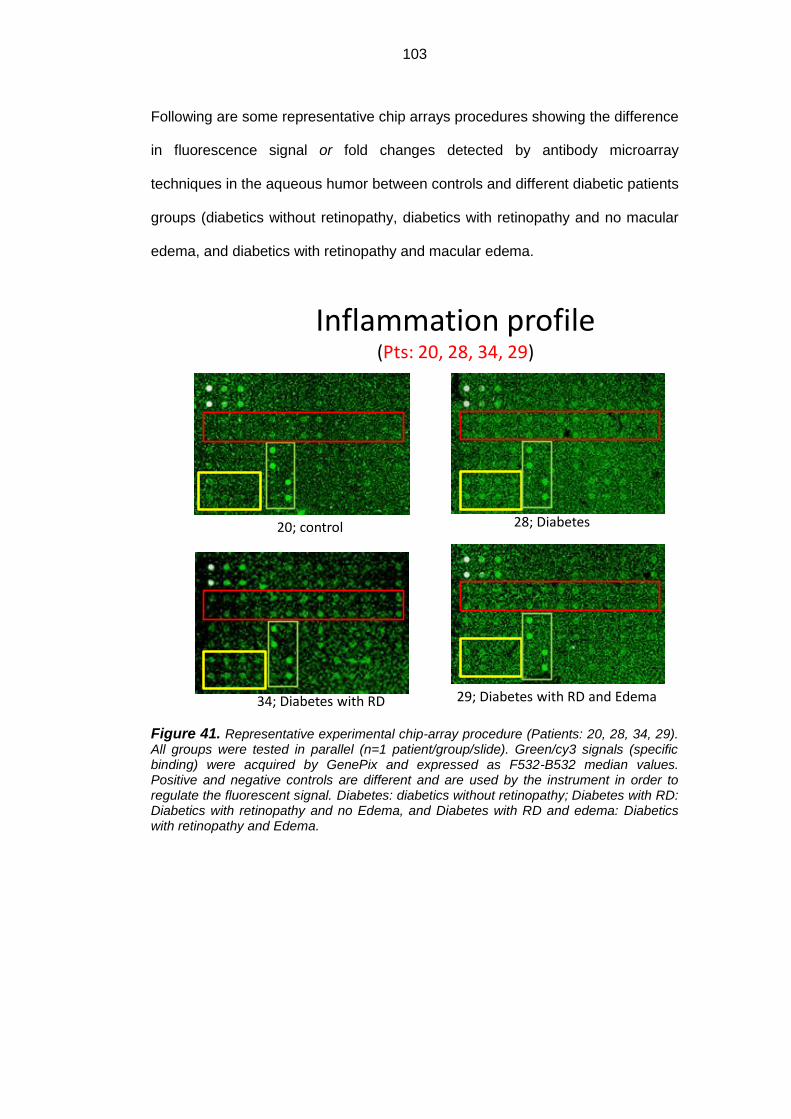
103
Following are some representative chip arrays procedures showing the difference
in fluorescence signal or fold changes detected by antibody microarray
techniques in the aqueous humor between controls and different diabetic patients
groups (diabetics without retinopathy, diabetics with retinopathy and no macular
edema, and diabetics with retinopathy and macular edema.
Figure 41. Representative experimental chip-array procedure (Patients: 20, 28, 34, 29). All groups were tested in parallel (n=1 patient/group/slide). Green/cy3 signals (specific binding) were acquired by GenePix and expressed as F532-B532 median values. Positive and negative controls are different and are used by the instrument in order to regulate the fluorescent signal. Diabetes: diabetics without retinopathy; Diabetes with RD: Diabetics with retinopathy and no Edema, and Diabetes with RD and edema: Diabetics with retinopathy and Edema.
Inflammation profile(Pts: 20, 28, 34, 29)
29; Diabetes with RD and Edema
20; control 28; Diabetes
34; Diabetes with RD
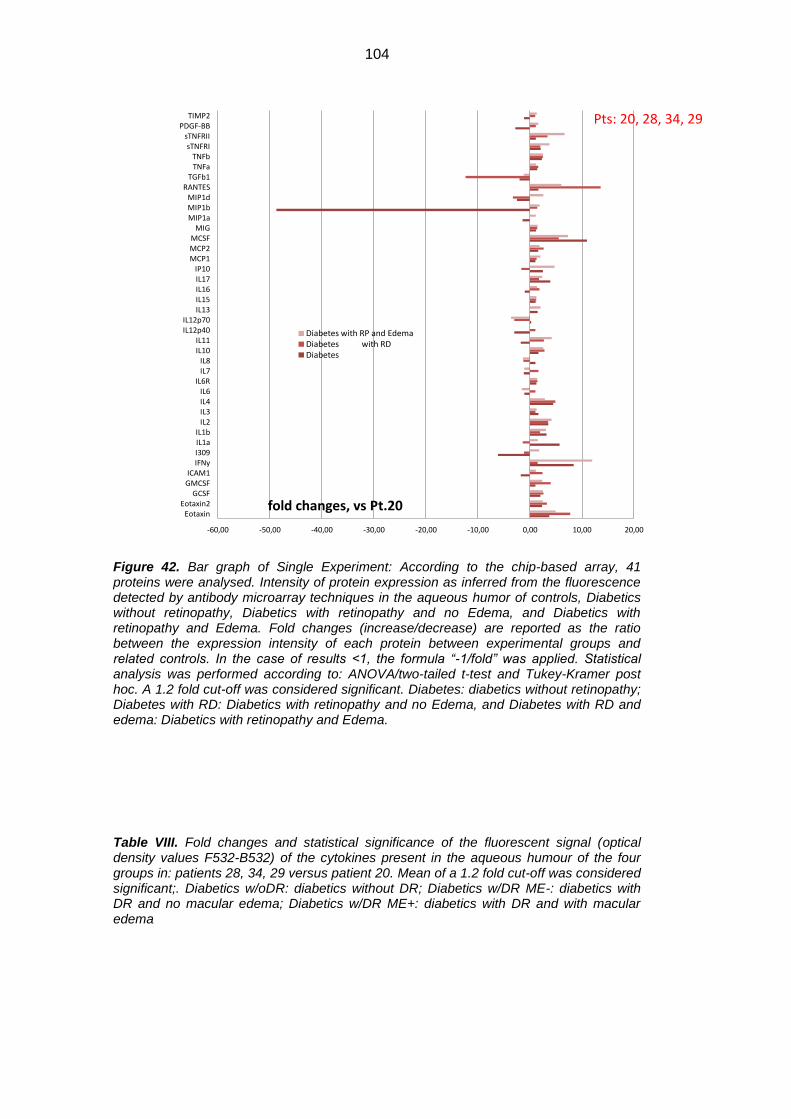
104
Figure 42. Bar graph of Single Experiment: According to the chip-based array, 41 proteins were analysed. Intensity of protein expression as inferred from the fluorescence detected by antibody microarray techniques in the aqueous humor of controls, Diabetics without retinopathy, Diabetics with retinopathy and no Edema, and Diabetics with retinopathy and Edema. Fold changes (increase/decrease) are reported as the ratio between the expression intensity of each protein between experimental groups and related controls. In the case of results <1, the formula “-1/fold” was applied. Statistical analysis was performed according to: ANOVA/two-tailed t-test and Tukey-Kramer post hoc. A 1.2 fold cut-off was considered significant. Diabetes: diabetics without retinopathy; Diabetes with RD: Diabetics with retinopathy and no Edema, and Diabetes with RD and edema: Diabetics with retinopathy and Edema.
Table VIII. Fold changes and statistical significance of the fluorescent signal (optical density values F532-B532) of the cytokines present in the aqueous humour of the four groups in: patients 28, 34, 29 versus patient 20. Mean of a 1.2 fold cut-off was considered significant;. Diabetics w/oDR: diabetics without DR; Diabetics w/DR ME-: diabetics with DR and no macular edema; Diabetics w/DR ME+: diabetics with DR and with macular edema
-60,00 -50,00 -40,00 -30,00 -20,00 -10,00 0,00 10,00 20,00
EotaxinEotaxin2
GCSFGMCSFICAM1
IFNyI309IL1aIL1b
IL2IL3IL4IL6
IL6RIL7IL8
IL10IL11
IL12p40IL12p70
IL13IL15IL16IL17IP10
MCP1MCP2MCSF
MIGMIP1aMIP1bMIP1d
RANTESTGFb1
TNFaTNFb
sTNFRIsTNFRII
PDGF-BBTIMP2
fold changes, vs Pt.20
Diabetes with RP and EdemaDiabetes with RDDiabetes
Pts: 20, 28, 34, 29
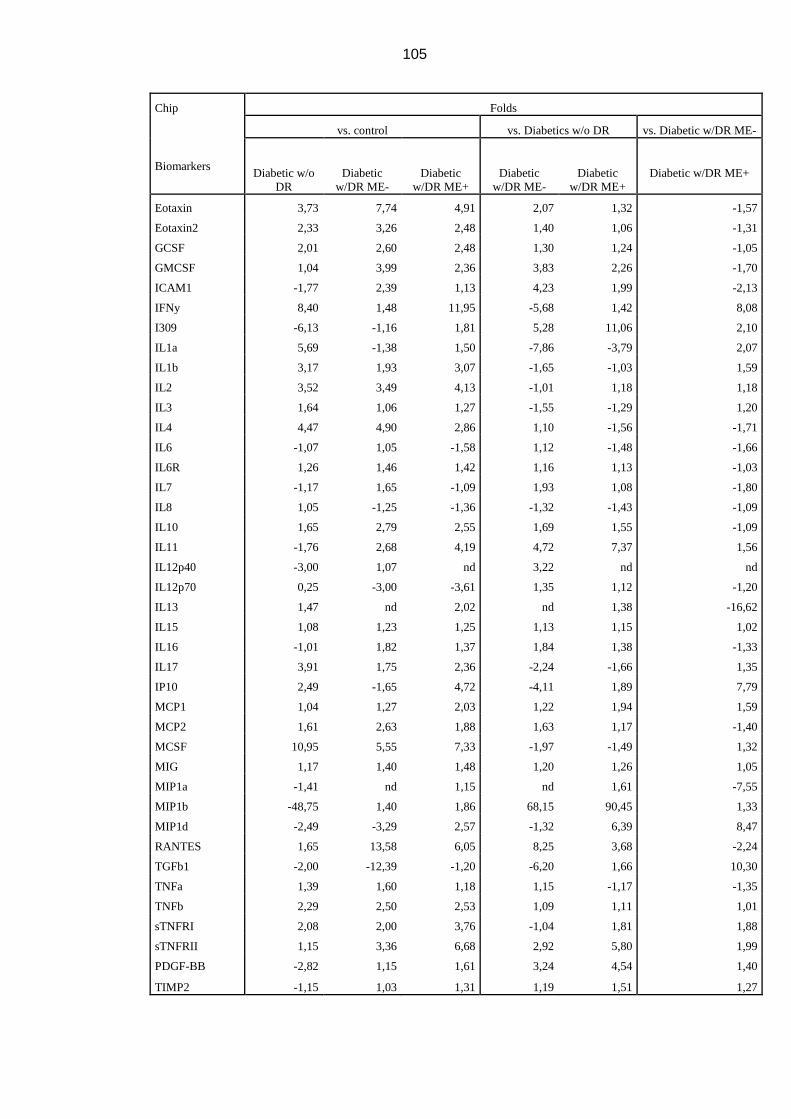
105
Chip Folds
vs. control vs. Diabetics w/o DR vs. Diabetic w/DR ME-
Biomarkers Diabetic w/o
DR
Diabetic
w/DR ME-
Diabetic
w/DR ME+
Diabetic
w/DR ME-
Diabetic
w/DR ME+
Diabetic w/DR ME+
Eotaxin 3,73 7,74 4,91 2,07 1,32 -1,57
Eotaxin2 2,33 3,26 2,48 1,40 1,06 -1,31
GCSF 2,01 2,60 2,48 1,30 1,24 -1,05
GMCSF 1,04 3,99 2,36 3,83 2,26 -1,70
ICAM1 -1,77 2,39 1,13 4,23 1,99 -2,13
IFNy 8,40 1,48 11,95 -5,68 1,42 8,08
I309 -6,13 -1,16 1,81 5,28 11,06 2,10
IL1a 5,69 -1,38 1,50 -7,86 -3,79 2,07
IL1b 3,17 1,93 3,07 -1,65 -1,03 1,59
IL2 3,52 3,49 4,13 -1,01 1,18 1,18
IL3 1,64 1,06 1,27 -1,55 -1,29 1,20
IL4 4,47 4,90 2,86 1,10 -1,56 -1,71
IL6 -1,07 1,05 -1,58 1,12 -1,48 -1,66
IL6R 1,26 1,46 1,42 1,16 1,13 -1,03
IL7 -1,17 1,65 -1,09 1,93 1,08 -1,80
IL8 1,05 -1,25 -1,36 -1,32 -1,43 -1,09
IL10 1,65 2,79 2,55 1,69 1,55 -1,09
IL11 -1,76 2,68 4,19 4,72 7,37 1,56
IL12p40 -3,00 1,07 nd 3,22 nd nd
IL12p70 0,25 -3,00 -3,61 1,35 1,12 -1,20
IL13 1,47 nd 2,02 nd 1,38 -16,62
IL15 1,08 1,23 1,25 1,13 1,15 1,02
IL16 -1,01 1,82 1,37 1,84 1,38 -1,33
IL17 3,91 1,75 2,36 -2,24 -1,66 1,35
IP10 2,49 -1,65 4,72 -4,11 1,89 7,79
MCP1 1,04 1,27 2,03 1,22 1,94 1,59
MCP2 1,61 2,63 1,88 1,63 1,17 -1,40
MCSF 10,95 5,55 7,33 -1,97 -1,49 1,32
MIG 1,17 1,40 1,48 1,20 1,26 1,05
MIP1a -1,41 nd 1,15 nd 1,61 -7,55
MIP1b -48,75 1,40 1,86 68,15 90,45 1,33
MIP1d -2,49 -3,29 2,57 -1,32 6,39 8,47
RANTES 1,65 13,58 6,05 8,25 3,68 -2,24
TGFb1 -2,00 -12,39 -1,20 -6,20 1,66 10,30
TNFa 1,39 1,60 1,18 1,15 -1,17 -1,35
TNFb 2,29 2,50 2,53 1,09 1,11 1,01
sTNFRI 2,08 2,00 3,76 -1,04 1,81 1,88
sTNFRII 1,15 3,36 6,68 2,92 5,80 1,99
PDGF-BB -2,82 1,15 1,61 3,24 4,54 1,40
TIMP2 -1,15 1,03 1,31 1,19 1,51 1,27
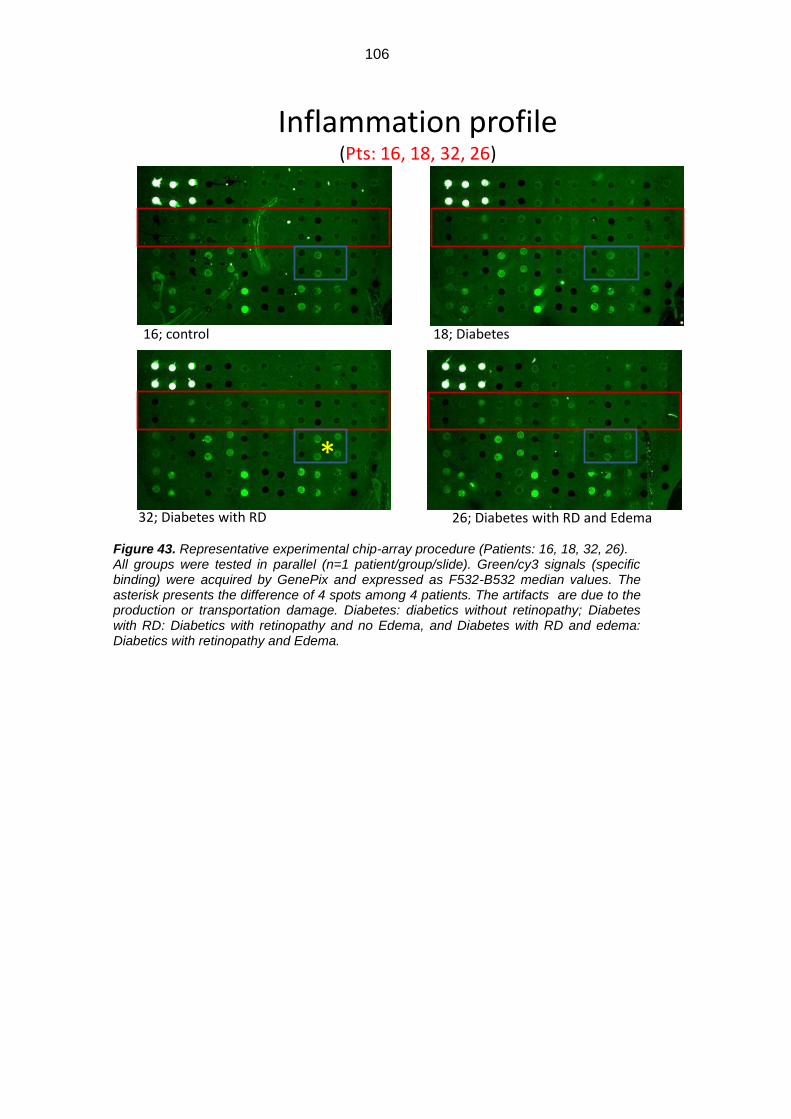
106
Figure 43. Representative experimental chip-array procedure (Patients: 16, 18, 32, 26). All groups were tested in parallel (n=1 patient/group/slide). Green/cy3 signals (specific binding) were acquired by GenePix and expressed as F532-B532 median values. The asterisk presents the difference of 4 spots among 4 patients. The artifacts are due to the production or transportation damage. Diabetes: diabetics without retinopathy; Diabetes with RD: Diabetics with retinopathy and no Edema, and Diabetes with RD and edema: Diabetics with retinopathy and Edema.
*
Inflammation profile(Pts: 16, 18, 32, 26)
16; control 18; Diabetes
32; Diabetes with RD 26; Diabetes with RD and Edema

107
Figure 44. Bar graph of Single Experiment: Intensity of protein expression as inferred
from the fluorescence detected by antibody microarray techniques in the 1st detection.
Fold changes (increase/decrease) are reported as the ratio between the expression
intensity of each protein between experimental groups and related controls. In the case of
results <1, the formula “-1/fold” was applied. Statistical analysis was performed according
to: ANOVA/two-tailed t-test and Tukey-Kramer post-hoc. A 1.2 fold cut-off was considered
significant. Diabetes: diabetics without retinopathy; Diabetes with RD: Diabetics with
retinopathy and no Edema, and Diabetes with RD and edema: Diabetics with retinopathy
and Edema.
Table IX. Fold changes and statistical significance of the fluorescent signal (optical density values F532-B532) of the cytokines present in the aqueous humour of the four groups in: patients 18, 32, 26 versus patient 16. Mean of a 1.2 fold cut-off was considered significant;. Diabetics w/oDR: diabetics without DR; Diabetics w/DR ME-: diabetics with DR and no macular edema; Diabetics w/DR ME+: diabetics with DR and with macular edema
-6,00 -4,00 -2,00 0,00 2,00 4,00 6,00 8,00 10,00 12,00 14,00 16,00
EotaxinEotaxin2
GCSFGMCSFICAM1
IFNyI309IL1aIL1b
IL2IL3IL4IL6
IL6RIL7IL8
IL10IL11
IL12p40IL12p70
IL13IL15IL16IL17IP10
MCP1MCP2MCSF
MIGMIP1aMIP1bMIP1d
RANTESTGFb1
TNFaTNFb
sTNFRIsTNFRII
PDGF-BBTIMP2
Fold changes, vs. Pt 16
Diabetes with RD and Edema
Diabetes with RD
Diabetes
Pts: 16, 18, 32, 26
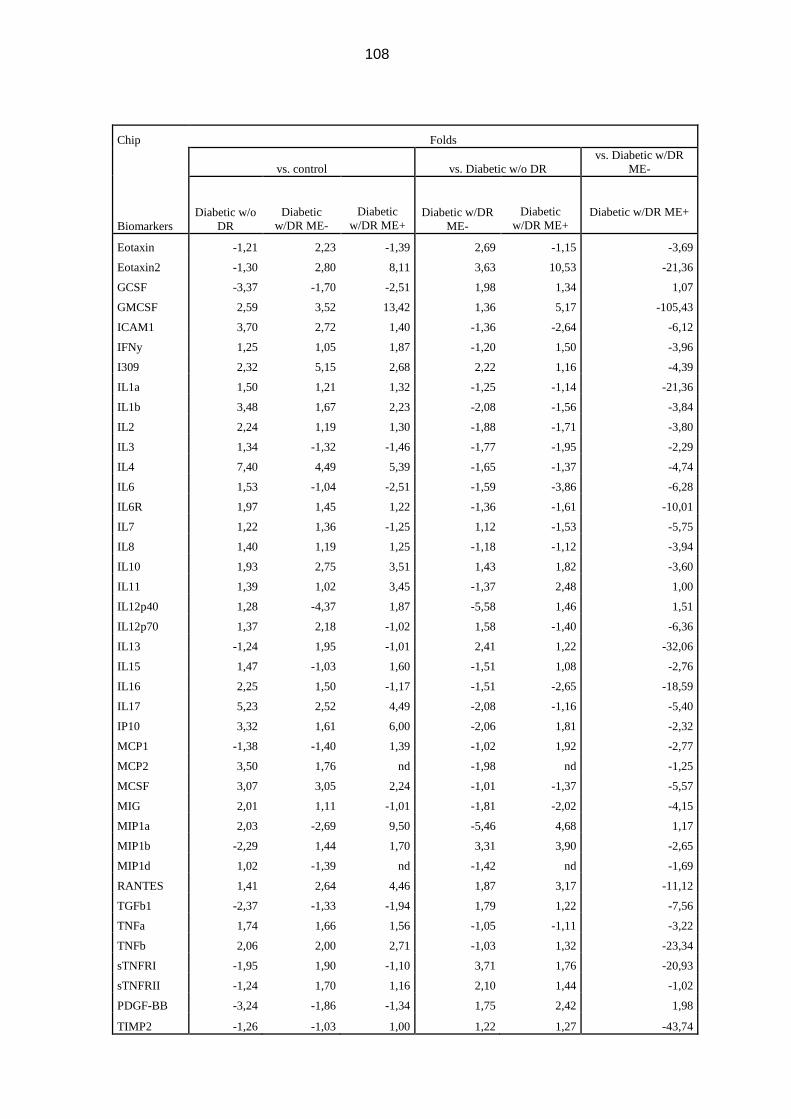
108
Chip Folds
vs. control vs. Diabetic w/o DR
vs. Diabetic w/DR
ME-
Biomarkers
Diabetic w/o
DR
Diabetic
w/DR ME-
Diabetic
w/DR ME+ Diabetic w/DR
ME-
Diabetic
w/DR ME+
Diabetic w/DR ME+
Eotaxin -1,21 2,23 -1,39 2,69 -1,15 -3,69
Eotaxin2 -1,30 2,80 8,11 3,63 10,53 -21,36
GCSF -3,37 -1,70 -2,51 1,98 1,34 1,07
GMCSF 2,59 3,52 13,42 1,36 5,17 -105,43
ICAM1 3,70 2,72 1,40 -1,36 -2,64 -6,12
IFNy 1,25 1,05 1,87 -1,20 1,50 -3,96
I309 2,32 5,15 2,68 2,22 1,16 -4,39
IL1a 1,50 1,21 1,32 -1,25 -1,14 -21,36
IL1b 3,48 1,67 2,23 -2,08 -1,56 -3,84
IL2 2,24 1,19 1,30 -1,88 -1,71 -3,80
IL3 1,34 -1,32 -1,46 -1,77 -1,95 -2,29
IL4 7,40 4,49 5,39 -1,65 -1,37 -4,74
IL6 1,53 -1,04 -2,51 -1,59 -3,86 -6,28
IL6R 1,97 1,45 1,22 -1,36 -1,61 -10,01
IL7 1,22 1,36 -1,25 1,12 -1,53 -5,75
IL8 1,40 1,19 1,25 -1,18 -1,12 -3,94
IL10 1,93 2,75 3,51 1,43 1,82 -3,60
IL11 1,39 1,02 3,45 -1,37 2,48 1,00
IL12p40 1,28 -4,37 1,87 -5,58 1,46 1,51
IL12p70 1,37 2,18 -1,02 1,58 -1,40 -6,36
IL13 -1,24 1,95 -1,01 2,41 1,22 -32,06
IL15 1,47 -1,03 1,60 -1,51 1,08 -2,76
IL16 2,25 1,50 -1,17 -1,51 -2,65 -18,59
IL17 5,23 2,52 4,49 -2,08 -1,16 -5,40
IP10 3,32 1,61 6,00 -2,06 1,81 -2,32
MCP1 -1,38 -1,40 1,39 -1,02 1,92 -2,77
MCP2 3,50 1,76 nd -1,98 nd -1,25
MCSF 3,07 3,05 2,24 -1,01 -1,37 -5,57
MIG 2,01 1,11 -1,01 -1,81 -2,02 -4,15
MIP1a 2,03 -2,69 9,50 -5,46 4,68 1,17
MIP1b -2,29 1,44 1,70 3,31 3,90 -2,65
MIP1d 1,02 -1,39 nd -1,42 nd -1,69
RANTES 1,41 2,64 4,46 1,87 3,17 -11,12
TGFb1 -2,37 -1,33 -1,94 1,79 1,22 -7,56
TNFa 1,74 1,66 1,56 -1,05 -1,11 -3,22
TNFb 2,06 2,00 2,71 -1,03 1,32 -23,34
sTNFRI -1,95 1,90 -1,10 3,71 1,76 -20,93
sTNFRII -1,24 1,70 1,16 2,10 1,44 -1,02
PDGF-BB -3,24 -1,86 -1,34 1,75 2,42 1,98
TIMP2 -1,26 -1,03 1,00 1,22 1,27 -43,74
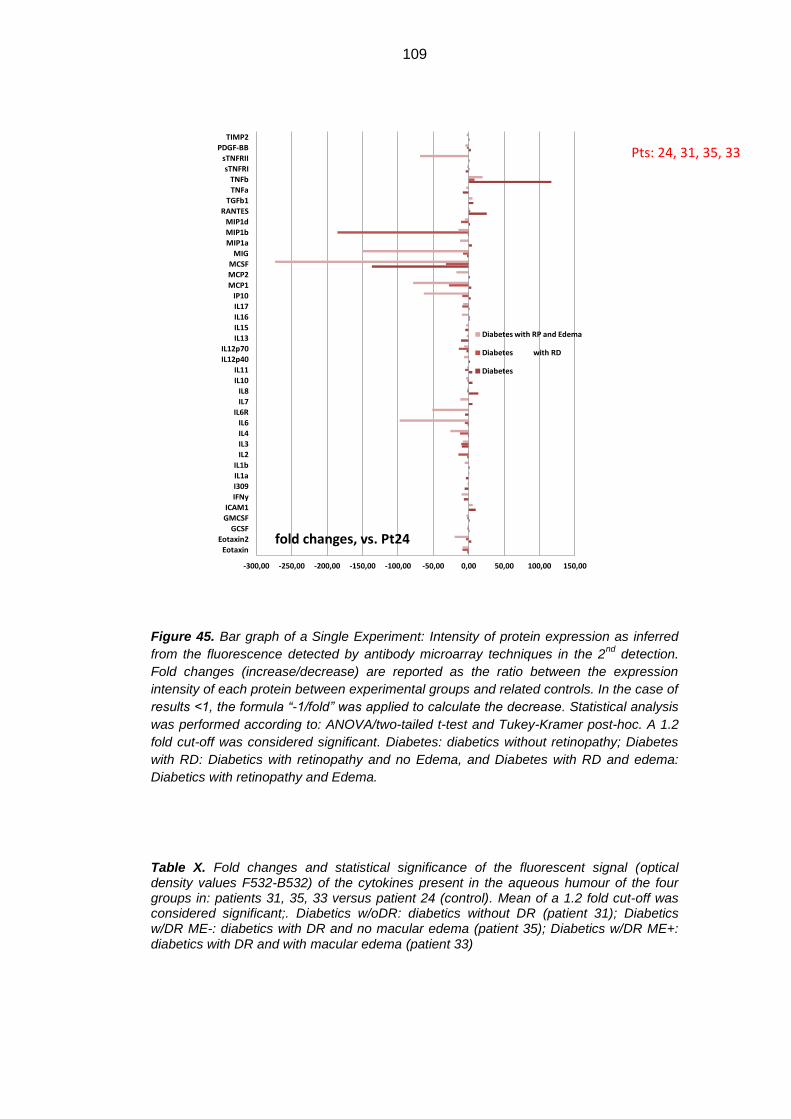
109
Figure 45. Bar graph of a Single Experiment: Intensity of protein expression as inferred
from the fluorescence detected by antibody microarray techniques in the 2nd
detection.
Fold changes (increase/decrease) are reported as the ratio between the expression
intensity of each protein between experimental groups and related controls. In the case of
results <1, the formula “-1/fold” was applied to calculate the decrease. Statistical analysis
was performed according to: ANOVA/two-tailed t-test and Tukey-Kramer post-hoc. A 1.2
fold cut-off was considered significant. Diabetes: diabetics without retinopathy; Diabetes
with RD: Diabetics with retinopathy and no Edema, and Diabetes with RD and edema:
Diabetics with retinopathy and Edema.
Table X. Fold changes and statistical significance of the fluorescent signal (optical density values F532-B532) of the cytokines present in the aqueous humour of the four groups in: patients 31, 35, 33 versus patient 24 (control). Mean of a 1.2 fold cut-off was considered significant;. Diabetics w/oDR: diabetics without DR (patient 31); Diabetics w/DR ME-: diabetics with DR and no macular edema (patient 35); Diabetics w/DR ME+: diabetics with DR and with macular edema (patient 33)
-300,00 -250,00 -200,00 -150,00 -100,00 -50,00 0,00 50,00 100,00 150,00
Eotaxin
Eotaxin2
GCSF
GMCSF
ICAM1
IFNy
I309
IL1a
IL1b
IL2
IL3
IL4
IL6
IL6R
IL7
IL8
IL10
IL11
IL12p40
IL12p70
IL13
IL15
IL16
IL17
IP10
MCP1
MCP2
MCSF
MIG
MIP1a
MIP1b
MIP1d
RANTES
TGFb1
TNFa
TNFb
sTNFRI
sTNFRII
PDGF-BB
TIMP2
fold changes, vs. Pt24
Diabetes with RP and Edema
Diabetes with RD
Diabetes
Pts: 24, 31, 35, 33
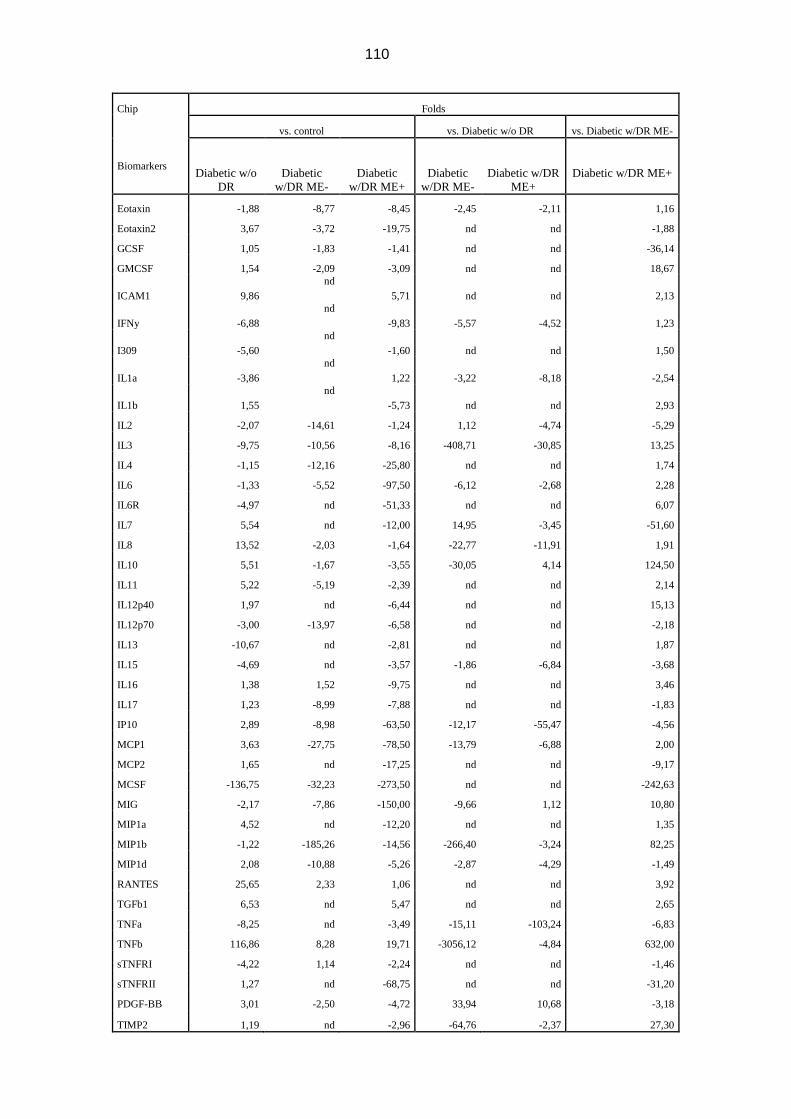
110
Chip Folds
vs. control vs. Diabetic w/o DR vs. Diabetic w/DR ME-
Biomarkers Diabetic w/o
DR
Diabetic
w/DR ME-
Diabetic
w/DR ME+
Diabetic
w/DR ME-
Diabetic w/DR
ME+
Diabetic w/DR ME+
Eotaxin -1,88 -8,77 -8,45 -2,45 -2,11 1,16
Eotaxin2 3,67 -3,72 -19,75 nd nd -1,88
GCSF 1,05 -1,83 -1,41 nd nd -36,14
GMCSF 1,54 -2,09 -3,09 nd nd 18,67
ICAM1 9,86
nd
5,71 nd nd 2,13
IFNy -6,88
nd
-9,83 -5,57 -4,52 1,23
I309 -5,60
nd
-1,60 nd nd 1,50
IL1a -3,86
nd
1,22 -3,22 -8,18 -2,54
IL1b 1,55
nd
-5,73 nd nd 2,93
IL2 -2,07 -14,61 -1,24 1,12 -4,74 -5,29
IL3 -9,75 -10,56 -8,16 -408,71 -30,85 13,25
IL4 -1,15 -12,16 -25,80 nd nd 1,74
IL6 -1,33 -5,52 -97,50 -6,12 -2,68 2,28
IL6R -4,97 nd -51,33 nd nd 6,07
IL7 5,54 nd -12,00 14,95 -3,45 -51,60
IL8 13,52 -2,03 -1,64 -22,77 -11,91 1,91
IL10 5,51 -1,67 -3,55 -30,05 4,14 124,50
IL11 5,22 -5,19 -2,39 nd nd 2,14
IL12p40 1,97 nd -6,44 nd nd 15,13
IL12p70 -3,00 -13,97 -6,58 nd nd -2,18
IL13 -10,67 nd -2,81 nd nd 1,87
IL15 -4,69 nd -3,57 -1,86 -6,84 -3,68
IL16 1,38 1,52 -9,75 nd nd 3,46
IL17 1,23 -8,99 -7,88 nd nd -1,83
IP10 2,89 -8,98 -63,50 -12,17 -55,47 -4,56
MCP1 3,63 -27,75 -78,50 -13,79 -6,88 2,00
MCP2 1,65 nd -17,25 nd nd -9,17
MCSF -136,75 -32,23 -273,50 nd nd -242,63
MIG -2,17 -7,86 -150,00 -9,66 1,12 10,80
MIP1a 4,52 nd -12,20 nd nd 1,35
MIP1b -1,22 -185,26 -14,56 -266,40 -3,24 82,25
MIP1d 2,08 -10,88 -5,26 -2,87 -4,29 -1,49
RANTES 25,65 2,33 1,06 nd nd 3,92
TGFb1 6,53 nd 5,47 nd nd 2,65
TNFa -8,25 nd -3,49 -15,11 -103,24 -6,83
TNFb 116,86 8,28 19,71 -3056,12 -4,84 632,00
sTNFRI -4,22 1,14 -2,24 nd nd -1,46
sTNFRII 1,27 nd -68,75 nd nd -31,20
PDGF-BB 3,01 -2,50 -4,72 33,94 10,68 -3,18
TIMP2 1,19 nd -2,96 -64,76 -2,37 27,30

111
4.3. Thickness analysis of the retinal layers
This study has also evaluated the thickness of various retinal layers via the SD-
OCT, considering 60 acquired intervals. The comparison between the 4 different
groups has been carried out: healthy controls, diabetics without DR, diabetics
with DR and without DME, and diabetics with DR and DME.
The mean thickness of various layers (60 intervals per layer) has shown
significant differences between the 4 groups in the following cases (table VIII):
- In the patient group with DR and DME, the average thicknesses of RNFL,
INL and ONL have resulted significantly greater compared to those of the
other 3 groups (p<0.05);
- In the patient group with DR and without DME, the RNFL thickness has
resulted significantly diminished, and the ONL thickness significantly
increased compared to the controls (p<0.05); in addition, though not
reaching the level of statistical significance, also in other groups there was
a tendency to RNFL reduction and ONL increase in diabetic patients
without DR compared to the controls.
Table XI. Comparison of the mean thickness and its standard deviation (in μm) of different retinal layers in the 4 groups of patients. Diabetics w/o DR: diabetics without retinopathy; diabetics w/DR ME-: diabetics with retinopathy and without macular edema; diabetics w/DR ME+: diabetics with retinopathy and DME; RNFL: nerve fiber layer; GCL: ganglion cell layer; IPL: inner plexiform layer; INL: inner nuclear layer; OPL: outer plexiform layer; ONL: outer nuclear layer.
LAYER
MEAN THICKNESS OF RETINAL LAYERS ± SD (μm)
Controls (N=12)
Diabetics w/o DR (N=11)
Diabetics w/DR ME-
(N=5)
Diabetics w/DR ME+
(N=6)
RNFL 26.8±3.4 26.5±2.8 24.3±2.6 37.3±9.9
GCL 39.4±3.3 40.2±4.6 38.5±2.3 44.1±5.6
IPL 30.3±1.8 29.7±3.8 29.9±2.9 33.8±2.9
INL 35.6±4.0 35.1±2.2 36.4±4.3 46.4±1.6
OPL 23.5±4.5 22.7±3.9 23.9±3.2 30.8±10.1
ONL 70.3±9.0 72.4±5.6 77.3±7.4 91.8±20.6
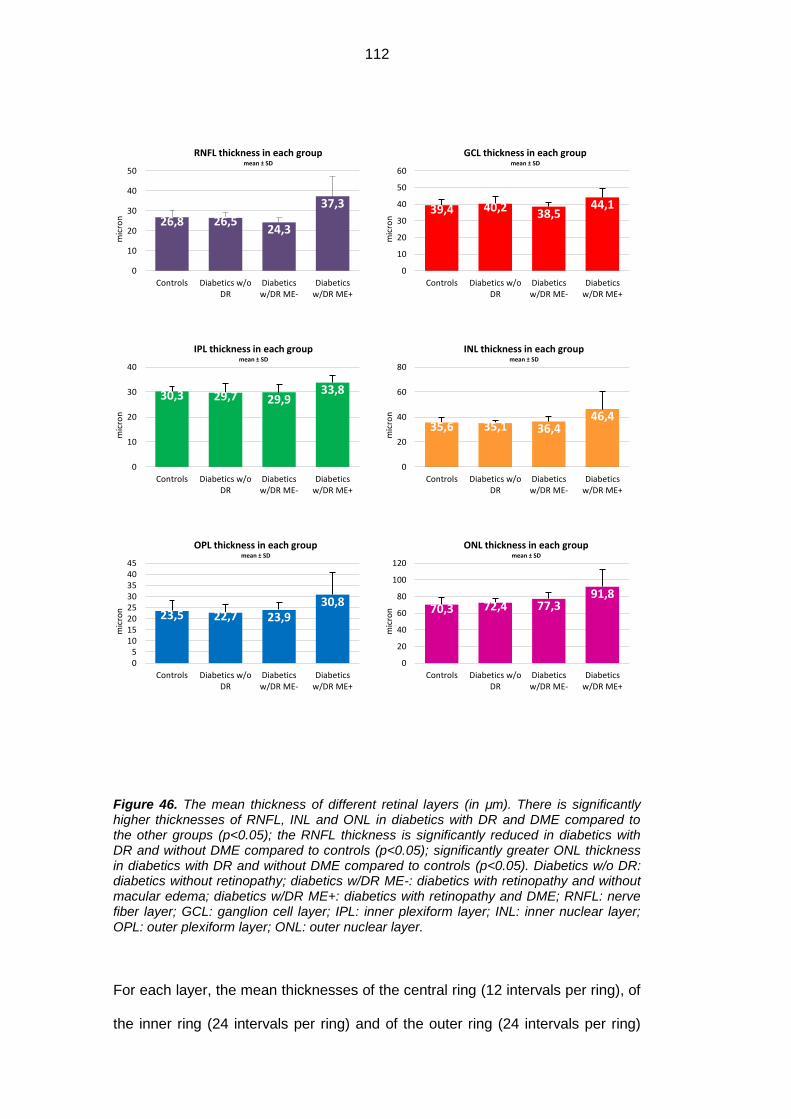
112
Figure 46. The mean thickness of different retinal layers (in μm). There is significantly higher thicknesses of RNFL, INL and ONL in diabetics with DR and DME compared to the other groups (p<0.05); the RNFL thickness is significantly reduced in diabetics with DR and without DME compared to controls (p<0.05); significantly greater ONL thickness in diabetics with DR and without DME compared to controls (p<0.05). Diabetics w/o DR: diabetics without retinopathy; diabetics w/DR ME-: diabetics with retinopathy and without macular edema; diabetics w/DR ME+: diabetics with retinopathy and DME; RNFL: nerve fiber layer; GCL: ganglion cell layer; IPL: inner plexiform layer; INL: inner nuclear layer; OPL: outer plexiform layer; ONL: outer nuclear layer.
For each layer, the mean thicknesses of the central ring (12 intervals per ring), of
the inner ring (24 intervals per ring) and of the outer ring (24 intervals per ring)
26,8 26,5 24,3
37,3
0
10
20
30
40
50
Controls Diabetics w/oDR
Diabeticsw/DR ME-
Diabeticsw/DR ME+
mic
ron
RNFL thickness in each group mean ± SD
39,4 40,2 38,5 44,1
0
10
20
30
40
50
60
Controls Diabetics w/oDR
Diabeticsw/DR ME-
Diabeticsw/DR ME+
mic
ron
GCL thickness in each group mean ± SD
30,3 29,7 29,9 33,8
0
10
20
30
40
Controls Diabetics w/oDR
Diabeticsw/DR ME-
Diabeticsw/DR ME+
mic
ron
IPL thickness in each group mean ± SD
35,6 35,1 36,4 46,4
0
20
40
60
80
Controls Diabetics w/oDR
Diabeticsw/DR ME-
Diabeticsw/DR ME+
mic
ron
INL thickness in each group mean ± SD
23,5 22,7 23,9 30,8
05
1015202530354045
Controls Diabetics w/oDR
Diabeticsw/DR ME-
Diabeticsw/DR ME+
mic
ron
OPL thickness in each group mean ± SD
70,3 72,4 77,3 91,8
0
20
40
60
80
100
120
Controls Diabetics w/oDR
Diabeticsw/DR ME-
Diabeticsw/DR ME+
mic
ron
ONL thickness in each group mean ± SD

113
have evidenced the significant differences between the 4 groups in the following
cases (table IX):
- in RNFL, the thicknesses of the inner and the outer rings are significantly
greater in diabetics with DR and DME compared to the other groups
(p<0.05);
- in INL, the thicknesses of the central and the inner rings are significantly
greater in diabetics with DR and DME compared to diabetics without DR
and the controls (p<0.05);
- in OPL, the thickness of the central ring is significantly greater in diabetics
with DR and DME compared to the one in the other groups (p<0.05);
- in ONL, the thicknesses of the central ring and the external one are
significantly greater in diabetics with DR and DME compared to diabetics
without DR and the controls (p<0.05).
It has been moreover detected that the course of the RNFL profile is significantly
different in diabetics with DR and DME compared to the other groups (p<0.05),
because of the accentuated increase of the thickness moving from the inside to
the outside. No significant differences have been found in the course of the
profiles of the other layers.

114
Table XII. Comparison of the mean thickness and its standard deviation (in μm) per ring in different retinal layers of the 4 patient groups. Diabetics nDR: diabetics without retinopathy; diabetics DR ME-: diabetics with retinopathy and without macular edema; diabetics DR ME+: diabetics with retinopathy and DME; RNFL: nerve fiber layer; GCL: ganglion cell layer; IPL: inner plexiform layer; INL: inner nuclear layer; OPL: outer plexiform layer; ONL: outer nuclear layer.
RING
MEAN THICKNESS PER RING ± SD (μm)
LAYER Controls (N=12)
Diabetics w/o DR (N=11)
Diabetics w/DR ME-
(N=5)
Diabetics w/DR ME+
(N=6)
CSF
RNFL 9.3±3.5 9.0±2.6 8.0±1.8 10.3±2.3
GCL 13.3±4.5 13.8±5.5 14.6±3.0 16.5±5.1
IPL 12.4±3.6 12.1±4.3 12.8±5.2 16.2±4.1
INL 19.3±5.3 18.4±5.1 22.3±3.2 33.2±14.3
OPL 15.3±5.7 14.6±5.8 13.5±3.7 26.7±11.9
ONL 97.4±12.9 101.0±9.9 106.9±9.3 129.0±31.1
INNER
RNFL 24.3±3.4 25.0±3.8 22.0±2.1 33.4±8.1
GCL 53.5±6.2 53.5±6.4 50.3±4.1 57.5±9.2
IPL 36.2±2.6 35.3±5.4 36.8±4.9 41.2±3.4
INL 43.4±6.0 42.4±4.0 43.7±4.9 56.2±16.9
OPL 27.3±6.8 26.2±5.1 27.0±4.7 34.0±9.8
ONL 70.8±10.2 71.5±6.4 78.2±9.1 88.8±23.5
OUTER
RNFL 38.1±5.0 36.7±3.0 34.6±4.5 54.7±15.9
GCL 38.4±4.4 40.2±5.0 38.6±3.3 44.4±4.8
IPL 33.4±3.6 32.9±3.9 31.5±1.2 35.2±4.8
INL 36.0±3.9 36.3±2.4 36.1±4.7 43.1±11.0
OPL 23.8±2.7 23.2±2.7 26.1±3.2 29.7±10.0
ONL 56.1±8.6 59.1±6.6 61.6±6.5 76.2±22.0

115
Figure 47. Mean thickness per each ring in the different retinal layers (in μm). Diabetics w/o DR: diabetics without retinopathy; diabetics w/DR ME-: diabetics with retinopathy and without macular edema; diabetics w/DR ME+: diabetics with retinopathy and DME; RNFL: nerve fiber layer; GCL: ganglion cell layer; IPL: inner plexiform layer; INL: inner nuclear layer; OPL: outer plexiform layer; ONL: outer nuclear layer.
0
10
20
30
40
50
60
CSF Inner Outer
Mic
ron
RNFL thickness in each ring Controls Diabetics w/o DR
Diabetics w/DR ME- Diabetics w/DR ME+
0
10
20
30
40
50
60
CSF Inner Outer
Mic
ron
GCL thickness in each ring Controls Diabetics w/o DR
Diabetics w/DR ME- Diabetics w/DR ME+
0
10
20
30
40
50
CSF Inner Outer
Mic
ron
IPL thickness in each ring Controls Diabetics w/o DR
Diabetics w/DR ME- Diabetics w/DR ME+
10
20
30
40
50
60
CSF Inner Outer
Mic
ron
INL thickness in each ring Controls Diabetics w/o DR
Diabetics w/DR ME- Diabetics w/DR ME+
10
15
20
25
30
35
40
CSF Inner Outer
Mic
ron
OPL thickness in each ring Controls Diabetics w/o DR
Diabetics w/DR ME- Diabetics w/DR ME+
5060708090
100110120130140
CSF Inner Outer
Mic
ron
ONL thickness in each ring Controls Diabetics w/o DR
Diabetics w/DR ME- Diabetics w/DR ME+
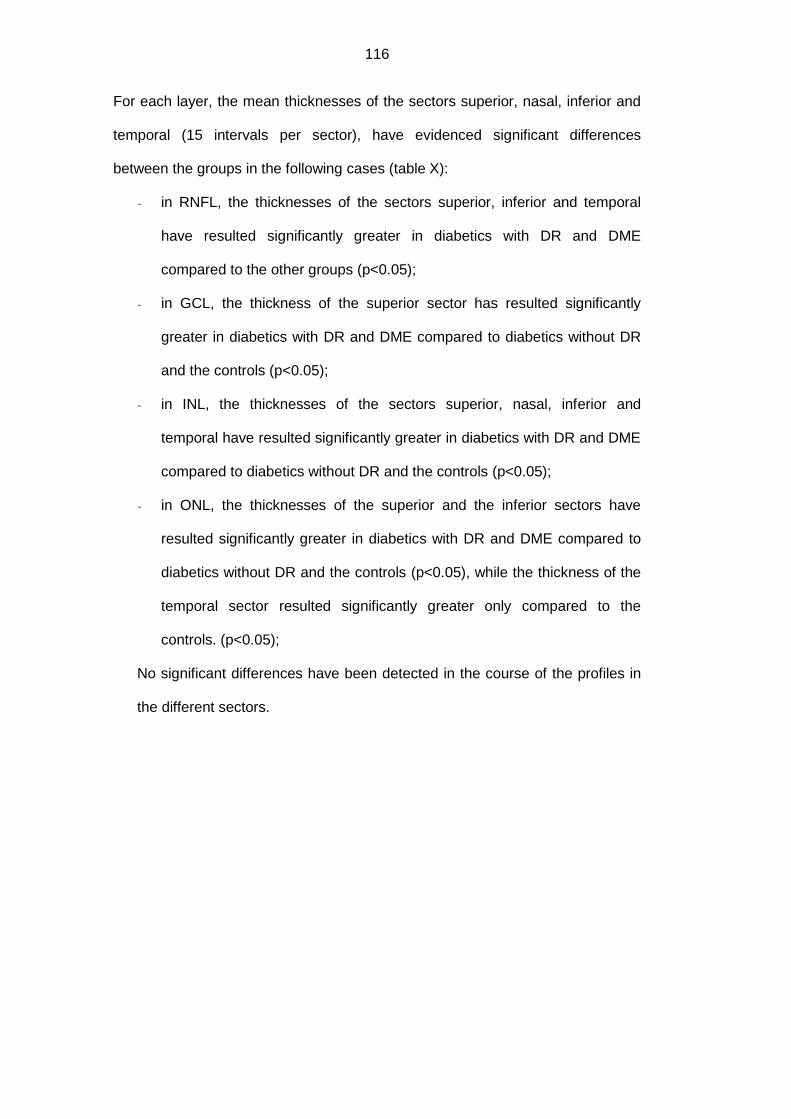
116
For each layer, the mean thicknesses of the sectors superior, nasal, inferior and
temporal (15 intervals per sector), have evidenced significant differences
between the groups in the following cases (table X):
- in RNFL, the thicknesses of the sectors superior, inferior and temporal
have resulted significantly greater in diabetics with DR and DME
compared to the other groups (p<0.05);
- in GCL, the thickness of the superior sector has resulted significantly
greater in diabetics with DR and DME compared to diabetics without DR
and the controls (p<0.05);
- in INL, the thicknesses of the sectors superior, nasal, inferior and
temporal have resulted significantly greater in diabetics with DR and DME
compared to diabetics without DR and the controls (p<0.05);
- in ONL, the thicknesses of the superior and the inferior sectors have
resulted significantly greater in diabetics with DR and DME compared to
diabetics without DR and the controls (p<0.05), while the thickness of the
temporal sector resulted significantly greater only compared to the
controls. (p<0.05);
No significant differences have been detected in the course of the profiles in
the different sectors.
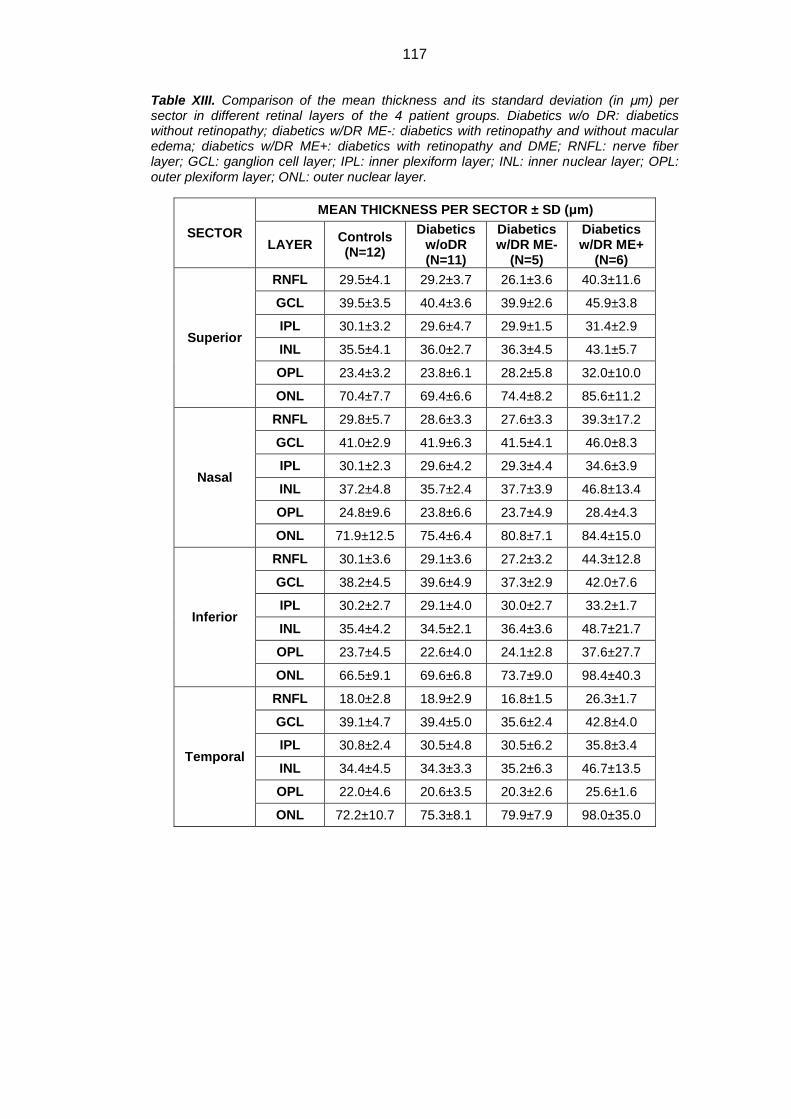
117
Table XIII. Comparison of the mean thickness and its standard deviation (in μm) per sector in different retinal layers of the 4 patient groups. Diabetics w/o DR: diabetics without retinopathy; diabetics w/DR ME-: diabetics with retinopathy and without macular edema; diabetics w/DR ME+: diabetics with retinopathy and DME; RNFL: nerve fiber layer; GCL: ganglion cell layer; IPL: inner plexiform layer; INL: inner nuclear layer; OPL: outer plexiform layer; ONL: outer nuclear layer.
SECTOR
MEAN THICKNESS PER SECTOR ± SD (μm)
LAYER Controls (N=12)
Diabetics w/oDR (N=11)
Diabetics w/DR ME-
(N=5)
Diabetics w/DR ME+
(N=6)
Superior
RNFL 29.5±4.1 29.2±3.7 26.1±3.6 40.3±11.6
GCL 39.5±3.5 40.4±3.6 39.9±2.6 45.9±3.8
IPL 30.1±3.2 29.6±4.7 29.9±1.5 31.4±2.9
INL 35.5±4.1 36.0±2.7 36.3±4.5 43.1±5.7
OPL 23.4±3.2 23.8±6.1 28.2±5.8 32.0±10.0
ONL 70.4±7.7 69.4±6.6 74.4±8.2 85.6±11.2
Nasal
RNFL 29.8±5.7 28.6±3.3 27.6±3.3 39.3±17.2
GCL 41.0±2.9 41.9±6.3 41.5±4.1 46.0±8.3
IPL 30.1±2.3 29.6±4.2 29.3±4.4 34.6±3.9
INL 37.2±4.8 35.7±2.4 37.7±3.9 46.8±13.4
OPL 24.8±9.6 23.8±6.6 23.7±4.9 28.4±4.3
ONL 71.9±12.5 75.4±6.4 80.8±7.1 84.4±15.0
Inferior
RNFL 30.1±3.6 29.1±3.6 27.2±3.2 44.3±12.8
GCL 38.2±4.5 39.6±4.9 37.3±2.9 42.0±7.6
IPL 30.2±2.7 29.1±4.0 30.0±2.7 33.2±1.7
INL 35.4±4.2 34.5±2.1 36.4±3.6 48.7±21.7
OPL 23.7±4.5 22.6±4.0 24.1±2.8 37.6±27.7
ONL 66.5±9.1 69.6±6.8 73.7±9.0 98.4±40.3
Temporal
RNFL 18.0±2.8 18.9±2.9 16.8±1.5 26.3±1.7
GCL 39.1±4.7 39.4±5.0 35.6±2.4 42.8±4.0
IPL 30.8±2.4 30.5±4.8 30.5±6.2 35.8±3.4
INL 34.4±4.5 34.3±3.3 35.2±6.3 46.7±13.5
OPL 22.0±4.6 20.6±3.5 20.3±2.6 25.6±1.6
ONL 72.2±10.7 75.3±8.1 79.9±7.9 98.0±35.0
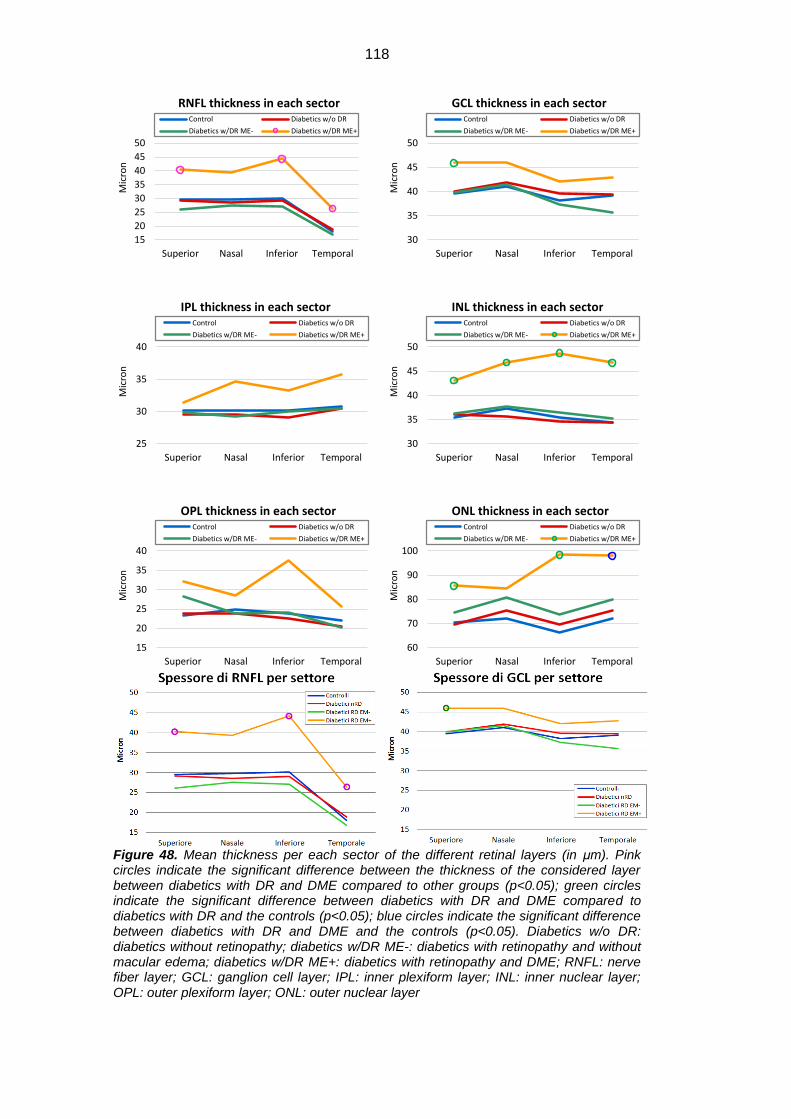
118
Figure 48. Mean thickness per each sector of the different retinal layers (in μm). Pink circles indicate the significant difference between the thickness of the considered layer between diabetics with DR and DME compared to other groups (p<0.05); green circles indicate the significant difference between diabetics with DR and DME compared to diabetics with DR and the controls (p<0.05); blue circles indicate the significant difference between diabetics with DR and DME and the controls (p<0.05). Diabetics w/o DR: diabetics without retinopathy; diabetics w/DR ME-: diabetics with retinopathy and without macular edema; diabetics w/DR ME+: diabetics with retinopathy and DME; RNFL: nerve fiber layer; GCL: ganglion cell layer; IPL: inner plexiform layer; INL: inner nuclear layer; OPL: outer plexiform layer; ONL: outer nuclear layer
15
20
25
30
35
40
45
50
Superior Nasal Inferior Temporal
Mic
ron
RNFL thickness in each sector Control Diabetics w/o DR
Diabetics w/DR ME- Diabetics w/DR ME+
30
35
40
45
50
Superior Nasal Inferior Temporal
Mic
ron
GCL thickness in each sector Control Diabetics w/o DR
Diabetics w/DR ME- Diabetics w/DR ME+
25
30
35
40
Superior Nasal Inferior Temporal
Mic
ron
IPL thickness in each sector Control Diabetics w/o DR
Diabetics w/DR ME- Diabetics w/DR ME+
30
35
40
45
50
Superior Nasal Inferior Temporal
Mic
ron
INL thickness in each sector Control Diabetics w/o DR
Diabetics w/DR ME- Diabetics w/DR ME+
15
20
25
30
35
40
Superior Nasal Inferior Temporal
Mic
ron
OPL thickness in each sector Control Diabetics w/o DR
Diabetics w/DR ME- Diabetics w/DR ME+
60
70
80
90
100
Superior Nasal Inferior Temporal
Mic
ron
ONL thickness in each sector Control Diabetics w/o DR
Diabetics w/DR ME- Diabetics w/DR ME+
119
DISCUSSION
Our study has analyzed for the first time in literature the concentrations in the
aqueous humour of the proteins of glial origin GFAP, AQP1 and AQP4 in
subjects afflicted and not afflicted by DM, detecting a significant increase in the
first group compared to the second one, both in presence of non proliferative DR
and in its absence. Ours is, moreover, the first study to demonstrate a significant
increase of different inflammatory cytokines in the AH of diabetic subjects,
whether they presented a clinically detectable retinal involvement, or not.
The AH, the vitreous and the lachrymal fluid constantly exchange substances
with the blood and with ocular tissues: their protein content may therefore be
considered an extremely useful instrument for the evaluation of the integrity and
the functionality of the structure of the ocular bulb.[27] Since there have been
various studies which had demonstrated that the microvascular complications
caused by DM could alter quantitatively and qualitatively the protein content of
ocular fluids, it is reasonable to consider possible to identify certain proteins as
markers which could anticipate the onset of DR. [14, 27, 210-219] It is well known
that microvascular lesions typical of DR are preceded first by the activation and
the dysfunction of glial cells and then by the retinal neurodegeneration: for this
reason, our research was concentrated on the identification of the early
biomarkers of glial origin found in AH.
Even though this fluid is not in direct contact with the retina, the proteins released
by the retina may overflow in it thanks to the diffusion through the vitreous and
the intraocular structures and to the crossing of the blood-retinal and the blood-
aqueous barriers.[14] In addition, it is known that the collection of the AH is much
easier and much less invasive than the collection of the vitreous, and that it does
not imply any additional risk with respect to a normal cataract intervention: for
these reasons, we believed that this fluid constituted the most adequate choice
for our research. [220]

120
Despite the ongoing debate on the existence of a connection between the protein
composition of the AH and the vitreous, the Funatsu and the Ecker groups have
demonstrated that there is good relationship between the two for many of the
contained proteins. [215, 217, 220] Our interest has, moreover, been to
individuate the biomarkers of glial activation which present themselves in different
concentrations in healthy subjects compared to diabetic subjects with or without
signs of retinopathy, independently of their vitreous concentration.
One of the greatest limitations of the use of AH consists in the fact that only small
volumes, usually around 100-200μl, can be obtained in the collection process.
These quantities are sufficient only for the evaluation of a limited number of
proteins via the ELISA test, especially considering that protein concentrations in
this liquid are extremely low. For this reason, we have decided to use, along with
the ELISA tests for AQP1, AQP4 and GFAP, also the protein array technique,
which is able to analyze contemporarily many molecules, which in our case were
constituted by 40 different cytokines. It is a recently introduced technique in
continuous evolution, whose validity in recognizing the presence of studied
molecules was demonstrated by the Sharma group, and confirmed by various
studies on different cytokines in ocular fluids.[156, 221-223]
In our study, the mean GFAP concentration results significantly increased in
diabetic patients with DR compared both to the controls (324.44 pg/µg vs 182.34
pg/µg) and diabetics without DR (324.44 pg/µg vs 165.61 pg/µg). This protein is
usually expressed by the glial cells of the CNS, and, in particular, on the retinal
level in physiological conditions it is expressed only by the astrocytes, while it is
absent in Müller cells. GFAP, together with other proteins, participates in the
formation of intermediate filaments of the cellular cytoskeleton, and has an
important role in the mitotic process, in the maintenance of the blood-encephalic
and the blood-retinal barriers, as well as in neuronal communication and repair.
[224-227] During the course of DM, in spite the fact that its expression decreases
121
in astrocytes, this protein is expressed on the retinal level thanks to its increased
production by the Müller cells. [83, 97-99, 101] The fact that there is a hyper-
expression of GFAP during the course of different neurodegenerative pathologies
involving not only the retina, but also, more generally, the CNS, explains the
reason why it is considered a valid marker of glial activation. [149] In particular,
on the ocular level, the importance of GFAP is evidenced especially after retinal
insults, since it has been observed that it is very important for the integrity of the
Müller cells and consequently for the integrity of the internal and the external
limiting membranes. [149]
The available studies in literature have analyzed the GFAP expression
exclusively on the histological level, both in animal and in human tissue; in this
study, however, we have evaluated the concentration in vivo in AH both in normal
conditions and in the course of diabetic disease. At the very beginning (in
diabetics without DR) we found a moderate decrease in GFAP when compared to
the normal subjects. This may be due to the early atrocyte loss, already
demonstrated as one of the first signs of neuronal dysfunction in DM. [83] Later
on, there is a significant increase of GFAP in presence of very initial stages of
clinically detectable signs of DR, confirming the early activation of the glial
component in the course of DR (Muller cells).
Different studies have, in fact, confirmed such hypothesis, suggesting that the
glial activation could be responsible for the instauration of functional and
metabolic imbalances of the retina which are the reasons behind both the
neuronal and the microvascular damage. [89, 90, 93, 94] The increase of GFAP
in AH would therefore be the consequence both of the normal exchange process
of the Müller cells, which become hypertrophic and more numerous, and the
increased apoptotic rate of the astrocytes, and to a lesser degree, of the very
Müller cells, according to many studies done on animal and human histological
samples during the course of DM.[93, 94, 150, 228-230]
122
There were no studies in literature which analyzed the aquaporin concentrations
in ocular fluids, with the exception of two studies by the Ohashi and the Hirai
groups on AQP5 in lachrymal fluid, respectively during the course of the dry eye
syndrome and the dacryoadenitis. [231, 232] In order to quantify this protein,
these studies have made use, as in our case, of the ELISA test, and both studies
have detected a reduction of AQP5. [231, 232]
In our study, the AQP4 concentration resulted significantly greater in diabetic
patients with retinopathy compared both to diabetics without retinopathy and the
healthy subjects (respectively 852.03pg/µg vs 206.87pg/µg vs 33.58 pg/µg); such
increase resulted significant also in diabetics without DR compared to healthy
subjects (206.87pg/µg vs 33.58 pg/µg). AQP4 is a channel protein which permits
the flow of free water through the cell membrane, and which results present in the
CNS, in the eye, in the kidney and in the respiratory apparatus. [233] In the eye in
particular, AQP4 is normally expressed especially by the Müller cells and the
astrocytes, as well as by the cilliary body epithelium and the lachrymal gland.
[118, 126, 234] Thanks to its ability to transport free water and its functional
pairing with potassium channels, AQP4 maintains the osmotic balance between
the intra- and the extra-cellular matrixes, thus guaranteeing optimal cell
functioning. [235] The Zhang and the Cui groups have recently evidenced, in the
experiments on rat retina, that during the course of DM there is an increase in
AQP4 on the retinal level: it is plausible to suppose that this constitutes a
compensation attempt with respect to the altered osmotic equilibrium in the retina
during diabetes.[146, 147] While there are different histological studies done so
far regarding the variation in AQP4 expression in the retina during the course of
DM, there are no researches which evaluate its concentration in ocular fluids
either in healthy subjects or in subjects afflicted with pathologies regarding the
eye. [97, 121, 146-148] Our study has investigated AQP4 concentrations in
healthy subjects and in diabetics, noticing a significant increase of this aquaporin
123
in the AH, not only in presence of microvascular alterations typical of DR, but also
in its subclinical stage. We consider this increase caused, on one part, by the
natural process of retinal cell metabolism, and, on the other, by the increased cell
apoptosis which strikes the astrocytes and only marginally the Müller cells: both
factors would entail the release of this protein in the AH, making it therefore
detectable at this location. Since AQP4 is expressed especially in the retinal glial
cells, it is possible to consider this molecule an early and very effective marker of
retinal damage during the course of DM.
In our research, we have also detected a significant increase in AQP1 in diabetic
subjects with retinopathy compared both to diabetics without DR and to healthy
subjects (respectively 105.72pg/µg vs 28.84pg/µg vs 50.92pg/µg); and in diabetic
subjects with retinopathy and without macular edema compared to those with
macular edema (105.72pg/µg vs 37.09pg/µg). This aquaporin, present in the
CNS, the eye, the kidney and the respiratory apparatus, is usually expressed in
amacrine cells and the photoreceptors, as well as in the corneal endothelium and
the iridocorneal trabeculae, in the cilliary body epithelium, in the lens and iris and
in RPE. [119, 132, 136, 233, 236] Like AQP4, its function is also the regulation of
the transcellular flow of free water, contributing to the maintenance of osmotic
balance between the intra- and the extracellular matrixes, hence exercising an
essential role in the functional maintenance of the cells.[235] There are various
histological studies both of animal and human tissue, which have analyzed the
changes in AQP1 expression during the course of DM: they have evidenced its
presence also in the inner retinal layers, in particular in Müller cells, and the
substitution of AQP4 with AQP1 in retinal surface vessels, entailing an increase
in its production. [116, 121, 144, 145] Such hyper-expression would constitute a
compensation attempt regarding the altered osmotic balance inside the retina
during the course of DM.[116, 126] Even though many studies were directed at
the different histological expressions of AQP1 during this pathology, nobody has

124
analyzed the concentrations of this protein in ocular fluids. With the present
study, however, we have examined the AQP1 concentrations in the AH both in
the healthy subjects and in the diabetic ones, evidencing the increase of this
protein in subjects afflicted by DR. In this case, too, the increase is connected to
the normal process of retinal cell metabolism and to the increased apoptosis
which affects the astrocytes in particular, and only marginally the Müller cells,
during the course of DM, with the consequent release of molecules inside ocular
fluid, especially inside the AH. Since we have not noticed an increase in AQP1 in
diabetic patients without DR compared to controls, it is possible to consider that
such increase can be detected exclusively when the retinal damage is clinically
evident and that it therefore constitutes a modification of glial cells subsequent to
those previously mentioned.
AQP1 could therefore constitute a useful marker of glial activation, capable of
indicating the aggravation of retinal damage during the course of DM.
A curious finding was the observation of decrease in GFAP, AQP1 and AQP4 in
diabetics with macular edema compared to diabetics with DR and without ME.
This might be explained by the anatomic alterations in Muller cells induced by
cystic spaces caused by edema. The cells are stretched, and reduced in number,
and therefore this may be the reason for the observed decrease in glial markers
concentration in ME.
The data concerning the concentration of different inflammatory cytokines,
presented in the form of fluorescent signal, has enabled the detection, both in
diabetic subjects without retinopathy and in those with retinopathy, of a general
increase in such molecules, in compliance with the hypothesis according to which
the DR would also be inflammatory in nature. [31] Our study has evidenced how
the levels of some inflammatory cytokines result higher in diabetic subjects
without retinopathy compared to normal subjects: IFNy, IL-1a, IL-1b, IL-3, IL-4,
IL-17, TNF-ß, MCP2; whereas, the IL-7 was significantly decreased in diabetic
125
subjects without DR; an increase has been observed also between the diabetics
with DR and normal subjects for: Eotaxin, TNF-ß, IL-4, MCP2, RANTES,
sTNFRII, IFNy, TNF-α ; an increase has been observed also between the
diabetics with DME and normal subjects for: Eotaxin2, GM-CSF, IFNy, IP-10,
TNFb, MIP1a, sTNFRII, Il-10, IL-11, MCP1; a significant difference has been
observed also between the diabetics with DR and those without for: MIP1b,
TNFb. Therefore, this may be explained by the fact that these cytokines are
affected by the diabetes-caused retinal damage only in a later stage.
In our study, therefore, we have noticed especially the significant increase in the
cytokines produced by the glial cells and in those which attract the circulating
macrophages to the site of the lesion. This observation confirms the key role that
these cells hold, not only in presence of microvascular lesions caused by DR, but
also in the stage before the lesions become clinically detectable. For this reason,
glial activation would entail the triggering of the inflammatory process responsible
for the retinal damage, both vascular and nervous.
In contrast to what has been said for GFAP, AQP1 and AQP4, there are
numerous studies which have investigated the presence of the inflammatory
cytokines in AH and the vitreous of diabetic subjects. [155, 219, 222, 237, 238]
Nevertheless, most of these studies have considered only the subjects who
presented advanced stages of DR, in many cases already in its proliferative form
or associated with the macular edema. [215, 217, 219, 222, 223, 237-240] The
peculiarity of this study consists in the search for the signs of glial activation
before the onset of microvascular lesions, confirming that both the glial activation
and the inflammatory response in general can have a crucial role in the formation
of retinal lesions from the earliest stages of diabetes mellitus. Many studies have
evidenced an increase in VEGF, a proangiogenic cytokine, and an increase in
PEDF, with antiangiogenic effect, in diabetic patients afflicted by retinopathy
compared to non diabetic subjects.[239, 241]

126
We have not, however, analyzed these molecules, since our main interest was to
concentrate specifically on the glial activation caused by diabetes, and not on the
retinal angiogenic process.
With respect to the AH, there are many works which have evidenced an increase
in inflammatory cytokines in diabetic subjects with retinopathy compared to
healthy subjects. The cytokines which resulted significantly increased are: MIP-
1β, sICAM-1, IL-6, IL-8, IL-12, IP-10, MCP-1, TGF-β.[155, 156, 215, 219, 222,
223, 237, 238] Moreover, our study, evidences that IFNy, IL-1a, IL-1b, IL-3, IL-4,
IL-17, TNF-ß, and MCP2 do not increase only when there are visible signs of
microvascular lesions, but are increased already at the subclinical stage.
The works which have analyzed the cytokine concentration in the vitreous or AH
in presence of proliferative diabetic retinopathy or of macular edema, have
reported a significant increase in IL-1, IL-3, IL-6, IL-8, IL-10, IL-13, IP-10, MCP-1,
MIP-1β, PDGF, TNF-α, VEGF, sICAM-1, sVCAM-1, MMP-1, MMP-9, TGF-b,
PIGF and RANTES compared to non diabetic subjects. [63, 66, 67, 219, 239,
242, 242-250] In compliance with this data (although we have not included
patients with PDR and we have evaluated samples of AH which contain a
significantly lower concentration of cytokines), our study has demonstrated that,
GM-CSF, IFNy, IP-10, TNFb, MIP1a, sTNFRII, Eotaxin 2, IL-10, IL-11, MCP1 are
increased in the AH of patients with DME, whereas, IFNy, IL-3, IL-4, IL-17, TNF-
ß, MCP2, IL-1a, IL-1b are increased during the course of DM even when there
are no signs of retinopathy. MCP-2 is a monocyte chemotactic factor and
increased levels of this chemokine suggest an early inflammatory response. [223]
On the other hand, the late inflammatory response in DR (before the onset of
new-vessels) was demonstrated by Kyung Oh et al. with higher concentrations of
MCP1, IP-10, IL-8 in eyes with severe NPDR and PDR, than in eyes with less
severe DR and normal subjects. [223] This may partially explain differences in
our results: we have evaluated patients in earlier stages of DR, and therefore

127
these cytokines were increased just in DME patients.
One of the major limits of this study is the relatively low number of involved
patients, especially as we divided patients with DR into two groups which were
separately analyzed. Therefore, statistical significance was not reached (although
absolute numbers were increased) for several cytokines that have already been
demonstrated increased in DR. These include: IL-2, IL-13, ICAM1 (see table VII)
On the other side, a decrease in TGF-b was found, a potent neuroprotective
factor, even in diabetics without DR.[98]
We can therefore affirm that, considering the results obtained in our study, there
are various cytokines which can be considered as early biomarkers of glial
activation, confirming again the central role of these cells in the pathogenic
process of DR.
The obtained results evidence for the first time that all of the glial cell categories
are activated since the very beginnings of DM, and that their modifications
constitute a crucial element in the pathogenetic process of DR. The only
previous work which focused on these cells, conducted by the Nishoikiori group,
has evidenced in the vitreous of diabetic patients an increase in GDNF (glial cell-
derived neurotrophic factor): this was probably a compensation attempt caused
by the damage in the blood-retinal barrier during the course of diabetes.[251]
Nevertheless, our study detects signs of glial activation in the AH already at the
subclinical stages of DR, when it is still not possible to make any diagnosis based
on microvascular lesions.
The identification of retinopathy biomarkers is important for early diagnosis,
therapy and retinal lesions prognosis during the course of DM. We believe that
the evidence of the pathogenetic role of glial cells in this microvascular
complication might lead to new and more efficient therapeutic solutions able to
improve the outcome of the disease. So far, there is only one study in the
literature which has investigated the risk markers for the onset of retinopathy
128
during the course of DM; none of the 11 proteins it has individuated is connected
to glial activation, but only to mechanisms of molecular transport, angiogenesis,
cellular oxidation, tissue remodeling and cytoprotection. [14]
The glial activation detected during the course of diabetes mellitus is also
confirmed by the OCT analysis of the thicknesses of retinal layers.
In our study, the mean thickness of RNFL in diabetic patients with retinopathy
and macular edema results significantly increased compared both to controls and
diabetic subjects without or with retinopathy not associated to macular edema.
Such increase is statistically significant in the inner and the outer rings and in the
sectors superior, inferior and temporal of the macular area. We have, moreover,
observed that in diabetics with retinopathy and macular edema, the behavior of
RNFL is contrary to the one in the other groups, where there its thickness tends
to decrease. The increase in RNFL thickness in diabetic subjects with retinopathy
and edema can be explained, more than as the instauration of the interstitial
edema (which involves only minimally the nerve fiber layer), with the fact that the
instrument we used does not allow the distinction of ILM from RNFL, entailing its
inclusion in the RNFL measurements. Regarding this matter, histopathologic
studies have demonstrated that diabetic subjects present an ILM thickening
caused mainly by the Müller cell alteration, which become hypertrophic and are
afflicted by proliferation. [252-254] We therefore believe that the RNFL thickening
we observed is caused prevalently by the increase in number of the Müller cells
and the swellings of their end-feet on neuronal degeneration, which is thus
masked by this phenomenon. The tendency of progressive reduction of RNFL
thickness in the other groups, which reaches statistical significance in diabetic
patients with retinopathy without macular edema compared to controls, is
explained by the equally progressive neuronal loss induced by diabetic disease.
It is well known that the reason behind such phenomenon is the glial cell
dysfunction, which are no longer able to maintain an adequate osmotic
129
equilibrium between the intra- and the extra-cellular matrixes and which, by
expressing different proinflammatory cytokines, induce the apoptosis of neuronal
cells, especially of the ganglion cells, with their consequent axonal degeneration.
.[73, 83, 98, 99, 108, 109] In compliance with a similar hypothesis, two recent
studied presented at the ARVO (Association for Research in Vision and
Ophthalmology) have evidenced certain morphological alterations in vivo of the
retina of diabetic subjects: the first one has observed a significant increase in
thickness of ILM, IPL, INL and a decrease in those of GCL and RNFL in patients
with non proliferative retinopathy, while the second one noticed the thickening of
the INL+IPL complex and the presence of microaggregates in ILM and RNFL
corresponding to the microglia, confirming the early activation of the glial cells in
the retina during the course of diabetes mellitus. [207, 208] Finally, many works
have observed the thinning of RNFL and, in some cases, of the GCL+IPL
complex as well, demonstrating that retinal neurodegeneration constitutes an
early event in the course of diabetes mellitus, present from the subclinical stages
of the retinopathy. [201, 204, 255, 256]
We can therefore affirm that both the protein analysis and the measurement of
the thicknesses of retinal layers carried out with SD-OCT may provide useful
information on the activation of the retinal glia during the course of diabetes
mellitus.
130
CONCLUSIONS
In conclusion, we have demonstrated that, during the course of diabetes mellitus,
there is a significant increase in the aqueous humour of the protein biomarkers of
glial activation, not only in presence of advanced stages of diabetic retinopathy,
but also in its subclinical and early clinical stages. This has confirmed the
physiopathological role of these cells in the development of this microvascular
complication, and is a valid reason for considering the proteins derived in this
way as potential predictors of the development of retinopathy. The proteins for
which an increase was registered in the aqueous humour of diabetic patients
(with or without DR) compared to healthy subjects are: GFAP, AQP1, AQP4,
IFNy, IL-1a, IL-1b, IL-3, IL-4, IL-10, IL-11, IL-17, TNF- α, TNF-ß, MCP1, MCP2,
Eotaxin, Eotaxin 2, RANTES, sTNFRII, GM-CSF, IP-10, MIP1a, MIP1b; GFAP,
AQP1 and AQP4 were reduced in diabetic patients with macular edema
compared to diabetic patients with diabetic retinopathy and no macular edema,
probably due to anatomic changes of Muller cells. The 23 proteins we have
individuated may therefore be used in future as possible therapeutic targets for
the prevention and care of diabetic retinopathy, helping to avoid its onset and
improving the visual prognosis.

131
BIBLIOGRAPHY
1. Girach A, Manner D, Porta M: Diabetic microvascular complications: can
patients at risk be identified? A review. Int J Clin Pract 2006;60:1471-1483.
2. Farag YM, Gaballa MR: Diabesity: an overview of a rising epidemic. Nephrol
Dial Transplant 2011;26:28-35.
3. Shaw J, Sicree R, Zimmet P: Global estimates of the prevalence of diabetes
for 2010 and 2030. Diabetes Res Clin Pract 2010;87:4-14.
4. Cowie CC, Rust KF, Byrd-Holt DD, Eberhardt MS, Flegal KM, Engelgau MM,
Saydah SH, Williams DE, Geiss LS, Gregg EW: Prevalence of diabetes and
impaired fasting glucose in adults in the US population. Diabetes Care
2006;29:1263-1268.
5. Maggini M, Mamo C: Le disuguaglianze sociali nella malattia diabetica.
Notiziario dell'Istituto Superiore di Sanità 2010;1:1.
6. Spolaore P: L'epidemiologia del diabete mellito nella Regione Veneto. AMD
SID 2008;1:1-23.
7. Yau JW, Rogers SL, Kawasaki R, Lamoureux EL, Kowalski JW, Bek T, Chen
SJ, Dekker JM, Fletcher A, Grauslund J, Haffner S, Hamman RF, Ikram MK,
Kayama T, Klein BE, Klein R, Krishnaiah S, Mayurasakorn K, O'Hare JP,
Orchard TJ, Porta M, Rema M, Roy MS, Sharma T, Shaw J, Taylor H, Tielsch

132
JM, Varma R, Wang JJ, Wang N, West S, Xu L, Yasuda M, Zhang X, Mitchell P,
Wong TY, Meta-Analysis for Eye Disease (META-EYE) Study Group: Global
prevalence and major risk factors of diabetic retinopathy. Diabetes Care
2012;35:556-564.
8. Prokofyeva E, Zrenner E: Epidemiology of major eye diseases leading to
blindness in Europe: a literature review. Ophthalmic Res 2012;47:171-188.
9. Vespasiani G, Nicolucci A, Giorda C: Epidemiologia del diabete. Ministero
della Salute-Area editoriale 2005;1:1-6.
10. Dedov I, Maslova O, Suntsov Y, Bolotskaia L, Milenkaia T, Besmertnaia L:
Prevalence of diabetic retinopathy and cataract in adult patients with type 1 and
type 2 diabetes in Russia. Rev Diabet Stud 2009;6:124-129.
11. Antonetti DA, Klein R, Gardner TW: Diabetic retinopathy. N Engl J Med
2012;366:1227-1239.
12. Lim LS, Lamoureux E, Saw SM, Tay WT, Mitchell P, Wong TY: Are myopic
eyes less likely to have diabetic retinopathy?. Ophthalmology 2010;117:524-530.
13. Olafsdottir E, Andersson DKG, Stefánsson E: The prevalence of cataract in a
population with and without type 2 diabetes mellitus. Acta Ophthalmol 2011.
14. Chiang SY, Tsai ML, Wang CY, Chen A, Chou YC, Hsia CW, Wu YF, Chen
HM, Huang TH, Chen PH, Liu HT, Shui HA: Proteomic analysis and identification
133
of aqueous humor proteins with a pathophysiological role in diabetic retinopathy.
J Proteomics 2012;75:2950-2959.
15. Midena E: Anatomia. In: Malattie dell'apparato visivo. Cedam Publ, Padova,
2006, pp 1-18.
16. Anastasi G, Capitani S, Carnazza ML, Cinti S, De Caro R, Donato RF,
Ferrario VF, Fonzi L, Franzi AT, Gaudio E, Geremia R, Giordano Lanza G, Grossi
CE, Manzoli FA, Mazzotti G, Michetti F, Miscia S, Mitolo V, Montella A, Oriandini
G, Paparelli A, Renda T, Ribatti D, Ruggeri A, Sirigu P, Soscia A, Tredici G,
Vitale M, Zaccheo D, Zauli G, Zecchi S: Apparato della vista. In: Trattato di
Anatomia Umana. Edi-Ermes Publ, Milano, 2007, pp 331-367.
17. Albert D, Jakobiec F: Cell biology of the optic nerve, Muller cells and the
retinal pigment epithelium. In: Principles and practice of ophthalmology. W. B:
Saunders Company Publ, Philadelphia, 1994, pp 366-419.
18. Coorey NJ, Shen W, Chung SH, Zhu L, Gillies MC: The role of glia in retinal
vascular disease. Clin Exp Optom 2012;95:266-281.
19. Biedermann B, Wolf S, Kohen L, Wiedemann P, Buse E, Reichenbach A,
Pannicke T: Patch-clamp recording of Müller glial cells after cryopreservation. J
Neurosci Methods 2002;120:173-178.
20. Standring S: Occhio. In: Anatomia del Gray - Le basi anatomiche per la
pratica clinica. Pula G and Letterio T eds Elsevier-Masson Publ, Milano, 2009, pp
647-670.

134
21. Antonetti DA, Barber AJ, Bronson SK, Freeman WM, Gardner TW, Jefferson
LS, Kester M, Kimball SR, Krady JK, LaNoue KF: Diabetic retinopathy. Diabetes
2006;55:2401-2411.
22. Lorenzi M, Gerhardinger C: Early cellular and molecular changes induced by
diabetes in the retina. Diabetologia 2001;44:791-804.
23. Gallego BI, Salazar JJ, de Hoz R, Rojas B, Ramírez AI, Salinas-Navarro M,
Ortín-Martínez A, Valiente-Soriano FJ, Avilés-Trigueros M, Villegas-Perez MP:
IOP induces upregulation of GFAP and MHC-II and microglia reactivity in mice
retina contralateral to experimental glaucoma. Journal of Neuroinflammation
2012;9:92.
24. Paresce DM, Chung H, Maxfield FR: Slow degradation of aggregates of the
Alzheimer’s disease amyloid β-protein by microglial cells. J Biol Chem
1997;272:29390-29397.
25. Abcouwer SF: Neural inflammation and the microglial response in diabetic
retinopathy. Journal of Ocular Biology, Diseases, and Informatics 2011:1-9.
26. Bucci MG: Glaucoma. In: Oftalmologia. Società Editrice Universo Publ,
Roma, 2001, pp. 378-396.
27. Grus FH, Joachim SC, Pfeiffer N: Proteomics in ocular fluids.
PROTEOMICS–Clinical Applications 2007;1:876-888.
135
28. Wilkinson CP, Ferris III FL, Klein RE, Lee PP, Agardh CD, Davis M, Dills D,
Kampik A, Pararajasegaram R, Verdaguer JT: Proposed international clinical
diabetic retinopathy and diabetic macular edema disease severity scales.
Ophthalmology 2003;110:1677-1682.
29. Fenwick EK, Xie J, Ratcliffe J, Pesudovs K, Finger RP, Wong TY, Lamoureux
EL: The impact of diabetic retinopathy and diabetic macular edema on health-
related quality of life in type 1 and type 2 diabetes. Invest Ophthalmol Vis Sci
2012;53:677-684.
30. Kollias AN, Ulbig MW: Diabetic retinopathy: early diagnosis and effective
treatment. Deutsches Arzteblatt International 2010;107:75.
31. Ola MS, Nawaz MI, Siddiquei MM, Al-Amro S, Abu El-Asrar AM: Recent
advances in understanding the biochemical and molecular mechanism of diabetic
retinopathy. J Diabetes Complications 2012;26:56-64.
32. Chistiakov DA: Diabetic retinopathy: Pathogenic mechanisms and current
treatments. Diabetes and Metabolic Syndrome: Clinical Research and Reviews
2012.
33. Chung S, Chung S: Aldose reductase in diabetic microvascular
complications. Curr Drug Targets 2005;6:475-486.
34. Lorenzi M: The polyol pathway as a mechanism for diabetic retinopathy:
attractive, elusive, and resilient. Exp Diabetes Res 2007;2007:61038.
136
35. Obrosova IG, Pacher P, Szabó C, Zsengeller Z, Hirooka H, Stevens MJ,
Yorek MA: Aldose reductase inhibition counteracts oxidative-nitrosative stress
and poly (ADP-ribose) polymerase activation in tissue sites for diabetes
complications. Diabetes 2005;54:234-242.
36. Goh SY, Cooper ME: The role of advanced glycation end products in
progression and complications of diabetes. Journal of Clinical Endocrinology &
Metabolism 2008;93:1143-1152.
37. Stitt AW: Advanced glycation: an important pathological event in diabetic and
age related ocular disease. Br J Ophthalmol 2001;85:746-753.
38. Yamagishi S, Matsui T: Advanced glycation end products (AGEs), oxidative
stress and diabetic retinopathy. Curr Pharm Biotechnol 2011;12:362-368.
39. Yamagishi S: Advanced glycation end products and receptor–oxidative stress
system in diabetic vascular complications. Therapeutic Apheresis and Dialysis
2009;13:534-539.
40. Yamagishi S, Matsui T, Nakamura K, Inoue H, Takeuchi M, Ueda S, Okuda
S, Imaizumi T: Olmesartan blocks inflammatory reactions in endothelial cells
evoked by advanced glycation end products by suppressing generation of
reactive oxygen species. Ophthalmic Res 2008;40:10-15.
41. Yamagishi S, Matsui T, Nakamura K, Ueda S, Noda Y, Imaizumi T: Pigment
epithelium-derived factor (PEDF): its potential therapeutic implication in diabetic
vascular complications. Curr Drug Targets 2008;9:1025-1029.
137
42. Yamagishi S, Ueda S, Matsui T, Nakamura K, Okuda S: Role of advanced
glycation end products (AGEs) and oxidative stress in diabetic retinopathy. Curr
Pharm Des 2008;14:962-968.
43. Yamagishi S, Matsui T, Nakamura K, Yoshida T, Takeuchi M, Inoue H,
Yoshida Y, Imaizumi T: Pigment-epithelium-derived factor suppresses expression
of receptor for advanced glycation end products in the eye of diabetic rats.
Ophthalmic Res 2007;39:92-97.
44. Drel VR, Xu W, Zhang J, Kador PF, Ali TK, Shin J, Julius U, Slusher B, El-
Remessy AB, Obrosova IG: Poly (ADP-ribose) polymerase inhibition counteracts
cataract formation and early retinal changes in streptozotocin-diabetic rats. Invest
Ophthalmol Vis Sci 2009;50:1778-1790.
45. Giacco F, Brownlee M: Oxidative stress and diabetic complications. Circ Res
2010;107:1058-1070.
46. Nakamura M, Barber AJ, Antonetti DA, LaNoue KF, Robinson KA, Buse MG,
Gardner TW: Excessive hexosamines block the neuroprotective effect of insulin
and induce apoptosis in retinal neurons. J Biol Chem 2001;276:43748-43755.
47. Giacchetti G, Sechi LA, Rilli S, Carey RM: The renin–angiotensin–
aldosterone system, glucose metabolism and diabetes. Trends in Endocrinology
& Metabolism 2005;16:120-126.
138
48. Noma H, Funatsu H, Mimura T, Harino S, Hori S: Vitreous levels of
interleukin-6 and vascular endothelial growth factor in macular edema with
central retinal vein occlusion. Ophthalmology 2009;116:87-93.
49. Noma H, Minamoto A, Funatsu H, Tsukamoto H, Nakano K, Yamashita H,
Mishima HK: Intravitreal levels of vascular endothelial growth factor and
interleukin-6 are correlated with macular edema in branch retinal vein occlusion.
Graefe's Archive for Clinical and Experimental Ophthalmology 2006;244:309-315.
50. Ido Y, Kilo C, Williamson J: Cytosolic NADH/NAD , free radicals, and vascular
dysfunction in early diabetes mellitus. Diabetologia 1997;40:115-117.
51. Madsen-Bouterse SA, Kowluru RA: Oxidative stress and diabetic retinopathy:
pathophysiological mechanisms and treatment perspectives. Reviews in
endocrine & metabolic disorders 2008;9:315-327.
52. Kanwar M, Kowluru RA: Role of glyceraldehyde 3-phosphate dehydrogenase
in the development and progression of diabetic retinopathy. Diabetes
2009;58:227-234.
53. Ola MS, Berkich DA, Xu Y, King MT, Gardner TW, Simpson I, LaNoue KF:
Analysis of glucose metabolism in diabetic rat retinas. American Journal of
Physiology-Endocrinology And Metabolism 2006;290:E1057-E1067.
54. Zheng L, Kern TS: Role of nitric oxide, superoxide, peroxynitrite and PARP in
diabetic retinopathy. Front Biosci 2009;14:3974-3987.
139
55. Al-Shabrawey M, Rojas M, Sanders T, Behzadian A, El-Remessy A, Bartoli
M, Parpia AK, Liou G, Caldwell RB: Role of NADPH oxidase in retinal vascular
inflammation. Invest Ophthalmol Vis Sci 2008;49:3239-3244.
56. Kowluru RA, Chan PS: Oxidative stress and diabetic retinopathy. Exp
Diabetes Res 2007;2007:43603.
57. Timothy S K: Contributions of inflammatory processes to the development of
the early stages of diabetic retinopathy. Experimental diabetes research
2007;2007.
58. Tang J, Kern TS: Inflammation in diabetic retinopathy. Prog Retin Eye Res
2011;30:343-358.
59. Liou GI: Diabetic retinopathy: Role of inflammation and potential therapies for
anti-inflammation. World J Diabetes 2010;1:12-18.
60. Robinson R, Barathi VA, Chaurasia SS, Wong TY, Kern TS: Update on
animal models of diabetic retinopathy: from molecular approaches to mice and
higher mammals. Disease Models & Mechanisms 2012;5:444-456.
61. Leal EC, Santiago AR, Ambrosio AF: Old and new drug targets in diabetic
retinopathy: from biochemical changes to inflammation and neurodegeneration.
Curr Drug Targets CNS Neurol Disord 2005;4:421-434.
140
62. Rangasamy S, McGuire PG, Das A: Diabetic retinopathy and inflammation:
Novel therapeutic targets. Middle East African Journal of Ophthalmology
2012;19:52.
63. Adamiec-Mroczek J, Oficjalska-Młyńczak J: Assessment of selected adhesion
molecule and proinflammatory cytokine levels in the vitreous body of patients with
type 2 diabetes—role of the inflammatory–immune process in the pathogenesis
of proliferative diabetic retinopathy. Graefe's Archive for Clinical and
Experimental Ophthalmology 2008;246:1665-1670.
64. El-Asrar AMA: Role of inflammation in the pathogenesis of diabetic
retinopathy. Middle East African Journal of Ophthalmology 2012;19:70.
65. El-Asrar AMA, Nawaz MI, Kangave D, Geboes K, Ola MS, Ahmad S, Al-
Shabrawey M: High-mobility group box-1 and biomarkers of inflammation in the
vitreous from patients with proliferative diabetic retinopathy. Molecular Vision
2011;17:1829.
66. El-Asrar AMASS, Kangave DGK, Damme JV: Chemokines in proliferative
diabetic retinopathy and proliferative vitreoretinopathy. Eur Cytokine Netw
2006;17:155-166.
67. Funatsu H, Noma H, Mimura T, Eguchi S, Hori S: Association of vitreous
inflammatory factors with diabetic macular edema. Ophthalmology 2009;116:73-
79.
141
68. Ciulla TA, Amador AG, Zinman B: Diabetic retinopathy and diabetic macular
edema. Diabetes Care 2003;26:2653-2664.
69. Ejaz S, Chekarova I, Ejaz A, Sohail A, Lim CW: Importance of pericytes and
mechanisms of pericyte loss during diabetic retinopathy. Diabetes, Obesity and
Metabolism 2008;10:53-63.
70. Shah CA: Diabetic retinopathy: A comprehensive review. Indian J Med Sci
2008;62:500-519.
71. Garner A: Histopathology of diabetic retinopathy in man. Eye 1993;7:250-
253.
72. Aiello LM: Perspectives on diabetic retinopathy. Am J Ophthalmol
2003;136:122-135.
73. Villarroel M, Ciudin A, Hernandez C, Simo R: Neurodegeneration: An early
event of diabetic retinopathy. World J Diabetes 2010;1:57-64.
74. Barber AJ, Gardner TW, Abcouwer SF: The significance of vascular and
neural apoptosis to the pathology of diabetic retinopathy. Invest Ophthalmol Vis
Sci 2011;52:1156-1163.
75. Barber AJ: A new view of diabetic retinopathy: a neurodegenerative disease
of the eye. Prog Neuropsychopharmacol Biol Psychiatry 2003;27:283-290.

142
76. Curtis TM, Gardiner TA, Stitt AW: Microvascular lesions of diabetic
retinopathy: clues towards understanding pathogenesis?. Eye (Lond)
2009;23:1496-1508.
77. Wolter JR: Diabetic retinopathy. Am J Ophthalmol 1961;51:1123-1141.
78. Bloodworth JM,Jr: Diabetic retinopathy. Diabetes 1962;11:1-22.
79. Scott TM, Foote J, Peat B, Galway G: Vascular and neural changes in the rat
optic nerve following induction of diabetes with streptozotocin. J Anat
1986;144:145-152.
80. Barber AJ, Lieth E, Khin SA, Antonetti DA, Buchanan AG, Gardner TW:
Neural apoptosis in the retina during experimental and human diabetes. Early
onset and effect of insulin. J Clin Invest 1998;102:783-791.
81. Kern TS, Barber AJ: Retinal ganglion cells in diabetes. J Physiol
2008;586:4401-4408.
82. Gastinger MJ, Singh RS, Barber AJ: Loss of cholinergic and dopaminergic
amacrine cells in streptozotocin-diabetic rat and Ins2Akita-diabetic mouse
retinas. Invest Ophthalmol Vis Sci 2006;47:3143-3150.
83. Ly A, Yee P, Vessey KA, Phipps JA, Jobling AI, Fletcher EL: Early inner
retinal astrocyte dysfunction during diabetes and development of hypoxia, retinal
stress, and neuronal functional loss. Invest Ophthalmol Vis Sci 2011;52:9316-
9326.
143
84. Schmidt KG, Bergert H, Funk RH: Neurodegenerative diseases of the retina
and potential for protection and recovery. Curr Neuropharmacol 2008;6:164-178.
85. Funk R: Blood supply of the retina. Ophthalmic Res 1997;29:320-325.
86. Meyer-Rüsenberg B, Pavlidis M, Stupp T, Thanos S: Pathological changes in
human retinal ganglion cells associated with diabetic and hypertensive
retinopathy. Graefe's Archive for Clinical and Experimental Ophthalmology
2006;245:1009-1018.
87. Park SH, Park JW, Park SJ, Kim KY, Chung JW, Chun MH, Oh SJ: Apoptotic
death of photoreceptors in the streptozotocin-induced diabetic rat retina.
Diabetologia 2003;46:1260-1268.
88. Park JW, Park SJ, Park SH, Kim KY, Chung JW, Chun MH, Oh SJ: Up-
regulated expression of neuronal nitric oxide synthase in experimental diabetic
retina. Neurobiol Dis 2006;21:43-49.
89. Van Dijk HW, Verbraak FD, Kok PHB, Stehouwer M, Garvin MK, Sonka M,
DeVries JH, Schlingemann RO, Abràmoff MD: Early Neurodegeneration in the
Retina of Type 2 Diabetic Patients. Invest Ophthalmol Vis Sci 2012;53:2715-
2719.
90. Gardner T, Antonetti D, Barber A, LaNoue K, Levison S: Diabetic
Retinopathy-More Than Meets the Eye. Surv Ophthalmol 2002;47:253-262.
144
91. Devi TS, Lee I, Huttemann M, Kumar A, Nantwi KD, Singh LP: TXNIP links
innate host defense mechanisms to oxidative stress and inflammation in retinal
Muller glia under chronic hyperglycemia: implications for diabetic retinopathy. Exp
Diabetes Res 2012;2012:438238.
92. Zong H, Ward M, Madden A, Yong P, Limb G, Curtis T, Stitt A:
Hyperglycaemia-induced pro-inflammatory responses by retinal Müller glia are
regulated by the receptor for advanced glycation end-products (RAGE).
Diabetologia 2010;53:2656-2666.
93. Carrasco E, Hernández C, Miralles A, Huguet P, Farrés J, Simó R: Lower
somatostatin expression is an early event in diabetic retinopathy and is
associated with retinal neurodegeneration. Diabetes Care 2007;30:2902-2908.
94. Carrasco E, Hernández C, De Torres I, Farrés J, Simó R: Lowered cortistatin
expression is an early event in the human diabetic retina and is associated with
apoptosis and glial activation. Molecular vision 2008;14:1496.
95. Tretiach M, Madigan MC, Wen L, Gillies MC: Effect of Müller cell co-culture
on in vitro permeability of bovine retinal vascular endothelium in normoxic and
hypoxic conditions. Neurosci Lett 2005;378:160-165.
96. Barber AJ, Antonetti DA, Gardner TW: Altered expression of retinal occludin
and glial fibrillary acidic protein in experimental diabetes. Invest Ophthalmol Vis
Sci 2000;41:3561-3568.
145
97. Curtis T, Hamilton R, Yong PH, McVicar C, Berner A, Pringle R, Uchida K,
Nagai R, Brockbank S, Stitt A: Müller glial dysfunction during diabetic retinopathy
in rats is linked to accumulation of advanced glycation end-products and
advanced lipoxidation end-products. Diabetologia 2011;54:690-698.
98. Bringmann A, Iandiev I, Pannicke T, Wurm A, Hollborn M, Wiedemann P,
Osborne NN, Reichenbach A: Cellular signaling and factors involved in Müller cell
gliosis: neuroprotective and detrimental effects. Prog Retin Eye Res
2009;28:423-451.
99. Bringmann A, Wiedemann P: Muller glial cells in retinal disease.
Ophthalmologica 2012;227:1-19.
100. Bringmann A, Pannicke T, Grosche J, Francke M, Wiedemann P, Skatchkov
SN, Osborne NN, Reichenbach A: Müller cells in the healthy and diseased retina.
Prog Retin Eye Res 2006;25:397-424.
101. Yong PH, Zong H, Medina RJ, Limb GA, Uchida K, Stitt AW, Curtis TM:
Evidence supporting a role for N-(3-formyl-3,4-dehydropiperidino)lysine
accumulation in Muller glia dysfunction and death in diabetic retinopathy. Mol Vis
2010;16:2524-2538.
102. Reichenbach A, Wurm A, Pannicke T, Iandiev I, Wiedemann P, Bringmann
A: Müller cells as players in retinal degeneration and edema. Graefe's Archive for
Clinical and Experimental Ophthalmology 2007;245:627-636.
146
103. Rungger–Brändle E, Dosso AA, Leuenberger PM: Glial reactivity, an early
feature of diabetic retinopathy. Invest Ophthalmol Vis Sci 2000;41:1971-1980.
104. Newman EA: Sodium-bicarbonate cotransport in retinal astrocytes and
Müller cells of the rat. Glia 1999;26:302-308.
105. Rungger-Brändle E, Kolb H, Niemeyer G: Histochemical demonstration of
glycogen in neurons of the cat retina. Invest Ophthalmol Vis Sci 1996;37:702-
715.
106. Mogi M, Horiuchi M: Neurovascular coupling in cognitive impairment
associated with diabetes mellitus. Circ J 2011;75:1042-1048.
107. Karlstetter M, Ebert S, Langmann T: Microglia in the healthy and
degenerating retina: insights from novel mouse models. Immunobiology
2010;215:685-691.
108. Joussen AM, Poulaki V, Le ML, Koizumi K, Esser C, Janicki H,
Schraermeyer U, Kociok N, Fauser S, Kirchhof B: A central role for inflammation
in the pathogenesis of diabetic retinopathy. The FASEB journal 2004;18:1450-
1452.
109. Ibrahim AS, El-Remessy AB, Matragoon S, Zhang W, Patel Y, Khan S, Al-
Gayyar MM, El-Shishtawy MM, Liou GI: Retinal microglial activation and
inflammation induced by amadori-glycated albumin in a rat model of diabetes.
Diabetes 2011;60:1122-1133.

147
110. Zeng HY, Green WR, Tso MO: Microglial activation in human diabetic
retinopathy. Arch Ophthalmol 2008;126:227-232.
111. Zeng XX, Ng YK, Ling EA: Neuronal and microglial response in the retina of
streptozotocin-induced diabetic rats. Vis Neurosci 2000;17:463-471.
112. Yang LP, Sun HL, Wu LM, Guo XJ, Dou HL, Tso MO, Zhao L, Li SM:
Baicalein reduces inflammatory process in a rodent model of diabetic retinopathy.
Invest Ophthalmol Vis Sci 2009;50:2319-2327.
113. Joussen AM, Doehmen S, Le ML, Koizumi K, Radetzky S, Krohne TU,
Poulaki V, Semkova I, Kociok N: TNF-α mediated apoptosis plays an important
role in the development of early diabetic retinopathy and long-term
histopathological alterations. Molecular vision 2009;15:1418.
114. Liu W, Xu GZ, Jiang CH, Tian J: Macrophage colony-stimulating factor and
its receptor signaling augment glycated albumin-induced retinal microglial
inflammation in vitro. BMC Cell Biol 2011;12:5.
115. Langmann T: Microglia activation in retinal degeneration. J Leukoc Biol
2007;81:1345-1351.
116. Fukuda M, Nakanishi Y, Fuse M, Yokoi N, Hamada Y, Fukagawa M, Negi A,
Nakamura M: Altered expression of aquaporins 1 and 4 coincides with
neurodegenerative events in retinas of spontaneously diabetic Torii rats. Exp Eye
Res 2010;90:17-25.
148
117. Tenckhoff S, Hollborn M, Kohen L, Wolf S, Wiedemann P, Bringmann A:
Diversity of aquaporin mRNA expressed by rat and human retinas. Neuroreport
2005;16:53-56.
118. Fischbarg J: Water channels and their roles in some ocular tissues. Mol
Aspects Med 2012;33:638-641.
119. Benga G: The first discovered water channel protein, later called aquaporin
1: Molecular characteristics, functions and medical implications. Mol Aspects Med
2012;33:518-534.
120. Kumari SS, Varadaraj M, Yerramilli VS, Menon AG, Varadaraj K: Spatial
expression of aquaporin 5 in mammalian cornea and lens, and regulation of its
localization by phosphokinase A. Mol Vis 2012;18:957-967.
121. Fukuda M, Naka M, Mizokami J, Negi A, Nakamura M: Diabetes induces
expression of aquaporin-0 in the retinal nerve fibers of spontaneously diabetic
Torii rats. Exp Eye Res 2011;92:195-201.
122. Iandiev I, Dukic-Stefanovic S, Hollborn M, Pannicke T, Hartig W,
Wiedemann P, Reichenbach A, Bringmann A, Kohen L: Immunolocalization of
aquaporin-6 in the rat retina. Neurosci Lett 2011;490:130-134.
123. Ding C, Lu M, Huang J: Changes of the ocular surface and aquaporins in
the lacrimal glands of rabbits during pregnancy. Mol Vis 2011;17:2847-2855.
149
124. Karasawa K, Tanaka A, Jung K, Matsuda A, Okamoto N, Oida K, Ohmori K,
Matsuda H: Patterns of aquaporin expression in the canine eye. Vet J
2011;190:e72-7.
125. Iandiev I, Pannicke T, Härtig W, Grosche J, Wiedemann P, Reichenbach A,
Bringmann A: Localization of aquaporin-0 immunoreactivity in the rat retina.
Neurosci Lett 2007;426:81-86.
126. Iandiev I, Pannicke T, Reichenbach A, Wiedemann P, Bringmann A:
Diabetes alters the localization of glial aquaporins in rat retina. Neurosci Lett
2007;421:132-136.
127. Verkman AS: A cautionary note on cosmetics containing ingredients that
increase aquaporin-3 expression. Exp Dermatol 2008;17:871-872.
128. Dibas A, Yang MH, He S, Bobich J, Yorio T: Changes in ocular aquaporin-4
(AQP4) expression following retinal injury. Mol Vis 2008;14:1770-1783.
129. Iandiev I, Biedermann B, Reichenbach A, Wiedemann P, Bringmann A:
Expression of aquaporin-9 immunoreactivity by catecholaminergic amacrine cells
in the rat retina. Neurosci Lett 2006;398:264-267.
130. Kim IB, Oh SJ, Nielsen S, Chun MH: Immunocytochemical localization of
aquaporin 1 in the rat retina. Neurosci Lett 1998;244:52-54.
150
131. Shankardas J, Patil RV, Vishwanatha JK: Effect of down-regulation of
aquaporins in human corneal endothelial and epithelial cell lines. Mol Vis
2010;16:1538-1548.
132. Macnamara E, Sams GW, Smith K, Ambati J, Singh N, Ambati BK:
Aquaporin-1 expression is decreased in human and mouse corneal endothelial
dysfunction. Mol Vis 2004;10:51-56.
133. Ruiz A, Bok D: Characterization of the 3' UTR sequence encoded by the
AQP-1 gene in human retinal pigment epithelium. Biochim Biophys Acta
1996;1282:174-178.
134. Raina S, Preston GM, Guggino WB, Agre P: Molecular cloning and
characterization of an aquaporin cDNA from salivary, lacrimal, and respiratory
tissues. J Biol Chem 1995;270:1908-1912.
135. Baetz NW, Hoffman EA, Yool AJ, Stamer WD: Role of aquaporin-1 in
trabecular meshwork cell homeostasis during mechanical strain. Exp Eye Res
2009;89:95-100.
136. Stamer WD, Chan DW, Conley SM, Coons S, Ethier CR: Aquaporin-1
expression and conventional aqueous outflow in human eyes. Exp Eye Res
2008;87:349-355.
137. Frigeri A, Nicchia GP, Svelto M: Aquaporins as targets for drug discovery.
Curr Pharm Des 2007;13:2421-2427.
151
138. Peng J, Zhang H, Li T, Li Z, Wu Y: Effect of dexamethasone and aquaporin-
1 antisense oligonucleotides on the aquaporin-1 expression in cultured human
trabecular meshwork cells. J Huazhong Univ Sci Technolog Med Sci
2006;26:137-140.
139. Verkman AS: Role of aquaporin water channels in eye function. Exp Eye
Res 2003;76:137-143.
140. Verkman AS: Physiological importance of aquaporin water channels. Ann
Med 2002;34:192-200.
141. Hamann S, Zeuthen T, La Cour M, Nagelhus EA, Ottersen OP, Agre P,
Nielsen S: Aquaporins in complex tissues: distribution of aquaporins 1-5 in
human and rat eye. Am J Physiol 1998;274:C1332-45.
142. Nagelhus EA, Horio Y, Inanobe A, Fujita A, Haug FM, Nielsen S, Kurachi Y,
Ottersen OP: Immunogold evidence suggests that coupling of K+ siphoning and
water transport in rat retinal Muller cells is mediated by a coenrichment of Kir4.1
and AQP4 in specific membrane domains. Glia 1999;26:47-54.
143. Iandiev I, Tenckhoff S, Pannicke T, Biedermann B, Hollborn M, Wiedemann
P, Reichenbach A, Bringmann A: Differential regulation of Kir4. 1 and Kir2. 1
expression in the ischemic rat retina. Neurosci Lett 2006;396:97-101.
144. Hollborn M, Dukic-Stefanovic S, Pannicke T, Ulbricht E, Reichenbach A,
Wiedemann P, Bringmann A, Kohen L: Expression of aquaporins in the retina of
diabetic rats. Curr Eye Res 2011;36:850-856.

152
145. Qin Y, Fan J, Ye X, Xu G, Liu W, Da C: High salt loading alters the
expression and localization of glial aquaporins in rat retina. Exp Eye Res
2009;89:88-94.
146. Zhang Y, Xu G, Ling Q, Da C: Expression of aquaporin 4 and Kir4.1 in
diabetic rat retina: treatment with minocycline. J Int Med Res 2011;39:464-479.
147. Cui B, Sun J, Xiang F, Liu L, Li W: Aquaporin 4 knockdown exacerbates
streptozotocin-induced diabetic retinopathy through aggravating inflammatory
response. Exp Eye Res 2012;98:37-43.
148. Gerhardinger C, Costa MB, Coulombe MC, Toth I, Hoehn T, Grosu P:
Expression of acute-phase response proteins in retinal Muller cells in diabetes.
Invest Ophthalmol Vis Sci 2005;46:349-357.
149. Sarthy V: Focus on Molecules: Glial fibrillary acidic protein (GFAP). Exp Eye
Res 2007;84:381-382.
150. Mizutani M, Gerhardinger C, Lorenzi M: Müller cell changes in human
diabetic retinopathy. Diabetes 1998;47:445-449.
151. Lieth E, Gardner TW, Barber AJ, Antonetti DA, Penn State Retina Research
Group: Retinal neurodegeneration: early pathology in diabetes. Clin Experiment
Ophthalmol 2000;28:3-8.
152. Kumar S, Zhuo L: Longitudinal in vivo imaging of retinal gliosis in a diabetic
mouse model. Exp Eye Res 2010;91:530-536.
153
153. Shelton MD, Distler AM, Kern TS, Mieyal JJ: Glutaredoxin regulates
autocrine and paracrine proinflammatory responses in retinal glial (muller) cells. J
Biol Chem 2009;284:4760-4766.
154. Liu Y, Biarnes Costa M, Gerhardinger C: IL-1beta is upregulated in the
diabetic retina and retinal vessels: cell-specific effect of high glucose and IL-
1beta autostimulation. PLoS One 2012;7:e36949.
155. Gverovic Antunica A, Karaman K, Znaor L, Sapunar A, Busko V, Puzovic V:
IL-12 concentrations in the aqueous humor and serum of diabetic retinopathy
patients. Graefes Arch Clin Exp Ophthalmol 2012;250:815-821.
156. Cheung CMG, Vania M, Ang M, Chee SP, Li J: Comparison of aqueous
humor cytokine and chemokine levels in diabetic patients with and without
retinopathy. Molecular Vision 2012;18:830.
157. Wurm A, Pannicke T, Wiedemann P, Reichenbach A, Bringmann A: Glial
cell-derived glutamate mediates autocrine cell volume regulation in the retina:
activation by VEGF. J Neurochem 2008;104:386-399.
158. Fletcher EL, Phipps JA, Wilkinson-Berka JL: Dysfunction of retinal neurons
and glia during diabetes. Clin Exp Optom 2005;88:132-145.
159. Gowda K, Zinnanti WJ, LaNoue KF: The influence of diabetes on glutamate
metabolism in retinas. J Neurochem 2011;117:309-320.

154
160. Hernandez C, Simo R: Neuroprotection in Diabetic Retinopathy. Curr Diab
Rep 2012.
161. Mysona B, Dun Y, Duplantier J, Ganapathy V, Smith SB: Effects of
hyperglycemia and oxidative stress on the glutamate transporters GLAST and
system xc- in mouse retinal Muller glial cells. Cell Tissue Res 2009;335:477-488.
162. Ishikawa A, Ishiguro SI, Tamai M: Changes in GABA metabolism in
streptozotocin-induced diabetic rat retinas. Curr Eye Res 1996;15:63-71.
163. Phipps JA, Jobling AI, Greferath U, Fletcher EL, Vessey KA: Alternative
pathways in the development of diabetic retinopathy: the renin-angiotensin and
kallikrein-kinin systems. Clin Exp Optom 2012;95:282-289.
164. Fukumoto M, Takai S, Ishizaki E, Sugiyama T, Oku H, Jin D, Sakaguchi M,
Sakonjo H, Ikeda T, Miyazaki M: Involvement of angiotensin II-dependent
vascular endothelial growth factor gene expression via NADPH oxidase in the
retina in a type 2 diabetic rat model. Curr Eye Res 2008;33:885-891.
165. Fletcher EL, Phipps JA, Ward MM, Vessey KA, Wilkinson-Berka JL: The
renin-angiotensin system in retinal health and disease: Its influence on neurons,
glia and the vasculature. Prog Retin Eye Res 2010;29:284-311.
166. Downie L, Vessey K, Miller A, Ward M, Pianta M, Vingrys A, Wilkinson-
Berka J, Fletcher E: Neuronal and glial cell expression of angiotensin II type 1
(AT1) and type 2 (AT2) receptors in the rat retina. Neuroscience 2009;161:195-
213.

155
167. Ozawa Y, Kurihara T, Sasaki M, Ban N, Yuki K, Kubota S, Tsubota K:
Neural degeneration in the retina of the streptozotocin-induced type 1 diabetes
model. Exp Diabetes Res 2011;2011:108328.
168. Zong H, Ward M, Stitt AW: AGEs, RAGE, and diabetic retinopathy. Current
Diabetes Reports 2011:1-9.
169. Whitmire W, Al-Gayyar MM, Abdelsaid M, Yousufzai BK, El-Remessy AB:
Alteration of growth factors and neuronal death in diabetic retinopathy: what we
have learned so far. Mol Vis 2011;17:300-308.
170. Ali TK, Matragoon S, Pillai BA, Liou GI, El-Remessy AB: Peroxynitrite
mediates retinal neurodegeneration by inhibiting nerve growth factor survival
signaling in experimental and human diabetes. Diabetes 2008;57:889-898.
171. Al-Gayyar MMH, Matragoon S, Pillai B, Ali T, Abdelsaid M, El-Remessy A:
Epicatechin blocks pro-nerve growth factor (proNGF)-mediated retinal
neurodegeneration via inhibition of p75 neurotrophin receptor proNGF expression
in a rat model of diabetes. Diabetologia 2011;54:669-680.
172. Seki M, Tanaka T, Nawa H, Usui T, Fukuchi T, Ikeda K, Abe H, Takei N:
Involvement of brain-derived neurotrophic factor in early retinal neuropathy of
streptozotocin-induced diabetes in rats. Diabetes 2004;53:2412-2419.
173. Yoko O, Toshihide K, Mariko S, Norimitsu B, Kenya Y, Shunsuke K, Kazuo
T: Neural Degeneration in the Retina of the Streptozotocin-Induced Type 1
Diabetes Model. Experimental diabetes research 2011;2011.
156
174. Zhu X, Sun Y, Wang Z, Cui W, Peng Y, Li R: Expression of glial cell line-
derived neurotrophic factor and its receptors in cultured retinal Muller cells under
high glucose circumstance. Anat Rec (Hoboken) 2012;295:532-539.
175. Buabbud JC, Al-latayfeh MM, Sun JK: Optical coherence tomography
imaging for diabetic retinopathy and macular edema. Curr Diab Rep
2010;10:264-269.
176. Kanski JJ: Tecniche di imaging. In: Oftalmología clínica. Azzolini C eds
Elsevier Publ, Milano, 2008, pp 47-48.
177. Gabriele ML, Wollstein G, Ishikawa H, Kagemann L, Xu J, Folio LS,
Schuman JS: Optical coherence tomography: history, current status, and
laboratory work. Invest Ophthalmol Vis Sci 2011;52:2425-2436.
178. Guedes V, Schuman JS, Hertzmark E, Wollstein G, Correnti A, Mancini R,
Lederer D, Voskanian S, Velazquez L, Pakter HM: Optical coherence
tomography measurement of macular and nerve fiber layer thickness in normal
and glaucomatous human eyes. Ophthalmology 2003;110:177-189.
179. Chen TC, Cense B, Pierce MC, Nassif N, Park BH, Yun SH, White BR,
Bouma BE, Tearney GJ, de Boer JF: Spectral domain optical coherence
tomography: ultra-high speed, ultra-high resolution ophthalmic imaging. Arch
Ophthalmol 2005;123:1715.

157
180. Kiernan DF, Mieler WF, Hariprasad SM: Spectral-domain optical coherence
tomography: a comparison of modern high-resolution retinal imaging systems.
Am J Ophthalmol 2010;149:18-31.
181. Verma A, Rani PK, Raman R, Pal SS, Laxmi G, Gupta M, Sahu C,
Vaitheeswaran K, Sharma T: Is neuronal dysfunction an early sign of diabetic
retinopathy? Microperimetry and spectral domain optical coherence tomography
(SD-OCT) study in individuals with diabetes, but no diabetic retinopathy. Eye
(Lond) 2009;23:1824-1830.
182. Grover S, Murthy RK, Brar VS, Chalam KV: Comparison of retinal thickness
in normal eyes using Stratus and Spectralis optical coherence tomography.
Invest Ophthalmol Vis Sci 2010;51:2644-2647.
183. Kiernan DF, Hariprasad SM, Chin EK, Kiernan CL, Rago J, Mieler WF:
Prospective comparison of cirrus and stratus optical coherence tomography for
quantifying retinal thickness. Am J Ophthalmol 2009;147:267-275.e2.
184. DeBuc DC, Somfai G: Early detection of retinal thickness changes in
diabetes using Optical Coherence Tomography. Med Sci Monit 2010;16:21.
185. Wolf S, Wolf-Schnurrbusch U: Spectral-domain optical coherence
tomography use in macular diseases: a review. Ophthalmologica 2010;224:333-
340.
158
186. Sadda SR, Keane PA, Ouyang Y, Updike JF, Walsh AC: Impact of scanning
density on measurements from spectral domain optical coherence tomography.
Invest Ophthalmol Vis Sci 2010;51:1071-1078.
187. Debuc DC, Salinas HM, Ranganathan S, Tatrai E, Gao W, Shen M, Wang J,
Somfai GM, Puliafito CA: Improving image segmentation performance and
quantitative analysis via a computer-aided grading methodology for optical
coherence tomography retinal image analysis. J Biomed Opt 2010;15:046015.
188. Forooghian F, Cukras C, Meyerle CB, Chew EY, Wong WT: Evaluation of
time domain and spectral domain optical coherence tomography in the
measurement of diabetic macular edema. Invest Ophthalmol Vis Sci
2008;49:4290-4296.
189. Schaudig UH, Glaefke C, Scholz F, Richard G: Optical coherence
tomography for retinal thickness measurement in diabetic patients without
clinically significant macular edema. Ophthalmic Surg Lasers 2000;31:182.
190. Pires I, Bernardes RC, Lobo CL, Soares MA, Cunha-Vaz JG: Retinal
thickness in eyes with mild nonproliferative retinopathy in patients with type 2
diabetes mellitus: comparison of measurements obtained by retinal thickness
analysis and optical coherence tomography. Arch Ophthalmol 2002;120:1301.
191. Sánchez-Tocino H, Alvarez-Vidal A, Maldonado MJ, Moreno-Montañés J,
García-Layana A: Retinal thickness study with optical coherence tomography in
patients with diabetes. Invest Ophthalmol Vis Sci 2002;43:1588-1594.
159
192. Oshitari T, Hanawa K, Adachi-Usami E: Changes of macular and RNFL
thicknesses measured by Stratus OCT in patients with early stage diabetes. Eye
2008;23:884-889.
193. Lattanzio R, Brancato R, Pierro L, Bandello F, Iaccher B, Fiore T,
Maestranzi G: Macular thickness measured by optical coherence tomography
(OCT) in diabetic patients. Eur J Ophthalmol 2002;12:482.
194. Sng CC, Cheung CY, Man RE, Wong W, Lavanya R, Mitchell P, Aung T,
Wong TY: Influence of diabetes on macular thickness measured using optical
coherence tomography: the Singapore Indian Eye Study. Eye (Lond)
2012;26:690-698.
195. Massin P, Erginay A, Haouchine B, Mehidi A, Paques M, Gaudric A: Retinal
thickness in healthy and diabetic subjects measured using optical coherence
tomography mapping software. Eur J Ophthalmol 2002;12:102-108.
196. Alkuraya H, Kangave D, Abu El-Asrar AM: The correlation between optical
coherence tomographic features and severity of retinopathy, macular thickness
and visual acuity in diabetic macular edema. Int Ophthalmol 2005;26:93-99.
197. Bressler NM, Edwards AR, Antoszyk AN, Beck RW, Browning DJ, Ciardella
AP, Danis RP, Elman MJ, Friedman SM, Glassman AR, Gross JG, Li HK, Murtha
TJ, Stone TW, Sun JK, Diabetic Retinopathy Clinical Research Network: Retinal
thickness on Stratus optical coherence tomography in people with diabetes and
minimal or no diabetic retinopathy. Am J Ophthalmol 2008;145:894-901.

160
198. Biallosterski C, van Velthoven MEJ, Michels RPJ, Schlingemann RO,
DeVries JH, Verbraak FD: Decreased optical coherence tomography-measured
pericentral retinal thickness in patients with diabetes mellitus type 1 with minimal
diabetic retinopathy. Br J Ophthalmol 2007;91:1135-1138.
199. Nilsson M, Von Wendt G, Wanger P, Martin L: Early detection of macular
changes in patients with diabetes using Rarebit Fovea Test and optical
coherence tomography. Br J Ophthalmol 2007;91:1596-1598.
200. Asefzadeh B, Fisch BM, Parenteau CE, Cavallerano AA: Macular thickness
and systemic markers for diabetes in individuals with no or mild diabetic
retinopathy. Clin Experiment Ophthalmol 2008;36:455-463.
201. Van Dijk HW, Kok PHB, Garvin M, Sonka M, DeVries JH, Michels RPJ, van
Velthoven MEJ, Schlingemann RO, Verbraak FD, Abràmoff MD: Selective loss of
inner retinal layer thickness in type 1 diabetic patients with minimal diabetic
retinopathy. Invest Ophthalmol Vis Sci 2009;50:3404-3409.
202. Van Dijk HW, Verbraak FD, Kok PHB, Garvin MK, Sonka M, Lee K, DeVries
JH, Michels RPJ, Van Velthoven MEJ, Schlingemann RO: Decreased retinal
ganglion cell layer thickness in patients with type 1 diabetes. Invest Ophthalmol
Vis Sci 2010;51:3660-3665.
203. Peng PH, Lin HS, Lin S: Nerve fibre layer thinning in patients with preclinical
retinopathy. Can J Ophthalmol 2009;44:417-422.
161
204. Araszkiewicz A, Zozulinska-Ziolkiewicz D, Meller M, Bernardczyk-Meller J,
Pilacinski S, Rogowicz-Frontczak A, Naskret D, Wierusz-Wysocka B:
Neurodegeneration of the retina in type 1 diabetic patients. Pol Arch Med Wewn
2012.
205. de Faria JML, Russ H, Costa V: Retinal nerve fibre layer loss in patients with
type 1 diabetes mellitus without retinopathy. Br J Ophthalmol 2002;86:725-728.
206. Takahashi H, Goto T, Shoji T, Tanito M, Park M, Chihara E: Diabetes-
associated retinal nerve fiber damage evaluated with scanning laser polarimetry.
Am J Ophthalmol 2006;142:88-94.
207. Midena E, Martini F, Rediu A, Casciano M, Vujosevic S: Retinal glial cells
activation in diabetics with and without retinopathy: an in vivo study. ARVO
2011;1:1-1.
208. Midena G, Vujosevic S, Martini F, Bini S, Parrozzani R, Midena E: Retina
microglia in diabetics with and without retinopathy: an in vivo study. ARVO
2012;1:1-1.
209. American Diabetes Association: Diagnosis and classification of diabetes
mellitus. Diabetes Care 2012;35 Suppl 1:S64-71.
210. Herber S, Grus FH, Sabuncuo P, Augustin AJ: Two-dimensional analysis of
tear protein patterns of diabetic patients. Electrophoresis 2001;22:1838-1844.
162
211. Grus F, Sabuncuo P, Dick H, Augustin A, Pfeiffer N: Changes in the tear
proteins of diabetic patients. BMC ophthalmology 2002;2:4.
212. Herber S, Grus FH, Sabuncuo P, Augustin AJ: Changes in the tear protein
patterns of diabetic patients using two-dimensional electrophoresis. Adv Exp Med
Biol 2002;506:623-626.
213. Er H, Doğanay S, Özerol E, Yürekli M: Adrenomedullin and leptin levels in
diabetic retinopathy and retinal diseases. Ophthalmologica 2005;219:107-111.
214. Murugeswari P, Shukla D, Rajendran A, Kim R, Namperumalsamy P,
Muthukkaruppan V: Proinflammatory cytokines and angiogenic and anti-
angiogenic factors in vitreous of patients with proliferative diabetic retinopathy
and Eales’ disease. Retina 2008;28:817.
215. Funatsu H, Yamashita H, Noma H, Mimura T, Yamashita T, Hori S:
Increased levels of vascular endothelial growth factor and interleukin-6 in the
aqueous humor of diabetics with macular edema. Am J Ophthalmol 2002;133:70-
77.
216. Funatsu H, Yamashita H, Sakata K, Noma H, Mimura T, Suzuki M, Eguchi
S, Hori S: Vitreous levels of vascular endothelial growth factor and intercellular
adhesion molecule 1 are related to diabetic macular edema. Ophthalmology
2005;112:806-816.
217. Funatsu H, Yamashita H, Noma H, Mimura T, Nakamura S, Sakata K, Hori
S: Aqueous humor levels of cytokines are related to vitreous levels and
163
progression of diabetic retinopathy in diabetic patients. Graefes Arch Clin Exp
Ophthalmol 2005;243:3-8.
218. Jonas JB, Neumaier M: Erythropoietin levels in aqueous humour in eyes
with exudative age-related macular degeneration and diabetic retinopathy. Clin
Experiment Ophthalmol 2007;35:186-187.
219. Jonas JB, Jonas RA, Neumaier M, Findeisen P: Cytokine Concentration in
Aqueous Humor of Eyes with Diabetic Macular Edema. Retina 2012. 32:2150-7.
220. Ecker SM, Hines JC, Pfahler SM, Glaser BM: Aqueous cytokine and growth
factor levels do not reliably reflect those levels found in the vitreous. Mol Vis
2011;17:2856-2863.
221. Sharma RK, Rogojina AT, Chalam KV: Multiplex immunoassay analysis of
biomarkers in clinically accessible quantities of human aqueous humor. Mol Vis
2009;15:60-69.
222. Forooghian F, Kertes PJ, Eng KT, Agron E, Chew EY: Alterations in the
intraocular cytokine milieu after intravitreal bevacizumab. Invest Ophthalmol Vis
Sci 2010;51:2388-2392.
223. Oh IK, Kim SW, Oh J, Lee TS, Huh K: Inflammatory and angiogenic factors
in the aqueous humor and the relationship to diabetic retinopathy. Curr Eye Res
2010;35:1116-1127.
164
224. Tardy M, Fages C, Le Prince G, Rolland B, Nunez J: Regulation of the glial
fibrillary acidic protein (GFAP) and of its encoding mRNA in the developing brain
and in cultured astrocytes. Adv Exp Med Biol 1990;265:41-52.
225. Liedtke W, Edelmann W, Bieri PL, Chiu FC, Cowan NJ, Kucherlapati R,
Raine CS: GFAP is necessary for the integrity of CNS white matter architecture
and long-term maintenance of myelination. Neuron 1996;17:607-615.
226. Weinstein DE, Shelanski ML, Liem R: Suppression by antisense mRNA
demonstrates a requirement for the glial fibrillary acidic protein in the formation of
stable astrocytic processes in response to neurons. J Cell Biol 1991;112:1205-
1213.
227. Tuccari G, Trombetta C, Giardinelli MM, Arena F, Barresi G: Distribution of
glial fibrillary acidic protein in normal and gliotic human retina. Basic Appl
Histochem 1986;30:425-432.
228. Garcia-Ramirez M, Hernandez C, Villarroel M, Canals F, Alonso MA,
Fortuny R, Masmiquel L, Navarro A, Garcia-Arumi J, Simo R: Interphotoreceptor
retinoid-binding protein (IRBP) is downregulated at early stages of diabetic
retinopathy. Diabetologia 2009;52:2633-2641.
229. Kuiper EJ, Witmer AN, Klaassen I, Oliver N, Goldschmeding R,
Schlingemann RO: Differential expression of connective tissue growth factor in
microglia and pericytes in the human diabetic retina. Br J Ophthalmol
2004;88:1082-1087.
165
230. Abu-El-Asrar AM, Dralands L, Missotten L, Al-Jadaan IA, Geboes K:
Expression of apoptosis markers in the retinas of human subjects with diabetes.
Invest Ophthalmol Vis Sci 2004;45:2760-2766.
231. Ohashi Y, Ishida R, Kojima T, Goto E, Matsumoto Y, Watanabe K, Ishida N,
Nakata K, Takeuchi T, Tsubota K: Abnormal protein profiles in tears with dry eye
syndrome. Am J Ophthalmol 2003;136:291-299.
232. Hirai S, Ishida N, Watanabe K, Mita S: Leakage of aquaporin 5 in the tear of
dacryoadenitis mice. Invest Ophthalmol Vis Sci 2000;41:2432-2437.
233. Huber VJ, Tsujita M, Nakada T: Aquaporins in drug discovery and
pharmacotherapy. Mol Aspects Med 2012.
234. Iandiev I, Pannicke T, Hollborn M, Wiedemann P, Reichenbach A, Grimm C,
Reme CE, Bringmann A: Localization of glial aquaporin-4 and Kir4.1 in the light-
injured murine retina. Neurosci Lett 2008;434:317-321.
235. Castle NA: Aquaporins as targets for drug discovery. Drug Discov Today
2005;10:485-493.
236. Stamer WD, Bok D, Hu J, Jaffe GJ, McKay BS: Aquaporin-1 channels in
human retinal pigment epithelium: role in transepithelial water movement. Invest
Ophthalmol Vis Sci 2003;44:2803-2808.
166
237. Lee WJ, Cho HY: Possible short-term changes of aqueous inflammatory
cytokines after intravitreal bevacizumab for diabetic macular edema. Am J
Ophthalmol 2012;153:387-8; author reply 388.
238. Sohn HJ, Han DH, Kim IT, Oh IK, Kim KH, Lee DY, Nam DH: Changes in
aqueous concentrations of various cytokines after intravitreal triamcinolone
versus bevacizumab for diabetic macular edema. Am J Ophthalmol
2011;152:686-694.
239. Patel JI, Tombran-Tink J, Hykin PG, Gregor ZJ, Cree IA: Vitreous and
aqueous concentrations of proangiogenic, antiangiogenic factors and other
cytokines in diabetic retinopathy patients with macular edema: Implications for
structural differences in macular profiles. Exp Eye Res 2006;82:798-806.
240. Jeon S, Lee WK: Intravitreal bevacizumab increases intraocular interleukin-6
levels at 1day after injection in patients with proliferative diabetic retinopathy.
Cytokine 2012.
241. Boehm BO, Lang G, Volpert O, Jehle PM, Kurkhaus A, Rosinger S, Lang
GK, Bouck N: Low content of the natural ocular anti-angiogenic agent pigment
epithelium-derived factor (PEDF) in aqueous humor predicts progression of
diabetic retinopathy. Diabetologia 2003;46:394-400.
242. Zhou J, Wang S, Xia X: Role of intravitreal inflammatory cytokines and
angiogenic factors in proliferative diabetic retinopathy. Curr Eye Res
2012;37:416-420.

167
243. Suzuki Y, Nakazawa M, Suzuki K, Yamazaki H, Miyagawa Y: Expression
profiles of cytokines and chemokines in vitreous fluid in diabetic retinopathy and
central retinal vein occlusion. Jpn J Ophthalmol 2011:1-8.
244. Petrovic MG, Korosec P, Kosnik M, Hawlina M: Vitreous levels of
interleukin-8 in patients with proliferative diabetic retinopathy. Am J Ophthalmol
2007;143:175-176.
245. Demircan N, Safran BG, Soylu M, Ozcan AA, Sizmaz S: Determination of
vitreous interleukin-1 (IL-1) and tumour necrosis factor (TNF) levels in
proliferative diabetic retinopathy. Eye (Lond) 2006;20:1366-1369.
246. Maier R, Weger M, Haller-Schober EM, El-Shabrawi Y, Wedrich A, Theisl A,
Aigner R, Barth A, Haas A: Multiplex bead analysis of vitreous and serum
concentrations of inflammatory and proangiogenic factors in diabetic patients.
Mol Vis 2008;14:637-643.
247. Adamiec-Mroczek J, Oficjalska-Mlynczak J, Misiuk-Hojlo M: Roles of
endothelin-1 and selected proinflammatory cytokines in the pathogenesis of
proliferative diabetic retinopathy: Analysis of vitreous samples. Cytokine
2010;49:269-274.
248. Mocan MC, Kadayifcilar S, Eldem B: Elevated intravitreal interleukin-6 levels
in patients with proliferative diabetic retinopathy. Can J Ophthalmol 2006;41:747-
752.
168
249. Patel J, Saleh G, Hykin P, Gregor Z, Cree I: Concentration of
haemodynamic and inflammatory related cytokines in diabetic retinopathy. Eye
2006;22:223-228.
250. Schoenberger SD, Kim SJ, Sheng J, Rezaei KA, Lalezary M, Cherney E:
Increased prostaglandin E2 (PGE2) levels in proliferative diabetic retinopathy,
and correlation with VEGF and inflammatory cytokines. Invest Ophthalmol Vis
Sci. 2012;53:5906-11.
251. Nishikiori N, Osanai M, Chiba H, Kojima T, Mitamura Y, Ohguro H, Sawada
N: Glial cell-derived cytokines attenuate the breakdown of vascular integrity in
diabetic retinopathy. Diabetes 2007;56:1333-1340.
252. Bringmann A, Wiedemann P: Involvement of Müller glial cells in epiretinal
membrane formation. Graefe's Archive for Clinical and Experimental
Ophthalmology 2009;247:865-883.
253. Kalvoda J, Dušková J, Kuběna A, Povýšil C, Kalvodová B: Morphometry of
surgically removed internal limiting membrane during vitrectomy in diabetic
macular edema. Graefe's Archive for Clinical and Experimental Ophthalmology
2009;247:1307-1314.
254. Matsunaga N, Ozeki H, Hirabayashi Y, Shimada S, Ogura Y:
Histopathologic evaluation of the internal limiting membrane surgically excised
from eyes with diabetic maculopathy. Retina 2005;25:311-316.
169
255. Cabrera DeBuc D, Somfai GM: Early detection of retinal thickness changes
in diabetes using Optical Coherence Tomography. Med Sci Monit 2010;16:MT15-
21.
256. Cabrera Fernández D, Somfai GM, Tátrai E, Ranganathan S, Yee DC,
Ferencz M, Smiddy WE: Potentiality of intraretinal layer segmentation to locally
detect early retinal changes in patients with diabetes mellitus using optical
coherence tomography. Invest Ophthalmol Visual Sci 2008;49.