TRANSDERMAL AND TRANSMUCOSAL … · 2.2.5 Determination of microparticle size ... oral mucositis...
120
UNIVERSITÀ DEGLI STUDI DI MILANO SCUOLA DI DOTTORATO IN SCIENZE E TECNOLOGIE CHIMICHE DIPARTIMENTO DI SCIENZE FARMACEUTICHE CORSO DI DOTTORATO IN CHIMICA DEL FARMACO CICLO XXVI TRANSDERMAL AND TRANSMUCOSAL PHARMACEUTICAL DOSAGE FORMS FOR PALLIATIVE CARE IN CANCER THERAPY SETTORE CHIM/09 FARMACEUTICO TECNOLOGICO APPLICATIVO dott. UMBERTO MARIA MUSAZZI Matricola: R09050 Tutor: prof.ssa PAO Coordinatore del dottorato: prof. ERMANNO VALOTI ANNO ACCADEMICO 2012/2013
Transcript of TRANSDERMAL AND TRANSMUCOSAL … · 2.2.5 Determination of microparticle size ... oral mucositis...
UNIVERSITÀ DEGLI STUDI DI MILANO
SCUOLA DI DOTTORATO IN SCIENZE E TECNOLOGIE CHIMICHE
DIPARTIMENTO DI SCIENZE FARMACEUTICHE
CORSO DI DOTTORATO IN CHIMICA DEL FARMACO
CICLO XXVI
TRANSDERMAL AND TRANSMUCOSAL
PHARMACEUTICAL DOSAGE FORMS FOR
PALLIATIVE CARE IN CANCER THERAPY
SETTORE CHIM/09 FARMACEUTICO TECNOLOGICO APPLICATIVO
dott. UMBERTO MARIA MUSAZZI
Matricola: R09050
Tutor: prof.ssa PAO
Coordinatore del dottorato: prof. ERMANNO VALOTI
ANNO ACCADEMICO2012/2013
Γνῶθι σεαυτόν
3
Table of contents Table of contents .......................................................................................................... 3
Preface .......................................................................................................................... 6
1 General introduction ............................................................................................ 7
1.1 Aim of the work ............................................................................................ 9
1.1.1 Mucoadhesive mouthwash intended for the treatment of oral mucositis
induced by chemo- and radiotherapy ....................................................... 9
1.1.2 Nano-delivery system intended for treating ototoxicity induced by
chemotherapeutic agents ........................................................................ 10
1.1.3 Dermal and transdermal delivery of morphine derivatives: a qualitative
structure-penetration relationship ........................................................... 12
1.2 References ................................................................................................... 14
2 A novel oromucosal prolonged release mucoadhesive suspension by one step
spray coagulation method .................................................................................. 17
2.0 Abstract ....................................................................................................... 18
2.1 Introduction ................................................................................................. 19
2.2 Materials and Methods ................................................................................ 20
2.2.1 Materials ................................................................................................. 20
2.2.2 Preparation of FITC-labelled alginate .................................................... 21
2.2.3 Preparation of oromucosal microparticle suspension ............................. 21
2.2.4 Viscosity measurements ......................................................................... 22
2.2.5 Determination of microparticle size ....................................................... 22
2.2.6 Uniformity of Mass Delivered ............................................................... 22
2.2.7 Mucoadhesive properties ........................................................................ 24
2.2.8 Drug content ........................................................................................... 24
2.2.9 HPLC assay ............................................................................................ 24
2.2.10 In vitro drug release ................................................................................ 25
2.2.11 In vitro mucosa penetration study .......................................................... 25
2.2.12 In vitro evaluation of plaque development ............................................. 26
2.2.13 Preliminary evaluation of MMS stability ............................................... 28
2.3 Results ......................................................................................................... 28
2.3.1 Preparation of oromucosal mucoadhesive suspensions .......................... 28
2.3.2 In vitro mucosa Flurbiprofen penetration studies ................................... 31
4
2.3.3 In vitro evaluation of plaque development ............................................. 34
2.3.4 Preliminary stability evaluation .............................................................. 35
2.4 Discussion ................................................................................................... 36
2.5 Conclusion................................................................................................... 37
2.6 References ................................................................................................... 38
3 An oromucosal bioadhesive suspension for prolonged release of clobetasol
propionate............................................................................................................ 40
3.0 Abstract ....................................................................................................... 41
3.1 Introduction ................................................................................................. 42
3.2 Materials and methods ................................................................................ 43
3.2.1 Materials ................................................................................................. 43
3.2.2 Mouthwash preparation .......................................................................... 43
3.2.3 Mucoadhesive properties ........................................................................ 44
3.2.4 Design of experiments ............................................................................ 45
3.2.5 Statistical analyses .................................................................................. 45
3.2.6 Microparticle size and distribution ......................................................... 45
3.2.7 Drug content ........................................................................................... 46
3.2.8 HPLC analysis ........................................................................................ 46
3.2.9 In vitro mucosa penetration study .......................................................... 46
3.3 Results and discussion................................................................................. 50
3.4 Conclusion................................................................................................... 54
3.5 References ................................................................................................... 55
4 Resveratrol-loaded nanocarriers: formulation optimization, characterization
and in vitro toxicity on cochlear cells ................................................................ 56
4.0 Abstract ....................................................................................................... 57
4.1 Introduction ................................................................................................. 58
4.2 Materials and Methods ................................................................................ 59
4.2.1 Materials ................................................................................................. 59
4.2.2 Preparation of resveratrol-loaded nanoparticles ..................................... 60
4.2.3 Preparation of resveratrol nanocrystals .................................................. 60
4.2.4 Design of experiments ............................................................................ 60
4.2.5 Physiochemical characterization of resveratrol-loaded nanoparticles ... 62
4.2.6 Effect of cryoprotectants on resveratrol-loaded nanoparticle changes
during freeze-drying ............................................................................... 63
4.2.7 Morphological analysis of resveratrol-loaded nanoparticles .................. 64
4.2.8 In vitro drug release from resveratrol-loaded nanoparticles .................. 64
5
4.2.9 In vitro cell culture study of resveratrol-loaded nanoparticles ............... 64
4.3 Results ......................................................................................................... 66
4.3.1 Optimization of resveratrol-loaded nanoparticles .................................. 66
4.3.2 Powder X-ray diffraction pattern analysis of resveratrol-loaded
nanoparticles ........................................................................................... 70
4.3.3 Effect of the cryoprotectants on the physical stability of resveratrol-
loaded nanoparticles ............................................................................... 71
4.3.4 Morphology of resveratrol-loaded nanoparticles ................................... 73
4.3.5 In vitro drug release kinetics from resveratrol-loaded nanoparticles ..... 74
4.3.6 In vitro toxicity of resveratrol, blank and resveratrol-loaded nanoparticles
............................................................................................................... 75
4.4 Discussion ................................................................................................... 78
4.5 Conclusion................................................................................................... 82
4.6 References ................................................................................................... 83
4.7 Appendix 4.1: Ferrocene-loaded nanocarrier as probe for cochlear
biodistribution study.................................................................................... 86
5 Dermal and transdermal delivery of morphine derivatives: a qualitative
structure-penetration relationship .................................................................... 89
5.0 Abstract ....................................................................................................... 90
5.1 Introduction ................................................................................................. 92
5.2 Materials and methods ................................................................................ 93
5.2.1 Materials ................................................................................................. 93
5.2.2 Preparation and characterization of the morphine derivatives ............... 94
5.2.3 In vitro penetration studies ..................................................................... 98
5.2.4 Data analysis ........................................................................................... 99
5.2.5 Statistical analyses ................................................................................ 100
5.3 Results ....................................................................................................... 101
5.3.1 Chemistry ............................................................................................. 101
5.3.2 Physicochemical characterization ........................................................ 103
5.3.3 In vitro penetration studies ................................................................... 104
5.4 Discussion ................................................................................................. 110
5.5 Conclusion................................................................................................. 113
5.6 References ................................................................................................. 114
6 Final remarks .................................................................................................... 117
Acknowledgements .................................................................................................. 119

6
Preface
Pain is recognized as one of the most distressing cancer-related syndromes and treatment
side effects and is linked to decreased quality of life among patients. Despite the
improvements of pain management guidelines proposed in the last decades, therapeutic
issues are still unsolved, above all in the treatment of loco-regional painful symptoms.
For example, a proper pharmacological therapy to treat cisplatin-induced ototoxicity is
not currently available. Pain associated to cutaneous wounds is treated by an off-label use
of systemic analgesics with high incidence of related side effects. Conventional dosage
forms applied in the buccal cavity are unable to achieve suitable efficacy in the case of
oral mucositis.
Hence, there is a need to design novel drug delivery systems, which can be easily used in
the clinical practice for an effective treatment of loco-regional painful syndromes.
This doctoral thesis aimed to investigate the critical aspects of drug delivery correlated to
three loco-regional syndromes and propose technological solutions to rationalize drug
delivery. In particular, the experimental work focused on:
(1) the development of a mucoadhesive microparticle suspension intended for treating
oral mucositis and designed to combine the peculiarities of prolonged release
mucoadhesive systems with those of an immediate release oromucosal solution;
(2) the optimization of a biodegradable nanoparticle system intended to deliver
resveratrol to cochlea in the therapy of cisplatin-induced ototoxicity;
(3) the rationalization of the use of morphine derivatives, according to their chemical
structure, in the management of cutaneous painful syndromes.

General introduction
7
1 General introduction
The prevalence of cancer has been enlarged worldwide both for the increase of population
age and for the diffusion of unhealthy behavior (e.g., smoking). Moreover, the
development of effective cancer treatments has also increased the 5-year survival of
patients, since some cancer types have become chronic [1, 2]. Pain is one of the main
symptoms of cancer, especially in advanced and incurable states. Indeed, more than 50%
of all patients suffer for painful cancer-related syndromes [3]. Therefore, pain
management is the central goal of care to ensure an acceptable patient quality of life. The
etiology of pain is very wide: painful syndromes might be caused by cancer itself, cancer-
related symptoms, concurrent disorder or side effects related to anticancer treatments [4].
Furthermore, pain manifestations might be systemic or loco-regional.
The World Health Organization (WHO) has introduced specific guidance for palliative
care [4]. According to the WHO, “palliative care is an approach that improves the quality
of life of patients and their families facing the problem associated with life-threatening
illness, through the prevention and relief of suffering by means of early identification and
impeccable assessment and treatment of pain and other problems, physical, psychosocial
and spiritual” [5]. In order to achieve acceptable pain management, the WHO suggests
that clinical protocols should be based on a 3-step “analgesic ladder” [4]. The analgesic
drugs are chosen according to the scale of pain severity. NSAIDs are preferred for treating
mild pain, but moderate and severe pain requires potent analgesics as opioids. Although
good effectiveness in controlling acute and chronic pain, the onset of related side effects
(e.g., sedation, nausea, constipation and fatigue) negatively affects the risk-benefit
assessment of opioid-based treatments.
In general, available therapeutic strategies for systemic drug delivery have been based on
oral, transdermal and parenteral dosage forms (e.g., solutions, suspensions, tablets and
transdermal patches) [6]. For the management of loco-regional symptoms, the
development of locally acting drug products have also been developed and marketed.
However, many of them are liquid and semisolid dosage forms, which are not optimized
for drug absorption through physiological barriers such as buccal mucosa and skin. Even
if many analgesic drugs and dosage forms are available in the market, therapeutic failure

General introduction
8
has been widely reported in literature [7]. In many cases, undertreated pain has been
caused by low patient compliance and onset of drug side effects [8].
In particular, therapeutic failures are more frequent in the treatment of loco-regional
painful symptoms. On the top of that, pharmacological solutions were often absent, based
on off-label use of systemic analgesics or conventional dosage forms with unsatisfactory
bioavailability.
To improve the clinical effectiveness and patient’s compliance, the development of novel
drug delivery systems intended for specific locoregional drug delivery might be
challenging. For example, oral mucositis (OMs) are a critical side effect to treat. Induced
by chemo- or radiotherapy, OMs might affect oral intake, maintenance of oral hygiene
and quality of life of patient [9]. Many of the pharmacological treatments available on the
market are drug solutions or other immediate release dosage forms. Such dosage forms
might be ineffective for guaranteeing high drug bioavailability, since the short absorption
window due to the physiological swallowing. Consequently, clinical protocols require
high doses and regimen increasing the systemic side effect incidence.
On the other hand, Food and Drug Administration (FDA) and European Medicines
Agency (EMA) have not yet authorized drug products for preventing or treating the
ototoxicity induced by cisplatin [10]. Indeed, conventional dosage forms cannot
guarantee reproducible drug concentration at the active site, because of the small
distribution volume of cochlea.
Finally, cutaneous painful symptomatology (e.g., post herpetic neuralgia, cutaneous
lesions) are also critical. The discovery of opioid receptor in skin epidermis has increased
the off-label use of topical opioids [11]. However, the effectiveness of such treatments
has not been well demonstrated, especially for the empirical selection of drug and delivery
systems.
General introduction
9
1.1 Aim of the work
This doctoral thesis aimed to investigate and propose technological solutions for
rationalizing drug delivery in three cancer- and treatment-related syndromes. In
particular, the experimental work focused on: (1) the development of a mucoadhesive
formulation intended for prolonged drug absorption in the buccal cavity; (2) the
optimization of a nanoparticle system intended for drug delivery to cochlea; (3) the study
of influence of chemical structure on the dermal and transdermal delivery of morphine
derivatives. Such a rationalization was focused on identifying the best opioid candidate
for skin penetration among the morphine derivatives used in therapy.
1.1.1 Mucoadhesive mouthwash intended for the treatment of oral
mucositis induced by chemo- and radiotherapy
OMs are one of the side effects of anticancer treatment that badly affects the patient
quality of life [12]. Indeed, most of the drugs used in cancer chemotherapy are toxic for
rapidly dividing mucosal cells, thus inducing a loco-regional inflammation and epidermal
damage. In particular, OMs are generally associated with head and neck cancer chemo-
and radiotherapy. The overall incidence ranges from 40% to 76%. OMs induce pain,
limitations to oral intake, high incidence of secondary infection and risk of systemic
septicemia [13]. Therefore, several therapeutic protocol, including basic oral care
interventions [14], administration of anti-inflammatory agents [15], antimicrobials,
mucosal coating agents, anesthetics and analgesics [9], have been proposed for preventing
or treating OMs.
However, few of them have been proven efficacy in reducing the severity and duration of
OMs, since most of the clinical studies have been contradictory or carried out with
inadequate methodologies. Moreover, the selection of drug delivery systems has not been
rationalized according both the pharmacokinetic limitations of buccal cavity and the
patient’s compliance. For example, topical applied drug solutions (e.g., lidocaine
mouthwashes) were reported to ensure a very short-lived pain relief. On the other side,
the use of systemic analgesic drugs (e.g., fentanyl transdermal patch) is related to
systemic side effects.
The development of a prolonged release dosage forms might be useful to improve the
patient’s compliance and treatment efficacy. For an efficient drug delivery system, the
General introduction
10
adhesion to the mucous layer on the surface of buccal cavity should be carefully
considered to improve the drug absorption. The polymer selection is critical to achieve
suitable mucoadhesion, since it is a complex phenomenon that may be considered as the
result of electrostatic, Van de Waal’s interactions between polymer chain and mucosa
proteins (e.g., mucin) [16].
Therefore, prolonged release mouthwashes were designed by preparing mucoadhesive
microparticles in aqueous suspension (Chapter 2). The feasibility was investigated by
preparing different formulations containing three model drugs, namely clobetasol,
flurbiprofen and delmopinol. The formers were selected for their clinical effectiveness in
treating OMs and other inflammatory conditions of buccal cavity. Delmopinol was
chosen to verify the effectiveness of this technological platform as supportive treatment
for limiting secondary bacterial infection in OMs patients. The mucoadhesive
microparticles were made by spraying polymeric solutions containing the three model
drugs in a cross-linking bath. Alginates were used as functional excipient of
microparticles and bivalent cations were added as cross-linking agents [17]. Poly-
acrylates were added for increasing microparticle mucoadhesion. The effects of
microparticle composition and manufacturing parameters on in vitro performances of
clobetasol mucoadhesive mouthwash were evaluated using a full-factorial design
(Chapter 3). The ability of proposed technological platforms to improve the drug
penetration into the buccal mucosae were studied by a wash-off method [18]. The in vitro
ability to avoid and/or reduce the plaque development was also assayed in case of
delmopinol formulations.
1.1.2 Nano-delivery system intended for treating ototoxicity induced by
chemotherapeutic agents
Cisplatin is frequently used as chemotherapeutic agent for the treatment of several cancer
types. However, its clinical effectiveness has been correlated with severe side effects,
such as ototoxicity [10]. The ototoxic effect of cisplatin is particularly critical in children,
because of their higher susceptibility in comparison with adults [19]. In this case, the
ototoxicity might seriously prejudice speech skill, language and social development of
young patients [20]. For instance, great efforts have been devoted to understand the
mechanism of drug-induced ototoxicity and suggest some prevention strategies. In vivo

General introduction
11
and in vitro studies showed that cisplatin induces apoptosis in cochlear cell lines (e.g.,
hair cells, Strial Ganglion cells and Stria Vascularis cells) [21, 22], increasing the
intracellular concentration of reactive oxygen species [23]. Therefore, the efficacy of
several antioxidant agents have been tested after local and systemic delivery [24, 25].
Nonetheless, the simultaneous administration of some antioxidant agents (e.g., sodium
thiosulfate) decreased the therapeutic effect of cisplatin due to a direct molecular
interaction, thus limiting their systemic administration [10].
According to the peculiarity of the cochlear system, the development of a drug delivery
has been very challenging for pharmacokinetic issues after both systemic and local
administration. Indeed, the small dimension of the cochlea does not allow achieving
suitable drug concentrations in the target site without increasing its systemic doses. On
the other hand, the local delivery was affected by low drug bioavailability and high intra-
patient variability (e.g., tympanic delivery route). Moreover, high-specialized medical
devices and expertise are required for intra-tympanic or intra-cochlear drug delivery [26].
The recent improvements in nanotechnology could overcome the pharmacokinetic and
physicochemical drawbacks, thus delivering the drug directly to target tissues or cell
lines. Therefore, the properties of nanoparticle systems should be carefully selected
according to the therapeutic target. In particular, the nanoparticle morphology, the surface
properties, cellular uptake mechanism, the drug release profile should be deeply
investigated in order to optimize drug delivering and avoiding toxic effect induced by the
nanocarrier itself [27].
Resveratrol-loaded nanoparticles were developed and optimized to obtain nanoparticle
with reproducible morphology and high drug loading (Chapter 4). Since it was known
that freeze-drying process affects the physical stability of nanosystems [28], the effect of
well-known cryoprotectants was also evaluated. Finally, the toxicity of proposed
nanosystems was checked in vitro using a model of organ of Corti cells and a Stria
Vascularis one.

General introduction
12
1.1.3 Dermal and transdermal delivery of morphine derivatives: a
qualitative structure-penetration relationship
Opioids have been widely used for managing several kinds of acute and chronic painful
syndromes [29]. Their pharmacological action (e.g., central analgesia) or related side
effects (e.g., constipation) are related to the activation of G protein-coupled receptors
widely distributed in brain, spinal cord and digestive tract.
Recently, opioid receptors were also discovered in the human skin [30]. In addition to the
regulation of peripheral nociceptive signaling, cutaneous opioid receptors are involved in
the keratinocyte proliferation, differentiation and the pigmentation process. These
receptors might also modulate the immunity response of skin immune cells [31].
Therefore, recent clinical studies reported the efficacy of opioid in the treatment of
peripheral painful syndromes, such as post herpetic neuralgia [32], regeneration of
cutaneous lesions and pain controlling in wounds [33].
Although these cutaneous lesions are very painful, the use of potent analgesic is still
limited. Indeed, the systemic administration of opioids is complicated by the
unpredictable drug cutaneous bioavailability due to the inflammation process [34].
Therefore, topical opioids (e.g., morphine gels) have been widely studied for treating
cutaneous painful syndromes to guarantee high drug concentration at therapeutic site and
negligible systemic absorption [34]. However, their effectiveness has been strongly
affected by the drug ability to diffuse through the skin barrier [11]. In order to obtain a
local effect in the skin, morphine derivatives have to permeate through the stratum
corneum and concentrate in the viable epidermis.
Despite the increase of clinical interest, the cutaneous absorption of morphine and its
active derivatives has not been deeply investigated. Published studies are limited to
fentanyl [35, 36] and buprenorphine [37]. Moreover, the available literature reports that
morphine and its derivatives poorly permeated the human epidermis. According to the
results obtained by Roy et al., the in vitro flux of morphine, hydromorphone and codeine
was lower than 0.1 µg/cm2/h through human cadaver skin [38], where the fluxes fentanyl
and buprenorphine were 40-fold higher [39].
These evidences allowed speculating that small modifications on chemical structure of
morphine derivatives have a great influence on their permeation profiles. For example,

General introduction
13
the introduction of a methoxyl group induced a 15-fold increase in the permeation profile
of codeine in comparison with morphine [38]. Furthermore, Wang et al. suggested that
esterification of the hydroxyl group on morphine phenolic ring could improve the drug
permeation though nude/hairless mouse skin [40], because of an increase of drug
lipophilicity. In particular, most of the models used have demonstrated the correlation
between the drug lipophilicity (log P) and molecular weight to its diffusion through the
human skin [41]. However, such models lost robustness in describing the permeation of
a small dataset of molecules and other electrochemical descriptors have been proposed
[42]. Furthermore, the drug retention in the human skin has not been widely investigated.
On the best of our knowledge, only few authors tried modelling the skin retention of a
specific class of molecules, like corticosteroids [43, 44].
Considering the clinical need to find effective treatments for managing loco-regional
painful syndromes and for avoiding systemic side effect, the influence of chemical
structure of eight well-known morphine derivatives was evaluated in terms of skin
permeation and retention (Chapter 5). Statistical analyses were carried out to test the
effect of four substituents (i.e., 3-methoxyl, 6-carbonyl, 14-hydroxyl, 7,8-didehydro) on
molecule penetration through human epidermis.

General introduction
14
1.2 References
[1] Sedjo, R. L., Byers, T., Barrera, E., Jr., Cohen, C., Fontham, E. T., Newman, L. A., Runowicz, C. D.,
Thorson, A. G., Thun, M. J., Ward, E., Wender, R. C., and Eyre, H. J., 2007, "A midpoint assessment of
the American Cancer Society challenge goal to decrease cancer incidence by 25% between 1992 and 2015,"
CA Cancer J. Clin., 57(6), pp. 326-340.
[2] Schottenfeld, D., Beebe-Dimmer, J. L., Buffler, P. A., and Omenn, G. S., 2013, "Current perspective on
the global and United States cancer burden attributable to lifestyle and environmental risk factors," Annu.
Rev. Public Health, 34, pp. 97-117.
[3] van den Beuken-van Everdingen, M. H., de Rijke, J. M., Kessels, A. G., Schouten, H. C., van Kleef,
M., and Patijn, J., 2007, "Prevalence of pain in patients with cancer: a systematic review of the past 40
years," Ann. Oncol., 18(9), pp. 1437-1449.
[4] WHO, 1996, Cancer Pain Relief: with a guide to opioid availability, Geneva.
[5] WHO, 2013, "WHO definition of palliative care," http://www.who.int/cancer/palliative/definition/en/.
[6] Comerford, D., 2008, "Techniques of opioid administration," Anaesthesia & Intensive Care Medicine,
9(1), pp. 21-26.
[7] Deandrea, S., Montanari, M., Moja, L., and Apolone, G., 2008, "Prevalence of undertreatment in cancer
pain. A review of published literature," Ann. Oncol., 19(12), pp. 1985-1991.
[8] Zuccaro, S., Vellucci, R., Sarzi-Puttini, P., Cherubino, P., Labianca, R., and Fornasari, D., 2012,
"Barriers to Pain Management," Clin. Drug Investig., 32(1), pp. 11-19.
[9] Saunders, D. P., Epstein, J. B., Elad, S., Allemano, J., Bossi, P., van de Wetering, M. D., Rao, N. G.,
Potting, C., Cheng, K. K., Freidank, A., Brennan, M. T., Bowen, J., Dennis, K., and Lalla, R. V., 2013,
"Systematic review of antimicrobials, mucosal coating agents, anesthetics, and analgesics for the
management of oral mucositis in cancer patients," Support. Care Cancer, 21(11), pp. 3191-3207.
[10] Rybak, L. P., Whitworth, C. A., Mukherjea, D., and Ramkumar, V., 2007, "Mechanisms of cisplatin-
induced ototoxicity and prevention," Hear. Res., 226(1–2), pp. 157-167.
[11] Farley, P., 2011, "Should topical opioid analgesics be regarded as effective and safe when applied to
chronic cutaneous lesions?," J. Pharm. Pharmacol., 63(6), pp. 747-756.
[12] Raber-Durlacher, J. E., Weijl, N. I., Abu Saris, M., de Koning, B., Zwinderman, A. H., and Osanto,
S., 2000, "Oral mucositis in patients treated with chemotherapy for solid tumors: a retrospective analysis
of 150 cases," Support. Care Cancer, 8(5), pp. 366-371.
[13] Sonis, S. T., 1998, "Mucositis as a biological process: a new hypothesis for the development of
chemotherapy-induced stomatotoxicity," Oral Oncol., 34(1), pp. 39-43.
[14] McGuire, D. B., Fulton, J. S., Park, J., Brown, C. G., Correa, M. E., Eilers, J., Elad, S., Gibson, F.,
Oberle-Edwards, L. K., Bowen, J., and Lalla, R. V., 2013, "Systematic review of basic oral care for the
management of oral mucositis in cancer patients," Support. Care Cancer, 21(11), pp. 3165-3177.
[15] Nicolatou-Galitis, O., Sarri, T., Bowen, J., Di Palma, M., Kouloulias, V. E., Niscola, P., Riesenbeck,
D., Stokman, M., Tissing, W., Yeoh, E., Elad, S., and Lalla, R. V., 2013, "Systematic review of anti-
inflammatory agents for the management of oral mucositis in cancer patients," Support. Care Cancer,
21(11), pp. 3179-3189.
[16] Gu, J. M., Robinson, J. R., and Leung, S. H., 1988, "Binding of acrylic polymers to mucin/epithelial
surfaces: structure-property relationships," Crit. Rev. Ther. Drug Carrier Syst., 5(1), pp. 21-67.
[17] Chan, L., Jin, Y., and Heng, P., 2002, "Cross-linking mechanisms of calcium and zinc in production
of alginate microspheres," Int. J. Pharm., 242(1-2), pp. 255-258.
[18] Rao, K. V. R., and Buri, P., 1989, "A novel in situ method to test polymers and coated microparticles
for bioadhesion," Int. J. Pharm., 52(3), pp. 265-270.

General introduction
15
[19] Knight, K. R., Kraemer, D. F., and Neuwelt, E. A., 2005, "Ototoxicity in children receiving platinum
chemotherapy: underestimating a commonly occurring toxicity that may influence academic and social
development," J. Clin. Oncol., 23(34), pp. 8588-8596.
[20] Ruggiero, A., Trombatore, G., Triarico, S., Arena, R., Ferrara, P., Scalzone, M., Pierri, F., and Riccardi,
R., 2013, "Platinum compounds in children with cancer: toxicity and clinical management," Anticancer
Drugs, 24(10), pp. 1007-1019.
[21] Sluyter, S., Klis, S. F., de Groot, J. C., and Smoorenburg, G. F., 2003, "Alterations in the stria
vascularis in relation to cisplatin ototoxicity and recovery," Hear. Res., 185(1-2), pp. 49-56.
[22] Alam, S. A., Ikeda, K., Oshima, T., Suzuki, M., Kawase, T., Kikuchi, T., and Takasaka, T., 2000,
"Cisplatin-induced apoptotic cell death in Mongolian gerbil cochlea," Hear. Res., 141(1–2), pp. 28-38.
[23] Dehne, N., Lautermann, J., Petrat, F., Rauen, U., and de Groot, H., 2001, "Cisplatin ototoxicity:
involvement of iron and enhanced formation of superoxide anion radicals," Toxicol. Appl. Pharmacol.,
174(1), pp. 27-34.
[24] Rybak, L. P., Whitworth, C., and Somani, S., 1999, "Application of antioxidants and other agents to
prevent cisplatin ototoxicity," Laryngoscope, 109(11), pp. 1740-1744.
[25] Wimmer, C., Mees, K., Stumpf, P., Welsch, U., Reichel, O., and Suckfull, M., 2004, "Round window
application of D-methionine, sodium thiosulfate, brain-derived neurotrophic factor, and fibroblast growth
factor-2 in cisplatin-induced ototoxicity," Otol. Neurotol., 25(1), pp. 33-40.
[26] Swan, E. E. L., Mescher, M. J., Sewell, W. F., Tao, S. L., and Borenstein, J. T., 2008, "Inner ear drug
delivery for auditory applications," Adv. Drug Deliv. Rev., 60(15), pp. 1583-1599.
[27] FDA, 2011, "Investigation of Potential Toxic Effects of Engineered Nanoparticles and Biologic
Microparticles in Blood and Their Biomarker Applications,"
http://www.fda.gov/BiologicsBloodVaccines/ScienceResearch/BiologicsResearchAreas/ucm127045.htm.
[28] Abdelwahed, W., Degobert, G., Stainmesse, S., and Fessi, H., 2006, "Freeze-drying of nanoparticles:
formulation, process and storage considerations," Adv. Drug Deliv. Rev., 58(15), pp. 1688-1713.
[29] Barnett, M., 2001, "Alternative opioids to morphine in palliative care: A review of current practice
and evidence," Postgrad. Med. J., 77(908), pp. 371-378.
[30] Bigliardi, P. L., Tobin, D. J., Gaveriaux-Ruff, C., and Bigliardi-Qi, M., 2009, "Opioids and the skin –
where do we stand?," Exp. Dermatol., 18(5), pp. 424-430.
[31] Stein, C., and Küchler, S., 2012, "Non-analgesic effects of opioids: Peripheral opioid effects on
inflammation and wound healing," Curr. Pharm. Des., 18(37), pp. 6053-6069.
[32] Philip, A., and Thakur, R., 2011, "Post herpetic neuralgia," J. Palli. Med., 14(6), pp. 765-773.
[33] Graham, T., Grocott, P., Probst, S., Wanklyn, S., Dawson, J., and Gethin, G., 2013, "How are topical
opioids used to manage painful cutaneous lesions in palliative care? A critical review," PAIN, 154(10), pp.
1920-1928.
[34] LeBon, B., Zeppetella, G., and Higginson, I. J., 2009, "Effectiveness of Topical Administration of
Opioids in Palliative Care: A Systematic Review," J. Pain Symptom Manage., 37(5), pp. 913-917.
[35] Roy, S. D., and Flynn, G. L., 1990, "Transdermal delivery of narcotic analgesics: pH, anatomical, and
subject influences on cutaneous permeability of fentanyl and sufentanil," Pharm. Res., 7(8), pp. 842-847.
[36] Lane, M. E., 2013, "The transdermal delivery of fentanyl," Eur. J. Pharm. Biopharm., 84(3), pp. 449-
455.
[37] Stinchcomb, A. L., Paliwal, A., Dua, R., Imoto, H., Woodard, R. W., and Flynn, G. L., 1996,
"Permeation of buprenorphine and its 3-alkyl-ester prodrugs through human skin," Pharm. Res., 13(10),
pp. 1519-1523.
[38] Roy, S. D., and Flynn, G. L., 1989, "Transdermal delivery of narcotic analgesics: Comparative
permeabilities of narcotic analgesics through human cadaver skin," Pharm. Res., 6(10), pp. 825-832.
General introduction
16
[39] Roy, S. D., Roos, E., and Sharma, K., 1994, "Transdermal delivery of buprenorphine through cadaver
skin," J. Pharm. Sci., 83(2), pp. 126-130.
[40] Wang, J.-J., Sung, K. C., Huang, J.-F., Yeh, C.-H., and Fang, J.-Y., 2007, "Ester prodrugs of morphine
improve transdermal drug delivery: a mechanistic study," J. Pharm. Pharmacol., 59(7), pp. 917-925.
[41] Potts, R. O., and Guy, R. H., 1992, "Predicting skin permeability," Pharm. Res., 9(5), pp. 663-669.
[42] Abraham, M. H., Chadha, H. S., and Mitchell, R. C., 1995, "The Factors that Influence Skin Penetration
of Solutes," J. Pharm. Pharmacol., 47(1), pp. 8-16.
[43] Roberts, M. S., Cross, S. E., and Anissimov, Y. G., 2004, "Factors affecting the formation of a skin
reservoir for topically applied solutes," Skin Pharmacol. Physiol., 17(1), pp. 3-16.
[44] Cross, S. E., and Roberts, M. S., 2008, "Use of in vitro human skin membranes to model and predict
the effect of changing blood flow on the flux and retention of topically applied solutes," J. Pharm. Sci.,
97(8), pp. 3442-3450.

Chapter 2
17
2 A novel oromucosal prolonged
release mucoadhesive suspension by
one step spray coagulation method
Chapter 2
18
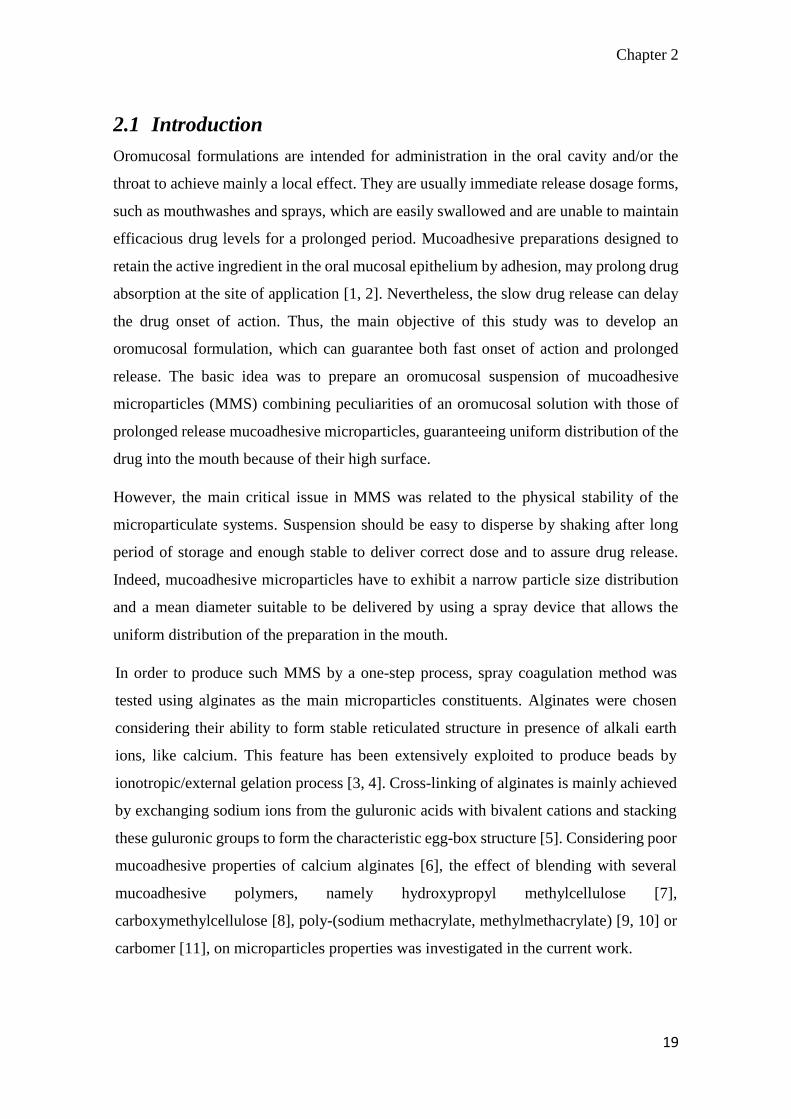
2.0 Abstract
An oromucosal suspension of mucoadhesive microparticles (MMS) able to combine the
peculiarities of prolonged release mucoadhesive microparticles with those of an
immediate release oromucosal solution is described. Microparticles were obtained by
ionotropic gelation of alginate blended with another mucoadhesive material in a one-step
process where the cross-linking bath constituted the suspension vehicle. The effects of
formulation and processing conditions on MMS performances were measured in vitro
determining the enhancement of drug penetration in buccal porcine mucosa and inhibition
of tooth plaque formation using flurbiprofen and delmopinol as model drugs,
respectively. Well-formed and spherical microparticles were obtained combining alginate
with carbomer; linear dependence of particle size from the feed composition, viscosity
and atomization pressure was found. As demonstrated by using FITC-labelled
microparticles, the system remained onto the buccal mucosa at least for a six-hour period.
Consequently, 0.1% flurbiprofen MMS guaranteed a concentration of flurbiprofen into
buccal porcine mucosa over 6 hours comparable to 0.25% flurbiprofen reference solution,
allowing a potential reduction of the 60% administered dose. The use of in-house made
artificial mouth revealed that the once-a-day administration of 0.1% delmopinol MMS
was as effective in plaque inhibition as the 0.2% delmopinol reference solution product
given twice a day. These results suggested that the development of bioadhesive
oromucosal suspensions, localizing the drug into buccal cavity, can reduce regimen and
administrated dose.
The formulative studies were carried out in the laboratory directed by prof. Luisa Montanari,
Department of Pharmaceutical Sciences, University of Milan, via G. Colombo, 71 – 20133, Milan
(Italy).
The in vitro evaluation of plaque development was carried out by in the laboratory directed by
dr. Cristiano Rumio, Department of Medical Biotechnology and Translational Medicine,
Humanitas Clinical and Research Center, via Manzoni, 56 – 20089, Rozzano (Italy)
The contents of this chapter was published in Current Drug Delivery (Cilurzo et al.; Cur. Drug.
Del.; 2013, 10, 251-260)
Chapter 2
19
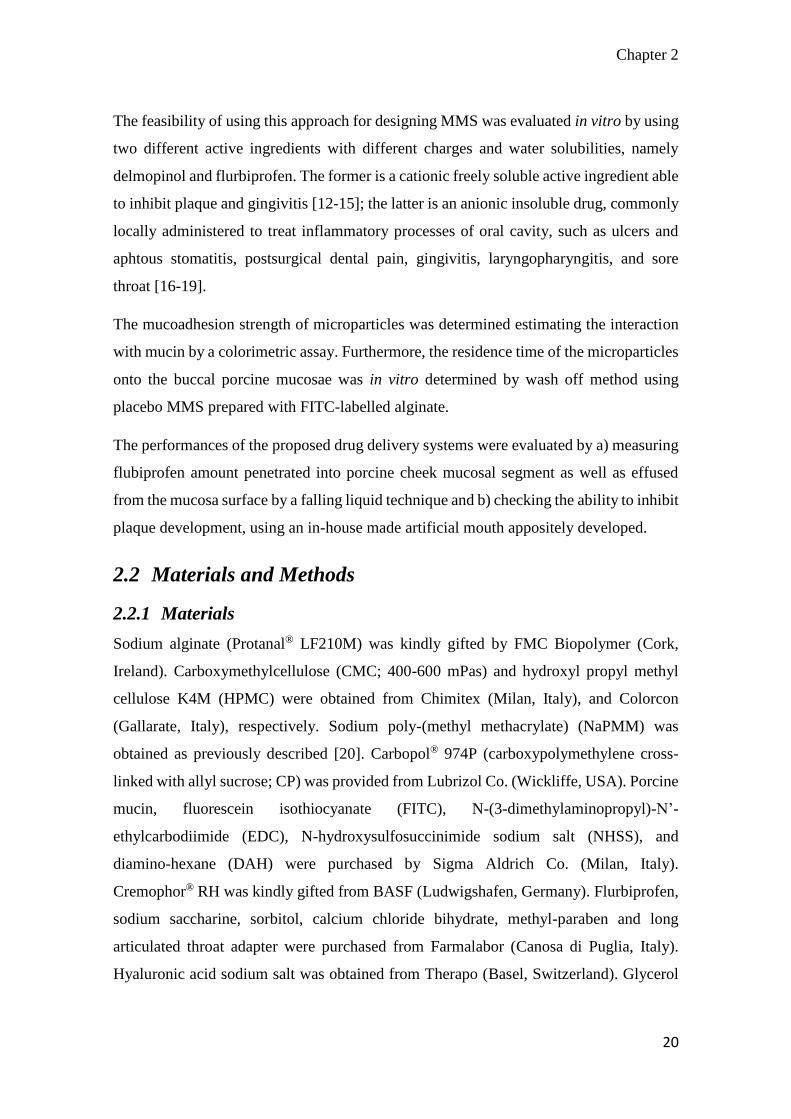
2.1 Introduction
Oromucosal formulations are intended for administration in the oral cavity and/or the
throat to achieve mainly a local effect. They are usually immediate release dosage forms,
such as mouthwashes and sprays, which are easily swallowed and are unable to maintain
efficacious drug levels for a prolonged period. Mucoadhesive preparations designed to
retain the active ingredient in the oral mucosal epithelium by adhesion, may prolong drug
absorption at the site of application [1, 2]. Nevertheless, the slow drug release can delay
the drug onset of action. Thus, the main objective of this study was to develop an
oromucosal formulation, which can guarantee both fast onset of action and prolonged
release. The basic idea was to prepare an oromucosal suspension of mucoadhesive
microparticles (MMS) combining peculiarities of an oromucosal solution with those of
prolonged release mucoadhesive microparticles, guaranteeing uniform distribution of the
drug into the mouth because of their high surface.
However, the main critical issue in MMS was related to the physical stability of the
microparticulate systems. Suspension should be easy to disperse by shaking after long
period of storage and enough stable to deliver correct dose and to assure drug release.
Indeed, mucoadhesive microparticles have to exhibit a narrow particle size distribution
and a mean diameter suitable to be delivered by using a spray device that allows the
uniform distribution of the preparation in the mouth.
In order to produce such MMS by a one-step process, spray coagulation method was
tested using alginates as the main microparticles constituents. Alginates were chosen
considering their ability to form stable reticulated structure in presence of alkali earth
ions, like calcium. This feature has been extensively exploited to produce beads by
ionotropic/external gelation process [3, 4]. Cross-linking of alginates is mainly achieved
by exchanging sodium ions from the guluronic acids with bivalent cations and stacking
these guluronic groups to form the characteristic egg-box structure [5]. Considering poor
mucoadhesive properties of calcium alginates [6], the effect of blending with several
mucoadhesive polymers, namely hydroxypropyl methylcellulose [7],
carboxymethylcellulose [8], poly-(sodium methacrylate, methylmethacrylate) [9, 10] or
carbomer [11], on microparticles properties was investigated in the current work.
Chapter 2
20
The feasibility of using this approach for designing MMS was evaluated in vitro by using
two different active ingredients with different charges and water solubilities, namely
delmopinol and flurbiprofen. The former is a cationic freely soluble active ingredient able
to inhibit plaque and gingivitis [12-15]; the latter is an anionic insoluble drug, commonly
locally administered to treat inflammatory processes of oral cavity, such as ulcers and
aphtous stomatitis, postsurgical dental pain, gingivitis, laryngopharyngitis, and sore
throat [16-19].
The mucoadhesion strength of microparticles was determined estimating the interaction
with mucin by a colorimetric assay. Furthermore, the residence time of the microparticles
onto the buccal porcine mucosae was in vitro determined by wash off method using
placebo MMS prepared with FITC-labelled alginate.
The performances of the proposed drug delivery systems were evaluated by a) measuring
flubiprofen amount penetrated into porcine cheek mucosal segment as well as effused
from the mucosa surface by a falling liquid technique and b) checking the ability to inhibit
plaque development, using an in-house made artificial mouth appositely developed.
2.2 Materials and Methods
2.2.1 Materials
Sodium alginate (Protanal® LF210M) was kindly gifted by FMC Biopolymer (Cork,
Ireland). Carboxymethylcellulose (CMC; 400-600 mPas) and hydroxyl propyl methyl
cellulose K4M (HPMC) were obtained from Chimitex (Milan, Italy), and Colorcon
(Gallarate, Italy), respectively. Sodium poly-(methyl methacrylate) (NaPMM) was
obtained as previously described [20]. Carbopol® 974P (carboxypolymethylene cross-
linked with allyl sucrose; CP) was provided from Lubrizol Co. (Wickliffe, USA). Porcine
mucin, fluorescein isothiocyanate (FITC), N-(3-dimethylaminopropyl)-N’-
ethylcarbodiimide (EDC), N-hydroxysulfosuccinimide sodium salt (NHSS), and
diamino-hexane (DAH) were purchased by Sigma Aldrich Co. (Milan, Italy).
Cremophor® RH was kindly gifted from BASF (Ludwigshafen, Germany). Flurbiprofen,
sodium saccharine, sorbitol, calcium chloride bihydrate, methyl-paraben and long
articulated throat adapter were purchased from Farmalabor (Canosa di Puglia, Italy).
Hyaluronic acid sodium salt was obtained from Therapo (Basel, Switzerland). Glycerol
Chapter 2
21
was purchased from Carlo Erba Reagenti (Milan, Italy). Mint flavor was kindly gifted by
Kerry Group (Tralee, Ireland). Delmopinol hydrochloride was kindly obtained from
Sinclair Pharma S.r.l. (Milan, Italy). All solvents were of analytical grade unless
specified.
2.2.2 Preparation of FITC-labelled alginate
The alginate-FITC derivative was synthesized adapting a process previously described in
literature [21]. Briefly, 12 g sodium alginate solution 1% w/w were mixed in 1.5 mL pH
4.9 sodium acetic buffer and mixed with 50 mg EDC and 30 mg NHSS for 30 min; then
60 mg DAH were added and the system was stirred for 4 h. Finally, 12 mL isopropanol
were added to the blend to remove the excess of DAH and precipitate the alginate-amine
derivative. The latter was reacted with 14.03 mg FITC in pH 9 sodium bicarbonate for 4
h and precipitated with 5 mL acetone. Alginate-FTIC was assayed by an HPLC coupled
with a spectrofluorimeter (HP 1100 ChemStations, Agilent, Santa Clara, USA) using a
SEC column (BioSuit 125, 4 µm UHR SEC 4.6x300 mm, Waters Co., Dublin, Ireland)
to assure the absence of unreacted FITC and/or FITC-labelled alginate degraded by the
reaction process.
2.2.3 Preparation of oromucosal microparticle suspension
In order to evaluate the influence of formulation variables and experimental parameters,
placebo MMS were preliminarily prepared starting from mixtures of alginate and several
mucoadhesive polymers. The feed was made mixing aqueous dispersion of sodium
alginate and secondary mucoadhesive polymer in 3:1 ratio. The best feed in terms of
microparticles formation was remade according to the ratios reported in Table 2.1.
Afterwards, feed was pumped at the rate of 15 mL/min into a standard two-way nozzle
(0.8 mm inner diameter, Schlick Atomizing Technologies, Düsen-Schlick GmbH,
Untersiemau, Germany) and sprayed into a 2% w/w calcium chloride solution, under
magnetic stirring. The air pressure ranged from 450 mbar to 550 mbar. Microparticles
were cured into the cross-linking bath for 1 h at room temperature before filtering
throughout a 710 µm sieve. The final placebo MMS were stored in 50 mL blue PE bottle
at 25°C until use. Drug-loaded MMS were similarly prepared. Since cross-linking baths
constituted product vehicles, all constituents, including active ingredients, were dissolved

Chapter 2
22
before spraying (Table 2.1). In the control formulations D0a, D0b and F0 (Table 2.1),
microparticles and cross-linking agent were not present.
2.2.4 Viscosity measurements
The feed viscosity was determined using a rotational viscometer (HAAKE VT500,
Gemini B.V., Apeldoorn, Netherlands) equipped with a recirculating bath to maintain
sample at 20.0±0.1 °C. The sample temperature in the rheometer was stabilized 15 min
before taking the measurement. The shear rate (D) was in the 0-300 s-1 range.
Reproducibility of the data was assessed in triplicate. The obtained rheograms were
analyzed and adjusted to the Ostwald model, then the viscosity () was calculated at D =
250 s-1.
2.2.5 Determination of microparticle size
The particle size of suspension (1 mL) was measured by an Accusizer 770 granulometer
(PSS Inc., Santa Barbara, USA). Particle size was expressed as undersize cumulative
percentages and the population dispersion was referred as SPAN and calculated as
reported in the Eq. 2.1:
𝑆𝑃𝐴𝑁 =𝑑90−𝑑10
𝑑50 Eq. 2.1
where d90, d10, and d50 are the mean diameters at the 90%, 10% and 50% of the population
distribution, respectively.
2.2.6 Uniformity of Mass Delivered
The uniformity of mass delivered from the device was assayed according to the Ph. Eur.
method (2.9.27). Moreover, since a variation in the amount of delivered microparticles
might cause differences in the drug release, the number of microparticles suspended in
aliquots of 10 mL and 20 mL were also counted by an Accusizer 770 granulometer (PSS
Inc., Santa Barbara, USA). The results were expressed as the mean of three
determinations.
Chapter 2
23
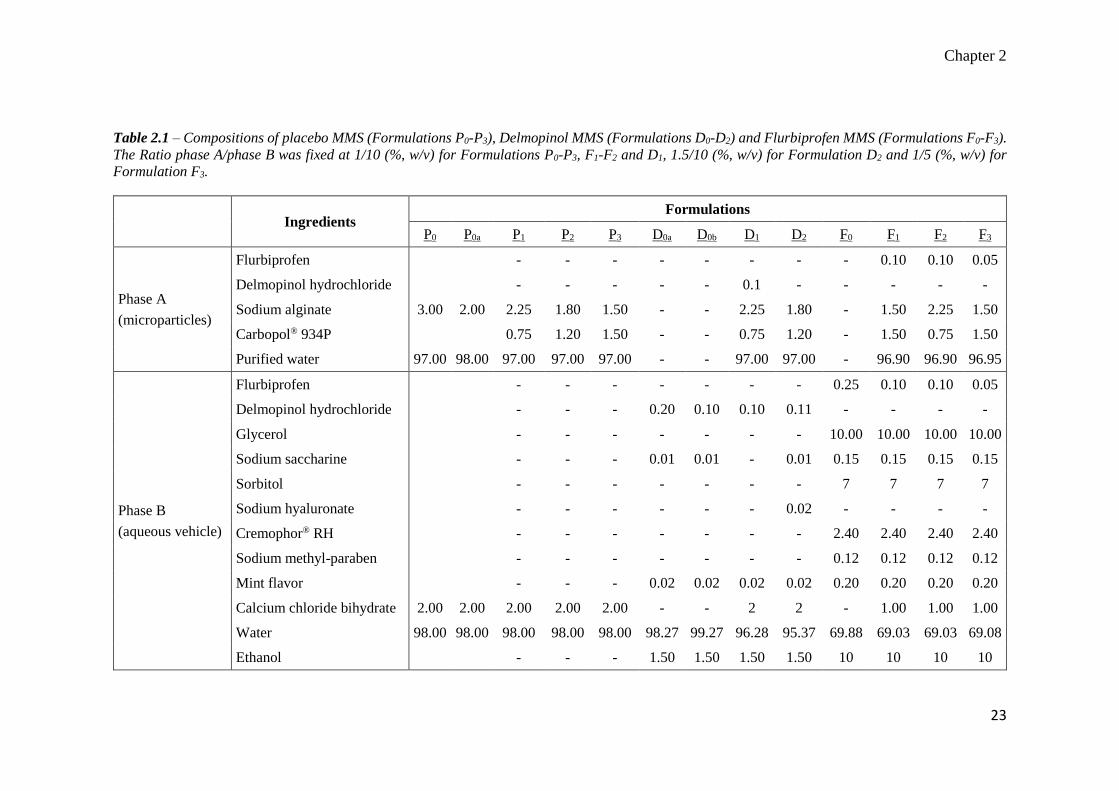
Table 2.1 – Compositions of placebo MMS (Formulations P0-P3), Delmopinol MMS (Formulations D0-D2) and Flurbiprofen MMS (Formulations F0-F3).
The Ratio phase A/phase B was fixed at 1/10 (%, w/v) for Formulations P0-P3, F1-F2 and D1, 1.5/10 (%, w/v) for Formulation D2 and 1/5 (%, w/v) for
Formulation F3.
Ingredients
Formulations
P0 P0a P1 P2 P3 D0a D0b D1 D2 F0 F1 F2 F3
Phase A
(microparticles)
Flurbiprofen - - - - - - - - 0.10 0.10 0.05
Delmopinol hydrochloride - - - - - 0.1 - - - - -
Sodium alginate 3.00 2.00 2.25 1.80 1.50 - - 2.25 1.80 - 1.50 2.25 1.50
Carbopol® 934P 0.75 1.20 1.50 - - 0.75 1.20 - 1.50 0.75 1.50
Purified water 97.00 98.00 97.00 97.00 97.00 - - 97.00 97.00 - 96.90 96.90 96.95
Phase B
(aqueous vehicle)
Flurbiprofen - - - - - - - 0.25 0.10 0.10 0.05
Delmopinol hydrochloride - - - 0.20 0.10 0.10 0.11 - - - -
Glycerol - - - - - - - 10.00 10.00 10.00 10.00
Sodium saccharine - - - 0.01 0.01 - 0.01 0.15 0.15 0.15 0.15
Sorbitol - - - - - - - 7 7 7 7
Sodium hyaluronate - - - - - - 0.02 - - - -
Cremophor® RH - - - - - - - 2.40 2.40 2.40 2.40
Sodium methyl-paraben - - - - - - - 0.12 0.12 0.12 0.12
Mint flavor - - - 0.02 0.02 0.02 0.02 0.20 0.20 0.20 0.20
Calcium chloride bihydrate 2.00 2.00 2.00 2.00 2.00 - - 2 2 - 1.00 1.00 1.00
Water 98.00 98.00 98.00 98.00 98.00 98.27 99.27 96.28 95.37 69.88 69.03 69.03 69.08
Ethanol - - - 1.50 1.50 1.50 1.50 10 10 10 10

Chapter 2
24
2.2.7 Mucoadhesive properties
The mucoadhesive properties of placebo and drug-loaded microparticles were determined
after filtering MMS through a 90 μm sieve. Aliquots of 100 mg microparticles were
suspended in 2.5 mL purified water. Afterwards, same volume of 0.05% w/v mucin
solution was added. Samples were shaken at 100 rpm for 5 min in a shaker incubator
(Sartorius Stedim, Antella, Italy) at 371 °C and then centrifuged at 1000 × g by a Hettich
Universal centrifuge 30F (Andreas Hettich GmbH & Co. KG, Tuttlingen, Germany).
After discharging the supernatant, 5 mL fresh purified water was added to each tube to
remove mucin not adsorbed on the microparticle surface. This water was discharged and
the microparticles were re-suspended in 2.5 mL deionized water. Aliquots of each
suspension (200 μL) were incubated for 30 min at 371 °C by using a micro BCA Protein
Assay Reagent (Euroclone, Pero, Italy) following a method adapted from Shi and
Caldwell [22]. The amount of bound mucin was determined by spectrophotometer at the
wavelength of 562 nm (DU®-640 spectrophotometer, Beckman Coulter, Brea, USA).
2.2.8 Drug content
Microparticles recovered by filtration through a 0.45 μm membrane were washed with
methanol to remove the drug absorbed on their surface and dried at room temperature till
constant weight. 50 mg samples were digested in 10 mL 5% w/v sodium chloride
solution/methanol (50/50 %, v/v) under sonication for 2 h. Then, samples were filtered
and the contents of flurbiprofen and delmopinol were determined using the HPLC
methods reported below. The drug content of the aqueous vehicle was also determined
after dilution 1:10 with water.
2.2.9 HPLC assay
The drug content in microparticles and vehicles was determined by an HP 1100
Chemstations (Agilent, Santa Clara, USA). The results were expressed as mean of three
determinations. The experimental conditions were set up in order to avoid interferences
of the other components.
Flurbiprofen - Column: Symmetry ShieldTM, ODS HYPERSIL, 100 x 4.6 mm ID,
particle size 3 μm (Waters Co., Dublin, Ireland); mobile phase: methanol/pH 2.5 0.01 M
Na2HPO4 (66/34 %, v/v);. flow rate: 1.2 mL/min; temperature: 40°C wavelength: 254
Chapter 2
25
nm; injection volume: 10 μL; retention time: 4 min. The standard curve was constructed
in the concentration range from 0.05 to 50 μg/mL (R2 = 0.99999).
Delmopinol - Column: Symmetry ShieldTM RPC-18, 150 x 4.6 mm ID, particle size 5
μm (Waters Co., Dublin, Ireland); mobile phase: methanol/pH 7.0 PBS (80/20 %, v/v);
flow rate: 1 mL/min; wavelength: 210 nm; temperature: 25°C; injection volume: 10 μL;
retention time: 5 min. The standard curve was constructed in the concentration range from
15 to 500 μg/mL (R2 = 0.99921).
2.2.10 In vitro drug release
The release profile of flurbiprofen from microparticles was determined using the USP 26
paddle dissolution apparatus, using 500 mL of PH 6.4 PBS at 37.0±0.5 °C and 25 rpm.
MMS was filtered in order to remove suspension medium and washed with fresh water.
Samples of microparticles were exactly weighed to achieve an amount of flurbiprofen
corresponding to 50 mg. Drug concentration in the release medium was determined at
249 nm.
The results were expressed as mean of three samples. In order to understand drug release
mechanism, release profiles were fitted with the Higuchi model (Eq. 2.2).
𝑀𝑡 𝑀∞⁄ = 𝐾𝑡1 2⁄ Eq. 2.2
where Mt was the amount of drug released at time t, M∞ was the drug loading in the
microparticles, and K was the release rate constant expressed as h-1 [23].
2.2.11 In vitro mucosa penetration study
The in vitro mucosa penetration study was performed adapting the falling liquid technique
described by Rao and Buri [24] by using fresh porcine cheek mucosa obtained by a local
slaughterhouse. Specimens of mucosa were dipped in pH 7.4 PBS at 70°C for 1 min in
order to isolate mucosa epithelium.
In-house equipment of three components was built up: (a) six in-series mucosa supports
set at an acute angle of 30°; (b) peristaltic pump and (c) collector of fractions. Apparatus
was designed in order to mimic both the effusion of the preparations from the surface of
buccal mucosa and flurbiprofen penetrated amount.

Chapter 2
26
A dose of the selected MMS was sprayed twice onto a 2.5x1.0 cm mucosal surface
corresponding to a total amount of about 40 mg. Then, porcine cheek epithelium
membrane was placed on the sample support and pH 6.4 PBS was dropped at the rate of
1 mL/min to simulate the buccal environment and the saliva swallowing.
This system was used either for qualitatively estimating the residence time of
microparticles onto the buccal mucosa by testing MMS, made with 30% of FTIC-labelled
alginate, or determining the penetration of flurbiprofen in the porcine cheek epithelium
membrane. In the former case, porcine sample sheet was dismounted at predetermined
intervals of time and fluorescent microparticles applied onto the mucosa segments were
observed by using an Eclipse 80i Microscope (Nikon Instruments S.p.A, Firenze, Italy).
In the case of flurbiprofen formulations, portions of the effused buffer were collected at
predetermined intervals and drug concentration was determined by HPLC.
At predefined times (i.e., 1, 3 and 6 h), the applied test sample was peeled away by means
of an adhesive tape strip and the mucosa was stored at -40°C for 24 h. Finally, mucosa
samples were homogenized and the amount of the penetrated drug was extracted with 5
mL methanol and assayed.
2.2.12 In vitro evaluation of plaque development
In order to investigate antiplaque efficacy of different formulations, an in vitro system
called “artificial mouth”, assuring high standardization and repeatability, was developed.
This testing system was composed by an array of six glass holding intact human grinders
reassembling in independent artificial oral cavities. The artificial oral cavities were
surrounded by thermostated jacket at 351 °C. The upper part of the artificial oral cavity
was firmly closed by a lid equipped with three atomizers connected to working solutions
which acted as drop collectors for bacterial suspension and the testing product. The
functionality of each atomizer was independently programmable. Each artificial oral
cavity was equipped with a discharge system for the rinsing liquids. Prior insertion in the
artificial mouth to use, each tooth was thoroughly cleaned with a rubber cup and pumice,
immersed in physiologic solution and sterilized by saturated steam under pressure at
121°C for 15 min.
Chapter 2
27
At the beginning of the experiments, sterilized teeth were inserted into the artificial
mouth. The drop collectors for bacteria suspension and the test solution were adjusted at
a position of 8 cm straight above the tooth specimen. The solutions of tested plaque-
inhibiting compounds were supplied (6 mL/dose) onto the tooth specimen once a day over
a 10 day period. For guaranteeing formation and development of plaque, it was essential
that any contamination occurred. Therefore, equipment coming into direct contact with
the bacterial suspension, nutrient broth or tooth specimen were sterilized and all
procedures were carried out in aseptic conditions. Moreover, a standard protocol was
established for the sterilization of artificial oral cavities at the beginning and the end of
each testing. Soft plaque collected from healthy human subjects was cultured in a nutrient
broth and bacteria were harvested in the logarithmic growth phase. The nutrient broth
containing bacteria was used at a bacterial density of 106-107 cells/mL. The suspension
of bacteria was supplied onto the tooth specimen at a flow rate of 5 mL/h over a 10-day
period, at 5 s per hour, once an hour. The suspension of bacteria was daily tested for pH
and number of cells per volume unit. During the experimental procedure, the suspension
of bacteria was kept at 41 °C under continuous stirring to avoid undesired bacterial
growth.
At the end of the testing period (10 days), the plaque formed on the tooth surface was
stained with 0.05% w/v basic fuchsine. To estimate plaque-inhibiting effect of the tested
product, the amount of plaque formed on the tooth surfaces was quantified according to
a Visual Index as well as a semi-automatic image analyzer (NAIS Elements) on defined
area of the tooth surface.
The Visual Index was made up by the following scale:
0: no plaque formation;
1: slight plaque formation, when less than 1/3 of the tooth surface was covered by
plaque;
2: moderate plaque formation, when 1/3-2/3 of the tooth surface was covered by
plaque;
3: heavy plaque formation, when more then 2/3 of the tooth surface was covered by
plaque.
Chapter 2
28
In addition, the percentage of the tooth surface covered by plaque was calculated by
computerized planimetric measurements and the plaque inhibiting effect of the tested
substance was classified as following:
very good: less than 10% tooth surface covered by plaque;
good: 10-20 % tooth surface covered by plaque;
moderate: 20-50 % tooth surface covered by plaque
slight: 50-80 % tooth surface covered by plaque;
no effect: more than 80% tooth surface covered by plaque.
To assess ability to the reduce plaque formation, following formulations were tested:
formulation D0a (the conventional solution containing 0.2% w/w delmopinol as the
marketed product), D0b (the conventional solution of delmopinol at the same
concentration as the MMS) and D2 (0.1% w/w delmopinol MMS) (Table 2.1). Sterile
water was also supplied onto control tooth specimens for comparison with plaque
inhibitors-treated teeth.
2.2.13 Preliminary evaluation of MMS stability
The stability of drug-loaded MMS was investigated over six months in terms of re-
suspendability, pH of aqueous vehicle and drug content. Volumes of 100 mL of the
Formulations D2 and F1 were filled in 120 mL blue polyethylene terephthalate bottles and
stored at 25°C/60 % and 40°C/75 % relative humidity (RH).
2.3 Results
2.3.1 Preparation of oromucosal mucoadhesive suspensions
Spraying alginate/NaPMM mixtures into the aqueous vehicle containing CaCl2,
formation of irregular and solid particles occurred probably due to the strong interaction
between NaPMM and calcium ions [25]. The suspension of microparticles made of
CMC/alginate and HPMC/alginate mixtures resulted not stable overtime, since
aggregation was evident after few days of storage.
Well-formed and spherical microparticles were obtained only combining alginate with
CP. Table 2.2 reports the feed viscosities and the particle size distribution of suspensions
Chapter 2
29
of designed formulations using such polymeric blends. Considering that obtained
microparticles should guarantee a prolonged drug release and be deployed from the
device by spraying, SPAN and d90 were considered the most critical parameters to
evaluate in particle size distribution. As far as the former parameter was concerned, the
atomization of the feed, during the preparation process, at 550 mbar allowed lower values
and narrower particle size distribution than 450 mbar; increasing atomization pressure up
to 550 mbar did not allow suitable microparticle formation.
A linear dependence of d90 from the feed composition, viscosity (η) and atomization
pressure (P) was found as shown by Eq. 2.3 (R2=0.894):
d90 = +0.238 ± 0.005 η − 1.323 ± 0.229 P − 1.039 ± 0.247 CP Eq. 2.3
where all independent variables were significant (p<0.01). The amount of alginate was
excluded from the equation due to co-linearity with CP.
Both the total amount of mass delivered (average value 160 mg) and the number of
microparticles sprayed from the device filled with 30 mL MMS of Formulation P2
atomized at 450 mbar resulted not statistically different during the draining: 38000±5000
microparticles were sprayed, 36000±5000 after the deployment of one third of the MMS
and 35000±6000 after the deployment of two third of the preparation from the same
container. Therefore, the selected spray device was considered adequate for the delivery
of the MMS. The measured pH in all vehicles resulted 4.5.
The mucoadhesive data are reported in Table 2.2. As expected, MMS made of alginate
and CP showed mucoadhesive properties statistically higher than cross-linked alginate
(p<0.05) and the following rank order was found: P0 < P1 ≈ P2 < P3. Moreover, the
encapsulation and/or adsorption of both drugs did not affect the mucoadhesive properties
of all formulations (p>0.80).
In all MMSs, sedimentation of microparticles occurred within few hours leading to a clear
vehicle. The preliminary stability data indicated suitability of the proposed system to
produce oromucosal suspensions. Indeed, the sediment of microparticles could be easily
re-suspended by manual agitation. No aggregates were observed up to six months from
preparation, indicating that the selected active ingredients did not affect the physical
Chapter 2
30
stability of formulation. These observations were also confirmed by results of mass
delivered as the number of microparticles sprayed from the device after 6 months of
storage at 25°C and 40°C results comparable to those obtained at time 0 (data not shown).
On bases of these evaluations, the atomization pressure of 550 mbar was selected and the
upper limit of viscosity was established at 50 cps for drug-loaded MMS.
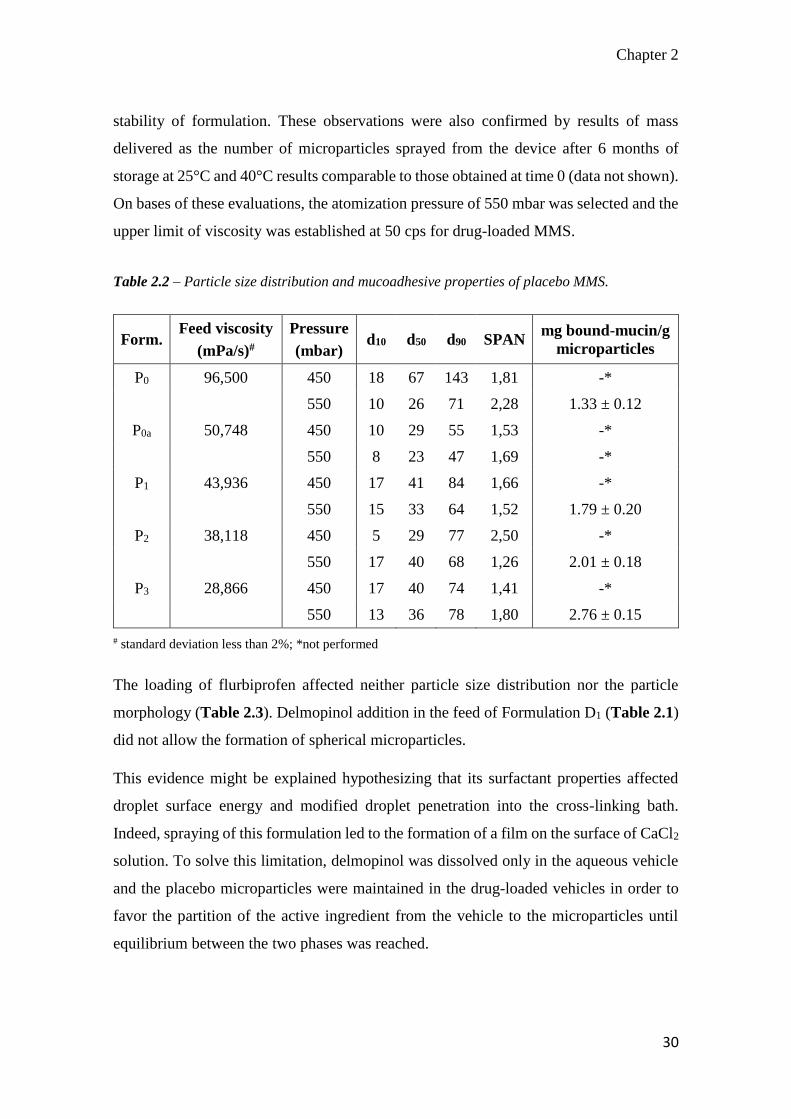
Table 2.2 – Particle size distribution and mucoadhesive properties of placebo MMS.
Form. Feed viscosity
(mPa/s)#
Pressure
(mbar) d10 d50 d90 SPAN
mg bound-mucin/g
microparticles
P0 96,500 450 18 67 143 1,81 -*
550 10 26 71 2,28 1.33 ± 0.12
P0a 50,748 450 10 29 55 1,53 -*
550 8 23 47 1,69 -*
P1 43,936 450 17 41 84 1,66 -*
550 15 33 64 1,52 1.79 ± 0.20
P2 38,118 450 5 29 77 2,50 -*
550 17 40 68 1,26 2.01 ± 0.18
P3 28,866 450 17 40 74 1,41 -*
550 13 36 78 1,80 2.76 ± 0.15
# standard deviation less than 2%; *not performed
The loading of flurbiprofen affected neither particle size distribution nor the particle
morphology (Table 2.3). Delmopinol addition in the feed of Formulation D1 (Table 2.1)
did not allow the formation of spherical microparticles.
This evidence might be explained hypothesizing that its surfactant properties affected
droplet surface energy and modified droplet penetration into the cross-linking bath.
Indeed, spraying of this formulation led to the formation of a film on the surface of CaCl2
solution. To solve this limitation, delmopinol was dissolved only in the aqueous vehicle
and the placebo microparticles were maintained in the drug-loaded vehicles in order to
favor the partition of the active ingredient from the vehicle to the microparticles until
equilibrium between the two phases was reached.
Chapter 2
31
The drug content assayed in the vehicle and microparticles of Formulation D1 indicated
that encapsulation efficiency was higher than 100% (Table 2.3). This evidence may be
due to interaction among delmopinol amine and carboxylic moieties of CP and/or
alginates. The same phenomenon was not evident in the presence of hyaluronic acid
(Formulation D2, Table 2.1). Indeed, it is possible to speculate that this compound was
able to limit the drug migration from the external phase towards the microparticles.
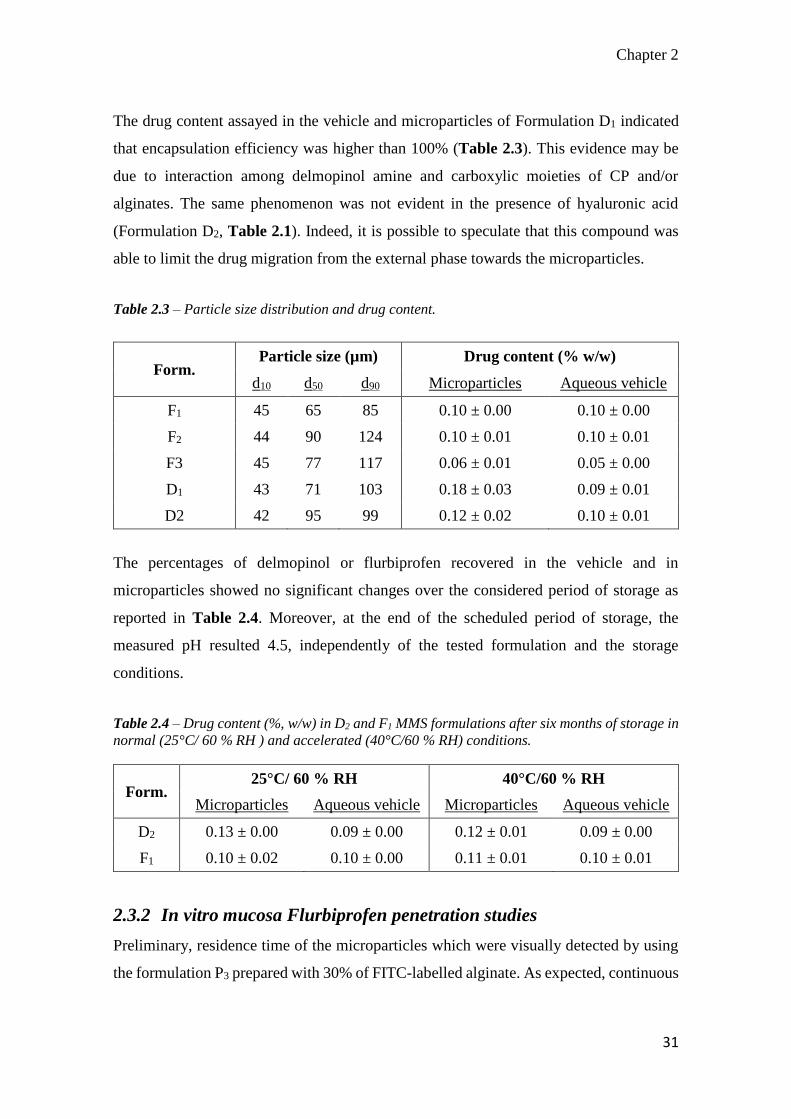
Table 2.3 – Particle size distribution and drug content.
Form. Particle size (µm) Drug content (% w/w)
d10 d50 d90 Microparticles Aqueous vehicle
F1 45 65 85 0.10 ± 0.00 0.10 ± 0.00
F2 44 90 124 0.10 ± 0.01 0.10 ± 0.01
F3 45 77 117 0.06 ± 0.01 0.05 ± 0.00
D1 43 71 103 0.18 ± 0.03 0.09 ± 0.01
D2 42 95 99 0.12 ± 0.02 0.10 ± 0.01
The percentages of delmopinol or flurbiprofen recovered in the vehicle and in
microparticles showed no significant changes over the considered period of storage as
reported in Table 2.4. Moreover, at the end of the scheduled period of storage, the
measured pH resulted 4.5, independently of the tested formulation and the storage
conditions.
Table 2.4 – Drug content (%, w/w) in D2 and F1 MMS formulations after six months of storage in
normal (25°C/ 60 % RH ) and accelerated (40°C/60 % RH) conditions.
Form. 25°C/ 60 % RH 40°C/60 % RH
Microparticles Aqueous vehicle Microparticles Aqueous vehicle
D2 0.13 ± 0.00 0.09 ± 0.00 0.12 ± 0.01 0.09 ± 0.00
F1 0.10 ± 0.02 0.10 ± 0.00 0.11 ± 0.01 0.10 ± 0.01
2.3.2 In vitro mucosa Flurbiprofen penetration studies
Preliminary, residence time of the microparticles which were visually detected by using
the formulation P3 prepared with 30% of FITC-labelled alginate. As expected, continuous
Chapter 2
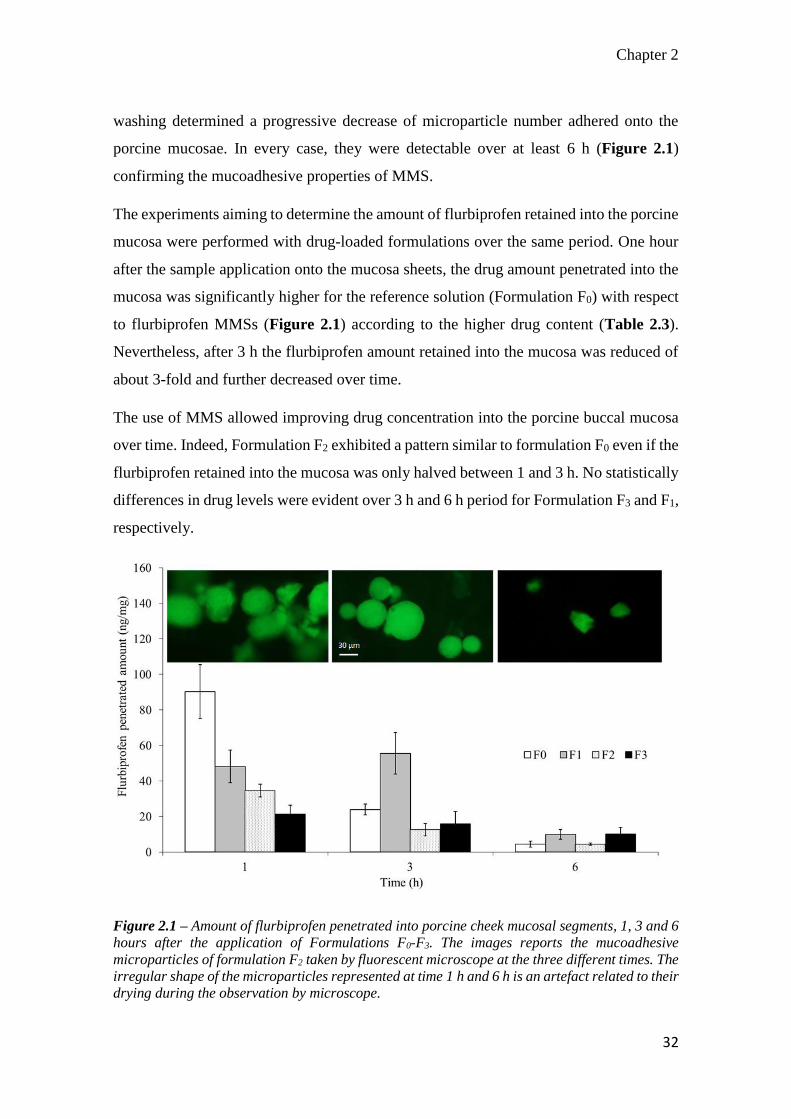
32
washing determined a progressive decrease of microparticle number adhered onto the
porcine mucosae. In every case, they were detectable over at least 6 h (Figure 2.1)
confirming the mucoadhesive properties of MMS.
The experiments aiming to determine the amount of flurbiprofen retained into the porcine
mucosa were performed with drug-loaded formulations over the same period. One hour
after the sample application onto the mucosa sheets, the drug amount penetrated into the
mucosa was significantly higher for the reference solution (Formulation F0) with respect
to flurbiprofen MMSs (Figure 2.1) according to the higher drug content (Table 2.3).
Nevertheless, after 3 h the flurbiprofen amount retained into the mucosa was reduced of
about 3-fold and further decreased over time.
The use of MMS allowed improving drug concentration into the porcine buccal mucosa
over time. Indeed, Formulation F2 exhibited a pattern similar to formulation F0 even if the
flurbiprofen retained into the mucosa was only halved between 1 and 3 h. No statistically
differences in drug levels were evident over 3 h and 6 h period for Formulation F3 and F1,
respectively.
Figure 2.1 – Amount of flurbiprofen penetrated into porcine cheek mucosal segments, 1, 3 and 6
hours after the application of Formulations F0-F3. The images reports the mucoadhesive
microparticles of formulation F2 taken by fluorescent microscope at the three different times. The
irregular shape of the microparticles represented at time 1 h and 6 h is an artefact related to their
drying during the observation by microscope.
Chapter 2
33
After 6 hours, the drug concentrations for Formulations F0 and F2 were not statistically
different (p=0.47) and were lower than those obtained with Formulations F1 and F3
(p<0.02). A higher reduction of drug concentration after 6 hours was observed for
Formulations F1 than F3, since a lower amount of mucoadhesive microparticles was
present in aqueous vehicle of such formulation (Table 2.1).
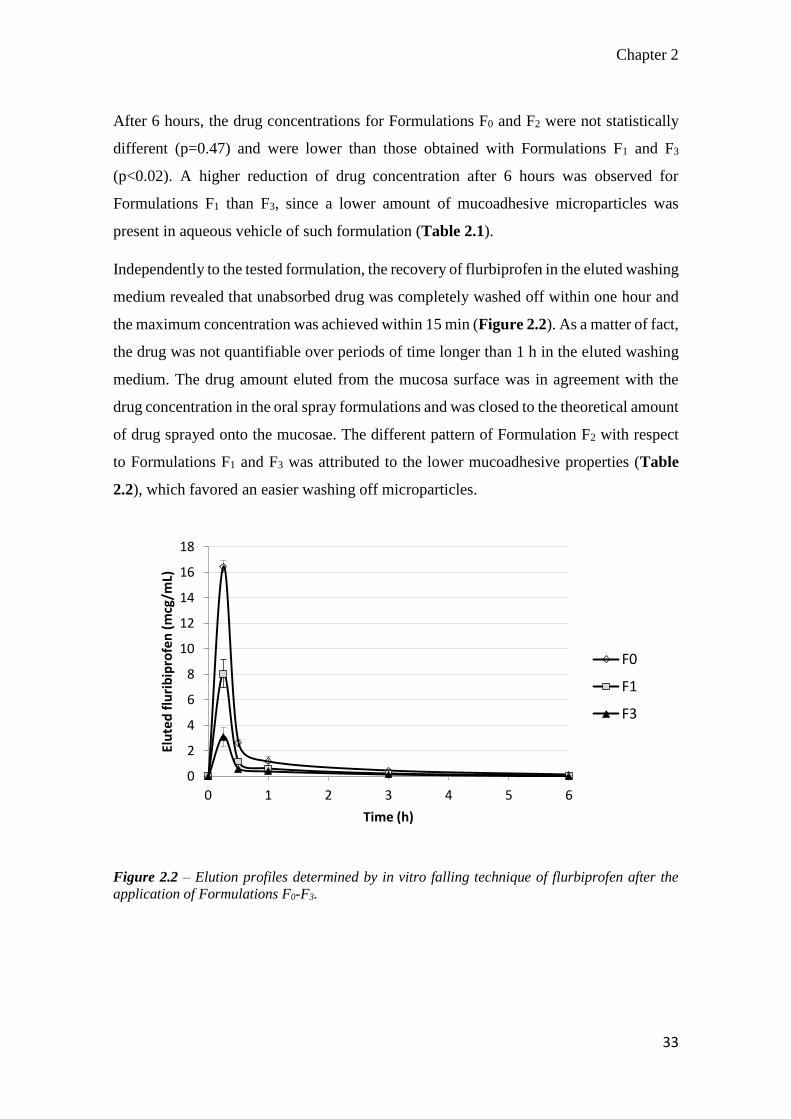
Independently to the tested formulation, the recovery of flurbiprofen in the eluted washing
medium revealed that unabsorbed drug was completely washed off within one hour and
the maximum concentration was achieved within 15 min (Figure 2.2). As a matter of fact,
the drug was not quantifiable over periods of time longer than 1 h in the eluted washing
medium. The drug amount eluted from the mucosa surface was in agreement with the
drug concentration in the oral spray formulations and was closed to the theoretical amount
of drug sprayed onto the mucosae. The different pattern of Formulation F2 with respect
to Formulations F1 and F3 was attributed to the lower mucoadhesive properties (Table
2.2), which favored an easier washing off microparticles.
Figure 2.2 – Elution profiles determined by in vitro falling technique of flurbiprofen after the
application of Formulations F0-F3.
0
2
4
6
8
10
12
14
16
18
0 1 2 3 4 5 6
Elu
ted
flu
rib
ipro
fen
(m
cg/m
L)
Time (h)
F0
F1
F3

Chapter 2
34
Figure 2.3 – Drug release profile of flurbiprofen from microparticles contained in Formulations
F1 and F2.
This hypothesis was confirmed by the comparison of the drug release profiles, which
resulted superimposable (Figure 2.3). Furthermore, the release rate constants (K)
calculated according the Higuchi model were not statistically different (KF1 = 1.07±0.06
h-1; KF2 = 1.06±0.04 h-1; p=0.7487) and the good sound of correlation (R2>0.9940)
supported the hypothesis that the drug release was mainly controlled by diffusion. This
result suggests that Formulations F1 and F3 retained the drug in the buccal mucosa for
longer period with respect to Formulation F2 because of its higher mucoadhesive
properties rather than to a different ability to control drug release.
2.3.3 In vitro evaluation of plaque development
The in-house made artificial mouth and selected operative conditions allowed to
discriminate the effect of the formulative variables of the oromucosal preparations on
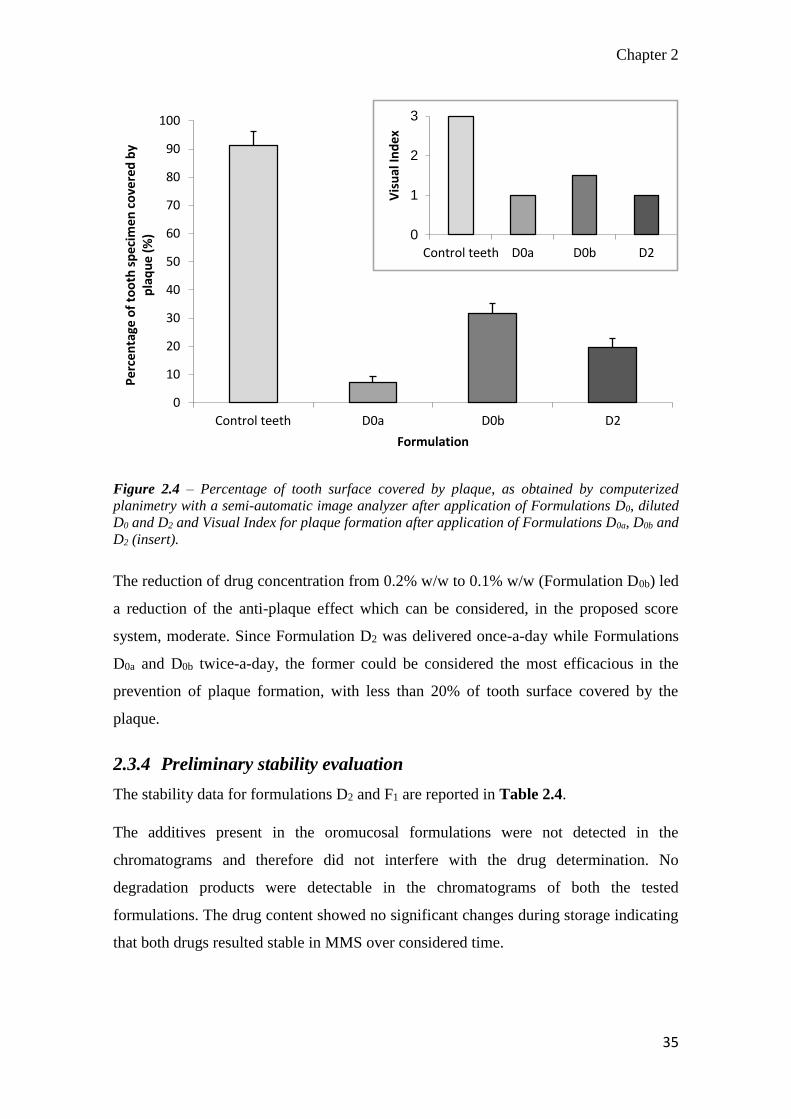
antiplaque effect of delmopinol. Indeed, results obtained by computerized planimetry
with a semi-automatic image analyzer on definite areas of tooth surface (Figure 2.4)
substantially confirmed evaluation by Visual Index: antiplaque performance of reference
solutions, containing the highest drug amount (Formulation D0a) was considered “very
good”.
0
20
40
60
80
100
0 50 100 150 200
Flu
rbip
rofe
n r
elea
sed
(%
)
Time (min)
F1
F2
Chapter 2
35
0
1
2
3
Control teeth D0a D0b D2
Vis
ual
Ind
ex
Figure 2.4 – Percentage of tooth surface covered by plaque, as obtained by computerized
planimetry with a semi-automatic image analyzer after application of Formulations D0, diluted
D0 and D2 and Visual Index for plaque formation after application of Formulations D0a, D0b and
D2 (insert).
The reduction of drug concentration from 0.2% w/w to 0.1% w/w (Formulation D0b) led
a reduction of the anti-plaque effect which can be considered, in the proposed score
system, moderate. Since Formulation D2 was delivered once-a-day while Formulations
D0a and D0b twice-a-day, the former could be considered the most efficacious in the
prevention of plaque formation, with less than 20% of tooth surface covered by the
plaque.
2.3.4 Preliminary stability evaluation
The stability data for formulations D2 and F1 are reported in Table 2.4.
The additives present in the oromucosal formulations were not detected in the
chromatograms and therefore did not interfere with the drug determination. No
degradation products were detectable in the chromatograms of both the tested
formulations. The drug content showed no significant changes during storage indicating
that both drugs resulted stable in MMS over considered time.
0
10
20
30
40
50
60
70
80
90
100
Control teeth D0a D0b D2
Pe
rce
nta
ge o
f to
oth
sp
eci
me
n c
ove
red
by
pla
qu
e (
%)
Formulation

Chapter 2
36
Moreover, at the end of the scheduled period of storage, the measured pH resulted 4.5,
independently of the tested formulation and the storage conditions.
2.4 Discussion
The feasibility of obtaining a drug controlled release by preparing microparticles
comprising alginate and CP was already reported in several papers [26]. Nevertheless, the
final goal was to obtain mucoadhesive microparticles suitable for oral administration. In
all cases, mucoadhesive microparticles were obtained by adding dropwise an aqueous
polymeric dispersion comprising sodium alginate and CP to a cross-linking bath.
Afterwards, the resulting suspension was filtered, dried and the microparticles derived by
collapsing the hydrated beads [26, 27].
The production by using a standard nozzle, instead of a syringe equipped with a needle
having a diameter generally comprised in the range 24-27G, allowed to obtain hydrated
microparticles with an average particle size of 100 µm, which did not require further
processing, such as drying. Such microparticles had no tendency to aggregation and, at
the same time, high surface area and satisfactory mucoadhesive properties.
As underlined by the results concerning the multiple regression (Eq. 2.3), the particle size
of microparticles could be easily set by changing polymer concentrations, which
determined the feed viscosity, and atomization pressure. In particular, CP concentration
might be considered the most critical formulative parameter since it determined the
microparticle mucoadhesive properties and, therefore, drug retention into mucosa.
The proposed system resulted also flexible and versatile, in terms of encapsulation, since
active ingredients with different characteristics could be loaded. The final drug loading
might be adjusted by adding different amount of active ingredient in the feed and/or in
the aqueous vehicle, or appropriate excipients. As verified in the case of delmopinol, the
active ingredient could be added only in the cross-linking bath ant then uptaken by
microparticles after their formation. The data obtained by flurbiprofen MMS suggested
that when specific interaction between drug and swelled polymers used to obtain
microparticles did not occur, the drug release was mainly controlled by the physically
cross-linked alginate rather than the CP content.
Chapter 2
37
The quantification of flurbiprofen penetrated into porcine buccal mucosa and the
inhibition of plaque formation on teeth induced by delmopinol suggested that use of
prolonged release oromucosal bioadhesive suspensions, such as those proposed in the
current study, might decrease both the administered dose and the frequency of
administration. Indeed, these formulations permitted to obtain performances comparable
to those obtained by administering a traditional flurbiprofen oromucosal spray and
delmopinol conventional product at dose reduced of about 60% and 50%, respectively.
The proposed drug delivery systems present also several advantages with respect to other
mucoadhesive preparations intended for the treatment of pathologies localized in the oral
cavity. With respect to buccal tablets and patches, the delivery of formulation by means
a spray permitted to cover easily the entire oral mucosa or to localize active ingredient
mainly on the throat. Furthermore, since mucoadhesive microparticles were suspended in
a medium containing the drug, it could be assumed that designed MMS allowed to a fast
onset of action associated to subsequent prolonged drug release.
2.5 Conclusion
The alginate/CP binary blend might be used for producing such MMS by ionotropic
gelation using a one step process. The mucoadhesive microparticles exhibited a narrow
particle size distribution and a mean diameter suitable to be delivered by using a spray
device. The proposed MMS could assure a prolonged release of both cationic and anionic
active ingredients. Finally, results of in vitro experiments suggested that development of
MMS, localizing the drug into buccal cavity, could reduce the administrated dose and
regimen.
Chapter 2
38
2.6 References
[1] Cilurzo, F., Gennari, C. G. M., Selmin, F., Epstein, J. B., Gaeta, G. M., Colella, G., and Minghetti, P.,
2010, "A new mucoadhesive dosage form for the management of oral lichen planus: Formulation study and
clinical study," Eur. J. Pharm. Biopharm., 76(3), pp. 437-442.
[2] Kellaway, I. W., Ponchel, G., and Duchene, D., 2003, "Oral Mucosal Drug Delivery," Modified-Release
Drug Delivery Technology, M. J. Rathbone, J. Hadgraft, and M. S. Roberts, eds., Marcel Dekker, Inc., New
York, pp. 349-364.
[3] Schoubben, A., Blasi, P., Giovagnoli, S., Rossi, C., and Ricci, M., 2010, "Development of a scalable
procedure for fine calcium alginate particle preparation," Chem. Eng. J., 160(1), pp. 363-369.
[4] Scocca, S., Faustini, M., Villani, S., Munari, E., Conte, U., Russo, V., Riccardi, A., Vigo, D., and Torre,
M. L., 2007, "Alginate/polymethacrylate copolymer microparticles for the intestinal delivery of enzymes,"
Curr. Drug Deliv., 4(2), pp. 103-108.
[5] Gombotz, W. R., and Wee, S., 1998, "Protein release from alginate matrices," Adv. Drug Deliv. Rev.,
31(3), pp. 267-285.
[6] Wittaya-areekul, S., Kruenate, J., and Prahsarn, C., 2006, "Preparation and in vitro evaluation of
mucoadhesive properties of alginate/chitosan microparticles containing prednisolone," Int. J. Pharm., 312,
pp. 113-118.
[7] Rahman, M. R., Jahan, S. T., Sadat, S. M. A., and Jalil, R.-u., 2010, "Preparation and evaluation of
mucoadhesive hydrophilic hydroxy propyl methyl cellulose based extended release matrix tablets of Niacin
(Nicotinic acid)," Am. J. Sci. Ind. Res., 1, pp. 558-564.
[8] Burjak, M., Bogataj, M., Velnar, M., Grabnar, I., and Mrhar, A., 2001, "The study of drug release from
microspheres adhered on pig vesical mucosa," Int. J. Pharm., 224(1-2), pp. 123-130.
[9] Cilurzo, F., Selmin, F., Minghetti, P., Rimoldi, I., Demartin, F., and Montanari, L., 2005, "Fast-
dissolving mucoadhesive microparticulate delivery system containing piroxicam," Eur. J. Pharm. Sci.,
24(4), pp. 355-361.
[10] Cilurzo, F., Selmin, F., Minghetti, P., Gennari, C. G., Demartin, F., and Montanari, L., 2008,
"Characterization and physical stability of fast-dissolving microparticles containing nifedipine," Eur. J.
Pharm. Biopharm., 68(3), pp. 579-588.
[11] Singla, A. K., Chawla, M., and Singh, A., 2000, "Potential applications of carbomer in oral
mucoadhesive controlled drug delivery system: a review," Drug. Dev. Ind. Pharm., 26(9), pp. 913-924.
[12] Collaert, B., Attstrom, R., De Bruyn, H., and Movert, R., 1992, "The effect of delmopinol rinsing on
dental plaque formation and gingivitis healing," J. Clin. Periodontol., 19(4), pp. 274-280.
[13] Hase, J. C., Soder, P. O., Soder, B., Kulstad, S., and Kelty, E., 1995, "Development of plaque and
gingivitis after mouthrinsing with 0.2% delmopinol hydrochloride," Eur. J. Oral. Sci., 103(3), pp. 172-178.
[14] Hase, J. C., Ainamo, J., Etemadzadeh, H., and Astrom, M., 1995, "Plaque formation and gingivitis
after mouthrinsing with 0.2% delmopinol hydrochloride, 0.2% chlorhexidine digluconate and placebo for
4 weeks, following an initial professional tooth cleaning," J. Clin. Periodontol., 22(7), pp. 533-539.
[15] Moran, J., Addy, M., Wade, W. G., Maynard, J. H., Roberts, S. E., Astrom, M., and Movert, R., 1992,
"A comparison of delmopinol and chlorhexidine on plaque regrowth over a 4-day period and salivary
bacterial counts," J. Clin. Periodontol., 19(10), pp. 749-753.
[16] Heasman, P. A., Offenbacher, S., Collins, J. G., Edwards, G., and Seymour, R. A., 1993, "Flurbiprofen
in the prevention and treatment of experimental gingivitis," J. Clin. Periodontol., 20(10), pp. 732-738.
[17] Procaccini, M., Palazzo, V., Mastroianni, L., and Orefici, M., 1996, "[Flurbiprofen collutory in oral
surgical pathology]," Minerva Stomatol., 45(9), pp. 421-425.
[18] Ahmad, N., Grad, H. A., Haas, D. A., Aronson, K. J., Jokovic, A., and Locker, D., 1997, "The efficacy
of nonopioid analgesics for postoperative dental pain: a meta-analysis," Anesth. Prog., 44(4), pp. 119-126.

Chapter 2
39
[19] Roszkowski, M. T., Swift, J. Q., and Hargreaves, K. M., 1997, "Effect of NSAID administration on
tissue levels of immunoreactive prostaglandin E2, leukotriene B4, and (S)-flurbiprofen following extraction
of impacted third molars," Pain, 73(3), pp. 339-345.
[20] Cilurzo, F., Minghetti, P., Selmin, F., Casiraghi, A., and Montanari, L., 2003, "Polymethacrylate salts
as new low-swellable mucoadhesive materials," J. Control. Release, 88(1), pp. 43-53.
[21] Liu, J., Zhang, Y., Yang, T., Ge, Y., Zhang, S., Chen, Z., and Gu, N., 2009, "Synthesis,
characterization, and application of composite alginate microspheres with magnetic and fluorescent
functionalities," J. Appl. Polym. Sci., 113(6), pp. 4042-4051.
[22] Shi, L., and Caldwell, K. D., 2000, "Mucin Adsorption to Hydrophobic Surfaces," J. Colloid Interface
Sci., 224(2), pp. 372-381.
[23] Cilurzo, F., Alberti, E., Minghetti, P., Gennari, C. G. M., Casiraghi, A., and Montanari, L., 2010,
"Effect of drug chirality on the skin permeability of ibuprofen," Int. J. Pharm., 386(1–2), pp. 71-76.
[24] Rao, K. V. R., and Buri, P., 1989, "A novel in situ method to test polymers and coated microparticles
for bioadhesion," Int. J. Pharm., 52(3), pp. 265-270.
[25] Cilurzo, F., Gennari, C. G., Selmin, F., and Vistoli, G., 2010, "Effects of metal ions on entero-soluble
poly(methacrylic acid-methyl methacrylate) coating: a combined analysis by ATR-FTIR spectroscopy and
computational approaches," Mol. Pharm., 7(2), pp. 421-430.
[26] Thorat, Y. S., Modi, V. S., and Dhavale, S. C., 2009, "Use of carbomers to design mucoadhesive
microspheres for anti-H. Pylori drug, Clarithromycin," Int. J. Pharm. Tech. Res., 7, pp. 421-430.
[27] Sambathkumar, R., Venkateswaramurthy, N., Vijayabaskaran, M., and Perumal, P., 2011,
"Formulation of clarithromycin loaded mucoadhesive microspheres by emulsification-internal gelation
technique for anti-helicobacter pylori therapy," Int. J. Pharm. Pharm. Sci., 3(2), pp. 173-177.

Chapter 3
40
3 An oromucosal bioadhesive
suspension for prolonged release of
clobetasol propionate

Chapter 3
41
3.0 Abstract
The study aimed to develop a buccal delivery system designed for having both fast onset
of drug action and prolonged release, combining the peculiarities of aqueous solution and
prolonged release mucoadhesive microparticles. Clobetasol propionate (CP) was chosen
as model drug since it is currently administered to treat inflammatory diseases of the oral
cavity. CP loaded mucoadhesive microparticles were prepared in one-step process by
spray coagulation method. Sodium alginate (ALG) and two different grades of acrylic
acid-based polymers (PAA) were selected as encapsulating and bioadhesive polymers,
respectively. The effects of PAA type, PAA concentration in microparticle (25% or 50%,
w/w) and spraying pressure (450 or 550 mbar) were investigated on microparticle
morphology and CP penetration into porcine cheek mucosa by 23 factorial design.
Microparticles were characterized in terms of morphology, micrometrics, mucoadhesion.
Well-formed and spherical microparticles were obtained combining ALG with both types
of PAA. The microparticle micrometrics was mainly influenced by spraying air pressure.
The amount of mucin bounded to ALG/PAA microparticles was significantly higher
(p<0.05) than those made of the pure ALG. The drug amount penetrated into the mucosa
was significantly higher after 6 hours from administration of CP-loaded microparticles in
comparison with the reference drug solution. The PAA type was critical to achieve high
amount of drug penetration, especially when ALG/PAA were in the 1/1 ratio.
In conclusion, the proposed oromucosal mucoadhesive prolonged release suspension
might be advantageously used to reduce the administration frequency of CP in the oral
cavity.
The experimental work was carried out in the laboratory directed by prof. Luisa Montanari,
Department of Pharmaceutical Sciences, University of Milan, via G. Colombo, 71 – 20133, Milan
(Italy).
Chapter 3
42
3.1 Introduction
Oral mucositis is one of the most critical complication of chemo- and radiotherapy [1].
Because of the high impact on life quality and care cost, several therapeutic protocols
have been proposed for prevention and treatment. In general, they consisted in the basic
oral care, topical administration of antimicrobials, mucosal coating agent, anesthetics, or
systemic administration of high potent analgesics. Moreover, anti-inflammatory agents
were tested, since oral mucositis are also correlated to an activation of inflammatory
mechanism [2]. However, few of them were proven efficacy in reducing the severity and
duration of oral mucositis.
Since buccal dosage forms used in the treatment of oral mucositis are based on solutions
and semisolid preparations for skin application, the clinical failure might also be
correlated to an ineffective drug delivery. Therefore, to improve the patient’s compliance,
the development of a prolonged release dosage forms might be challenging.
In a previous work, Cilurzo et al. proposed an oromucosal suspension of mucoadhesive
microparticles (MMS) able to combine the peculiarities of prolonged release systems with
those of an immediate release oromucosal solution [3]. The MMS was made by one-step
spray coagulation method using sodium alginate (ALG) and poly-acrylate acids (PAA)
as main microparticle constituents. The former was selected for the ability to form stable
reticulate structure in presence of bivalent cations [4], the latter to conferee suitable
mucoadhesive properties of microparticle. The in vitro effectiveness of MMS was
demonstrated by loading flurbiprofen and delmopinol. However, the effect of polymeric
feed composition and process conditions on the MMS residence time on buccal mucosa
was not investigated in detail.
Therefore, the present study aimed to study the effect of these variables on clobetasol
propionate (CP)-loaded MMS aiming to assure the presence of the drug into the buccal
mucosae over six hours. CP was selected as model drug since its effectiveness in the
treatment of oral mucositis and oral lichen planus [5]. Furthermore, two types of PAA
were selected among those authorized for oral delivery according to the different
crosslinking pattern: Carbopol® 974P is cross-linked with allyl ethers of pentaerythritol
(APE), whereas Noveon® AA-1 is cross-linked with divinyl glycol (DVG). The effect of

Chapter 3
43
the PAA types was evaluated in term of microparticle mucoadhesion and MMS in vitro
performances.
A 23 full factorial design was built in to investigate the influence of formulation variables
(i.e., PAA type, ALG/PAA) and manufacturing parameter (i.e., spraying air pressure) on
the microparticle micrometrics the CP amount of penetrated in porcine mucosa after 6 h.
3.2 Materials and methods
3.2.1 Materials
Clobetasol propionate was purchased from Sicor SpA (Rho, Italy). Protanal® LF 120 M
was supplied by FMC BioPolymer (Philadelphia, USA). Carbopol® 974P (APE-PAA),
Noveon® AA-1 (DVG-PAA) were purchased from Lubrizol Corporation (Wickliffe,
USA). Cremophor® RH 40 was kindly gifted by BASF (Ludwigshafen, Germany).
Polyethylene glycol 400, sorbitol, saccharin sodium, methyl-paraben sodium, calcium
chloride dehydrate were supplied by Farmalabor (Canosa di Puglia, Italy). Glycerol and
ethanol were purchased form Carlo Erba Reagenti (Milan, Italy). Mint flavor was
purchased from Kerry Group (Tralee, Ireland). Mucin type II was purchased from Sigma-
Aldrich Co. (Milan, Italy). All other reagents and solvents were used as received without
further purification.
3.2.2 Mouthwash preparation
The placebo feed solutions were made mixing aqueous dispersion of ALG and
mucoadhesive polymers (i.e., APE-PAA, DVG-PAA) in the 1/1 ratio. The feed solution
was pumped at the rate of 15 mL/min into a standard two-way nozzle (0.8 mm inner
diameter; Schlick Atomizing Technologies, Düsen-Schlick GmbH, Untersiemau,
Germany) and sprayed into a 1% w/w calcium chloride solution, under magnetic stirring.
The spraying air pressure ranged was set at 450 mbar. Microparticles were cured into the
cross-linking bath for 1 h at room temperature before filtering throughout a 710 µm sieve.
The final MMS were stored in 50 mL blue PE bottle at 25°C until use. The ratio between
feed and aqueous vehicle were set up to achieve a final microparticle concentration of
10% w/w.
The CP-loaded MMS were prepared adding drug in both feed solution and vehicle
solution to achieve final concentration of 0.025% w/v in microparticle and aqueous

Chapter 3
44
vehicle. The PAA type, its concentration in microparticles and spraying air pressure were
set up according 23 full factorial design (Table 3.1 and Table 3.2). In order to compare
the effectiveness of MMS with a marketed mouthwash containing 0.025% w/v CP, other
excipients were added to aqueous vehicles as reported in Table 3.3.
Table 3.1 - Factor and responses used in the 23 full factorial design of CP-loaded MMS and
response specification.
Factors Low level High level
PAA type (X1) APE-PAA DVG-PAA
% PAA (X2) 25 50
Air pressure (X3, mbar) 450 550
Responses Goals
Particle mean diameter (Y1) None
SPAN (Y2) Minimize
Retained amount at 6h (Y3) Maximize
3.2.3 Mucoadhesive properties
Although mucoadhesion of microparticles have been also investigated previously [3], the
effect of DVG-PAA have not been evaluated on microparticle mucoadhesion yet.
According that, three placebo MMS were made containing ALG only (P0), ALG/APE-
PAA (P1) and ALG/DVG-PAA (P2) (Table 3.3). The ratio between ALG and PAA was
set up at 1/1 for maximize the mucoadhesion differences. The mucoadhesion properties
of three formulation was determined after filtering microparticles through a 90 µm sieve.
Aliquots of 100 mg microparticle were suspended in 2.5 mL purified water and known
volume of 0.05% w/v mucin solution was added. Then, samples were shaken at 100 rpm
for 5 min in a shaker incubator (Sartorius Stedim, Bagno a Ripoli, Italy) at 37±1 °C and
centrifuged at 1000 x g by a Hettich Universal centrifuge 30F (Andreas Hettich GmbH &
Co. KG, Tuttlingen, Germany). After discharging the supernatant, microparticles were
washed by 5 mL fresh purified water to remove mucin not adsorbed on the surface.
Afterwards, microparticles were re-suspended in 2.5 mL deionized water. Aliquot of each
suspension (200 µL) were incubated with a micro BCA Protein Assay Reagent
(Euroclone, Pero, Italy) for 30 min at 37±1 °C, as modified from Shi and Caldwell [6].
The amount of bound mucin was determined by spectrophotometer at the wavelength of
Chapter 3
45
562 nm (DU®-640 spectrophotometer, Beckman Coulter, Brea, USA). The results were
expressed as milligrams of bound mucin normalized for grams of microparticles. The data
was reported as mean values ± SEM (n=3).
3.2.4 Design of experiments
A 23 full factorial design was built in to screen formulation and manufacturing parameter
influencing the effectiveness of proposed CP-loaded OMS in mucosal drug penetration.
Type of bioadhesive polymer (APE-PAA, DVG-PAA; X1), theoretical PAA
concentration in dried microparticles (X2), and spray air pressure (X3) were selected as
independent variables (factors). The particle mean diameter (Y1), particle size dispersion
(SPAN; Y2) and drug penetrated amount into mucosa after 6 h (Y3) were used as
dependent variables (responses; Table 3.1). Statistical analyses of the formulations
design were performed using JMP® software version 10 (SAS Institute; Cary, USA).
3.2.5 Statistical analyses
Linear correlations were made from the response values of the Y1, Y2, Y3 of results of 8
runs (Table 3.2). Analyses of variance (ANOVA) were performed to ensure the model
fit. Factors and their interaction that significantly influenced Y1, Y2 and Y3 were identified
by stepwise backward analyses. Theoretical optimum condition was obtained by setting
the maximum desirability of minimum Y2 and maximum Y3 (Table 3.1). Any optimal
condition was set up for Y1, considering that microparticle size was not a critical
parameter for oromucosal delivery. Results were considered statistically significant at
p<0.05 using the Fisher’s t-test.
3.2.6 Microparticle size and distribution
The particle size of suspension (1 mL) was measured by an Accusizer 770 granulometer
(PSS Inc., Santa Barbara, USA). Particle size was expressed as undersize cumulative
percentages and the population dispersion was expressed as SPAN, according to the
following equation (Eq. 3.1):
𝑆𝑃𝐴𝑁 =𝑑90−𝑑10
𝑑50× 100 Eq. 3.1
Chapter 3
46
where d90, d10 and d50 were the mean diameters at the 90%, 10% and 50% of the
distribution of microparticle population, respectively.
3.2.7 Drug content
Microparticles recovered by filtration through 45 µm membrane were washed with
acetonitrile to remove the drug absorbed on the surface and dried at room temperature till
constant weight. Microparticle samples (50 mg) were digested in 10 mL of 5% w/v
sodium chloride solution/acetonitrile (50/50, % v/v) under sonication for 2 h. Then,
samples were 45 µm filtered and the CP content was quantified by HPLC as reported
below. The CP content of aqueous vehicle was also determined after dilution 1:10 with
HPLC-grade water. The analyses were carried out in triplicate.
3.2.8 HPLC analysis
The concentration of CP was determined by HPLC (HP 1100, Chemstations, Agilent
Technologies, Santa Clara, USA). Compound separation was carried out using reverse-
phase column (Water Spherisorb®, ODS2, 3 µm, 150x4.6 mm, Waters Co., Dublin,
Ireland) and HPLC-grade water/acetonitrile (50/50, % v/v) as mobile phase. The flow rate
was 1.0 mL/min and the injection volume of 20 µL. The drug concentration was
determined at 240 nm from calibration curves in the range of 0.05-5 µg/mL (R2>0.999).
3.2.9 In vitro mucosa penetration study
The in vitro mucosa penetration study was performed according the falling liquid
technique described by Cilurzo et al. [3]. Briefly, the fresh porcine cheek mucosa was
obtained by a local slaughterhouse. Specimens of mucosa were dipped in pH 7.4 PBS at
70°C for 1 min to isolate the mucosa epithelial layer. In-house equipment was composed
by six in series mucosa supports set at an acute angle of 30°, the peristaltic pump and the
liquid fraction collector. Tested MMS was sprayed twice onto a 2.5x1.0 cm mucosa
surface corresponding a total amount of about 40 mg MMS. Then, porcine cheek
epithelial layer was placed on the sample support and pH 6.4 PBS was dropped at the 1
mL/min rate to simulate the buccal environment and the saliva swallowing. At predefined
times (i.e., 1, 3 and 6 h), the applied test sample was peeled away by means of an adhesive
tape strip and the mucosa was stored at -40°C for 24 h. Finally, mucosa samples were
homogenized and penetrated drug amount was extracted in acetonitrile (2.5 mL) and then

Chapter 3
47
quantified by HPLC. The amount of CP retained after a defined time (Qret) was expressed
as micrograms of drug in micrograms of epithelial layer.
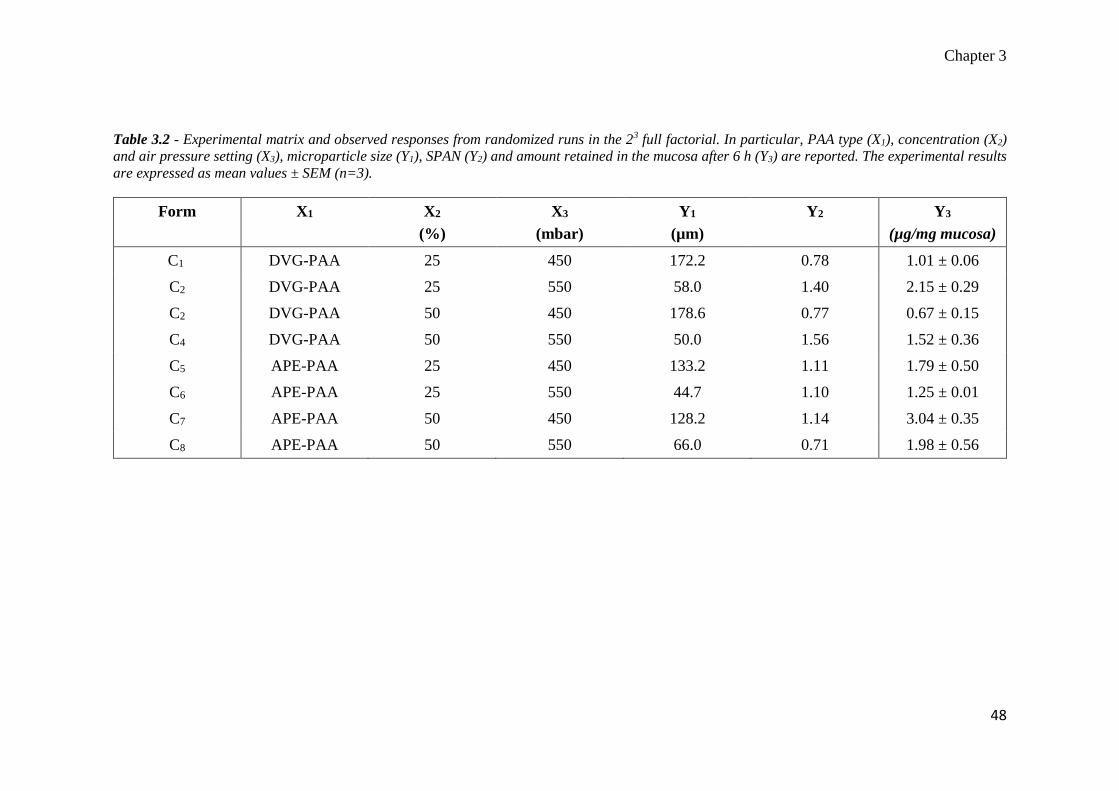
Chapter 3
48
Table 3.2 - Experimental matrix and observed responses from randomized runs in the 23 full factorial. In particular, PAA type (X1), concentration (X2)
and air pressure setting (X3), microparticle size (Y1), SPAN (Y2) and amount retained in the mucosa after 6 h (Y3) are reported. The experimental results
are expressed as mean values ± SEM (n=3).
Form X1 X2
(%)
X3
(mbar)
Y1
(µm)
Y2 Y3
(µg/mg mucosa)
C1 DVG-PAA 25 450 172.2 0.78 1.01 ± 0.06
C2 DVG-PAA 25 550 58.0 1.40 2.15 ± 0.29
C2 DVG-PAA 50 450 178.6 0.77 0.67 ± 0.15
C4 DVG-PAA 50 550 50.0 1.56 1.52 ± 0.36
C5 APE-PAA 25 450 133.2 1.11 1.79 ± 0.50
C6 APE-PAA 25 550 44.7 1.10 1.25 ± 0.01
C7 APE-PAA 50 450 128.2 1.14 3.04 ± 0.35
C8 APE-PAA 50 550 66.0 0.71 1.98 ± 0.56

Chapter 3
49
Table 3.3 – Composition of placebo mouthwashes (P0-P2), Reference (R) and optimal CP-loaded MMS (CP-MMS) according the results of 23 full
factorial design. The ratio between Phase A and Phase B was fixed at 1/10.
Ingredients Formulation composition (%)
P0 P1 P2 R CP-MMS
Phase A
(microparticles)
Clobetasol propionate - - - - 0.025
Sodium alginate 3.00 1.50 1.50 - 1.50
Carbopol® 974P - 1.50 - - -
Noveon® AA-1 - - 1.50 - 1.50
Purified water 97.00 97.00 97.00 100.00 97.00
Phase B
(aqueous
vehicle)
Clobetasol propionate - - - 0.025 0.025
Glycerol - - - 10.00 10.00
Ethanol - - - 10.00 10.00
Sorbitol - - - 7.00 7.00
Cremopohor® RH 40 - - - 2.40 2.40
CaCl2 1.00 1.00 1.00 1.00 1.00
Mint Flavor - - - 0.20 0.20
Sodium saccharin - - - 0.15 0.15
Sodium methyl-
paraben
- - - 0.10 0.10
Purified water 89.00 89.00 89.00 69.125 69.125

Chapter 3
50
3.3 Results and discussion
As expected, the addition of bioadhesive polymer to the feed solution conferred
mucoadhesive properties to microparticles. In particular, the results showed that bound
mucin increased from 1.33±0.07 mg/g for P0 to 2.23±0.09 for P1 (p=0.001) and 1.97±0.16
for P2 (p=0.019). No significant differences were observed comparing the results of two
types of PAA (p=0.225), showing that different cross-linker used did not significantly
affect mucoadhesion.
CP could be added to feed solution and its final concentration in microparticles ranged
from 0.029 to 0.032 % w/w. The drug loading caused an increase in particle size from
about 50 µm of placebo microparticles [3] to 150 µm of CP-loaded MMS (Table 3.2).
Furthermore, the step stepwise analyses highlighted that microparticle dimension were
mainly affected by spraying air pressure (X3). In particular, the microparticle size (Y1)
was inversely correlated to X3, as shown in Eq. 3.2 (p=0.016; R2=0.64; F Ratio=10.90).
𝑌1 = 496.17 − 0.76𝑋3 Eq. 3.2
On the contrary, the SPAN was influenced by the interaction of X1 and X3 (p=0.016). In
particular, the higher the air pressure used to spray (X3), the higher the values of Y2. The
linear correlation, valid only for MMS containing DVG-PAA, was shown by Eq. 3.3
(p=0.012; R2=0.97; F Ratio=77.35).
𝑌2 = −2.39 + 0.01𝑋3 Eq. 3.3
This evidence suggested that cross-linked nature of PAA was critical for microparticle
polydispersion. In general, cross-linking increased the rigidity of polymer structure.
Therefore, it is possible that DVG-PAA chains affected the ALG reorganization in
microparticles more strongly than APE-PAA, producing a high particle dispersion.
The in vitro penetration studies showed a high inter-sample variability (CV% > 30) due
to high heterogeneity of epithelial layer of porcine mucosa [7]. However, the results
showed different performances of tested formulation in drug retention into mucosa
epithelial layer (Figure 3.1).
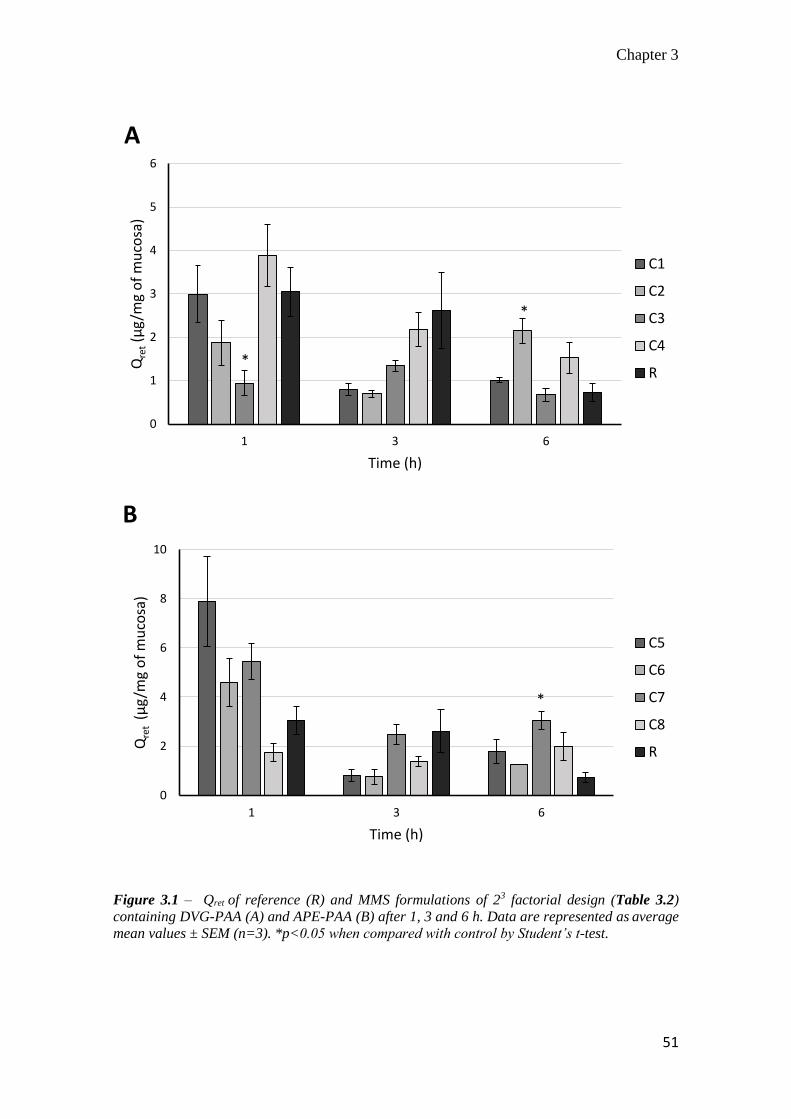
Chapter 3
51
Figure 3.1 – Qret of reference (R) and MMS formulations of 23 factorial design (Table 3.2)
containing DVG-PAA (A) and APE-PAA (B) after 1, 3 and 6 h. Data are represented as average
mean values ± SEM (n=3). *p<0.05 when compared with control by Student’s t-test.
0
1
2
3
4
5
6
1 3 6
Qre
t(µ
g/m
g o
f m
uco
sa)
Time (h)
A
C1
C2
C3
C4
R*
*
0
2
4
6
8
10
1 3 6
Qre
t (µ
g/m
g o
f m
uco
sa)
Time (h)
B
C5
C6
C7
C8
R
*

Chapter 3
52
Qret decreased over time both for reference mouthwash and for all MMS formulations. In
the case of reference mouthwash, CP retained amounts decreased from 3.04±0.55 to
0.72±0.21 µg/mg of mucosa after 1 and 6 h, respectively. The CP- loaded MMS retention
trends were influenced by design factors. Comparing Figure 3.1 A and B, it is noteworthy
that Qret was higher for MMS containing APE-PAA than for those with DVG-PAA. For
example, Qret were 0.94±0.29 and 5.47±0.73 µg/mg of mucosa after 1 hour from the
application of C3 and C7, respectively (p<0.01). The statistical analyses also suggested
that Qret after 6 h (Y3) was significantly influenced by the PAA type (X1; p=0.017),
interaction of the PAA type with ALG/PAA ratio (X1*X2; p=0.013) and with air pressure
(X1*X3; p=0.006).
Since the linear multiple regression fitted well with experimental results (p=0.0068;
R2=0.94; F Ratio=20.54), Eq. 3.4 was applied to describe the factor influence on MMS
made with APE-PAA.
Y3 = 3,56 + 0.03X2 − 0.01X3 Eq. 3.4
According to that, the Y3 was positively influenced by increase of APE-PAA and its
concentration in the dried microparticle (X2), whereas it was negatively affected by
increase of spraying air pressure (X3). The former observation might be justified
considering that the APE-PAA concentration in microparticle was correlated to the
improvement of microparticle mucoadhesion [3]. Therefore, the higher the mucoadhesive
properties of microparticles the longer the resistance time on the buccal mucosa,
prolonging the CP released at penetration site.
In the second case, the air pressure on Y3 induced the presence of smaller microparticles
on the mucosa surface as expressed by Eq. 3.3. These evidences might be explained
considering that drug retention was related to microparticle residence time on the mucosa.
The falling film technique uses liquid flow on an inclined plane to simulate the
physiological swallowing [8]. In these conditions, the liquid flow forces microparticles to
roll on the mucosa surface. Therefore, microparticle movement might be simplified as
sphere movement on the inclined plane.
The tendency to roll was directly correlated to the force applied on the sphere by liquid
flow (FL) and indirectly correlated to the rolling resistance (Fr). As reported by

Chapter 3
53
Ketterhagen and coworkers, the force of rolling resistance has been directly related to the
sphere weight (W) by the coefficient of rolling resistance (Crr) [9]. Since FL was constant
during the experiment, the microparticle residence time on the mucosa was directly
correlated to Fr. Furthermore, an increase of mucoadhesion produced higher Crr due to
the higher interaction between microparticle surface and mucosa layer. Therefore, at
elevated PAA concentrations (X2), Crr increased because of stronger mucoadhesion and
therefore the tendency of the microparticles to roll away to the mucosa resulted decreased.
On the other side, the negative effect of spraying air pressure (X3) on Qret might be
justified considering that size can be correlated to microparticle weight. At constant
density: the smaller the size, the lower the microparticle weight and the lower Fr.
Moreover, statistical model allowed identifying optimal formulation and condition to
achieving satisfying retention after 6 h. As shown in Figure 3.2, the optimal conditions
were APE-PAA (X1), 50% w/w of PAA (X2) and 450 mbar (X3; Desirability: 0.83).
Figure 3.2 – Prediction and desirability plot showing the effect of factors on Y3 of 23 full factorial
design.
Chapter 3
54
3.4 Conclusion
The experimental work confirmed that MMS was a suitable technological platform for
oromucosal delivery of drugs. The current study demonstrated that MMS were also able
to increase the mucosal penetration of clobetasol propionate. The 23 full factorial design
showed which formulation and manufacturing process affect mainly the microparticles
performances. Moreover, optimal conditions for high CP retention after 6 hours were
obtained using APE-PAA as bioadhesive polymer in the 50% w/w of microparticle
concentration. Finally, the spraying air pressure had to be set at 450 mbar in order to limit
the particle size dispersion during the production process.

Chapter 3
55
3.5 References
[1] Saunders, D. P., Epstein, J. B., Elad, S., Allemano, J., Bossi, P., van de Wetering, M. D., Rao, N. G.,
Potting, C., Cheng, K. K., Freidank, A., Brennan, M. T., Bowen, J., Dennis, K., and Lalla, R. V., 2013,
"Systematic review of antimicrobials, mucosal coating agents, anesthetics, and analgesics for the
management of oral mucositis in cancer patients" Support Care Cancer, 21(11), pp. 3191-3207.
[2] Nicolatou-Galitis, O., Sarri, T., Bowen, J., Di Palma, M., Kouloulias, V. E., Niscola, P., Riesenbeck,
D., Stokman, M., Tissing, W., Yeoh, E., Elad, S., and Lalla, R. V., 2013, "Systematic review of anti-
inflammatory agents for the management of oral mucositis in cancer patients" Support Care Cancer, 21(11),
pp. 3179-3189.
[3] Cilurzo, F., Gennari, C. G. M., Selmin, F., Musazzi, U. M., Rumio, C., and Minghetti, P., 2013, "A
Novel Oromucosal Prolonged Release Mucoadhesive Suspension by One Step Spray Coagulation Method,"
Curr. Drug Deliv., 10(3), pp. 251-260.
[4] Gombotz, W. R., and Wee, S., 1998, "Protein release from alginate matrices," Adv. Drug Deliv. Rev.,
31(3), pp. 267-285.
[5] Cilurzo, F., Gennari, C. G. M., Selmin, F., Epstein, J. B., Gaeta, G. M., Colella, G., and Minghetti, P.,
2010, "A new mucoadhesive dosage form for the management of oral lichen planus: Formulation study and
clinical study," Eur. J. Pharm. Biopharm., 76(3), pp. 437-442.
[6] Shi, L., and Caldwell, K. D., 2000, "Mucin Adsorption to Hydrophobic Surfaces," J. Colloid Interface
Sci., 224(2), pp. 372-381.
[7] Kulkarni, U., Mahalingam, R., Pather, I., Li, X., and Jasti, B., 2010, "Porcine buccal mucosa as in vitro
model: Effect of biological and experimental variables," J. Pharm. Sci., 99(3), pp. 1265-1277.
[8] Rao, K. V. R., and Buri, P., 1989, "A novel in situ method to test polymers and coated microparticles
for bioadhesion," Int. J. Pharm., 52(3), pp. 265-270.
[9] Ketterhagen, W. R., Bharadwaj, R., and Hancock, B. C., 2010, "The coefficient of rolling resistance
(CoRR) of some pharmaceutical tablets," Int. J. Pharm., 392(1–2), pp. 107-110.
Chapter 4
56
4 Resveratrol-loaded nanocarriers:
formulation optimization,
characterization and in vitro toxicity on
cochlear cells
Chapter 4
57
4.0 Abstract
The present work aimed to investigate polymeric nanoparticles (NPs) loaded with
resveratrol (RES)-loaded nanoparticles (NPs) as suitable drug delivery system to cochlear
cells. RES-loaded NPs were prepared by solvent-diffusion technique without surfactant.
Box-Behnken design was used to study the effect of formulation variables on particle
mean diameter, polydispersity index (PDI), zeta-potential, and percent drug encapsulation
efficiency (EE%) and ratio between NPs size before and after freeze-drying (Sf/Si).
Furthermore, the physicochemical stability of the colloidal suspension was improved
using different types and concentrations of cryoprotectants. Finally, the in vitro toxicity
of the synthesized NPs was evaluated in two cochlear cell lines: organ of Corti (HEI-
OC1) and Stria Vascularis (SVK-1) cells. The optimal formulation (desirability: 0.86)
corresponded to NPs with mean diameter of 135.5±37.3 nm, PDI of 0.126±0.080, zeta-
potential of -26.84±3.31 mV, EE% of 99.83±17.59% and Sf/Si of 3.30±0.92. The particle
mean diameter and PDI of RES-loaded NPs were maintained within the model space only
when trehalose was used at concentrations higher than 15% w/v. The in vitro studies
showed that blank NPs did not alter the viability of both cells lines, except for
concentrations higher than 600 µg/mL. On the other hand, the cell viability decreased at
high concentrations of native RES (>50μM) in both cell lines, whereas RES-loaded NPs
influenced only HEI-OC1 cell viability.
The formulative and in vitro toxicity studies were carried out in the Laboratory of Future
Nanomedicines and Theoretical Chronopharmaceutics directed by prof. Bi-Botti C. Youan,
Division of Pharmaceutical Sciences, University of Missouri Kansas City, 2464 Charlotte St.,
Kansas City, MO 64108, USA.
The Powder X-ray diffraction analyses were carried out in the laboratory directed by prof. James
B. Murowchick, Department of Geosciences, University of Missouri-Kansas City, 420 Flarsheim
Hall, 5110 Rockhill Rd., Kansas City, MO, 64110, USA.
The contents of this chapter have been submitted for publication to an. international peer-
reviewed journal. Furthermore, the results of ancillary in vivo biodistribution study were
presented as posters at the 2013 AAPS Annual Meeting and Exposition (Appendix 4.1).
Chapter 4
58
4.1 Introduction
Cisplatin (cis-diaminedichloroplatinum (II)) is one of the most frequently used
chemotherapeutic agents for the treatment of several varieties of tumors, including
ovarian, testicular, breast, hematologic, lung, cervical, and head and neck cancers.
However, its clinical effectiveness is often correlated with severe side effects such as
ototoxicity [1]. Cisplatin-induced ototoxicity generally manifests as ear pain, tinnitus,
sensorial hearing loss and deafness. In particular, around 60% of treated patients have
exhibited elevated hearing threshold with a higher incidence in children than in adults [2].
Cisplatin has been demonstrated to trigger in vitro activation of apoptosis in cochlear cell
lines (i.e., outer hair, Strial Ganglion and Stria Vascularis cells) through the generation
of reactive oxygen species (ROS) [3, 4]. Therefore, the efficacy of several antioxidant
agents, including α-lipoic acid, D-methionine, ebselen, L-carnitine, N-acetylcysteine, has
been tested in vitro and in vivo after local and systemic delivery [1, 5]. However, there
are no FDA/EMA-approved medicines for the treatment of hearing impairment caused
by cisplatin.
Recently, resveratrol (RES) has been proposed as a protective agent since its effectiveness
was proven after systemic administration in guinea pigs and rats [6, 7]. RES (3,5,4’-
trihydroxystilbene) is a non-flavonoid poly-phenolic compound abundant in grapes,
peanuts and other foods. In humans, RES has been correlated with several
pharmacological effects, including cardio-protection, cancer prevention, anti-
inflammatory activity, antioxidant effects, improvement of cellular stress resistance and
longevity [8]. However, the use of RES in clinics remains limited due to its low oral
bioavailability (70%), rapid metabolism and elimination [9]. Several delivery systems
including microparticles, ultra-fine fiber, nanosponges, liposomes, and nanoparticles
(NPs) have been proposed as alternative solutions to bypass the pharmacokinetic
limitations [9].
In the present study, RES was loaded in polymeric NPs, made of two biodegradable
polymers. Poly-(lactic-co-glycolic) acid (PLGA) was selected as a biodegradable
polymer considering its well-known safety and ability to control drug release. On the
other hand, the poly-(caprolactone)–poly-(ethylene glycol) (PCL–PEG) di-block was

Chapter 4
59
used for taking advantage of its amphiphilic nature for stabilizing nanoparticle surface
and improving drug loading.
Recently, experimental approaches based on design of experiment (DoE) have been
widely applied in the academic research and pharmaceutical development of new drugs
[10, 11]. Hence, Box-Behnken design (BBD) was selected, requiring fewer number of
runs (12 plus 3 center points) and only three levels of each independent variable than
other response surface designs [12]. The BBD allowed to deeply investigate the influence
of formulation variables (i.e., RES, PLGA and PCL-PEG amounts) on the selected
responses, namely particle mean diameter, PDI, Zeta-potential, percent drug
encapsulation efficiency (EE%) and physicochemical changes after freeze-drying.
The optimal formulation was also characterized by powder X-ray diffraction (PXRD),
scanning electron microscopy (SEM) and in vitro drug release. Furthermore, the effect of
well-known cryoprotectants was investigated to minimize physical instability of
nanoparticle system during freeze-drying.
Since no information has been available in literature about the pharmacology/toxicology
of RES in cochlear cells, its toxicity was evaluated in vitro in two different cochlear cell
lines: organ of Corti cells (HEI-OC1) and a Stria Vascularis one (SVK-1) [13, 14]. The
toxicity of blank and RES-loaded NPs was also tested in HEI-OC1 and SVK-1 cells.
4.2 Materials and Methods
4.2.1 Materials
RES was obtained from AK Scientific Inc. (Union City, USA). Poly-(D,L-lactide-co-
glycolide) with a L/G ratio of 50/50 and inherent viscosity of 0.39 dL/g was supplied
from Birmingham Polymers Inc. (Pelham, USA). Poly-(ε-caprolactone)–poly-(ethylene
glycol) di-block was obtained from Advanced Material Polymers Inc. (Montréal,
Canada). Sucrose, trehalose, acetone, methanol were supplied from Sigma Aldrich (Saint-
Louis, USA). Lactose and Mannitol were obtained from Fisher Scientific Inc. (Pittsburgh,
USA). All other chemicals used in the study were of analytical grade and were used
without further purification.
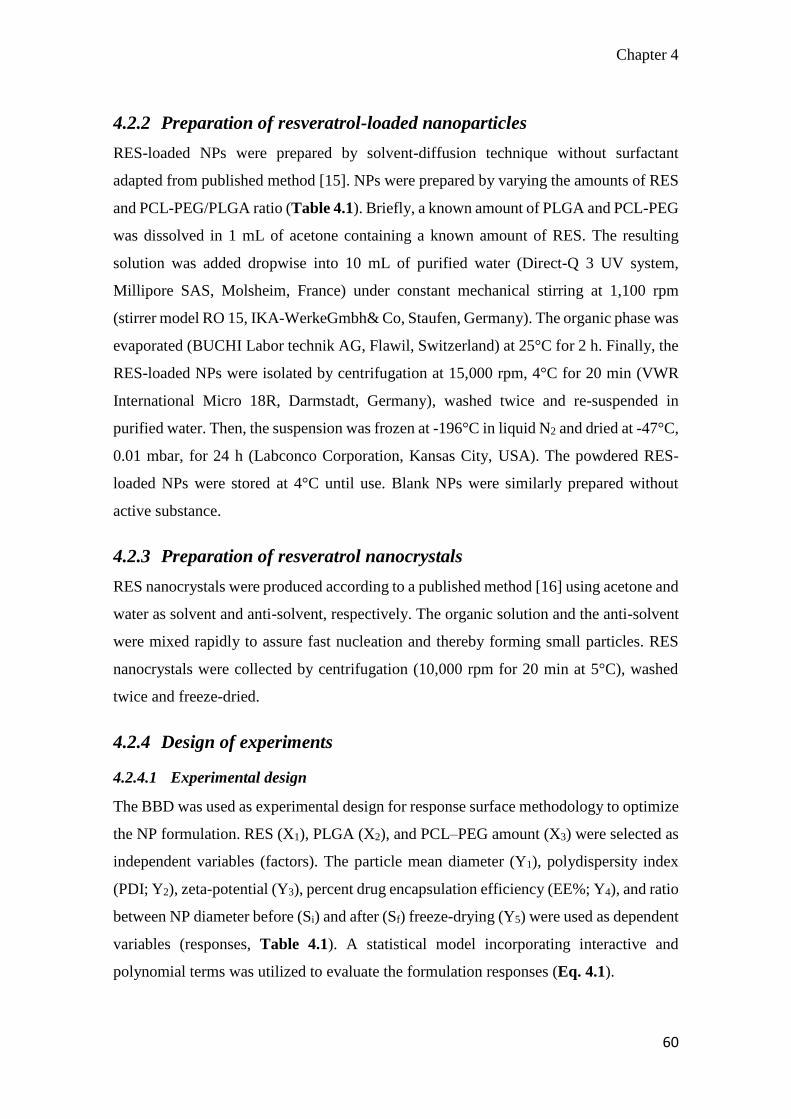
Chapter 4
60
4.2.2 Preparation of resveratrol-loaded nanoparticles
RES-loaded NPs were prepared by solvent-diffusion technique without surfactant
adapted from published method [15]. NPs were prepared by varying the amounts of RES
and PCL-PEG/PLGA ratio (Table 4.1). Briefly, a known amount of PLGA and PCL-PEG
was dissolved in 1 mL of acetone containing a known amount of RES. The resulting
solution was added dropwise into 10 mL of purified water (Direct-Q 3 UV system,
Millipore SAS, Molsheim, France) under constant mechanical stirring at 1,100 rpm
(stirrer model RO 15, IKA-WerkeGmbh& Co, Staufen, Germany). The organic phase was
evaporated (BUCHI Labor technik AG, Flawil, Switzerland) at 25°C for 2 h. Finally, the
RES-loaded NPs were isolated by centrifugation at 15,000 rpm, 4°C for 20 min (VWR
International Micro 18R, Darmstadt, Germany), washed twice and re-suspended in
purified water. Then, the suspension was frozen at -196°C in liquid N2 and dried at -47°C,
0.01 mbar, for 24 h (Labconco Corporation, Kansas City, USA). The powdered RES-
loaded NPs were stored at 4°C until use. Blank NPs were similarly prepared without
active substance.
4.2.3 Preparation of resveratrol nanocrystals
RES nanocrystals were produced according to a published method [16] using acetone and
water as solvent and anti-solvent, respectively. The organic solution and the anti-solvent
were mixed rapidly to assure fast nucleation and thereby forming small particles. RES
nanocrystals were collected by centrifugation (10,000 rpm for 20 min at 5°C), washed
twice and freeze-dried.
4.2.4 Design of experiments
4.2.4.1 Experimental design
The BBD was used as experimental design for response surface methodology to optimize
the NP formulation. RES (X1), PLGA (X2), and PCL–PEG amount (X3) were selected as
independent variables (factors). The particle mean diameter (Y1), polydispersity index
(PDI; Y2), zeta-potential (Y3), percent drug encapsulation efficiency (EE%; Y4), and ratio
between NP diameter before (Si) and after (Sf) freeze-drying (Y5) were used as dependent
variables (responses, Table 4.1). A statistical model incorporating interactive and
polynomial terms was utilized to evaluate the formulation responses (Eq. 4.1).
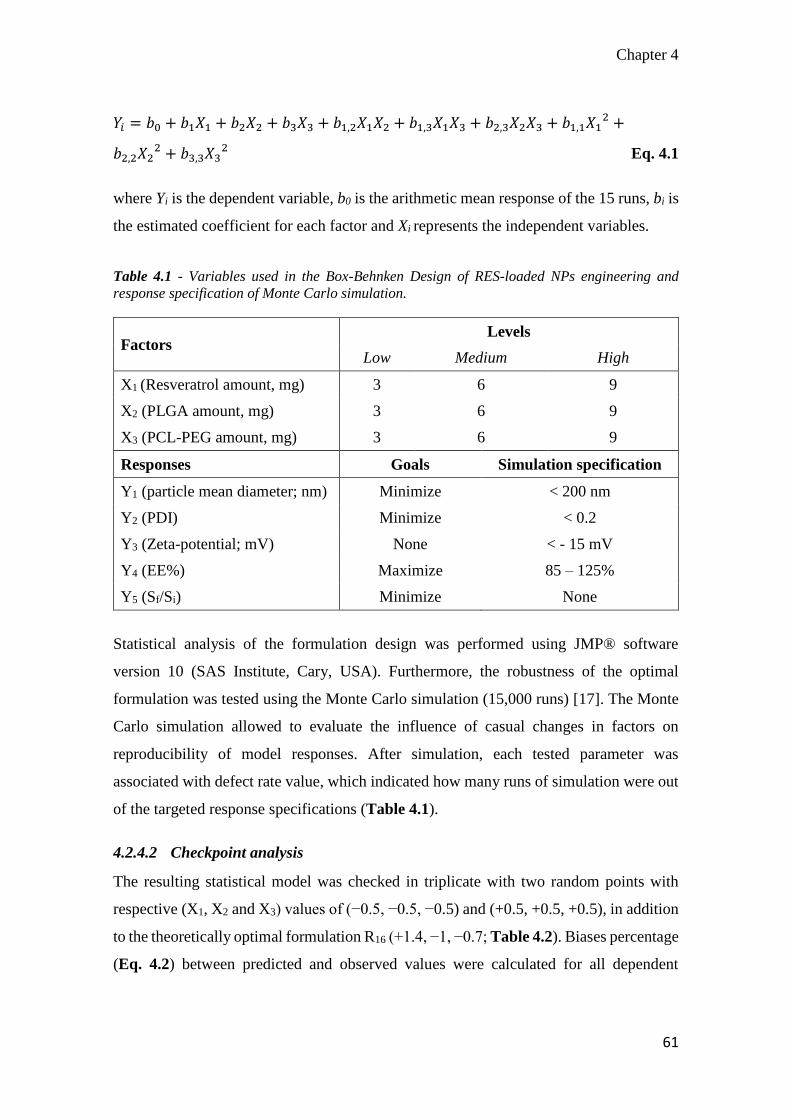
Chapter 4
61
𝑌𝑖 = 𝑏0 + 𝑏1𝑋1 + 𝑏2𝑋2 + 𝑏3𝑋3 + 𝑏1,2𝑋1𝑋2 + 𝑏1,3𝑋1𝑋3 + 𝑏2,3𝑋2𝑋3 + 𝑏1,1𝑋12 +
𝑏2,2𝑋22 + 𝑏3,3𝑋3
2 Eq. 4.1
where Yi is the dependent variable, b0 is the arithmetic mean response of the 15 runs, bi is
the estimated coefficient for each factor and Xi represents the independent variables.
Table 4.1 - Variables used in the Box-Behnken Design of RES-loaded NPs engineering and
response specification of Monte Carlo simulation.
Factors Levels
Low Medium High
X1 (Resveratrol amount, mg) 3 6 9
X2 (PLGA amount, mg) 3 6 9
X3 (PCL-PEG amount, mg) 3 6 9
Responses Goals Simulation specification
Y1 (particle mean diameter; nm) Minimize < 200 nm
Y2 (PDI) Minimize < 0.2
Y3 (Zeta-potential; mV) None < - 15 mV
Y4 (EE%) Maximize 85 – 125%
Y5 (Sf/Si) Minimize None
Statistical analysis of the formulation design was performed using JMP® software
version 10 (SAS Institute, Cary, USA). Furthermore, the robustness of the optimal
formulation was tested using the Monte Carlo simulation (15,000 runs) [17]. The Monte
Carlo simulation allowed to evaluate the influence of casual changes in factors on
reproducibility of model responses. After simulation, each tested parameter was
associated with defect rate value, which indicated how many runs of simulation were out
of the targeted response specifications (Table 4.1).
4.2.4.2 Checkpoint analysis
The resulting statistical model was checked in triplicate with two random points with
respective (X1, X2 and X3) values of (−0.5, −0.5, −0.5) and (+0.5, +0.5, +0.5), in addition
to the theoretically optimal formulation R16 (+1.4, −1, −0.7; Table 4.2). Biases percentage
(Eq. 4.2) between predicted and observed values were calculated for all dependent
Chapter 4
62
variables. The experimental responses (Yi) were compared with those predicted by the
model using the Student’s t-test.
𝐵𝑖𝑎𝑠 % =(𝑝𝑟𝑒𝑑𝑖𝑐𝑡𝑒𝑑 𝑣𝑎𝑙𝑢𝑒−𝑜𝑏𝑠𝑒𝑟𝑣𝑒𝑑 𝑣𝑎𝑙𝑢𝑒)
𝑜𝑏𝑠𝑒𝑟𝑣𝑒𝑑 𝑣𝑎𝑙𝑢𝑒𝑥100 Eq. 4.2
4.2.4.3 Statistical analysis
Polynomial equations were made by the significant response values of Y1, Y2, Y3, Y4 and
Y5 of 15 run results. One-way analysis of variance (ANOVA) and the analysis of lack of
fit were performed to ensure the model fitting. The formulation variables that significantly
affected Y1, Y2, Y3, Y4 and Y5 were identified and shown through a Pareto chart. The
theoretical optimum condition was obtained by setting the maximum desirability of
minimum Y1, Y2, Y5 and maximum Y4. Since Y3 was not critical for the proposed
formulation, the desirability was not set up (Table 4.1). Results were considered
statistically significant at p<0.05 using the Fisher’s t-test.
4.2.5 Physiochemical characterization of resveratrol-loaded
nanoparticles
4.2.5.1 Particle mean diameter, polydispersity index and zeta-potential
measurements
The particle mean diameter, PDI, and zeta-potential were measured at 25°C by dynamic
light scattering method (DLS; Zetasizer Nano ZS, Malvern Instruments Ltd,
Worcestershire, UK). According to the National Institute of Standards and Technology,
a sample with a PDI < 0.05 is considered monodisperse [18].
4.2.5.2 Percent drug encapsulation efficiency of resveratrol-loaded nanoparticles
The percent drug encapsulation efficiency (EE%; Y4) was evaluated according to a
previous method described by Youm et al. [19] with a slight modification. Briefly, the
powdered RES-loaded NPs (1 mg) were dissolved in 0.02 mL of acetone and diluted
(1:74, v/v) in a mixture of 1% v/v acetic acid aqueous solution and methanol (40:60). The
suspension was centrifuged at 15,000 rpm, 4°C for 20 min and then the supernatant was
collected for analysis. The amount of RES in the supernatant was determined by high
performance liquid chromatography (HPLC, Milford, USA) equipped with UV detector
at 305 nm. An isocratic flow of mobile phase composed of 1% v/v acetic acid aqueous
Chapter 4
63
solution/methanol (40:60, v/v) was employed at a flow rate of 1 mL/min with an injection
volume of 10 µL. The separation of RES was carried out using a Waters Spherisorb ODS2
Column, 80 Å, 5 µm, 4.6 x 250mm (Waters Corporation, Milford, USA) [20]. The
calibration curves were constructed in the range of 0.002 to 0.05mg/mL (R2=0.9982) and
0.05 to 1.00 mg/mL (R2=0.9993). The experimental loading of RES was quantified using
the peak area of each NP formulation. Theoretical RES loading (DL) and EE% were
calculated according to Eq. 4.3 and Eq. 4.4:
𝐷𝐿% =𝐷𝑟𝑢𝑔 𝑎𝑚𝑜𝑢𝑛𝑡
𝐴𝑚𝑜𝑢𝑛𝑡 𝑜𝑓 𝑝𝑜𝑙𝑦𝑚𝑒𝑟+𝑑𝑟𝑢𝑔𝑥100 Eq. 4.3
𝐸𝐸% =𝐸𝑥𝑝𝑒𝑟𝑖𝑚𝑒𝑛𝑡𝑎𝑙 𝑑𝑟𝑢𝑔 𝑙𝑜𝑎𝑑𝑖𝑛𝑔
𝑇ℎ𝑒𝑜𝑟𝑒𝑡𝑖𝑐𝑎𝑙 𝑑𝑟𝑢𝑔 𝑙𝑜𝑎𝑑𝑖𝑛𝑔𝑥100 Eq. 4.4
4.2.5.3 Powder X-ray diffraction analysis of resveratrol-loaded nanoparticles
PXRD analyses of the powdered RES-loaded NPs were performed using a MiniFlex
automated X-ray diffractometer (Rigaku, The Woodlands, USA) at room temperature.
Ni-filtered Cu Kα radiation was used at 30 kV and 15 mA. The diffraction angle covered
from 2θ = 10° to 2θ = 50° with a step size of 0.05°/step, and a count time of 2.5 sec/steps
(effectively 1.2 °/min). The samples were tested for 38 min. The diffraction patterns were
processed using Jade 8+ software (Materials Data, Inc., Livermore, USA).
4.2.6 Effect of cryoprotectants on resveratrol-loaded nanoparticle
changes during freeze-drying
In order to minimize unexpected physical changes of RES-loaded NPs, lactose, mannitol,
sucrose, and trehalose were tested to achieve suitable cryoprotection. Cryoprotectant
aqueous solutions were made at various concentrations (2%, 10%, 20%, 30%, 40%, w/v)
and mixed with aliquots of RES-loaded NP suspension before freeze-drying, to obtain the
final concentration of 1%, 5%, 10%, 15%, and 20% w/v. The suspensions were frozen at
-196°C in liquid N2 and dried at -47°C, 0.01 mbar for 24 h.
The particle mean diameter and PDI were measured by DLS before and after freeze-
drying at 25°C. The former analyses were carried out after diluting the mother suspension
(1:50, v/v) in HPLC-grade water (Fisher Scientific Inc., Pittsburgh, USA) and sonicating
the latter for 1 min. On the other hand, the particles dispersibility was optimized in
Chapter 4
64
suspending 1 mg of the powdered RES-loaded NPs in HPLC-grade water (dilution 1:50,
v/v). The colloidal supension was sonicated for 1 min with a probe-sonicator (Sonicator
300, Misonix Inc., Farmingdale, USA) and analyzed by DLS. The initial and final particle
mean diameter and PDI ratios (Sf/Si; PDIf/PDIi) were calculated as end points of the
freeze-drying process. The variabilities accepted by BBD for Y1 and Y2 were utilized as
references to evaluate the physical stability of the particles after freeze-drying. Therefore,
Sf/Si and PDIf/PDIi values up to 1.27 and 1.59 were considered out of the model space.
4.2.7 Morphological analysis of resveratrol-loaded nanoparticles
Mixtures of RES-loaded NPs and cryoprotectant (15%, w/v) were analyzed by scanning
electron microscopy (SEM). For this purpose, a small amount of the powdered RES-
loaded NP/cryoprotectant mixture was put into a grid and visualized under a Philips SEM
515 microscope (Philips/FEI, Eindhoven, USA).
4.2.8 In vitro drug release from resveratrol-loaded nanoparticles
In vitro drug release from RES-loaded NPs was performed using a dialysis method [19].
Specifically, a known amount of the powdered RES-loaded NPs (2 mg) was suspended
in an inner dialysis bag (Spectra/Por Float-A-Lyzer G2, MWCO 3.5-5 kD, Spectrum
Laboratories Inc. Rancho Dominguez, USA) containing 4 mL of 5% w/v ethanol aqueous
solution. Considering the poor water solubility of RES [9], ethanol medium was chosen
to achieve sink condition. In turn, the inner bag containing the RES-loaded NP suspension
was placed in a tube filled with 15 mL of 5% w/v ethanol solution. The system was placed
in a shaking water bath (BS-06, Lab. Companion, Des Plaines, USA) at 25°C, under
constant agitation (speed 50 rpm). At several times (1, 8, 24, 48, 72, and 96 h), aliquots
of 300 μL were withdrawn and replaced with the same volumes of fresh medium to
maintain constant the volume. The percent of RES released (%) from the NPs was
calculated at each time point as a percentage of total entrapped drug. RES nanocrystals
were used as a reference.
4.2.9 In vitro cell culture study of resveratrol-loaded nanoparticles
4.2.9.1 Cell culture
The toxicity studies were performed using cochlear cell lines as previously described [21].
Briefly, HEI-OC1 and SVK-1 cells, obtained from the House Research Institute (formerly
Chapter 4
65
House Ear Institute, Los Angeles, USA), were cultured under permissive conditions
(33°C, 10% CO2) in 75 cm2 culture flasks containing high-glucose Dulbecco’s Modified
Eagle’s Medium (DMEM; Gibco BRL, Gaithersburg, USA) and 10% v/v fetal bovine
serum (FBS; Gibco BRL, Life Technologies, Carlsbad, USA).
4.2.9.2 In vitro toxicity of native resveratrol and resveratrol-loaded nanoparticles
The in vitro toxicity of RES, blank NPs and RES-loaded NPs was investigated by the cell
viability and cellular membrane integrity assays after 24 h incubation.
The cell viability was determined by methyl tetrazolium salt (MTS) assay following the
manufacturer protocol. The assay was optimized for the cell lines used in the experiments.
Briefly, cells were transferred to 96-well plates to ensure 1x10⁴ cells per well until 80%
confluence. Then, each well was filled with 100 µL of increasing concentrations of native
RES, RES-loaded NPs (RES concentration: 0.005, 0.05, 0.5, 5, 50, 500 µM) and blank
NPs (NPs concentration: 200, 400, 600, 800, 1000 µg/mL) for 24 h of incubation at 37°C
with 5% CO2. The fresh medium and 1% of Triton X-100 were used as the control and
positive control, respectively. After incubation, 20 µL of CellTiter 96® Aqueous One
Solution Reagent (Promega, Madison, USA) was added to each well for 3 h. After the
completion of exposure period, 96-well plates were placed on a DTX 800 multimode
microplate reader (Beckman Coulter, Brea, USA) and absorbance of the formazan
product was read at 490 nm. The cell viability was determined using Eq. 4.5:
𝐶𝑒𝑙𝑙 𝑣𝑖𝑎𝑏𝑖𝑙𝑖𝑡𝑦 (%) =𝐴𝐵𝑆𝑇𝑒𝑠𝑡
𝐴𝐵𝑆𝐶𝑜𝑛𝑡𝑟𝑜𝑙× 100 Eq. 4.5
where ABSTest and ABSControl represent the absorbance of formazan detected in viable
cells treated with NPs and the culture medium alone, respectively.
The cellular membrane integrity was determined by the release of lactate dehydrogenase
(LDH) following the manufacturer protocol. Briefly, cells were seeded in a 96-well plate
and incubated with native RES, blank NPs and RES-loaded NPs using the same condition
as the MTS assay. After 24 h of incubation, the medium was removed and the cells were
washed twice with phosphate buffered saline (PBS). Then, 100 µL of CytoTox-OneTM
reagent (Promega, Madison, USA) was added in each well. The microplate was
maintained at room temperature for 10 min and 50 µL of stop solution was added to each
Chapter 4
66
well. The fluorescence was detected using the microplate reader at an excitation
wavelength of 560 nm and emission wavelength of 590 nm. For this assay, the samples
of both supernatant and cell lysate were determined in order to correct any endogenous
LDH activity in mammalian cells. The percent cell death for a given treatment is
expressed through Eq. 4.6:
𝐶𝑦𝑡𝑜𝑥𝑖𝑐𝑖𝑡𝑦 (%) =𝐸𝑥𝑝𝑒𝑟𝑖𝑚𝑒𝑛𝑡𝑎𝑙−𝐵𝑎𝑐𝑘𝑔𝑟𝑜𝑢𝑛𝑑
𝑃𝑜𝑠𝑖𝑡𝑖𝑣𝑒−𝐵𝑎𝑐𝑘𝑔𝑟𝑜𝑢𝑛𝑑𝑥100 Eq. 4.6
where Experimental, Background, and Positive represent the fluorescence of the NPs
treated, not treated, and cells treated with 1% of Triton X-100, respectively.
4.3 Results
4.3.1 Optimization of resveratrol-loaded nanoparticles
RES-loaded NPs were successfully formulated and optimized using BBD. The effect of
independent variables (X1, X2, and X3) on Y1, Y2, Y3, Y4 and Y5 were thoroughly
investigated. As showed in Table 4.2, RES-loaded NPs had Y1 and Y2 ranging from 119.1
to 329.5 nm and from 0.089 to 0.334, respectively. The Y3 was ranged from -35.2 to -
12.83 mV, Y4 from 31.11% to 141.35% and Y5 from 1.69 to 5.84. The effect of
formulation variables on the NPs physicochemical properties is shown in Figure 4.1 and
Figure 4.2.
Pareto charts show that a positive increase of Y1 can influence X1 (e.g., R3 versus R5;
Table 4.2) and X2 (e.g., R7 versus R10). On the other hand, X3 did not have any significant
effect on Y1 (p=0.8687).

Chapter 4
67
Table 4.2 – Experimental matrix, observed responses from randomized runs, optimal formulation
(R16), and checkpoint formulation (R17, R18) in the BBD (Table 4.1).
Form. X1
(mg)
X2
(mg)
X3
(mg)
Y1
(d-nm)
Y2 Y3
(mV)
Y4
(%)
Y5
R1 6 9 3 203.4 0.089 -33.00 104.18 3.55
R2 3 3 6 128.0 0.152 -29.03 31.11 4.07
R3 3 9 6 152.7 0.129 -35.20 47.43 4.68
R4 3 6 9 138.5 0.147 -30.83 43.95 5.84
R5 9 9 6 329.5 0.334 -26.00 103.08 3.01
R6 6 3 3 152.7 0.129 -28.50 98.52 4.68
R7 6 3 9 119.1 0.194 -21.15 138.45 2.34
R8 9 6 3 212.5 0.157 -31.77 107.5 4.62
R9 6 6 6 164.8 0.137 -28.77 77.62 3.79
R10 6 9 9 178.4 0.215 -26.93 116.82 3.89
R11 9 6 9 289.4 0.520 -12.83 141.35 1.69
R12 6 6 6 164.6 0.133 -27.20 95.04 3.50
R13 3 6 3 167.6 0.162 -22.33 63.99 2.73
R14 6 6 6 177.7 0.202 -23.93 90.15 2.67
R15 9 3 6 161.5 0.180 -22.97 100.18 2.45
R16 7.4 3 5.3 136.2 0.127 -26.80 100.09 3.30
R17 7.5 7.5 7.5 236.70 0.289 -24.47 100.65 2.46
R18 4.5 4.5 4.5 136.10 0.137 -27.20 75.32 4.31
Furthermore, the interactions between X1 and X2, and the intermolecular interaction of
X1 was shown to have a significant effect on Y1 (p=0.0223; p=0.0410, respectively). The
following polynomial equation was found to represent adequately Y1 variation (p=0.001,
R2 = 0.88; Eq. 4.7):
𝑌1 = 165.81 + 50.76𝑋1 + 37.83𝑋2 + 35.82𝑋1𝑋2 + 31.64𝑋12 Eq. 4.7
In contrast, Y2 was mainly influenced by X1 and X3 and the interaction between X1 and
X3 and intramolecular interaction of X1, (p=0.0006, R2=0.84; Eq. 4.8):
𝑌2 = 0.16 + 0.08𝑋1 + 0.07𝑋2 + 0.09𝑋1𝑋3 + 0.06𝑋12 Eq. 4.8

Chapter 4
68
Figure 4.1 – Pareto Charts showing standardized effect of formulation variables (X1, X2, X3) and
their interaction on Y1 (A), Y2 (B), Y3 (C), Y4 (D): x-axis showing the t ratio. Bars extending past
the vertical line indicate values reaching statistical significance.
The results also indicated that X1 (e.g., R3 versus R5) and X3 (e.g., R1 versus R10) induced
the significantly increase of Y3, whereas an increase of X2 leads to a decrease of Y3 (e.g.,
R7 versus R10). The interaction between X1 and X3 influenced significantly Y3 (p=0.0009).
The Eq. 4.9 reports all significant effects on Y3 (p=0.0002, R2=0.87):
𝑌3 = −26.69 + 2.98𝑋1 − 2.44𝑋2 + 2.98𝑋3 + 6.86𝑋1𝑋3 Eq. 4.9
Y4 increased with an increase of X1 (e.g., R3 versus R5; Table 4.2) and X3 (e.g., R4 versus
R13). Moreover, the increases of X2 did not have any significant influence on Y4
(p=0.9160). The data showed a significant interaction of X1 (p=0.0110), X3 (p=0.0082).
The interaction between X1 and X3 (p=0.0482) had a significant effect on Y4. The
following polynomial equation represents Y4 variation (p<0.0001, R2 = 0.94; Eq.4.10):
𝑌4 = 90.11 + 33.20𝑋1 + 8.30𝑋3 + 13.47𝑋1𝑋3 − 21.53𝑋12 + 22.50𝑋3
2 Eq. 4.10
Finally, Y5 results showed that the modification of the formulation composition was not
able to prevent the instability of the freeze-dried nanoparticles (Y5 > 1; Table 4.2).
Furthermore, the Pareto chart shows that Y5 was mainly influenced by X1 (p=0.0153; data
not shown).
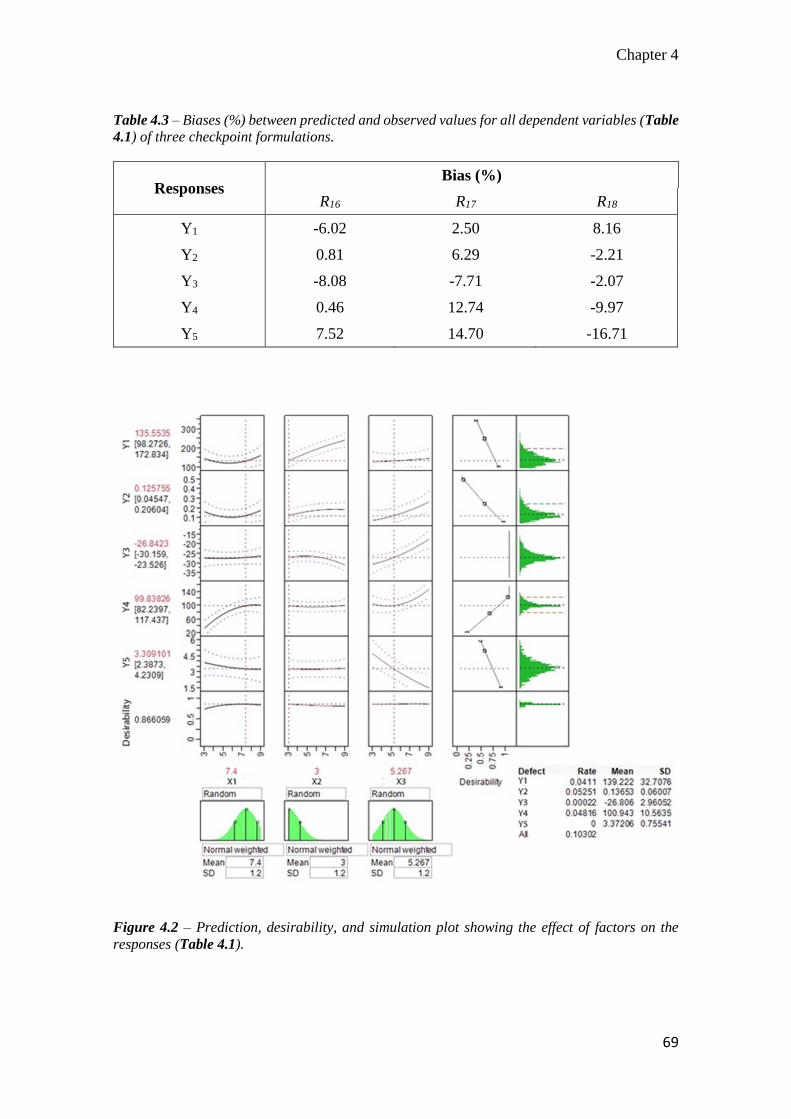
Chapter 4
69
Table 4.3 – Biases (%) between predicted and observed values for all dependent variables (Table
4.1) of three checkpoint formulations.
Responses Bias (%)
R16 R17 R18
Y1 -6.02 2.50 8.16
Y2 0.81 6.29 -2.21
Y3 -8.08 -7.71 -2.07
Y4 0.46 12.74 -9.97
Y5 7.52 14.70 -16.71
Figure 4.2 – Prediction, desirability, and simulation plot showing the effect of factors on the
responses (Table 4.1).
Chapter 4
70
As showed in Figure 4.2, the BBD optimal formulation was R16 (desirability 0.86). The
predicted responses of the optimal formulation were Y1: 135.5±37.3 nm, Y2:
0.126±0.080, Y3: -26.84±3.31 mV, Y4: 99.83±17.59 %, and Y5: 3.30±0.92 (Table 4.2).
A checkpoint analysis was performed with two random points R17, R18 and R16 (Table
4.2). The differences between predicted and measured Yi values were not statistically
significant (p>0.10). Moreover, Yi biases (%) were lower than 10%. The only exceptions
were Y5 values of R17 and R18 (Table 4.3). It might be explained by the fact that the model
lost accuracy predicting stochastic events such as physical changes that occurred during
freeze-drying [22].
According to the Monte Carlo simulation, the cumulative defect rate was near to 0.10,
indicating that less than 10% runs were discarded. This indicated a good robustness of
model prediction (Figure 4.2). Furthermore, the simulation showed Y1 (defect rate: 0.04),
Y2 (defect rate: 0.05), and Y4 (defect rate: 0.05) as the most sensitive responses to casual
errors.
4.3.2 Powder X-ray diffraction pattern analysis of resveratrol-loaded
nanoparticles
Representative PXRD patterns of the native RES, polymers, physical mixture
(RES+PLGA+PCL-PEG, 1:1:2, w/w/w; RES+blank R16, 1:1, w/w) and three RES-loaded
NPs (R2, R11, R16) are reported in Figure 4.3. As shown, native RES exhibited major
diffraction peaks at 16°, 19°, 22°, 23°, 25°, and 28°, which were consistent with previous
RES crystallography [23, 24]. PEG-PCL exhibited four characteristic peaks at 19°, 21°,
22°, and 24° as reported previously [19].
The RES and PEG-PCL diffraction peaks were present in the PXRD pattern of the
physical mixture. In contrast, these peaks disappeared in both blank NPs and RES-loaded
NPs, suggesting its presence in amorphous state. RES diffraction peaks were detected in
the physical dispersion with blank R16 and in RES-loaded NPs (R11, R16), but not in the
formulation R2

Chapter 4
71
Figure 4.3 – Powder X-ray diffraction pattern for RES-loaded NPs, physical mixtures (PM) and
individual component used in the formulation of nanoparticles. Native RES (A), RES-loaded NPs
R16 (B), RES-loaded NPs R11 (C), RES-loaded NPs R2 (D), blank NPs R16+RES physical mixture
(E), blank NPs R16 (F), RES+PLGA+PCL-PEG physical mixture (G), PCL-PEG (H), PLGA (I).
4.3.3 Effect of the cryoprotectants on the physical stability of resveratrol-
loaded nanoparticles
As shown in Figure 4.4, all the tested cryoprotectants were able to minimize the NPs
mean diameter changes after freeze-drying. The results also indicated that the
cryoprotectant effectiveness was type- and concentration-dependent. For example, 1%
w/v mannitol was correlated with low Sf/Si value (≈1.5), whereas at higher concentrations
of mannitol (15%, w/v), the Sf/Si was increased up to 2.20±0.01. Compared to the other
tested cryoprotectants, the PDIf/PDIi values were higher when stabilized with mannitol.
The cryoprotective effectiveness of sucrose, lactose and trehalose increased with
concentration. At 1% w/v of cryoprotectant, the Sf/Si values were 1.64±0.10 and
1.51±0.01 for sucrose and lactose, respectively. This value was significantly increased at
1% w/v of trehalose (1.79±0.07, p<0.05).
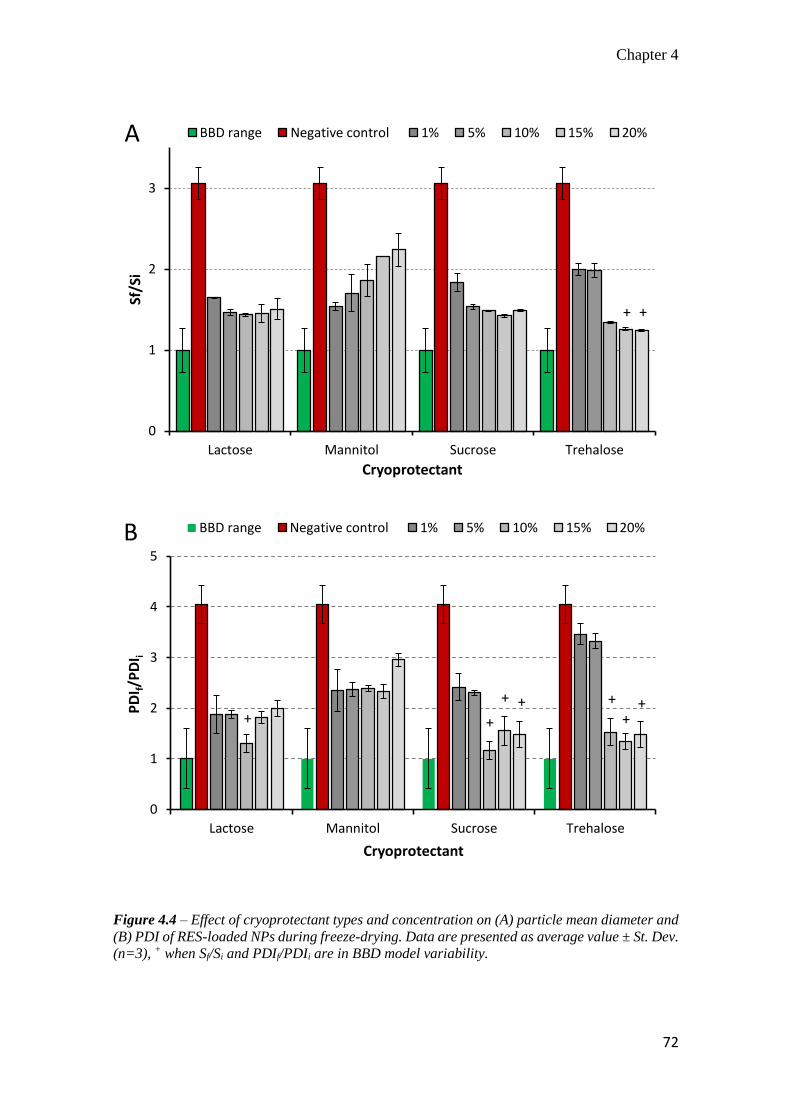
Chapter 4
72
Figure 4.4 – Effect of cryoprotectant types and concentration on (A) particle mean diameter and
(B) PDI of RES-loaded NPs during freeze-drying. Data are presented as average value ± St. Dev.
(n=3), + when Sf/Si and PDIf/PDIi are in BBD model variability.
0
1
2
3
Lactose Mannitol Sucrose Trehalose
Sf/S
i
Cryoprotectant
BBD range Negative control 1% 5% 10% 15% 20%
+ +
A
0
1
2
3
4
5
Lactose Mannitol Sucrose Trehalose
PD
I f/P
DI i
Cryoprotectant
BBD range Negative control 1% 5% 10% 15% 20%
+ +++
+
++
B
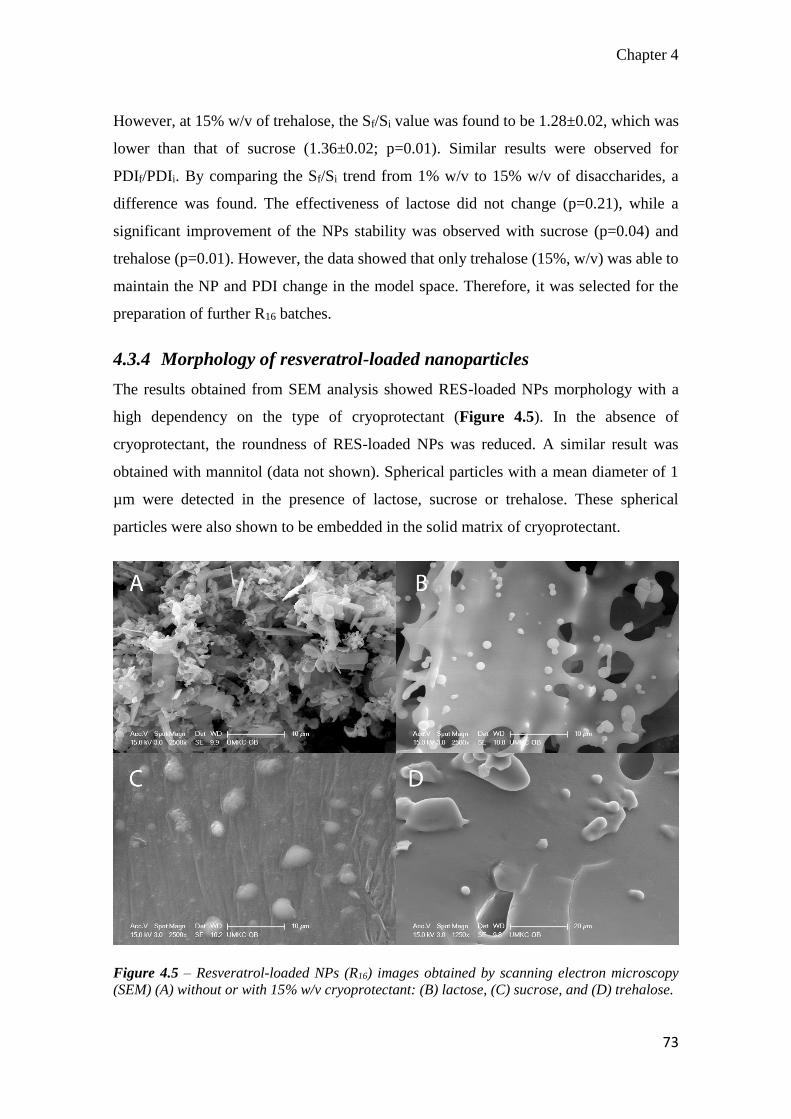
Chapter 4
73
However, at 15% w/v of trehalose, the Sf/Si value was found to be 1.28±0.02, which was
lower than that of sucrose (1.36±0.02; p=0.01). Similar results were observed for
PDIf/PDIi. By comparing the Sf/Si trend from 1% w/v to 15% w/v of disaccharides, a
difference was found. The effectiveness of lactose did not change (p=0.21), while a
significant improvement of the NPs stability was observed with sucrose (p=0.04) and
trehalose (p=0.01). However, the data showed that only trehalose (15%, w/v) was able to
maintain the NP and PDI change in the model space. Therefore, it was selected for the
preparation of further R16 batches.
4.3.4 Morphology of resveratrol-loaded nanoparticles
The results obtained from SEM analysis showed RES-loaded NPs morphology with a
high dependency on the type of cryoprotectant (Figure 4.5). In the absence of
cryoprotectant, the roundness of RES-loaded NPs was reduced. A similar result was
obtained with mannitol (data not shown). Spherical particles with a mean diameter of 1
µm were detected in the presence of lactose, sucrose or trehalose. These spherical
particles were also shown to be embedded in the solid matrix of cryoprotectant.
Figure 4.5 – Resveratrol-loaded NPs (R16) images obtained by scanning electron microscopy
(SEM) (A) without or with 15% w/v cryoprotectant: (B) lactose, (C) sucrose, and (D) trehalose.
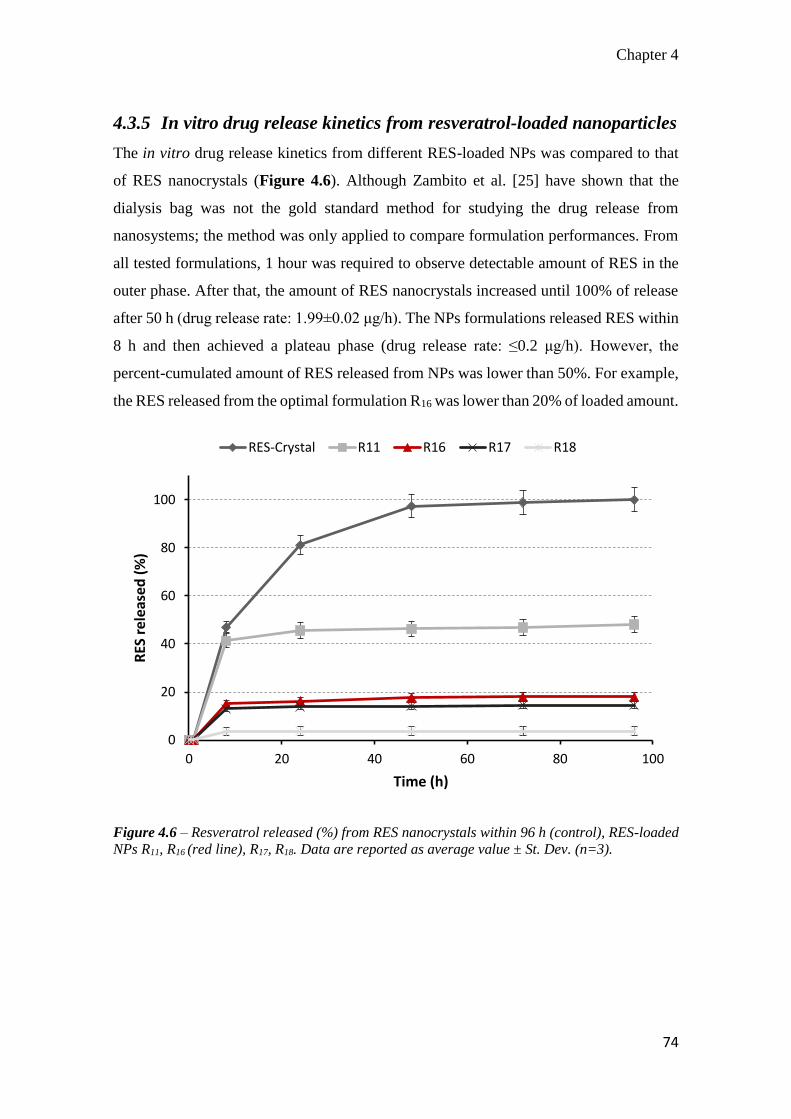
Chapter 4
74
4.3.5 In vitro drug release kinetics from resveratrol-loaded nanoparticles
The in vitro drug release kinetics from different RES-loaded NPs was compared to that
of RES nanocrystals (Figure 4.6). Although Zambito et al. [25] have shown that the
dialysis bag was not the gold standard method for studying the drug release from
nanosystems; the method was only applied to compare formulation performances. From
all tested formulations, 1 hour was required to observe detectable amount of RES in the
outer phase. After that, the amount of RES nanocrystals increased until 100% of release
after 50 h (drug release rate: 1.99±0.02 μg/h). The NPs formulations released RES within
8 h and then achieved a plateau phase (drug release rate: ≤0.2 μg/h). However, the
percent-cumulated amount of RES released from NPs was lower than 50%. For example,
the RES released from the optimal formulation R16 was lower than 20% of loaded amount.
Figure 4.6 – Resveratrol released (%) from RES nanocrystals within 96 h (control), RES-loaded
NPs R11, R16 (red line), R17, R18. Data are reported as average value ± St. Dev. (n=3).
0
20
40
60
80
100
0 20 40 60 80 100
RES
rel
ease
d (
%)
Time (h)
RES-Crystal R11 R16 R17 R18
Chapter 4
75
4.3.6 In vitro toxicity of resveratrol, blank and resveratrol-loaded
nanoparticles
As shown in Figure 4.7, the percentage of cytotoxicity induced by native RES and RES-
loaded NPs was negligible in both cell lines in comparison with blank control (p<0.05).
However, the results from blank NPs showed no-toxicity at lower concentration, whereas
cell-dependent cytotoxicity at higher concentration at higher ones.
At high concentration of NPs (600 µg/mL), HEI-OC1 cells seemed to be more sensitive
to blank NPs than SVK-1 cells. Indeed, the percentage of cell death in HEI-OC1 cells
achieved 58% when treated with 1000 μg/mL of blank NPs (Figure 4.7).
On the other hand, the cell viability was affected in a concentration-dependent manner in
both cell lines (Figure 4.8). At concentrations equal to 50 μM of RES, the cell viability
was decreased down slightly to 87% in HEI-OC1 cells. After incubation with 500 μM of
RES, the decrease of the cell viability was around 27%, which was similar to positive
control results in both cell lines (p>0.05). In the case of blank NPs, the results showed the
same trend of cytotoxicity in HEI-OC1 cells. At concentration higher than 800 μg/mL of
blank NPs, the viability of HEI-OC1 cells decreased, achieving 56% at 1000 μg/mL.
Finally, RES-loaded NPs were shown to affect the cell viability in HEI-OC1. A
significant effect on the cell viability was observed at concentrations higher than 25
µg/mL of RES-loaded NPs, corresponding to 50 µM of RES. However, the decrease of
the cell viability was less intense with RES-loaded NPs (90%) than with native RES
(p<0.05).

Chapter 4
76
Figure 4.7 – Cytotoxic effect of native RES (A), Blank NPs (B) and RES-loaded NPs (C) in SVK-
1 and HEI-OC1 cells after 24h exposure. Concentrations of RES-loaded NPs are expressed in
amount of RES loaded (µM). Data are presented as the average value ± SEM (n=5). * P<0.05
when compared with control by Student’s t-test.
0
40
80
120
Blank 0.005 0.05 0.5 5 50 500 PositiveControl
Ce
ll d
eat
h (
%)
Treatment and RES concentration (µM)
SVK-1
HEI-OC1
* *A
0
40
80
120
Blank 200 400 600 800 1000 PositiveControl
Ce
ll d
eat
h (
%)
Treatment and Blank NPs concentration (μg/mL)
SVK-1
HEI-OC1
* *
*
*
B
0
40
80
120
Blank 0.005 0.05 0.5 5 50 500 PositiveControl
Ce
ll d
eat
h (
%)
Treatment and concentration of RES loaded in NPs (µM)
SVK-1
HEI-OC1
* *C
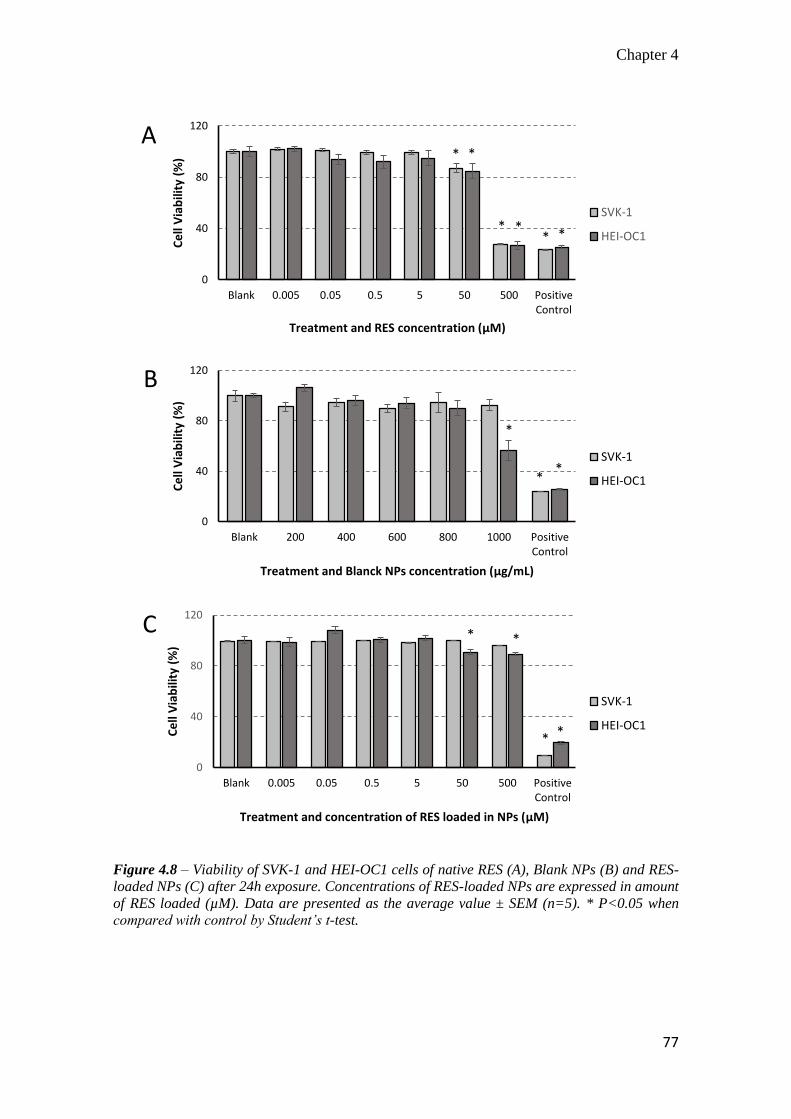
Chapter 4
77
Figure 4.8 – Viability of SVK-1 and HEI-OC1 cells of native RES (A), Blank NPs (B) and RES-
loaded NPs (C) after 24h exposure. Concentrations of RES-loaded NPs are expressed in amount
of RES loaded (µM). Data are presented as the average value ± SEM (n=5). * P<0.05 when
compared with control by Student’s t-test.
0
40
80
120
Blank 0.005 0.05 0.5 5 50 500 PositiveControl
Ce
ll V
iab
ility
(%
)
Treatment and RES concentration (µM)
SVK-1
HEI-OC1
* *
* ** *
A
0
40
80
120
Blank 200 400 600 800 1000 PositiveControl
Ce
ll V
iab
ility
(%
)
Treatment and Blanck NPs concentration (µg/mL)
SVK-1
HEI-OC1
B
*
*
*
0
40
80
120
Blank 0.005 0.05 0.5 5 50 500 PositiveControl
Ce
ll V
iab
ility
(%
)
Treatment and concentration of RES loaded in NPs (µM)
SVK-1
HEI-OC1
C * *
* *
Chapter 4
78
4.4 Discussion
The present study showed that the solvent-diffusion method was suitable for the
production of the proposed RES-loaded NPs. Moreover, all the NPs formulation prepared
showed consistency with other similar nanoparticle systems reported in literature [26].
The use of BBD as a tool for the design of experiment allowed creating a statistical model
for selecting the optimal formulation. The data obtained from checkpoint analyses (Table
4.2) and Monte Carlo simulation (Figure 4.2) demonstrated the accuracy and robustness
of the model prediction. Moreover, the BBD model could well describe how the factors
influenced the physiochemical properties of the RES-loaded NPs.
The results indicated that the amount of PLGA (X2) could directly influence the particle
mean diameter (Y1) and the NPs structure as well. As shown in a previous study, the
PLGA concentration might influence the viscosity of the organic internal phase [27]. In
the presence of PLGA, an increase of the viscosity tended to increase the size of acetone
nanodroplets dripped into the water phase, thus inducing an increase of the NPs diameter.
On the other hand, PXRD analyses showed that the crystalline diffraction peaks of PCL-
PEG were attenuated in the NPs, suggesting that the PCL-PEG chains were dispersed in
the PLGA matrix. Moreover, the BBD results revealed that PCL-PEG has a significant
influence on NPs surface. In addition, the amount of PLGA seemed to decrease the zeta-
potential of RES-loaded NPs (Figure 4.1, 4.2), whereas PCL-PEG tended to neutralize
it. Since zeta-potential has been defined as the potential difference between the aqueous
medium and the stationary layer of fluid attached to the dispersed particle [28], it was
likely to be influenced by the nature of NP surface. Therefore, the shift of the
neutralization of zeta-potential due to PCL-PEG suggested that negative charges of the
PLGA carboxylic group were shielded by the presence of the PCL-PEG molecules on the
surface of the NPs at physiological pH.
Moreover, the BBD results indicated that NPs, made of PCL-PEG and PLGA, were able
to load RES with high EE% (Table 4.2). Since the EE% (Y4) was mainly influenced by
the amount of PCL-PEG, it is possible to speculate that PCL-PEG increased the
hydrophobicity of the NPs core (Figure 4.2). This hypothesis was also supported by
published results of other nanosystems made of PCL-PEG [29, 30]. It is also interesting
to note that the EE% values were higher than 100% for DL higher than 30% (e.g., R11:
Chapter 4
79
DL 37%, EE% 141.35%; Table 4.2). Indeed, the amount of drug-loaded in the NPs matrix
depends on thermodynamic equilibrium [31, 32]. Moreover, Weigiel et al. have indicated
the RES/polymer ratio as a critical parameter for the avoidance of the drug crystallization
[23]. Therefore, NPs were not able to load RES above the thermodynamic limit of the
selected polymer mixture (close to 30% of DL); otherwise, the drug crystallization might
occur. Indeed, the PXRD analyses showed that RES was molecularly dispersed in the NP
formulations at low EE% (e.g., R2), whereas the typical RES crystal peaks appeared in
the formulations at high EE% (e.g., R11).
The significant effect of RES on the zeta-potential (Figure 4.1) suggested that drug
crystallization might occur on the surface of the NPs. This evidence also justified the
difference observed between formulations in percent of burst effect during the release
studies (Figure 4.6). Indeed, formulations with high EE% correlated well with high burst
effect. For example, the formulation R11 (EE%: 141.35%) exhibited the highest burst
effect (48.2%), whereas the lowest (3.7%) was detected with the formulation R18 (EE%:
75.32%).
Regardless to the burst effect, release studies showed that RES-loaded NPs were able to
prevent the release in the ethanol solution for more than 96 h. In comparison with other
published studies on RES-loaded micelles [29] or other RES-loaded NPs [33],
experimental results suggested that the PLGA matrix could better control the release of
RES. Indeed, if 60% of RES was released from the PCL-PEG micelles after 120 h, less
than 20% of RES was released after 96 h (R16). Moreover, the burst effect of R16 (< 20%)
was lower than that from PCL-PEG micelles (≈35%).
Indeed, the proposed NP system might be advantageous for the delivery of RES in the
cytoplasm of cochlear cells. This conclusion considers both low burst effect and
negligible amount of RES released into the physiological fluids before the cellular uptake.
Overall results indicated that RES-loaded NPs were unstable after the freeze-drying
(Sf/Si≥1.69; Table 4.2). Therefore, the utilization of cryoprotectants was required to
preserve the particle integrity [22]. The tested cryoprotectants did not show the same
effectiveness in maintaining Sf/Si and PDIf/PDIi values within the variability described
by BBD (Figure 4.4). For example, mannitol was not able to minimize the physical

Chapter 4
80
instability of the NPs, whereas the cryoprotective effectiveness of lactose, sucrose, and
trehalose was concentration-dependent (Figure 4.4).
According to the literature, a slow crystallization of mannitol has occurred after freeze-
drying at temperatures near to its glass transition (Tg), which was comparable to the
freezing temperature used during the freeze-drying process [34]. On the other hand,
disaccharides have inhibited the growth of ice crystal by the formation of cluster, thus
increasing the physical stability of the frozen compound [35]. Among the tested
disaccharides, only trehalose (> 15%, w/v) maintained the Sf/Si and PDIf/PDIi values in
the desirable BBD variability range. Therefore, trehalose might be considered as the most
effective cryoprotectant in minimizing the growth of ice crystals.
The evaluation of the NP toxicity has been very challenging over the last years [36, 37].
Hoire et al. have shown that PLGA microparticles loaded with lidocaine did not affect
the auditory and vestibular functions after their application to the round-window
membrane in guinea pigs [38]. However, the in vitro studies have shown a dosage-
dependent toxicity of nanocapsules on primary cochlear and mouse fibroblast cells,
particularly for concentration higher than 785 μg/mL [39].
In line with literature, the proposed blank NPs showed a concentration- and cell-
dependent toxicity. As showed in Figure 4.7, blank-NPs induced a significant
cytotoxicity in HEI-OC1 cells at higher concentrations (> 800 μg/mL). However, the
cytotoxicity and the cell viability were not affected by the blank NPs in SVK-1 cells
(Figure 4.7 and 4.8).
This difference in cell sensitivity might be attributed to specific characteristics of the cell
lines. HEI-OC1 cells are immortalized and derived from murine organ of Corti and can
be a specific tool to test the ototoxicity of drugs [13], whereas SVK-1 cells have been
derived from murine Stria Vascularis [14]. Since the organ of Corti cells required a
specific environmental condition to modulate the hearing process, high NPs
concentrations might alter the osmotic balance of the environment. This alteration might
be stressful for HEI-OC1 cells causing the decrease of cell viability and increase
cytotoxicity.
Chapter 4
81
On the other hand, SVK-1 cell line exhibits the morphology of epithelial cells and builds
the barrier between endolymph and blood [14]. Therefore, these cells were expected to
be more resistant than HEI-OC1 cells to stressful factors and osmotic modification
induced by nanoparticles.
The toxicity of RES was also evaluated in cochlear cell lines. Any cytotoxic effect was
observed in both cell lines at low and medium concentrations of RES (Figure 4.7).
However, the cell viability decreased in both cell lines when incubated with 100 μL of
complete medium containing higher concentrations of RES (> 50 μM; Figure 4.8). This
finding was due to a direct effect of RES on the functionality of cell mitochondria.
Lagouge et al. have shown that 50 μM of RES could increase oxidative phosphorylation
and mitochondrial biogenesis [40]. Moreover, RES concentrations higher than 100 μM
have been found to induce apoptosis and mitochondrial dysfunction in the human
hepatoblastoma cell model [41].
According to these facts and experimental results (Figure 4.8), it is reasonable to
conclude that RES concentrations below 50 μM did not affect the viability of HEI-OC1
and SVK-1 cells. Moreover, the results of RES-loaded NPs are consistent with those
obtained with native RES. RES concentrations higher than 50 µM significantly affected
the cell viability, especially the HEI-OC1 cells. Therefore, it is possible to exclude that
the effect of RES-loaded NPs on the cell viability was not due to modification of cell
environment. Indeed, the highest RES-loaded concentration tested (< 300 µg/mL) was far
from lowest cytotoxic concentration of blank NPs (600 µg/mL). Overall results suggested
that RES-loaded NPs might be taken up by the cochlear cells and release the RES into the
cytoplasm.

Chapter 4
82
4.5 Conclusion
The present study investigated the critical aspect involved in the preparation of RES-
loaded NPs intended for cochlear delivery. The application of Box-Behnken Design
allowed understanding deeply the effect of the formulation composition on the NPs
properties. Furthermore, the Monte Carlo simulation showed the robustness of optimal
formulation and highlighted which NPs properties are more sensitive to unintended errors
in the manufacturing process. Therefore, the use of Monte Carlo simulation in
combination with BBD permitted both optimizing the formulation and selecting the most
critical parameters of RES-loaded NPs. The use of trehalose (>15%, w/v) was required
to minimize the physical instability of RES-loaded NPs during the freeze-drying. The
results revealed that blank NPs could affect the viability of HEI-OC1 cells at
concentrations higher than 600 μg/mL. On the other hand, the results showed that RES
was able to decrease cell viability at concentrations higher than 50 µM. A similar
pharmacological effect was also observed when RES was loaded in NPs. These results
suggested that RES-loaded NPs were uptaken into the cells and released RES.
However, future works are required to study deeply the cell uptake mechanism and
cellular release of RES. Moreover, the effect of RES on the mitochondrial oxidative
phosphorylation should be studied to find out the effective concentration of RES that is
able to protect cochlear cells from cisplatin-induced ototoxicity.
Chapter 4
83
4.6 References
[1] Rybak, L. P., Whitworth, C. A., Mukherjea, D., and Ramkumar, V., 2007, "Mechanisms of cisplatin-induced ototoxicity and prevention," Hear. Res., 226(1–2), pp. 157-167.
[2] Knight, K. R., Kraemer, D. F., and Neuwelt, E. A., 2005, "Ototoxicity in children receiving platinum chemotherapy: underestimating a commonly occurring toxicity that may influence academic and social development," J. Clin. Oncol., 23(34), pp. 8588-8596.
[3] Bragado, P., Armesilla, A., Silva, A., and Porras, A., 2007, "Apoptosis by cisplatin requires p53 mediated p38α MAPK activation through ROS generation," Apoptosis, 12(9), pp. 1733-1742.
[4] Alam, S. A., Ikeda, K., Oshima, T., Suzuki, M., Kawase, T., Kikuchi, T., and Takasaka, T., 2000, "Cisplatin-induced apoptotic cell death in Mongolian gerbil cochlea," Hear. Res., 141(1–2), pp. 28-38.
[5] Rybak, L. P., Whitworth, C., and Somani, S., 1999, "Application of antioxidants and other agents to prevent cisplatin ototoxicity," Laryngoscope, 109(11), pp. 1740-1744.
[6] Yumusakhuylu, A. C., Yazici, M., Sari, M., Binnetoglu, A., Kosemihal, E., Akdas, F., Sirvanci, S., Yuksel, M., Uneri, C., and Tutkun, A., 2012, "Protective role of resveratrol against cisplatin induced ototoxicity in guinea pigs," Int. J. Pediatr. Otorhinolaryngol., 76(3), pp. 404-408.
[7] Erdem, T., Bayindir, T., Filiz, A., Iraz, M., and Selimoglu, E., 2011, "The effect of resveratrol on the prevention of cisplatin ototoxicity," Eur. Arch. Otorhinolaryngol., 269(10), pp. 2185-8
[8] Baur, J. A., and Sinclair, D. A., 2006, "Therapeutic potential of resveratrol: the in vivo evidence," Nat. Rev. Drug Discov., 5(6), pp. 493-506.
[9] Amri, A., Chaumeil, J. C., Sfar, S., and Charrueau, C., 2012, "Administration of resveratrol: What formulation solutions to bioavailability limitations?," J. Control. Release, 158(2), pp. 182-193.
[10] Rathore, A. S., and Winkle, H., 2009, "Quality by design for biopharmaceuticals," Nature biotechnology, 27(1), pp. 26-34.
[11] Meng, J., Sturgis, T. F., and Youan, B.-B. C., 2011, "Engineering tenofovir loaded chitosan nanoparticles to maximize microbicide mucoadhesion," Eur. J. Pharm. Sci., 44(1–2), pp. 57-67.
[12] Box, G. E. P., and Behnken, D. W., 1960, "Some New Three Level Designs for the Study of Quantitative Variables," Technometrics, 2(4), pp. 455-475.
[13] Kalinec, G. M., Webster, P., Lim, D. J., and Kalinec, F., 2003, "A cochlear cell line as an in vitro system for drug ototoxicity screening," Audiol. Neurootol., 8(4), pp. 177-189.
[14] Rivolta, M. N., and Holley, M. C., 2002, "Cell lines in inner ear research," J. Neurobiol., 53(2), pp. 306-318.
[15] Fessi, H., Puisieux, F., Devissaguet, J. P., Ammoury, N., and Benita, S., 1989, "Nanocapsule formation by interfacial deposition following solvent displacement," Int. J. Pharm., pp. 55:R51-R54.
[16] List, M., and Sucker, H., 1988, "Pharmaceutical injectable hydrosols containing water-insoluble active agents," Sandoz S. A., Switz. . p. 26 pp.
[17] Kappele, W. D., "Setting robust process specifications using design of experiments and Monte Carlo techniques," Proc. 2010 AIChE Spring Meeting and 6th Global Congress on Process Safety, 10AIChE.

Chapter 4
84
[18] Hackley, V., and Ferraris, C., 2001, "The use of nomenclature in dispersion science and technology, NIST Recommended Practice Guide: SP."
[19] Youm, I., Murowchick, J. B., and Youan, B. B., 2012, "Entrapment and release kinetics of furosemide from pegylated nanocarriers," Colloids Surf. B Biointerfaces, 94, pp. 133-142.
[20] Chen, X., He, H., Wang, G., Yang, B., Ren, W., Ma, L., and Yu, Q., 2007, "Stereospecific determination of cis- and trans-resveratrol in rat plasma by HPLC: application to pharmacokinetic studies," Biomed. Chromatogr., 21(3), pp. 257-265.
[21] Kalinec, G. M., Webster, P., Lim, D. J., and Kalinec, F., 2003, "A Cochlear Cell Line as an in vitro System for Drug Ototoxicity Screening," Audiol. Neurootol., 8, pp. 177-189.
[22] Abdelwahed, W., Degobert, G., Stainmesse, S., and Fessi, H., 2006, "Freeze-drying of nanoparticles: formulation, process and storage considerations," Adv. Drug Deliv. Rev., 58(15), pp. 1688-1713.
[23] Wegiel, L. A., Mauer, L. J., Edgar, K. J., and Taylor, L. S., 2013, "Crystallization of amorphous solid dispersions of resveratrol during preparation and storage-Impact of different polymers," J. Pharm. Sci., 102(1), pp. 171-184.
[24] Zhang, X.-P., Le, Y., Wang, J.-X., Zhao, H., and Chen, J.-F., 2013, "Resveratrol nanodispersion with high stability and dissolution rate," LWT - Food Science and Technology, 50(2), pp. 622-628.
[25] Zambito, Y., Pedreschi, E., and Di Colo, G., 2012, "Is dialysis a reliable method for studying drug release from nanoparticulate systems?-A case study," International journal of pharmaceutics, 434(1-2), pp. 28-34.
[26] Riley, T., Govender, T., Stolnik, S., Xiong, C. D., Garnett, M. C., Illum, L., and Davis, S. S., 1999, "Colloidal stability and drug incorporation aspects of micellar-like PLA–PEG nanoparticles," Colloids Surf. B Biointerfaces, 16(1–4), pp. 147-159.
[27] Mondal, N., Samanta, A., Pal, T. K., and Ghosal, S. K., 2008, "Effect of different formulation variables on some particle characteristics of poly (DL-lactide-co-glycolide) nanoparticles," Yakugaku Zasshi, 128(4), pp. 595-601.
[28] McNaught, A. D., and Wilkinson, A., 1997, IUPAC. Compendium of Chemical Terminology, Blackwell Scientific Publications, Oxford.
[29] Lu, X., Ji, C., Xu, H., Li, X., Ding, H., Ye, M., Zhu, Z., Ding, D., Jiang, X., Ding, X., and Guo, X., 2009, "Resveratrol-loaded polymeric micelles protect cells from Aβ-induced oxidative stress," Int. J. Pharm., 375(1-2), pp. 89-96.
[30] Kim, B. K., Lee, J. S., Oh, J. K., and Park, D. J., 2009, "Preparation of resveratrol-loaded poly(ε-caprolactone) nanoparticles by oil-in-water emulsion solvent evaporation method," Food Science and Biotechnology, 18(1), pp. 157-161.
[31] Kumar, V., and Prud'homme, R. K., 2008, "Thermodynamic limits on drug loading in nanoparticle cores," J. Pharm. Sci., 97(11), pp. 4904-4914.
[32] Vijay, N., Murowchick, J. B., and Youan, B. B., 2010, "Thermodynamics of drug nanoencapsulation: case study of phenytoin-poly (D, L-lactide) nanocarrier," Curr. Drug Deliv., 7(5), pp. 343-354.
[33] Sanna, V., Siddiqui, I. A., Sechi, M., and Mukhtar, H., 2013, "Resveratrol-Loaded Nanoparticles Based on Poly(epsilon-caprolactone) and Poly(d,l-lactic-co-glycolic acid)–Poly(ethylene glycol) Blend for Prostate Cancer Treatment," Mol. Pharm., 10(10), pp. 3871-3881.
Chapter 4
85
[34] Kim, A. I., Akers, M. J., and Nail, S. L., 1998, "The physical state of mannitol after freeze-drying: effects of mannitol concentration, freezing rate, and a noncrystallizing cosolute," J. Pharm. Sci., 87(8), pp. 931-935.
[35] Tsutomu Uchida, S. T. M. N. a. K. G., 2012, "Freezing Properties of Disaccharide Solutions: Inhibition of Hexagonal Ice Crystal Growth and Formation of Cubic Ice," Crystallization and Materials Science of Modern Artificial and Natural Crystals, E. Borisenko, ed., InTech.
[36] Hu, Y. L., and Gao, J. Q., 2010, "Potential neurotoxicity of nanoparticles," Int. J. Pharm., 394(1-2), pp. 115-121.
[37] FDA, 2011, "Investigation of Potential Toxic Effects of Engineered Nanoparticles and Biologic Microparticles in Blood and Their Biomarker Applications.."
[38] Horie, R. T., Sakamoto, T., Nakagawa, T., Tabata, Y., Okamura, N., Tomiyama, N., Tachibana, M., and Ito, J., 2010, "Sustained delivery of lidocaine into the cochlea using poly lactic/glycolic acid microparticles," Laryngoscope, 120(2), pp. 377-383.
[39] Zhang, Y., Zhang, W., Löbler, M., Schmitz, K. P., Saulnier, P., Perrier, T., Pyykkö, I., and Zou, J., 2011, "Inner ear biocompatibility of lipid nanocapsules after round window membrane application," Int. J. Pharm., 404(1-2), pp. 211-219.
[40] Lagouge, M., Argmann, C., Gerhart-Hines, Z., Meziane, H., Lerin, C., Daussin, F., Messadeq, N., Milne, J., Lambert, P., Elliott, P., Geny, B., Laakso, M., Puigserver, P., and Auwerx, J., 2006, "Resveratrol Improves Mitochondrial Function and Protects against Metabolic Disease by Activating SIRT1 and PGC-1α," Cell, 127(6), pp. 1109-1122.
[41] Ma, X., Tian, X., Huang, X., Yan, F., and Qiao, D., 2007, "Resveratrol-induced mitochondrial dysfunction and apoptosis are associated with Ca2+ and mCICR-mediated MPT activation in HepG2 cells," Mol. Cell. Biochem., 302(1-2), pp. 99-109
Chapter 4
86
4.7 Appendix 4.1: Ferrocene-loaded nanocarrier as probe for
cochlear biodistribution study
The contents of this appendix was presented as poster at the 2013 AAPS Annual Meeting
and Exposition; November 10-14, 2013; San Antonio TX, USA; Poster W4103.
Purpose: The fate of drug nanocarriers (NCs) in the inner ear remains elusive. The aim
of the work is to develop ferrocene (FER)-loaded NCs to elucidate the cochlear
biodistribution of such NCs.
Methods: FER-NCs were prepared by surfactant free solvent-diffusion technique using
a mixture of PLGA/PCL-PEG (ratios 1/1, 1/2) dissolved in acetone. FER-NCs were
washed and freeze-dried. TEM analyses were carried out to study the FER-NC
morphology. Lactose, mannitol, sucrose were tested at different
cryoprotectant/nanocarrier ratios (0/1, 1/1, 3/1, 5/1) to stabilize FER-NCs during freeze-
drying. The stability of the FER-NCs was checked by measuring particle size and zeta-
potential (ZP) immediately after water dispersion and after 12 days. FER-NCs were
placed in the round window (RW) niche of the middle ear in guinea pigs. After 48 hours,
the animals were sacrificed, the cochlea isolated and prepared for TEM.
Results: The Ferrocene-loaded NCs had a mean diameter of 201.2±57.7, PDI of
0.328±0.074 and ZP of -20.2±4.8mV. PLGA/PCL-PEG NCs of 1/2 allowed higher EE%
(85.50±11.15) than ones made with 1/1 ratio (42.93±3.65). The FER-NCs appeared
spherical with smooth surface. All cryoprotectants increased RES-NCs stability during
the freeze-drying process. However, lactose, especially when used in 3/1 ratio, was more
effective than other ones after dispersion and during 12-day stability studies. FER-NCs
crossed the RW membrane and were found adjacent or in the cells lining the scala tympani
of the cochlea (Figure 4.A.1). Hearing was normal after RW placement of NCs (Figure
4.A.2).

Chapter 4
87
Conclusion: FER-NCs were successfully prepared by emulsion-diffusion technique and
the 1/2 PLGA/PLC-PEG ratio was selected in term of best encapsulation efficiency.
Moreover, lactose (3/1 cryoprotectant/NCs ratio) guaranteed FER-NCs stability during
freeze-drying process and maintained FER-NCs stable in suspension for at least 12 days.
When placed into the RW niche, FER-NCs enter the cochlea and do not appear to cause
hearing loss.
Figure 4.A.1 - Distribution of FER-loaded NCs in cochlear tissue (Guinea pig).

Chapter 4
88
Figure 4.A.2 - Hearing thresholds by auditory brainstem responses (ABRs) after FER-loaded NC
injection into the middle ear (Guinea pig).
The formulative studies were carried out in the Laboratory of Future Nanomedicines and
Theoretical Chronopharmaceutics directed by prof. Bi-Botti C. Youan, Division of
Pharmaceutical Sciences, University of Missouri Kansas City, 2464 Charlotte St., Kansas City,
MO 64108, USA.
The in vivo biodistribution study was carried out in the laboratory directed by prof. Michael Anne
Gratton, Department of Otolaryngology-Head and Neck Surgery, School of Medicine, Saint Louis
University, 3635 Vista Ave, St. Louis, MO 63110,USA.
Chapter 5
89
5 Dermal and transdermal delivery of
morphine derivatives: a qualitative
structure-penetration relationship
Chapter 5
90
5.0 Abstract
Opioids have been used widely for pain management in patients with degenerative or
neoplastic diseases. Recent studies showed that opioids are also effective in the treatment
of cutaneous lesions. Aiming to select the most suitable candidate for cutaneous painful
syndromes, the in vitro permeability of eight different morphine derivatives (morphine,
codeine, hydromorphone, hydrocodone, oxymorphone, oxycodone) through human
epidermis was studied to elucidate the influence of four different substituents (e.g., 3-
methoxyl, 6-carbonyl, 14-hydroxyl, 7,8-didehydro) on the drug permeation and retention.
The in vitro permeation studies were performed using the Franz diffusion cells. The donor
phases were aqueous saturated solutions of morphine derivatives. At the end of
experiment (i.e., 24 h), the maximum flux (Jmax), the permeation coefficient (pKp), the
drug concentration in the epidermis at the steady state (Epi Qss) and normalized by drug
solubility (RQ/S) were calculated and a statistical analysis of possible structure-
permeability relationship was performed. In particular, the statistical analyses indicated
that 3-methoxyl group played a key role in governing the skin penetration of morphine
derivatives through human skin, since it increased the permeation flux and decreased the
drug retention. Moreover, the retention/permeation affinity index confirmed morphine as
suitable candidate and suggested hydromorphone as an alternative drug for treating
cutaneous painful symptomatology.
The synthesis of morphine derivatives was carried out in the Laboratory directed by prof. Marco
De Amici, Department of Pharmaceutical Sciences, University of Milan, via Mangiagalli, 25 –
20133, Milan (Italy).
The penetration study was carried out in the Laboratory directed by prof. Luisa Montanari,
Department of Pharmaceutical Sciences, University of Milan, via G. Colombo, 71 – 20133, Milan
(Italy).

Chapter 5
91
Abbreviations
AcOEt Ethyl acetate
CH2Cl2 Dichloromethane
CHCl3 Chloroform
CDCl3 Deuterochloroform
CH3CN Acetonitrile
DMSO-d6 Hexadeuterodimethyl sulfoxide
Et2O Diethyl ether
EtOH Ethanol
HCl Hydrochloric acid
iPrOH Isopropanol
KCl Potassium chloride
KOH Potassium hydroxide
MeOH Methanol
Na2CO3 Sodium carbonate
NaHCO3 Sodium bicarbonate
NaN3 Sodium azide
Na2SO4 Sodium sulfate
oct Octan-1-ol
Tg Glass transition temperature
THF Tetrahydrofuran
rt Room temperature
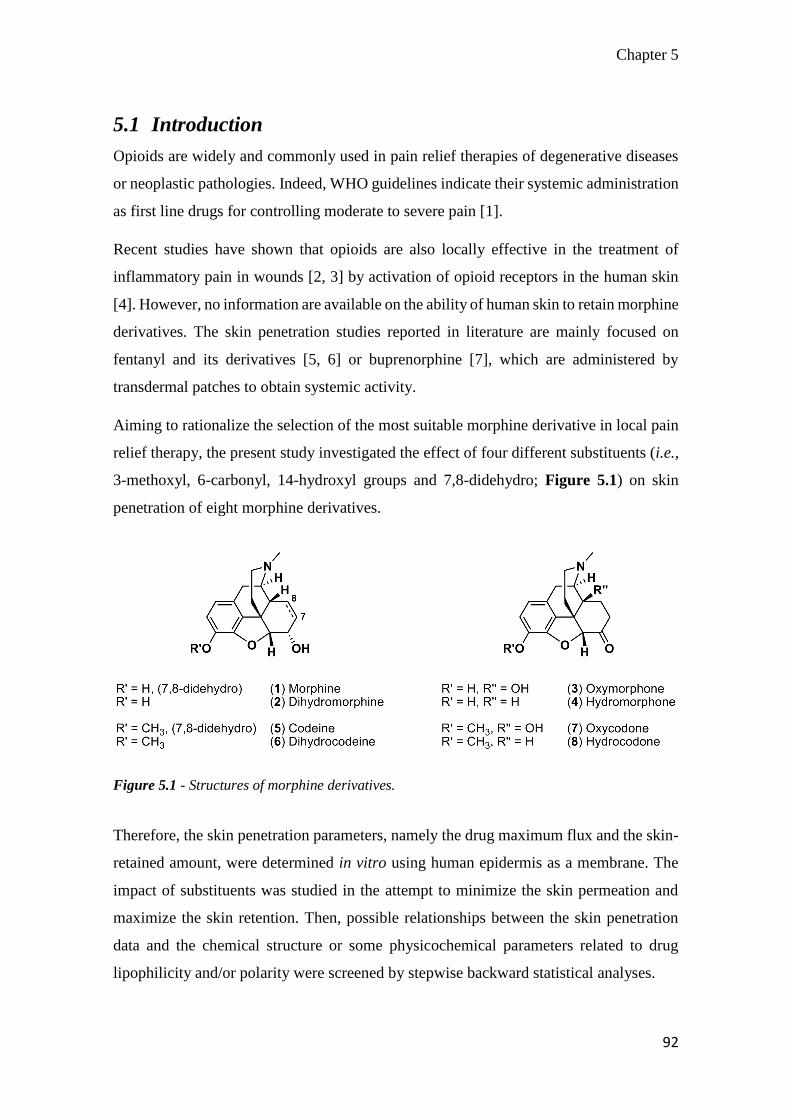
Chapter 5
92
5.1 Introduction
Opioids are widely and commonly used in pain relief therapies of degenerative diseases
or neoplastic pathologies. Indeed, WHO guidelines indicate their systemic administration
as first line drugs for controlling moderate to severe pain [1].
Recent studies have shown that opioids are also locally effective in the treatment of
inflammatory pain in wounds [2, 3] by activation of opioid receptors in the human skin
[4]. However, no information are available on the ability of human skin to retain morphine
derivatives. The skin penetration studies reported in literature are mainly focused on
fentanyl and its derivatives [5, 6] or buprenorphine [7], which are administered by
transdermal patches to obtain systemic activity.
Aiming to rationalize the selection of the most suitable morphine derivative in local pain
relief therapy, the present study investigated the effect of four different substituents (i.e.,
3-methoxyl, 6-carbonyl, 14-hydroxyl groups and 7,8-didehydro; Figure 5.1) on skin
penetration of eight morphine derivatives.
Figure 5.1 - Structures of morphine derivatives.
Therefore, the skin penetration parameters, namely the drug maximum flux and the skin-
retained amount, were determined in vitro using human epidermis as a membrane. The
impact of substituents was studied in the attempt to minimize the skin permeation and
maximize the skin retention. Then, possible relationships between the skin penetration
data and the chemical structure or some physicochemical parameters related to drug
lipophilicity and/or polarity were screened by stepwise backward statistical analyses.

Chapter 5
93
Most of the models in literature demonstrated the correlation between diffusion through
the human skin and the drug lipophilicity (log P) and molecular weight [8, 9]. In other
models, log P was more explicitly represented introducing the terms of dipolarity,
polarizability, hydrogen bond donor and acceptor activity, and molar refractivity [10];
whereas further parameters related to the permeant solubility were also taken into
consideration [11].
Unlike permeation process, the drug retention in the human skin has not been widely
investigated. On the best of our knowledge, only few papers proposed to model skin
retention of specific classes of molecules like alcohols and steroids [12, 13].
However, Cross and Robert demonstrated that drug retention was significantly affected
by dermal clearance [13]. The authors compared the concentration of different alcohols
and steroids in the viable epidermis obtained from two physiological models of blood
flow in human skin, namely the full-thickness skin and the epidermal membrane. The
former represents an in vivo infinite dermal vasoconstriction (low dermal clearance),
whereas the latter is a model of in vivo infinite dermal perfusion (high dermal clearance).
The published results showed that full thickness skin permitted to achieve higher drug
concentration in the epidermis layer than other model, suggesting that epidermis retention
was increased by low dermal clearance.
In the present study, the epidermis was selected as model membrane for the retention
study of morphine derivatives, because it permitted to better clarify the effects of
chemical structure on retention process in comparison to other skin models with higher
dermal clearance.
5.2 Materials and methods
5.2.1 Materials
Morphine hydrochloride, codeine phosphate, dihydrocodeine bitartrate and oxycodone
hydrochloride were purchased from SALAARS S.p.A. (Como, Italy). Standard KOH (0.5
N) and HCl (0.5 N) were prepared from Titrisol volumetric vials purchased from VWR
International PBI s.r.l. (Milan, Italy). All other reagents and solvents were used as
received without further purification.

Chapter 5
94
5.2.2 Preparation and characterization of the morphine derivatives
5.2.2.1 Synthesis
The progress of reactions was monitored by TLC analyses performed on commercial
silica gel 60 F254 aluminum sheets (Merck KGaA, Darmstadt, Germany); spots were
visualized by UV detection and further evidenced by spraying with a dilute alkaline
potassium permanganate solution or phosphomolybdic acid in ethanol solution, and the
Dragendorff reagent. 1H NMR and 13C NMR spectra were recorded with a Varian
Mercury 300 (1H, 300.063; 13C, 75.451 MHz) spectrometer at 20°C; the deuterated
solvents were indicated for each compound. Chemical shifts (δ) are expressed in ppm and
coupling constants (J) in Hz. ESI-MS spectra were obtained on a Varian 320 LC–MS/MS
instrument; data are reported as mass-to-charge ratio (m/z) of the corresponding positively
charged molecular ions.
Morphine [(5α,6α)-7,8-didehydro-4,5-epoxy-17-methylmorphinan-3,6-diol, 1]. Commercially
available morphine hydrochloride (1.000 g, 3.108 mmol) was dissolved in Na2CO3 aq. sat. and
vigorously extracted with CHCl3/iPrOH (9:1, 50 mL х 5). The organic phases were collected, dried
over anhydrous Na2SO4 and evaporated under reduced pressure to afford a viscous yellow oil that
was recrystallized from Et2O to give pure morphine base (1). Yield: 0.822 g (93%); white solid; 1H
NMR, 13C NMR and MS spectra were identical to those reported in the literature [14].
Dihydromorphine [3,6-dihydroxy-(5α,6α)-4,5-epoxy-17-methylmorphinan, 2]. A stirred
suspension of morphine hydrochloride (1.031 g, 3.204 mmol) and 10% Pd/C (50 mg) in MeOH
(25 mL) was evacuated and hydrogenated under pressure (50 psi) in a Parr apparatus for 4 h. The
reaction mixture was then passed through a pad of Celite® and the filtrate was concentrated under
reduced pressure. This crude material was dissolved in NaHCO3 aq. sat. and extracted with
CHCl3/iPrOH (9:1, 30 mL х 5), the organic phases were collected, dried over anhydrous Na2SO4
and evaporated under reduced pressure to afford a yellow oil which was recrystallized from CH3CN
to give pure dihydromorphine (2). Yield: 0.830 g (90%); pale yellow solid, Rf = 0.23
(CH2Cl2/MeOH = 7:3); 1H NMR (300 MHz, CDCl3): = 6.66 (d, 1H, J = 8.0 Hz), 6.55 (d, 1H,
J = 8.0 Hz), 4.60 (d, 1H, J = 5.2 Hz), 4.00 (m, 1H), 3.15 (m, 1H), 2.97 (d, 1H, J = 18.4
Hz), 2.59 (dd, 1H, J = 12.4, 3.8 Hz), 2.42 (s, 3H), 2.40 (dd, 1H, J = 18.4, 6.0 Hz), 2.28
(m, 2H), 1.95 (dt, 1H, J = 12.4, 5.2 Hz), 1.69 (ddd, 1H, J = 12.4, 3.8, 1.9 Hz), 1.45 (m,
3H), 1.08 (m, 1H) ppm; 13C NMR (75 MHz, DMSO-d6): = 146.03, 137.98, 130.07,

Chapter 5
95
125.19, 117.98, 116.69, 89.94, 66.11, 58.92, 46.03, 42.77, 42.01, 38.19, 37.25, 25.61,
19.61, 19.48 ppm; ESI-MS: m/z [M+H]+ calcd for [C17H22NO3]+ 288.16, found 288.1. 1H
NMR, 13C NMR and MS spectra were identical to those reported in the literature [15, 16].
Oxymorphone [4,5-α-epoxy-3,14-dihydroxy-17-methylmorphinan-6-one, 3]. This compound
was synthesized from commercially available oxycodone hydrochloride following a procedure
already reported in the literature [17]. Yield: 0.799 g (93%) from 1.004 g of oxycodone
hydrochloride; white solid; Rf = 0.45 (CH2Cl2/MeOH = 9:1); 1H NMR (300 MHz, CDCl3): =
6.72 (d, 1H, J = 8.0 Hz), 6.61 (d, 1H, J = 8.0 Hz), 5.30 (bs, 2H), 4.68 (s, 1H), 3.15 (d, 1H,
J = 18.4 Hz), 3.04 (dt, 1H, J = 5.2, 14.4 Hz), 2.88 (d, 1H, J = 5.6 Hz), 2.56 (dd, 1H, J =
6.0, 18.8 Hz), 2.46 (m, 5H), 2.31 (dt, 1H, J = 2.8, 14.4 Hz), 2.21 (m, 1H), 1.88 (ddd, 1H,
J = 3.2, 5.2, 13.6 Hz), 1.64 (m, 2 H) ppm; 13C NMR (75 MHz, DMSO-d6): = 208.7,
143.5, 139.5, 129.2, 119.1, 117.2, 89.3, 70.0, 63.9, 49.6, 45.2, 42.3, 39.9, 35.6, 31.0, 29.9,
21.5 ppm; ESI-MS: m/z [M+H]+ calcd for [C17H20NO4]+ 302.14, found 302.1. 1H NMR,
13C NMR and MS spectra were identical to those reported in literature [18].
Hydromorphone [4,5-α-epoxy-3-hydroxy-17-methyl morphinan-6-one, 4]. This compound was
prepared starting from morphine base (1) by a known procedure [19]. Yield: 1.089 g (82%) from
1.324 g of morphine; white solid; Rf = 0.22 (CH2Cl2/MeOH = 3:7); 1H NMR (300 MHz, CDCl3):
= 6.71 (d, 1H, J = 8.3 Hz), 6.61 (d, 1H, J = 8.3 Hz), 4.66 (s, 1H), 3.30 (m, 1H), 3.04 (d,
1H, J = 18.7 Hz), 2.69 (m, 2H), 2.48 (s, 3H), 2.40 (m, 2H), 2.27 (m, 2H), 1.83 (m, 2H),
1.25 (m, 2H) ppm; 13C NMR (75 MHz, DMSO-d6): = 209.1, 144.0, 139.4, 127.6, 124.6,
119.4, 117.1, 90.5, 58.4, 46.5, 46.3, 42.7, 41.5, 40.0, 34.9, 25.2, 19.6 ppm; ESI-MS: m/z
[M+H]+ calcd for [C17H20NO3]+ 286.14, found 286.1. 1H NMR, 13C NMR and MS spectra
were identical to those reported in literature [20, 21].
Codeine [(5α,6α)-7,8-didehydro-4,5-epoxy-3-methoxy-17-methylmorphinan-6-ol, 5].
Commercially available codeine phosphate (1.6209 g, mmol) was dissolved in Na2CO3 aq. sat.
and extracted with AcOEt (50 mL х 3). The organic phases were collected, dried over anhydrous
Na2SO4 and evaporated under reduced pressure to afford a viscous oil which was recrystallized
from Et2O to give pure codeine base (5). Yield: 0.959 g (78%); white solid; 1H NMR, 13C NMR
and MS spectra were identical to those reported in literature [22].

Chapter 5
96
Dihydrocodeine [4,5-α-epoxy-3-methoxy-17-methylmorphinan-6-ol, 6]. Commercially
available dihydrocodeine bitartrate (1.119 g, 2.479 mmol) was dissolved in Na2CO3 aq. sat. and
extracted with AcOEt (50 mL х 3). The organic phases were collected, dried over anhydrous
Na2SO4 and evaporated under reduced pressure to afford a viscous yellow oil which was triturated
with Et2O to give pure dihydrocodeine base (6) as a white glassy solid. Yield: 0.720 g (96%); white
solid; 1H NMR, 13C NMR and MS spectra were identical to those reported in literature [23].
Oxycodone [4,5-α-epoxy-14-hydroxy-3-methoxy-17-methylmorphinan-6-one, 7].
Commercially available oxycodone hydrochloride (0.598 g, 1.702 mmol) was dissolved in Na2CO3
aq. sat. and vigorously extracted with AcOEt (35 mL х 3). The organic phases were collected, dried
over anhydrous Na2SO4 and evaporated under reduced pressure to afford a viscous oil that was
recrystallized from Et2O to give pure oxycodone base (7). Yield: 0.482 g (90%); white solid; 1H
NMR, 13C NMR and MS spectra were identical to those reported in literature [24].
Hydrocodone [4,5-α-epoxy-3-methoxy-17-methylmorphinan-6-one, 8]. To a solution of
dihydrocodeine base (6) (0.734 g, 2.435 mmol) in dry CH2Cl2 (20 mL) Dess-Martin periodinane
(1.033 g, 2.435 mmol) was added at 0°C and the reaction mixture was stirred for 30 min, whereupon
it was allowed to warm to rt and stirred for further 2 h. The reaction mixture was diluted with
CH2Cl2, acidified with 1 N HCl and washed with Et2O (30 mL х 3). The acidic aqueous layer was
then basified with Na2CO3 and extracted with CH2Cl2 (30 mL х 3). The organic phases were
collected, dried over anhydrous Na2SO4 and evaporated under reduced pressure to afford a yellow
oil which was recrystallized from Et2O to provide pure hydrocodone (8). Yield: 0.649 g (89%); pale
yellow solid; Rf = 0.35 (CH2Cl2/MeOH = 85:15); 1H NMR (300 MHz, CDCl3): = 6.69 (d, 1H, J
= 8.1 Hz), 6.62 (d, 1H, J = 8.1 Hz), 4.64 (s, 1H), 3.88 (s, 3H), 3.22 (m, 1H), 3.02 (d, 1H, J = 18.3
Hz), 2.62 (m, 2H), 2.43 (s, 3H), 2.39 (m, 1H), 2.30 (m, 1 H), 2.17 (m, 2H), 1.83 (m, 2H), 1.24 (m,
2H) ppm; 13C NMR (75 MHz, CDCl3): = 208.1, 145.6, 143.1, 127.4, 126.4, 120.0, 114.7, 91.6,
59.5, 56.9, 53.7, 47.1, 43.1, 42.8, 40.4, 35.6, 25.8, 20.2 ppm. ESI-MS: m/z [M+H]+ calcd for
[C18H22NO3]+ 300.16, found 300.1. 1H NMR, 13C NMR and MS spectra were identical to those
reported in the literature [23].
Chapter 5
97
5.2.2.2 Determination of ionization constants and lipophilicity
The water-saturated octan-1-ol (partition-coefficient grade) was used in all partition experiments.
The KOH was standardized by titration with potassium hydrogen phthalate, while pH electrode
standardization was performed daily by titrating a known amount of HCl with standardized KOH.
The titration instrument Sirius PCA200 (Sirius Analytical Instruments, Forrest Row, UK) was
employed to perform the pKa and log P assays (25.0±0.1 °C under argon atmosphere). It was
equipped with a semi-micro Ross-type pH electrode, quartz precision dispensers for titrant addition,
a temperature probe and a micro mechanical stirrer. The operational pH scale was converted to the
concentration scale using a four-parameter equation [25].
Alkalimetric sample titrations were performed in 0.15M KCl employing sample concentrations in
the low mM-high µM range. All compounds (1-8) were sufficiently water soluble to perform
normal aqueous titrations. All octan-1-ol/water volume ratios were optimized to allow partitioning
in the octan-1-ol phase and a proper shift of the aqueous titration curve. The weighting scheme and
the iterative least squares refinement of the titration curves both in water and in octan-1-ol/water
biphasic partition system have been reported previously [26].
The aqueous ionization constants (pKa) were estimated from the Bjerrum difference plots and they
were refined by a non-linear multi titration-set least squares procedure [26]. The partition coefficient
(log P) was determined from the difference between the aqueous pKa of the species and the apparent
pKa (poKa) estimated from a titration in the presence of the partition solvent. The log P constants
were refined using data from three or more titrations, each with a different octan-1-ol/water volume
ratio and are reported together with their standard deviations.
5.2.2.3 DSC analyses
Thermal stability was estimated using Differential Scanning Calorimetry (DSC1, Mettler
Toledo, Greifensee, Switzerland). Samples of about 2.5 mg were loaded into a standard
aluminum pan and scanned from 0 to 300°C at a heating constant rate of 20°C/min under
constant purging of nitrogen at a rate of 80 mL/min.
5.2.2.4 Water solubility
Saturated solutions of opioids were made in HPLC-grade water. Briefly, a known amount
of opioids (about 40 mg) was suspended in 2 mL of solvent under constant stirring at
32°C for 24 h. Then, the suspension was centrifuged at 5000 rpm, 32°C, for 20 min

Chapter 5
98
(Universal 30RF, Hettich Holding GmbH & Co., Kirchlengern, Germany) and then the
supernatant was withdrawn, opportunely diluted and analyzed by HPLC.
5.2.2.5 Quantitative determination
The concentration of each opioid derivative was determined by HPLC (HP 1100
ChemStations, Agilent Technologies, Santa Clara, USA). Compound separation was
carried out using reverse-phase column (Hypersil Gold C8, 5 µm, 150 х 4.6 mm, Thermo
Fisher Scientific Inc., Waltham, USA) and 0.02 M phosphate pH 8 buffer/acetonitrile
(75/25) as mobile phase. The flow rate was 1.0 mL/min and the injection volume was 10
µL. The retention time of all opioid derivatives was between 3 and 10 min. The drug
concentration was determined at 210 nm by UV spectrophotometer from calibration
curves in the range of 0.1-10 µg/mL (R2<0.999).
5.2.3 In vitro penetration studies
Human epidermis was selected as membrane for the skin permeation studies. The skin
used in the permeation studies was obtained from the abdominal skin of two donors, who
underwent cosmetic surgery.
Skin samples were prepared following an internal standard procedure [27]. The full-
thickness skin was sealed in evacuated plastic bags and frozen at 20°C within 6 h after
removal. Prior to experiments, the skin was thawed at room temperature, and the excess
of fat was carefully removed. The skin sections were cut into squares of about 2.5 cm2
and, after immersing the skin in water at 60°C for 1 min, the epidermis was gently
separated from the remaining tissue with forceps and carefully inspected by light
microscopy for any defects. Afterward, the epidermis was mounted on the Franz diffusion
cell whose receptor compartment was filled with degassed phosphate buffer pH 6.5
containing 100 mg/mL NaN3 as preservative. Special care was given to avoid air bubbles
between the buffer and the epidermis in the receptor compartment. The upper and lower
parts of the Franz cell were sealed with Parafilm® (Pechiney Plastic Packaging Company,
Chicago, USA) and fastened together by means of a clamp, with the epidermis acting as
seal between the donor and receptor compartments. Then, the donor compartment was
filled with 0.4 mL saturated solution opioids. The system was kept at 37°C with a
Chapter 5
99
circulating water bath, so that the epidermis surface temperature was at 32±1 °C
throughout the experiment.
At predetermined times (1, 3, 5, 8, 24 h), 200 µL samples were withdrawn from the
receiver compartment and replaced with fresh receiver medium. Sink conditions were
maintained throughout the experiments. Samples were analyzed by HPLC according to
the method described above. The values were the averages of parallel experiments
performed in triplicate using epidermis sheet from two donors (n=6).
At the end of the permeation experiments, the opioid amount retained into epidermis was
quantified according to the following procedure. The epidermis sheet was removed from
Franz diffusion cell and each side was gently washed with 5 mL of methanol in order to
wash out the unabsorbed drug. Subsequently, sample was dried, sliced thinly and placed
in 5 mL of fresh methanol. The suspension was soaked in a sonicator for 30 min and then
maintained for 24 h at 2-8°C. Finally, the supernatant was 0.45 µm filtered and analyzed
by HPLC. The opioid amount retained by the epidermis after 24 h (Epi Qss) was expressed
as micrograms of opioid in milligrams of epidermis.
5.2.4 Data analysis
The cumulative amount permeated through the skin per unit area was calculated from the
drug concentration in the receiving medium and plotted as a function of time. The steady
state flux (Jmax) was determined as the slope of the linear portion of the plot. The
permeability coefficient was calculated according to the modified Fick’s first law of
diffusion (Eq. 5.1):
𝑝𝐾𝑝 = − log𝐽𝑚𝑎𝑥
𝑆 Eq. 5.1
where pKp (cm/h) is the permeability coefficient and S is the drug donor concentration
(µg/cm3), corresponding to the drug solubility in the vehicle at 32°C.
The concentration in the epidermis at the steady state (Epi Qss) was expressed as drug
concentration in the epidermal layer (µg/mg). In order to exclude the influence of drug
solubility on the retention, the Epi Qss was normalized by drug solubility in the donor
phase (S) [13, 28], as showed in Eq. 5.2:
Chapter 5
100
𝑅𝑄/𝑆 =𝐸𝑝𝑖 𝑄𝑠𝑠
𝑆 Eq. 5.2
The epidermis/transdermal selectivity index (IE/T value) was also calculated for each drug
as the ratio between the Epi Qss and Jmax. According to Lin et al., IE/T value can be used
as descriptor of the molecule affinity to be retained or permeate through human epidermis
[28]: the higher IE/T value, the greater affinity of the drug for epidermis (Eq. 5.3).
𝐼𝐸/𝑇 𝑣𝑎𝑙𝑢𝑒 =𝐸𝑝𝑖 𝐶𝑠𝑠
𝐽𝑚𝑎𝑥 Eq. 5.3
5.2.5 Statistical analyses
The effects of substituents (i.e., 3-methoxyl, X1; 6-carbonyl, X2; 14-hydroxyl, X3; 7,8-
didehydro, X4;) on permeation/retention parameters (Log Jmax, Y1; Log Epi Qss, Y2; pKp,
Y3; - Log RQ/S, Y4) and solubility (S, Y5) of the tested drugs were evaluated by JMP 10.0
software (SAS Institute, Cary, USA). Polynomial equations of interactive terms were
built in for each dependent variable, as shown by Eq. 5.4:
𝑌𝑖 = 𝑏𝑜 + 𝑏1𝑋1 + 𝑏2𝑋2 + 𝑏3𝑋3 + 𝑏4𝑋4 + 𝑏1,2𝑋1𝑋2 + 𝑏1,3𝑋1𝑋3 + 𝑏1,4𝑋1𝑋4 +
𝑏2,3𝑋2𝑋3 + 𝑏3,4𝑋3𝑋4 Eq. 5.4
where Yi is the dependent variable, b0 the arithmetic mean response of the runs and bi the
estimated coefficient for the categorical factor Xi. The interaction between carbonyl (X2)
and 7,8-didehydro (X4) was not considered in the statistical analyses, since it was not
present in the considered dataset of molecules.
The main effects represent the average results of changing one factor at a time from its
low (absence: - 1) to high level (presence, +1), as represented in Table 5.1. The
interaction terms (e.g., X1*X2) show how the response changes when two factors are
simultaneously changed.
The estimated coefficient of each interaction was calculated according to a symmetric
matrix 2x2 made plotting all possible combinations of two substituents. Due to the
symmetry of the matrix, two possible cases were taken into consideration in the model:
a) the level of substituents was the same (-1, -1; +1, +1) or b) the opposite (-1, +1; +1, -

Chapter 5
101
1). Consequently, the interaction coefficient estimated by the model in case b) had
opposite sign vs case a).
For each dependent variable, stepwise backward analyses were built in to exclude
negligible terms from the statistical model (p-value to leave: 0.051).
Even if the inter-donor variability might affect the results of statistical analyses, the t-
student tests were carried out on each of the considered permeation/retention parameters.
The results did not highlight any significant differences. Therefore, the epidermis donor
was not considered as block variable.
Table 5.1 – Chemical substituents present on the chemical structure of morphine derivatives. The
code +1 indicates the substituent presence, whereas -1 its absence.
Compound 3-methoxyl
(X1)
6-carbonyl
(X2)
14-hydroxyl
(X3)
7,8-didehydro
(X4)
Morphine -1 -1 -1 +1
Dihydromorphine -1 -1 -1 -1
Oxymorphone -1 +1 +1 -1
Hydromorphone -1 +1 -1 -1
Codeine +1 -1 -1 +1
Dihydrocodeine +1 -1 -1 -1
Oxycodone +1 +1 +1 -1
Hydrocodone +1 +1 -1 -1
5.3 Results
5.3.1 Chemistry
Morphine (1), codeine (5), dihydrocodeine (6) and oxycodone (7) were purchased as salts
and converted into the corresponding free bases by an organic solvent extraction from the
basic aqueous solutions and subsequent crystallization or trituration. The syntheses of
opioid derivatives (2), (3), (4), (8) were accomplished as shown in Figure 5.2.
Dihydromorphine (2) was obtained in high yield by a palladium-catalyzed high-pressure
hydrogenation of morphine hydrochloride in methanol at room temperature. In our
conditions, the hydrogenation reaction proceeded in a very satisfactory manner without
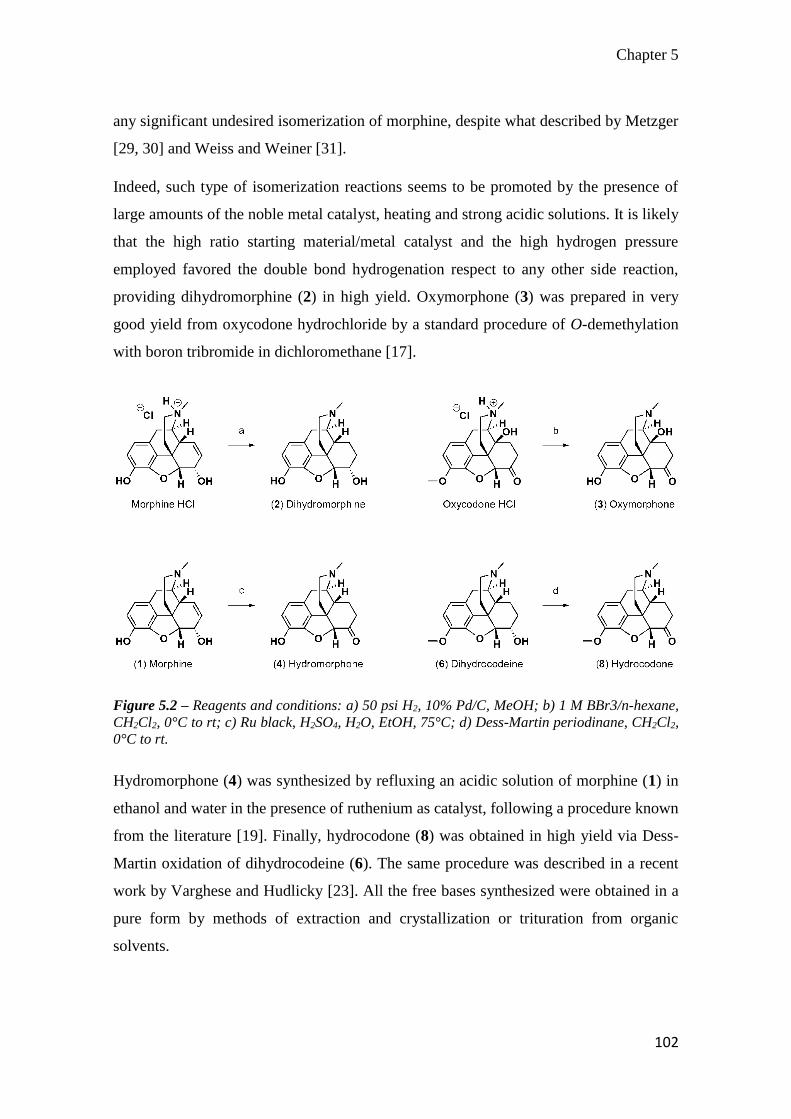
Chapter 5
102
any significant undesired isomerization of morphine, despite what described by Metzger
[29, 30] and Weiss and Weiner [31].
Indeed, such type of isomerization reactions seems to be promoted by the presence of
large amounts of the noble metal catalyst, heating and strong acidic solutions. It is likely
that the high ratio starting material/metal catalyst and the high hydrogen pressure
employed favored the double bond hydrogenation respect to any other side reaction,
providing dihydromorphine (2) in high yield. Oxymorphone (3) was prepared in very
good yield from oxycodone hydrochloride by a standard procedure of O-demethylation
with boron tribromide in dichloromethane [17].
Figure 5.2 – Reagents and conditions: a) 50 psi H2, 10% Pd/C, MeOH; b) 1 M BBr3/n-hexane,
CH2Cl2, 0°C to rt; c) Ru black, H2SO4, H2O, EtOH, 75°C; d) Dess-Martin periodinane, CH2Cl2,
0°C to rt.
Hydromorphone (4) was synthesized by refluxing an acidic solution of morphine (1) in
ethanol and water in the presence of ruthenium as catalyst, following a procedure known
from the literature [19]. Finally, hydrocodone (8) was obtained in high yield via Dess-
Martin oxidation of dihydrocodeine (6). The same procedure was described in a recent
work by Varghese and Hudlicky [23]. All the free bases synthesized were obtained in a
pure form by methods of extraction and crystallization or trituration from organic
solvents.
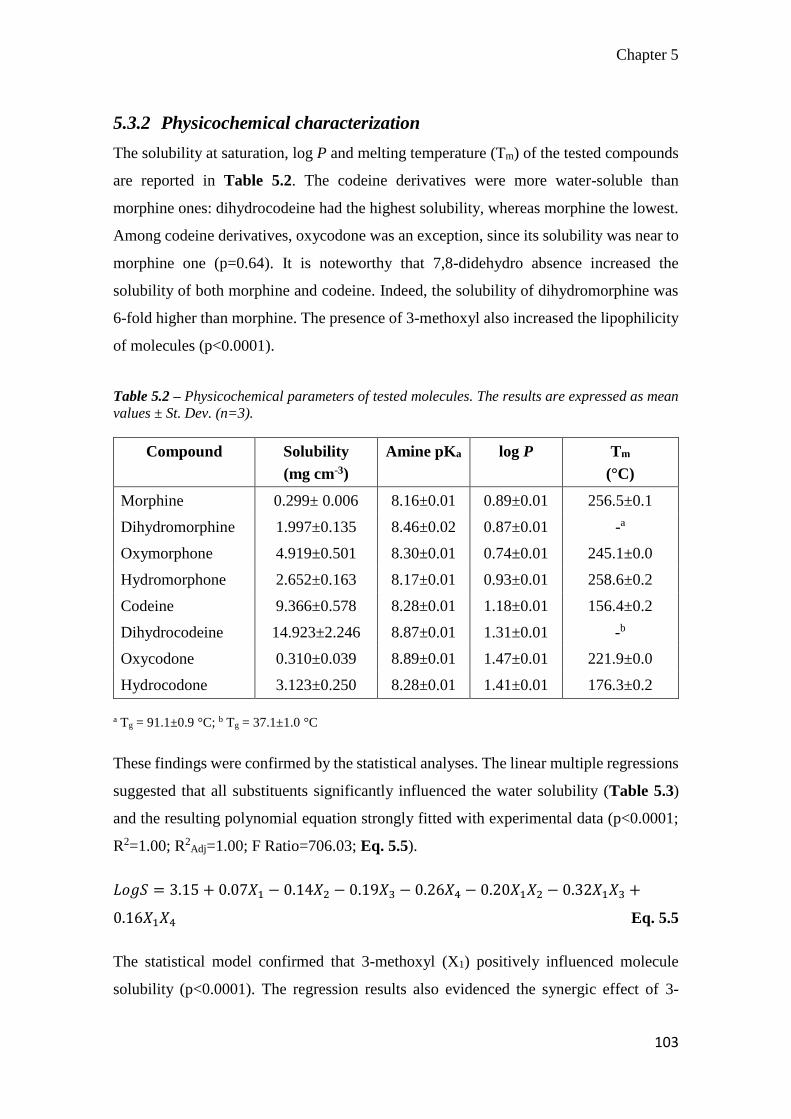
Chapter 5
103
5.3.2 Physicochemical characterization
The solubility at saturation, log P and melting temperature (Tm) of the tested compounds
are reported in Table 5.2. The codeine derivatives were more water-soluble than
morphine ones: dihydrocodeine had the highest solubility, whereas morphine the lowest.
Among codeine derivatives, oxycodone was an exception, since its solubility was near to
morphine one (p=0.64). It is noteworthy that 7,8-didehydro absence increased the
solubility of both morphine and codeine. Indeed, the solubility of dihydromorphine was
6-fold higher than morphine. The presence of 3-methoxyl also increased the lipophilicity
of molecules (p<0.0001).
Table 5.2 – Physicochemical parameters of tested molecules. The results are expressed as mean
values ± St. Dev. (n=3).
Compound Solubility
(mg cm-3)
Amine pKa log P Tm
(°C)
Morphine 0.299± 0.006 8.16±0.01 0.89±0.01 256.5±0.1
Dihydromorphine 1.997±0.135 8.46±0.02 0.87±0.01 -a
Oxymorphone 4.919±0.501 8.30±0.01 0.74±0.01 245.1±0.0
Hydromorphone 2.652±0.163 8.17±0.01 0.93±0.01 258.6±0.2
Codeine 9.366±0.578 8.28±0.01 1.18±0.01 156.4±0.2
Dihydrocodeine 14.923±2.246 8.87±0.01 1.31±0.01 -b
Oxycodone 0.310±0.039 8.89±0.01 1.47±0.01 221.9±0.0
Hydrocodone 3.123±0.250 8.28±0.01 1.41±0.01 176.3±0.2
a Tg = 91.1±0.9 °C; b Tg = 37.1±1.0 °C
These findings were confirmed by the statistical analyses. The linear multiple regressions
suggested that all substituents significantly influenced the water solubility (Table 5.3)
and the resulting polynomial equation strongly fitted with experimental data (p<0.0001;
R2=1.00; R2Adj=1.00; F Ratio=706.03; Eq. 5.5).
𝐿𝑜𝑔𝑆 = 3.15 + 0.07𝑋1 − 0.14𝑋2 − 0.19𝑋3 − 0.26𝑋4 − 0.20𝑋1𝑋2 − 0.32𝑋1𝑋3 +
0.16𝑋1𝑋4 Eq. 5.5
The statistical model confirmed that 3-methoxyl (X1) positively influenced molecule
solubility (p<0.0001). The regression results also evidenced the synergic effect of 3-

Chapter 5
104
methoxyl and 7,8-didehydro on drug solubility (X1*X4: p<0.0001). On the contrary, other
substituents negatively affected the drug solubility both alone (p<0.0001) and in
combination with 3-methoxyl (p<0.0001).
Finally, Tm of morphine derivatives were in agreement to literature data, with the
exception of dihydromorphine and dihydrocodeine. Surprisingly, the thermal analyses
showed glassy transitions, whereas melting temperatures were reported in literature [32].
The glass transition temperature (Tg) of dihydromorphine and dihydrocodeine were
91.1±0.9 °C and 37.1±1.0 °C, respectively (Table 5.2). Moreover, the lowest Tg value
registered for dihydrocodeine justified the highest solubility of such a compound.
Table 5.3 – Effect of substituents on Log S, Log Jmax, pKp, Log Epi Qss, - Log RQ/Si. The interaction
effect reported in table is obtained when the level of both substituent is the same (+1, +1; -1, -1).
Vice versa, the interaction effect has opposite impact on penetration parameters when substituent
level had opposite sign (+1, -1;-1, +1).
Substituent Log S Log Jmax pKp Log (Epi Qss) - Log RQ/S
X1 increase# increase# decrease# decrease# increase#
X2 decrease# decrease* - decrease* -
X3 decrease# decrease* - decrease# -
X4 decrease# decrease* - decrease* decrease*
Interactions
X1*X2 decrease# decrease* - decrease# -
X1*X3 decrease# decrease# - decrease# -
X1*X4 increase# - increase* - -
X2*X3 - - - - -
X3*X4 - - - - -
# p<0.001 by Fisher test. *
p<0.05 by Fisher test.
5.3.3 In vitro penetration studies
The cumulative amounts of tested compounds permeated through the human epidermis
in 24 h are shown in Figure 5.3. At a first glance, the permeation profiles evidenced that
3-methoxyl significantly increased the drug diffusion through the human epidermis.
Indeed, Jmax values of codeine derivatives resulted significantly higher than other
compounds (Table 5.4; p<0.01).

Chapter 5
105
Figure 5.3 – Permeation profiles of morphine (A) and codeine (B) derivatives. (n=6, mean value
± SEM.). Morphine derivatives are morphine (1), dihydromorphine (2), oxymorphone (3) and
hydromorphone (4). Codeine derivatives are codeine (5), dihydrocodeine (6), oxycodone (7) and
hydrocodone (8).
The highest Jmax was reported for dihydrocodeine, whereas the lowest for the morphine.
Indeed, Jmax values calculated for codeine derivatives resulted significantly higher than
other compounds (Table 5.4; p<0.01). Jmax of oxycodone was the only exception and its
0
2
4
6
8
10
12
14
16
0 5 10 15 20 25
Con
c. (
µg/c
m2)
Time (h)
1
2
3
4
A
0
100
200
300
400
500
600
700
800
0 5 10 15 20 25
Con
c. (
µg/c
m2)
Time (h)
5
6
7
8
B

Chapter 5
106
flux value was similar to morphine derivatives. The permeation coefficients confirmed
this trend: the pKp values of codeine derivatives resulted the lowest among the tested
molecules.
Table 5.4 – Penetration data and IE/T values of tested compounds (mean ± sd; donors=2, n=6).
Compound Jmax
(µg cm-2 h-1)
pKp
(cm h-1)
Epi Qss
(μg mg-1)
- Log RQ/S
(cm3 mg-1)
IE/T
Morphine 0.05±0.02 3.88±0.29 0.64±0.27 2.72±0.29 12.80
Dihydromorphine 0.21±0.20 4.22±0.55 1.50±0.78 3.16±0.24 7.14
Oxymorphone 0.58±0.70 4.24±0.58 4.68±2.54 3.09±0.25 8.07
Hydromorphone 0.11±0.07 4.47±0.34 2.81±1.64 3.04±0.24 25.55
Codeine 9.60±3.39 3.21±0.15 6.44±2.26 3.18±0.21 0.67
Dihydrocodeine 36.25±14.28 2.64±0.18 8.03±0.89 3.27±0.22 0.22
Oxycodone 0.40±0.41 3.07±0.45 0.10±0.05 3.52±0.26 0.25
Hydrocodone 4.19±1.43 2.90±0.17 2.10±0.82 3.20±0.18 0.50
The polynomial equations (Eq. 5.6 and Eq. 5.7) obtained for permeation parameters fitted
with the experimental data (Figure 5.4), allowing to identify the significant contribute of
each substituent to the permeation process (Table 5.4).
𝐿𝑜𝑔 𝐽𝑚𝑎𝑥 = −0.90 + 1.36𝑋1 − 0.60𝑋2 − 0.39𝑋3 − 0.60𝑋4 − 0.44𝑋1𝑋2 − 0.96𝑋1𝑋3
p<0.0001; R2=0.89; R2adj=0.88; F ratio=57.32 Eq. 5.6
𝑝𝐾𝑝 = 3.58 − 0.53𝑋1 + 0.19𝑋1𝑋4 Eq. 5.7
p<0.0001; R2=0.76; R2adj=0.74; F ratio=69.89
The statistical results confirmed the predominant effect of 3-methoxyl (X1) on the
permeation process through the skin. Indeed, 3-methoxyl determined an increase of Jmax
(p<0.0001) and a significant decrease pKp values (p<0.0001), suggesting that its effect on
diffusion process was due to an improvement of epidermal diffusivity of the molecule
through the human epidermis other than to the increase of drug solubility.

Chapter 5
107
The presence of other substituents on molecule backbone had an opposite effect on Jmax
(X2, p=0.0012; X3, p=0.0317; X4, p=0.0013) and resulted ineffective on pKp values,
suggesting that, conversely to 3-methoxyl, they influenced only the concentration
gradient. Moreover, the 3-methoxyl/6-carbonyl (X1*X2; p=0.0056) or 3-methoxyl/14-
hydroxyl (X1*X3; p<0.0001) interactions had a detrimental effect on the flux (Eq. 5.6).
These findings were in agreement with the highest Jmax of dihydrocodeine, having only
3-methoxyl among the considered substituents, and the lowest values of morphine (Table
5.4).
The trend observed in the case of Jmax and pKp were significantly different from that
observed in the case of the amount retained from the skin at the end of experiments (Epi
Qss). In this case, the highest Epi Qss values were found in the case of dihydrocodeine,
codeine, and oxymorphone. Furthermore, the retention seemed to be correlated to drug
solubility, as shown by Eq. 5.8.
𝐿𝑜𝑔(𝐸𝑝𝑖 𝑄𝑠𝑠) = −6.81 + 0.94𝐿𝑜𝑔𝑆 Eq. 5.8
p<0.0001; R2=0.75; R2adj=0.74; F ratio=136.86
However, the experimental results cannot be explained considering only water solubility
as the key parameter for partition of the morphine derivative from the donor solution to
the human epidermis. As an example, Epi Qss for morphine resulted about 6-fold higher
than that of oxycodone (Table 5.4), although the solubility was comparable (Table 5.2).
In the case of Epi Qss, the statistical analysis evidenced that all considered substituents
influenced the drug amount retained by the epidermis (Eq. 5.9)
𝐿𝑜𝑔(𝐸𝑝𝑖 𝑄𝑠𝑠) = 0.06 − 0.42𝑋1 − 0.21𝑋2 − 0.63𝑋3 − 0.29𝑋4 − 0.56𝑋1𝑋2 −
0.89𝑋1𝑋3 Eq. 5.9
p<0.0001; R2=0.89; R2adj=0.88; F ratio=56.90
In particular, all significant factors determined a decrease of drug concentration in
epidermis. It should be also underlined that among the main factors, 14-hydroxyl (X3)
along with interactions between 3-methoxyl and 6-carbonyl (X1*X2) or 14-hydroxyl
(X1*X3) showed the greater coefficients and the most significant effect (p<0.0001),
Chapter 5
108
justifying the lowest Epi Qss values determined in the case of oxycodone, which has all
these substituents.
On the contrary, the most of the significant effects observed in Eq. 5.9 became negligible
when – Log RQ/S was used as retention descriptor (Eq. 5.10).
−𝐿𝑜𝑔𝑅𝑄/𝑆 = 3.08 + 0.14𝑋1 − 0.13𝑋4 Eq. 5.10
p<0.0001; R2=0.41; R2adj=0.38; F ratio=15.44
The stepwise backward analyses showed that 3-methoxyl and 7,8-didehydro were the
only effects to remain significant when – Log RQ/S was used as retention descriptor. In
particular, the presence of 3-methoxyl (X1; p<0.0001) increased the – Log RQ/S, whereas
the 7,8-didehydro (X4; p<0.0013) had an opposite effect. Since the low correlation of Eq.
5.10, the results of stepwise backward analyses were checked by one-way ANOVA
analyses. These further tests confirmed 3-methoxyl (X1; p<0.0003) and 7,8.-didehydro
(X4; p<0.0057) to be significant for drug retention, suggesting that the influence of both
substituents on the drug retention was independent of the drug solubility in the donor
phase.
The estimated X1 coefficient in Eq. 5.10 is consistent with the value in Eq. 5.9, showing
that 3-methoxyl negatively affected the drug retention in the human epidermis. On the
other side, the coefficients of X4 had an opposite effect of 7,8-didehydro according to the
retention descriptor taken into account (Table 5.3). When Epi Qss was considered, the
results of statistical analyses showed that 7,8-didehydro decreased the drug concentration
in the human epidermis (b4 = - 0.29; Eq. 5.9). On the contrary, its negative effect on –
Log RQ/S suggested that X4 increased drug retention (b4 = - 0.13; Eq. 5.10). This
incongruity might be explained considering that drug solubility influenced only Epi Qss
and not –Log RQ/S. Thus, the negative effect of X4 on Epi Qss was related to the decrease
of drug solubility in the donor phase (Table 5.3). These findings are in agreement with
the experimental data. For example, the lower solubility of codeine justified its lower Epi
Qss in comparison to dihydrocodeine values (Table 5.2 and Table 5.4). Moreover, no
differences were observed in – Log RQ/S values of both molecules, suggesting that lower
Epi Qss of codeine was only due to drug solubility.

Chapter 5
109
Therefore, Eq. 5.10 better described the influence of 7,8-didehydro on the drug retention
than Eq. 5.9, since it exclude the ancillary effect of drug solubility.
Figure 5.4 – Actual and predicted plot of the linear multiple regression analyses on the
substituent effect on Log Jmax (A), pKp (B), Epi Qss (C) and – Log RQ/S (D).

Chapter 5
110
5.4 Discussion
The permeation data were consistent with those reported in literature, confirming that
morphine derivatives slowly permeated through human skin [33]. Statistical analyses
revealed significant correlations between chemical modifications on morphine structure
and the permeation process. At a first glance, the gradient concentration between donor
and receiver compartments seemed to govern the passive diffusion of these molecules
through the human epidermis. In other words, the higher the water solubility, the higher
the flux (p<0.0001; R2=0.72, R2adj=0.72; F=119.82).
However, 3-methoxyl determined an increase of Jmax and a significant decrease in pKp
values, suggesting that its effect on diffusion process was due to an improvement of
epidermal diffusivity of the molecule through the human epidermis other than the increase
of the concentration gradient.
In order to evaluate the goodness of linear regression in predicting the drug permeation
through human epidermis, the model proposed by Potts and Guy [8] was applied to the
experimental data of morphine derivatives. The results showed that the Potts and Guy
model fitted well with the dataset (p<0.0001; R2=0.63; R2adj=0.62, F ratio=39.10).
However, its low R2adj suggested that such a linear regression model was less accurate in
predicting permeation of morphine derivatives than the model described by Eq. 5.7.
Indeed, the bias between predicted and experimental pKp values of dihydrocodeine was
twice higher when pKp was calculated by the Potts and Guy equation (17.6%) than by
Eq. 5.7 (8.2%).
The lack of fit of the Potts and Guy model can be explain in term of molecular weight. In
the case of morphine derivatives, the considered range was too narrow to influence
significantly the drug permeation. Indeed, the statistical analyses emphasized the key role
of drug lipophilicity (log P) in determining the skin permeation (leverage p<0.0001),
whereas the effect of molecular weight was negligible (leverage p=0.6030).
Moreover, retained drug amount was demonstrated to correlate to the drug concentration
gradient as well as permeation process (Eq. 5.8). However, the substituent effect on drug
retention was not only justified by its effect on solubility, as shown by Eq. 5.10. In line
with literature data [13, 28], normalizing drug retention by solubility (RQ/S) permitted to

Chapter 5
111
discriminate which substituent effect on retention was influenced by solubility. For
example, 3-methoxyl (X1) had a positive influence on the drug solubility (Eq. 5.5),
whereas it negatively affected the drug retention in epithelial layer. These findings are in
agreement with permeation results: since 3-methoxyl was able to improve drug diffusivity
through the epidermis, it significantly decrease Epi Qss and increase – Log RQ/S.
The low correlation of the linear regression equation obtained for – Log RQ/S
demonstrated that retention process might not be modelled only on the base of chemical
structure modifications (Eq. 5.10). Furthermore, the use of physicochemical parameters
(i.e., molecular weight, log P) as model descriptors were linked to a similar lack of fit
(p<0.0001; R2=0.38; R2adj=0.35; F ratio = 13.75) [13], suggesting that the retention
process might be modelled introducing also descriptors based on composition of upper
layers of human skin. The stratum corneum barrier function is due to a multi-layered wall-
like structure in which flat keratinized corneocytes are embedded in a lipophilic network
of ceramides, cholesterol esters and fatty acids. In particular, ceramides are essential since
their key-role in the lipophilic network organization [34] and are able to modulate the
drug permeation through epidermis according to the relative concentration of the
ceramides types in the upper layers of human skin [35]. Therefore, the development of
predicting models able combine the physicochemical properties of molecules and their
interaction with epidermal constituents might be an challenging solution for solving the
lack of fit of proposed modelling approach.
In order to select the most suitable compound for designing a dosage form intended for
the local treatment of topical painful syndromes, the minimization of the skin permeation
and the maximization of the skin retention are highly desirable. Firstly, the overall results
on morphine revealed one of the lowest Epi Qss value and Jmax. Although the Epi Qss data
might induce to discard morphine as candidate for topical treatment, the low permeation
flux suggested a lower incidence of systemic side effect than other more permeable
morphine derivatives. Indeed, IE/T value is an order of magnitude higher than codeine
derivatives and it was comparable or slightly lower with respect to the parent compounds.
Furthermore, the results identified hydromorphone as another suitable alternative to be
topically applied for cutaneous pain management. Hydromorphone exhibited a very low
flux through the human epidermis (i.e., the highest pKp value) and Epi Qss was 4-fold

Chapter 5
112
higher than morphine. Therefore, hydromorphone resulted the morphine derivative with
the highest affinity for epidermis retention (highest IE/T value, Table 5.4) among the
considered set of compounds.
Chapter 5
113
5.5 Conclusion
The overall results highlighted that the permeation and retention of morphine derivatives
may be modelled according to the small modification on their chemical structure. Such
an approach appears accurate in predicting drug permeation. In particular, the statistical
analyses indicated that 3-methoxyl group played a key role in governing the skin
penetration of morphine derivatives through human skin. In contrary, the low R2 of linear
regression model for – Log RQ/S demonstrated that physicochemical properties of
molecules might be not enough for modelling the retention process, suggesting the need
to deeply understand the retention process taking in consideration the epithelial features.
Moreover, the retention/permeation affinity index confirmed that morphine was a good
candidate for treating cutaneous painful symptomatology, although low Epi Qss.
Interestingly, the statistical results suggested that hydromorphone can represent a good
alternative to morphine thanks to its greater affinity for human epidermis as well as a
relatively higher potency [36].
Finally, the study also underlined that dihydromorphine and dihydrocodeine bases were
not achievable as crystals, but only in amorphous state. These findings justified the higher
solubility of such drugs and, therefore, the higher fluxes with respect to the parent
compounds, namely morphine and codeine.

Chapter 5
114
5.6 References
[1] Santini, D., Lanzetta, G., Dell'Aquila, E., Vincenzi, B., Venditti, O., Russano, M., Papapietro,
N., Denaro, V., Tonini, G., and Ripamonti, C., 2013, "'Old' and 'new' drugs for the treatment of
cancer pain," Expert Opin. Pharmacother., 14(4), pp. 425-433.
[2] Graham, T., Grocott, P., Probst, S., Wanklyn, S., Dawson, J., and Gethin, G., 2013, "How are
topical opioids used to manage painful cutaneous lesions in palliative care? A critical review,"
PAIN, 154(10), pp. 1920-1928.
[3] LeBon, B., Zeppetella, G., and Higginson, I. J., 2009, "Effectiveness of Topical
Administration of Opioids in Palliative Care: A Systematic Review," J. Pain Symptom Manage.,
37(5), pp. 913-917.
[4] Stein, C., and Küchler, S., 2012, "Non-analgesic effects of opioids: Peripheral opioid effects
on inflammation and wound healing," Curr. Pharm. Des., 18(37), pp. 6053-6069.
[5] Roy, S. D., and Flynn, G. L., 1990, "Transdermal delivery of narcotic analgesics: pH,
anatomical, and subject influences on cutaneous permeability of fentanyl and sufentanil," Pharm.
Res., 7(8), pp. 842-847.
[6] Lane, M. E., 2013, "The transdermal delivery of fentanyl," Eur. J. Pharm. Biopharm., 84(3),
pp. 449-455.
[7] Stinchcomb, A. L., Paliwal, A., Dua, R., Imoto, H., Woodard, R. W., and Flynn, G. L., 1996,
"Permeation of buprenorphine and its 3-alkyl-ester prodrugs through human skin," Pharm. Res.,
13(10), pp. 1519-1523.
[8] Potts, R. O., and Guy, R. H., 1992, "Predicting skin permeability," Pharm. Res., 9(5), pp. 663-
669.
[9] Magnusson, B. M., Anissimov, Y. G., Cross, S. E., and Roberts, M. S., 2004, "Molecular size
as the main determinant of solute maximum flux across the skin," J. Invest. Dermatol., 122(4),
pp. 993-999.
[10] Potts, R. O., and Guy, R. H., 1995, "A predictive algorithm for skin permeability: The effects
of molecular size and hydrogen bond activity," Pharm. Res., 12(11), pp. 1628-1633.
[11] Lian, G., Chen, L., and Han, L., 2008, "An evaluation of mathematical models for predicting
skin permeability," J. Pharm. Sci., 97(1), pp. 584-598.
[12] Roberts, M. S., Cross, S. E., and Anissimov, Y. G., 2004, "Factors affecting the formation
of a skin reservoir for topically applied solutes," Skin Pharmacol. Physiol., 17(1), pp. 3-16.
[13] Cross, S. E., and Roberts, M. S., 2008, "Use of in vitro human skin membranes to model and
predict the effect of changing blood flow on the flux and retention of topically applied solutes,"
J. Pharm. Sci., 97(8), pp. 3442-3450.
[14] Koizumi, H., Yokoshima, S., and Fukuyama, T., 2010, "Total Synthesis of (-)-Morphine,"
Chem. Asian J., 5(10), pp. 2192-2198.
[15] Przybyl, A. K., Flippen-Anderson, J. L., Jacobson, A. E., and Rice, K. C., 2003, "Practical
and High-Yield Syntheses of Dihydromorphine from Tetrahydrothebaine and Efficient Syntheses
of (8S)-8-Bromomorphide," J. Org. Chem., 68(5), pp. 2010-2013.
[16] Varadi, A., Gergely, A., Beni, S., Jankovics, P., Noszal, B., and Hosztafi, S., 2011, "Sulfate
esters of morphine derivatives: Synthesis and characterization," Eur. J. Pharm. Sci., 42(1-2), pp.
65-72.
[17] Kvernenes, O. H., Nygard, A. M., Heggelund, A., and Halvorsen, H., 2007, "Process useful
in the preparation of morphinan antagonists," Alpharma Aps, Den. . p. 34 pp.
Chapter 5
115
[18] Kok, G. B., and Scammells, P. J., 2012, "Improved synthesis of 14-hydroxy opioid
pharmaceuticals and intermediates," RSC Adv., 2(30), pp. 11318-11325.
[19] Gindelberger, D. E., 2011, "Heterogeneous ruthenium metal catalyst for the production of
hydrocodone, hydromorphone or a derivative thereof," Mallinckrodt Inc., USA . p. 32pp.
[20] Smith, P. R., Frohwein, A. K., Hays, P. A., and Lurie, I. S., 2005, "Identification and
quantitation of hydromorphone hydrochloride in Palladone (extended time-release) capsules,"
Microgram J., 3(1-2), pp. 39-45.
[21] Bailey, T. S., Gee, P. S., and Rezaie, R., 2006, "Process for the synthesis of hydromorphone,"
Australia . p. 10 pp.
[22] Trost, B. M., and Tang, W., 2002, "Enantioselective Synthesis of (−)-Codeine and (−)-
Morphine," J. American Chem. Soc., 124(49), pp. 14542-14543.
[23] Varghese, V., and Hudlicky, T., 2013, "Total Synthesis of Dihydrocodeine and Hydrocodone
via a Double Claisen Rearrangement and C-10/C-11 Closure Strategy," Synlett, 24(3), pp. 369-
374.
[24] Tavakol, H., Esfandyari, M., Taheri, S., and Heydari, A., 2011, "Investigation of structure,
vibrational and NMR spectra of oxycodone and naltrexone: A combined experimental and
theoretical study," Spectrochim. Acta A Mol. Biomol. Spectrosc., 79(3), pp. 574-582.
[25] Avdeef, A., 1992, "PH-Metric log P. Part 1. Difference plots for determining ion-pair
octanol-water partition coefficients of multiprotic substances," Quantitative Structure-Activity
Relationships, 11(4), pp. 510-517.
[26] Avdeef, A., 1993, "pH-metric log P. II: Refinement of partition coefficients and ionization
constants of multiprotic substances," J. Pharm. Sci., 82(2), pp. 183-190.
[27] Cilurzo, F., Alberti, E., Minghetti, P., Gennari, C. G. M., Casiraghi, A., and Montanari, L.,
2010, "Effect of drug chirality on the skin permeability of ibuprofen," Int. J. Pharm., 386(1–2),
pp. 71-76.
[28] Lin, C.-F., Hwang, T.-L., Al-Suwayeh, S. A., Huang, Y.-L., Hung, Y.-Y., and Fang, J.-Y.,
2013, "Maximizing dermal targeting and minimizing transdermal penetration by
magnolol/honokiol methoxylation," Int. J. Pharm., 445(1–2), pp. 153-162.
[29] Metzger, H., 1935, "Dihydromorphinones," Knoll AG Chemische Fabriken, pp. Addn. to
607,931 (C. A. 629, 4030.4034).
[30] Metzger, H., 1936, "Dihydromorphinones," Knoll AG Chemische Fabriken, pp. Addn. to
607,931 (C. A. 629, 4030.4034).
[31] Weiss, U., and Weiner, N., 1949, "The isomerization of morphine to O-
desmethylthebainone," J. Org. Chem., 14(2), pp. 194-203.
[32] Goto, K., 1940, "Formation of (+)-dihydrocodeine and (+)-dihydromorphine from
sinomenine," Proc. Imp. Acad. (Tokyo), 16, pp. 403-404.
[33] Roy, S., and Flynn, G., 1989, "Transdermal Delivery of Narcotic Analgesics: Comparative
Permeabilities of Narcotic Analgesics Through Human Cadaver Skin," Pharm. Res., 6(10), pp.
825-832.
[34] Corbe, E., Laugel, C., Yagoubi, N., and Baillet, A., 2007, "Role of ceramide structure and
its microenvironment on the conformational order of model stratum corneum lipids mixtures: an
approach by FTIR spectroscopy," Chem. Phys. Lipids, 146(2), pp. 67-75.
[35] Školová, B., Janůšová, B., Zbytovská, J., Gooris, G., Bouwstra, J., Slepička, P., Berka, P.,
Roh, J., Palát, K., Hrabálek, A., and Vávrová, K., 2013, "Ceramides in the Skin Lipid Membranes:
Length Matters," Langmuir, 29(50), pp. 15624-15633.

Chapter 5
116
[36] Barnett, M., 2001, "Alternative opioids to morphine in palliative care: A review of current
practice and evidence," Postgrad. Med. J., 77(908), pp. 371-378.
Final remarks
117
6 Final remarks
This doctoral thesis dealt with the critical delivery aspects of three loco-regional cancer-
related syndromes and proposed technological solutions for rationalizing the drug
delivery. In particular, the experimental work permitted (1) to develop a mucoadhesive
formulation to guarantee a prolonged drug penetration in the buccal cavity; (2) to optimize
a nanoparticle system intended for the resveratrol delivery to cochlea; (3) to rationalize
the dermal delivery of morphine derivatives on the base of their chemical structure and
identify the best opioid candidate for skin permeation and retention among the most used
morphine derivatives in clinics.
The mucoadhesive microparticle suspension (MMS) was proposed as a technological
platform for delivering drugs intended for the treatment of oral mucositis (Chapter 2).
The MMS combined the advantages of liquid and semisolid drug products intended for
buccal delivery. First of all, it can be easily handled as liquid solution and it might avoid
the fast elimination of drugs by swallowing as well as semisolid dosage forms. Moreover,
being made with alginate, microparticles were conveniently prepared in one-step process.
The selection of poly-acrylates as bioadhesive polymers permitted to obtain
microparticles with a reproducible morphology and satisfactory mucoadhesive properties.
The loading of drugs with different physicochemical properties showed that MMS is a
robust technological platform for the delivery of several candidates intended for treating
oral mucositis (OMs). Moreover, the in vitro studies showed that the use of MMS might
be more advantageous than other conventional dosage forms for buccal delivery. In fact,
the in vitro increase of the drug penetration in mucosa suggested that MMS might allow
the in vivo reduction of the drug dose and regimen.
Resveratrol-loaded nanoparticles were proposed for treating cisplatin-induced ototoxicity
(Chapter 4). Such technological platform has the double advantage to be theoretically
suitable both for intra-tympanic and systemic administration. Indeed, the same
nanoparticle system was able to diffuse through round window membrane in guinea pigs
(Appendix 4.1). The PLGA-based matrix could also control the drug release better than
other similar delivery systems published in literature, reducing the drug amount released
before the intracellular uptake. Preliminary uptake studies revealed a significant effect of
Final remarks
118
resveratrol on mitochondrial metabolism suggesting that it might be released in the
cellular environment. Furthermore, the in vitro toxicity studies indicated that nanosystem
was safe for cochlear cell lines.
In both cases, Design of Experiments (DoE) was efficiently applied for rationalizing the
development of the proposed delivery systems. Since DoE was introduced in academic
and pharmaceutical industry, its application allows to better understand the effect of
formulative and process parameters on the final product properties. In particular, the use
of a 23 factorial design permitted to screen the influence of poly-acrylate polymer and air
pressure setting on the microparticle morphology and in vitro clobetasol mucosal
penetration (Chapter 3). The Box-Behnken Design (BBD) was applied to the
development of resveratrol-loaded nanoparticles (Chapter 4). It allowed to clarify the
influence of nanoparticle composition on the morphology and other critical properties and
to identify an optimal formulation. Moreover, the Monte Carlo simulations showed how
much robust the features of optimal formulation were to stochastic errors in the
preparation process. Such an approach showed the importance of combining DoE and
simulation tools for the improvement of the model accuracy and robustness in drug
product development.
Finally, the experimental work provided useful data for the selection of opioid molecules
intended for dermal delivery (Chapter 5). According to literature, the effectiveness of
opioids in the treatment of cutaneous painful syndromes was demonstrated by empirical
evaluation of clinical cases, rather than deep investigation of their pharmacological
activity or skin permeation profiles. The current investigation highlighted that permeation
and retention were influenced by presence and/or absence of specific substituents on the
chemical structure of the considered morphine derivatives. In particular, the overall
results suggested that the phenolic ring substitution might be critical for the modulation
of the drug affinity to permeate or be retained in the human skin. Among the eight
morphine derivatives, hydromorphone resulted as the most promising compound for
obtaining a local effect in the human skin. Indeed, due to the highest retention/permeation
index (IE/T value), the hydromorphone had the highest affinity to the epidermal layer
among tested molecules, one of the lowest flux through the human epidermis and a
relative potency higher than morphine.

119
Acknowledgements
I would like to acknowledge the many people who have trusted and supported me during
my PhD program.
First of all, I would like to thank prof. Paola Minghetti, prof. Luisa Montanari and prof.
Bi-Botti Youan for being an example for me and for pushing me in this challenging
adventure.
I would like to thank dr. Antonella Casiraghi, dr. Francesco Cilurzo, dr. Chiara M.G.
Gennari, dr. Francesca Selmin for the teachings, the support, the help and the patience
they have had with me in these years.
I would like to dr. Ibrahima Youm, dr. Ezoulin Miezan, dr. Tao Zhang, Vivek Agrahari,
Jianing Meng, Albert N’Go, Fohona Coulibaly for introducing me in the nanoscale world
and for making my visiting period at UMKC School of Pharmacy great.
I would like to thank dr. Clelia Dallanoce, dr. Carlo Matera and all member of laboratory
of prof. De Amici for their work on the synthesis of the morphine derivatives and for
supporting me in the preparation of Chapter 5.
Last but not least, I would like to thank a lot all my colleagues and friends for sharing
their time and personal experience with me: you helped making these three years in via
C. Colombo 71 fantastic.
Thank to Marco Colombo, Paolo Gerosa and Silvia Locati for the friendship and for
helping me in the experimental work of Chapter 2, 3, 5.
Thanks to Elena M., Federica C., Giustino D.P., Ilaria F., Iolanda P., Laura M., Paolo R.,
Silvia F., Ardita N., Clara P., Doriana P., Federica A.C., Laura R., Alessandro D.G.,
Andrea M., Anna B., Caterina P., Cristina B., Diana Y., Halvin B., Ilaria L., Leonardo S.,
Luca B., Marco B., Martina A., Martina M., Matteo F., Michele N., Paolo C., Rossella
S., Ruggero T., Simona P., Stefano R., Valentina C., Valeria D.N., Zhyljeta G.