Toll-like receptors as transducer of inflammatory signals in glia:...
131
Università degli Studi di Padova Dipartimento di Scienze del farmaco ___________________________________________________________________ SCUOLA DI DOTTORATO DI RICERCA IN SCIENZE FARMACOLOGICHE INDIRIZZO FARMACOLOGIA CELLULARE E MOLECOLARE CICLO XXVII Toll-like receptors as transducer of inflammatory signals in glia: the astrocyte-microglia connection Direttore della Scuola : Chiar.mo Prof. Pietro Giusti Coordinatore d’indirizzo: Chiar.mo Prof. Pietro Giusti Supervisore: Chiar.ma Dott.ssa. Morena Zusso Supervisore esterno: Chiar.mo Dott. Stephen D Skaper Dottorando: Dott.ssa Carla Marinelli
-
Upload
nguyenquynh -
Category
Documents
-
view
216 -
download
0
Transcript of Toll-like receptors as transducer of inflammatory signals in glia:...
Università degli Studi di Padova
Dipartimento di Scienze del farmaco
___________________________________________________________________
SCUOLA DI DOTTORATO DI RICERCA IN SCIENZE FARMACOLOGICHE
INDIRIZZO FARMACOLOGIA CELLULARE E MOLECOLARE
CICLO XXVII
Toll-like receptors as transducer of inflammatory signals in glia:
the astrocyte-microglia connection
Direttore della Scuola : Chiar.mo Prof. Pietro Giusti
Coordinatore d’indirizzo: Chiar.mo Prof. Pietro Giusti
Supervisore: Chiar.ma Dott.ssa. Morena Zusso
Supervisore esterno: Chiar.mo Dott. Stephen D Skaper
Dottorando: Dott.ssa Carla Marinelli

I
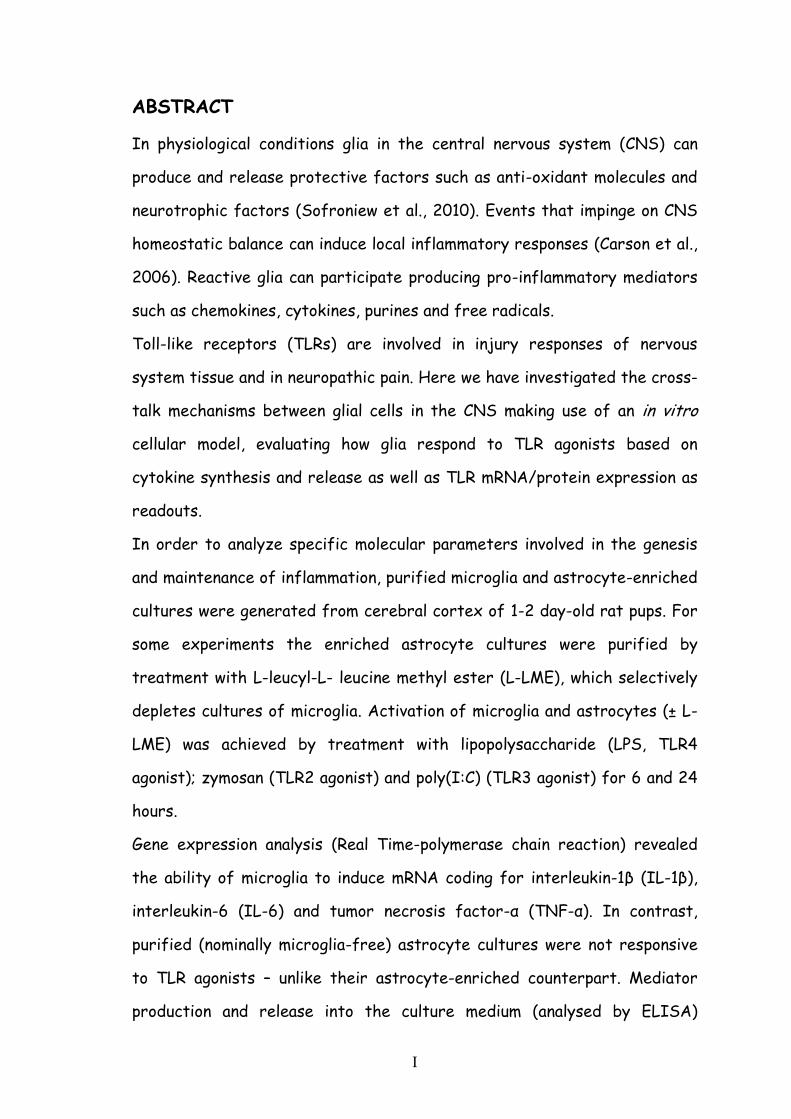
ABSTRACT
In physiological conditions glia in the central nervous system (CNS) can
produce and release protective factors such as anti-oxidant molecules and
neurotrophic factors (Sofroniew et al., 2010). Events that impinge on CNS
homeostatic balance can induce local inflammatory responses (Carson et al.,
2006). Reactive glia can participate producing pro-inflammatory mediators
such as chemokines, cytokines, purines and free radicals.
Toll-like receptors (TLRs) are involved in injury responses of nervous
system tissue and in neuropathic pain. Here we have investigated the cross-
talk mechanisms between glial cells in the CNS making use of an in vitro
cellular model, evaluating how glia respond to TLR agonists based on
cytokine synthesis and release as well as TLR mRNA/protein expression as
readouts.
In order to analyze specific molecular parameters involved in the genesis
and maintenance of inflammation, purified microglia and astrocyte-enriched
cultures were generated from cerebral cortex of 1-2 day-old rat pups. For
some experiments the enriched astrocyte cultures were purified by
treatment with L-leucyl-L- leucine methyl ester (L-LME), which selectively
depletes cultures of microglia. Activation of microglia and astrocytes (± L-
LME) was achieved by treatment with lipopolysaccharide (LPS, TLR4
agonist); zymosan (TLR2 agonist) and poly(I:C) (TLR3 agonist) for 6 and 24
hours.
Gene expression analysis (Real Time-polymerase chain reaction) revealed
the ability of microglia to induce mRNA coding for interleukin-1β (IL-1β),
interleukin-6 (IL-6) and tumor necrosis factor-α (TNF-α). In contrast,
purified (nominally microglia-free) astrocyte cultures were not responsive
to TLR agonists – unlike their astrocyte-enriched counterpart. Mediator
production and release into the culture medium (analysed by ELISA)
II
confirmed that microglia themselves respond to pathogenic stimuli.
Utilizing flow-cytometric analysis we evaluated the expression of TLR
receptors on the cell surface (TLR2/4) or in endosomal membranes (TLR3)
after 1, 6 or 24 hours of stimulation with TLR agonists.
Non-neuronal cell responsiveness to pathogenic stimuli is almost always
linked to the production of inflammatory mediators. In this context we
asked if the apparent inability of purified astrocytes to express a pro-
inflammatory phenotype was dependent on the absence of the relevant
TLR. Using confocal microscopy, stimulation with LPS conjugated with a
fluorochrome showed the presence of TLR4 on the astrocyte cell surface.
and Western blot analysis revealed the presence of the co-receptors MD2
and CD14. As consequence, purified astrocytes have been studied in flow
cytometry to evaluate alteration in TLR protein expression.
Moreover, we reconstituted the inflammatory profile in astrocyte cell
cultures by adding fixed numbers of purified microglia (10% of
contaminating cells final). Although the latter 'co-cultures' express pro-
inflammatory cytokines after TLR agonist stimulation the absolute levels
are inferior to those measured in enriched astrocytes (<5% of
contaminating microglia.
To further address the issue of whether microglial cell activation in the
presence of astrocytes results from either physical interaction between
cell membranes or chemical induction mediated by the release of
mediator(s) into the culture medium, a “Transwell insert” system was used.
The astrocyte/microglia co-culture paradigm described here may provide a
useful starting point to elucidate the molecular mechanisms underlying
astrocyte- and microglia-specific responses pertaining to, although not
limited to, CNS inflammation, especially where TLR activation plays a role.
III
RIASSUNTO
Nel sistema nervoso centrale (SNC), le cellule gliali in condizioni fisiologiche
producono e rilasciano sostanze protettive come molecole anti-ossidanti e
fattori neurotrofici (Sofroniew et al., 2010). Tutti gli eventi che alterano
l’equilibrio omeostatico inducono una risposta infiammatoria locale (Carson
et al., 2006). La glia reattiva partecipa producendo mediatori
dell’infiammazione come chemochine, citochine, purine e radicali liberi.
I recettori Toll-like (TLRs) sono coinvolti nelle risposte da danno indotto a
carico del tessuto nervoso e nel dolore neuropatico.
Nel nostro studio abbiamo investigato i meccanismi di comunicazione tra le
cellule della glia attraverso la realizzazione di un modello cellulare in vitro
idoneo alla valutazione della risposta gliale al trattamento con agonisti dei
TLRs, valutando sia l’espressione di molecole associate all’attivazione dei
recettori sia la modulazione genica/proteica degli stessi TLRs.
Per poter valutare meglio la genesi e la progressione dello stato
infiammatorio, colture di microglia purificata e colture arricchite in
astrociti (≥95%) sono state ottenute dal sacrificio di ratti neonati di 2
giorni e dalla successiva dissezione corticale. Per i nostri esperimenti le
colture arricchite di astrociti sono state trattate con L-leucil-L-Leucina
estere metilico (L-LME) al fine di ottenere una coltura purificata di
astrociti (≥99%).
L’attivazione della microglia e degli astrociti (± L-LME) è stata indotta dal
trattamento con lipopolisaccaride (LPS, agonista del TLR4), zymosan
(agonista del TLR2) e poli(I:C) (agonista del TLR3) per 6 e 24 ore.
L’analisi dell’espressione genica (in Real Time PCR) ha permesso di
dimostrare la capacità delle cellule della glia di indurre la trascrizione di
mRNA codificante per interleuchina-1β (IL-1β), interleuchina-6 (IL-6) e
tumor necrosis factor-α (TNF-α). La coltura purificata di astrociti non
IV
risponde al trattamento con agonisti TLRs, diversamente dalla coltura
arricchita in astrociti in cui persiste una piccola percentuale di cellule della
microglia.
La produzione e il rilascio nel terreno di coltura di mediatori
dell’infiammazione (dosaggio ELISA) confermano che la microglia risponde
allo stimolo patogenico. Inoltre le analisi di citofluorimetria hanno permesso
di valutare l’espressione dei TLRs sulla membrana cellulare (TLR2/4) e sulla
membrana degli endosomi (TLR3) dopo 1 ora, 6 ore e 24 ore di trattamento.
La responsività delle cellule non-neuronali ad uno stimolo lesivo viene
solitamente valutata sulla base della capacità delle cellule di produrre
mediatori pro-infiammatori. Alla luce di queste evidenze abbiamo voluto
chiarire se l’apparente assenza di responsività della coltura purificata di
astrociti, dipendesse da alterazioni a carico della struttura recettoriale.
Utilizzando la microscopia confocale, abbiamo marcato le cellule con LPS
coniugato con un fluorocromo dimostrando la presenza del TLR4 sulla
superficie cellulare degli astrociti e le analisi di Western Blot hanno
permesso di confermare anche la presenza dei co-recettori CD14 e MD2.
In particolare, lo studio sugli astrociti purificati è stato approfondito
mediante citofluorimetria per valutare le alterazioni a carico
dell’espressione proteica dei TLRs.
Un’ulteriore batteria di esperimenti è stata condotta ripristinando il profilo
infiammatorio aggiungendo un numero fisso di cellule di microglia (per un
totale del 10% di cellule contaminanti) ad una coltura purificata di astrociti.
Sebbene la ri-aggiunta di microglia su un monostrato di astrociti purificati
(≥99%) ripristini il profilo infiammatorio della coltura, in termini di valore
assoluto la quantità di citochine prodotte e rilasciate è comunque inferiore
ai valori misurati nella coltura arricchita in astrociti (in cui la contaminante
microgliale è ≤5%). Per meglio chiarire se l’attivazione microgliale in
V
presenza di astrociti dipendesse da il contatto fisico tra le membrane
cellulari oppure da fattori chimici abbiamo allestito un sistema “Transwell”.
Il paradigma descritto della co-coltura astrociti/microglia protrebbe
rappresentare un utile punto di partenza per chiarire i meccanismi
molecolari che sottendono le specifiche risposte delle singole popolazioni
cellulari all’infiammazione, non solo del SNC, specialmente in tutti quei
meccanismi che prevedono il coinvolgimento dei recettori TLRs.

VI
VII
Table of Contents
Pages
Abstract I
Riassunto III
Table of Contents VII
List of abbreviation XI
1. INTRODUCTION 1
1.1. The central nervous system 1
1.1.1. The role of microglia in the CNS 2
1.1.1.1. Identification of microglia populations 3
1.1.1.2. Physiological properties of microglia 4
1.1.2. The role of astrocytes in the CNS 7
1.1.2.1. Identification of astrocytic populations 8
1.1.2.2. Physiological properties of astrocytes 8
1.1.3. Microglia and astrocyte interplay 10
1.1.4. Inflammation 12
1.2.Toll-like receptors 13
1.2.1. TLR function, localization and signaling 17
1.2.2. TLR expression in microglia and astrocytes 22
1.2.2.1. TLR2 22
1.2.2.2. TLR3 23
1.2.2.3. TLR4 23
1.2.2.4. Other TLRs 24
VIII
1.2.3. TLRs in CNS health and disease 26
1.2.3.1. Alzheimer disease 28
1.2.3.2. Multiple sclerosis 28
1.2.3.3. Spinal cord injury 30
1.2.3.4. Neurogenesis, learning and memory 31
2. THESIS AIMS 33
3. MATERIALS AND METHODS 35
3.1. Primary culture of mixed glial cells 35
3.1.1. Primary culture of purified microglial cells 36
3.1.2. Isolation of a purified population of astrocytes 36
3.1.3. Treatment with TLR agonists 37
3.2. Immunophenotype analysis 38
3.2.1. Flow Cytometry 38
3.2.2. Immunofluorescence 39
3.3. Gene expression analysis and protein release 40
3.3.1.Total RNA extraction 41
3.3.2. RNA spectrophotometric quantification 43
3.3.3.First-Strand cDNA Synthesis 44
3.3.4. Real Time-Polymerase Chain Reaction (qRT-PCR) 44
3.3.4.1. Primer design 44
3.3.4.2. qRT-PCR analysis 45
3.3.4.3. Statistical analysis 46
3.3.5. Protein expression analysis 47
3.3.5.1. Total protein extraction 47
3.3.5.2. Western blot analysis 48
IX
3.3.6. Cytokine enzyme-linked immunosorbent assay
(ELISA) 48
4. RESULTS 51
4.1. Cellular and biochemical characterization of glia cell
population from cortex 51
4.1.1. Immunophenotypic characterization 51
4.1.2. Morphological and molecular characterization of
astrocyte-enriched and purified cultures 53
4.2. TLR agonists-dependent pro-inflammatory profile in
purified microglia 55
4.2.1. Cytokine gene expression modulation after LPS,
zymosan and poly(I:C) treatment 55
4.2.2. IL-1β release after LPS, zymosan and poly(I:C)
treatment 60
4.2.3. TLRs gene expression and protein modulation 62
4.2.3.1. TLR modulation in microglia challenged with LPS 62
4.2.3.2. TLR modulation in microglia challenged with
zymosan 65
4.2.3.3. TLR modulation in microglia challenged with
poly(I:C) 68
4.3. TLR agonists-dependent cytokine expression in
astrocytes: influence of microglia 71
4.4. LPS binding to TLR4 75
4.5. LPS, zymosan and poly(I:C) modulate TLR expression in
purified astrocytes 77
4.5.1. TLR modulation in astrocytes challenged with LPS 77
X
4.5.2. TLR modulation in astrocytes challenged with
zymosan 81
4.5.3. TLR modulation in astrocytes challenged with
poly(I:C) 84
4.6. Reintroduction of microglia restores purified astrocytes
responsiveness to TLR agonists 87
4.7. Microglia-astrocyte communication: evaluation of possible
mechanism 90
5. DISCUSSION 93
6. REFERENCES 99
7. Publications 117
XI
List of abbreviations
AD: Alzheimer’s disease
AMPA: Alpha-amino-3-hydroxy-5-methyl-4-isoxazole propinate
ATP: Adenosine triphosphate
cAMP: Cyclic adenosine monophosphate
CD: Cluster of differentiation
CNS: Central nervous system
CR3: Complement receptor type 3
DAMP: Damage-associated molecula pattern
FSC: Forward scatter
GABA: gamma-aminobutyric acid
GAPDH: Glyceraldehyde 3-phosphate dehydrogenase
GFAP: Glial fibrillary acid protein
Iba1: Ionized calcium binding adaptor molecule 1
IFN-γ: Interferon-gamma
IL-1β: Interleukine-1 beta
IL-6: Interleukine-6
iNOS: Inducible Nitric oxide synthase
KO: Knock-out
L-LME: L-leucyl-L-leucine methyl ester
LPS: Lipopolysaccharide
LTA: Lipotheicoic acid
MS: Multiple sclerosis
NF-Kb: Nuclear Factor kB
NO: Nitric oxide
P2X: Purinergic receptor type X
P2Y: Purinergic receptor type Y
PAMP: Pathogen-associated molecular pattern
PGN: Peptidoglycan
PRR: Pattern recognition receptor
ROS: Reactive oxygen species
SCI: Spinal cord injury
SSC: Side scatter
TLR: Toll-like receptor
TNF-α: Tumor necrosis factor-alpha

XII
1
1. INTRODUCTION
1.1. The central nervous system
The central nervous system (CNS) integrates information it receives from,
and coordinates and influences the activity of all parts of the body. This
phenomenon, named homeostasis, is fundamental for the organism’s survival.
The CNS in its most fundamental state is composed of neurons and glia.
Neurons use their electrical properties to transmit information by means
of electrical and chemical signals. They are organized in circuits and are
usually considered the most important cellular component of the brain.
Glia lack electrical properties and have always been considered as
supporting cells for neurons. We now know that glial cells are not only
heterogeneous, but also play critical roles in supporting the health of
neurons as well as possessing signaling properties in their own right. CNS
and peripheral nervous system glia can be distinguished on the basis of
morphology, function and location. For example in mammals, glia are
classified as astrocytes, oligodendrocytes (and the related Schwann cells)
and microglia.
The presence of glial cells is conserved across the animal kingdom, from
man to also the simplest invertebrate, no doubt a reflection of their
fundamental importance to the organism. There is a correlation between
animal size and the percentage of glial cells in brain. For example, in
Drosophila 25% of the brain is made up of glia; this proportion rises to 65%
in mouse and about 90% in man (Allen and Barres, 2009).
2
1.1.1. The role of microglia in the CNS
The CNS has been considered as immune-privileged because of the
presence of resident macrophagic cells, the microglia. The latter can be
easily distinguished from other glial cells by origin, morphology, gene
expression pattern and function (Sajo and Glas, 2011). Microglia are
considered to derive from cells of monocytic lineage and invade the brain
early in development (Farber and Kettenmann, 2005). Of the total CNS glial
cell content, some 5-20% comprises microglia, depending on the specific
brain region (Sajo and Glas, 2011; Lawson et al., 1990).
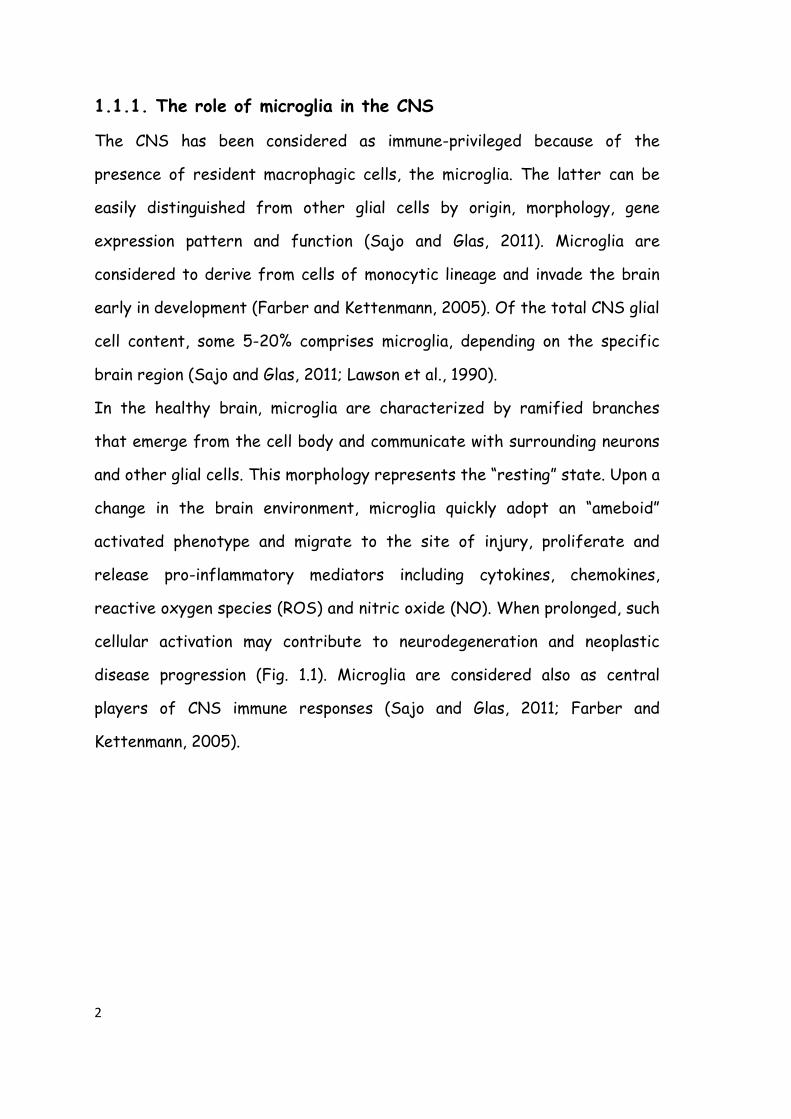
In the healthy brain, microglia are characterized by ramified branches
that emerge from the cell body and communicate with surrounding neurons
and other glial cells. This morphology represents the “resting” state. Upon a
change in the brain environment, microglia quickly adopt an “ameboid”
activated phenotype and migrate to the site of injury, proliferate and
release pro-inflammatory mediators including cytokines, chemokines,
reactive oxygen species (ROS) and nitric oxide (NO). When prolonged, such
cellular activation may contribute to neurodegeneration and neoplastic
disease progression (Fig. 1.1). Microglia are considered also as central
players of CNS immune responses (Sajo and Glas, 2011; Farber and
Kettenmann, 2005).
3
Figure 1.1 Microglial activity states throughout the activation process. Microglia in the
surveillance state (traditionally termed ‘resting’ state)—constantly survey their
environment for signals that would indicate a potential threat to CNS homeostasis. The
appearance of such ‘activating’ signals (infection, trauma or cell impairment) or loss of
constitutive ‘calming’ signals triggers a transition to an alerted state. Cells hence further
commit to distinct reactive phenotypes, constituted by transcriptional profiles and non-
transcriptional changes, and enter their executive phase (for example, release of cytokines
and chemokines, phagocytotic activity).
Some microglia may not retransform to a completely naive status but remain in a ‘post-
activated’ state. These cells could retain subtle changes, for example, in transcriptional
activity that affect their sensitivity to constitutive (calming) signals or alter responses to
subsequent stimulation. Post-activated microglia could thus have acquired some experience
(indicated as memory in the figure by a floppy disk icon) (Hanosh et al., 2007).
1.1.1.1. Identification of microglia populations
Since microglia and macrophages exhibit the same lineage origin, they
share many antigenic markers. For this reason the lack of unique microglial
antigens has hindered until now their identification. Immunohistochemistry
4
or immunofluorescence techniques can be applied to brain slices to detect
in vitro microglial cells. The downside of these procedures, however, is that
they fail to distinguish microglia from macrophages. Antibodies raised
against complement receptor type 3, CR3 (Graeber et al., 1989; Kingham et
al., 1999) recognize the complex CD11b/CD18 (also named OX42),
expressed by rat and mouse microglia and usually used as a classical marker
of microglia (Robinson et al., 1986). Alternatively, the cluster of
differentiation type 68 (CD68) (also named ED-1), a lysosomal protein, can
be used to identify microglia (Graeber et al., 1990; Slepko & Levi 1996;
Kingham et al., 1999; Hooper et al., 2005). High levels of CD68 expression
are associated with macrophages and activated microglia, while low levels of
expression are associated with quiescent ramified microglia (Graeber et al.,
1990; Slepko & Levi 1996; Kingham et al., 1999).
Microglial identification is often performed using flow cytometry, which
enables one to determine differences as well as quantify antigen expression
levels. Ramified parenchymal microglia possess the phenotype
CD11b+, CD45low (Ford et al., 1995; Becher & Antel 1996; Kingham et al.,
1999; Hooper et al., 2005) while other CNS and peripheral macrophages
exhibit the phenotype CD11b+, CD45high . Moreover, ionized calcium binding
adaptor molecule 1 (Iba1), a protein that mediates Ca2+ signals, can be used
to selectively detect microglia.
Brain microglia reportedly exhibit antigen heterogeneity (Ito et al., 1998;
Perry et al., 1985). For example, an antibody raised against OX-42 was
described to react with ramified but not perivascular microglia (Graeber et
al., 1988). By contrast, an anti-ED2 antibody reacted with perivascular but
not ramified microglia (Raeber et al., 1989). This heterogeneity can be a
reflection of different subpopulations of microglia. Ito and colleagues
5
(1998) demonstrated that Iba1 recognizes ramified microglia throughout
the white and grey matter and perivascular microglia in the brain,
suggesting that different subpopulations of microglia share a common
pattern of Iba1 expression (Ito et al., 1998).
1.1.1.2. Physiological properties of microglia
Microglia cell cultures have been used to identify surface membrane
receptors and channels. Classical neurotransmitters engage microglial
receptors in physiologic conditions and trigger increases in Ca2+
concentration, a transient increase in K+ conductance or open an intrinsic
ionic pore.
Different subtypes of glutamate receptors are expressed by microglia:
these include α-amino-3-hydroxy-5-methyl-4-isoxazole propionate and
kainate. Their activation induces the release of tumor necrosis factor-α
(TNF-α) (Noda et al., 2000) but can also reduce microglia activation by
lipopolysaccharide (LPS) (Taylor et al., 2002), a component of the outer
membrane of Gram-negative bacteria. Further, microglial cell γ-
aminobutyric acid (GABA)B receptors can control K+ conductance and
modulate the immune response reducing the release of interleukin-6 (IL-6)
in cells stimulated with LPS (Farber and Kettenmann, 2005, Kuhn et al.,
2004).
Adenosine triphosphate (ATP) is a nucleoside important not only as a key
energy substrate of cells but also as a cell signaling molecule. Purinergic
P2Y and P2X receptors are expressed on the cell surface (Farber and
Kettenmann, 2005). In microglia ATP can trigger complex responses upon
binding its target receptors. In particular, activation of P2X receptor
6
subtype 7 in LPS-‘primed’ microglia can induce the release of interleukin-1β
(IL-1β (Facci et al., 2014; Ferrari et al., 1997; Honda et al., 2001).
Microglia, moreover express β1- and β2- adrenergic receptors. Stimulation
with norepinephrine increases intracellular cyclic adenosine monophosphate
concentration and subsequent mRNA level of IL-1β (Tanaka et al., 2002).
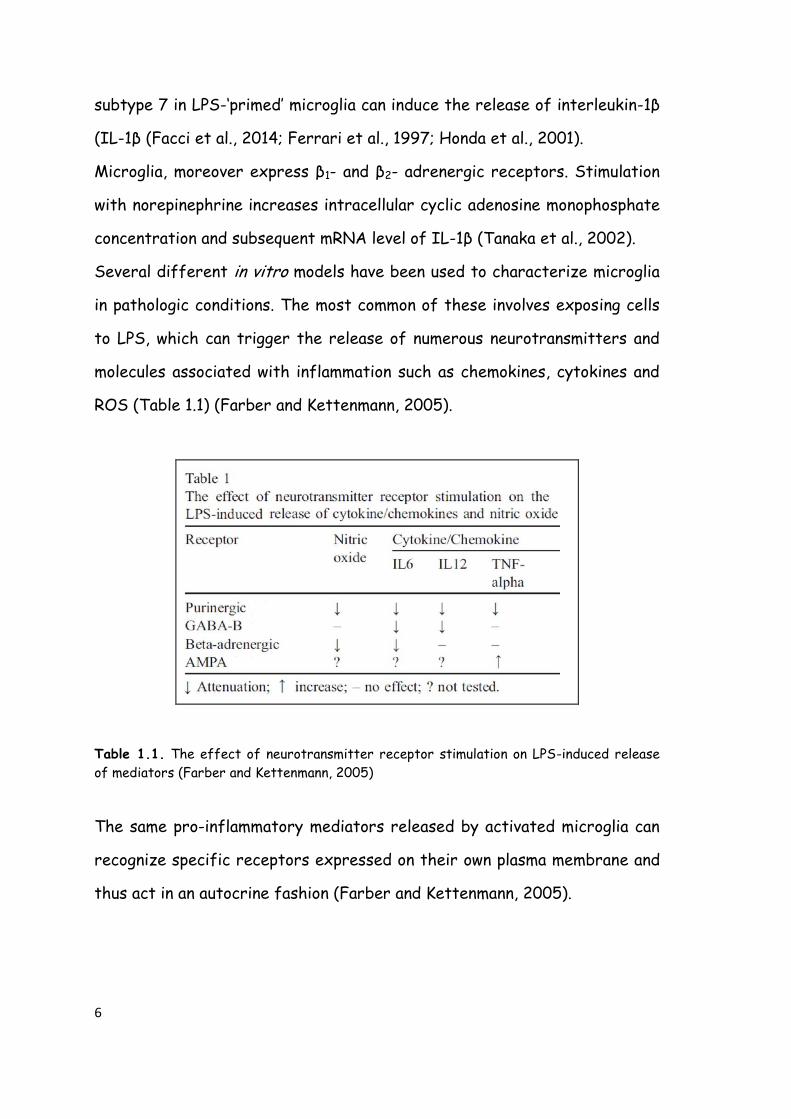
Several different in vitro models have been used to characterize microglia
in pathologic conditions. The most common of these involves exposing cells
to LPS, which can trigger the release of numerous neurotransmitters and
molecules associated with inflammation such as chemokines, cytokines and
ROS (Table 1.1) (Farber and Kettenmann, 2005).
Table 1.1. The effect of neurotransmitter receptor stimulation on LPS-induced release
of mediators (Farber and Kettenmann, 2005)
The same pro-inflammatory mediators released by activated microglia can
recognize specific receptors expressed on their own plasma membrane and
thus act in an autocrine fashion (Farber and Kettenmann, 2005).
7
1.1.2. The role of astrocytes in the CNS
Rudolf Virchow was the first to introduce the term “neuroglia”. He defined
these cells as small and round-shaped, which filled-up the extracellular
space and were part of the connective tissue. While the term neuroglia is
still used our knowledge of these cells has dramatically changed (Wang and
Bordey, 2008). In mammals, astrocytes are generated during gliogenesis
that begins late in embryonic development and continues during the
neonatal and postnatal period. Since different astrocyte lineages can be
distinguished, it is possible to postulate that not all originate in the same
manner (Wang and Bordey, 2008).
Astrocytes are found throughout the entire CNS in a contiguous and non-
overlapping manner. There are no CNS regions devoid of astrocytes or
closely related cells (Sofroniew and Vinters, 2009). Because of their
morphology and anatomical location, astrocytes can be divided into two main
subtypes, called protoplasmic and fibrous. The former are located in grey
matter, while the latter are found throughout the white matter (Sofroniew
and Vinters, 2009).
Both cell subtypes make contacts with blood vessels. In particular,
synapses are usually enveloped by the processes of protoplasmic
astrocytes, while nodes of Ranvier are tightly wrapped by the processes of
fibrous astrocytes (Sofroniew and Vinters, 2009). It has been estimated
that in hippocampus and cerebral cortex several hundred dendrites from
multiple neurons are contacted by branching processes of a single
astrocyte (Sofroniew and Vinters, 2009; Bushong et al., 2002; Halassa et
al., 2007; Ogata et al., 2002).
8
1.1.2.1. Identification of astrocytic populations
Glial cells can be characterized using specific molecular markers.
Astrocytes are commonly identified by the presence of intermediate
filaments (glial fibrils). The major component of glial fibrils, glial fibrillary
acid protein (GFAP) has become a typical marker in immunohistochemical
techniques. However this astrocytic marker has limitations. GFAP can be
clearly detected only in reactive astrocytes during pathological events. It
cannot be considered as a absolute marker because of its low detection
level in all non-reactive astrocytes in healthy brain. To overcome this
impasse double-staining with multiple markers is possible (Sofroniew and
Vinters, 2009). Large-scale genetic analysis of the astrocyte trascriptome
allowed one to identify a large number of molecules typical of these cells
compared to neurons and oligodendrocytes (Sofroniew and Vinters, 2009;
Chahoy et al., 2008).
An alternative way to characterize astrocytes is by the use of flow
cytometry, whose high sensitivity permits the detection of low protein
expression. The immunophenotype of astrocytic cells can be well-
characterized based on different expression levels in GFAP-positive cells
related to specific parameters of dimension and cell surface complexity
(forward and side scatter, FCS and SSC).
1.1.2.2. Physiological properties of astrocytes
Astroglia were at one time considered to be in a certain sense the brain’s
‘glue’, providing structural support for neurons. We now know that the story
is far more complex, whereby glial cells are active players in CNS well-
being. Astrocytes outnumber other cells in CNS.
9
The different subtypes of astrocytes share a common set of biophysical
characteristics. These macroglia all express potassium (K+) and sodium
(Na2+) channels, and are able to evoke inward currents without generating
action potentials - unlike neurons. For this reason astrocytes are referred
to as “passive” cells, but not necessarily “silent” or unresponsive (Sofroniew
and Vinters, 2009; Wang et al., 2008). An intriguing property of astrocytes
is their ability to generate intracellular calcium (Ca2+) waves that can be
considered as a form of astrocyte excitability. Cell behaviors will be
determined necessarily by intracellular ion species and concentration. Ionic
movements can be triggered by activity-dependent transmitter release
from neurons. Likewise, it can elicit the release of gliotransmitters from
astrocytes, thereby altering neuronal excitability (Sofroniew and Vinters,
2009; Halassa et al., 2007; Perea et al., 2009; Shigetomi et al., 2008).
Neighboring astrocytes can communicate with each other by means of ion
waves traversing gap junctions. Gap junction coupling of astrocytes into
multicellular networks participates both in normal function and CNS
disorders (Sofroniew and Vinters, 2009; Nedergaard et al., 2003;
Shigetomi et al., 2008; Volterra et al., 2005). The above phenomenon is now
believed to allow astrocytes to play a direct role in synaptic transmission.
Astrocytes express also a repertoire of cell surface metabotropic and
ionotropic receptors. Furthermore, they express receptors for growth
factors, chemokines, steroids and receptors involved in innate immunity
(Wang et al., 2008). It is important to keep in mind that astrocytes are also
a critical component of the blood-brain barrier, which can become
compromised in various neuropathologies – especially when inflammation is
involved (Fig. 1.2).
10
1.1.3. Microglia and astrocyte interplay
Microglia are the principal resident immune cell type in the CNS (‘brain
macrophages’) and as such represent the first line of defense, constantly
surveilling their environment to detect pathogens and injury. Activation
takes place immediately after the detection of exogenous substances, such
as LPS, or pro-inflammatory mediators, such as IL-1β (Davalos et al., 2005).
Microglia undergo rapid proliferation in order to increase their number for
the upcoming “battle”. Indeed immunostaining at this stage shows an
upregulation of OX42 (Kim and de Vellis, 2005). Their migration to the
injured area is accompanied by promotion of cell proliferation through the
secretion of pro-inflammatory factors. All these events allow microglia to
destroy the invading exogenous agent, remove potential harmful debris, and
secrete growth factors promoting tissue repair to return to homeostasis
(Fig. 1.2) (Kreutzberg, 1996).
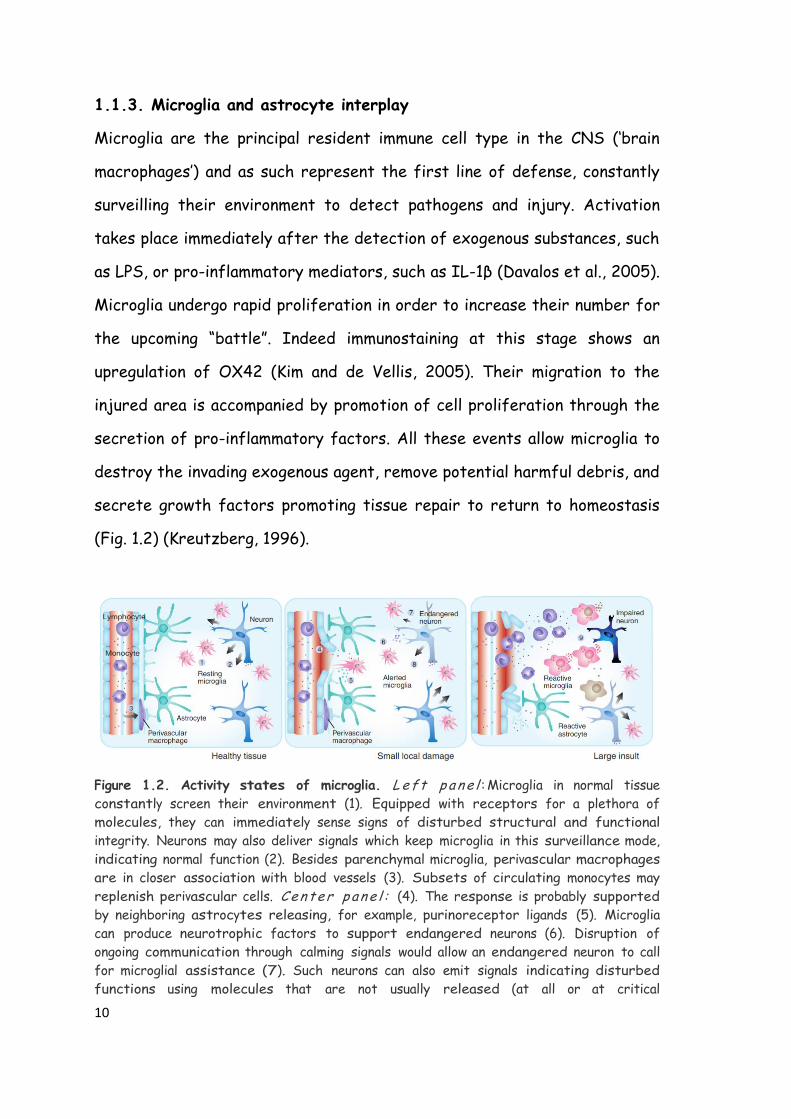
Figure 1.2. Activity states of microglia. L e f t p a n e l : Microglia in normal tissue
constantly screen their environment (1). Equipped with receptors for a plethora of
molecules, they can immediately sense signs of disturbed structural and functional
integrity. Neurons may also deliver signals which keep microglia in this surveillance mode,
indicating normal function (2). Besides parenchymal microglia, perivascular macrophages
are in closer association with blood vessels (3). Subsets of circulating monocytes may
replenish perivascular cells. C e n t e r p a n e l : (4). The response is probably supported
by neighboring astrocytes releasing, for example, purinoreceptor ligands (5). Microglia
can produce neurotrophic factors to support endangered neurons (6). Disruption of
ongoing communication through calming signals would allow an endangered neuron to call
for microglial assistance (7). Such neurons can also emit signals indicating disturbed
functions using molecules that are not usually released (at all or at critical
11
concentrations; (8)). Microglial cells may be able to limit further damage and restore
normal homeostasis. Right panel: stronger insults to the CNS (infectious challenge or
significant tissue injury) may trigger more drastic changes in the functional phenotype
of microglia. Excessive acute, sustained (chronic) or maladaptive responses of microglia
may lead to substantial impairment of neurons and glia (9). Failure of protection and an
active contribution to damaging cascades have been attributed to activated glial cells in
many pathologic scenarios in the CNS (Hanish et al., 2007).
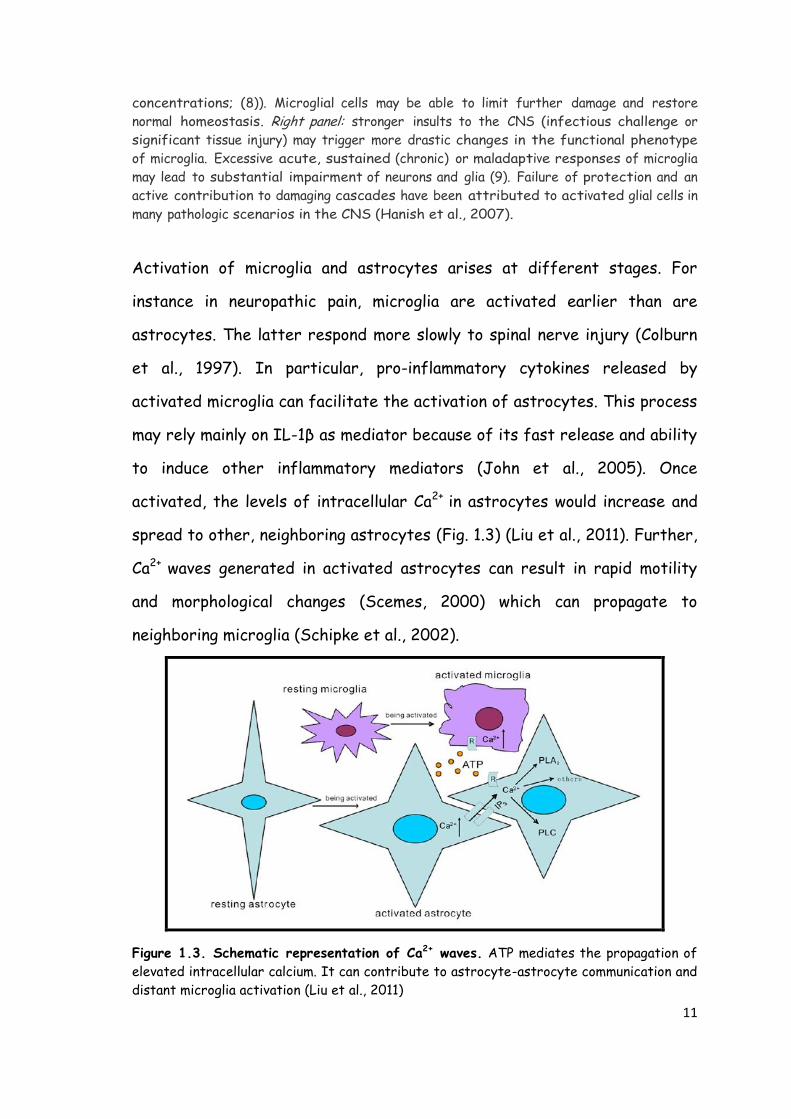
Activation of microglia and astrocytes arises at different stages. For
instance in neuropathic pain, microglia are activated earlier than are
astrocytes. The latter respond more slowly to spinal nerve injury (Colburn
et al., 1997). In particular, pro-inflammatory cytokines released by
activated microglia can facilitate the activation of astrocytes. This process
may rely mainly on IL-1β as mediator because of its fast release and ability
to induce other inflammatory mediators (John et al., 2005). Once
activated, the levels of intracellular Ca2+ in astrocytes would increase and
spread to other, neighboring astrocytes (Fig. 1.3) (Liu et al., 2011). Further,
Ca2+ waves generated in activated astrocytes can result in rapid motility
and morphological changes (Scemes, 2000) which can propagate to
neighboring microglia (Schipke et al., 2002).
Figure 1.3. Schematic representation of Ca2+ waves. ATP mediates the propagation of
elevated intracellular calcium. It can contribute to astrocyte-astrocyte communication and
distant microglia activation (Liu et al., 2011)
12
Blocking purinergic receptors with antagonists, such as suramin, can fully
prevent this propagation (Guan et al., 1997) – pointing to ATP as the
principal mediator (Cotrina et al., 1998). Purinergic receptors are highly
expressed on microglia, thus placing ATP in a position to mediate astrocyte-
to-microglia communication (Honda et al., 2001; Noremberg et al., 1997;
Shigemoto-Mogami et al., 2001; Suzuki et al., 2004). In addition, microglia
respond to cytokines released from ATP-stimulated cells (Bianco et al.,
2005; Hide et al., 2000). Astrocytes propagating long-distance Ca2+ waves
can contribute to microglia activation at a distance (Nedergaard and
Dirnagl, 2005, Liu et al., 2011).
1.1.4. Inflammation
Inflammation and neurological diseases are intimately connected. Although
fundamentally a protective cellular response aimed at removing injurious
stimuli and initiating the healing process, when prolonged, inflammation
overrides the bounds of physiological control and eventually becomes
destructive. The degree and extend of inflammation is a function of the
interplay between the initiating insult (pathogen and/or tissue trauma) and
the immune system (Carson et al., 2006; Lo et al., 1999; Medzhitov et al.,
1998). Inflammation increasingly surfaces as a key element in the
pathobiology of chronic pain and neuropathic pain, neurodegenerative
diseases, stroke, spinal cord injury, and perhaps even neuropsychiatric
disorders (Carson et al., 2006; Melchior et al., 2006; Herbert et al., 2005;
others). A plethora of pro-inflammatory cytokines, eicosanoids, and other
immune neurotoxins, have been found in cerebrospinal fluid and/or
affected brain regions of patients with neurodegenerative disorders
13
(Nagatsu et al., 2000). Glia provide a link also between neuroinflammation
and neuropathic pain (Thacker et al., 2007); microglia, in particular, show
increased activity in multiple pain processing pathways in response to
peripheral injury (Gao and Ji, 2010).
A key advance in the field of pain research has been the insight that not
only neurons, but also immune-derived non-neuronal cells, such as microglia,
as well as other non-neuronal cells (astrocytes, mast cells), are involved in
pain signaling. The participation of these non-neuronal cells allows for the
transmission of pain messages from peripheral nociceptors to the spinal and
supraspinal levels. Further, these cell types are able to communicate with
each other – as noted above. This has important implications for pain
treatment, as pain pharmacology has traditionally targeted neurons while
ignoring these non-neuronal elements and their interactions. This, no doubt,
accounts for the fact that current analgesics predominately modulate pain
transduction and transmission in neurons and have limited success in
controlling disease progression. Understanding how glia respond to
pathogens will be important in the design of more efficacious anti-
inflammatory therapeutics.
1.2. Toll-like receptors
The immune system preserves homeostasis and protects the organism
against disease. To function properly, an immune system must detect a wide
variety of external agents, known as pathogens, and distinguish between
self and non-self. In many species, the immune system can be subdivided in
two branches: the innate and the adaptive immune systems. The former is
cell-mediated and represents the first line of defense, while the latter is
14
defined as humoral and is responsible for the production of antibodies and
formation of long-lived memory cells (Kelian, 2005).
Microglia, together with macrophages, dendritic cells, natural killer cells
and neutrophils are components of the innate immune system and express a
predetermined subset of germline-encoded receptors, called pattern
recognition receptors (PRRs). PRRs are a large family of receptors
classified as membrane-bound, cytoplasmic or secreted. Toll-like receptors
(TLRs) are cell surface PRRs and are considered crucial environmental-
sensing molecular motifs termed pathogen-associated molecular patterns
(PAMPs) and endogenous molecules termed damage-associated molecular
patterns (DAMPs) (Hanke and Kelian, 2011).
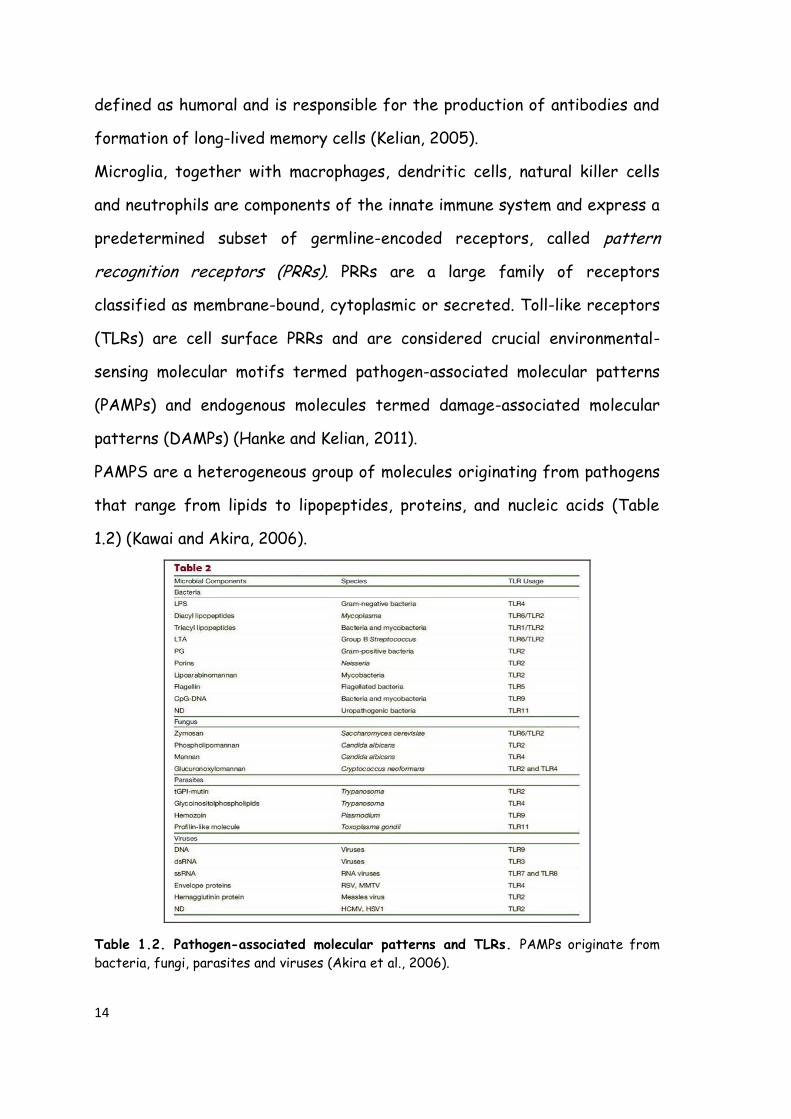
PAMPS are a heterogeneous group of molecules originating from pathogens
that range from lipids to lipopeptides, proteins, and nucleic acids (Table
1.2) (Kawai and Akira, 2006).
Table 1.2. Pathogen-associated molecular patterns and TLRs. PAMPs originate from
bacteria, fungi, parasites and viruses (Akira et al., 2006).
15
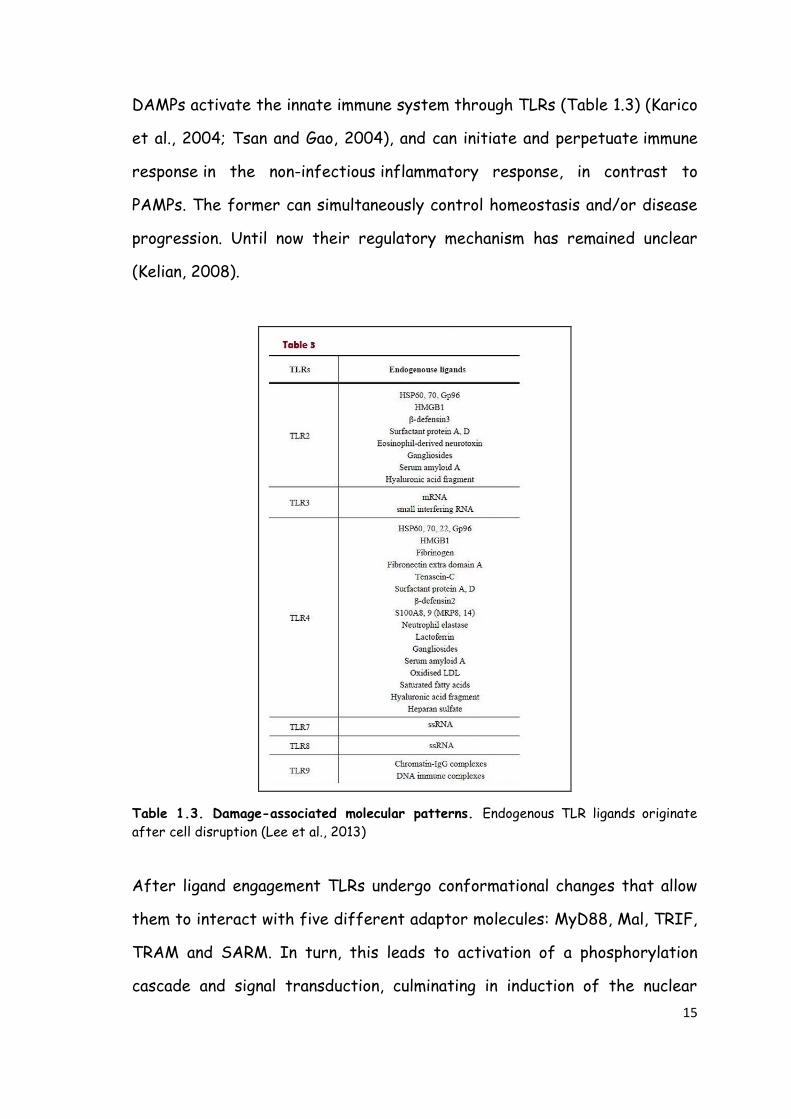
DAMPs activate the innate immune system through TLRs (Table 1.3) (Karico
et al., 2004; Tsan and Gao, 2004), and can initiate and perpetuate immune
response in the non-infectious inflammatory response, in contrast to
PAMPs. The former can simultaneously control homeostasis and/or disease
progression. Until now their regulatory mechanism has remained unclear
(Kelian, 2008).
Table 1.3. Damage-associated molecular patterns. Endogenous TLR ligands originate
after cell disruption (Lee et al., 2013)
After ligand engagement TLRs undergo conformational changes that allow
them to interact with five different adaptor molecules: MyD88, Mal, TRIF,
TRAM and SARM. In turn, this leads to activation of a phosphorylation
cascade and signal transduction, culminating in induction of the nuclear
16
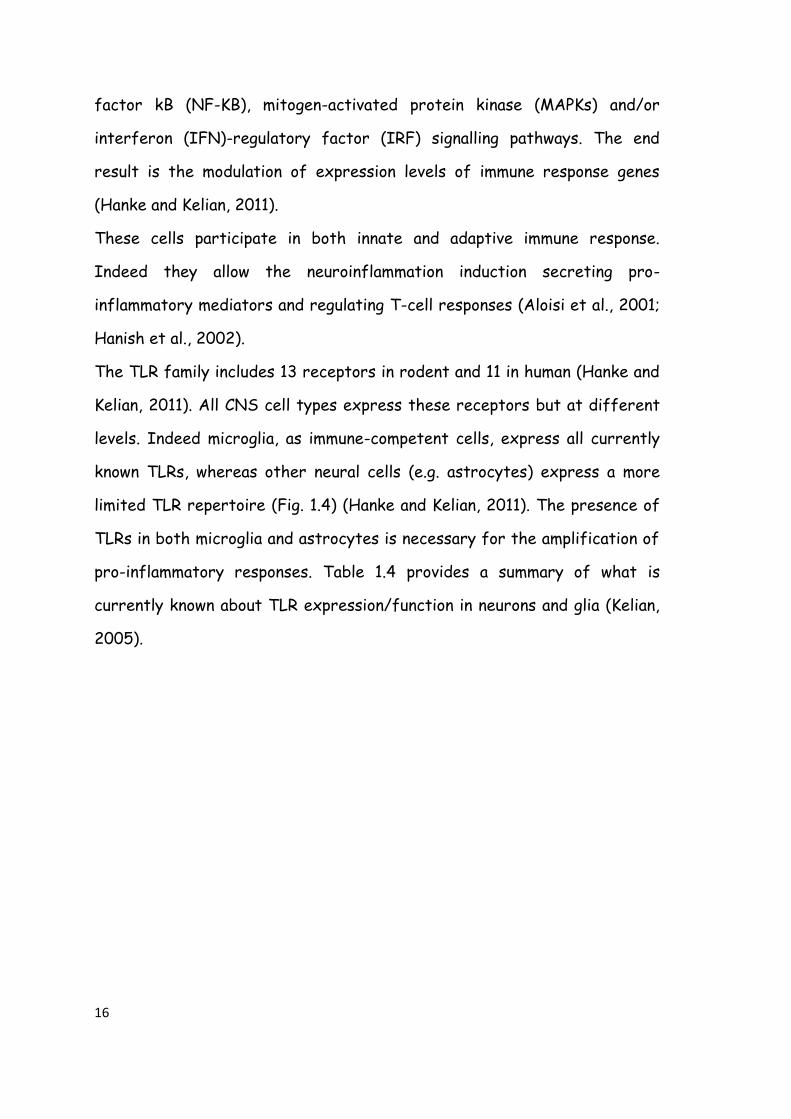
factor kB (NF-KB), mitogen-activated protein kinase (MAPKs) and/or
interferon (IFN)-regulatory factor (IRF) signalling pathways. The end
result is the modulation of expression levels of immune response genes
(Hanke and Kelian, 2011).
These cells participate in both innate and adaptive immune response.
Indeed they allow the neuroinflammation induction secreting pro-
inflammatory mediators and regulating T-cell responses (Aloisi et al., 2001;
Hanish et al., 2002).
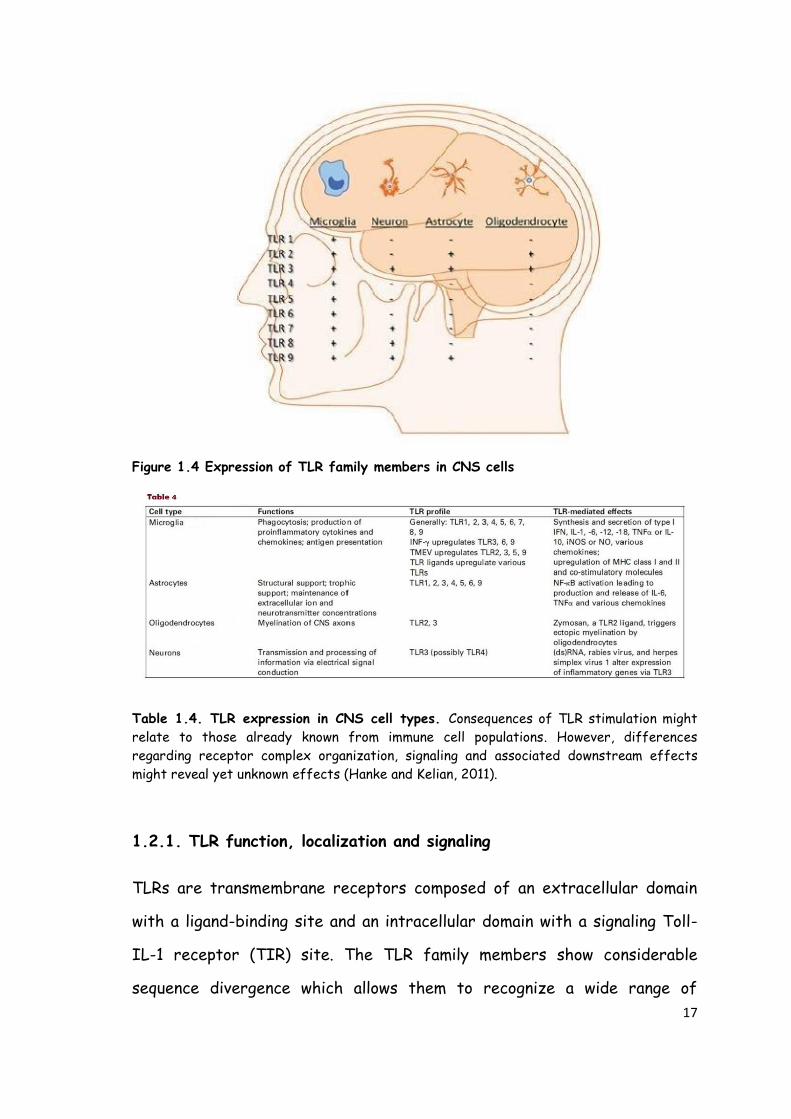
The TLR family includes 13 receptors in rodent and 11 in human (Hanke and
Kelian, 2011). All CNS cell types express these receptors but at different
levels. Indeed microglia, as immune-competent cells, express all currently
known TLRs, whereas other neural cells (e.g. astrocytes) express a more
limited TLR repertoire (Fig. 1.4) (Hanke and Kelian, 2011). The presence of
TLRs in both microglia and astrocytes is necessary for the amplification of
pro-inflammatory responses. Table 1.4 provides a summary of what is
currently known about TLR expression/function in neurons and glia (Kelian,
2005).
17
Figure 1.4 Expression of TLR family members in CNS cells
Table 1.4. TLR expression in CNS cell types. Consequences of TLR stimulation might
relate to those already known from immune cell populations. However, differences
regarding receptor complex organization, signaling and associated downstream effects
might reveal yet unknown effects (Hanke and Kelian, 2011).
1.2.1. TLR function, localization and signaling
TLRs are transmembrane receptors composed of an extracellular domain
with a ligand-binding site and an intracellular domain with a signaling Toll-
IL-1 receptor (TIR) site. The TLR family members show considerable
sequence divergence which allows them to recognize a wide range of
18
chemical structures. The TIR domain, in contrast, is highly conserved
between family members and recognizes the TIR domain containing adaptor
molecules.
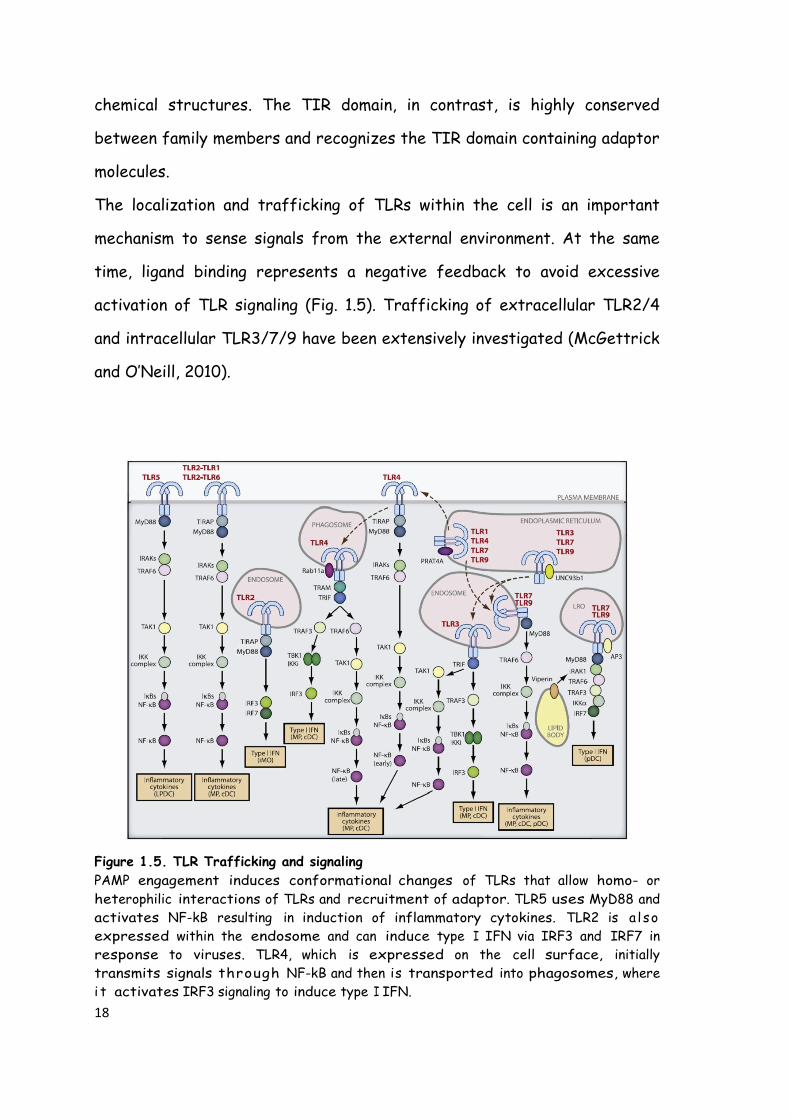
The localization and trafficking of TLRs within the cell is an important
mechanism to sense signals from the external environment. At the same
time, ligand binding represents a negative feedback to avoid excessive
activation of TLR signaling (Fig. 1.5). Trafficking of extracellular TLR2/4
and intracellular TLR3/7/9 have been extensively investigated (McGettrick
and O’Neill, 2010).
Figure 1.5. TLR Trafficking and signaling
PAMP engagement induces conformational changes of TLRs that allow homo- or
heterophilic interactions of TLRs and recruitment of adaptor. TLR5 uses MyD88 and
activates NF-kB resulting in induction of inflammatory cytokines. TLR2 is a l so
expressed within the endosome and can induce type I IFN via IRF3 and IRF7 in
response to viruses. TLR4, which is expressed on the cell surface, initially
transmits signals through NF-kB and then is transported into phagosomes, where
i t activates IRF3 signaling to induce type I IFN.
19
TLR3, TLR7, and TLR9 are localized mainly to the endoplasmic reticulum in the steady-
state and traffic to the endosomal compartment, where they engage their ligands.
TLR3 activates the TRIF-dependent pathway to induce type I IFN and inflammatory
cytokines. TLR7 and TLR9 activate NF-kB and IRF7, respectively (Kawai and Akira,
2011).
Initial studies using cell lines transfected with TLR4 showed no
responsiveness to LPS. It was later determined that an additional molecule,
named MD2, was needed for LPS signaling. MD2 is physically bound to TLR4
forming a complex, and recognizes the lipid A portion of LPS, the
biologically active component (Shimazu et al., 1999; Viriyakosol et al.,
2000). TLR4 is currently the best-characterized TLR. Together with MD2
and CD14, a glycosylphosphatidyl inositol (GPI)-anchored receptor belonging
to PRRs, these form a complex that binds LPS.
A single LPS molecule can regulate TLR4 cell surface expression at two
levels: the amount of TLR4 moving from Golgi to plasma membrane; the
amount of TLR4 moving from plasma membrane to endosomes. In resting
human monocytes TLR4 protein can be detected both in Golgi and on the
cell surface (Husebye et al., 2006; Latz et al., 2002). MD2 has an essential
role in regulating TLR4 distribution and, as a consequence, in LPS
responsiveness (Nagai et al., 2002; Shimazu et al., 1999). There is good
evidence to confirm that a continuous cycling of TLR4 between Golgi and
plasma membrane occurs after LPS engagement. This cycle leads to
interaction with molecular transducers and finally cytosolic NF-kB
activation (Verstrepen et al., 2008; Windheim et al., 2008). Within 15
minutes after LPS binding, TLR4 translocates from cell surface to
endosome via a clathrin-dependent dynamic process (Husebye et al., 2006;
Palsson-McDermott et al., 2009). It was initially thought that this receptor
movement served to allow its degradation (Husebye et al., 2006), although
20
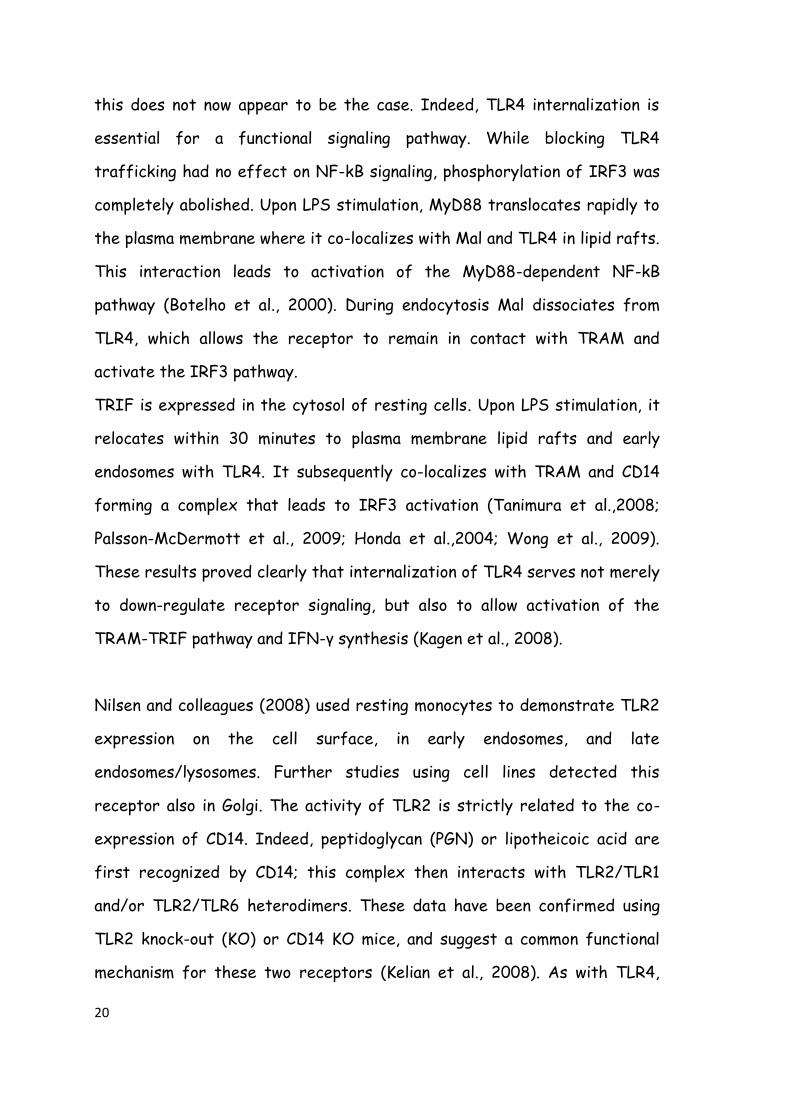
this does not now appear to be the case. Indeed, TLR4 internalization is
essential for a functional signaling pathway. While blocking TLR4
trafficking had no effect on NF-kB signaling, phosphorylation of IRF3 was
completely abolished. Upon LPS stimulation, MyD88 translocates rapidly to
the plasma membrane where it co-localizes with Mal and TLR4 in lipid rafts.
This interaction leads to activation of the MyD88-dependent NF-kB
pathway (Botelho et al., 2000). During endocytosis Mal dissociates from
TLR4, which allows the receptor to remain in contact with TRAM and
activate the IRF3 pathway.
TRIF is expressed in the cytosol of resting cells. Upon LPS stimulation, it
relocates within 30 minutes to plasma membrane lipid rafts and early
endosomes with TLR4. It subsequently co-localizes with TRAM and CD14
forming a complex that leads to IRF3 activation (Tanimura et al.,2008;
Palsson-McDermott et al., 2009; Honda et al.,2004; Wong et al., 2009).
These results proved clearly that internalization of TLR4 serves not merely
to down-regulate receptor signaling, but also to allow activation of the
TRAM-TRIF pathway and IFN-γ synthesis (Kagen et al., 2008).
Nilsen and colleagues (2008) used resting monocytes to demonstrate TLR2
expression on the cell surface, in early endosomes, and late
endosomes/lysosomes. Further studies using cell lines detected this
receptor also in Golgi. The activity of TLR2 is strictly related to the co-
expression of CD14. Indeed, peptidoglycan (PGN) or lipotheicoic acid are
first recognized by CD14; this complex then interacts with TLR2/TLR1
and/or TLR2/TLR6 heterodimers. These data have been confirmed using
TLR2 knock-out (KO) or CD14 KO mice, and suggest a common functional
mechanism for these two receptors (Kelian et al., 2008). As with TLR4,
21
upon stimulation TLR2 accumulates in lipid rafts and in phagosomes
(Triantafilou et al., 2002; Ozinsky et al., 2000; Takahashi et al., 2008;
Underhill et al., 1999). Likewise, antigens bound to TLR2 are presented to
the major histocompatibility complex (MHC) class II to induce proliferation
of mouse C-specific human CD4+ T cell clones (Schjetne et al., 2003). TLR2
internalization is required for the production of IFNγ but not TNFα. These
data support the idea that TLR2 and TLR4 have distinct subcellular
locations and mediate two signaling pathways (Barbalat et al., 2009).
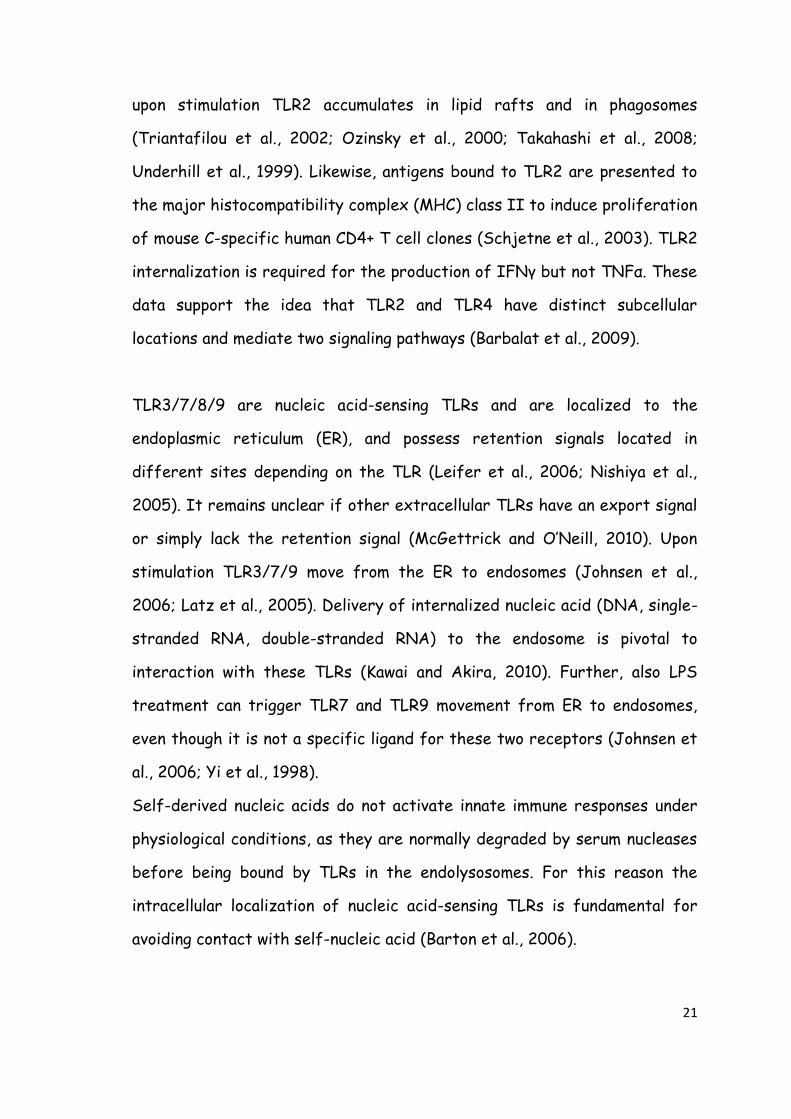
TLR3/7/8/9 are nucleic acid-sensing TLRs and are localized to the
endoplasmic reticulum (ER), and possess retention signals located in
different sites depending on the TLR (Leifer et al., 2006; Nishiya et al.,
2005). It remains unclear if other extracellular TLRs have an export signal
or simply lack the retention signal (McGettrick and O’Neill, 2010). Upon
stimulation TLR3/7/9 move from the ER to endosomes (Johnsen et al.,
2006; Latz et al., 2005). Delivery of internalized nucleic acid (DNA, single-
stranded RNA, double-stranded RNA) to the endosome is pivotal to
interaction with these TLRs (Kawai and Akira, 2010). Further, also LPS
treatment can trigger TLR7 and TLR9 movement from ER to endosomes,
even though it is not a specific ligand for these two receptors (Johnsen et
al., 2006; Yi et al., 1998).
Self-derived nucleic acids do not activate innate immune responses under
physiological conditions, as they are normally degraded by serum nucleases
before being bound by TLRs in the endolysosomes. For this reason the
intracellular localization of nucleic acid-sensing TLRs is fundamental for
avoiding contact with self-nucleic acid (Barton et al., 2006).
22
1.2.2. TLRs expression in microglia and astrocytes
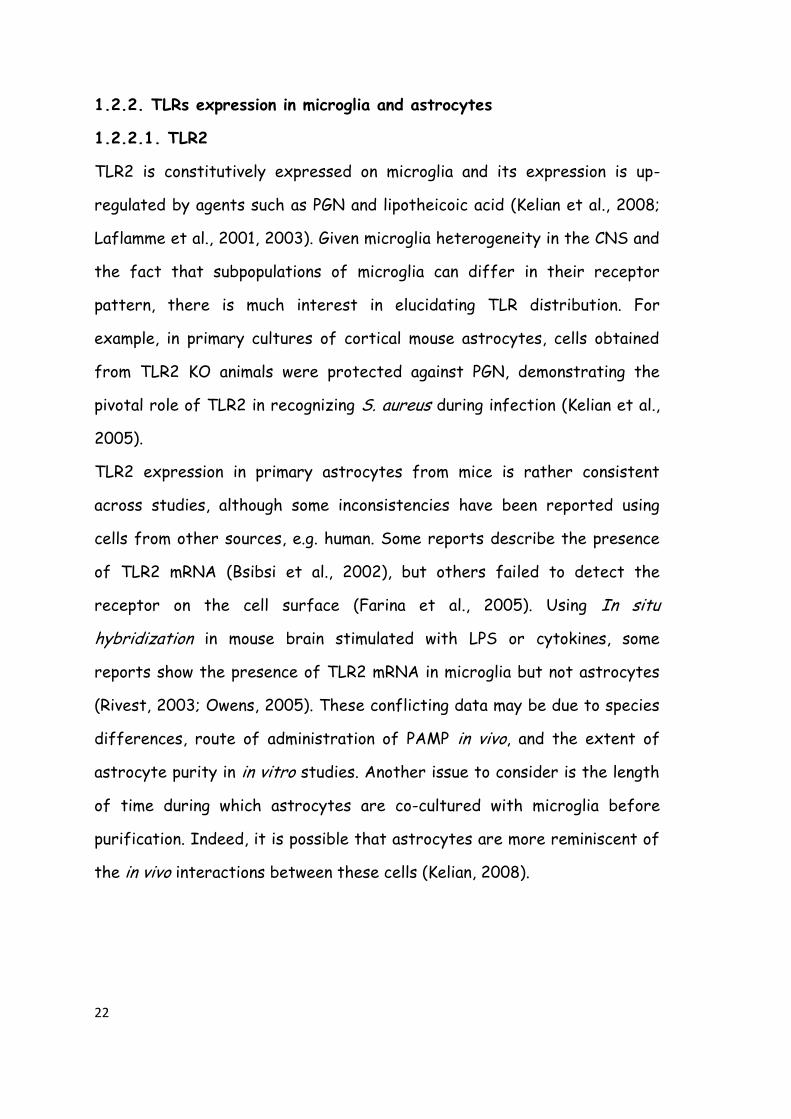
1.2.2.1. TLR2
TLR2 is constitutively expressed on microglia and its expression is up-
regulated by agents such as PGN and lipotheicoic acid (Kelian et al., 2008;
Laflamme et al., 2001, 2003). Given microglia heterogeneity in the CNS and
the fact that subpopulations of microglia can differ in their receptor
pattern, there is much interest in elucidating TLR distribution. For
example, in primary cultures of cortical mouse astrocytes, cells obtained
from TLR2 KO animals were protected against PGN, demonstrating the
pivotal role of TLR2 in recognizing S. aureus during infection (Kelian et al.,
2005).
TLR2 expression in primary astrocytes from mice is rather consistent
across studies, although some inconsistencies have been reported using
cells from other sources, e.g. human. Some reports describe the presence
of TLR2 mRNA (Bsibsi et al., 2002), but others failed to detect the
receptor on the cell surface (Farina et al., 2005). Using In situ
hybridization in mouse brain stimulated with LPS or cytokines, some
reports show the presence of TLR2 mRNA in microglia but not astrocytes
(Rivest, 2003; Owens, 2005). These conflicting data may be due to species
differences, route of administration of PAMP in vivo, and the extent of
astrocyte purity in in vitro studies. Another issue to consider is the length
of time during which astrocytes are co-cultured with microglia before
purification. Indeed, it is possible that astrocytes are more reminiscent of
the in vivo interactions between these cells (Kelian, 2008).
23
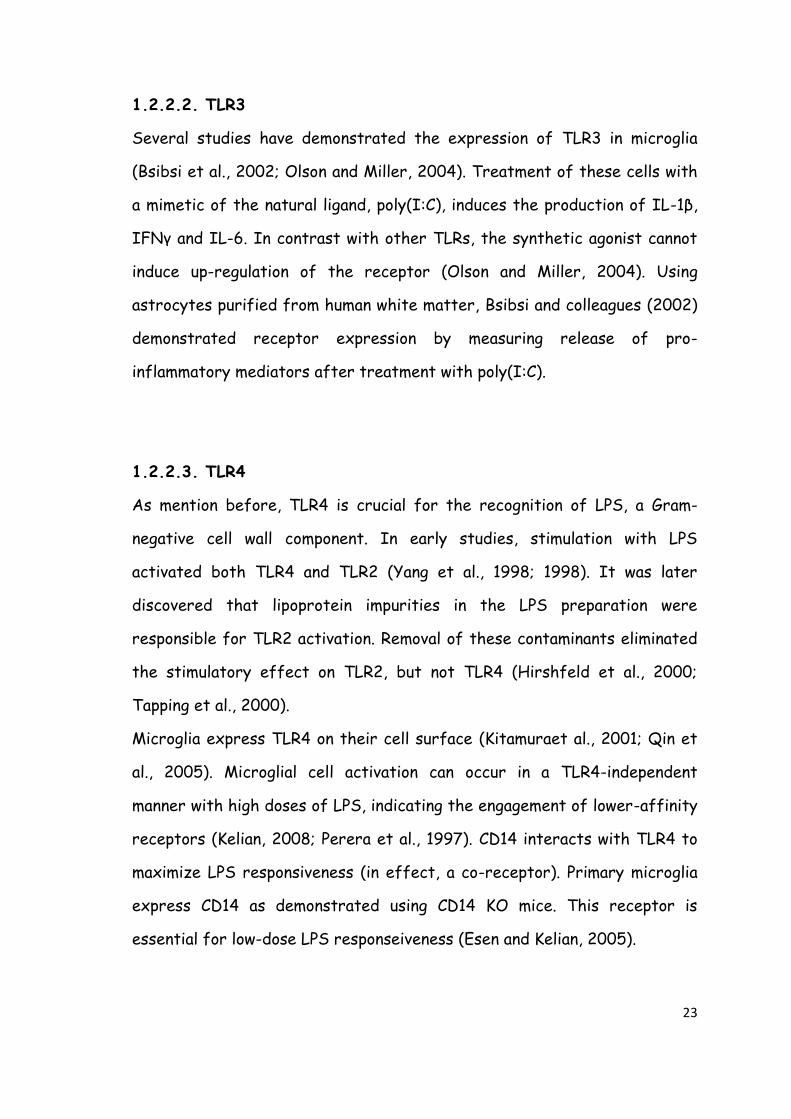
1.2.2.2. TLR3
Several studies have demonstrated the expression of TLR3 in microglia
(Bsibsi et al., 2002; Olson and Miller, 2004). Treatment of these cells with
a mimetic of the natural ligand, poly(I:C), induces the production of IL-1β,
IFNγ and IL-6. In contrast with other TLRs, the synthetic agonist cannot
induce up-regulation of the receptor (Olson and Miller, 2004). Using
astrocytes purified from human white matter, Bsibsi and colleagues (2002)
demonstrated receptor expression by measuring release of pro-
inflammatory mediators after treatment with poly(I:C).
1.2.2.3. TLR4
As mention before, TLR4 is crucial for the recognition of LPS, a Gram-
negative cell wall component. In early studies, stimulation with LPS
activated both TLR4 and TLR2 (Yang et al., 1998; 1998). It was later
discovered that lipoprotein impurities in the LPS preparation were
responsible for TLR2 activation. Removal of these contaminants eliminated
the stimulatory effect on TLR2, but not TLR4 (Hirshfeld et al., 2000;
Tapping et al., 2000).
Microglia express TLR4 on their cell surface (Kitamuraet al., 2001; Qin et
al., 2005). Microglial cell activation can occur in a TLR4-independent
manner with high doses of LPS, indicating the engagement of lower-affinity
receptors (Kelian, 2008; Perera et al., 1997). CD14 interacts with TLR4 to
maximize LPS responsiveness (in effect, a co-receptor). Primary microglia
express CD14 as demonstrated using CD14 KO mice. This receptor is
essential for low-dose LPS responseiveness (Esen and Kelian, 2005).
24
Protracted LPS stimulation (i.e. 72 hrs) is able to induce apoptosis in
microglia via IFN-γ release. This autocrine stimulation is driven by TLR4
activation (Jung et al., 2005). Under these conditions other factors are
released, including NO, superoxide and other cytokines. Collectively these
factors are capable of inducing cell death also in susceptible neurons and
oligodendrocytes when co-cultured with microglia. These results were
confirmed using primary cultures from TLR4-deficent mice (Lenhardt et al.,
2004).
In contrast to microglia, TLR4 expression on astrocytes remains an open
question. Several groups have demonstrated cell surface TLR4 in vitro
(Farina et al., 2005) or in vivo (Laflamme and Rivest, 2001; Lehnardt et al.,
2002; 2003), while others detected low, constitutive expression of TLR4 in
astrocytes that increased upon cell activation (Bsibsi et al., 2002; Bowman
et al., 2003). The divergent results for TLR4 expression can probably be
explained in the same way as for TLR2 discrepancies already discussed. In
addition, the sensitivity of TLR detection methods applied may be a factor.
1.2.2.4. Other TLRs
Numerous studied have been conducted to detect the presence of other
TLRs. The available data are equivocal, given the lack of functional studies,
for example, using KO mice.
TLR1 and TLR6 form a heterodimer with TLR2 and mediate Gram-positive
recognition (Ozynsky et al., 2000; Takeuchi et al., 2002; 2003). They are
both expressed on microglia (Bsibsi et al., 2002; Kelian et al., 2002; Olson
and Miller, 2004) and astrocytes (Carpentier et al., 2005).
TLR5 binds flagellin, a monomer of bacterial flagella. Astrocytes and
microglia express this receptor on their surface (Bowman et al., 2003;
25
Carpentier et al., 2005; Bsibsi et al., 2002; Olson and Miller, 2004). In
particular Bowman and colleagues (2003) demonstrated that astrocytes
treated with flagellin release IL-6 and up-regulate expression of TLR5, its
target, but also TLR2 and TLR4.
TLR7 and TLR8 share a high degree of primary sequence homology; each
binds GU-rich single stranded RNA (ssRNA). Since mammalian RNA
contains GU-rich sequences, these TLRs can be involved as an autoimmune
trigger in patients with systemic Lupus erythrematosus, who show high
levels of auto-antibodies against RNA (Lau et al., 2005). While no studies
have been conducted treating glia with TLR7/8 agonists, there is evidence
supporting their expression in microglia and astrocytes (Bsibsi et al., 2002;
Olson and Miller, 2004; Carpentier et al., 2005).
TLR9 mediates its responses when binding to bacterial DNA, viral DNA and
synthetic oligodeoxynucleotides containing unmethylated CpG motifs.
Several studies have reported TLR9 expression on rodent primary microglia
in culture. Astrocytes are also activated by TLR9 agonists. TLR9 activation
in microglia results in the production of numerous pro-inflammatory
mediators and activation of inducible NO synthase. These effects have not
been verified in primary human astrocytes (Kelian, 2008).
TLR10 is an orphan receptor, and is capable of forming heterodimers with
TLR1 and TLR2 (Hasan et al., 2005). TLR11 is involved in uropathogenic
bacterial identification, for example, E. coli (Zhang et al., 2004).
Considering the limited pattern expression of TLR10 and TLR11, it seems
unlikely - although this remains to be completely excluded - that either one
is to be found in CNS glia (Kelian, 2008).
26
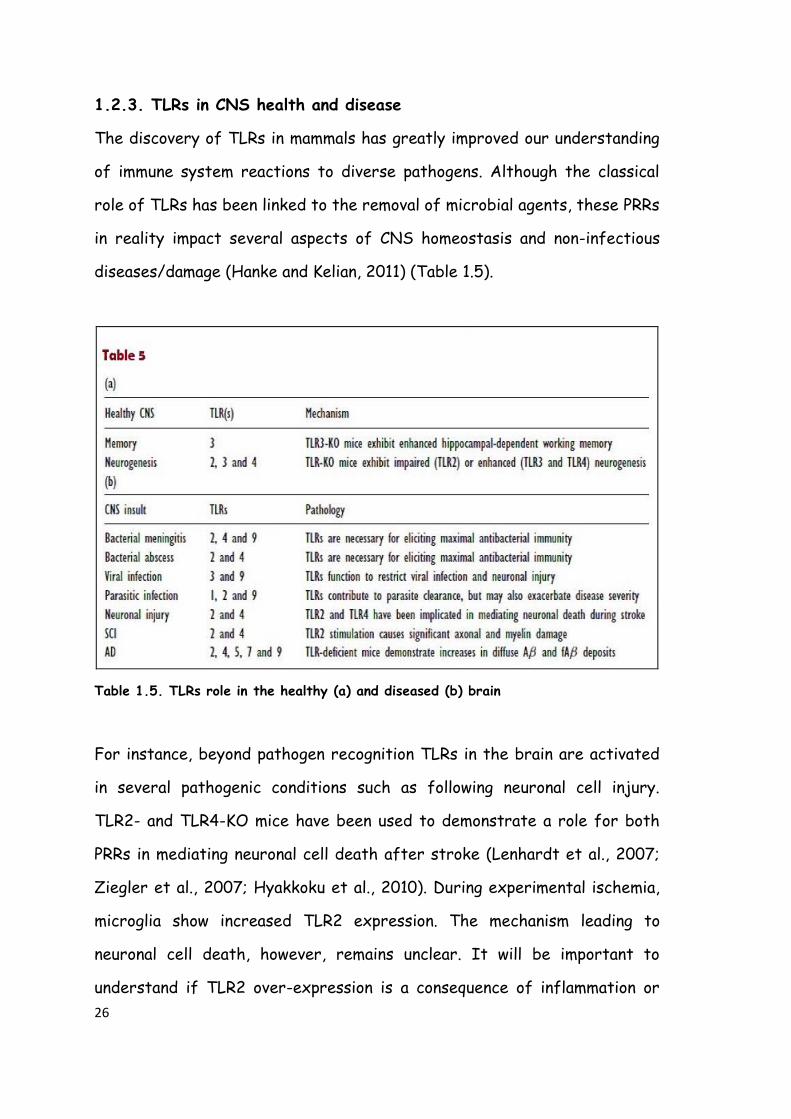
1.2.3. TLRs in CNS health and disease
The discovery of TLRs in mammals has greatly improved our understanding
of immune system reactions to diverse pathogens. Although the classical
role of TLRs has been linked to the removal of microbial agents, these PRRs
in reality impact several aspects of CNS homeostasis and non-infectious
diseases/damage (Hanke and Kelian, 2011) (Table 1.5).
Table 1.5. TLRs role in the healthy (a) and diseased (b) brain
For instance, beyond pathogen recognition TLRs in the brain are activated
in several pathogenic conditions such as following neuronal cell injury.
TLR2- and TLR4-KO mice have been used to demonstrate a role for both
PRRs in mediating neuronal cell death after stroke (Lenhardt et al., 2007;
Ziegler et al., 2007; Hyakkoku et al., 2010). During experimental ischemia,
microglia show increased TLR2 expression. The mechanism leading to
neuronal cell death, however, remains unclear. It will be important to
understand if TLR2 over-expression is a consequence of inflammation or
27
has a functional impact on disease. TLR2- and TLR4-KO mice have been
utilized to evaluate parameters such as infarct size, neurological deficits
and neuronal cell damage (Tang et al., 2007). The endogenous ligand(s) that
trigger TLR activation after stroke have yet to be identified. Considering
the extensive inflammation and neuronal cell injury, it is not unreasonable
to presume that a mixture of elements released after cell death are
responsible (Hanke and Kelian, 2011).
Another interesting aspect of the role of TLRs in neuropathology is that of
painful neuropathy. TLR4 has a critical role in the induction phase of
behavioral hypersensitivity. Using two different TLR4 mutant mouse
strains, Tanga et al. (2004, 2005) showed these animals to have an
attenuated mechanical allodynia and thermal hypersensitivity in comparison
to wild-type mice. Moreover there was a decreased expression of activated
microglial markers and a reduction in pro-inflammatory mediator release.
Making use of MyD88- and TLR2-KO mice to dissect the TLR signaling
pathway, Owens and colleagues (2005) investigated the connection between
glial responses and axonal degeneration in the hippocampal dentate gyrus.
In this model axonal terminals located in the entorhinal cortex are
transected to reproduce the pathology (Jersen et al., 1997, 1999; Finsen et
al., 1999). Axotomy in MyD88-KO mice led to a reduction in both
macrophages and lymphocytes infiltrating the hippocampus. In addition,
microglia that normally increase at specific times post-lesion, were reduced
in hippocampus of TLR2-KO mice. These results are consistent with a role
for TLR2 in inflammatory response following injury. However, neither
TLR4-KO nor MyD88-KO mice showed a complete inhibition of behavioral
hypersensitivity or axonal inflammation. It is thus possible that additional
receptors or factors elicit neuroinflammation (Owens et al., 2005).
28
1.2.3.1. Alzheimer disease (AD)
Aging is a physiological event often associated with a progressive increase
in basal neuroinflammation state and innate immune receptor expression
(Letiembre et al., 2009; Letiembre et al., 2007; Miller et al., 2007). It is
not still clear why all these changes occur, although it may be an adaptive
response to aging. Indeed, there is a correlation between the size of
amyloid β (Aβ) plaques and the level of pro-inflammatory cytokines in the
AD brain. Further, activated microglia surround and envelop the Aβ deposit,
forming complexes between cell surface receptors such as CD36 and CD47,
and Aβ (Bornemann et al., 2001; Bolmont et al., 2008). There is some
evidence to suggest the involvement of TLRs in this complex formation. Aβ
may trigger microglial TLR4-TLR6, releasing cytokines such as IL-1β, IL-10,
IL-17 and TNF-α. Jin and colleagues (2008) have found a correlation
between TLR4 signaling and AD progression. In another study, TLR2/TLR4-
double-KO mice receiving active Aβ immunization showed a reduction in
pro-inflammatory mediator release and a less severe impairment of
cognitive function (Vollmar et al., 2010).
It is conceivable that TLRs have a dual role in the progression or
attenuation of AD, which might be a function of the burden and biochemical
composition of Aβ but also the extent of neuronal cell pathology (Hanke and
Kelian, 2011). Whether or not TLRs may come forward as new potential
therapeutic targets remains a speculative proposition.
1.2.3.2. Multiple sclerosis
Multiple sclerosis (MS) is a chronic neurodegenerative disease affecting
brain and spinal cord and is characterized by autoimmune demyelination and
progressive axonal degeneration (Hanke and Kelian, 2011). There is good
29
evidence to suggest that infections can provoke clinical relapses in MS
patients (Sibley et al., 1985; Rapp et al., 1995; Buljevac et al., 2002). The
best characterized PAMPs involved in these phenomena are PGN and
pertussis toxin, which enable inappropriate immune-mediated recognition of
self-antigens. As consequence antigen-presenting cells do not recognize
self-myelin antigens. Molecular mechanisms are not completely clarified but
probably involve TLRs on antigen-presenting cells (Segal et al., 2000;
Ichikawa et al., 2002; Kerfoot et al., 2004; Waldner et al 2004; Visser et
al., 2005).
Experimental autoimmune encephalomyelitis (EAE) is the most common
animal model for human MS. Pertussis toxin is necessary to induce the
disease because of its ability to alter blood-brain barrier permeability to
allow immune cell entry into the CNS (Racke et al., 2005). In this model the
first effect is modulation of adhesion molecule (P-selectin)-dependent
rolling of leukocytes to the cerebral vascular endothelium and blood-brain
barrier impairment (Kerfoot et al., 2004). This cellular recruitment can be
attenuated in TLR4-deficient mice. Although these data suggest TLR
involvement, more experiments are needed. It may be possible that
unknown environmental factors contribute to establishment of EAE in the
animal model, given the observed variability in the study of Kerfoot et al.,
(2004).
Human TLR4 genetic variants have been taken into consideration to
determine disease involvement (Reindl et al., 2003; Kroner et al., 2005).
Two mutations occur with high frequency: D299G, T399I. The former
alters the TLR4 extracellular domain, resulting in defective signaling
(Arbour et al., 2000; Lorenz et al., 2001). In MS patients the TLR4
polymorphism does not appear to influence either incidence or progression
30
of the pathology (Reindl et al., 2003; Kroner et al., 2005). In addition to
TLR4, also TLR2 participates in the innate immune response in the EAE
model. In some brain areas, levels of TLR2 expression are higher than
those of TLR4 (Zekki et al., 2002). Accordingly, PGN can induce clinical
disease (Visser et al., 2005).
The above studies illustrate how TLRs can provide a link between infectious
disease and uncontrolled immune response (Kelian et al., 2008).
1.2.3.3. Spinal Cord injury
Spinal cord injury (SCI) frequently occurs after motor/vehicle accidents,
falls, sporting/recreation accidents and violence (Beers et al., 2006;
Jackson et al., 2004). Spinal cord compression can result from traumatic
SCI as well as non-traumatic events, such surgical intervention, tumor
invasion or degenerative bone diseases (Prasad et al., 2005; Shedid et al.,
2007; Babb et al., 2006). During trauma, axon and myelin damage is delayed
24-48 hours post-injury. Strategies to attenuate neurodegeneration have
been oriented to blocking secondary injury cascades such ischemia,
excitotoxicity and inflammation (Dusart et al., 1994; Fehlings et al., 2001).
Injecting the TLR2 agonist zymosan into the spinal cord elicits production
of neurotoxic mediators in the brain (Popovich et al., 2002). Several studies
have demonstrated that TLR2, but not TLR4 causes significant axonal and
myelin damage, even though the latter can induce macrophage activation
(Schonberg et al., 2007).
It is clear that TLRs influence SCI pathology and repair, post-traumatic
inflammation, neuronal cell survival and axon regeneration. These receptors
can be considered as potential targets for modulating SCI to facilitate
reparative processes. Understanding how TLRs control neural and glial
31
progenitor cell fate will be critical in designing cell replacement therapies
for SCI and other neurological disorders (Thuret et al., 2006; Bradbury et
al., 2006).
1.2.3.4. Neurogenesis, learning and memory
Neural progenitor cells (NPSc) express many immune-relevant molecules
necessary to interact with an inflamed CNS microenvironment (Ji et al.,
2004; Ni et al., 2004; Kim et al., 2006; Keohane et al., 2010; Ben-Hur et al.,
2003). Specific brain areas associated with the generation of new neurons
are the sub-ventricular zone of the lateral ventricles and the sub-granular
zone of the hippocampal dentate gyrus. Adult NPCs in these areas express
TLR2 and TLR4 (Okun et al., 2010; Rolls et al., 2007). These PRRs control
proliferation and differentiation of NPCs in opposing ways (Covacu et al.,
2009): TLR2-KO mice display impaired hippocampal neurogenesis whereas
TLR4-KO animals show enhanced proliferation and neuronal cell
differentiation. Like with TLR4-KO, TLR3-KO mice display increased
hippocampal neurogenesis, hippocampal cornus hammonis 1 and dentate
gyrus volumes (Okun et al., 2010). As these experiments were conducted in
the absence of infectious stimuli, it remains unclear what signals are
responsible for the observed phenotypes (Hanke and Kelian, 2011). Other
physiological functions such as learning and memory can be related to TLR
activation. Cognitive impairment is often associated with systemic
inflammation (Cunningham et al., 2009), although the precise connection
between TLRs and behavioral/cognitive functions remains to be elucidated
(Hanke and Kelian, 2011).

32
33
2.THESIS AIMS
In physiological conditions glia in the CNS can produce and release neuro-
protective factors such as anti-oxidants and neurotrophic factors
(Sofroniew et al., 2010). Is not uncommon for the healthy brain to respond
to stress and insults by transiently up-regulating inflammatory processes
which are kept in check by endogenous protective elements (Carson et al.,
2006). Indeed, inflammation is fundamentally a protective cellular response
aimed at removing injurious stimuli and initiating the healing process. When
prolonged, however, inflammation overrides the bounds of physiological
control and eventually becomes destructive. Upsetting this homeostatic
balance, however, can result in disease or exacerbation of initiating factors
that result in disease. Inflammation increasingly surfaces as a key element
in the pathobiology of neurodegenerative diseases, stroke, spinal cord
injury, neuropathic pain, and perhaps even neuropsychiatric disorders.
From a mechanistic point of view, TLRs expressed by immunocompetent
cells like microglia are thought to be critically involved in
neuroinflammation. A number of questions remain open to investigation,
including TLR expression by astrocytes (which are involved also in
neuroinflammation) (Hanke and Kelian, 2011), cross-talk between microglia
and astrocytes in inflammation, and the potential for activation of one TLR
isoform to influence expression/activity of other TLR isoforms.
This research project was organized around 3 main objectives:
1. To establish and characterize cultures of microglia and astrocytes
from neonatal rat cortex, utilizing immunocytochemical, molecular
biological, and fluorescence-activated cell sorting techniques. This
will include the application of methodology to purify astrocyte
cultures, which will allow to observe their behaviors when presented
34
with and inflammatory challenge in the absence of contaminating
microglia.
2. To investigate how glia respond to TLR agonists through the analysis
of TLR mRNA expression and their presence on cell surface
(TLR2/4) or the endosome membrane (TLR3).
3. To investigate the cross-talk mechanisms between glial cells in the
CNS by: analyzing inflammatory mediator expression at the gene and
product level in purified microglia, astrocyte-enriched cultures, and
the effect of cultured microglia with purified astrocytes;
establishing a “Transwell insert” system to examine the nature of
interactions between the two types of glia, measuring the production
of IL1β.
35
3. MATERIALS AND METHODS
3.1. Primary culture of mixed glial cells
Solutions:
• Papain (Worthington (Lorne))
• DNAse I bovine pancreas 4 mg/mL (Sigma)
• L-cysteine 24 mg/mL (Sigma)
• Trypsin inhibitor 100 mg/mL (Sigma)
• Bovine serum albumin 5 mg/mL (Sigma)
• Poly-L-lysine 1 mg/mL in Borate Buffer 0.15 M pH 8.4 (Sigma)
• L-leucyl-L-leucine methyl ester 50 mM (L-LME) (Sigma)
Procedures:
Mixed glial cell cultures were routinely prepared using postnatal day 1-2 rat
pups of both sexes CD strain, Sprague-Dawley). Experiments were
performed in accordance with the National Institutes of Health guidelines
for the care and use of laboratory animals and those of the Italian Ministry
of Health (D.L. 116/92), and were approved by the Institutional Animal Care
and Use Committee. The cerebral hemispheres were removed and the
meninges peeled off. The dissected cortical tissue was minced and
incubated with a solution containing papain (140 µL), DNase I (30 µL) and L-
cysteine (30 µL) in L-15 medium (+L-glutamine, L-amino acids; Invitrogen)
for 1 hour in a 37°C water bath. Upon completion of the enzyme incubation
step the supernatant was replaced with ovomucoid solution (30 µL of
tryspin inhibitor, 30 µL of DNase I and, 30 µL of bovine serum albumin in L-
15 medium) for 5 minutes at in a 37°C water bath.
Cerebral cortices were plated in 75-cm2 poly-L-lysine-coated tissue culture
flasks (BD Falcon) at a density of 1.5 brains per flask and grown in high-
36
glucose Dulbecco’s modified Eagle’s medium (DMEM) (+4.5 g/L glucose, L-
glutamine, pyruvate; purchased from Invitrogen) with 2 mM glutamine, 50
units/ml penicillin/ 50 µg/ml streptomycin, 50 µg/ml gentamycin and 10%
fetal bovine serum (FBS) (glia growth medium). Culture medium was
changed after 24 hours.
3.1.1. Primary culture of purified microglial cells
Rat microglia were isolated from the mixed glial cell cultures as previously
described (Rosin et al., 2004). Microglia were isolated between days 7-10
by shaking the flasks on an orbital shaker at 200 rpm for 1 hour (37°C).
The culture supernatant (containing mainly microglia) was transferred to
sterile petri plastic dishes (Sterilin, Bibby-Sarstedt) and incubated for 45
minutes at 37°C (5% CO2, 95% air) to allow differential adhesion of
microglia. The adherent microglial cells (>99% pure) were detached by
mechanically scraping into glia growth medium and replated in this same
medium, on poly-L-lysine-coated (10 µg/mL) microwell culture plates or
dishes.
3.1.2. Isolation of a purified population of astrocytes
The attached cell monolayer remaining after shaking to recover microglia
was used as a source of highly enriched astrocytes (>95%). To eliminate
residual microglia, astrocyte monolayers were incubated 1 hour with 50 mM
L-LME, a lysosomotropic agent (Hamby et al., 2006) dissolved in growth
medium. Culture medium was exchanged for fresh medium, and allowed to
recover for 1 day in growth medium prior to experimentation. Cultures were
visually inspected to ensure microglial lysis. Care must be taken, as longer
exposure times to L-LME can lead to astrocytic toxicity.
37
In some cases cell culture inserts were used to establish
astrocyte/microglia co-cultures. Enriched astrocytes were seeded into a
poly-L-lysine-coated 24-well plate (3 x 10⁵ cells per well) in culture medium.
Twenty-four hours later some cultures were treated with 50 mM L-LME
for 60 minutes, as described above. In parallel, 24-well culture inserts
were seeded with 5 x 10⁴ microglia in culture medium (0.4 ml per insert),
and placed in a 24-well plate (notched for inserts) in this same medium (0.8
ml/well). Transwell cell culture inserts are convenient, easy-to-use
permeable support devices; the suspended design allows for undamaged co-
culturing of cells in the lower compartment. The porous transwell membrane
allows for communication between the chambers, and for passage of
microglia-derived factors to the lower chamber containing astrocytes and
vice versa. The following day, inserts were transferred to the 24-well plate
of astrocytes. The distance between the astrocyte monolayer and microglia
on the insert membrane is 1 mm, according to the manufacturer’s
description. At this time LPS (100 ng/ml final) was added to either the
upper or lower chamber (0.4 ml and 0.8 ml final volume, respectively), and
incubation continued for another 24 hours. The culture medium was then
collected, and cells lysed, as described below. The IL-1β content of culture
supernatants and lysates was determined by ELISA, as described below.
3.1.3. Treatment with TLR agonists
Solutions:
• LPS-EB Ultra-Pure 100 ng/mL (Invivogen)
• Zymosan 10 µg/mL (Invivogen)
• Poly(I:C) 50µg/mL (Sigma)
38
LPS-EB Ultra-Pure is a selective agonist for TLR4, zymosan binds TLR2 and
poly(I:C) is a synthetic analogue of double stranded-RNA (dsRNA).
Agonists were added in DMEM + 10% FBS. Cells were treated for 6 or 24
hours for gene expression and cytofluorimetric analysis. For western blot
analysis cells were treated in DMEM without serum for 15, 30 or 60
minutes. After treatments cells were collected and processed as described
in the following subsections.
3.2 Immunophenotype analysis
3.2.1 Flow Cytometry
Solutions:
• BD CytoFix/CytoPerm (BD Biosciences)
• BD CytoFix (BD Biosciences)
Procedures:
The cortical cell suspension was fixed with BD CytoFix or
fixed/permeabilized with BD CytoFix/CytoPerm at 4°C for 20 minutes.
Purified microglia and enriched astrocytes were stained for flow
cytometric analysis using different markers. The Immunophenotypical
characterization was performed using the following antibodies:
• mouse anti- GFAP (Cell Signaling)
• rabbit anti-Iba1 (Wako)
• rabbit anti-TLR2 (Santa Cruz)
• rabbit anti-rat TLR4 (Santa Cruz)
• rabbit anti-rat TLR3 (Santa Cruz)
39
For indirect staining, Alexa Fluor®488 anti-rabbit or anti-mouse secondary
antibodies (Life Technologies) were utilized. Samples labelled with isotypic
or secondary conjugated antibodies were prepared as controls. Data were
acquired using a flow cytometer FACSCanto II (BD Biosciences) and then
analyzed with the Substruction tool of Summit 4.3 software (DAKO-
Beckman Coulter).
3.2.2 Immunofluorescence
Solutions:
• L-leucyl-L-leucine methyl ester 50 mM (L-LME)
• Poly-L-lysine 1 mg/mL in borate buffer 0.15 M pH
8.4 (Sigma)
• 4 % paraformaldehyde (PFA)
• Phosphate buffer saline (PBS) 10X
NaCl 80 g
KCl 1g
Na2HPO4 5.75 g
KH2PO4 1 g
• 0.05%Triton-X 100 (0.05% PBS-T)
• 10% Normal goat serum (NGS)
• 4'-6'-diamidino-2-phenylindole (DAPI) 100 ng/ml
• Fluoromount-G
Procedures:
Enriched astrocytes were seeded on poly-L-lysine-coated 12-mm diameter
cover-glasses (Menzel-Gläser, Menzel GmbH, Germany) placed in the wells
of a 12-well multiwall plate, at a density of 500,000 cells per well, using glia
cell growth medium and allowed to adhere overnight. The next day the cells
40
were treated with 50 mM L-LME for 1 hour, and allowed to recover for 1
day in growth medium. Cells were fixed with 4% PFA (Sigma-Aldrich), at
4°C for 30 minutes. After fixation, cells were washed 3x10 minutes in PBS-
1X pH 7.4. Cells were then permeabilized and blocked with 0.05% PBS-T/
10% NGS for 1 hour at room temperature. Finally the cells were incubated
overnight with primary antibody (Ab).
The following Abs were used:
- anti-GFAP (Sigma-Aldrich) for astrocytes
- anti-Iba 1 (Wako, Japan) for microglia.
Cells were washed with PBS-1X 3 times for 10 minutes and subsequently
incubated for 1 hour at room temperature with an anti-mouse AlexaFluor
595 or anti-rabbit Alexa Fluor488 Ab (1:500, Molecular Probes, Life
Technologies). Nuclei where visualized by incubating for 2 minutes with
DAPI (Boehringer Mannheim, Germany). Cover glasses were mounted onto
glass slides using Fluoromount-G (Southern Biotech, USA), and images were
acquired on a Leica DMI4000 B microscope equipped for
immunofluorescence (Leica Microsystems GmbH, Wetzlar, Germany) using a
Leica DFC 480 digital camera (Leica Microsystems GmbH, Wetzlar,
Germany).
3.3 Gene expression analysis and protein release
Cells were seeded in poly-L-lysine-coated 24-well plates at a density of
250,000 astrocytes per well and 25,000 microglia per well using glia cell
growth medium. Cells were stimulated to produce and release pro-
inflammatory mediators using one of the following TLR agonist: LPS;
Zymosan; Poly(I:C)) for 6 and 24 hours. Supernatants were collected for
ELISA assay and cells were lysated for total RNA extraction.
41
3.3.1.Total RNA extraction
Total RNA was isolated from cells using the ReliaPrep™ RNA Cell Miniprep
System (Promega), according to the manufacturer’s instructions. Purity and
integrity of the isolated RNA is critical for its effective use in applications
such as reverse transcription PCR (RT-PCR) and reverse transcription
quantitative PCR (RT-qPCR). In recent years, RT-PCR and RT-qPCR have
emerged as powerful methods to identify and quantitate specific mRNAs
from small amounts of total RNA and mRNA. The ReliaPrep™ RNA Cell
Miniprep System has been designed to supply the need for methods to
rapidly isolate high-quality RNA, substantially free of genomic DNA
contamination, from small amounts of starting material. The ReliaPrep™
RNA Cell Miniprep System provides a fast and simple technique for
preparing purified and intact total RNA from cultured cells. The system
also incorporates a DNase treatment step designed to substantially reduce
genomic DNA contamination, which can interfere with amplification-based
methodologies.
Solutions:
• BL + TG Buffer
4 M Guanidine thiocyanate
0.01 M Tris (pH 7.5)
2% 1-Thioglycerol
• Column Wash Solution
• DNase I incubation mix:
24 µl of Yellow Core Buffer
3 µl 0.09 M MnCl
3 µl of DNase I enzyme
• Yellow Core Buffer
0.0225 M Tris (pH 7.5)
1.125 M NaCl
42
0.0025% yellow dye (w/v)
• RNA Wash Solution
60 mM potassium acetate,
10 mM Tris-HCl (pH7.5 at 25°C)
60% ethanol
• Nuclease-Free Water
• 95% ethanol, RNase-free
• 100% isopropanol, RNase-free
• Phosphate buffer saline (PBS) 1X
Lysates may be prepared directly in the culture dish by the addition of BL
+ TG buffer directly to the dish for 5 minutes at room temperature to
permit complete dissociation of nucleoprotein complexes. Cells lysates were
collected in a sterile centrifuge tube and 100% isopropanol added (30 µL)
and mixed by vortexing for 5 seconds. Lysates were then transfered to the
ReliaPrep™ Minicolumn and placed into a collection tube (all provided by
kit). The minicolumns with their bound nucleic acids were then centrifuged
at 12,000 × g for 30 seconds at 20°–25°C. The binding reaction occurrs
rapidly due to disruption of water molecules by the chaotropic salts, thus
favoring adsorption of nucleic acids to the column, RNA wash solution
(500µl) was then added to the minicolumn and the column centrifuged at
12,000 × g for 30 seconds. To each miniclumn was applied 30 µl of freshly
prepared DNase I incubation mix directly to the membrane inside the
column and incubation carried out for 15 minutes at room temperature. This
step allows for digestion of contaminating genomic DNA. After this
incubation, column wash solution (200 µl) was added to the minicolumn to
purify the bound total RNA from contaminating salts, proteins and cellular
components. Samples were centrifuged at 12,000 × g for 15 seconds. RNA
wash solution (500 µl) was added to the minicolumn and centrifuged at
43
12,000 × g for 30 seconds. This wash and centrifugation step was repeated
again, but with 300 µL of column wash solution and a 2-minute spin at
12,000 x g. The minicolumn was transferred to the elution tube, and
nuclease-free water was added to the membrane (30 µL). Final elution was
performed by centrifugation at 14,000 × g for 1 minute. The elution tube
containing the purified RNA was store at –80°C until use.
3.3.2. RNA spectrophotometric quantification
Total RNA yield and purity was determined measuring 1 µL samples with the
NanoDrop2000 spectrophotometer (Thermo Scinetific) at a wavelength of
260 nm.
Total RNA isolated with the ReliaPrep™ RNA Cell Miniprep System was
substantially free of DNA and contaminating protein. The purity of the
sample was evaluated by the determination of its optical density at 260 and
230 nm, corresponding to the absorbtion wavelength of contaminants. The
absorbance of RNA samples at 260 nm and 280 nm, diluted in nuclease-free
water, was used to evaluate protein contamination (A260/A280 ratio). Pure
RNA exhibits a A260/A280 ratio of 2.0.
However, it should be noted that, due to variations between individual
starting materials and in performing the procedure, the expected range of
A260/A280 ratios for RNA may be 1.7–2.1. Using this protocol, the RNA
usually exhibited an A 260/A230 ratio of 1.8-2.2. A low A260/230 may
indicate guanidine contamination that can interfere with downstream
processing.
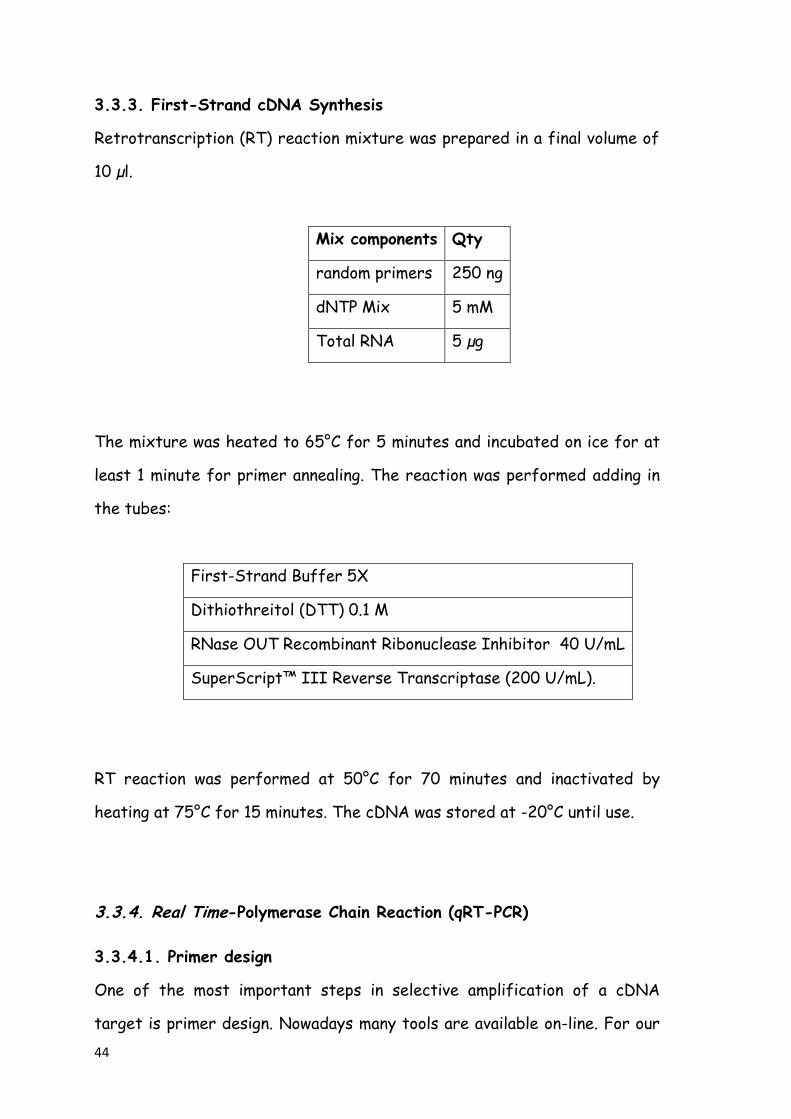
44
3.3.3. First-Strand cDNA Synthesis
Retrotranscription (RT) reaction mixture was prepared in a final volume of
10 µl.
Mix components Qty
random primers 250 ng
dNTP Mix 5 mM
Total RNA 5 µg
The mixture was heated to 65°C for 5 minutes and incubated on ice for at
least 1 minute for primer annealing. The reaction was performed adding in
the tubes:
First-Strand Buffer 5X
Dithiothreitol (DTT) 0.1 M
RNase OUT Recombinant Ribonuclease Inhibitor 40 U/mL
SuperScript™ III Reverse Transcriptase (200 U/mL).
RT reaction was performed at 50°C for 70 minutes and inactivated by
heating at 75°C for 15 minutes. The cDNA was stored at -20°C until use.
3.3.4. Real Time-Polymerase Chain Reaction (qRT-PCR)
3.3.4.1. Primer design
One of the most important steps in selective amplification of a cDNA
target is primer design. Nowadays many tools are available on-line. For our
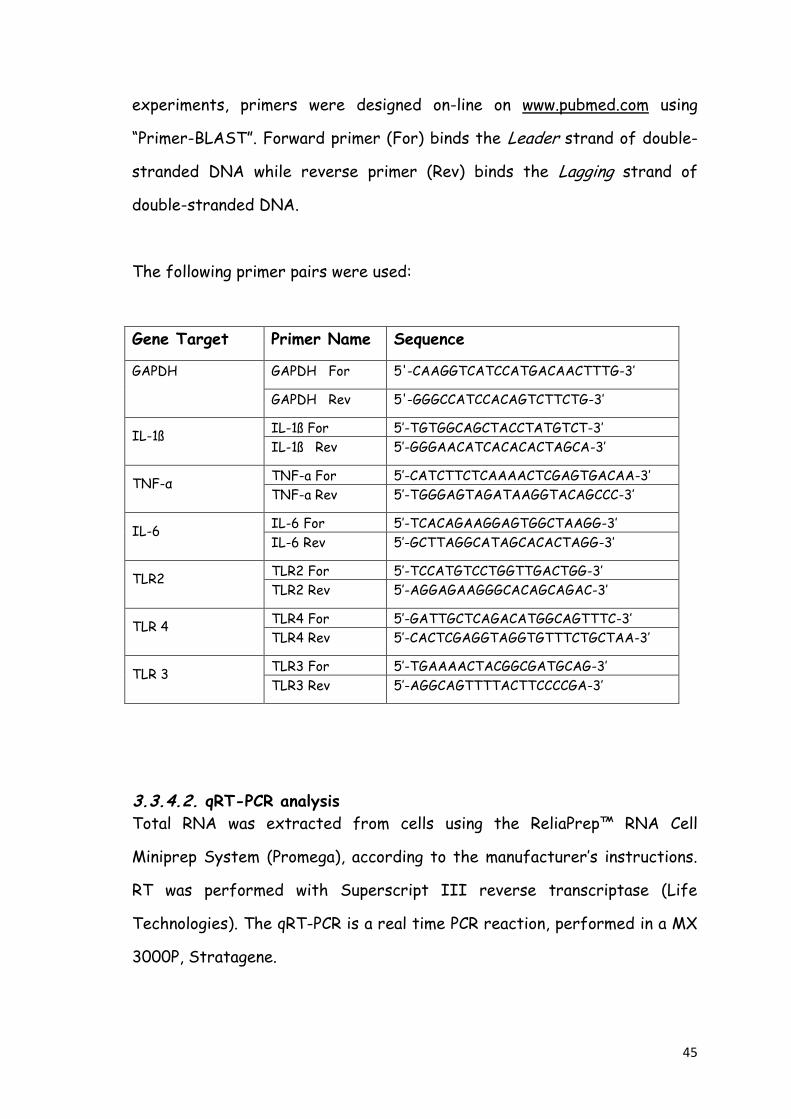
45
experiments, primers were designed on-line on www.pubmed.com using
“Primer-BLAST”. Forward primer (For) binds the Leader strand of double-
stranded DNA while reverse primer (Rev) binds the Lagging strand of
double-stranded DNA.
The following primer pairs were used:
Gene Target Primer Name Sequence
GAPDH GAPDH For 5'-CAAGGTCATCCATGACAACTTTG-3’
GAPDH Rev 5'-GGGCCATCCACAGTCTTCTG-3’
IL-1ß IL-1ß For 5’-TGTGGCAGCTACCTATGTCT-3’
IL-1ß Rev 5’-GGGAACATCACACACTAGCA-3’
TNF-α TNF-a For 5’-CATCTTCTCAAAACTCGAGTGACAA-3’
TNF-a Rev 5’-TGGGAGTAGATAAGGTACAGCCC-3’
IL-6 IL-6 For 5’-TCACAGAAGGAGTGGCTAAGG-3’
IL-6 Rev 5’-GCTTAGGCATAGCACACTAGG-3’
TLR2 TLR2 For 5’-TCCATGTCCTGGTTGACTGG-3’
TLR2 Rev 5’-AGGAGAAGGGCACAGCAGAC-3’
TLR 4 TLR4 For 5’-GATTGCTCAGACATGGCAGTTTC-3’
TLR4 Rev 5’-CACTCGAGGTAGGTGTTTCTGCTAA-3’
TLR 3 TLR3 For 5’-TGAAAACTACGGCGATGCAG-3’
TLR3 Rev 5’-AGGCAGTTTTACTTCCCCGA-3’
3.3.4.2. qRT-PCR analysis
Total RNA was extracted from cells using the ReliaPrep™ RNA Cell
Miniprep System (Promega), according to the manufacturer’s instructions.
RT was performed with Superscript III reverse transcriptase (Life
Technologies). The qRT-PCR is a real time PCR reaction, performed in a MX
3000P, Stratagene.
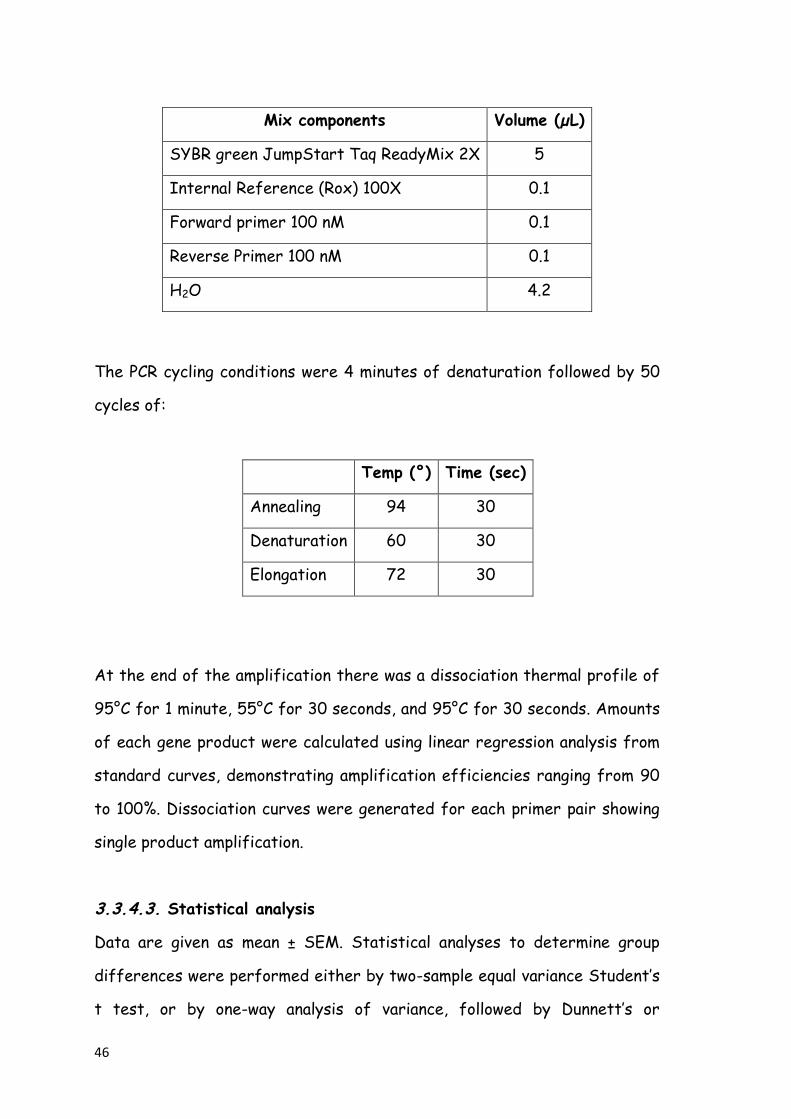
46
The PCR cycling conditions were 4 minutes of denaturation followed by 50
cycles of:
Temp (°) Time (sec)
Annealing 94 30
Denaturation 60 30
Elongation 72 30
At the end of the amplification there was a dissociation thermal profile of
95°C for 1 minute, 55°C for 30 seconds, and 95°C for 30 seconds. Amounts
of each gene product were calculated using linear regression analysis from
standard curves, demonstrating amplification efficiencies ranging from 90
to 100%. Dissociation curves were generated for each primer pair showing
single product amplification.
3.3.4.3. Statistical analysis
Data are given as mean ± SEM. Statistical analyses to determine group
differences were performed either by two-sample equal variance Student’s
t test, or by one-way analysis of variance, followed by Dunnett’s or
Mix components Volume (µL)
SYBR green JumpStart Taq ReadyMix 2X 5
Internal Reference (Rox) 100X 0.1
Forward primer 100 nM 0.1
Reverse Primer 100 nM 0.1
H2O 4.2
47
Bonferroni’s post-hoc tests for comparisons involving more than two data
groups. Significance was taken at p<0.05.
3.3.5 Protein expression analysis
3.3.5.1. Total protein extraction
Solutions:
• NP40 Lysis Buffer (Invitrogen)
50 mM Tris, pH 7.4
250 mM NaCl
5 mM EDTA
50 mM NaF
1 mM Na3VO4
1% Nonidet P40 (NP40)
0.02% NaN3
• Proteinase inhibitor cocktail (Sigma)
• Pefablock 0.1 M (Roche)
• Working solution
NP40 lysis buffer
Proteinase inhibitor cocktail 1:10
Pefablock 0.1 M 1:100
Cell lysis with mild detergent is commonly used for cultured animal cells.
Working solution was added for 30 minutes to adherent cells (on ice) and
then the extract was transferred to a centrifuge tube. Lysates were
centrifuged at 12,000 x g for 10 minutes at 4°C. After centrifugation, the
supernatant was collected and stored at -80°C until use for protein
determination and western blot analysis.
48
3.3.5.2. Western blot analysis
Protein quantification was conducted using the BCA Protein Assay Reagent
Kit (Pierce) according to the manufacturer’s protocol. Protein samples (10
µg) were separated on a Mini-PROTEAN ® Precast Gel (Biorad) with a 4-
15% gradient for 90 minutes at 140V. Proteins were electrophoretically
transferred from the gel onto polyvinylidene difluoride (PVDF, Millipore)
membranes overnight at 4°C at 25V. Membranes were blocked with 3%
bovine serum albumin (Sigma Aldrich) and then incubated overnight at 4°C
with one of the following primary antibodies:
GAPDH (working dilution 1:200; Santa Cruz)
β-Actin (working dilution 1:25000; Sigma)
TLR4 (working dilution 1:300; Abcam)
CD14 (working dilution 1:200; Santa Cruz)
MD2 (working dilution 1:1000; Abcam)
The membranes were washed and then incubated for 1 hour with the
appropriate secondary antibody (goat anti-rabbit or goat anti-mouse,
BioRad) conjugated to horseradish peroxidase (HRP) at a dilution of 1:4000.
Developing has been performed using an enhanced chemiluminescence
substrate (Sigma). Immunreactivity was visualized using the VersaDoc
Imaging System and protein expression normalized to GAPDH or β-actin
for band density quantification.
3.3.6 Cytokine enzyme-linked immunosorbent assay (ELISA)
Solutions:
Coating antibody working solution
Coating antibody stock solution (1:100)
49
Coating buffer
Detection antibody working solution
Detection antibody stock (1:200)
Assay diluent
Avidin-HRP working solution
Avidin-HRP stock solution (1:2000)
Assay diluent
Color development solution
Color development Reagent A:B (1:2)
Stop solution
H2SO4 (2 M)
PBS-T
PBS
Tween-20 (1:2000)
Procedure:
Cells were seeded in poly-L-lysine-coated 24-well plates at a density of
250,000 astrocytes per well and 25,000 microglia per well using glia cell
growth medium. Cells were stimulated to produce and release pro-
inflammatory mediators in medium containing TLR agonist (LPS; Zymosan;
Poly(I:C)). Cell supernatants were harvested after 24 hours and cytokine
release was assayed by ELISA according to the manufacturer’s instructions
(Antigenix America, Huntington Station, NY, USA).
Multi-well plates were pre-coated with coating antibody working solution.
Supernatants were incubated in these pre-coated multi-well plates at room
50
temperature for 2 hours and then washed using PBS-T. Detection antibody
working solution was added to the plates and incubation continued for
another 2 hours. After washing, Avidin-HRP working solution was added,
the plated were incubated at room temperature for 30 minutes, followed
by addition of color development solution. After a futher 30-minute
incubation the reaction was stopped by adding 2N H2SO4 and absorbance
measured at a wavelength of 540 nm. The amount of cytokine was
quantified using a standard curve.
51
4. RESULTS
PART 1
4.1 Cellular and molecular characterization of glial cell populations from
cortex
4.1.1. Immuno-phenotypic characterization
Glial cell preparations were subjected to flow cytometric analysis to
determine expression of cell type-specific (astrocytes and microglia)
surface markers by immunoreactivity. Cells were defined by cell count
versus GFAP expression level (Fig. 4.1, first column), by granularity
characteristics (side scatter, SSC) versus Iba1 expression level (Fig. 4.1,
second column) and finally by size (forward scatter, FSC) versus
granularity (SSC) (Fig. 4.1, third column). The basic scatter dot blot was
used to exclude cell debris from the analysis and the regions containing
astrocytes and microglia were identified. By gating the individual
subpopulation (determined by GFAP expression, low or high), the level of
Iba1 expression was examined.
In the mixed glial cell population, GFAP-negative staining corresponds to
microglia. Microglia (defined as GFAP-negative cells) can be also
morphologically identified as the smaller cells and with less surface
complexity compared to the GFAP-positive subpopulation (Fig. 4.1, row A).
The percentage of these two cell groups are about 90% GFAP+ and 10%
GFAP-.
In the CNS microglia comprise 5-20% of all glial cells, depending on the
specific brain region (Sajo and Glas, 2011; Lawson et al., 1990). Our
characterization confirms data available in the literature. This mixed glial
cell population can be used as a starting point for the isolation of purified
microglia and astrocyte-enriched subpopulations.
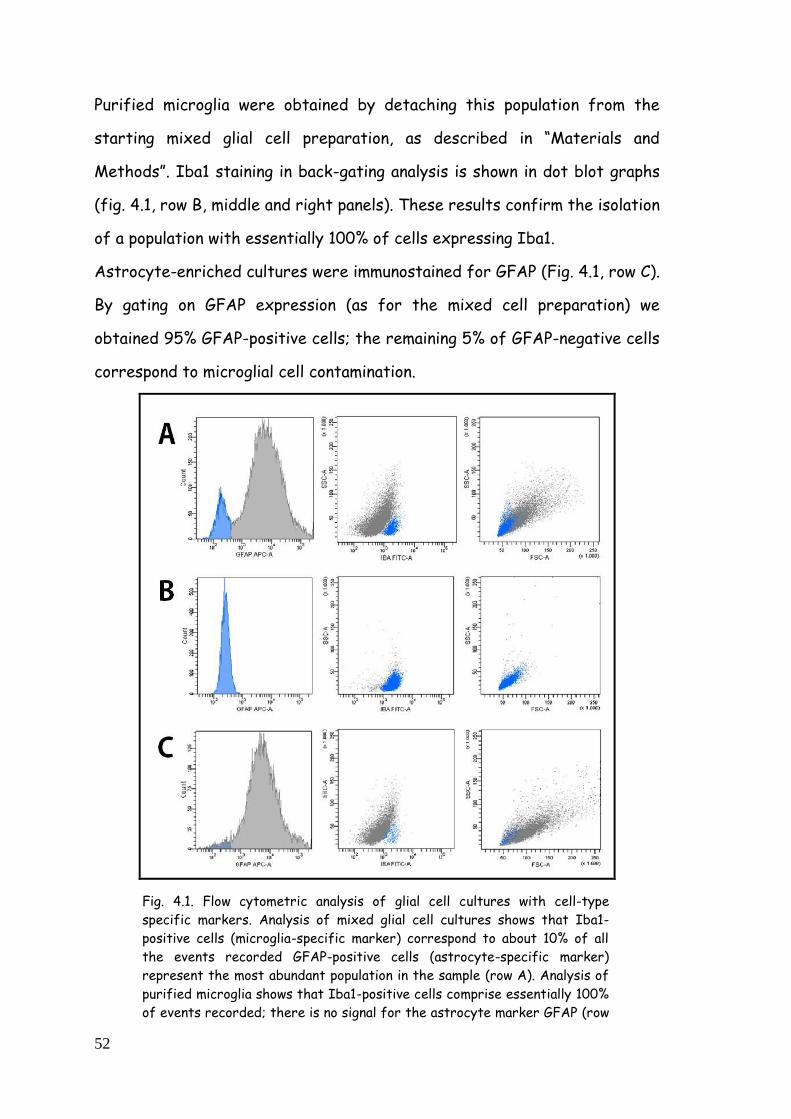
52
Purified microglia were obtained by detaching this population from the
starting mixed glial cell preparation, as described in “Materials and
Methods”. Iba1 staining in back-gating analysis is shown in dot blot graphs
(fig. 4.1, row B, middle and right panels). These results confirm the isolation
of a population with essentially 100% of cells expressing Iba1.
Astrocyte-enriched cultures were immunostained for GFAP (Fig. 4.1, row C).
By gating on GFAP expression (as for the mixed cell preparation) we
obtained 95% GFAP-positive cells; the remaining 5% of GFAP-negative cells
correspond to microglial cell contamination.
Fig. 4.1. Flow cytometric analysis of glial cell cultures with cell-type
specific markers. Analysis of mixed glial cell cultures shows that Iba1-
positive cells (microglia-specific marker) correspond to about 10% of all
the events recorded GFAP-positive cells (astrocyte-specific marker)
represent the most abundant population in the sample (row A). Analysis of
purified microglia shows that Iba1-positive cells comprise essentially 100%
of events recorded; there is no signal for the astrocyte marker GFAP (row
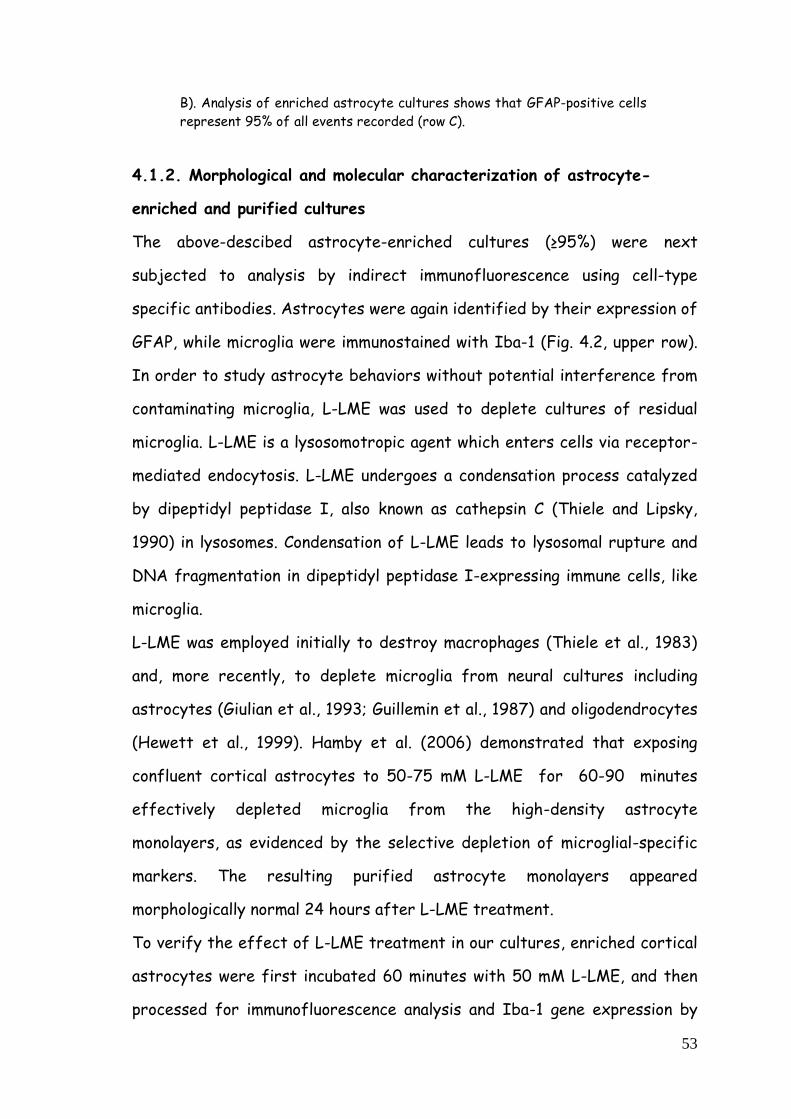
53
B). Analysis of enriched astrocyte cultures shows that GFAP-positive cells
represent 95% of all events recorded (row C).
4.1.2. Morphological and molecular characterization of astrocyte-
enriched and purified cultures
The above-descibed astrocyte-enriched cultures (≥95%) were next
subjected to analysis by indirect immunofluorescence using cell-type
specific antibodies. Astrocytes were again identified by their expression of
GFAP, while microglia were immunostained with Iba-1 (Fig. 4.2, upper row).
In order to study astrocyte behaviors without potential interference from
contaminating microglia, L-LME was used to deplete cultures of residual
microglia. L-LME is a lysosomotropic agent which enters cells via receptor-
mediated endocytosis. L-LME undergoes a condensation process catalyzed
by dipeptidyl peptidase I, also known as cathepsin C (Thiele and Lipsky,
1990) in lysosomes. Condensation of L-LME leads to lysosomal rupture and
DNA fragmentation in dipeptidyl peptidase I-expressing immune cells, like
microglia.
L-LME was employed initially to destroy macrophages (Thiele et al., 1983)
and, more recently, to deplete microglia from neural cultures including
astrocytes (Giulian et al., 1993; Guillemin et al., 1987) and oligodendrocytes
(Hewett et al., 1999). Hamby et al. (2006) demonstrated that exposing
confluent cortical astrocytes to 50-75 mM L-LME for 60-90 minutes
effectively depleted microglia from the high-density astrocyte
monolayers, as evidenced by the selective depletion of microglial-specific
markers. The resulting purified astrocyte monolayers appeared
morphologically normal 24 hours after L-LME treatment.
To verify the effect of L-LME treatment in our cultures, enriched cortical
astrocytes were first incubated 60 minutes with 50 mM L-LME, and then
processed for immunofluorescence analysis and Iba-1 gene expression by
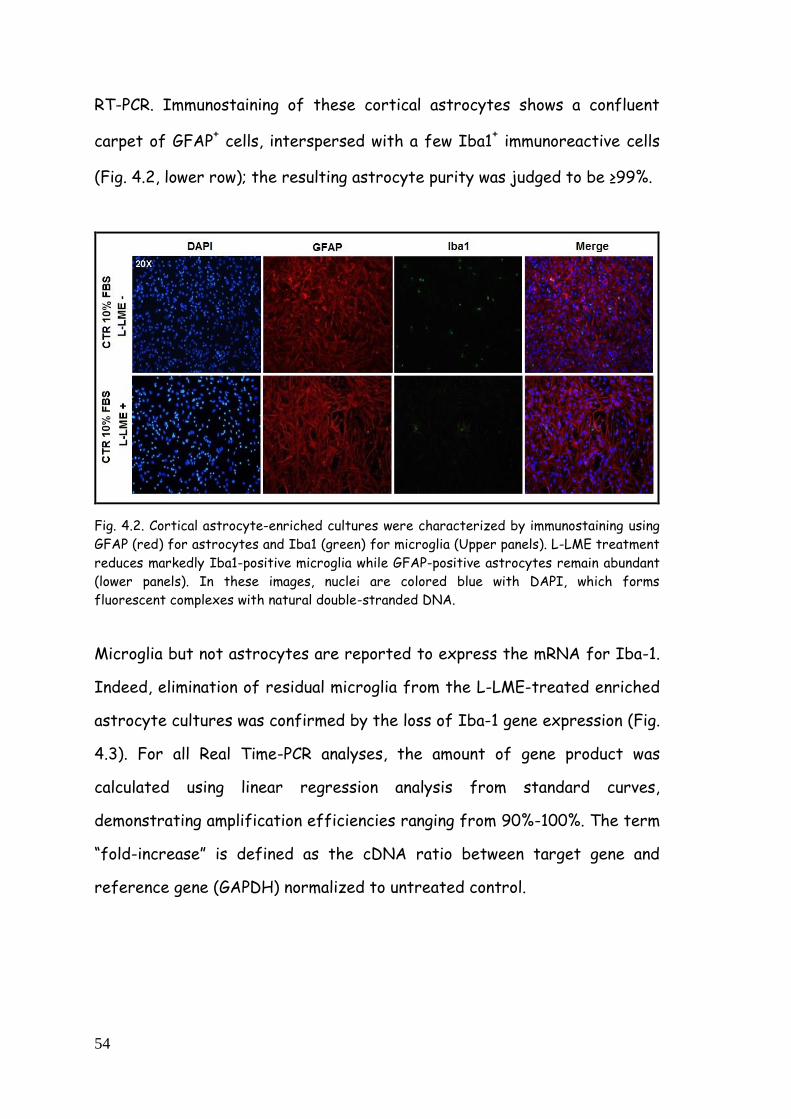
54
RT-PCR. Immunostaining of these cortical astrocytes shows a confluent
carpet of GFAP+ cells, interspersed with a few Iba1+ immunoreactive cells
(Fig. 4.2, lower row); the resulting astrocyte purity was judged to be ≥99%.
Fig. 4.2. Cortical astrocyte-enriched cultures were characterized by immunostaining using
GFAP (red) for astrocytes and Iba1 (green) for microglia (Upper panels). L-LME treatment
reduces markedly Iba1-positive microglia while GFAP-positive astrocytes remain abundant
(lower panels). In these images, nuclei are colored blue with DAPI, which forms
fluorescent complexes with natural double-stranded DNA.
Microglia but not astrocytes are reported to express the mRNA for Iba-1.
Indeed, elimination of residual microglia from the L-LME-treated enriched
astrocyte cultures was confirmed by the loss of Iba-1 gene expression (Fig.
4.3). For all Real Time-PCR analyses, the amount of gene product was
calculated using linear regression analysis from standard curves,
demonstrating amplification efficiencies ranging from 90%-100%. The term
“fold-increase” is defined as the cDNA ratio between target gene and
reference gene (GAPDH) normalized to untreated control.
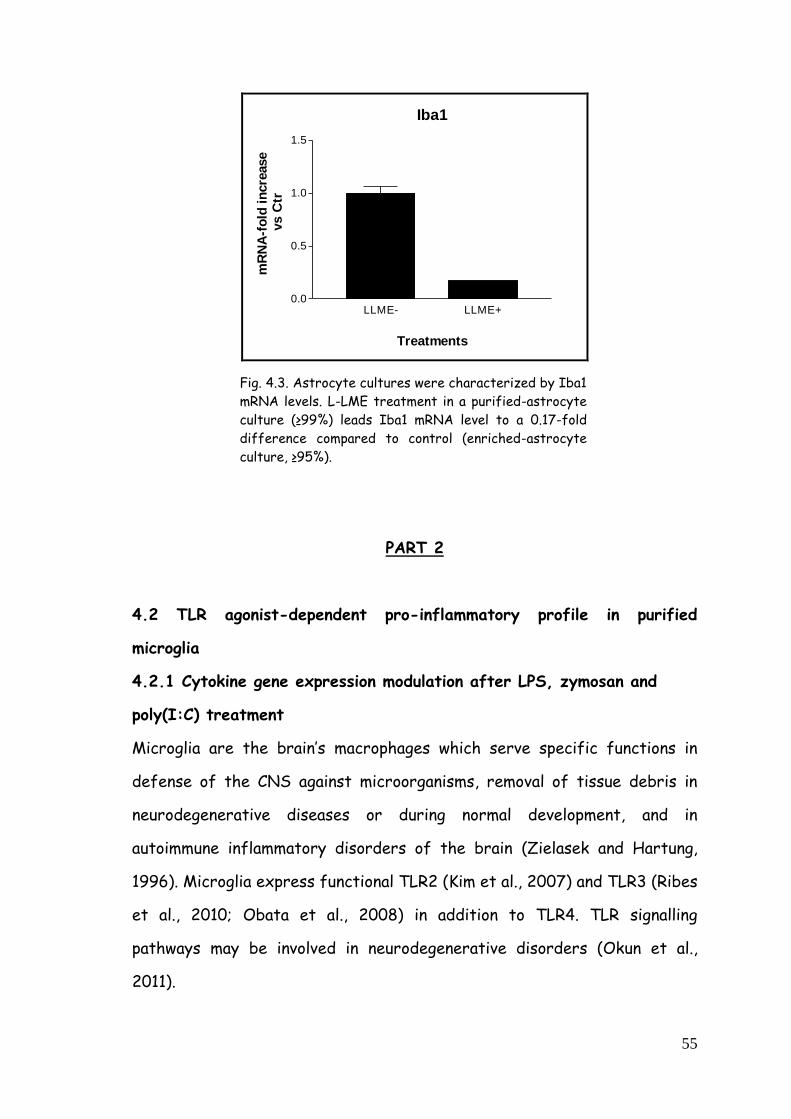
55
Iba1
LLME- LLME+0.0
0.5
1.0
1.5
Treatments
mR
NA
-fo
ld i
ncre
ase
vs C
tr
Fig. 4.3. Astrocyte cultures were characterized by Iba1
mRNA levels. L-LME treatment in a purified-astrocyte
culture (≥99%) leads Iba1 mRNA level to a 0.17-fold
difference compared to control (enriched-astrocyte
culture, ≥95%).
PART 2
4.2 TLR agonist-dependent pro-inflammatory profile in purified
microglia
4.2.1 Cytokine gene expression modulation after LPS, zymosan and
poly(I:C) treatment
Microglia are the brain’s macrophages which serve specific functions in
defense of the CNS against microorganisms, removal of tissue debris in
neurodegenerative diseases or during normal development, and in
autoimmune inflammatory disorders of the brain (Zielasek and Hartung,
1996). Microglia express functional TLR2 (Kim et al., 2007) and TLR3 (Ribes
et al., 2010; Obata et al., 2008) in addition to TLR4. TLR signalling
pathways may be involved in neurodegenerative disorders (Okun et al.,
2011).
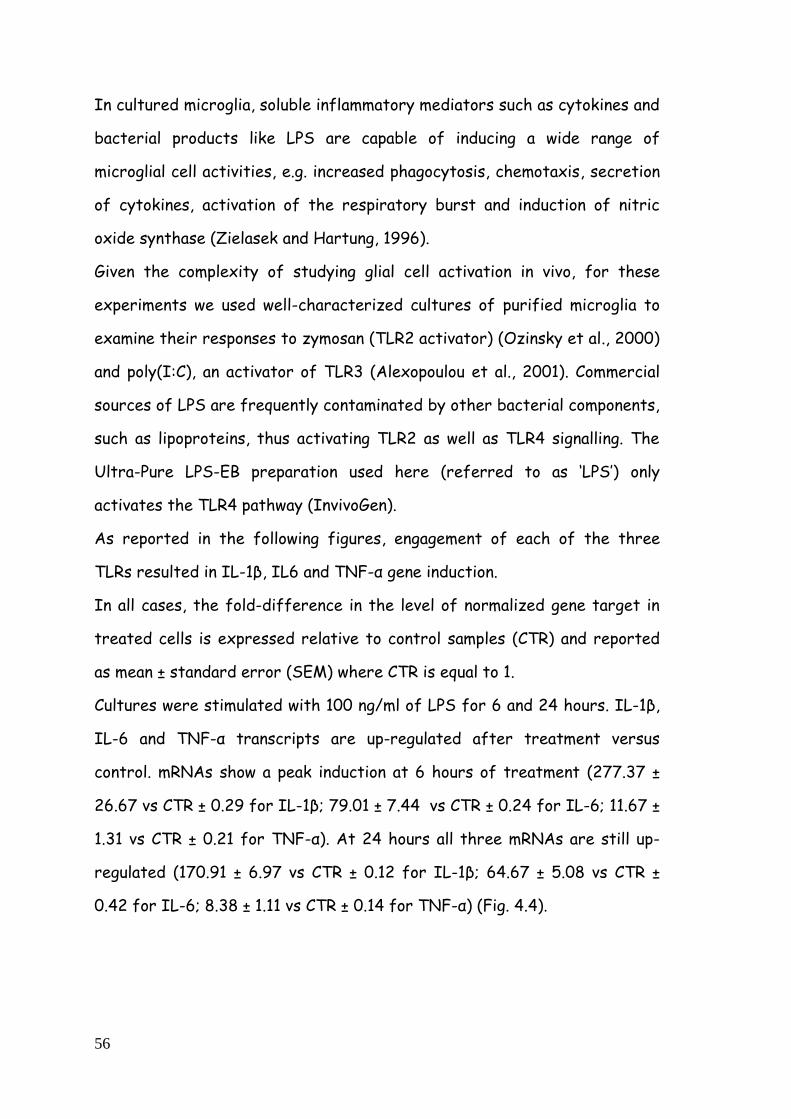
56
In cultured microglia, soluble inflammatory mediators such as cytokines and
bacterial products like LPS are capable of inducing a wide range of
microglial cell activities, e.g. increased phagocytosis, chemotaxis, secretion
of cytokines, activation of the respiratory burst and induction of nitric
oxide synthase (Zielasek and Hartung, 1996).
Given the complexity of studying glial cell activation in vivo, for these
experiments we used well-characterized cultures of purified microglia to
examine their responses to zymosan (TLR2 activator) (Ozinsky et al., 2000)
and poly(I:C), an activator of TLR3 (Alexopoulou et al., 2001). Commercial
sources of LPS are frequently contaminated by other bacterial components,
such as lipoproteins, thus activating TLR2 as well as TLR4 signalling. The
Ultra-Pure LPS-EB preparation used here (referred to as ‘LPS’) only
activates the TLR4 pathway (InvivoGen).
As reported in the following figures, engagement of each of the three
TLRs resulted in IL-1β, IL6 and TNF-α gene induction.
In all cases, the fold-difference in the level of normalized gene target in
treated cells is expressed relative to control samples (CTR) and reported
as mean ± standard error (SEM) where CTR is equal to 1.
Cultures were stimulated with 100 ng/ml of LPS for 6 and 24 hours. IL-1β,
IL-6 and TNF-α transcripts are up-regulated after treatment versus
control. mRNAs show a peak induction at 6 hours of treatment (277.37 ±
26.67 vs CTR ± 0.29 for IL-1β; 79.01 ± 7.44 vs CTR ± 0.24 for IL-6; 11.67 ±
1.31 vs CTR ± 0.21 for TNF-α). At 24 hours all three mRNAs are still up-
regulated (170.91 ± 6.97 vs CTR ± 0.12 for IL-1β; 64.67 ± 5.08 vs CTR ±
0.42 for IL-6; 8.38 ± 1.11 vs CTR ± 0.14 for TNF-α) (Fig. 4.4).
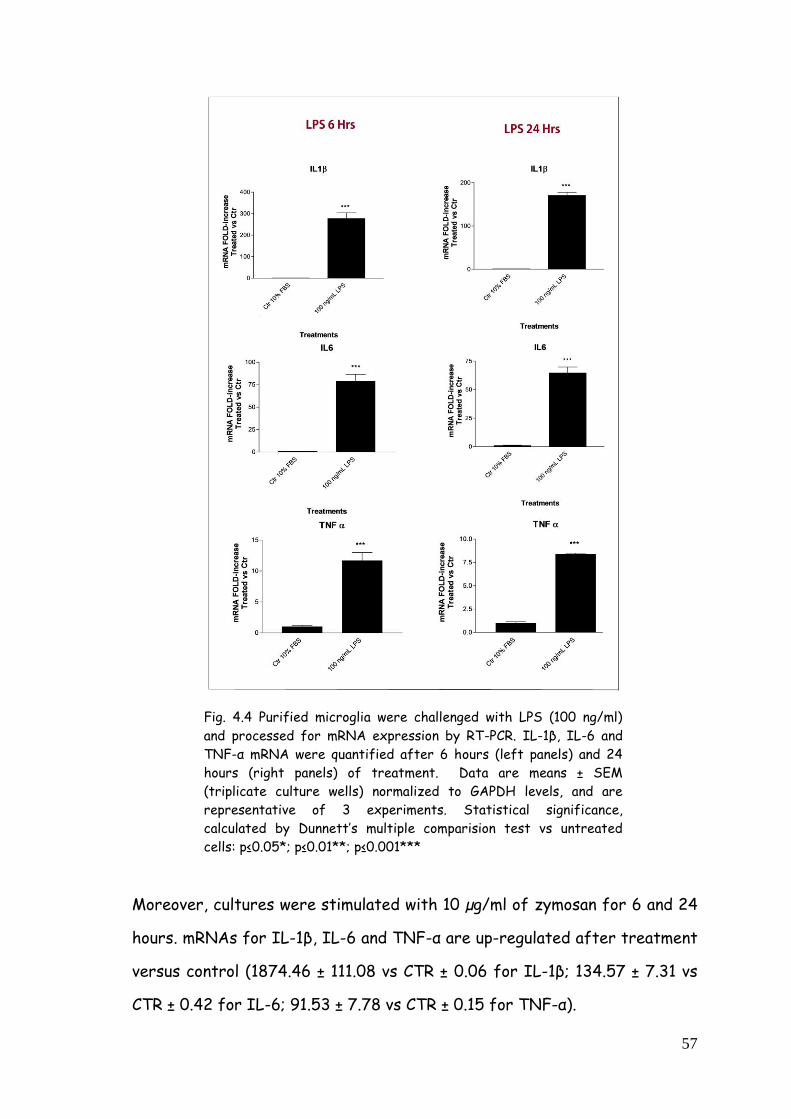
57
Fig. 4.4 Purified microglia were challenged with LPS (100 ng/ml)
and processed for mRNA expression by RT-PCR. IL-1β, IL-6 and
TNF-α mRNA were quantified after 6 hours (left panels) and 24
hours (right panels) of treatment. Data are means ± SEM
(triplicate culture wells) normalized to GAPDH levels, and are
representative of 3 experiments. Statistical significance,
calculated by Dunnett’s multiple comparision test vs untreated
cells: p≤0.05*; p≤0.01**; p≤0.001***
Moreover, cultures were stimulated with 10 µg/ml of zymosan for 6 and 24
hours. mRNAs for IL-1β, IL-6 and TNF-α are up-regulated after treatment
versus control (1874.46 ± 111.08 vs CTR ± 0.06 for IL-1β; 134.57 ± 7.31 vs
CTR ± 0.42 for IL-6; 91.53 ± 7.78 vs CTR ± 0.15 for TNF-α).
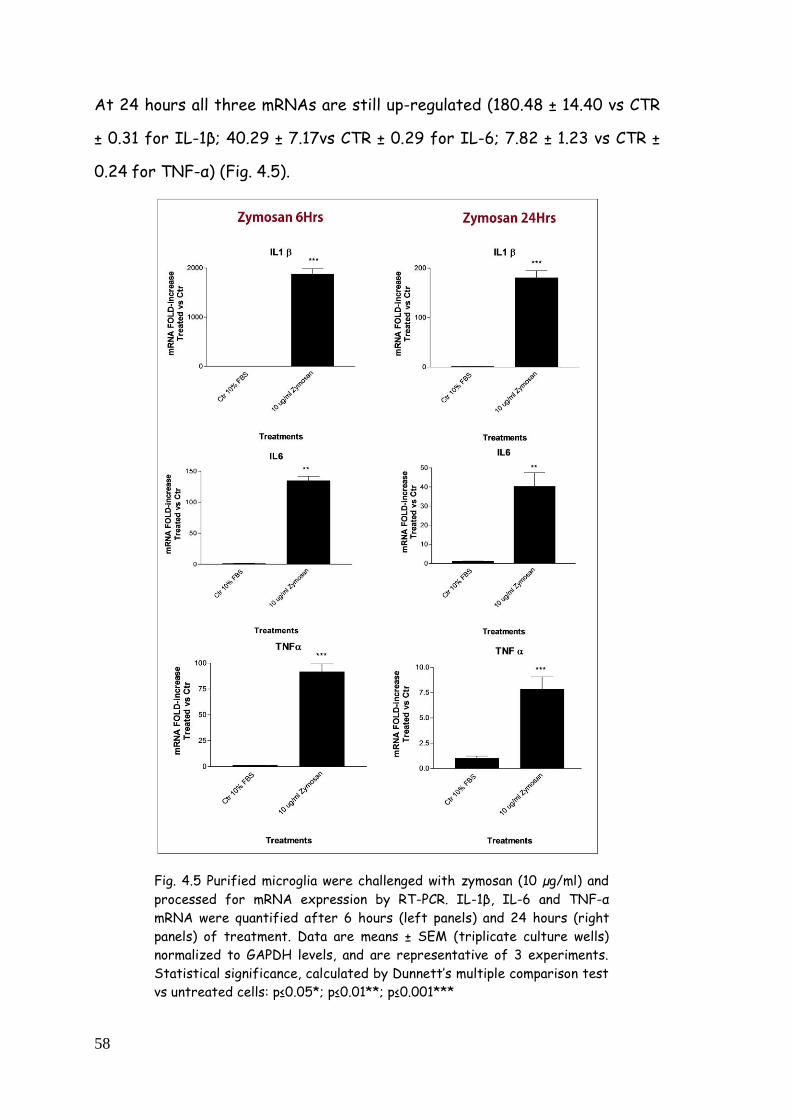
58
At 24 hours all three mRNAs are still up-regulated (180.48 ± 14.40 vs CTR
± 0.31 for IL-1β; 40.29 ± 7.17vs CTR ± 0.29 for IL-6; 7.82 ± 1.23 vs CTR ±
0.24 for TNF-α) (Fig. 4.5).
Fig. 4.5 Purified microglia were challenged with zymosan (10 µg/ml) and
processed for mRNA expression by RT-PCR. IL-1β, IL-6 and TNF-α
mRNA were quantified after 6 hours (left panels) and 24 hours (right
panels) of treatment. Data are means ± SEM (triplicate culture wells)
normalized to GAPDH levels, and are representative of 3 experiments.
Statistical significance, calculated by Dunnett’s multiple comparison test
vs untreated cells: p≤0.05*; p≤0.01**; p≤0.001***
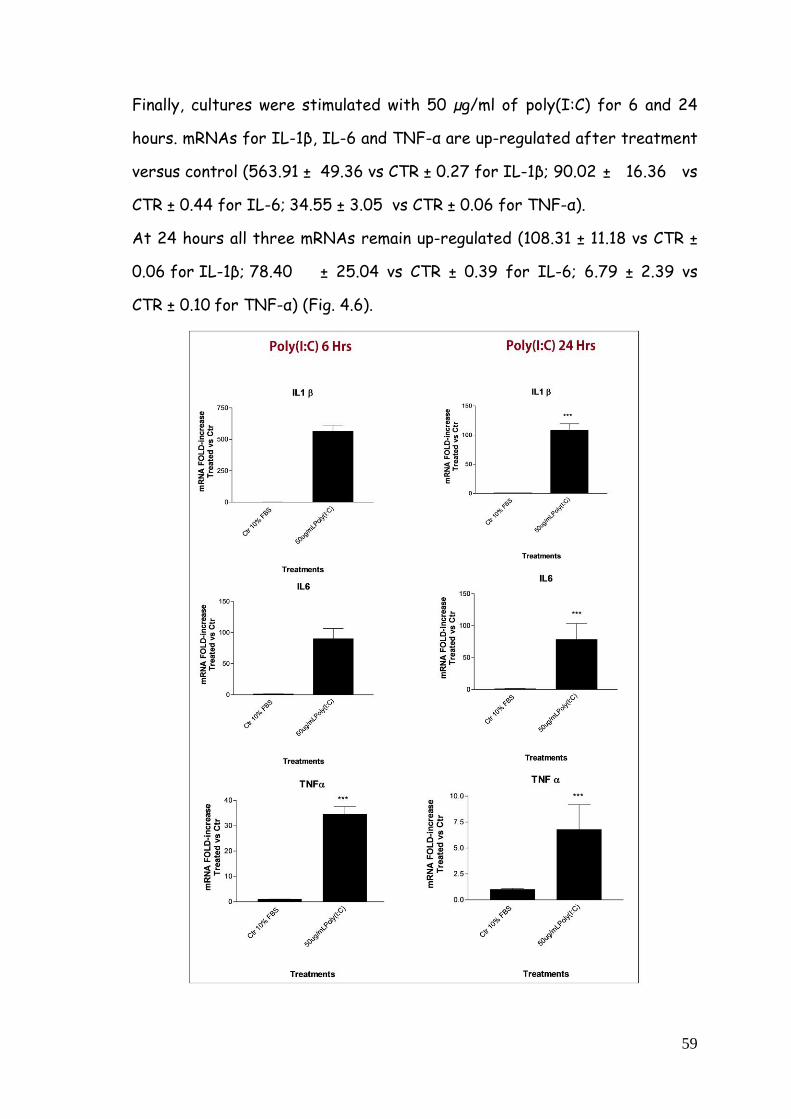
59
Finally, cultures were stimulated with 50 µg/ml of poly(I:C) for 6 and 24
hours. mRNAs for IL-1β, IL-6 and TNF-α are up-regulated after treatment
versus control (563.91 ± 49.36 vs CTR ± 0.27 for IL-1β; 90.02 ± 16.36 vs
CTR ± 0.44 for IL-6; 34.55 ± 3.05 vs CTR ± 0.06 for TNF-α).
At 24 hours all three mRNAs remain up-regulated (108.31 ± 11.18 vs CTR ±
0.06 for IL-1β; 78.40 ± 25.04 vs CTR ± 0.39 for IL-6; 6.79 ± 2.39 vs
CTR ± 0.10 for TNF-α) (Fig. 4.6).
60
Fig. 4.6 Purified microglia were challenged with poly(I:C) (50 µg/ml)
and processed for mRNA expression by RT-PCR. IL-1β, IL-6 and
TNF-α mRNA were quantified after 6 hours (left panels) and 24
hours (right panels) of treatment. Data are means ± SEM
(triplicate culture wells) normalized to GAPDH levels, and are
representative of 3 experiments. Statistical significance,
calculated by Dunnett’s multiple comparision test vs untreated
cells: p≤0.05*; p≤0.01**; p≤0.001***
4.2.2. IL-1β release after LPS, zymosan and poly(I:C) treatment
In the brain, IL-1β is mainly produced by activated microglia (Giulian et al.,
1986; Van Dam et al., 1995). LPS is a potent activator of IL-1β
transcription/translation (Chauvet et al., 2001) and this process occurs in
primary cortical microglia, as well (Barbierato et al., 2013).
Our experiments suggest that not only LPS but also treatment with other
TLR ligands causes appreciable amounts of IL-1β to accumulate in the
culture medium after 24 hours. In particular, LPS induces synthesis and
release of 32.54 ± 10.01 pg/mL, zymosan induces 95.85 ± 6.55 pg/mL and
poly(I:C) induces 84.81 ± 3.24 pg/mL of IL-1β (Fig. 4.7).
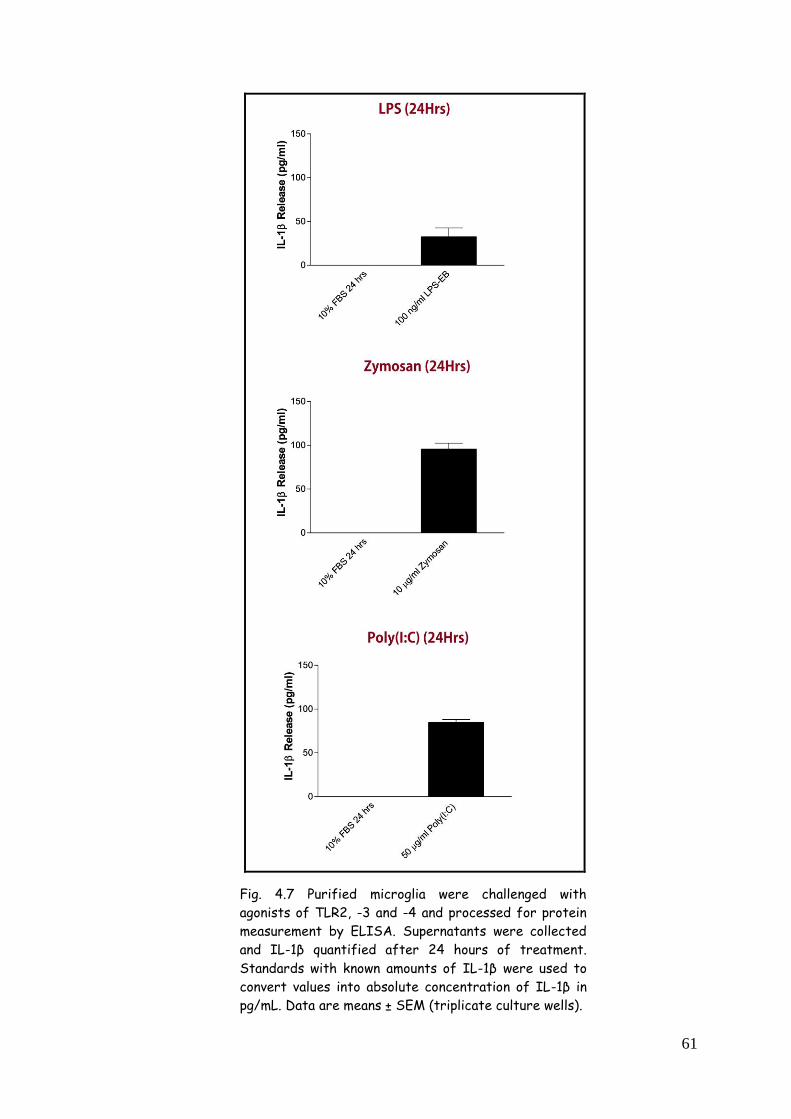
61
Fig. 4.7 Purified microglia were challenged with
agonists of TLR2, -3 and -4 and processed for protein
measurement by ELISA. Supernatants were collected
and IL-1β quantified after 24 hours of treatment.
Standards with known amounts of IL-1β were used to
convert values into absolute concentration of IL-1β in
pg/mL. Data are means ± SEM (triplicate culture wells).
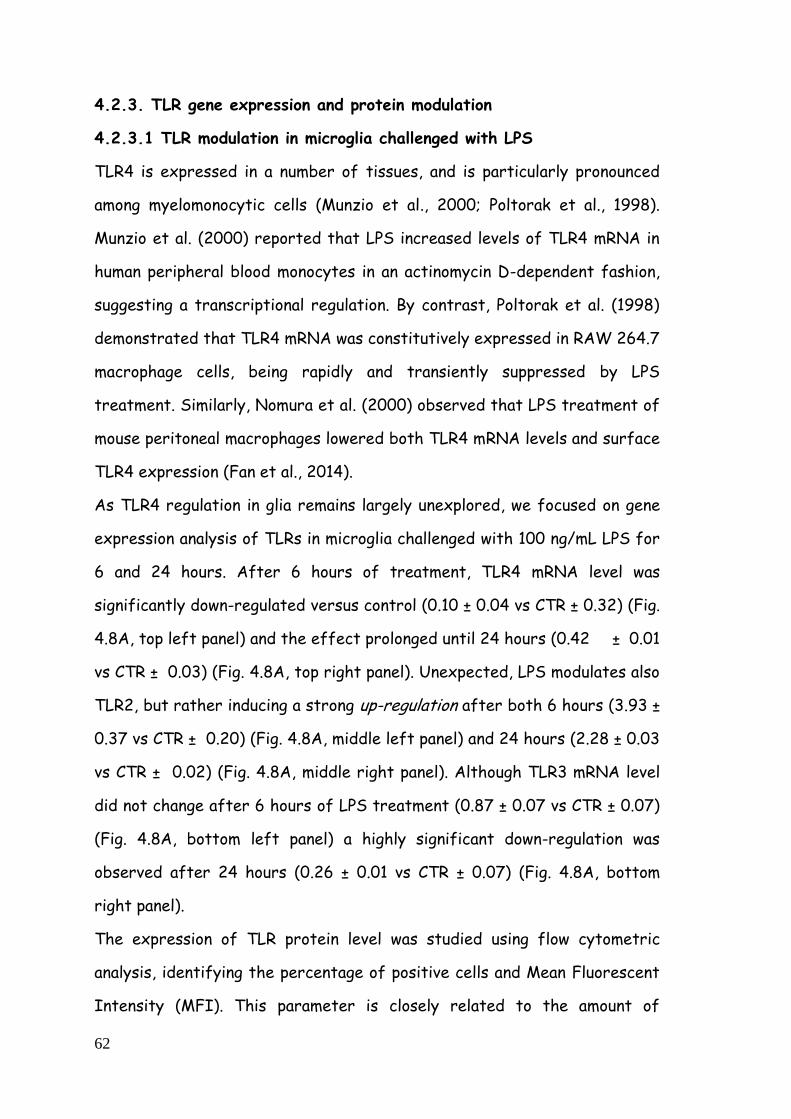
62
4.2.3. TLR gene expression and protein modulation
4.2.3.1 TLR modulation in microglia challenged with LPS
TLR4 is expressed in a number of tissues, and is particularly pronounced
among myelomonocytic cells (Munzio et al., 2000; Poltorak et al., 1998).
Munzio et al. (2000) reported that LPS increased levels of TLR4 mRNA in
human peripheral blood monocytes in an actinomycin D-dependent fashion,
suggesting a transcriptional regulation. By contrast, Poltorak et al. (1998)
demonstrated that TLR4 mRNA was constitutively expressed in RAW 264.7
macrophage cells, being rapidly and transiently suppressed by LPS
treatment. Similarly, Nomura et al. (2000) observed that LPS treatment of
mouse peritoneal macrophages lowered both TLR4 mRNA levels and surface
TLR4 expression (Fan et al., 2014).
As TLR4 regulation in glia remains largely unexplored, we focused on gene
expression analysis of TLRs in microglia challenged with 100 ng/mL LPS for
6 and 24 hours. After 6 hours of treatment, TLR4 mRNA level was
significantly down-regulated versus control (0.10 ± 0.04 vs CTR ± 0.32) (Fig.
4.8A, top left panel) and the effect prolonged until 24 hours (0.42 ± 0.01
vs CTR ± 0.03) (Fig. 4.8A, top right panel). Unexpected, LPS modulates also
TLR2, but rather inducing a strong up-regulation after both 6 hours (3.93 ±
0.37 vs CTR ± 0.20) (Fig. 4.8A, middle left panel) and 24 hours (2.28 ± 0.03
vs CTR ± 0.02) (Fig. 4.8A, middle right panel). Although TLR3 mRNA level
did not change after 6 hours of LPS treatment (0.87 ± 0.07 vs CTR ± 0.07)
(Fig. 4.8A, bottom left panel) a highly significant down-regulation was
observed after 24 hours (0.26 ± 0.01 vs CTR ± 0.07) (Fig. 4.8A, bottom
right panel).
The expression of TLR protein level was studied using flow cytometric
analysis, identifying the percentage of positive cells and Mean Fluorescent
Intensity (MFI). This parameter is closely related to the amount of
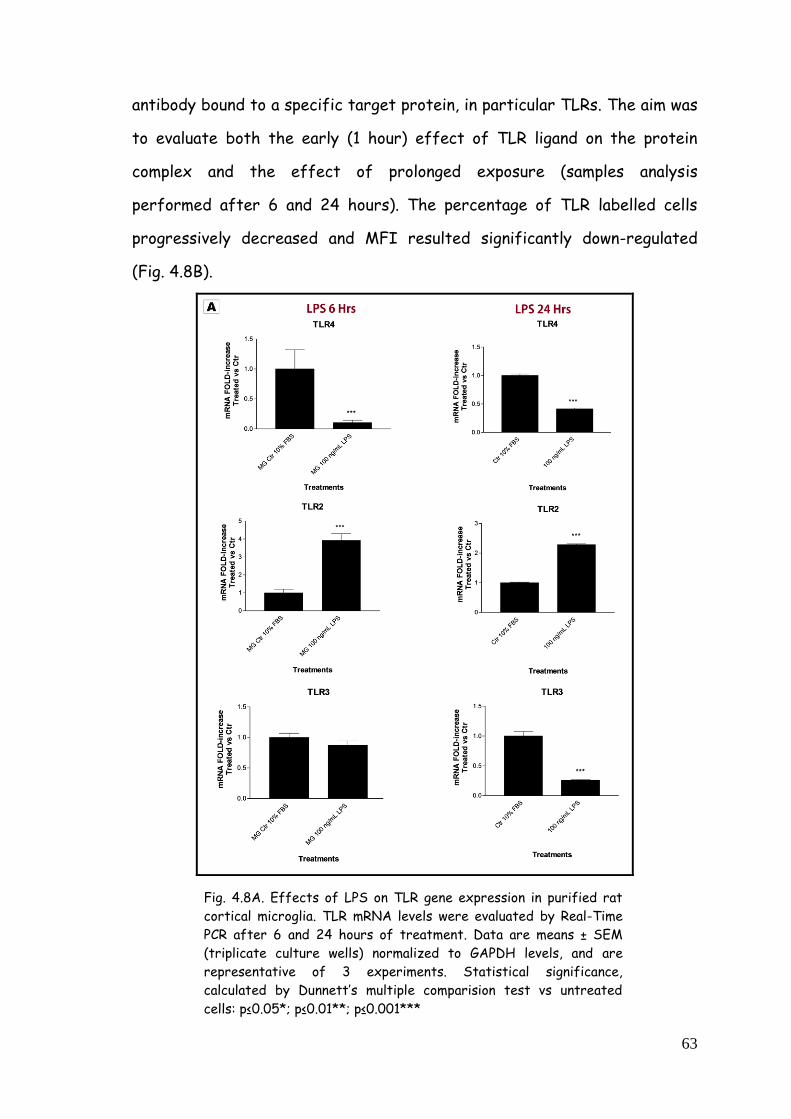
63
antibody bound to a specific target protein, in particular TLRs. The aim was
to evaluate both the early (1 hour) effect of TLR ligand on the protein
complex and the effect of prolonged exposure (samples analysis
performed after 6 and 24 hours). The percentage of TLR labelled cells
progressively decreased and MFI resulted significantly down-regulated
(Fig. 4.8B).
Fig. 4.8A. Effects of LPS on TLR gene expression in purified rat
cortical microglia. TLR mRNA levels were evaluated by Real-Time
PCR after 6 and 24 hours of treatment. Data are means ± SEM
(triplicate culture wells) normalized to GAPDH levels, and are
representative of 3 experiments. Statistical significance,
calculated by Dunnett’s multiple comparision test vs untreated
cells: p≤0.05*; p≤0.01**; p≤0.001***
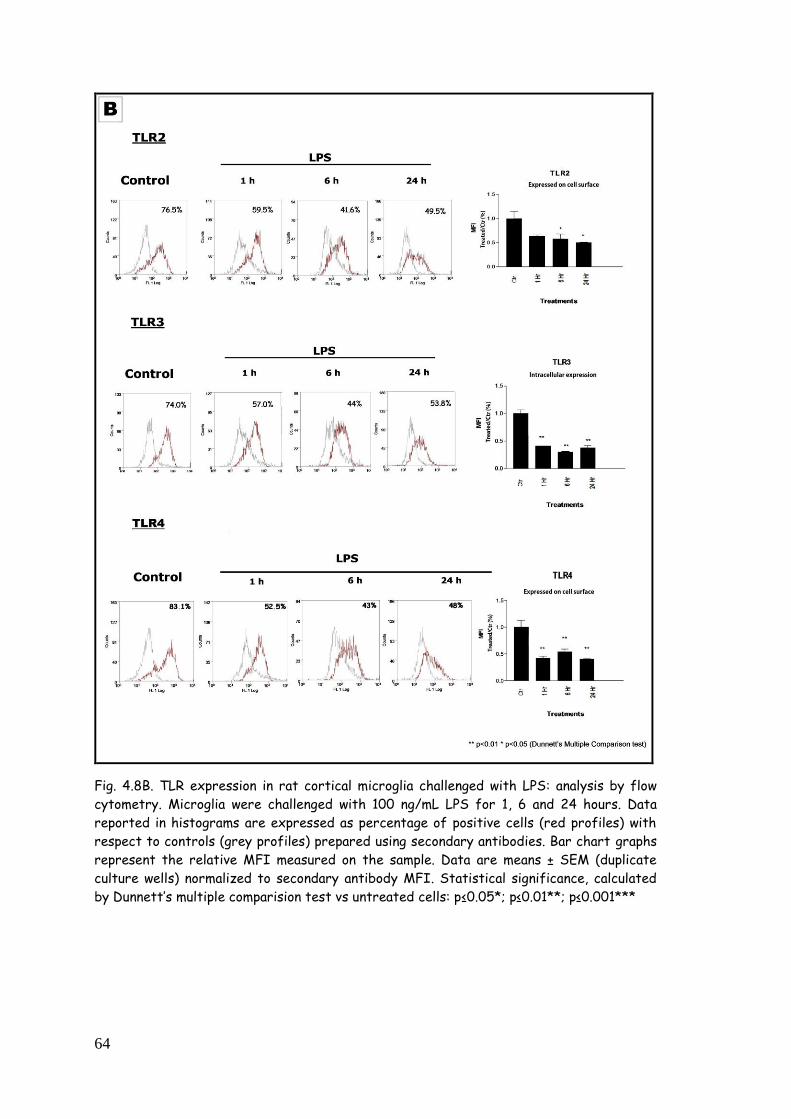
64
Fig. 4.8B. TLR expression in rat cortical microglia challenged with LPS: analysis by flow
cytometry. Microglia were challenged with 100 ng/mL LPS for 1, 6 and 24 hours. Data
reported in histograms are expressed as percentage of positive cells (red profiles) with
respect to controls (grey profiles) prepared using secondary antibodies. Bar chart graphs
represent the relative MFI measured on the sample. Data are means ± SEM (duplicate
culture wells) normalized to secondary antibody MFI. Statistical significance, calculated
by Dunnett’s multiple comparision test vs untreated cells: p≤0.05*; p≤0.01**; p≤0.001***
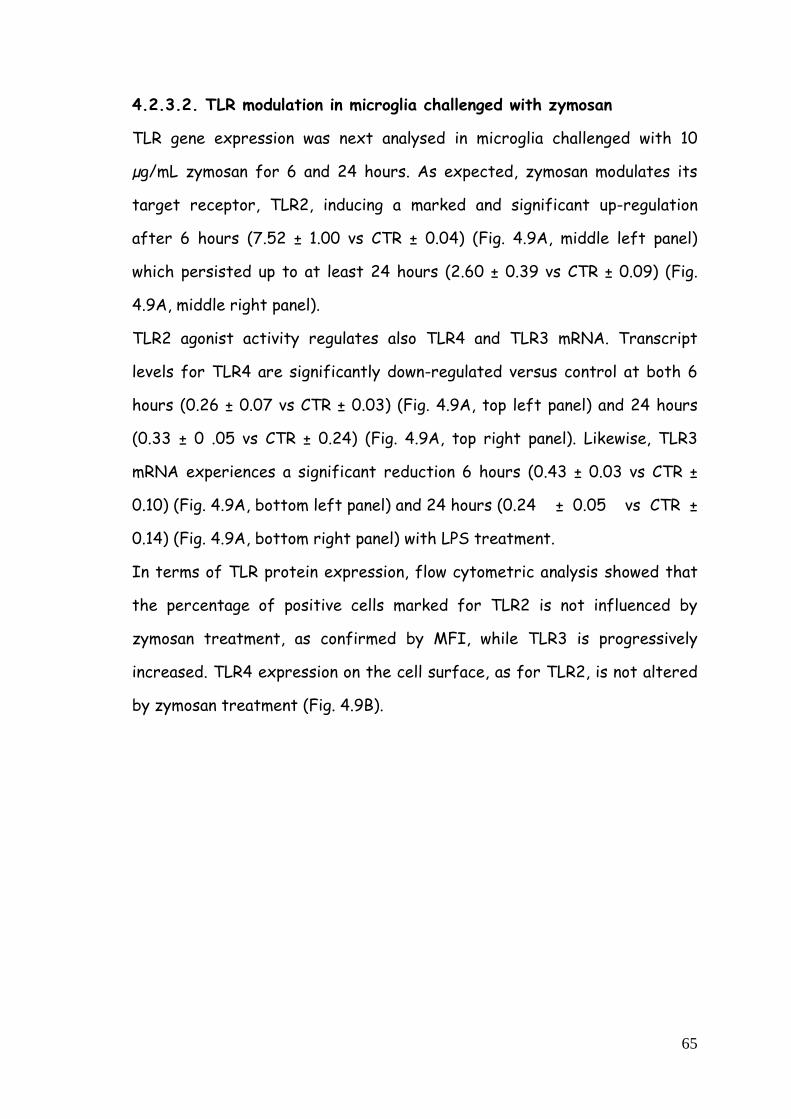
65
4.2.3.2. TLR modulation in microglia challenged with zymosan
TLR gene expression was next analysed in microglia challenged with 10
µg/mL zymosan for 6 and 24 hours. As expected, zymosan modulates its
target receptor, TLR2, inducing a marked and significant up-regulation
after 6 hours (7.52 ± 1.00 vs CTR ± 0.04) (Fig. 4.9A, middle left panel)
which persisted up to at least 24 hours (2.60 ± 0.39 vs CTR ± 0.09) (Fig.
4.9A, middle right panel).
TLR2 agonist activity regulates also TLR4 and TLR3 mRNA. Transcript
levels for TLR4 are significantly down-regulated versus control at both 6
hours (0.26 ± 0.07 vs CTR ± 0.03) (Fig. 4.9A, top left panel) and 24 hours
(0.33 ± 0 .05 vs CTR ± 0.24) (Fig. 4.9A, top right panel). Likewise, TLR3
mRNA experiences a significant reduction 6 hours (0.43 ± 0.03 vs CTR ±
0.10) (Fig. 4.9A, bottom left panel) and 24 hours (0.24 ± 0.05 vs CTR ±
0.14) (Fig. 4.9A, bottom right panel) with LPS treatment.
In terms of TLR protein expression, flow cytometric analysis showed that
the percentage of positive cells marked for TLR2 is not influenced by
zymosan treatment, as confirmed by MFI, while TLR3 is progressively
increased. TLR4 expression on the cell surface, as for TLR2, is not altered
by zymosan treatment (Fig. 4.9B).
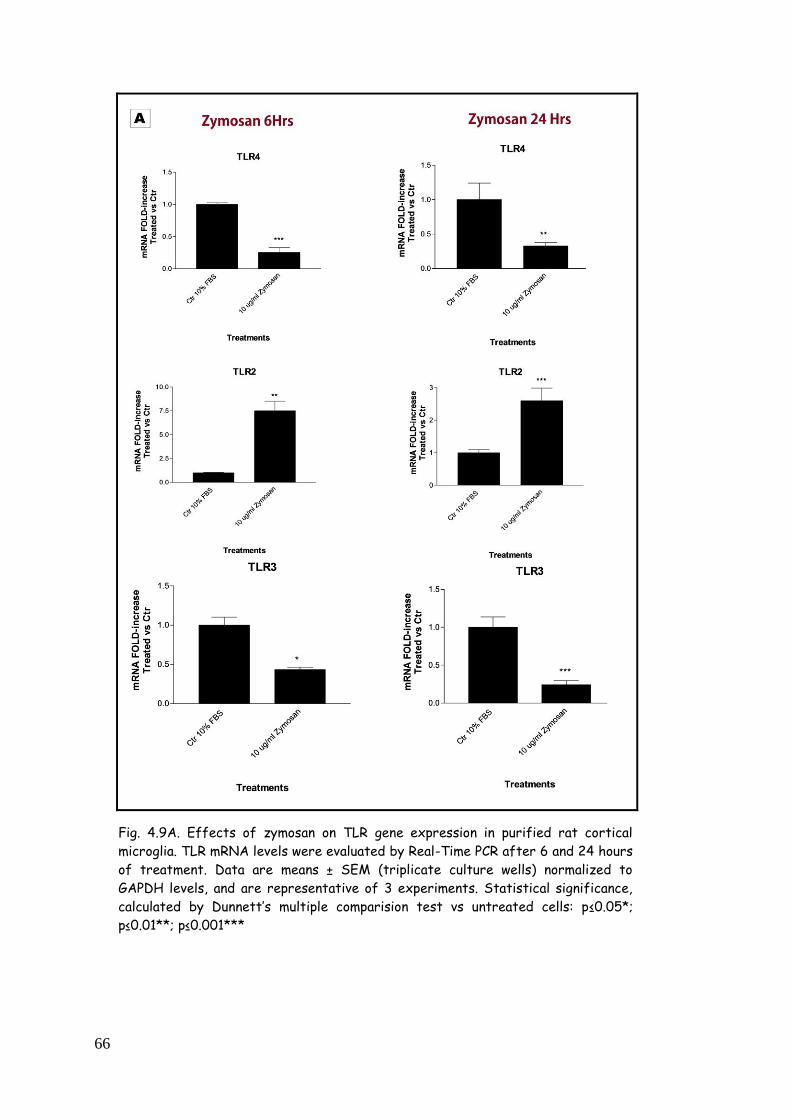
66
Fig. 4.9A. Effects of zymosan on TLR gene expression in purified rat cortical
microglia. TLR mRNA levels were evaluated by Real-Time PCR after 6 and 24 hours
of treatment. Data are means ± SEM (triplicate culture wells) normalized to
GAPDH levels, and are representative of 3 experiments. Statistical significance,
calculated by Dunnett’s multiple comparision test vs untreated cells: p≤0.05*;
p≤0.01**; p≤0.001***
67
Fig. 4.9B. TLR expression in rat cortical microglia challenged with zymosan: analysis by
flow cytometry. Data reported in histograms are expressed as percentage of positive
cells (red profiles) with respect to controls (grey profiles) prepared using secondary
antibodies. Bar chart graphs represent the relative MFI measured on the samples.
Data are means ± SEM (duplicate culture wells) normalized to secondary antibody MFI.
Statistical significance, calculated by Dunnett’s multiple comparision test vs untreated
cells: p≤0.05*; p≤0.01**; p≤0.001***
68
4.2.3.3. TLRs modulation in microglia challenged with poly(I:C)
Gene expression analysis of TLRs in microglia challenged with 50 µg/mL
poly(I:C) for 6 and 24 hours was analysed. Unexpected, poly(I:C) does not
modulate its target receptor, TLR3. A trend to decrease after 24 hours
was observed, but was not statistically significant (6 hours treatment: 0.97
± 0,03 vs CTR ± 0.14; 24 hours treatment: 0.65 ± 0.18 vs CTR ± 0.10) (Fig.
4.10A, bottom left and right panels). Poly(I:C), however, induced a highly
significant increase in TLR2 gene expression after 6 hours (5.32 ± 0.42 vs
CTR ± 0.14) and 24 hours (2.83 ± 0.73 vs CTR ± 0.08) (Fig. 4.10A, middle
left and right panels, repectively). Transcript levels for TLR4 showed a
statistically significant down-regulation after 6 hours (0.11 ± 0.01 vs CTR ±
0.14) (Fig. 4.10A, top left panel) and a non-significant trend after 24 hours
(0.68 ± 0.22 vs CTR ± 0.10) (Fig. 4.10A, right column).
Flow cytometry revealed that poly(I:C) increased its target receptor,
TLR3, after 1 hour. The percentage of positive cells for all 3 TLRs was
significantly diminished after both 6 and 24 hours exposure to poly(I:C).
These data were confirmed by MFI (Fig. 4.10B).
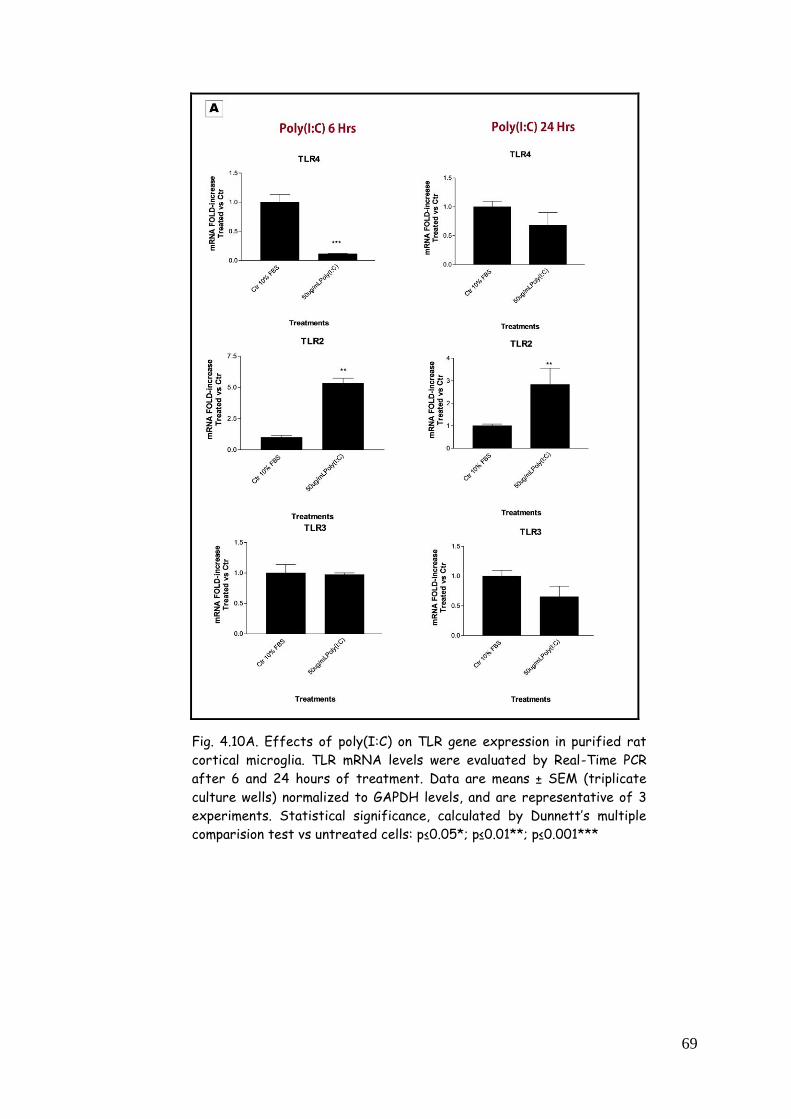
69
Fig. 4.10A. Effects of poly(I:C) on TLR gene expression in purified rat
cortical microglia. TLR mRNA levels were evaluated by Real-Time PCR
after 6 and 24 hours of treatment. Data are means ± SEM (triplicate
culture wells) normalized to GAPDH levels, and are representative of 3
experiments. Statistical significance, calculated by Dunnett’s multiple
comparision test vs untreated cells: p≤0.05*; p≤0.01**; p≤0.001***
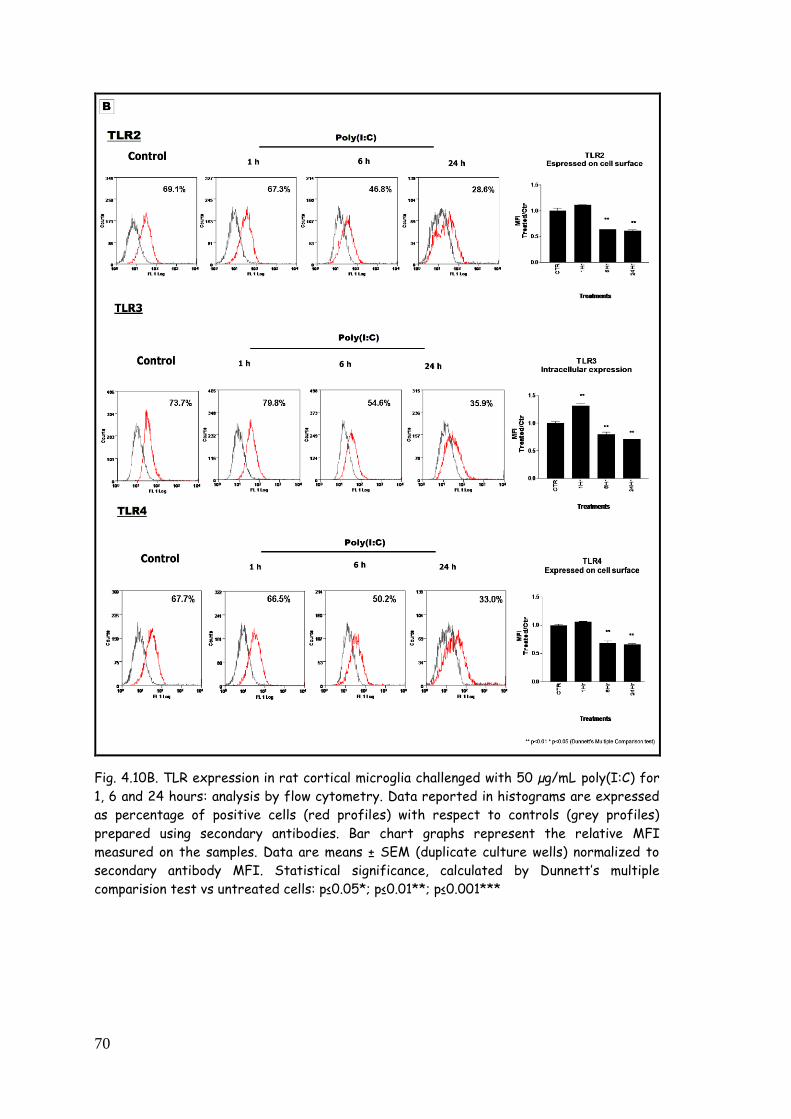
70
Fig. 4.10B. TLR expression in rat cortical microglia challenged with 50 µg/mL poly(I:C) for
1, 6 and 24 hours: analysis by flow cytometry. Data reported in histograms are expressed
as percentage of positive cells (red profiles) with respect to controls (grey profiles)
prepared using secondary antibodies. Bar chart graphs represent the relative MFI
measured on the samples. Data are means ± SEM (duplicate culture wells) normalized to
secondary antibody MFI. Statistical significance, calculated by Dunnett’s multiple
comparision test vs untreated cells: p≤0.05*; p≤0.01**; p≤0.001***
71
PART 3
4.3. TLR agonist-dependent cytokine expression in astrocytes:
influence of microglia
Numerous studies have described the use of astrocyte-enriched cultures
to study their capability to elaborate inflammation-related molecules, e.g.
cytokines, chemokines, and adhesion molecules. Oftentimes these reports
assume that astrocytes are the cell type responsible for the observed
effect, although this point can be questioned (Saura, 2007).
In view of the above, we decided to more fully characterize the role of
astrocytes in our cultures, using a specific microglia toxin, L-LME (Thiele et
al., 1983) to eradicate residual microglia. Confluent enriched astrocyte
monolayers were treated for 1 hour with 50 mM L-LME (Hamby et al.,
2006) followed 24 hours later by challenge with TLR ligands. As shown
earlier, enriched astrocytes strongly respond to LPS (Fig. 4.11), zymosan
(Fig. 4.12) and poly(I:C) (Fig. 4.13) treatment after both 6 and 24 hours
with up-regulation of mRNA for the pro-flammatory cytokines IL-1, IL-6
and TNF-. Under these conditions, we verified that L-LME-treated
astrocytes were unable to respond to the TLR ligands with induction of IL-
1β and IL-6 mRNA expression, although TNF-α gene expression is not
completely abolished (Figs. 4.11, 4.12, 4.13).
These observations are consistent with earlier findings (Barbierato et al.,
2013). Because nominally microglia-free astrocytes are incapable of
producing pro-inflammatory mediators following TLR2/3/4 activation, it is
not unreasonable to assume that astrocytes per se are not the source of
these molecules during inflammation.
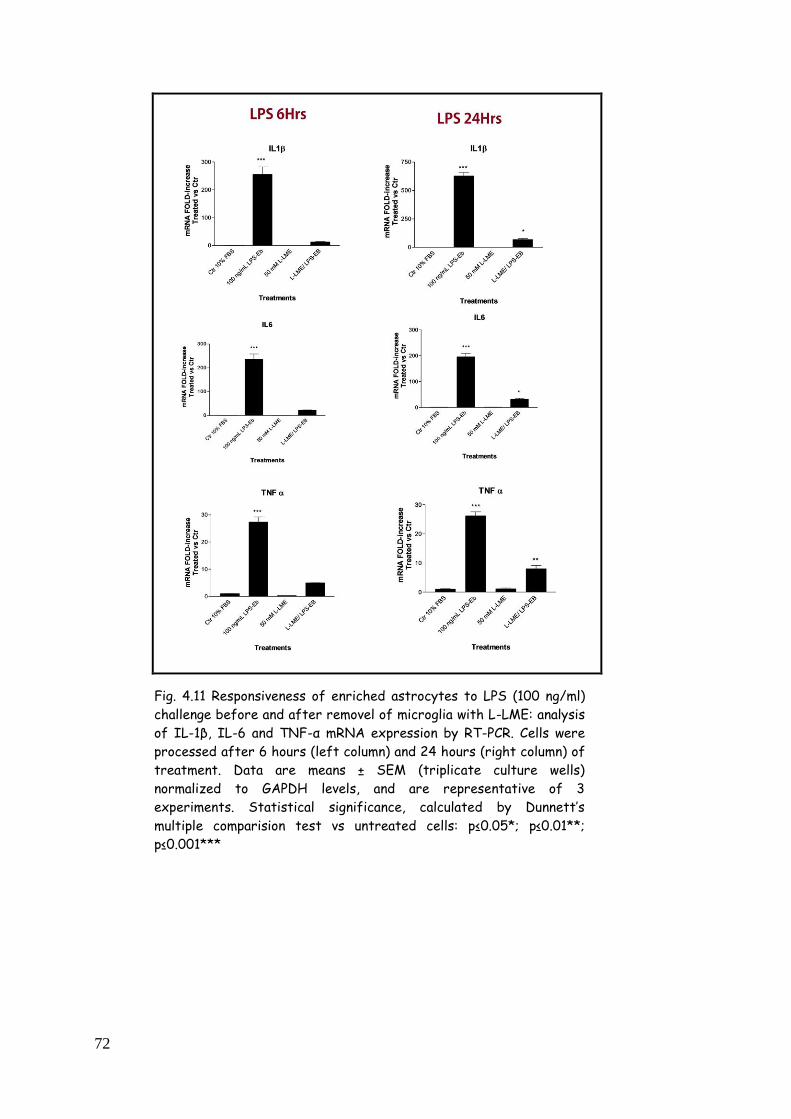
72
Fig. 4.11 Responsiveness of enriched astrocytes to LPS (100 ng/ml)
challenge before and after removel of microglia with L-LME: analysis
of IL-1β, IL-6 and TNF-α mRNA expression by RT-PCR. Cells were
processed after 6 hours (left column) and 24 hours (right column) of
treatment. Data are means ± SEM (triplicate culture wells)
normalized to GAPDH levels, and are representative of 3
experiments. Statistical significance, calculated by Dunnett’s
multiple comparision test vs untreated cells: p≤0.05*; p≤0.01**;
p≤0.001***
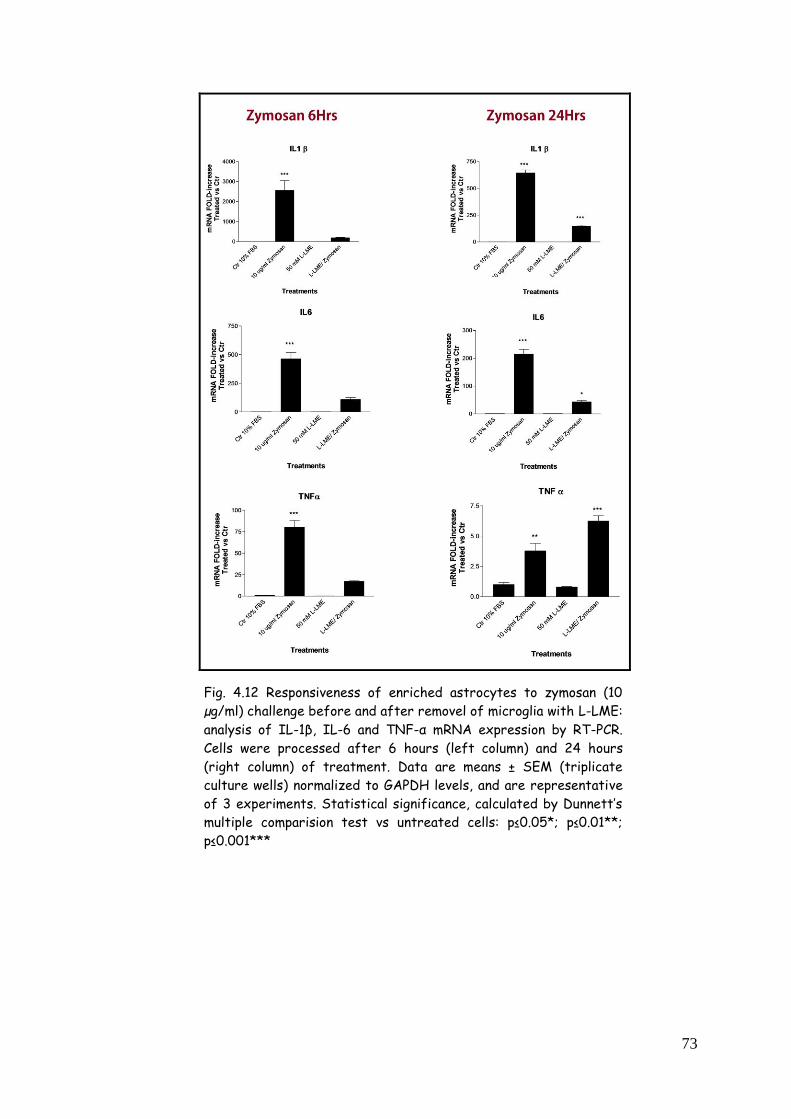
73
Fig. 4.12 Responsiveness of enriched astrocytes to zymosan (10
µg/ml) challenge before and after removel of microglia with L-LME:
analysis of IL-1β, IL-6 and TNF-α mRNA expression by RT-PCR.
Cells were processed after 6 hours (left column) and 24 hours
(right column) of treatment. Data are means ± SEM (triplicate
culture wells) normalized to GAPDH levels, and are representative
of 3 experiments. Statistical significance, calculated by Dunnett’s
multiple comparision test vs untreated cells: p≤0.05*; p≤0.01**;
p≤0.001***
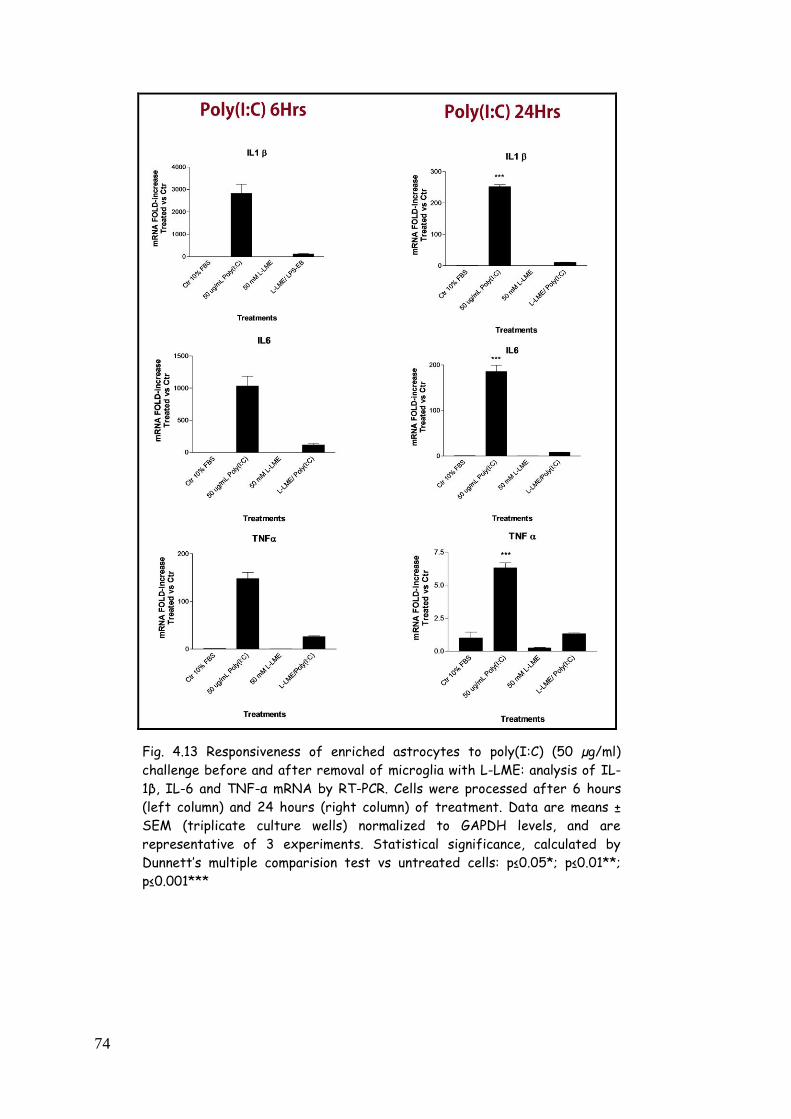
74
Fig. 4.13 Responsiveness of enriched astrocytes to poly(I:C) (50 µg/ml)
challenge before and after removal of microglia with L-LME: analysis of IL-
1β, IL-6 and TNF-α mRNA by RT-PCR. Cells were processed after 6 hours
(left column) and 24 hours (right column) of treatment. Data are means ±
SEM (triplicate culture wells) normalized to GAPDH levels, and are
representative of 3 experiments. Statistical significance, calculated by
Dunnett’s multiple comparision test vs untreated cells: p≤0.05*; p≤0.01**;
p≤0.001***
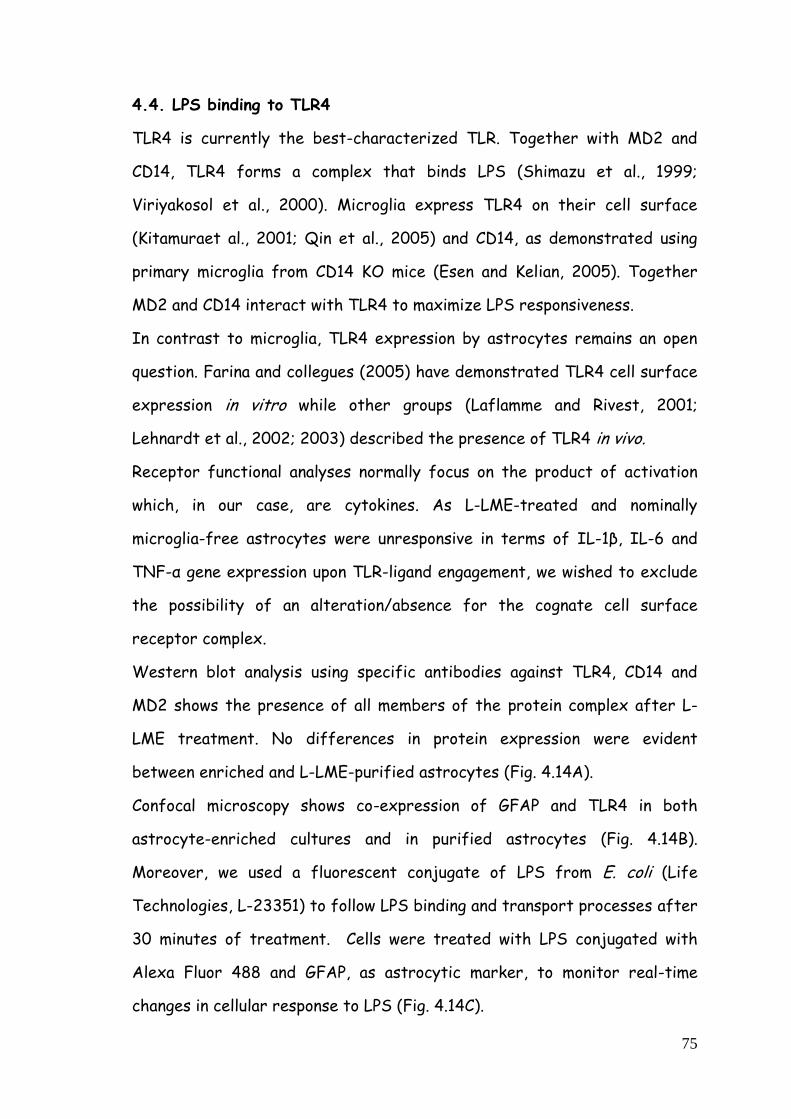
75
4.4. LPS binding to TLR4
TLR4 is currently the best-characterized TLR. Together with MD2 and
CD14, TLR4 forms a complex that binds LPS (Shimazu et al., 1999;
Viriyakosol et al., 2000). Microglia express TLR4 on their cell surface
(Kitamuraet al., 2001; Qin et al., 2005) and CD14, as demonstrated using
primary microglia from CD14 KO mice (Esen and Kelian, 2005). Together
MD2 and CD14 interact with TLR4 to maximize LPS responsiveness.
In contrast to microglia, TLR4 expression by astrocytes remains an open
question. Farina and collegues (2005) have demonstrated TLR4 cell surface
expression in vitro while other groups (Laflamme and Rivest, 2001;
Lehnardt et al., 2002; 2003) described the presence of TLR4 in vivo.
Receptor functional analyses normally focus on the product of activation
which, in our case, are cytokines. As L-LME-treated and nominally
microglia-free astrocytes were unresponsive in terms of IL-1β, IL-6 and
TNF-α gene expression upon TLR-ligand engagement, we wished to exclude
the possibility of an alteration/absence for the cognate cell surface
receptor complex.
Western blot analysis using specific antibodies against TLR4, CD14 and
MD2 shows the presence of all members of the protein complex after L-
LME treatment. No differences in protein expression were evident
between enriched and L-LME-purified astrocytes (Fig. 4.14A).
Confocal microscopy shows co-expression of GFAP and TLR4 in both
astrocyte-enriched cultures and in purified astrocytes (Fig. 4.14B).
Moreover, we used a fluorescent conjugate of LPS from E. coli (Life
Technologies, L-23351) to follow LPS binding and transport processes after
30 minutes of treatment. Cells were treated with LPS conjugated with
Alexa Fluor 488 and GFAP, as astrocytic marker, to monitor real-time
changes in cellular response to LPS (Fig. 4.14C).
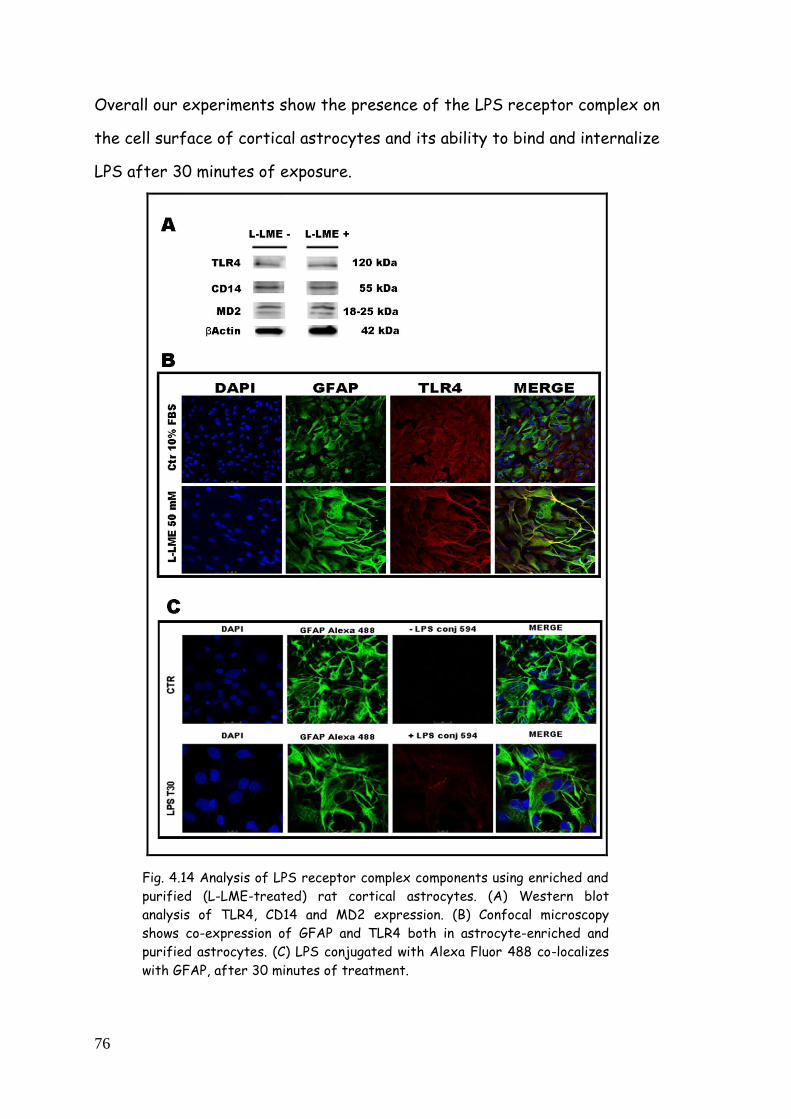
76
Overall our experiments show the presence of the LPS receptor complex on
the cell surface of cortical astrocytes and its ability to bind and internalize
LPS after 30 minutes of exposure.
Fig. 4.14 Analysis of LPS receptor complex components using enriched and
purified (L-LME-treated) rat cortical astrocytes. (A) Western blot
analysis of TLR4, CD14 and MD2 expression. (B) Confocal microscopy
shows co-expression of GFAP and TLR4 both in astrocyte-enriched and
purified astrocytes. (C) LPS conjugated with Alexa Fluor 488 co-localizes
with GFAP, after 30 minutes of treatment.
77
4.5. LPS, zymosan and poly(I:C) modulate TLR expression in purified
astrocytes
4.5.1. TLR modulation in astrocytes challenged with LPS
Immune responses in the CNS are mainly attributed to microglia (Rivest,
2009), due to the capacity of these cells to present antigens (Gorina et al.,
2011). However, astrocytes are the most abundant CNS cell type. Since we
have demonstrated the presence of TLRs in purified astrocyte cell
cultures, we asked whether TLR ligands are able to modulate features of
immune responses regulating TLR protein expression, indepdendent of
cytokine production.
TLR gene expression was studied by Real-Time PCR using enriched
astrocyte cell cultures without or with a prior exposure to L-LME to
deplete the residual microglial cell population. Cells were challenged with
100 ng/mL LPS for 6 or 24 hours. TLR4 mRNA levels were significantly
down-regulated both in enriched astrocytes (0.71 ± 0.03 vs CTR ± 0.03) and
purified astrocytes (0.11 ± 0.01 vs CTR ± 0.03) at 6 hours (Fig. 4.15A, top
left panel) and 24 hours (Fig. 4.8A, top right panel). In contrast to TLR4,
LPS significantly up-regulated TLR2 mRNA levels after 6 hours in enriched
as well as in purified astrocytes (Fig. 4.15A, middle left panel); this effect
was still evident after 24 hours (Fig. 4.15A, middle right panel). LPS
treatment significantly raised TLR3 mRNA at after 6 hours in enriched
astrocytes only; there was a non-significant trend to increase in all other
samples (Fig. 4.15A, bottom left and right panels). Interestingly, L-LME
treatment reduced, but did not abolish basal TLR4 mRNA (0.22 ± 0.05 vs
CTR ± 0.03 for TLR4; 0.44 ± 0.12 vs CTR ± 0.06 for TLR3; 0.13 ± 0.01 vs
CTR ± 0.14 for TLR2).
Analyses of TLR cell surface expression of were performed using FACS
utilizing purified astrocyte cultures challenged with LPS for 1, 6, and 24
78
hours. While the percentage of TLR4-positive cells increased already at 1
hour, the amounts of cell surface-expressed receptor did not change (Fig.
4.15B, bar chart). TLR3, but not TLR2 is modulated due to the treatment
(Fig. 4.15B). These data demonstrate that the percentage of positive cells
does not always follow the direction of the MFI, indicating a cellular
regulation of the receptor exposure.
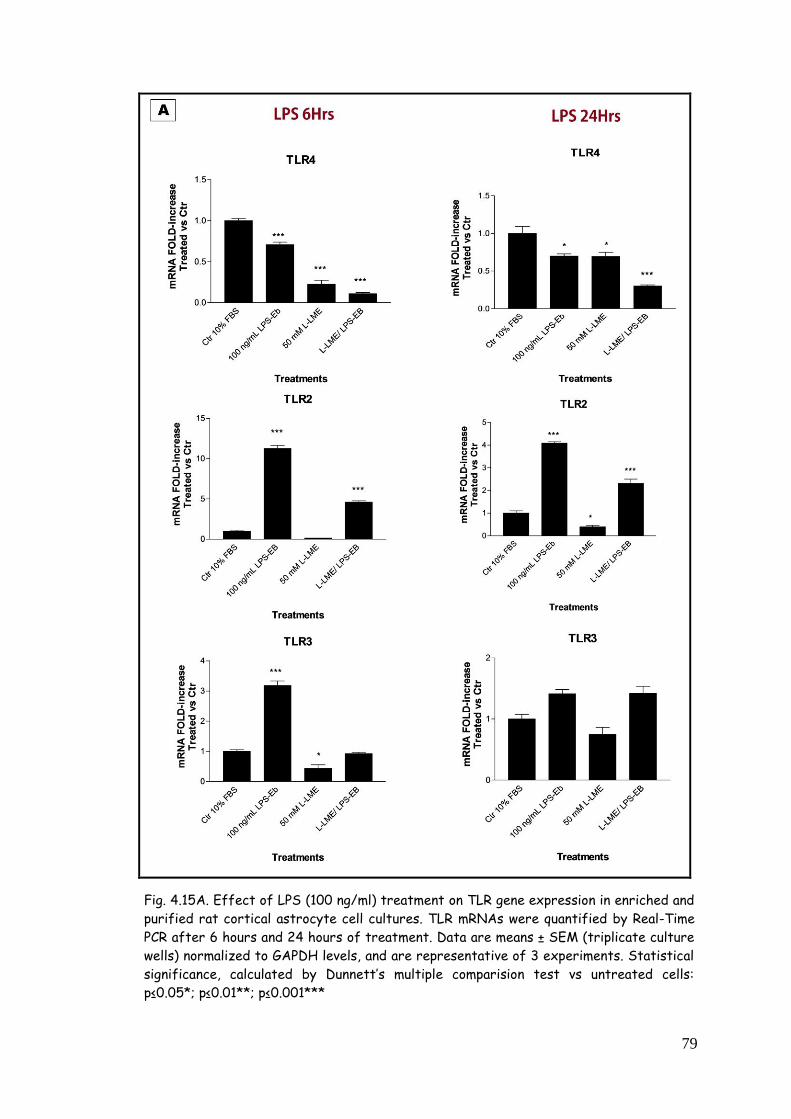
79
Fig. 4.15A. Effect of LPS (100 ng/ml) treatment on TLR gene expression in enriched and
purified rat cortical astrocyte cell cultures. TLR mRNAs were quantified by Real-Time
PCR after 6 hours and 24 hours of treatment. Data are means ± SEM (triplicate culture
wells) normalized to GAPDH levels, and are representative of 3 experiments. Statistical
significance, calculated by Dunnett’s multiple comparision test vs untreated cells:
p≤0.05*; p≤0.01**; p≤0.001***
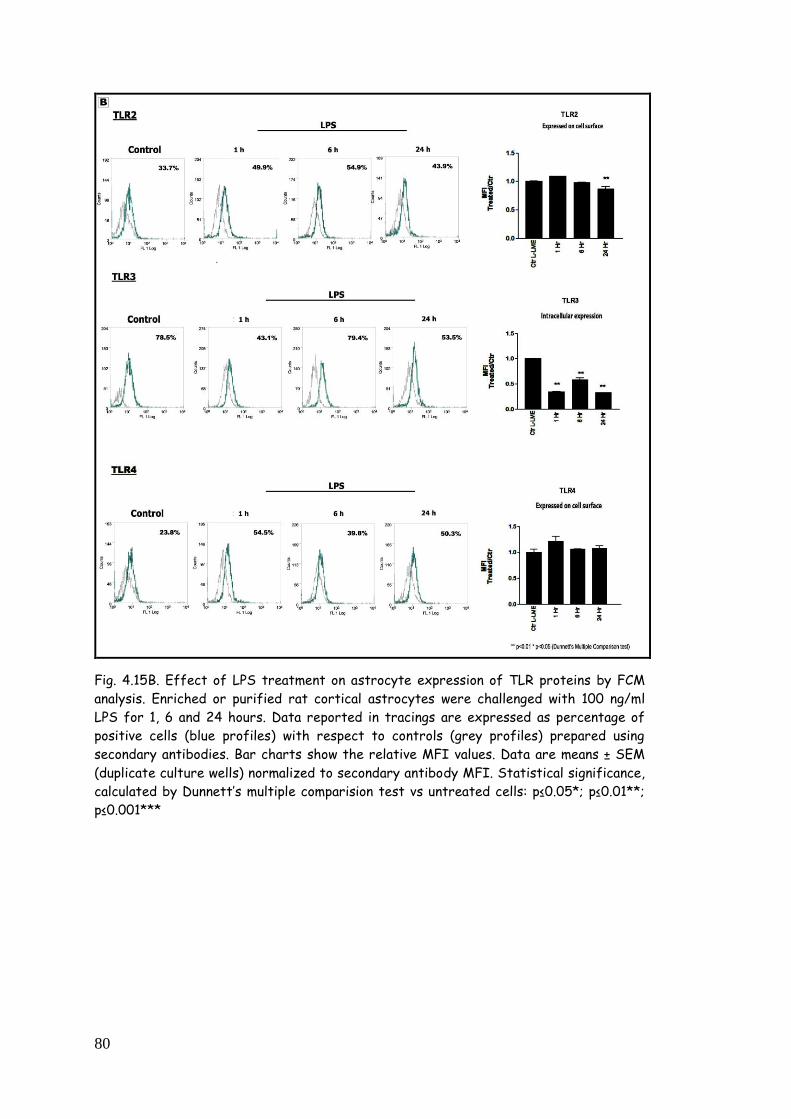
80
Fig. 4.15B. Effect of LPS treatment on astrocyte expression of TLR proteins by FCM
analysis. Enriched or purified rat cortical astrocytes were challenged with 100 ng/ml
LPS for 1, 6 and 24 hours. Data reported in tracings are expressed as percentage of
positive cells (blue profiles) with respect to controls (grey profiles) prepared using
secondary antibodies. Bar charts show the relative MFI values. Data are means ± SEM
(duplicate culture wells) normalized to secondary antibody MFI. Statistical significance,
calculated by Dunnett’s multiple comparision test vs untreated cells: p≤0.05*; p≤0.01**;
p≤0.001***
81
4.5.2. TLRs modulation in astrocytes challenged with zymosan
Astrocytes were stimulated with zymosan (10 µg/mL) for 6 and 24 hours.
Not unexpectedly, this TLR2 ligand modulates its target receptor, inducing
a marked and significant up-regulation in purified astrocytes after 6 hours
(10.85 ± 1.15 vs CTR ± 0.2) (Fig. 4.16A, middle left panel) and also after 24
hours (3.06 ± 0.16 vs CTR ± 0.2) (Fig. 4.16A, middle right panel). TLR2
agonist activity regulates also TLR4 and TLR3 mRNA. Transcript levels for
TLR4 mRNA are down-regulated after 6 hours (0.0.12 ± 0.02 vs CTR ±
0.06) (Fig. 4.16A, top left panel) and 24 hours (0.37 ± 0.02 vs CTR ± 0.15)
(Fig. 4.16A, top right panel). TLR3 mRNA does not statistically change in 6
hours (1.14 ± 0.08 vs CTR ± 0.07) (Fig. 4.9A, bottom left panel) but is
significantly raised after 24 hours (1.55 ± 0.0 vs CTR ± 0.02) (Fig. 4.16A,
bottom right panel).
FCM analyses for protein expression show that the percentage of positive
cells marked for TLR2 is strongly reduced by treatment, as confirmed also
by MFI (Fig. 4.9B). TLR3 is not influenced by the treatment considering
both the percentage of positive cells and MFI. TLR4 expression on the cell
surface, as TLR2 decreases already after 1 hour and remains low until 24
hours (Fig. 4.9B).
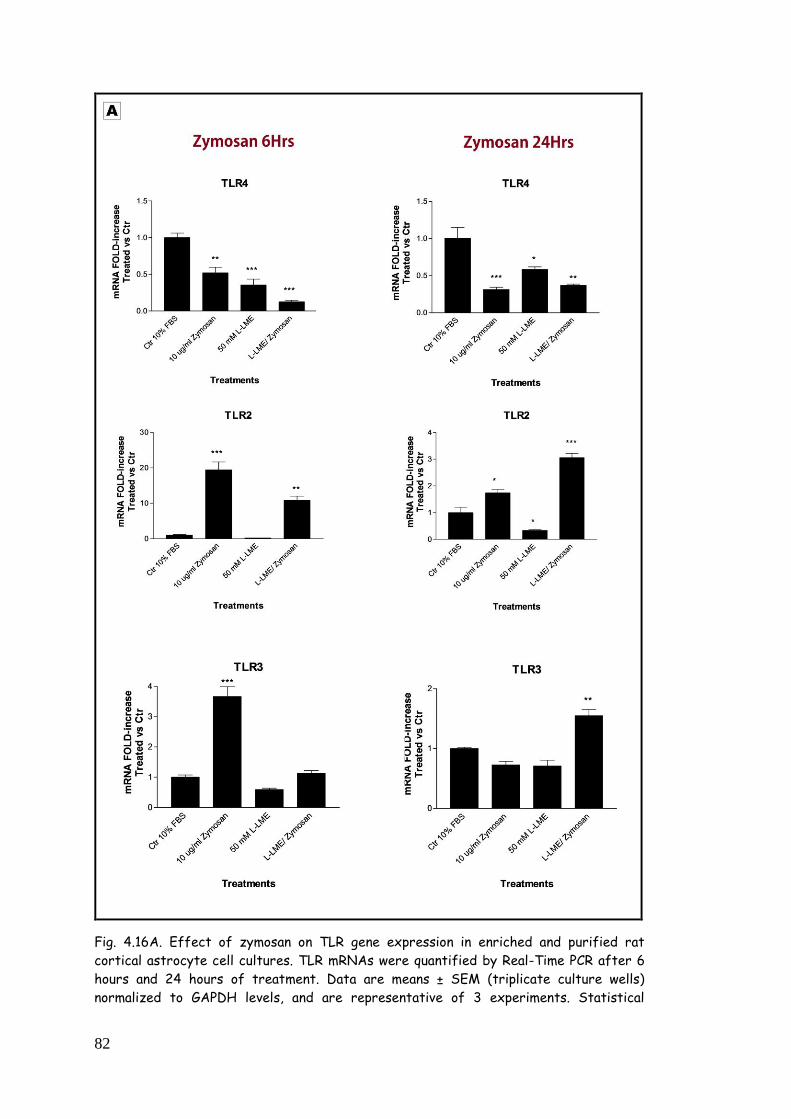
82
Fig. 4.16A. Effect of zymosan on TLR gene expression in enriched and purified rat
cortical astrocyte cell cultures. TLR mRNAs were quantified by Real-Time PCR after 6
hours and 24 hours of treatment. Data are means ± SEM (triplicate culture wells)
normalized to GAPDH levels, and are representative of 3 experiments. Statistical
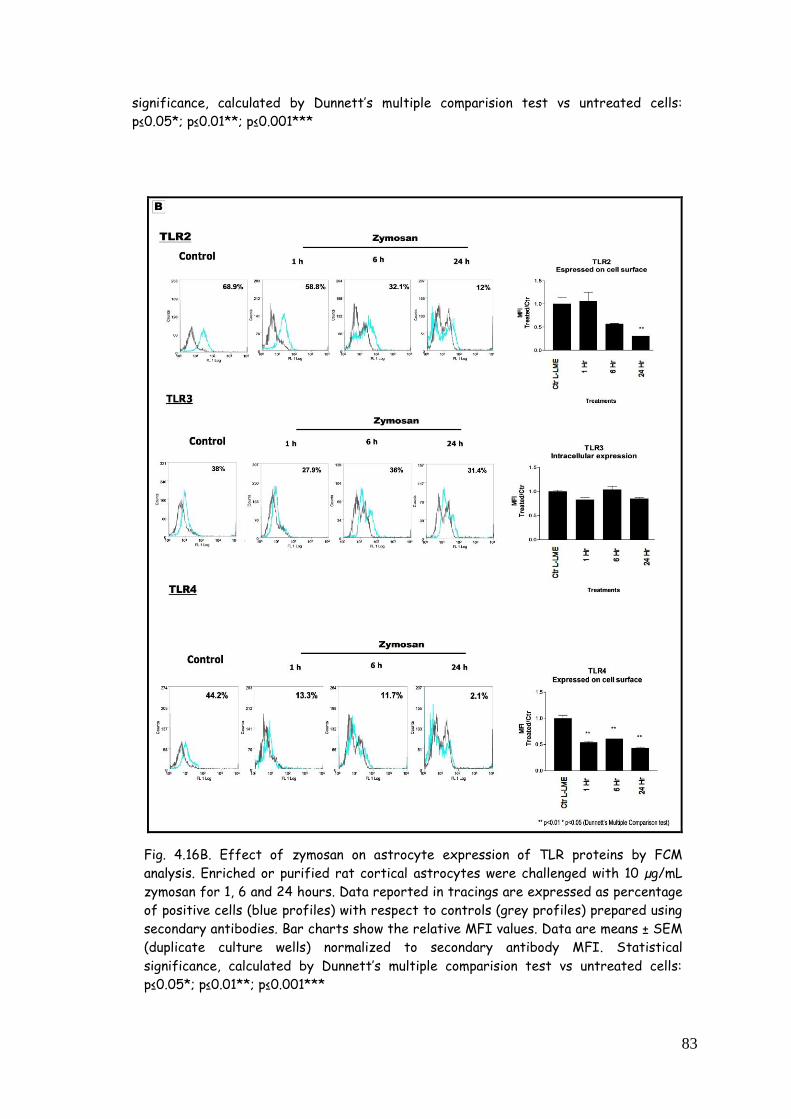
83
significance, calculated by Dunnett’s multiple comparision test vs untreated cells:
p≤0.05*; p≤0.01**; p≤0.001***
Fig. 4.16B. Effect of zymosan on astrocyte expression of TLR proteins by FCM
analysis. Enriched or purified rat cortical astrocytes were challenged with 10 µg/mL
zymosan for 1, 6 and 24 hours. Data reported in tracings are expressed as percentage
of positive cells (blue profiles) with respect to controls (grey profiles) prepared using
secondary antibodies. Bar charts show the relative MFI values. Data are means ± SEM
(duplicate culture wells) normalized to secondary antibody MFI. Statistical
significance, calculated by Dunnett’s multiple comparision test vs untreated cells:
p≤0.05*; p≤0.01**; p≤0.001***
84
4.5.3. TLR modulation in astrocytes challenged with poly(I:C)
Astrocytes were stimulated with poly(I:C) (50 µg/mL) for 6 and 24 hours
and TLR gene expression analysed. Poly(I:C) treatment of purified
astrocytes produced a significant, robust increase in TLR3 mRNA after 6
hours (3.56 ± 0.16 vs CTR ± 0.07) and 24 hours (2.18 ± 0.10 vs CTR ± 0.12)
(Fig. 4.17A, bottom left and right panels, respectively). Futher, poly(I:C)
induced a strong and significant rise in TLR2 gene expression after 6 hours
(11.24 ± 0.22 vs CTR ± 0.01) and after 24 hours (2.26 ± 0.15 vs CTR ± 0.15)
(Fig. 4.17A, middle left and right panels, respectively). In contrast,
transcript levels for TLR4 were statistically lower versus control after 6
hours (0.29 ± 0.05 vs CTR ± 0.11) (Fig. 4.17A, top left panel); the effect was
not evident at the 24-hour time point (0.47 ± 0.03 vs CTR ± 0.19) (Fig.
4.17A, top right panel).
The effects of poly(I:C) on TLR protein expression were studied using
FCM. The percentage of TLR3-positive cells after 6 hours was found to be
decreased; this was confirmed by MFI. TLR3 expression on the endosomal
membrane was not modulated by poly(I:C) treatment; these data are in
agreement with MFI analysis (Fig. 4.17B). TLR2 and TLR4 were up-
regulated after 6 hours of poly(I:C) treatment (Fig 4.17B).
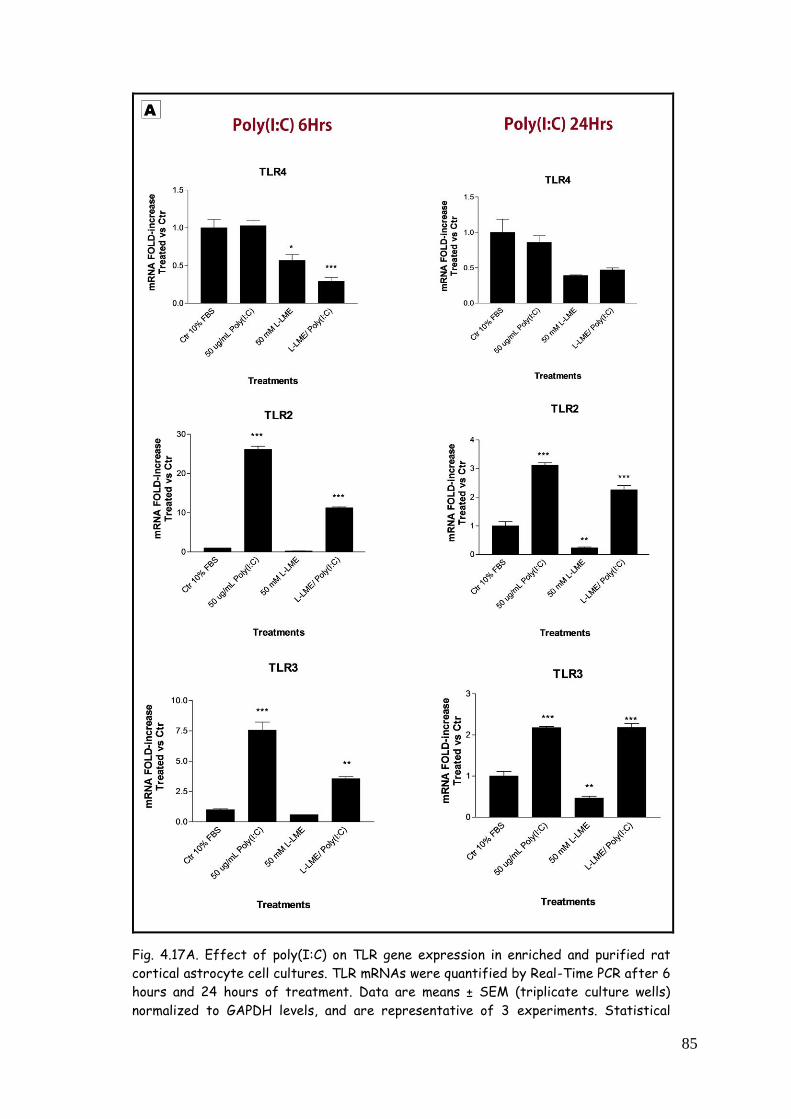
85
Fig. 4.17A. Effect of poly(I:C) on TLR gene expression in enriched and purified rat
cortical astrocyte cell cultures. TLR mRNAs were quantified by Real-Time PCR after 6
hours and 24 hours of treatment. Data are means ± SEM (triplicate culture wells)
normalized to GAPDH levels, and are representative of 3 experiments. Statistical
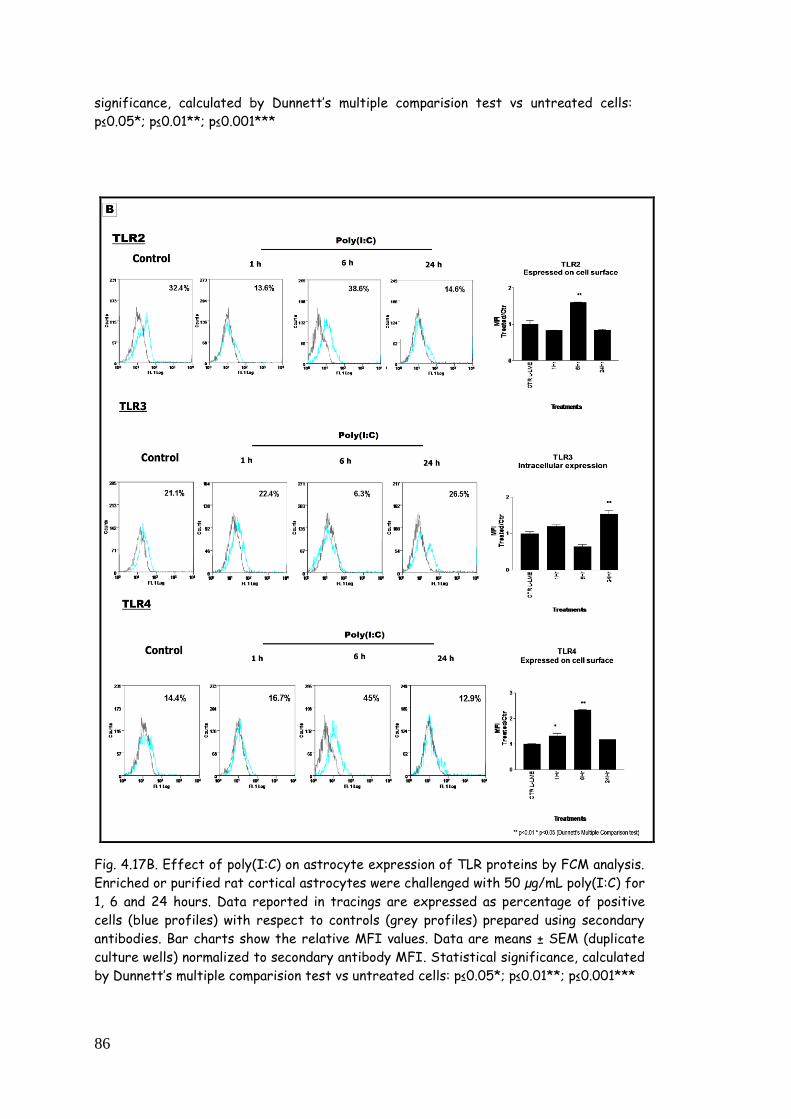
86
significance, calculated by Dunnett’s multiple comparision test vs untreated cells:
p≤0.05*; p≤0.01**; p≤0.001***
Fig. 4.17B. Effect of poly(I:C) on astrocyte expression of TLR proteins by FCM analysis.
Enriched or purified rat cortical astrocytes were challenged with 50 µg/mL poly(I:C) for
1, 6 and 24 hours. Data reported in tracings are expressed as percentage of positive
cells (blue profiles) with respect to controls (grey profiles) prepared using secondary
antibodies. Bar charts show the relative MFI values. Data are means ± SEM (duplicate
culture wells) normalized to secondary antibody MFI. Statistical significance, calculated
by Dunnett’s multiple comparision test vs untreated cells: p≤0.05*; p≤0.01**; p≤0.001***
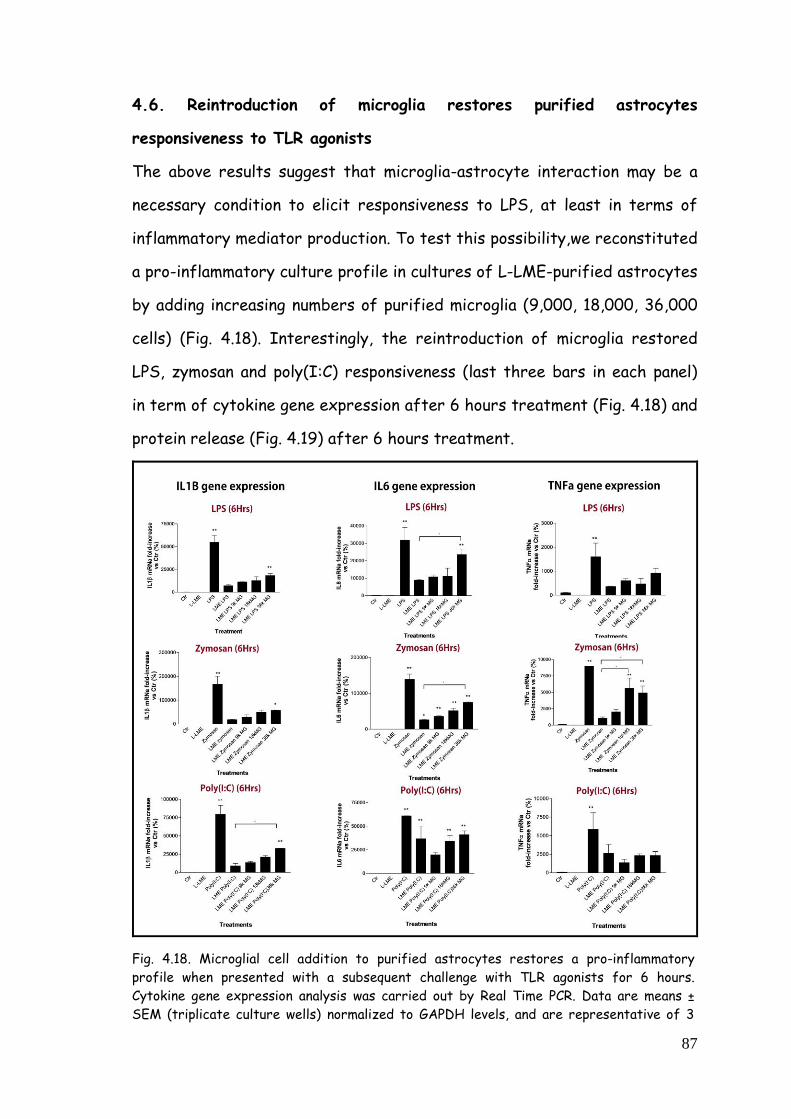
87
4.6. Reintroduction of microglia restores purified astrocytes
responsiveness to TLR agonists
The above results suggest that microglia-astrocyte interaction may be a
necessary condition to elicit responsiveness to LPS, at least in terms of
inflammatory mediator production. To test this possibility,we reconstituted
a pro-inflammatory culture profile in cultures of L-LME-purified astrocytes
by adding increasing numbers of purified microglia (9,000, 18,000, 36,000
cells) (Fig. 4.18). Interestingly, the reintroduction of microglia restored
LPS, zymosan and poly(I:C) responsiveness (last three bars in each panel)
in term of cytokine gene expression after 6 hours treatment (Fig. 4.18) and
protein release (Fig. 4.19) after 6 hours treatment.
Fig. 4.18. Microglial cell addition to purified astrocytes restores a pro-inflammatory
profile when presented with a subsequent challenge with TLR agonists for 6 hours.
Cytokine gene expression analysis was carried out by Real Time PCR. Data are means ±
SEM (triplicate culture wells) normalized to GAPDH levels, and are representative of 3
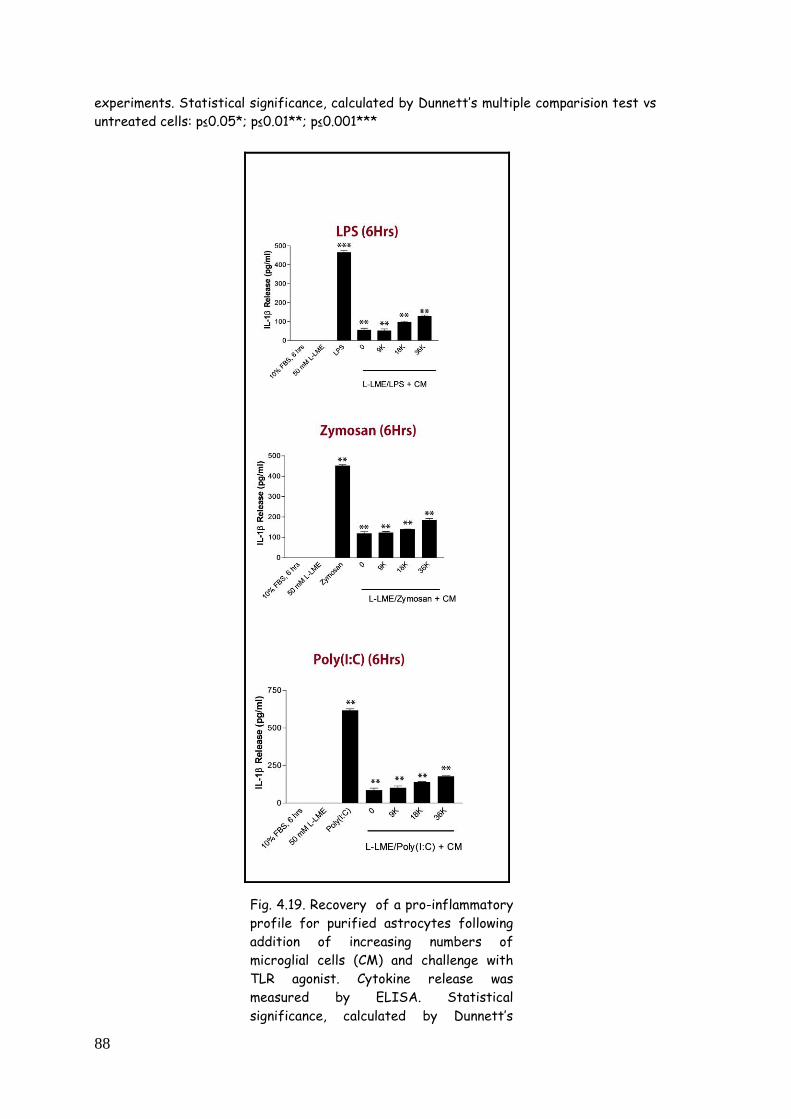
88
experiments. Statistical significance, calculated by Dunnett’s multiple comparision test vs
untreated cells: p≤0.05*; p≤0.01**; p≤0.001***
Fig. 4.19. Recovery of a pro-inflammatory
profile for purified astrocytes following
addition of increasing numbers of
microglial cells (CM) and challenge with
TLR agonist. Cytokine release was
measured by ELISA. Statistical
significance, calculated by Dunnett’s
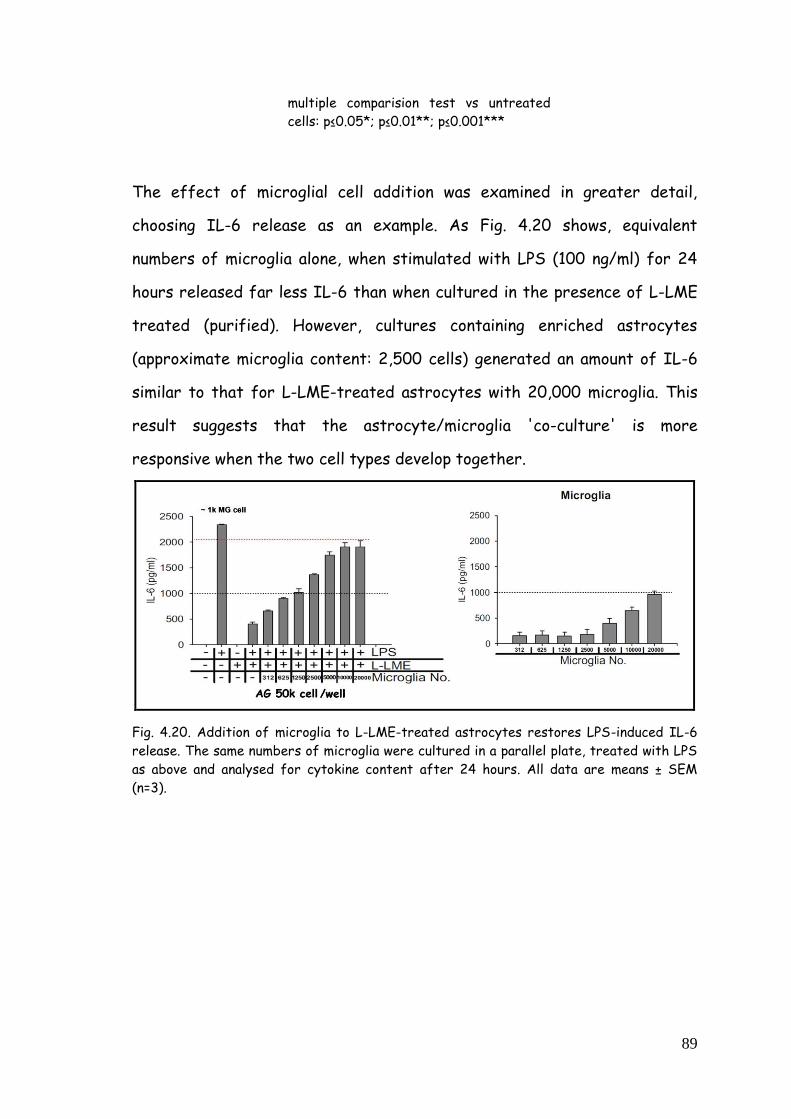
89
multiple comparision test vs untreated
cells: p≤0.05*; p≤0.01**; p≤0.001***
The effect of microglial cell addition was examined in greater detail,
choosing IL-6 release as an example. As Fig. 4.20 shows, equivalent
numbers of microglia alone, when stimulated with LPS (100 ng/ml) for 24
hours released far less IL-6 than when cultured in the presence of L-LME
treated (purified). However, cultures containing enriched astrocytes
(approximate microglia content: 2,500 cells) generated an amount of IL-6
similar to that for L-LME-treated astrocytes with 20,000 microglia. This
result suggests that the astrocyte/microglia 'co-culture' is more
responsive when the two cell types develop together.
Fig. 4.20. Addition of microglia to L-LME-treated astrocytes restores LPS-induced IL-6
release. The same numbers of microglia were cultured in a parallel plate, treated with LPS
as above and analysed for cytokine content after 24 hours. All data are means ± SEM
(n=3).
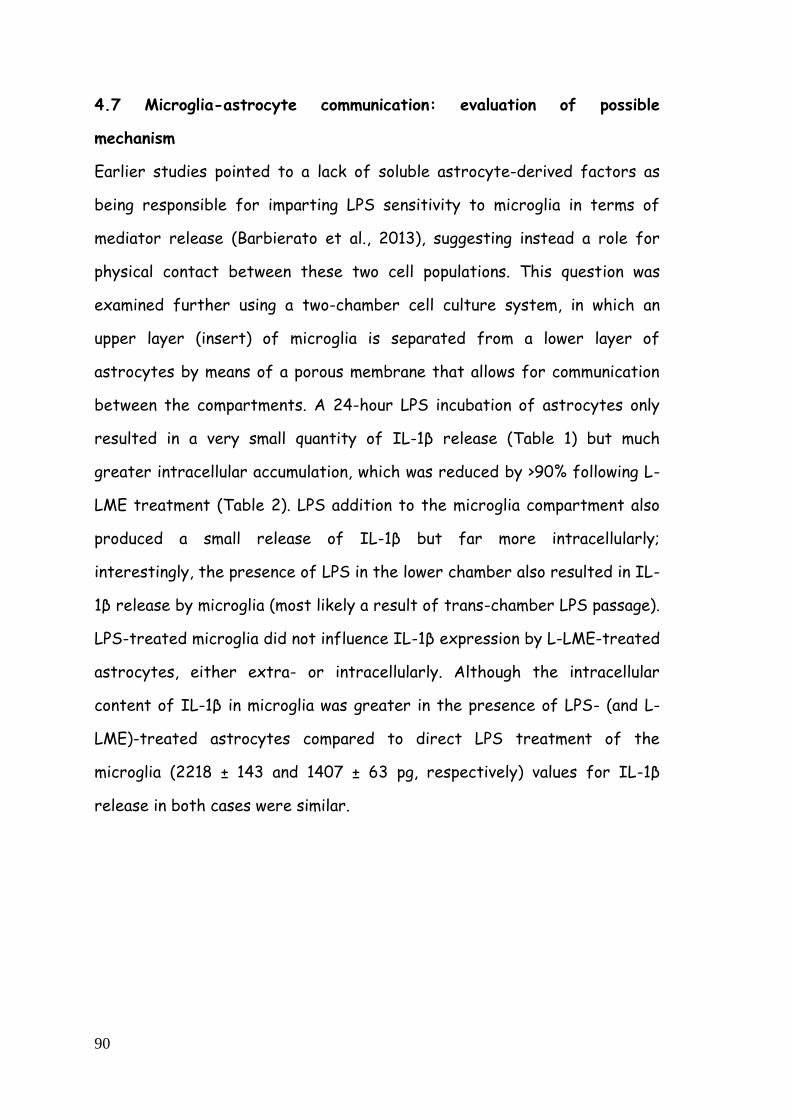
90
4.7 Microglia-astrocyte communication: evaluation of possible
mechanism
Earlier studies pointed to a lack of soluble astrocyte-derived factors as
being responsible for imparting LPS sensitivity to microglia in terms of
mediator release (Barbierato et al., 2013), suggesting instead a role for
physical contact between these two cell populations. This question was
examined further using a two-chamber cell culture system, in which an
upper layer (insert) of microglia is separated from a lower layer of
astrocytes by means of a porous membrane that allows for communication
between the compartments. A 24-hour LPS incubation of astrocytes only
resulted in a very small quantity of IL-1β release (Table 1) but much
greater intracellular accumulation, which was reduced by >90% following L-
LME treatment (Table 2). LPS addition to the microglia compartment also
produced a small release of IL-1β but far more intracellularly;
interestingly, the presence of LPS in the lower chamber also resulted in IL-
1β release by microglia (most likely a result of trans-chamber LPS passage).
LPS-treated microglia did not influence IL-1β expression by L-LME-treated
astrocytes, either extra- or intracellularly. Although the intracellular
content of IL-1β in microglia was greater in the presence of LPS- (and L-
LME)-treated astrocytes compared to direct LPS treatment of the
microglia (2218 ± 143 and 1407 ± 63 pg, respectively) values for IL-1β
release in both cases were similar.
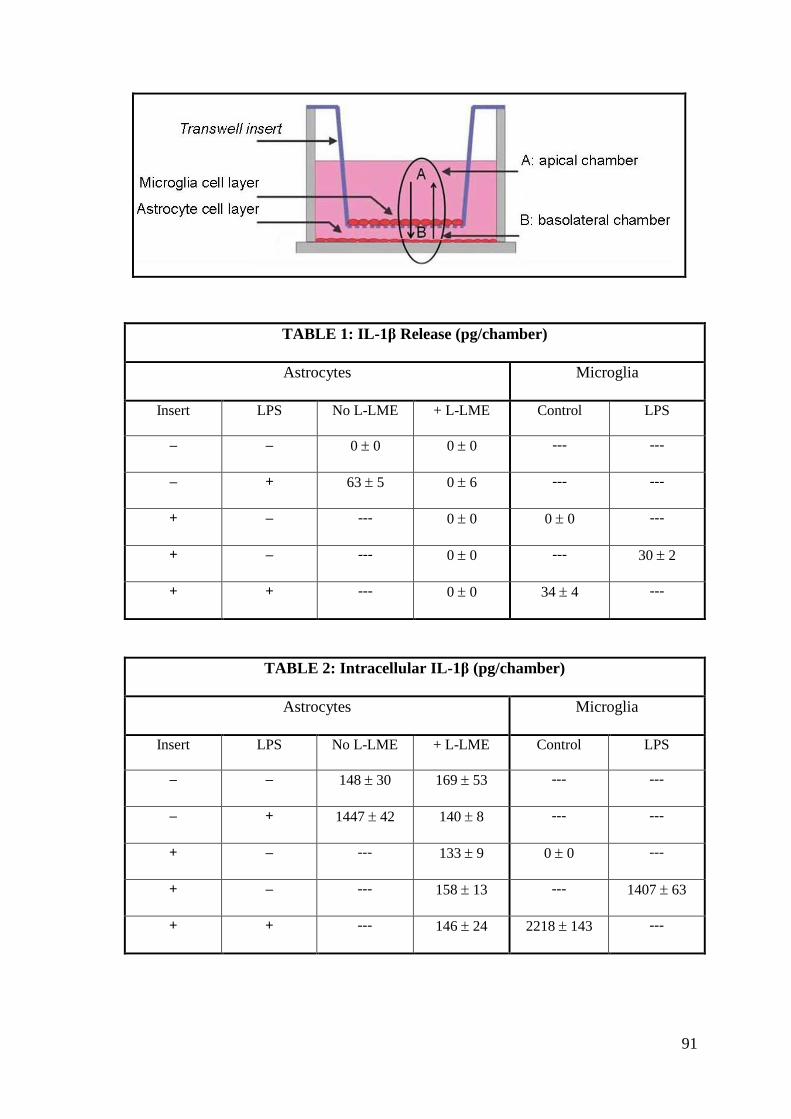
91
TABLE 1: IL-1β Release (pg/chamber)
Astrocytes Microglia
Insert LPS No L-LME + L-LME Control LPS
– – 0 0 0 0 --- ---
– + 63 5 0 6 --- ---
+ – --- 0 0 0 0 ---
+ – --- 0 0 --- 30 2
+ + --- 0 0 34 4 ---
TABLE 2: Intracellular IL-1β (pg/chamber)
Astrocytes Microglia
Insert LPS No L-LME + L-LME Control LPS
– – 148 30 169 53 --- ---
– + 1447 42 140 8 --- ---
+ – --- 133 9 0 0 ---
+ – --- 158 13 --- 1407 63
+ + --- 146 24 2218 143 ---

92
93
5.DISCUSSION
Toll-like receptors (TLRs) are best known for recognizing pathogens and
initiating an innate immune response to protect the host. However, they
also detect tissue damage and induce sterile inflammation upon the binding
of endogenous ligands released by stressed or injured cells (Heiman et al.,
2014) (Tables 2 and 3).
In the CNS, microglia are the best-characterized cell type expressing
TLRs. They constantly survey their environment and can rapidly switch to
an “activated” phenotype, producing factors that influence surrounding
astrocytes. Upon coming into contact with a danger signal microglia undergo
activation, a process which induces engagement of other immune system
cells and repair. Left unchecked, protracted inflammatory stimuli lead to a
strong release of pro-inflammatory factors and consequent neuron cell
death (Glass et al., 2010). Astrocytes, the predominant CNS cell type, also
become reactive following injury and have been implicated in the
pathogenesis of CNS inflammation (Sofroniew and Vinters, 2010; John et
al., 2005; Medeiros and Laferla, 2013) and neuropathic pain (Chen et al.,
2012). As succinctly stated by Nathan and Ding (2010), "The problem with
inflammation is not how often it starts, but how often it fails to subside".
The interplay between astrocytes and microglia and their associated pro-
inflammatory environment is, no doubt, a key element in the pathogenesis
of chronic pain and neuropathic pain, neurodegenerative diseases, stroke,
spinal cord injury, and perhaps even neuropsychiatric disorders (Carson et
al., 2006; Melchior et al., 2006; Herbert et al., 2005).
94
In the present study we used a series of TLR subtype-selective agonists
(LPS for TLR4, zymosan for TLR2 and poly(I:C) for TLR3) to generate a
glial cell-based experimental in vitro model of neuroinflammation, which can
be applied to investigate the induction and release of pro-inflammatory
mediators upon TLR activation.
Cortical purified microglia subjected to pathogenic stimuli responded
already by 6 hours with the production of mRNAs coding for pro-
inflammatory genes. After a longer stimulation period, all mRNAs were
translated into the respective cytokine polypeptide which was released into
the culture medium. Furthermore, these TLR ligands were capable of
modulating the expression of both cell surface (TLR2/TLR4) and endosomal
membrane (TLR3) TLRs. This modulation following TLR ligand presentation
could be the consequence of several factors. Indeed, it was possible to
observe both pre-existent protein level modulation (internalization/ligand-
binding/receptor degradation/receptor exposition) and genetic regulation
(up- or down-regulation of mRNAs coding for TLRs).
Intriguingly, not only did a given TLR ligand modulate its own receptor’s
expression, but also that of other TLRs as well. This last result proposes
the existence of a cross-talk mechanism in the TLR pathway(s) which may
have important consequences for how multiple TLR isoforms respond to
stress/injury, for example as in neuropathic pain. Enriched astrocytes from
rat cortex were responsive to all TLR agonists, as well, with induction of
the genes for IL-1β, IL-6 and TNF-α.
The above findings obtained with ex vivo glial cell systems illustrate a
widely-utilized approach to investigate activation of these cell types during
inflammatory processes, and are often preferred over in vivo analysis
95
because of the latter’s complexity. While microglia can be easily obtained
as a highly purified (>99%) cell population (as demonstrated in this project),
achieving highly purified astrocyte cultures is more difficult owing to
minor, and variable, percentages of residual contaminating microglia (Saura,
2007).
In order to study astrocyte behaviours without potential interference
from contaminating microglia, L-LME was used to deplete the enriched
astrocyte monolayers of residual microglia. Microglia depletion was
confirmed by the disappearance of Iba-1 gene and protein expression from
these cultures.
L-LME treatment abolished TLR agonist induction and release of pro-
inflammatory cytokines from cortical astrocytes. We asked if this
unresponsiveness by nominally microglia-free astrocytes in terms of IL-1β,
IL-6 and TNF-α gene expression, upon TLR-ligand engagement, could be due
to possible alteration/absence of the cognate cell surface receptor
complex. In contrast to microglia, TLR4 expression by astrocytes remains
an open question. Farina and colleagues (2005) have demonstrated TLR4
cell surface expression in vitro while other groups (Laflamme and Rivest,
2001; Lehnardt et al., 2002; 2003) described the presence of TLR4 in vivo.
In the present study, astrocytes striped of microglia and incubated with a
fluorescent LPS showed co-localization of immunoreactivity for GFAP and
the TLR4-specific ligand. In addition, it was possible to demonstrate the
presence of the TLR4 co-receptors MD2 and CD14. Moreover, purified
astrocytes challenged with TLR agonists responded with a modulation of
both its cognate receptor as well as other TLRs. These results are
important in that they place astrocytes in the context of the inflammatory
96
process by being able to detect and respond to pro-inflammatory signals
even though they do not produce pro-inflammatory mediators – at least
those evaluated in this study.
It is worth stressing the point that numerous studies have described the
use of astrocyte-enriched cultures to study their capability to elaborate
inflammation-related molecules, e.g. cytokines, chemokines, and adhesion
molecules (Saura, 2007). In the present study, we clearly demonstrate that
oftentimes these reports wrongly assume that astrocytes are the cell type
responsible for the observed effect. Rather, the effects may well be due
to a minor population of contaminating microglia. To further emphasize this
view, we performed experiments whereby fixed numbers of purified
microglia (10% of contaminating cells final) were introduced to cultures of
(L-LME) purified astrocytes. Doing so restored TLR responsiveness of the
latter in terms of IL-1β, IL-6 and TNF-α gene expression.
The TLR agonist responsiveness of these microglia-astrocyte co-cultures
was evident also at the level of mediator release. When an equivalent
number of microglia alone was challenged with a given TLR agonist cytokine
output (in terms of absolute amount) into the culture medium was
surprisingly less than the amount released when the same number of
microglia had been added to the astrocytes. These data show that
astrocytes alone are unable to respond when challenged with exogenous
TLR2/3/4 ligands. The fact that the response was more robust when
microglia were in the presence of astrocytes suggests the existence of a
synergism between astrocytes and microglia. It bears noting that although
the 'co-cultures' express pro-inflammatory cytokines after TLR agonist
stimulation, the absolute levels are inferior to those measured in enriched
97
astrocytes (<5% of contaminating microglia) – that latter having far fewer
microglia than the numbers added to reconstitute the co-culture.
Conceivably, microglia which are ‘nurtured’ by astrocytes may be more
responsive to an inflammatory stimulus than cultures in which the microglia
are chemically ‘stripped’ and then re-introduced. This tenet, if upheld in
vivo has important implications for how these two glial cell types may
interact in pathology.
To further address the issue of whether microglial cell activation in the
presence of astrocytes results from either physical interaction between
cell membranes or chemical induction mediated by the release of
mediator(s) into the culture medium, a “Transwell insert” system was used.
In our study we pointed to a lack of soluble astrocyte-derived factors as
being responsible for imparting LPS sensitivity to microglia in terms of
mediator release, suggesting instead a role for physical contact between
these two cell populations. The presence of LPS in the lower chamber
resulted in IL-1β release by microglia (plated in the upper chamber,
indicating trans-chamber LPS passage) but this release did not influence
IL-1β expression by purified astrocytes, either extra- or intracellularly.
The molecular basis for the observed astrocyte-microglia interaction
remains to be clarified.
In conclusion, the astrocyte/microglia co-culture paradigm described here
may represent a useful starting point to elucidate the cross-talk
mechanisms underlying astrocyte- and microglia-specific responses after
TLR activation during, although not limited to, CNS inflammation.
To more fully understand how glial cells respond to inflammatory stimuli,
future studies could explore intracellular signal transduction pathways.
98
Microglia themselves respond to TLR agonists, undergoing activation to
release cytokines. Since purified astrocytes express TLRs - at least those
evaluated in this study - but do not elaborate either transcription or
translation for IL-1β, IL-6 and TNF-α, it is possible to speculate a
different regulation of NF-kB, IRF3 or IRF7 signalling. It is even
conceivable that transcription factor activation is under unknown control
mechanisms or, alternatively, astrocytes might need a further signal(s) to
induce activation. In spite of the large amount of data published to date,
this field of research has much to reveal still.
99
6. REFERENCES
Alexopoulou L, Holt AC, Medzhitov R & Flavell RA “Recognition of double-
stranded RNA and activation of NF-kappaB by Toll-like receptor 3”,
Nature (2001) 413, 732-738
Allen NJ, Barres BA, “Glia-more than just a glue”, Neuroscience (2009)
457: 675-677
Aloisi F. “Immune function of microglia”, Glia (2001) 36:165–179.
Arbour NC, Lorenz E, Schutte BC, Zabner J, Kline JN, Jones M, Frees K,
Watt JL, Schwartz DA, ”TLR4 mutations are associated with endotoxin
hyporesponsiveness in humans”, Nat Genet (2000) 25:187–191
Babb A. and Carlson WO,“Vertebral compression fractures: treatment and
evaluation” , S. D. Med. (2006) 59, 343–345
Barbalat R, Lau L, Locksley RM, Barton GM; “Toll-like receptor 2 on
inflammatory monocytes induces type I interferon in response to viral
but not bacterial ligands”, Nat Immunol (2009)
Barbierato M, Facci L, Argentini C, Marinelli C, Skaper SD, Giusti P
“Astrocyte-microglia cooperation in the expression of a pro-
inflammatory phenotype”, CNS Neurol. Disord. Drug Targets (2013) 12,
608-618
Barton GM, Kagan, JC & Medzhitov R, “Intracellular localization of Toll-like
receptor 9 prevents recognition of self DNA but facilitates access to
viral DNA”, Nat. Immunol. (2006) 7, 49–56
Becher B, Antel JP, “Comparison of phenotypic and functional properties of
immediately ex vivo and cultured human adult microglia”, Glia (1996) 18,
1-10.
Beers MH and Kaplan JL,“The Merck Manual of Diagnosis and Therapy”,
Merck Sharp & Dohme, Whitehouse Station, (2006), NJ
Ben-Hur T, Ben-Menachem O, Furer V, Einstein O, Mizrachi-Kol R and
Grigoriadis N, “Effects of proinflammatory cytokines on the growth,
fate and motility of multipotential neural precursor cells”, Mol. Cell.
Neurosci. (2003) 24, 623–631
Bianco F, Pravettoni E, Colombo A, Schenk U, Moller T, Matteoli M,
“Astrocytes- derived ATP induces vesicle shedding and IL-1β release
from microglia”, J Immunol (2005); 174(11):7268–77.
Bolmont T, Haiss F, Eicke D, Radde R, Mathis CA, Klunk WE, Kohsaka S,
Jucker M and Calhoun ME “Dynamics of the microglial/amyloid
100
interaction indicate a role in plaque maintenance”, J. Neurosci. (2008)
28, 4283–4292
Bornemann KD, Wiederhold KH, Pauli C, Ermini F, Stalder M, Schnell L,
Sommer B, Jucker M and Staufenbiel M “Aβ -induced inflammatory
processes in microglia cells of APP23 transgenic mice”, Am. J. Pathol.
(2001) 158, 63–73
Botelho RJ, Teruel M, Dierckman R, Anderson R, Wells A, York JD, Meyer
T, Grinstein S; “Localized biphasic changes in phosphatidylinositol-4,5-
bisphosphate at sites of phagocytosis”, J Cell Biol (2000) 151:1353-
1368
Boucsein C., H. Kettenmann, C. Nolte, “Electrophysiological proper- ties of
microglial cells in normal and pathologic rat brain slices”, Eur. J.
Neurosci. 12 (2000) 2049 – 2058.
Bowman CC, Rasley A, Tranguch SL, Marriott I. “Cultured astrocytes
express Toll-like receptors for bacterial products”. Glia (2003); 43:281–
291.
Bradbury EJ and McMahon SB “Spinal cord repair strategies: why do they
work?” Nat. Rev. Neurosci. (2006) 7, 644–653
Bsibsi M, Ravid R, Gveric D, van Noort JM. “Broad expression of Toll-like
receptors in the human central nervous system”, J Neuropathol Exp
Neurol (2002);61:1013–1021.
Buljevac D, Flach HZ, Hop WC, Hijdra D, Laman JD, Savelkoul HF, van Der
Meche FG, van Doorn PA, Hintzen RQ. “Prospective study on the
relationship between infections and multiple sclerosis exacerbations”,
Brain (2002);125:952–960.
Carpentier PA, Begolka WS, Olson JK, Elhofy A, Karpus WJ, Miller SD.
“Differential activation of astrocytes by innate and adaptive immune
stimuli”, Glia (2005);49:360–374.
Carson MJ, Thrash JC, Walter B, “The cellular response in
neuroinflammation: The role of leukocytes, microglia and astrocytes in
neuronal death and survival”, Clin Neurosci Res (2006), 5: 237–245
Chauvet N, Palin K, Verrier D, Poole S, Dantzer R, Lestage J, “Rat
microglial cells secrete predominantly the precursor of interleukin-1β in
response to lipopolysaccharide”, Eur J Neurosci (2001), 14:609-617
Chen MJ, Kress B, Han X, Moll K, Peng W, Ji RR, Nedergaard M;
“Astrocytic CX43 hemichannels and gap junctions play a crucial role in
101
development of chronic neuropathic pain following spinal cord injury”,
Glia (2012) 60:1660-1670.
Colburn RW, Deleo JA, Rickman AJ, Yeager MP, Kwon P, Hickey WF.
“Dissociation of microglial activation and neuropathic pain behaviors
following peripheral nerve injury in the rat”. J Neuroimmuology
(1997);79(2):163–75.
Cotrina ML, Lin JH, Alves-Rodrigues A, Liu S, Li J, Azmi-Ghadimi H, et al.
“Connexins regulate calcium signaling by controlling ATP release”, Proc
Natl Acad Sci U S A (1998);95:15735–40.
Covacu R, Arvidsson L, Andersson A, Khademi M, Erlandsson-Harris H,
Harris RA, Svensson MA, Olsson T and Brundin L, “TLR activation
induces TNF-α production from adult neural stem/progenitor cells”, J.
Immunol. (2009) 182, 6889–6895
Cunningham C, Campion S, Lunnon K, Murray CL, Woods JF, Deacon R M,
Rawlins JN and Perry VH, “Systemic inflammation induces acute
behavioral and cognitive changes and accelerates neurodegenerative
disease”, Biol. Psychiatry (2009) 65, 304–312
Davalos D, Grutzendler J, Yang G, Kim JV, Zuo Y, Jung S, “ATP mediates
rapid microglial response to local brain injury in vivo”, Nat Neurosci
(2005);8(6):752–8.
Dong Y, Benveniste EN, “Immune function of astrocytes”, Glia
2001;36:180–190.
Dusart I and Schwab ME, , “Secondary cell death and the inflammatory
reaction after dorsal hemisection of the rat spinal cord”, Eur. J.
Neurosci. (1994)6, 712–724
Esen N, Kielian T, “Recognition of staphylococcus aureus-derived
peptidoglycan (PGN) but not intact bacteria is mediated by CD14 in
microglia”, J Neuroimmunol (2005) 170:93–104.
Fan MJ, Huang-Liu R, Shen CY, Ju DT, Lin YM, Pai P, Huang PY, Ho TJ, Tsai
FJ, Tsai CH, Huang CY, “Reduction of TLR4 mRNA stability and protein
expressions through inhibiting cytoplasmic translocation of HuR
transcription factor by E₂ and/or ERα in LPS-treated H9c2
cardiomyoblast cells”, Chin J Physiol. (2014); 57(1):8-18. doi:
10.4077/CJP.2014.BAC197.
Farber K, Kettenmann H, “Physiology of microglial cells”, Brain research
reviews 48 (2005) 133-143
102
Farina C, Krumbholz M, Giese T, Hartmann G, Aloisi F, Meinl E.
“Preferential expression and function of Toll-like receptor 3 in human
astrocytes”, J Neuroimmunol (2005) 159:12–19.
Fehlings M. G. and Sekhon L. H. “Acute interventions in spinal cord injury:
what do we know, what should we do?”, Clin. Neurosurg. (2001) 48, 226–
242
Ferrari D, Chiozzi P, Falzoni S, Hanau S, Di Virgilio F, “Purinergic
modulation of interleukin-1 beta release from microglial cells stimu-
lated with bacterial endotoxin”, J. Exp. Med. 185 (1997) 579 – 582
Finsen B, Jensen MB, Lomholt ND, Hegelund IV, Poulsen FR, Owens T.
“Axotomy-induced glial reactions in normal and cytokine transgenic
mice”. Adv Exp Med Biol (1999) 468:157–171.
Ford A. L., Goodsall A. L., Hickey W. F., Sedgwick J. D. “Normal ramified
microglia separated from other central nervous system macrophages by
flow cytometric sorting”, J. Immunol. (1995) 154, 4309-4321.
Gao YJ, Ji RR. “Chemokines, neuronal-glial interactions, and central
processing of neuropathic pain”, Pharmacol Ther (2010); 126:56-68.
Gehrmann J., G.W. Kreutzberg, “Characterisation of two new mono-clonal
antibodies directed against rat microglia”, J. Comp. Neurol. (1991) 313:
409–430.
Giulian D, Baker TJ, Shih LC, “Interleukin 1 of the central nervous system
is produced by ameboid microglia”, J Exp Med. (1986); 164(2):594-604.
Giulian D, Vaca K., Corpuz M, ”Brain glia release factors with opposing
actions upon neuronal serviva”, J Neurosci (1993)13:29-37
Glass CK, Saijo K, Winner B, Marchetto MC, Gage FH, “Mechanisms
Underlying Inflammation in Neurodegeneration”, Cell (2010) 140(6): 918–
934
Graeber MB, Banati RB, Streit WJ, Kreutzberg GW “Immunophenotypic
characterization of rat brain macrophages in culture”. Neurosci. Lett.
(1989) 103, 241-246.
Graeber MB, Streit WJ, Kiefer R, Schoen SW, Kreutzberg GW “New
expression of myelomonocytic antigens by microglia and perivascular
cells following lethal motor neurone injury”, J. Neuroimmunol. (1990) 27,
121-131.
Graeber MB, Streit WJ, Kreutzberg GW, “Axotomy of the rat facial nerve
leads to increased CR3 complement receptor expression by activated
microglial cells”, J. Neurosci. Res. 211 (1988) 8–24.
103
Graeber MB, Streit WJ, Kreutzberg GW, “Identity of ED2-posi- tive
perivascular cells in rat brain”, J. Neurosci. Res. 22 (1989), 103–
106.
Guan X, Cravatt BF, Ehring GR, Hall JE, Boger DL, Lerner RA, “The sleep-
inducing lipid oleamide deconvolutes gap junction communication and
calcium wave transmission in glial cells”, J Cell Biol (1997), 139:1785–
92.
Guillemin G, Boussin FD, Croitoru J, Franck-Duchenne M, Le Grand R,
Lazarini F, “Obtention and characterization of primary astrocyte and
microglial cultures from adult monkey brains”, J Neurosci Res, (1997),
49:576-591
Hamby ME, Uliasz TF, Hewett SJ, Hewett JA, “Characterization of an
improved procedure for the removal of microglia from confluent
monolayers of primary astrocytes”, J Neurosci Methods. (2006);
150(1):128-37
Hanisch UK. “Microglia as a source and target of cytokines”, Glia
(2002);40:140–155.
Hanke ML, Kelian T., “Toll-like receptors in health and disease in the brain:
mechanisms and therapeutic potential”, Clinical Science (2011) 121,
367–387
Hasan U, Chaffois C, Gaillard C, Saulnier V, Merck E, Tancredi S, Guiet C,
Briere F, Vlach J, Lebecque S, Trinchieri G, Bates EE. “Human TLR10 is
a functional receptor, expressed by B cells and plasmacytoid dendritic
cells, which activates gene transcription through MyD88”, J Immunol
(2005) 174:2942–2950.
Herbert MR, “Large brains in autism: the challenge of pervasive
abnormality”, Neuroscientist (2005);11 (5):417–40
Hewett S.J. “Interferon-gamma reduces cyclooxygenase-2-mediated
prostaglandin E2 production from primary mouse astrocytes
independent of nitric oxide formation”, J. Neuroimmunol. (1999),
94, 134-143.
Hide I, Tanaka M, Inoue A, Nakajima K, Kohsaka S, Inoue K, “Extracellular
ATP triggers tumor necrosis factor-alpha release from rat microglia”,
J Neurochem (2000);75(3):965–72.
Hirschfeld M, Ma Y, Weis JH, Vogel SN, Weis JJ. “Cutting edge:
repurification of lipopolysaccharide eliminates signaling through both
human and murine Toll-like receptor 2”, J Immunol (2000);165:618– 622.
104
Honda K, Yanai H, Mizutani T, Negishi H, Shimada N, Suzuki N, Ohba Y,
Takaoka A, Yeh WC, Taniguchi T; “Role of a transductional-
transcriptional processor complex involving MyD88 and IRF-7 in Toll-like
receptor signaling”, Proc Natl Acad Sci U S A (2004), 101:15416-15421.
Honda S, Sasaki Y, Ohsawa K, Imai Y, Nakamura Y, Inoue K, “Extracellular
ATP or ADP induce chemotaxis of cultured microglia through Gi/o-
coupled P2Y receptors”, J Neurosci (2001);21(6):1975–82.
Honda S., S. Kohsaka, “Regulation of microglial cell function by ATP”, Nihon
Shinkei Seishin Yakurigaku Zasshi 21 (2001) 89 – 93.
Hooper C., Taylor D L., Pocock J. M, “Pure albumin is a potent trigger of
calcium signalling and proliferation in microglia but not macrophages or
astrocytes”, J. Neurochem. (2005) 92, 1363-1376.
Husebye H, Halaas O, Stenmark H, Tunheim G, Sandanger O, Bogen B,
Brech A, Latz E, Espevik T, “Endocytic pathways regulate Toll-like
receptor 4 signaling and link innate and adaptive immunity”, EMBO J
(2006), 25:683-692.
Hyakkoku K, Hamanaka J, Tsuruma K, Shimazawa M, Tanaka H, Uematsu S,
Akira S, Inagaki N, Nagai H and Hara H, “Toll-like receptor 4 (TLR4),
but not TLR3 or TLR9, knock-out mice have neuroprotective effects
against focal cerebral ischemia”, Neuroscience (2010), 171, 258–267
Ichikawa HT, Williams LP, Segal BM. “Activation of APCs through CD40 or
Toll-like receptor 9 overcomes tolerance and precipitates autoimmune
disease”, J Immunol (2002) 169:2781–2787.
Ip WK, Takahashi K, Moore KJ, Stuart LM, Ezekowitz RA; “Mannose-
binding lectin enhances Toll-like receptors 2 and 6 signaling from the
phagosome”, J Exp Med (2008) 205:169-181
Ito D, Imai Y, Ohsawa K, Nakayama K, Fukuuchi Y, Kohsaka S; “Microglia-
specific localization of a novel calcium binding proteion, Iba1”;
Molecular Brain Research 57 (1998) 1–9
Jackson AB, Dijkers M, DeVivo MJ and Poczatek RB, “A demographic
profile of new traumatic spinal cord injuries: change and stability over
30 years”, Arch. Phys. Med. Rehabil. (2004), 85, 1740–1748
Jensen MB, Finsen B, Zimmer J, “Morphological and immunophenotypic
microglial changes in the denervated fascia dentata of adult rats:
correlation with blood-brain barrier damage and astroglial reactions”,
Exp Neurol (1997) 143:103–116.
105
Jensen MB, Hegelund IV, Poulsen FR, Owens T, Zimmer J, Finsen B.
“Microglial reactivity correlates to the density and the myelination of
the anterogradely degenerating axons and terminals following perforant
path denervation of the mouse fascia dentate”, Neuroscience (1999)
93:507–518.
Ji JF, He BP, Dheen ST and Tay SS, “Expression of chemokine receptors
CXCR4, CCR2, CCR5 and CX3CR1 in neural progenitor cells isolated from
the subventricular zone of the adult rat brain”, Neurosci. Lett. (2004),
355, 236–240
Jin J, Kim HD, Maxwell JA, Li L and Fukuchi K, “Toll-like receptor 4-
dependent upregulation of cytokines in a transgenic mouse model of
Alzheimer’s disease”, J. Neuroinflammation (2008), 5, 23
John GR, Lee SC, Song X, Rivieccio M, Brosnan CF; “IL-1-regulated
responses in astrocytes: relevance to injury and recovery”, Glia (2005),
49(2):161–76.
John GR, Lee SC, Song X, Rivieccio M, Brosnan CF; “IL-1β-regulated
responses in astrocytes: relevance to injury and recovery”, Glia (2005)
49:161-176
Johnsen IB, Nguyen TT, Ringdal M, Tryggestad AM, Bakke O, Lien E,
Espevik T, Anthonsen MW; “Toll-like receptor 3 associates with c-Src
tyrosine kinase on endosomes to initiate antiviral signaling”, EMBO J
(2006), 25:3335-3346.
Kagen JC, Su T, Horng T, Chow A, Akira S, Medzhitov R; “TRAM couples
endocytosis of Toll-like receptor 4 to the induction of interferon-
beta”, Nat Immunol (2008) 9:361-368.
Kariko K, Weissman D, Welsh FA. “Inhibition of Toll-like receptor and
cytokine signaling—a unifying theme in ischemic tolerance”, J Cereb
Blood Flow Metab (2004) 24:1288–1304
Kawai T, Akira S, “The role of pattern-recognition receptors in innate
immunity: update on Toll-like receptors”, Nature Immunology (2010) 11:
373-384
Kawai T, Akira S, “TLR signaling”. Cell Death Differ (2006), 13:816-825
Kawai T, Akira S, “Toll-like receptors and their crosstalk with other innate
receptors in infection and immunity”, Immunity (2011) 34:637-650
Keohane A, Ryan S, Maloney E, Sullivan AM and Nolan YM, “Tumour
necrosis factor-α impairs neuronal differentiation but not proliferation
106
of hippocampal neural precursor cells: role of Hes1”, Mol. Cell. Neurosci.
(2010), 43, 127–135
Kerfoot SM, Long EM, Hickey MJ, Andonegui G, Lapointe BM, Zanardo RC,
Bonder C, James WG, Robbins SM, Kubes P. “TLR4 contributes to
disease-inducing mechanisms resulting in central nervous system
autoimmune disease”, J Immunol (2004) 173:7070–7077.
Kettenmann H, Hanisch UK, Noda M & Verkhratsky A, “Physiology of
microglia“, Physiol. Rev. (2011), 91, 461–553
Kettenmann H, Verkhratsky A. “Neuroglia: the 150 years after”, Trends
Neurosci (2008); 31(12): 653–9.
Kielian T, Esen N, Bearden ED, “Toll-like receptor 2 (TLR2) is pivotal for
recognition of S. aureus peptidoglycan but not intact bacteria by
microglia”, Glia (2005) 49:567–576.
Kielian T, Mayes P, Kielian M. “Characterization of microglial responses to
Staphylococcus aureus: effects on cytokine, costimulatory molecule, and
Toll-like receptor expression”, J Neuroimmunol (2002) 130:86–99.
Kielian T., “Toll-Like Receptors in Central Nervous System Glial
Inflammation and Homeostasis”, J Neurosci Res. (2006) 83: 711–730.
Kim D, Kim MA, Cho IH, Kim MS, Lee S, Jo EK, Choi SY, Park K, Kim JS,
Akira S, Na HS, Oh SB, Lee SJ. “A critical role of toll-like receptor 2 in
nerve injury-induced spinal cord glial cell activation and pain
hypersensitivity”, J. Biol. Chem. (2007), 282, 14975-14983
Kim SU, De Vellis J. “Microglia in health and disease”, J Neurosci Res
(2005); 81(3):302–13.
Kim BW and Son H, “Neural cell adhesion mole-cule (NCAM) induces
neuronal phenotype acquisition in dominant negative MEK1-expressing
hippocampal neural progenitor cells”, Exp. Mol. Med. (2006), 38, 732–
738
Kingham PJ, Cuzner ML, Pocock JM, “Apoptotic pathways mobilized in
microglia and neurones as a consequence of chromogranin A-induced
microglial activation”, J. Neurochem. (1999), 73, 538-547.
Kitamura Y, Kakimura J, Koike H, Umeki M, Gebicke-Haerter PJ, Nomura Y,
Taniguchi T. “Effects of 15-deoxy-delta(12,14) prostaglandin J and
interleukin-4 in Toll-like receptor-4-mutant glial cells”, Eur J Pharmacol
(2001) 411:223–230.
Kreutzberg GW, “Microglia: a sensor for pathological events in the CNS”,
Trends Neurosci (1996); 19(8):312–8.
107
Kroner A, Vogel F, Kolb-Maurer A, Kruse N, Toyka KV, Hemmer B,
Rieckmann P, Maurer M., “Impact of the Asp299Gly polymorphism in the
Toll-like receptor 4 (tlr-4) gene on disease course of multiple sclerosis”,
J Neuroimmunol (2005) 165:161–165.
Kuhn A., F.K. van Landeghem, R. Zacharias, K. F7rber, A. Rappert, S.
Pavlovic, A. Hoffmann, C. Nolte, H. Kettenmann, “Microglia express
GABA(B) receptors to modulate interleukin release”, Mol. Cell. Neurosci.
25 (2004) 312 – 322.
Laflamme N, Echchannaoui H, Landmann R, Rivest S. “Cooperation between
Toll-like receptor 2 and 4 in the brain of mice challenged with cell wall
components derived from gram-negative and gram- positive bacteria”,
Eur J Immunol (2003) 33:1127–1138.
Laflamme N, Rivest S. “Toll-like receptor 4: the missing link of the
cerebral innate immune response triggered by circulating gram-negative
bacterial cell wall components”. FASEB J (2001) 15:155–163.
Laflamme N, Soucy G, Rivest S. “Circulating cell wall components derived
from gram-negative, not gram- positive, bacteria cause a profound
induction of the gene-encoding Toll-like receptor 2 in the CNS”., J
Neurochem (2001) 79:648–657.
Latz E, Schoenemeyer A, Visintin A, Fitzgerald KA, Monks BG, Knetter
CF, Lien E, Nilsen NJ, Espevik T, Golenbock DT, “TLR9 signals after
translocating from the ER to CpG DNA in the lysosome”. Nat Immunol
(2004), 5:190-198.
Latz E, Visintin A, Lien E, Fitzgerald KA, Monks BG, Kurt-Jones EA,
Golenbock DT, Espevik T, “Lipopolysaccharide rapidly traffics to and
from the Golgi apparatus with the Toll-like receptor 4-MD-2-CD14
complex in a process that is distinct from the initiation of signal
transduction”, J Biol Chem (2002) 277:47834-47843.
Lawson LJ, Perry VH, Dri P, Gordon S, “Heterogeneity in the distribution
and morphology of microglia in the normal, adult mouse brain”,
Neuroscience 39 (1990), 151–170.
Lee H, Lee S, Cho IH, Lee SJ, “Toll-like receptors: sensor molecules for
detecting damage to the nervous system”, Curr Protein Pept Sci. (2013),
14(1):33-42.
Lehnardt S, Lachance C, Patrizi S, Lefebvre S, Follett PL, Jensen FE,
Rosenberg PA, Volpe JJ, Vartanian T. “The Toll-like receptor TLR4 is
108
necessary for lipopolysaccharide-induced oligodendrocyte injury in the
CNS”, J Neurosci (2002) 22:2478–2486.
Lehnardt S, Lehmann S, Kaul D, Tschimmel K, Hoffmann O, Cho S, Krueger
C, Nitsch R, Meisel A and Weber JR, “Toll-like receptor 2 mediates
CNS injury in focal cerebral ischemia”. J. Neuroimmunol. (2007), 190,
28–33
Lehnardt S, Massillon L, Follett P, Jensen FE, Ratan R, Rosenberg
PA, Volpe JJ, Vartanian T, ”Activation of innate immunity in the CNS
triggers neurodegeneration through a Toll-like receptor 4-dependent
pathway”, Proc Natl Acad Sci U S A. (2003); 100(14):8514-9.
Leifer CA, Brooks JC, Hoelzer K, Lopez J, Kennedy MN, Mazzoni A,
Segal DM, “Cytoplasmic targeting motifs control localization of Toll-like
receptor 9”, J Biol Chem (2006), 281:35585-35592.
Letiembre M, Hao W, Liu Y, Walter S, Mihaljevic I, Rivest S, Hartmann T
and Fassbender K, “Innate immune receptor expression in normal brain
aging”, Neuroscience (2007), 146, 248–254
Letiembre M, Liu Y, Walter S, Hao W, Pfander T, Wrede A, Schulz-
Schaeffer W and Fassbender K, “Screening of innate immune receptors
in neurodegenerative diseases: a similar pattern”, Neurobiol. Aging
(2009), 30, 759–768
Liu W, Tang Y, Feng J; “Cross talk between activation between microglia
and astrocytes in pathological conditions in the central nervous sytem”,
Life science 89 (2011), 141-146
Liu W, Wang CH, Cui Y, Mo LQ, Zhi JL, Sun SN, “Inhibition of neuronal
nitric oxide synthase antagonizes morphine antinociceptive tolerance by
decreasing activation of p38 MAPK in the spinal microglia”, Neurosci
Lett (2006), 410(3):174–7.
Lo D, Feng LL, Li L, Carson MJ, Crowley M, Pauza M, “Integrating innate and
adaptive immunity in the whole animal”, Immunol Rev (1999), 169:225–
39
Lorenz E, Frees KL, Schwartz DA, ”Determination of the TLR4 genotype
using allele-specific PCR”, Biotechniques (2001), 31:22–24.
Lotz M, Ebert S, Esselmann H, Iliev AI, Prinz M, Wiazewicz N, Wiltfang J,
Gerber J, Nau R, “Amyloid β peptide 1–40 enhances the action of Toll-
like receptor-2 and -4 agonists but antagonizes Toll-like eceptor-9-
induced inflammation in primary mouse microglial cell cultures”, J
Neurochem (2005) 94:289–298.
http://www.ncbi.nlm.nih.gov/pubmed/?term=Massillon%20L%5BAuthor%5D&cauthor=true&cauthor_uid=12824464
109
McGettrick AF, O’Neill LAJ; “Localisation and trafficking of Toll-like
receptors: an important mode of regulation”, Current opinion in
Immunology (2010), 22:20–27
Medeiros and Laferla, “Astrocytes: conductors of the Alzheimer disease
neuroinflammatory symphony”; Exp Neurol (2013): 239:133-138
Medzhitov R, Janeway CA Jr, “Innate immune recognition and control of
adaptive immune responses”, Semin Immunol (1998);10(5):351–
Melchior JB, Puntambekar SS, Carson MJ, “Microglia and the control of
autoreactive T cell responses”, Neurochem Int (2006)
Miller KR and Streit WJ, “The effects of aging, injury and disease on
microglial function: a case for cellular senescence”, Neuron Glia Biol.
(2007), 3: 245–253
Nagai Y, Akashi S, Nagafuku M, Ogata M, Iwakura Y, Akira S, Kitamura T,
Kosugi A, Kimoto M, Miyake K; “Essential role of MD-2 in LPS
responsiveness and TLR4 distribution”, Nat Immunol (2002) 3:667-672.
Nagatsu T, Mogi M, Ichinose H, Togari A. “Changes in cytokines and
neurotrophins in Parkinson disease”, J Neural Transm (2000); Suppl
60:277-290.
Nakajima K, Kohsaka S, “Response of microglia to brain injury” in: H.
Kettenmann, B.R. Ransom (Eds.), Neuroglia, Oxford Univ. Press, (2004),
p. 443.
Nathan and Ding; “Nonresolving inflammation”; Cell (2010) 140, 871-882
Nedergaard M, Dirnagl U., “Role of glial cells in cerebral ischemia”, Glia
(2005); 50(4):281–6.
Ni HT, Hu S, Sheng WS, Olson JM, Cheeran MC, Chan AS, Lokensgard, JR
and Peterson PK, “High-level expression of functional chemokine
receptor CXCR4 on human neural precursor cells”, Brain Res. Dev. Brain
Res. (2004), 152, 159–169
Nilsen NJ, Deininger S, Nonstad U, Skjeldal F, Husebye H, Rodionov D,
von Aulock S, Hartung T, Lien E, Bakke O, “Cellular trafficking of
lipoteichoic acid and Toll-like receptor 2 in relation to signaling: role of
CD14 and CD36”, J Leukoc Biol (2008) 84:280-291.
Nishiya T, Kajita E, Miwa S, Defranco AL, “TLR3 and TLR7 are targeted to
the same intracellular compartments by distinct regulatory elements”,
J Biol Chem (2005), 280:37107-37117.
110
Noda M., H. Nakanishi, J. Nabekura, N. Akaike, “AMPA-kainate subtypes
of glutamate receptor in rat cerebral microglia”, J. Neurosci. 20 (2000)
251 – 258.
Nomura F, Akashi S, Sakao Y, Sato S, Kawai T, Matsumoto M, Nakanishi
K, Kimoto M, Miyake K, Takeda K, Akira S; “Cutting edge: endotoxin
tolerance in mouse peritoneal macrophages correlates with down-
regulation of surface toll-like receptor 4 expression”, J Immunol.
(2000) 1;164(7):3476-9.
Norenberg W, Cordes A, Blohbaum G, Frohlich R, Illes P, “Coexistence of
purino- and pyrimidinoceptors on activated rat microglial cells”. Br J
Pharmacol (1997); 121(6): 1087–98.
Obata K, Katsura H, Miyoshi K, Kondo T, Yamanaka H, Kobayashi K, Dai Y,
Fukuoka T, Akira S, Noguchi K, “Toll like receptor 3 contributes to
spinal glial activation and tactile allodynia after nerve injury”, J.
Neurochem. (2008) 105, 2249-2259
Okun E, Griffioe KJ, Son TG, Lee JH, Roberts NJ, Mughal MR, Hutchison
E, Cheng A, Arumugam TV, Lathia JD, “TLR2 activation inhibits
embryonic neural progenitor cell proliferation”, J. Neurochem. (2010),
114, 462–474
Okun E, Griffioen K, Barak B, Roberts NJ, Castro K, Pita MA, Cheng A,
Mughal MR, Wan R, Ashery U and Mattson MP, “Toll-like receptor 3
inhibits memory retention and constrains adult hippocampal
neurogenesis”, Proc. Natl. Acad. Sci. U.S.A. (2010), 107: 15625–15630
Okun E, Griffioen KJ, Lathia JD, Tang SC, Mattson MP, Arumugam TV.
“Toll-like receptors in neurodegeneration”, Brain Res. Rev. (2009), 59,
278-292
Olson JK, Miller SD; “Microglia initiate central nervous system innate and
adaptive immune responses through multiple TLRs”, J Immunol (2004)
173:3916–3924
Owens T. “Toll-like receptors on astrocytes: patterning for immunity”, J
Neuroimmunol (2005) 159:1–2.
Ozinsky A, Underhill DM, Fontenot JD, Hajjar AM, Smith KD, Wilson CB,
Schroeder L, Aderem A; “The repertoire for pattern recognition of
pathogens by the innate immune system is defined by cooperation
between Toll-like receptors”, Proc Natl Acad Sci U S A (2000)
97:13766-13771.
http://www.ncbi.nlm.nih.gov/pubmed/?term=Matsumoto%20M%5BAuthor%5D&cauthor=true&cauthor_uid=10725699
http://www.ncbi.nlm.nih.gov/pubmed/?term=Nakanishi%20K%5BAuthor%5D&cauthor=true&cauthor_uid=10725699
111
Ozinsky A, Underhill DM, Fontenot JD, Hajjar AM, Smith KD, Wilson CB,
Schroeder L, Aderem A, “The repertoire for pattern recognition of
pathogens by the innate immune system is defined by cooperation
between toll-like receptors”, Proc. Natl. Acad. Sci. USA (2000) 97,
13766-13771
Palsson-McDermott EM, Doyle SL, McGettrick AF, Hardy M, Husebye H,
Banahan K, Gong M, Golenbock D, Espevik T, O’Neill LA; “TAG, a splice
variant of the adaptor TRAM, negatively regulates the adaptor
MyD88-independent TLR4 pathway”, Nat Immunol (2009) 10:579-586.
Perera PY, Vogel SN, Detore GR, Haziot A, Goyert SM. “CD14-dependent
and CD14-independent signaling pathways in murine macrophages from
normal and CD14 knockout mice stimulated with lipopolysaccharide or
taxol”, J Immunol (1997) 158:4422–4429.
Perry VH, Hume DA, Gordon S, “Immunohistochemical localization of
macrophages and microglia in the adult and developing mouse brain”,
Neurosci. (1985), 15, 313-326.
Perry, V. H. & Gordon, S. “Macrophages and the nervous system”, Int. Rev.
Cytol. (1991), 125, 203–244
Popovich PG, Guan Z, McGaughy V, Fisher L, Hickey WF and Basso DM,
“The neuropathological and behavioral consequences of intraspinal
microglial/macrophage activation”, J. Neuropathol. Exp. Neurol. (2002),
61, 623–633
Prasad D and Schiff D, “Malignant spinal-cord compression”, Lancet Oncol.
(2005), 6, 15–24
Qin L, Li G, Qian X, Liu Y, Wu X, Liu B, Hong JS, Block ML. “Interactive
role of the Toll-like receptor 4 and reactive oxygen species in LPS-
induced microglia activation”, Glia (2005) 52:78–84.
Rapp NS, Gilroy J, Lerner AM. “Role of bacterial infection in exacerbation
of multiple sclerosis”, Am J Phys Med Rehabil (1995) 74:415–418.
Rasley A, Anguita J, Marriott I. “Borrelia burgdorferi induces
inflammatory mediator production by murine microglia”, J Neuroimmunol
(2002) 130:22–31.
Reindl M, Lutterotti A, Ingram J, Schanda K, Gassner C, Deisenhammer F,
Berger T, Lorenz E. “Mutations in the gene for Toll-like receptor 4 and
multiple sclerosis”, Tissue Antigens (2003) 61:85–88.
Ribes S, Adam N, Ebert S, Regen T, Bunkowski S, Hanish UK, Nau R, “The
viral TLR3 agonist poly(I:C) stimulates phagocytosis and intracellular
112
killing of Escherichia coli by microglial cells”, Neurosci Lett. (2010);
482(1):17-20
Rivest S, “Molecular insights on the cerebral innate immune system”, Brain
Behav Immun (2003) 17:13– 19.
Robinson AP, White TM, Mason DW, “Macrophage heterogene- ity in the
rat as delineated by two monoclonal antibodies MRC OX-41 and
MRS OX-42, the latter recognising complement receptor type 3”,
Immunology 57 (1986) 239–247.
Rolls A, Shechter R, London A, Ziv Y, Ronen A, Levy R and Schwartz M,
“Toll-like receptors modulate adult hippocampal neurogenesis”, Nat.
Cell Biol. (2007), 9, 1081–1088ù
Sajo k., Glass C, “Microglial cell origin and phenotypes in health and
disease”, Nature review (2011), 11: 775-787
Saura J, “Microglial cells in astroglial cultures: a cautionary note”, J
Neuroinflammation (2007), 4:26
Scemes E. “Components of astrocytic intercellular calcium signaling”, Mol
Neurobiol (2000), 22(1–3):167–79.
Schipke CG, Boucsein C, Ohlemeyer C, Kirchhoff F, Kettenmann H.
“Astrocytes Ca2+ waves trigger responses in microglial cells in brain
slices”, FASEB J (2002), 16(2): 255–7.
Schjetne KW, Thompson KM, Nilsen N, Flo TH, Fleckenstein B, Iversen
JG, Espevik T, Bogen B; “Cutting edge: link between innate and
adaptive immunity: Toll-like receptor 2 internalizes antigen for
presentation to CD4+ T cells and could be an efficient vaccine target”,
J Immunol (2003), 171:32-36.
Schonberg DL, Popovich PG and McTigue DM, “Oligodendrocyte generation
is differentially influenced by toll-like receptor (TLR) 2 and TLR4-
mediated intraspinal macrophage activation”, J. Neuropathol. Exp.
Neurol. (2007), 66, 1124–1135
Segal BM, Chang JT, Shevach EM. “CpG oligonucleotides are potent
adjuvants for the activation of autoreactive encephalitogenic T cells in
vivo”, J Immunol (2000), 164:5683–5688.
Shedid D and Benzel EC, “Cervical spondylosis anatomy: pathophysiology
and biomechanics”, Neurosurgery (2007), 60, S7–S13
Shigemoto-Mogami Y, Koizumi S, Tsuda M, Ohsawa K, Kohsaka S, Inoue K.
“Mechanisms underlying extracellular ATP-evoked interleukin-6 release
113
in mouse microglial cell line, MG-5”, J Neurochem (2001);78(6):1339–
49.
Shimazu R, Akashi S, Ogata H, Nagai Y, Fukudome K, Miyake K, Kimoto M:
“MD-2, a molecule that confers lipopolysaccharide responsiveness on
Toll-like receptor 4” , J Exp Med (1999) 189:1777-1782.
Sibley WA, Bamford CR, Clark K., “Clinical viral infections and multiple
sclerosis”, Lancet (1985) 1:1313–1315.
Sofroniew M, Vinters H, “Astrocytes: biology and pathology”, Acta
neuropathol (2010) 119: 7-35
Sofroniew MV and Vinters HV, “Astrocytes: biology and pathology”, Acta
neuropathol, (2010) 119:7-35
Steit WJ, “Microglial cells” in: H. Kettenmann, B.R. Ransom (Eds.),
Neuroglia, Oxford Univ. Press, New York, (2004), p. 60.
Suzuki T, Hide I, Ido K, Kohsaka S, Inoue K, Nakata Y, “Production and
release of neuroprotective tumor necrosis factor by P2X7 receptor-
activated microglia”, J Neurosci (2004), 24(1):1–7.
Suzuki T, Hide I, Ido K, Kohsaka S, Inoue K, Nakata Y, “Production and
release of neuroprotective tumor necrosis factor by P2X7 receptor-
activated microglia”, J Neurosci (2004), 24(1):1–7.
Takeuchi O, Kawaic T, Muhlradt PF, Morr M, Radolf JD, Zychlinsky A,
Takeda K, Akira S. “Discrimination of bacterial lipoproteins by Toll-like
receptor 6”, Int Immunol (2001), 13:933–940.
Takeuchi O, Sato S, Horiuchi T, Hoshino K, Takeda K, Dong Z, Modlin RL,
Akira S., “Cutting edge: role of Toll-like receptor 1 in mediating immune
response to microbial lipoproteins”, J Immunol (2002), 169:10–14
Tanaka KF, Kashima H, , Suzuki H, Ono K, Sawada M, “Existence of
functional beta1- and beta2-adrenergic receptors on microglia”, J.
Neurosci. Res. 70 (2002), 232 – 237.
Tang SC, Arumugam TV, Xu X, Cheng A, Mughal MR, Jo DG, Lathia JD,
Siler DA, Chigurupati S, Ouyang X,”Pivotal role for neuronal Toll-like
receptors in ischemic brain injury and functional deficits”, Proc. Natl.
Acad. Sci. U.S.A. (2007), 104, 13798–13803
Tanimura N, Saitoh S, Matsumoto F, Akashi-Takamura S, Miyake K, “Roles
for LPS-dependent interaction and relocation of TLR4 and TRAM in
TRIF-signaling”, Biochem Biophys Res Commun (2008), 368:94-99.
Tapping RI, Akashi S, Miyake K, Godowski PJ, Tobias PS, “Toll-like
receptor 4, but not Toll-like receptor 2, is a signaling receptor for
114
Escherichia and Salmonella lipopolysaccharides”, J Immunol (2000)
165:5780–5787.
Taylor DL, Diemel LT, Cuzner ML, Pocock JM, “Activation of group II
metabotropic glutamate receptors underlies microglial reactivity and
neurotoxicity following stimulation with chromogranin A, a peptide up-
regulated in Alzheimer’s disease”, J. Neurochem. 82 (2002) 1179 – 1191.
Thacker MA, Clark AK, Marchand F, McMahon SB. “Pathophysiology of
peripheral neuropathic pain: immune cells and molecules”, Anesth Analg
(2007); 105:838-847.
Thiele DL, Kurosaka M, Lipsky PE, “Phenotype of the accessory cell
necessary for mitogen-stimulated T and B cell responses in human
peripheral blood: delineation by its sensitivity to the lysosomotropic
agent, L-leucine methyl ester”, J Immunol (1983), 131:2282-2290
Thiele DL, Lipsky PE, “Mechanism of L-leucyl-L-leucine methyl ester-
mediated killing of cytotoxic lymphocytes: dependence on a lysosomal
thiol protease, dipeptidyl peptidase I, that is enriched in these cells”,
Proc Natl Acad Sci U S A. (1990); 87(1):83-7.
Thiele DL, Lipsky PE, “The action of leucyl-leucine methyl ester on
cytotoxic lymphocytes requires uptake by a novel dipeptide-specific
facilitated transport system and dipeptidyl peptidase I-mediated
conversion to membranolytic products”, J Exp Med. (1990); 172(1):183-
94.
Thomas WE, “Brain macrophages: evaluation of microglia and their
functions”, Brain Res. Rev. 17 (1992) 61–74.
Thuret S, Moon LD and Gage FH, “Therapeutic interventions after spinal
cord injury”, Nat. Rev. Neurosci. (2006), 7, 628–643
Triantafilou M, Miyake K, Golenbock DT, Triantafilou K, “Mediators of
innate immune recognition of bacteria concentrate in lipid rafts and
facilitate lipopolysaccharide-induced cell activation”, J Cell Sci (2002)
115:2603-2611
Tsan MF, Gao B. “Endogenous ligands of Toll-like receptors”, J Leukoc Biol
(2004) 76:514–519.
Underhill DM, Ozinsky A, Hajjar AM, Stevens A, Wilson CB, Bassetti M,
Aderem A, “The Toll-like receptor 2 is recruited to macrophage
phagosomes and discriminates between pathogens”, Nature (1999)
401:811-815.
115
Van Dam AM, Bauer J, Tilders FJ & Berkenbosch F, “Endotoxin-induced
appearance of immunoreactive interleukin-1 beta in ramified microglia in
rat brain: a light and electron microscopic study”, Neuroscience (1995),
65, 815-826
Verstrepen L, Bekaert T, Chau TL, Tavernier J, Chariot A, Beyaert R,
“TLR-4, IL-1R and TNF-R signaling to NF-kappaB: variations on a
common theme”. Cell Mol Life Sci (2008), 65:2964-2978.
Viriyakosol S, Kirkland T, Soldau K, Tobias P, “MD-2 binds to bacterial
lipopolysaccharide”, J Endotoxin Res (2000), 6:489–491.
Vollmar, P, Kullmann JS, Thilo B, Claussen MC, Rothhammer V, Jacobi H,
Sellner J, Nessler S, Korn T and Hemmer B, “Active immunization with
amyloid-β 1–42 impairs memory performance through TLR2/4-
dependent activation of the innate immune system”, J. Immunol. (2010),
185, 6338–6347
Waldner H, Collins M, Kuchroo VK. “Activation of antigen-presenting cells
by microbial products breaks self tolerance and induces autoimmune
disease”, J Clin Invest (2004), 113:990–997.
Wang DD, Bordey A, “The Astrocyte Odyssey”, Progress in neurobiology
(2008), 86: 342-367
Windheim M, Stafford M, Peggie M, Cohen P, “Interleukin-1 (IL-1) induces
the Lys63-linked polyubiquitination of IL-1 receptor- associated kinase 1
to facilitate NEMO binding and the activation of IkappaBalpha kinase”,
Mol Cell Biol (2008), 28:1783-1791.
Wong SW, Kwon MJ, Choi AM, Kim HP, Nakahira K, Hwang DH, “Fatty
acids modulate Toll-like receptor 4 activation through regulation of
receptor dimerization and recruitment into lipid rafts in a reactive
oxygen species-dependent manner”, J Biol Chem (2009), 284:27384-
27392
Yang RB, Mark MR, Gray A, Huang A, Xie MH, Zhang M, Goddard A, Wood
WI, Gurney AL, Godowski PJ. “Toll-like receptor-2 mediates
lipopolysaccharide-induced cellular signaling”, Nature (1998), 395:284–
288.
Yang RB, Mark MR, Gurney AL, Godowski PJ, “Signaling events induced by
lipopolysaccharide- activated Toll-like receptor 2”, J Immunol (1999),
163:639–643.
Yi AK, Tuetken R, Redford T, Waldschmidt M, Kirsch J, Krieg AM, “CpG
motifs in bacterial DNA activate leukocytes through the pH-dependent
116
generation of reactive oxygen species”, J Immunol (1998), 160:4755-
4761.
Zekki H, Feinstein DL, Rivest S, “The clinical course of experimental
autoimmune encephalomyelitis is associated with a profound and
sustained transcriptional activation of the genes encoding Toll-like
receptor 2 and CD14 in the mouse CNS”, Brain Pathol (2002), 12:308–
319.
Zhang D, Zhang G, Hayden MS, Greenblatt MB, Bussey C, Flavell RA, Ghosh
SA, “Toll-like receptor that prevents infection by uropathogenic
bacteria”, Science (2004), 303:1522–1526.
Ziegler G, Harhausen D, Schepers C, Hoffmann O, Rohr C, Prinz V, Konig J,
Lehrach H, Nietfeld W and Trendelenburg G, “TLR2 has a detrimental
role in mouse transient focal cerebral ischemia”, Biochem. Biophys. Res.
Commun. 3(2007), 59, 574–579
Zielasek and Hartung, “Molecular mechanisms of microglial activation”, Adv
Neuroimmunol. (1996); 6(2):191-22

117
7. Publications
Marinelli C, Facci L, Barbierato M, Argentini C, Giusti P and Stephen D. Skaper,
“Activation of Toll-Like receptors 2, -3 and -4 prime microglia from diverse
central nervous system regions for ATP-dependent interleukin-1β release”,
Federation of European Neuroscience Society, Biannual meeting 2014,
Abstract, Milano, Italy
Facci L, Barbierato M, Marinelli C, Argentini C, Skaper S, Giusti P, “Toll-Like
Receptors 2, -3 and -4 prime microglia but not astrocytes across central
nervous system regions for ATP-dependent interleukin-1β release”, Scientific
Reports (2014) 4:6824. doi: 10.1038/srep06824.
Barbierato M, Facci L, Argentini C, Marinelli C, Skaper SD, Giusti P,
“Astrocyte-microglia cooperation in the expression of a pro-inflammatory
phenotype”, CNS Neurol Disord Drug Targets, 2013;12(5):608-18
Curia G, Lucchi C, Vinet J, Gualtieri F, Marinelli C, Torsello A, Costantino L and
Biagini G; Pathophysiogenesis of mesial temporal lobe epilepsy: is prevention of
damage antiepileptogenic?”, Current Medicinal Chemistry (2014) 21(6):663-88.
Gualtieri F, Marinelli C, Longo D, Pugnaghi M, Nichelli PF, Meletti S, Biagini G,
“Hypoxia markers are expressed in interneurons exposed to recurrent
seizures”, Neuromolecular Med, 2013; 15(1):133-46.
Biagini G, Marinelli C, Panuccio G, Puia G, Avoli M; “Glia-neuron interactions:
neurosteroids and epileptogenesis”, Jasper's Basic Mechanisms of the
Epilepsies [Internet]. 4th edition. Bethesda (MD): National Center for
Biotechnology Information (US); 2012.
Gualtieri F, Curia G, Marinelli C, Biagini G, “Increased perivascular laminin
predicts damage to astrocytes in CA3 and piriform cortex following
chemoconvulsive treatments”, Neuroscience (2012), 218:278-94.