
Capitolo 58 MS and other inflammatory demyelinating disorders of the CNS E-book dott.ssa Tavazzi.

UNIVERSITÀ DEGLI STUDI DI TRIESTE
XXVI Ciclo del Dottorato di Ricerca
In Scienze della Riproduzione e dello Sviluppo
Indirizzo Genetico Molecolare
Genetic variation in HLA-G: its influence in
inflammatory autoimmune and viral diseases
MED/03 Genetica Medica
Dottoranda: Eulalia Catamo
Coordinatore: Prof.ssa Giuliana Decorti
Supervisore di tesi: Prof. Sergio Crovella
ANNO ACCADEMICO 2012-2013
ABSTRACT
The Human Leukocyte Antigen (HLA)-G present a physiological restricted tissue-specific
expression and an immuno-tolerogenic functions. The HLA-G expression has been associated with
various autoimmune and viral diseases. In this PhD project we analyzed the possible association
between genetic variant in the HLA-G gene, supposed to regulate HLA-G expression, and the
susceptibility to develop celiac disease, systemic lupus erythematosus, rheumatoid arthritis and
hepatitis C virus infection.
Furthermore, we analyzed if variations within the HLA-G promoter could alter its transcription, and
for this reason luciferase reporter gene assays was conducted.
The HLA-G 5’ upstream regulatory region (URR), 3’ untranslated region (UTR) and a cytosine
deletion at exon 3 (ΔC, HLA-G*0105N allele) were analyzed in 402 celiac patients and 509
controls from Italy; 114 systemic lupus erythematosus patients and 128 healthy controls from North
East Brazil; 127 rheumatoid arthritis patients and 128 controls from North East Brazil; and 286
Hepatitis C virus Caucasian patients and 285 controls from the same geographical area.
The luciferase reporter gene assay was used for the HLA-G promoter CCTAGGACCG,
CGTAGGACCG, CTTAGGACCG, TCGGTACGAA, TGGGTACGAA, TTGGTACGAA,
CCTAGGAGCG, CGTAGGAGCG, and CTTAGGAGCG haplotypes.
Several HLA-G SNPs and haplotypes were associated with the diseases analyzed.
By luciferase reporter gene assay, we found that the presence of polymorphisms in the HLA-G
promoter altered gene transcription, specifically -725 C allele was significantly associated with an
increased of the HLA-G transcription with respect to -725 G and T alleles in stress condition.
Our findings indicate an association between HLA-G gene polymorphisms and susceptibility to
diseases development, suggesting that HLA-G molecule is involved in the pathogenesis of the
diseases. Also, we can hypothesize that HLA-G gene is a stress-inducible gene and that the presence
of SNPs to the promoter alter levels of transcription of the gene.

ABSTRACT
L'antigene leucocitario umano (HLA)-G presenta, in condizioni fisiologiche, una ristretta
espressione tessuto-specifica ed ha funzione immuno-tollerogenica. Però, la presenza della
molecola HLA-G è stata associata a diverse patologie autoimmuni e virali.
In questo progetto di dottorato di ricerca abbiamo analizzato la possibile associazione tra la varianti
genetiche nel gene HLA-G, che si suppone regolino l'espressione di HLA-G, e la suscettibilità allo
sviluppo e al decorso della malattia celiaca, del lupus eritematoso sistemico, dell'artrite reumatoide
e dell'infezione dal virus dell'epatite C.
Inoltre, abbiamo analizzato se variazioni all'interno del promotore di HLA-G possano alterare la sua
trascrizione genica, a questo scopo è stato condotto il saggio della luciferasi.
Per gli studi di associazione sono stati analizzati 800 bp del promotore, l’intero 3’UTR e la
delezione di una citosina all’esone 3 (ΔC, allele HLA-G*0105N) in 402 pazienti celiaci e 509
controlli italiani; 114 pazienti con lupus eritematoso sistemico e 128 controlli sani provenienti dal
Nord -Est del Brasile, 127 pazienti con artrite reumatoide e 128 controlli dal Nord-Est del Brasile, e
286 pazienti caucasici HCV positivi e 285 controlli provenienti dalla stessa area geografica.
Il saggio della luciferasi è stato condotto su 9 diversi aplotipi al promotore del gene HLA-G:
CCTAGGACCG, CGTAGGACCG, CTTAGGACCG, TCGGTACGAA, TGGGTACGAA,
TTGGTACGAA, CCTAGGAGCG, CGTAGGAGCG, e CTTAGGAGCG.
Numerosi SNPs e aplotipi del gene HLA-G sono stati associati con le malattie analizzate.
Inoltre, il saggio della luciferasi ha permesso di constatare che la presenza di polimorfismi, nel
promotore del gene HLA-G, altera la trascrizione genica; nello specifico, in condizioni di stress,
l’allele -725 C era significativamente associato ad un aumento della trascrizione del gene rispetto
agli alleli -725 G e T.
I nostri i risultati indicano un'associazione tra i polimorfismi del gene HLA-G e la suscettibilità allo
sviluppo delle malattie studiate, suggerendo che molecola HLA-G è coinvolta nella patogenesi di
queste malattie. Inoltre, possiamo ipotizzare che il gene HLA-G sia un gene stress-inducibile e che
la presenza di SNPs al promotore alterati i livelli di trascrizione del gene.
INDEX
INTRODUCTION 1
1. MAJOR HISTOCOMPATIBILITY COMPLEX (MHC) 1
2. HUMAN LEUKOCYTE ANTIGEN (HLA)-G 1
2.1. Gene structure 2
2.2. HLA-G isoforms, alleles and polymorphisms 4
2.3. HLA-G functions 6
2.4. HLA-G expression and physiologic relevance 8
2.5. HLA-G polymorphisms and their impact on HLA-G expression 10
3. HLA-G AND DISEASE 11
3.1. Celiac disease 12
3.2. Systemic lupus erythematosus 14
3.3. Rheumatoid arthritis 17
3.4. Hepatitis C virus infection 19
AIMS 22
MATERIAL AND METHODS 23
1. PATIENTS AND CONTROLS 23
1.1. Celiac patients and controls 23
1.2. Systemic lupus erythematosus patients and controls 24
1.3. Rheumatoid arthritis patients and controls 25
1.4. Hepatitis C virus patients and controls 26
2. DNA EXTRACTION 27
3. HLA CLASS II MOLECULAR TYPING 27
4. HLA-G GENOTYPING 27
5. LUCIFERASE REPORTER GENE ASSAY 28
6. STATISTICAL ANALYSIS 30

RESULTS 31
1. ASSOCIATION STUDIES 31
1.1. Celiac disease 32
1.2. Systemic lupus erythematosus 40
1.3. Rheumatoid arthritis 44
1.4. Hepatitis C virus infection 50
2. LUCIFERASE REPORTER GENE ASSAY 53
DISCUSSION 57
CONCLUSIONS 66
1. ROLE OF THE HLA-G IN THE DEVELOPMENT OF
CELIAC DISEASE 66
2. ROLE OF THE HLA-G IN THE DEVELOPMENT OF
SYSTEMIC LUPUS ERYTHEMATOSUS AND IN THE
CLINICAL MANIFESTATION 66
3. ROLE OF THE HLA-G IN THE DEVELOPMENT OF
RHEUMATOID ARTHRITIS AND IN THE CLINICAL MANIFESTATION 67
4. ROLE OF THE HLA-G IN THE DEVELOPMENT OF HEPATITIS C VIRUS INFECTION 67
REFERENCES 69
1
INTRODUCTION
1. MAJOR HYSTOCOMPATIBILITY COMPLEX (MHC)
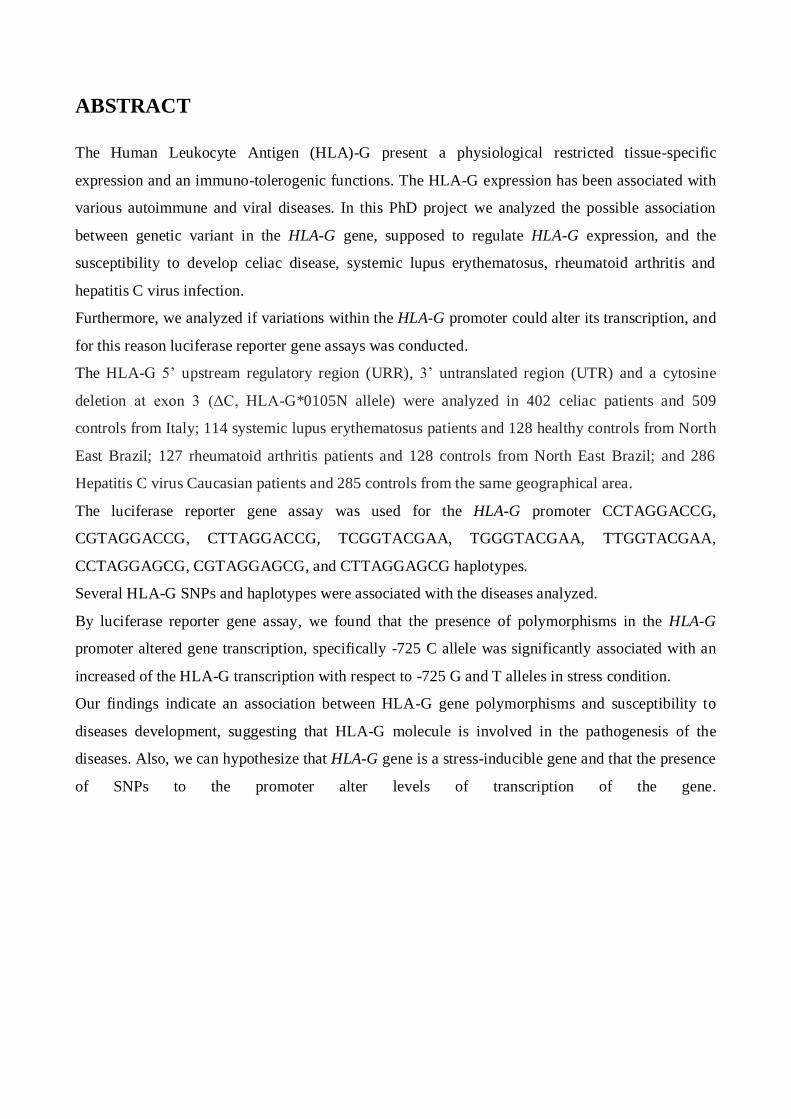
The MHC, also called Human Leukocyte Antigen (HLA), map on the short arm of chromosome 6
(6p21.3) and occupies a DNA segment of about 3500 Kb (Franeke U and Pellegrino M, 1977). This
multigene complex encodes several genes, including class Ia genes, HLA-A, -B and -C, that are
highly polymorphic; class Ib genes, HLA-E, -F and -G, with limited polymorphism; and class II
genes, HLA-DP, -DQ and -DR (Klein J, 1986; Geraghty DE, 1987) (Figure 1).
2. HUMAN LEUKOCYTE ANTIGEN (HLA)-G
The HLA-G gene is a nonclassical HLA class Ib gene together with HLA-E and -F (Geraghty DE,
1987) (Figure 1). The HLA-G gene differs from the classical class I HLA (-A, -B and -C) for the
gene structure, polymorphism, expression and function. Indeed, the HLA-G presents only 8 protein
variants with respect to 462 for HLA-A; the molecule has a marked tissue-specific expression,
especially at the level of trophoblast cell (Kovats S et al, 1990); and finally the HLA-G molecule
has immunosuppressive activities, rather than immunostimulatory ones (Riteau B, 1999; Riteau B,
2001; Fons P, 2006; LeMaoult J, 2007).
Figure 1: Gene map of the Major Histocompatibility Complex region
2
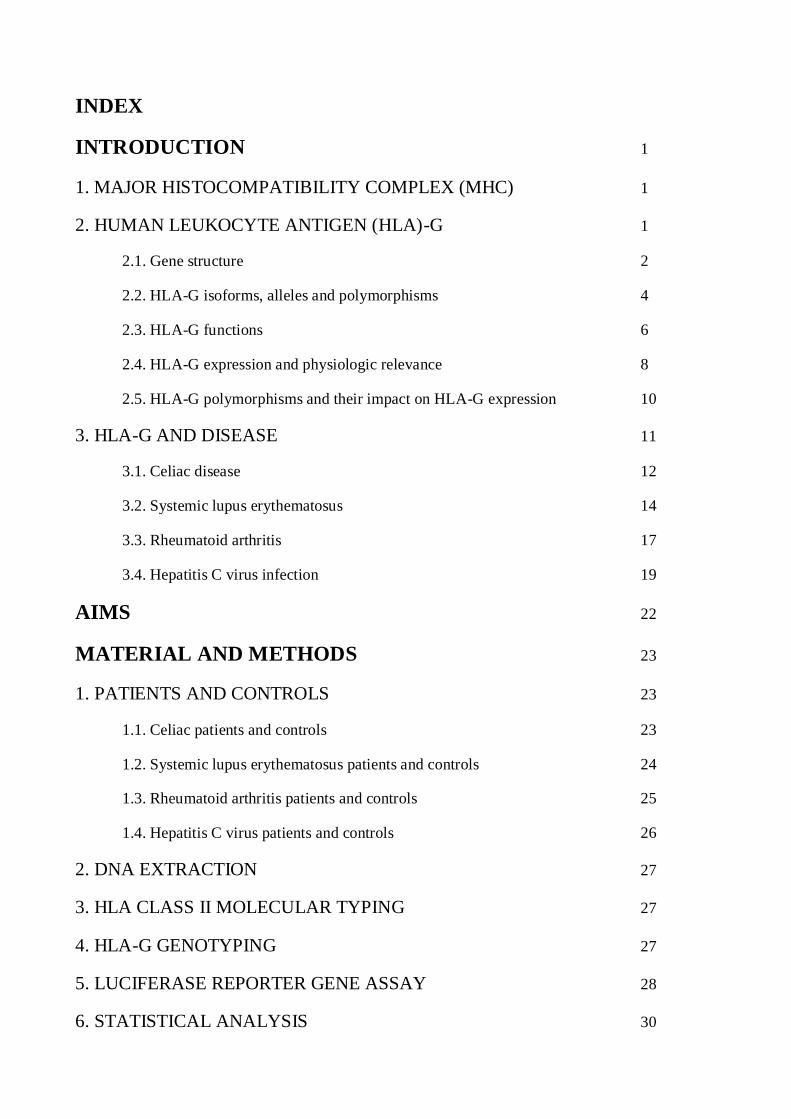
2.1 Gene Structure
The HLA-G gene is composed of 8 exons and 7 introns, presents a premature stop codon at exon 6
that leads to the formation of a short cytoplasmic tail and the heavy chain is approximately 45 kDa.
The gene has a 5’ upstream regulatory region (5’URR) consisting of 1.4 kb upstream the ATG
(Solier et al, 2001; Moreau et al, 2009) and a 3’ untranslated region (3’UTR) that consists of about
450 bp (Figure 2 and 3).
Figure 2: HLA-G gene structure
Exon 1 encodes the signal peptide, exons 2, 3 and 4 encode the extracellular α1, α2 and α3 domains
respectively, and the exons 5 and 6 encode the transmembrane and the cytoplasmic domain of the
heavy chain; exon 7 is not present in mature mRNA and the exon 8 is not translated (Carosella ED
et al, 2008a).
The HLA-G promoter is different compared to all other HLA genes, indeed it presents a modified
Enhancer A (enhA) and a deleted Interferon-Stimulated Regulatory Element (ISRE) that make the

3
promoter unresponsive to NF-kB (Gobin SJ et al. 1998) and to IFN-γ (Gobin SJ, et al. 1999). The
SXY module, usually consisting of S, X1, X2 and Y boxes in the classical HLA-class I genes,
presents only S and X1 boxes in the HLA-G gene (Rousseau P, 2000). Located at -1.2 kb from the
ATG codon there is a regulatory region that is critical for spatio-temporal HLA-G expression
(Schmidt CM et al., 1993); also in the HLA-G promoter two regulatory elements are present: two
cAMP response elements (CRE) (-934 and -770 from the ATG), that allow promoter transactivation
with the co-activators CREB binding protein (Gobin SJ et al. 2002). In addition, the HLA-G
promoter presents an ISRE motif located 744 bp upstream the ATG (Lefebvre S, et al, 2001) that
bind IFN-response factor 1 (IRF-1), which is supposed to allow the HLA-G promoter to respond to
stimulation by IFN-β (Lefebvre S, et al, 2001). At -459/-454 position a heat shock element (HSE) is
present that binds heat shock factor 1 (HSF-1) (Ibrahim EC et al, 2000). Finally, the ras responsive
element binding 1 factor (RREB-1) binds three ras response elements (RREs), located 1356, 142
and 53 bp upstream the ATG respectively, downregulating HLA-G transcription (Flajollet S, et al.
2009) (Figure 3).
4
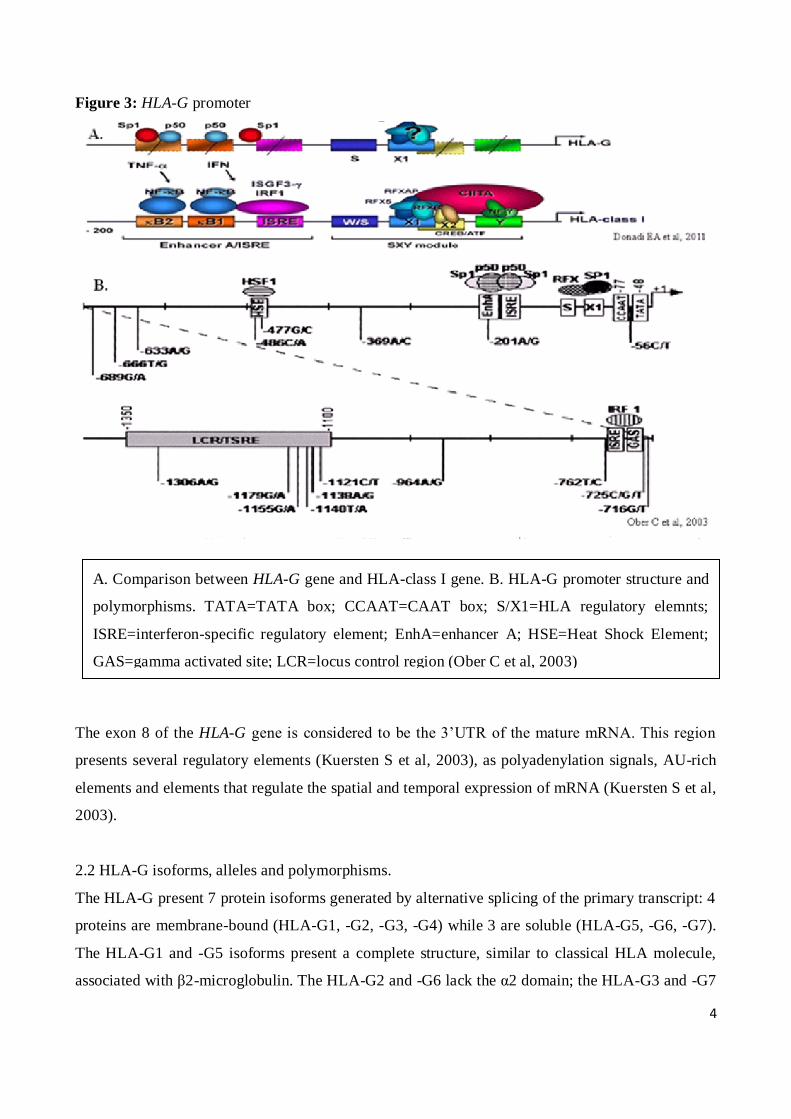
Figure 3: HLA-G promoter
The exon 8 of the HLA-G gene is considered to be the 3’UTR of the mature mRNA. This region
presents several regulatory elements (Kuersten S et al, 2003), as polyadenylation signals, AU-rich
elements and elements that regulate the spatial and temporal expression of mRNA (Kuersten S et al,
2003).
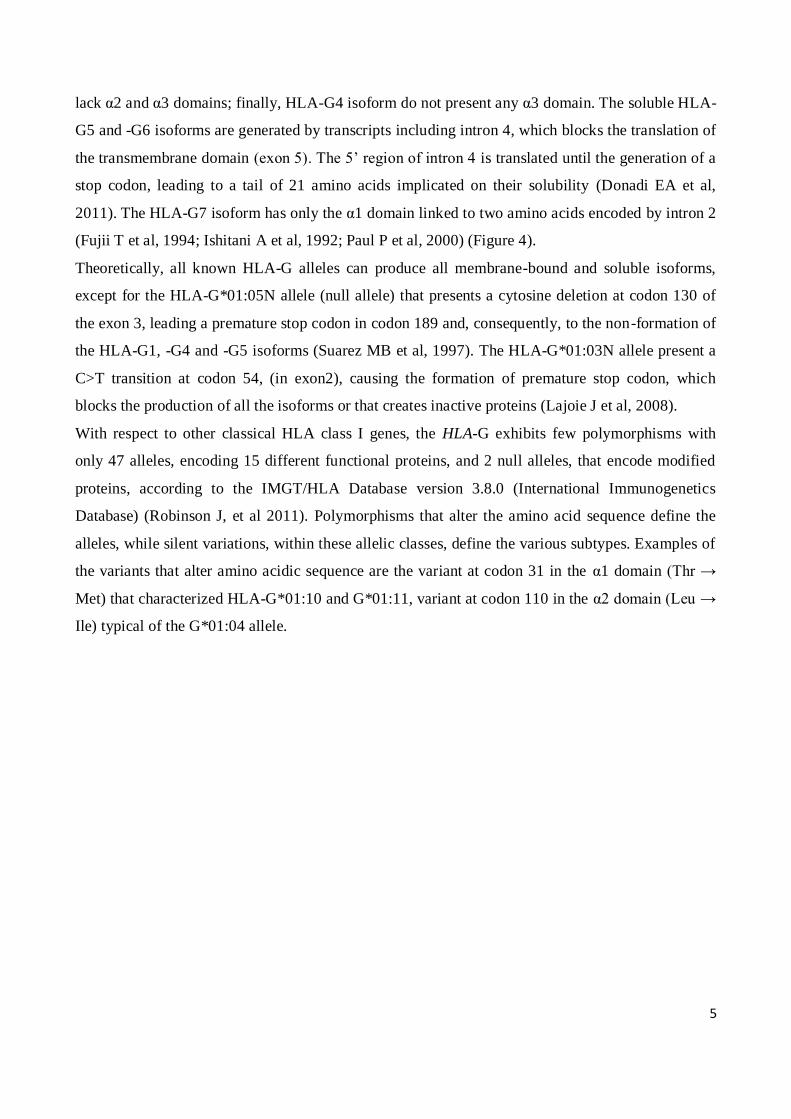
2.2 HLA-G isoforms, alleles and polymorphisms.
The HLA-G present 7 protein isoforms generated by alternative splicing of the primary transcript: 4
proteins are membrane-bound (HLA-G1, -G2, -G3, -G4) while 3 are soluble (HLA-G5, -G6, -G7).
The HLA-G1 and -G5 isoforms present a complete structure, similar to classical HLA molecule,
associated with β2-microglobulin. The HLA-G2 and -G6 lack the α2 domain; the HLA-G3 and -G7
A. Comparison between HLA-G gene and HLA-class I gene. B. HLA-G promoter structure and
polymorphisms. TATA=TATA box; CCAAT=CAAT box; S/X1=HLA regulatory elemnts;
ISRE=interferon-specific regulatory element; EnhA=enhancer A; HSE=Heat Shock Element;
GAS=gamma activated site; LCR=locus control region (Ober C et al, 2003)
5
lack α2 and α3 domains; finally, HLA-G4 isoform do not present any α3 domain. The soluble HLA-
G5 and -G6 isoforms are generated by transcripts including intron 4, which blocks the translation of
the transmembrane domain (exon 5). The 5’ region of intron 4 is translated until the generation of a
stop codon, leading to a tail of 21 amino acids implicated on their solubility (Donadi EA et al,
2011). The HLA-G7 isoform has only the α1 domain linked to two amino acids encoded by intron 2
(Fujii T et al, 1994; Ishitani A et al, 1992; Paul P et al, 2000) (Figure 4).
Theoretically, all known HLA-G alleles can produce all membrane-bound and soluble isoforms,
except for the HLA-G*01:05N allele (null allele) that presents a cytosine deletion at codon 130 of
the exon 3, leading a premature stop codon in codon 189 and, consequently, to the non-formation of
the HLA-G1, -G4 and -G5 isoforms (Suarez MB et al, 1997). The HLA-G*01:03N allele present a
C>T transition at codon 54, (in exon2), causing the formation of premature stop codon, which
blocks the production of all the isoforms or that creates inactive proteins (Lajoie J et al, 2008).
With respect to other classical HLA class I genes, the HLA-G exhibits few polymorphisms with
only 47 alleles, encoding 15 different functional proteins, and 2 null alleles, that encode modified
proteins, according to the IMGT/HLA Database version 3.8.0 (International Immunogenetics
Database) (Robinson J, et al 2011). Polymorphisms that alter the amino acid sequence define the
alleles, while silent variations, within these allelic classes, define the various subtypes. Examples of
the variants that alter amino acidic sequence are the variant at codon 31 in the α1 domain (Thr →
Met) that characterized HLA-G*01:10 and G*01:11, variant at codon 110 in the α2 domain (Leu →
Ile) typical of the G*01:04 allele.
6
Figure 4: HLA-G isoforms
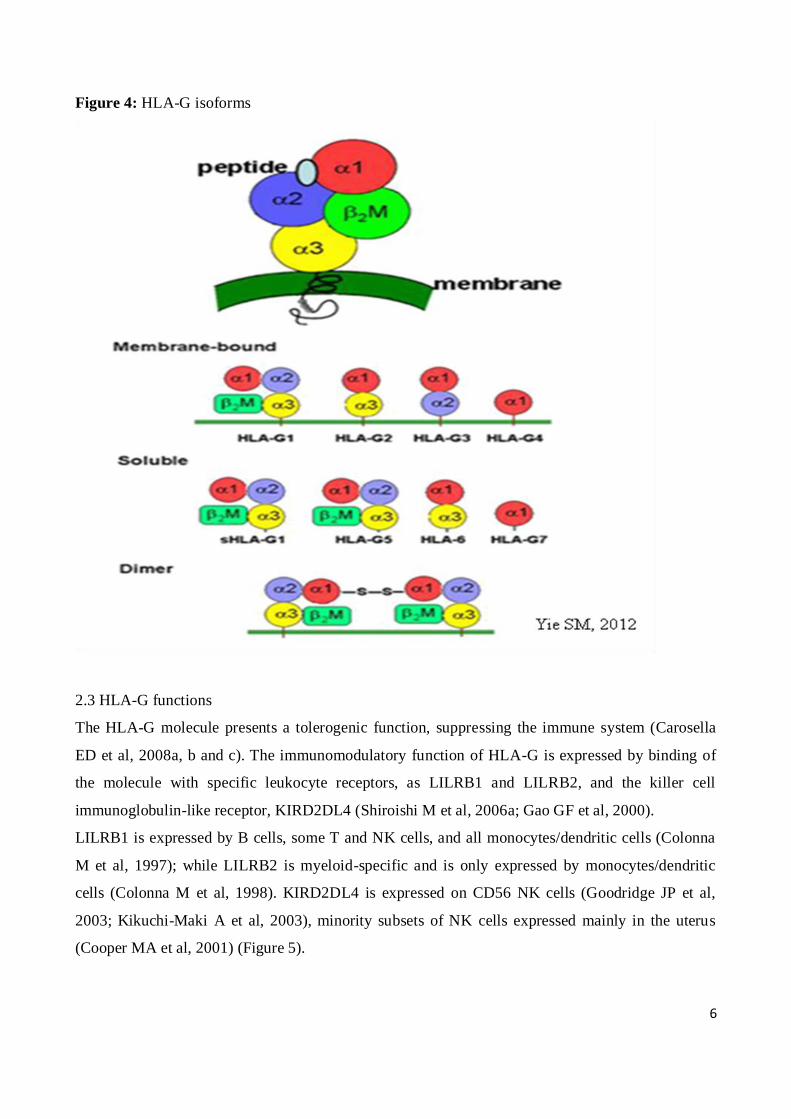
2.3 HLA-G functions
The HLA-G molecule presents a tolerogenic function, suppressing the immune system (Carosella
ED et al, 2008a, b and c). The immunomodulatory function of HLA-G is expressed by binding of
the molecule with specific leukocyte receptors, as LILRB1 and LILRB2, and the killer cell
immunoglobulin-like receptor, KIRD2DL4 (Shiroishi M et al, 2006a; Gao GF et al, 2000).
LILRB1 is expressed by B cells, some T and NK cells, and all monocytes/dendritic cells (Colonna
M et al, 1997); while LILRB2 is myeloid-specific and is only expressed by monocytes/dendritic
cells (Colonna M et al, 1998). KIRD2DL4 is expressed on CD56 NK cells (Goodridge JP et al,
2003; Kikuchi-Maki A et al, 2003), minority subsets of NK cells expressed mainly in the uterus
(Cooper MA et al, 2001) (Figure 5).
7
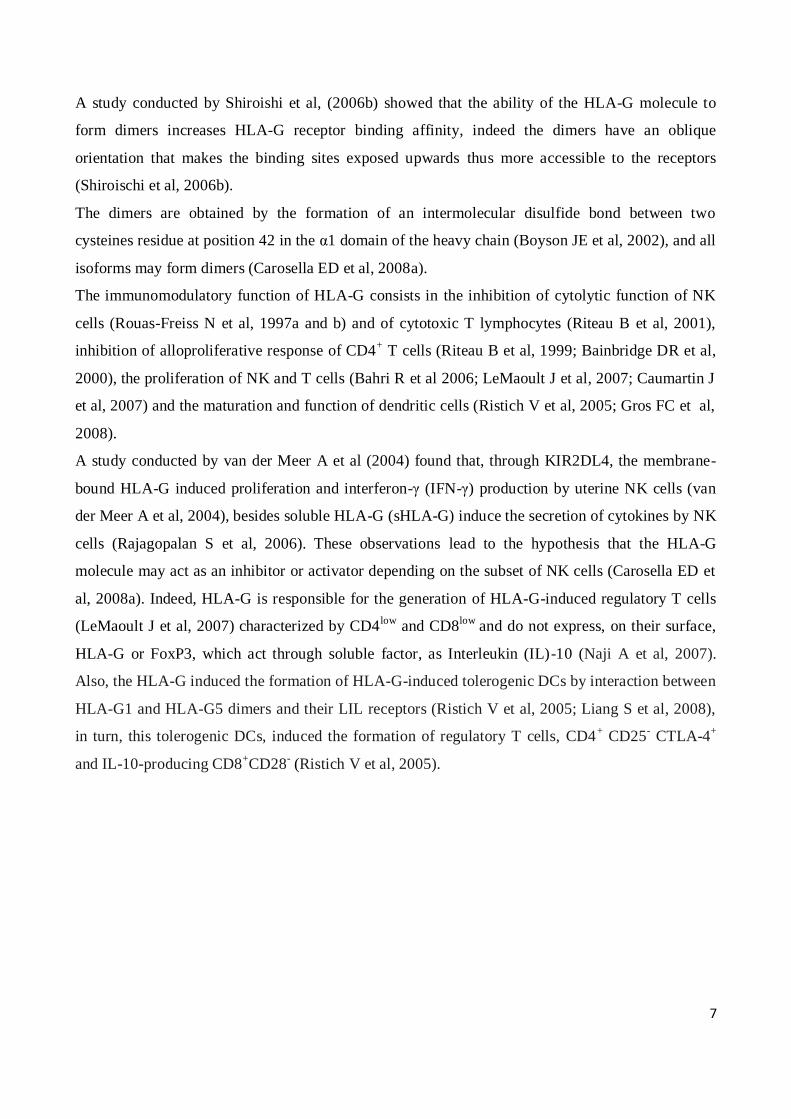
A study conducted by Shiroishi et al, (2006b) showed that the ability of the HLA-G molecule to
form dimers increases HLA-G receptor binding affinity, indeed the dimers have an oblique
orientation that makes the binding sites exposed upwards thus more accessible to the receptors
(Shiroischi et al, 2006b).
The dimers are obtained by the formation of an intermolecular disulfide bond between two
cysteines residue at position 42 in the α1 domain of the heavy chain (Boyson JE et al, 2002), and all
isoforms may form dimers (Carosella ED et al, 2008a).
The immunomodulatory function of HLA-G consists in the inhibition of cytolytic function of NK
cells (Rouas-Freiss N et al, 1997a and b) and of cytotoxic T lymphocytes (Riteau B et al, 2001),
inhibition of alloproliferative response of CD4+ T cells (Riteau B et al, 1999; Bainbridge DR et al,
2000), the proliferation of NK and T cells (Bahri R et al 2006; LeMaoult J et al, 2007; Caumartin J
et al, 2007) and the maturation and function of dendritic cells (Ristich V et al, 2005; Gros FC et al,
2008).
A study conducted by van der Meer A et al (2004) found that, through KIR2DL4, the membrane-
bound HLA-G induced proliferation and interferon-γ (IFN-γ) production by uterine NK cells (van
der Meer A et al, 2004), besides soluble HLA-G (sHLA-G) induce the secretion of cytokines by NK
cells (Rajagopalan S et al, 2006). These observations lead to the hypothesis that the HLA-G
molecule may act as an inhibitor or activator depending on the subset of NK cells (Carosella ED et
al, 2008a). Indeed, HLA-G is responsible for the generation of HLA-G-induced regulatory T cells
(LeMaoult J et al, 2007) characterized by CD4low
and CD8low
and do not express, on their surface,
HLA-G or FoxP3, which act through soluble factor, as Interleukin (IL)-10 (Naji A et al, 2007).
Also, the HLA-G induced the formation of HLA-G-induced tolerogenic DCs by interaction between
HLA-G1 and HLA-G5 dimers and their LIL receptors (Ristich V et al, 2005; Liang S et al, 2008),
in turn, this tolerogenic DCs, induced the formation of regulatory T cells, CD4+ CD25
- CTLA-4
+
and IL-10-producing CD8+CD28
- (Ristich V et al, 2005).
8
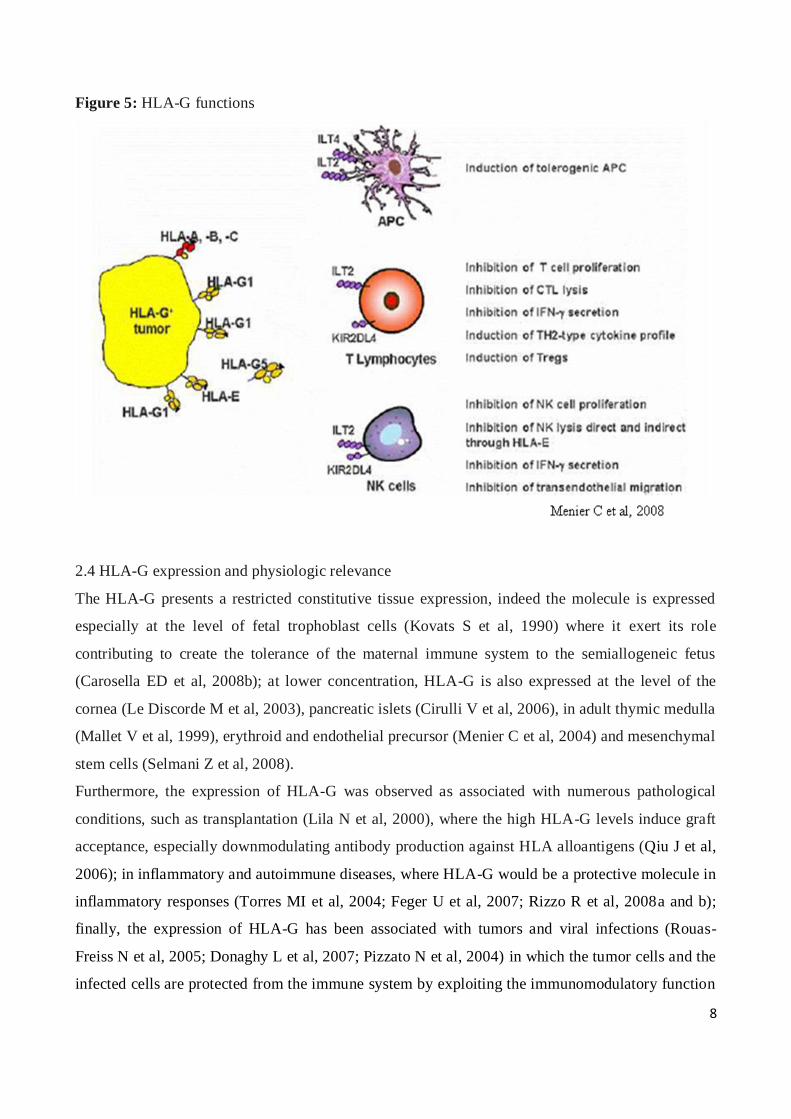
Figure 5: HLA-G functions
2.4 HLA-G expression and physiologic relevance
The HLA-G presents a restricted constitutive tissue expression, indeed the molecule is expressed
especially at the level of fetal trophoblast cells (Kovats S et al, 1990) where it exert its role
contributing to create the tolerance of the maternal immune system to the semiallogeneic fetus
(Carosella ED et al, 2008b); at lower concentration, HLA-G is also expressed at the level of the
cornea (Le Discorde M et al, 2003), pancreatic islets (Cirulli V et al, 2006), in adult thymic medulla
(Mallet V et al, 1999), erythroid and endothelial precursor (Menier C et al, 2004) and mesenchymal
stem cells (Selmani Z et al, 2008).
Furthermore, the expression of HLA-G was observed as associated with numerous pathological
conditions, such as transplantation (Lila N et al, 2000), where the high HLA-G levels induce graft
acceptance, especially downmodulating antibody production against HLA alloantigens (Qiu J et al,
2006); in inflammatory and autoimmune diseases, where HLA-G would be a protective molecule in
inflammatory responses (Torres MI et al, 2004; Feger U et al, 2007; Rizzo R et al, 2008a and b);
finally, the expression of HLA-G has been associated with tumors and viral infections (Rouas-
Freiss N et al, 2005; Donaghy L et al, 2007; Pizzato N et al, 2004) in which the tumor cells and the
infected cells are protected from the immune system by exploiting the immunomodulatory function
9
of HLA-G expressed on their surface (Rouas-Freiss N et al, 2005; Donaghy L et al, 2007; Lozano
JM et al, 2002).
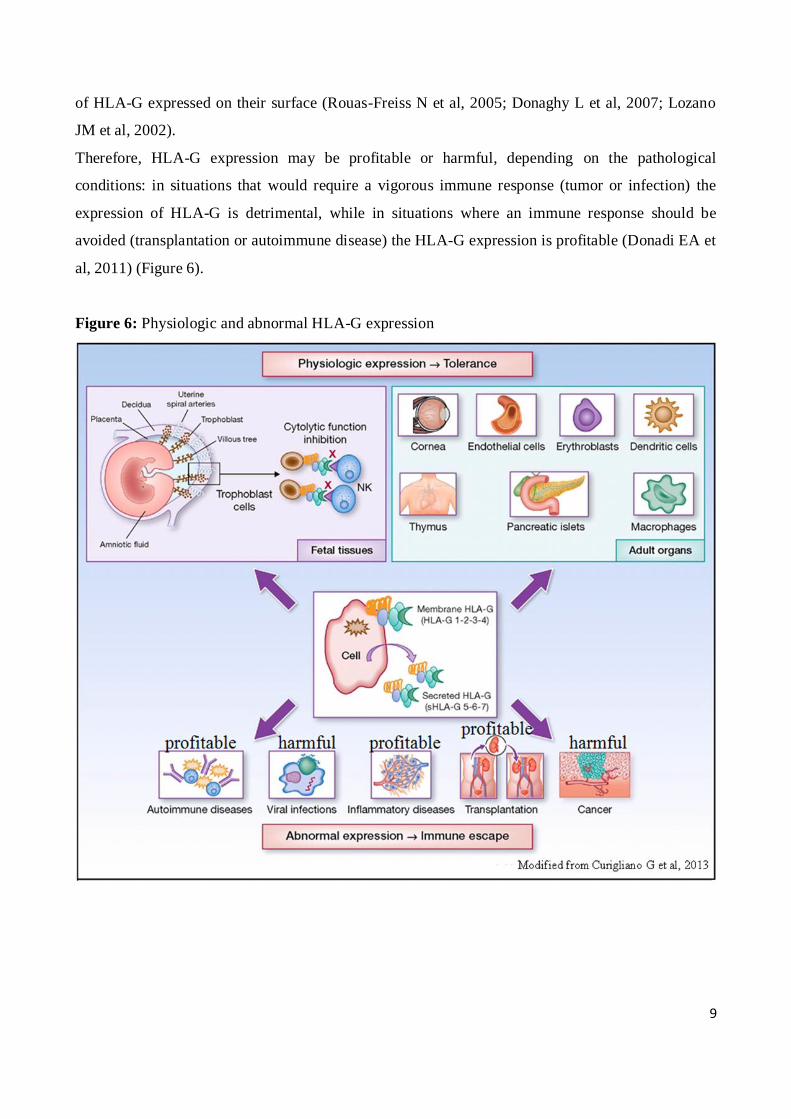
Therefore, HLA-G expression may be profitable or harmful, depending on the pathological
conditions: in situations that would require a vigorous immune response (tumor or infection) the
expression of HLA-G is detrimental, while in situations where an immune response should be
avoided (transplantation or autoimmune disease) the HLA-G expression is profitable (Donadi EA et
al, 2011) (Figure 6).
Figure 6: Physiologic and abnormal HLA-G expression
10
2.5. HLA-G polymorphisms and their impact on HLA-G expression
The expression level of a protein depends upon the rate of synthesis, as well as on the rate of
degradation, stability, localization and translatability of its mRNA (Kuersten S and Goodwin EB,
2003).
The HLA-G gene presents numerous nucleotide variations that may influence HLA-G expression,
especially those present at the level of the promoter and of the 3’ untranslated region (Donadi EA et
al, 2011).
The HLA-G promoter presents 29 known single nucleotide polymorphisms (SNPs) (Tan Z et al,
2005; Hviid TV et al, 2006b; Hviid TV et al, 2004) many of which coincide with or are closed to
the regulatory elements, leading to assume that their presence may alter the binding of the
corresponding regulatory factors (Donadi EA et al, 2011). For example, -762 T>C, -725 C>G>T
and -716 G>T SNPs are located near to an ISRE motif, while -486 C>A and -477 G>C are located
within a heat shock element and the -201 G>A within an enhancerA.
However, only for the -725C>G>T polymorphism functional studies have been performed; this
triallelic SNP is located very close to an ISRE motif and the presence of the guanine creates a CpG
dinucleotide, togheter with cysteine in -726 position, which may undergo methylation, resulting in
alteration of gene transcription (Ober C et al, 2006).
Ober C et al, 2006, found, by luciferase assay, that the haplotype presenting the -725G allele is
significantly associated with a higher expression of the HLA-G with respect to haplotypes
containing C or T alleles.
The 3’UTR presents 8 SNPs: the deletion or insertion of 14 bp is the most studied variation;
numerous studies have shown that this SNP can modulate the mRNA stability (Rousseau P et al
2003; Hiby SE et al; 1999; O’Brien M et al, 2001; Hviid TV et al, 2003); particularly, the 14bp
insertion has been associated with higher mRNA instability and, consequently, lower mRNA
production for most membrane-bound and soluble isoforms (Hviid TV et al, 2003; Hviid TV, 2006a
and b).
Hiby SE et al (1999) and Hviid TV et al (2003) hypothesized that a fraction of HLA-G mRNA
transcripts that present the 14bp insertion could be processed by removal of 92 bases (including the
14bp) from the mature mRNA, making it more stable (Rousseau P et al, 2003).
At the 3142 position a C>G variation is present, where the presence of a guanine increases the
affinity to microRNAs (miRNAs), that are small non-coding RNAs about 22 nucleotides in length
that degrade mRNA, suppressing the translation (Tan Z et al, 2007). Castelli et al (2009), have
shown in silico that, in addition to 3142 C>G SNP, other SNPs located at the 3’UTR, such as the

11
14bp deletion/insertion, 3003 T>C, 3010 G>C, 3027 C>A and 3035 C>T, could bind miRNAs and
be involved in the degradation of mRNA. Finally, an A>G transition at position 3187, located next
to an AU-rich motif that mediates mRNA degradation, was shown in vitro to be associated with
increased RNA stability and HLA-G expression (Yie SM et al, 2008).
3. HLA-G AND DISEASES
As previously mentioned, the HLA-G expression, in pathological condition, can be harmful or
profitable.
In autoimmune diseases, where the lower immuno suppressive status determines the onset of the
disease, HLA-G, which inhibits autoreactive T cells and stimulates the proliferation of Treg cells
inducing the anti-inflammatory immune response, represent one of the mechanism for counteract
the expansion of the inflammatory state (Baricordi OR et al, 2008).
A study conducted by Wiendl H et al (2005) found HLA-G protein in acute and chronic plaques,
perilesional areas, normal white matter and cerebrospinal fluid (CSF) of multiple sclerosis (MS)
patients, and the sHLA-G levels in CSF were significantly more elevated in MS patients with
clinically and magnetic resonance imaging (MRI) stable disease.
Besides, the same group, observed that sHLA-G levels in CSF were significantly increased in
clinically stable and MRI inactive individuals and in MS patients without lesional activity,
indicating that sHLA-G mediated immuno suppression may be involved in disease stabilization
(Fainardi E et al, 2006).
Instead, in viral infections, the viruses downregulates the expression of classical MHC class I in
order to protect the activity of cytotoxic T lymphocytes cells (Donadi EA et al, 2011; Hansen TH
and Bouvier M, 2009); but this downregulation makes the infected cells susceptible to cytolysis by
NK cells, whereby viruses have developed various mechanisms to impede NK cells recognition,
such as inducing HLA-G expression (Onno M et al, 2000; Lozano JM et al, 2002). Indeed in
infectious diseases the alteration of cytokines production, most importantly IL-10 and INF-γ,
upregulates HLA-G mRNAs at both cell surface and soluble HLA-G protein levels (Moreau P et al,
1999; Yang Y et al, 1996; Ugurel S et al, 2001). The protection mechanism of the virus has been
described in the case of HIV-1: the HIV by Nef-dependent mechanism downregulates the HLA I
expression through the recognition of a sequence (Y320 SQAASS) present on the cytoplasmic tail of
these HLA molecules (Piguet V et al, 2000; Williams M et al, 2002), allowing the infected cell to
protect itself from the action of CD8+ T lymphocytes (Collins KL et al, 1998). Instead, Nef
maintains the expression of HLA-C, -G, and -E, in order to inhibit the innate response of the natural
12
killer cells (NK) (Cohen GB et L, 1999; Pizzato N et al, 2004; Nattermann J et al, 2005) thanks also
to the synthesis, by the viral protein gp41, of cytokines such as IL-10 that, as mentioned before,
stimulate the production of HLA-G, (Barcova M et al, 1998; Moreau P et al, 1999). Therefore, in
this condition, increased expression of HLA-G is harmful facilitating the progression of the virus.
A study conducted by Lajoie J et al (2010) demonstrated that plasma sHLA-G levels were increased
in early stage of infection and remained elevated in patients under treatment and with a rapid
progression of the disease, while plasma HLA-G levels returned to normality during the chronic
phase of the infection in those patients with normal progression.
3.1 Celiac disease
Celiac disease (CD) is a common autoimmune inflammatory disease of the small bowel, triggered
by the consumption of foods that contain gluten, including wheat. Patients with celiac disease
present a genetic predisposition represented by the HLA-DQ2 (about 90%) (DQA1*05, DQB1*02,
DRB1*03) and/or HLA-DQ8 (about 10%) (DQA1*03, DQB1*0201, DRB1*04), and specific
autoantibodies against tissue transglutaminase (TG2) enzyme and against endomysium (EMA)
(Rostom A et al, 2006; Schuppan D et al, 2009).
In celiac patients some gluten peptides are not degraded by gastrointestinal enzymes (Shan L et al,
2002) and they cross the epithelium of the small-bowel mucosa (Zimmer KP et al, 2010), where
they are presented on the antigen-presenting cells that have HLA-DQ2 or HLA-DQ8 stimulating
gluten-specific T cells. Then, glutamine residue is deamidated through the activity of the enzyme
TG2 to produce an acidic glutamic acid residue, promoting the binding of gluten peptides to HLA-
DQ2 or HLA-DQ8 and potentiating the inflammatory T-cell reaction (Schuppan D et al, 2009). The
activated T cells in the lamina propria and within the epithelium are cytotoxic, with effects
including apoptosis of enterocytes, atrophic remodeling of the mucosa, malabsorption,
inflammatory infiltrate in the duodenum, crypt hyperplasia and villous atrophy (Schuppan D and
Zimmer K, 2013) (Figure 7).
The mucosal lesions are classified according to the Marsh classification (Marsh MN, 1992): Marsh
III shows the partial or total loss of villi; Marsh II, when, even without villous atrophy, the crypt
hyperplasia is seen with at least 25 intraepithelial lymphocytes per 100 enterocytes, and if there are
autoantibodies; Marsh I, when there is isolated proliferation of intraepithelial lymphocytes with at
least 25 per 100 epithelial cells (Oberhuber G et al, 2001; Chang F et al, 2005).
13
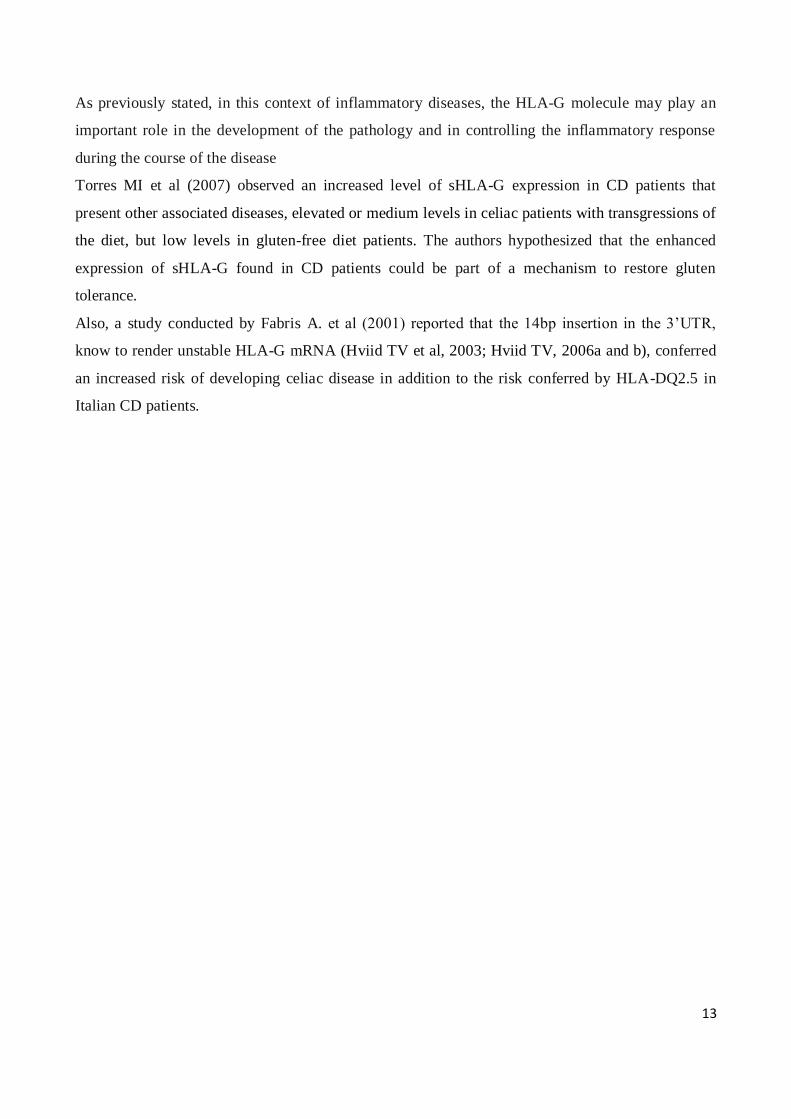
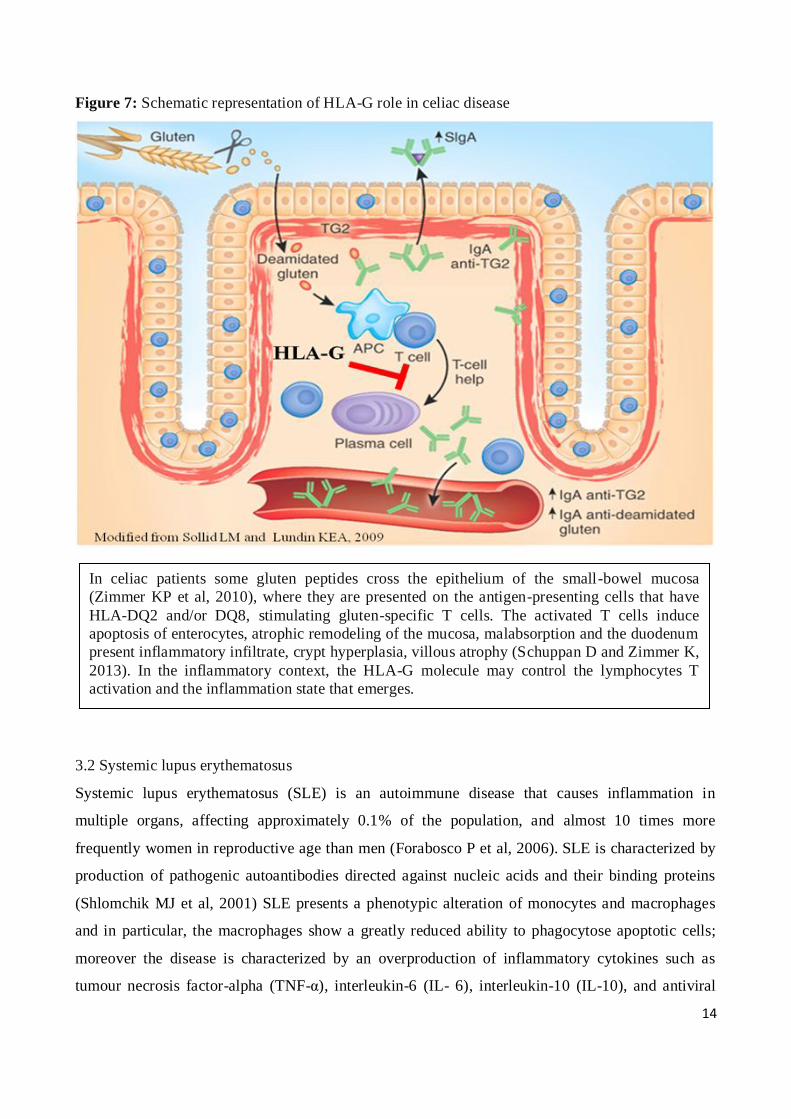
As previously stated, in this context of inflammatory diseases, the HLA-G molecule may play an
important role in the development of the pathology and in controlling the inflammatory response
during the course of the disease
Torres MI et al (2007) observed an increased level of sHLA-G expression in CD patients that
present other associated diseases, elevated or medium levels in celiac patients with transgressions of
the diet, but low levels in gluten-free diet patients. The authors hypothesized that the enhanced
expression of sHLA-G found in CD patients could be part of a mechanism to restore gluten
tolerance.
Also, a study conducted by Fabris A. et al (2001) reported that the 14bp insertion in the 3’UTR,
know to render unstable HLA-G mRNA (Hviid TV et al, 2003; Hviid TV, 2006a and b), conferred
an increased risk of developing celiac disease in addition to the risk conferred by HLA-DQ2.5 in
Italian CD patients.
14
Figure 7: Schematic representation of HLA-G role in celiac disease
3.2 Systemic lupus erythematosus
Systemic lupus erythematosus (SLE) is an autoimmune disease that causes inflammation in
multiple organs, affecting approximately 0.1% of the population, and almost 10 times more
frequently women in reproductive age than men (Forabosco P et al, 2006). SLE is characterized by
production of pathogenic autoantibodies directed against nucleic acids and their binding proteins
(Shlomchik MJ et al, 2001) SLE presents a phenotypic alteration of monocytes and macrophages
and in particular, the macrophages show a greatly reduced ability to phagocytose apoptotic cells;
moreover the disease is characterized by an overproduction of inflammatory cytokines such as
tumour necrosis factor-alpha (TNF-α), interleukin-6 (IL- 6), interleukin-10 (IL-10), and antiviral
In celiac patients some gluten peptides cross the epithelium of the small-bowel mucosa
(Zimmer KP et al, 2010), where they are presented on the antigen-presenting cells that have
HLA-DQ2 and/or DQ8, stimulating gluten-specific T cells. The activated T cells induce
apoptosis of enterocytes, atrophic remodeling of the mucosa, malabsorption and the duodenum
present inflammatory infiltrate, crypt hyperplasia, villous atrophy (Schuppan D and Zimmer K,
2013). In the inflammatory context, the HLA-G molecule may control the lymphocytes T
activation and the inflammation state that emerges.
15
type I interferons (IFNs) (Taylor KE et al, 2011; Bronson PG et al, 2012). In this inflammatory
context, monocytes and macrophages present self antigens to autoreactive T cells (Kavai M and
Szegedi G, 2007), and IFNs stimulate antibody production and class switching from B cells,
contributing to the breaking of immune tolerance (Ronnblom L et al, 2006). The autoimmune
response that is created in the course of the disease, These effector mechanisms initiate infiltration
and activation of tissue-infiltrating macrophages that promote the inflammatory response with
resultant tissue injury due to a high tissue damage (Choi J et al, 2012; Manderson AP et al, 2004;
Bergtold A et al, 2006). The kidney is the most affected organ , and the resulting nephritis is caused
by deposition of immune complexes of autoantibodies and autoantigens (Schiffer L et al, 2003).
The development of SLE occurs in genetically-predisposed individuals, a strong genetic
contribution to the development of SLE is supported by the high heritability of the disease (>66%)
(Alarcón-Segovia D et al, 2005).
Six genome-wide association studies (GWAS) in patients with SLE (four in populations of
European ancestry and two in Asian populations) have increased the number of established genetic
associations with SLE during the past few years (Hom G et al, 2008; International Consortium for
Systemic Lupus Erythematosus Genetics (SLEGEN) et al, 2008; Kozyrev SV et al, 2008; Graham
RR et al, 2008; Gateva V et al, 2009; Han JW et al, 2009; Yang W et al, 2010). These studies have
identified 18 novel SLE associated non-HLA loci reaching genome-wide significance (Interferon
regulatory factor 5,IRF5; STAT4; FcγR genes, etc). In addition, candidate gene studies have
identified 13 SLE-associated loci (including HLA loci).
Individual genetic risk variants associated with SLE each have a modest magnitude of effect with
odds ratios in the range of 1.1–2.3 (Deng Y and Tsao BP, 2010). However, the genetic risk for SLE
involves multiple genes and so the overall genetic risk for SLE is higher than in many other auto-
immune diseases (Vyse TJ and Todd JA, 1996). The first genetic association described for SLE was
with the HLA region at chromosome 6p21.3, which encodes over 200 genes, many with known
immunological roles (Goldberg MA et al, 1976; The MHC sequencing consortium, 1999). GWAS
in both European and Asian populations have shown that the strongest contribution to risk for SLE
resides in the HLA region and consists of multiple genetic effects (Hom G et al, 2008; International
Consortium for Systemic Lupus Erythematosus Genetics (SLEGEN) et al, 2008; Graham RR et al,
2008; Gateva V et al, 2009; Han JW et al, 2009; Yang W et al, 2010).
The HLA-G gene, located in the 6p21.3 region, might be a good candidate gene for susceptibility to
disease, since, given its immunomodulatory function, could serve as a protective molecule in
inflammatory response (Brenol CV et al, 2012) (Figure 8).
16
Monsiváis-Urenda AE et al (2011) found, in monocytes of SLE patients, low levels of HLA-G;
also, the authors observed that HLA-G+ monocytes from healthy controls decreased the degree of
proliferation of autologous lymphocytes; monocytes of SLE patients, treated with IFN-γ to
stimulated the HLA-G expression, have a decreased suppressive activity. Furthermore, the
lymphocytes of SLE patients had little ability to acquire HLA-G through the mechanism of
trogocitosys, the contact-dependent intercellular membrane transfer; and finally, they found that
HLA-Gacq lymphocytes from healthy controls significantly diminished the proliferation of
autologous HLA-G-negative cells. HLA-Gacq lymphocytes from SLE patients showed an enhanced
capability to proliferate, further indicating that these cells are partially refractory to the regulatory
effect of HLA-G, suggesting that HLA-G had a complex role in the immune abnormalities observed
in SLE (Monsiváis-Urenda AE et al, 2011).
Various studies investigating the possible association between disease susceptibility and
polymorphisms in the HLA-G 3'UTR have been conducted (Lucena-Silva N et al, 2013; Consiglio
CR et al, 2011; Veit TD et al, 2009; Rizzo R et al, 2008a). These studies found the 14bp del/ins and
3142C>G SNPs associated with the development of the disease; since both SNPs are associated
with a mRNA instability (Hviid TV et al, 2003; Hviid TV, 2006b; Tan Z et al, 2007) these results
support a potential role of HLA-G for the susceptibility of SLE (Rizzo R et al, 2008a).
17
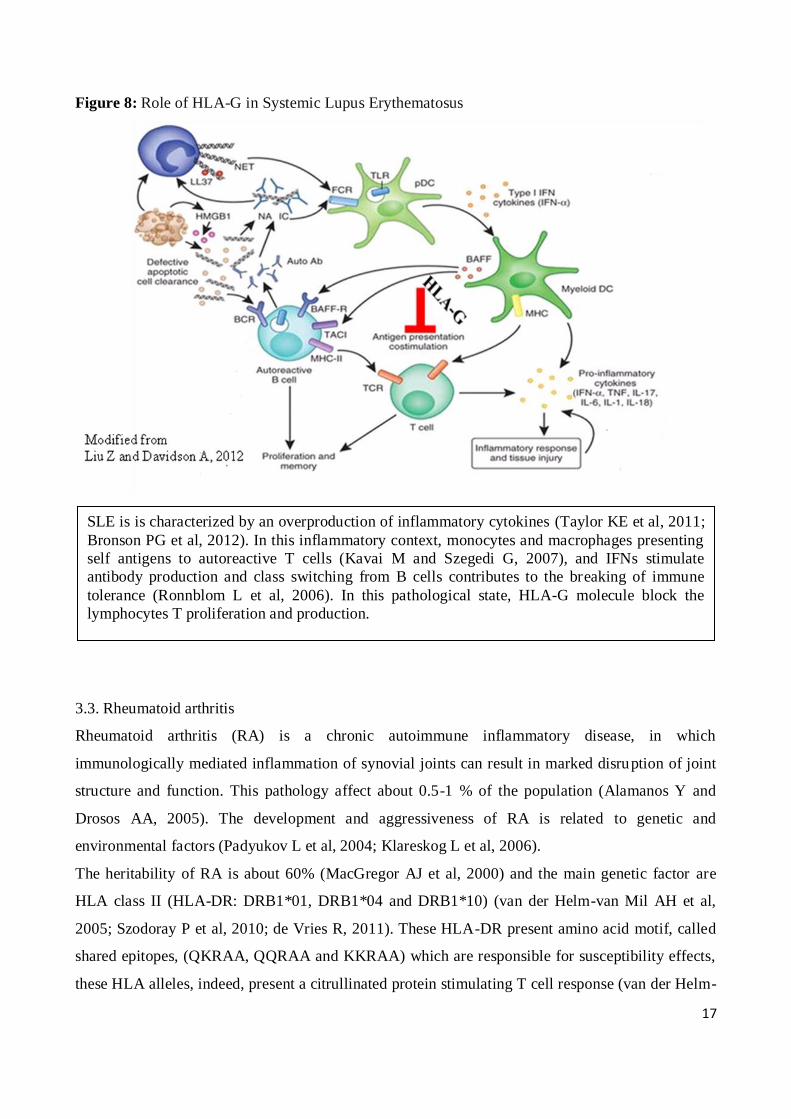
Figure 8: Role of HLA-G in Systemic Lupus Erythematosus
3.3. Rheumatoid arthritis
Rheumatoid arthritis (RA) is a chronic autoimmune inflammatory disease, in which
immunologically mediated inflammation of synovial joints can result in marked disruption of joint
structure and function. This pathology affect about 0.5-1 % of the population (Alamanos Y and
Drosos AA, 2005). The development and aggressiveness of RA is related to genetic and
environmental factors (Padyukov L et al, 2004; Klareskog L et al, 2006).
The heritability of RA is about 60% (MacGregor AJ et al, 2000) and the main genetic factor are
HLA class II (HLA-DR: DRB1*01, DRB1*04 and DRB1*10) (van der Helm-van Mil AH et al,
2005; Szodoray P et al, 2010; de Vries R, 2011). These HLA-DR present amino acid motif, called
shared epitopes, (QKRAA, QQRAA and KKRAA) which are responsible for susceptibility effects,
these HLA alleles, indeed, present a citrullinated protein stimulating T cell response (van der Helm-
SLE is is characterized by an overproduction of inflammatory cytokines (Taylor KE et al, 2011;
Bronson PG et al, 2012). In this inflammatory context, monocytes and macrophages presenting
self antigens to autoreactive T cells (Kavai M and Szegedi G, 2007), and IFNs stimulate
antibody production and class switching from B cells contributes to the breaking of immune
tolerance (Ronnblom L et al, 2006). In this pathological state, HLA-G molecule block the
lymphocytes T proliferation and production.

18
van Mil AH et al, 2005; Gregersen PK et al, 1987) that is supposed to be related to the production
of anti-citrullinated protein antibodies (ACPA) (Szodoray P et al, 2010; van der Woude D et al,
2010).
Citrullination is a post-translational modification of a protein that consists in the positioning of a
charged arginine with a neutral citrulline, through the action of the intracellular enzyme
peptidylargininedeaminase. The enzyme requires calcium for its activation, and in normal condition
the calcium is maintained at low levels and the enzyme inactive, while during inflammation, the cell
membrane is compromised, and the release of calcium and enzyme triggers the activation of the
latter (Vossenaar ER et al, 2003; Asaga H et al, 1998). The exposure of citrullinated proteins to the
humoral immune system in genetically predisposed individuals leads to the formation of ACPA and
in some cases the progression to RA (Goldman K et al, 2012).
RA is characterized by a Th1 and Th17 immune response (Chen J et al, 2012) and it can be assumed
that, in activation of inflammatory cells, the HLA-G molecule might counteract the inflammation
(Figure 9).
Rizzo R et al (2013) observed lower levels of HLA-G in early RA patients with a more severe
degree of disease; also they observed an up-modulation of soluble HLA-G after 3 months of therapy
in patients with an improvement in disease status, as well as of the membrane HLA-G expression
by CD14 positive peripheral blood monocytes and of ILT2 receptor, which is the main HLA-G
receptor.
Kuroki K et al (2013) studied the in vivo immunosuppressive effect of the HLA-G, in the
rheumatoid arthritis condition, using the collagen-induced arthritis model. Mice were treated with
the HLA-G monomer and dimer, and both had excellent anti-inflammatory effects, especially the
dimers, that showed significant immunosuppressive effects even at lower concentrations and for a
long time.
19
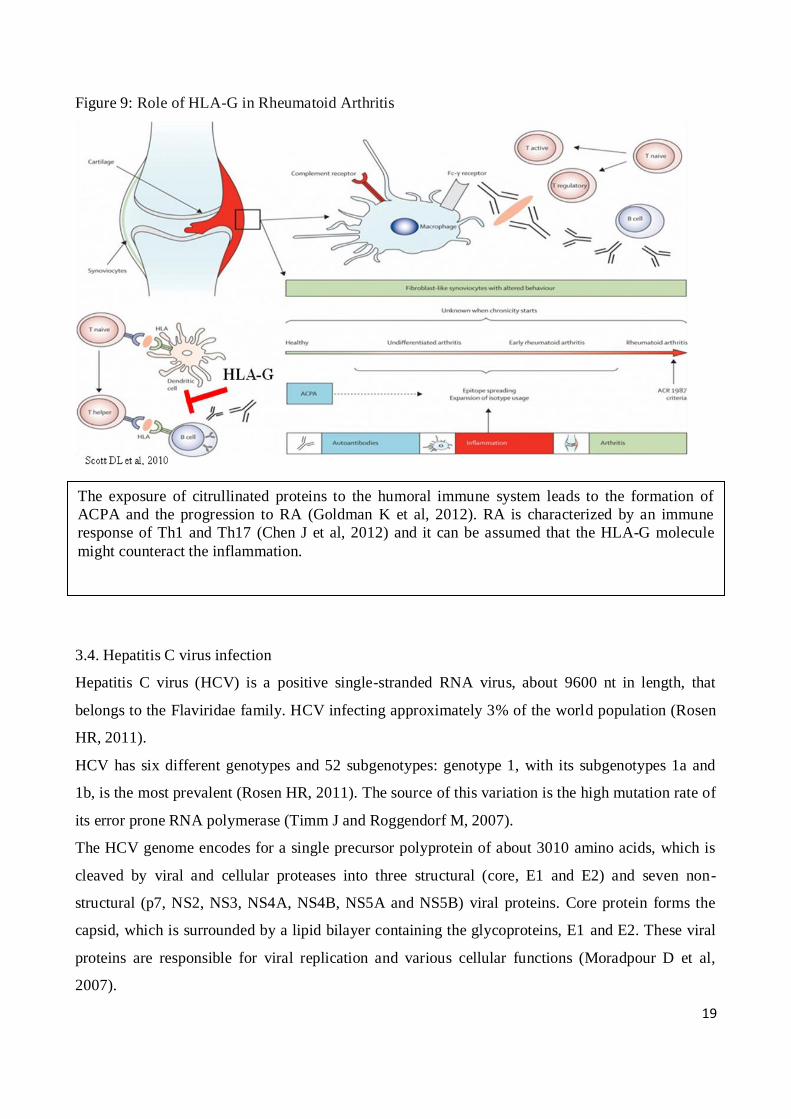
Figure 9: Role of HLA-G in Rheumatoid Arthritis
3.4. Hepatitis C virus infection
Hepatitis C virus (HCV) is a positive single-stranded RNA virus, about 9600 nt in length, that
belongs to the Flaviridae family. HCV infecting approximately 3% of the world population (Rosen
HR, 2011).
HCV has six different genotypes and 52 subgenotypes: genotype 1, with its subgenotypes 1a and
1b, is the most prevalent (Rosen HR, 2011). The source of this variation is the high mutation rate of
its error prone RNA polymerase (Timm J and Roggendorf M, 2007).
The HCV genome encodes for a single precursor polyprotein of about 3010 amino acids, which is
cleaved by viral and cellular proteases into three structural (core, E1 and E2) and seven non-
structural (p7, NS2, NS3, NS4A, NS4B, NS5A and NS5B) viral proteins. Core protein forms the
capsid, which is surrounded by a lipid bilayer containing the glycoproteins, E1 and E2. These viral
proteins are responsible for viral replication and various cellular functions (Moradpour D et al,
2007).
The exposure of citrullinated proteins to the humoral immune system leads to the formation of
ACPA and the progression to RA (Goldman K et al, 2012). RA is characterized by an immune
response of Th1 and Th17 (Chen J et al, 2012) and it can be assumed that the HLA-G molecule
might counteract the inflammation.
20
In the early stages of viral infection the immune response attacks the virus in a non-specific manner
that slows down the viral replication; while the adaptive immune response (humoral, with
antibodies, and cellular, with CD4+ and CD8
+ cells) attacks specifically HCV particles and infected
cells, limiting HCV infection (Plauzolles A et al, 2013; Cooper S et al,1999; Lauer GM et al, 2001;
Neumann-Haefelin C et al, 2005; Lauer GM et al, 2004).
About 70% of HC infected individuals develop chronic or persistent infection, cirrhosis and
hepatocellular carcinoma (HCC) (Saito I et al, 1990; Di Bisceglie AM, 1997). The rate of
progression of chronic hepatitis C depends on various factors, as alcohol abuse, viral genotype, co-
infection with another type of virus, as HIV-1, and the host immune defenses. Indeed various
studies observed that genetic variations in genes involved in innate and adaptive immune response ,
as HLA, NK cell receptor, chemokines, interleukins and interferons (Airoldi A et al, 2004; Alric L
et al, 1997; Asti M et al, 1999) are associated with persistent HCV infection. Particularly, the HLA
is the major responsible of the specificity of the adaptive immune response to HCV; this action of
HLA is compromised by the mutability of the viral genome and this allows the virus to escape the
action of the immune system (Thimme R et al, 2006; Timm J et al, 2004).
As mentioned previously, the viruses have developed several mechanisms to defend the infected
cells by the action of the immune system (Figure 10,) (Donadi EA et al, 2011; Hansen TH and
Bouvier M, 2009; Onno M et al, 2000; Lozano JM et al, 2002); and can be assumed that also HCV
uses the same strategy of protection and that, also in this case, an increased expression of HLA-G
can accelerate the progression of viral infection .
Weng PJ et al (2011) observed significantly higher plasma sHLA-G levels in chronic HCV infected
patients independently of HCV genotype and viral RNA loads.
The patients with chronic HCV infection showed a drastic decrease of T cell responses (Chisari FV,
1997; Takaki A et al, 2000). The authors hypothesized that HLA-G expression may be included
among the factors associated with persistence of HCV infection.
de Oliveira Crispim JC et al (2012) observed that HLA-G expression in the liver microenvironment
was significantly higher in milder stages of fibrosis in HCV-infected patients.
21
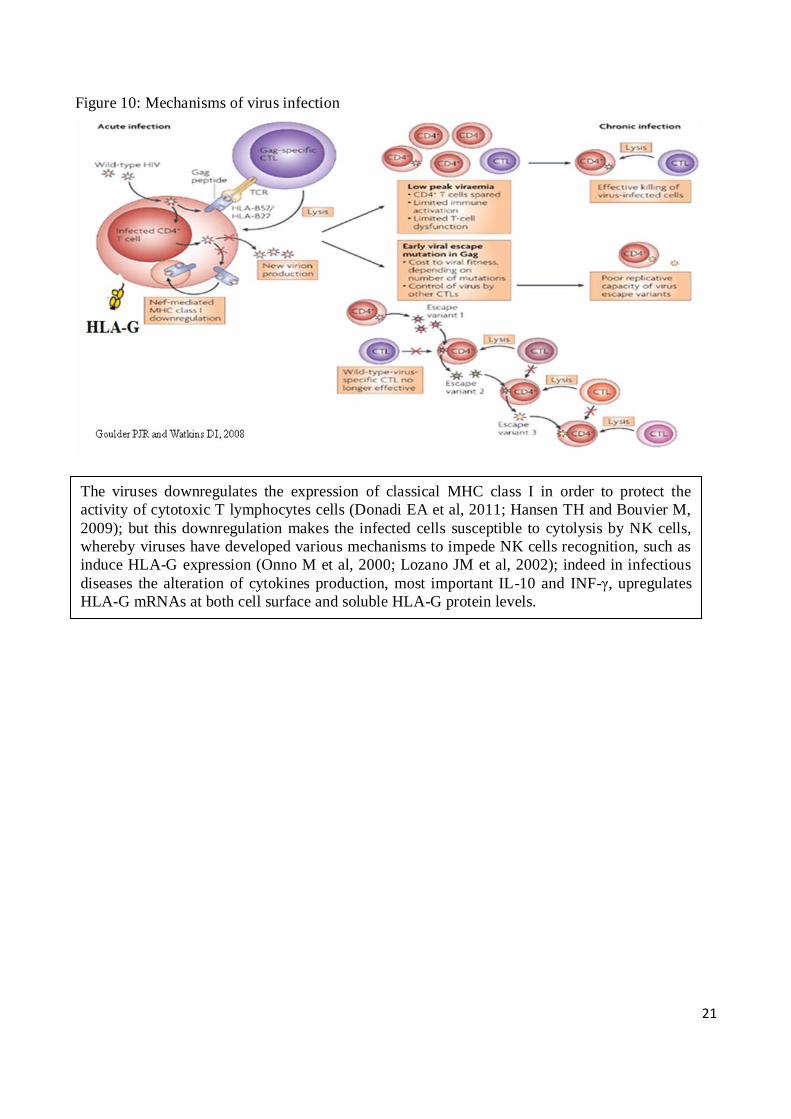
Figure 10: Mechanisms of virus infection
The viruses downregulates the expression of classical MHC class I in order to protect the
activity of cytotoxic T lymphocytes cells (Donadi EA et al, 2011; Hansen TH and Bouvier M,
2009); but this downregulation makes the infected cells susceptible to cytolysis by NK cells,
whereby viruses have developed various mechanisms to impede NK cells recognition, such as
induce HLA-G expression (Onno M et al, 2000; Lozano JM et al, 2002); indeed in infectious
diseases the alteration of cytokines production, most important IL-10 and INF-γ, upregulates
HLA-G mRNAs at both cell surface and soluble HLA-G protein levels.

22
AIMS
The HLA-G molecule present a restricted tissue-specific expression and is expressed especially at
the level of cytotrophoblasts, where it plays a key role in the establishment of tolerance to the semi-
allogenic fetus. Indeed, the HLA-G molecule has the important role to inhibit the cytotoxic activity
of T lymphocytes and Natural Killer cells, to inhibit of alloproliferative response of CD4+ T cells,
the proliferation of NK and T cells and the maturation and function of dendritic cells.
Despite its restricted tissue-specific expression, the HLA-G molecule was observed in numerous
pathologies, as well as inflammatory, autoimmune and viral disease.
The implication of HLA-G molecule, as immunosuppressive molecule, in autoimmune and
inflammatory diseases, or in viral infections, has been hypothesized, but the role of this molecule in
the development and progression of these diseases is not yet established. Also, the factors that
induce the expression of HLA-G in certain clinical conditions are not yet known.
The first aim of this PhD project was to understand the role of the HLA-G in autoimmune and viral
diseases, by performing an association study analyzing SNPs in the HLA-G gene in celiac disease,
systemic lupus erythematosus, rheumatoid arthritis and HCV-positive patients and controls. The
chosen SNPS were hypothetically involved in HLA-G expression and mRNA stability, and located
in the regulatory regions.
Furthermore, we also wanted to understand if variations within the HLA-G promoter may alter its
transcription, and for this reason a luciferase reporter gene assays was conducted.
23
MATERIAL AND METHODS
1. PATIENTS AND CONTROLS
1.1 Celiac patients and controls
We enrolled 420 CD Italian patients (European Caucasian, mean age 21.05±15.5 years) (262
female, mean age 23.8±17.31 years, and 158 male mean age 16.72±10.84 years, female (F)/male
(M) ratio 1.6), of whom 294 patients (181 females and 113 males, F/M ratio 1.6) present DQ2.5
(DQA1*05/DQB1*02/DRB1*03) and 126 patients (81 females and 45 males, F/M ratio 1.8) present
DQ8 (DQA1*03/DQB1*0302/DRB1*04) haplotypes.
All patients were recruited at the Gastroenterology Service of IRCCS Burlo Garofolo (Trieste,
Italy). CD diagnosis was made according to the European Society for Pediatric Gastroenterology,
Hepatology and Nutrition guidelines (Walker-Smith JA et al, 1990): after the evaluation of clinical
symptoms, anti-tissue Transglutaminase (anti-tTG) serological test was performed (with the ELISA
Eu-tTG kit; Eurospital, Trieste, Italy), and EMA antibodies were subsequently screened (with the
Antiendomysium Kit; Eurospital) for results confirmation when ambiguous serological results were
achieved. Molecular HLA typing was used to exclude/include CD in doubtful cases; moreover in
this study we performed the search for HLA Class II risk haplotypes in all CD patients aimed at
stratifying them on the basis of their HLA risk profile for CD.
After confirming the diagnosis of celiac disease, all patients started a gluten-free diet, whose effects
were measured using tTG serology (Eu-tTg kit; Eurospital). Values below 7 AU (Absorbance
Units) were considered as negative; values comprised between 7 and 10 AU were considered
borderline and required EMA analysis; values above 10 AU were considered positive. The mean
serum anti-tTG value was 39.5±5.3 AU (range 13-174) in CD patients; normally, the introduction of
a gluten-free diet leads to a decline in the number of tTG autoantibodies under the cutoff value of
7 AU.
As healthy controls (HC) we enrolled 509 European-Caucasian individuals (mean age 40.64±10.29
years) (277 females, mean age 37.9±8.68 years, 232 males, mean age 43.9±11.12 years, F/M ratio
1.2), of whom 148 (85 female and 63 male, F/M ratio 1.3) with DQ2.5, 67 HC (32 females and 35
males, F/M ratio 0.9) with DQ8 haplotypes and 294 not carrying DQ2.5 or DQ8 (named as NR)
(160 females and 134 males, F/M ratio 1.19).
All subjects had no clinical signs related to the disease, no familiar history of CD and were not on
gluten-free diet. CD was excluded by testing the subjects for the presence of anti-tTG antibodies

24
(mean serum anti-tTG value 1.8±0.3 AU range 0.1–5.3). The study was approved by the local
ethical committee (Burlo Garofolo protocol no. CE/V-71).
1.2 Systemic lupus erythematosus patients and controls
For this study, we enrolled 114 SLE Brazilian patients (mean age 37.5±10.4 years, 110 females and
4 males), and 128 Brazilian controls (mean age 34.11±13.04 years, 105 females and 23 males).
The patients were followed-up at the Division of Rheumatology, Hospital das Clínicas, Federal
University of Pernambuco, Brazil, and fulfilled the American College of Rheumatology Criteria for
SLE diagnosis. Clinical and laboratorial data regarding SLE patients were collected and are
depicted in Table 1. Clinical data were missing (or not complete) for 7 SLE patients.
Table 1: Clinical and laboratorial characteristics of SLE patients
Clinical/laboratorial characteristics Number of patients (%)
Cutaneous alterations (malar and discoid rashes, oral ulcers) 93/107 (86.9%)
Nephritis 54/107 (50.5%)
Arthritis 77/107 (72%)
Hematological alterations (lymphopenia, leucopenia,
thrombocytopenia) 73/107 (68.2%)
Immunological alterations (Anti-SM, Anti-Ro/SSA,
Anticardiolipin) 33/107 (30.8%)
Anti double-strand DNA antibody (anti ds-DNA) 26/107 (24.35%)
Photosensitivity 72/107 (67.3%)
Serositis (Pleuritis, Pericarditis) 24/107 (22.4%)
Neuropsychiatric disorders 8/107 (7.5%)
AntiNuclear Factor positive (FAN) 100/107 (93.5%)
Antiphospholipid Syndrome (APS) 6/107 (5.6%)
25
The healthy controls were blood donors coming from the same geographic area of SLE patients
who did not present any previous family history of autoimmune disorders as ascertained by the
physicians using an appropriate questionnaire.
The ethics committee of Federal University of Pernambuco, Brazil, approved the study (CAAE
03065312.3.0000.5208) and written informed consent was obtained from all individuals.
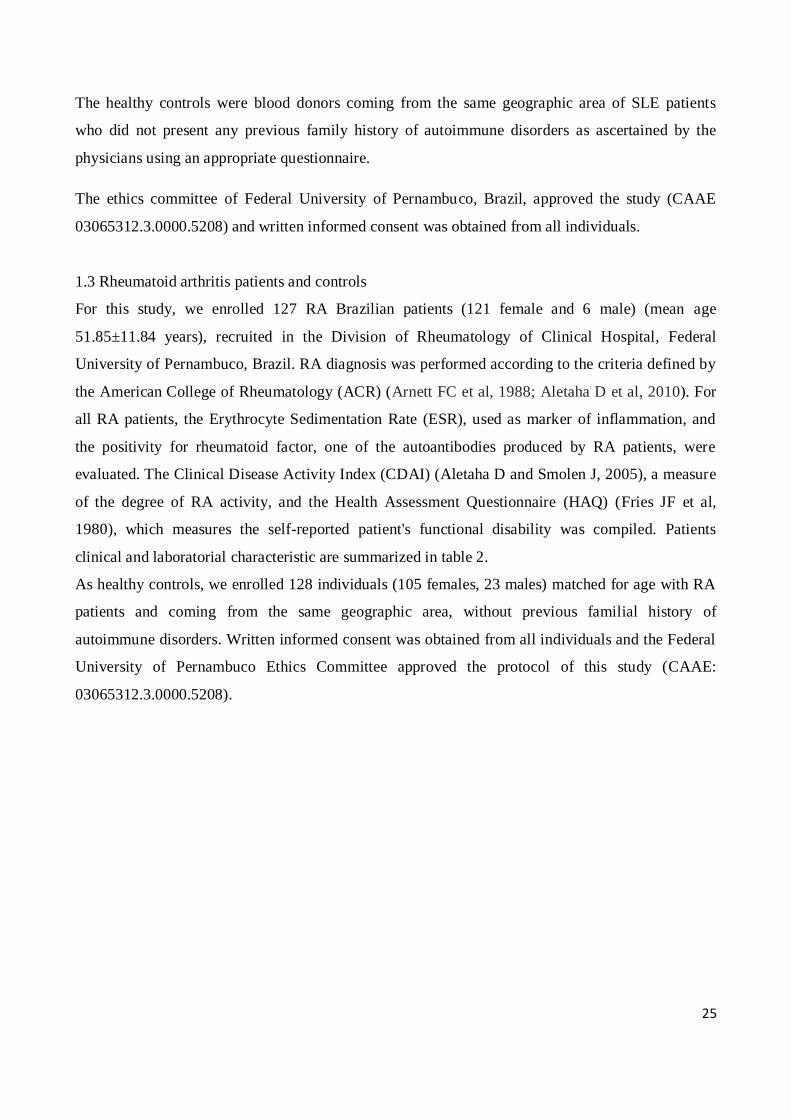
1.3 Rheumatoid arthritis patients and controls
For this study, we enrolled 127 RA Brazilian patients (121 female and 6 male) (mean age
51.85±11.84 years), recruited in the Division of Rheumatology of Clinical Hospital, Federal
University of Pernambuco, Brazil. RA diagnosis was performed according to the criteria defined by
the American College of Rheumatology (ACR) (Arnett FC et al, 1988; Aletaha D et al, 2010). For
all RA patients, the Erythrocyte Sedimentation Rate (ESR), used as marker of inflammation, and
the positivity for rheumatoid factor, one of the autoantibodies produced by RA patients, were
evaluated. The Clinical Disease Activity Index (CDAI) (Aletaha D and Smolen J, 2005), a measure
of the degree of RA activity, and the Health Assessment Questionnaire (HAQ) (Fries JF et al,
1980), which measures the self-reported patient's functional disability was compiled. Patients
clinical and laboratorial characteristic are summarized in table 2.
As healthy controls, we enrolled 128 individuals (105 females, 23 males) matched for age with RA
patients and coming from the same geographic area, without previous familial history of
autoimmune disorders. Written informed consent was obtained from all individuals and the Federal
University of Pernambuco Ethics Committee approved the protocol of this study (CAAE:
03065312.3.0000.5208).
26
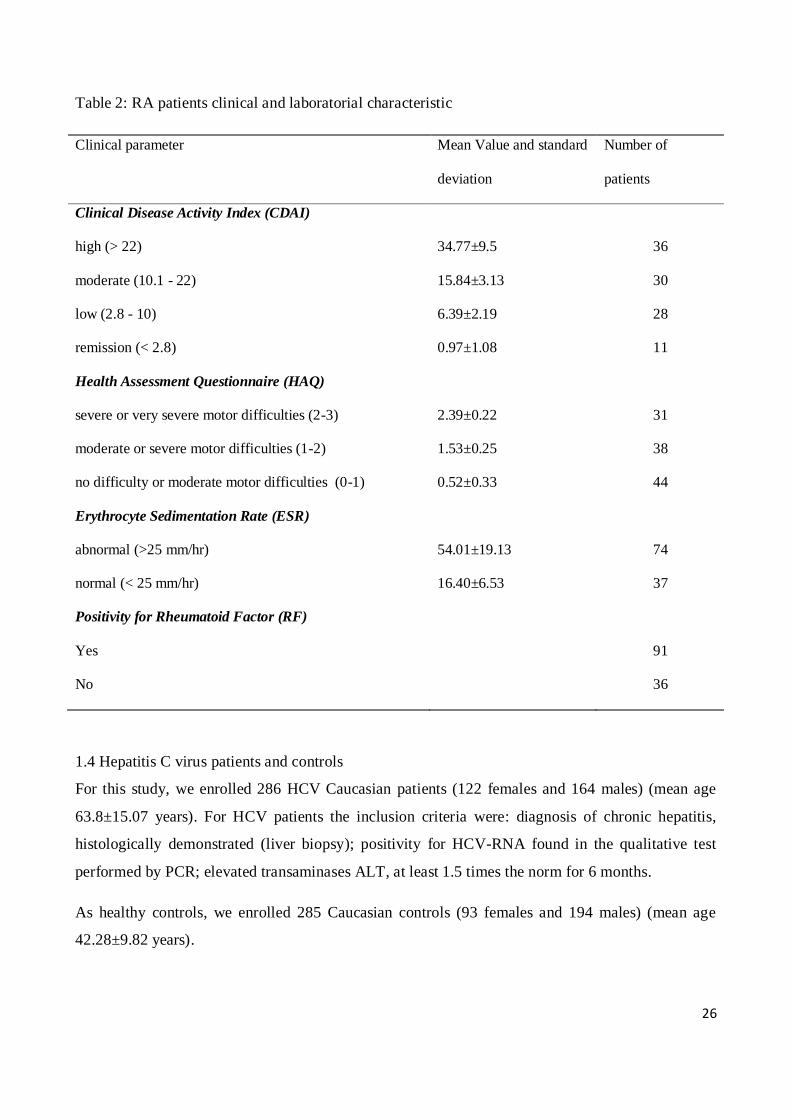
Table 2: RA patients clinical and laboratorial characteristic
Clinical parameter Mean Value and standard
deviation
Number of
patients
Clinical Disease Activity Index (CDAI)
high (> 22) 34.77±9.5 36
moderate (10.1 - 22) 15.84±3.13 30
low (2.8 - 10) 6.39±2.19 28
remission (< 2.8) 0.97±1.08 11
Health Assessment Questionnaire (HAQ)
severe or very severe motor difficulties (2-3) 2.39±0.22 31
moderate or severe motor difficulties (1-2) 1.53±0.25 38
no difficulty or moderate motor difficulties (0-1) 0.52±0.33 44
Erythrocyte Sedimentation Rate (ESR)
abnormal (>25 mm/hr) 54.01±19.13 74
normal (< 25 mm/hr) 16.40±6.53 37
Positivity for Rheumatoid Factor (RF)
Yes 91
No 36
1.4 Hepatitis C virus patients and controls
For this study, we enrolled 286 HCV Caucasian patients (122 females and 164 males) (mean age
63.8±15.07 years). For HCV patients the inclusion criteria were: diagnosis of chronic hepatitis,
histologically demonstrated (liver biopsy); positivity for HCV-RNA found in the qualitative test
performed by PCR; elevated transaminases ALT, at least 1.5 times the norm for 6 months.
As healthy controls, we enrolled 285 Caucasian controls (93 females and 194 males) (mean age
42.28±9.82 years).
27
The patients were followed-up at the Fondazione Italiana Fegato and ambulatorio per la malattie
epatologiche della S.C. Clinica Medica presso l’Ospedale di Cattinara. The healthy controls were
blood donors coming from the same geographic area of HCV patients.
Written informed consent was obtained from all individuals.
2. DNA EXTRACTION
Genomic DNAs of celiac patients and their controls were extracted from peripheral whole blood
using the EZ1 DNA extraction kit and automatic DNA extraction system (Qiagen, Milan),
following the manufacturer's indications.
Genomic DNA of SLE and RA patients and their controls was extracted from peripheral whole
blood using the Wizard Genomic DNA Purification Kit (Promega, WI, USA).
Genomic DNA of HCV and their controls was extracted from peripheral whole blood using salting
out procedure (modified from Miller SA et al, 1988).
3. HLA CLASS II MOLECULAR TYPING
For HLA class II molecular typing of CD patients and controls the Eu-Gen Risk kit (Eurospital,
Trieste, Italy) was used, following the manufacturer's instructions.
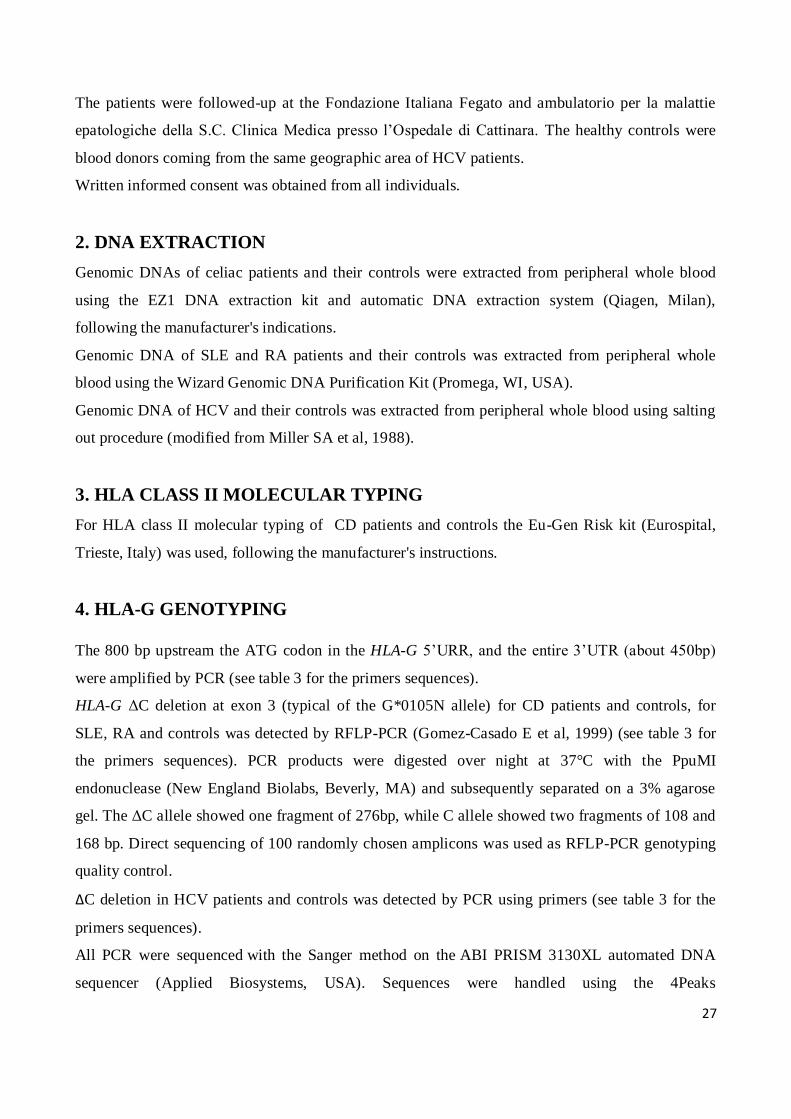
4. HLA-G GENOTYPING
The 800 bp upstream the ATG codon in the HLA-G 5’URR, and the entire 3’UTR (about 450bp)
were amplified by PCR (see table 3 for the primers sequences).
HLA-G ΔC deletion at exon 3 (typical of the G*0105N allele) for CD patients and controls, for
SLE, RA and controls was detected by RFLP-PCR (Gomez-Casado E et al, 1999) (see table 3 for
the primers sequences). PCR products were digested over night at 37°C with the PpuMI
endonuclease (New England Biolabs, Beverly, MA) and subsequently separated on a 3% agarose
gel. The ΔC allele showed one fragment of 276bp, while C allele showed two fragments of 108 and
168 bp. Direct sequencing of 100 randomly chosen amplicons was used as RFLP-PCR genotyping
quality control.
ΔC deletion in HCV patients and controls was detected by PCR using primers (see table 3 for the
primers sequences).
All PCR were sequenced with the Sanger method on the ABI PRISM 3130XL automated DNA
sequencer (Applied Biosystems, USA). Sequences were handled using the 4Peaks
28
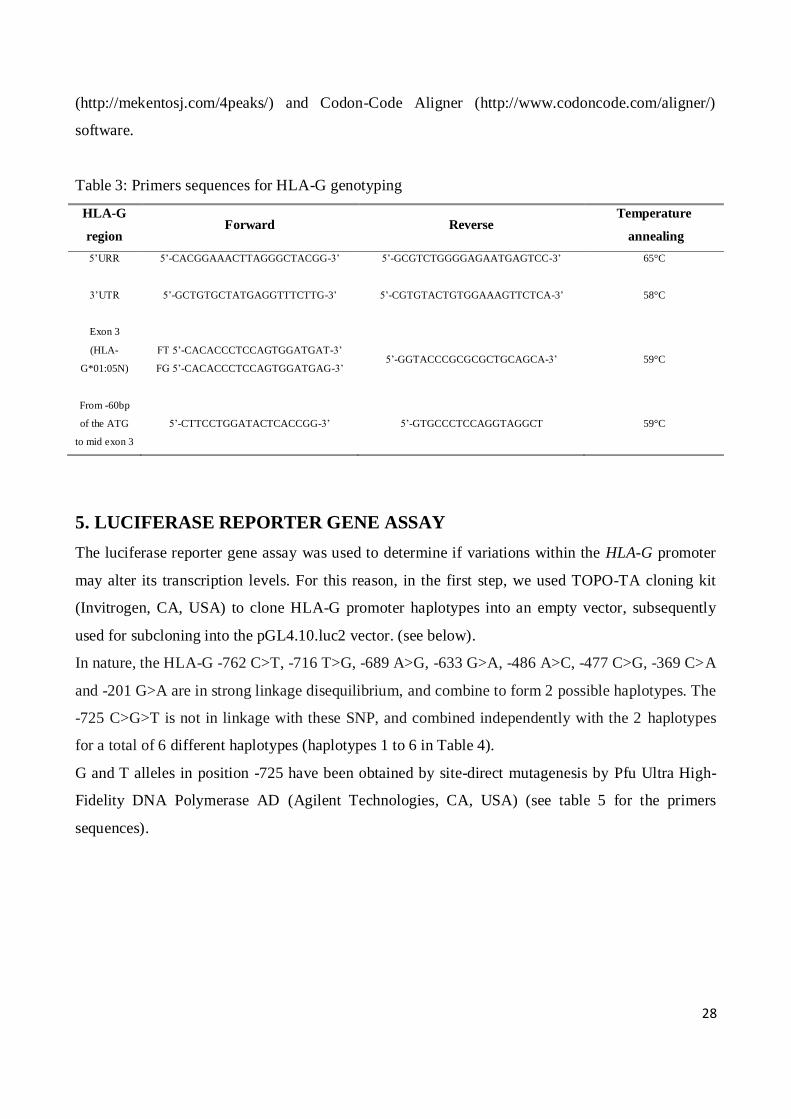
(http://mekentosj.com/4peaks/) and Codon-Code Aligner (http://www.codoncode.com/aligner/)
software.
Table 3: Primers sequences for HLA-G genotyping
HLA-G
region Forward Reverse
Temperature
annealing
5’URR
5’-CACGGAAACTTAGGGCTACGG-3’
5’-GCGTCTGGGGAGAATGAGTCC-3’
65°C
3’UTR
5’-GCTGTGCTATGAGGTTTCTTG-3’
5’-CGTGTACTGTGGAAAGTTCTCA-3’
58°C
Exon 3
(HLA-
G*01:05N)
FT 5’-CACACCCTCCAGTGGATGAT-3’
FG 5’-CACACCCTCCAGTGGATGAG-3’ 5’-GGTACCCGCGCGCTGCAGCA-3’ 59°C
From -60bp
of the ATG
to mid exon 3
5’-CTTCCTGGATACTCACCGG-3’ 5’-GTGCCCTCCAGGTAGGCT 59°C
5. LUCIFERASE REPORTER GENE ASSAY
The luciferase reporter gene assay was used to determine if variations within the HLA-G promoter
may alter its transcription levels. For this reason, in the first step, we used TOPO-TA cloning kit
(Invitrogen, CA, USA) to clone HLA-G promoter haplotypes into an empty vector, subsequently
used for subcloning into the pGL4.10.luc2 vector. (see below).
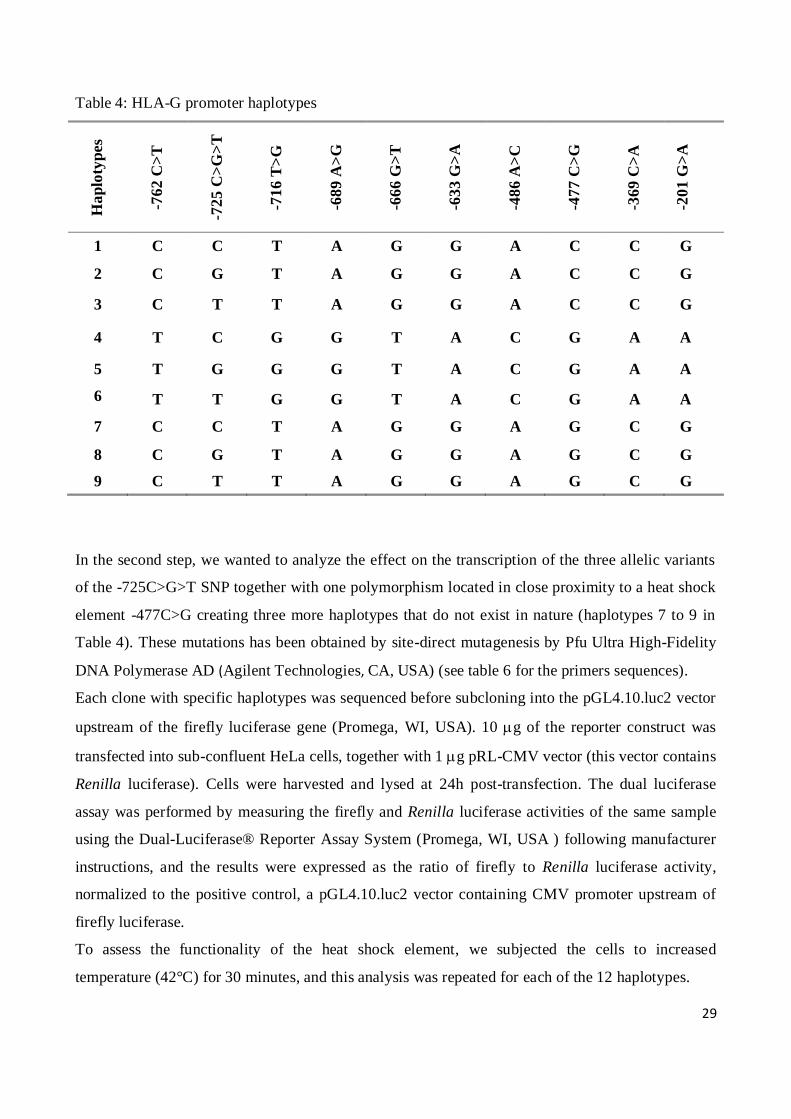
In nature, the HLA-G -762 C>T, -716 T>G, -689 A>G, -633 G>A, -486 A>C, -477 C>G, -369 C>A
and -201 G>A are in strong linkage disequilibrium, and combine to form 2 possible haplotypes. The
-725 C>G>T is not in linkage with these SNP, and combined independently with the 2 haplotypes
for a total of 6 different haplotypes (haplotypes 1 to 6 in Table 4).
G and T alleles in position -725 have been obtained by site-direct mutagenesis by Pfu Ultra High-
Fidelity DNA Polymerase AD (Agilent Technologies, CA, USA) (see table 5 for the primers
sequences).
29
Table 4: HLA-G promoter haplotypes H
ap
loty
pes
-76
2 C
>T
-72
5 C
>G
>T
-71
6 T
>G
-68
9 A
>G
-66
6 G
>T
-63
3 G
>A
-48
6 A
>C
-47
7 C
>G
-36
9 C
>A
-20
1 G
>A
1 C C T A G G A C C G
2 C G T A G G A C C G
3 C T T A G G A C C G
4 T C G G T A C G A A
5 T G G G T A C G A A
6
T T G G T A C G A A
7 C C T A G G A G C G
8 C G T A G G A G C G
9 C T T A G G A G C G
In the second step, we wanted to analyze the effect on the transcription of the three allelic variants
of the -725C>G>T SNP together with one polymorphism located in close proximity to a heat shock
element -477C>G creating three more haplotypes that do not exist in nature (haplotypes 7 to 9 in
Table 4). These mutations has been obtained by site-direct mutagenesis by Pfu Ultra High-Fidelity
DNA Polymerase AD (Agilent Technologies, CA, USA) (see table 6 for the primers sequences).
Each clone with specific haplotypes was sequenced before subcloning into the pGL4.10.luc2 vector
upstream of the firefly luciferase gene (Promega, WI, USA). 10 g of the reporter construct was
transfected into sub-confluent HeLa cells, together with 1g pRL-CMV vector (this vector contains
Renilla luciferase). Cells were harvested and lysed at 24h post-transfection. The dual luciferase
assay was performed by measuring the firefly and Renilla luciferase activities of the same sample
using the Dual-Luciferase® Reporter Assay System (Promega, WI, USA ) following manufacturer
instructions, and the results were expressed as the ratio of firefly to Renilla luciferase activity,
normalized to the positive control, a pGL4.10.luc2 vector containing CMV promoter upstream of
firefly luciferase.
To assess the functionality of the heat shock element, we subjected the cells to increased
temperature (42°C) for 30 minutes, and this analysis was repeated for each of the 12 haplotypes.
30
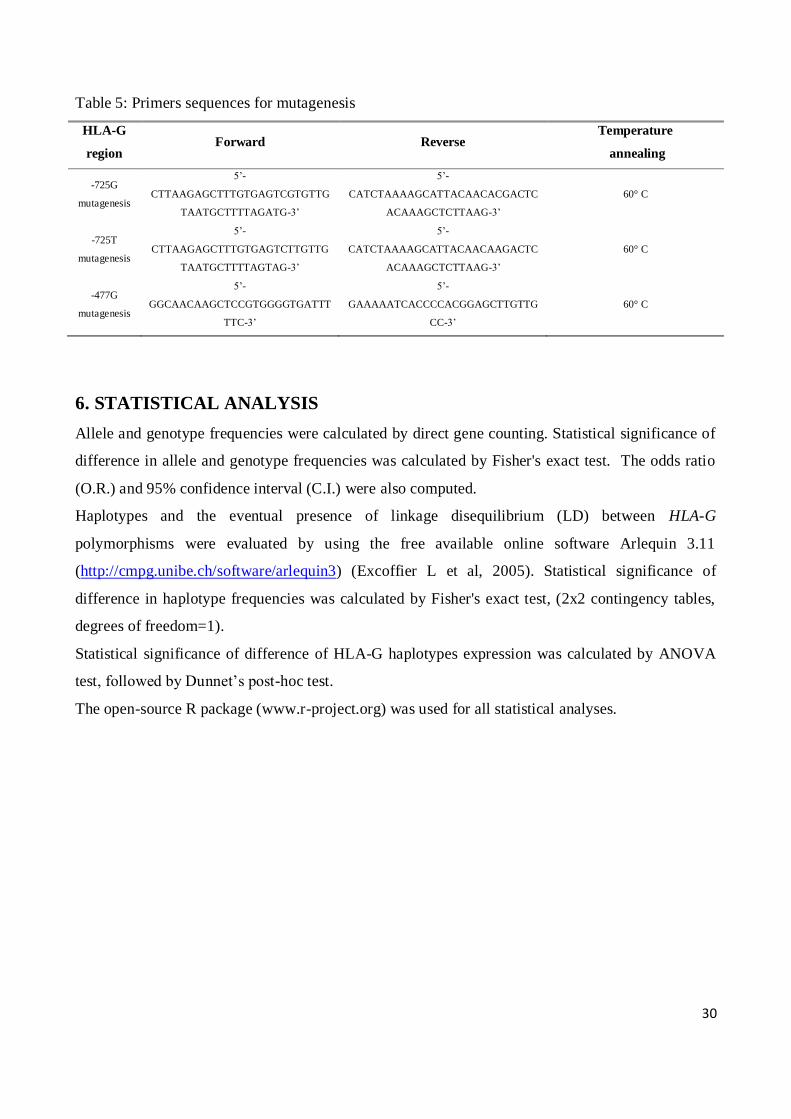
Table 5: Primers sequences for mutagenesis
HLA-G
region Forward Reverse
Temperature
annealing
-725G
mutagenesis
5’-
CTTAAGAGCTTTGTGAGTCGTGTTG
TAATGCTTTTAGATG-3’
5’-
CATCTAAAAGCATTACAACACGACTC
ACAAAGCTCTTAAG-3’
60° C
-725T
mutagenesis
5’-
CTTAAGAGCTTTGTGAGTCTTGTTG
TAATGCTTTTAGTAG-3’
5’-
CATCTAAAAGCATTACAACAAGACTC
ACAAAGCTCTTAAG-3’
60° C
-477G
mutagenesis
5’-
GGCAACAAGCTCCGTGGGGTGATTT
TTC-3’
5’-
GAAAAATCACCCCACGGAGCTTGTTG
CC-3’
60° C
6. STATISTICAL ANALYSIS
Allele and genotype frequencies were calculated by direct gene counting. Statistical significance of
difference in allele and genotype frequencies was calculated by Fisher's exact test. The odds ratio
(O.R.) and 95% confidence interval (C.I.) were also computed.
Haplotypes and the eventual presence of linkage disequilibrium (LD) between HLA-G
polymorphisms were evaluated by using the free available online software Arlequin 3.11
(http://cmpg.unibe.ch/software/arlequin3) (Excoffier L et al, 2005). Statistical significance of
difference in haplotype frequencies was calculated by Fisher's exact test, (2x2 contingency tables,
degrees of freedom=1).
Statistical significance of difference of HLA-G haplotypes expression was calculated by ANOVA
test, followed by Dunnet’s post-hoc test.
The open-source R package (www.r-project.org) was used for all statistical analyses.

31
RESULTS
1. ASSOCIATION STUDIES
We detected 16 polymorphisms in the HLA-G gene, namely -762 C>T (rs1632946), -725 C>G>T
(rs1233334), -716 T>G (rs2249863), -689 A>G (rs2735022), -666 G>T (rs35674592), -646 A>G
(rs17875391), -633 G>A (rs1632944), insG540 (rs17875392), delA533 (rs370236002), -509 C>G
(rs17875393), -486 A>C (rs1736933), -477 C>G (rs1736932), -400 G>A (rs17875395), -391 G>A
(rs17875396), -369 C>A (rs1632943) and -201 G>A (rs1233333) by sequencing the 800bp
upstream the ATG codon (HLA-G 5’URR) (Table 6).
We also identified 8 polymorphisms at HLA-G 3’UTR: 14bp del/ins (rs1704), 3003 T>C (rs1707),
3010 G>C (rs1710), 3027 C>A (rs17179101), 3035 C>T (rs17179108), 3142 C>G (rs1063320),
3187 A>G (rs9380142) and 3196 C>G (rs1610696) (Table 6).
Table 6: HLA-G gene polymorphisms analyzed
SNP rs Chromosome Position (bp) Gene region
-762T>C rs1632946 29794860 5’URR
-725C>G>T rs1233334 29794897 5’URR
-716G>T rs2249863 29794906 5’URR
-689G>A rs2735022 29794933 5’URR
-666T>G rs35674592 29794956 5’URR
-646A>G rs17875391 29794976 5’URR
-633A>G rs1632944 29794989 5’URR
-540G>INS rs17875392 29795077:29795078 5’URR
-533A>DEL rs370236002 29795089 5’URR
-509C>G rs17875393 29795113 5’URR
-486C>A rs1736933 29795136 5’URR
-477G>C rs1736932 29795145 5’URR
-400G>A rs17875395 29795222 5’URR
-391G>A rs17875396 29795231 5’URR
-369A>C rs1632943 29795253 5’URR
-201A>G rs1233333 29795421 5’URR
0105NΔC rs41557518 29796435 Exon 3
14bpDEL/INS rs1704 29798581:29798582 3’UTR
3003T>C rs1707 29798610 3’UTR
3010C>G rs1710 29798617 3’UTR
3027C>A rs17179101 29798634 3’UTR
32
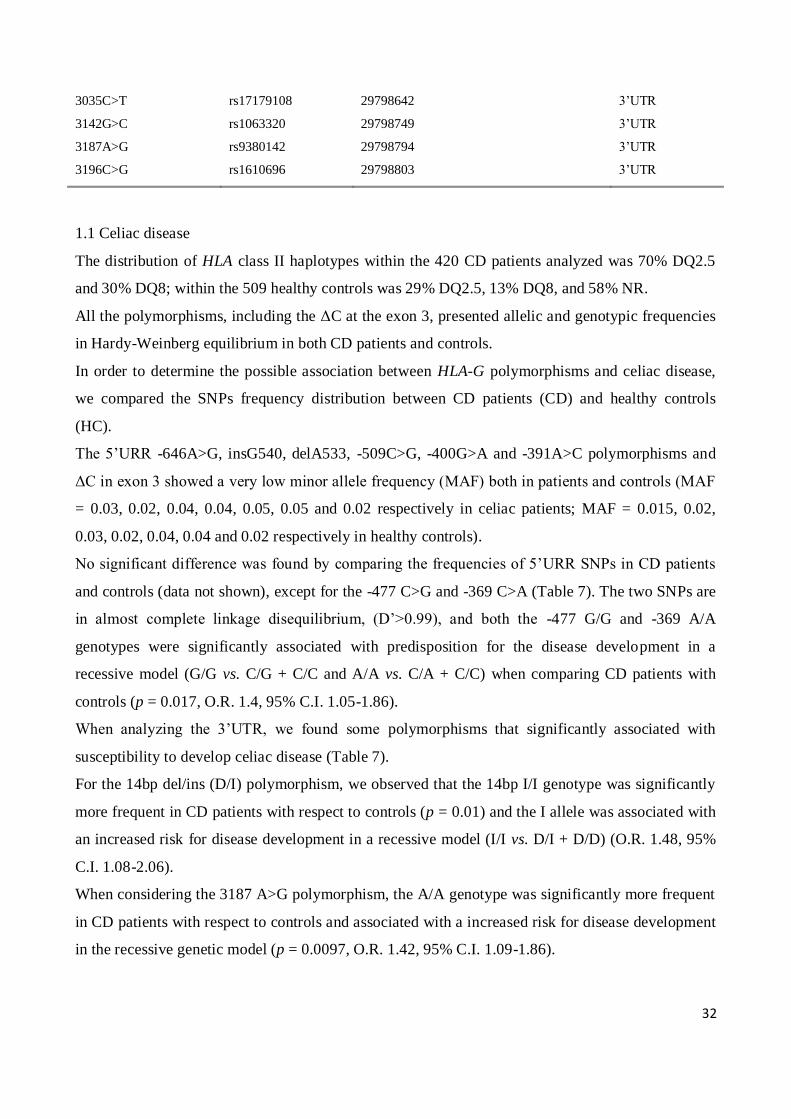
3035C>T rs17179108 29798642 3’UTR
3142G>C rs1063320 29798749 3’UTR
3187A>G rs9380142 29798794 3’UTR
3196C>G rs1610696 29798803 3’UTR
1.1 Celiac disease
The distribution of HLA class II haplotypes within the 420 CD patients analyzed was 70% DQ2.5
and 30% DQ8; within the 509 healthy controls was 29% DQ2.5, 13% DQ8, and 58% NR.
All the polymorphisms, including the ΔC at the exon 3, presented allelic and genotypic frequencies
in Hardy-Weinberg equilibrium in both CD patients and controls.
In order to determine the possible association between HLA-G polymorphisms and celiac disease,
we compared the SNPs frequency distribution between CD patients (CD) and healthy controls
(HC).
The 5’URR -646A>G, insG540, delA533, -509C>G, -400G>A and -391A>C polymorphisms and
ΔC in exon 3 showed a very low minor allele frequency (MAF) both in patients and controls (MAF
= 0.03, 0.02, 0.04, 0.04, 0.05, 0.05 and 0.02 respectively in celiac patients; MAF = 0.015, 0.02,
0.03, 0.02, 0.04, 0.04 and 0.02 respectively in healthy controls).
No significant difference was found by comparing the frequencies of 5’URR SNPs in CD patients
and controls (data not shown), except for the -477 C>G and -369 C>A (Table 7). The two SNPs are
in almost complete linkage disequilibrium, (D’>0.99), and both the -477 G/G and -369 A/A
genotypes were significantly associated with predisposition for the disease development in a
recessive model (G/G vs. C/G + C/C and A/A vs. C/A + C/C) when comparing CD patients with
controls (p = 0.017, O.R. 1.4, 95% C.I. 1.05-1.86).
When analyzing the 3’UTR, we found some polymorphisms that significantly associated with
susceptibility to develop celiac disease (Table 7).
For the 14bp del/ins (D/I) polymorphism, we observed that the 14bp I/I genotype was significantly
more frequent in CD patients with respect to controls (p = 0.01) and the I allele was associated with
an increased risk for disease development in a recessive model (I/I vs. D/I + D/D) (O.R. 1.48, 95%
C.I. 1.08-2.06).
When considering the 3187 A>G polymorphism, the A/A genotype was significantly more frequent
in CD patients with respect to controls and associated with a increased risk for disease development
in the recessive genetic model (p = 0.0097, O.R. 1.42, 95% C.I. 1.09-1.86).
33
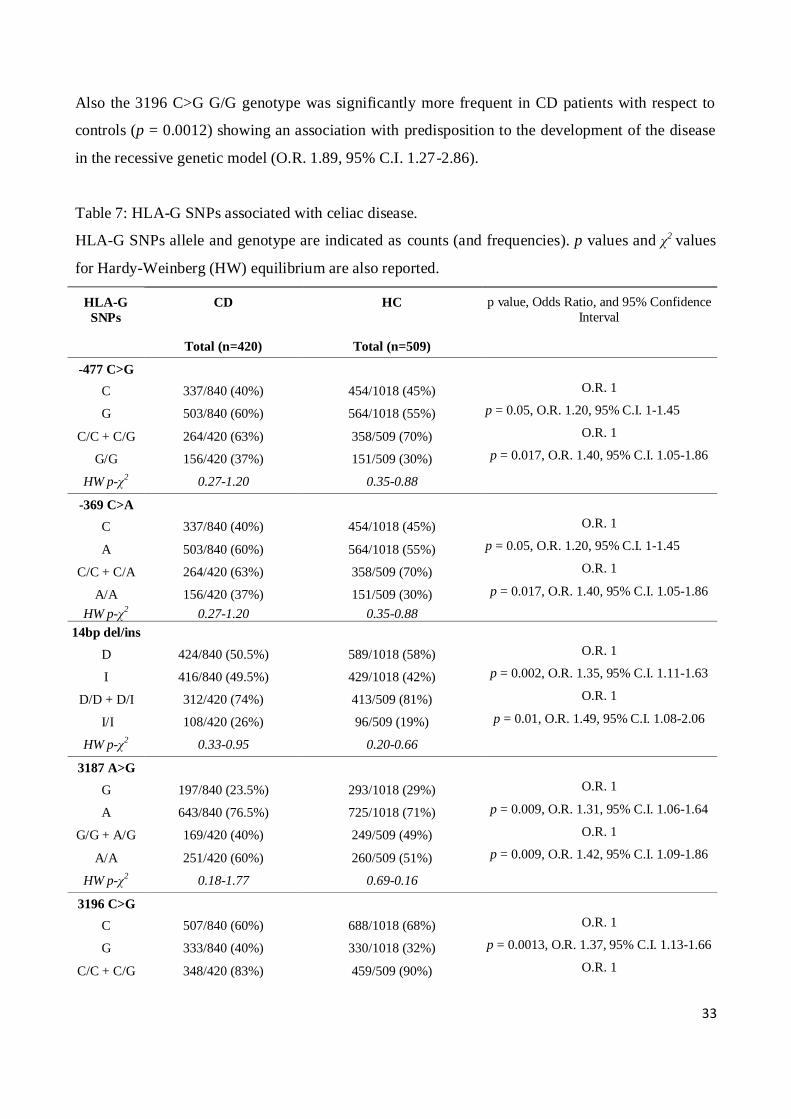
Also the 3196 C>G G/G genotype was significantly more frequent in CD patients with respect to
controls (p = 0.0012) showing an association with predisposition to the development of the disease
in the recessive genetic model (O.R. 1.89, 95% C.I. 1.27-2.86).
Table 7: HLA-G SNPs associated with celiac disease.
HLA-G SNPs allele and genotype are indicated as counts (and frequencies). p values and χ2 values
for Hardy-Weinberg (HW) equilibrium are also reported.
HLA-G
SNPs
CD
HC p value, Odds Ratio, and 95% Confidence
Interval
Total (n=420) Total (n=509)
-477 C>G
C 337/840 (40%) 454/1018 (45%) O.R. 1
G 503/840 (60%) 564/1018 (55%) p = 0.05, O.R. 1.20, 95% C.I. 1-1.45
C/C + C/G 264/420 (63%) 358/509 (70%) O.R. 1
G/G 156/420 (37%) 151/509 (30%) p = 0.017, O.R. 1.40, 95% C.I. 1.05-1.86
HW p-χ2 0.27-1.20 0.35-0.88
-369 C>A
C 337/840 (40%) 454/1018 (45%) O.R. 1
A 503/840 (60%) 564/1018 (55%) p = 0.05, O.R. 1.20, 95% C.I. 1-1.45
C/C + C/A 264/420 (63%) 358/509 (70%) O.R. 1
A/A 156/420 (37%) 151/509 (30%) p = 0.017, O.R. 1.40, 95% C.I. 1.05-1.86
HW p-χ2 0.27-1.20 0.35-0.88
14bp del/ins
D 424/840 (50.5%) 589/1018 (58%) O.R. 1
I 416/840 (49.5%) 429/1018 (42%) p = 0.002, O.R. 1.35, 95% C.I. 1.11-1.63
D/D + D/I 312/420 (74%) 413/509 (81%) O.R. 1
I/I 108/420 (26%) 96/509 (19%) p = 0.01, O.R. 1.49, 95% C.I. 1.08-2.06
HW p-χ2 0.33-0.95 0.20-0.66
3187 A>G
G 197/840 (23.5%) 293/1018 (29%) O.R. 1
A 643/840 (76.5%) 725/1018 (71%) p = 0.009, O.R. 1.31, 95% C.I. 1.06-1.64
G/G + A/G 169/420 (40%) 249/509 (49%) O.R. 1
A/A 251/420 (60%) 260/509 (51%) p = 0.009, O.R. 1.42, 95% C.I. 1.09-1.86
HW p-χ2 0.18-1.77 0.69-0.16
3196 C>G
C 507/840 (60%) 688/1018 (68%) O.R. 1
G 333/840 (40%) 330/1018 (32%) p = 0.0013, O.R. 1.37, 95% C.I. 1.13-1.66
C/C + C/G 348/420 (83%) 459/509 (90%) O.R. 1
34
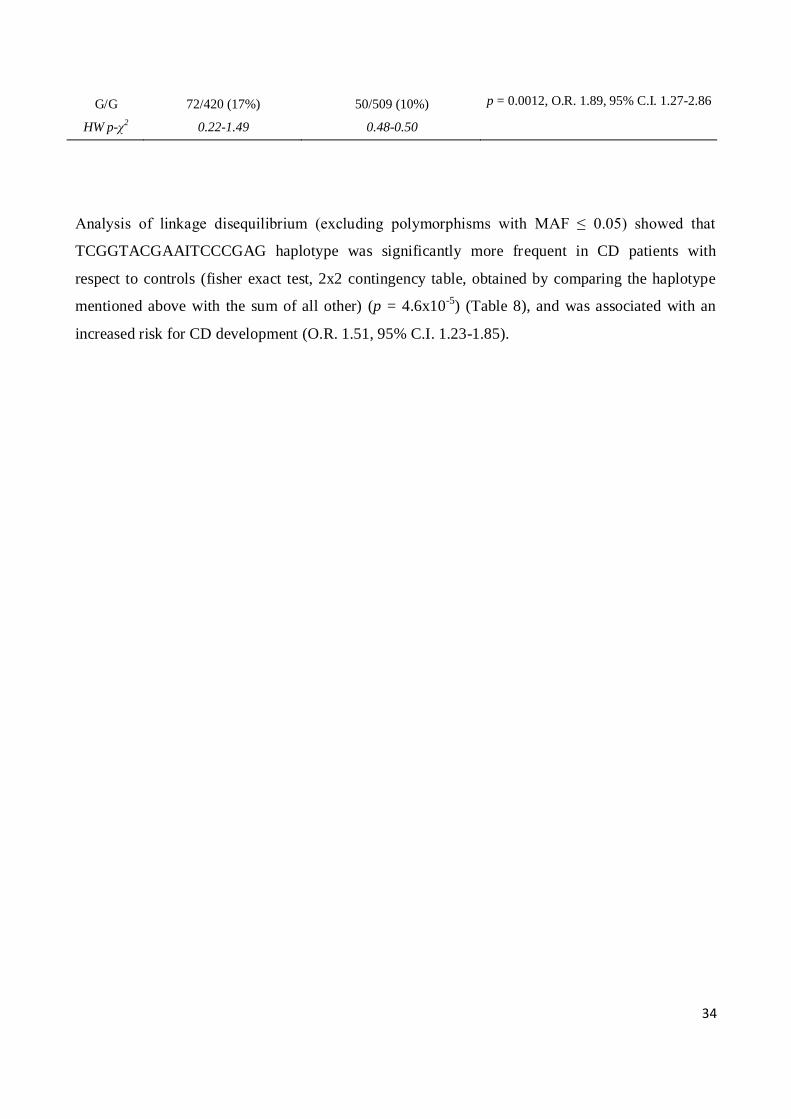
G/G 72/420 (17%) 50/509 (10%) p = 0.0012, O.R. 1.89, 95% C.I. 1.27-2.86
HW p-χ2 0.22-1.49 0.48-0.50
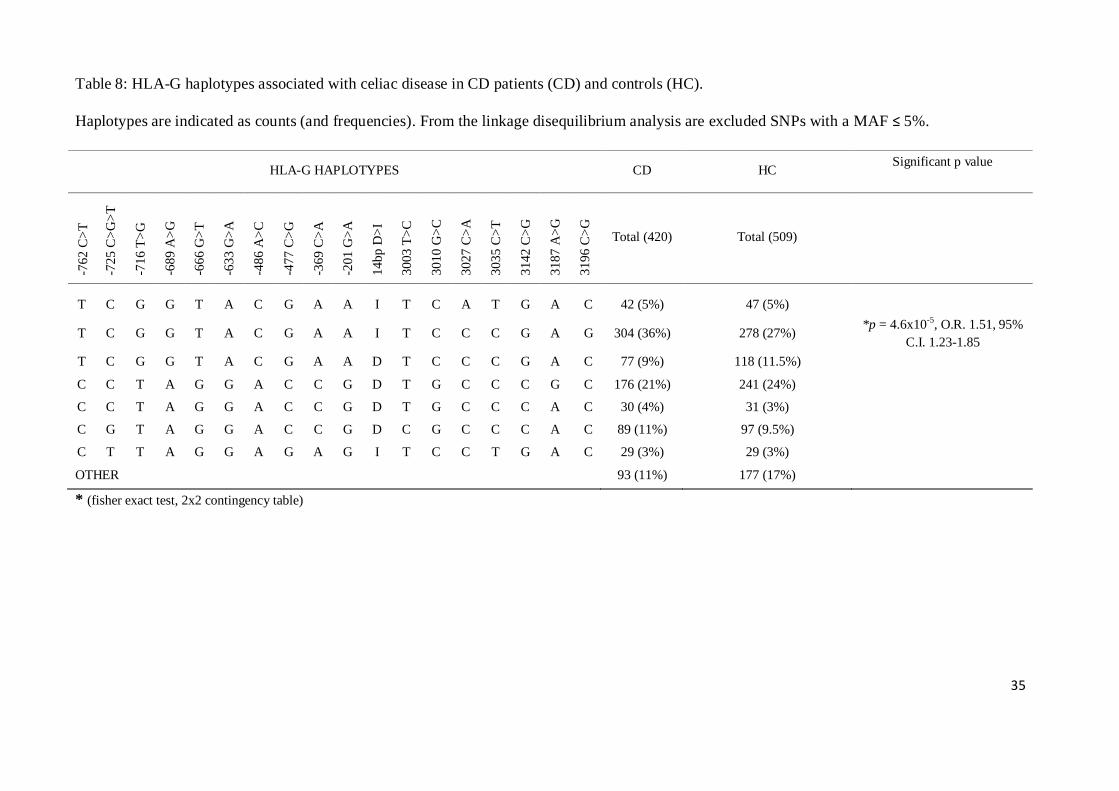
Analysis of linkage disequilibrium (excluding polymorphisms with MAF ≤ 0.05) showed that
TCGGTACGAAITCCCGAG haplotype was significantly more frequent in CD patients with
respect to controls (fisher exact test, 2x2 contingency table, obtained by comparing the haplotype
mentioned above with the sum of all other) (p = 4.6x10⁻⁵
) (Table 8), and was associated with an
increased risk for CD development (O.R. 1.51, 95% C.I. 1.23-1.85).
35
Table 8: HLA-G haplotypes associated with celiac disease in CD patients (CD) and controls (HC).
Haplotypes are indicated as counts (and frequencies). From the linkage disequilibrium analysis are excluded SNPs with a MAF ≤ 5%.
HLA-G HAPLOTYPES CD HC Significant p value
-76
2 C
>T
-72
5 C
>G
>T
-71
6 T
>G
-68
9 A
>G
-66
6 G
>T
-63
3 G
>A
-48
6 A
>C
-47
7 C
>G
-36
9 C
>A
-20
1 G
>A
14
bp
D>
I
30
03
T>
C
30
10
G>
C
30
27
C>
A
30
35
C>
T
31
42
C>
G
31
87
A>
G
31
96
C>
G
Total (420) Total (509)
T C G G T A C G A A I T C A T G A C 42 (5%) 47 (5%)
T C G G T A C G A A I T C C C G A G 304 (36%) 278 (27%) *p = 4.6x10
-5, O.R. 1.51, 95%
C.I. 1.23-1.85
T C G G T A C G A A D T C C C G A C 77 (9%) 118 (11.5%)
C C T A G G A C C G D T G C C C G C 176 (21%) 241 (24%)
C C T A G G A C C G D T G C C C A C 30 (4%) 31 (3%)
C G T A G G A C C G D C G C C C A C 89 (11%) 97 (9.5%)
C T T A G G A G A G I T C C T G A C 29 (3%) 29 (3%)
OTHER 93 (11%) 177 (17%)
* (fisher exact test, 2x2 contingency table)

36
We then compared patients and controls characterized by the same HLA-DQ risk factor for the
development of celiac disease, DQ2.5/DQ8 (HR), in order to highlight the effective role of HLA-G
in the presence/absence of the main genetic risk factor. DQ2.5 and DQ8 haplotype are the major
risk factors for celiac disease and it is know that there is a significant linkage between the HLA
regions. In order to exclude that the associations we found might be due to a different genetic
background HLA DQ between patients and controls, we decided to repeat the analysis of HLA-G
restricting it to patients and controls both characterized by HLA DQ2.5 and/or DQ8.
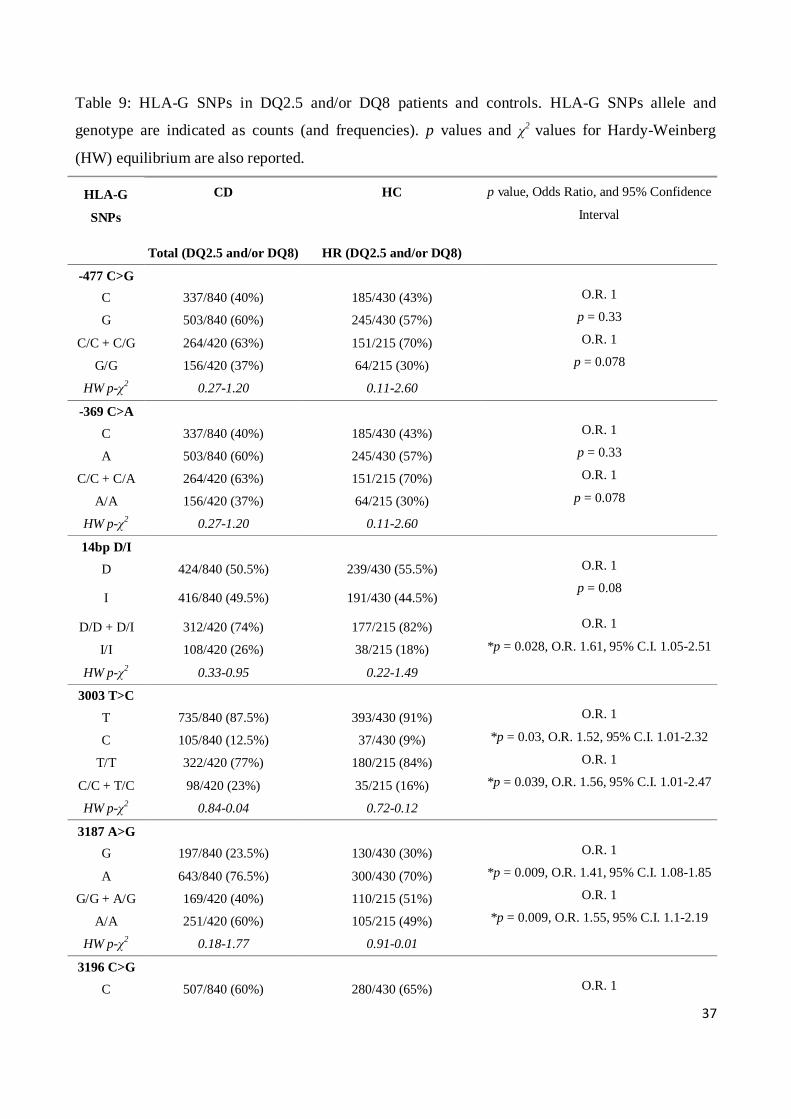
From this comparison, we observed that the -477 C>G and -369 G>A 5'URR SNPs confirmed the
trend (p = 0.07) obtained from the comparison between CD patients and controls, but this did not
attain statistical significance. Instead, the statistically significant association for the SNPs at the
3’UTR observed within the totality of CD patients and controls, was confirmed in the DQ2.5 and/or
DQ8 subgroups. Indeed, the 14bp I/I genotype (p = 0.028, O.R. 1.61, 95% C.I. 1.05-2.51), the 3187
A/A (p = 0.0097, O.R. 1.42, 95% C.I. 1.09-1.86) and the 3196 G/G genotype (p = 0.03 O.R. 1.72,
95% C.I. 1.03-2.99) were still associated with an increased risk for disease development, all
according to a recessive genetic model (Table 9).
Furthermore, we found another association for the 3003 T>C SNP, since the C allele was
significantly more frequent in DQ2.5 and/or DQ8 CD patients with respect to DQ2.5 and/or DQ8
controls (p = 0.039) conferring an increased risk for the disease according to a dominant genetic
model (C/C + C/T vs. T/T) (O.R. 2.91, 95% C.I. 1.01-2.47) (Table 9).
37
Table 9: HLA-G SNPs in DQ2.5 and/or DQ8 patients and controls. HLA-G SNPs allele and
genotype are indicated as counts (and frequencies). p values and χ2 values for Hardy-Weinberg
(HW) equilibrium are also reported.
HLA-G
SNPs
CD
HC p value, Odds Ratio, and 95% Confidence
Interval
Total (DQ2.5 and/or DQ8) HR (DQ2.5 and/or DQ8)
-477 C>G
C 337/840 (40%) 185/430 (43%) O.R. 1
G 503/840 (60%) 245/430 (57%) p = 0.33
C/C + C/G 264/420 (63%) 151/215 (70%) O.R. 1
G/G 156/420 (37%) 64/215 (30%) p = 0.078
HW p-χ2 0.27-1.20 0.11-2.60
-369 C>A
C 337/840 (40%) 185/430 (43%) O.R. 1
A 503/840 (60%) 245/430 (57%) p = 0.33
C/C + C/A 264/420 (63%) 151/215 (70%) O.R. 1
A/A 156/420 (37%) 64/215 (30%) p = 0.078
HW p-χ2 0.27-1.20 0.11-2.60
14bp D/I
D 424/840 (50.5%) 239/430 (55.5%) O.R. 1
I 416/840 (49.5%) 191/430 (44.5%) p = 0.08
D/D + D/I 312/420 (74%) 177/215 (82%) O.R. 1
I/I 108/420 (26%) 38/215 (18%) *p = 0.028, O.R. 1.61, 95% C.I. 1.05-2.51
HW p-χ2 0.33-0.95 0.22-1.49
3003 T>C
T 735/840 (87.5%) 393/430 (91%) O.R. 1
C 105/840 (12.5%) 37/430 (9%) *p = 0.03, O.R. 1.52, 95% C.I. 1.01-2.32
T/T 322/420 (77%) 180/215 (84%) O.R. 1
C/C + T/C 98/420 (23%) 35/215 (16%) *p = 0.039, O.R. 1.56, 95% C.I. 1.01-2.47
HW p-χ2 0.84-0.04 0.72-0.12
3187 A>G
G 197/840 (23.5%) 130/430 (30%) O.R. 1
A 643/840 (76.5%) 300/430 (70%) *p = 0.009, O.R. 1.41, 95% C.I. 1.08-1.85
G/G + A/G 169/420 (40%) 110/215 (51%) O.R. 1
A/A 251/420 (60%) 105/215 (49%) *p = 0.009, O.R. 1.55, 95% C.I. 1.1-2.19
HW p-χ2 0.18-1.77 0.91-0.01
3196 C>G
C 507/840 (60%) 280/430 (65%) O.R. 1
38
G 333/840 (40%) 150/430 (35%) p = 0.09
C/C + C/G 348/420 (83%) 192/215 (89%) O.R. 1
G/G 72/420 (17%) 23/215 (11%) *p = 0.03, O.R. 1.72, 95% C.I. 1.03-2.99
HW p-χ2 0.22-1.49 0.34-0.90
* significant p value
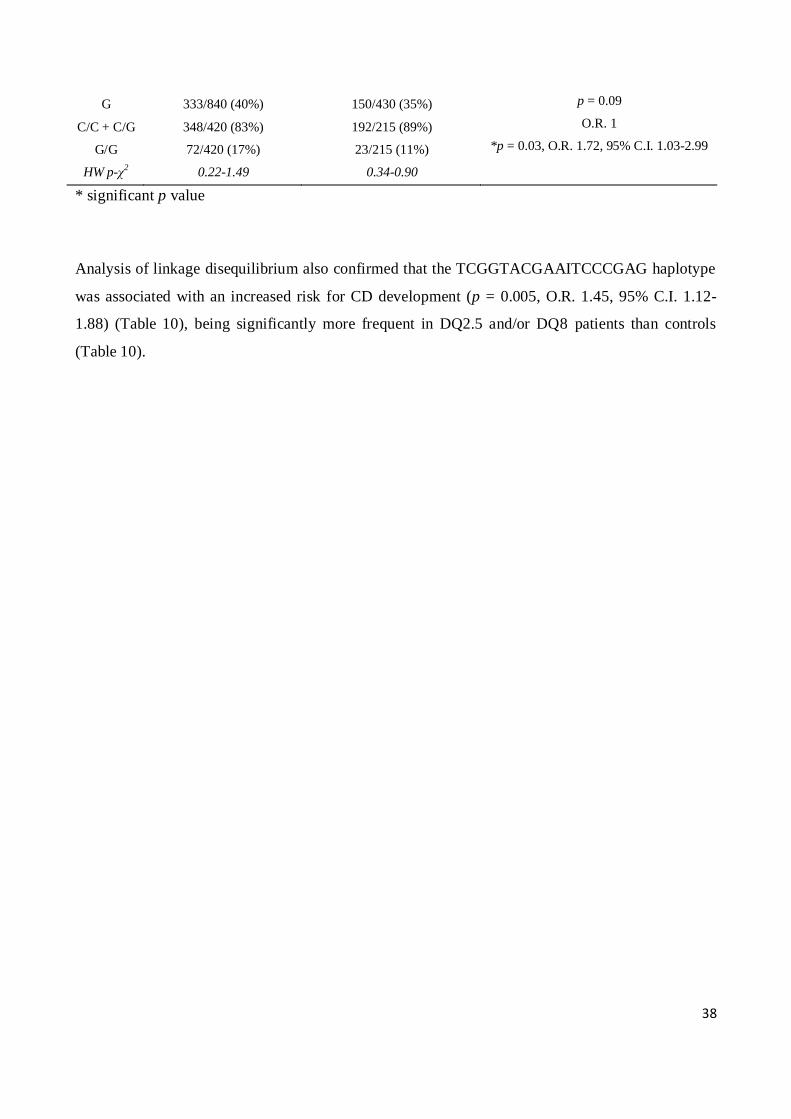
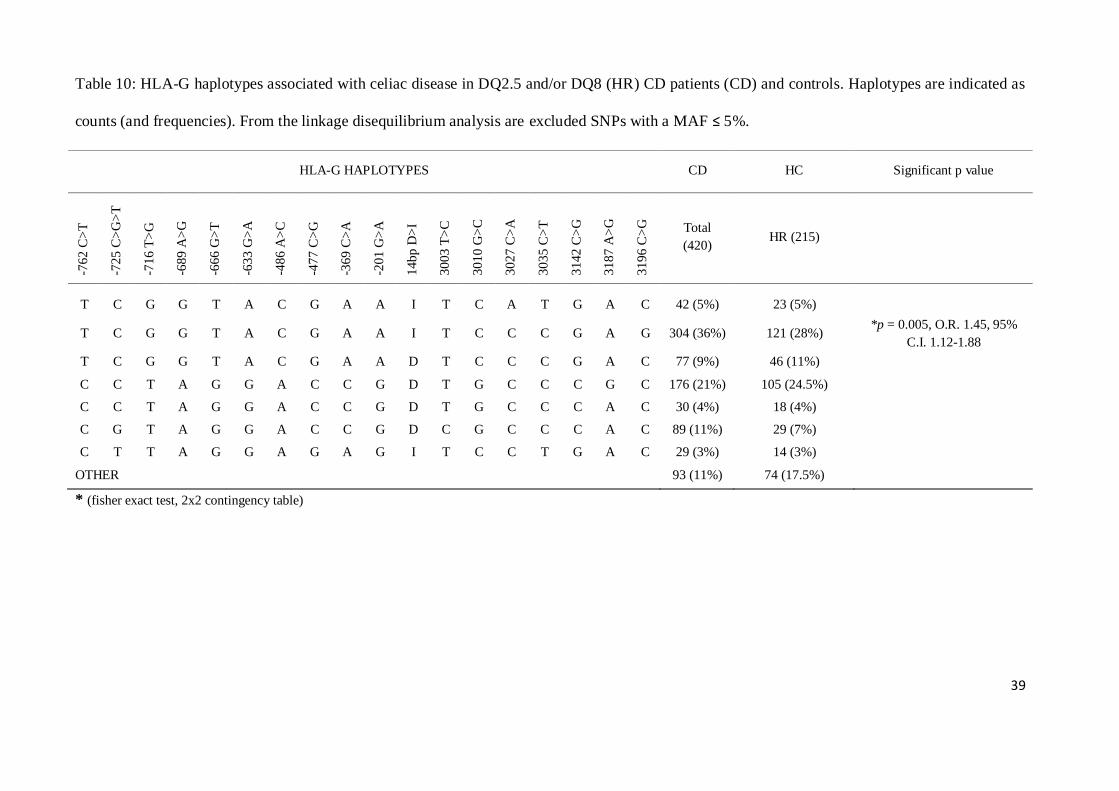
Analysis of linkage disequilibrium also confirmed that the TCGGTACGAAITCCCGAG haplotype
was associated with an increased risk for CD development (p = 0.005, O.R. 1.45, 95% C.I. 1.12-
1.88) (Table 10), being significantly more frequent in DQ2.5 and/or DQ8 patients than controls
(Table 10).
39
Table 10: HLA-G haplotypes associated with celiac disease in DQ2.5 and/or DQ8 (HR) CD patients (CD) and controls. Haplotypes are indicated as
counts (and frequencies). From the linkage disequilibrium analysis are excluded SNPs with a MAF ≤ 5%.
HLA-G HAPLOTYPES CD HC Significant p value
-76
2 C
>T
-72
5 C
>G
>T
-71
6 T
>G
-68
9 A
>G
-66
6 G
>T
-63
3 G
>A
-48
6 A
>C
-47
7 C
>G
-36
9 C
>A
-20
1 G
>A
14
bp
D>
I
30
03
T>
C
30
10
G>
C
30
27
C>
A
30
35
C>
T
31
42
C>
G
31
87
A>
G
31
96
C>
G
Total
(420) HR (215)
T C G G T A C G A A I T C A T G A C 42 (5%) 23 (5%)
T C G G T A C G A A I T C C C G A G 304 (36%) 121 (28%) *p = 0.005, O.R. 1.45, 95%
C.I. 1.12-1.88
T C G G T A C G A A D T C C C G A C 77 (9%) 46 (11%)
C C T A G G A C C G D T G C C C G C 176 (21%) 105 (24.5%)
C C T A G G A C C G D T G C C C A C 30 (4%) 18 (4%)
C G T A G G A C C G D C G C C C A C 89 (11%) 29 (7%)
C T T A G G A G A G I T C C T G A C 29 (3%) 14 (3%)
OTHER 93 (11%) 74 (17.5%)
* (fisher exact test, 2x2 contingency table)

40
1.2 Systemic lupus erythematosus
From the comparison between SLE patients and controls, no significant differences were found in
the allele and genotype frequencies of all HLA-G studied SNPs (data not shown), except for the
3003 T>C (rs1707) polymorphism (Table 11).
The 3003 T>C T allele was indeed significantly more frequent in healthy controls than SLE patients
(94% vs. 88%, p = 0.026, O.R. 0.48, 95% C.I. 0.23-0.94), and was associated with a protective
effect for disease development according to a recessive genetic model (T/T vs. C/T+C/C; p = 0.017,
O.R. = 0.43, 95% C.I. = 0.20-0.90). The C/C genotype was extremely rare, and was found only in
one patient and in one control. Genotype frequencies for the 3003T>C SNP were in HW
equilibrium in both patients and controls groups (χ2
= 0.39, p = 0.53 and χ2
= 0.57 p = 0.45
respectively).
Table 11: HLA-G 3003 T>C (rs1707) SNP association with SLE susceptibility
3003T>C
HLA-G SNP
SLE Patients Controls p value, Odds Ratio, and 95% Confidence
Interval
C 28/228 (0.12) 16/256 (0.06) O.R. 1
T 200/228 (0.88) 240/256 (0.94) p = 0.026, O.R. 0.48, 95% C.I. 0.23-0.94
T/C + C/C 27/114 (0.24) 15/128 (0.12) O.R. 1
T/T 87/114 (0.76) 113/128 (0.88) p = 0.017, O.R. 0.43, 95% C.I. 0.20-0.90
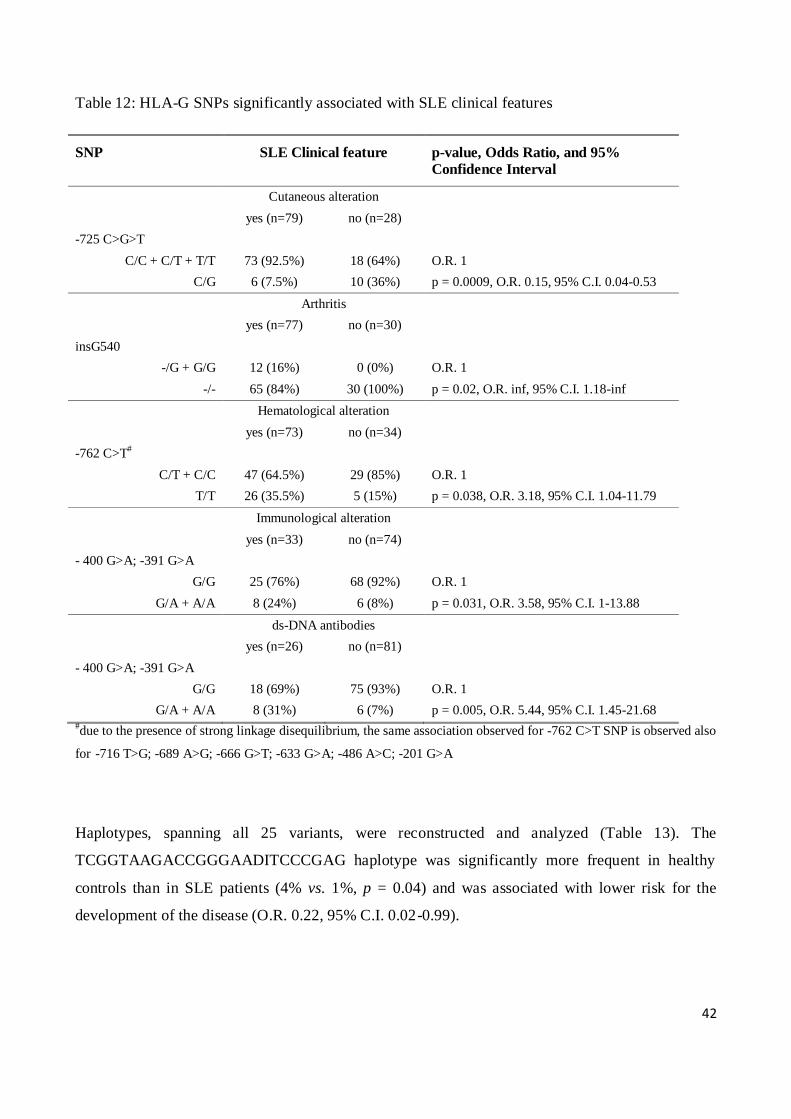
The possible association between HLA-G polymorphisms and several clinical parameters of SLE
patients (described in table 1) was also evaluated, and significant associations were found (Table
12).
In the triallelic -725 C>G>T SNP, the presence of the -725 G allele inversely associated with the
presence of cutaneous alteration (malar and discoid rashes, and oral ulcers) according to a dominant
model (p = 0.0009, O.R. 0.15, 95% C.I. 0.04-0.53).
41
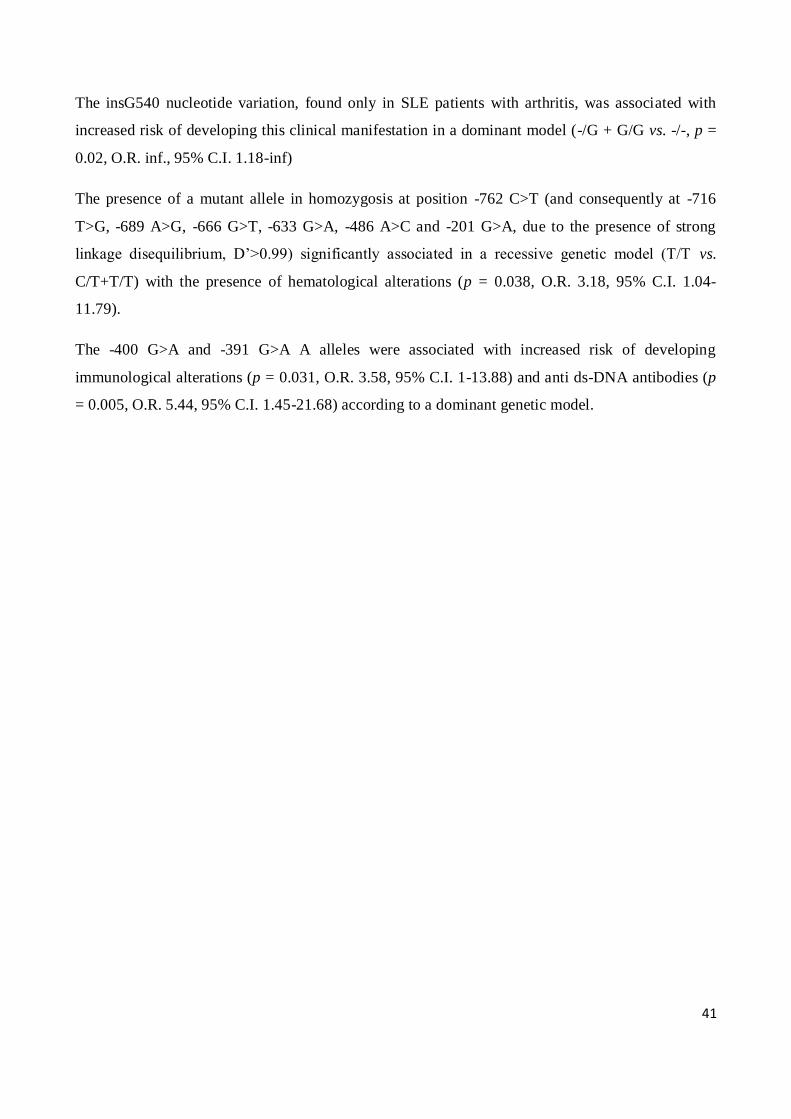
The insG540 nucleotide variation, found only in SLE patients with arthritis, was associated with
increased risk of developing this clinical manifestation in a dominant model (-/G + G/G vs. -/-, p =
0.02, O.R. inf., 95% C.I. 1.18-inf)
The presence of a mutant allele in homozygosis at position -762 C>T (and consequently at -716
T>G, -689 A>G, -666 G>T, -633 G>A, -486 A>C and -201 G>A, due to the presence of strong
linkage disequilibrium, D’>0.99) significantly associated in a recessive genetic model (T/T vs.
C/T+T/T) with the presence of hematological alterations (p = 0.038, O.R. 3.18, 95% C.I. 1.04-
11.79).
The -400 G>A and -391 G>A A alleles were associated with increased risk of developing
immunological alterations (p = 0.031, O.R. 3.58, 95% C.I. 1-13.88) and anti ds-DNA antibodies (p
= 0.005, O.R. 5.44, 95% C.I. 1.45-21.68) according to a dominant genetic model.
42
Table 12: HLA-G SNPs significantly associated with SLE clinical features
SNP SLE Clinical feature p-value, Odds Ratio, and 95%
Confidence Interval
Cutaneous alteration
yes (n=79) no (n=28)
-725 C>G>T
C/C + C/T + T/T 73 (92.5%) 18 (64%) O.R. 1
C/G 6 (7.5%) 10 (36%) p = 0.0009, O.R. 0.15, 95% C.I. 0.04-0.53
Arthritis
yes (n=77) no (n=30)
insG540
-/G + G/G 12 (16%) 0 (0%) O.R. 1
-/- 65 (84%) 30 (100%) p = 0.02, O.R. inf, 95% C.I. 1.18-inf
Hematological alteration
yes (n=73) no (n=34)
-762 C>T#
C/T + C/C 47 (64.5%) 29 (85%) O.R. 1
T/T 26 (35.5%) 5 (15%) p = 0.038, O.R. 3.18, 95% C.I. 1.04-11.79
Immunological alteration
yes (n=33) no (n=74)
- 400 G>A; -391 G>A
G/G 25 (76%) 68 (92%) O.R. 1
G/A + A/A 8 (24%) 6 (8%) p = 0.031, O.R. 3.58, 95% C.I. 1-13.88
ds-DNA antibodies
yes (n=26) no (n=81)
- 400 G>A; -391 G>A
G/G 18 (69%) 75 (93%) O.R. 1
G/A + A/A 8 (31%) 6 (7%) p = 0.005, O.R. 5.44, 95% C.I. 1.45-21.68 #due to the presence of strong linkage disequilibrium, the same association observed for -762 C>T SNP is observed also
for -716 T>G; -689 A>G; -666 G>T; -633 G>A; -486 A>C; -201 G>A
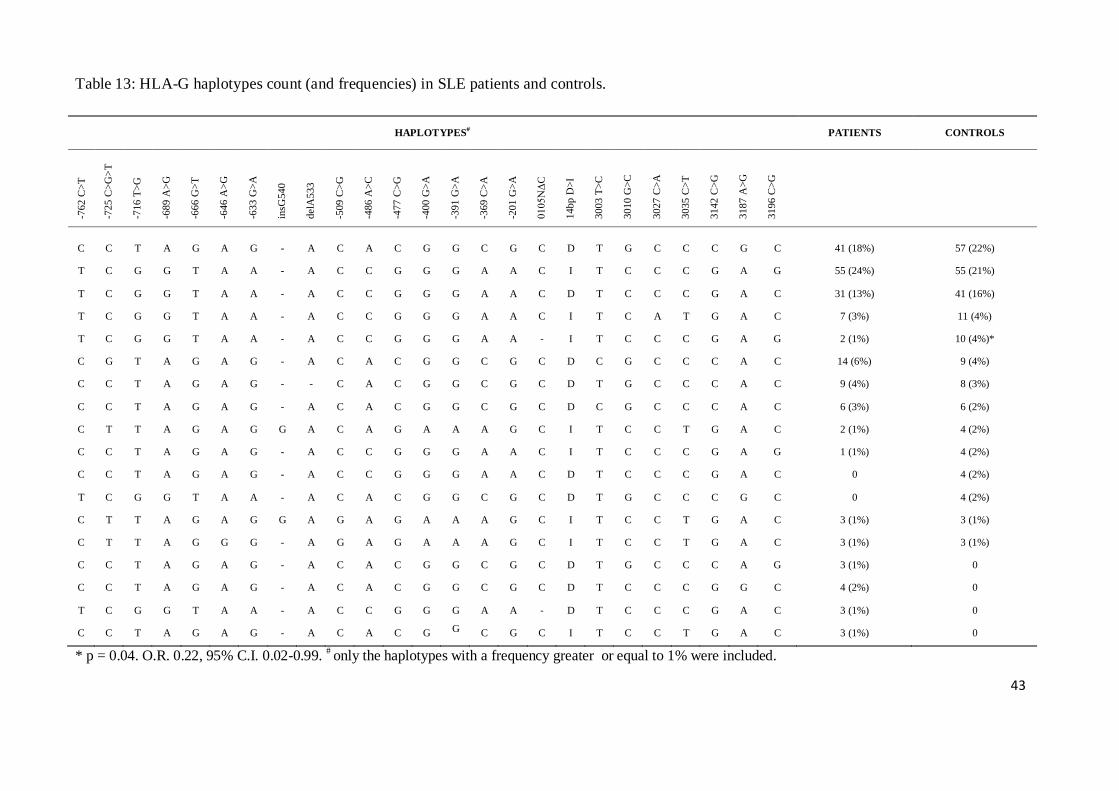
Haplotypes, spanning all 25 variants, were reconstructed and analyzed (Table 13). The
TCGGTAAGACCGGGAADITCCCGAG haplotype was significantly more frequent in healthy
controls than in SLE patients (4% vs. 1%, p = 0.04) and was associated with lower risk for the
development of the disease (O.R. 0.22, 95% C.I. 0.02-0.99).
43
Table 13: HLA-G haplotypes count (and frequencies) in SLE patients and controls.
HAPLOTYPES# PATIENTS CONTROLS
-762 C
>T
-725 C
>G
>T
-716 T
>G
-689 A
>G
-666 G
>T
-646 A
>G
-633 G
>A
insG
540
del
A533
-509 C
>G
-486 A
>C
-477 C
>G
-400 G
>A
-391 G
>A
-369 C
>A
-201 G
>A
0105N
ΔC
14bp D
>I
3003 T
>C
3010 G
>C
3027 C
>A
3035 C
>T
3142 C
>G
3187 A
>G
3196 C
>G
C C T A G A G - A C A C G G C G C D T G C C C G C 41 (18%) 57 (22%)
T C G G T A A - A C C G G G A A C I T C C C G A G 55 (24%) 55 (21%)
T C G G T A A - A C C G G G A A C D T C C C G A C 31 (13%) 41 (16%)
T C G G T A A - A C C G G G A A C I T C A T G A C 7 (3%) 11 (4%)
T C G G T A A - A C C G G G A A - I T C C C G A G 2 (1%) 10 (4%)*
C G T A G A G - A C A C G G C G C D C G C C C A C 14 (6%) 9 (4%)
C C T A G A G - - C A C G G C G C D T G C C C A C 9 (4%) 8 (3%)
C C T A G A G - A C A C G G C G C D C G C C C A C 6 (3%) 6 (2%)
C T T A G A G G A C A G A A A G C I T C C T G A C 2 (1%) 4 (2%)
C C T A G A G - A C C G G G A A C I T C C C G A G 1 (1%) 4 (2%)
C C T A G A G - A C C G G G A A C D T C C C G A C 0 4 (2%)
T C G G T A A - A C A C G G C G C D T G C C C G C 0 4 (2%)
C T T A G A G G A G A G A A A G C I T C C T G A C 3 (1%) 3 (1%)
C T T A G G G - A G A G A A A G C I T C C T G A C 3 (1%) 3 (1%)
C C T A G A G - A C A C G G C G C D T G C C C A G 3 (1%) 0
C C T A G A G - A C A C G G C G C D T C C C G G C 4 (2%) 0
T C G G T A A - A C C G G G A A - D T C C C G A C 3 (1%) 0
C C T A G A G - A C A C G G
C G C I T C C T G A C 3 (1%) 0
* p = 0.04. O.R. 0.22, 95% C.I. 0.02-0.99. # only the haplotypes with a frequency greater or equal to 1% were included.
44
1.3 Rheumatoid arthritis
When analyzing 5’URR, we observed that the -762T, -716G, -689G, -666T, -633A, -486C and -
201A alleles were more frequent in controls with respect to RA patients (54% vs. 41%, p = 0.005)
(Table 14), and were all associated with a protective effect for disease development (O.R. 0.60,
95% C.I. 0.42-0.87). The association was compatible with a recessive model, where the presence of
the mutant allele in homozygosis confers a protective effect for disease development when
compared to heterozygous plus homozygous wild type genotypes (p = 0.001, O.R. 0.37, 95% C.I.
0.19-0.70) (Table 15).
When considering the triallelic SNP -725C>G>T, the G allele was more frequent in RA patients
than in controls (11.5% vs. 5%, p = 0.009, table 14) and this allele was associated with
predisposition to disease development (O.R. 2.4, 95% C.I. 1.18-5.17). The association was
confirmed at the genotype level when genotypes with at least one G allele were compared with
genotypes that do not contain that allele (p = 0.01, O.R. 2.49, 95% C.I. 1.17-5.54) (C/G + G/G
+G/T vs C/C + T/T +C/T) (Table 15).
The -477G and -369A alleles were more frequent in controls with respect to RA patients (62% vs.
52% p = 0.039, O.R. 0.68, 95% C.I. 0.47-0.98, table 16) and the presence of these alleles in
homozygosis conferred a protective effect for disease development compared to heterozygous and
homozygous wild type alleles (p = 0.005, O.R. 0.45, 95% C.I. 0.25-0.80) (Table 15).
The 5’URR -646A>G, insG540, delA533, -509C>G, -400G>A and -391A>C polymorphisms
showed very low minor allele frequencies (MAF) in both patients and controls (MAF ≤0.08) and no
significant difference was found by comparing their frequencies in RA patients and controls (Table
14).
No significant differences between RA patients and controls were found also for exon 3 ΔC
polymorphism and for most of HLA-G 3’UTR SNPs, namely 14bp del/ins, 3010G>C, 3027C>A,
3035C>T, 3142C>G, 3187A>G and 3196C>G (Table 14).
The 3003T allele was more frequent in healthy controls with respect to RA patients (94% vs. 86%,
p = 0.005, O.R. 0.42, 95% C.I. 0.21-0.80) (Table 14) and this allele was associated with a minor
risk for disease development in a recessive model (T/T vs. C/C + C/T) (p = 0.0025, O.R. 0.36, 95%
C.I. 0.17-0.74) (Table 15).
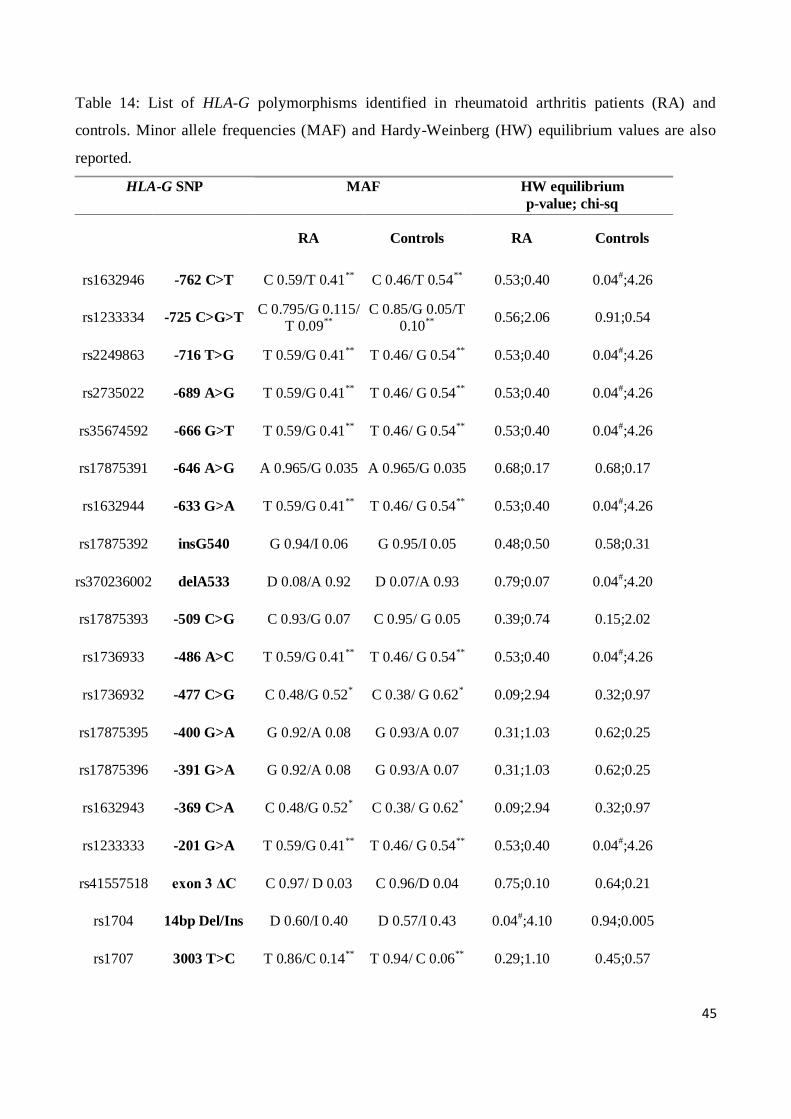
45
Table 14: List of HLA-G polymorphisms identified in rheumatoid arthritis patients (RA) and
controls. Minor allele frequencies (MAF) and Hardy-Weinberg (HW) equilibrium values are also
reported.
HLA-G SNP MAF HW equilibrium
p-value; chi-sq
RA Controls RA Controls
rs1632946 -762 C>T C 0.59/T 0.41** C 0.46/T 0.54** 0.53;0.40 0.04#;4.26
rs1233334 -725 C>G>T C 0.795/G 0.115/
T 0.09** C 0.85/G 0.05/T
0.10** 0.56;2.06 0.91;0.54
rs2249863 -716 T>G T 0.59/G 0.41** T 0.46/ G 0.54** 0.53;0.40 0.04#;4.26
rs2735022 -689 A>G T 0.59/G 0.41** T 0.46/ G 0.54** 0.53;0.40 0.04#;4.26
rs35674592 -666 G>T T 0.59/G 0.41** T 0.46/ G 0.54** 0.53;0.40 0.04#;4.26
rs17875391 -646 A>G A 0.965/G 0.035 A 0.965/G 0.035 0.68;0.17 0.68;0.17
rs1632944 -633 G>A T 0.59/G 0.41** T 0.46/ G 0.54** 0.53;0.40 0.04#;4.26
rs17875392 insG540 G 0.94/I 0.06 G 0.95/I 0.05 0.48;0.50 0.58;0.31
rs370236002 delA533 D 0.08/A 0.92 D 0.07/A 0.93 0.79;0.07 0.04#;4.20
rs17875393 -509 C>G C 0.93/G 0.07 C 0.95/ G 0.05 0.39;0.74 0.15;2.02
rs1736933 -486 A>C T 0.59/G 0.41** T 0.46/ G 0.54** 0.53;0.40 0.04#;4.26
rs1736932 -477 C>G C 0.48/G 0.52* C 0.38/ G 0.62* 0.09;2.94 0.32;0.97
rs17875395 -400 G>A G 0.92/A 0.08 G 0.93/A 0.07 0.31;1.03 0.62;0.25
rs17875396 -391 G>A G 0.92/A 0.08 G 0.93/A 0.07 0.31;1.03 0.62;0.25
rs1632943 -369 C>A C 0.48/G 0.52* C 0.38/ G 0.62* 0.09;2.94 0.32;0.97
rs1233333 -201 G>A T 0.59/G 0.41** T 0.46/ G 0.54** 0.53;0.40 0.04#;4.26
rs41557518 exon 3 ΔC C 0.97/ D 0.03 C 0.96/D 0.04 0.75;0.10 0.64;0.21
rs1704 14bp Del/Ins D 0.60/I 0.40 D 0.57/I 0.43 0.04#;4.10 0.94;0.005
rs1707 3003 T>C T 0.86/C 0.14** T 0.94/ C 0.06** 0.29;1.10 0.45;0.57

46
rs1710 3010 G>C G 0.48/ C 0.52 G 0.39/ C 0.61 0.002#;9.80 0.10;2.75
rs17179101 3027 C>A C 0.97/A 0.03 C 0.95/A 0.05 0.71;0.13 0.29;1.10
rs17179108 3035 C>T C 0.86/T 0.14 C 0.86/T 0.14 0.29;1.10 0.65;0.21
rs1063320 3142 C>G C 0.48/ G 0.52 C 0.39/ G 0.61 0.002#;9.80 0.10;2.75
rs9380142 3187 A>G A 0.72/ G 0.28 A 0.75/G 0.25 0.20;1.70 0.35;0.89
rs1610696 3196 C>G C 0.72/ G 0.28 C 0.71/G 0.29 0.46;0.53 0.20;1.65
# HW p-values <0.05
*Allelic comparison p-values <0.05
** p-values <0.01
Table 15: Analysis of dominant and/or recessive genetic models for HLA-G alleles significantly
associated with rheumatoid arthritis.
HLA-G SNPs Rheumatoid Arthritis
patients (RA) Controls p-value, O.R., C.I.
-762 C>T
TT 0.16 (20) 0.33 (43) p = 0.001, O.R. 0.37, C.I. 0.19-
0.70 CC+CT 0.84 (107) 0.67 (85)
-725 C>G>T
CG+GG+GT 0.22 (28) 0.098 (13) p = 0.01, O.R. 2.49, C.I. 1.17-
5.54 CC+TT+CT 0.78 (99) 0.902 (115)
-716 T>G
GG 0.16 (20) 0.33 (43) p = 0.001, O.R. 0.37, C.I. 0.19-
0.70 TT+TG 0.84 (107) 0.67 (85)
-689 A>G
GG 0.16 (20) 0.33 (43) p = 0.001, O.R. 0.37, C.I. 0.19-
0.70 AA+AG 0.84 (107) 0.67 (85)
-666 G>T
TT 0.16 (20) 0.33 (43) p = 0.001, O.R. 0.37, C.I. 0.19-
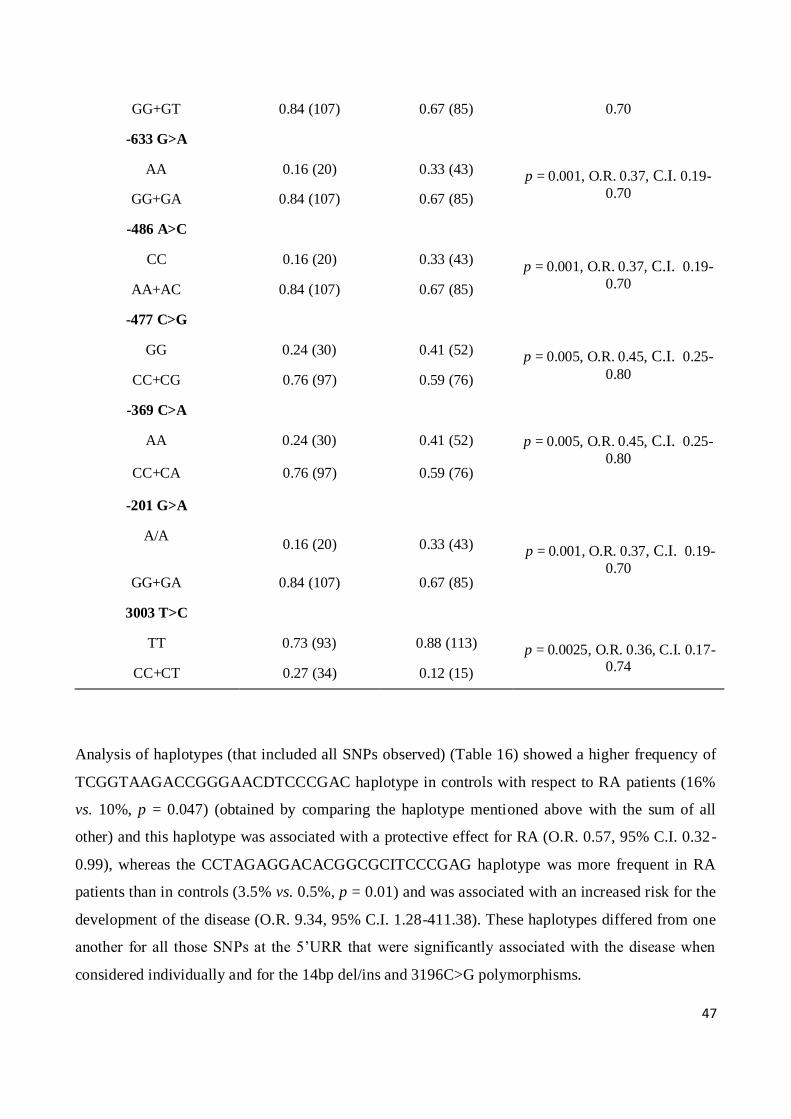
47
GG+GT 0.84 (107) 0.67 (85) 0.70
-633 G>A
AA 0.16 (20) 0.33 (43) p = 0.001, O.R. 0.37, C.I. 0.19-
0.70 GG+GA 0.84 (107) 0.67 (85)
-486 A>C
CC 0.16 (20) 0.33 (43) p = 0.001, O.R. 0.37, C.I. 0.19-
0.70 AA+AC 0.84 (107) 0.67 (85)
-477 C>G
GG 0.24 (30) 0.41 (52) p = 0.005, O.R. 0.45, C.I. 0.25-
0.80 CC+CG 0.76 (97) 0.59 (76)
-369 C>A
AA 0.24 (30) 0.41 (52) p = 0.005, O.R. 0.45, C.I. 0.25-
0.80
CC+CA 0.76 (97) 0.59 (76)
-201 G>A
A/A
0.16 (20) 0.33 (43) p = 0.001, O.R. 0.37, C.I. 0.19-
0.70 GG+GA 0.84 (107) 0.67 (85)
3003 T>C
TT 0.73 (93) 0.88 (113) p = 0.0025, O.R. 0.36, C.I. 0.17-0.74 CC+CT 0.27 (34) 0.12 (15)
Analysis of haplotypes (that included all SNPs observed) (Table 16) showed a higher frequency of
TCGGTAAGACCGGGAACDTCCCGAC haplotype in controls with respect to RA patients (16%
vs. 10%, p = 0.047) (obtained by comparing the haplotype mentioned above with the sum of all
other) and this haplotype was associated with a protective effect for RA (O.R. 0.57, 95% C.I. 0.32-
0.99), whereas the CCTAGAGGACACGGCGCITCCCGAG haplotype was more frequent in RA
patients than in controls (3.5% vs. 0.5%, p = 0.01) and was associated with an increased risk for the
development of the disease (O.R. 9.34, 95% C.I. 1.28-411.38). These haplotypes differed from one
another for all those SNPs at the 5’URR that were significantly associated with the disease when
considered individually and for the 14bp del/ins and 3196C>G polymorphisms.
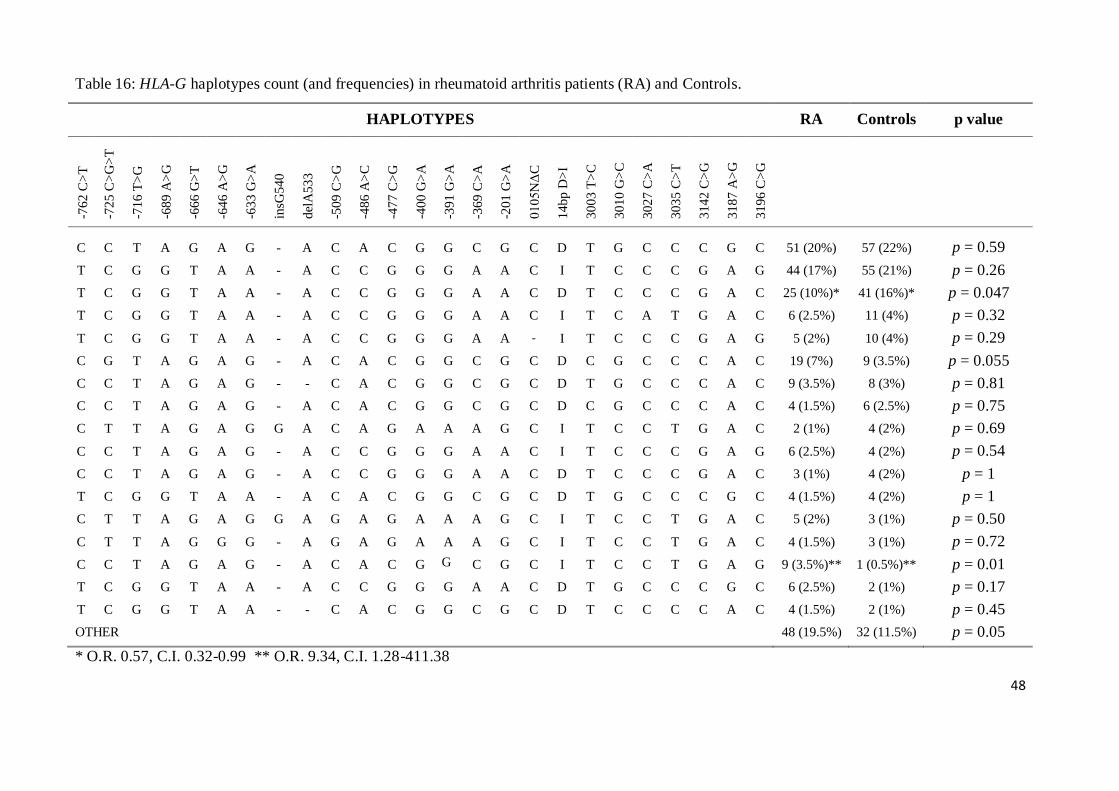
48
Table 16: HLA-G haplotypes count (and frequencies) in rheumatoid arthritis patients (RA) and Controls.
HAPLOTYPES RA Controls p value
-76
2 C
>T
-72
5 C
>G
>T
-71
6 T
>G
-68
9 A
>G
-66
6 G
>T
-64
6 A
>G
-63
3 G
>A
insG
54
0
del
A5
33
-50
9 C
>G
-48
6 A
>C
-47
7 C
>G
-40
0 G
>A
-39
1 G
>A
-36
9 C
>A
-20
1 G
>A
01
05
NΔ
C
14
bp
D>
I
30
03
T>
C
30
10
G>
C
30
27
C>
A
30
35
C>
T
31
42
C>
G
31
87
A>
G
31
96
C>
G
C C T A G A G - A C A C G G C G C D T G C C C G C 51 (20%) 57 (22%) p = 0.59
T C G G T A A - A C C G G G A A C I T C C C G A G 44 (17%) 55 (21%) p = 0.26
T C G G T A A - A C C G G G A A C D T C C C G A C 25 (10%)*
41 (16%)* p = 0.047
T C G G T A A - A C C G G G A A C I T C A T G A C 6 (2.5%) 11 (4%) p = 0.32
T C G G T A A - A C C G G G A A - I T C C C G A G 5 (2%) 10 (4%) p = 0.29
C G T A G A G - A C A C G G C G C D C G C C C A C 19 (7%) 9 (3.5%) p = 0.055
C C T A G A G - - C A C G G C G C D T G C C C A C 9 (3.5%) 8 (3%) p = 0.81
C C T A G A G - A C A C G G C G C D C G C C C A C 4 (1.5%) 6 (2.5%) p = 0.75
C T T A G A G G A C A G A A A G C I T C C T G A C 2 (1%) 4 (2%) p = 0.69
C C T A G A G - A C C G G G A A C I T C C C G A G 6 (2.5%) 4 (2%) p = 0.54
C C T A G A G - A C C G G G A A C D T C C C G A C 3 (1%) 4 (2%) p = 1
T C G G T A A - A C A C G G C G C D T G C C C G C 4 (1.5%) 4 (2%) p = 1
C T T A G A G G A G A G A A A G C I T C C T G A C 5 (2%) 3 (1%) p = 0.50
C T T A G G G - A G A G A A A G C I T C C T G A C 4 (1.5%) 3 (1%) p = 0.72
C C T A G A G - A C A C G G
C G C I T C C T G A G 9 (3.5%)** 1 (0.5%)** p = 0.01
T C G G T A A - A C C G G G A A C D T G C C C G C 6 (2.5%) 2 (1%) p = 0.17
T C G G T A A - - C A C G G C G C D T C C C C A C 4 (1.5%) 2 (1%) p = 0.45
OTHER 48 (19.5%) 32 (11.5%) p = 0.05
* O.R. 0.57, C.I. 0.32-0.99 ** O.R. 9.34, C.I. 1.28-411.38

49
We then evaluated the possible association of the HLA-G gene polymorphisms with the clinical
parameters of the disease (CDAI, ESR and HAQ) as well as with the production of rheumatoid
factor. We only found one significant association, namely between the delA533 SNP and CDAI
(Kruskal-Wallis equality-of-populations rank test p = 0.04, chi-squared with ties = 6.434 with 2
d.f): the A/D heterozygous patients were characterized by a higher median CDAI values compared
to A/A patients (Two-sample Wilcoxon rank-sum (Mann-Whitney) test (Prob > |z| = 0.0457)).
(Figure 11).Only one patient was D/D homozygous so it was not included in the analysis
Figure 11: Box plot of Clinical Disease Activity Index median values (CDAI, on y-axis) in RA
patients stratified according to HLA-G delA533 polymorphism genotype (A/A and D/A, on x-axis).
* two-sample Wilcoxon rank-sum (Mann-Whitney) test p = 0.0457
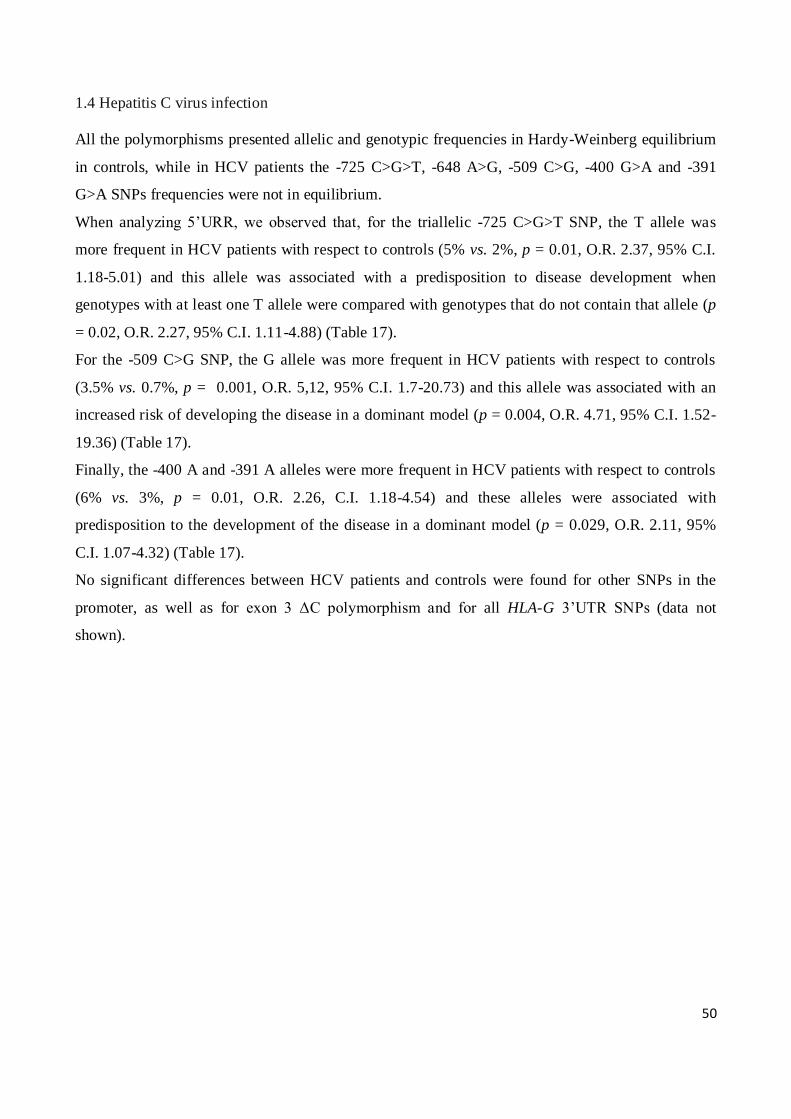
50
1.4 Hepatitis C virus infection
All the polymorphisms presented allelic and genotypic frequencies in Hardy-Weinberg equilibrium
in controls, while in HCV patients the -725 C>G>T, -648 A>G, -509 C>G, -400 G>A and -391
G>A SNPs frequencies were not in equilibrium.
When analyzing 5’URR, we observed that, for the triallelic -725 C>G>T SNP, the T allele was
more frequent in HCV patients with respect to controls (5% vs. 2%, p = 0.01, O.R. 2.37, 95% C.I.
1.18-5.01) and this allele was associated with a predisposition to disease development when
genotypes with at least one T allele were compared with genotypes that do not contain that allele (p
= 0.02, O.R. 2.27, 95% C.I. 1.11-4.88) (Table 17).
For the -509 C>G SNP, the G allele was more frequent in HCV patients with respect to controls
(3.5% vs. 0.7%, p = 0.001, O.R. 5,12, 95% C.I. 1.7-20.73) and this allele was associated with an
increased risk of developing the disease in a dominant model (p = 0.004, O.R. 4.71, 95% C.I. 1.52-
19.36) (Table 17).
Finally, the -400 A and -391 A alleles were more frequent in HCV patients with respect to controls
(6% vs. 3%, p = 0.01, O.R. 2.26, C.I. 1.18-4.54) and these alleles were associated with
predisposition to the development of the disease in a dominant model (p = 0.029, O.R. 2.11, 95%
C.I. 1.07-4.32) (Table 17).
No significant differences between HCV patients and controls were found for other SNPs in the
promoter, as well as for exon 3 ΔC polymorphism and for all HLA-G 3’UTR SNPs (data not
shown).
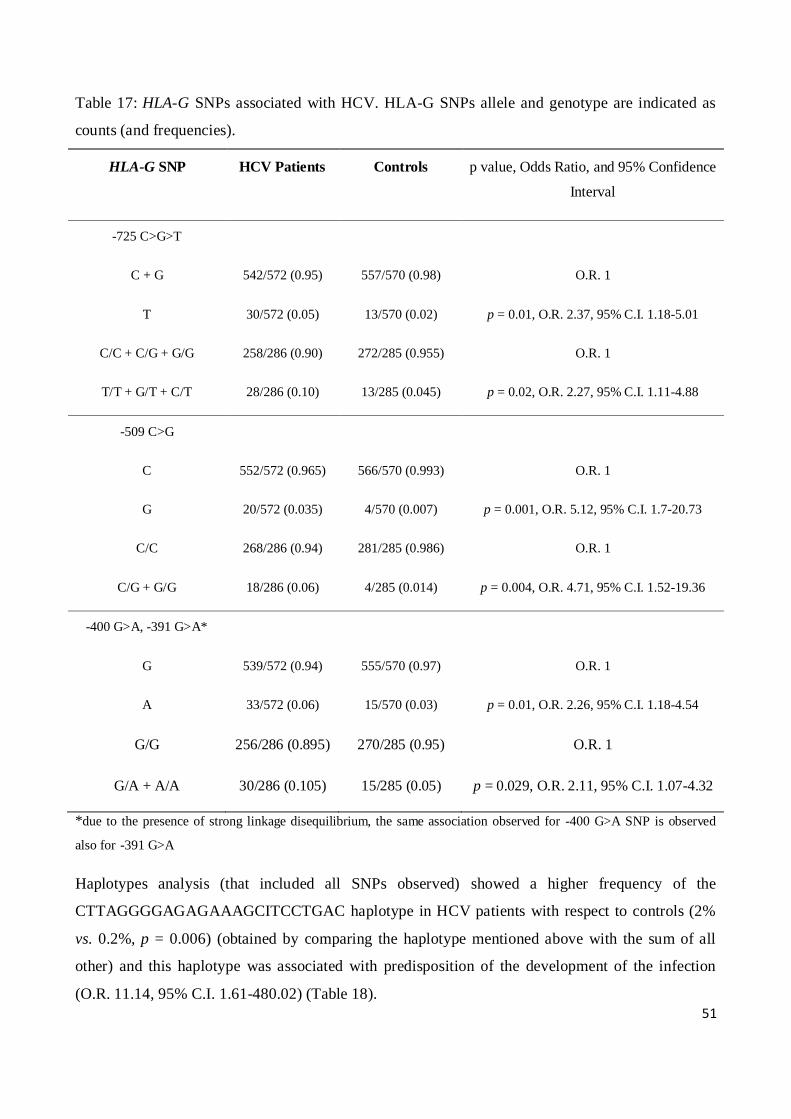
51
Table 17: HLA-G SNPs associated with HCV. HLA-G SNPs allele and genotype are indicated as
counts (and frequencies).
HLA-G SNP HCV Patients Controls p value, Odds Ratio, and 95% Confidence
Interval
-725 C>G>T
C + G 542/572 (0.95) 557/570 (0.98) O.R. 1
T 30/572 (0.05) 13/570 (0.02) p = 0.01, O.R. 2.37, 95% C.I. 1.18-5.01
C/C + C/G + G/G 258/286 (0.90) 272/285 (0.955) O.R. 1
T/T + G/T + C/T 28/286 (0.10) 13/285 (0.045) p = 0.02, O.R. 2.27, 95% C.I. 1.11-4.88
-509 C>G
C 552/572 (0.965) 566/570 (0.993) O.R. 1
G 20/572 (0.035) 4/570 (0.007) p = 0.001, O.R. 5.12, 95% C.I. 1.7-20.73
C/C 268/286 (0.94) 281/285 (0.986) O.R. 1
C/G + G/G 18/286 (0.06) 4/285 (0.014) p = 0.004, O.R. 4.71, 95% C.I. 1.52-19.36
-400 G>A, -391 G>A*
G 539/572 (0.94) 555/570 (0.97) O.R. 1
A 33/572 (0.06) 15/570 (0.03) p = 0.01, O.R. 2.26, 95% C.I. 1.18-4.54
G/G 256/286 (0.895) 270/285 (0.95) O.R. 1
G/A + A/A 30/286 (0.105) 15/285 (0.05) p = 0.029, O.R. 2.11, 95% C.I. 1.07-4.32
*due to the presence of strong linkage disequilibrium, the same association observed for -400 G>A SNP is observed
also for -391 G>A
Haplotypes analysis (that included all SNPs observed) showed a higher frequency of the
CTTAGGGGAGAGAAAGCITCCTGAC haplotype in HCV patients with respect to controls (2%
vs. 0.2%, p = 0.006) (obtained by comparing the haplotype mentioned above with the sum of all
other) and this haplotype was associated with predisposition of the development of the infection
(O.R. 11.14, 95% C.I. 1.61-480.02) (Table 18).
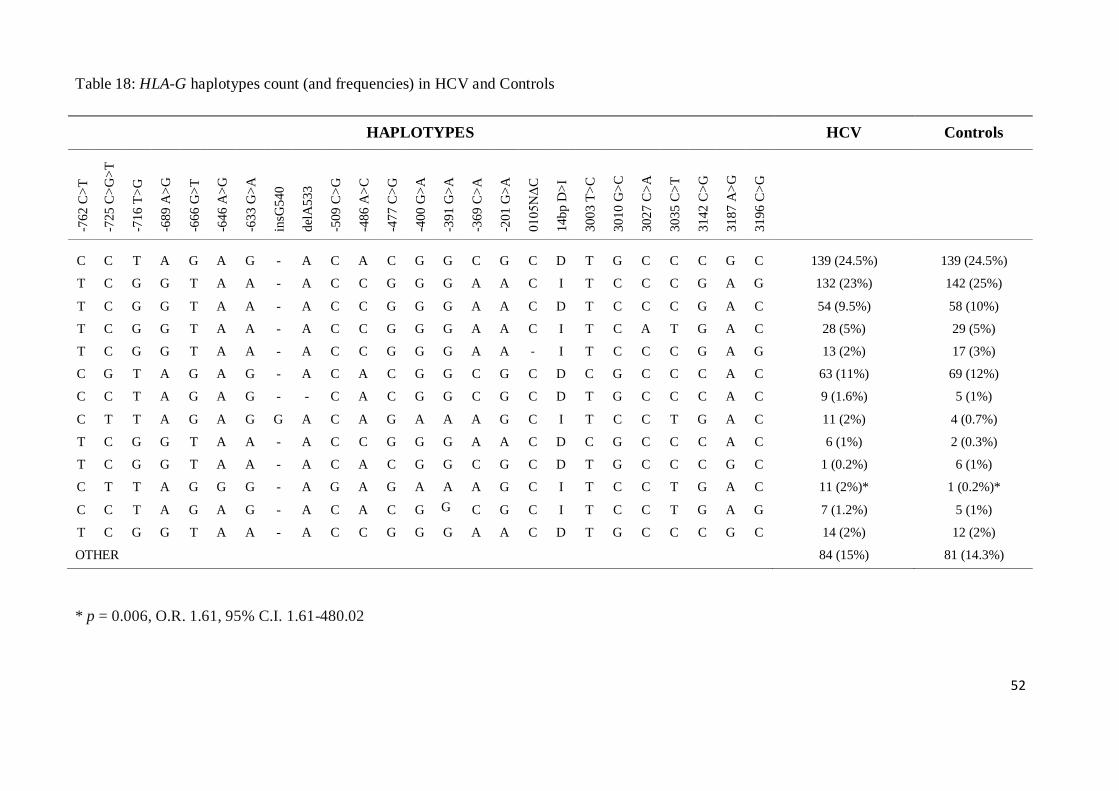
52
Table 18: HLA-G haplotypes count (and frequencies) in HCV and Controls
* p = 0.006, O.R. 1.61, 95% C.I. 1.61-480.02
HAPLOTYPES HCV Controls
-76
2 C
>T
-72
5 C
>G
>T
-71
6 T
>G
-68
9 A
>G
-66
6 G
>T
-64
6 A
>G
-63
3 G
>A
insG
54
0
del
A5
33
-50
9 C
>G
-48
6 A
>C
-47
7 C
>G
-40
0 G
>A
-39
1 G
>A
-36
9 C
>A
-20
1 G
>A
01
05
NΔ
C
14
bp
D>
I
30
03
T>
C
30
10
G>
C
30
27
C>
A
30
35
C>
T
31
42
C>
G
31
87
A>
G
31
96
C>
G
C C T A G A G - A C A C G G C G C D T G C C C G C 139 (24.5%) 139 (24.5%)
T C G G T A A - A C C G G G A A C I T C C C G A G 132 (23%) 142 (25%)
T C G G T A A - A C C G G G A A C D T C C C G A C 54 (9.5%)
58 (10%)
T C G G T A A - A C C G G G A A C I T C A T G A C 28 (5%) 29 (5%)
T C G G T A A - A C C G G G A A - I T C C C G A G 13 (2%) 17 (3%)
C G T A G A G - A C A C G G C G C D C G C C C A C 63 (11%) 69 (12%)
C C T A G A G - - C A C G G C G C D T G C C C A C 9 (1.6%) 5 (1%)
C T T A G A G G A C A G A A A G C I T C C T G A C 11 (2%) 4 (0.7%)
T C G G T A A - A C C G G G A A C D C G C C C A C 6 (1%) 2 (0.3%)
T C G G T A A - A C A C G G C G C D T G C C C G C 1 (0.2%) 6 (1%)
C T T A G G G - A G A G A A A G C I T C C T G A C 11 (2%)* 1 (0.2%)*
C C T A G A G - A C A C G G
C G C I T C C T G A G 7 (1.2%) 5 (1%)
T C G G T A A - A C C G G G A A C D T G C C C G C 14 (2%) 12 (2%)
OTHER 84 (15%) 81 (14.3%)

53
2. LUCIFERASE REPORTER GENE ASSAY
To evaluate the ability of expression of the HLA-G promoter, 800bp from ATG were subcloned
into the pGL4.10.luc2 vector for the luciferase reporter gene assay.
Under basal condition, the six haplotypes (1 to 6 in Table 4) showed low expression which did not
change regardless of the presence of the -725 C, G or T alleles (Figure 12).
Figure 12: HLA-G promoter basal expression
In a second step, the promoter is stimulated with incubation at 42°C, to determine the functionality
of the heat shock element and if the presence of polymorphisms could alter the degree of response
to the stimulus. We observed that after heat stimulus the difference of expression between
CCTAGGACCG and CGTAGGACCG was statistically significant (mean 36.06, s.e.m 3.49 and
mean 9.11, s.e.m 3.93, respectively; p = 0.02) (Figure 13), as well as the comparison between
TCGGTACGAA and TGGGTACGAA (mean 22.24, s.e.m 5.38 vs. mean10.83, s.e.m. 4; p = 0.04);
while there was no significant difference with the haplotypes that have the -725 T allele (Figure 13).
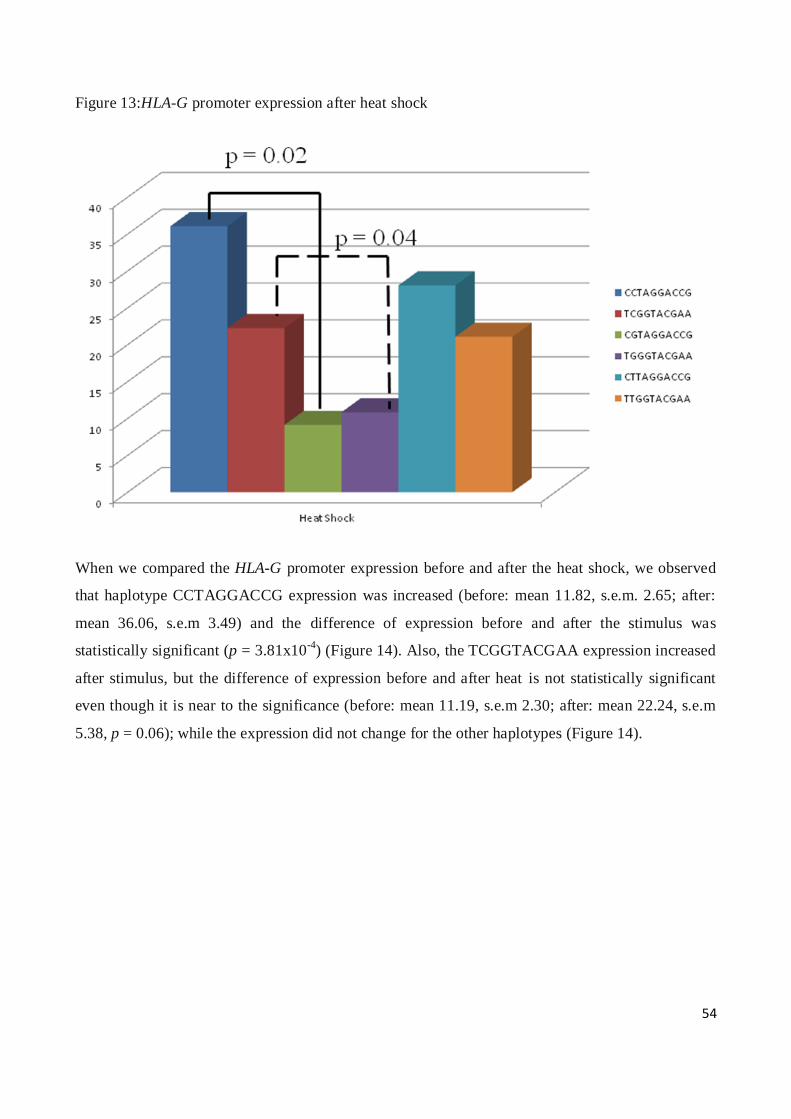
54
Figure 13:HLA-G promoter expression after heat shock
When we compared the HLA-G promoter expression before and after the heat shock, we observed
that haplotype CCTAGGACCG expression was increased (before: mean 11.82, s.e.m. 2.65; after:
mean 36.06, s.e.m 3.49) and the difference of expression before and after the stimulus was
statistically significant (p = 3.81x10⁻⁴
) (Figure 14). Also, the TCGGTACGAA expression increased
after stimulus, but the difference of expression before and after heat is not statistically significant
even though it is near to the significance (before: mean 11.19, s.e.m 2.30; after: mean 22.24, s.e.m
5.38, p = 0.06); while the expression did not change for the other haplotypes (Figure 14).

55
Figure 14: HLA-G promoter expression before and after heat shock stimulus
Finally, we generated haplotypes (Table 4), that do not exist in nature, by PCR mutagenesis, in
order to evaluate if the only -477 C>G SNP, located close to heat shock element, could affect the
functionality of the HSE.
The basal expression of the CCTAGGAGCG, CGTAGGAGCG CTTAGGAGCG haplotypes did
not show variations with respect to CCTAGGACCG, CGTAGGACCG CTTAGGACCG
haplotypes (data not shown). However, the presence of the -477 G mutant allele blocked the
response to the heat stimulus of the CCTAGGACCG haplotype; indeed, there was a significant
difference of expression between CCTAGGACCG and CCTAGGAGCG haplotypes (mean 36.06,
s.e.m 3.49 vs. mean 7.61, s.e.m 0.49, p = 7.97x10⁻⁴
) and between TCGGTACGAA and
CCTAGGAGCG haplotypes (mean 22.24, s.e.m 5.38 vs. mean 7.61, s.e.m 0.49, p = 0.001) (Figure
15).

56
Figure 15: Effect of the -477 C>G SNP on the HLA-G promoter expression
0
5
10
15
20
25
30
35
40
Heat Shock
CCTAGGACCG
TCGGTACGAA
CCTAGGAGCG
p = 7.97x10⁻⁴
p = 0.001
The CGTAGGAGCG CTTAGGAGCG haplotype maintained the basal expression after stimulation
by heat shock (data not shown).
57
DISCUSSION
In physiological conditions, the HLA-G molecule has a restricted tissue-specific expression, while
its expression is altered in numerous pathology. The enhancer A and the ISRE motif, which are
disrupted in HLA-G promoter, are the most likely cause of low physiological HLA-G expression
(Boucraut J et al, 1993; Gobin SJ et al, 1998). The increased expression of HLA-G in pathological
conditions may be due to various factors, such INF-γ (Yang Y et al, 1996; Chu W et al, 1999), IL-2
(Amiot L et al, 1998) or IL-10 (Moreau P et al, 1998), but the mechanisms by which these factors
affect HLA-G transcription are not known.
Besides, the HLA-G gene presents a high number of SNPs located within or closely nearby the sites
of transcription or in key areas for mRNA stability, that could alter the promoter functionality and
HLA-G molecule production.
By using luciferase reporter gene assay, we investigated the functionality of the HLA-G promoter,
800bp upstream of ATG, in HeLa cell line, and we evaluated if presence of numerous
polymorphisms in this sequence could alter the HLA-G transcription. We initially evaluated the
transcription of six different haplotypes (including SNPs at position -762, -725, -716, -689, -633, -
486, -477, -369 and -201) namely CCTAGGACCG, CGTAGGACCG, CTTAGGACCG,
TCGGTACGAA, TGGGTACGAA and TTGGTACGAA, and we observed that in this cell line the
HLA-G expression was low and that the presence of allelic variants does not significantly affect the
level of transcription.
Ibrahim EC et al (2000), have studied the effects of various stress (heat shock and arsenite) on HLA-
G expression in human melanoma cell line, and they observed that stress induced increase of the
level of the HLA-G, suggesting that it might be considered as a stress-inducible gene.
We thus evaluated the effect of a temperature stress on HLA-G transcription in HeLa cell line. After
heat shock, we found that the HLA-G expression increased considerably only if the -725 C allele
was present, but not if in the same position the G or T alleles were present. These results supports
the hypothesis that the HLA-G gene is a stress-inducible gene, but also indicate that the presence of
SNPs can affect the levels of the HLA-G expression.
The -725 C>G>T SNP is located about 250 bp from the heat shock element, and giving the
significant effects that nucleotide changes in this position had on the response to heat, we
hypothesize that in the process of transcriptional activation, there is a physical interaction between
the elements of the promoter.
58
For this reason, we created haplotypes where, in addition to the three allelic variants -725 C, G or T,
only -477 SNP was mutated to assess whether the only SNP near by the heat shock element could
alter the response to thermal shock.
We observed that the CCTAGGACCG haplotype, who responded to the stimulus by heat with a
substantial increase in HLA-G transcription, was no longer associated with increased levels of
transcription when in position -477 was present the G allele. The -477 C>G SNP is part of an
haplotype block which involves the majority of SNPs located at the HLA-G promoter. We found
that a single mutation of a SNP located within the haploblock alter the transcription, and thus we
can hypothesize that the linkage disequilibrium between SNPs to the HLA-G promoter had a
functional role.
The implication of HLA-G molecule in autoimmune and inflammatory diseases, or in viral
infections, has been hypothesized, but the role of this molecule in the development and progression
of these diseases is not yet established.
In our study, we have found significant association at the genetic levels between several HLA-G
polymorphisms and different pathology, such as celiac disease, systemic lupus erythematosus,
rheumatoid arthritis and HCV infection.
Previous studies had found some associations between polymorphisms in the HLA-G gene and the
susceptibility to the development of these diseases (Fabris A et al, 2011; Rizzo R et al, 2008a and b;
Consiglio CR et al, 2011; Lucena-Silva N et al, 2013; Rizzo R et al. 2013; Cordero EA et al, 2009),
but most of these studies were limited to one or few SNPs. To the best of our knowledge, our study
is the first one to include in the analysis such a great number of SNPs.
At the 5’URR, we found that, from the comparison between celiac patients and controls, HLA-G
promoter -477 G/G and -369 A/A genotypes were significantly associated with an increased risk for
disease development and this association was partially confirmed in the DQ2.5 and/or DQ8
subgroups, although the statistical significance in this case was not achieved.
Ten polymorphisms in the 5’URR of the gene were found to be associated with RA in our study
population, namely -762C>T, -716T>G, -689A>G, -666G>T, -633G>A, -486A>C, -201G>A, -
725C>G>T, -477C>G and -369C>A. Specifically, the mutant alleles were associated with
protection to the development to disease, except the -725 G allele , which was associated with
susceptibility.
Finally, in HCV patients, we found four SNPs in the 5’URR associated with increased susceptibility
to viral infection by HCV. In particularly, -725 T allele was associated with a predisposition to
59
disease development, as well as -509 G, -400 A and -391 A alleles (Table 19 shows the summary of
our findings reporting HLA-G polymorphisms found in association with predisposition or
susceptibility to diseases).
Given the proximity of these polymorphisms to key regulatory sites, it can be presumed that the
genetic variants can affect the functionality of the promoter, affecting the binding of the
corresponding regulatory factors (Donadi EA et al, 2011; Tan Z et al, 2005; Ober C et al, 2006).
From our functional studies, with the luciferase reporter gene assay, we observed that, in HeLa cell
line, the basal expression of HLA-G do not change in relation to allelic variations; but under stress
(simulated with heat shock), which is assumed to occur during the development and course of
diseases, the allelic variations assume a key role. In particular, we highlighted the importance of the
-725 C>G>T SNP, where the presence of the C allele was associated with an increased HLA-G
expression. These results, were in contrast with Ober C et al (2006), which have demonstrated, by
using a luciferase reporter assay in JEG-3 cells, that promoter haplotypes that carry the -725G allele
are associated with increased transcription rates with respect to haplotypes with -725C and T
alleles. However, according to Moreau P et al (2003), the presence of the G allele should inhibit and
not increase HLA-G transcription, since it creates a CpG dinucleotide, which undergoes methylation
and inhibits the binding of IRF-1 to ISRE motif. Ober C et al. (2006) affirmed that these contrasting
findings could be due to the choice of JEG-3 cell line as model, since this cell line presents altered
properties, possibly including the altered transcription profile of HLA-G, and that the haplotype that
contains the -725G allele (HLA-G*010101) and that was associated with higher HLA-G expression
levels also presents the 14bp deletion, which is known to be associated with high mRNA stability
(Moreau P et al, 2003).
In our association study, we found that -725 G and -725 T alleles were associated with an increased
risk of RA and HCV infection development, respectively. In stress condition, these alleles were
associated with a lower HLA-G expression; therefore, we could speculate that in these diseases a
lower production of HLA-G is not able to modulate the immune response.
A study, conducted by Schett G et al (1998) had shown that the inflammatory status, during the
course of RA, induce transcriptional activation of the heat shock factor (HSF)-1 that bind to DNA at
a specific site, HSE, of the HLA-G gene promoter region, inducing the transcription of stress-
inducible gene.
From our functional results, we had demonstrated that HLA-G gene is a stress-inducible gene and
that, during the course of RA, the increased production of HSF-1 could also induce the increased
60
expression of HLA-G, and that the RA patients that present the -725 G allele fail to respond to this
stimulus and low HLA-G levels are not able to counteract the chronic inflammation of the disease.
Up to now, no functional studies have been conducted for all other polymorphisms at the 5’URR.
These SNPs are in strong linkage disequilibrium, and we observed that independent variations
within the haplotype block rendered the HLA-G promoter unresponsive to stimulation by stress. It is
possible to speculate that linkage disequilibrium happens because the single SNP would be
detrimental for HLA-G expression and others genetic variation appear that would compensate this
effects, thus functionally linking those SNPs.
Similarly to 5’URR, also 3’UTR presents numerous polymorphic sites that could affect HLA-G
transcription and/or translation (Donadi EA et al, 2011).
By sequencing this region, we detected 4 polymorphisms that showed some significant associations
with CD. Indeed, from the comparison between the totality of celiac patients and controls we
observed a higher frequency of the 14bp I/I, 3187 A/A, and 3196 G/G genotypes in CD patients and
these associations were also confirmed when comparing DQ2.5 and/or DQ8 patients and controls.
These polymorphisms are known to modulate mRNA stability, indeed, they have been associated
with decreased stability of HLA-G mRNA, lower levels of HLA-G mRNA and lower levels of
HLA-G molecules (Hviid TV et al, 2004; Rousseau P et al, 2003; Yie SM et al, 2008; Hviid TV et
al 2003; Rebmann V et al, 2001; Castelli EC et al, 2010). The modulation of the HLA-G transcript
stability is especially known for the 14bp D/I polymorphism, which has been associated with
pregnancy complications, autoimmunity, asthma, sepsis, and organ rejection (Larsen and Hviid,
2009). Moreover, it has been already reported that the 14bp del/ins polymorphism was associated
with an increased risk of CD in Italian CD patients (Fabris A et al, 2011).
When we compared HLA-G SNPs frequencies in DQ2.5 and/or DQ8 CD patients and controls, we
also found a significantly higher frequency of the 3003 C/C and C/T genotypes in patients,
conferring an increased risk for the disease.
In SLE and RA patients the 3003 T allele and T/T genotype were associated with protection against
development of these disease.
The biological effect of this genetic variant is not known, although the presence of the 3003 T allele
might cause increased transcriptional stability and decreased microRNAs (miRNAs) binding
affinity compared to the C allele, as described in silico (Suryanarayana V et al, 2008; Castelli EC et
al, 2009).
61
Table 19 shows the summary of our findings reporting HLA-G polymorphisms found in association
with predisposition or susceptibility to diseases.
It has to be remembered, however, that HLA-G expression levels are possibly modulated not only
by single SNPs, but also by the combination of SNPs at the haplotype level. For this reason we had
implemented our association study including the study of HLA-G haplotypes.
When considering haplotypes data, we evidenced an increased frequency of the
TCGGTACGAAITCCCGAG haplotype both in the totality of celiac patients with respect to
controls, both in the DQ2.5 and/or DQ8 subgroups. We thus hypothesize that lower levels of HLA-
G molecule could play a role in the modulation of susceptibility to celiac disease, given that the low
levels of HLA-G may cause an inability to suppress the development of reactive cell against wheat
gluten, facilitating the development to celiac disease.
In the SLE patients, we found a protective effect towards SLE development for the
TCGGTAAGACCGGGAADITCCCGAG haplotype.
In RA patients, analysis showed a significant association between the
CCTAGAGGACACGGCGCITCCCGAG haplotype and an increased risk of developing RA.
In HCV patients, the CTTAGGGGAGAGAAAGCITCCTGAC haplotype was associated with an
increased risk of developing HCV infection
All these haplotypes have been associated with lower sHLA-G level compared to haplotypes with
the 14bp deletion, 3142 C and 3187 C alleles (Di Cristofaro J et al, 2013). Indeed, all these
variations are known to be associated with lower levels of HLA-G: the 14bp insertion create a
highly mRNA instability (Castelli EC et al, 2010), also the 3142 position is a binding site for
various microRNAs and a study conducted in vitro, by Zhu XM et al (2010), reported that the
presence of the G in this position increase the binding affinity of specific miRNAs, inducing
degradation of the mRNA or inhibiting translation and, consequently, decreasing HLA-G
expression; finally, the 3187 A allele, located in proximity of an AU-rich motif, was associated with
a major mRNA degradation (Yie SM et al, 2008).
Besides, the haplotype associated with a protective effect in SLE patients presented also the ΔC
deletion at exon 3, which distinguishes the null HLA-G*0105N allele, that presents premature stop
codons that impede the formation of HLA-G1 and -G5 isoforms and the translation of HLA-G4
(LeDiscorde M et al, 2005).
Finally, in the RA patients the TCGGTAAGACCGGGAACDTCCCGAC haplotype is instead
associated with a protective effect against the development of the disease and it is characteristic of
62
the HLA-G*01:04 allele, which has been associated with high HLA-G production (Donadi EA et al,
2011). Furthermore, this haplotype presents the -201A allele that recreates the traditional kβ2
element of the HLA-A2 that could increases the binding affinity of NF-kβ and transactivate the
HLA-G promoter (Solier C et al, 2001).
The association study suggest that in CD, RA and HCV lower levels of HLA-G are associated with
predisposition to the disease, instead in SLE lower levels of HLA-G are protective in the
development of the disease.
Our hypothesis about celiac disease seems in contrast with the study by Torres MI et al (2007)
reporting elevated levels of soluble HLA-G in celiac patients; however, sHLA-G levels were
elevated in celiac patients with other associated diseases, elevated or medium in celiac patients with
transgressions of the diet, but lower in gluten-free diet patients. Therefore, we hypothesized that
lower basal levels of HLA-G molecule (such as in presence of SNPs that affect the mRNA stability)
could increase the risk of celiac disease development; once that the disease has occurred, and the
patient is not on gluten-free diet, or when there are other associated diseases, the organism produces
higher levels of sHLA-G trying to restore the immune tolerance (LeMaoult J et al, 2004; Fournel S
et al, 2000) associated diseases, the organism produces higher levels of sHLA-G trying to restore
the immune tolerance (LeMaoult J et al, 2004; Fournel S et al, 2000).
For RA, our hypothesis, that low levels of HLA-G are associated with predisposition to the disease,
was supported by Verbruggen LA et al (2006), which showed that RA patients present low levels of
soluble HLA-G with respect to controls and the authors hypothesized that these low levels may be
the cause of the establishment of the inflammatory state typical of the rheumatoid arthritis disease.
For HCV infection, we found that the nucleotide variations more frequent in HCV patients with
respect to controls are those associated with lower levels of HLA-G molecule. These results would
be in contrast with the previous hypothesis that an increased HLA-G expression protects the
infected cell by the immune system.
However, association study, conducted by da Silva GK et al (2014), that observed an increased
frequency of the 14bp I and 3142 G allele in African-derived-HIV-infected patients co-infected
with HCV; and by Cordero EA et al (2009), that observed that the 3142 G allele was associated to
HCV infection in sickle cell disease patients, confirmed our results.
63
Instead, in SLE low levels of HLA-G are associated with a protection against the development of
the disease. To confirm, Rizzo R et al. (2008a) and Wu FX et al. (2009) found significantly
increased levels of HLA-G in SLE patients with respect to controls, so we can hypothesize that
lower levels of HLA-G could be protective against the development of the disease.
However, our study, aimed at replicating Lucena-Silva N et al (2013) findings, showed that, in spite
of having selected patients and controls from the same town (Recife, North East Brazil) led to
different results, being the 3003 T>C polymorphism associated with susceptibility to develop SLE
in our study, while the 3010 C>G and 3142C>G polymorphisms conferred susceptibility to SLE in
the Lucena-Silva study. Only HLA-G haplotypes (although not completely concordant) conferred a
slight protection against development of SLE in both studies.
The fact that, in a replica study performed in the same town, HLA-G polymorphisms did not
provide similar results in terms of association with SLE, gives us an idea of the very small effect of
this gene on predisposition to the complex phenotype represented by SLE.
For the SLE and RA patients, we also investigated the possible association of HLA-G
polymorphisms with the clinical parameters of the disease.
In the SLE patients, stratifying SLE patients according to the presence or absence of different
clinical manifestations, we found an association with different clinical manifestation of SLE.
The -725 G allele, associated with lower HLA-G expression, was associated in our study with
protection against the development of cutaneous alterations. Since two different studies (Aractingi S
et al, 2001; Khosrotehrani K et al, 2001) have observed an increased HLA-G expression in skin
lesions of psoriasis and atopic dermatitis, we can hypothesize that lower HLA-G expression may be
protective against the development of cutaneous alterations.
The insG540 SNP was associated in our study with lupus arthritis, the haplotype block in the
5’URR (-762 C>T, -716 T>G, -689 A>G, -666 G>T, -633 G>A, -486 A>C and -201 G>A) was
associated with hematological alteration, and the -400 G>A and -391 G>A SNPs associated with
immunological alteration and with anti ds-DNA production.
A significant association between HLA-G polymorphism and clinical parameters of RA has also
been found in this study. The delA533 D/A heterozygous patients were characterized by higher
median CDAI values compared to A/A patients.
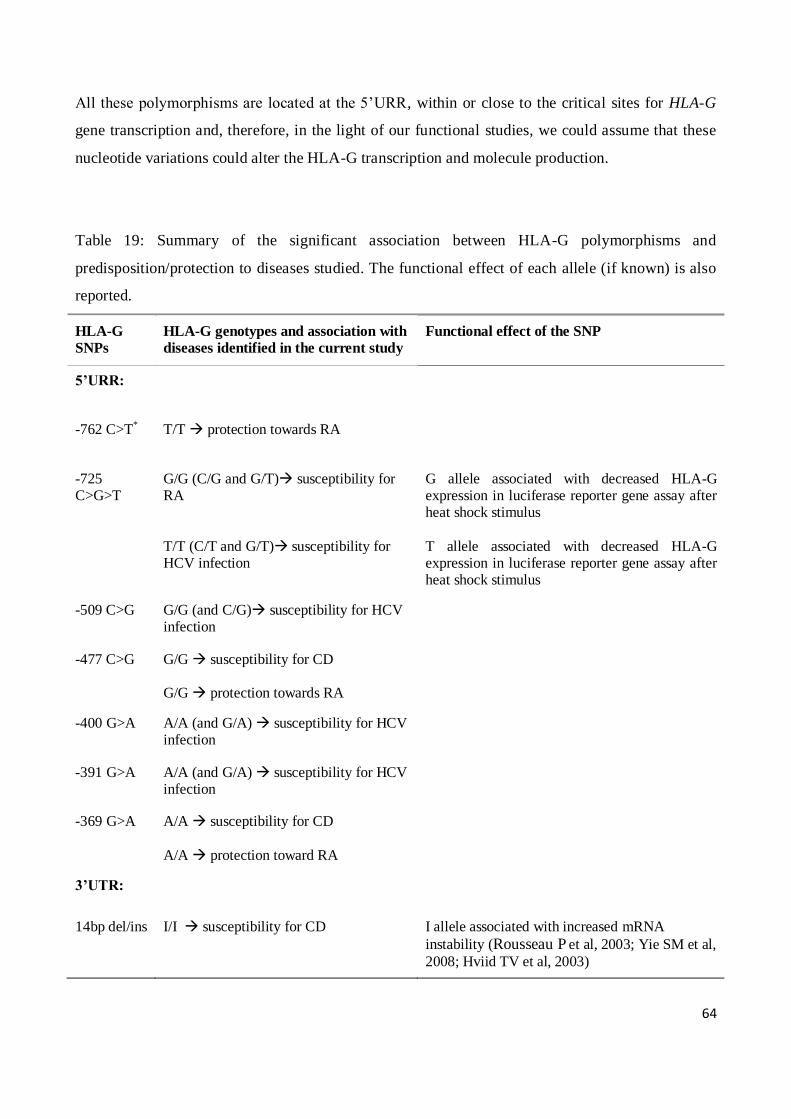
64
All these polymorphisms are located at the 5’URR, within or close to the critical sites for HLA-G
gene transcription and, therefore, in the light of our functional studies, we could assume that these
nucleotide variations could alter the HLA-G transcription and molecule production.
Table 19: Summary of the significant association between HLA-G polymorphisms and
predisposition/protection to diseases studied. The functional effect of each allele (if known) is also
reported.
HLA-G
SNPs HLA-G genotypes and association with
diseases identified in the current study Functional effect of the SNP
5’URR:
-762 C>T* T/T protection towards RA
-725 C>G>T
G/G (C/G and G/T) susceptibility for RA
T/T (C/T and G/T) susceptibility for HCV infection
G allele associated with decreased HLA-G expression in luciferase reporter gene assay after heat shock stimulus
T allele associated with decreased HLA-G expression in luciferase reporter gene assay after heat shock stimulus
-509 C>G G/G (and C/G) susceptibility for HCV infection
-477 C>G G/G susceptibility for CD G/G protection towards RA
-400 G>A A/A (and G/A) susceptibility for HCV infection
-391 G>A A/A (and G/A) susceptibility for HCV infection
-369 G>A A/A susceptibility for CD
A/A protection toward RA
3’UTR:
14bp del/ins I/I susceptibility for CD I allele associated with increased mRNA
instability (Rousseau P et al, 2003; Yie SM et al,
2008; Hviid TV et al, 2003)
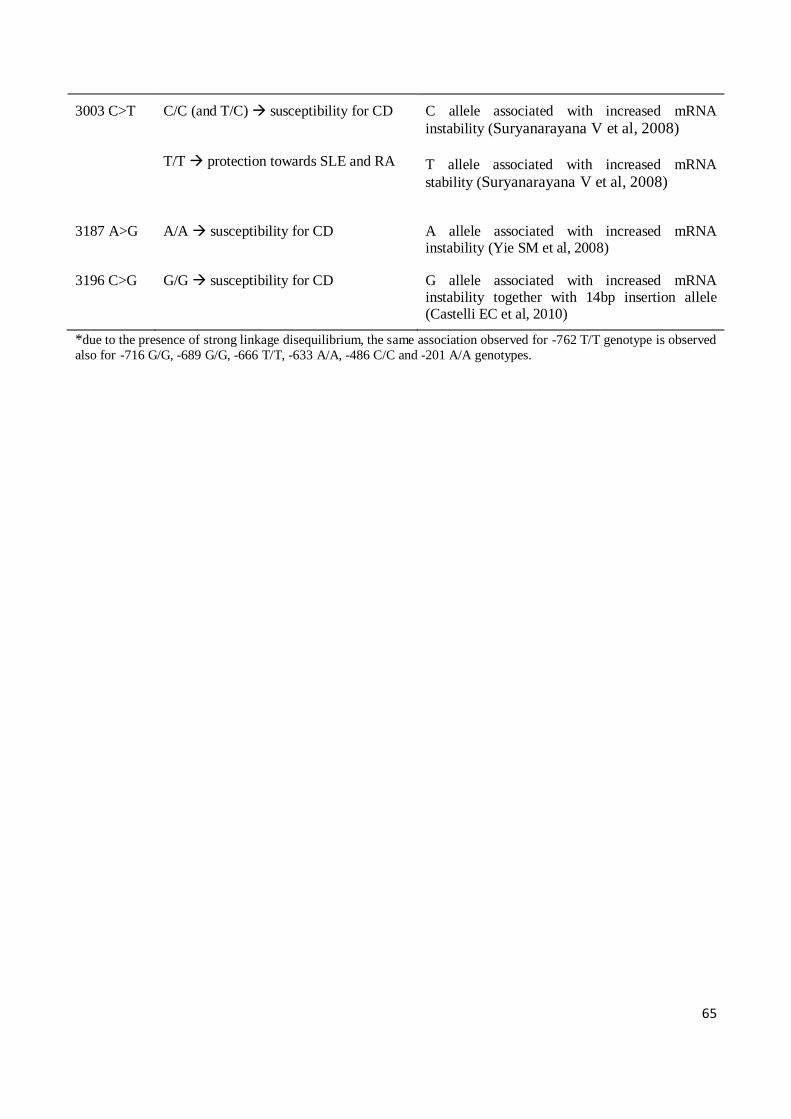
65
3003 C>T C/C (and T/C) susceptibility for CD T/T protection towards SLE and RA
C allele associated with increased mRNA
instability (Suryanarayana V et al, 2008)
T allele associated with increased mRNA
stability (Suryanarayana V et al, 2008)
3187 A>G A/A susceptibility for CD A allele associated with increased mRNA instability (Yie SM et al, 2008)
3196 C>G G/G susceptibility for CD G allele associated with increased mRNA instability together with 14bp insertion allele (Castelli EC et al, 2010)
*due to the presence of strong linkage disequilibrium, the same association observed for -762 T/T genotype is observed
also for -716 G/G, -689 G/G, -666 T/T, -633 A/A, -486 C/C and -201 A/A genotypes.

66
CONCLUSIONS
1. ROLE OF HLA-G IN THE DEVELOPMENT OF CELIAC DISEASE
Our findings thus indicate that the nucleotide variations more frequent in celiac patients with
respect to controls are those associated with a lower stability of mRNA and with lower levels of
HLA-G molecules. Moreover, the fact that the associations were confirmed in the DQ2.5 and/or
DQ8, suggests that they are not depending on the presence of linkage or hitchhiking effect with
other HLA regions known to be the major genetic risk factor for CD.
We thus hypothesize that lower levels of HLA-G molecule could play a role in the modulation of
susceptibility to celiac disease, given that the low levels of HLA-G may cause an inability to
suppress the development of reactive cell against wheat gluten, facilitating the development to
celiac disease.
In conclusion, our findings confirm the involvement of the 14bp del/ins polymorphism in CD
susceptibility, previously reported by Fabris A et al (2011), and also highlight the possible
involvement of other HLA-G polymorphisms, showing that HLA-G can play a role as minor genetic
factor, evident from the low OR values encountered and described in this study, in the
predisposition to a complex disease such as CD.
2. ROLE OF HLA-G IN THE DEVELOPMENT OF SYSTEMIC LUPUS
ERYTHEMATOSUS AND IN THE CLINICAL MANIFESTATION
Our findings indicate that the nucleotide variations more frequent in SLE patients with respect to
controls are those associated with high levels of HLA-G molecules and we can hypothesize that
lower levels of HLA-G could be protective against the development of the disease.
However, the effective role of HLA-G molecule in the development of the SLE disease and its
clinical manifestations is far from being elucidated thus far; all results are indicating that a
multifactorial panel of immunological components could act together in concert to trigger the
development of the disease. Our findings, lead us to conclude that, even if HLA-G is located in a
supposed “hotbed” region for SLE, its effect on the predisposition to develop the pathology is not
so relevant and it should not be considered as a good candidate gene for SLE, but eventually just a
sort of modifier gene with very little impact on the phenotype considered as a good candidate gene
for SLE, but eventually just a sort of modifier gene with very little impact on the phenotype.
67
3. ROLE OF HLA-G IN THE DEVELOPMENT OF RHEUMATOID ARTHRITIS
AND IN THE CLINICAL MANIFESTATION
In our study, we performed a comprehensive analysis of several genetic variants in the HLA-G gene
in the context of RA disease, finding some association between HLA-G and the risk of developing
the disease. That said, it is possible to hypothesize that individuals which present alleles that affect
HLA-G gene transcription and mRNA stability have a lower expression of HLA-G molecule and are
more susceptible to disease development and to the establishment of the inflammatory state typical
of the RA disease.
We are aware however that the p-values we reported are just slightly within the statistical
significant threshold and applying Bonferroni's correction the statistical significance will be lost.
However, we think that the differences we found could be indicative of the involvement of HLA-G
gene in RA susceptibility, especially since the number of samples analyzed is modest and since the
effects of a single gene in a complex diseases such as RA, is supposed to be probably small.
4. ROLE OF HLA-G IN THE DEVELOPMENT OF HEPATITIS C VIRUS
INFECTION
Our findings indicate that, the nucleotide variations more frequent in HCV patients with respect to
controls are those associated with lower levels of HLA-G molecule and that lower levels predispose
to the infection acquisition.
In conclusion, we hypothesized a possible role of the HLA-G molecule in the viral infection, and
that the lower HLA-G expression can favor the susceptibility of the HCV infection modulating the
immune system, but the mechanisms by which the HLA-G molecule can act are still unclear.
However, we have to remark that since different findings concerning direct correlation between
3'UTR allelic variants/mRNA instability and HLA-G levels have been reported (Svendsen SG et al,
2013), our association results, not having been functionally validated, are just speculative; moreover
several of the associations observed in our study were related to allelic variants and not haplotypes,
being the latter more important to functionally modify HLA-G mRNA and protein levels.
Functional validations for the 3’utr SNPs are strongly needed to elucidate the role of these
polymorphisms on the HLA-G expression and on the mRNA stability; finally replica studies on

68
different populations with higher number of patients and controls are mandatory to confirm the
associations found.

69
REFERENCES
Airoldi A, Zavaglia C, Silini E et al. Lack of a strong association between HLA class II, tumor
necrosis factor and transporter associated with antigen processing gene polymorphisms and
virological response to alpha-interferon treatment in patients with chronic hepatitis C. Eur J
Immunogenet 2004; 31:259–65.
Alamanos Y, Drosos AA. Epidemiology of adult rheumatoid arthritis. Autoimmun Rev. 2005; 4:
130-6.
Alarcón-Segovia D, Alarcòn-Riquelme ME, Cardiel MH, et al. Familial aggregation of systemic
lupus erythematosus, rheumatoid arthritis, and other autoimmune diseases in 1,177 lupus patients
from the GLADEL cohort. Arthritis Rheum 2005; 52:1138-47.
Aletaha D, Neogi T, Silman AJ, et al. 2010 rheumatoid arthritis clessification criteria: an American
College of Rheumatology/European League Against Rheumatism collaborative initiative. Ann
Rheum Dis 2010; 69:1580-8.
Aletaha D, Smolen J. The Simplified Disease Activity Index (SDAI) and the Clinical Disease
Activity Index (CDAI): a review of their usefulness and validity in rheumatoid arthritis. Review.
Clin Exp Rheumatol 2005; 23:S100-8.
Alric L, Fort M, Izopet J et al. Genes of the major histocompatibility complex class II influence the
outcome of hepatitis C virus infection. Gastroenterology 1997; 113:1675-81.
Amiot L, Onno M, Dre´nou B, et al. HLAG class I gene expression in normal and malignant
hematopoietic cells. Hum Immunol 1998; 59:524-8.
Aractingi S, Briand N, Le Danff, et al. HLA-G and NK receptor are expressed in psoriatic skin: a
possible pathway for regulating infiltrating T cells? Am J Pathol 2001; 159:71-7.
Arnett FC, Edworthy SM, Bloch DA, et al. The American Rheumatism Association 1987 revised
criteria for the classification of rheumatoid arthritis. Arthritis Rheum 1988; 31:315-24.
Asaga H, Yamada M, Senshu T. Selective deimination of vimentin in calcium ionophore-induced
apoptosis of mouse peritoneal macrophages. Biochem Biophys Res Commun 1998; 243:641-6.
Asti M, Martinetti M, Zavaglia C et al. Human leukocyte antigen class II and III alleles and severity
of hepatitis C virus-related chronic liver disease. Hepatology 1999; 29:1272-9.
Bahri R, Hirsch F, Josse A, et al. Soluble HLA-G inhibits cell cycle progression in human
alloreactive T lymphocytes. J Immunol. 2006; 176:1331-9.
Bainbridge DR, Ellis SA, Sargent IL. HLA-G suppresses proliferation of CD4(+) T-lymphocytes. J
Reprod Immunol 2000; 48:17-26.
70
Barcova M, Kacani L, Speth C, et al. gp41 envelope protein of human immunodeficiency virus
induces interleukin (IL)-10 in monocytes, but not in B, T, or NK cells, leading to reduced IL-2 and
interferon-γ production. Journal of Infectious Diseases 1998; 177:905-13.
Baricordi OR, Stignani M, Melchiorri L, et al. HLA-G and inflammatory diseases. Inflamm Allergy
Drug Targets 2008; 7:67-74.
Bergtold A, Gavhane A, D’Agati V, et al. FcR-bearing myeloid cells are Responsible for triggering
murine lupus nephritis. J Immunol. 2006; 177:7287-95.
Boucraut J, Hawley S, Robertson K, et al. Differential nuclear expression of enhancer A DNA-
binding proteins in human first trimester trophoblast cells. J Immunol 1993; 150:3882-94.
Boyson JE, Erskine R, Whitman MC, et al. Disulfide bond-mediated dimerization of HLA-G on the
cell surface. Proc Natl Acad Sci USA 2002; 99:16180-5.
Brenol CV, Veit TD, Chies JA, et al. The role of the HLA-G gene and molecule on the clinicla
expression of rheumatologic diseases. Rev Bras Reumatol 2012; 52:82-91.
Bronson PG, Chaivorapol C, Ortmann W, et al. The genetics of type I interferon in systemic lupus
erythematosus. Curr Opin Immunol. 2012; 24:530-7.
Carosella ED, Favier B, Rouas-Freiss N, et al. Beyond the increasing complexity of the
immunomodulatory HLA-G molecule. Blood 2008a; 111:4862-70.
Carosella ED, Moreau P, Lemaoult J, et al. HLA-G: from biology to clinical benefits. Trends
Immunol 2008b; 29:125-32.
Carosella ED, HoWangYin KY, Favier B, et al. HLA-G-dependent suppressor cells: diverse by
nature, function, and significance. Hum Immunol 2008c; 69:700-7.
Castelli EC, Moreau P, Oya e Chiromatzo A, et al. In silico analysis of microRNAS targeting the
HLA-G 3’ untranslated region alleles and haplotypes. Hum Immunol 2009; 70:1020-25.
Castelli EC, Mendes-Junior CT, Deghaide NHS, et al. The genetic structure of 3’ untranslated
region of the HLA-G gene: polymorphisms and haplotypes. Genes and Immunity 2010; 11:134-41.
Caumartin J, Favier B, Daouya M, et al. Trogocytosis-based generation of suppressive NK cells.
EMBO J. 2007; 26:1423-33.
Chang F, Mahadeva U, Deere H. Pathological and clinical significance of increased intraepithelial
lymphocytes (IELs) in small bowel mucosa. APMIS 2005; 113:385-99.
Chen J, Li J, Gao H, et al. Comprehensive evaluation of different T-helper cell subsets
differentiation and function in rheumatoid arthritis. J Biomed Biotechnol 2012; 2012:535361.
Choi J, Kim ST, Craft J. The pathogenesis of systemic lupus erythematosus – an update. Curr Opin
Immunol 2012; 24:651-7.

71
Chu W, Yang Y, Geraghty DE, et al. Interferons enhance HLA-G mRNA and protein in transfected
mouse fibroblasts. J Reprod Immunol 1999; 42: 1-15.
Chisari FV. Cytotoxic T cells and viral hepatitis. J Clin Invest 1997; 99:1472-7.
Cirulli V, Zalatan J, McMaster M, et al. The class I HLA repertoire of pancreatic islets comprises
the nonclassical class Ib antigen HLA-G. Diabetes 2006; 55:1214-22.
Cohen GB, Gandhi RT, Davis DM, et al. The selective downregulation of class I major
histocompatibility complex proteins by HIV-1 protects HIV-infected cells from NK cells. Immunity
1999; 10:661-71.
Collins KL, Chen BK, Kalams SA, et al. HIV-1 Nef protein protects infected primary cells against
killing by cytotoxic T lymphocytes. Nature 1998; 391:397-401.
Colonna M, Navarro F, Bellon T, et al. A common inhibitory receptor for major histocompatibility
complex class I molecules on human lymphoid and myelomonocytic cells. J Exp Med. 1997;
186:1809-18.
Colonna M, Samaridis J, Cella M, et al. Human myelomonocytic cells express an inhibitory
receptor for classical and nonclassical MHC class I molecules. J Immunol 1998; 160:3096-100.
Consiglio CR, Veit TD, Monticielo OA, et al. Association of the HLA-G gene +3142C>G
polymorphism with systemic lupus erythematosus. Tissue Antigens. 2011; 77:540-5.
Cooper MA, Fehniger TA, Caligiuri MA. The biology of human natural killer-cell subsets. Trends
Immunol 2001; 22:633-40.
Cooper S, Erickson AL, Adams EJ, et al. Analysis of a successful immune response against
hepatitis C virus. Immunity 1999; 10:439-49.
Cordero EA, Veit TD, da Silva, MA, et al. HLAG polymorphism influences the susceptibility to
HCV infection in sickle cell disease patients. Tissue Antigens 2009; 74:308-13.
Curigliano G. Criscitiello C, Gelao L, et al. Molecular pathways human leukocyte antigen G (HLA-
G). Clin Cancer Res 2013; 19:5564-71.
da Silva GK, Vianna P, Veit TD, et al. Influence of HLA-G polymorphisms in human
immunodeficiency virus infection and hepatitis C virus co-infection in Brazilian and Italian
individuals. Infect Genet Evo 2014; 21C:418-23.
de Oliveira Crispim JC, Silva TG, et al. Upregulation of soluble and membrane-bound human
leukocyte antigen G expression is primarily observed in the milder histopathological stages of chronic hepatitis C virus infection. Hum Immunol 2012; 73:258-62.
de Vries R. Genetics of rheumatoid arthritis: time for a change! Curr Opin Rheumatol. 2011;
23:227-32.
72
Deng Y, Tsao BP. Genetic susceptibility to systemic lupus erythematosus in the genomic era. Nat
Rev Rheumatol. 2010; 6:683-92.
Di Cristofaro J, El Moujally D, Agnel A, et al. HLA-G haplotype structure shows good
conservation between different populations and good correlation with high, normal and low soluble
HLA-G expression. Hum Immunol 2013; 74:203-206.
Di Bisceglie AM. Hepatitis C and hepatocellular carcinoma. Hepatology 1997; 26:34S–38S.
Donadi EA, Castelli EC, Arnaiz-Villena A, et al. Implications of the polymorphism of HLA-G on
its function, regulation, evolution and disease association. Cell Mol Life Sci 2011; 68:369-95.
Donaghy L, Gros F, Amiot L, et al. Elevated levels of soluble non-classical major
histocompatibility class I molecule human leucocyte antigen (HLA)-G in the blood of HIV-infected
patients with or without visceral leishmaniasis. Clin. Exp. Immunol. 2007; 147:236-40.
Excoffier L, Laval G, Schneider S. Arlequin ver 3.0: an integrated software package for population
genetics data analysis. Evol Bioinform Online 2005; 1:47-50.
Fabris A, Segat L, Catamo E, et al. HLA-G 14bp deletion/insertion polymorphism in celiac disease.
Am J Gastroenterol 2011; 106:139-44.
Fainardi E, Rizzo R, Melchiorri L, et al. Intrathecal synthesis of of soluble HLA-G and HLA-I
molecules are reciprocally associated to clinical and MRI activity in patients with multiple sclerosis.
Mult Scler 2006; 12:2-12.
Feger U, Tolosa E, Huang YH, et al. HLA-G expression defines a novel regulatory T-cell subset
present in human peripheral blood and sites of inflammation. Blood 2007; 110:568-77.
Flajollet S, Poras I, Carosella ED, et al. RREB-1 is a transcriptional repressor of HLA-G. J
Immunol 2009; 183:6948-59.
Fons P, Chabot S, Cartwright JE, et al. Soluble HLA-G1 inhibits angiogenesis through an apoptotic
pathway and by direct binding to CD160 receptor expressed by endothelial cells. Blood 2006; 108:
2608-15.
Forabosco P, Gorman JD, Cleveland C, et al. Meta-analysis of genome-wide linkage studies of
systemic lupus erythematosus. Genes Immun 2006; 7:609-14.
Fournel S, Aguerre-Girr M, Huc X, et al. Cutting edge: soluble HLA-G1 triggers CD95/CD95
ligand-mediated apoptosis in activated CD8+ cells by interacting with CD8. J Immunol 2000;
164:6100-4.
Franeke U, Pellegrino M. Assignment of the miajor histocompatibility complex to a region of the
short arm of human chromosome 6. Proc Natl Acad Sci USA 1977; 74:1147-51.
Fries JF, Spitz P, Kraines RG, et al. Measurement of patients outcome in arthritis. Arthritis Rheum
1980; 23:137-45.

73
Fujii T, Ishitani A, Geraghty DE. A soluble form of the HLA-G antigen is encoded by a messenger
ribonucleic acid containing intron 4. J Immunol 1994; 153:5516-24.
Gao GF, Willcox BE, Wyer JR, et al. Classical and nonclassical class I major histocompatibility
complex molecules exhibit subtle conformational differences that affect binding to CD8alphaalpha.
J Biol Chem 2000; 275:15232-8.
Gateva V, Sandling JK, Hom G, et al. A large-scale replication study identifies TNIP1, PRDM1,
JAZF1, UHRF1BP1 and IL10 as risk loci for systemic lupus erythematosus. Nat Genet. 2009;
41:1228-33.
Geraghty DE, Kolier BH, Orr HT. A human major histocompatibility complex class I gene that
encodes a protein with shirtened cytoplasmic segment. Proc Natl Acad Sci USA 1987; 84:9145-9.
Gobin SJ, Biesta P, de Steenwinkel JE, et al. HLA-G transactivation by cAMP-response element-
binding protein (CREB). An alternative transactivation pathway to the conserved major
histocompatibility complex (MHC) class I regulatory routes. J Biol Chem 2002; 277:39525-31.
Gobin SJ, Keijsers V, van Zutphen M, et al. The role of enhancer A in the locus-specific
transactivation of classical and nonclassical HLA class I genes by nuclear factor kappa B. J
Immunol 1998; 161:2276-83.
Gobin SJ, van Zutphen M, Woltman AM, et al. Transactivation of classical and nonclassical HLA
class I genes through the IFN-stimulated response element. J Immunol 1999; 163:1428-34.
Goldberg MA, Arnett FC, Bias WB, et al. Histocompatibility antigens in systemic lupus
erythematosus. Arthritis Rheum. 1976; 19:129-32.
Goldman K, Gertel S, Amital H. Anti-citrullinated peptide antibodies is more than an accurate tool
for diagnosis of Rheumatoid Arthritis. Rheumatology 2012; 51:vi5-vi9.
Gomez-Casado E, Martinez-Lasot J, Castro MJ, et al. Detection of HLA-E and -G DNA alleles for
population and disease studies. Cell Mol Life Sci 1999; 56:356-62.
Goodridge JP, Witt CS, Christiansen FT, et al. KIR2DL4 (CD158d) genotype influences expression
and function in NK cells. J Immunol. 2003; 171:1768-74.
Goulder PJR, Watkins DI. Impact of MHC class I diversity on immune control of
immunodeficiency virus replication. Nature Reviews Immunology 2008; 8:619-30.
Graham RR, Cotsapas C, Davies L, et al. Genetic variants near TNFAIP3 on 6q23 are associated
with systemic lupus erythematosus. Nat Genet. 2008; 40:1059-61.
Gregersen PK, Silver J, Winchester RJ. The shared epitope hypothesis. An approach to
understanding the molecular genetics of susceptibility to rheumatoid arthritis. Arthritis Rheum.
1987; 30:1205-13.
Gros FC, Toutirais O, Le Maux A, et al. Soluble HLA-G molecules impair natural killer/ dendritic
cell crosstalk via inhibition of dendritic cells. Eur J Immunol. 2008; 8:742-9.
74
Han JW, Zheng HF, Cui Y, et al. Genome-wide association study in a Chinese Han population
identifies nine new susceptibility loci for systemic lupus erythematosus. Nat Genet. 2009; 41:1234-
37.
Hansen TH, Bouvier M. MHC class I antigen presentation: learning from viral evasion strategies.
Nat Rev Immunol 2009; 9:503-13.
Hiby SE, King A, Sharkey A, et al. Molecular studies of trophoblast HLA-G: polymorphism,
isoforms, imprinting and expression in preimplantation embryo. Tissue Antigens 1999; 53:1-13.
Hom G, Graham RR, Modrek B, et al. Association of systemic lupus erythematosus with C8orf13-
BLK and ITGAM-ITGAX. N Engl J Med 2008; 358:900-9.
Hviid TV, Hylenius S, Rorbye C, et al. HLA-G allelic variants are associated with differences in the
HLA-G mRNA isoform profile and HLA-G mRNA levels. Immunogenetics 2003; 55:63-79.
Hviid TV, Rizzo R, Christiansen OB, et al. HLA-G and IL-10 in serum in relation to HLA-G
genotype and polymorphisms. Immunogenetics 2004; 56:135-41.
Hviid TV, Milman N, Hylenius S, et al. HLA-G polymorphisms and HLA-G expression in
sarcoidosis. Sarcoidosis Vasc Diffuse Lung Dis 2006a; 23:30-7.
Hviid TV, Rizzo R, Melchiorri L, et al. Polymorphism in the 5’ upstream regulatory and 3’
untranslated regions of the HLA-G gene in relation to soluble HLA-G and IL-10 expression. Hum
Immunol 2006b; 67:53-62.
Hylenius S, Andersen AM, Melbye M, et al. Association between HLA-G genotype and risk of pre-
eclampsia: a case-control study using family triads. Mol Hum Reprod 2004; 10:237-46.
Ibrahim EC, Morange M, Dausset J, et al. Heat shock and arsenite induce expression of the
nonclassical class I histocompatibility HLA-G gene in tumor cell lines. Cell Stress Chaperones
2000; 5:207-18.
International Consortium for Systemic Lupus Erythematosus Genetics (SLEGEN), Harley JB,
Alarcón-Riquelme ME, et al. Genome-wide association scan in women with systemic lupus
erythematosus identifies susceptibility variants in ITGAM, PXK, KIAA1542 and other loci. Nat
Genet. 2008; 40:204-10.
Ishitani A, Geraghty DE. Alternative splicing of HLA-G transcripts yields proteins with primary
structures resembling both class I and class II antigens. Proc Natl Acad Sci USA 1992; 89:3947-51.
Kavai M, Szegedi G. Immune complex clearance by monocytes and macrophages in systemic
Lupus erythematosus. Autoimmunity Reviews 2007; 6:497-502.
Khosrotehrani K, Le Danff C, Reynaud-Mendel B, et al. HLA-G expression in atopic dermatitis. J
Invest Dermatol 2001;117:750-2.
75
Kikuchi-Maki A, Yusa S-i Catina TL, et al. KIR2DL4 is an IL-2-regulated NK cell receptor that
exhibits limited expression in humans but triggers strong IFN-γ production. J Immunol 2003;
171:3415-25.
Klareskog L, Padyukov L, Lorentzen J, et al. Mechanisms of disease: genetic susceptibility and
environmental triggers in the development of rheumatoid arthritis. Nat Clin Pract Rheumatol 2006;
2:425-33.
Klein J. Natural history of the major histocomnpatibility complex. Wiley-Interscience 1986; 756-
61.
Kovats S, Main EK, Librach C, et al. A class I antigen, HLA-G, expressed in human trophoblasts.
Science 1990; 248:220-3.
Kozyrev SV, Abelson AK, Wojcik J, et al. Functional variants in the B-cell gene BANK1 are
associated with systemic lupus erythematosus. Nat Genet. 2008; 40:211-6.
Kuersten S, Goodwin EB. The power of the 3’ UTR: translational control and development. Nat
Rev Genet 2003; 4:626-37.
Kuroki K, Hirose K, Okabe Y, et al. The long-term immunosuppressive effects of disulfide-linked
HLA-G dimer in mice with collagen-induced arthritis. Hum Immunol. 2013; 74:433-8.
Lajoie J, Jeanneau A, Faucher MC, et al. Characterisation of five novel HLA-G alleles with coding
DNA base changes. Tissue Antigens 2008; 72:502-4.
Lajoie J, Massinga Loembe M, et al. Blood soluble human leukocyte antigen G levels are associated
with human immunodeficiency virus type 1 infection in Beninese commercial sex workers. Hum
Immunol 2010; 71:182-5.
Larsen MH and Hviid TV. Human leukocyte antigen-G polymorphism in relation to expression,
function, and disease. Hum Immunol 2009; 70:1026-34.
Lauer GM, Barnes E, Lucas M et al. High resolution analysis of cellular immune responses in
resolved and persistent hepatitis C virus infection. Gastroenterology 2004; 127:924-36.
Lauer GM, Walker BD. Hepatitis C virus infection. New England Journal of Medicine 2001;
345:41-52.
Le Discorde M, Moreau P, Sabatier P, et al. Expression of HLA-G in human cornea, an immune-
privileged tissue. Hum Immunol 2003; 64:1039-44.
Le Discorse M, Le Danff C, Moreau P, et al. HLA-G*0105N null allele encodes functional HLA-G
isoforms. Biol Reprod 2005; 73:280-8.
Lefebvre S, Berrih-Aknin S, Adrian F, et al. A specific interferon (IFN)-stimulated response
element of the distal HLA-G promoter binds IFN-regulatory factor 1 and mediates enhancement of
this nonclassical class I gene by IFN-beta. J Biol Chem 2001; 276:6133-9.
76
LeMaoult J, Krawice-Radanne I, Dausset J, et al. HLA-G1-expressing antigen-presenting cells
induce immunosoppressive CD4+ T cells. Proc Natl Acad Sci USA 2004; 101:7064-9.
LeMaoult J, Caumartin J, Daouya M, et al. Immune regulation by pretenders: cell-to-cell transfers
of HLA-G make effector T cells act as regulatory cells. Blood 2007; 109:2040-48.
Liang S, Ristich V, Arase H, et al. Modulation of dendritic cell differentiation by HLA-G and ILT4
requires the IL-6–STAT3 signaling pathway. Proc Natl Acad Sci 2008; 105:8357-62.
Lila N, Carpentier A, Amrein C, et al. Implication of HLA-G molecule in heart-graft acceptance.
Lancet 2000; 355:2138.
Liu Z, Davidson A. Taming lupus-a new understanding of pathogenesis is leading to clinical
advances. Nat Med 2012; 18:871-82.
Lozano JM, Gonzalez R, Kindelan JM, et al. Monocytes and T lymphocytes in HIV-1- positive
patients express HLA-G molecule. AIDS 2002; 16:347-51.
Lucena-Silva N, de Souza VS, Gomes RG, et al. HLA-G 3' untranslated region polymorphisms are
associated with systemic lupus erythematosus in 2 Brazilian populations. J Rheumatol 2013;
40:1104-13.
MacGregor AJ, Snieder H, Rigby AS, et al. Characterizing the quantitative genetic contribution to
rheumatoid arthritis using data from twins. Arthritis Rheum 2000; 43:30-37.
Mallet V, Blaschitz A, Crisa L, et al. HLA-G in the human thymus: A subpopulation of medullary
epithelial but not CD83(+) dendritic cells expresses HLA-G as a membrane-bound and soluble
protein. Int Immunol 1999; 11:889-98.
Manderson AP, Botto M, Walport MJ. The role of complement in the development of systemic
lupus erythematosus. Annu Rev Immunol 2004; 22:431-56.
Marsh MN. Gluten, major histocompatibility complex, and the small intestine. A molecular and
immunobiologic approach to the spectrum of gluten sensitivity (’celiac sprue’). Gastroenterology
1992; 102:330-54.
Menier C, Rabreau M, Challier JC, et al. Erythroblasts secrete the nonclassical HLA-G molecule
from primitive to definitive hematopoiesis. Blood 2004; 104:3153-60.
Menier C, Rouas-Freiss N, Carosella ED. The HLA-G non classical MHC class I molecule is
expressed in cancer with poor prognosis. Implications in tumour escape from immune system and
clinical applications. Atlas Genet Cytogenet Oncol Haematol 2008.
Miller SA, Dykes DD, Polesky HF. A simple salting out procedure for extracting DNA from human
nucleated cells. Nucleic Acids Res 1988; 16:1215.
77
Monsiváis-Urenda AE, Baranda L, Alvarez-Quiroga C, et al. Expression and Functional Role of
HLA-G in Immune Cells from Patients with Systemic Lupus Erythematosus. J Clin Immunol 2011;
31:369-78.
Moradpour D, Penin F, Rice CM. Replication of hepatitis C virus. Nat Rev Microbiol 2007; 5:453-
63.
Moreau P, Lefebvre S, Gourand L, et al. Specific binding of nuclear factors to the HLA-G gene
promoter correlates with a lack of HLA-G transcripts in first trimester human fetal liver. Hum
Immunol 1998; 59:751-7.
Moreau P, Adrian-Cabestre F, Menier C, et al. IL-10 selectively induces HLA-G expression in
human trophoblasts and monocytes. Int Immunol 1999; 11:803-11.
Moreau P, Mouillot G, Rousseau P, et al. HLA-G gene repression is reversed by demethylation.
Proc Natl Acad Sci U S A 2003;100:1191-6.
Moureau P, Flajollet S, Carosella ED. Nonclassical transcriptional regulation of HLA-G: an update.
J Cell Mol Med 2009; 13:2973-89.
Naji A, Le Rond S, Durrbach A, et al. CD3+CD4low and CD3+CD8low are induced by HLA-G.
Novel human peripheral blood suppressor T-cell subsets involved in transplant acceptance. Blood
2007; 110:3936-48.
Nattermann J, Nischalke HD, Hofmeister V, et al. HIV-1 infection leads to increased HLA-E
expression resulting in impaired function of natural killer cells. Antiviral Therapy 2005; 10:95-107.
Neumann-Haefelin C, Blum HE, Chisari FV, et al cell response in hepatitis C virus infection.
Journal of Clinical Virology 2005; 32:75-85.
O’Brien M, McCarthy T, Jenkins D, et al. Altered HLA-G transcription in preeclampsia is
associated with allele specific inheritance: possible role of the HLA-G gene in susceptibility to the
disease. Cell Mol Life Sci 2001; 58:1943-9.
Ober C, Billstrand C, Kuldanek S, et al. The miscarriage-associated HLA-G -725G allele influences
transcription rates in JEG-3 cells. Hum Reprod 2006; 21:1743-8.
Oberhuber G, Caspary WF, Kirchner T,et al. [Study Group of Gastroenterological Pathology of the
German Society of Pathology. Recommendations for celiac disease/sprue diagnosis].
Gastroenterol. 2001; 39:157-66.
Onno M, Pangault C, Le Friec G, et al Modulation of HLA-G antigens expression by human
cytomegalovirus: specific induction in activated macrophages harboring human cytomegalovirus
infection. J Immunol 2000; 164:6426-34.
Padyukov L, Silva C, Stolt P, et al. A gene–environment interaction between smoking and shared
epitope genes in HLA-DR provides a high risk of seropositive rheumatoid arthritis. Arthritis
Rheum. 2004; 50:3085-92.
78
Paul P, Cabestre FA, Ibrahim EC, et al. Identification of HLA-G7 as a new splice variant of the
HLA-G mRNA and expression of soluble HLA-G5, -G6, and -G7 transcripts in human transfected
cells. Hum Immunol 2000; 61:1138-49.
Piguet V, Wan L, Borel C, et al. HIV-1 Nef protein binds to the cellular protein PACS-1 to
downregulate class I major histocompatibility complexes. Nature Cell Biology 2000; 2:163-7.
Pizzato N, Derrien M, Lenfant F. The short cytoplasmic tail of HLA-G determines its resistance to
HIV-1 Nef-mediated cell surface downregulation. Human Immunology 2004; 65:1389-96.
Plauzolles A, Lucas M, Gaudieri S. Hepatitis C Virus Adaptation to T-Cell Immune Pressure.
Scientific World Journal 2013;2013:673240.
Qiu J, Terasaki PI, Miller J, et al. Soluble HLA-G expression and renal graft acceptance. Am. J.
Transplant 2006; 6:2152-6.
Rajagopalan S, Bryceson YT, Kuppusamy SP, et al. Activation of NK cells by an endocytosed
receptor for soluble HLA-G. PLoS Biol 2006; 4:e9.
Rebmann V, van der Ven K, Passler M, et al. Association of soluble HLA-G plasma levels with
HLA-G alleles. Tissue Antigens 2001; 57:15-21.
Ristich V, Liang S, Zhang W, et al. Tolerization of dendritic cells by HLA-G. Eur J Immunol. 2005;
35:1133-42.
Riteau B, Menier C, Khalil-Daher I, et al. HLA-G inhibits the allogeneic proliferative response. J
Reprod Immunol 1999; 43:203-11.
Riteau B, Rouas-Freiss N, Menier C, et al. HLA-G2, -G3, and -G4 isoforms expressed as
nonmature cell surface glycoproteins inhibits NK and antigen-specific CTL cytolisis. J Immunol
2001; 166:5018-26.
Rizzo R, Farina I, Bortolotti D, et al. HLA-G may predict the disease course in patients with early
rheumatoid arthritis. Human Immunology 2013; 74 :425-32.
Rizzo R, Hviid TV, Govoni M, et al. HLA-G genotype and HLA-G expression in systemic lupus
erythematosus: HLA-G as a putative susceptibility gene in systemic lupus erythematosus. Tissue
Antigens 2008a; 71:520-9.
Rizzo R, Melchiorri L, Simone L, et al. Different production of soluble HLA-G antigens by
peripheral blood mononuclear cells in ulcerative colitis and Crohn’s disease: a noninvasive
diagnostic tool? Inflamm Bowel Dis 2008b; 14:100-5.
Robinson J, Mistry K, McWilliam H, et al. The IMGT/HLA Database. Nucleic Acids Res 2011;
39:1171-6.
Ronnblom L, Eloranta ML, Alm GV. The type I interferon system in systemic lupus erythematosus.
Arthritis Rheum 2006; 54:408-20.
79
Rosen HR. Clinical practice. Chronic hepatitis C infection. N Engl J Med 2011; 364:2429-38.
Rostom A, Murray JA, Kagnoff MF: American Gastroenterological Association (AGA) Institute
technical review on the diagnosis and management of celiac disease. Gastroenterology 2006;
131:1981-2002.
Rouas-Freiss N, Goncalves RM, Menier C, et al. Direct evidence to support the role of HLA-G in
protecting the fetus from maternal uterine natural killer cytolysis. Proc Natl Acad Sci U S A 1997b;
94:11520-5.
Rouas-Freiss N, Marchal RE, Kirszenbaum M, et al. The alpha1 domain of HLA-G1 and HLA-G2
inhibits cytotoxicity induced by natural killer cells: is HLA-G the public ligand for natural killer
cell inhibitory receptors? Proc Natl Acad Sci U S A 1997a; 94:5249-54.
Rouas-Freiss N, Moreau P, Ferrone S, et al. HLA-G proteins in cancer: do they provide tumor cells
with an escape mechanism? Cancer Res 2005; 65:10139-44.
Rousseau P, Le Discorde M, Mouillot G, et al. The 14 bp deletion-insertion polymorphism in the 3’
UT region of the HLA-G gene influences HLA-G mRNA stability. Hum Immunol 2003; 64:1005-
10.
Rousseau P, Paul P, O’Brien M, et al. The X1 box of HLA-G promoter is a target site for RFX and
Sp1 factors. Hum Immunol 2000; 61:1132-7.
Saito I, Miyamura T, Ohbayashi A, et al. Hepatitis C virus infection is associated with the
development of hepatocellular carcinoma. Proc Natl Acad Sci USA 1990; 87:6547-9.
Schett G, Redlich K, Xu Q, et al. Enhanced expression of heat shock protein 70 (hsp70) and heat
shock factor 1 (HSF1) activation in rheumatoid arthritis synovial tissue. Differential regulation of
hsp70 expression and hsf1 activation in synovial fibroblasts by proinflammatory cytokines, shear
stress, and antiinflammatory drugs. J Clin Invest 1998; 102:302-11.
Schiffer L, Sinha J, Wang X, et al. Short term administration of costimulatory blockade and
cyclophosphamide induces remission of systemic lupus erythematosus nephritis in NZB/W F1 mice
by a mechanism downstream of renal immune complex deposition. J Immunol. 2003; 171:489-97.
Schmidt CM, Ehlenfeldt RG, Athanasiou MC, et al. Extraembryonic expression of the human MHC
class I gene HLA-G in transgenic mice. evidence for a positive regulatory region located 1 kilobase
5’ to the start site of transcription. J Immunol 1993; 151:2633-45.
Schuppan D, Junker Y, Barisani D: Celiac disease: from pathogenesis to novel therapies.
Gastroenterology 2009; 137:1912-33.
Schuppan D, Zimmer K. The diagnosis of treatment of celiac disease. Dtsch Arztebl Int 2013;
110:835-45.
Scott DL, Wolfe F, Huizinga TWJ. Rheumatoid arthritis. The Lancet 2010; 376:1094-108.
80
Selmani Z, Naji A, Zidi I, et al. Human leukocyte antigen-G5 secretion by human mesenchymal
stem cells is required to suppress T lymphocyte and natural killer function and to induce
CD4+CD25highFOXP3+ regulatory T cells. Stem Cells 2008; 26:212-22.
Shan L, Molberg O, Parrot I, et al.: Structural basis for gluten intolerance in celiac sprue. Science
2002; 297:2275-9.
Shiroishi M, Kuroki K, Rasubala L, et al. Structural basis for recognition of the nonclassical MHC
molecule HLA-G by the leukocyte Ig-like receptor B2 (LILRB2/LIR2/ILT4/CD85d). Proc Natl
Acad Sci USA 2006a; 103:16412-7.
Shiroishi M, Kuroki K, Ose T, et al. Efficient leukocyte Ig-like receptor signaling and crystal
structure of disulfide-linked HLA-G dimer. J Biol Chem 2006b; 281:10439-47.
Shlomchik MJ, Craft JE, Mamula MJ. From T to B and back again: positive feedback in systemic
autoimmune disease. Nat Rev Immunol 2001; 1:147-53.
Solier C, Mallet V, Lenfant F, et al. HLA-G unique promoter region: functional implications.
Immunogenetics 2001; 53:617-25.
Sollid LM, Lundin KE. Diagnosis and treatment of celiac disease. Mucosal Immunol 2009; 2:3-7.
Suarez MB, Morales P, Castro MJ, et al. A new HLA-G allele (HLA-G*0105N) and its distribution
in the Spanish population. Immunogenetics 1997; 45:464-5.
Suryanarayana V, Rao L, Kanakavalli M, et al. Association between novel HLA-G genotypes and
risk of recurrent miscarriages: a case-control study in a south indian population. Reproductive
Sciences 2008; 15:817-24.
Svendsen SG, Hantash BM, Zhao L et al. Faber C, Bzorek M, Nissen MH, Hviid TV. The
expression and functional activity of membrane-bound human leukocyte antigen-G1 are influenced
by the 3'-untranslated region. Hum Immunol 2013; 74:818-27.
Szodoray P, Szabo Z, Kapitany A, et al. Anti-citrullinated protein/peptide autoantibodies in
association with genetic and environmental factors as indicators of disease outcome in rheumatoid
arthritis. Autoimmun Rev 2010; 9:140-3.
Takaki A, Wiese M, Maertens G, et al. Cellular immune responses persist and humoral responses
decrease two decades after recovery from a single-source outbreak of hepatitis C. Nat Med 2000;
6:578-82.
Tan Z, Randall G, Fan J, et al. Allele-specific targeting of microRNAs to HLA-G and risk of
asthma. Am J Hum Genet 2007; 81:829-34.
Tan Z, Shon AM, Ober C. Evidence of balancing selection at the HLA-G promoter region. Hum
Mol Genet 2005; 14:3619-28.
81
Taylor KE, Chung SA, Graham RR, et al. Risk alleles for systemic lupus erythematosus in a large
case-control collection and associations with clinical subphenotypes. PLoS Genet 2011;
7:e1001311.
The MHC sequencing consortium. Complete sequence and gene map of a human major
histocompatibility complex. Nature. 1999; 401:921-3.
Thimme R, Lohmann V, Weber F. A target on the move: innate and adaptive immune escape
strategies of hepatitis C virus. Antiviral Research 2006; 69:129-41.
Timm J, Lauer GM, Kavanagh DG, et al. CD8 epitope escape and reversion in acute HCV
infection. Journal of Experimental Medicine 2004; 200:1593-604.
Timm J, Roggendorf M: Sequence diversity of hepatitis C virus: Implications for immune control
and therapy. World J Gastroenterol 2007, 13:4808-17.
Torres MI, Lopez Casado MA, Rios A. New aspects in celiac disease. World J Gastroenterol 2007;
13:1156-61.
Torres MI, Le Discorde M, Lorite P, et al. Expression of HLA-G in inflammatory bowel disease
provides a potential way to distinguish between ulcerative and Crohn’s disease. Int. Immunol 2004;
16:579-83.
Ugurel S, Rebmann V, Ferrone S, et al. Soluble human leukocyte antigen_G serum level is elevated
in melanoma patients and is further increased by interferon-alpha immunotherapy. Cancer 2001;
92:369-76.
van der Helm-van Mil AH, Wesoly JZ, Huizinga TW. Understanding the genetic contribution to
rheumatoid arthritis. Curr Opin Rheumatol 2005; 17:299-304.
van der Meer A, Lukassen HGM, van Lierop MJC, et al. Membrane-bound HLA-G activates
proliferation and interferon-gamma production by uterine natural killer cells. Mol Hum Reprod
2004; 10:189-95.
van der Woude D, Alemayehu WG, Verduijn W, et al. Gene–environment interaction influences the
reactivity of autoantibodies to citrullinated antigens in rheumatoid arthritis. Nat Genet. 2010;
42:814-6.
Veit TD, Cordero EA, Mucenic T, et al. Association of the HLA-G 14 bp polymorphism
with systemic lupus erythematosus. Lupus 2009; 18:424-30.
Verbruggen LA, Rebmann V, Demanet C, et al. Soluble HLA-G in rheumatoid arthritis. Hum
Immunol 2006; 67:561-7.
Vossenaar ER, Zendman AJ, van Venrooij WJ, et al. PAD, a growing family of citrullinating
enzymes: genes, features and involvement in disease. Bioessays 2003; 25: 1106-18.
Vyse TJ, Todd JA. Genetic analysis of autoimmune disease. Cell 1996; 85:311-8.
82
Walker-Smith JA, Guandalini S, Schmitz J, et al. Revised criteria for diagnosis of celiac disease.
Report of Working Group of European Society of Paediatric Gastroenterology and Nutrition. Arch
Dis Child 1990; 65: 909-11.
Weng PJ, Fu YM, Ding SX, et al. Elevation of plasma soluble human leukocyte antigen–G in
patients with chronic hepatitis C virus infection. Hum Immunol 2011; 72:406-11.
Wiendl H, Feger U, Mittelbronn M, et al. Expression of the immune-tolerogenic major
histocompatibility molecule HLA-G in multiple sclerosis: implications for CNS immunity. Brain
2005; 128:2689-704.
Williams M, Roeth JF, Kasper MR, et al. Direct binding of human immunodeficiency virus type 1
Nef to the major histocompatibility complex class I (MHC-I) cytoplasmic tail disrupts MHC-I
trafficking. Journal of Virology 2002; 76:12173-84.
Wu FX, Wu LJ, Luo XY, et al. Lack of association between HLA-G 14-bp polymorphism and
systemic lupus erythematosus in a Han Chinese population. Lupus 2009; 18:1259-66.
Yang W Shen N, Ye DQ, et al. Genome-wide association study in Asian populations identifies
variants in ETS1 and WDFY4 associated with systemic lupus erythematosus. PLoS Genet 2010;
6:e1000841.
Yang Y, Chu W, Geraghty DE, et al. Expression of HLA-G in human mononuclear phagocytes and
selective induction by IFN-gamma. J Immunol 1996; 156:4224-31.
Yie SM. HLA-G major histocompatibility complex, class I, G. Atlas Genet Cytogenet Oncol
Haematol 2012.
Yie SM, Li LH, Xiao R, et al. A single base-pair mutation in the 30-untranslated region of HLA-G
mRNA is associated with pre-eclampsia. Mol Hum Reprod 2008; 14:649-53.
Zimmer KP, Fischer I, Mothes T, et al. Endocytotic segregation of gliadin peptide 31–49 in
enterocytes. Gut 2010; 59:300-10.
Zhu XM, Han T, Wang XH, et al. Overexpression of miR-152 leads to reduced expression of
human leukocyte antigen-G and increased natural killer cell mediated cytolysis in JEG-3 cells. Am
J Obstet Gynecol 2010; 202:592.