STATISTICA - mi.imati.cnr.it · varianza totale Analisi della Varianza Fonte di variabilità Gradi...
19
Regressione-4 Il modello lineare generale STATISTICA
Transcript of STATISTICA - mi.imati.cnr.it · varianza totale Analisi della Varianza Fonte di variabilità Gradi...

Regressione-4
Il modello lineare generale
STATISTICA

InferenzaIl modello della
regressione linearesemplice:
⟺ ~ ,
~ ,

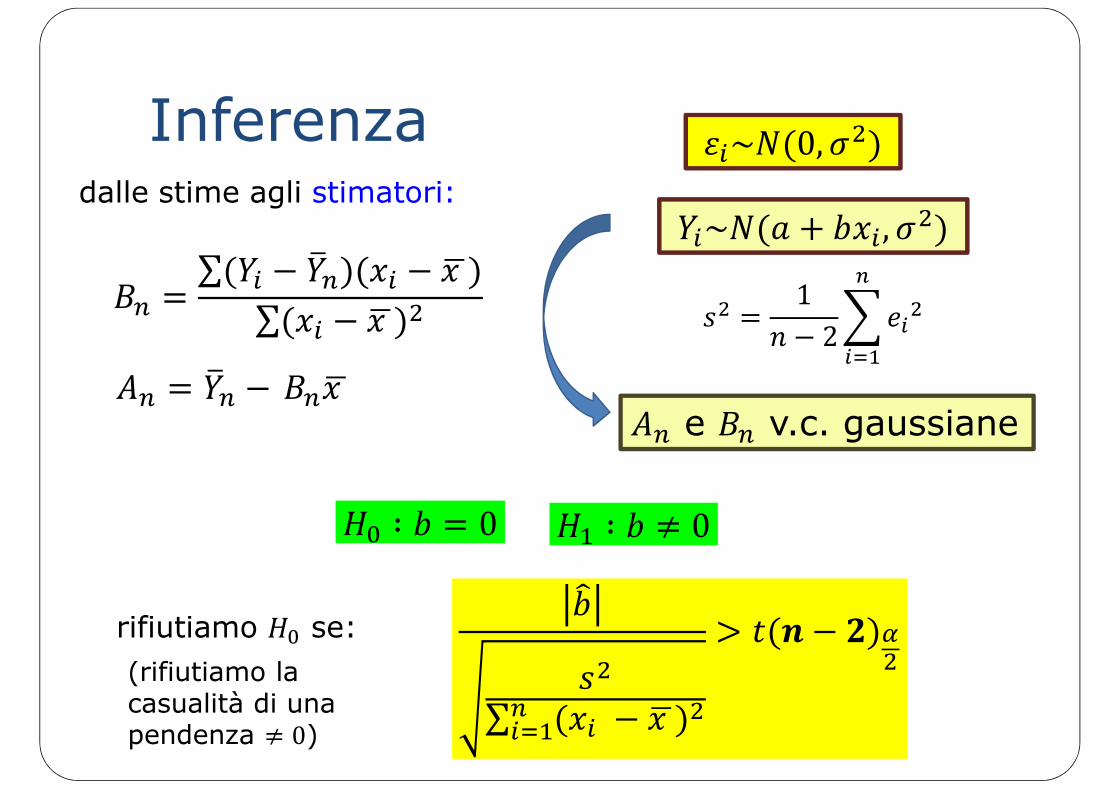
Inferenza
⟺ ~ ,
0
∑∑
Inferenza
∑ ∑
~ 0,
~ ,
e v.c. gaussiane
dalle stime agli stimatori:
∶ 0 ∶ ≠ 0
12
∑
>rifiutiamo se:
(rifiutiamo la casualità di unapendenza ≠ 0)

La regressione con
6 8 10 12 14 16
15
20
25
30
35
Disoccupazione (%)
Vo
to p
er
Ma
cro
n (
%)
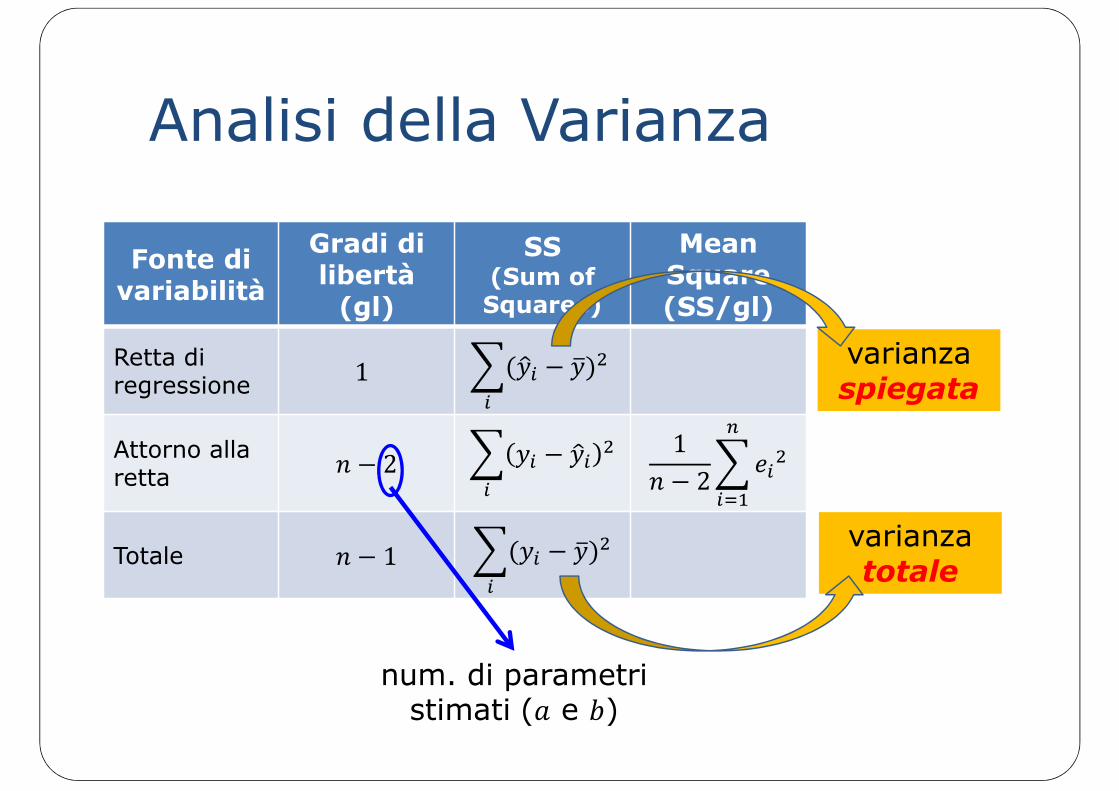
varianzatotale
Analisi della Varianza
Fonte di variabilità
Gradi di libertà
(gl)
SS(Sum of Squares)
Mean Square(SS/gl)
Retta di regressione
1
Attorno allaretta
2 12
Totale 1
num. di parametristimati ( e )
varianzaspiegata
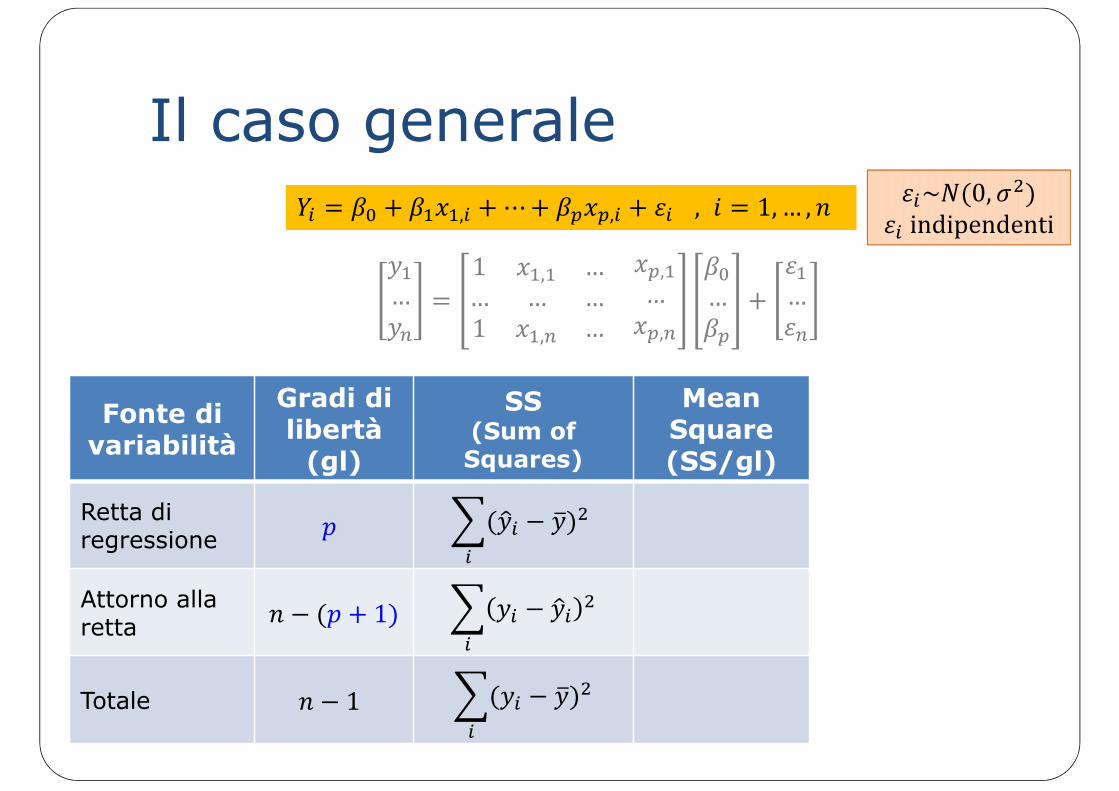
Il caso generale
, ⋯ , , 1, … ,
…1 , …… … …1 , …
,
…,
… …
Fonte di variabilità
Gradi di libertà
(gl)
SS(Sum of Squares)
Mean Square(SS/gl)
Retta di regressione
Attorno allaretta
1
Totale 1
~ 0,indipendenti~ 0,
indipendenti
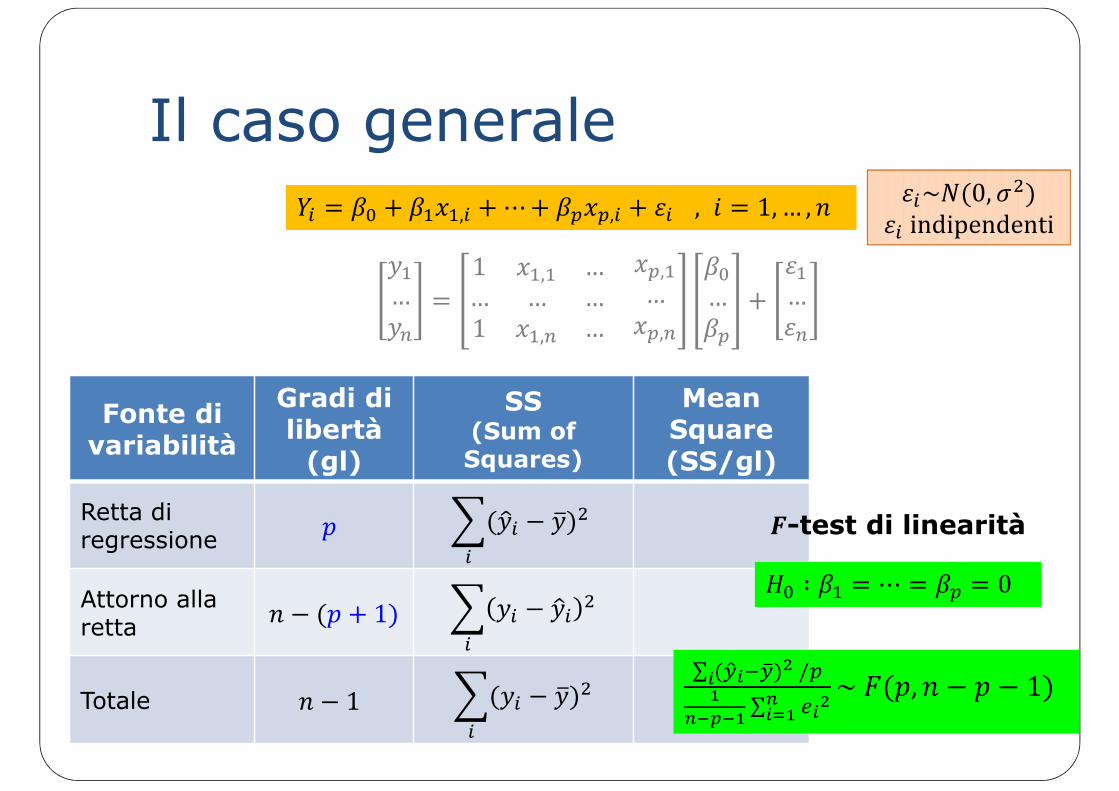
Il caso generale
, ⋯ , , 1, … ,
…1 , …… … …1 , …
,
…,
… …
Fonte di variabilità
Gradi di libertà
(gl)
SS(Sum of Squares)
Mean Square(SS/gl)
Retta di regressione
Attorno allaretta
1
Totale 1∑ /
∑ ~ , 1
∶ ⋯ 0-test di linearità
~ 0,indipendenti~ 0,
indipendenti
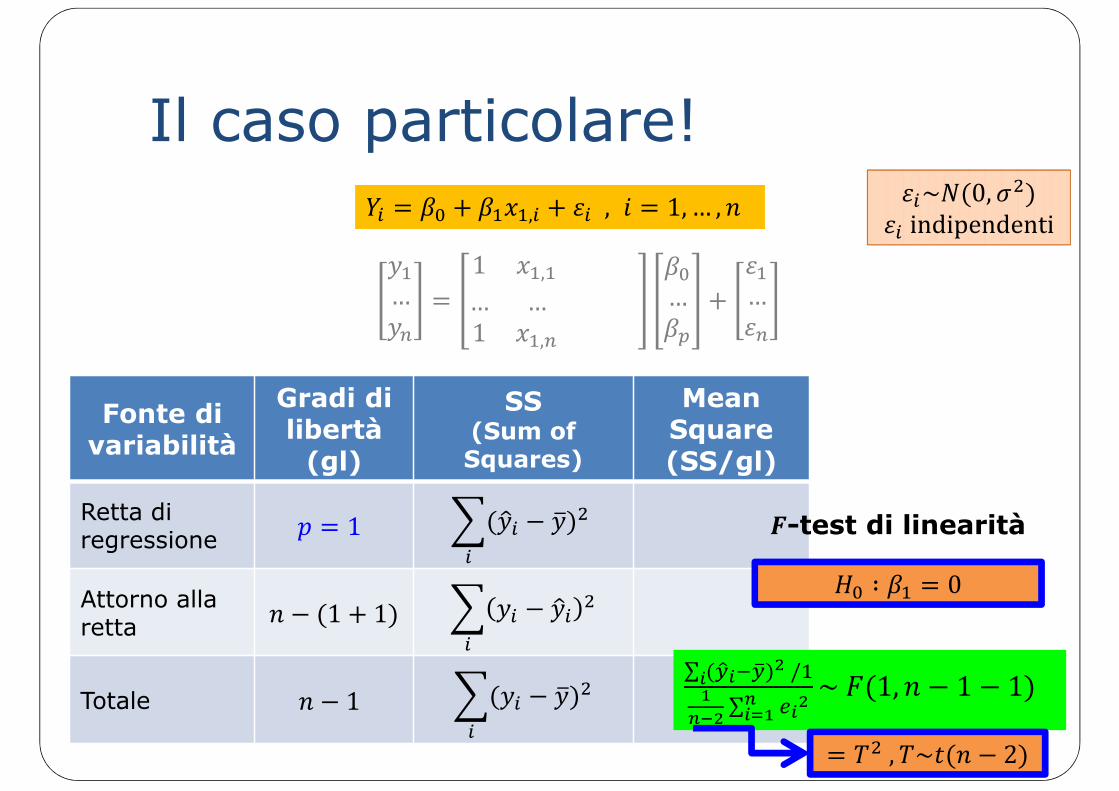
Il caso particolare!
, , 1, … ,
…1 ,… …1 ,
… …
Fonte di variabilità
Gradi di libertà
(gl)
SS(Sum of Squares)
Mean Square(SS/gl)
Retta di regressione
1
Attorno allaretta
1 1
Totale 1∑ /
∑ ~ 1, 1 1
∶ 0-test di linearità
~ 0,indipendenti~ 0,
indipendenti
, ~ 2
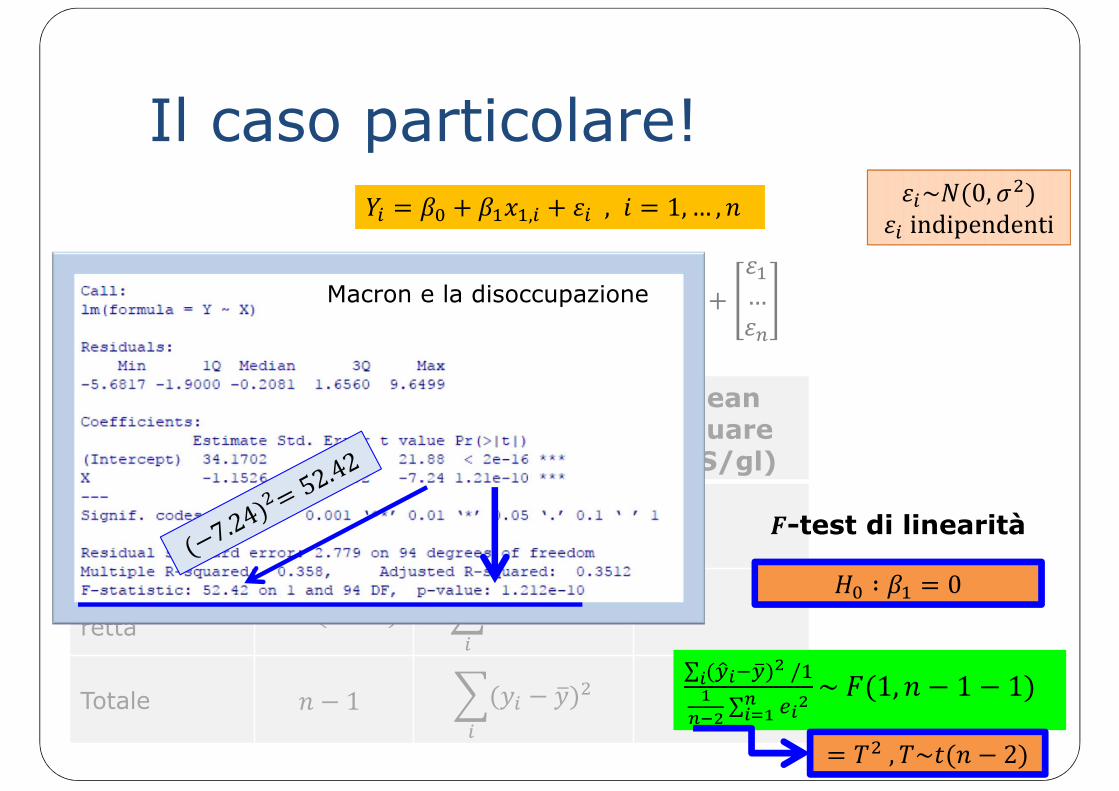
Il caso particolare!
, , 1, … ,
…1 ,… …1 ,
… …
Fonte di variabilità
Gradi di libertà
(gl)
SS(Sum of Squares)
Mean Square(SS/gl)
Retta di regressione
1
Attorno allaretta
1 1
Totale 1∑ /
∑ ~ 1, 1 1
∶ 0-test di linearità
~ 0,indipendenti~ 0,
indipendenti
, ~ 2
Macron e la disoccupazione

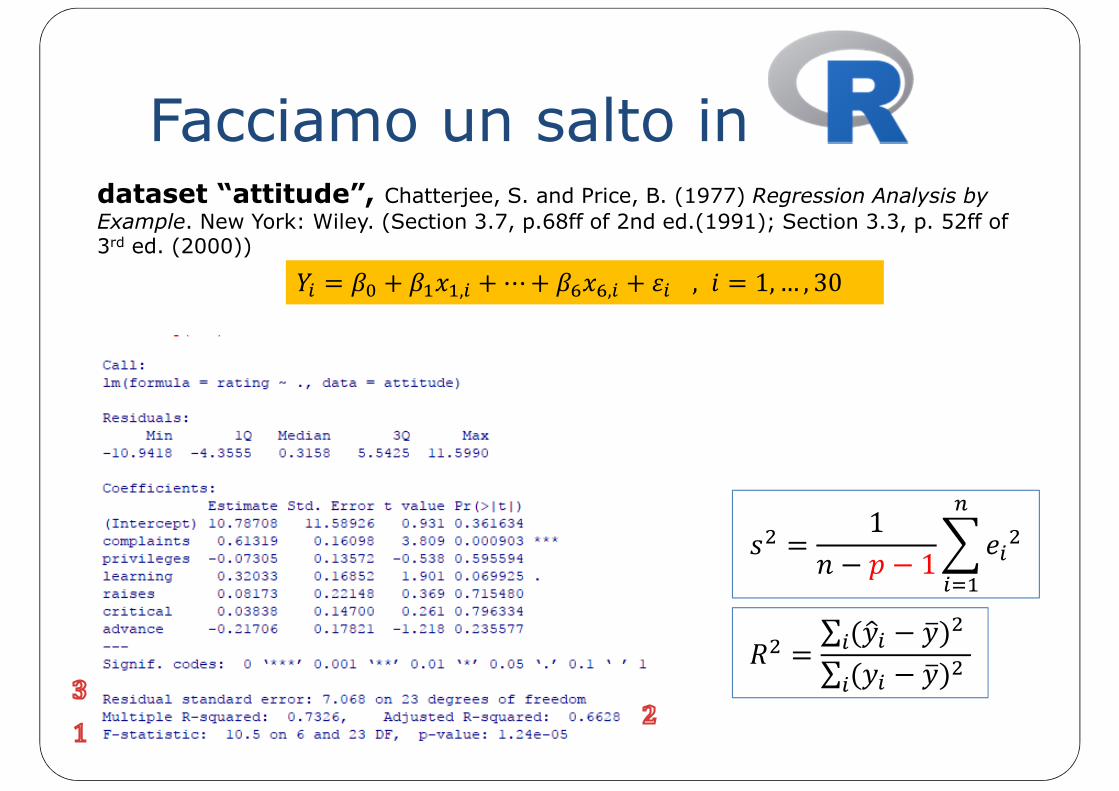
Facciamo un salto in dataset “attitude”, Chatterjee, S. and Price, B. (1977) Regression Analysis by
Example. New York: Wiley. (Section 3.7, p.68ff of 2nd ed.(1991); Section 3.3, p. 52ff of 3rd ed. (2000))
From a survey of the clerical employees of a large financial organization, the data are aggregated from the questionnaires of the approximately 35 employees for each of 30 (randomly selected) departments. The numbers give the percent proportion of favorable responses to seven questions in each department.
There was a question designed to measure the overall performance of a supervisor, as well as questions that were related to specific activities involving interaction between supervisor and employee.
, , related to direct interpersonal relationships between superv. and empl., whereasand related to the job as a whole. (rate of advancing to better jobs) served as a
general measure of how the empl. perceives his/her own progress in the company.
The response to any item ranged 1-5 (1=very satisfactory, 5=very insatisfactory). A dichotomus index was created to each item: {1,2} = favorable response. Data have been aggregated for departments.
Facciamo un salto in dataset “attitude”, Chatterjee, S. and Price, B. (1977) Regression Analysis by
Example. New York: Wiley. (Section 3.7, p.68ff of 2nd ed.(1991); Section 3.3, p. 52ff of 3rd ed. (2000))
∑ ∑
11
, ⋯ , , 1, … , 30
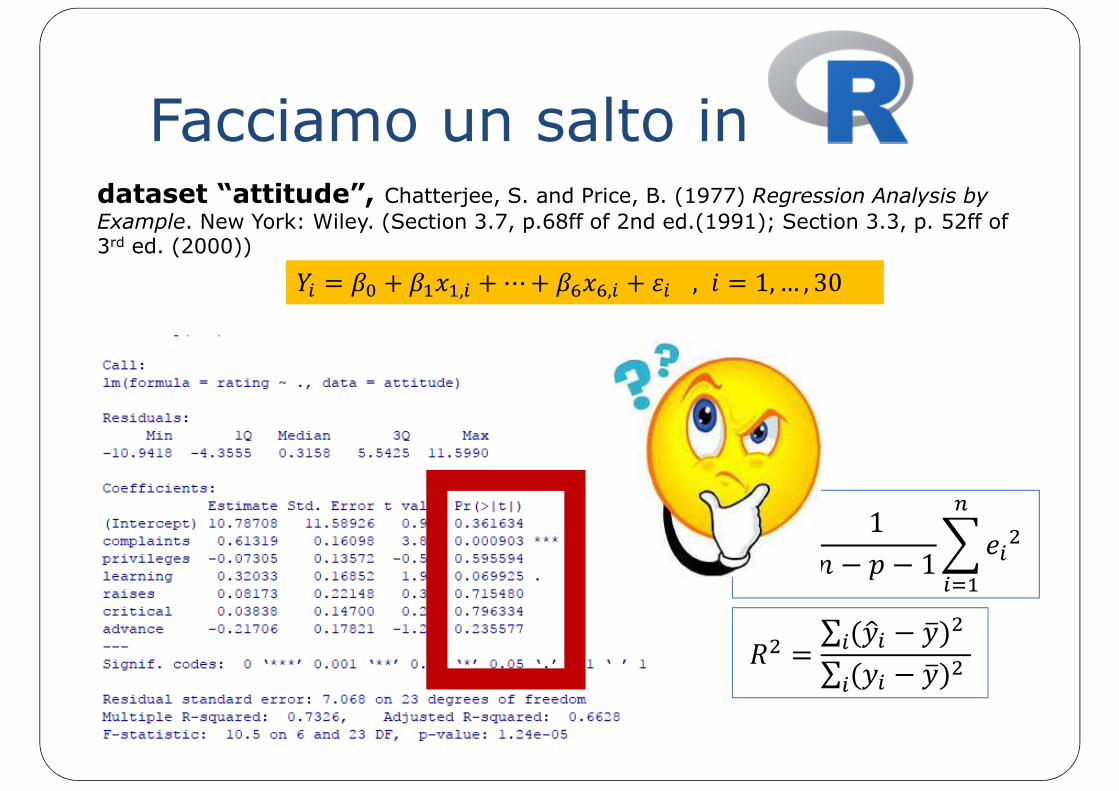
Facciamo un salto in dataset “attitude”, Chatterjee, S. and Price, B. (1977) Regression Analysis by
Example. New York: Wiley. (Section 3.7, p.68ff of 2nd ed.(1991); Section 3.3, p. 52ff of 3rd ed. (2000))
∑ ∑
11
, ⋯ , , 1, … , 30
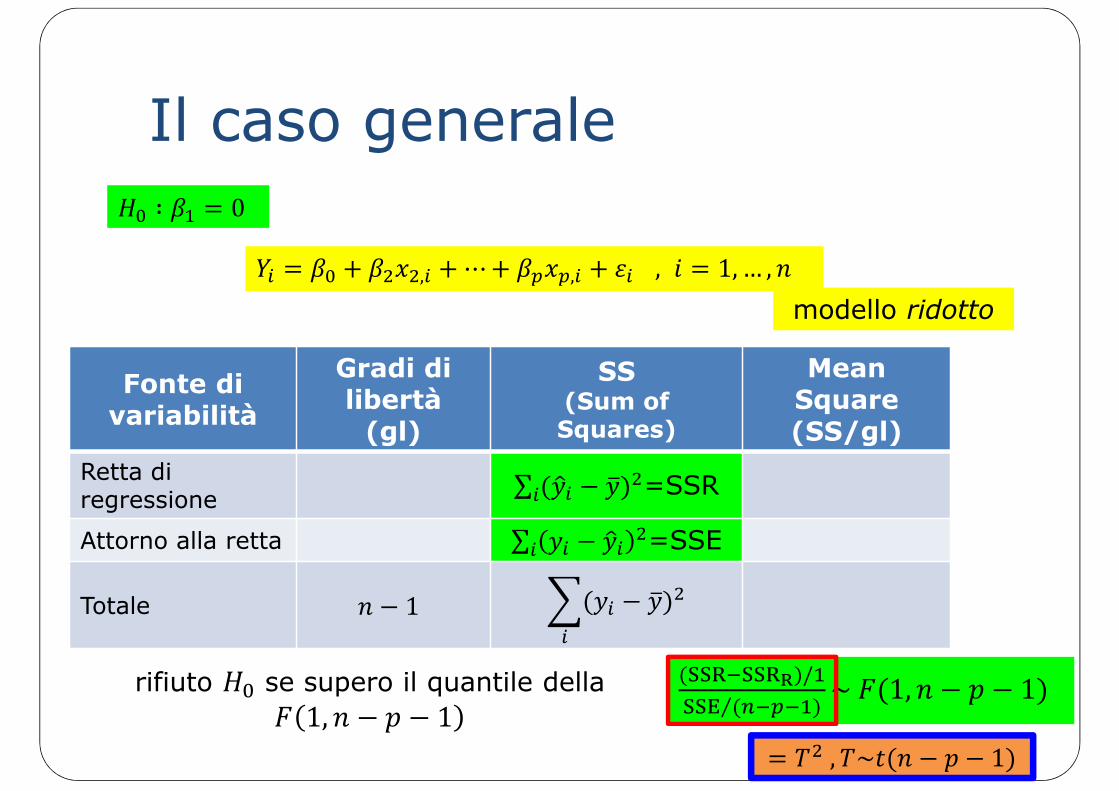
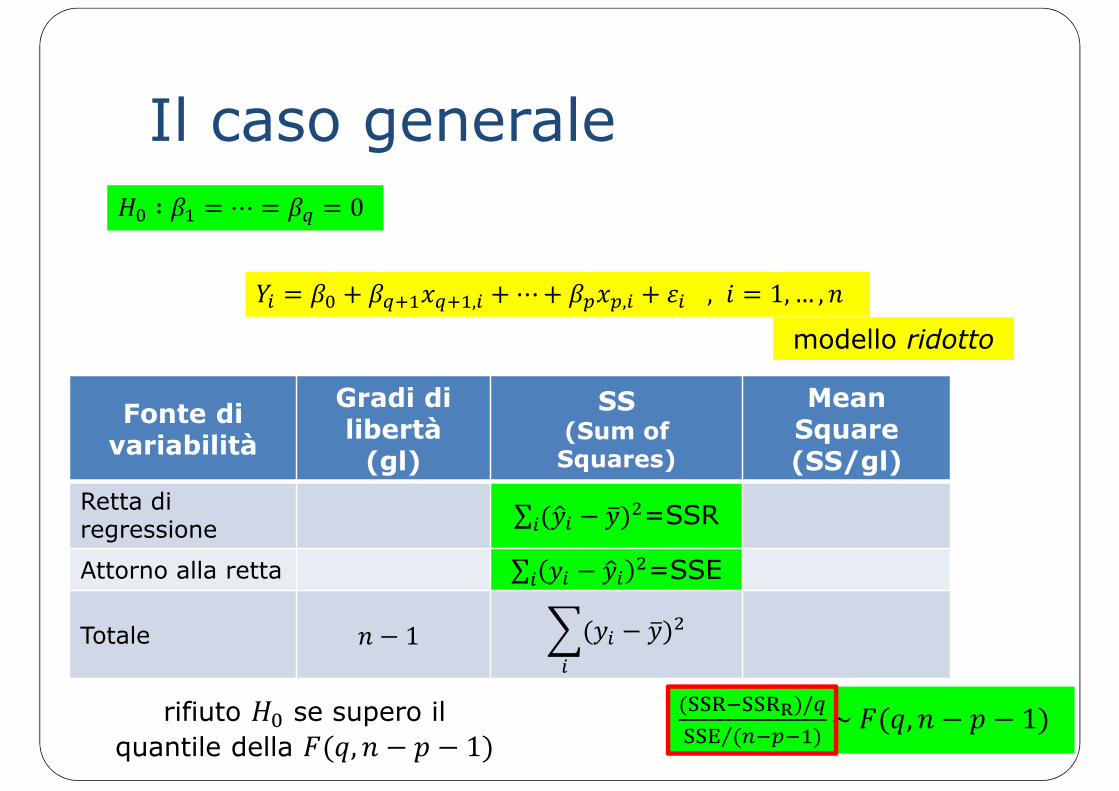
Il caso generale
, ⋯ , , 1, … ,
Fonte di variabilità
Gradi di libertà
(gl)
SS(Sum of Squares)
Mean Square(SS/gl)
Retta di regressione
∑ =SSR
Attorno alla retta ∑ =SSE
Totale 1
/⁄ ~ 1, 1
∶ 0
modello ridotto
rifiuto se supero il quantile della
1, 1, ~ 1
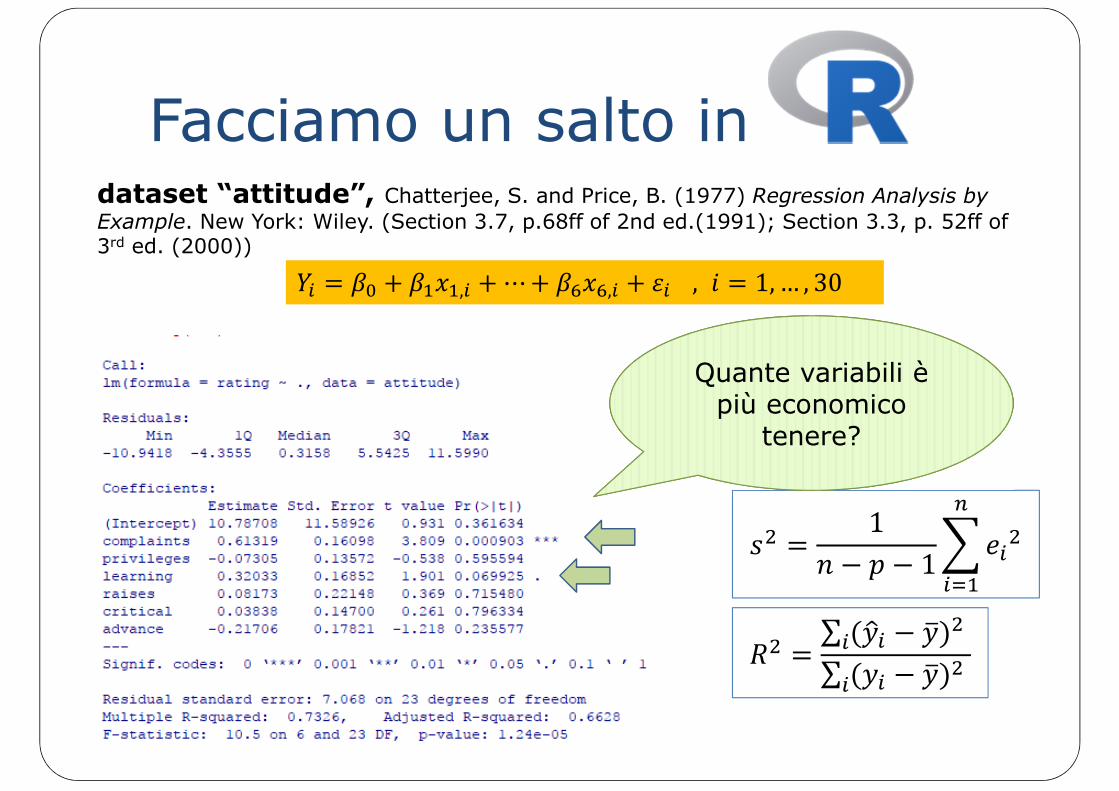
Facciamo un salto in dataset “attitude”, Chatterjee, S. and Price, B. (1977) Regression Analysis by
Example. New York: Wiley. (Section 3.7, p.68ff of 2nd ed.(1991); Section 3.3, p. 52ff of 3rd ed. (2000))
∑ ∑
11
, ⋯ , , 1, … , 30
Quante variabili è più economico
tenere?
Il caso generale
, ⋯ , , 1, … ,
Fonte di variabilità
Gradi di libertà
(gl)
SS(Sum of Squares)
Mean Square(SS/gl)
Retta di regressione
∑ =SSR
Attorno alla retta ∑ =SSE
Totale 1
/⁄ ~ , 1
∶ ⋯ 0
modello ridotto
rifiuto se supero il
quantile della , 1
Il caso generale
, ⋯ , , 1, … ,
Fonte di variabilità
Gradi di libertà
(gl)
SS(Sum of Squares)
Mean Square(SS/gl)
Retta di regressione
∑ =SSR
Attorno alla retta ∑ =SSE
Totale 1
/⁄ ~ , 1
∶ ⋯ 0
modello ridotto
rifiuto se supero il
quantile della , 1
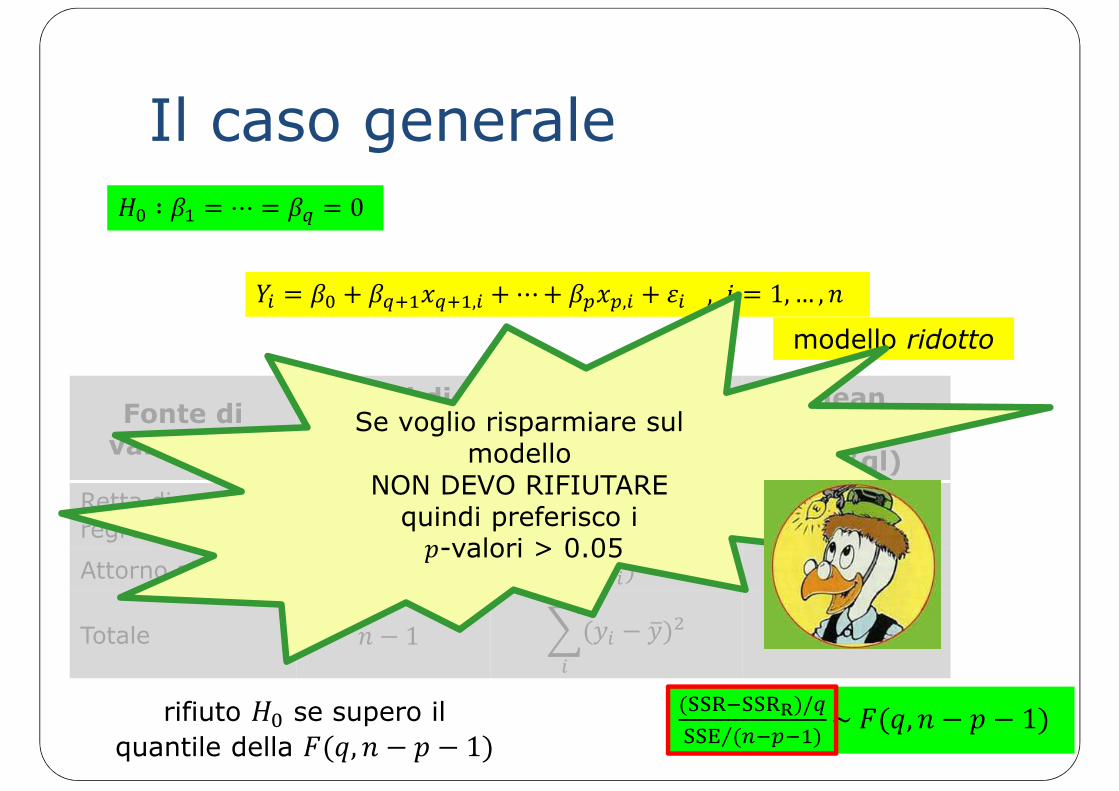
Se voglio risparmiare sulmodello
NON DEVO RIFIUTAREquindi preferisco i
-valori > 0.05
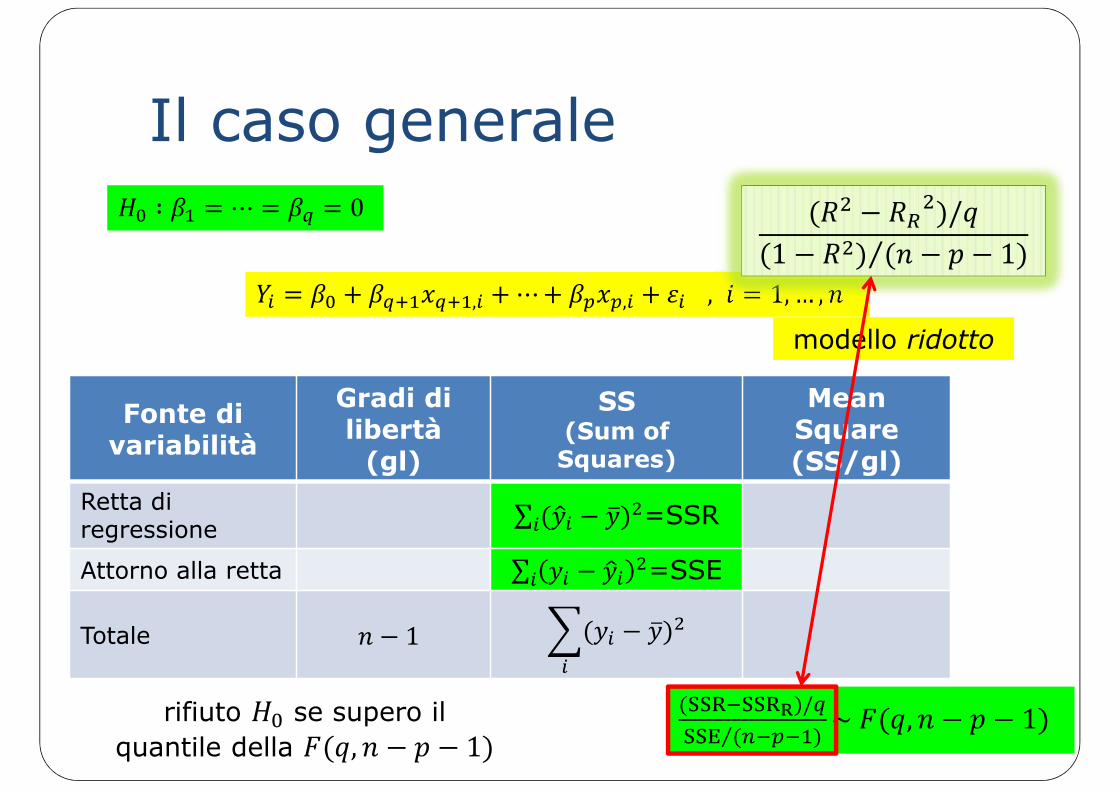
Il caso generale
, ⋯ , , 1, … ,
Fonte di variabilità
Gradi di libertà
(gl)
SS(Sum of Squares)
Mean Square(SS/gl)
Retta di regressione
∑ =SSR
Attorno alla retta ∑ =SSE
Totale 1
/⁄ ~ , 1
∶ ⋯ 0
modello ridotto
/1 1⁄
/1 1⁄
rifiuto se supero il
quantile della , 1

Facciamo un salto in dataset “attitude”, Chatterjee, S. and Price, B. (1977) Regression Analysis by
Example. New York: Wiley. (Section 3.7, p.68ff of 2nd ed.(1991); Section 3.3, p. 52ff of 3rd ed. (2000))
/1 1⁄
0.7326 0.708 4⁄1 0.7326 23⁄ 0.621/
1 1⁄0.7326 0.708 4⁄1 0.7326 23⁄ 0.621

![3LDQR GL 0LJOLRUDPHQWR 3'00rghoor gl 3ldqr gl 0ljolrudphqwr ,1',5( 3djlqd gl 0rgdolwj gl ulohyd]lrqh 2elhwwlyr gl surfhvvr lq yld gl dwwxd]lrqh frpxqlfduh hiilfdfhphqwh od plvvlrq](https://static.fdocumenti.com/doc/165x107/6063ca72175738031e142e3b/3ldqr-gl-0ljolrudphqwr-30-0rghoor-gl-3ldqr-gl-0ljolrudphqwr-15-3djlqd-gl-0rgdolwj.jpg)


![%DQGR '$*5, SHU LO )LQDQ]LDPHQWR GL $]LRQL GL … · 2019-11-26 · 3ursrvwd shu lo ulfrqrvflphqwr gho wlwror gl 9lvlwlqj 3urihvvru gl 'lsduwlphqwr 6l yxroh ulfklhghuh lo ulfrqrvflphqwr](https://static.fdocumenti.com/doc/165x107/5ebffc368ad5475862755ee1/dqgr-5-shu-lo-lqdqldphqwr-gl-lrql-gl-2019-11-26-3ursrvwd-shu-lo-ulfrqrvflphqwr.jpg)