Simposio - psicogeriatria.it · Post mortem autoradiograms In vivo PET imaging Klunk et al. 2004 ....
83
Daniela Perani Vita-Salute San Raffaele University, Nuclear Medicine Department and Division of Neuroscience San Raffaele Scientific Institute, Milano AIP 15° Congresso Nazionale Firenze 16-18 aprile 2015 Simposio Il punto sulle più recenti evoluzioni dell’imaging nelle demenze HIGHLIGTHS SUI CONTRIBUTI della PET
Transcript of Simposio - psicogeriatria.it · Post mortem autoradiograms In vivo PET imaging Klunk et al. 2004 ....

Daniela Perani
Vita-Salute San Raffaele University,
Nuclear Medicine Department and Division of Neuroscience
San Raffaele Scientific Institute, Milano
AIP 15° Congresso Nazionale
Firenze 16-18 aprile 2015
Simposio
Il punto sulle più recenti evoluzioni dell’imaging nelle
demenze
HIGHLIGTHS SUI CONTRIBUTI della PET

• investigating underline
pathophysiological mechanisms
• providing disease evidence in early
and preclinical phase
• supporting clinical diagnosis and
differential diagnosis
• evaluating prognosis and risk
progression
• monitoring therapy
PET molecular neuroimaging
in neurology research

This patient demonstrates a significant correlation
between severe decreased cognitive functions and
diffuse functional reduction more severe in the
temporo/parietal associative cortex
Probable AD
Perani et al. JNM, 1988
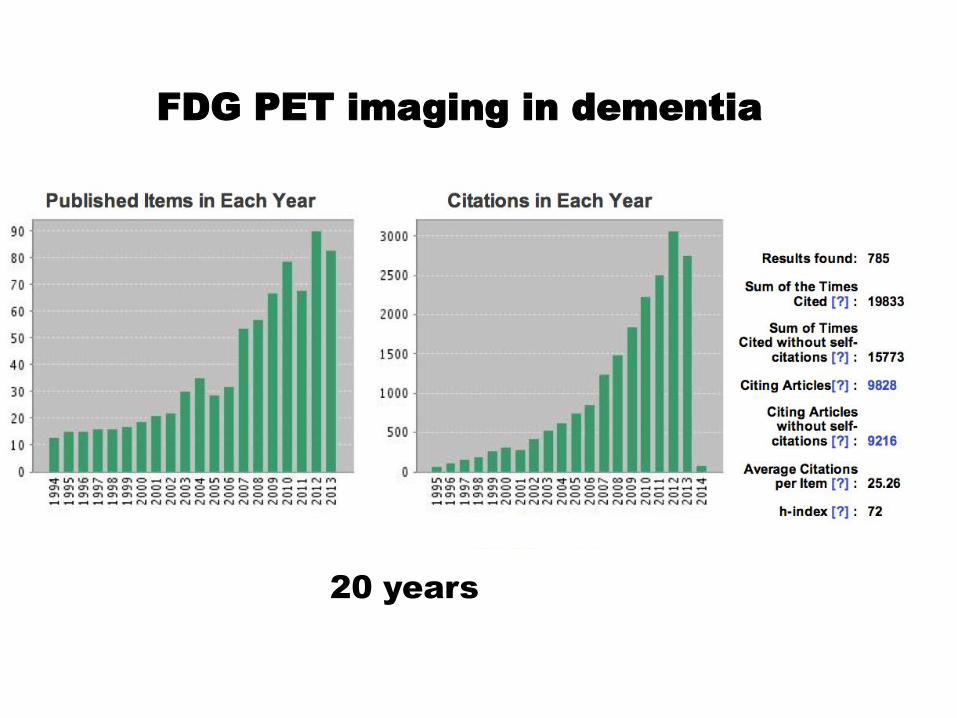
FDG PET imaging in dementia
20 years

Post mortem autoradiograms In vivo PET imaging
Klunk et al. 2004

AMYLOID-PET imaging in dementia
10 years

Current diagnostic neuroimaging
biomarkers fall into two categories:
biomarkers of disease stage (neuronal injury):
FDG-PET
biomarkers of disease state (Ab amyloid burden): AMY-PET
These PET biomarkers are sufficiently validated to have been incorporated into research diagnostic criteria and commonly used in therapeutic trials
Jack CR, Holtzman DM, Neuron 2013
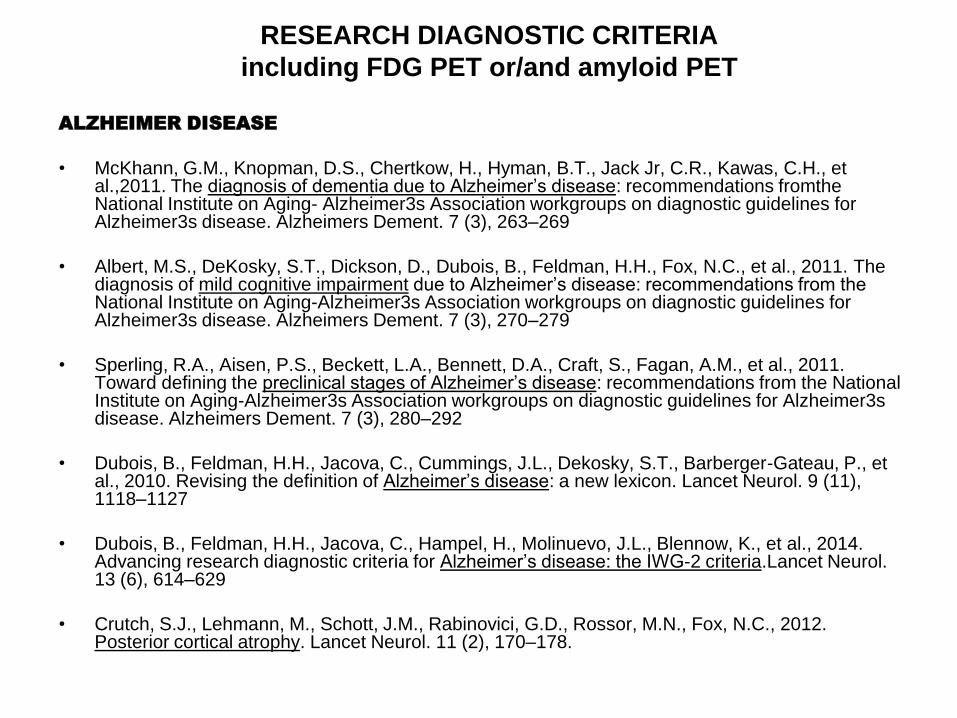
RESEARCH DIAGNOSTIC CRITERIA
including FDG PET or/and amyloid PET
ALZHEIMER DISEASE
• McKhann, G.M., Knopman, D.S., Chertkow, H., Hyman, B.T., Jack Jr, C.R., Kawas, C.H., et al.,2011. The diagnosis of dementia due to Alzheimer’s disease: recommendations fromthe National Institute on Aging- Alzheimer3s Association workgroups on diagnostic guidelines for Alzheimer3s disease. Alzheimers Dement. 7 (3), 263–269
• Albert, M.S., DeKosky, S.T., Dickson, D., Dubois, B., Feldman, H.H., Fox, N.C., et al., 2011. The diagnosis of mild cognitive impairment due to Alzheimer’s disease: recommendations from the National Institute on Aging-Alzheimer3s Association workgroups on diagnostic guidelines for Alzheimer3s disease. Alzheimers Dement. 7 (3), 270–279
• Sperling, R.A., Aisen, P.S., Beckett, L.A., Bennett, D.A., Craft, S., Fagan, A.M., et al., 2011. Toward defining the preclinical stages of Alzheimer’s disease: recommendations from the National Institute on Aging-Alzheimer3s Association workgroups on diagnostic guidelines for Alzheimer3s disease. Alzheimers Dement. 7 (3), 280–292
• Dubois, B., Feldman, H.H., Jacova, C., Cummings, J.L., Dekosky, S.T., Barberger-Gateau, P., et al., 2010. Revising the definition of Alzheimer’s disease: a new lexicon. Lancet Neurol. 9 (11), 1118–1127
• Dubois, B., Feldman, H.H., Jacova, C., Hampel, H., Molinuevo, J.L., Blennow, K., et al., 2014. Advancing research diagnostic criteria for Alzheimer’s disease: the IWG-2 criteria.Lancet Neurol. 13 (6), 614–629
• Crutch, S.J., Lehmann, M., Schott, J.M., Rabinovici, G.D., Rossor, M.N., Fox, N.C., 2012. Posterior cortical atrophy. Lancet Neurol. 11 (2), 170–178.

LEWY BODY DISEASE
• McKeith, I.G., Dickson, D.W., Lowe, J., Emre, M., O3Brien, J.T., Feldman, H., et al., 2005.Diagnosis and management of dementia with Lewy bodies: third report of the DLB. Consortium. Neurology 65 (12), 1863–1872
FRONTOTEMPORAL DEGENERATION SPECTRUM
• bvFTD Rascovsky, K., Hodges, J.R., Knopman, D., Mendez, M.F., Kramer, J.H., Neuhaus, J., et al.,2011. Sensitivity of revised diagnostic criteria for the behavioural variant of Frontotemporal dementia. Brain 134 (9), 2456–2477
• PPA Gorno-Tempini, M.L., Hillis, A.E., Weintraub, S., Kertesz, A., Mendez, M., Cappa, S.F., et al.,2011. Classification of primary progressive aphasia and its variants. Neurology 76 (11), 1006–1014
• CBD Armstrong, M.J., Litvan, I., Lang, A.E., Bak, T.H., Bhatia, K.P., Borroni, B., et al., 2013. Criteria for the diagnosis of corticobasal degeneration. Neurology 80 (5), 496–503
RESEARCH DIAGNOSTIC CRITERIA
including FDG PET or/and amyloid PET

Summary sensitivity effect measures: 0.86 for FDG-early diagnosis 0.90 for FDG-differential diagnosis
0.91 for amyloid-early sensitivity

• FDG PET = detect specific topographical
patterns
• AMY PET = measure the amount of
amyloid burden


Statistical Parametric Mapping SPM [18F]FDG-PET
VOXEL-BASED ANALYSIS at a GROUP and SINGLE SUBJECT
LEVEL

Probable AD

Logopenic vPPA

Lewy-Body Dementia (DLB) ♀ 71 years old


Behavioral Variant FTD (bvFTD) ♀ 69 years old


Higher sensitivity and specificity values for SPM Maps (96% and
84%),
Improved diagnostic accuracy with SPM Maps
Additional value to clinical information
Importance of metrics in the clinical setting!
NEUROIMAGE CLIN: 2014


no
conversion 8 AD
conversion
5 FTD
conversion
2 DBL
conversion
FDG PET

• Recent memory impairment, sustained attention disorder, anxiety and depression;
• Mild long-term memory impairment at NPS evaluation (Rey word list borderline performance) • 4 years of disease duration;
• BADL 6/6; IADL 8/8; MMSE 29/30;
• Normal brain MRI;
♀ 56 years old
aMCI?

aMCI ♀ 62 years old
NO Neurodegenerative
disease

“the high specificity of FDG-PET in AD, FTLD and DLB implies that a negative, or normal scan in the presence of the suspicion of dementia makes a diagnosis of a neurodegenerative disease very unlikely “.
“in the context of initial diagnosis, the exclusionary role of FDG-PET, is especially important in younger subjects with a suspicion of neurodegenerative disease”.
(Jagust et al. 2007)

25 years of research in
neurodegenerative diseases
using FDG PET imaging
FDG PET metabolic patterns
clinical application

BIOLOGICAL PROCESS
[
[11
C]PIB-PET
[18F]NeuroCeq
[18F]AV-45
[18F]GE
Amyloid plaques
Mo
le
cu
la
r Im
ag
in
g
In
divid
ua
l leve
l

The strong direct correlation of in vivo PiB retention with
region-matched quantitative analyses of Ab plaques in the
same subject supports the validity of PiB-PET imaging as a
method for in vivo evaluation of Ab plaque burden

Villemagne and Rowe JAD 2013
AMYLOID PET

[11C]PIB
the more diffuse and clinically tested
amyloid ligand
• Short half life
• Low cost, few production centres
[18F] fluorbetaben
[18F] fluorbetapir
[18F] flutemetamol
in clinical trials sponsored by the industries
• Long half life, commercializzabile
• High cost for public health system

Amy-PET analysis
methods
• Standardized Uptake Value (SUVr)
[Kepe et al. 2004]
• Distribution Volume Ratio (DVR)
[Logan et al. 2006]
• Simplified reference tissue-based
methods [Wong et al. 2006 ]
• Voxel-based analysis (Statistical
Parametric Mapping-SPM)

Why quantification
or semi-quantification in amyloid
PET?
1. Multicentric studies
2. Between group variability
3. Intersubject variability
4. DISEASE variability
5. Therapy monitoring

TERMINATED 2.8%
RECRUITING 34.7% ACTIVE
ENROLLING 18%
UNKNOWN 1.4%
SUSPENDED 1.4%
COMPLETED 37.5%
NOT YET
RECRUITED 4.2%
PET AMYLOID CLINICAL TRIALS
Exclusion of amyloid pathology should allow a more accurate
prognosis to be given and ensure appropriate recruitment into
clinical trials testing the efficacy of new putative antiamyloid
agents at an earlier disease stage.

Villemagne et al. 2008

• Alzheimer’s disease and AD subtypes
• MCI subjects (amnestic type) and converters
• Lewy Body Dementia
• PD, PD dementia
• Amyloid angiopathy
• Traumatic injuries
Variable or high amyloid load
(SUVr >1.1-1.5 up to 2.5……)
Amy-PET positivity in:
Lewy Diseases

Gomperts et al. Mov Dis 2012

Viswanathan,and Greenberg
Ann Neurol 2011

TRAUMATIC BRAIN INJURY
Hong YT et al. JAMA Neurol 2014

Aß amyloid in
Alzheimer Disease
risk of progression
to dementia

DIMI Eu Project 7° FWP
EJNM 2012

11
C-PIB PET imaging
102 AD patients (51 male, 51 females, 69±8
yrs, MMSE 23.9±3)
73 MCI patients (38 males, 35 females,
67±8 yrs, MMSE 27.1±2.0) 4 yrs follow up
52 healthy controls (22 males, 30 females,
67±6, MMSE 29.1±1.1)

65%
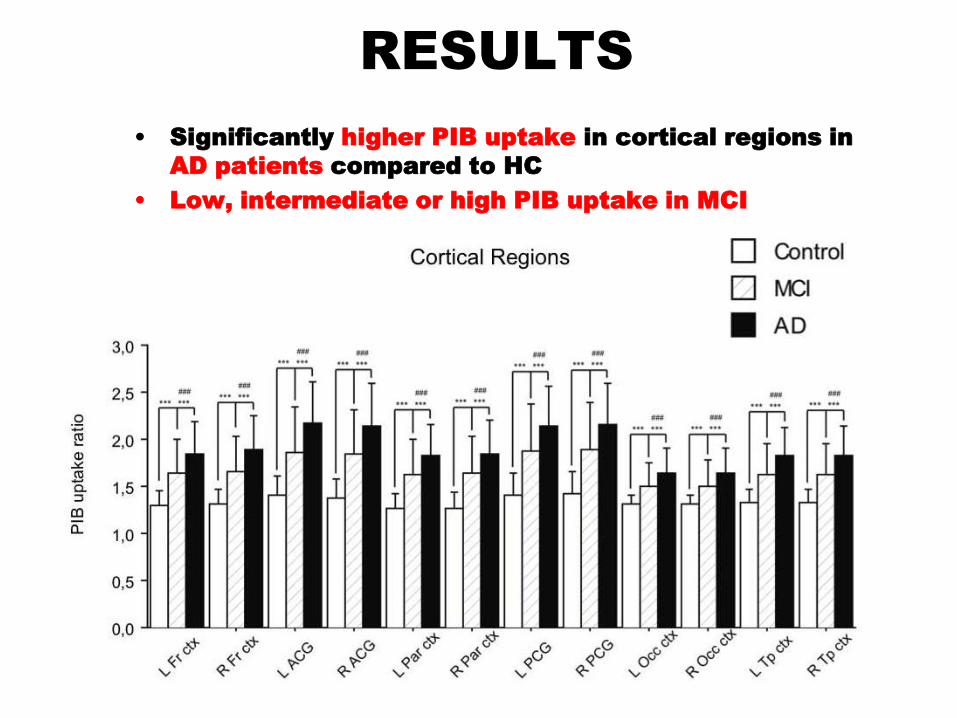
RESULTS
• Significantly higher PIB uptake in cortical regions in
AD patients compared to HC
• Low, intermediate or high PIB uptake in MCI

None of the 21 PIB- MCI
converted to AD
67,4 % of the PIB+ MCI
converted to AD at 28 ±
15 month follow-up
PIB+ MCI patients
progressed to AD at an
estimated rate of 25%
per year


Neurodegenerative diseases are complex disorders
with multiple and overlapping pathophysiological
processes, multitracer imaging may be helpful in
combining metabolic with those labelling typical protein
aggregations seen in the progression of MCI to
Alzheimer’s disease.
Combination of biomarker modalities, such as AMY-
PET, FDG-PET, and structural MR, is likely to provide
the best additional neuroimaging information over that
of single imaging (Jack 2008; Trzepacz 2014)
Moreover, the combined use of 11C-PIB and 18F-FDG
PET provided beneficial information for MCI due to
non-AD (Banzo 2014).

Fig. 1 . Classification abilities of single and
combined Imaging biomarkers in predicting MCI
conversion to AD dementia (F-up > 2yrs to 5)
1. FDG PET SPM Hypometabolism Pattern
was the best single predictor of
conversion to AD dementia
Sens: 1; Spec: 0.954; Acc: 0.974
2. Amyloid PET positivity above the cut-
off thresholds showed high
sensitivity but low specificity
Sens: 1; Spec: 0.65; Acc: 0.80
3. Adding Amyloid PET to FDG PET did
not incresed sensitivity and
specificity
Sens: 1; Spec: 0.954; Acc: 0.974
The role of SPM FDG-PET and Amyloid-PET in predicting MCI conversion to AD dementia
IIaccarino, Chiotis et al., submitted

1. 16/17 Amy+/FDG+ converted to
AD
2. 14/14 Amy-/FDG- did not convert
3. 7/7 Amy+/FDG- did not convert
(incident amyloid positivity)
4. 1/17 Amy+/FDG+ did not convert
Longer follow-up needed
7
14
1
16
The role of SPM FDG-PET and Amyloid-PET in predicting MCI conversion to AD dementia
Iaccarino, Chiotis et al., submitted

DIFFERENT PET MARKERS
= DIFFERENT MOLECULAR
MEASURES

Voxel-Based Comparisons of Amyloid PET, FDG PET Differences between Subjects with AD and Cognitively Normal
Elderly
Jack et al., Neuron, 2013
AMYLOID-PET FDG-PET

Diverging patterns of amyloid deposition and
hypometabolism in clinical AD variants
Lehmann et al. Brain 2013
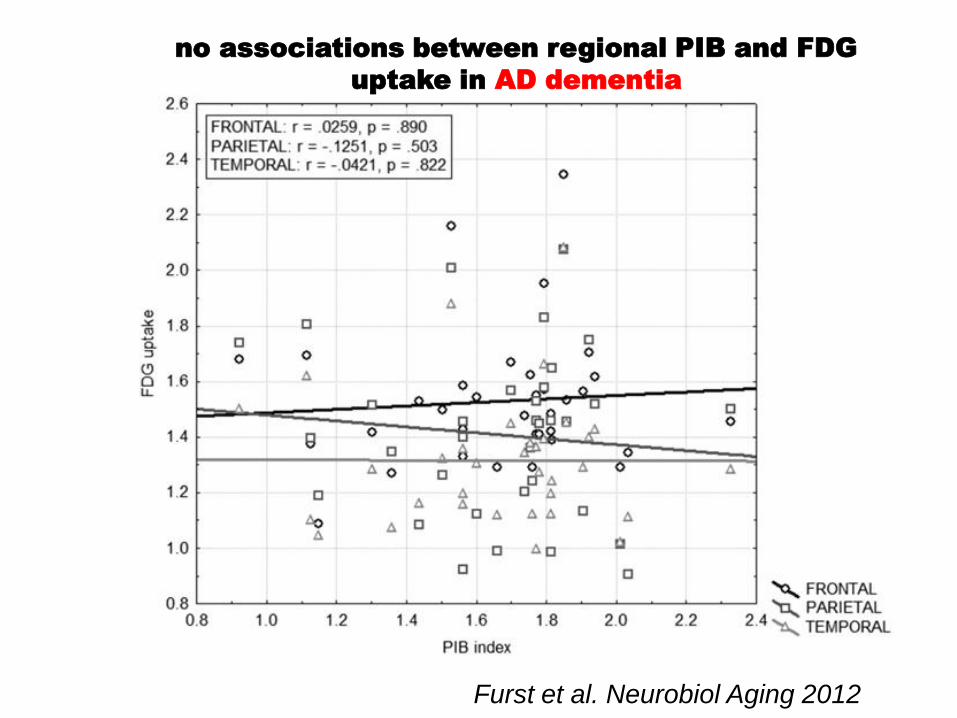
no associations between regional PIB and FDG
uptake in AD dementia
Furst et al. Neurobiol Aging 2012

No FDG- AMY PET
brain regional correlations
in MCI converters
Alongi, Iaccarino et al. submitted

Furst et al. Neurobiol Aging 2012


Spatial convergence between Aβ, DMN,
heteromodal cortex and cortical hubs
PIB-PET
amy load
cortical HUBs
Heteromodal
Cortex
DMN
Aerobic
Glycolysis
Jagust and Mormino Trends Cogn Sci. 2011

AD sbj NC high PIB

Brain Reserve
in diseases

Amyloid deposition is associated with lower
cognitive performance both in AD patients and in the
normal elderly, but the association is modified by
CR, suggesting that CR may be protective against
amyloid related cognitive impairment.

temporal cortex
parietal cortex and precuneus
pAD
Garibotto et al, Neurology 2008

1. synthesis 2. release 3. binding potentials 4.neurotransmission 5. re-uptake
POSITRON EMISSION TOMOGRAPHY

Education/Occupation and BPs
positive correlation
Garibotto et al. NBD 2013
POSITRON EMISSION TOMOGRAPHY


Tau-mediated neuronal injury
and dysfunction
FDG-PET HYPOMETABOLISM IN EARLY AD
Tau pathology
tau PET ligands FDG-PET

[18F]FDDNP signal was associated with
lower cognitive Z scores at each cortical voxel

Ossenkoppele et al. Ann Neurol 2015
FDG/AMYLOID/TAU relationship
PCA AD case
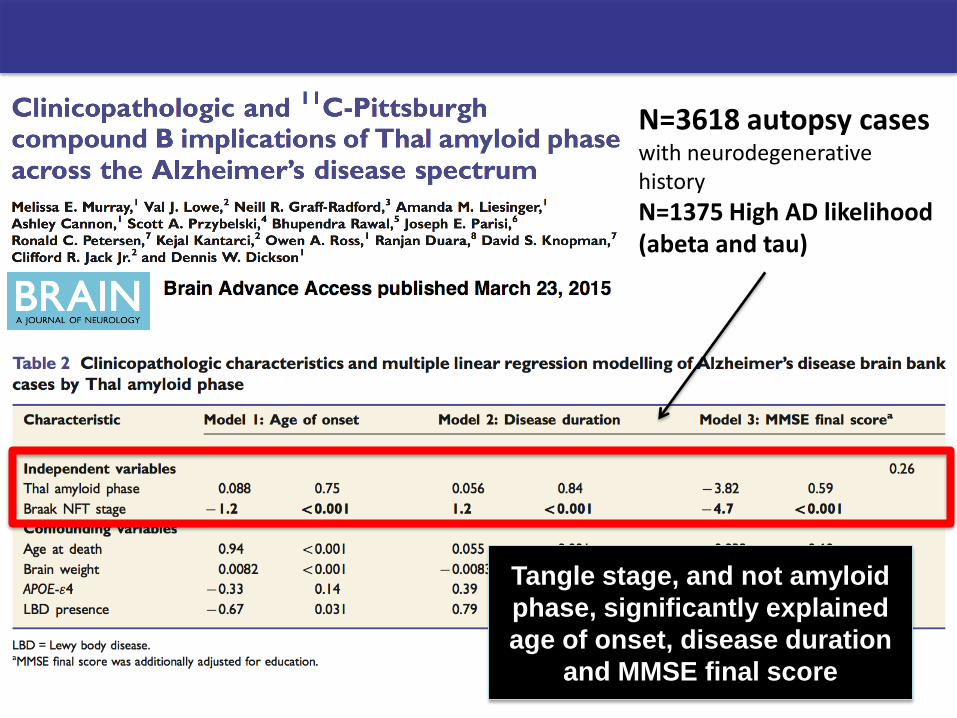
Tangle stage, and not amyloid
phase, significantly explained
age of onset, disease duration
and MMSE final score
N=3618 autopsy cases with neurodegenerative history
N=1375 High AD likelihood (abeta and tau)
Aging and Aß amyloid
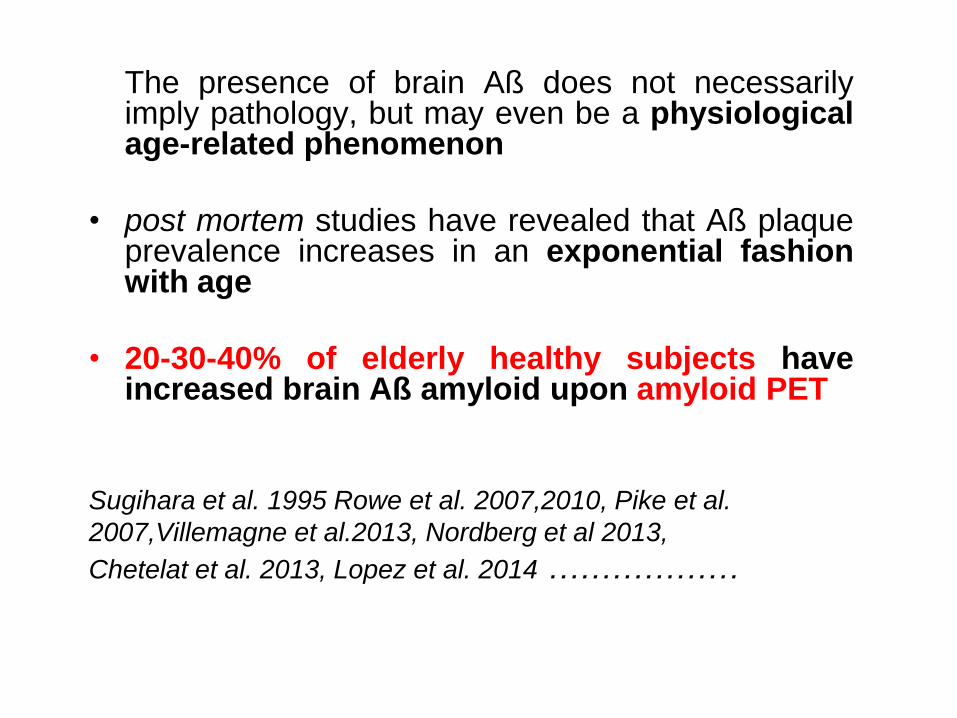
The presence of brain Aß does not necessarily imply pathology, but may even be a physiological age-related phenomenon
• post mortem studies have revealed that Aß plaque prevalence increases in an exponential fashion with age
• 20-30-40% of elderly healthy subjects have increased brain Aß amyloid upon amyloid PET
Sugihara et al. 1995 Rowe et al. 2007,2010, Pike et al.
2007,Villemagne et al.2013, Nordberg et al 2013,
Chetelat et al. 2013, Lopez et al. 2014 ………………

Nordberg et al. 2013

Arch Neurol. 2008;65(11):1509-1517
• amyloid deposition was not associated with worse cognitive function
• elderly person with a significant amyloid burden can remain cognitively normal

• Once amyloid reaches AD levels, deposition reaches a plateau.

Future Directions: Biomarker temporal modeling
The rate of amy deposition per year
is indendependent by amy burden
at baseline in HC, MCI and AD
Different rates of amy deposition
independent by the MMSE
in HC, MCI and AD


Findings suggest that the major growth in
Ab burden occurs during a preclinical stage
of Alzheimer disease (AD), prior to the onset
of AD-related symptoms

Future Directions: When amyloid turns toxic
• Results show that toxic oligormers may form after a critical concentration of amyloid has been reached • The oligomers are formed from monomeric peptide molecules through a secondary nucleation reaction involving also amyloid fibrils

Future Directions: When amyloid turns toxic
•Amyloid plaques are not toxic by themselves in vivo, but facilitate the generation of toxic oligomers after a critical concentration of amyloid by a surface catalysis
•This is in contrast to the theory that Ab oligomers form first and then form fibrils. We can hypothesize from these data and our PET imaging data that a pathologic threshold of amyloid fibril accumulation, sufficient to catalyze formation of toxic oligomeric Ab, is occurring at a PiB SUVR of at least 1.5.
•Left open to question is whether minimal levels of amyloid lower than 1.5 exert any neurotoxic effect seen as hypometabolism or otherwise it requires more longitudinal and serial individual data to resolve

Lowe et al. Neurology, 2014


THANK YOU
FOR YOUR ATTENTION


![Ruolo dell’imaging nella diagnosi differenziale delle ... · PET amiloide: [11C] PiB-PET, Florbetapir F18 Tau scan: 18F-T807 PET, 18F-THK523 PET BF227 α-synuclein/Lewy bodies PET](https://static.fdocumenti.com/doc/165x107/5f5d423cb091ea08670bd90e/ruolo-dellaimaging-nella-diagnosi-differenziale-delle-pet-amiloide-11c.jpg)