Se si escludono istanti prodigiosi e singoli che il destino ci puo’ … · 2015-10-05 · \Se si...
211
Transcript of Se si escludono istanti prodigiosi e singoli che il destino ci puo’ … · 2015-10-05 · \Se si...

“Se si escludono istanti prodigiosi e singoli che il destino ci puo’ donare,
l’amare il proprio lavoro (che purtroppo e’ privilegio di pochi) costituisce la migliore
approssimazione concreta alla felicita’ sulla terra: ma questa e’ una verita’ che non
molti conoscono.”
Primo Levi, La chiave a stella, (1978)

Sommario
L’ ampia diffusione dei cosiddetti dispositivi “smart”, assieme al dinamismo dell’ecosi-
stema delle applicazioni mobili, ha contribuito alla diffusione di malware specifico per
questi terminali, con particolare attenzione al sistema operativo Android.
Le attuali contromisure si limitano all’ implementazione di tecniche basate su sig-
nature, le quali sono in grado di riconoscere il malware noto, ma risultano presentare
seri problemi nell’identificazione di malware del quale non si conosce la signature ed in
generale dei malware di tipo zero-day. Il problema principale delle tecniche di rileva-
mento signature-based e la diffusione su larga scala del malware prima dell’ inclusione
della sua signature nel database degli antimalware.
Diversi metodi sono stati sviluppati nel corso degli ultimi anni dalla comunita di
ricerca per arginare il fenomeno, basati sia su analisi statica, che prevede un’analisi
della applicazioni senza eseguirle, che su analisi dinamica, che prevede l’esecuzione
dell’applicazione al fine di analizzarne il comportamento.
Le maggiori limitazioni dei metodi attualmente proposti dalla comunita di ricerca
presentano una bassa accuratezza, possibilita di evasione con modifiche triviali del
codice e, nel caso si opti per l’analisi dinamica, utilizzo di emulatori e/o kernel mod-
ificati, rendendo la soluzione non utilizzabile su larga scala.
Questo scenario crea una serie di opportunita agli attacker, considerando anche
l’ingente mole di informazioni sensibili che sono contenute in un dispositivo mobile.
Lo scopo del seguente lavoro di tesi e la definizione di una serie di tecniche nuove
ed efficaci per l’identificazione del malware su dispositivi mobili e la caratterizzazione
delle diverse famiglie in cui e suddiviso.
Nella prima parte della dissertazione sono valutate le debolezze degli attuali mec-
canismi di rilevazione del malware, attraverso la sottomissione di un dataset di mal-
ware noti a piu di 50 antimalware sia free che commerciali. Inoltre per valutare la
robustezza degli antimalware rispetto alle tecniche di offuscamento del codice, abbi-
amo applicato una serie di trasformazioni al dataset di malware. La sottomissione
1
dei sample trasformati ha evidenziato che anche con tecniche di offuscamento triviali,
come l’inserimento di junk code, e estremamente facile evadere gli attuali meccanismi
di rilevamento.
Guidati dallo studio delle debolezze degli attuali meccanismi di detection abbi-
amo progettato un nuovo modello di malware per evidenziare la necessita di ulteriori
approfondimenti in questa direzione.
Ogni tecnica proposta e valutata sul medesimo dataset di applicazioni trusted e
malware, permettendo quindi una comparazione fra le tecniche proposte, evidenziando
punti di forza e punti di debolezza, in termini di accuratezza.
I risultati ottenuti sono promettenti e competitivi con i risultati ottenuti dalla
comunita scientifica nella malware analysis.
Parole chiave: (malware, mobile, Android, sicurezza, testing).


4
Abstract
The increasing diffusion of so-called “smart” devices, along with the dynamism of
the mobile applications ecosystem, are boosting the production of malware for the
Android platform.
Countermeasures are limited to signature-based techniques, which are able to rec-
ognize known malware, but present serious problems in identifying malware without
know the signature and in general zero-day malware. The main problem of signature-
based detection techniques is the widespread introduction of malware before its in-
clusion in the database of malware signatures.
This scenario creates a window of opportunity for attackers.
In recent years, research community developed several methods in order to tackle
the problem, based on both static analysis, including an analysis of the application
without running it, and on dynamic analysis, which includes the execution of the
application in order to analyze the behavior .
The main limitations of existing methods include: low accuracy, proneness to eva-
sion techniques, and weak validation, often limited to emulators or modified kernels.
The aim of the this work is to define novel and effective techniques to address to
plague of mobile malware and to characterize the different families of belonging.
First of all, we evaluate the weakness of the current mechanism of malware de-
tection, submitting to more than 50 commercial and free antimalware a dataset of
well-known malicious samples. Furthermore to assess the antimalware robustness
with respect to obfuscation techniques, we applied a series of code transformation to
malware samples. The submission of samples processed has shown that even with
trivial changes it is very easy to evade the detection.
Each technique is evaluated on the same dataset of trusted and malware applica-
tions.
We provide a comparison of the proposed techniques, highlighting strengths and
weaknesses.
5
Guided by the study of the weaknesses of current detection mechanisms, we de-
signed a new model of malware to highlight the need for further study in this direction.
Our results are promising and competitive with the state-of-the-art results ob-
tained from community researchers in malware analysis.
Keywords: (malware, mobile, Android, security, testing).
6


List of publications
List of the publications of the candidate
[1] Gerardo Canfora, Francesco Mercaldo, Corrado Aaron Visaggio, Mauro D’Angelo,
Antonio Furno, Carminantonio Manganelli (2013) “A Case Study of Automating
User Experience-Oriented Performance Testing on Smartphones”, in proceedings
of International Conference on Software Testing, Verification and Validation,
pp. 66-69, IEEE.
[2] Gerardo Canfora, Francesco Mercaldo, Corrado Aaron Visaggio (2013) “Iden-
tification of Anomalies in Processes of Database Alteration”, in proceedings of
International Conference on Software Testing, Verification and Validation, pp.
513-514, IEEE.
[3] Gerardo Canfora, Francesco Mercaldo, Corrado Aaron Visaggio (2013) “A clas-
sifier of Malicious Android Applications”, in proceedings of International Con-
ference on Availability, Reliability and Security, pp. 607-614, IEEE.
[4] Gerardo Canfora, Eric Medvet, Francesco Mercaldo, Corrado Aaron Visaggio
(2014) “Detection of Malicious Web Pages Using System Calls Sequences”, in
proceedings of International Cross Domain Conference and Workshop, in con-
junction with International Conference on Availability, Reliability and Security,
pp. 226-238, Lecture Notes in Computer Science, Springer.
[5] Gerardo Canfora, Francesco Mercaldo, Corrado Aaron Visaggio, Paolo Di Notte
(2014) “Metamorphic Malware Detection Using Code Metrics”, Information
Security Journal: A Global Perspective, 23(3): 57-67.
[6] Gerardo Canfora, Francesco Mercaldo, Corrado Aaron Visaggio (2014) “Ma-
licious JavaScript Detection by Features Extraction”, e-Informatica Software
Engineering Journal, 8(1): 65-78.
9
[7] Gerardo Canfora, Francesco Mercaldo, Corrado Aaron Visaggio (2015) “Mobile
Malware Detection using Op-code Frequency Histograms”, in proceedings of
International Conference on Security and Cryptography, SECRYPT 2015, to
appear.
[8] Gerardo Canfora, Francesco Mercaldo, Giovanni, Moriano, Corrado Aaron Vis-
aggio (2015) “Composition-malware: building Android malware at run time”, in
proceedings of International Conference on Availability, Reliability and Security,
to appear.
[9] Gerardo Canfora, Andrea De Lorenzo, Eric Medvet, Francesco Mercaldo, Cor-
rado Aaron Visaggio (2015) “Effectiveness of Opcode ngrams for Detection of
Multi Family Android Malware”, in proceedings of International Conference on
Availability, Reliability and Security, to appear.
[10] Gerardo Canfora, Eric Medvet, Francesco Mercaldo, Corrado Aaron Visaggio
(2015) “Detecting Android Malware using Sequences of System Calls”, in pro-
ceedings of The Third International Workshop on Software Development Life-
cycle for Mobile, in conjunction with ESEC/FSE, to appear.


12
Contents
Sommario 1
Abstract 5
List of publications 9
1 Introduction 17
1.1 Context . . . . . . . . . . . . . . . . . . . . . . . . . . . . . . . . . . . 18
1.2 Motivation . . . . . . . . . . . . . . . . . . . . . . . . . . . . . . . . . 22
1.3 Research Goals . . . . . . . . . . . . . . . . . . . . . . . . . . . . . . . 25
1.4 Overview of the research . . . . . . . . . . . . . . . . . . . . . . . . . . 25
2 Security of Software Applications for Smartphones 31
2.1 The Mobile Security Landscape . . . . . . . . . . . . . . . . . . . . . . 32
2.2 Malware Classification and Evolution . . . . . . . . . . . . . . . . . . . 37
2.2.1 Malware Diffusion Mechanism . . . . . . . . . . . . . . . . . . . 38
2.2.2 Methods for activating attacks . . . . . . . . . . . . . . . . . . 41
2.2.3 Categories of payloads . . . . . . . . . . . . . . . . . . . . . . . 41
2.3 The Current Approaches of Commercial Antimalware . . . . . . . . . 47
2.4 Limits of the Commercial Antimalware Strategies . . . . . . . . . . . . 49
3 The State of the Art 69
3.1 Static Analysis . . . . . . . . . . . . . . . . . . . . . . . . . . . . . . . 70
3.2 Dynamic Analysis . . . . . . . . . . . . . . . . . . . . . . . . . . . . . 76
3.2.1 Methods using mainly system calls . . . . . . . . . . . . . . . . 76
3.2.2 Methods using only other features . . . . . . . . . . . . . . . . 79
13
CONTENTS
4 The Static approaches 83
4.1 The Available Malware Dataset . . . . . . . . . . . . . . . . . . . . . . 84
4.2 The baseline: permission analysis . . . . . . . . . . . . . . . . . . . . . 86
4.3 Technique #1: A classifier of Malicious Android Applications . . . . . 87
4.3.1 The method . . . . . . . . . . . . . . . . . . . . . . . . . . . . . 87
4.3.2 The proposed features . . . . . . . . . . . . . . . . . . . . . . . 88
4.3.3 Analysis of data . . . . . . . . . . . . . . . . . . . . . . . . . . 90
4.4 Technique #2: Mobile Malware Detection using Op-code Frequency
Histograms . . . . . . . . . . . . . . . . . . . . . . . . . . . . . . . . . 94
4.4.1 The method . . . . . . . . . . . . . . . . . . . . . . . . . . . . . 94
4.4.2 The proposed features . . . . . . . . . . . . . . . . . . . . . . . 96
4.4.3 The evaluation . . . . . . . . . . . . . . . . . . . . . . . . . . . 99
4.5 Technique #3: Effectiveness of Opcode ngrams for Detection of Multi
Family Android Malware . . . . . . . . . . . . . . . . . . . . . . . . . . 109
4.5.1 The method . . . . . . . . . . . . . . . . . . . . . . . . . . . . . 109
4.5.2 The proposed features . . . . . . . . . . . . . . . . . . . . . . . 110
4.5.3 Analysis of data . . . . . . . . . . . . . . . . . . . . . . . . . . 112
4.6 Technique #4: A HMM and Structural Entropy based detector for
Android Malware . . . . . . . . . . . . . . . . . . . . . . . . . . . . . . 115
4.6.1 Background . . . . . . . . . . . . . . . . . . . . . . . . . . . . . 116
4.6.2 Adapting HMM and Structural Entropy malware detection for
Android . . . . . . . . . . . . . . . . . . . . . . . . . . . . . . . 120
4.6.3 Entropy-based detection . . . . . . . . . . . . . . . . . . . . . . 122
4.6.4 Experimental evaluation: Study definition . . . . . . . . . . . . 123
4.6.5 Analysis of Results . . . . . . . . . . . . . . . . . . . . . . . . . 126
5 The Dynamic approaches 139
5.1 Technique #5: Detecting Android Malware using Sequences of System
Calls . . . . . . . . . . . . . . . . . . . . . . . . . . . . . . . . . . . . . 140
5.1.1 The method . . . . . . . . . . . . . . . . . . . . . . . . . . . . . 140
5.1.2 The detection method . . . . . . . . . . . . . . . . . . . . . . . 141
5.1.3 The evaluation . . . . . . . . . . . . . . . . . . . . . . . . . . . 142
5.1.4 Methodology and results . . . . . . . . . . . . . . . . . . . . . . 145
6 Composition-malware: building Android malware at run time 151
6.1 Motivation . . . . . . . . . . . . . . . . . . . . . . . . . . . . . . . . . 152
6.2 The Model . . . . . . . . . . . . . . . . . . . . . . . . . . . . . . . . . 153
14
CONTENTS
6.3 Implementation . . . . . . . . . . . . . . . . . . . . . . . . . . . . . . . 155
6.3.1 The ARS Case Study . . . . . . . . . . . . . . . . . . . . . . . 159
6.3.2 The FindMe Case Study . . . . . . . . . . . . . . . . . . . . . . 160
6.4 Preliminary Evaluation . . . . . . . . . . . . . . . . . . . . . . . . . . 163
6.5 Android AntiMalware: why this model is able to evade current anti-
malware . . . . . . . . . . . . . . . . . . . . . . . . . . . . . . . . . . . 165
6.6 Proposals for improving the security system in Android . . . . . . . . 167
7 Techniques Assessment and Concluding Remarks 169
7.1 Techniques Assessment . . . . . . . . . . . . . . . . . . . . . . . . . . . 169
7.2 Conclusions and Future Works . . . . . . . . . . . . . . . . . . . . . . 180
References 183
List of figures 196
List of tables 205
15

CONTENTS
16
Chapter 1
Introduction
With the wide diffusion of smartphones and their usage in everyday activities, like
internet browsing, mail checking and also bank accounting, malware writers focus
their attention on mobile platform. Android is the most diffuse platform, for this
reason Android malware continues its evolution by adding new propagation vectors,
functionality, and stealth techniques to hide its presence and evade the detection of
antimalware software. Commercial signature-based antimalwares are unable to detect
zero-day malware and new variants before their diffusion on large scale. In practice,
a malware is recognizable only if its signature is present in the antimalware database
vendor. Trivial changes in the code are usually enough, i.e. the variable renaming into
the malware code, in order to evade this mechanism. Google, with the introduction
of Bouncer, tries to mitigate the problem but attackers write malware more and
more aggressive that is able to evade easily this mechanism. Bouncer executes the
application in a sandbox for a fixed-time window: it is clear that if the malware
action happens afterwards this interval time Bouncer can not detect the malicious
event. Starting from these considerations, it urges to study new techniques in order
to mitigate the problem. In this chapter we contextualize our research, describing
the scenario with several recent reports from the most important players in security
threats. This real world scenario is the motivation to our research.
17
Introduction
1.1 Context
During recent years mobile phones have become the main computing and communi-
cation devices. With the facilities to access them and the increasing capabilities of
these devices, they represent the most used way to access to web and to cloud re-
sources, as a necessary step towards a realistic realization of what Mark Weiser [108]
called ubiquitous computing. In his vision, Weiser describes that classical computer
will be replaced by small, intelligent, distributed, and networked devices that will be
integrated into everyday objects and activities. This vision can be already nowadays
observed, as matter of fact we are spectators of a revolution in Software Engineering
world. With the explosion of the Internet of Things (IoT) indeed we will assist to
so-called web 3.0. IoT is an evolution of Internet, in this vision the objects make it
recognizable and acquire intelligence thanks to the fact of being able to communicate
data about themselves and access to aggregate information from other objects: for
instance, alarms sound before in the case of traffic, the sneakers transmit time, speed
and distance to compete in real time with people on the other side of the globe, the
medicine will alert if you forget to take it. All object in this vision can take a proactive
role by connecting to the network.
The goal of the Internet of Things is to ensure that the electronic world draw a
map of the real one, giving an electronic identity to things and places in the phys-
ical environment. Objects and places bearing labels Radio Frequency Identification
(RFID) or QR Codes communicate information in the network or to mobile devices
such as smart phones.
Smartphones is a commonly used term for describing current mobile devices that
combine a mobile phone and the state of the art regarding technical characteristics
as well as software development environmentes that allow creation of third-party
applications: basically they are mobile phone with computing capability, memory and
data connection much more advanced than previous generation of mobile phones. In
addition to this they are based on an operating system for mobile devices.
The current evolution of smartphones can be seen as part of this vision since they
represent a possibility to making use of technical and computational capabilities in
mobile context.
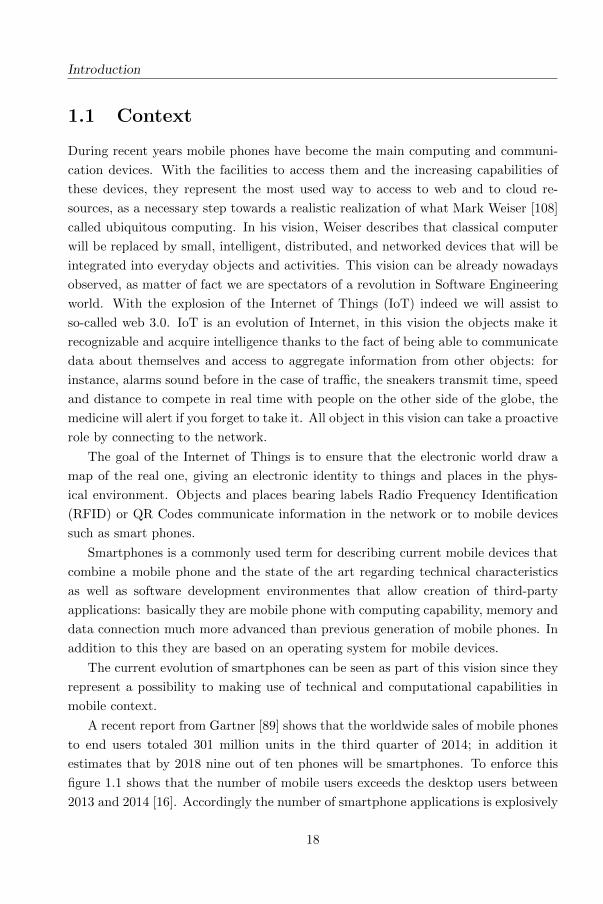
A recent report from Gartner [89] shows that the worldwide sales of mobile phones
to end users totaled 301 million units in the third quarter of 2014; in addition it
estimates that by 2018 nine out of ten phones will be smartphones. To enforce this
figure 1.1 shows that the number of mobile users exceeds the desktop users between
2013 and 2014 [16]. Accordingly the number of smartphone applications is explosively
18
1.1. Context
Figure 1.1: Mobile internet users exceed desktop users.
growing. With the growth of smartphones capabilities, more and more malicious
software, the so-called malware, targeting mobile devices are emerging. In 2004,
the first article about malware for smartphones [79, 107] apparead describing mobile
devices as the next generation of targets.
Unfortunately, such popularity also attracts malware developers, determining a
high production of malware for the Android platform. Not only official marketplaces,
such as Google Play [91], but a number of third-party marketplaces (AppBrain, Ap-
toide, Blackmart Alpha) provide smartphone applications: anedotical evidence tells
us that these markets are very likely to contain malware. In mobile threat landscape,
malware authors continue to concentrate on the Android platform. This should not
be a surprise considering that Android holds 79.3% of the total market share [8] in
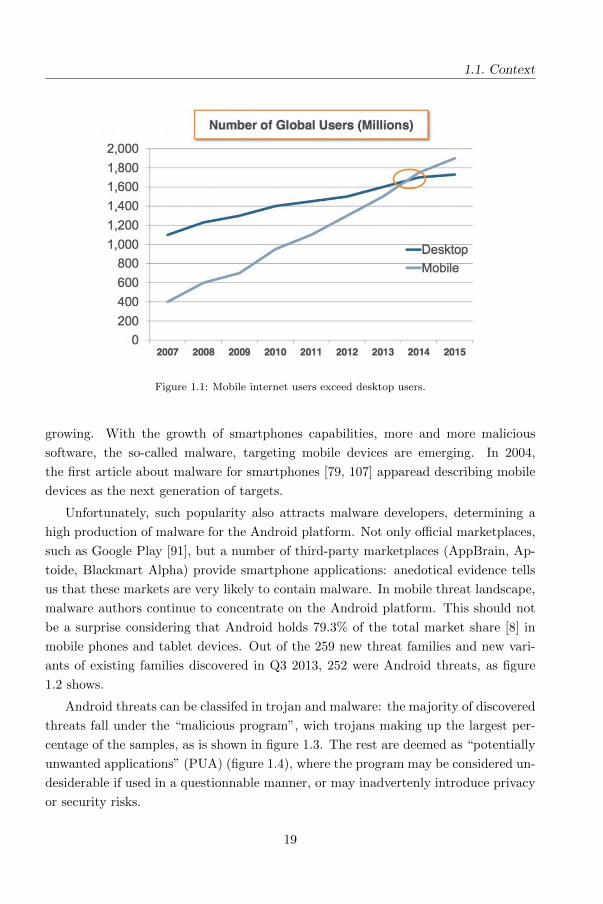
mobile phones and tablet devices. Out of the 259 new threat families and new vari-
ants of existing families discovered in Q3 2013, 252 were Android threats, as figure
1.2 shows.
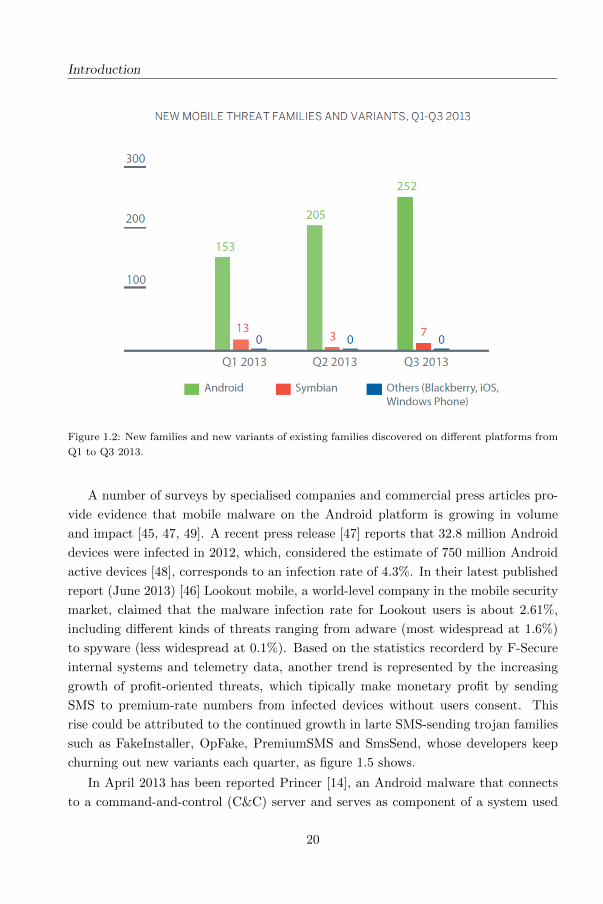
Android threats can be classifed in trojan and malware: the majority of discovered
threats fall under the “malicious program”, wich trojans making up the largest per-
centage of the samples, as is shown in figure 1.3. The rest are deemed as “potentially
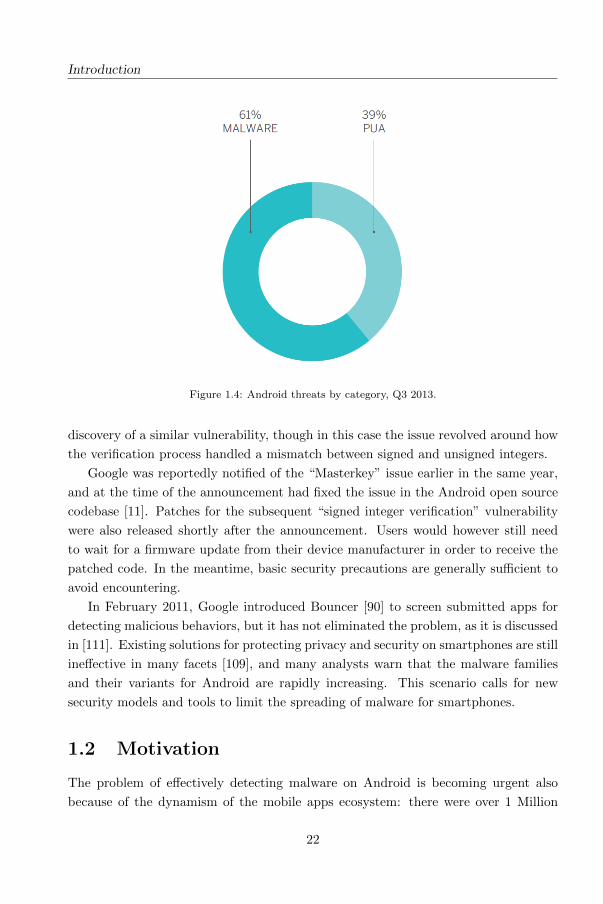
unwanted applications” (PUA) (figure 1.4), where the program may be considered un-
desiderable if used in a questionnable manner, or may inadvertenly introduce privacy
or security risks.
19
Introduction
Figure 1.2: New families and new variants of existing families discovered on different platforms from
Q1 to Q3 2013.
A number of surveys by specialised companies and commercial press articles pro-
vide evidence that mobile malware on the Android platform is growing in volume
and impact [45, 47, 49]. A recent press release [47] reports that 32.8 million Android
devices were infected in 2012, which, considered the estimate of 750 million Android
active devices [48], corresponds to an infection rate of 4.3%. In their latest published
report (June 2013) [46] Lookout mobile, a world-level company in the mobile security
market, claimed that the malware infection rate for Lookout users is about 2.61%,
including different kinds of threats ranging from adware (most widespread at 1.6%)
to spyware (less widespread at 0.1%). Based on the statistics recorderd by F-Secure
internal systems and telemetry data, another trend is represented by the increasing
growth of profit-oriented threats, which tipically make monetary profit by sending
SMS to premium-rate numbers from infected devices without users consent. This
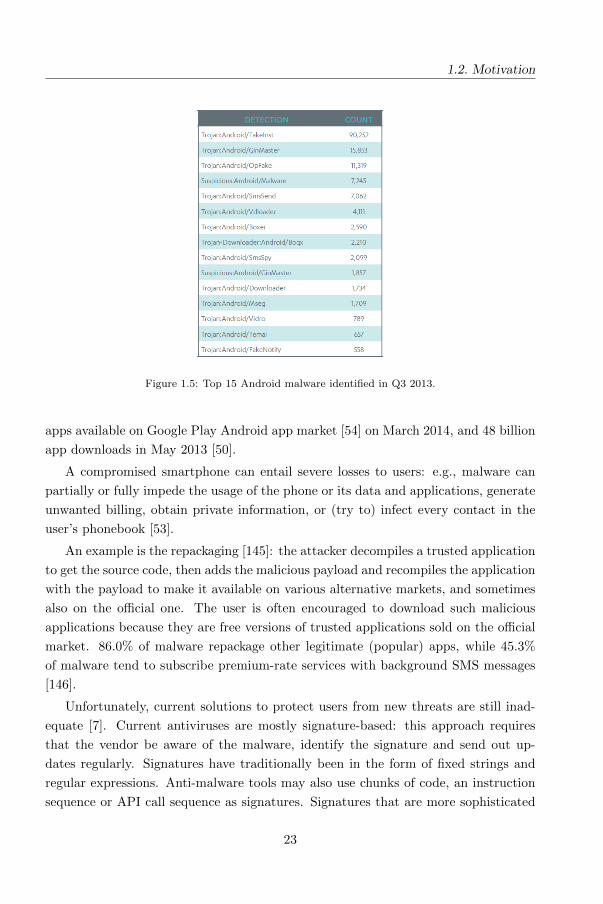
rise could be attributed to the continued growth in larte SMS-sending trojan families
such as FakeInstaller, OpFake, PremiumSMS and SmsSend, whose developers keep
churning out new variants each quarter, as figure 1.5 shows.
In April 2013 has been reported Princer [14], an Android malware that connects
to a command-and-control (C&C) server and serves as component of a system used
20
1.1. Context
Figure 1.3: New mobile threats families and variants discovered in Q3 2013, broken down into types.
to defeat two-factor authentication for online banking transactions. In August of the
same year, security researcher Brian Krebs reportedly tracked down and identified
the author of this trojan as a developer in a Russian app development company, who
had apparently create Princer for an unindentified client as freelance side project [9].
In Q1 2013, F-Secure reported on the Perkele toolkit used to generate Android
trojans for monitoring and forwarding SMS messages containing mobile transaction
autentication numbers (mTANs). In July of the same year, there were reports of a new
toolkit that simplifies the process of inserting malicious code into legitimate Android
apps. The binder, named “Androrat APK binder”, is used to insert an existing
remote access tool (RAT) knows as AndroRAT, into a “carrier” app, trojanizing it
[15]. Once the carrier app in installed on the device, the installed AndroRAT allows
to an attacker to remotely control it and it is able to remote use the phones, in order
to, for instance, make a call, send SMS, activate the camera and microphone and
access to stored files.
In July 2013, security researchers publicly announced the discovery of a vulnerabil-
ity in cryptographic signature verification for Android apps that, if exploited, would
allow an attacker to modify a legitimate app without affecting its cryptographic signa-
ture [13], essentilally keeping the tampering from being detected during verification.
Shortly after the announcement, researchers were able to find samples of such modified
apps being distributed [12, 10]. Few days later, Chinese security researches announced
21
Introduction
Figure 1.4: Android threats by category, Q3 2013.
discovery of a similar vulnerability, though in this case the issue revolved around how
the verification process handled a mismatch between signed and unsigned integers.
Google was reportedly notified of the “Masterkey” issue earlier in the same year,
and at the time of the announcement had fixed the issue in the Android open source
codebase [11]. Patches for the subsequent “signed integer verification” vulnerability
were also released shortly after the announcement. Users would however still need
to wait for a firmware update from their device manufacturer in order to receive the
patched code. In the meantime, basic security precautions are generally sufficient to
avoid encountering.
In February 2011, Google introduced Bouncer [90] to screen submitted apps for
detecting malicious behaviors, but it has not eliminated the problem, as it is discussed
in [111]. Existing solutions for protecting privacy and security on smartphones are still
ineffective in many facets [109], and many analysts warn that the malware families
and their variants for Android are rapidly increasing. This scenario calls for new
security models and tools to limit the spreading of malware for smartphones.
1.2 Motivation
The problem of effectively detecting malware on Android is becoming urgent also
because of the dynamism of the mobile apps ecosystem: there were over 1 Million
22
1.2. Motivation
Figure 1.5: Top 15 Android malware identified in Q3 2013.
apps available on Google Play Android app market [54] on March 2014, and 48 billion
app downloads in May 2013 [50].
A compromised smartphone can entail severe losses to users: e.g., malware can
partially or fully impede the usage of the phone or its data and applications, generate
unwanted billing, obtain private information, or (try to) infect every contact in the
user’s phonebook [53].
An example is the repackaging [145]: the attacker decompiles a trusted application
to get the source code, then adds the malicious payload and recompiles the application
with the payload to make it available on various alternative markets, and sometimes
also on the official one. The user is often encouraged to download such malicious
applications because they are free versions of trusted applications sold on the official
market. 86.0% of malware repackage other legitimate (popular) apps, while 45.3%
of malware tend to subscribe premium-rate services with background SMS messages
[146].
Unfortunately, current solutions to protect users from new threats are still inad-
equate [7]. Current antiviruses are mostly signature-based: this approach requires
that the vendor be aware of the malware, identify the signature and send out up-
dates regularly. Signatures have traditionally been in the form of fixed strings and
regular expressions. Anti-malware tools may also use chunks of code, an instruction
sequence or API call sequence as signatures. Signatures that are more sophisticated
23
Introduction
require a deeper static analysis of the given sample. Analysis may be restricted within
function boundaries (intra-procedural analysis) or may expand to cover multiple func-
tions (inter-procedural analysis). Using signature-based detection, a threat must be
widespread for being successfully recognized.
In addition to this, there exist several techniques to allow the mobile malware to
evade signature detection [123, 121]. In the meantime, simple forms of polymorphic
attacks targeting Android platform have already been seen in the wild [64].
Therefore any antivirus software on Android can never perform the monitoring of
the file system: this allows applications to download updates and run the new code
without any control by the operating system. This behavior will not be detected by
anti-virus software in any way; as a matter of fact, a series of attacks are based on
this principle (this kind of malware is also known as “downloader”).
For these reasons, signature-based malware detection, which is the most common
technique adopted by commercial antimalware for mobile environment, is often inef-
fective. Moreover it is costly, as the process for obtaining and classifying a malware
signature is laborious and time-consuming. The anecdotal evidence of the growth of
malware is abundant and steadily expanding.
For instance, a malware, known as MMarketPay, infected more than 100 000 An-
droid devices in China. This malware appears as a legitimate application, whose
main task is to purchase applications and contents without the consent of the device
owners: as a result, users are billed very high amounts [52].
The incident convinced Google to introduce stronger rules for applications running
on Android, such as naming conventions and constraints on personal information
which can be accessed without user consent.
Similarly, an Android SMS malware firm was fined 50 000 by the UK premium
phone services regulator PhonepayPlus [51]
There are two general approaches followed by research community to implement
malware detectors which base on (a) static analysis or (b) dynamic analysis. Broadly
speaking, the former does not require many resources, in terms of enabling infrastruc-
ture, and is faster to execute than the latter, but is more prone to be evaded with tech-
niques whose effectiveness has been largely demonstrated in literature [117, 131, 138].
The latter is harder to bypass, as it captures the behavior, but it usually needs more
resources and it cannot be run directly on the devices (it is often performed on virtual
or dedicated machines).
Currently, the process of malware evolution mainly consists of modifications to
existing malware. Malware writers use to improve mechanisms of infection, obfus-
24
1.3. Research Goals
cation techniques, or payloads already implemented in previous malware, or tend to
combine them [146].
This indeed explains why malware is classified in terms of families, i.e., malicious
apps which share behaviors, implementation strategies and characteristics [59, 147].
As a consequence, malicious apps belonging to the same family are very likely to
exhibit strong similarities in code and in behavior. For instance, they could share
mechanisms to implement Command and Control engine, obfuscation techniques, the
implementation of reflection for dynamically change the code, the usage of third party
libraries.
Moreover, malicious apps of the same family tend to reproduce the same actions in
the payload: stealing sensitive information, sending high rate premium SMS, botnet
capabilities, cyphering device data for ransom, and so on. Our assumption is that the
behavior similarities among malicious apps could be used to detect new malware.
1.3 Research Goals
The aim of the research is to define a novel and effective methodology to detect
Android malware.
This thesis investigates and evaluates alternative approaches to signature based
which are capable of detecting new malware for smartphones without using signature
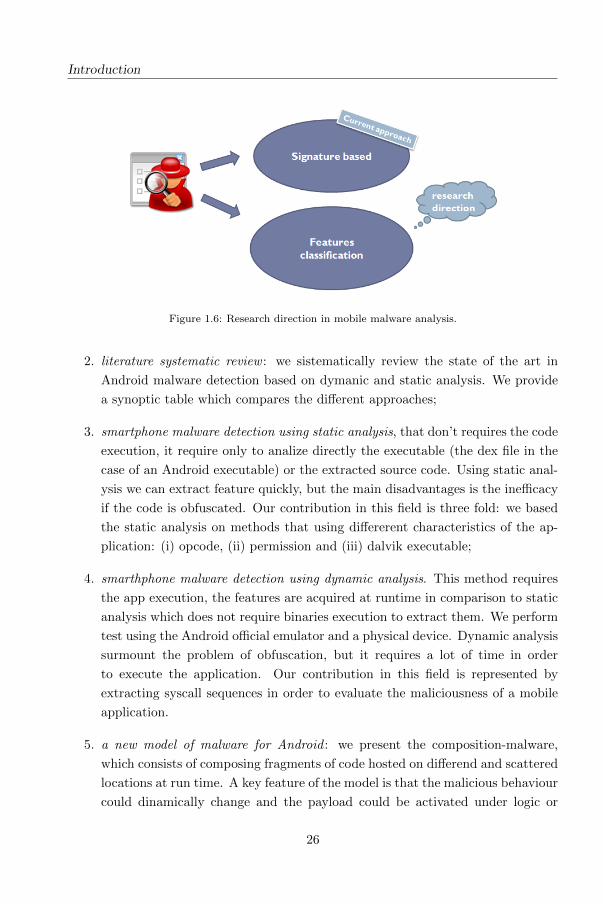
(figure 1.6). Here, we distinguish between approaches that require execution of mal-
ware for analysis (dynamic analysis) and approaches that do not require execution
(static analysis). Both approaches have their advantages and drawbacks which will
be described in the corresponding sections. We use Android platform for our experi-
ment, emulator but also physical device, in order to allow us to generate and analyze
realistic data.
1.4 Overview of the research
The contributions of the thesis can be summarized as follows:
1. signature based antimalware evaluation using a real malware dataset: we eval-
uate more of 50 signature based free and commercial antimalware available on
digital market in order to provide the evidence of the need to think of alternative
solutions;
25
Introduction
Figure 1.6: Research direction in mobile malware analysis.
2. literature systematic review : we sistematically review the state of the art in
Android malware detection based on dymanic and static analysis. We provide
a synoptic table which compares the different approaches;
3. smartphone malware detection using static analysis, that don’t requires the code
execution, it require only to analize directly the executable (the dex file in the
case of an Android executable) or the extracted source code. Using static anal-
ysis we can extract feature quickly, but the main disadvantages is the inefficacy
if the code is obfuscated. Our contribution in this field is three fold: we based
the static analysis on methods that using differerent characteristics of the ap-
plication: (i) opcode, (ii) permission and (iii) dalvik executable;
4. smarthphone malware detection using dynamic analysis. This method requires
the app execution, the features are acquired at runtime in comparison to static
analysis which does not require binaries execution to extract them. We perform
test using the Android official emulator and a physical device. Dynamic analysis
surmount the problem of obfuscation, but it requires a lot of time in order
to execute the application. Our contribution in this field is represented by
extracting syscall sequences in order to evaluate the maliciousness of a mobile
application.
5. a new model of malware for Android : we present the composition-malware,
which consists of composing fragments of code hosted on differend and scattered
locations at run time. A key feature of the model is that the malicious behaviour
could dinamically change and the payload could be activated under logic or
26
1.4. Overview of the research
Figure 1.7: The two-step of the features based classification process: training and prediction.
temporal conditions.
Basically the main research work consists in the extraction of features from dif-
ferent application “levels” (i.e. source code, executable, permission, application) in
order to build classifiers to evaluate the effectiveness of features we choose.
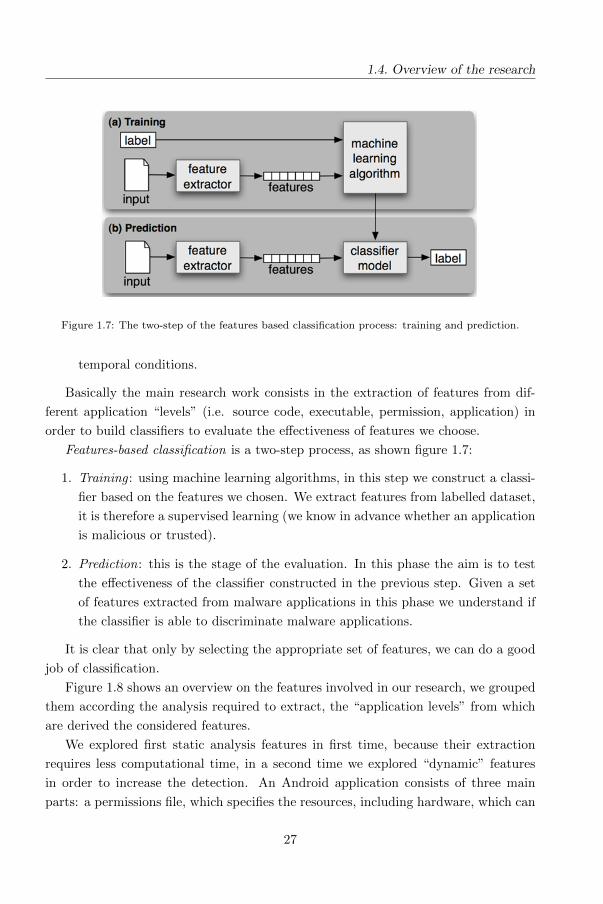
Features-based classification is a two-step process, as shown figure 1.7:
1. Training : using machine learning algorithms, in this step we construct a classi-
fier based on the features we chosen. We extract features from labelled dataset,
it is therefore a supervised learning (we know in advance whether an application
is malicious or trusted).
2. Prediction: this is the stage of the evaluation. In this phase the aim is to test
the effectiveness of the classifier constructed in the previous step. Given a set
of features extracted from malware applications in this phase we understand if
the classifier is able to discriminate malware applications.
It is clear that only by selecting the appropriate set of features, we can do a good
job of classification.
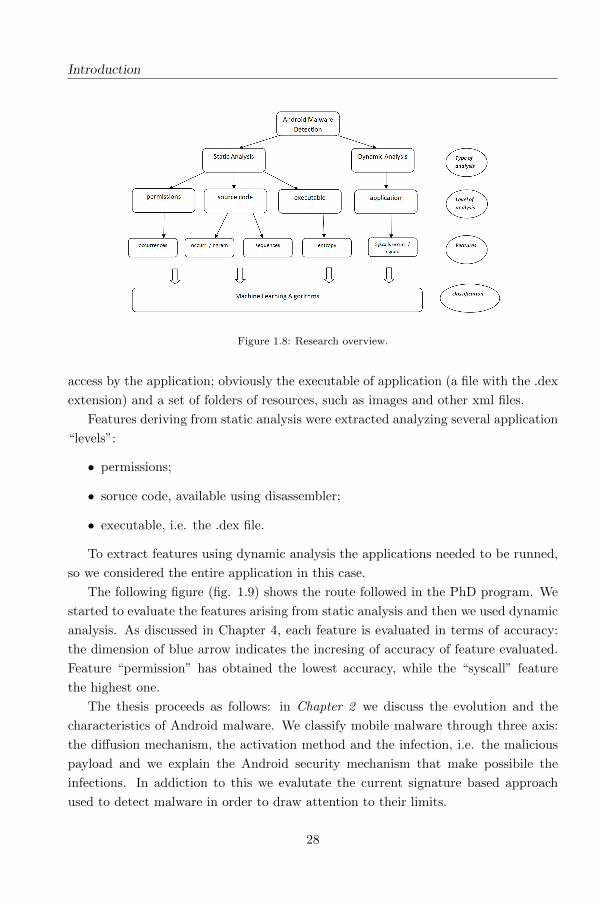
Figure 1.8 shows an overview on the features involved in our research, we grouped
them according the analysis required to extract, the “application levels” from which
are derived the considered features.
We explored first static analysis features in first time, because their extraction
requires less computational time, in a second time we explored “dynamic” features
in order to increase the detection. An Android application consists of three main
parts: a permissions file, which specifies the resources, including hardware, which can
27
Introduction
Figure 1.8: Research overview.
access by the application; obviously the executable of application (a file with the .dex
extension) and a set of folders of resources, such as images and other xml files.
Features deriving from static analysis were extracted analyzing several application
“levels”:
• permissions;
• soruce code, available using disassembler;
• executable, i.e. the .dex file.
To extract features using dynamic analysis the applications needed to be runned,
so we considered the entire application in this case.
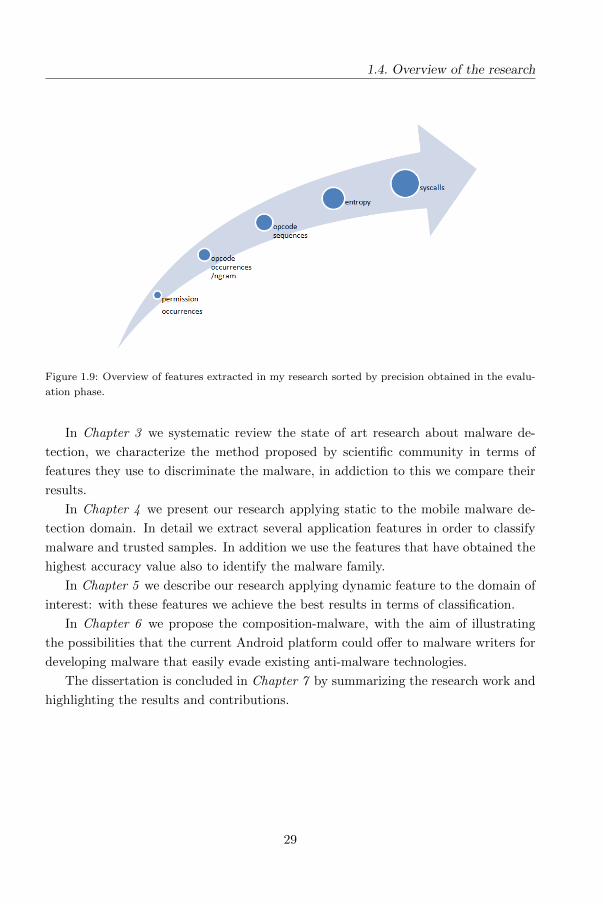
The following figure (fig. 1.9) shows the route followed in the PhD program. We
started to evaluate the features arising from static analysis and then we used dynamic
analysis. As discussed in Chapter 4, each feature is evaluated in terms of accuracy:
the dimension of blue arrow indicates the incresing of accuracy of feature evaluated.
Feature “permission” has obtained the lowest accuracy, while the “syscall” feature
the highest one.
The thesis proceeds as follows: in Chapter 2 we discuss the evolution and the
characteristics of Android malware. We classify mobile malware through three axis:
the diffusion mechanism, the activation method and the infection, i.e. the malicious
payload and we explain the Android security mechanism that make possibile the
infections. In addiction to this we evalutate the current signature based approach
used to detect malware in order to draw attention to their limits.
28
1.4. Overview of the research
Figure 1.9: Overview of features extracted in my research sorted by precision obtained in the evalu-
ation phase.
In Chapter 3 we systematic review the state of art research about malware de-
tection, we characterize the method proposed by scientific community in terms of
features they use to discriminate the malware, in addiction to this we compare their
results.
In Chapter 4 we present our research applying static to the mobile malware de-
tection domain. In detail we extract several application features in order to classify
malware and trusted samples. In addition we use the features that have obtained the
highest accuracy value also to identify the malware family.
In Chapter 5 we describe our research applying dynamic feature to the domain of
interest: with these features we achieve the best results in terms of classification.
In Chapter 6 we propose the composition-malware, with the aim of illustrating
the possibilities that the current Android platform could offer to malware writers for
developing malware that easily evade existing anti-malware technologies.
The dissertation is concluded in Chapter 7 by summarizing the research work and
highlighting the results and contributions.
29

Chapter 2
Security of Software
Applications for Smartphones
Smartphones are becoming more and more popular. This trend represents an appeal-
ing scenario for malware writers that develop continuously new threats and propagate
them through official and third-party markets. In addition to the propagation vec-
tors, malware is also evolving quickly. From SMS Trojans to legitimate applications
repacked with malicious payload, from AES encrypted root exploits to the ability to
dynamically load a payload retrieved from a remote server, malicious code is con-
stantly changing to maximize the probability to evade detection. Malware writers
have also been developing detection evasion techniques which are rapidly making
anti-malware technologies uneffective. In particular, zero-days malware is able to eas-
ily pass signature based detection, while dynamic analysis based techniques, which
could be more accurate and robust, are too costly or inappropriate to real contexts,
especially for reasons related to usability.
31
Security of Software Applications for Smartphones
2.1 The Mobile Security Landscape
Recent years have closely watched an explosive growth in smartphone sales. Ac-
cording to CNN [6], smartphone shipments have tripled from 2008 to 2012, from 40
million of sold units to about 120 million. The year 2011 was a milestone for smart-
phone vendors, as in the first time in history that smartphones have outsold personal
computers.
Unfortunately, the increasing adoption of smartphones combined to bring about
the growing prevalence of mobile malware. As the most popular mobile platform,
Google’s Android overtook others (e.g., iOS, Windows Mobile) to become the top
mobile malware platform.
Mobile security has become increasingly important in mobile computing. It is
referred of a particular sub area related to the security of personal and business
information stored on mobile devices, such a smartphone or a tablet. In last years,
with the introduction of IoT, the concept of mobile security has been extendend to
the so-called wearable devices, such glasses (e.g., Google Glasses) or watches (e.g.,
SmartWatches or Apple Watches).
More and more users and businesses employ smartphones as communication tools,
but also as a means of planning and organizing their work and private life. Within
companies, the introduction of these technologies caused profound changes in the
organization of information systems and therefore they have become the source of
new risks. Indeed, smartphones collect and compile an increasing amount of sensitive
information to which access must be controlled to protect the privacy of the user and
of the intellectual property of the company. According to ABI Research, the Mobile
Security Services market was amounted to around $1.88 billion in 2013 [38].
All smartphones, as computers, are preferred targets of attacks. These attacks
exploit weaknesses related to smartphones that can take advantage from means of
communication like Short Message Service (SMS, aka text messaging), Multimedia
Messaging Service (MMS), Wi-Fi networks, Bluetooth and GSM, the de facto global
standard for mobile communications. There are also attacks that exploit software
vulnerabilities from both the web browser and operating system. Finally, there are
forms of malicious software that rely on the weak knowledge of average users.
Moreover, smartphones today are constantly connected to the network, both wi-fi
and mobile, so they can always send data continuously without any control from the
user. Many people use their smartphones to perform banking transactions, storing in
the device their banking credentials. These information if not deleted will be available
to any software able to retrieve them. But that’s not all: in fact, with the adoption of
32
2.1. The Mobile Security Landscape
BYOD (bring your own device) many companies invite their employees to use their
personal devices in the workplace, and especially using them to have privileged access
to corporate information and their applications. This trend is making significant
inroads into the corporate world, with about 75% of employees in developing countries
companies, such as Brazil and Russia and 45% in developed companies that already
use their technology to work [1]. This means that mobile devices are designed to
be the central point in which will travel more and more sensitive information: each
mobile device becomes a point of access to the corporate network, and therefore a
potential attack vector. It has become a target for the information it own, but also a
way to attack the network of the company.
Different security counter-measures are being developed and applied to smart-
phones, from security in different layers of software to the dissemination of informa-
tion to end users. There are good practices to be observed at all levels, from design to
use, through the development of operating systems, software layers, and downloadable
apps.
For example, here are listed the main features to try to ensure the safety of mobile
devices with the Android operating system on board:
• a core set of mechanisms that handle application isolation and security;
• each application will run in its own isolated space with unique user and group
identifier;
• applications are not allowed to exchange data unless they explicitily request
permissions from the user;
• access to specific API is controlled using permissions;
• custom permissions can be created in order to protect applications;
• it provides cryptographic API with the intent of securing data such as passwords
and personal information. Stream ciphers are supported as well as asymmetric,
symmetric and block ciphers.
But, anyway a smartphone user is still exposed to various threats when he uses
his device. In just the last two quarters of 2012, the number of unique mobile threats
grew by 261%, according to ABI Research [38]. These threats can disrupt the oper-
ation of the smartphone, and transmit or modify user data. For these reasons, the
applications deployed there must guarantee privacy and integrity of the information
33
Security of Software Applications for Smartphones
they handle. In addition, since some apps could themselves be malware, their func-
tionality and activities should be limited (e.g., restricting the apps from accessing
location information via GPS, blocking access to the user’s address book, preventing
the transmission of data on the network, sending SMS messages that are billed to the
user, etc.).
There are three prime targets for attackers [68]:
• Data: smartphones are devices for data management, therefore they may con-
tain sensitive data like credit card numbers, authentication information, private
information, activity logs (calendar, call logs);
• Identity : smartphones are highly customizable, so the device or its contents are
associated with a specific person. For example, every mobile device can transmit
information related to the owner of the mobile phone contract, and an attacker
may want to steal the identity of the owner of a smartphone to commit other
offenses;
• Availability : by attacking a smartphone one can limit access to it and deprive
the owner of the service.
The attack is perpetuated through a software defined in literature as “malware”,
the contraction of two words: “malicious” and “software”. A malware is a specified
software intentend to intercept or take partial control of a computer ‘s (in general a
device, mobile also) operation without the informed content of user, in addiction it
subverts the operation of the infected machine for a benifit of a third party.
We distinguish several categories of malware, although often these programs are
composed of several parts interdependent and therefore belong to more than one class.
Furthermore, given the rapid developments in this field, the classification presented
below is not to be considered exhaustive:
• Virus: a piece of code that inserts itself into a host program in order to infects
it. A virus cannot run independently, it requires that its host program be run
to activate it.
• Worm: a program that can run independently and it can propogate a complete
working version of itself into other hosts on a network.
• Logic bomb: a program inserted into software by an intruder. It executes on
specific condition (i.e. trigger). Triggers for logic bombs can include change in
a file, by a particular series of keystrokes, or at a specific time or date.
34
2.1. The Mobile Security Landscape
• Trojan horse: programs that appear to have one (useful) function but actually
perform another (malicious) function, without the user’s knowledge.
• Backdoor : any mechanism that bypasses a normal security check. It is a code
that recognizes for example some special input sequence; programmers can use
backdoors legitimately to debug and test programs.
• Exploit : malicious code specific to a single vulnerability.
• Keylogger : captures key strokes on a compromised system.
• Rootkit : a set of hacker tools installed on a computer system after the attacked
has broken into the system and gained administrator (i.e. root-level) access.
• Zombie, bot : program on infected machine activated to launch attacks on other
machines.
• Spyware: collect info from a computer and transmits it to another system.
• Stealth virus: a form of virus explicitily designed to hide from detection by
antivirus software.
• Polymorphic virus: a virus that mutates with every infection making detection
by the “signature” of the virus difficult.
• Metamorphic virus: this category can be defined as the evolved form of poly-
morphic viruses. The main difference is that while in polymorphic viruses the
mutation engine changes the decryption routine at each infection, in metamor-
phic samples the mutation is made on the entire body of the virus, generating a
completely different version that keeping perfectly the same features of original
one.
Malware categories can be divided into two groups:
1. program fragments that need host program, i.e. parasitic malware (e.g. viruses,
logic bombs, and backdoors: they cannot exist independently of some actual
application program, utility or system program);
2. independent self-contained programs (e.g. worms, bots: they can be run directly
by the operating system)
35
Security of Software Applications for Smartphones
Malware can simultaneously belong to multiple categories, in particular mobile
malware in the wild belong to the category of trojan horses with capabilities of spyware
but we have also examples of zombie and polymoprhic virus. In any case, they all
belong to the category of program fragments that need a host program.
The source of these attacks are the same actors found in the non-mobile computing
space [68]:
• Professionals, whether commercial or military, who focus on the three targets
mentioned above. They steal sensitive data from the general public, as well as
undertake industrial espionage. They will also use the identity of those attacked
to achieve other attacks;
• Thieves who want to gain income through data or identities they have stolen.
The thieves will attack many people to increase their potential income;
• Black hat hackers who specifically attack availability [39]. Their goal is to
develop viruses, and cause damage to the device. In some cases, hackers have
an interest in stealing data on devices.
• Grey hat hackers who reveal vulnerabilities [44]. Their goal is to expose vul-
nerabilities of the device [40]. Grey hat hackers do not intend on damaging the
device or stealing data [67].
When a smartphone is infected by an attacker, the attacker can attempt several
things:
• the attacker can manipulate the smartphone as a zombie machine, that is to say,
a machine with which the attacker can communicate and send commands which
will be used to send unsolicited messages (spam) via sms or email [77]. The
server that manipulates the device is also called C&C (command and control)
server: a C&C server is able to send commands to wake up the device and get
back a series of sensitive informations;
• the attacker can easily force the smartphone to make silent phone calls or to
send silent SMS. For example, he can use the API (library that contains the
basic functions not present by default in the smartphone) PhoneMakeCall by
Microsoft, which collects telephone numbers from any source such as yellow
pages, and then call them [77]. But the attacker can also use this method to
call paid services or send SMS to premium-rate numbers, resulting in a charge to
36
2.2. Malware Classification and Evolution
the owner of the smartphone. It is also very dangerous because the smartphone
could call emergency services and thus disrupt those services [77];
• a compromised smartphone can record conversations between the user and oth-
ers and send them to a third party [77]. Most smartphones also have a camera,
so they could even record video and send it over the network connection always
on. This results user privacy and industrial security problems;
• an attacker can also steal a user’s identity, usurp their identity (with a copy of
the user’s sim card or even the smartphone itself), and thus impersonate the
owner. This raises security concerns in countries where smartphones can be
used to place orders, view bank accounts or are used as an identity card [77];
• the attacker can reduce the utility of the smartphone, by discharging the battery
[80]. For example, they can launch an application that will run continuously on
the smartphone processor, requiring a lot of energy and draining the battery.
One factor that distinguishes mobile computing from traditional desktop PCs is
their limited performance. Frank Stajano and Ross Anderson first described this
form of attack, calling it an attack of “battery exhaustion” or “sleep deprivation
torture” [82]. Usually this type of damage can be easily detected, because the
users notice evident slowdowns in daily use of their device;
• the attacker can prevent the operation and/or starting of the smartphone by
making it unusable [135]. This attack can either delete the boot scripts, resulting
in a phone without a functioning OS, or modify certain files to make it unusable
(e.g., a script that launches at startup that forces the smartphone to restart) or
even embed a startup application that would empty the battery [82];
• the attacker can remove the personal (photos, music, videos, etc.) or professional
data (contacts, calendars, notes) of the user [135].
2.2 Malware Classification and Evolution
In this section, we characterize Android malware, which can be roughly classified
along three axes: the malware diffusion mechanism, the activation method, and the
malicious payload.
37
Security of Software Applications for Smartphones
2.2.1 Malware Diffusion Mechanism
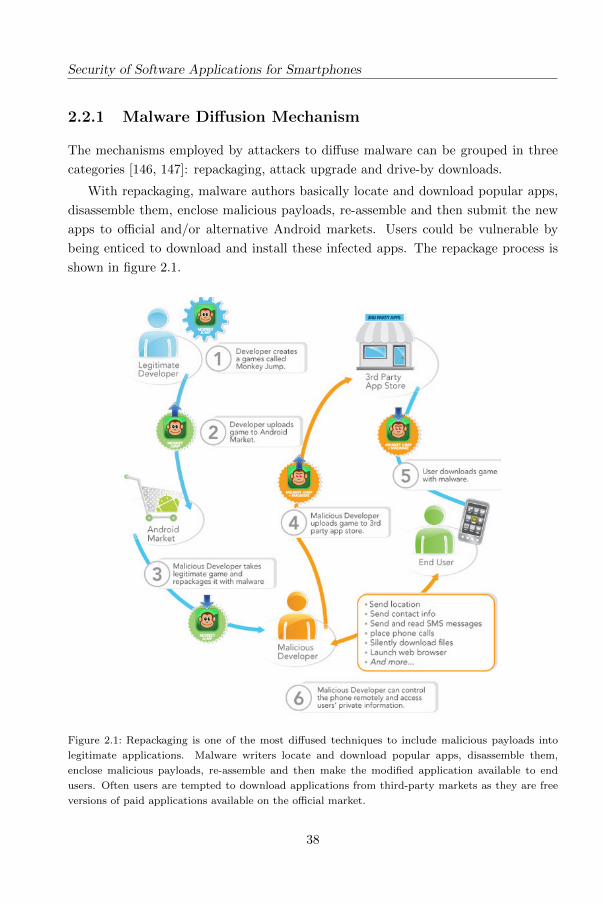
The mechanisms employed by attackers to diffuse malware can be grouped in three
categories [146, 147]: repackaging, attack upgrade and drive-by downloads.
With repackaging, malware authors basically locate and download popular apps,
disassemble them, enclose malicious payloads, re-assemble and then submit the new
apps to official and/or alternative Android markets. Users could be vulnerable by
being enticed to download and install these infected apps. The repackage process is
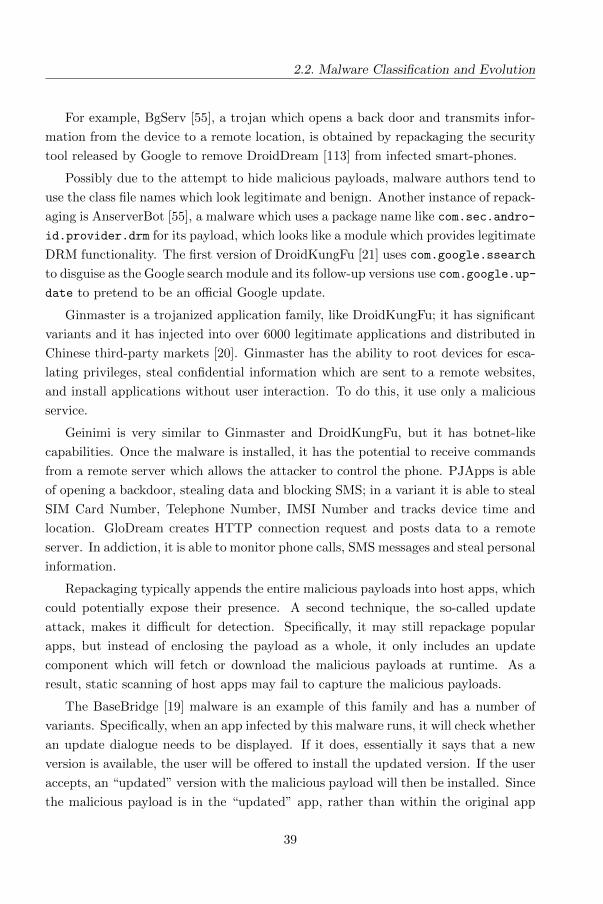
shown in figure 2.1.
Figure 2.1: Repackaging is one of the most diffused techniques to include malicious payloads into
legitimate applications. Malware writers locate and download popular apps, disassemble them,
enclose malicious payloads, re-assemble and then make the modified application available to end
users. Often users are tempted to download applications from third-party markets as they are free
versions of paid applications available on the official market.
38
2.2. Malware Classification and Evolution
For example, BgServ [55], a trojan which opens a back door and transmits infor-
mation from the device to a remote location, is obtained by repackaging the security
tool released by Google to remove DroidDream [113] from infected smart-phones.
Possibly due to the attempt to hide malicious payloads, malware authors tend to
use the class file names which look legitimate and benign. Another instance of repack-
aging is AnserverBot [55], a malware which uses a package name like com.sec.andro-
id.provider.drm for its payload, which looks like a module which provides legitimate
DRM functionality. The first version of DroidKungFu [21] uses com.google.ssearch
to disguise as the Google search module and its follow-up versions use com.google.up-
date to pretend to be an official Google update.
Ginmaster is a trojanized application family, like DroidKungFu; it has significant
variants and it has injected into over 6000 legitimate applications and distributed in
Chinese third-party markets [20]. Ginmaster has the ability to root devices for esca-
lating privileges, steal confidential information which are sent to a remote websites,
and install applications without user interaction. To do this, it use only a malicious
service.
Geinimi is very similar to Ginmaster and DroidKungFu, but it has botnet-like
capabilities. Once the malware is installed, it has the potential to receive commands
from a remote server which allows the attacker to control the phone. PJApps is able
of opening a backdoor, stealing data and blocking SMS; in a variant it is able to steal
SIM Card Number, Telephone Number, IMSI Number and tracks device time and
location. GloDream creates HTTP connection request and posts data to a remote
server. In addiction, it is able to monitor phone calls, SMS messages and steal personal
information.
Repackaging typically appends the entire malicious payloads into host apps, which
could potentially expose their presence. A second technique, the so-called update
attack, makes it difficult for detection. Specifically, it may still repackage popular
apps, but instead of enclosing the payload as a whole, it only includes an update
component which will fetch or download the malicious payloads at runtime. As a
result, static scanning of host apps may fail to capture the malicious payloads.
The BaseBridge [19] malware is an example of this family and has a number of
variants. Specifically, when an app infected by this malware runs, it will check whether
an update dialogue needs to be displayed. If it does, essentially it says that a new
version is available, the user will be offered to install the updated version. If the user
accepts, an “updated” version with the malicious payload will then be installed. Since
the malicious payload is in the “updated” app, rather than within the original app
39
Security of Software Applications for Smartphones
itself, it is more stealthy than the first technique which directly includes the entire
malicious payload in the first place.
The previous update attacks require user approval to download and install new
versions. Other malware, such as AnserverBot [18] and Plankton [25], advance the
update attack by stealthily upgrading certain components in the host apps rather
than the entire app. As a result, it does not require user approval. In particular,
Plankton directly fetches and runs a .jar file maintained in a remote server while
AnserverBot retrieves a public (encrypted) blog entry, which contains the actual pay-
loads for update. In detail, Plankton combines reflection and dynamic loading: when
the application executes the onCreate() method, a Plankton malware runs a back-
ground service which has no effect on user experience but downloads a .jar file from
a remote server with a .dex file with classes to load dynamically. Plankton uses
reflection to access these classes and permanently extends the host application with
new malicious behavior.
The third technique applies the traditional drive-by download attacks to mobile.
Though they are not directly exploiting mobile browser vulnerabilities, they are es-
sentially enticing users to download “interesting” or “feature-rich” apps. There are
four such malware families of this kind: GGTracker [23], Jifake [24], Spitmo [22] and
ZitMo [30]. The last two are designed to steal user’s sensitive banking information.
Similarly, the Jifake malware is downloaded when users are redirected to a malicious
website. However, it does not use in-app advertisements to attract and redirect users:
instead, it uses a malicious QR code, which redirects the user to another URL contain-
ing the Jifake malware, when scanned. This malware itself is the repackaged mobile
ICQ client, which sends several SMS messages to a premium-rate number. While
QR code-based malware propagation has been warned earlier [27], this was the first
time that this attack actually occurred in the wild. The last two Spitmo and ZitMo
are ported versions of nefarious PC malware, i.e., SpyEye and Zeus. They work in
a similar manner: when a user is doing online banking with a comprised PC, the
user will be redirected to download a particular smartphone app, which is claimed to
better protect online banking activities. However, the downloaded app is actually a
malware, which can collect and send credential for online banking or SMS messages
to a remote server.
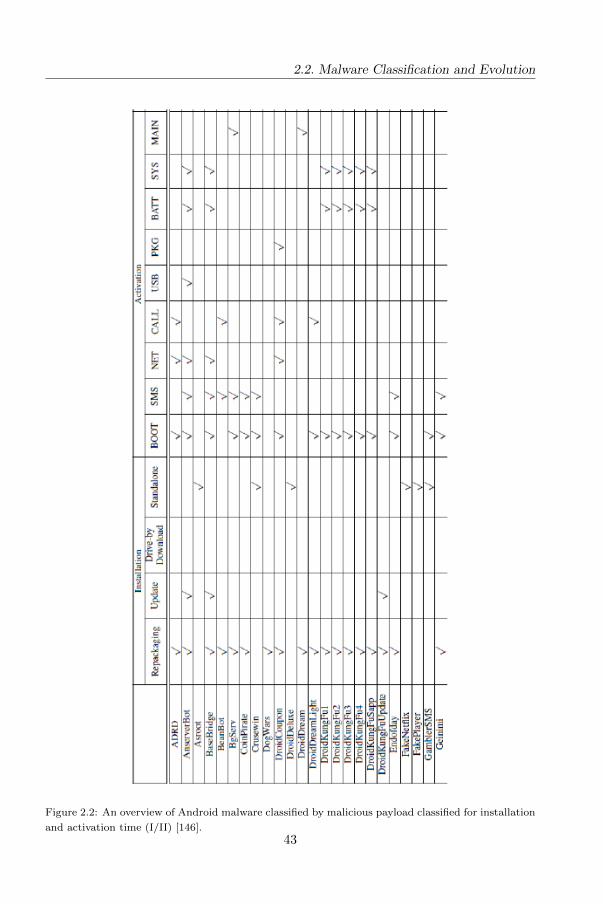
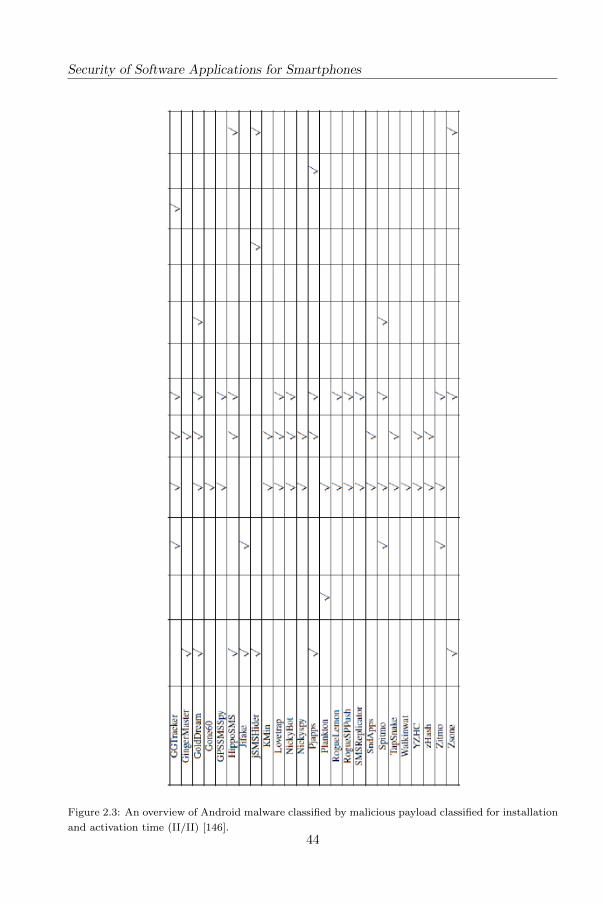
In figures 2.3 and 2.3 on overview of top 50 Android malware families grouped by
installation (repackaging, update, drive-by download and standalone) and activation
time (boot, SMS, network, call, USB, package installation, battery, system and main
activity events) [146].
40
2.2. Malware Classification and Evolution
2.2.2 Methods for activating attacks
There are several ways an Android malware may employ to activate, each one asso-
ciated with a system event. Since in the Android platform an application is allowed
to receive system event dispatches only upon corresponding permissions, methods for
activation can be described in terms of permissions.
The BOOT COMPLETED event is the most used within existing Android malware.
This is not surprising, as this event will be triggered when the system finishes its
booting process, a perfect timing for malware to kick off its background services. By
listening to this event, the malware can start itself without user’s intervention.
The SMS RECEIVED event is another interesting one from malware authors’ point of
view. This event will be broadcasted to the whole system when a new SMS message
is being received. By listening to this event, the malware can be keen in intercepting
or responding to particular incoming SMS messages. As an example, Zsone [29]
listens to this SMS RECEIVED event and intercepts or removes all SMS messages from
particular originating numbers such as “10086” and “10010”. The RogueSPPush [28]
listens to this event to automatically hide and reply to incoming premium-rate service
subscription SMS messages. In fact, the malware can even discard this SMS RECEIVED
event and stop it from further spreading in the system by calling abortBroadcast()
function. As a result, other apps (including system SMS messaging app) do not even
know the arrival of this new SMS message.
2.2.3 Categories of payloads
The actual malicious actions carried out by malware, i.e., the payload, may be grouped
into four different categories: privilege escalation, remote control, financial charges,
and personal information stealing.
A malware application which involves privilege escalation is RATC, which exploits
a bug in the Zygote daemon (Zygote is the deamon responsible to launch applications
in Android).
In the payload with remote control, the HTTP-based web traffic is leveraged
to communicate with remote servers and to receive commands. Malware families
attempt to be stealthy by encrypting the URLs of remote servers as well as their
communication with servers. For example, Pjapps develops its own encoding scheme
to encrypt the server addresses, while DroidKungFu3 employs the standard AES
encryption scheme. Geinimi similarly applies DES encryption scheme to encrypt its
communication to the remote server. Most servers are registered in domains controlled
41
Security of Software Applications for Smartphones
by attackers themselves, but some servers are also hosted in public clouds.
One profitable way for attackers is to surreptitiously subscribe to premium-rate
services, such as by sending SMS messages using a financial charge payload. On
Android, there is a permission-guarded function sendTextMessage() which allows for
sending an SMS message in the background without user’s awareness. The very first
malware in the story of Android, FakePlayer, sends SMS message “798657” to multiple
premium-rate numbers in Russia. GGTracker automatically signs up the infected user
to premium services in US without user’s knowledge. Zsone sends SMS messages to
premium-rate numbers in China without user’s consent. Some malware applications
do not hard-code premium-rate numbers with their code: instead, they leverage the
flexible remote control to push down the numbers at runtime. This behavior appears
in a number of malware, including Zsone, RogueSPPush, and GGTracker.
Malware also actively harvests various types of information on the infected phones,
including SMS messages, phone numbers, and users’ account information. For exam-
ple, SndApps collects email addresses of users and sends them to a remote server.
FakeNetflix gathers users’ Netflix accounts and passwords by providing a fake but
seeming identical Netflix UI.
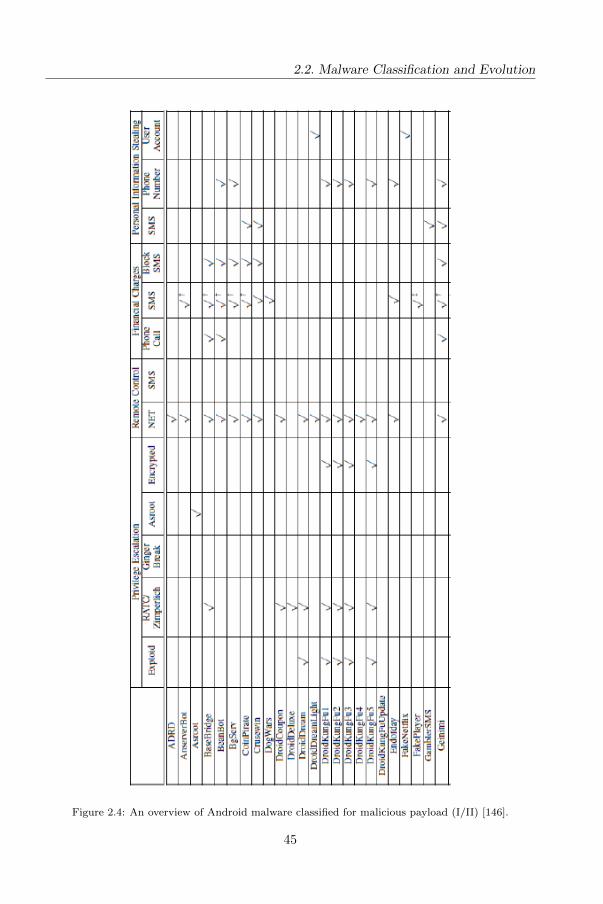
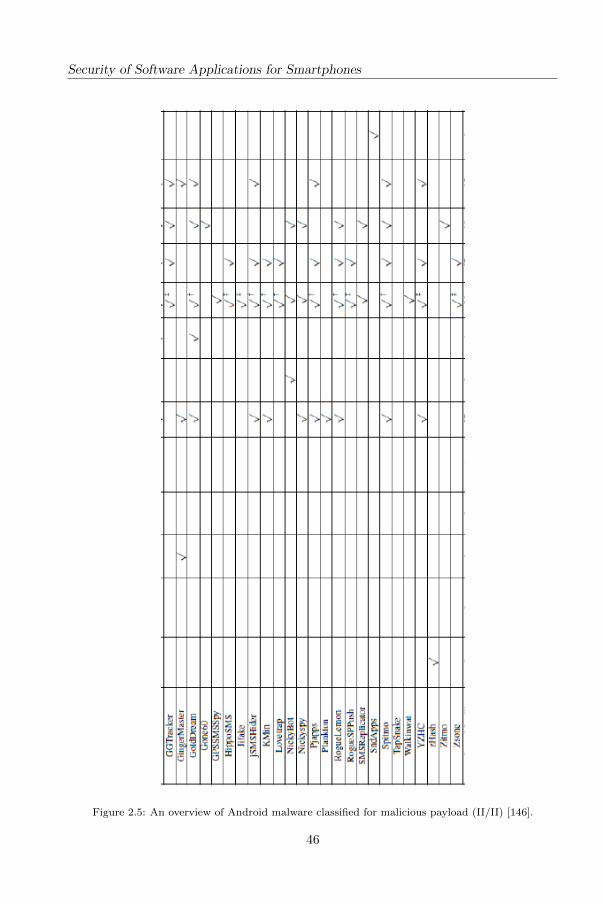
In figures 2.4 and 2.5 on overview of top 50 Android malware families grouped by
payload category: privilege exalation, remote control, financial charges and personal
information stealing [146].
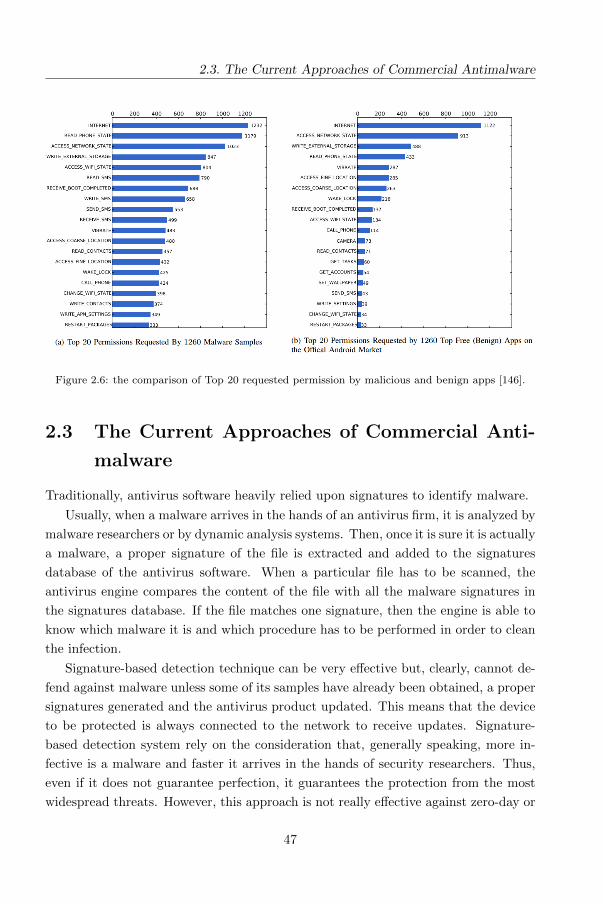
Android permissions such as INTERNET, READ PHONE STATE, ACCESS NETWORK STATE,
and WRITE EXTERNAL STORAGE are widely requested in both malicious and benign
apps. The first two are typically needed to allow for the embedded ad libraries to
function properly. But malicious apps clearly tend to request more frequently on the
SMS-related permissions, such as READ SMS, WRITE SMS, RECEIVE SMS, and SEND SMS.
Figure 2.6 shows the comparison of Top 20 requested permission by malicious and
benign apps [146].
42
2.2. Malware Classification and Evolution
Figure 2.2: An overview of Android malware classified by malicious payload classified for installation
and activation time (I/II) [146].43
Security of Software Applications for Smartphones
Figure 2.3: An overview of Android malware classified by malicious payload classified for installation
and activation time (II/II) [146].44
2.2. Malware Classification and Evolution
Figure 2.4: An overview of Android malware classified for malicious payload (I/II) [146].
45
Security of Software Applications for Smartphones
Figure 2.5: An overview of Android malware classified for malicious payload (II/II) [146].
46
2.3. The Current Approaches of Commercial Antimalware
Figure 2.6: the comparison of Top 20 requested permission by malicious and benign apps [146].
2.3 The Current Approaches of Commercial Anti-
malware
Traditionally, antivirus software heavily relied upon signatures to identify malware.
Usually, when a malware arrives in the hands of an antivirus firm, it is analyzed by
malware researchers or by dynamic analysis systems. Then, once it is sure it is actually
a malware, a proper signature of the file is extracted and added to the signatures
database of the antivirus software. When a particular file has to be scanned, the
antivirus engine compares the content of the file with all the malware signatures in
the signatures database. If the file matches one signature, then the engine is able to
know which malware it is and which procedure has to be performed in order to clean
the infection.
Signature-based detection technique can be very effective but, clearly, cannot de-
fend against malware unless some of its samples have already been obtained, a proper
signatures generated and the antivirus product updated. This means that the device
to be protected is always connected to the network to receive updates. Signature-
based detection system rely on the consideration that, generally speaking, more in-
fective is a malware and faster it arrives in the hands of security researchers. Thus,
even if it does not guarantee perfection, it guarantees the protection from the most
widespread threats. However, this approach is not really effective against zero-day or
47
Security of Software Applications for Smartphones
next-generation malware, i.e. malware that has not been yet encountered/analyzed.
As new malware are being created each day, the signature-based detection ap-
proach requires frequent updates of the signatures database. To assist the antivirus
firms, the software may automatically upload new malware to the company or allow
the user to manually do it, allowing the antivirus firms to dramatically shorten the
life of those threats.
When antivirus software scans a file for viruses, it checks the contents of a file
against a dictionary of virus signatures. A virus signature is the viral code. Finding
a virus signature in a file is the same as saying you found the virus itself. If a virus
signature is found in a file, the antivirus software can take action to remove the
virus. Antivirus software will usually perform one or more of the following actions;
quarantining, repairing, or deleting. Quarantining a file will make it inaccessible,
and is usually the first action antivirus software will take if a malicious file is found.
Encrypting the file is a good quarantining technique because it renders the file useless.
Sometimes a user wants to save the content of an infected file because viruses
can sometimes embed themselves in files, called code injection, and the file may be
essential to normal operation. To do this, antivirus software will attempt to repair
the file. To do this, the software will try to remove the viral code from the file.
Unfortunately, some viruses might damage the file upon injection.
The third action antivirus software can take against a virus is deleting it. If a file
repair operation fails, usually the best thing to do is to just delete the file. Deleting
the file is necessary if the entire file is infected.
As explained, new viruses are being created each day, the signature based detection
approach requires frequent updates of the virus signature dictionary. To assist the
antivirus software companies, the software may allow the user to upload new viruses
or variants to the company. There, the virus can be analyzed and the signature added
to the dictionary.
Signature-based antivirus software typically examines files when the computer’s
operating system creates, opens, closes, or e-mails them. In this way it can detect a
known virus immediately upon receipt. System administrators can schedule antivirus
software to scan all files on the computer’s hard disk at a set time and date.
Although the signature-based approach can effectively contain malware outbreaks,
malware authors have tried to stay a step ahead of such software by writing “polymor-
phic” and, more recently, “metamorphic” viruses, which encrypt parts of themselves
or otherwise modify themselves as a method of disguise, so as to not match virus
signatures in the dictionary [132].
48
2.4. Limits of the Commercial Antimalware Strategies
An emerging technique to deal with malware in general is whitelisting. Rather
than looking for only known bad software, this technique prevents execution of all
computer code except that which has been previously identified as trustworthy by
the system administrator. By following this “default deny” approach, the limitations
inherent in keeping virus signatures up to date are avoided. Additionally, computer
applications that are unwanted by the system administrator are prevented from exe-
cuting since they are not on the whitelist. Since modern enterprise organizations have
large quantities of trusted applications, the limitations of adopting this technique
rests with the system administrators’ ability to properly inventory and maintain the
whitelist of trusted applications. Viable implementations of this technique include
tools for automating the inventory and whitelist maintenance processes.
Some more sophisticated antivirus software uses heuristic analysis to identify new
malware or variants of known malware.
Many viruses start as a single infection and through either mutation or refinements
by other attackers, can grow into dozens of slightly different strains, called variants.
Generic detection refers to the detection and removal of multiple threats using a single
virus definition [41].
For example, the Vundo trojan has several family members, depending on the
antivirus vendor’s classification. Symantec classifies members of the Vundo family
into two distinct categories, Trojan.Vundo and Trojan.Vundo.B [42, 43].
While it may be advantageous to identify a specific virus, it can be quicker to
detect a virus family through a generic signature or through an inexact match to an
existing signature. Virus researchers find common areas that all viruses in a family
share uniquely and can thus create a single generic signature. These signatures often
contain non-contiguous code, using wildcard characters where differences lie. These
wildcards allow the scanner to detect viruses even if they are padded with extra,
meaningless code [43]. A detection that uses this method is said to be “heuristic
detection”.
2.4 Limits of the Commercial Antimalware Strate-
gies
In this section we evaluate the limitations of current signature based antimalware with
a real mobile malware dataset. Malware novadays implements a lot of techniques to
evade the detection by anti-malware. As explained, polymorphism is used to evade
detection tools by transforming a malware in different forms but with the same code.
49
Security of Software Applications for Smartphones
Metamorphism is another common technique able to mutate code so that it no longer
remains the same but still has the same behaviour.
Antimalware software should prevent and eliminate malware powerfully and effi-
ciently, but as we explained in previous section there are many limitations that make
antimalware unable to detect malware efficiently.
In the next we focus on the assess of antimalware products for Android with
current Android malware and we deduce how resistant the signatures are against
changes in malware binaries.
Changes in malware binaries are a widespread tecnique employed from malware
writers: In the wild there are in fact several techniques that obfuscate malware to
generate different forms of it (“morphs”) in order to evade the signature detection.
We develop a framework which applies a set of transformations to Android ap-
plications smali code. We then transformed a real world malware dataset and we
submitted the applications (the original malware and the variants) to the Virustotal
service, in order to evaluate the maliciousness before and after the transformations
(we submitted every sample “pre” and “post” the transformation process). Our en-
gine is able to modify a submitted application with different transformation levels,
here we explain the morphing level we applied to our dataset:
• Disassembling & Reassembling : we recall here that Android packages are signed
.jar files. These may be unzipped with the regular zip utilities and then repacked
again with tools offered in Android SDK. Once repacked, applications are signed
with custom keys (the original developer keys are not available). Detection
signatures that match the developer keys or a checksum of the entire application
package are rendered ineffective by this transformation. This transformation is
based on the apktool representation of the items contained in the .dex file. For
disassembling an application, the command “apktool d apkname” generates
several directories representing the original application resources: source code,
Android Manifest, etc. The command “apktool b apkDirectory” generates an
application based on a new apktool dex file representation.
• Repacking : the compiled Dalvik bytecode in classes.dex file (the name is the
same for each Android application) of the application package may be disas-
sembled and then reassembled back again. The various items (classes, methods,
strings, and so on) in a dex file may be arranged or represented in more than
one way and thus a compiled program may be represented in different forms.
Signatures that match the whole classes.dex are beaten by this transformation.
50
2.4. Limits of the Commercial Antimalware Strategies
Every Android application has a developer signature key that will be lost af-
ter disassembling the application an the reassembling it. To create a new key
we used the tool “signapk” to avoid the detection signatures that match the
developer keys or a checksum of the entire application package.
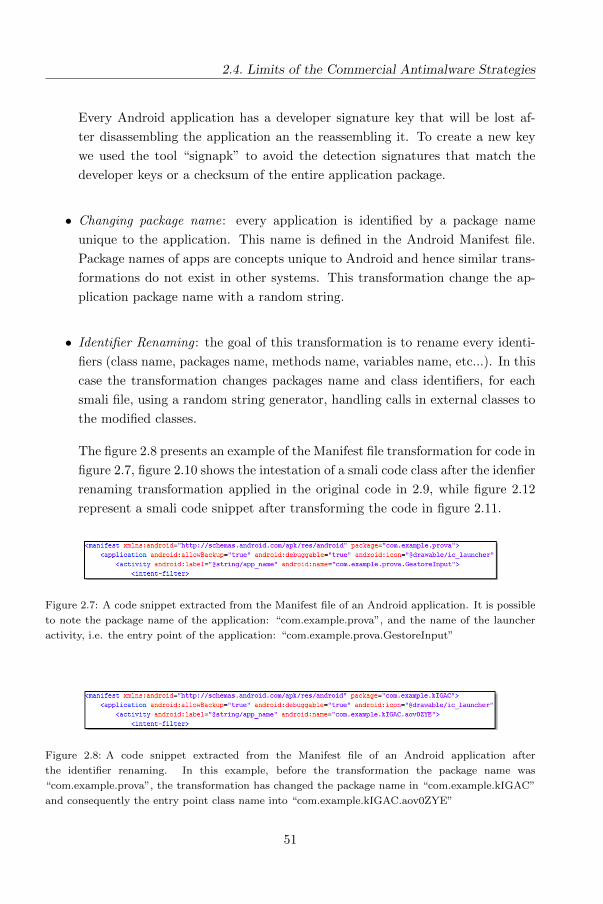
• Changing package name: every application is identified by a package name
unique to the application. This name is defined in the Android Manifest file.
Package names of apps are concepts unique to Android and hence similar trans-
formations do not exist in other systems. This transformation change the ap-
plication package name with a random string.
• Identifier Renaming : the goal of this transformation is to rename every identi-
fiers (class name, packages name, methods name, variables name, etc...). In this
case the transformation changes packages name and class identifiers, for each
smali file, using a random string generator, handling calls in external classes to
the modified classes.
The figure 2.8 presents an example of the Manifest file transformation for code in
figure 2.7, figure 2.10 shows the intestation of a smali code class after the idenfier
renaming transformation applied in the original code in 2.9, while figure 2.12
represent a smali code snippet after transforming the code in figure 2.11.
Figure 2.7: A code snippet extracted from the Manifest file of an Android application. It is possible
to note the package name of the application: “com.example.prova”, and the name of the launcher
activity, i.e. the entry point of the application: “com.example.prova.GestoreInput”
Figure 2.8: A code snippet extracted from the Manifest file of an Android application after
the identifier renaming. In this example, before the transformation the package name was
“com.example.prova”, the transformation has changed the package name in “com.example.kIGAC”
and consequently the entry point class name into “com.example.kIGAC.aov0ZYE”
51
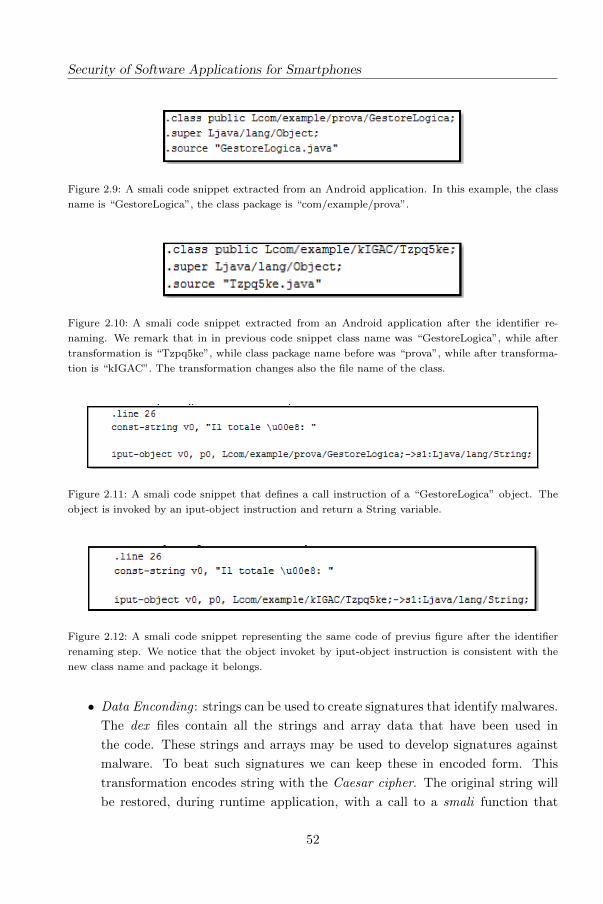
Security of Software Applications for Smartphones
Figure 2.9: A smali code snippet extracted from an Android application. In this example, the class
name is “GestoreLogica”, the class package is “com/example/prova”.
Figure 2.10: A smali code snippet extracted from an Android application after the identifier re-
naming. We remark that in in previous code snippet class name was “GestoreLogica”, while after
transformation is “Tzpq5ke”, while class package name before was “prova”, while after transforma-
tion is “kIGAC”. The transformation changes also the file name of the class.
Figure 2.11: A smali code snippet that defines a call instruction of a “GestoreLogica” object. The
object is invoked by an iput-object instruction and return a String variable.
Figure 2.12: A smali code snippet representing the same code of previus figure after the identifier
renaming step. We notice that the object invoket by iput-object instruction is consistent with the
new class name and package it belongs.
• Data Enconding : strings can be used to create signatures that identify malwares.
The dex files contain all the strings and array data that have been used in
the code. These strings and arrays may be used to develop signatures against
malware. To beat such signatures we can keep these in encoded form. This
transformation encodes string with the Caesar cipher. The original string will
be restored, during runtime application, with a call to a smali function that
52
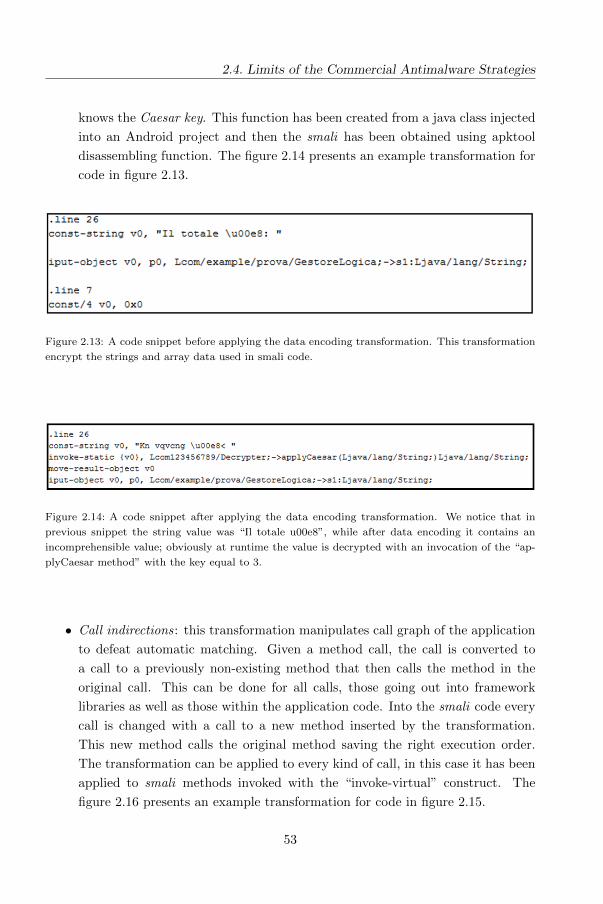
2.4. Limits of the Commercial Antimalware Strategies
knows the Caesar key. This function has been created from a java class injected
into an Android project and then the smali has been obtained using apktool
disassembling function. The figure 2.14 presents an example transformation for
code in figure 2.13.
Figure 2.13: A code snippet before applying the data encoding transformation. This transformation
encrypt the strings and array data used in smali code.
Figure 2.14: A code snippet after applying the data encoding transformation. We notice that in
previous snippet the string value was “Il totale u00e8”, while after data encoding it contains an
incomprehensible value; obviously at runtime the value is decrypted with an invocation of the “ap-
plyCaesar method” with the key equal to 3.
• Call indirections: this transformation manipulates call graph of the application
to defeat automatic matching. Given a method call, the call is converted to
a call to a previously non-existing method that then calls the method in the
original call. This can be done for all calls, those going out into framework
libraries as well as those within the application code. Into the smali code every
call is changed with a call to a new method inserted by the transformation.
This new method calls the original method saving the right execution order.
The transformation can be applied to every kind of call, in this case it has been
applied to smali methods invoked with the “invoke-virtual” construct. The
figure 2.16 presents an example transformation for code in figure 2.15.
53
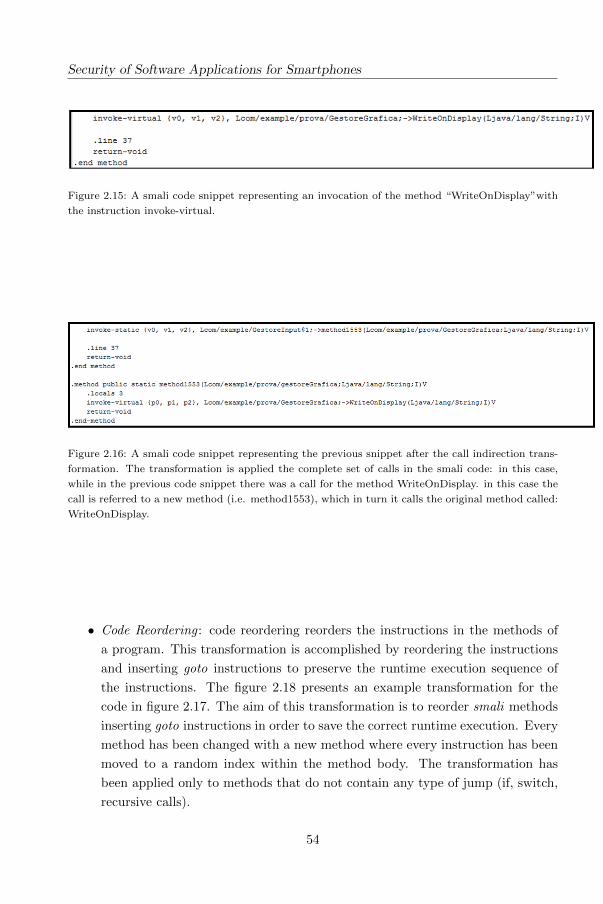
Security of Software Applications for Smartphones
Figure 2.15: A smali code snippet representing an invocation of the method “WriteOnDisplay”with
the instruction invoke-virtual.
Figure 2.16: A smali code snippet representing the previous snippet after the call indirection trans-
formation. The transformation is applied the complete set of calls in the smali code: in this case,
while in the previous code snippet there was a call for the method WriteOnDisplay. in this case the
call is referred to a new method (i.e. method1553), which in turn it calls the original method called:
WriteOnDisplay.
• Code Reordering : code reordering reorders the instructions in the methods of
a program. This transformation is accomplished by reordering the instructions
and inserting goto instructions to preserve the runtime execution sequence of
the instructions. The figure 2.18 presents an example transformation for the
code in figure 2.17. The aim of this transformation is to reorder smali methods
inserting goto instructions in order to save the correct runtime execution. Every
method has been changed with a new method where every instruction has been
moved to a random index within the method body. The transformation has
been applied only to methods that do not contain any type of jump (if, switch,
recursive calls).
54
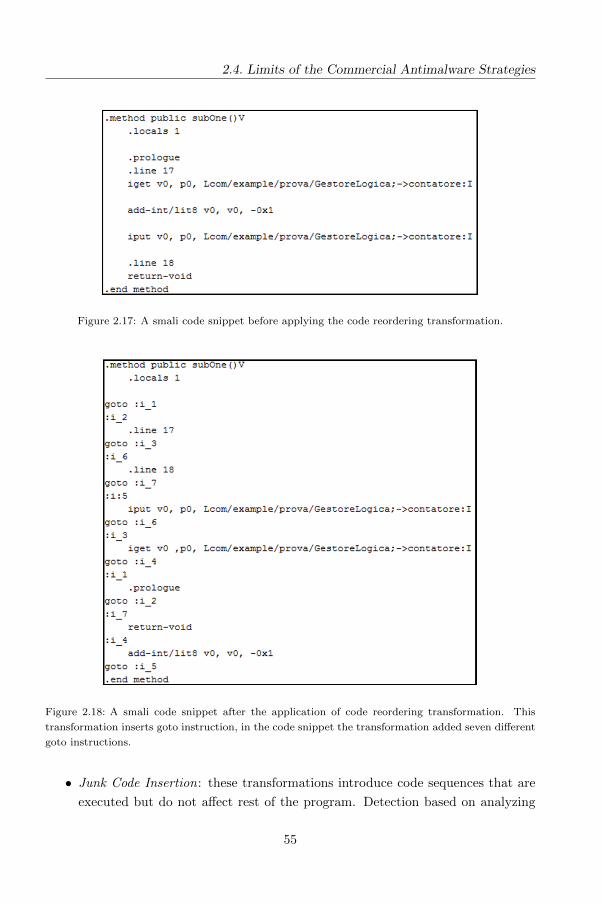
2.4. Limits of the Commercial Antimalware Strategies
Figure 2.17: A smali code snippet before applying the code reordering transformation.
Figure 2.18: A smali code snippet after the application of code reordering transformation. This
transformation inserts goto instruction, in the code snippet the transformation added seven different
goto instructions.
• Junk Code Insertion: these transformations introduce code sequences that are
executed but do not affect rest of the program. Detection based on analyzing
55
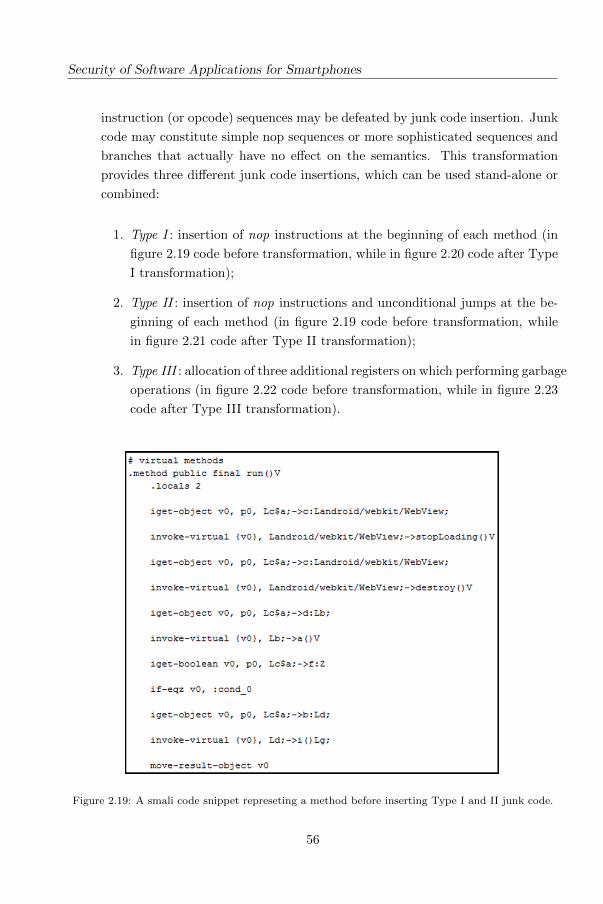
Security of Software Applications for Smartphones
instruction (or opcode) sequences may be defeated by junk code insertion. Junk
code may constitute simple nop sequences or more sophisticated sequences and
branches that actually have no effect on the semantics. This transformation
provides three different junk code insertions, which can be used stand-alone or
combined:
1. Type I : insertion of nop instructions at the beginning of each method (in
figure 2.19 code before transformation, while in figure 2.20 code after Type
I transformation);
2. Type II : insertion of nop instructions and unconditional jumps at the be-
ginning of each method (in figure 2.19 code before transformation, while
in figure 2.21 code after Type II transformation);
3. Type III : allocation of three additional registers on which performing garbage
operations (in figure 2.22 code before transformation, while in figure 2.23
code after Type III transformation).
Figure 2.19: A smali code snippet represeting a method before inserting Type I and II junk code.
56
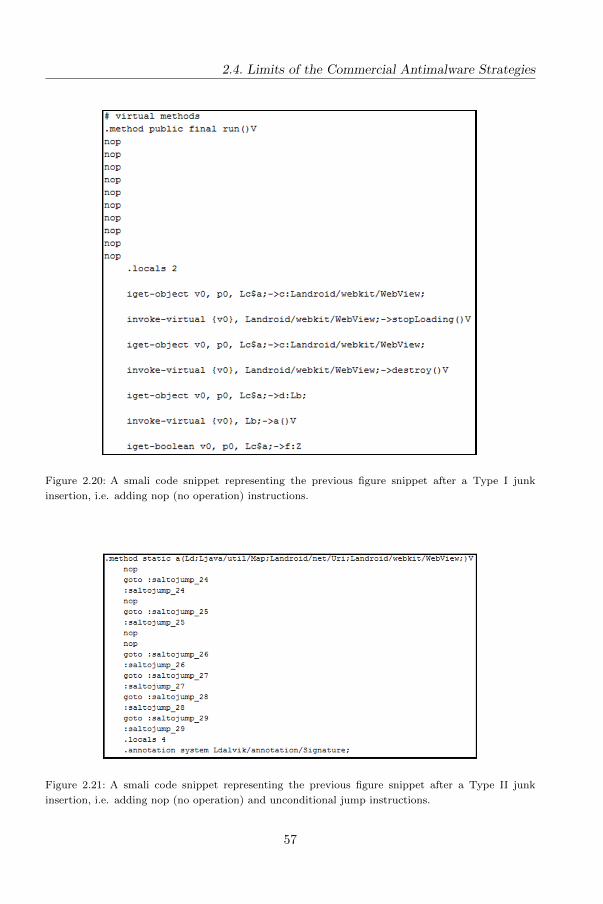
2.4. Limits of the Commercial Antimalware Strategies
Figure 2.20: A smali code snippet representing the previous figure snippet after a Type I junk
insertion, i.e. adding nop (no operation) instructions.
Figure 2.21: A smali code snippet representing the previous figure snippet after a Type II junk
insertion, i.e. adding nop (no operation) and unconditional jump instructions.
57
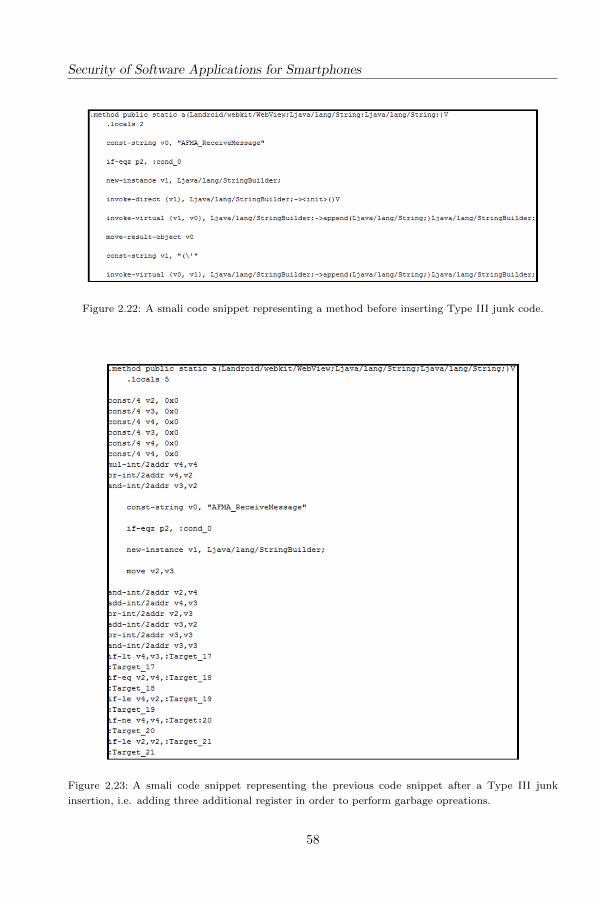
Security of Software Applications for Smartphones
Figure 2.22: A smali code snippet representing a method before inserting Type III junk code.
Figure 2.23: A smali code snippet representing the previous code snippet after a Type III junk
insertion, i.e. adding three additional register in order to perform garbage opreations.
58
2.4. Limits of the Commercial Antimalware Strategies
We implemented all the transformations so that may be applied automatically to
the full dataset of applications. We applied the complete set of transformations on the
malware dataset, composed by 5560 malware belonging to different 179 families. We
use the Smali/Baksmali1 and Apktool2 in our implementation. Our code-level trans-
formations are implemented in smali code. Moreover, disassembling and assembling
transformation uses Apktool. This has the effect of repacking, changing the order
and representation of items in the classes.dex file, and changing the AndroidManifest
(while preserving its semantics). All other transformations in our implementation
(apart from repacking) make use of Apktool to unpack/repack application packages.
The developed tool uses a specific execution order to avoid conflicts when trans-
formations are combined together. This is the transformation chain that from our
observation does not create conflicts:
1. disassembling ;
2. changing package name;
3. data encoding ;
4. code reordering ;
5. insert Type I junk instructions;
6. insert Type II junk instructions;
7. insert Type III junk instructions;
8. identifiers renaming package;
9. identifiers renaming class;
10. call indirection;
11. reassembling ;
12. repacking.
To evaluate a multitude of antimalware in one-step we use VirusTotal, a free
online service that allow to scan the detection of viruses, worms, trojans or any
malware found in suspicious files and URLs, submitting simultaneously on numerous
anti-malware scanners, constantly updated to the latest version [2].
1https://code.google.com/p/smali/2http://ibotpeaches.github.io/Apktool/
59
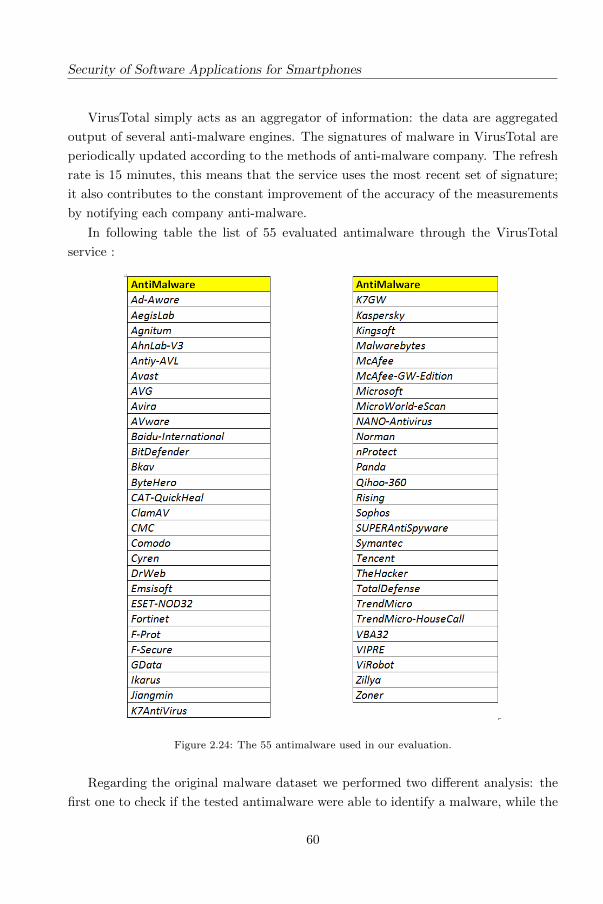
Security of Software Applications for Smartphones
VirusTotal simply acts as an aggregator of information: the data are aggregated
output of several anti-malware engines. The signatures of malware in VirusTotal are
periodically updated according to the methods of anti-malware company. The refresh
rate is 15 minutes, this means that the service uses the most recent set of signature;
it also contributes to the constant improvement of the accuracy of the measurements
by notifying each company anti-malware.
In following table the list of 55 evaluated antimalware through the VirusTotal
service :
Figure 2.24: The 55 antimalware used in our evaluation.
Regarding the original malware dataset we performed two different analysis: the
first one to check if the tested antimalware were able to identify a malware, while the
60
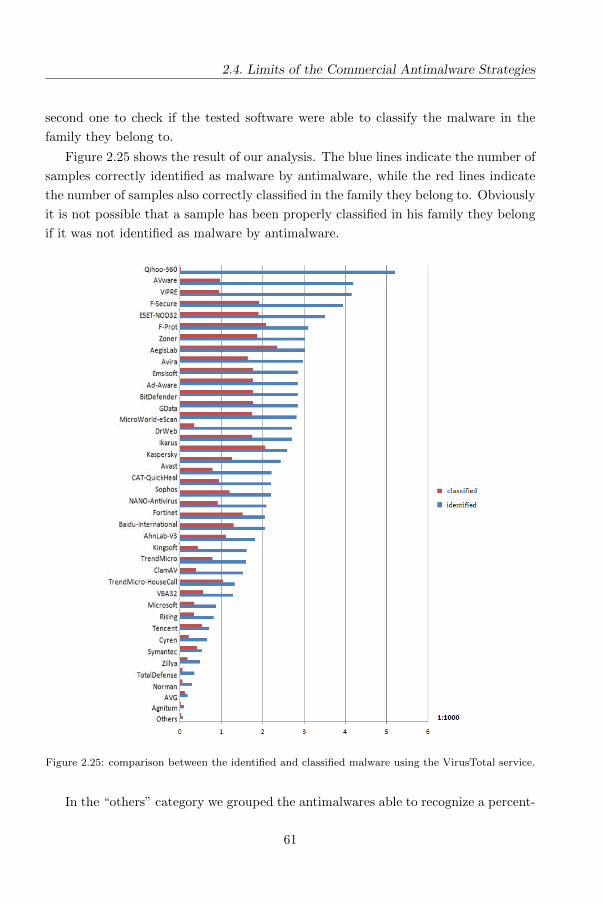
2.4. Limits of the Commercial Antimalware Strategies
second one to check if the tested software were able to classify the malware in the
family they belong to.
Figure 2.25 shows the result of our analysis. The blue lines indicate the number of
samples correctly identified as malware by antimalware, while the red lines indicate
the number of samples also correctly classified in the family they belong to. Obviously
it is not possible that a sample has been properly classified in his family they belong
if it was not identified as malware by antimalware.
Figure 2.25: comparison between the identified and classified malware using the VirusTotal service.
In the “others” category we grouped the antimalwares able to recognize a percent-
61
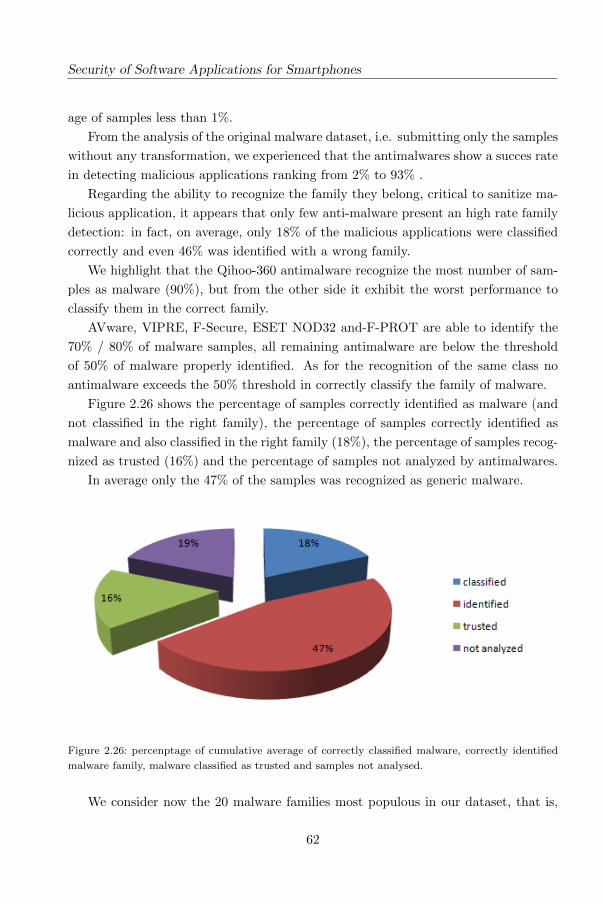
Security of Software Applications for Smartphones
age of samples less than 1%.
From the analysis of the original malware dataset, i.e. submitting only the samples
without any transformation, we experienced that the antimalwares show a succes rate
in detecting malicious applications ranking from 2% to 93% .
Regarding the ability to recognize the family they belong, critical to sanitize ma-
licious application, it appears that only few anti-malware present an high rate family
detection: in fact, on average, only 18% of the malicious applications were classified
correctly and even 46% was identified with a wrong family.
We highlight that the Qihoo-360 antimalware recognize the most number of sam-
ples as malware (90%), but from the other side it exhibit the worst performance to
classify them in the correct family.
AVware, VIPRE, F-Secure, ESET NOD32 and-F-PROT are able to identify the
70% / 80% of malware samples, all remaining antimalware are below the threshold
of 50% of malware properly identified. As for the recognition of the same class no
antimalware exceeds the 50% threshold in correctly classify the family of malware.
Figure 2.26 shows the percentage of samples correctly identified as malware (and
not classified in the right family), the percentage of samples correctly identified as
malware and also classified in the right family (18%), the percentage of samples recog-
nized as trusted (16%) and the percentage of samples not analyzed by antimalwares.
In average only the 47% of the samples was recognized as generic malware.
Figure 2.26: percenptage of cumulative average of correctly classified malware, correctly identified
malware family, malware classified as trusted and samples not analysed.
We consider now the 20 malware families most populous in our dataset, that is,
62
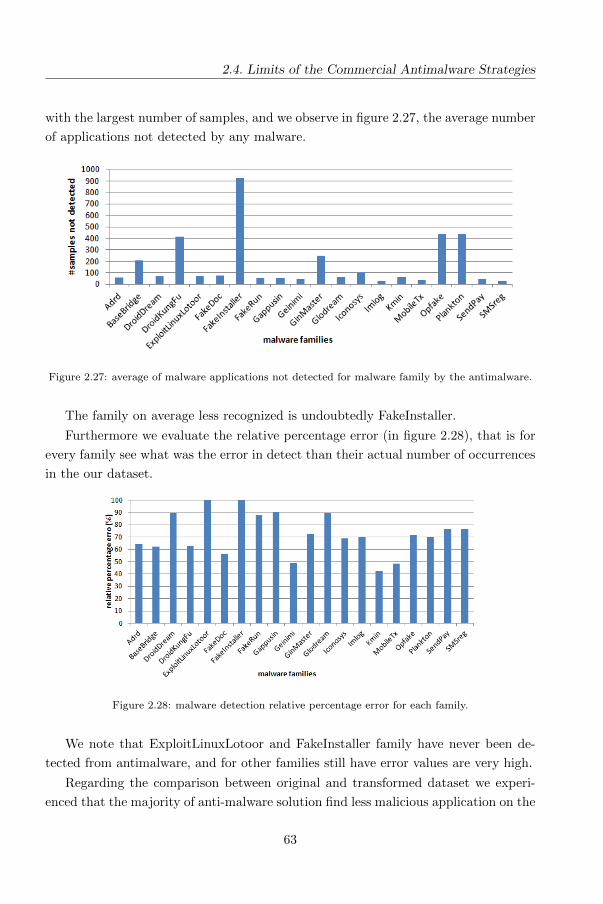
2.4. Limits of the Commercial Antimalware Strategies
with the largest number of samples, and we observe in figure 2.27, the average number
of applications not detected by any malware.
Figure 2.27: average of malware applications not detected for malware family by the antimalware.
The family on average less recognized is undoubtedly FakeInstaller.
Furthermore we evaluate the relative percentage error (in figure 2.28), that is for
every family see what was the error in detect than their actual number of occurrences
in the our dataset.
Figure 2.28: malware detection relative percentage error for each family.
We note that ExploitLinuxLotoor and FakeInstaller family have never been de-
tected from antimalware, and for other families still have error values are very high.
Regarding the comparison between original and transformed dataset we experi-
enced that the majority of anti-malware solution find less malicious application on the
63
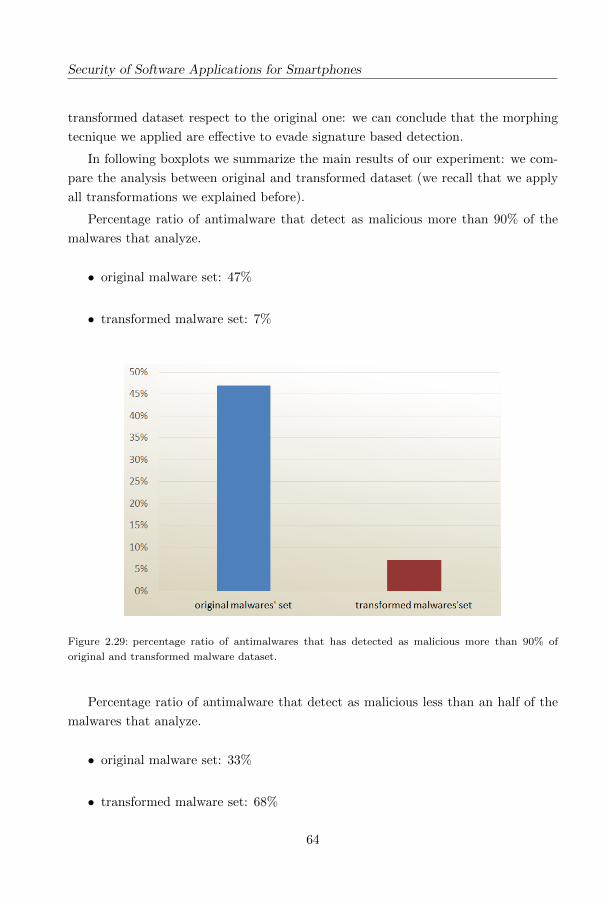
Security of Software Applications for Smartphones
transformed dataset respect to the original one: we can conclude that the morphing
tecnique we applied are effective to evade signature based detection.
In following boxplots we summarize the main results of our experiment: we com-
pare the analysis between original and transformed dataset (we recall that we apply
all transformations we explained before).
Percentage ratio of antimalware that detect as malicious more than 90% of the
malwares that analyze.
• original malware set: 47%
• transformed malware set: 7%
Figure 2.29: percentage ratio of antimalwares that has detected as malicious more than 90% of
original and transformed malware dataset.
Percentage ratio of antimalware that detect as malicious less than an half of the
malwares that analyze.
• original malware set: 33%
• transformed malware set: 68%
64
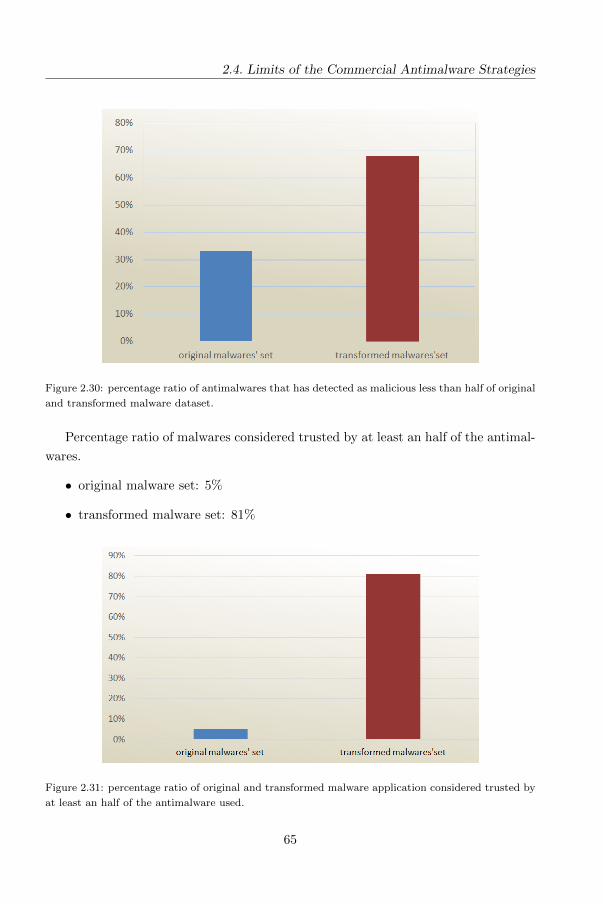
2.4. Limits of the Commercial Antimalware Strategies
Figure 2.30: percentage ratio of antimalwares that has detected as malicious less than half of original
and transformed malware dataset.
Percentage ratio of malwares considered trusted by at least an half of the antimal-
wares.
• original malware set: 5%
• transformed malware set: 81%
Figure 2.31: percentage ratio of original and transformed malware application considered trusted by
at least an half of the antimalware used.
65
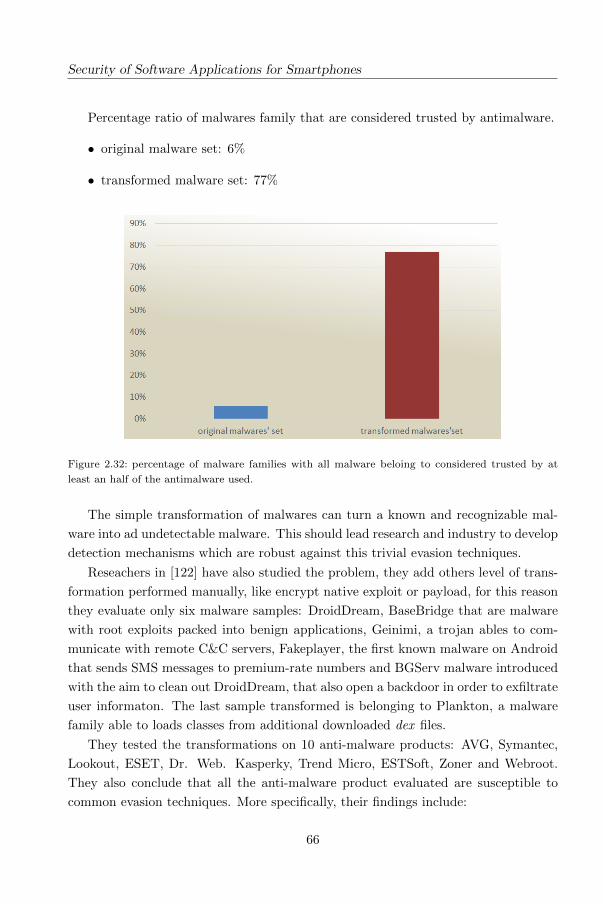
Security of Software Applications for Smartphones
Percentage ratio of malwares family that are considered trusted by antimalware.
• original malware set: 6%
• transformed malware set: 77%
Figure 2.32: percentage of malware families with all malware beloing to considered trusted by at
least an half of the antimalware used.
The simple transformation of malwares can turn a known and recognizable mal-
ware into ad undetectable malware. This should lead research and industry to develop
detection mechanisms which are robust against this trivial evasion techniques.
Reseachers in [122] have also studied the problem, they add others level of trans-
formation performed manually, like encrypt native exploit or payload, for this reason
they evaluate only six malware samples: DroidDream, BaseBridge that are malware
with root exploits packed into benign applications, Geinimi, a trojan ables to com-
municate with remote C&C servers, Fakeplayer, the first known malware on Android
that sends SMS messages to premium-rate numbers and BGServ malware introduced
with the aim to clean out DroidDream, that also open a backdoor in order to exfiltrate
user informaton. The last sample transformed is belonging to Plankton, a malware
family able to loads classes from additional downloaded dex files.
They tested the transformations on 10 anti-malware products: AVG, Symantec,
Lookout, ESET, Dr. Web. Kasperky, Trend Micro, ESTSoft, Zoner and Webroot.
They also conclude that all the anti-malware product evaluated are susceptible to
common evasion techniques. More specifically, their findings include:
66
2.4. Limits of the Commercial Antimalware Strategies
• Finding 1 : all the anti-malware product evaluated are vulnerable to common
transformation. For example, Geinimi variants have encrypted strings, the
DroidKungFu malware uses encrypted exploit code. Transformation like Iden-
tifier Renaming or Data Encryption are easily evailable with free or commercial
tools. The most important consideration is that such signatures do not capture
semantic properties of malware such as data and control flow.
• Finding 2 : at least 43% of signatures are not based on codelevel artifacts.
These signature are based on filename, dex checksum, information obtained by
the PackageManager API or like AVG only by the content of the Manifest file.
• Finding 3 : 90% of the signatures do not require static analysis of bytecode. Only
one of ten anti-malware tools was found to be using static analysis. Names of
classes, methods, and fileds, and all the strings and array data are stored in the
classes.dex file as they are and hence can be obtained by content matching.
• Finding 4 : Anti-malware tools have evolved towards content-based signatures
over the past year. Last year (i.e. 2013), 45% of the signatures were evaded
by trivial transformations. Their present results show a marked decrease in
this fraction to 16%. New solutions moved to content-based matching such as
matching Identifier and Strings.
The study we performed demonstrate without any doubts that signatures still lack
resilience against mobile malware.
67

Chapter 3
The State of the Art
Malware detection techniques can be characterized in terms of the features they use to
discriminate between malware and non-malware applications: those features can be
obtained by means of static analysis or dynamic analysis. In general, static analysis
captures suspicious patterns within the code (or artifacts related to code, such as
meta information), whereas dynamic analysis captures suspicious patterns related to
the behavior observed during the application running. We here review recent works
within these two categories of techniques. Table 3.1 provides a comparison of all
the techniques and summarizes the features used by each technique, while table 3.2
highlights the number of samples involved in the related work evaluation and the
results obtained in terms of precision and recall (when available).
69
The State of the Art
3.1 Static Analysis
Several works consider permissions as a prominent feature for discriminating between
malware and non-malware applications. Arp et al. [59] use the requests of hardware
components (e.g., application requests to camera or GPS), the requested permissions
and intents; in addition to this, they extract features from disassembled code. Their
solution is evaluated using a malware dataset composed by 5560 samples and a trusted
one by 123 453 samples and their method is able to detect 94% of the malware sam-
ples with a false positive rate of 1%. Stowaway [115] detects overprivilege in compiled
Android applications analyzing API call in order to identify permission use. Authors
apply Stowaway to a set of 940 applications and they find that about one-third are
overprivileged. They also investigate about the causes of overprivilege and find ev-
idence that developers are trying to follow least privilege but sometimes fail due to
insufficient API documentation. Di Cerbo et al. [81] study the permission model and
how it can be useful to malware detection. To discriminate an application, the method
compares the permissions requested by the application, with the reference model of
sensible data access profiles, in order to detect if the application has different security
requirements with respect to other applications in the same profile. They use the
Apriori algorithm to group the applications according to their similarity of requested
permissions. Authors punctualize that the method is not a detector, but its main
focus is to signal to the forensics analyst a situation that could require additional
specific investigations. Barrera et al. [62] and Aswini and Vinod [60] also identify
permissions requested by applications. Barrera et al. [62] analyze 1100 applications
using Self-Organizing Map (SOM), a type of neural network algorithm which employs
unsupervised learning (i.e., without requiring any labels) to produce a 2-dimensional,
discretized representation of a high dimensional input space. Their results show that
a small subset of the permissions are used very frequently where a large subset of
permissions were used by very few applications, suggesting that the frequently used
permissions (e.g. the INTERNET permission) do not provide sufficient expressiveness
and hence may benefit from being divided into sub-categories, perhaps in a hierarchi-
cal manner. Aswini and Vinod [60] propose Droid Permission Miner, a tool to extract
promiment permissions. The prominent features that give way to lesser misclassifica-
tion are determined using Bi-Normal Separation (BNS) and Mutual Information (MI)
feature selection techniques. They observed, on a dataset composed by 436 samples,
that better classification accuracy (i.e., 81.56%) is obtained with Mutual Information
features selection methods with a small feature lenght of 15 features. Fazeen and
Dantu [87] use the permission requested in order to construct the probability mass
70
3.1. Static Analysis
functions (PMF). In the proposed approachfisrt of all they constructed a machine
learning model to group benign apps into different clusters based on their operations
known as the task-intention. Once they trained the model, it was used to identify
the task-intention of an application. They used only the benign applications to con-
struct the task-intentions and none of the malware signatures were involved in this
phase. Then, for each task-intention group, they extracted the permission-requests
of the apps and constructed the PMF. They compared the permission-requests of
an unknown app with its corresponding shape of the PMF to identify the potential
malware apps. Authors obtained an accuracy of 89% in detecting potential malware
samples, using a dataset consisting of 1730 benign applications along with 273 mal-
ware samples. Liu and Liu [105] based their research on the assumption that the
occurrence of two permissions as a pair in one app can reflect malicious behavior.
They use both requested permissions and used permissions. They use a dataset com-
posed by 28 548 benign apps and 1536 malicious apps as training set, and 8000 benign
apps and with 400 malicious apps as test set. They obtain an accuracy of 0.986 using
the J48 algorithm. However, due to its high correlation with the used dataset, au-
thors conclude that a permission-based malware detecting mechanism can be used a a
filter in the first step to identify malicious applications. DroidMat [137] uses Manifest
permissions in addiction to intent messages passing and API calls to characterize ap-
plication behavior. DroidMat extracts the information (e.g., requested permissions,
Intent messages passing, etc) from each applications manifest file, and regards com-
ponents (Activity, Service, Receiver) as entry points drilling down for tracing API
Calls related to permissions. Next, it applies K-means algorithm that enhances the
malware modeling capability. The number of clusters are decided by Singular Value
Decomposition (SVD) method on the low rank approximation. Finally, it uses K-
nearest neighbors algorithm to classify the application as benign or malicious. Using
a dataset is composed by 1500 benign applications and 238 malicious one they obtain
an accuracy of 0.9787, a recall of 0.8739 and a precision of 0.9674.
Some approaches have been proposed which consider control flow, such as in [125];
the cited work is based on AndroGuard [17], a tool which extracts a series of features
from mobile applications in order to train a one-class Support Vector Machine. In
detail, they use AndroGuard [17] to extract permissions and control flow graphs from
packaged Android applications. They method is tested against a collection of 2081 be-
nign and 91 malicious one. The method shows promising results in that it has a very
low false negative rate, but also much room for improvement in its high false positive
rate. Chin et al. [76] consider also the control flow to detect application communi-
71
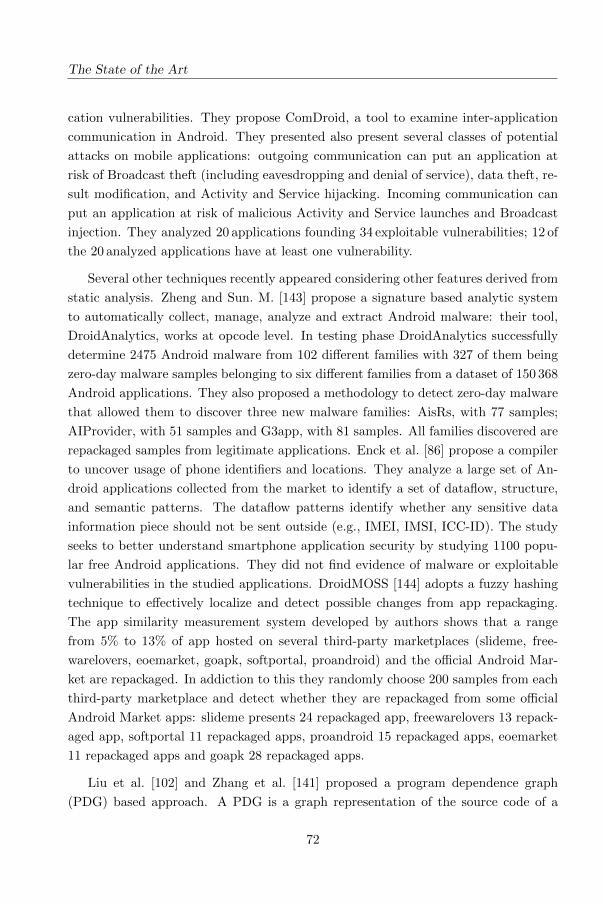
The State of the Art
cation vulnerabilities. They propose ComDroid, a tool to examine inter-application
communication in Android. They presented also present several classes of potential
attacks on mobile applications: outgoing communication can put an application at
risk of Broadcast theft (including eavesdropping and denial of service), data theft, re-
sult modification, and Activity and Service hijacking. Incoming communication can
put an application at risk of malicious Activity and Service launches and Broadcast
injection. They analyzed 20 applications founding 34 exploitable vulnerabilities; 12 of
the 20 analyzed applications have at least one vulnerability.
Several other techniques recently appeared considering other features derived from
static analysis. Zheng and Sun. M. [143] propose a signature based analytic system
to automatically collect, manage, analyze and extract Android malware: their tool,
DroidAnalytics, works at opcode level. In testing phase DroidAnalytics successfully
determine 2475 Android malware from 102 different families with 327 of them being
zero-day malware samples belonging to six different families from a dataset of 150 368
Android applications. They also proposed a methodology to detect zero-day malware
that allowed them to discover three new malware families: AisRs, with 77 samples;
AIProvider, with 51 samples and G3app, with 81 samples. All families discovered are
repackaged samples from legitimate applications. Enck et al. [86] propose a compiler
to uncover usage of phone identifiers and locations. They analyze a large set of An-
droid applications collected from the market to identify a set of dataflow, structure,
and semantic patterns. The dataflow patterns identify whether any sensitive data
information piece should not be sent outside (e.g., IMEI, IMSI, ICC-ID). The study
seeks to better understand smartphone application security by studying 1100 popu-
lar free Android applications. They did not find evidence of malware or exploitable
vulnerabilities in the studied applications. DroidMOSS [144] adopts a fuzzy hashing
technique to effectively localize and detect possible changes from app repackaging.
The app similarity measurement system developed by authors shows that a range
from 5% to 13% of app hosted on several third-party marketplaces (slideme, free-
warelovers, eoemarket, goapk, softportal, proandroid) and the official Android Mar-
ket are repackaged. In addiction to this they randomly choose 200 samples from each
third-party marketplace and detect whether they are repackaged from some official
Android Market apps: slideme presents 24 repackaged app, freewarelovers 13 repack-
aged app, softportal 11 repackaged apps, proandroid 15 repackaged apps, eoemarket
11 repackaged apps and goapk 28 repackaged apps.
Liu et al. [102] and Zhang et al. [141] proposed a program dependence graph
(PDG) based approach. A PDG is a graph representation of the source code of a
72
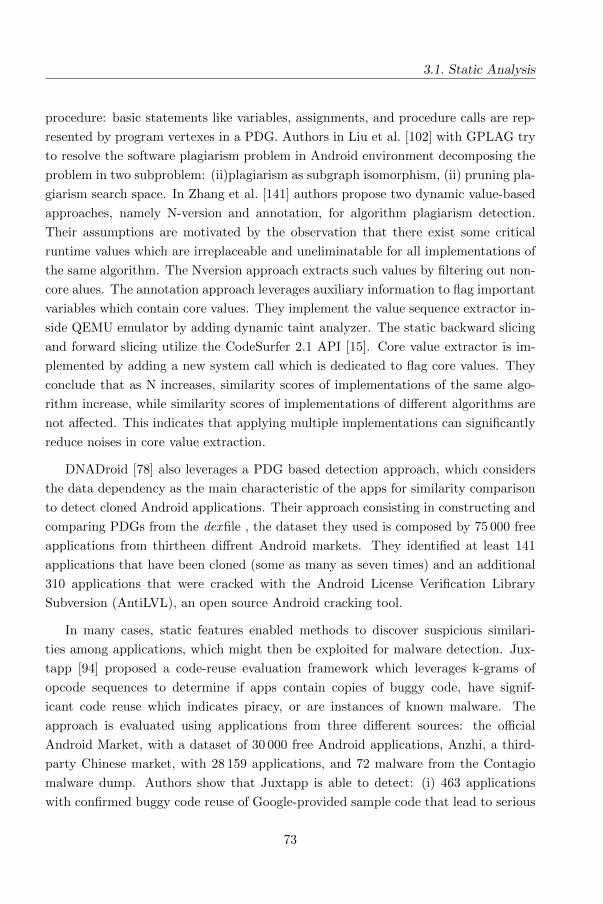
3.1. Static Analysis
procedure: basic statements like variables, assignments, and procedure calls are rep-
resented by program vertexes in a PDG. Authors in Liu et al. [102] with GPLAG try
to resolve the software plagiarism problem in Android environment decomposing the
problem in two subproblem: (ii)plagiarism as subgraph isomorphism, (ii) pruning pla-
giarism search space. In Zhang et al. [141] authors propose two dynamic value-based
approaches, namely N-version and annotation, for algorithm plagiarism detection.
Their assumptions are motivated by the observation that there exist some critical
runtime values which are irreplaceable and uneliminatable for all implementations of
the same algorithm. The Nversion approach extracts such values by filtering out non-
core alues. The annotation approach leverages auxiliary information to flag important
variables which contain core values. They implement the value sequence extractor in-
side QEMU emulator by adding dynamic taint analyzer. The static backward slicing
and forward slicing utilize the CodeSurfer 2.1 API [15]. Core value extractor is im-
plemented by adding a new system call which is dedicated to flag core values. They
conclude that as N increases, similarity scores of implementations of the same algo-
rithm increase, while similarity scores of implementations of different algorithms are
not affected. This indicates that applying multiple implementations can significantly
reduce noises in core value extraction.
DNADroid [78] also leverages a PDG based detection approach, which considers
the data dependency as the main characteristic of the apps for similarity comparison
to detect cloned Android applications. Their approach consisting in constructing and
comparing PDGs from the dexfile , the dataset they used is composed by 75 000 free
applications from thirtheen diffrent Android markets. They identified at least 141
applications that have been cloned (some as many as seven times) and an additional
310 applications that were cracked with the Android License Verification Library
Subversion (AntiLVL), an open source Android cracking tool.
In many cases, static features enabled methods to discover suspicious similari-
ties among applications, which might then be exploited for malware detection. Jux-
tapp [94] proposed a code-reuse evaluation framework which leverages k-grams of
opcode sequences to determine if apps contain copies of buggy code, have signif-
icant code reuse which indicates piracy, or are instances of known malware. The
approach is evaluated using applications from three different sources: the official
Android Market, with a dataset of 30 000 free Android applications, Anzhi, a third-
party Chinese market, with 28 159 applications, and 72 malware from the Contagio
malware dump. Authors show that Juxtapp is able to detect: (i) 463 applications
with confirmed buggy code reuse of Google-provided sample code that lead to serious
73
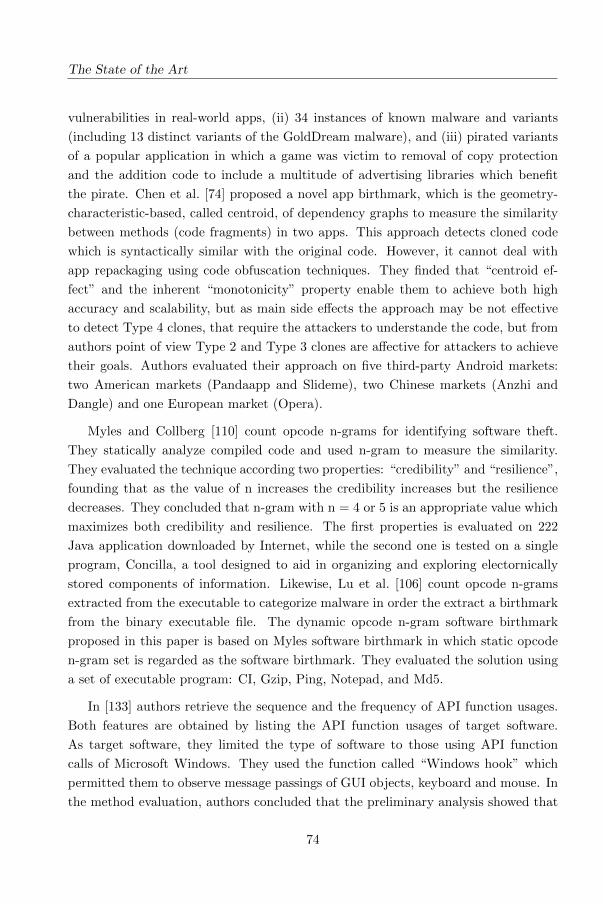
The State of the Art
vulnerabilities in real-world apps, (ii) 34 instances of known malware and variants
(including 13 distinct variants of the GoldDream malware), and (iii) pirated variants
of a popular application in which a game was victim to removal of copy protection
and the addition code to include a multitude of advertising libraries which benefit
the pirate. Chen et al. [74] proposed a novel app birthmark, which is the geometry-
characteristic-based, called centroid, of dependency graphs to measure the similarity
between methods (code fragments) in two apps. This approach detects cloned code
which is syntactically similar with the original code. However, it cannot deal with
app repackaging using code obfuscation techniques. They finded that “centroid ef-
fect” and the inherent “monotonicity” property enable them to achieve both high
accuracy and scalability, but as main side effects the approach may be not effective
to detect Type 4 clones, that require the attackers to understande the code, but from
authors point of view Type 2 and Type 3 clones are affective for attackers to achieve
their goals. Authors evaluated their approach on five third-party Android markets:
two American markets (Pandaapp and Slideme), two Chinese markets (Anzhi and
Dangle) and one European market (Opera).
Myles and Collberg [110] count opcode n-grams for identifying software theft.
They statically analyze compiled code and used n-gram to measure the similarity.
They evaluated the technique according two properties: “credibility” and “resilience”,
founding that as the value of n increases the credibility increases but the resilience
decreases. They concluded that n-gram with n = 4 or 5 is an appropriate value which
maximizes both credibility and resilience. The first properties is evaluated on 222
Java application downloaded by Internet, while the second one is tested on a single
program, Concilla, a tool designed to aid in organizing and exploring electornically
stored components of information. Likewise, Lu et al. [106] count opcode n-grams
extracted from the executable to categorize malware in order the extract a birthmark
from the binary executable file. The dynamic opcode n-gram software birthmark
proposed in this paper is based on Myles software birthmark in which static opcode
n-gram set is regarded as the software birthmark. They evaluated the solution using
a set of executable program: CI, Gzip, Ping, Notepad, and Md5.
In [133] authors retrieve the sequence and the frequency of API function usages.
Both features are obtained by listing the API function usages of target software.
As target software, they limited the type of software to those using API function
calls of Microsoft Windows. They used the function called “Windows hook” which
permitted them to observe message passings of GUI objects, keyboard and mouse. In
the method evaluation, authors concluded that the preliminary analysis showed that
74
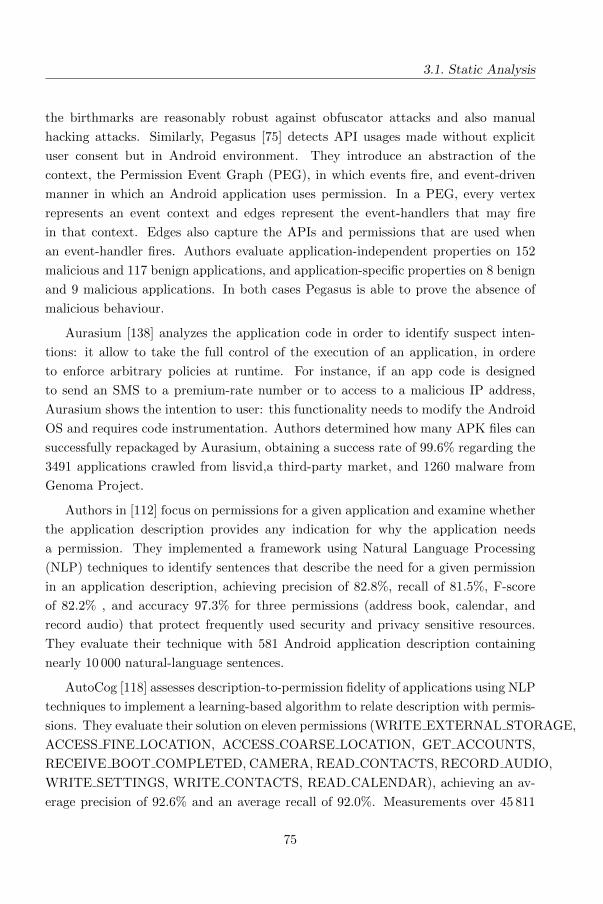
3.1. Static Analysis
the birthmarks are reasonably robust against obfuscator attacks and also manual
hacking attacks. Similarly, Pegasus [75] detects API usages made without explicit
user consent but in Android environment. They introduce an abstraction of the
context, the Permission Event Graph (PEG), in which events fire, and event-driven
manner in which an Android application uses permission. In a PEG, every vertex
represents an event context and edges represent the event-handlers that may fire
in that context. Edges also capture the APIs and permissions that are used when
an event-handler fires. Authors evaluate application-independent properties on 152
malicious and 117 benign applications, and application-specific properties on 8 benign
and 9 malicious applications. In both cases Pegasus is able to prove the absence of
malicious behaviour.
Aurasium [138] analyzes the application code in order to identify suspect inten-
tions: it allow to take the full control of the execution of an application, in ordere
to enforce arbitrary policies at runtime. For instance, if an app code is designed
to send an SMS to a premium-rate number or to access to a malicious IP address,
Aurasium shows the intention to user: this functionality needs to modify the Android
OS and requires code instrumentation. Authors determined how many APK files can
successfully repackaged by Aurasium, obtaining a success rate of 99.6% regarding the
3491 applications crawled from lisvid,a third-party market, and 1260 malware from
Genoma Project.
Authors in [112] focus on permissions for a given application and examine whether
the application description provides any indication for why the application needs
a permission. They implemented a framework using Natural Language Processing
(NLP) techniques to identify sentences that describe the need for a given permission
in an application description, achieving precision of 82.8%, recall of 81.5%, F-score
of 82.2% , and accuracy 97.3% for three permissions (address book, calendar, and
record audio) that protect frequently used security and privacy sensitive resources.
They evaluate their technique with 581 Android application description containing
nearly 10 000 natural-language sentences.
AutoCog [118] assesses description-to-permission fidelity of applications using NLP
techniques to implement a learning-based algorithm to relate description with permis-
sions. They evaluate their solution on eleven permissions (WRITE EXTERNAL STORAGE,
ACCESS FINE LOCATION, ACCESS COARSE LOCATION, GET ACCOUNTS,
RECEIVE BOOT COMPLETED, CAMERA, READ CONTACTS, RECORD AUDIO,
WRITE SETTINGS, WRITE CONTACTS, READ CALENDAR), achieving an av-
erage precision of 92.6% and an average recall of 92.0%. Measurements over 45 811
75
The State of the Art
applications demonstrate that the description-to-permissions fidelity is generally low
on Google Play with only 9.1% of applications having permissions that can all be in-
ferred from the descriptions. Moreover, they observe the negative correlation between
fidelity and application popularity.
3.2 Dynamic Analysis
There are several approaches which base mainly on system calls [96, 124, 134, 95, 126]
or only on other features [83, 100, 103, 98, 127, 69, 128, 72, 142, 85, 140, 139, 92].
3.2.1 Methods using mainly system calls
CopperDroid [124] recognizes malware through a system calls analysis using a cus-
tomized version of the Android emulator able to tracking system calls. Basing on
the observation that malicious behaviors are all achieved through the invocation of
system calls, CopperDroid is able to automatically describe low-level OS-specific and
high-level Android-specific behaviors of Android malware by observing and analyzing
system call invocations, including IPC and RPC interactions, carried out as system
calls underneath. In addiction CopperDroid is also able to stimulate the application
to disclosing malware behaviours. The method was validated on a set of 1600 ma-
licious apps, and was able to find the 60% of the malicious apps belonging to one
sample (the Genoma Project), and the 73% of the malicious apps included in the
second sample (the Contagio dataset).
The authors of [136] use an emulator to perform a similar task, proposing two sys-
tem call based software birthmarks: System Call Short Sequence Birthmark (SCSSB)
and Input Dependant System Call Subsequence Birthmark (IDSCSB). The aim of the
proposed birthmarks is to detect software component theft, evaluating them on a set of
large software (web browsers). To collect system calls authors implemented SATracer
tool, based on Valgrind (an open soure dynamic emulator), a syscalls recorder able to
run the program in its own emulation environment. It records the system call number
as well as the process and thread numbers when a system call is invoked. Experiment
results show that all the plagiarisms obfuscated by SandMark (a tool developed at
the University of Arizona for software watermarking, tamper-proofing, and code ob-
fuscation of Java bytecode that implements 39 byte code obfuscators) are successfully
discriminated.
Jeong et al. [96] hook system calls to create, read/write operations on files, and
intents activity to detect malicious behavior. Their technique hooks system calls and
76
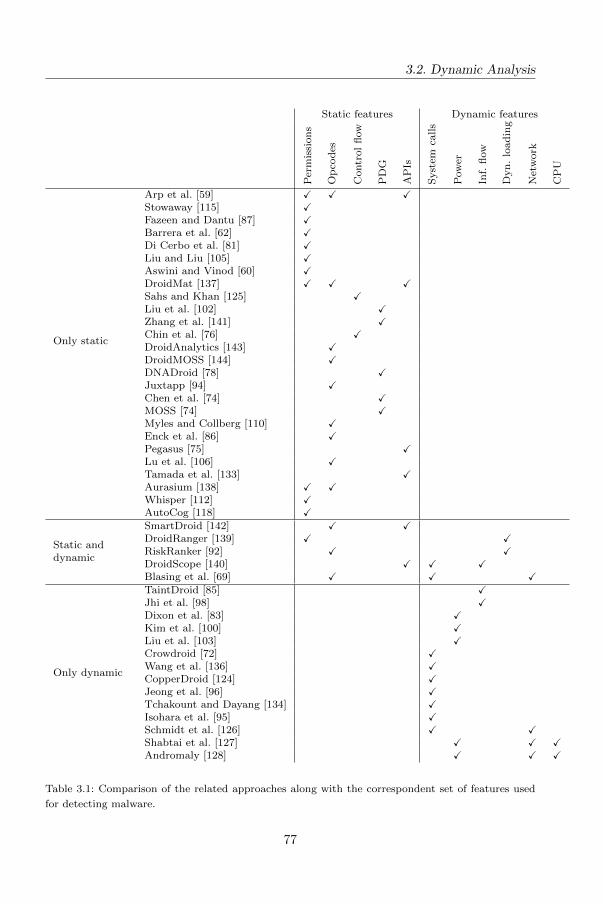
3.2. Dynamic Analysis
Static features Dynamic features
Per
mis
sion
s
Op
cod
es
Contr
ol
flow
PD
G
AP
Is
Syst
emca
lls
Pow
er
Inf.
flow
Dyn
.lo
ad
ing
Net
work
CP
U
Only static
Arp et al. [59] X X XStowaway [115] XFazeen and Dantu [87] XBarrera et al. [62] XDi Cerbo et al. [81] XLiu and Liu [105] XAswini and Vinod [60] XDroidMat [137] X X XSahs and Khan [125] XLiu et al. [102] XZhang et al. [141] XChin et al. [76] XDroidAnalytics [143] XDroidMOSS [144] XDNADroid [78] XJuxtapp [94] XChen et al. [74] XMOSS [74] XMyles and Collberg [110] XEnck et al. [86] XPegasus [75] XLu et al. [106] XTamada et al. [133] XAurasium [138] X XWhisper [112] XAutoCog [118] X
Static anddynamic
SmartDroid [142] X XDroidRanger [139] X XRiskRanker [92] X XDroidScope [140] X X XBlasing et al. [69] X X X
Only dynamic
TaintDroid [85] XJhi et al. [98] XDixon et al. [83] XKim et al. [100] XLiu et al. [103] XCrowdroid [72] XWang et al. [136] XCopperDroid [124] XJeong et al. [96] XTchakount and Dayang [134] XIsohara et al. [95] XSchmidt et al. [126] X XShabtai et al. [127] X X XAndromaly [128] X X X
Table 3.1: Comparison of the related approaches along with the correspondent set of features used
for detecting malware.
77
The State of the Art
a binder driver function in the Android kernel. In detail the proposed method consists
of two modules: the first one hooks a function of binder driver to monitor IPC/RPC
events and messages, while the second module hooks system calls to trace and log
the malicious behavior of a specific application. The technique hooks the system
calls and a binder driver function in the Android kernel using the Loadable Kernel
Module (LKM) programming interfaces and the Kprobes debugging mechanism. For
example, we can track and examine the flow of sensitive information by monitoring and
logging file I/O operations, InterProcess Communication (IPC)/Remote Procedure
Call (RPC) requests, and their messages. The authors used a customized kernel on a
real device, and the sample included 2 malicious apps developed by the authors.
In [134] the authors characterize the response of an application in terms of a subset
of system calls generated from bad activities in background when they stimulate
apps with user interfaces events. From authors point of view if an user clicks in
a region of mobile screen that is distinct to what the attacker programmed to lure
the user, attacker malicious events are triggered: they confirm that malwares may
not start automatically at the Kernel layer, they require the user to manually run
the infected application. They use an Android emulator for running experiments and
their evaluation is based on 2 malicious samples of DroidDream family (Super History
Eraser and Task Killer Pro).
Schmidt et al. [126] used the view from Linux-kernel such as network traffic, system
calls, and file system logs to detect anomalies in the Android system.The detection
mechanism they proposed is composed by five major task: (i) event perception, which
is done by an event sensor, (ii) system monitoring, to gain informations about some
system observables (features) when required. For each class of event authors provided
a monitoring module, (iii) detection, i.e. analyzing system features and assigning a
level of normality, done by the detector, (iv) learning, which the external server is
responsible for, and (v) collaboration, which is used in the absence of external server
or for reducing the load from the external server.
The method presented in [95] consists of an application log and a recorder of
a set of system calls related to management of file, I/O and processes. The log
collector records all system calls and filters events with the target application. The
log analyzer matches activities with signatures described by regular expressions to
detect a malicious activity. Here, signatures of information leakage are automatically
generated using the smartphone IDs, e.g., phone number, SIM serial number, and
Gmail accounts. Authors did not collected all syscalls but only those that from their
point of view are related to reveal malicious activities of application process, in order
78
3.2. Dynamic Analysis
to obtain helpful information from process management activity (syscall collected in
this category: clone, execve, fork, getuid, getuid32, geteuid, geteuid32) and file I/O
activity (syscalls collected in this category: accept, bind, connect, mkdir, open, read,
recv, rename, rmdir, send, stat, unlink, vfork, write). They use a physical device,
with an Android 2.1 based modified ROM image. The evaluation phase considers 230
applications in greater part downloaded from Google Play and the method detects 37
applications which steal some kinds of personal sensitive data, 14 applications which
execute exploit code and 13 destructive applications.
3.2.2 Methods using only other features
Dixon et al. [83], Kim et al. [100] and Liu et al. [103] consider the power consumption
as the distinguishable feature between benign and malicious applications. Authors
in [83] hypothesized that there is a strong correlation between smartphone power
consumption pattern and location. In their study power consumption data from
twenty smartphone users was collected over a period of three months. To study the
interrelationship between power consumption and user behavior, they develop two
applications, one for the Nokia N900 smartphone running Maemo Linux and the
other for Android smartphones.
Method proposed in reference [100] consists in a power-aware malware-detection
framework that monitors, detects, and analyzes previously unknown energy-depletion
threats. Their solution is composed of (1) a power monitor which collects power
samples and builds a power consumption history from the collected samples, and (2)
a data analyzer which generates a power signature from the constructed history. To
generate a power signature, simple and effective noise-filtering and data-compression
are applied, thus reducing the detection overhead. They conducted the experiment
using an HP iPAQ running a Windows Mobile OS.
Authors in [103] developed VirusMeter a tool to monitor power consumption on a
mobile device able to catch misbehaviors that lead to abnormal power consumption.
To do this VirusMeter monitors and audits power consumption on mobile devices
with a behavior-power model that characterizes power consumption of normal user
behaviors. Their assumption is based on the fact that mobile devivces are commonly
battery powerred and any malware activity on a mobile device will inevitably consume
battery power. They tested the method on a Nokia 5500 Sport to evaluate some real
cellphone malware.
The method of [100] produced 99% true positive rate but using a sample of 3
malicious apps for validation; the experimentation of [83, 103] did not evaluate the
79
The State of the Art
method performances.
Jhi et al. [98] introduce an approach to dynamic characterization of executable
programs using taint analysis. Authors consider the software plagiarisms problem in
the presence of automated obfuscators in which no source code of the suspect pro-
gram is available.: whole-program plagiarism, where the plagiarizer copies the whole
or majority of the plaintiff program and wraps it in a modified interface, and core-part
plagiarism, where the plagiarizer copies only a part such as a module or an engine of
the plaintiff program. Their experimental results show that the value-based method
successfully discriminates 34 plagiarisms obfuscated by SandMark, plagiarisms heavily
obfuscated by KlassMaster, programs obfuscated by Thicket, and executables obfus-
cated by Loco/Diablo.
Shabtai et al. [127] use the knowledge-based temporal abstraction (KBTA) method-
ology. They detect suspicious temporal patterns to decide whether an intrusion is
found, using patterns predefined by security experts. They use several features to do
this, like memory, CPU and power consumption, keyboard usage and so on. Eval-
uation results demonstrated the effectiveness in detecting malicious applications on
mobile devices (detection rate above 94% in most scenarios) with CPU consumption
of 3% on average on mobile devices. Their dataset was formed by five Android ma-
licious applications, which were developed from authors: (i)snake, while playing a
snake game, in the background the application is quietly taking picturs and sending
themoff to a remote server; (ii)tip calculator, that launches a background service that
in turn spawns hundreds of threads to effectively overload the system; (III)malware
inkection, which permits to a malware on a PC to secretly install a malicious software
on the Android which blocks outgoing phone calls; (iv)SD-card leackage, that reads
sensitive information stored on the SD-card and other locations and sends it ot a
remote server; (v)Lunar Lander & SMS scheduler, able to exploit the Shared-User-ID
and to read contacts and sending them via SMS.
Authors of [69] use a combination of static and dynamic techniques. They first
scan the code, then run the suspicious app in an Android sandbox which is a totally
monitored environment, catching all the events occurring in the sandbox such as files
open operations, connections to remote server. They use a loadable kernel module to
hijack all available system calls targeting for ARM architecture. They use an example
application to evalute their method, a fork bomb which uses Runtime.Exec() to start
an external binary program. The application creates subprocesses of itself in an
infinite loop. The intended behaviour is that the operating system is not responding
after a while. It represents an implementation of the so-called Denial of Service (Dos)
80
3.2. Dynamic Analysis
attack.
Shabtai et al. [128] propose with Andromaly a host-based malware detection sys-
tem which uses machine learning to classify normal and abnormal applications relying
on smartphones features and events occurring during the app running. The method
considers several metrics, like CPU consumption, number of sent packets through
wireless LAN, number of running processes and battery level. The authors obtained
a detection rate of 94%, but the apps used in the experimentation were ad-hoc devel-
oped by the authors.
Burguera et al. [72] use crowdsourcing to collect traces from multiple real users.
The detector is embedded in an overall framework.
SmartDroid [142] combines the static and dynamic analysis, to automatically re-
veal UI-based trigger conditions in Android applications. Static analysis generates
the activity call graph and function call graph from source code, whereas dynamic
analysis is applied to find the UI interaction paths towards sensitive APIs. The sample
employed in the validation included 6 real Android malicious apps.
TaintDroid [85] uses dynamic information flow tracking to detect sensitive data
leakage through the network. It requires to flash a custom-built firmware to run. The
dataset used for experimentation included 30 popular third-party Android applica-
tions, and the method was able to recognize 20 apps with potential misuse of users’
private information.
DroidScope [140] reconstructs semantic views to collect detailed execution traces
of applications. This approach requires a customized Android kernel. The authors
obtained a detection rate of 100%, but they analyzed only two Android malicious
apps.
DroidRanger [139] and RiskRanker [92] combine both static and dynamic analysis
to detect dangerous behaviors. Authors of [139] use a dataset of 204 040 apps from
five different markets, while authors of [92] use a sample of 118 318 apps taken from
15 different markets. The main purpose of these papers was to evaluate the infection
impact on real marketplaces rather than propose and assess a malware detection
technique.
In next table the comparison of the related approaches along with the correspon-
dent dataset involved in the experimentation and the performance obtained (when
available).
81
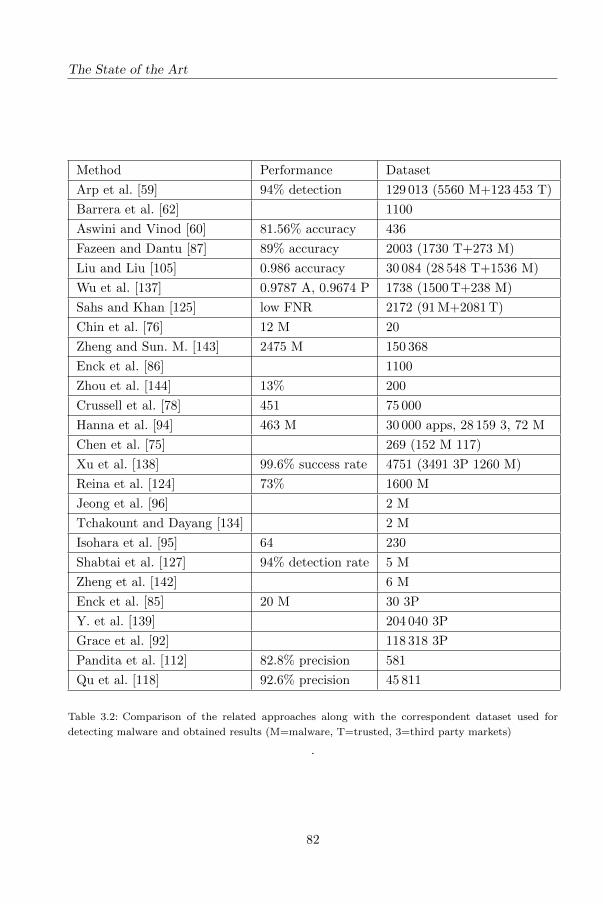
The State of the Art
Method Performance Dataset
Arp et al. [59] 94% detection 129 013 (5560 M+123 453 T)
Barrera et al. [62] 1100
Aswini and Vinod [60] 81.56% accuracy 436
Fazeen and Dantu [87] 89% accuracy 2003 (1730 T+273 M)
Liu and Liu [105] 0.986 accuracy 30 084 (28 548 T+1536 M)
Wu et al. [137] 0.9787 A, 0.9674 P 1738 (1500 T+238 M)
Sahs and Khan [125] low FNR 2172 (91 M+2081 T)
Chin et al. [76] 12 M 20
Zheng and Sun. M. [143] 2475 M 150 368
Enck et al. [86] 1100
Zhou et al. [144] 13% 200
Crussell et al. [78] 451 75 000
Hanna et al. [94] 463 M 30 000 apps, 28 159 3, 72 M
Chen et al. [75] 269 (152 M 117)
Xu et al. [138] 99.6% success rate 4751 (3491 3P 1260 M)
Reina et al. [124] 73% 1600 M
Jeong et al. [96] 2 M
Tchakount and Dayang [134] 2 M
Isohara et al. [95] 64 230
Shabtai et al. [127] 94% detection rate 5 M
Zheng et al. [142] 6 M
Enck et al. [85] 20 M 30 3P
Y. et al. [139] 204 040 3P
Grace et al. [92] 118 318 3P
Pandita et al. [112] 82.8% precision 581
Qu et al. [118] 92.6% precision 45 811
Table 3.2: Comparison of the related approaches along with the correspondent dataset used for
detecting malware and obtained results (M=malware, T=trusted, 3=third party markets)
.
82
Chapter 4
The Static approaches
In this chapter we show the proposed approaches using static analysis. Starting from a
baseline permissions-based between trusted and malware applications (the reason why
we choose this features is that most of tecniques mentioned in the previous chapter use
this features to discriminate between trusted and malware applications). We extracted
from our dataset permissions in order to understand how the proposed methods differ
from the baseline. We recall here that we use the same dataset in order to evaluate
each proposed techniques and the baseline. The techniques are explained in the
same temporal order in which they were tested. We tested following static features:
a) permissions, b) opcode occurrences, c) opcode ngram, d) structural entropy. We
use machine learning techniques in order to evalute the features extracted, obtaining
an accuracy range from 0.9 with the baseline to 0.97 using dynamic features.
83
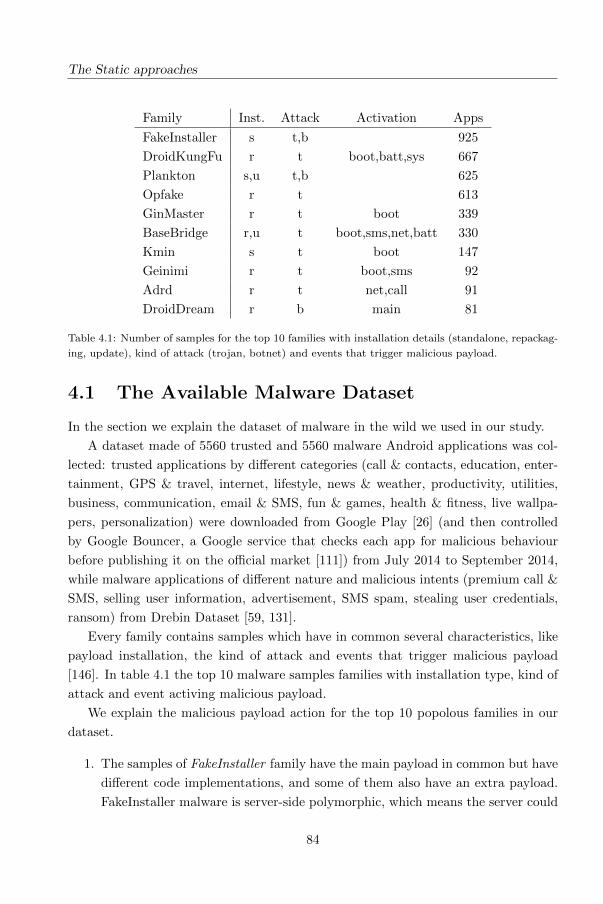
The Static approaches
Family Inst. Attack Activation Apps
FakeInstaller s t,b 925
DroidKungFu r t boot,batt,sys 667
Plankton s,u t,b 625
Opfake r t 613
GinMaster r t boot 339
BaseBridge r,u t boot,sms,net,batt 330
Kmin s t boot 147
Geinimi r t boot,sms 92
Adrd r t net,call 91
DroidDream r b main 81
Table 4.1: Number of samples for the top 10 families with installation details (standalone, repackag-
ing, update), kind of attack (trojan, botnet) and events that trigger malicious payload.
4.1 The Available Malware Dataset
In the section we explain the dataset of malware in the wild we used in our study.
A dataset made of 5560 trusted and 5560 malware Android applications was col-
lected: trusted applications by different categories (call & contacts, education, enter-
tainment, GPS & travel, internet, lifestyle, news & weather, productivity, utilities,
business, communication, email & SMS, fun & games, health & fitness, live wallpa-
pers, personalization) were downloaded from Google Play [26] (and then controlled
by Google Bouncer, a Google service that checks each app for malicious behaviour
before publishing it on the official market [111]) from July 2014 to September 2014,
while malware applications of different nature and malicious intents (premium call &
SMS, selling user information, advertisement, SMS spam, stealing user credentials,
ransom) from Drebin Dataset [59, 131].
Every family contains samples which have in common several characteristics, like
payload installation, the kind of attack and events that trigger malicious payload
[146]. In table 4.1 the top 10 malware samples families with installation type, kind of
attack and event activing malicious payload.
We explain the malicious payload action for the top 10 popolous families in our
dataset.
1. The samples of FakeInstaller family have the main payload in common but have
different code implementations, and some of them also have an extra payload.
FakeInstaller malware is server-side polymorphic, which means the server could
84
4.1. The Available Malware Dataset
provide different .apk files for the same URL request. There are variants of
FakeInstaller that not only send SMS messages to premium rate numbers, but
also include a backdoor to receive commands from a remote server. There is
a large number of variants for this family, and it has distributed in hundreds
of websites and alternative markets. The members of this family hide their
malicious code inside repackaged version of popular applications. During the
installation process the malware sends expensive SMS messages to premium
services owned by the malware authors.
2. DroidKungFu installs a backdoor that allows attackers to access the smartphone
when they want and use it as they please. They could even turn it into a bot.
This malware encrypts two known root exploits, exploit and rage against the
cage, to break out of the Android security container. When it runs, it decrypts
these exploits and then contacts a remote server without the user knowing.
3. Plankton uses an available native functionality (i.e., class loading) to forward
details like IMEI and browser history to a remote server. It is present in a wide
number of versions as harmful adware that download unwanted advertisements
and it changes the browser homepage or add unwanted bookmarks to it.
4. The Opfake samples make use of an algorithm that can change shape over time
so to evade the antimalware. The Opfake malware demands payment for the
application content through premium text messages. This family represents an
example of polymorphic malware in Android environment: it is written with
an algorithm that can change shape over time so to evade any detection by
signature based antimalware.
5. GinMaster family contains a malicious service with the ability to root devices to
escalate privileges, steal confidential information and send to a remote website,
as well as install applications without user interaction. It is also a trojan applica-
tion and similarly to the DroidKungFu family the malware starts its malicious
services as soon as it receives a BOOT COMPLETED or USER PRESENT
intent. The malware can successfully avoid detection by mobile anti-virus soft-
ware by using polymorphic techniques to hide malicious code, obfuscating class
names for each infected object, and randomizing package names and self-signed
certificates for applications.
6. BaseBridge malware sends information to a remote server running one ore more
malicious services in background, like IMEI, IMSI and other files to premium-
85
The Static approaches
rate numbers. BaseBridge malware is able to obtain the permissions to use
Internet and to kill the processes of antimalware application in background.
7. Kmin malware is similar to BaseBridge, but does not kill antimalware processes.
8. Geinimi is the first Android malware in the wild that displays botnet-like capa-
bilities. Once the malware is installed, it has the potential to receive commands
from a remote server that allows the owner of that server to control the phone.
Geinimi makes use of a bytecode obfuscator. The malware belonging to this
family is able to read, collect, delete SMS, send contact informations to a re-
mote server, make phone call silently and also launch a web browser to a specific
URL to start files download.
9. Adrd family is very close to Geinimi but with less server side commands, it
also compromises personal data such as IMEI and IMSI of infected device. In
addiction to Geinimi, this one is able to modify device settings.
10. DroidDream is another example of botnet, it gained root access to device to
access unique identification information. This malware could also downloads
additional malicious programs without the user’s knowledge as well as open the
phone up to control by hackers. The name derives from the fact that it was set
up to run between the hours of 11pm and 8am when users were most likely to
be sleeping and their phones less likely to be in use.
4.2 The baseline: permission analysis
In order to provide a baseline, we designed and evaluated a detection method based
on application permissions. As discussed in chapters 2 and 3, permissions have been
shown to be a relevant feature for the purpose of discriminating between malware and
non-malware applications [59, 115, 105, 60, 73, 137, 81, 62].
In particular, in the baseline method we build a feature vector f for each applica-
tion where an element fi is 1 or 0, depending on the respective ith permission being
declared for that application. The list of all the permissions (and hence the length of
the feature vectors) is determined once in the training phase. The remaining part of
the baseline method is the same as in the proposed method: two steps feature selec-
tion, SVM training and actual classification using the trained SVM on the selected
features.
Table 4.2 shows baseline results.
Best accuracy (90.6) is obtained using k=750.
86
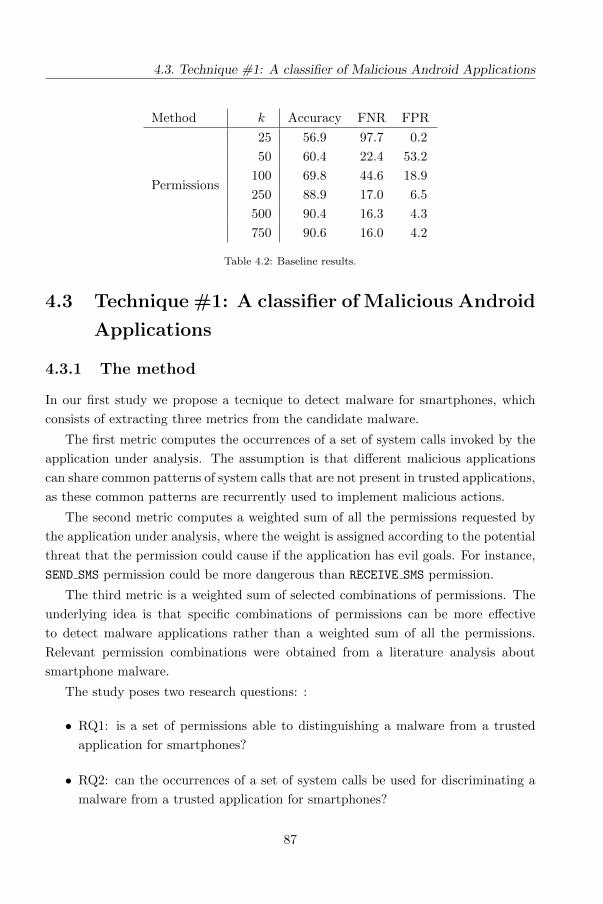
4.3. Technique #1: A classifier of Malicious Android Applications
Method k Accuracy FNR FPR
Permissions
25 56.9 97.7 0.2
50 60.4 22.4 53.2
100 69.8 44.6 18.9
250 88.9 17.0 6.5
500 90.4 16.3 4.3
750 90.6 16.0 4.2
Table 4.2: Baseline results.
4.3 Technique #1: A classifier of Malicious Android
Applications
4.3.1 The method
In our first study we propose a tecnique to detect malware for smartphones, which
consists of extracting three metrics from the candidate malware.
The first metric computes the occurrences of a set of system calls invoked by the
application under analysis. The assumption is that different malicious applications
can share common patterns of system calls that are not present in trusted applications,
as these common patterns are recurrently used to implement malicious actions.
The second metric computes a weighted sum of all the permissions requested by
the application under analysis, where the weight is assigned according to the potential
threat that the permission could cause if the application has evil goals. For instance,
SEND SMS permission could be more dangerous than RECEIVE SMS permission.
The third metric is a weighted sum of selected combinations of permissions. The
underlying idea is that specific combinations of permissions can be more effective
to detect malware applications rather than a weighted sum of all the permissions.
Relevant permission combinations were obtained from a literature analysis about
smartphone malware.
The study poses two research questions: :
• RQ1: is a set of permissions able to distinguishing a malware from a trusted
application for smartphones?
• RQ2: can the occurrences of a set of system calls be used for discriminating a
malware from a trusted application for smartphones?
87
The Static approaches
4.3.2 The proposed features
The proposed tecnique is designed for extracting two classes of features from a smart-
phone application: invoked system calls and permissions that the application under
analysis requires.
A Linux Kernel has more than 250 system calls identified by a number that can be
retrieved by the table of the system calls in the kernel. By capturing and analyzing
the system calls that go through the system call interface (glibc), it is possible to get
accurate information with regards to the behavior of the application.
Given the high number of system calls, we capture a reduced number of calls
that are thought as the ones that could be recurrently used for malicious purposes.
The set of the system calls considered is related to the management of the processes
(creation, binaries execution, and termination of processes) and to I/O operations
(creation, elimination, writing and reading of file objects).
The first metric that we compute, named syscall, counts the occurrence of each
system call in the reduced set of system calls we considered.
The other two metrics regard the permissions requested by the application, and
are:
• sumperm, which is a weighted sum of a subset of permissions, i.e.:
sumperm =∑N
i=1 pi ∗ wi
where: pi is 1 if the i-th permission in table 4.3 is claimed, 0 otherwise, and wi is
the weight assigned to the permission pi.
• risklevel, which is a weighted sum over specific combinations of permissions,
shown in table 4.4.
In table 4.3, the highest weight (3) is assigned to those permissions that are con-
sidered more dangerous for privacy of security, such as: RECEIVE BOOT COMPLETED,
which can be used for launching malware installer, KILL BACKGROUND PROCESS fre-
quently employed by command and control tools, CALL PHONE which can be used to
start phone calls without the consensus of the smartphone’s owner, and INTERNET,
which can be used for connecting to the net and can allow the malware to perform
malicious actions (send recorded conversations to a drop server, for instance).
The risklevel is obtained by enumerating specific combinations of permissions that
could be a proxy of a malicious intent in the application. The combinations listed in
table 4.4 are derived based on simple heuristics built by analyzing the features of the
88
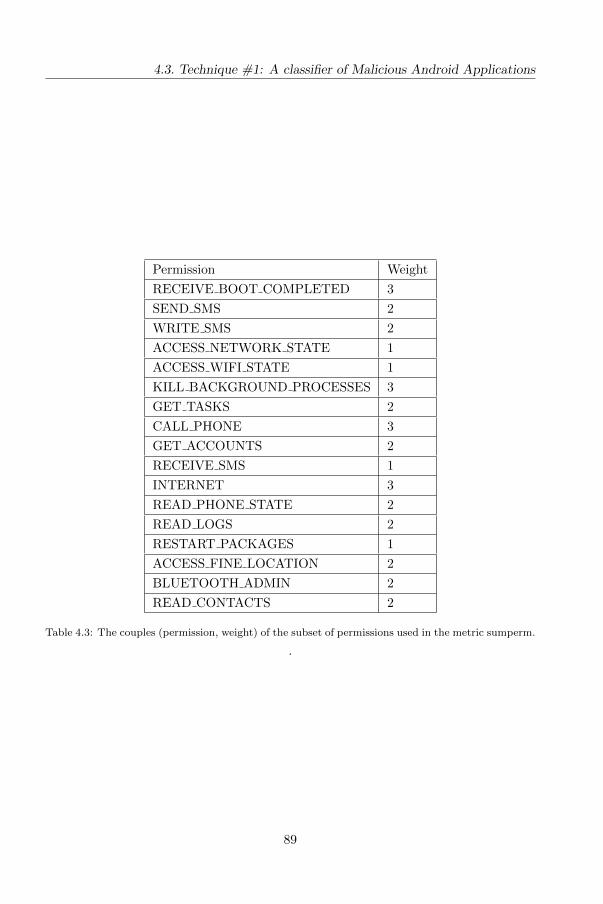
4.3. Technique #1: A classifier of Malicious Android Applications
Permission Weight
RECEIVE BOOT COMPLETED 3
SEND SMS 2
WRITE SMS 2
ACCESS NETWORK STATE 1
ACCESS WIFI STATE 1
KILL BACKGROUND PROCESSES 3
GET TASKS 2
CALL PHONE 3
GET ACCOUNTS 2
RECEIVE SMS 1
INTERNET 3
READ PHONE STATE 2
READ LOGS 2
RESTART PACKAGES 1
ACCESS FINE LOCATION 2
BLUETOOTH ADMIN 2
READ CONTACTS 2
Table 4.3: The couples (permission, weight) of the subset of permissions used in the metric sumperm.
.
89
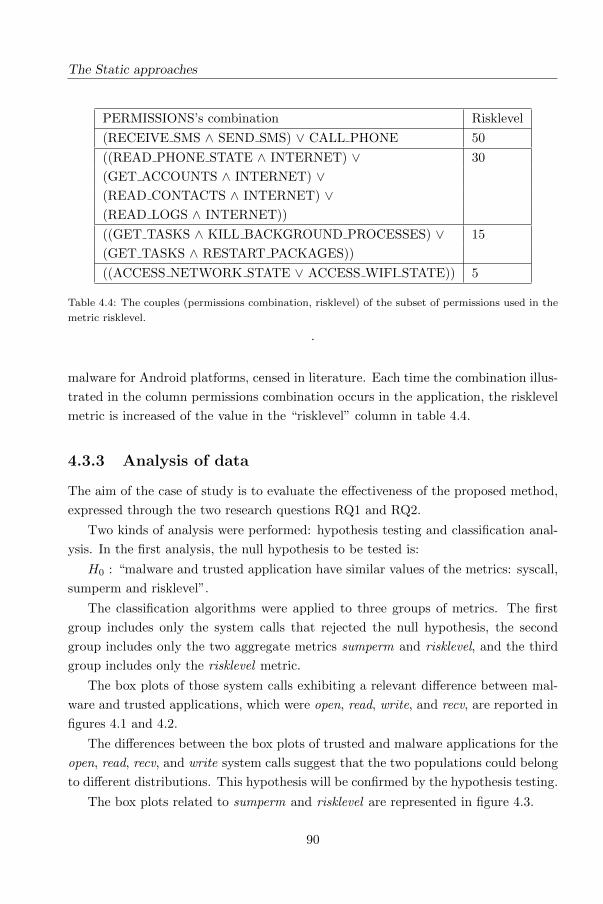
The Static approaches
PERMISSIONS’s combination Risklevel
(RECEIVE SMS ∧ SEND SMS) ∨ CALL PHONE 50
((READ PHONE STATE ∧ INTERNET) ∨ 30
(GET ACCOUNTS ∧ INTERNET) ∨(READ CONTACTS ∧ INTERNET) ∨(READ LOGS ∧ INTERNET))
((GET TASKS ∧ KILL BACKGROUND PROCESSES) ∨ 15
(GET TASKS ∧ RESTART PACKAGES))
((ACCESS NETWORK STATE ∨ ACCESS WIFI STATE)) 5
Table 4.4: The couples (permissions combination, risklevel) of the subset of permissions used in the
metric risklevel.
.
malware for Android platforms, censed in literature. Each time the combination illus-
trated in the column permissions combination occurs in the application, the risklevel
metric is increased of the value in the “risklevel” column in table 4.4.
4.3.3 Analysis of data
The aim of the case of study is to evaluate the effectiveness of the proposed method,
expressed through the two research questions RQ1 and RQ2.
Two kinds of analysis were performed: hypothesis testing and classification anal-
ysis. In the first analysis, the null hypothesis to be tested is:
H0 : “malware and trusted application have similar values of the metrics: syscall,
sumperm and risklevel”.
The classification algorithms were applied to three groups of metrics. The first
group includes only the system calls that rejected the null hypothesis, the second
group includes only the two aggregate metrics sumperm and risklevel, and the third
group includes only the risklevel metric.
The box plots of those system calls exhibiting a relevant difference between mal-
ware and trusted applications, which were open, read, write, and recv, are reported in
figures 4.1 and 4.2.
The differences between the box plots of trusted and malware applications for the
open, read, recv, and write system calls suggest that the two populations could belong
to different distributions. This hypothesis will be confirmed by the hypothesis testing.
The box plots related to sumperm and risklevel are represented in figure 4.3.
90
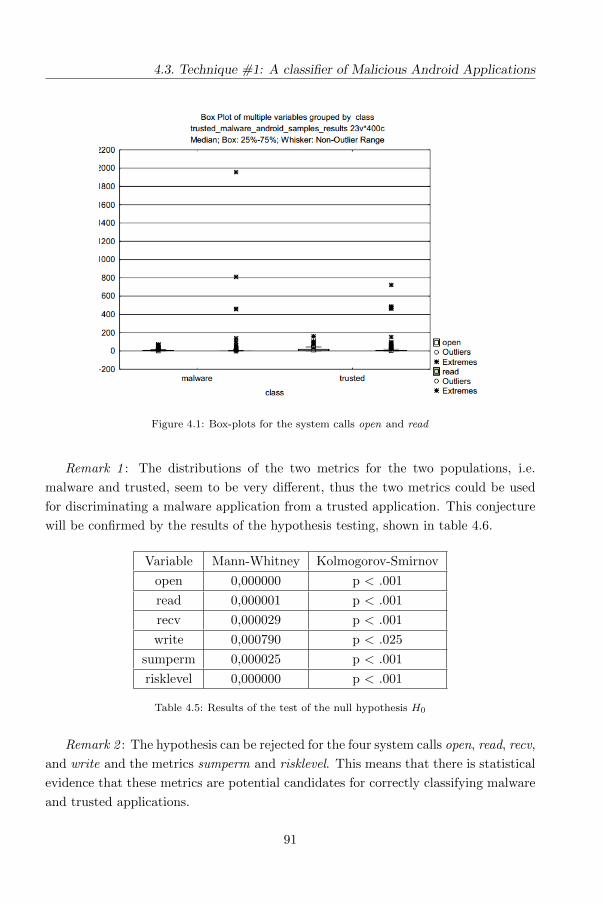
4.3. Technique #1: A classifier of Malicious Android Applications
Figure 4.1: Box-plots for the system calls open and read
Remark 1 : The distributions of the two metrics for the two populations, i.e.
malware and trusted, seem to be very different, thus the two metrics could be used
for discriminating a malware application from a trusted application. This conjecture
will be confirmed by the results of the hypothesis testing, shown in table 4.6.
Variable Mann-Whitney Kolmogorov-Smirnov
open 0,000000 p < .001
read 0,000001 p < .001
recv 0,000029 p < .001
write 0,000790 p < .025
sumperm 0,000025 p < .001
risklevel 0,000000 p < .001
Table 4.5: Results of the test of the null hypothesis H0
Remark 2 : The hypothesis can be rejected for the four system calls open, read, recv,
and write and the metrics sumperm and risklevel. This means that there is statistical
evidence that these metrics are potential candidates for correctly classifying malware
and trusted applications.
91
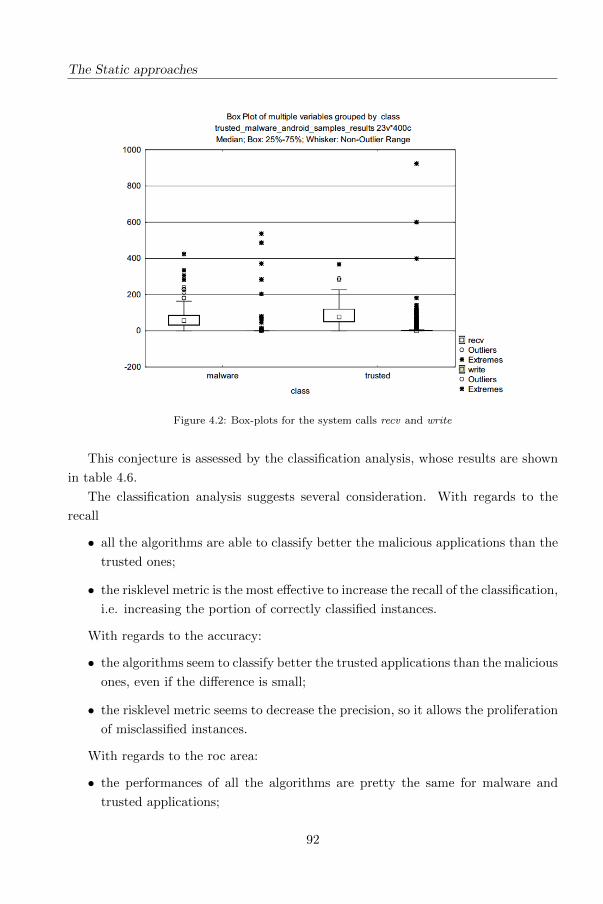
The Static approaches
Figure 4.2: Box-plots for the system calls recv and write
This conjecture is assessed by the classification analysis, whose results are shown
in table 4.6.
The classification analysis suggests several consideration. With regards to the
recall
• all the algorithms are able to classify better the malicious applications than the
trusted ones;
• the risklevel metric is the most effective to increase the recall of the classification,
i.e. increasing the portion of correctly classified instances.
With regards to the accuracy:
• the algorithms seem to classify better the trusted applications than the malicious
ones, even if the difference is small;
• the risklevel metric seems to decrease the precision, so it allows the proliferation
of misclassified instances.
With regards to the roc area:
• the performances of all the algorithms are pretty the same for malware and
trusted applications;
92
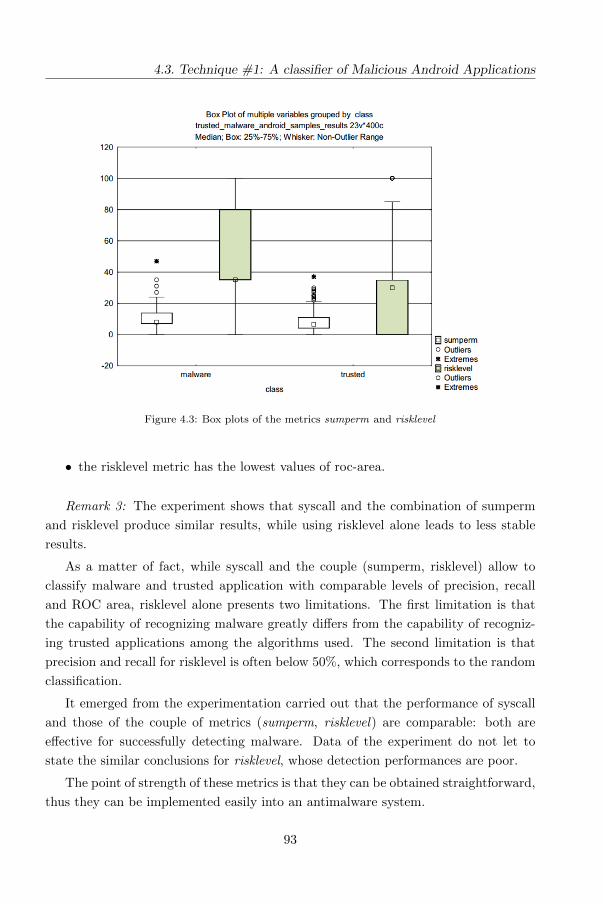
4.3. Technique #1: A classifier of Malicious Android Applications
Figure 4.3: Box plots of the metrics sumperm and risklevel
• the risklevel metric has the lowest values of roc-area.
Remark 3: The experiment shows that syscall and the combination of sumperm
and risklevel produce similar results, while using risklevel alone leads to less stable
results.
As a matter of fact, while syscall and the couple (sumperm, risklevel) allow to
classify malware and trusted application with comparable levels of precision, recall
and ROC area, risklevel alone presents two limitations. The first limitation is that
the capability of recognizing malware greatly differs from the capability of recogniz-
ing trusted applications among the algorithms used. The second limitation is that
precision and recall for risklevel is often below 50%, which corresponds to the random
classification.
It emerged from the experimentation carried out that the performance of syscall
and those of the couple of metrics (sumperm, risklevel) are comparable: both are
effective for successfully detecting malware. Data of the experiment do not let to
state the similar conclusions for risklevel, whose detection performances are poor.
The point of strength of these metrics is that they can be obtained straightforward,
thus they can be implemented easily into an antimalware system.
93
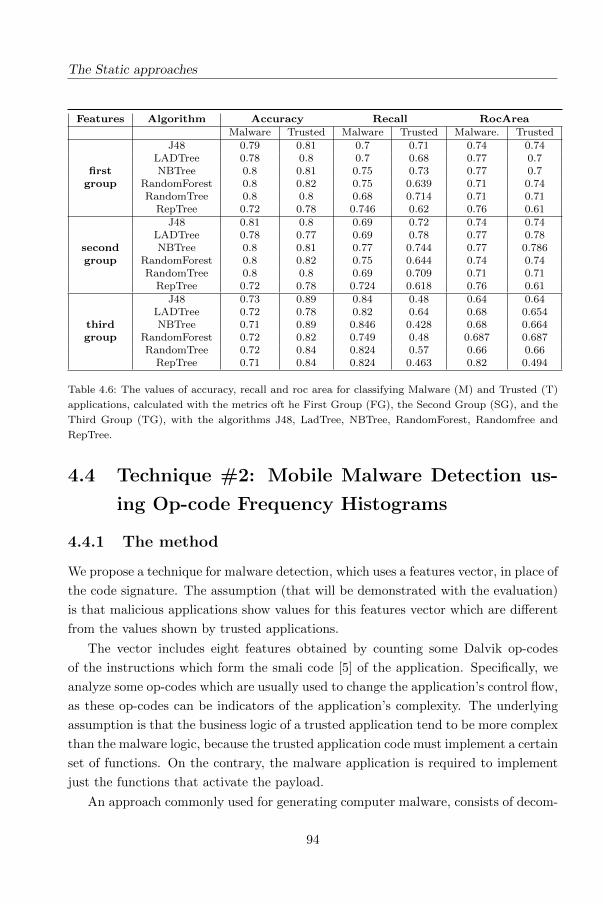
The Static approaches
Features Algorithm Accuracy Recall RocArea
Malware Trusted Malware Trusted Malware. TrustedJ48 0.79 0.81 0.7 0.71 0.74 0.74
LADTree 0.78 0.8 0.7 0.68 0.77 0.7first NBTree 0.8 0.81 0.75 0.73 0.77 0.7
group RandomForest 0.8 0.82 0.75 0.639 0.71 0.74RandomTree 0.8 0.8 0.68 0.714 0.71 0.71
RepTree 0.72 0.78 0.746 0.62 0.76 0.61J48 0.81 0.8 0.69 0.72 0.74 0.74
LADTree 0.78 0.77 0.69 0.78 0.77 0.78second NBTree 0.8 0.81 0.77 0.744 0.77 0.786group RandomForest 0.8 0.82 0.75 0.644 0.74 0.74
RandomTree 0.8 0.8 0.69 0.709 0.71 0.71RepTree 0.72 0.78 0.724 0.618 0.76 0.61
J48 0.73 0.89 0.84 0.48 0.64 0.64LADTree 0.72 0.78 0.82 0.64 0.68 0.654
third NBTree 0.71 0.89 0.846 0.428 0.68 0.664group RandomForest 0.72 0.82 0.749 0.48 0.687 0.687
RandomTree 0.72 0.84 0.824 0.57 0.66 0.66RepTree 0.71 0.84 0.824 0.463 0.82 0.494
Table 4.6: The values of accuracy, recall and roc area for classifying Malware (M) and Trusted (T)
applications, calculated with the metrics oft he First Group (FG), the Second Group (SG), and the
Third Group (TG), with the algorithms J48, LadTree, NBTree, RandomForest, Randomfree and
RepTree.
4.4 Technique #2: Mobile Malware Detection us-
ing Op-code Frequency Histograms
4.4.1 The method
We propose a technique for malware detection, which uses a features vector, in place of
the code signature. The assumption (that will be demonstrated with the evaluation)
is that malicious applications show values for this features vector which are different
from the values shown by trusted applications.
The vector includes eight features obtained by counting some Dalvik op-codes
of the instructions which form the smali code [5] of the application. Specifically, we
analyze some op-codes which are usually used to change the application’s control flow,
as these op-codes can be indicators of the application’s complexity. The underlying
assumption is that the business logic of a trusted application tend to be more complex
than the malware logic, because the trusted application code must implement a certain
set of functions. On the contrary, the malware application is required to implement
just the functions that activate the payload.
An approach commonly used for generating computer malware, consists of decom-
94
4.4. Technique #2: Mobile Malware Detection using Op-code Frequency Histograms
posing the control flow in smaller procedures to be called in a certain order, instead
of following the original flow [61, 65]. This technique is called ‘fragmentation’, and
is intended to circumvent signature based antivirus or those kinds of antivirus which
attempt to analyze the control flow for detecting malware.
The first six features aim at characterizing the fragmentation of the control flow,
and compute, respectively, the number of the “move”, the “jump”, the “packed-
switch”, the “sparse- switch”, the “invoke” and the “if” op-codes, singly taken, divided
by the overall sum of the occurrences of all these six Dalvik op-codes.
The last two features are based on another assumption. The classes of a trusted
application tend to exhibit an intrinsic variability, because each class is designed to
implement a specific part of the business logic of the overall application. Such a
variability should be reflected in the distribution of the op-codes, so the same op-code
should occur with different frequencies in different classes. Conversely, as the malware
has not an articulated business logic except for the malicious payload, this difference
among its classes tend to be less evident than in trusted applications. For evaluating
such a difference in op-codes distribution among the different classes forming the final
application we use two features, which are two variants of the Minkowski distance
[119]: the first one is represented by the Manhattan distance, the second one by the
Euclidean distance. All the features are used to build a classifier which is then used to
discriminate an Android malware from a trusted Android application. An advantage
of using a classifier, removes the need to continuously collect malware signatures.
However, this requires a sample of malware and a sample of trusted applications for
training the classifier. Of course, the training can be run with new samples after
a certain period of usage, in order to improve the accuracy and make the classifier
robust with respect to the new families of malware that arise over time.
The study poses two research questions:
• RQ1: are the features extracted able to distinguish a malware from a trusted
application for Android platform?
• RQ2: is a combination of the features more effective than a single feature to
distinguish an Android malware from a trusted application?
The main contribution of this study can be resumed in the following points:
• we provide a set of features that have been never applied to the detection of
Android malware;
• the set of features consists of occurrence frequency of some specific op-codes, so
95
The Static approaches
the extraction of such features is easy to reproduce and does not require a great
use of resources;
• we discuss extensive experimentation that shows how our detection technique
is very effective in terms of accuracy and recall.
4.4.2 The proposed features
We classify malware using a set of features which count the occurrences of a specific
group of op-codes extracted from the smali Dalvik code of the application under
analysis (i.e., the AUA). Smali is a language that represents disassembled code for
the Dalvik Virtual Machine [4], a virtual machine optimized for the hardware of
mobile devices.
We produce the histograms of a set of op-codes occurring in the AUA: each his-
togram dimension represents the number of times the op-code corresponding to that
dimension appears in the code. The collected op-codes have been chosen because they
are representative of the alteration of the control flow. The underlying assumption
is that a trusted application tend to have a greater complexity than a malicious one.
We consider 6 op-codes:
• “Move”: which moves the content of one register into another one.
• “Jump”: which deviates the control flow to a new instruction based on the value
in a specific register.
• “Packed-Switch”: which represents a switch statement. The instruction uses an
index table.
• “Sparse-Switch”: which implements a switch statement with sparse case table,
the difference with the previous switch is that it uses a lookup table.
• “Invoke”: which is used to invoke a method, it may accept one or more param-
eters.
• “If”: which is a Jump conditioned by the verification of a truth predicate.
In order to compute the set of features, we follow two steps. The first step consists
of preprocessing the AUA: we prepare the input data in form of histograms. It is worth
observing that the histogram dissimilarity has been already applied with success in
malware detection in [119, 120].
96
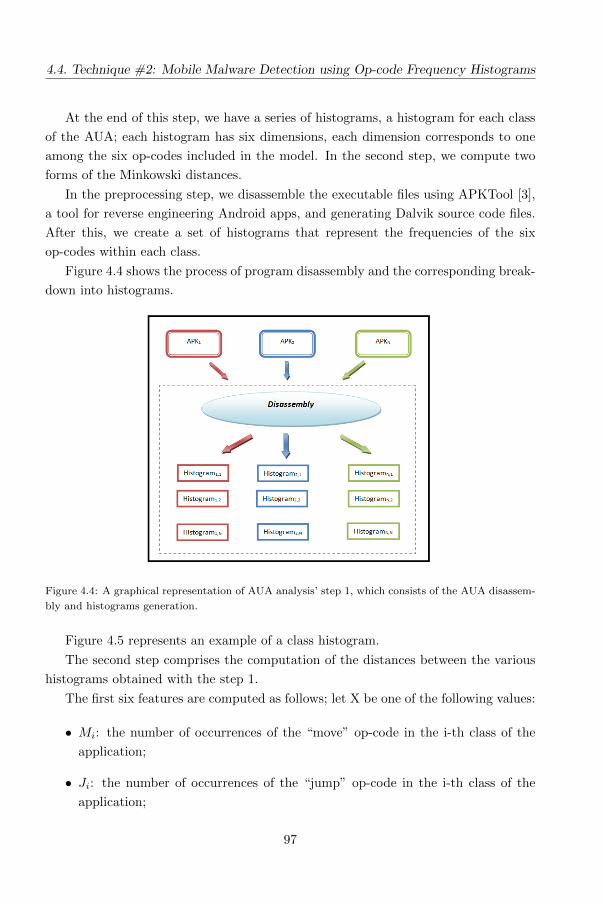
4.4. Technique #2: Mobile Malware Detection using Op-code Frequency Histograms
At the end of this step, we have a series of histograms, a histogram for each class
of the AUA; each histogram has six dimensions, each dimension corresponds to one
among the six op-codes included in the model. In the second step, we compute two
forms of the Minkowski distances.
In the preprocessing step, we disassemble the executable files using APKTool [3],
a tool for reverse engineering Android apps, and generating Dalvik source code files.
After this, we create a set of histograms that represent the frequencies of the six
op-codes within each class.
Figure 4.4 shows the process of program disassembly and the corresponding break-
down into histograms.
Figure 4.4: A graphical representation of AUA analysis’ step 1, which consists of the AUA disassem-
bly and histograms generation.
Figure 4.5 represents an example of a class histogram.
The second step comprises the computation of the distances between the various
histograms obtained with the step 1.
The first six features are computed as follows; let X be one of the following values:
• Mi: the number of occurrences of the “move” op-code in the i-th class of the
application;
• Ji: the number of occurrences of the “jump” op-code in the i-th class of the
application;
97
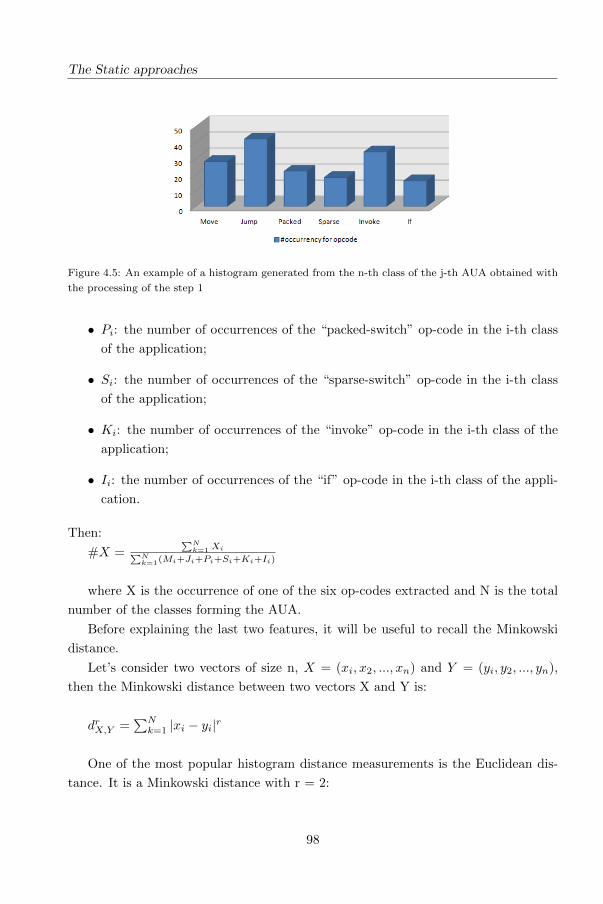
The Static approaches
Figure 4.5: An example of a histogram generated from the n-th class of the j-th AUA obtained with
the processing of the step 1
• Pi: the number of occurrences of the “packed-switch” op-code in the i-th class
of the application;
• Si: the number of occurrences of the “sparse-switch” op-code in the i-th class
of the application;
• Ki: the number of occurrences of the “invoke” op-code in the i-th class of the
application;
• Ii: the number of occurrences of the “if” op-code in the i-th class of the appli-
cation.
Then:
#X =∑N
k=1 Xi∑Nk=1(Mi+Ji+Pi+Si+Ki+Ii)
where X is the occurrence of one of the six op-codes extracted and N is the total
number of the classes forming the AUA.
Before explaining the last two features, it will be useful to recall the Minkowski
distance.
Let’s consider two vectors of size n, X = (xi, x2, ..., xn) and Y = (yi, y2, ..., yn),
then the Minkowski distance between two vectors X and Y is:
drX,Y =∑N
k=1 |xi − yi|r
One of the most popular histogram distance measurements is the Euclidean dis-
tance. It is a Minkowski distance with r = 2:
98
4.4. Technique #2: Mobile Malware Detection using Op-code Frequency Histograms
dEX,Y =√∑N
k=1(xi − yi)2
Another popular histogram distance measurement is Manhattan distance. Even
the Manhattan distance is a form of the Minkowski distance, in this case r = 1:
dMX,Y =∑N
k=1 |xi − yi|
The last two features are Manhattan and Euclidean distance, computed with a
process of three steps. Given an AUA containing N classes, the AUA will have N
histograms, one for each class, where each histograms Hi will be a vector of six values,
each one corresponding to an op-code of the model (“move”, “jump”, “packed-switch”,
“sparse-switch”, “invoke”, “if”).
As an example, we will show an application of the model to a simplified case,
in which the model has only three classes and two op-codes. Let’s assume that the
AUA’s histograms are H1= {4,2}, H2={2,1}, H3={5,9}.
• Step1 : the Minkowski distance is computed among each pair Hi, Hj with i 6=j
and 1≤i,j≤N. In the example we will have d1,2=3; d1,3=2; d2,3=11.We do not
compute d2,1, d3,1 and d3,2 because Minkowski distance is symmetric, i.e. di,j
= dj,i for 1≤i,j≤N. For simplicity we consider only the Manhattan distance in
the example;
• Step 2 : the vector with all the distances is computed for each AUA, D= {di,j— i6=j and 1≤i≤ N, 2≤j≤ N}. Each dimension of the vector corresponds to a
class of the AUA. In the example D ={3, 2, 11}.
• Step 3 : the max element in the vector is extracted, which is MAUA = MAX
(D[i]). In the example MAUA is 11.
Finally the last two features are the values MAUA computed, respectively, with Man-
hattan and Euclidean distance. Thus, MAUA is a measure of dissimilarity among the
classes of the AUA.
4.4.3 The evaluation
For the sake of clarity, the results of our evaluation will be discussed reflecting the
data analysis’ division in three phases: descriptive statistics, hypotheses testing and
classification.
99
The Static approaches
Descriptive statistics
The analysis of box plots (shown in figure 4.6) related to the eight features helps to
identify the features more effective to discriminate malware from trusted applications.
The differences between the box plots of malware and trusted applications for the
“move” and “jump” features suggest that the two populations could belong to different
distributions. A huge part of the trusted sample (between the second and the third
quartile) has values greater than the 75% of the malware sample for this couple of
features. The reason may reside, as conjectured in the introduction, in the fact that in
trusted applications these op-codes are used for implementing a certain business logic
(whose complexity may vary a lot), while in the malware they can be only employed
basically for code fragmentation.
This hypothesis will be confirmed by the hypothesis testing, as discussed later.
The distributions of “sparse-switch” and “packed-switch” op-codes seem to show a
difference in the two samples, too, which is more relevant for the “sparse-switch” box
plots. This evidence strengthens the starting assumption of the study, that will be
confirmed by the results of the hypotheses testing. Switch constructs are frequently
used for implementing the business logic of remote control (command and control
malware are very widespread) of a victim device, or the selection cretira for activating
the payload.
Instead, the box plots related to the features “invoke” and “if” do not produce
significant differences between malware and trusted samples.
Finally, the differences between the box plots of trusted applications and malware
for the Manhattan and the Euclidean distance are much more pronounced than the
previous cases, suggesting that the two populations could belong to different distri-
butions. It is interesting to observe how in both the cases the third percentile of the
malware sample is lower than the first percentile of the trusted sample.
The very tight box plots of the distances for malware, especially the one associated
to the Manhattan distance, confirm the assumption that malware code has a lower
variability (in terms of business logic) than trusted applications.
100
4.4. Technique #2: Mobile Malware Detection using Op-code Frequency Histograms
Figure 4.6: Box plots for the features extracted.101
The Static approaches
Remark 1 : From descriptive statistics we find out that trusted applications box-
plots (for “move” and “jump” opcodes, and for the two distances) range in a wider
interval than the malware ones. This may reveal the fact that malware applications
implement little business logic with respect to the trusted ones, and identifies these
four features as good candidates for the classification phase. This result will be con-
firmed by the hypotheses testing and by the classification analysis.
Hypothesis testing
The hypothesis testing aims at evaluating if the features present different distributions
for the populations of malware and trusted applications with statistical evidence.
We assume valid the results when the null hypothesis is rejected by both the tests
performed.
Table 4.7 shows the results of hypothesis testing: the null hypothesis H0 can be
rejected for all the eight features. This means that there is statistical evidence that
the vector of features is a potential candidate for correctly classifying malware and
trusted applications.
Variable Mann-Whitney Kolmogorov-Smirnov
Move 0,000000 p < .001
Jump 0,000000 p < .001
Packed 0,000240 p < .001
Sparse 0,000000 p < .001
If 0,000000 p < .001
Invoke 0,000000 p < .001
Manhattan 0,000000 p < .001
Euclidean 0,000000 p < .001
Table 4.7: Results of the test of the null hypothesis H0
This result will provide an evaluation of the risk to generalize the fact that the
selected features produce values which belong to two different distributions (i.e. the
one of malware and the trusted one): those features can distinguish those observations.
With the classification analysis we will be able to establish the accuracy of the features
in associating any applications to a sample, malware or trusted.
Remark 2 : the malware and trusted samples (produced with all the eight features)
show a statistically significant difference by running both the tests.
102
4.4. Technique #2: Mobile Malware Detection using Op-code Frequency Histograms
Classification analysis
The classification analysis consisted of building a classifier, and evaluating its accu-
racy. For training the classifier, we defined T as a set of labelled mobile applications
(AUA, l), where each AUA is associated to a label l ∈ {trusted, malicious}. For each
AUA we built a feature vector F ∈ Ry , where y is the number of the features used in
training phase (1≤y≤8 ). To answer RQ1, we performed eight different classifications,
each one with a single feature (y=1), while for answering RQ2 we performed three
classifications with y>1 (classifications with a set of features).
For the learning phase, we use a k-fold cross-validation: the dataset is randomly
partitioned into k subsets. A single subset is retained as the validation dataset for
testing the model, while the remaining k-1 subsets of the original dataset are used
as training data. We repeated the process for k times; each one of the k subsets has
been used once as the validation dataset. To obtain a single estimate, we computed
the average of the k results from the folds.
We evaluated the effectiveness of the classification method with the following pro-
cedure:
1. build a training set T⊂D ;
2. build a testing set T’ = D÷T;
3. run the training phase on T ;
4. apply the learned classifier to each element of T’.
We performed a 10-fold cross validation: we repeated the four steps 10 times
varying the composition of T (and hence of T’ ).
The results that we obtained with this procedure are shown in table 4.8. Three
metrics were used to evaluate the classification results: recall, accuracy and roc area.
The classification analysis suggests several considerations. With regards to the
accuracy:
• All the algorithms are able to effectively classify both trusted applications and
malicious applications (with the exception of the “packed-switch” feature that
exhibits a value of accuracy in the trusted classification lower than 0.5 with the
NBTree classification algorithm).
• The features “move” and “jump” return the best results for the classification of
malware applications (in particular, the precision of the “move” is equal to 0.916
103
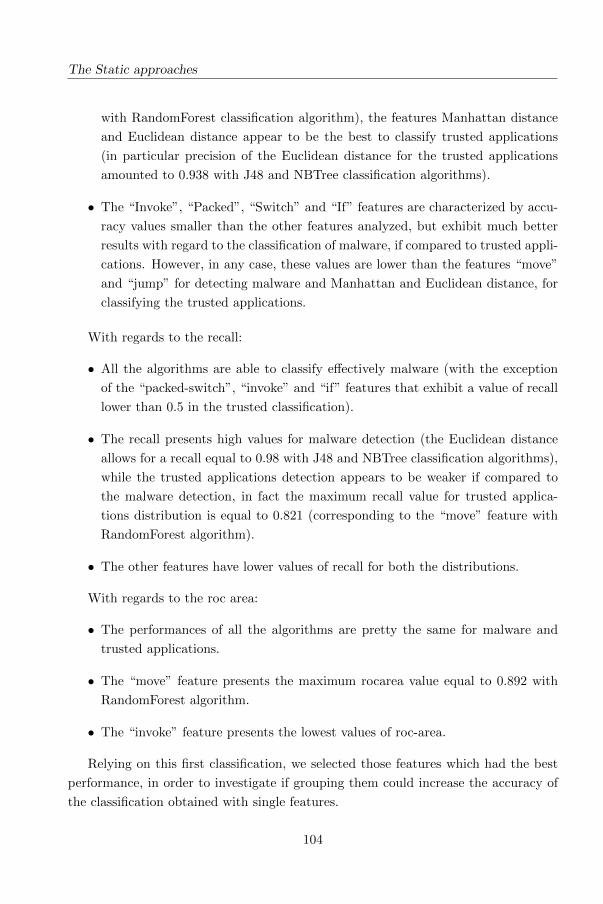
The Static approaches
with RandomForest classification algorithm), the features Manhattan distance
and Euclidean distance appear to be the best to classify trusted applications
(in particular precision of the Euclidean distance for the trusted applications
amounted to 0.938 with J48 and NBTree classification algorithms).
• The “Invoke”, “Packed”, “Switch” and “If” features are characterized by accu-
racy values smaller than the other features analyzed, but exhibit much better
results with regard to the classification of malware, if compared to trusted appli-
cations. However, in any case, these values are lower than the features “move”
and “jump” for detecting malware and Manhattan and Euclidean distance, for
classifying the trusted applications.
With regards to the recall:
• All the algorithms are able to classify effectively malware (with the exception
of the “packed-switch”, “invoke” and “if” features that exhibit a value of recall
lower than 0.5 in the trusted classification).
• The recall presents high values for malware detection (the Euclidean distance
allows for a recall equal to 0.98 with J48 and NBTree classification algorithms),
while the trusted applications detection appears to be weaker if compared to
the malware detection, in fact the maximum recall value for trusted applica-
tions distribution is equal to 0.821 (corresponding to the “move” feature with
RandomForest algorithm).
• The other features have lower values of recall for both the distributions.
With regards to the roc area:
• The performances of all the algorithms are pretty the same for malware and
trusted applications.
• The “move” feature presents the maximum rocarea value equal to 0.892 with
RandomForest algorithm.
• The “invoke” feature presents the lowest values of roc-area.
Relying on this first classification, we selected those features which had the best
performance, in order to investigate if grouping them could increase the accuracy of
the classification obtained with single features.
104
4.4. Technique #2: Mobile Malware Detection using Op-code Frequency Histograms
The following three groups of features were identified: (i) “move-jump”, in or-
der to obtain the maximum accuracy value for detecting malware; (ii) “Manhattan-
Euclidean”, in order to obtain the maximum precision value in the detection of trusted
applications, and (iii) “move-jump-Manhattan-Euclidean”, in order to combine the
characteristics of the two sets of features previously considered.
The classification accomplished by using these groups of features confirms our
expectations: we obtained results significantly better than in the case of the classifi-
cation with single features, as table 4.9 shows.
The group of features “move-jump” allows for an accuracy equal to 0.92 by per-
forming the classification of malware with the RandomForest and the J48 algorithm,
while the accuracy of the classification of trusted applications is equal to 0.78 using
the RepTree algorithm.
Combining the two features produces an improvement on the detection of malware
(0.92), in fact by using only the “move” the accuracy is equal to 0.916, by using the
algorithm RandomForest; while the single “jump” feature reaches an accuracy equal
to 0.874, by using the algorithm RepTree.
The recall is 0.911 in the classification of malware, when using the algorithm
RandomForest and RandomTree, while for the classification of trusted applications is
0.853 by using the J48 algorithm.
The maximum value of rocarea is equal to 0.928 by using the algorithm Random-
Forest.
The group of the features “Manhattan-Euclidean” presents an accuracy in the
detection of malware equal to 0.91, by using the algorithm RandomForest, while with
regard to the trusted applications a value equal to 0.91 is obtained by using the
NBTree algorithm. Combining these two features produces an improvement for the
detection of the trusted applications: in fact, the precision of the feature “Manhattan”
for trusted applications is equal to 0.888 with the algorithm NBTree, for the feature
“Euclidean” is equal to 0.934 with the algorithm J48 and NBTree.
The recall is 0.961 in the classification of malware using the algorithm J48, while
in the trusted applications detection is equal to 0.77 using the algorithm RandomTree.
The maximum value of rocarea is equal to 0.897 using the algorithm RandomForest.
The classification of the combination of the four features leads to optimal results
for the detection of both malware and trusted applications: in fact, the value of accu-
racy for the detection of malware is equal to 0.929 by using the algorithm Random-
Forest and 0.912 for the trusted applications, by using the algorithm RandomForest.
The recall is 0.961 using the algorithm RandomForest in the case of malware, and
105
The Static approaches
0.821 using the algorithms RandomForest and RandomTree. The rocArea is main-
tained equal for the detection of both trusted applications and malware, using the
algorithm RandomForest. This result is particularly valuable: tests producing values
of ROCArea greater than 0.9 are usually considered optimal in terms of accuracy.
Remark 3: The classification analysis suggets that the features are effective to
detect mobile malware. The multi-features classification improves the detection ca-
pability, with a very high level of accuracy.
The experiment allowed us to provide the following answers to the research ques-
tions we posed:
• RQ1: the features extracted are able to discriminate malware from trusted
applications. In particular, the features “move” and “jump” produced values of
accuracy equal to 0.9 in the identification of malware, while the “Manhattan”
and “Euclidean” distance revealed to be the best ones for detecting the trusted
applications.
• RQ2: grouping the features may increase accuracy and recall of classification. In
fact the classification with all the features allows for benefits for both malware
and trusted applications classification, achieving an accuracy of 0.919 in the de-
tection of malware and 0.889 in detection of trusted applications. Additionally,
the recall of the tests is equal to 0.95, which is considered optimal.
Unfortunately code morphing techniques could be employed in order to alterate
op-codes histograms. This is usually accomplished by adding junk code which does
not alter the behaviour of malware, but just the distribution of op-codes.
This evasion technique can be contrasted by two ways: first, by applying methods
for finding junk code within malware. Second, by identifying precise patterns and
sequences of op-codes that could be recurrent in malicious malware’s code. This
latter technique could also help to understand which is the family each malware
instance belongs to, which is a further improvement of interest in the area of malware
detection.
An undeniable advantage of this technique is the easiness of implementation and
the correspondent lightness in terms of requested resources: basically the proposed
method needs to extract the occurrence frequency of a set of op-codes. The method
can be straightforward reproduced and this fosters the replications of our study for
confirming the outcomes or finding possible weakness points.
The best deployment of the proposed classifier is a client-server architecture, where
the classifier resides in a server and a client app is installed on the user device and
106
4.4. Technique #2: Mobile Malware Detection using Op-code Frequency Histograms
Features Algorithm Accuracy Recall RocArea
Malware Trusted Malware Trusted Malware TrustedJ48 0.91 0.73 0.885 0.757 0.856 0.856
LADTree 0.82 0.73 0.887 0.742 0.858 0.858move NBTree 0.84 0.72 0.887 0.742 0.859 0.859
RandomForest 0.916 0.7 0.867 0.821 0.802 0.802RandomTree 0.89 0.69 0.866 0.817 0.88 0.88
RepTree 0.912 0.704 0.886 0.755 0.886 0.886J48 0.87 0.72 0.896 0.651 0.858 0.858
LADTree 0.842 0.74 0.91 0.626 0.875 0.875jump NBTree 0.873 0.729 0.925 0.575 0.861 0.861
RandomForest 0.87 0.78 0.903 0.697 0.876 0.876RandomTree 0.84 0.71 0.904 0.695 0.868 0.868
RepTree 0.874 0.761 0.893 0.695 0.871 0.871J48 0.735 0.529 0.935 0.227 0.569 0.569
LADTree 0.745 0.578 0.935 0.227 0.569 0.569invoke NBTree 0.745 0.578 0.935 0.227 0.569 0.569
RandomForest 0.77 0.578 0.935 0.227 0.578 0.578RandomTree 0.715 0.57 0.935 0.227 0.569 0.569
RepTree 0.757 0.55 0.935 0.227 0.569 0.569J48 0.64 0.53 0.937 0.201 0.619 0.619
LADTree 0.715 0.509 0.938 0.161 0.715 0.715packed NBTree 0.719 0.31 0.95 0.059 0.635 0.635
RandomForest 0.728 0.427 0.918 0.254 0.64 0.64RandomTree 0.701 0.528 0.935 0.201 0.725 0.725
RepTree 0.737 0.528 0.936 0.107 0.697 0.697J48 0.807 0.735 0.919 0.555 0.747 0.747
LADTree 0.864 0.789 0.92 0.501 0.826 0.826sparse NBTree 0.826 0.727 0.921 0.489 0.801 0.801
RandomForest 0.864 0.729 0.932 0.493 0.855 0.855RandomTree 0.827 0.756 0.941 0.462 0.849 0.849
RepTree 0.838 0.735 0.921 0.52 0.836 0.836J48 0.758 0.697 0.935 0.229 0.621 0.621
LADTree 0.754 0.586 0.934 0.232 0.71 0.71if NBTree 0.765 0.587 0.926 0.227 0.71 0.71
RandomForest 0.767 0.576 0.928 0.216 0.726 0.726RandomTree 0.757 0.586 0.928 0.216 0.72 0.72
RepTree 0.758 0.586 0.932 0.241 0.708 0.708
J48 0.835 0.804 0.934 0.575 0.843 0.843LADTree 0.834 0.806 0.956 0.556 0.868 0.868
Manhattan NBTree 0.827 0.892 0.969 0.5 0.854 0.854RandomForest 0.893 0.779 0.921 0.686 0.852 0.852RandomTree 0.89 0.803 0.918 0.7 0.809 0.809
RepTree 0.889 0.863 0.953 0.591 0.849 0.849J48 0.825 0.938 0.98 0.478 0.71 0.71
LADTree 0.836 0.918 0.974 0.489 0.869 0.869Euclidean NBTree 0.838 0.938 0.98 0.478 0.854 0.854
RandomForest 0.87 0.778 0.918 0.702 0.854 0.854RandomTree 0.897 0.746 0.915 0.706 0.811 0.811
RepTree 0.857 0.835 0.951 0.558 0.852 0.852
Table 4.8: Classification Results: Accuracy, Recall and RocArea for classifying Malware and Trusted
applications, computed with the single features, with the algorithms J48, LadTree, NBTree, Ran-
domForest, RandomTree and RepTree
107
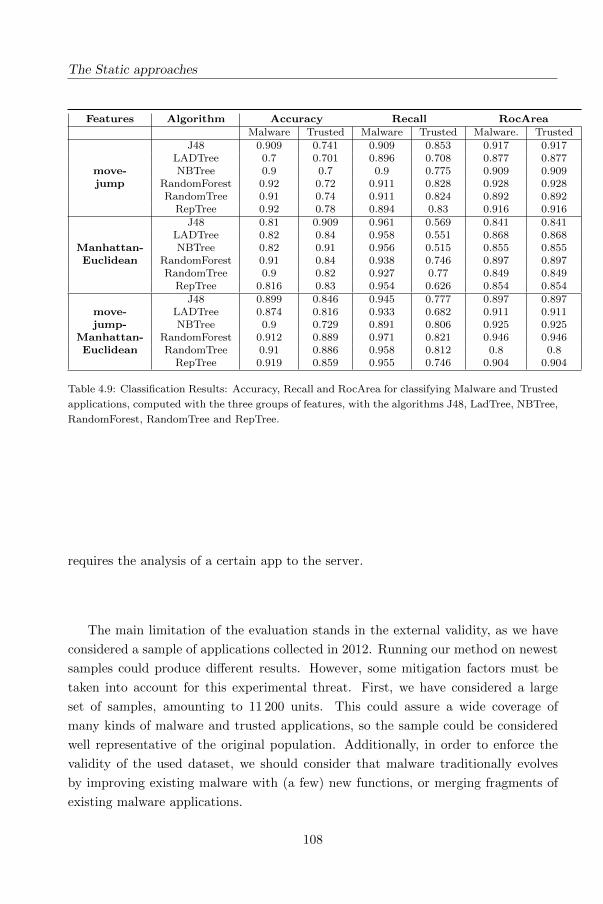
The Static approaches
Features Algorithm Accuracy Recall RocArea
Malware Trusted Malware Trusted Malware. TrustedJ48 0.909 0.741 0.909 0.853 0.917 0.917
LADTree 0.7 0.701 0.896 0.708 0.877 0.877move- NBTree 0.9 0.7 0.9 0.775 0.909 0.909jump RandomForest 0.92 0.72 0.911 0.828 0.928 0.928
RandomTree 0.91 0.74 0.911 0.824 0.892 0.892RepTree 0.92 0.78 0.894 0.83 0.916 0.916
J48 0.81 0.909 0.961 0.569 0.841 0.841LADTree 0.82 0.84 0.958 0.551 0.868 0.868
Manhattan- NBTree 0.82 0.91 0.956 0.515 0.855 0.855Euclidean RandomForest 0.91 0.84 0.938 0.746 0.897 0.897
RandomTree 0.9 0.82 0.927 0.77 0.849 0.849RepTree 0.816 0.83 0.954 0.626 0.854 0.854
J48 0.899 0.846 0.945 0.777 0.897 0.897move- LADTree 0.874 0.816 0.933 0.682 0.911 0.911jump- NBTree 0.9 0.729 0.891 0.806 0.925 0.925
Manhattan- RandomForest 0.912 0.889 0.971 0.821 0.946 0.946Euclidean RandomTree 0.91 0.886 0.958 0.812 0.8 0.8
RepTree 0.919 0.859 0.955 0.746 0.904 0.904
Table 4.9: Classification Results: Accuracy, Recall and RocArea for classifying Malware and Trusted
applications, computed with the three groups of features, with the algorithms J48, LadTree, NBTree,
RandomForest, RandomTree and RepTree.
requires the analysis of a certain app to the server.
The main limitation of the evaluation stands in the external validity, as we have
considered a sample of applications collected in 2012. Running our method on newest
samples could produce different results. However, some mitigation factors must be
taken into account for this experimental threat. First, we have considered a large
set of samples, amounting to 11 200 units. This could assure a wide coverage of
many kinds of malware and trusted applications, so the sample could be considered
well representative of the original population. Additionally, in order to enforce the
validity of the used dataset, we should consider that malware traditionally evolves
by improving existing malware with (a few) new functions, or merging fragments of
existing malware applications.
108
4.5. Technique #3: Effectiveness of Opcode ngrams for Detection of Multi FamilyAndroid Malware
4.5 Technique #3: Effectiveness of Opcode ngrams
for Detection of Multi Family Android Malware
4.5.1 The method
With this tecnique, we investigate whether short sequences of opcodes (i.e., opcode
ngrams) are informative for detecting Android malware. In particular, we focus
on the current scenario in which partitions of the malware exist within which the
applications share common parts of code. We focus on opcodes because they are
closely related to the application code. Indeed, several works in literature showed that
opcodes frequency can discriminate a malware software from a trusted one. Bilar [66]
obtained evidence that malware opcodes frequency distribution deviates significantly
from trusted applications. While Han et al. [93] show that malware classification using
instructions frequency can be a useful technique for speeding up malware detection.
Rad and Masrom [119] used opcodes for detecting obfuscated versions of metamorphic
viruses. The sequences of opcodes could represent a sort of signature of the malware,
which is always available and easily extractable from the application to be analyzed.
Moreover, as this is a static technique, the analysis has the advantage to be fast and
easy to implement.
We designed a method for classifying Android applications as malware or trusted.
Our method is built using state-of-the-art classifiers and operates on frequencies of op-
code ngrams extracted from the applications. We experimentally applied the method
to a dataset composed of 5560 real mobile malware grouped in 179 families and 5560
mobile trusted applications. We varied method parameters in order to investigate
about the method effectiveness with respect to:
1. how many consecutive opcodes should be a ngram consists, and
2. how many different ngrams should be considered.
The technique proposed seems to be much more effective than the existing tech-
niques of static analysis discussed in literature, as we obtained performances that are
significantly better than those obtained by the other techniques, that is 96.88% in the
recognition of malware. The detection rate among the most spread Android malware
families range from 88.6% to 100%.
109
The Static approaches
4.5.2 The proposed features
Detection method
We consider a binary classification problem in which an input application a has to be
classified as malware or trusted. We propose a supervised classification method for
solving this problem in which the features are the frequencies of opcode sequences in
the application.
Our method consists of two phases: a learning phase, in which the classifier is
trained using a labelled dataset of applications, and the actual classification phase,
in which an input application is classified as malware or trusted. In both cases, each
application is pre-processed in order to obtain numeric values (frequences of opcode
sequences) suitable to be processed by the classifier.
Pre-processing
The pre-processing of an application consists of transforming an application a packed
as an .apk file in a set of numeric values, as follows. We first use apktool1 to ex-
tract from the .apk the .dex file, which is the compiled application file of a (Dalvik
Executable); then, with the smali2 tool, we disassemble the application .dex file and
obtain several files (i.e., smali classes) which contains the machine level instructions,
each consisting in an opcode and its parameters. From these files, we obtain a set of
opcode sequences where each item is the sequence of opcodes corresponding to the
machine level instructions of a method of a class in a.
We compute the frequency of opcodes ngrams as follows. Let O be the set of
possible opcodes, and let O =⋃i=n
i=1 Oi the set of ngrams, i.e., sequences of opcodes
whose length is up to n—n being a parameter of our method. We denote with
f(a, o) the frequency of the ngram o ∈ O in the application a: f(a, o) is hence the
number of occurrences of o divided by the total length of the opcode sequences in
a. Finally, we set the feature vector f(a) ∈ [0, 1]|O| corresponding to a to f(a) =
(f(a, o1), f(a, o2), . . . ) with oi ∈ O.
In general, the size |O| of the feature vector f can be large, being |O| =∑i=n
i=1 |O|i;however, not all possible ngrams could be actually observed. We remark that we
split the application code in chunks corresponding to class methods, since we want
to avoid inserting meaningless ngrams obtained by considering together instructions
corresponding to different methods: in that case, indeed, we would wrongly consider
1http://ibotpeaches.github.io/Apktool/2https://code.google.com/p/smali/
110
4.5. Technique #3: Effectiveness of Opcode ngrams for Detection of Multi FamilyAndroid Malware
as subsequent those instructions which belong to different methods.
Learning phase
The learning phase consists of obtaining a trained binary classifier C from two sets
AM , AT of malware and trusted applications (the learning sets), respectively. The
learning phase is divided into a feature selection phase and the actual classifier training
phase.
The aim of the feature selection phase is two-fold: on the one hand, we want to
reduce the dimension of the input—with n = 5, the size |O| of each feature vector f
can be up to ≈ 1012. On the other hand, we want to retain only the more informative
ngrams, with respect to the output label, while removing noisy features.
We proceed as follows. We first compute the average frequencies fM (o) and fT (o)
for each ngram o ∈ O respectively on the malware and trusted applications:
fM (o) =1
|AM |∑
a∈AM
f(a, o)
fT (o) =1
|AT |∑a∈AT
f(a, o)
We then compute the relative difference d(o) between the two average values:
d(o) =abs(fM (o)− fT (o))
max(fM (o), fT (o))
The relative difference d(o) is high if the ngram o is frequent among malware appli-
cations and infrequent among trusted applications (and vice versa).
Then, we build the set O′ ⊂ O of ngrams composed of the h ngrams with the
highest values of d(o), where h is a parameter of our method. We do not include in
O′ the ngrams for which d(o) = 1, i.e., we purposely do not consider those ngrams
which occur only in the trusted (malware) applications of the learning sets: this way,
we strive to avoid building a classifier which works well on seen applications but fails
to generalize.
We then discard from O′ each ngram ox for which another ngram oy exists in O′
such that oy is a supersequence of ox: we perform this step in order to avoid con-
sidering redundant information, i.e., frequency of sequences of opcodes which largely
overlap. For instance, suppose that the ngram ox = (const, iput, move) exhibits a
high relative difference d(ox); then, we want to avoid considering the information cor-
responding to the frequency of oy = (const, iput) if it also exhibits a high relative
difference.
111
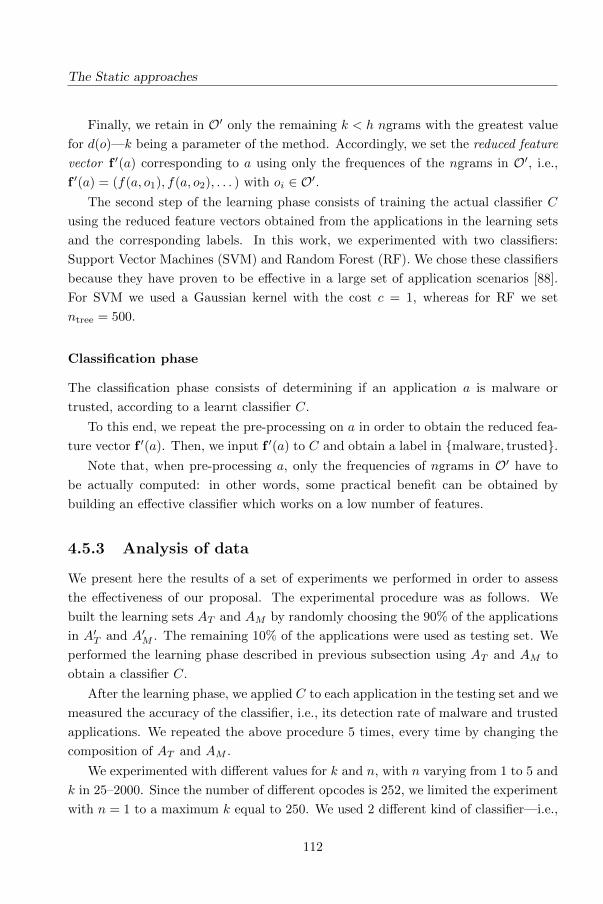
The Static approaches
Finally, we retain in O′ only the remaining k < h ngrams with the greatest value
for d(o)—k being a parameter of the method. Accordingly, we set the reduced feature
vector f ′(a) corresponding to a using only the frequences of the ngrams in O′, i.e.,
f ′(a) = (f(a, o1), f(a, o2), . . . ) with oi ∈ O′.The second step of the learning phase consists of training the actual classifier C
using the reduced feature vectors obtained from the applications in the learning sets
and the corresponding labels. In this work, we experimented with two classifiers:
Support Vector Machines (SVM) and Random Forest (RF). We chose these classifiers
because they have proven to be effective in a large set of application scenarios [88].
For SVM we used a Gaussian kernel with the cost c = 1, whereas for RF we set
ntree = 500.
Classification phase
The classification phase consists of determining if an application a is malware or
trusted, according to a learnt classifier C.
To this end, we repeat the pre-processing on a in order to obtain the reduced fea-
ture vector f ′(a). Then, we input f ′(a) to C and obtain a label in {malware, trusted}.Note that, when pre-processing a, only the frequencies of ngrams in O′ have to
be actually computed: in other words, some practical benefit can be obtained by
building an effective classifier which works on a low number of features.
4.5.3 Analysis of data
We present here the results of a set of experiments we performed in order to assess
the effectiveness of our proposal. The experimental procedure was as follows. We
built the learning sets AT and AM by randomly choosing the 90% of the applications
in A′T and A′M . The remaining 10% of the applications were used as testing set. We
performed the learning phase described in previous subsection using AT and AM to
obtain a classifier C.
After the learning phase, we applied C to each application in the testing set and we
measured the accuracy of the classifier, i.e., its detection rate of malware and trusted
applications. We repeated the above procedure 5 times, every time by changing the
composition of AT and AM .
We experimented with different values for k and n, with n varying from 1 to 5 and
k in 25–2000. Since the number of different opcodes is 252, we limited the experiment
with n = 1 to a maximum k equal to 250. We used 2 different kind of classifier—i.e.,
112
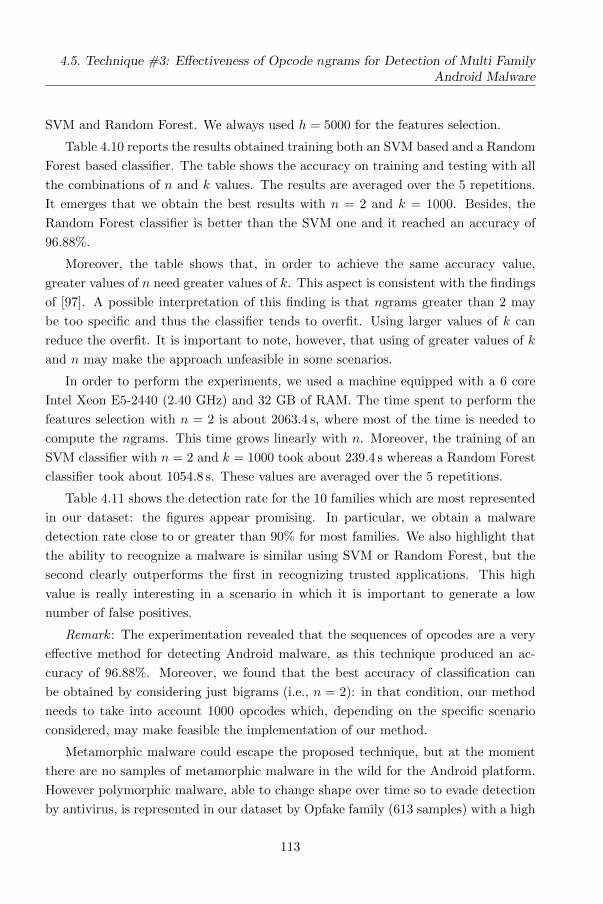
4.5. Technique #3: Effectiveness of Opcode ngrams for Detection of Multi FamilyAndroid Malware
SVM and Random Forest. We always used h = 5000 for the features selection.
Table 4.10 reports the results obtained training both an SVM based and a Random
Forest based classifier. The table shows the accuracy on training and testing with all
the combinations of n and k values. The results are averaged over the 5 repetitions.
It emerges that we obtain the best results with n = 2 and k = 1000. Besides, the
Random Forest classifier is better than the SVM one and it reached an accuracy of
96.88%.
Moreover, the table shows that, in order to achieve the same accuracy value,
greater values of n need greater values of k. This aspect is consistent with the findings
of [97]. A possible interpretation of this finding is that ngrams greater than 2 may
be too specific and thus the classifier tends to overfit. Using larger values of k can
reduce the overfit. It is important to note, however, that using of greater values of k
and n may make the approach unfeasible in some scenarios.
In order to perform the experiments, we used a machine equipped with a 6 core
Intel Xeon E5-2440 (2.40 GHz) and 32 GB of RAM. The time spent to perform the
features selection with n = 2 is about 2063.4 s, where most of the time is needed to
compute the ngrams. This time grows linearly with n. Moreover, the training of an
SVM classifier with n = 2 and k = 1000 took about 239.4 s whereas a Random Forest
classifier took about 1054.8 s. These values are averaged over the 5 repetitions.
Table 4.11 shows the detection rate for the 10 families which are most represented
in our dataset: the figures appear promising. In particular, we obtain a malware
detection rate close to or greater than 90% for most families. We also highlight that
the ability to recognize a malware is similar using SVM or Random Forest, but the
second clearly outperforms the first in recognizing trusted applications. This high
value is really interesting in a scenario in which it is important to generate a low
number of false positives.
Remark : The experimentation revealed that the sequences of opcodes are a very
effective method for detecting Android malware, as this technique produced an ac-
curacy of 96.88%. Moreover, we found that the best accuracy of classification can
be obtained by considering just bigrams (i.e., n = 2): in that condition, our method
needs to take into account 1000 opcodes which, depending on the specific scenario
considered, may make feasible the implementation of our method.
Metamorphic malware could escape the proposed technique, but at the moment
there are no samples of metamorphic malware in the wild for the Android platform.
However polymorphic malware, able to change shape over time so to evade detection
by antivirus, is represented in our dataset by Opfake family (613 samples) with a high
113
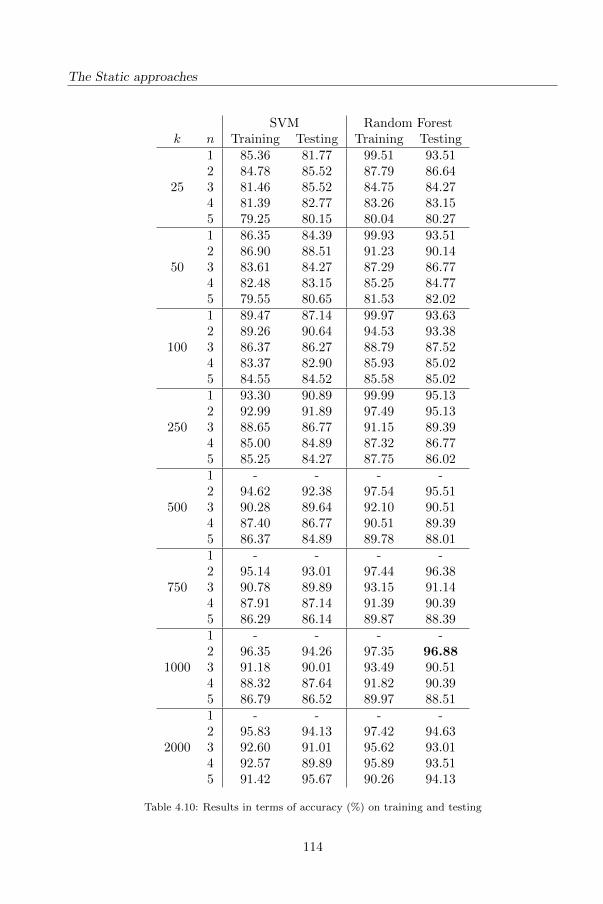
The Static approaches
SVM Random Forestk n Training Testing Training Testing
25
1 85.36 81.77 99.51 93.512 84.78 85.52 87.79 86.643 81.46 85.52 84.75 84.274 81.39 82.77 83.26 83.155 79.25 80.15 80.04 80.27
50
1 86.35 84.39 99.93 93.512 86.90 88.51 91.23 90.143 83.61 84.27 87.29 86.774 82.48 83.15 85.25 84.775 79.55 80.65 81.53 82.02
100
1 89.47 87.14 99.97 93.632 89.26 90.64 94.53 93.383 86.37 86.27 88.79 87.524 83.37 82.90 85.93 85.025 84.55 84.52 85.58 85.02
250
1 93.30 90.89 99.99 95.132 92.99 91.89 97.49 95.133 88.65 86.77 91.15 89.394 85.00 84.89 87.32 86.775 85.25 84.27 87.75 86.02
500
1 - - - -2 94.62 92.38 97.54 95.513 90.28 89.64 92.10 90.514 87.40 86.77 90.51 89.395 86.37 84.89 89.78 88.01
750
1 - - - -2 95.14 93.01 97.44 96.383 90.78 89.89 93.15 91.144 87.91 87.14 91.39 90.395 86.29 86.14 89.87 88.39
1000
1 - - - -2 96.35 94.26 97.35 96.883 91.18 90.01 93.49 90.514 88.32 87.64 91.82 90.395 86.79 86.52 89.97 88.51
2000
1 - - - -2 95.83 94.13 97.42 94.633 92.60 91.01 95.62 93.014 92.57 89.89 95.89 93.515 91.42 95.67 90.26 94.13
Table 4.10: Results in terms of accuracy (%) on training and testing
114
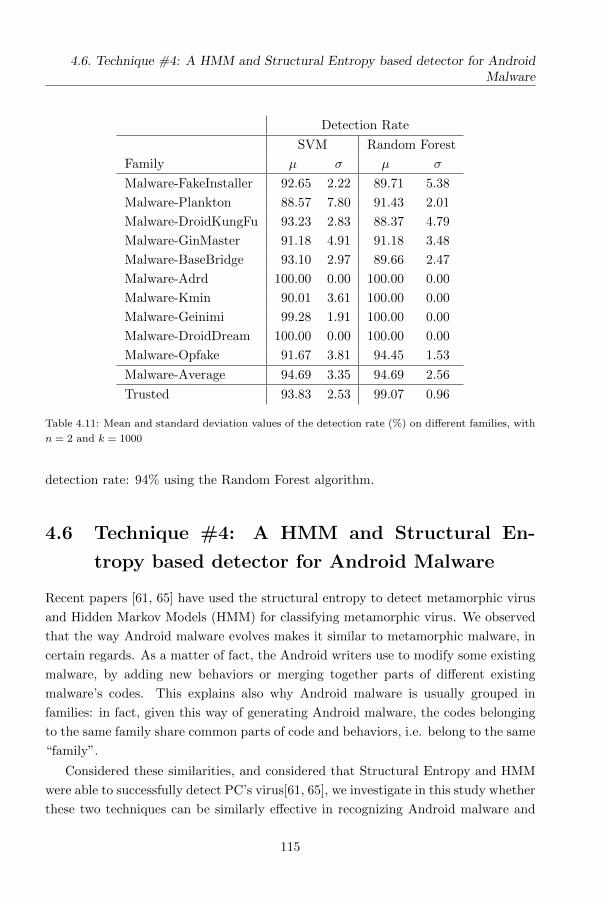
4.6. Technique #4: A HMM and Structural Entropy based detector for AndroidMalware
Detection Rate
SVM Random Forest
Family µ σ µ σ
Malware-FakeInstaller 92.65 2.22 89.71 5.38
Malware-Plankton 88.57 7.80 91.43 2.01
Malware-DroidKungFu 93.23 2.83 88.37 4.79
Malware-GinMaster 91.18 4.91 91.18 3.48
Malware-BaseBridge 93.10 2.97 89.66 2.47
Malware-Adrd 100.00 0.00 100.00 0.00
Malware-Kmin 90.01 3.61 100.00 0.00
Malware-Geinimi 99.28 1.91 100.00 0.00
Malware-DroidDream 100.00 0.00 100.00 0.00
Malware-Opfake 91.67 3.81 94.45 1.53
Malware-Average 94.69 3.35 94.69 2.56
Trusted 93.83 2.53 99.07 0.96
Table 4.11: Mean and standard deviation values of the detection rate (%) on different families, with
n = 2 and k = 1000
detection rate: 94% using the Random Forest algorithm.
4.6 Technique #4: A HMM and Structural En-
tropy based detector for Android Malware
Recent papers [61, 65] have used the structural entropy to detect metamorphic virus
and Hidden Markov Models (HMM) for classifying metamorphic virus. We observed
that the way Android malware evolves makes it similar to metamorphic malware, in
certain regards. As a matter of fact, the Android writers use to modify some existing
malware, by adding new behaviors or merging together parts of different existing
malware’s codes. This explains also why Android malware is usually grouped in
families: in fact, given this way of generating Android malware, the codes belonging
to the same family share common parts of code and behaviors, i.e. belong to the same
“family”.
Considered these similarities, and considered that Structural Entropy and HMM
were able to successfully detect PC’s virus[61, 65], we investigate in this study whether
these two techniques can be similarly effective in recognizing Android malware and
115
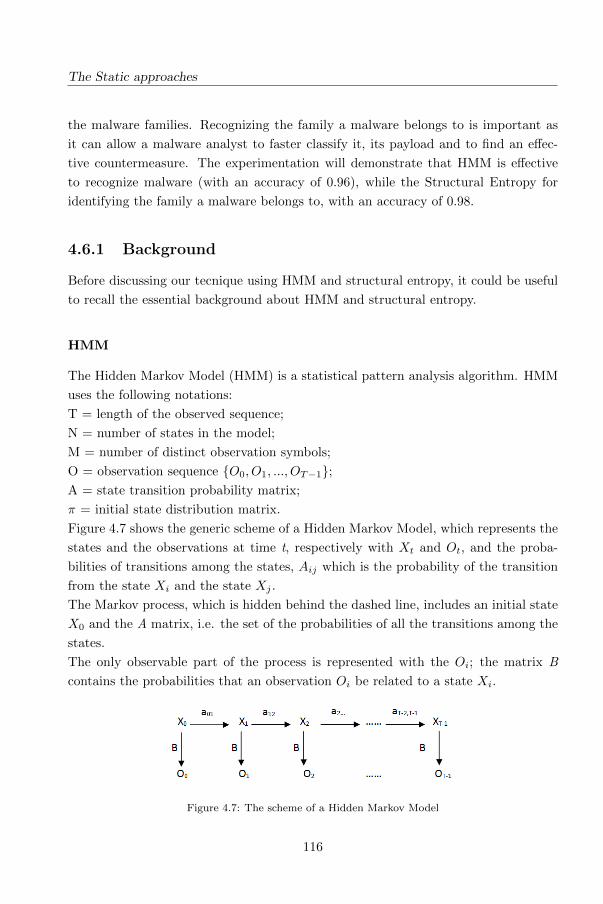
The Static approaches
the malware families. Recognizing the family a malware belongs to is important as
it can allow a malware analyst to faster classify it, its payload and to find an effec-
tive countermeasure. The experimentation will demonstrate that HMM is effective
to recognize malware (with an accuracy of 0.96), while the Structural Entropy for
identifying the family a malware belongs to, with an accuracy of 0.98.
4.6.1 Background
Before discussing our tecnique using HMM and structural entropy, it could be useful
to recall the essential background about HMM and structural entropy.
HMM
The Hidden Markov Model (HMM) is a statistical pattern analysis algorithm. HMM
uses the following notations:
T = length of the observed sequence;
N = number of states in the model;
M = number of distinct observation symbols;
O = observation sequence {O0, O1, ..., OT−1};A = state transition probability matrix;
π = initial state distribution matrix.
Figure 4.7 shows the generic scheme of a Hidden Markov Model, which represents the
states and the observations at time t, respectively with Xt and Ot, and the proba-
bilities of transitions among the states, Aij which is the probability of the transition
from the state Xi and the state Xj .
The Markov process, which is hidden behind the dashed line, includes an initial state
X0 and the A matrix, i.e. the set of the probabilities of all the transitions among the
states.
The only observable part of the process is represented with the Oi; the matrix B
contains the probabilities that an observation Oi be related to a state Xi.
Figure 4.7: The scheme of a Hidden Markov Model
116
4.6. Technique #4: A HMM and Structural Entropy based detector for AndroidMalware
Common applications of HMMs are protein modeling [114] and speech recognition
applications [101], i.e. identifying whether a protein can be attributed to a known
protein structure, or if a speech fragment can be associated to a known speech pat-
tern.
As a machine learner, HMM works in this way: the first step consists of creating a
training model that represents the input data (training data).
The training model includes a chain of unique symbols observed within the input data
along with their positions in the input sequence.
This model will be used by the HMM to determine if a given new input sequence
shows a pattern similar to that found in the model.
In a recent paper[61], HMM machine learners have been applied to detect metamor-
phic virus.
Although metamorphic engines change the form of viral copies by employing differ-
ent code obfuscation techniques, some similar patterns can be found within the same
family of virus.
A HMM-based detector gathers the input data from a sample of known virus and
builds the training model (one for each family virus) with this input dataset.
Subsequently, any file can be tested against these models to determine if it can be
considered as belonging to one among the learned models. If an input file belongs to a
model, then it is classified as a member of the virus family that the model represents.
Mathematical details of the HMM can be found in literature [61].
Structural Entropy
The similarity method considered here was originally introduced in Baysa [65].
The technique performs a static analysis of files using the structural entropy [65] to
evaluate the similarity among Android applications.
Unlikely to the HMM method, the similarity score is computed directly on the exe-
cutable file (i.e. the .dex file in the case of Android applications); thus the disassembly
step is not necessary, and the technique can be applied independently of the specific
executable file format, because it ignores header-specific information.
The method of structural entropy compares two given files and produces a similarity
measure, i.e. evaluates at which extent the two files can be considered similar.
The entropy measure provides a sort of signature of a file, by computing the distribu-
tion of bytes within the file. We do not provide the details of the computation, that
can be found in [65].
117
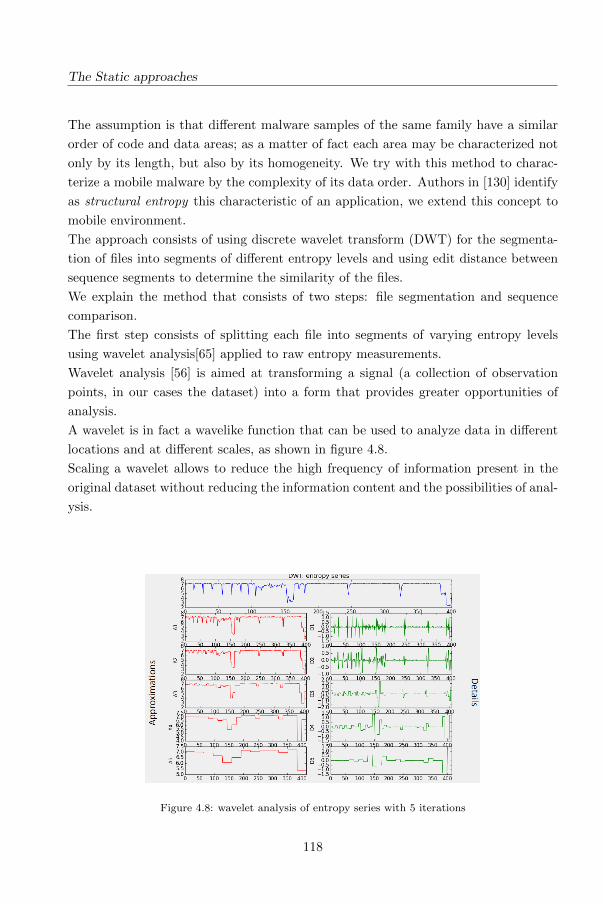
The Static approaches
The assumption is that different malware samples of the same family have a similar
order of code and data areas; as a matter of fact each area may be characterized not
only by its length, but also by its homogeneity. We try with this method to charac-
terize a mobile malware by the complexity of its data order. Authors in [130] identify
as structural entropy this characteristic of an application, we extend this concept to
mobile environment.
The approach consists of using discrete wavelet transform (DWT) for the segmenta-
tion of files into segments of different entropy levels and using edit distance between
sequence segments to determine the similarity of the files.
We explain the method that consists of two steps: file segmentation and sequence
comparison.
The first step consists of splitting each file into segments of varying entropy levels
using wavelet analysis[65] applied to raw entropy measurements.
Wavelet analysis [56] is aimed at transforming a signal (a collection of observation
points, in our cases the dataset) into a form that provides greater opportunities of
analysis.
A wavelet is in fact a wavelike function that can be used to analyze data in different
locations and at different scales, as shown in figure 4.8.
Scaling a wavelet allows to reduce the high frequency of information present in the
original dataset without reducing the information content and the possibilities of anal-
ysis.
Figure 4.8: wavelet analysis of entropy series with 5 iterations
118
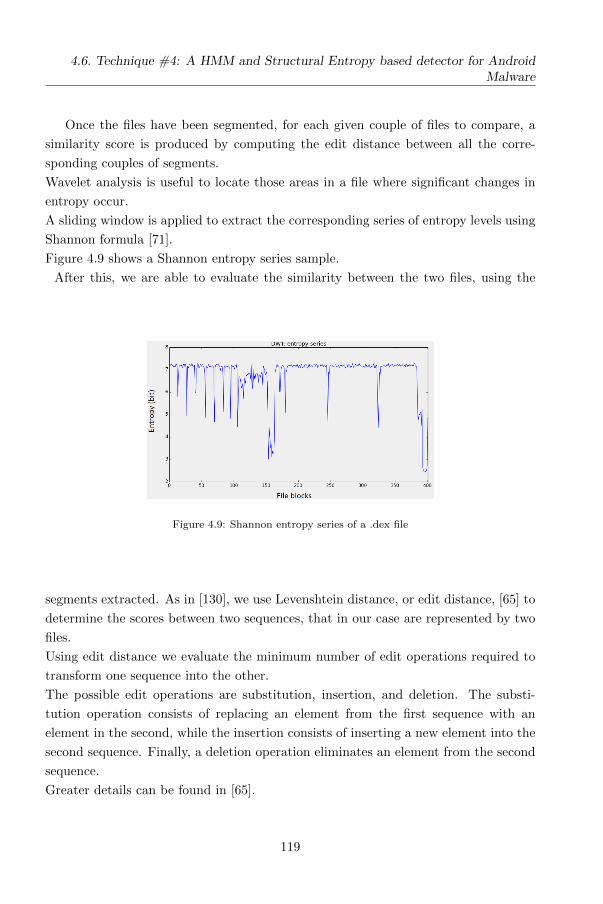
4.6. Technique #4: A HMM and Structural Entropy based detector for AndroidMalware
Once the files have been segmented, for each given couple of files to compare, a
similarity score is produced by computing the edit distance between all the corre-
sponding couples of segments.
Wavelet analysis is useful to locate those areas in a file where significant changes in
entropy occur.
A sliding window is applied to extract the corresponding series of entropy levels using
Shannon formula [71].
Figure 4.9 shows a Shannon entropy series sample.
After this, we are able to evaluate the similarity between the two files, using the
Figure 4.9: Shannon entropy series of a .dex file
segments extracted. As in [130], we use Levenshtein distance, or edit distance, [65] to
determine the scores between two sequences, that in our case are represented by two
files.
Using edit distance we evaluate the minimum number of edit operations required to
transform one sequence into the other.
The possible edit operations are substitution, insertion, and deletion. The substi-
tution operation consists of replacing an element from the first sequence with an
element in the second, while the insertion consists of inserting a new element into the
second sequence. Finally, a deletion operation eliminates an element from the second
sequence.
Greater details can be found in [65].
119
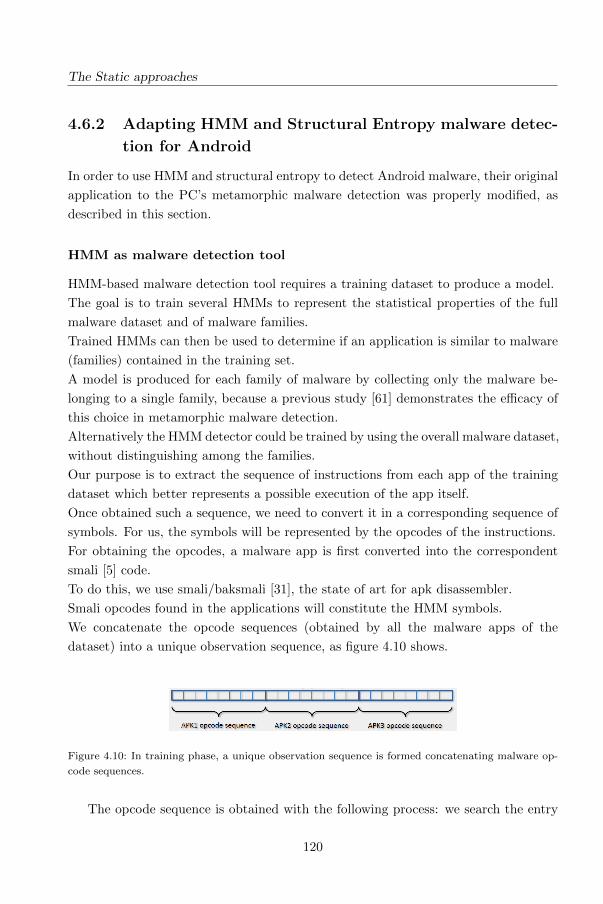
The Static approaches
4.6.2 Adapting HMM and Structural Entropy malware detec-
tion for Android
In order to use HMM and structural entropy to detect Android malware, their original
application to the PC’s metamorphic malware detection was properly modified, as
described in this section.
HMM as malware detection tool
HMM-based malware detection tool requires a training dataset to produce a model.
The goal is to train several HMMs to represent the statistical properties of the full
malware dataset and of malware families.
Trained HMMs can then be used to determine if an application is similar to malware
(families) contained in the training set.
A model is produced for each family of malware by collecting only the malware be-
longing to a single family, because a previous study [61] demonstrates the efficacy of
this choice in metamorphic malware detection.
Alternatively the HMM detector could be trained by using the overall malware dataset,
without distinguishing among the families.
Our purpose is to extract the sequence of instructions from each app of the training
dataset which better represents a possible execution of the app itself.
Once obtained such a sequence, we need to convert it in a corresponding sequence of
symbols. For us, the symbols will be represented by the opcodes of the instructions.
For obtaining the opcodes, a malware app is first converted into the correspondent
smali [5] code.
To do this, we use smali/baksmali [31], the state of art for apk disassembler.
Smali opcodes found in the applications will constitute the HMM symbols.
We concatenate the opcode sequences (obtained by all the malware apps of the
dataset) into a unique observation sequence, as figure 4.10 shows.
Figure 4.10: In training phase, a unique observation sequence is formed concatenating malware op-
code sequences.
The opcode sequence is obtained with the following process: we search the entry
120
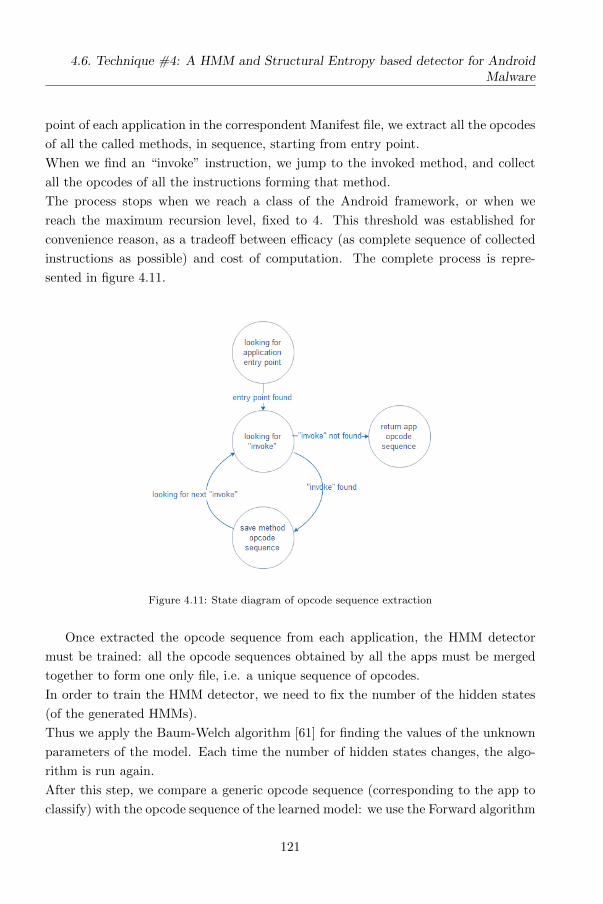
4.6. Technique #4: A HMM and Structural Entropy based detector for AndroidMalware
point of each application in the correspondent Manifest file, we extract all the opcodes
of all the called methods, in sequence, starting from entry point.
When we find an “invoke” instruction, we jump to the invoked method, and collect
all the opcodes of all the instructions forming that method.
The process stops when we reach a class of the Android framework, or when we
reach the maximum recursion level, fixed to 4. This threshold was established for
convenience reason, as a tradeoff between efficacy (as complete sequence of collected
instructions as possible) and cost of computation. The complete process is repre-
sented in figure 4.11.
Figure 4.11: State diagram of opcode sequence extraction
Once extracted the opcode sequence from each application, the HMM detector
must be trained: all the opcode sequences obtained by all the apps must be merged
together to form one only file, i.e. a unique sequence of opcodes.
In order to train the HMM detector, we need to fix the number of the hidden states
(of the generated HMMs).
Thus we apply the Baum-Welch algorithm [61] for finding the values of the unknown
parameters of the model. Each time the number of hidden states changes, the algo-
rithm is run again.
After this step, we compare a generic opcode sequence (corresponding to the app to
classify) with the opcode sequence of the learned model: we use the Forward algorithm
121
The Static approaches
[61] for finding the likelihood of the sequence, i.e. the probability that the (learned)
model generates the sequence to classify. If this is true, then the app is considered a
malware instance. Of course, the “definition” of a malware depends strictly from the
used training dataset.
We trained our HMMs using different number of states and examined the resulting
probabilities to deduce which features the states represent. The number of hidden
states N that we tested are N= 3,4,5.
4.6.3 Entropy-based detection
The entropy-based method is based on the estimation of structural entropy of an
Android executable (.dex file).
The first step is the extraction of an entropy series: once the .dex file has been divided
into blocks of fixed size, we compute the Shannon entropy for each block.
This is the first representation of .dex file; in order to obtain the segments of the
file, we use the wavelet transform which gives an useful representation of the entropy
series, with approximation and detail coefficients.
Once two parameters, minimum and maximum scale of the wavelet transform, have
been selected, we use the detail coefficients to detect the discontinuities in the entropy
series and extract the segments:
• the length of each segment is represented by the distance between two consec-
utive discontinuities;
• the entropy value of each segment is the approximation value of the entropy
series between the discontinuities.
The output of the segmentation phase is represented by the list of segments that
represent the different entropy areas in .dex file.
The second phase of the method is the comparison between the segments of two .dex
files to calculate a similarity score (fig. 4.12).
As we explained before, the similarity score is based on the Levenshtein distance.
This value represents the percentage of similarity between two .dex files based on the
corresponding entropy areas.
122
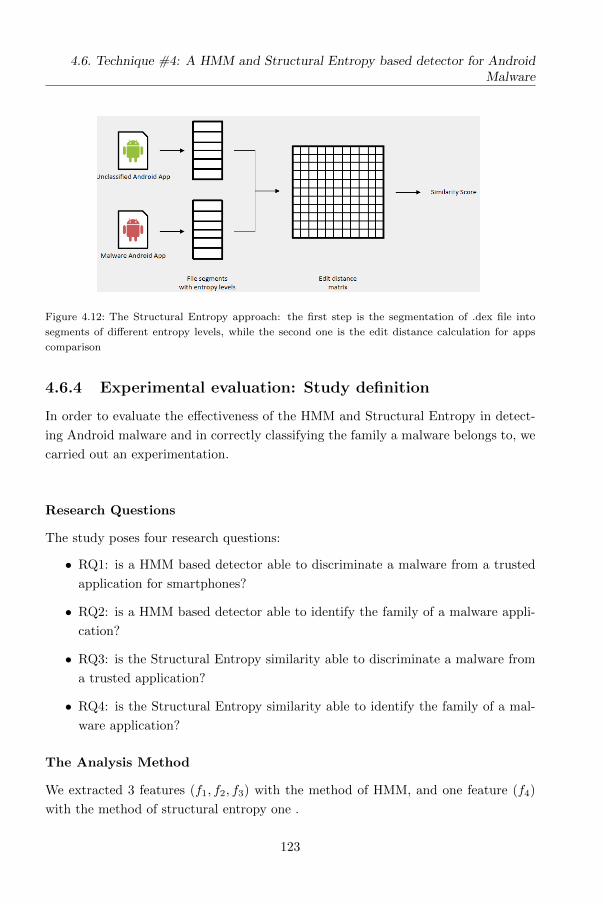
4.6. Technique #4: A HMM and Structural Entropy based detector for AndroidMalware
Figure 4.12: The Structural Entropy approach: the first step is the segmentation of .dex file into
segments of different entropy levels, while the second one is the edit distance calculation for apps
comparison
4.6.4 Experimental evaluation: Study definition
In order to evaluate the effectiveness of the HMM and Structural Entropy in detect-
ing Android malware and in correctly classifying the family a malware belongs to, we
carried out an experimentation.
Research Questions
The study poses four research questions:
• RQ1: is a HMM based detector able to discriminate a malware from a trusted
application for smartphones?
• RQ2: is a HMM based detector able to identify the family of a malware appli-
cation?
• RQ3: is the Structural Entropy similarity able to discriminate a malware from
a trusted application?
• RQ4: is the Structural Entropy similarity able to identify the family of a mal-
ware application?
The Analysis Method
We extracted 3 features (f1, f2, f3) with the method of HMM, and one feature (f4)
with the method of structural entropy one .
123
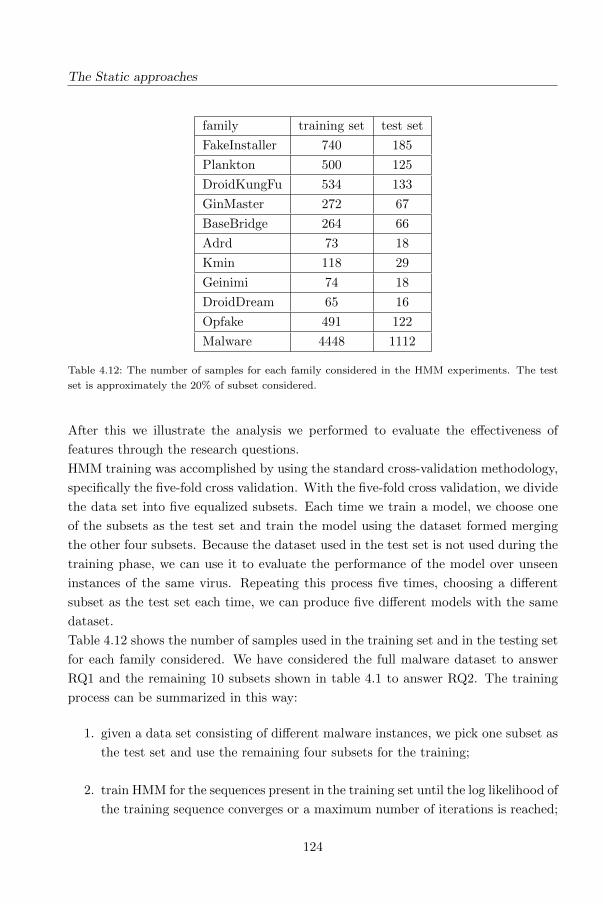
The Static approaches
family training set test set
FakeInstaller 740 185
Plankton 500 125
DroidKungFu 534 133
GinMaster 272 67
BaseBridge 264 66
Adrd 73 18
Kmin 118 29
Geinimi 74 18
DroidDream 65 16
Opfake 491 122
Malware 4448 1112
Table 4.12: The number of samples for each family considered in the HMM experiments. The test
set is approximately the 20% of subset considered.
After this we illustrate the analysis we performed to evaluate the effectiveness of
features through the research questions.
HMM training was accomplished by using the standard cross-validation methodology,
specifically the five-fold cross validation. With the five-fold cross validation, we divide
the data set into five equalized subsets. Each time we train a model, we choose one
of the subsets as the test set and train the model using the dataset formed merging
the other four subsets. Because the dataset used in the test set is not used during the
training phase, we can use it to evaluate the performance of the model over unseen
instances of the same virus. Repeating this process five times, choosing a different
subset as the test set each time, we can produce five different models with the same
dataset.
Table 4.12 shows the number of samples used in the training set and in the testing set
for each family considered. We have considered the full malware dataset to answer
RQ1 and the remaining 10 subsets shown in table 4.1 to answer RQ2. The training
process can be summarized in this way:
1. given a data set consisting of different malware instances, we pick one subset as
the test set and use the remaining four subsets for the training;
2. train HMM for the sequences present in the training set until the log likelihood of
the training sequence converges or a maximum number of iterations is reached;
124
4.6. Technique #4: A HMM and Structural Entropy based detector for AndroidMalware
3. compute the score, i.e., the log likelihood of malware in the test set and other
files in the comparison set;
4. repeat from (1), choosing a different subset as the test set, until all five subsets
have been chosen.
Each training was performed for N=3,4,5 hidden states.
When the training process is over, every app in the dataset is associated to a score
for the subset considered.
Using HMM with 3,4 and 5 hidden states, as result we have three scores i.e. three
features for every app (f1 = HMM score with 3 hidden states, f2 = HMM score with
4 hidden states, f3 = HMM score with 5 hidden states).
With regard to the structural entropy, we want to evaluate the similarity of an appli-
cation X with a population Xp, we first need to calculate the structural entropy of
X and the structural entropy of Xp. Once we have this two values, we can calculate
the similarity between them and obtain an evaluation of the similarity between (the
structural entropy of) X and (the structural entropy of) Xp.The structural entropy
of Xp is the arithmetic mean of the structural entropies of all the applications Xpi
belonging to the population Xp.
In particular, for answering RQ3 we evaluated:
• the similarity between each malware application (X) and the full malware
dataset (Xp);
• the similarity between each trusted application (X) and the full trusted dataset
(Xp).
Meanwhile, in order to answer RQ4 we calculated:
• the similarity between each malware application (X) and the full set of appli-
cations belonging to the same family (Xp).
When the process is over, every app in the dataset is associated to a score for the
subset considered (f4 = structural entropy, as defined previously).
Similarly to HMM, even for the Structural Entropy we have considered the full mal-
ware dataset to answer RQ3 and the 10 subsets in table 4.1 to answer RQ4: the
reason for this choice has been explained previously.
Two kinds of analysis were performed: hypothesis testing and classification.
The test of hypothesis was aimed at understanding whether the features the model
125
The Static approaches
consists of are able to produce a statistically significant difference between the two
samples, malware and trusted.
The classification was aimed to determine whether the features extracted allowed
to associate correctly an application to the malware class or the trusted class, and
whether the features allowed to correctly associate each malware to the family it re-
ally belongs to .
After extracting the features we tested the following null hypothesis:
H0 : malware and trusted applications have similar values of the proposed features.
The H0 states that, given the i-th feature fi, if fiT denotes the value of the feature
fi measured on a trusted application, and fiM denoted the value of the same feature
measured on a malicious application:
σ(fiT ) = σ(fiM ) for i=1,...,4
being σ(fi) the means of the (control or experimental) sample for the feature fi.
The null hypothesis was tested with Mann-Whitney (with the p-level fixed to 0.05)
and with Kolmogorov-Smirnov Test (with the p-level fixed to 0.05). Two different
tests of hypotheses were performed in order to have a stronger internal validity.
The classification analysis was aimed at assessing whether the features where able to
correctly classify malicious and trusted applications.
The algorithms were applied to each of the four features.
Six algorithms of classification were used: J48, LadTree, NBTree, RandomForest,
RandomTree, RepTree. Similarly to hypothesis testing, different algorithms for clas-
sification were used for strengthening the internal validity.
4.6.5 Analysis of Results
The hypothesis test produced evidence that the considered features have different
distributions in the control and experimental sample, as shown in table 4.13. As a
matter of fact, all the p-values are under 0.001.
126
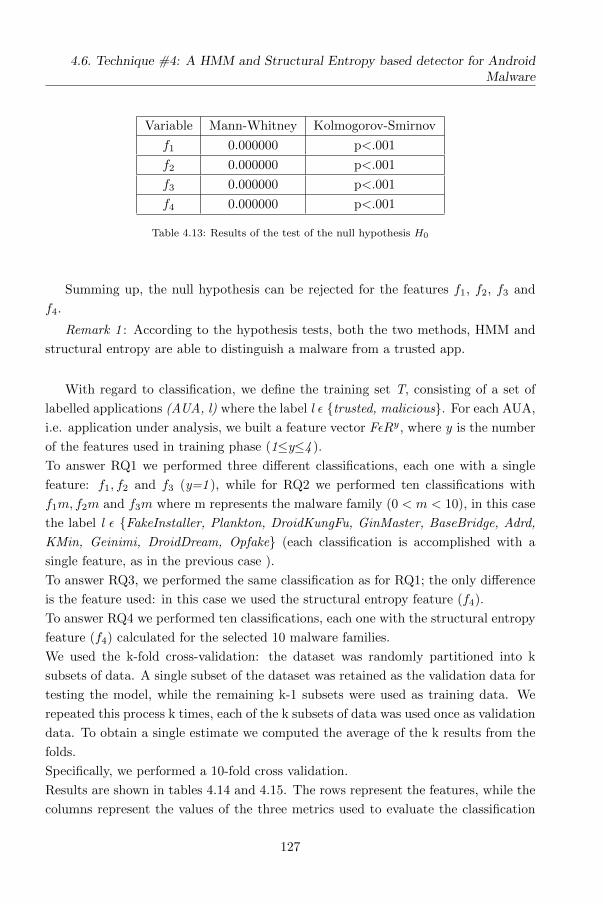
4.6. Technique #4: A HMM and Structural Entropy based detector for AndroidMalware
Variable Mann-Whitney Kolmogorov-Smirnov
f1 0.000000 p<.001
f2 0.000000 p<.001
f3 0.000000 p<.001
f4 0.000000 p<.001
Table 4.13: Results of the test of the null hypothesis H0
Summing up, the null hypothesis can be rejected for the features f1, f2, f3 and
f4.
Remark 1 : According to the hypothesis tests, both the two methods, HMM and
structural entropy are able to distinguish a malware from a trusted app.
With regard to classification, we define the training set T, consisting of a set of
labelled applications (AUA, l) where the label l ε {trusted, malicious}. For each AUA,
i.e. application under analysis, we built a feature vector FεRy, where y is the number
of the features used in training phase (1≤y≤4 ).
To answer RQ1 we performed three different classifications, each one with a single
feature: f1, f2 and f3 (y=1 ), while for RQ2 we performed ten classifications with
f1m, f2m and f3m where m represents the malware family (0 < m < 10), in this case
the label l ε {FakeInstaller, Plankton, DroidKungFu, GinMaster, BaseBridge, Adrd,
KMin, Geinimi, DroidDream, Opfake} (each classification is accomplished with a
single feature, as in the previous case ).
To answer RQ3, we performed the same classification as for RQ1; the only difference
is the feature used: in this case we used the structural entropy feature (f4).
To answer RQ4 we performed ten classifications, each one with the structural entropy
feature (f4) calculated for the selected 10 malware families.
We used the k-fold cross-validation: the dataset was randomly partitioned into k
subsets of data. A single subset of the dataset was retained as the validation data for
testing the model, while the remaining k-1 subsets were used as training data. We
repeated this process k times, each of the k subsets of data was used once as validation
data. To obtain a single estimate we computed the average of the k results from the
folds.
Specifically, we performed a 10-fold cross validation.
Results are shown in tables 4.14 and 4.15. The rows represent the features, while the
columns represent the values of the three metrics used to evaluate the classification
127
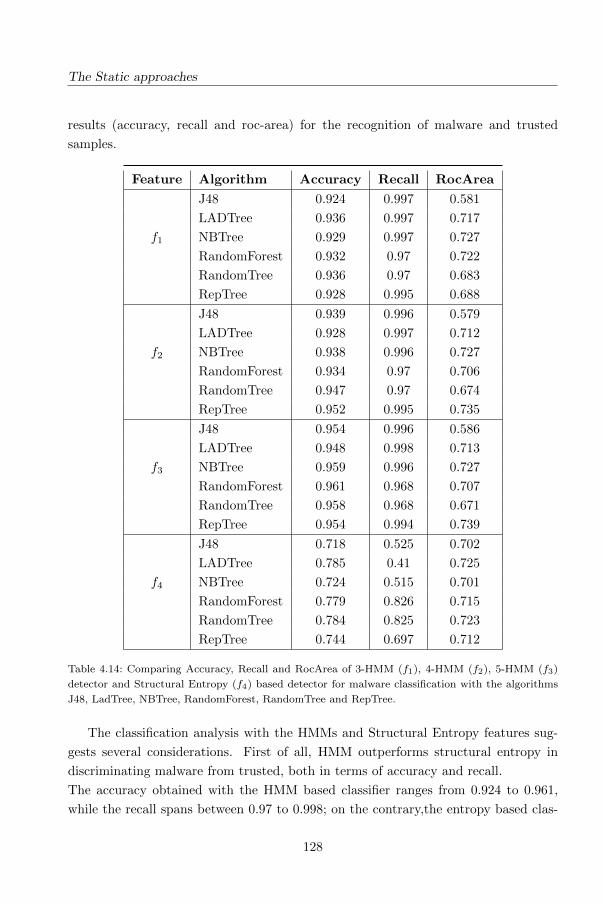
The Static approaches
results (accuracy, recall and roc-area) for the recognition of malware and trusted
samples.
Feature Algorithm Accuracy Recall RocArea
J48 0.924 0.997 0.581
LADTree 0.936 0.997 0.717
f1 NBTree 0.929 0.997 0.727
RandomForest 0.932 0.97 0.722
RandomTree 0.936 0.97 0.683
RepTree 0.928 0.995 0.688
J48 0.939 0.996 0.579
LADTree 0.928 0.997 0.712
f2 NBTree 0.938 0.996 0.727
RandomForest 0.934 0.97 0.706
RandomTree 0.947 0.97 0.674
RepTree 0.952 0.995 0.735
J48 0.954 0.996 0.586
LADTree 0.948 0.998 0.713
f3 NBTree 0.959 0.996 0.727
RandomForest 0.961 0.968 0.707
RandomTree 0.958 0.968 0.671
RepTree 0.954 0.994 0.739
J48 0.718 0.525 0.702
LADTree 0.785 0.41 0.725
f4 NBTree 0.724 0.515 0.701
RandomForest 0.779 0.826 0.715
RandomTree 0.784 0.825 0.723
RepTree 0.744 0.697 0.712
Table 4.14: Comparing Accuracy, Recall and RocArea of 3-HMM (f1), 4-HMM (f2), 5-HMM (f3)
detector and Structural Entropy (f4) based detector for malware classification with the algorithms
J48, LadTree, NBTree, RandomForest, RandomTree and RepTree.
The classification analysis with the HMMs and Structural Entropy features sug-
gests several considerations. First of all, HMM outperforms structural entropy in
discriminating malware from trusted, both in terms of accuracy and recall.
The accuracy obtained with the HMM based classifier ranges from 0.924 to 0.961,
while the recall spans between 0.97 to 0.998; on the contrary,the entropy based clas-
128
4.6. Technique #4: A HMM and Structural Entropy based detector for AndroidMalware
sifier’s accuracy has values all around 0.75, while the greatest recall is 0.826.
It would seem that the performances of the HMM based detector could depend on the
number of hidden states, as accuracy increases with the number of hidden states.The
roc area values signal that the accuracy is fair, but it will be desiderable to have a
value of roc area of 0.9 for having a perfect test.
However the differences in performances among 3,4 and 5 states of the HMM detector
are not that significant. This result is consistent with the one obtained with meta-
morphic malware [61].
Regarding the detection of the malware’s families, whose results are reported in table
4.15, the structural entropy reveals to be the best feature to use in the classifica-
tion, reaching in many cases values of accuracy greater 0.9. This is not a completely
unexpected outcome, as the structural entropy is a measure of similarity between
executable files, and apps belonging to the same family are supposed to share some
parts of the code. Moreover, structural entropy seems to be very effective for some
families, like Opfake, Kmin, DroidKungFu, and less for others, but even the smallest
values of accuracy and recall remain enough acceptable. It is important to observe
that the values of roc area for the structural entropy are high, in many cases over 0.9.
So the accuracy of the classification is perfect for the structural entropy, except for
Gemini and DroidDream family.
Remark 2 : HMM is not effective for detecting malware families, even if the values
of accuracy and recall in some cases are close to 0.8, which represents not a totally
bad performance.
It is worth noticing that in this case the rocarea is close to 0.9 for many tests
which use HMM. This implies that for recognizing malware families, the tests with
HMM have a good accuracy.
Remark 3 : The structural entropy performs better in recognizing the malware
families with polymorphic malware.
As a matter of fact the best outcomes are obtained with Opfake, that is polimor-
phic. This is consistent with the results of similar studies on PC’c viruses [61, 65].
In the following, we respond in detail to the research questions and justify answers
with descriptive statistics and the results of the classification.
129
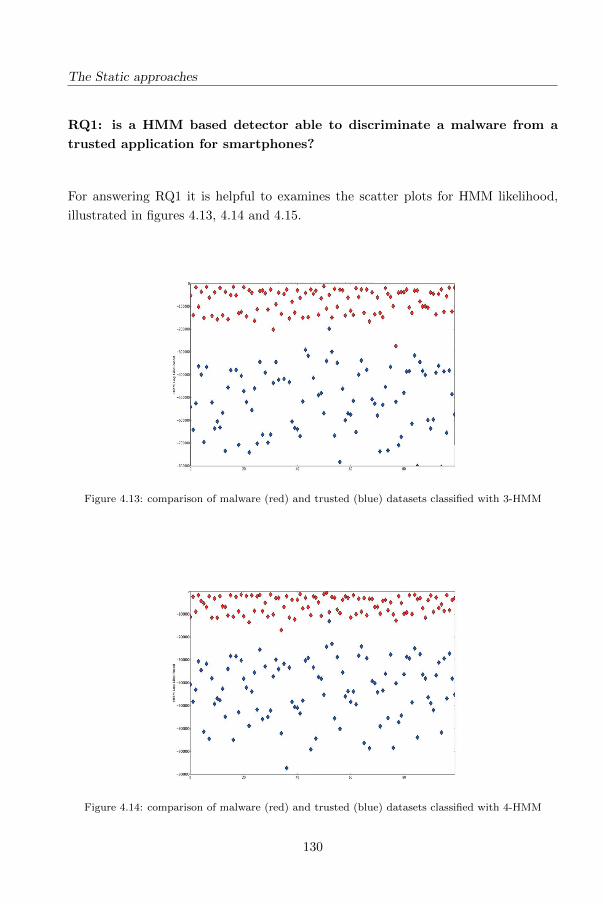
The Static approaches
RQ1: is a HMM based detector able to discriminate a malware from a
trusted application for smartphones?
For answering RQ1 it is helpful to examines the scatter plots for HMM likelihood,
illustrated in figures 4.13, 4.14 and 4.15.
Figure 4.13: comparison of malware (red) and trusted (blue) datasets classified with 3-HMM
Figure 4.14: comparison of malware (red) and trusted (blue) datasets classified with 4-HMM
130
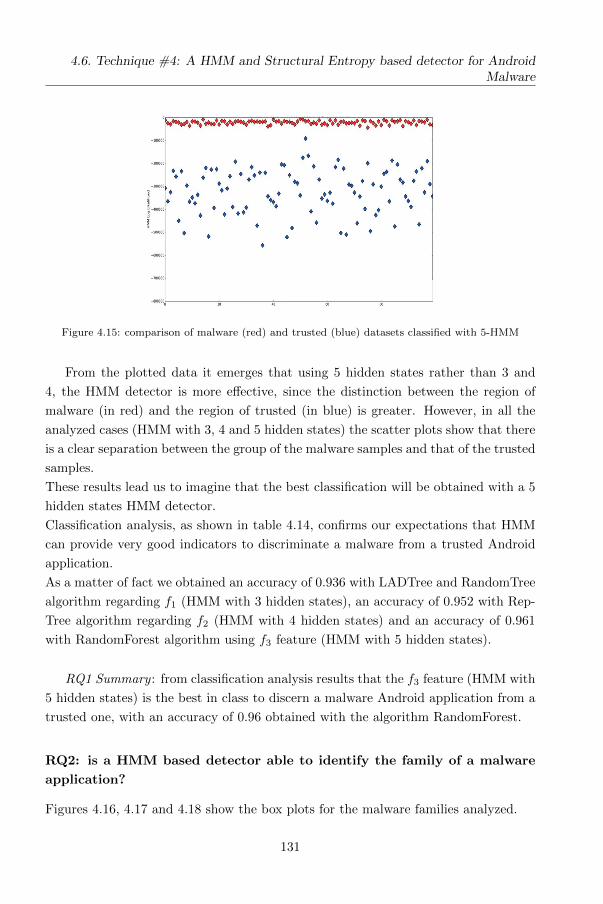
4.6. Technique #4: A HMM and Structural Entropy based detector for AndroidMalware
Figure 4.15: comparison of malware (red) and trusted (blue) datasets classified with 5-HMM
From the plotted data it emerges that using 5 hidden states rather than 3 and
4, the HMM detector is more effective, since the distinction between the region of
malware (in red) and the region of trusted (in blue) is greater. However, in all the
analyzed cases (HMM with 3, 4 and 5 hidden states) the scatter plots show that there
is a clear separation between the group of the malware samples and that of the trusted
samples.
These results lead us to imagine that the best classification will be obtained with a 5
hidden states HMM detector.
Classification analysis, as shown in table 4.14, confirms our expectations that HMM
can provide very good indicators to discriminate a malware from a trusted Android
application.
As a matter of fact we obtained an accuracy of 0.936 with LADTree and RandomTree
algorithm regarding f1 (HMM with 3 hidden states), an accuracy of 0.952 with Rep-
Tree algorithm regarding f2 (HMM with 4 hidden states) and an accuracy of 0.961
with RandomForest algorithm using f3 feature (HMM with 5 hidden states).
RQ1 Summary : from classification analysis results that the f3 feature (HMM with
5 hidden states) is the best in class to discern a malware Android application from a
trusted one, with an accuracy of 0.96 obtained with the algorithm RandomForest.
RQ2: is a HMM based detector able to identify the family of a malware
application?
Figures 4.16, 4.17 and 4.18 show the box plots for the malware families analyzed.
131
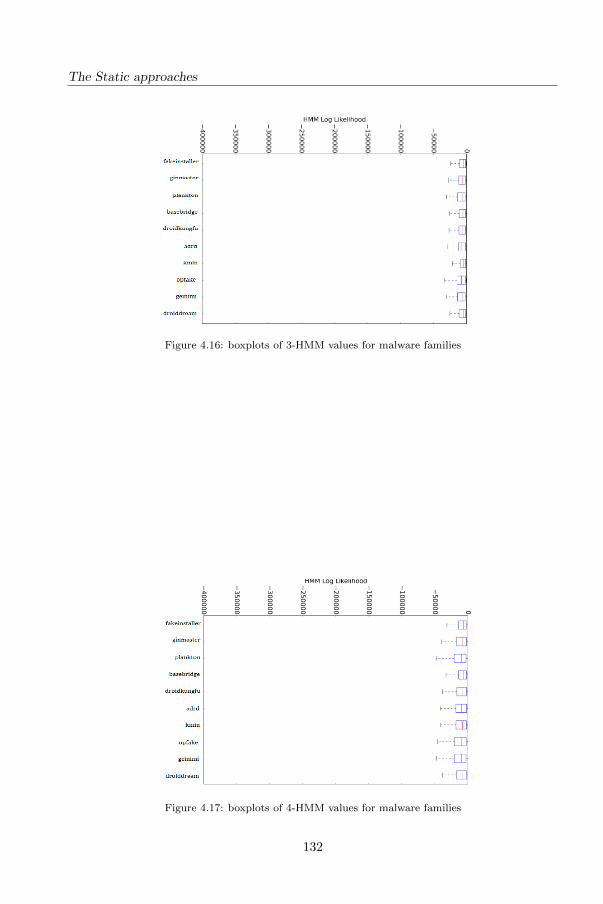
The Static approaches
Figure 4.16: boxplots of 3-HMM values for malware families
Figure 4.17: boxplots of 4-HMM values for malware families
132
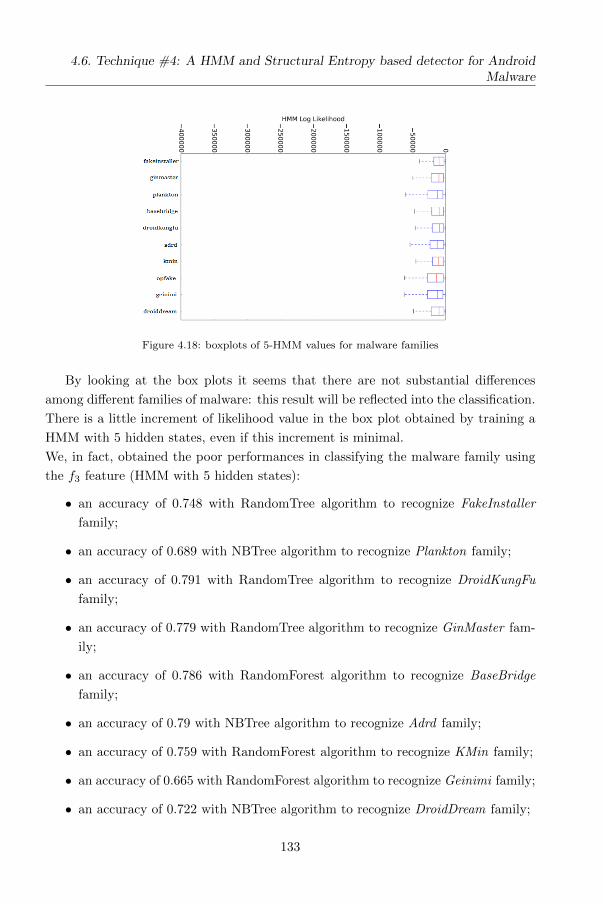
4.6. Technique #4: A HMM and Structural Entropy based detector for AndroidMalware
Figure 4.18: boxplots of 5-HMM values for malware families
By looking at the box plots it seems that there are not substantial differences
among different families of malware: this result will be reflected into the classification.
There is a little increment of likelihood value in the box plot obtained by training a
HMM with 5 hidden states, even if this increment is minimal.
We, in fact, obtained the poor performances in classifying the malware family using
the f3 feature (HMM with 5 hidden states):
• an accuracy of 0.748 with RandomTree algorithm to recognize FakeInstaller
family;
• an accuracy of 0.689 with NBTree algorithm to recognize Plankton family;
• an accuracy of 0.791 with RandomTree algorithm to recognize DroidKungFu
family;
• an accuracy of 0.779 with RandomTree algorithm to recognize GinMaster fam-
ily;
• an accuracy of 0.786 with RandomForest algorithm to recognize BaseBridge
family;
• an accuracy of 0.79 with NBTree algorithm to recognize Adrd family;
• an accuracy of 0.759 with RandomForest algorithm to recognize KMin family;
• an accuracy of 0.665 with RandomForest algorithm to recognize Geinimi family;
• an accuracy of 0.722 with NBTree algorithm to recognize DroidDream family;
133
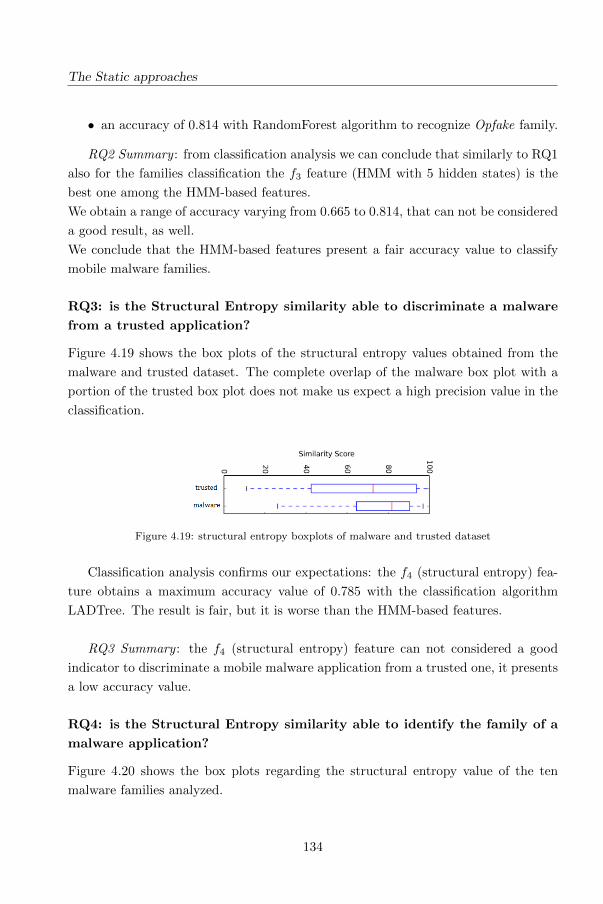
The Static approaches
• an accuracy of 0.814 with RandomForest algorithm to recognize Opfake family.
RQ2 Summary : from classification analysis we can conclude that similarly to RQ1
also for the families classification the f3 feature (HMM with 5 hidden states) is the
best one among the HMM-based features.
We obtain a range of accuracy varying from 0.665 to 0.814, that can not be considered
a good result, as well.
We conclude that the HMM-based features present a fair accuracy value to classify
mobile malware families.
RQ3: is the Structural Entropy similarity able to discriminate a malware
from a trusted application?
Figure 4.19 shows the box plots of the structural entropy values obtained from the
malware and trusted dataset. The complete overlap of the malware box plot with a
portion of the trusted box plot does not make us expect a high precision value in the
classification.
Figure 4.19: structural entropy boxplots of malware and trusted dataset
Classification analysis confirms our expectations: the f4 (structural entropy) fea-
ture obtains a maximum accuracy value of 0.785 with the classification algorithm
LADTree. The result is fair, but it is worse than the HMM-based features.
RQ3 Summary : the f4 (structural entropy) feature can not considered a good
indicator to discriminate a mobile malware application from a trusted one, it presents
a low accuracy value.
RQ4: is the Structural Entropy similarity able to identify the family of a
malware application?
Figure 4.20 shows the box plots regarding the structural entropy value of the ten
malware families analyzed.
134
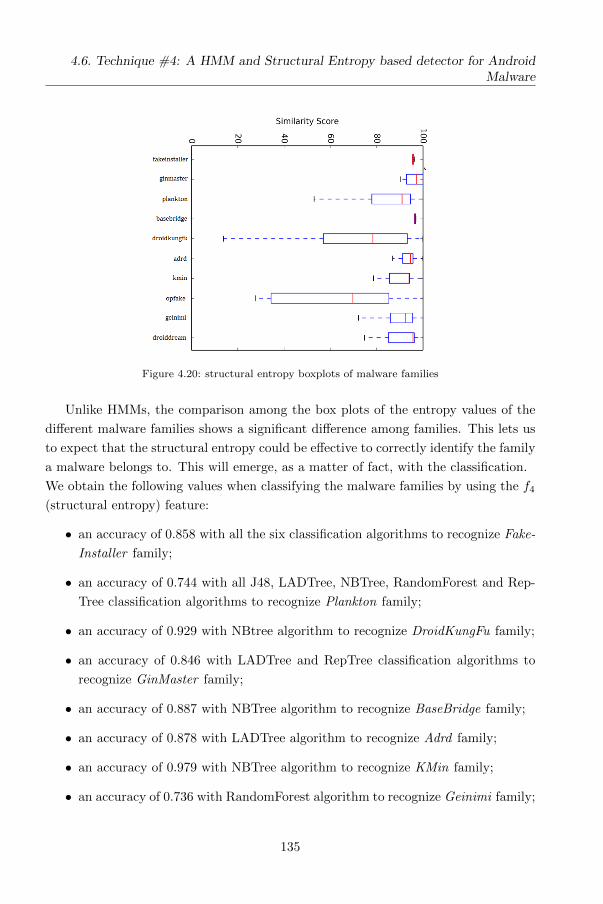
4.6. Technique #4: A HMM and Structural Entropy based detector for AndroidMalware
Figure 4.20: structural entropy boxplots of malware families
Unlike HMMs, the comparison among the box plots of the entropy values of the
different malware families shows a significant difference among families. This lets us
to expect that the structural entropy could be effective to correctly identify the family
a malware belongs to. This will emerge, as a matter of fact, with the classification.
We obtain the following values when classifying the malware families by using the f4
(structural entropy) feature:
• an accuracy of 0.858 with all the six classification algorithms to recognize Fake-
Installer family;
• an accuracy of 0.744 with all J48, LADTree, NBTree, RandomForest and Rep-
Tree classification algorithms to recognize Plankton family;
• an accuracy of 0.929 with NBtree algorithm to recognize DroidKungFu family;
• an accuracy of 0.846 with LADTree and RepTree classification algorithms to
recognize GinMaster family;
• an accuracy of 0.887 with NBTree algorithm to recognize BaseBridge family;
• an accuracy of 0.878 with LADTree algorithm to recognize Adrd family;
• an accuracy of 0.979 with NBTree algorithm to recognize KMin family;
• an accuracy of 0.736 with RandomForest algorithm to recognize Geinimi family;
135
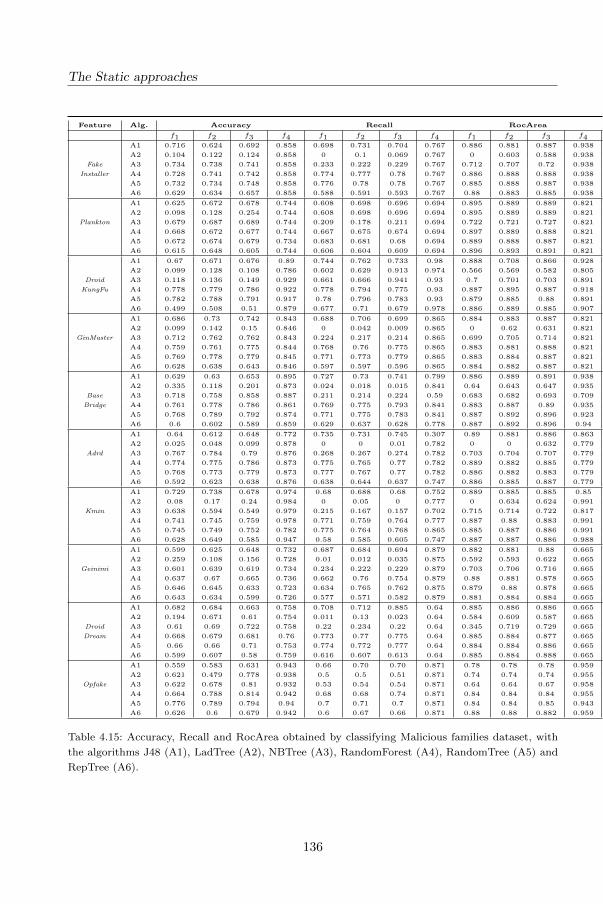
The Static approaches
Feature Alg. Accuracy Recall RocArea
f1 f2 f3 f4 f1 f2 f3 f4 f1 f2 f3 f4A1 0.716 0.624 0.692 0.858 0.698 0.731 0.704 0.767 0.886 0.881 0.887 0.938
A2 0.104 0.122 0.124 0.858 0 0.1 0.069 0.767 0 0.603 0.588 0.938
Fake A3 0.734 0.738 0.741 0.858 0.233 0.222 0.229 0.767 0.712 0.707 0.72 0.938
Installer A4 0.728 0.741 0.742 0.858 0.774 0.777 0.78 0.767 0.886 0.888 0.888 0.938
A5 0.732 0.734 0.748 0.858 0.776 0.78 0.78 0.767 0.885 0.888 0.887 0.938
A6 0.629 0.634 0.657 0.858 0.588 0.591 0.593 0.767 0.88 0.883 0.885 0.938
A1 0.625 0.672 0.678 0.744 0.608 0.698 0.696 0.694 0.895 0.889 0.889 0.821
A2 0.098 0.128 0.254 0.744 0.608 0.698 0.696 0.694 0.895 0.889 0.889 0.821
Plankton A3 0.679 0.687 0.689 0.744 0.209 0.178 0.211 0.694 0.722 0.721 0.727 0.821
A4 0.668 0.672 0.677 0.744 0.667 0.675 0.674 0.694 0.897 0.889 0.888 0.821
A5 0.672 0.674 0.679 0.734 0.683 0.681 0.68 0.694 0.889 0.888 0.887 0.821
A6 0.615 0.648 0.605 0.744 0.606 0.604 0.609 0.694 0.896 0.893 0.891 0.821
A1 0.67 0.671 0.676 0.89 0.744 0.762 0.733 0.98 0.888 0.708 0.866 0.928
A2 0.099 0.128 0.108 0.786 0.602 0.629 0.913 0.974 0.566 0.569 0.582 0.805
Droid A3 0.118 0.136 0.149 0.929 0.661 0.666 0.941 0.93 0.7 0.701 0.703 0.891
KungFu A4 0.778 0.779 0.786 0.922 0.778 0.794 0.775 0.93 0.887 0.895 0.887 0.918
A5 0.782 0.788 0.791 0.917 0.78 0.796 0.783 0.93 0.879 0.885 0.88 0.891
A6 0.499 0.508 0.51 0.879 0.677 0.71 0.679 0.978 0.886 0.889 0.885 0.907
A1 0.686 0.73 0.742 0.843 0.688 0.706 0.699 0.865 0.884 0.883 0.887 0.821
A2 0.099 0.142 0.15 0.846 0 0.042 0.009 0.865 0 0.62 0.631 0.821
GinMaster A3 0.712 0.762 0.762 0.843 0.224 0.217 0.214 0.865 0.699 0.705 0.714 0.821
A4 0.759 0.761 0.775 0.844 0.768 0.76 0.775 0.865 0.883 0.881 0.888 0.821
A5 0.769 0.778 0.779 0.845 0.771 0.773 0.779 0.865 0.883 0.884 0.887 0.821
A6 0.628 0.638 0.643 0.846 0.597 0.597 0.596 0.865 0.884 0.882 0.887 0.821
A1 0.629 0.63 0.653 0.895 0.727 0.73 0.741 0.799 0.886 0.889 0.891 0.938
A2 0.335 0.118 0.201 0.873 0.024 0.018 0.015 0.841 0.64 0.643 0.647 0.935
Base A3 0.718 0.758 0.858 0.887 0.211 0.214 0.224 0.59 0.683 0.682 0.693 0.709
Bridge A4 0.761 0.778 0.786 0.861 0.769 0.775 0.793 0.841 0.883 0.887 0.89 0.935
A5 0.768 0.789 0.792 0.874 0.771 0.775 0.783 0.841 0.887 0.892 0.896 0.923
A6 0.6 0.602 0.589 0.859 0.629 0.637 0.628 0.778 0.887 0.892 0.896 0.94
A1 0.64 0.612 0.648 0.772 0.735 0.731 0.745 0.307 0.89 0.881 0.886 0.863
A2 0.025 0.048 0.099 0.878 0 0 0.01 0.782 0 0 0.632 0.779
Adrd A3 0.767 0.784 0.79 0.876 0.268 0.267 0.274 0.782 0.703 0.704 0.707 0.779
A4 0.774 0.775 0.786 0.873 0.775 0.765 0.77 0.782 0.889 0.882 0.885 0.779
A5 0.768 0.773 0.779 0.873 0.777 0.767 0.77 0.782 0.886 0.882 0.883 0.779
A6 0.592 0.623 0.638 0.876 0.638 0.644 0.637 0.747 0.886 0.885 0.887 0.779
A1 0.729 0.738 0.678 0.974 0.68 0.688 0.68 0.752 0.889 0.885 0.885 0.85
A2 0.08 0.17 0.24 0.984 0 0.05 0 0.777 0 0.634 0.624 0.991
Kmin A3 0.638 0.594 0.549 0.979 0.215 0.167 0.157 0.702 0.715 0.714 0.722 0.817
A4 0.741 0.745 0.759 0.978 0.771 0.759 0.764 0.777 0.887 0.88 0.883 0.991
A5 0.745 0.749 0.752 0.782 0.775 0.764 0.768 0.865 0.885 0.887 0.886 0.991
A6 0.628 0.649 0.585 0.947 0.58 0.585 0.605 0.747 0.887 0.887 0.886 0.988
A1 0.599 0.625 0.648 0.732 0.687 0.684 0.694 0.879 0.882 0.881 0.88 0.665
A2 0.259 0.108 0.156 0.728 0.01 0.012 0.035 0.875 0.592 0.593 0.622 0.665
Geinimi A3 0.601 0.639 0.619 0.734 0.234 0.222 0.229 0.879 0.703 0.706 0.716 0.665
A4 0.637 0.67 0.665 0.736 0.662 0.76 0.754 0.879 0.88 0.881 0.878 0.665
A5 0.646 0.645 0.633 0.723 0.634 0.765 0.762 0.875 0.879 0.88 0.878 0.665
A6 0.643 0.634 0.599 0.726 0.577 0.571 0.582 0.879 0.881 0.884 0.884 0.665
A1 0.682 0.684 0.663 0.758 0.708 0.712 0.885 0.64 0.885 0.886 0.886 0.665
A2 0.194 0.671 0.61 0.754 0.011 0.13 0.023 0.64 0.584 0.609 0.587 0.665
Droid A3 0.61 0.69 0.722 0.758 0.22 0.234 0.22 0.64 0.345 0.719 0.729 0.665
Dream A4 0.668 0.679 0.681 0.76 0.773 0.77 0.775 0.64 0.885 0.884 0.877 0.665
A5 0.66 0.66 0.71 0.753 0.774 0.772 0.777 0.64 0.884 0.884 0.886 0.665
A6 0.599 0.607 0.58 0.759 0.616 0.607 0.613 0.64 0.885 0.884 0.888 0.665
A1 0.559 0.583 0.631 0.943 0.66 0.70 0.70 0.871 0.78 0.78 0.78 0.959
A2 0.621 0.479 0.778 0.938 0.5 0.5 0.51 0.871 0.74 0.74 0.74 0.955
Opfake A3 0.622 0.678 0.81 0.932 0.53 0.54 0.54 0.871 0.64 0.64 0.67 0.958
A4 0.664 0.788 0.814 0.942 0.68 0.68 0.74 0.871 0.84 0.84 0.84 0.955
A5 0.776 0.789 0.794 0.94 0.7 0.71 0.7 0.871 0.84 0.84 0.85 0.943
A6 0.626 0.6 0.679 0.942 0.6 0.67 0.66 0.871 0.88 0.88 0.882 0.959
Table 4.15: Accuracy, Recall and RocArea obtained by classifying Malicious families dataset, with
the algorithms J48 (A1), LadTree (A2), NBTree (A3), RandomForest (A4), RandomTree (A5) and
RepTree (A6).
136
4.6. Technique #4: A HMM and Structural Entropy based detector for AndroidMalware
• an accuracy of 0.759 with RepTree classification algorithm to recognize Droid-
Dream family;
• an accuracy of 0.943 with J48 classification algorithm to recognize Opfake family.
RQ4 Summary : the f4 (structural entropy) feature is the best in class to identify
the malware family, with an accuracy from 0.744 to 0.979, respectively in case of
Geinimi family and KMin family.
137

Chapter 5
The Dynamic approaches
In following chapter we show the proposed approaches using dynamic analysis, based
on sequences of system calls. The assumption is that malicious behaviors (e.g., sending
high premium rate SMS, cyphering data for ransom, botnet capabilities, and so on)
are implemented by specific system calls sequences: yet, no apriori knowledge is
available about which sequences are associated with which malicious behaviors, in
particular in the mobile applications ecosystem where new malware and non-malware
applications continuously arise. Hence, we use Machine Learning to automatically
learn these associations (a sort of “fingerprint” of the malware); then we exploit
them to actually detect malware. Experimentation on 20 000 execution traces of 2000
applications (1000 of them being malware belonging to different malware families),
performed on a real device, shows promising results: we obtain a detection accuracy
of 97%. Moreover, we show that the proposed method can cope with the dynamism
of the mobile apps ecosystem, since it can detect unknown malware.
139
The Dynamic approaches
5.1 Technique #5: Detecting Android Malware us-
ing Sequences of System Calls
5.1.1 The method
In this study we propose an Android malware detection method based on sequences of
system calls. The assumption is that malicious behaviors (e.g., sending high premium
rate SMS, cyphering data for ransom, botnet capabilities, and so on) are implemented
by specific system calls sequences: yet, no apriori knowledge is available about which
sequences are associated with which malicious behaviors, in particular in the mobile
applications ecosystem where new malware and non-malware applications continu-
ously arise. Hence, we use Machine Learning to automatically learn these associa-
tions (a sort of “fingerprint” of the malware); then we exploit them to actually detect
malware. Experimentation on 20 000 execution traces of 2000 applications (1000 of
them being malware belonging to different malware families), performed on a real
device, shows promising results: we obtain a detection accuracy of 97%. Moreover,
we show that the proposed method can cope with the dynamism of the mobile apps
ecosystem, since it can detect unknown malware.
Our assumption is that the behavior similarities among malicious apps could be
used to detect new malware. We chose to characterize behavior in terms of sequences
of system calls as this representation is, on the one hand, specific enough to capture
the app behavior and, on the other hand, it is generic enough to be robust to cam-
ouflage techniques aimed at hiding the behavior. In other words, we assume that the
frequencies of a set of system calls sequences may represent a sort of fingerprint of the
malicious behavior. Thus, new malware should be recognized when that fingerprint
is found.
The contributions of this method based on dynamic analysis can be summarized
as follows:
1. We designed a method for (i) automatically selecting, among the very large
number of possible system calls sequences, those which are the most useful for
malware detection, and, (ii) given the fingerprint defined in terms of frequencies
of the selected system calls sequences, classifying an execution trace as malware
or non-malware.
2. We performed an extensive experimental evaluation using a real device on which
we executed 2000 apps for a total of 20 000 runs: we found that our method
delivers an accuracy up to 97%. We remark that, in most cases, previous works
140
5.1. Technique #5: Detecting Android Malware using Sequences of System Calls
based on dynamic analysis validated their proposals using emulators and modi-
fied kernels, which produce outcomes which are less realistic than the outcomes
deriving from real devices, i.e., the one used in this experimentation.
3. We assessed our method also in the more challenging scenario of zero-day at-
tacks, where the detection is applied to new malware applications or new mal-
ware families, i.e., to applications whose behavior has never observed before
(and hence has not be exploited to build the fingerprint).
5.1.2 The detection method
We consider the problem of classifying an execution trace of a mobile application as
trusted or malicious, i.e., classifying the corresponding application as non-malware
or malware. An execution trace is a sequence t in which each element represents a
system call being issued by the application under analysis (AUA): we consider only
the function name and discard all the parameters values. We denote by C the set of
all the possible system calls, i.e., the alphabet to which symbols forming a sequence
t belong.
A system call is the mechanism used by a user-level process or application layer
to request a kernel level service to the operating system, such as power management,
memory, process life-cycle, network connection, device security, access to hardware re-
sources [129]. When performed, a system call implies a shift from user mode to kernel
mode: this allows the kernel of the operating system to perform sensitive opera-
tions. When the task carried out by the invoked system call is completed, the control
is returned to the user mode. In [58] Android kernel invocations are sub-grouped
into: (i) system calls which directly invoke the native kernel functionality; (ii) binder
calls, which support the invocation of Binder driver in the kernel (Binder is a system
for inter-process communication); and (iii) socket calls, which allow read/write com-
mands and send data to/from a Linux socket. System calls are not called directly
by a user process: they are invoked through interrupts, or by means of asynchronous
signals indicating requests for a particular service sent by the running process to the
operating system. A Linux kernel (which the Android system builds on) has more
than 250 system calls: our method considers all the system calls generated by the
AUA when running.
The classification method here proposed consists of two phases, the training phase,
in which a classifier is built on a set of labeled examples, and the actual classification
phase, in which a trace is classified by the classifier.
141
The Dynamic approaches
In the training phase, we proceed as follows. Let T be a set of labeled examples,
i.e., a set of pairs (t, l) where t is a trace and l ∈ {trusted,malicious} is a label. We
first transform each trace t in a feature vector f(t) ∈ [0, 1]|C|n
, where n is a parameter.
Each element of f(t) represents the relative occurrences of a given n-long subsequence
of system calls in t. For example, let n = 3 and let f2711(t) represents the relative
occurrences of the subsequence {open, stat64, open} in t, then f2711(t) is obtained as
the number of occurrences of that subsequence divided by the sequence length |t|.The number |C|n of different features may be remarkably large: for this reason, we
perform a feature selection procedure aimed at selecting only the k feature which best
discriminate between trusted and malicious applications in T . The feature selection
procedure comprises of two steps. Let Tt and Tm be respectively the set of trusted
and malicious traces, i.e., Tt := {(t, l) ∈ T : l = trusted} and Tt := {(t, l) ∈ T : l =
malicious}.In the first step, we compute, for each ith feature, the relative class difference δi
as:
δi =
∣∣∣ 1|Tt|∑
(t,l)∈Ttfi(t)− 1
|Tm|∑
(t,l)∈Tmfi(t)
∣∣∣max(t,l)∈T fi(t)
We then select the k′ � k features with the greatest δi—among those for which
max(t,l)∈T fi(t) > 0.
In the second step, we compute, for each ith feature among the k′ selected at
the previous step, the mutual information Ii with the label. We then select the k
features with the greatest Ii. During the exploratory analysis, we also experimented
with a feature selection procedure which took into account, during the second step,
the inter-dependencies among features: we found that it did not deliver better results.
Finally, we train a Support Vector Machine (SVM) on the selected features for
the traces contained in T : we use a Gaussian radial kernel with the cost parameter
set to 1.
The actual classification of an execution trace t is performed by computing the
corresponding feature vector f(t), retaining only the features obtained by the afore-
mentioned feature selection procedure, and then applying the trained classifier.
5.1.3 The evaluation
We performed an extensive experimental evaluation for the purpose of assessing our
method in the following detection scenarios:
• Unseen execution trace Ability to correctly classify an execution trace of an
142
5.1. Technique #5: Detecting Android Malware using Sequences of System Calls
application for which other execution traces where available during the training
phase.
• Unseen application Ability to correctly classify an execution trace of an appli-
cation for which no execution traces were available during the training phase,
but belonging to a malware family for which some traces were available during
the training phase.
• Unseen family Ability to correctly classify an execution trace of a malware
application belonging to a family for which no execution traces were available
during the training phase.
Clearly, the considered scenarios are differently challenging (the former is the least
challenging, the latter is the most challenging), since the amount of information avail-
able to the training phase, w.r.t. the AUA, is different. We investigated these scenarios
using a single dataset T , whose collection procedure is described in the next section,
and varying the experimental procedure, i.e., varying the way we built the training
set T and the testing set T ′ from T .
Applications
The malware dataset was obtained from the Drebin dataset. This dataset consists of a
total of 5560 applications belonging to 179 different families, classified as malware [59,
131]. To the best of our knowledge, this is the most recent dataset of mobile malware
applications currently used to evaluate malware detectors in literature.
The malware dataset includes 28 different families, unevenly represented in the
dataset. In order to improve the validity of the experiment, we randomly selected
1000 applications.
Execution traces
We aimed at collecting execution traces which were realistic. To this end, (i) we used
a real device, (ii) we generated a number of UI interactions and system events during
the execution, and (iii) we collected 10 execution traces for each application (totaling
20 000 traces), in order to mitigate the occurrence of rare conditions and to stress
several running options of the AUA.
More in detail, the executions were performed on a Google Nexus 5 with Android
4.4.4 (KitKat). The Nexus 5 is provided with a Qualcomm Snapdragon 800 chipset,
143
The Dynamic approaches
a 32-bit processor quad core 2.3 GHz Krait 400 CPU, an Adreno 330 450 MHz GPU,
and 2 GB of RAM. The used model had 16 GB of internal memory.
Concerning the UI interactions and system events, we used the monkey tool of
the Android Debug Brigde (ADB [36]) version 1.0.32. Monkey generates pseudo-
random streams of user events such as clicks, touches, or gestures; moreover, it can
simulate a number of system-level events. Specifically, we configured Monkey to send
2000 random UI events in one minute and to stimulate the Android operating system
with the following events (one every 5 s starting when the AUA is in foreground):
(1) reception of SMS; (2) incoming call; (3) call being answered (to simulate a con-
versation); (4) call being rejected; (5) network speed changed to GPRS; (6) network
speed changed to HSDPA; (7) battery status in charging; (8) battery status discharg-
ing; (9) battery status full; (10) battery status 50%; (11) battery status 0%; (12) boot
completed. This set of events was selected because it represents an acceptable cov-
erage of all possible events which an app can receive. Moreover, this list takes into
account the events which most frequently trigger the payload in Android malware,
according to [146, 147].
In order to collect the traces for an AUA, we built a script which interacts with
ADB and the connected device and performs the following procedure:
1. copies the AUA into the storage device;
2. installs the AUA (using the install command of ADB);
3. gets the package name and the class (activity/service) of the AUA with the
launcher intent (i.e., get the AUA entry point, needed for step 4);
4. starts the AUA (using the am start command of ADB);
5. gets the AUA process id (PID, needed for step 6);
6. starts system calls collection;
7. starts Monkey (using the monkey command of ADB), instructed to send UI and
system events;
8. waits 60 s;
9. kills the AUA (using the PID collected before);
10. uninstalls the AUA (using the uninstall command of ADB);
11. deletes the AUA from the device.
144
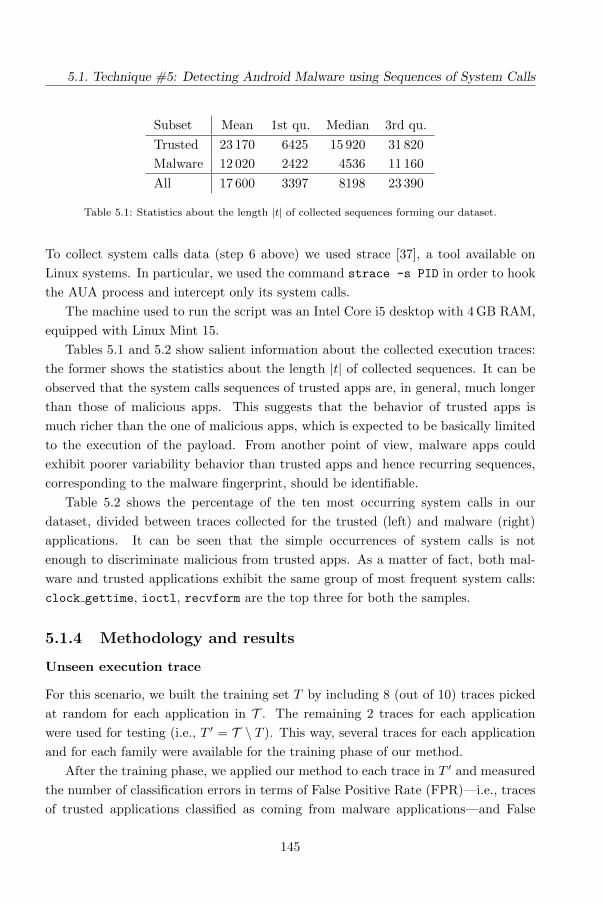
5.1. Technique #5: Detecting Android Malware using Sequences of System Calls
Subset Mean 1st qu. Median 3rd qu.
Trusted 23 170 6425 15 920 31 820
Malware 12 020 2422 4536 11 160
All 17 600 3397 8198 23 390
Table 5.1: Statistics about the length |t| of collected sequences forming our dataset.
To collect system calls data (step 6 above) we used strace [37], a tool available on
Linux systems. In particular, we used the command strace -s PID in order to hook
the AUA process and intercept only its system calls.
The machine used to run the script was an Intel Core i5 desktop with 4 GB RAM,
equipped with Linux Mint 15.
Tables 5.1 and 5.2 show salient information about the collected execution traces:
the former shows the statistics about the length |t| of collected sequences. It can be
observed that the system calls sequences of trusted apps are, in general, much longer
than those of malicious apps. This suggests that the behavior of trusted apps is
much richer than the one of malicious apps, which is expected to be basically limited
to the execution of the payload. From another point of view, malware apps could
exhibit poorer variability behavior than trusted apps and hence recurring sequences,
corresponding to the malware fingerprint, should be identifiable.
Table 5.2 shows the percentage of the ten most occurring system calls in our
dataset, divided between traces collected for the trusted (left) and malware (right)
applications. It can be seen that the simple occurrences of system calls is not
enough to discriminate malicious from trusted apps. As a matter of fact, both mal-
ware and trusted applications exhibit the same group of most frequent system calls:
clock gettime, ioctl, recvform are the top three for both the samples.
5.1.4 Methodology and results
Unseen execution trace
For this scenario, we built the training set T by including 8 (out of 10) traces picked
at random for each application in T . The remaining 2 traces for each application
were used for testing (i.e., T ′ = T \ T ). This way, several traces for each application
and for each family were available for the training phase of our method.
After the training phase, we applied our method to each trace in T ′ and measured
the number of classification errors in terms of False Positive Rate (FPR)—i.e., traces
of trusted applications classified as coming from malware applications—and False
145
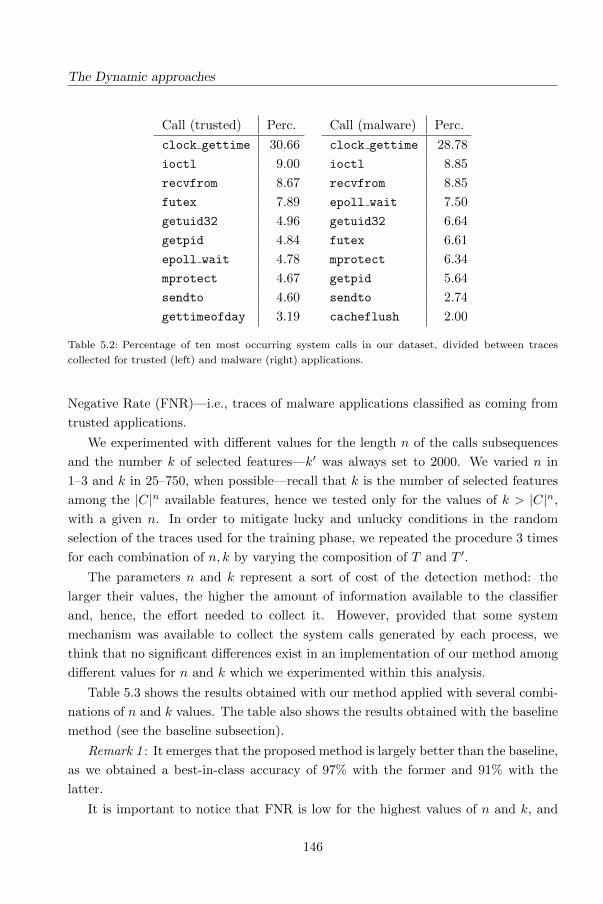
The Dynamic approaches
Call (trusted) Perc.
clock gettime 30.66
ioctl 9.00
recvfrom 8.67
futex 7.89
getuid32 4.96
getpid 4.84
epoll wait 4.78
mprotect 4.67
sendto 4.60
gettimeofday 3.19
Call (malware) Perc.
clock gettime 28.78
ioctl 8.85
recvfrom 8.85
epoll wait 7.50
getuid32 6.64
futex 6.61
mprotect 6.34
getpid 5.64
sendto 2.74
cacheflush 2.00
Table 5.2: Percentage of ten most occurring system calls in our dataset, divided between traces
collected for trusted (left) and malware (right) applications.
Negative Rate (FNR)—i.e., traces of malware applications classified as coming from
trusted applications.
We experimented with different values for the length n of the calls subsequences
and the number k of selected features—k′ was always set to 2000. We varied n in
1–3 and k in 25–750, when possible—recall that k is the number of selected features
among the |C|n available features, hence we tested only for the values of k > |C|n,
with a given n. In order to mitigate lucky and unlucky conditions in the random
selection of the traces used for the training phase, we repeated the procedure 3 times
for each combination of n, k by varying the composition of T and T ′.
The parameters n and k represent a sort of cost of the detection method: the
larger their values, the higher the amount of information available to the classifier
and, hence, the effort needed to collect it. However, provided that some system
mechanism was available to collect the system calls generated by each process, we
think that no significant differences exist in an implementation of our method among
different values for n and k which we experimented within this analysis.
Table 5.3 shows the results obtained with our method applied with several combi-
nations of n and k values. The table also shows the results obtained with the baseline
method (see the baseline subsection).
Remark 1 : It emerges that the proposed method is largely better than the baseline,
as we obtained a best-in-class accuracy of 97% with the former and 91% with the
latter.
It is important to notice that FNR is low for the highest values of n and k, and
146
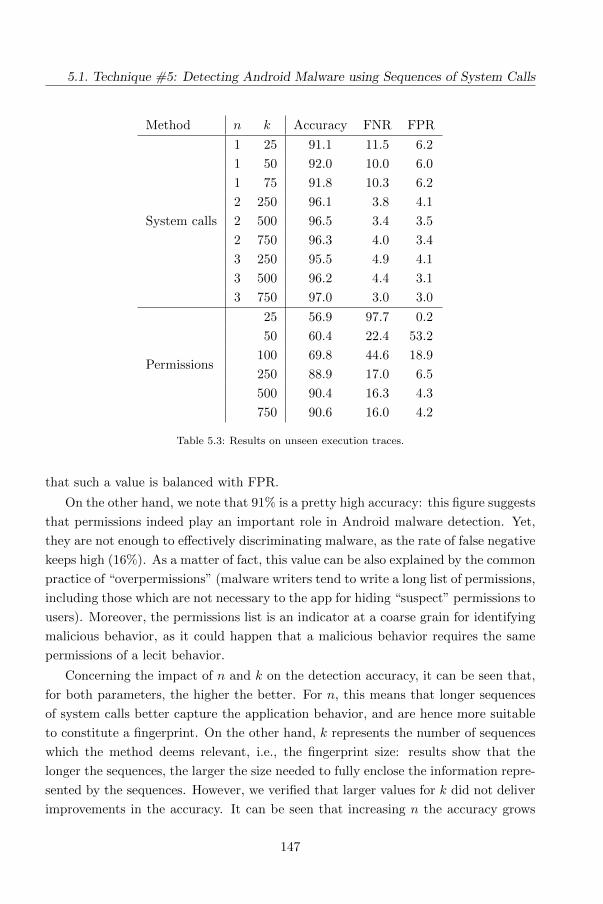
5.1. Technique #5: Detecting Android Malware using Sequences of System Calls
Method n k Accuracy FNR FPR
System calls
1 25 91.1 11.5 6.2
1 50 92.0 10.0 6.0
1 75 91.8 10.3 6.2
2 250 96.1 3.8 4.1
2 500 96.5 3.4 3.5
2 750 96.3 4.0 3.4
3 250 95.5 4.9 4.1
3 500 96.2 4.4 3.1
3 750 97.0 3.0 3.0
Permissions
25 56.9 97.7 0.2
50 60.4 22.4 53.2
100 69.8 44.6 18.9
250 88.9 17.0 6.5
500 90.4 16.3 4.3
750 90.6 16.0 4.2
Table 5.3: Results on unseen execution traces.
that such a value is balanced with FPR.
On the other hand, we note that 91% is a pretty high accuracy: this figure suggests
that permissions indeed play an important role in Android malware detection. Yet,
they are not enough to effectively discriminating malware, as the rate of false negative
keeps high (16%). As a matter of fact, this value can be also explained by the common
practice of “overpermissions” (malware writers tend to write a long list of permissions,
including those which are not necessary to the app for hiding “suspect” permissions to
users). Moreover, the permissions list is an indicator at a coarse grain for identifying
malicious behavior, as it could happen that a malicious behavior requires the same
permissions of a lecit behavior.
Concerning the impact of n and k on the detection accuracy, it can be seen that,
for both parameters, the higher the better. For n, this means that longer sequences
of system calls better capture the application behavior, and are hence more suitable
to constitute a fingerprint. On the other hand, k represents the number of sequences
which the method deems relevant, i.e., the fingerprint size: results show that the
longer the sequences, the larger the size needed to fully enclose the information repre-
sented by the sequences. However, we verified that larger values for k did not deliver
improvements in the accuracy. It can be seen that increasing n the accuracy grows
147
The Dynamic approaches
and it grows also faster with k.
With n = 1, our method just uses frequencies of system calls, rather than se-
quences: results of Table 5.3 show that this variant exhibits a lower detection rate,
compared to the case in which sequences are considered. This finding suggests that
the simple frequency of system calls can be a misleading feature: indeed, there are
system calls which are more likely to be used in a malware rather than in a trusted
app (e.g., epoll wait and cacheflush, as reported in Table 5.2), but they do not
allow to build a highly accurate classifier.
Concerning the execution times, the training phase of our method took, on the
average for n = 3 and k = 750, 1183 s, of which 61 s for the feature selection procedure
and 1122 s for training the SVM classifier: we found that these times grow roughly
linearly with k′ and k, respectively. The actual classification phase of a single trace
took, on the average for n = 3 and k = 750, 18 ms: we found that this time is largely
independent from n and grows roughly linearly with k. Finally, the trace processing
(i.e., transforming a trace t in a feature vector f(t)) took, on the average for n = 3,
135 ms: we found that this time grows roughly exponentially with n. We obtained
these figures on a machine powered with a 6 core Intel Xeon E5-2440 (2.40 GHz)
equipped with 32 GB of RAM: we remark that we used a single threaded prototype
implementation of our method.
Unseen application
For this scenario, we built the training set T by including all the traces of 1600 (among
2000) applications picked at random and evenly divided in trusted and malicious.
Then, after the training phase, we applied our method to the traces of the remain-
ing 400 applications and measured accuracy, FPR and FNR. This way, no traces for
a given AUA were available for the training; however, traces for applications different
from the AUA yet belonging to the same family could have been available for the
training.
Since the results of previous experiments show that the best effectiveness can be
obtained with n = 3, we varied only k in 250–750, in order to investigate if the
ideal fingerprint size changes when unseen applications are involved. We repeated the
procedure 3 times for each value of k by varying the composition of T and T ′.
Table 5.4 shows the results.
Remark 2 : The main finding is that our detection method is able to accurately
detect (≈ 95%) also unseen malware, provided that it belongs to a family for which
some execution traces were available.
148
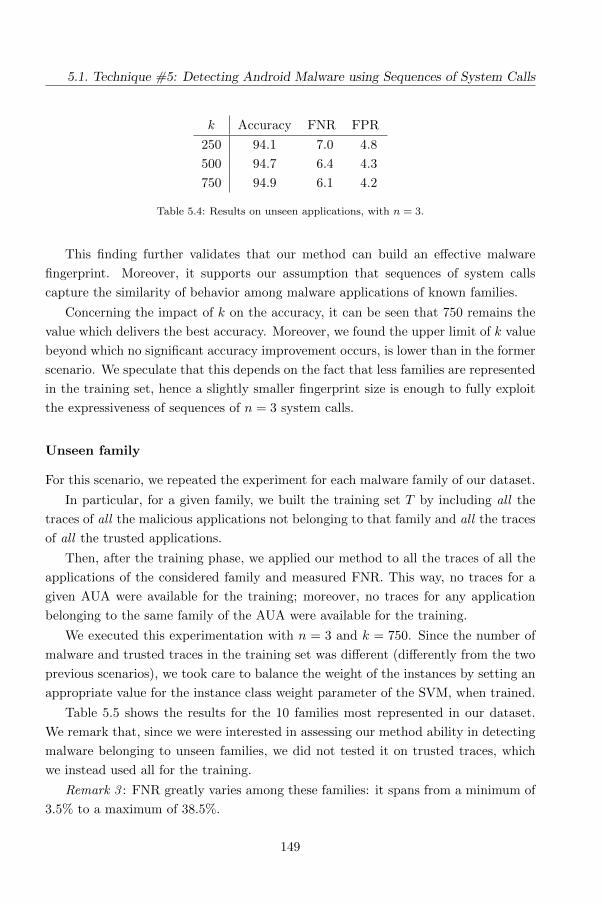
5.1. Technique #5: Detecting Android Malware using Sequences of System Calls
k Accuracy FNR FPR
250 94.1 7.0 4.8
500 94.7 6.4 4.3
750 94.9 6.1 4.2
Table 5.4: Results on unseen applications, with n = 3.
This finding further validates that our method can build an effective malware
fingerprint. Moreover, it supports our assumption that sequences of system calls
capture the similarity of behavior among malware applications of known families.
Concerning the impact of k on the accuracy, it can be seen that 750 remains the
value which delivers the best accuracy. Moreover, we found the upper limit of k value
beyond which no significant accuracy improvement occurs, is lower than in the former
scenario. We speculate that this depends on the fact that less families are represented
in the training set, hence a slightly smaller fingerprint size is enough to fully exploit
the expressiveness of sequences of n = 3 system calls.
Unseen family
For this scenario, we repeated the experiment for each malware family of our dataset.
In particular, for a given family, we built the training set T by including all the
traces of all the malicious applications not belonging to that family and all the traces
of all the trusted applications.
Then, after the training phase, we applied our method to all the traces of all the
applications of the considered family and measured FNR. This way, no traces for a
given AUA were available for the training; moreover, no traces for any application
belonging to the same family of the AUA were available for the training.
We executed this experimentation with n = 3 and k = 750. Since the number of
malware and trusted traces in the training set was different (differently from the two
previous scenarios), we took care to balance the weight of the instances by setting an
appropriate value for the instance class weight parameter of the SVM, when trained.
Table 5.5 shows the results for the 10 families most represented in our dataset.
We remark that, since we were interested in assessing our method ability in detecting
malware belonging to unseen families, we did not tested it on trusted traces, which
we instead used all for the training.
Remark 3 : FNR greatly varies among these families: it spans from a minimum of
3.5% to a maximum of 38.5%.
149
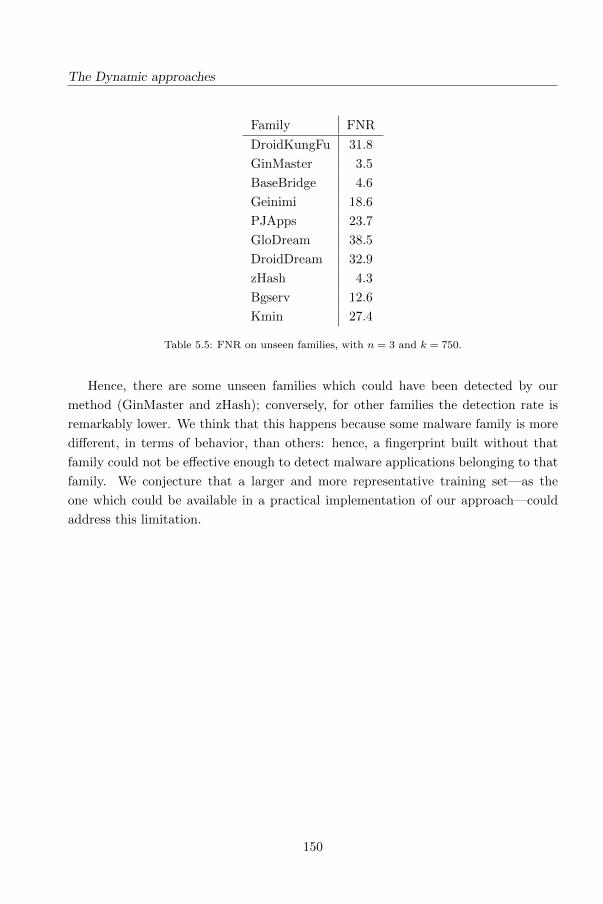
The Dynamic approaches
Family FNR
DroidKungFu 31.8
GinMaster 3.5
BaseBridge 4.6
Geinimi 18.6
PJApps 23.7
GloDream 38.5
DroidDream 32.9
zHash 4.3
Bgserv 12.6
Kmin 27.4
Table 5.5: FNR on unseen families, with n = 3 and k = 750.
Hence, there are some unseen families which could have been detected by our
method (GinMaster and zHash); conversely, for other families the detection rate is
remarkably lower. We think that this happens because some malware family is more
different, in terms of behavior, than others: hence, a fingerprint built without that
family could not be effective enough to detect malware applications belonging to that
family. We conjecture that a larger and more representative training set—as the
one which could be available in a practical implementation of our approach—could
address this limitation.
150
Chapter 6
Composition-malware:
building Android malware at
run time
In this chapter we present a novel model of malware for Android, named composi-
tion-malware, which consists of composing fragments of code hosted on different and
scattered locations at run time. A key feature of the model is that the malicious
behavior could dynamically change and the payload could be activated under logic
or temporal conditions. These characteristics allow a malware written according to
this model to evade current malware detection technologies for Android platform,
as the evaluation has demonstrated. We propose in last section of the chapter new
approaches to malware detection that should be adopted in anti-malware tools for
blocking a composition-malware.
151
Composition-malware: building Android malware at run time
6.1 Motivation
In order to solicit the study and the development of new technologies of antimalware
that are robust enough against existing malware for mobile applications and that will
be feasible and applicable in the real world, we illustrate a novel model of malware
architecture for mobile device that is hard to detect with the current antimalware
technologies. The model exploits two mechanisms that are typical of the java platform
and that are inherited by Android: dynamic loading and reflection. Of course, these
two features are useful for enhancing the capabilities of java (and mobile) applications
so the solution to the problem can not be to remove them from the Android platform.
The model of malware we propose is hard to detect with the current antimalware
technologies. The model exploits two mechanisms that are typical of the java platform
and that are inherited by Android: dynamic loading and reflection. Of course, these
two features are useful for enhancing the capabilities of java (and mobile) applications
so the solution to the problem can not be to remove them from the Android platform.
We call our model “composition-malware”, as its main working mechanism con-
sists of stealthily, dynamically and temporarily composing malware fragments at run
time, after having extracted the fragments from different locations scattered over the
Web. As an effect, the complete payload does not reside never in any place, but it is
dynamically built by a host application, that will be named the “driver application”
from here on.
Initially, the driver application exposes a benign behavior, in order to pass the
antimalware scanning and achieve the user trust; then, the driver application searches
for fragments of malware code residing on servers located in the network. The driver
application composes together the single pieces of code and executes the harmful
(composed) payload. The complete payload does not stay in one only place but it is
the result of the runtime compositions of different invocations of methods residing on
different servers. After the execution of the payload, the driver application turns to
show a benign behavior.
This model allows also for changing on the fly the control flow of the malware and
also the behavior, as the single code fragments can vary (each server can have more
than one only code fragment) and the composition logic, too.
These two features should impede the detection of the malware with the current
technologies; in fact:
• as the malicious payload is scattered in different locations and composed only dy-
namically, static analysis is not able to intercept the complete set of instructions
152
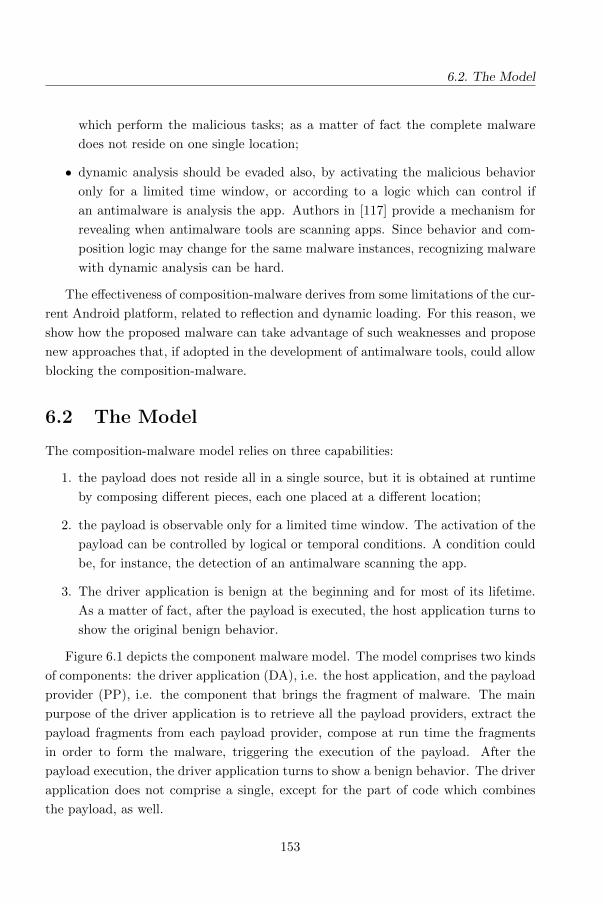
6.2. The Model
which perform the malicious tasks; as a matter of fact the complete malware
does not reside on one single location;
• dynamic analysis should be evaded also, by activating the malicious behavior
only for a limited time window, or according to a logic which can control if
an antimalware is analysis the app. Authors in [117] provide a mechanism for
revealing when antimalware tools are scanning apps. Since behavior and com-
position logic may change for the same malware instances, recognizing malware
with dynamic analysis can be hard.
The effectiveness of composition-malware derives from some limitations of the cur-
rent Android platform, related to reflection and dynamic loading. For this reason, we
show how the proposed malware can take advantage of such weaknesses and propose
new approaches that, if adopted in the development of antimalware tools, could allow
blocking the composition-malware.
6.2 The Model
The composition-malware model relies on three capabilities:
1. the payload does not reside all in a single source, but it is obtained at runtime
by composing different pieces, each one placed at a different location;
2. the payload is observable only for a limited time window. The activation of the
payload can be controlled by logical or temporal conditions. A condition could
be, for instance, the detection of an antimalware scanning the app.
3. The driver application is benign at the beginning and for most of its lifetime.
As a matter of fact, after the payload is executed, the host application turns to
show the original benign behavior.
Figure 6.1 depicts the component malware model. The model comprises two kinds
of components: the driver application (DA), i.e. the host application, and the payload
provider (PP), i.e. the component that brings the fragment of malware. The main
purpose of the driver application is to retrieve all the payload providers, extract the
payload fragments from each payload provider, compose at run time the fragments
in order to form the malware, triggering the execution of the payload. After the
payload execution, the driver application turns to show a benign behavior. The driver
application does not comprise a single, except for the part of code which combines
the payload, as well.
153
Composition-malware: building Android malware at run time
Figure 6.1: Component malware entails a four-phases process: retrieve, composition, execution, and
stealth mode. The driver application (DA) retrieves (Retrieve phase) the first payload provider
(PP1) at the location u1 (Step 1). The DA extracts (Step 2) the payloads fragment from the PP1
(I1) and the pointer to the next PP, PP2 (u2). In the Step 3 the DA integrates (Composition phase)
the first payloads fragment in its body and extracts the second payload fragment (I2) along with the
pointer to the third PP, PP3 (u3). Then DA integrates the second payloads fragment and retrieves
the third payloads fragment (I3) at u3. As PP3 has a null pointer, this means that it is the last
payload provider, so anymore payloads fragments will be searched. Thus the last payload’s fragment
I3 is integrated in the DA(Step 4). Once the entire PM is composed (Step 5) it will be executed
(Execution phase) according to some execute-condition. Finally (Stealth mode), the PM is removed
and the driver application shows a benign behavior again (Step 6).
154
6.3. Implementation
The driver application exposes a benign behavior for quite all its lifecycle, with
the only exception of the time window in which it executes the malicious payload.
Payload providers have the role of sending the payload fragments to the driver
application, together with the location of the next payload provider from which the
driver application will get the next fragment of the payload. When the driver appli-
cation receives the last fragment of the payload, it merges together all the fragments
and produces the entire harmful payload.
The pseudocode in Figure 6.2 provides a generic description of the driver applica-
tion behaviour.
The pointer to each payload provider can be also cyphered in order to avoid that, if
a provider is retrieved by an antimalware system, the extraction of the url could allow
reconstructing the complete payload providers chain, and thus the entire payload.
From an attacker viewpoint, our model produces two advantages:
1. the complete payload is never entirely available in any source, as it is dynami-
cally composed by the driver application;
2. the malicious behavior could also change, for the same set of driver application-
payload providers, as any payload provider could have an array of malicious
behaviors that can be sent to the driver application, rather than only one. This
results in morphing both the structure and the behavior of the payload.
6.3 Implementation
The implementation of the proposed model relies on two instruments offered by the
Java/Android platform: reflection and dynamic loading. These allow Java developers
to extend the features of an application at runtime, in order to adapt the application
to the emerging needs of users.
Reflection allows inspecting the byte code of an existing class, including private
methods, in order to create an instance on which the discovered methods can be
invoked. Dynamic loading is in charge of loading one or more classes in memory at
runtime. Android has inherited these two Java mechanisms. However, aided by the
fact that the Android permissions system shows many limitations, discussed later in
the paper, these two mechanisms can be combined to implement the proposed model
of malware.
The process of retrieving and executing malicious payload comprises four steps,
as explained in previous section. In the following we discuss the implementation for
155
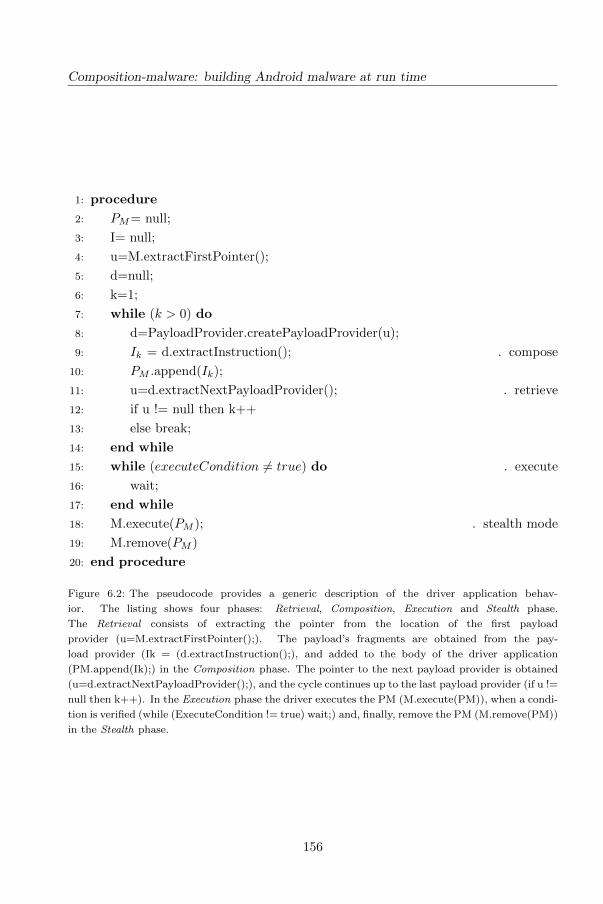
Composition-malware: building Android malware at run time
1: procedure
2: PM= null;
3: I= null;
4: u=M.extractFirstPointer();
5: d=null;
6: k=1;
7: while (k > 0) do
8: d=PayloadProvider.createPayloadProvider(u);
9: Ik = d.extractInstruction(); . compose
10: PM .append(Ik);
11: u=d.extractNextPayloadProvider(); . retrieve
12: if u != null then k++
13: else break;
14: end while
15: while (executeCondition 6= true) do . execute
16: wait;
17: end while
18: M.execute(PM ); . stealth mode
19: M.remove(PM )
20: end procedure
Figure 6.2: The pseudocode provides a generic description of the driver application behav-
ior. The listing shows four phases: Retrieval, Composition, Execution and Stealth phase.
The Retrieval consists of extracting the pointer from the location of the first payload
provider (u=M.extractFirstPointer();). The payload’s fragments are obtained from the pay-
load provider (Ik = (d.extractInstruction();), and added to the body of the driver application
(PM.append(Ik);) in the Composition phase. The pointer to the next payload provider is obtained
(u=d.extractNextPayloadProvider();), and the cycle continues up to the last payload provider (if u !=
null then k++). In the Execution phase the driver executes the PM (M.execute(PM)), when a condi-
tion is verified (while (ExecuteCondition != true) wait;) and, finally, remove the PM (M.remove(PM))
in the Stealth phase.
156
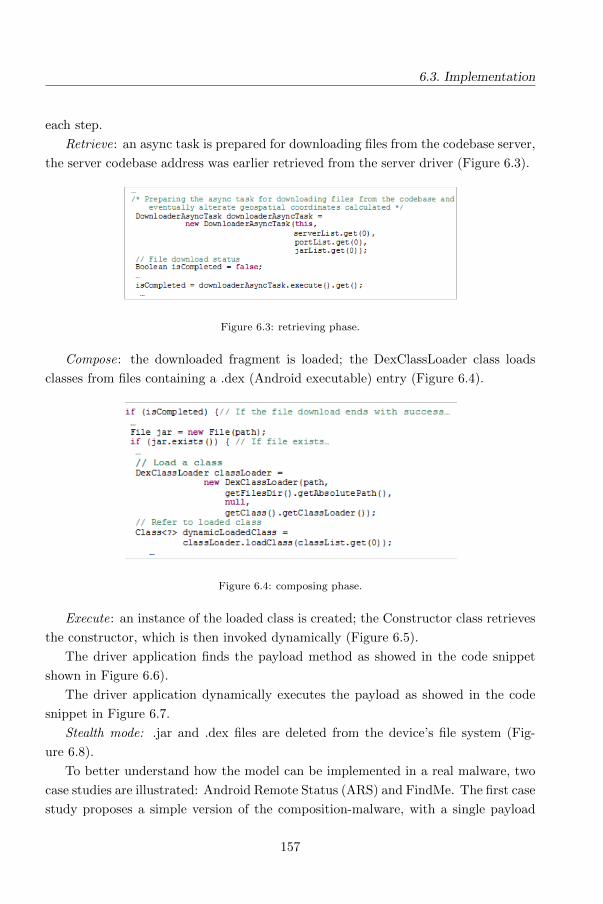
6.3. Implementation
each step.
Retrieve: an async task is prepared for downloading files from the codebase server,
the server codebase address was earlier retrieved from the server driver (Figure 6.3).
Figure 6.3: retrieving phase.
Compose: the downloaded fragment is loaded; the DexClassLoader class loads
classes from files containing a .dex (Android executable) entry (Figure 6.4).
Figure 6.4: composing phase.
Execute: an instance of the loaded class is created; the Constructor class retrieves
the constructor, which is then invoked dynamically (Figure 6.5).
The driver application finds the payload method as showed in the code snippet
shown in Figure 6.6).
The driver application dynamically executes the payload as showed in the code
snippet in Figure 6.7.
Stealth mode: .jar and .dex files are deleted from the device’s file system (Fig-
ure 6.8).
To better understand how the model can be implemented in a real malware, two
case studies are illustrated: Android Remote Status (ARS) and FindMe. The first case
study proposes a simple version of the composition-malware, with a single payload
157
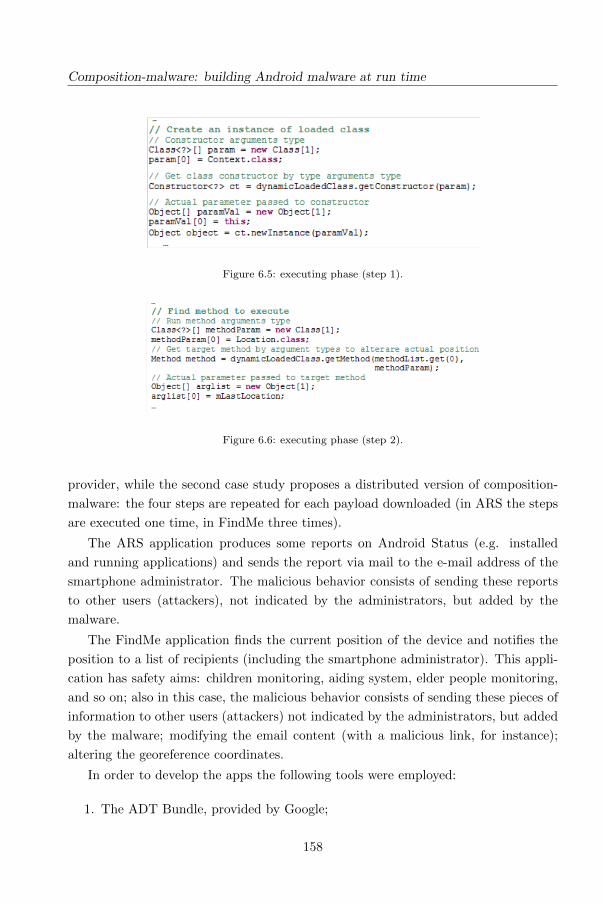
Composition-malware: building Android malware at run time
Figure 6.5: executing phase (step 1).
Figure 6.6: executing phase (step 2).
provider, while the second case study proposes a distributed version of composition-
malware: the four steps are repeated for each payload downloaded (in ARS the steps
are executed one time, in FindMe three times).
The ARS application produces some reports on Android Status (e.g. installed
and running applications) and sends the report via mail to the e-mail address of the
smartphone administrator. The malicious behavior consists of sending these reports
to other users (attackers), not indicated by the administrators, but added by the
malware.
The FindMe application finds the current position of the device and notifies the
position to a list of recipients (including the smartphone administrator). This appli-
cation has safety aims: children monitoring, aiding system, elder people monitoring,
and so on; also in this case, the malicious behavior consists of sending these pieces of
information to other users (attackers) not indicated by the administrators, but added
by the malware; modifying the email content (with a malicious link, for instance);
altering the georeference coordinates.
In order to develop the apps the following tools were employed:
1. The ADT Bundle, provided by Google;
158
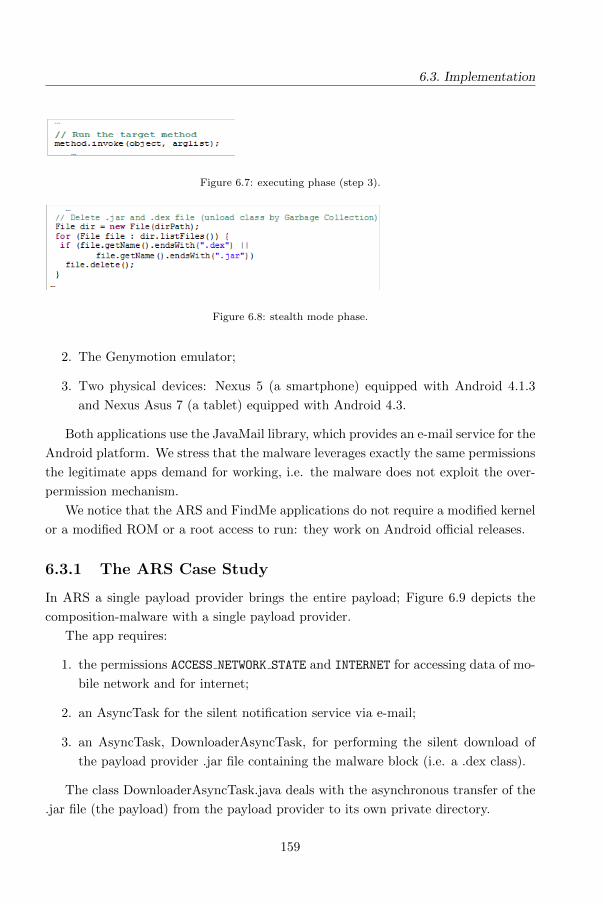
6.3. Implementation
Figure 6.7: executing phase (step 3).
Figure 6.8: stealth mode phase.
2. The Genymotion emulator;
3. Two physical devices: Nexus 5 (a smartphone) equipped with Android 4.1.3
and Nexus Asus 7 (a tablet) equipped with Android 4.3.
Both applications use the JavaMail library, which provides an e-mail service for the
Android platform. We stress that the malware leverages exactly the same permissions
the legitimate apps demand for working, i.e. the malware does not exploit the over-
permission mechanism.
We notice that the ARS and FindMe applications do not require a modified kernel
or a modified ROM or a root access to run: they work on Android official releases.
6.3.1 The ARS Case Study
In ARS a single payload provider brings the entire payload; Figure 6.9 depicts the
composition-malware with a single payload provider.
The app requires:
1. the permissions ACCESS NETWORK STATE and INTERNET for accessing data of mo-
bile network and for internet;
2. an AsyncTask for the silent notification service via e-mail;
3. an AsyncTask, DownloaderAsyncTask, for performing the silent download of
the payload provider .jar file containing the malware block (i.e. a .dex class).
The class DownloaderAsyncTask.java deals with the asynchronous transfer of the
.jar file (the payload) from the payload provider to its own private directory.
159
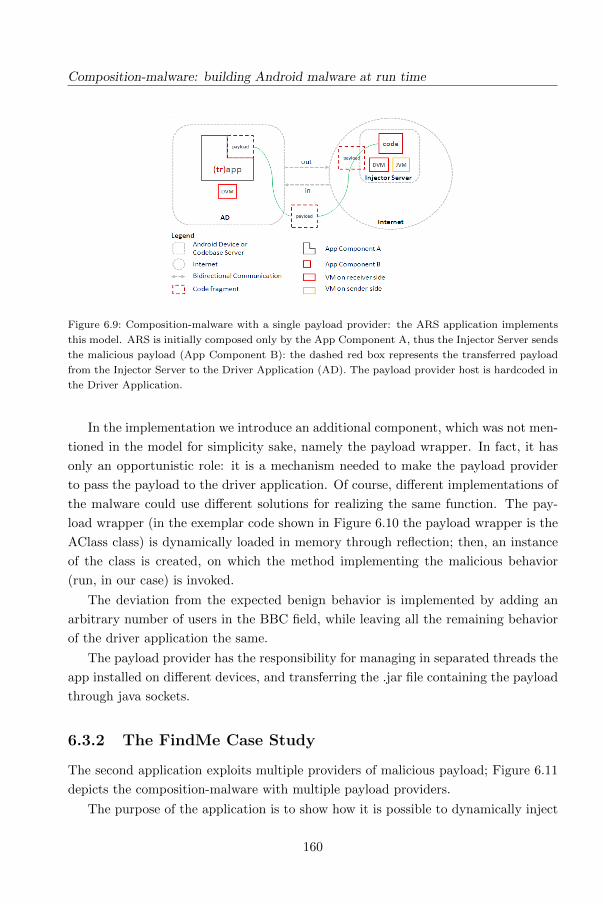
Composition-malware: building Android malware at run time
Figure 6.9: Composition-malware with a single payload provider: the ARS application implements
this model. ARS is initially composed only by the App Component A, thus the Injector Server sends
the malicious payload (App Component B): the dashed red box represents the transferred payload
from the Injector Server to the Driver Application (AD). The payload provider host is hardcoded in
the Driver Application.
In the implementation we introduce an additional component, which was not men-
tioned in the model for simplicity sake, namely the payload wrapper. In fact, it has
only an opportunistic role: it is a mechanism needed to make the payload provider
to pass the payload to the driver application. Of course, different implementations of
the malware could use different solutions for realizing the same function. The pay-
load wrapper (in the exemplar code shown in Figure 6.10 the payload wrapper is the
AClass class) is dynamically loaded in memory through reflection; then, an instance
of the class is created, on which the method implementing the malicious behavior
(run, in our case) is invoked.
The deviation from the expected benign behavior is implemented by adding an
arbitrary number of users in the BBC field, while leaving all the remaining behavior
of the driver application the same.
The payload provider has the responsibility for managing in separated threads the
app installed on different devices, and transferring the .jar file containing the payload
through java sockets.
6.3.2 The FindMe Case Study
The second application exploits multiple providers of malicious payload; Figure 6.11
depicts the composition-malware with multiple payload providers.
The purpose of the application is to show how it is possible to dynamically inject
160
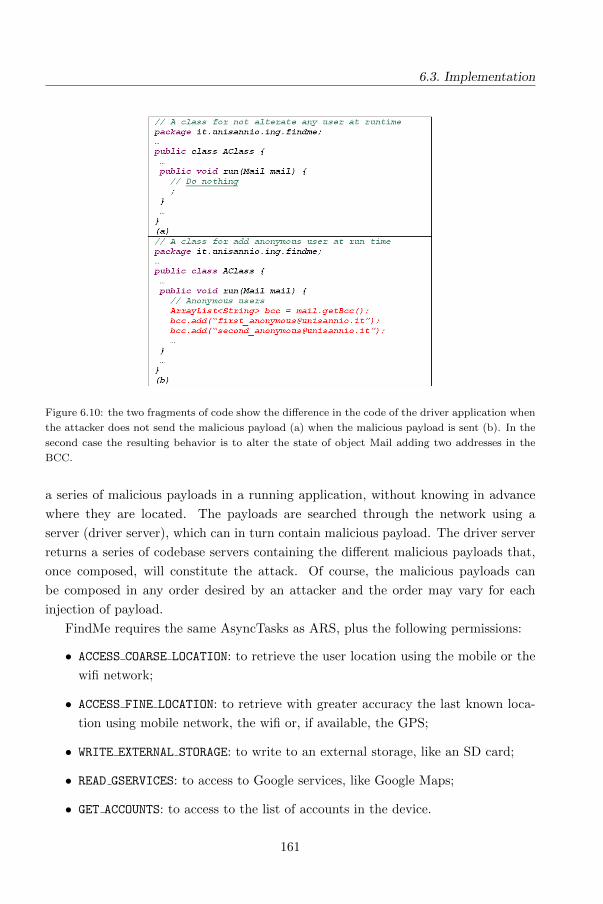
6.3. Implementation
Figure 6.10: the two fragments of code show the difference in the code of the driver application when
the attacker does not send the malicious payload (a) when the malicious payload is sent (b). In the
second case the resulting behavior is to alter the state of object Mail adding two addresses in the
BCC.
a series of malicious payloads in a running application, without knowing in advance
where they are located. The payloads are searched through the network using a
server (driver server), which can in turn contain malicious payload. The driver server
returns a series of codebase servers containing the different malicious payloads that,
once composed, will constitute the attack. Of course, the malicious payloads can
be composed in any order desired by an attacker and the order may vary for each
injection of payload.
FindMe requires the same AsyncTasks as ARS, plus the following permissions:
• ACCESS COARSE LOCATION: to retrieve the user location using the mobile or the
wifi network;
• ACCESS FINE LOCATION: to retrieve with greater accuracy the last known loca-
tion using mobile network, the wifi or, if available, the GPS;
• WRITE EXTERNAL STORAGE: to write to an external storage, like an SD card;
• READ GSERVICES: to access to Google services, like Google Maps;
• GET ACCOUNTS: to access to the list of accounts in the device.
161
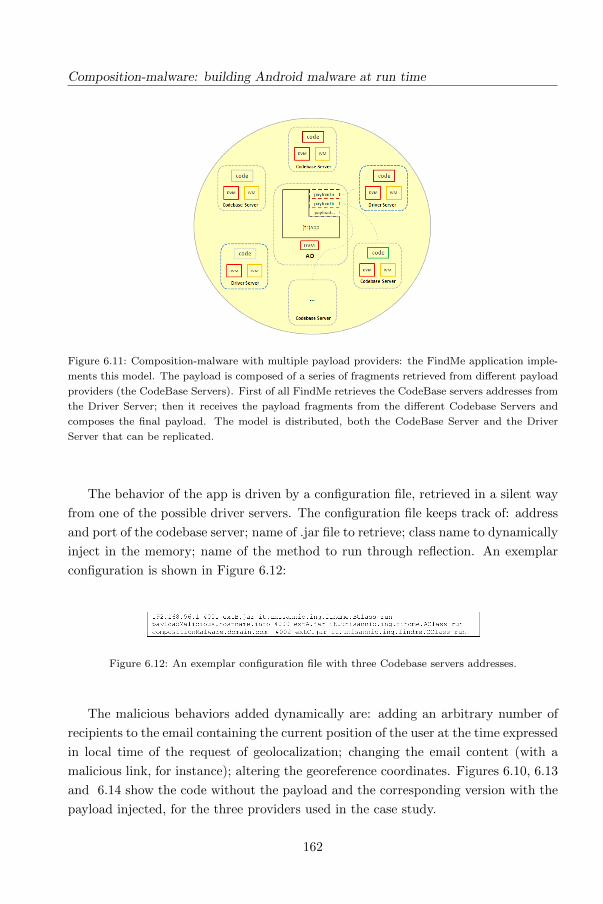
Composition-malware: building Android malware at run time
Figure 6.11: Composition-malware with multiple payload providers: the FindMe application imple-
ments this model. The payload is composed of a series of fragments retrieved from different payload
providers (the CodeBase Servers). First of all FindMe retrieves the CodeBase servers addresses from
the Driver Server; then it receives the payload fragments from the different Codebase Servers and
composes the final payload. The model is distributed, both the CodeBase Server and the Driver
Server that can be replicated.
The behavior of the app is driven by a configuration file, retrieved in a silent way
from one of the possible driver servers. The configuration file keeps track of: address
and port of the codebase server; name of .jar file to retrieve; class name to dynamically
inject in the memory; name of the method to run through reflection. An exemplar
configuration is shown in Figure 6.12:
Figure 6.12: An exemplar configuration file with three Codebase servers addresses.
The malicious behaviors added dynamically are: adding an arbitrary number of
recipients to the email containing the current position of the user at the time expressed
in local time of the request of geolocalization; changing the email content (with a
malicious link, for instance); altering the georeference coordinates. Figures 6.10, 6.13
and 6.14 show the code without the payload and the corresponding version with the
payload injected, for the three providers used in the case study.
162
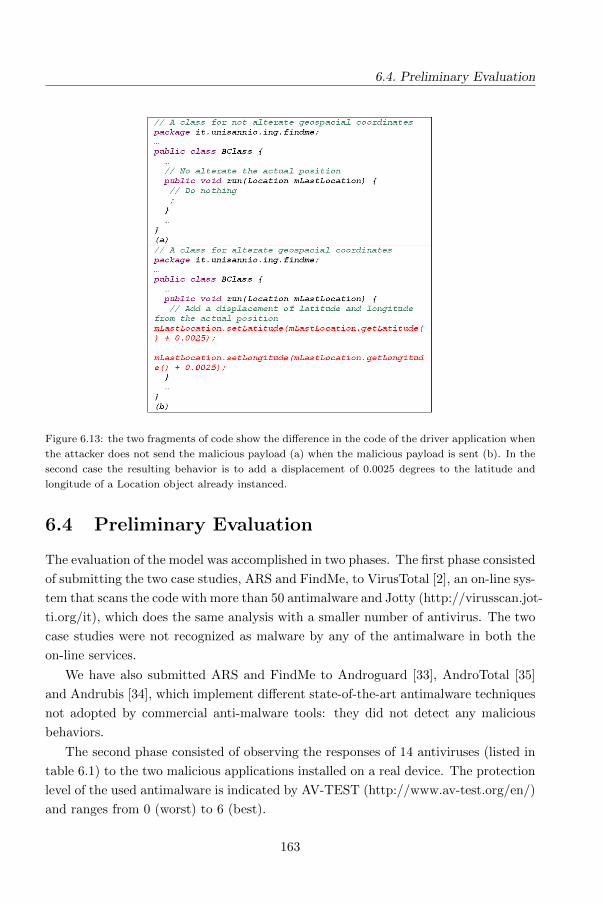
6.4. Preliminary Evaluation
Figure 6.13: the two fragments of code show the difference in the code of the driver application when
the attacker does not send the malicious payload (a) when the malicious payload is sent (b). In the
second case the resulting behavior is to add a displacement of 0.0025 degrees to the latitude and
longitude of a Location object already instanced.
6.4 Preliminary Evaluation
The evaluation of the model was accomplished in two phases. The first phase consisted
of submitting the two case studies, ARS and FindMe, to VirusTotal [2], an on-line sys-
tem that scans the code with more than 50 antimalware and Jotty (http://virusscan.jot-
ti.org/it), which does the same analysis with a smaller number of antivirus. The two
case studies were not recognized as malware by any of the antimalware in both the
on-line services.
We have also submitted ARS and FindMe to Androguard [33], AndroTotal [35]
and Andrubis [34], which implement different state-of-the-art antimalware techniques
not adopted by commercial anti-malware tools: they did not detect any malicious
behaviors.
The second phase consisted of observing the responses of 14 antiviruses (listed in
table 6.1) to the two malicious applications installed on a real device. The protection
level of the used antimalware is indicated by AV-TEST (http://www.av-test.org/en/)
and ranges from 0 (worst) to 6 (best).
163
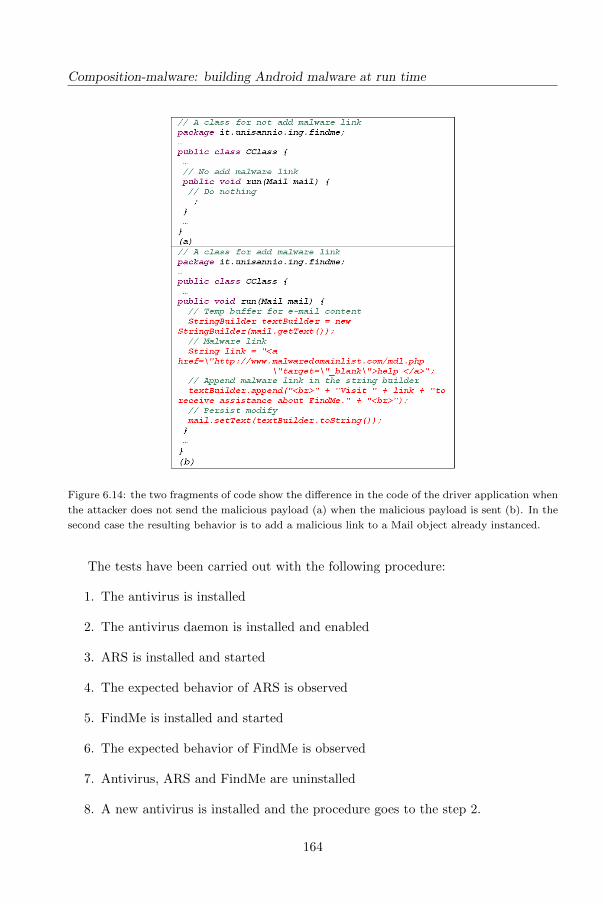
Composition-malware: building Android malware at run time
Figure 6.14: the two fragments of code show the difference in the code of the driver application when
the attacker does not send the malicious payload (a) when the malicious payload is sent (b). In the
second case the resulting behavior is to add a malicious link to a Mail object already instanced.
The tests have been carried out with the following procedure:
1. The antivirus is installed
2. The antivirus daemon is installed and enabled
3. ARS is installed and started
4. The expected behavior of ARS is observed
5. FindMe is installed and started
6. The expected behavior of FindMe is observed
7. Antivirus, ARS and FindMe are uninstalled
8. A new antivirus is installed and the procedure goes to the step 2.
164
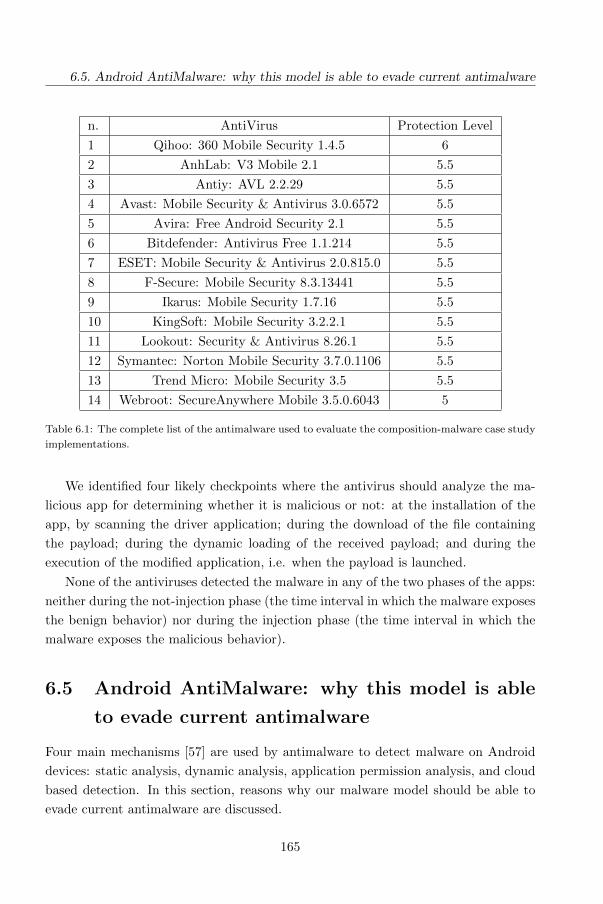
6.5. Android AntiMalware: why this model is able to evade current antimalware
n. AntiVirus Protection Level
1 Qihoo: 360 Mobile Security 1.4.5 6
2 AnhLab: V3 Mobile 2.1 5.5
3 Antiy: AVL 2.2.29 5.5
4 Avast: Mobile Security & Antivirus 3.0.6572 5.5
5 Avira: Free Android Security 2.1 5.5
6 Bitdefender: Antivirus Free 1.1.214 5.5
7 ESET: Mobile Security & Antivirus 2.0.815.0 5.5
8 F-Secure: Mobile Security 8.3.13441 5.5
9 Ikarus: Mobile Security 1.7.16 5.5
10 KingSoft: Mobile Security 3.2.2.1 5.5
11 Lookout: Security & Antivirus 8.26.1 5.5
12 Symantec: Norton Mobile Security 3.7.0.1106 5.5
13 Trend Micro: Mobile Security 3.5 5.5
14 Webroot: SecureAnywhere Mobile 3.5.0.6043 5
Table 6.1: The complete list of the antimalware used to evaluate the composition-malware case study
implementations.
We identified four likely checkpoints where the antivirus should analyze the ma-
licious app for determining whether it is malicious or not: at the installation of the
app, by scanning the driver application; during the download of the file containing
the payload; during the dynamic loading of the received payload; and during the
execution of the modified application, i.e. when the payload is launched.
None of the antiviruses detected the malware in any of the two phases of the apps:
neither during the not-injection phase (the time interval in which the malware exposes
the benign behavior) nor during the injection phase (the time interval in which the
malware exposes the malicious behavior).
6.5 Android AntiMalware: why this model is able
to evade current antimalware
Four main mechanisms [57] are used by antimalware to detect malware on Android
devices: static analysis, dynamic analysis, application permission analysis, and cloud
based detection. In this section, reasons why our malware model should be able to
evade current antimalware are discussed.
165
Composition-malware: building Android malware at run time
Static analysis consists of analyzing code for finding fragments that could imple-
ment malicious behavior. Static analysis is not able to detect the malicious behavior
in the proposed model, as the malicious behavior is hidden in the payload providers.
If the antimalware does not have access to the entire composition of the payload code
fragments, and this can not happen with the proposed model, the malicious behavior
cannot be caught.
Dynamic analysis consists of executing the mobile application in an isolated en-
vironment, such as a virtual machine or an emulator, so that the application can
be monitored. An exemplar case of dynamic analysis tool is TaintDroid [85], which
provides a taint tracking for Android, marking suspicious data that originates from
sensitive sources, such as location, microphone, camera and other smartphone identi-
fiers. Sandboxing is a method to execute the application to analyze in a safe way. An
exemplar implementation is Android Application Sandbox AASandbox [70], which
includes a first phase of static analysis and a second phase of dynamic analysis. The
static analysis generates the application binary image and searches any suspicious
path. The Dynamic analysis executes the binary in an Android emulator and logs the
system calls. Even with this technique, it is hard to detect the malicious behavior of
the composition-malware, as the payload runs only in a specific time window, which
could be started much later the application is installed and launched. Thus, the exe-
cution in the emulator should last a time long enough to intercept the payload. For
instance, the trigger could be activated one week after the first run of the application.
Moreover, as previously discussed, researchers [117] demonstrated the possibility for
a malicious app to reveal a scanning activity running on the victim device and so a
malicious app could launch the malicious behavior only when the scanning activity is
over.
Permissions are an essential part of the security mechanisms in the Android plat-
form. Applications must obtain adequate permissions from the smartphone owner to
execute.
Some security tools check the permissions in order to infer whether some combi-
nations of permissions may hide a malicious payload. For instance, Kirin [84] is an
application certification for Android; it analyzes permissions required by the applica-
tion during installation based on a set of rules. Rules that verify the combinations of
permissions are not effective for the malware model proposed in this paper, because
it leverages only the permissions agreed by the user, that are the legitimate permis-
sions, i.e. the permissions needed for performing the expected (benign) behavior of
the driver application.
166
6.6. Proposals for improving the security system in Android
Due to limitations of computational power and energy sources, mobile devices
may not be equipped with a fully featured security system. This is why the cloud is
increasingly used for performing many tasks of smartphone. Paranoid Android [116] is
a cloud-based malware protection technique that moves security analysis to a remote
server that hosts multiple replicas of mobile phones running on emulators. A tracer,
hosted by the smartphone, records all the required information in order to repeat the
mobile application execution. Similarly, Crowdroid [72] monitors system calls invoked
by target mobile applications, preprocesses the calls, and sends them to the cloud,
where an analysis based on clustering technique establishes whether the application
is benign or malicious. As cloud-based techniques are substantially dynamic analysis
with increased computational power, the observations done for the dynamic analysis
with regards to the composition-malware are still valid.
Observing energy consumption can help identifying malicious applications, which
tend to consume more energy than benign ones. VirusMeter [104] is one possible
implementation of this technique. However, the composition-malware does not nec-
essarily require more resources than the driver application legitimate behavior, and
this energy monitoring may be ineffective.
6.6 Proposals for improving the security system in
Android
We propose two possible countermeasures in order to block malware that implements
the composition-malware model.
The first one consists of notifying to the user all the suspicious events that could
threat the security and privacy of the device owner. A solution at coarse grain is
that the device administrator is informed of all the information pieces that the device
sends to an external location (a server, another device, a recipient, and so on). In our
example, the malware sends to other recipients some notifications: in this case, the
device owner should have received a warning containing all the recipients where the
mail was sent. Of course, as this mechanism could degrade usability, the user could
explicitly specify which kind of information or actions must be considered private or
related to security concerns: the user will be informed only when that information is
sent somewhere or those actions are performed by an app.
The countermeasure we propose here is similar to the approach introduced by
Kato and Matsuura [99], who defined an authorization system that customizes the
permissions of an app according to the privacy and security preferences of the user.
167
Composition-malware: building Android malware at run time
Arabo and Pranggono [57] propose a solution that goes in the same direction: a
framework which assigns the responsibilities of assuring security and privacy to the
different stakeholders, i.e. users, developers, network providers, and marketplace.
A second countermeasure is to deny to external code the permission to modify
the state of an object created by an app running on the device. In our example, the
malicious payload modifies (dynamically) the state of the object “mail” by adding
new recipients, after the object mail was created.
Finally, composition-malware leverages a limit of the Android permission system,
as the two malicious apps developed use the same permissions used by the benign
behavior of the apps. Permissions at a finer grain would have created difficulties to
the malware to perform its harmful actions. As an example, instead of allowing a
generic internet connection with PERMISSION INTERNET permission, the permission
should also define to which urls the app is allowed to connect to. This would inhibit
the possibility to create further illegal communication channels.
168
Chapter 7
Techniques Assessment and
Concluding Remarks
7.1 Techniques Assessment
In this section we compare the techniques discussed in chapter 4. We evaluate the
effectiveness of the proposed solutions in terms of accuracy. We recall here that the
accuracy is the proportion of true results (both true positives and true negatives)
among the total number of cases examined:
Accuracy = #truepositives+#truenegatives#truepositives+falsepositives+falsenegatives+truenegatives
The baseline
Figure 7.1 shows the performance of baseline permission-based, the basis for compar-
ing the effectiveness of the methods developed compared to the state of the art.
169

Techniques Assessment and Concluding Remarks
Figure 7.1: Baseline accuracy for value of varying from 25 to 750.
The greatest accuracy (0.906) is obtained considering k=750: this is the baseline
value used to compare our tecniques respect the state-of-art.
Technique #1
In first study we conduct we extract three metrics:
• The first metric computes the occurrences of a set of system calls invoked by the
application under analysis.The set of the system calls considered is related to
the management of the processes (creation, binaries execution, and termination
of processes) and to I/O operations (creation, elimination, writing and reading
of file objects).
• Sumperm: the second metric computes a weighted sum of all the permissions
requested by the application under analysis, where the weight is assigned ac-
cording to the potential threat that the permission could cause if the application
has evil goals.
• Risklevel : the third metric is a weighted sum of selected combinations of per-
missions.
The classification algorithms were applied to three groups of metrics. The first
group (FG) included only theset of system calls, the second group (SG) included only
the two aggregate metrics sumperm and risklevel, and the third group (TG) included
only the risklevel metric.
170
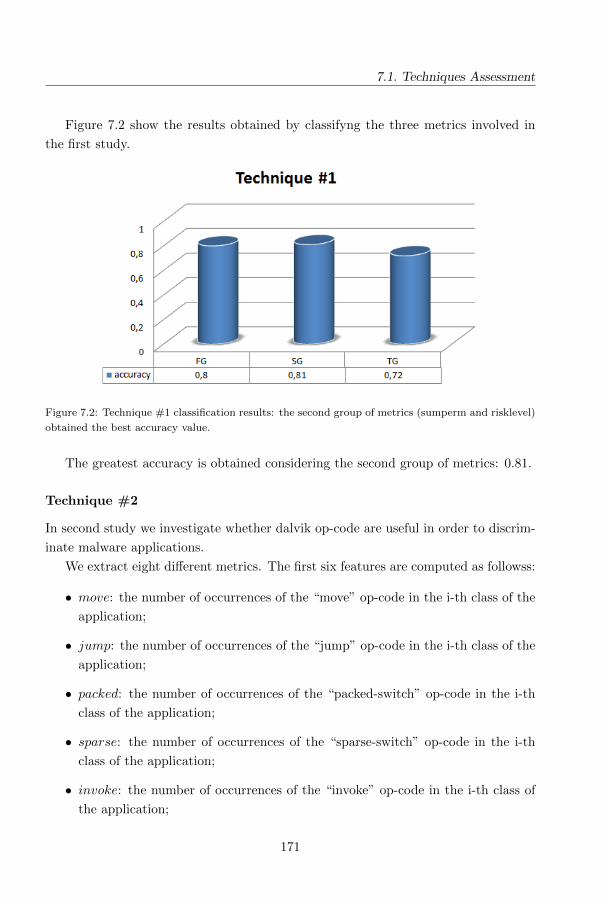
7.1. Techniques Assessment
Figure 7.2 show the results obtained by classifyng the three metrics involved in
the first study.
Figure 7.2: Technique #1 classification results: the second group of metrics (sumperm and risklevel)
obtained the best accuracy value.
The greatest accuracy is obtained considering the second group of metrics: 0.81.
Technique #2
In second study we investigate whether dalvik op-code are useful in order to discrim-
inate malware applications.
We extract eight different metrics. The first six features are computed as followss:
• move: the number of occurrences of the “move” op-code in the i-th class of the
application;
• jump: the number of occurrences of the “jump” op-code in the i-th class of the
application;
• packed: the number of occurrences of the “packed-switch” op-code in the i-th
class of the application;
• sparse: the number of occurrences of the “sparse-switch” op-code in the i-th
class of the application;
• invoke: the number of occurrences of the “invoke” op-code in the i-th class of
the application;
171
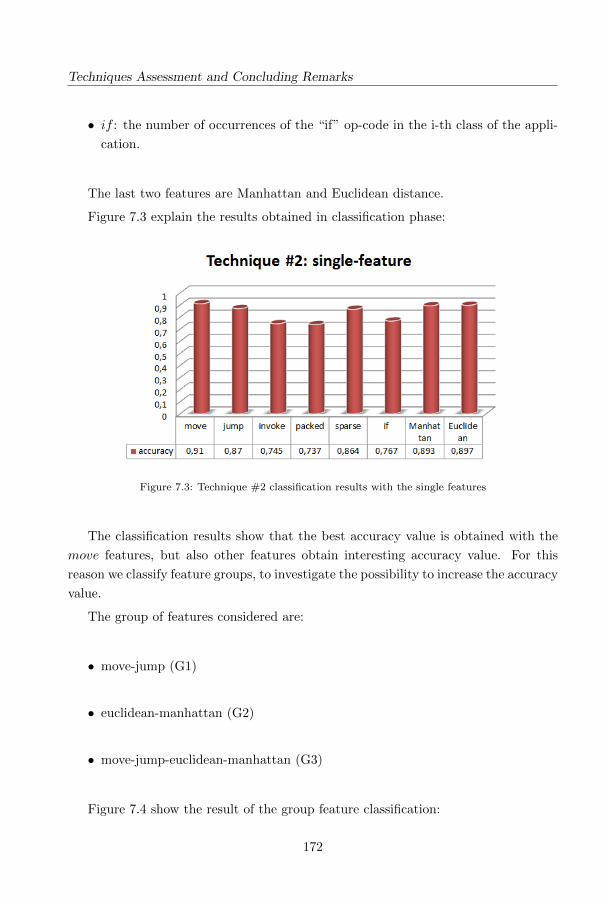
Techniques Assessment and Concluding Remarks
• if : the number of occurrences of the “if” op-code in the i-th class of the appli-
cation.
The last two features are Manhattan and Euclidean distance.
Figure 7.3 explain the results obtained in classification phase:
Figure 7.3: Technique #2 classification results with the single features
The classification results show that the best accuracy value is obtained with the
move features, but also other features obtain interesting accuracy value. For this
reason we classify feature groups, to investigate the possibility to increase the accuracy
value.
The group of features considered are:
• move-jump (G1)
• euclidean-manhattan (G2)
• move-jump-euclidean-manhattan (G3)
Figure 7.4 show the result of the group feature classification:
172
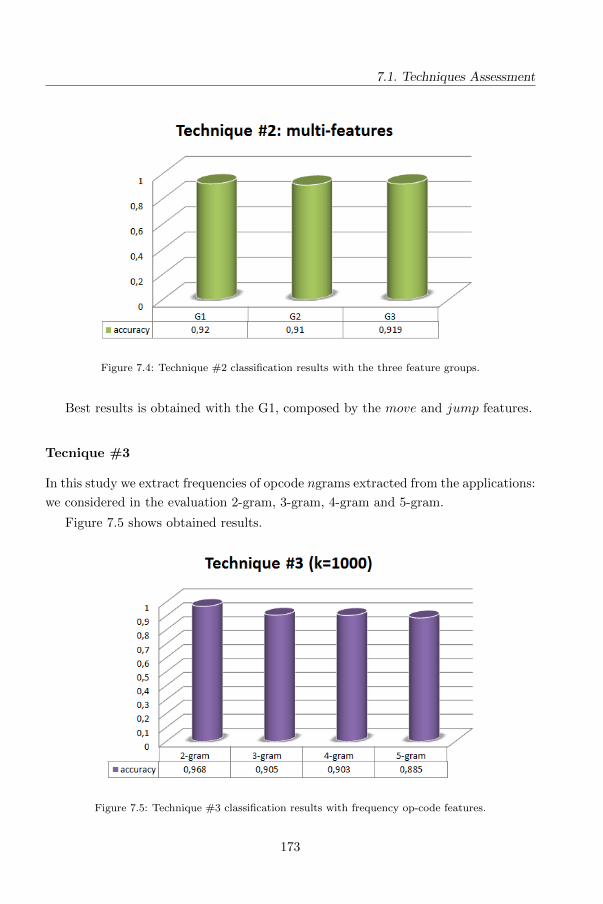
7.1. Techniques Assessment
Figure 7.4: Technique #2 classification results with the three feature groups.
Best results is obtained with the G1, composed by the move and jump features.
Tecnique #3
In this study we extract frequencies of opcode ngrams extracted from the applications:
we considered in the evaluation 2-gram, 3-gram, 4-gram and 5-gram.
Figure 7.5 shows obtained results.
Figure 7.5: Technique #3 classification results with frequency op-code features.
173
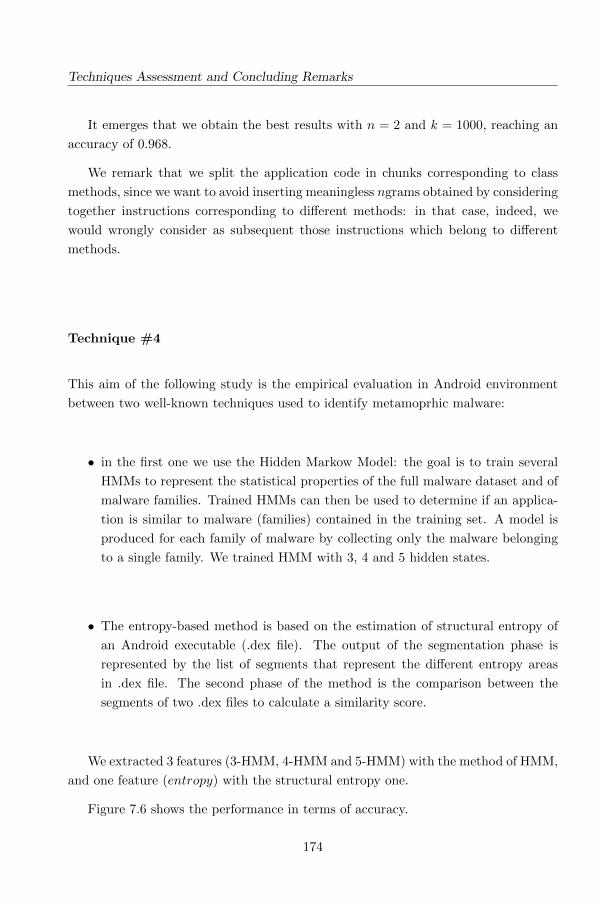
Techniques Assessment and Concluding Remarks
It emerges that we obtain the best results with n = 2 and k = 1000, reaching an
accuracy of 0.968.
We remark that we split the application code in chunks corresponding to class
methods, since we want to avoid inserting meaningless ngrams obtained by considering
together instructions corresponding to different methods: in that case, indeed, we
would wrongly consider as subsequent those instructions which belong to different
methods.
Technique #4
This aim of the following study is the empirical evaluation in Android environment
between two well-known techniques used to identify metamoprhic malware:
• in the first one we use the Hidden Markow Model: the goal is to train several
HMMs to represent the statistical properties of the full malware dataset and of
malware families. Trained HMMs can then be used to determine if an applica-
tion is similar to malware (families) contained in the training set. A model is
produced for each family of malware by collecting only the malware belonging
to a single family. We trained HMM with 3, 4 and 5 hidden states.
• The entropy-based method is based on the estimation of structural entropy of
an Android executable (.dex file). The output of the segmentation phase is
represented by the list of segments that represent the different entropy areas
in .dex file. The second phase of the method is the comparison between the
segments of two .dex files to calculate a similarity score.
We extracted 3 features (3-HMM, 4-HMM and 5-HMM) with the method of HMM,
and one feature (entropy) with the structural entropy one.
Figure 7.6 shows the performance in terms of accuracy.
174
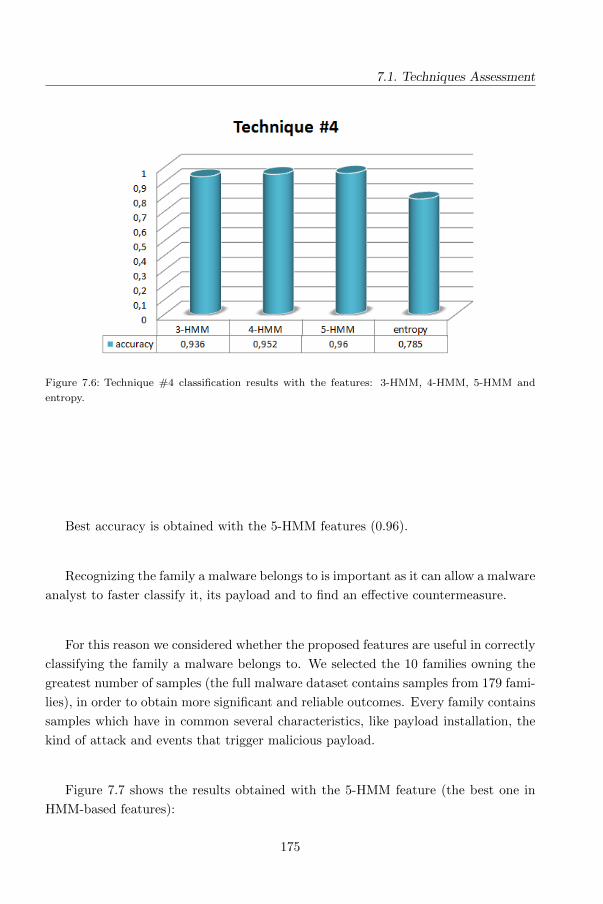
7.1. Techniques Assessment
Figure 7.6: Technique #4 classification results with the features: 3-HMM, 4-HMM, 5-HMM and
entropy.
Best accuracy is obtained with the 5-HMM features (0.96).
Recognizing the family a malware belongs to is important as it can allow a malware
analyst to faster classify it, its payload and to find an effective countermeasure.
For this reason we considered whether the proposed features are useful in correctly
classifying the family a malware belongs to. We selected the 10 families owning the
greatest number of samples (the full malware dataset contains samples from 179 fami-
lies), in order to obtain more significant and reliable outcomes. Every family contains
samples which have in common several characteristics, like payload installation, the
kind of attack and events that trigger malicious payload.
Figure 7.7 shows the results obtained with the 5-HMM feature (the best one in
HMM-based features):
175
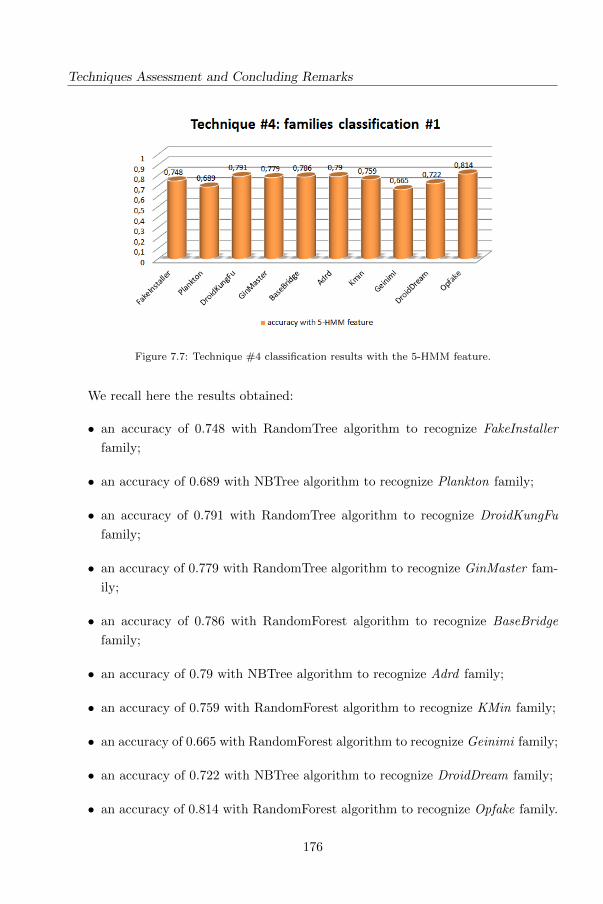
Techniques Assessment and Concluding Remarks
Figure 7.7: Technique #4 classification results with the 5-HMM feature.
We recall here the results obtained:
• an accuracy of 0.748 with RandomTree algorithm to recognize FakeInstaller
family;
• an accuracy of 0.689 with NBTree algorithm to recognize Plankton family;
• an accuracy of 0.791 with RandomTree algorithm to recognize DroidKungFu
family;
• an accuracy of 0.779 with RandomTree algorithm to recognize GinMaster fam-
ily;
• an accuracy of 0.786 with RandomForest algorithm to recognize BaseBridge
family;
• an accuracy of 0.79 with NBTree algorithm to recognize Adrd family;
• an accuracy of 0.759 with RandomForest algorithm to recognize KMin family;
• an accuracy of 0.665 with RandomForest algorithm to recognize Geinimi family;
• an accuracy of 0.722 with NBTree algorithm to recognize DroidDream family;
• an accuracy of 0.814 with RandomForest algorithm to recognize Opfake family.
176
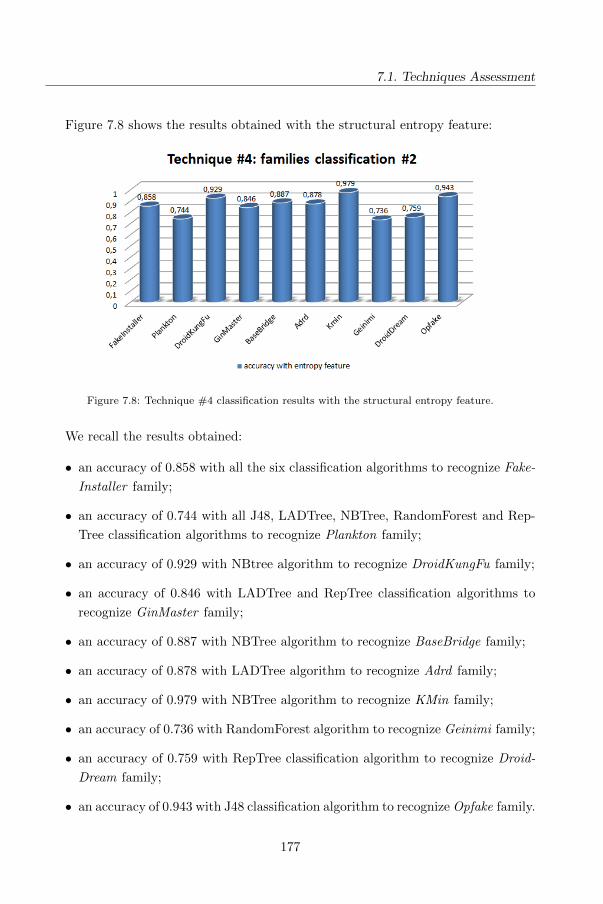
7.1. Techniques Assessment
Figure 7.8 shows the results obtained with the structural entropy feature:
Figure 7.8: Technique #4 classification results with the structural entropy feature.
We recall the results obtained:
• an accuracy of 0.858 with all the six classification algorithms to recognize Fake-
Installer family;
• an accuracy of 0.744 with all J48, LADTree, NBTree, RandomForest and Rep-
Tree classification algorithms to recognize Plankton family;
• an accuracy of 0.929 with NBtree algorithm to recognize DroidKungFu family;
• an accuracy of 0.846 with LADTree and RepTree classification algorithms to
recognize GinMaster family;
• an accuracy of 0.887 with NBTree algorithm to recognize BaseBridge family;
• an accuracy of 0.878 with LADTree algorithm to recognize Adrd family;
• an accuracy of 0.979 with NBTree algorithm to recognize KMin family;
• an accuracy of 0.736 with RandomForest algorithm to recognize Geinimi family;
• an accuracy of 0.759 with RepTree classification algorithm to recognize Droid-
Dream family;
• an accuracy of 0.943 with J48 classification algorithm to recognize Opfake family.
177
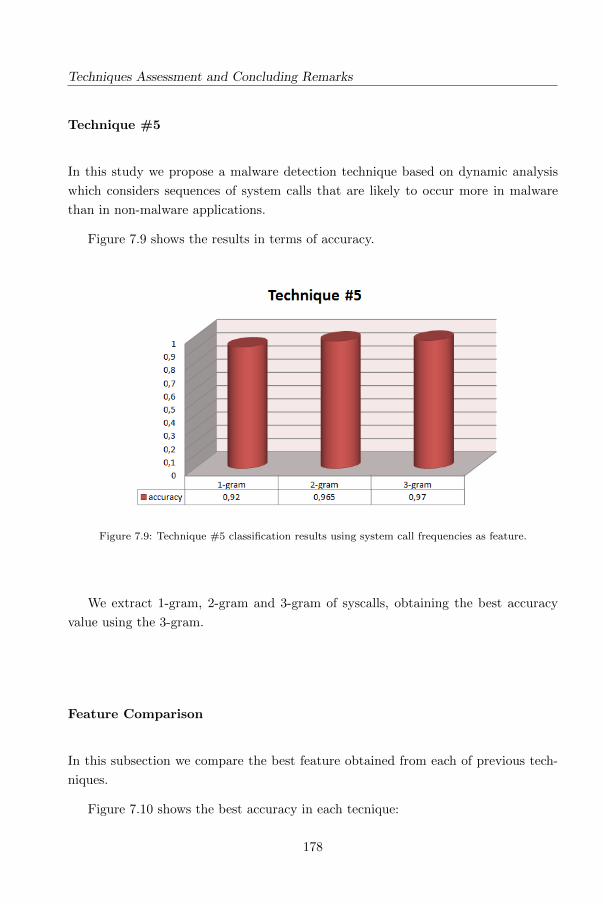
Techniques Assessment and Concluding Remarks
Technique #5
In this study we propose a malware detection technique based on dynamic analysis
which considers sequences of system calls that are likely to occur more in malware
than in non-malware applications.
Figure 7.9 shows the results in terms of accuracy.
Figure 7.9: Technique #5 classification results using system call frequencies as feature.
We extract 1-gram, 2-gram and 3-gram of syscalls, obtaining the best accuracy
value using the 3-gram.
Feature Comparison
In this subsection we compare the best feature obtained from each of previous tech-
niques.
Figure 7.10 shows the best accuracy in each tecnique:
178
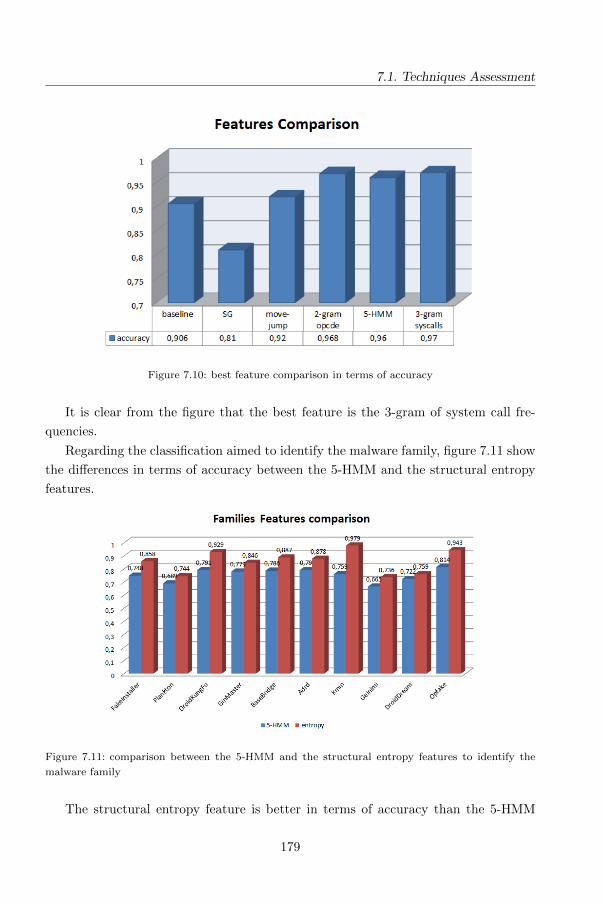
7.1. Techniques Assessment
Figure 7.10: best feature comparison in terms of accuracy
It is clear from the figure that the best feature is the 3-gram of system call fre-
quencies.
Regarding the classification aimed to identify the malware family, figure 7.11 show
the differences in terms of accuracy between the 5-HMM and the structural entropy
features.
Figure 7.11: comparison between the 5-HMM and the structural entropy features to identify the
malware family
The structural entropy feature is better in terms of accuracy than the 5-HMM
179
Techniques Assessment and Concluding Remarks
one to classify correctly the malware families, with an accuracy ranging from 0.66 to
0.943.
7.2 Conclusions and Future Works
With the wide diffusion of smartphones and their usage in a plethora of processes
and activities, these devices have been handling an increasing variety of sensitive
resources.
Attackers are hence producing a large number of malware applications for Android
(the most spread mobile platform), often by slightly modifying existing applications,
which results in malware being organized in families.
In addition to the propagation vectors, malware is also evolving quickly. From
SMS Trojans to legitimate applications repacked with malicious payload, from AES
encrypted root exploits to the ability to dynamically load a payload retrieved from a
remote server, malicious code is constantly changing to maximize the probability to
evade detection.
For example, a malware that is plaguing a huge number of devices while the
authors are writing this paper is the ransomware [32], which encrypts data stored on
the device and holds it for ransom. The information will be released only after the
victim pays the required amount, in bitcoin.
Unfortunately, current solutions to protect users from new threats are still in-
adequate [7]. Current commercial antivirus tools are mostly signature-based: this
approach requires that the vendor be aware of the malware, identify the signature
and send out updates regularly. Signatures have traditionally been in the form of
fixed strings and regular expressions. Anti-malware tools may also use chunks of
code, an instruction sequence or API call sequence as signatures. Signatures that are
more sophisticated require a deeper static analysis of the given sample. Analysis may
be restricted within function boundaries (intra-procedural analysis) or may expand
to cover multiple functions (inter-procedural analysis).
Using signature-based detection, a threat must be widespread for being successfully
recognized.
In this dissertation we presented a series of tecniques to detect Android malware,
based on both static and dynamic analysis analysis. We briefly recall here the best
features in terms of accuracy we extracted:
• sumperm-risklevel, the first defined as a weighted sum of a subset of permissions
requested by the applications, and the second one as a weighted sum of selected
180
7.2. Conclusions and Future Works
combinations of permissions;
• move-jump, the occurrences of two dalvik-level instructions: “move” , “jump” ;
• 2-grams opcode, i.e. a consecutive sequences of dalvik level instructions;
• structural entropy, an estimation of structural entropy of an Android executable;
• 5-HMM, we trained a HMM with 5 hidden states used to determine whether an
application is similar to malware;
• 3-gram system calls, we collected 10 system calls traces for application in order
to build a classifier able to discriminate a malware using as feature the system
call frequencies.
The tecnique obtaining better accuracy is based on the analysis of system calls
sequences. The underlying assumption is that a fingerprint of malware behavior can
be built which consists of the relative frequencies of a limited number of system calls
sequences. This assumption is supported by the fact that the typical evolution of
Android malware consists in modifying existing malware, and hence behaviors are
often common among different malicious apps. Moreover, capturing app behavior at
such a fine grain allows our method to be resilient to known evasion techniques, such
as code alteration at level of opcodes, control flow graph, API calls and third party
libraries.
We used Machine Learning for building the fingerprint using a training set of
execution traces. Furthermore, our validation differs from the most discussed in
literature, as it makes use of real devices rather than emulators or modified kernel,
which makes the experiment more realistic.
Experimentation on 20 000 execution traces of 2000 applications (1000 of them
being malware belonging to different malware families), performed on a real device,
shows promising results: we obtain a detection accuracy of 97%. Moreover, we show
that the proposed method can cope with the dynamism of the mobile apps ecosystem,
since it can detect unknown malware.
As future work, we plan to investigate the following concerns:
• Evaluate to which extent our method can withstand common evasions tech-
niques [117, 122].
• Consider longer sequences (i.e., greater values of n), since this could allow to
capture even better the malware behavior. Unfortunately, since the actual num-
181
Techniques Assessment and Concluding Remarks
ber of possible sequences grows exponentially with n, this also implies coping
with a very large problem space.
• Improve the quality of the training data by labelling only those portions of the
execution traces of malware applications which actually correspond to malicious
behaviors.
• Extend our method to not only classify an entire execution trace as malicious or
trusted, but also to specify exactly where, in the trace, there appears to occur
the malicious behavior.
Additionally we would apply the system calls sequences to track the philogenesys
of malware in order to characterize which are the known malware an unknown mal-
ware descends from. Finally, despite the fact that our findings seem to suggest that
long sequence of opcodes are not so informative, it could be interesting to explore
the possibility of automatically building pattern-like signatures of system calls from
examples and use corresponding frequencies for detection of malware: indeed, the
inference of patterns from examples for security purposes has already been explored
(e.g., for intrusion detection [63])
We moreover discussed two exemplar composition-malware implementations in
order to demonstrate how the composition-model can be coded into an app. A pre-
liminary evaluation has demonstrated that both the applications are not recognized
as malware by more than fifty antiviruses for Android. Finally, as the aim of the
the proposed model is to show which possibilities could be exploited for writing mal-
ware that evades current detection techniques, we also propose some mechanisms that
could impede the success of applications implementing the composition-malware.
As future work in this research direction, we are developing mechanisms to auto-
matically understand the usage profile of the smartphone in terms of resource usage
and communication with servers, devices and external applications; whenever an ac-
tion is not compliant with the profile, we send warnings to the user. For instance,
if the user does not use applications that send the IMEI of the smartphone to third
party servers, when an application attempts to sends the IMEI, a notification is sent
to the user.
182
References
[1] Pros and cons of bringing your own device to work. http://www.pcworld.com/
article/246760/pros and cons of byod bring your own device .html, last
visit 09 April 2015.
[2] Virustotal. https://www.virustotal.com/, last visit 09 April 2015.
[3] apktool. https://code.google.com/p/android-apktool/, last visit 12 June
2015.
[4] dalvik. http://pallergabor.uw.hu/androidblog/dalvik\ opcodes.html, last
visit 12 June 2015.
[5] smali. https://code.google.com/p/smali/, last visit 12 June 2015.
[6] Smartphone shipments tripled since ’08. dumb phones are flat.
http://fortune.com/2011/11/01/smartphone-shipments-tripled-since-
08-dumb-phones-are-flat/l, last visit 13 April 2015.
[7] On the effectiveness of malware protection on android. http://
www.aisec.fraunhofer.de/content/dam/aisec/Dokumente/Publikationen/
Studien TechReports/deutsch/042013-Technical-Report-Android-
Virus-Test.pdf, last visit 21 January 2015.
[8] Applecedes market share in smartphone operating system market as android
surges and windows phone gains, according to idc. http://www.idc.com, last
visit 23 April 2015.
[9] Krebs on security. http://krebsonsecurity.com/2013/08/, last visit 23 April
2015.
183
REFERENCES
[10] Infosecurity, more exploits for android. http://www.infosecurity-
magazine.com/news/more-exploits-for-android-masterkey-
vulnerability/, last visit 23 April 2015.
[11] Threat post, on the android mater-key vulnerability. https:
//threatpost.com/, last visit 23 April 2015.
[12] Naked security, android master key vulnerability. http://naked-
security.sophos.com/2013/08/09/android-master-key-vulnerability-
more-malwa-re-found-exploiting-code-verification-bypass, last visit
23 April 2015.
[13] Symantec, master key android vulnerability discovered. http:
//www.symantec.com/connect/blogs/first-malicious-use-master-key-
android-vulnerability-discovered, last visit 23 April 2015.
[14] F-secure, trojan:android/pincer.a. https://www.f-secure.com/weblog/
archives/00002538.html, last visit 23 April 2015.
[15] Symantec, remote access tool takes aim with android apk binder.
http://www.symantec.com/connect/blogs/remote-access-tool-takes-
aim-android-apk-binder, last visit 23 April 2015.
[16] Morgan stanley releases the mobile internet report. http://
www.morganstanley.com/about-us-articles/4659e2f5-ea51-11de-aec2-
33992aa82cc2.html, last visit 24 March 2015.
[17] Androguard. https://code.google.com/p/androguard/,, last visit 24 Novem-
ber 2014.
[18] An analysis of the anserverbot trojan. http://www.csc.ncsu.edu/faculty/
jiang/pubs/AnserverBot Analysis.pdf, last visit 24 November 2014.
[19] Microsoft malware protection center, trojan:androidos/basebridge.b.
http://www.microsoft.com/security/portal/threat/encyclopedia/
Entry.aspx?Name=Trojan%3AAndroidOS%2FBaseBridge.B, last visit 24 Novem-
ber 2014.
[20] Ginmaster: A case study in android malware. https://www.sophos.com/en-
us/medialibrary/PDFs/technical%20papers/Yu-VB2013.pdf?la=en.pdf,
last visit 24 November 2014.
184
REFERENCES
[21] Security alert: New sophisticated android malware droidkungfu found in al-
ternative chinese app markets. http://www.csc.ncsu.edu/faculty/jiang/
DroidKungFu.html, last visit 24 November 2014.
[22] First spyeye attack on android mobile platform now in the wild.
https://www.trusteer.com/blog/first-spyeye-attack-android-mobile-
platform-now-wild, last visit 24 November 2014.
[23] Ggtracker technical tear down. http://blog.mylookout.com/wp-content/
uploads/2011/06/GGTracker-Teardown Lookout-Mobile-Security.pdf, last
visit 24 November 2014.
[24] Malicious qr codes pushing android malware. http://securelist.com/blog/
virus-watch/31386/malicious-qr-codes-pushing-android-malware/, last
visit 24 November 2014.
[25] Security alert: New stealthy android spyware – plankton – found in official an-
droid market. http://www.csc.ncsu.edu/faculty/jiang/Plankton/, last visit
24 November 2014.
[26] Google play. https://play.google.com/store?hl=it, last visit 24 November
2014.
[27] Using qr tags to attack smartphones (attaging). http://
kaoticoneutral.blogspot.it/2011/09/using-qr-tags-to-attack-
smartphones 10.html, last visit 24 November 2014.
[28] Android roguesppush malware. http://blogs.quickheal.com/wp/android-
roguesppush-malware/, last visit 24 November 2014.
[29] F-secure: New zsone android malware may be developed. http:
//news.softpedia.com/news/F-Secure-New-Zsona-Android-Malware-
May-Be-Developed-272956.shtml, last visit 24 November 2014.
[30] Zeus-in-the-mobile-facts and theories. http://www.securelist.com/en/
analysis/204792194/ZeuS in the Mobile Facts and Theories, last visit 24
November 2014.
[31] An assembler / disassembler for android’s dex format. https://
code.google.com/p/smali/, last visit 25 June 2015.
185
REFERENCES
[32] Malware protection center. http://www.microsoft.com/security/portal/
mmpc/shared/ransomware.aspx, last visit 25 June 2015.
[33] Androguard. https://github.com/androguard/androguard, last visit 25
March 2015.
[34] Andrubis, malware analysis for unknown binaries. https://
anubis.iseclab.org/, last visit 25 March 2015.
[35] Andrototal. http://andrototal.org/, last visit 25 March 2015.
[36] Android debug bridge. http://developer.android.com/tools/help/
adb.html, last visit 25 November 2014.
[37] strace-linux man page. http://linux.die.net/man/1/strace, last visit 25
November 2014.
[38] Byod and increased malware threats help driving billion dollar mobile secu-
rity services market in 2013. https://www.abiresearch.com/press/byod-and-
increased-malware-threats-help-driving-bi/, last visit 31 March 2015.
[39] Your smartphone is hackers’ next big target. http://edition.cnn.com/2013/
08/26/opinion/olson-mobile-hackers/index.html, last visit 31 March 2015.
[40] ’unknowns’ hack nasa, air force, saying ’we’re here to help’. http:
//gcn.com/articles/2012/05/07/the-unknowns-hack-nasa-air-force-
harvard.aspx, last visit 31 March 2015.
[41] ’securelist generic detection. http://securelist.com/glossary/57295/
generic-detection/, last visit 31 March 2015.
[42] Symantec trojan.vundo. http://www.symantec.com/security response/
writeup.jsp?docid=2004-112111-3912-99, last visit 31 March 2015.
[43] Symantec trojan.vundo.b. http://www.symantec.com/security response/
writeup.jsp?docid=2005-042810-2611-99, last visit 31 March 2015.
[44] Tech industry. http://www.cnet.com/topics/tech-industry/, last visit 31
March 2015.
[45] B. krebs. mobile malcoders pay to google play. http://krebsonsecurity.com/
2013/03/mobile-malcoders-pay-to-google-play/, last visit 31 November
2014.
186
REFERENCES
[46] Lookout mobile. lookout tours the current world of mobile threats. lookout blog,
june 2013. https://blog.lookout.com/blog/2013/06/05/world-current-
of-mobile-threats/, last visit 31 November 2014.
[47] Nqmobile. mobile malware up 163% in 2012, getting even smarter in
2013. http://ir.nq.com/phoenix.zhtml?c=243152&p=irol-newsArticle&id=
1806588, last visit 31 November 2014.
[48] Larry page: Update from the ceo, mar. 2013. http://
googleblog.blogspot.fi/2013/03/update-from-ceo.html, last visit 31
November 2014.
[49] Damballa labs. damballa threat report first half 2011. technical report, 2011.
https://www.damballa.com/downloads/r pubs/Damballa Threat Report-
First Half 2011.pdf, last visit 31 November 2014.
[50] Google announces 900 million android activations, 48 billion apps downloaded,
2013. http://appleinsider.com/articles/13/05/15/google-announces-
900-million-android-activations-48-billion-app-installs, last visit
31 November 2014.
[51] Phonepay plus, the uk premium rate phone number and service regulator. http:
//www.phonepayplus.org.uk, last visit 31 November 2014.
[52] C. baldwin, android applications vulnerable to security. http://
www.computerweekly.com/, last visit 31 November 2014.
[53] Creative android apps. http://creativeandroidapps.blogspot.it/, last visit
31 November 2014.
[54] Number of avaliable android applications. http://www.appbrain.com/stats/
number-of-android-apps, last visit 31 November 2014.
[55] Android bgserv found on fake google security patch. http:
//www.symantec.com/connect/blogs/androidbgserv-found-fake-google-
security-patch, last visit 4 December 2014.
[56] P. S. Addison. The illustrated wavelet transform handbook: Introductory theory
and applications in science, engineering, medicine and finance. Taylor & Francis
Group, 2002.
187
REFERENCES
[57] A. Arabo and B. Pranggono. Mobile malware and smart device security: Trends,
challenges and solutions. In Proceedings of 19th International Conference on
Control Systems and Computer Science, 2013.
[58] Alessandro Armando, Alessio Merlo, and Luca Verderame. An empirical evalu-
ation of the android security framework. In Security and Privacy Protection in
Information Processing Systems IFIP Advances in Information and Communi-
cation Technology Volume 405, 2013, pp 176-189, 2013.
[59] Daniel Arp, Michael Spreitzenbarth, Malte Huebner, Hugo Gascon, and Konrad
Rieck. Drebin: Efficient and explainable detection of android malware in your
pocket. In Proceedings of 21th Annual Network and Distributed System Security
Symposium (NDSS), 2014.
[60] A.M. Aswini and P. Vinod. Droid permission miner: Mining prominent per-
missions for android malware analysis. In Proceedings of 5th International
Conference on the Applications of Digital Information and Web Technologies
(ICADIWT), 2014.
[61] S. Attaluri, S. McGhee, and M. Stamp. Profile hidden markov models and
metamorphic virus detection. Journal of Computer Virology and Hacking Tech-
niques, 5(2):179–192, November 2008.
[62] D Barrera, H. G. Kayacik, P. C. van Oorschot, and A. Somayaji. A methodology
for empirical analysis of permission-based security models and its application
to android. In Proceedings of 17th ACM Conference on Computer and Commu-
nications Security, 2010.
[63] Alberto Bartoli, Simone Cumar, Andrea De Lorenzo, and Eric Medvet. Com-
pressing regular expression sets for deep packet inspection. pages 394–403, 2014.
[64] Ulrich Bayer, Christopher Kruegel, and Engin Kirda. Ttanalyze: A tool for
analyzing malware. In European Institute for Computer Antivirus Research
Annual Conference, 2006.
[65] D. Baysa, R. M. Low, and M. Stamp. Structural entropy and metamorphic
malware. Journal of Computer Virology and Hacking Techniques, 9(4):179–192,
November 2013.
[66] D. Bilar. Opcodes as predictor for malware. International Journal of Electronic
Security and Digital Forensics, 2007.
188
REFERENCES
[67] N. Bilton. Hackers With Enigmatic Motives Vex Companies. The New York
Times, p. 5, 26 July 2010.
[68] M. Bishop. Introduction to Computer Security. Addison Wesley Professional.
[69] T. Blasing, A.-D. Schmidt, L. Batyuk, S. A. Camtepe, and S. Albayrak. An
android application sandbox system for suspicious software detection. In Pro-
ceedings of 5th International Conference on Malicious and Unwanted Software,
2010.
[70] T. Blsing, L. Bayyuk, A.-D. Schmidt, S.A. Camtepe, and S. Albayrak. An
android application sandbox system for suspicious software detection. In Pro-
ceedings of 5th International Conference on Malicious and Unwanted Software
(Malware 10), 2010.
[71] M. Borda. Fundamentals in information theory and coding. Springer, 2011.
[72] I. Burguera, U. Zurutuza, and S. Nadjm-Tehrani. Crowdroid: behavior based
malware detection system for android. In Proceedings of the 1st ACM workshop
on Security and privacy in smartphones and mobile devices, pp. 1526, 2011.
[73] Gerardo Canfora, Francesco Mercaldo, and Corrado Aaron Visaggio. A classifier
of malicious android applications. In Proceedings of the 2nd International Work-
shop on Security of Mobile Applications, in conjunction with the International
Conference on Availability, Reliability and Security, 2013.
[74] K. Chen, P. Liu, and Y. Zhang. Achieving accuracy and scalability simultane-
ously in detecting application clones on android markets. In Proceedings of 36th
International Conference on Software Engineering (ICSE), 2014.
[75] K. Z. Chen, N. Johnson, V. DSilva, S. Dai, K. MacNamara, T. Magrino, E. Wu,
M. Rinard, and D. Song. Contextual policy enforcement in android applications
with permission event graphs. In Proceedings of the 21st USENIX Security
Symposium, 2013.
[76] Erika Chin, Adrienne Porter Felt, Kate Greenwood, and David Wagner. An-
alyzing inter-application communication in android. In Proceedings of the 9th
international conference on Mobile systems, applications, and services, 2011.
[77] G. Chuanxiong, W. Helen, and Z. Wenwu. Smart-phone attacks and defenses.
In ACM SIGCOMM HotNets, 2004.
189
REFERENCES
[78] J. Crussell, C. Gibler, and H. Chen. Attack of the clones: Detecting cloned
applications on android markets. In Proceedings of ESORICS, pp. 37-54, 2012.
[79] D. Dagin, Martin T., and T. Startner. Mobile phones as computing devices:
The viruses are coming! IEEE Pervasive Computing, 3(4):11–15, 2004.
[80] D. Dagon, T. Martin, and T. Starder. Mobile Phones as Computing Devices:
The Viruses are Coming! IEEE Pervasive Computing, 3 (4):11, 2004.
[81] F. Di Cerbo, A. Girardello, F. Michahelles, and S. Voronkova. Detection of ma-
licious applications on android os. In Proceedings of 4th international conference
on Computational forensics, 2011.
[82] B. Dixon and Shivakant Mishra. On and rootkit and malware detection in
smartphones. In Proceedings of the International Conference on Dependable
Systems and Networks Workshops, 2010.
[83] B. Dixon, Y. Jiang, A. Jaiantilal, and S. Mishra. Location based power anal-
ysis to detect malicious code in smartphones. In Proceedings of the 1st ACM
workshop on Security and privacy in smartphones and mobile devices, 2011.
[84] W Enck, M. Ongtang, and P. McDaniel. On lightweight mobile phone applica-
tion certification. In Proceedings of 16th ACM Conf. Computer and Communi-
cations Security (CCS 09), 2009.
[85] W. Enck, P. Gilbert, B.-G. Chun, L. P. Cox, J. Jung, P. McDaniel, and A. Sheth.
Taintdroid: An information-flow tracking system for realtime privacy monitor-
ing on smartphones. In OSDI, volume 10,pages 255270, 2010.
[86] W. Enck, D. Octeau, P. McDaniel, and S. Chaudhuri. A study of android
application security. In Proceedings of the 20th USENIX conference on Security,
pp. 2121, 2011.
[87] M. Fazeen and R. Dantu. Another free app: Does it have the right intentions?
In Proceedings of 12th Annual International Conference on Privacy, Security
and Trust (PST), 2014.
[88] Manuel Fernandez-Delgado, Eva Cernadas, Senen Barro, and Dinani Amorim.
Do we need hundreds of classifiers to solve real world classification problems?
The Journal of Machine Learning Research, 15(1):3133–3181, 2014.
[89] Gartner. http://www.gartner.com/newsroom/id/2944819, 2014.
190
REFERENCES
[90] GoogleMobile. http://googlemobile.blogspot.it/2012/02/android-and-
security.html, 2014.
[91] GooglePlay. https://play.google.com/store?hl=it, 2014.
[92] M. Grace, Y. Zhou, Q. Zhang, S. Zou, and X. Jiang. Riskranker: scalable
and accurate zero-day android malware detection. In Proceedings of the 10th
international conference on Mobile systems, applications, and services, pages
281294, 2012.
[93] K.S. Han, B. Kang, and E. G. Im. Malware classification using instruction
frequencies. In Proceedings of RACS’14, International Conference on Research
in Adaptive and Convergent Systems, pp. 298-300, 2014.
[94] S. Hanna, L. Huang, E. Wu, S. Li, and C. Chen. Juxtapp: A scalable system
for detecting code reuse among android applications. In Proceedings of the 9th
Conference on Detection of Intrusions and Malware & Vulnerability Assessment,
2012.
[95] T. Isohara, K. Takemori, and A. Kubota. Kernel-based behavior analysis for
android malware detection. In Proceedings of Seventh International Conference
on Computational Intelligence and Security, pp. 1011-1015, 2011.
[96] Youn-sik Jeong, Hwan-taek Lee, Seong-je Cho, Sangchul Han, and Minkyu
Park. A kernel-based monitoring approach for analyzing malicious behavior
on android. In Proceedings of the 29th Annual ACM Symposium on Applied
Computing, 2014.
[97] Q. Jerome, K. Allix, R. State, and T. Engel. Using opcode-sequences to detect
malicious android applications. In IEEE International Conference on Commu-
nication and Information Systems Security Symposium, pages 914–919, 2014.
[98] Y.-C. Jhi, X. Wang, X. Jia, S Zhu, P. Liu, and D. Wu. Value-based pro-
gram characterization and its application to software plagiarism detection. In
Proceedings of the 33rd International Conference on Software Engineering, pp.
756-765, 2011.
[99] M. Kato and S. Matsuura. A dynamic countermeasure method to android
malware by user approval. In Proceedings of the 37th IEEE Annual Computer
Software and Application Conference, 2013.
191
REFERENCES
[100] H. Kim, J. Smith, and K. G. Shin. Detecting energy-greedy anomalies and
mobile malware variants. In Proceedings of the 6th international conference on
Mobile systems, applications, and services, 2008.
[101] T. Kinjo and K. Funaki. On hmm speech recognition based on complex speech
analysis. In Annual Conference on Industrial Electronics, pages 3477–3480,
2006.
[102] C. Liu, C. Chen, J. Han, and P. S. Yu. Gplag: detection of software plagia-
rism by program dependence graph analysis. In Proceedings of the 12th ACM
SIGKDD international conference on Knowledge discovery and data mining,
2006.
[103] L. Liu, G. Yan, X. Zhang, and S. Chen. Virusmeter: Preventing your cellphone
from spies. In Proceedings of the 29th Annual ACM Symposium on Applied
Computing, 2014.
[104] L.G. Liu, Y. Zhang, and S. Chen. Virusmeter: Preventing your cellphone from
spies. In Proceedings of International Symposium Research in Attacks, Intru-
sions, and Defenses (RAID 09), 2009.
[105] Xing Liu and Jiqiang Liu. A two-layered permission-based android malware
detection scheme. In Proceedings of 2nd IEEE International Conference on
Mobile Cloud Computing, Services, and Engineering, 2014.
[106] B. Lu, F. Liu, X. Ge, B. Liu, and X Luo. A software birthmark based on
dynamic opcode n-gram. In Proceedings of the International Conference on
Semantic Computing, 2007.
[107] Piercy M. Embedded devices next on the virus target list. IEEE Electronics
Systems and Software, 2:42–43, 2004.
[108] Weiser M. The computer for the 21st century. Scientific American, 265(3), 1991.
[109] C. Marforio, F. Aurelien, and C. Srdjan. Application collusion attack on the
permission-based security model and its implications for modern smartphone
systems, 2011. URL \url{ftp://ftp.inf.ethz.ch/doc/tech-reports/7xx/724.pdf}.
[110] G. Myles and C. Collberg. K-gram based software birthmarks. In Proceedings
of the 2005 ACM symposium on Applied computing, 2005.
192
REFERENCES
[111] J. Oberheide and C. Mille. Dissecting the android bouncer. In SummerCon,
2012.
[112] R. Pandita, X. Xiao, W. Yang, W. Enck, and T. Xie. Whyper: Towards au-
tomating risk assessment of mobile applications. In 22nd USENIX Security
Symposium, pages 527–542, 2013.
[113] H. Pieterse and M. S. Oliver. Android botnets on the rise: Trends and char-
acteristics. In in Proceedings of Information Security for South Africa (ISSA),
pp. 1-5, 2012.
[114] T. Pl’otz and G. A. Fink. A new approach for hmm based protein sequence fam-
ily modeling and its application to remote homology classification. In Workshop
on Statistical Signal Processing, pages 1008–1013, 2005.
[115] Adrienne Porter Felt, Erika Chin, Steve Hanna, Dawn Song, and David Wagner.
Android permissions demystified. In Proceedings of 18th ACM Conference on
Computer and Communications Security, 2011.
[116] G. Portokalidis, P. Homburg, K. Anagnostakis, and H. Bos. Paranoid android:
Versatile protection for smartphones. In Proceedings of Annual Computer Se-
curity Applications Conf. (ACSAC 10), 2010.
[117] Dominik Maier Tilo Muller Mykola Protsenko. Divide-and-conquer: Why an-
droid malware cannot be stopped.
[118] Z. Qu, V. Rastogi, X. Zhang, and Y. Chen. Autocog: Measuring the description-
to-permission fidelity in android applications. In 21st ACM Conference on Com-
puter and Communications Security, pages 1354–1365, 2014.
[119] B. B. Rad and M. Masrom. Metamorphic virus variants classification using
opcode frequency histogram. Latest Trends on Computers (Volume I), 2010.
[120] B.B. Rad, M. Masrom, and S. Ibrahim. Opcodes histogram for classifying meta-
morphic portable executables malware. In ICEEE’12, International Conference
on e-Learning and e-Technologies in Education, pp. 209-213, 2012.
[121] Rahul Ramachandran, Tae Oh, and William Stackpole. Android anti-virus
analysis. In Annual Symposium on Information Assurance & Secure Knowledge
Management, pages 35–40, June 2012.
193
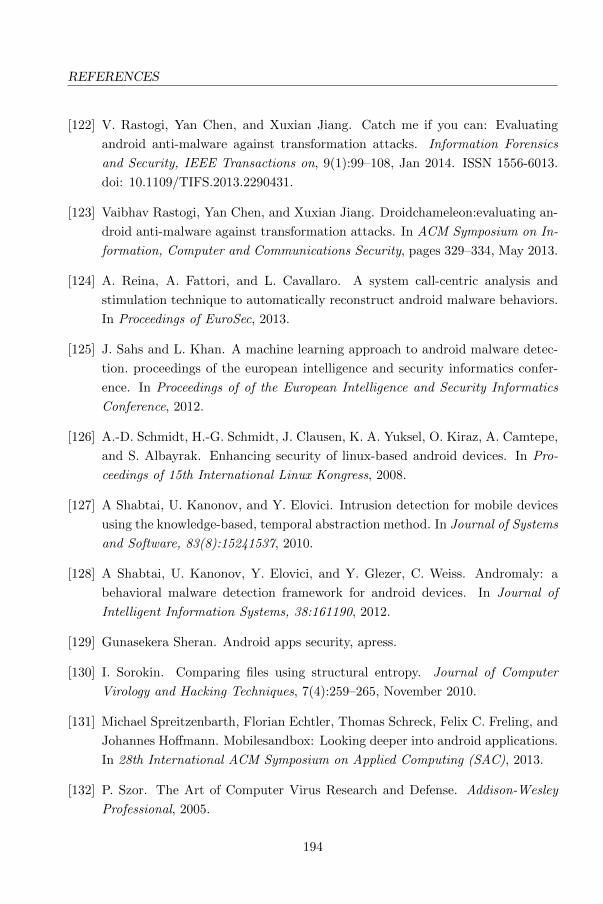
REFERENCES
[122] V. Rastogi, Yan Chen, and Xuxian Jiang. Catch me if you can: Evaluating
android anti-malware against transformation attacks. Information Forensics
and Security, IEEE Transactions on, 9(1):99–108, Jan 2014. ISSN 1556-6013.
doi: 10.1109/TIFS.2013.2290431.
[123] Vaibhav Rastogi, Yan Chen, and Xuxian Jiang. Droidchameleon:evaluating an-
droid anti-malware against transformation attacks. In ACM Symposium on In-
formation, Computer and Communications Security, pages 329–334, May 2013.
[124] A. Reina, A. Fattori, and L. Cavallaro. A system call-centric analysis and
stimulation technique to automatically reconstruct android malware behaviors.
In Proceedings of EuroSec, 2013.
[125] J. Sahs and L. Khan. A machine learning approach to android malware detec-
tion. proceedings of the european intelligence and security informatics confer-
ence. In Proceedings of of the European Intelligence and Security Informatics
Conference, 2012.
[126] A.-D. Schmidt, H.-G. Schmidt, J. Clausen, K. A. Yuksel, O. Kiraz, A. Camtepe,
and S. Albayrak. Enhancing security of linux-based android devices. In Pro-
ceedings of 15th International Linux Kongress, 2008.
[127] A Shabtai, U. Kanonov, and Y. Elovici. Intrusion detection for mobile devices
using the knowledge-based, temporal abstraction method. In Journal of Systems
and Software, 83(8):15241537, 2010.
[128] A Shabtai, U. Kanonov, Y. Elovici, and Y. Glezer, C. Weiss. Andromaly: a
behavioral malware detection framework for android devices. In Journal of
Intelligent Information Systems, 38:161190, 2012.
[129] Gunasekera Sheran. Android apps security, apress.
[130] I. Sorokin. Comparing files using structural entropy. Journal of Computer
Virology and Hacking Techniques, 7(4):259–265, November 2010.
[131] Michael Spreitzenbarth, Florian Echtler, Thomas Schreck, Felix C. Freling, and
Johannes Hoffmann. Mobilesandbox: Looking deeper into android applications.
In 28th International ACM Symposium on Applied Computing (SAC), 2013.
[132] P. Szor. The Art of Computer Virus Research and Defense. Addison-Wesley
Professional, 2005.
194
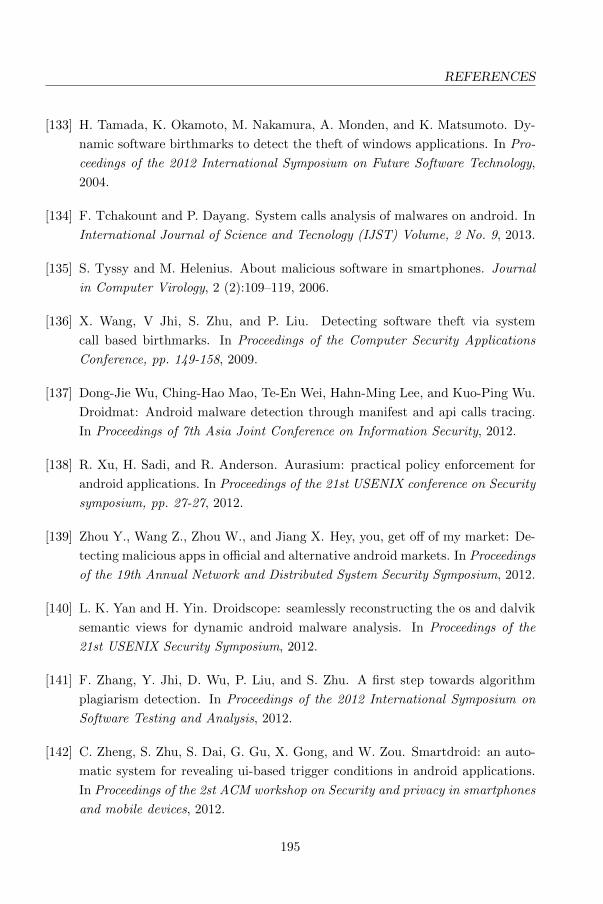
REFERENCES
[133] H. Tamada, K. Okamoto, M. Nakamura, A. Monden, and K. Matsumoto. Dy-
namic software birthmarks to detect the theft of windows applications. In Pro-
ceedings of the 2012 International Symposium on Future Software Technology,
2004.
[134] F. Tchakount and P. Dayang. System calls analysis of malwares on android. In
International Journal of Science and Tecnology (IJST) Volume, 2 No. 9, 2013.
[135] S. Tyssy and M. Helenius. About malicious software in smartphones. Journal
in Computer Virology, 2 (2):109–119, 2006.
[136] X. Wang, V Jhi, S. Zhu, and P. Liu. Detecting software theft via system
call based birthmarks. In Proceedings of the Computer Security Applications
Conference, pp. 149-158, 2009.
[137] Dong-Jie Wu, Ching-Hao Mao, Te-En Wei, Hahn-Ming Lee, and Kuo-Ping Wu.
Droidmat: Android malware detection through manifest and api calls tracing.
In Proceedings of 7th Asia Joint Conference on Information Security, 2012.
[138] R. Xu, H. Sadi, and R. Anderson. Aurasium: practical policy enforcement for
android applications. In Proceedings of the 21st USENIX conference on Security
symposium, pp. 27-27, 2012.
[139] Zhou Y., Wang Z., Zhou W., and Jiang X. Hey, you, get off of my market: De-
tecting malicious apps in official and alternative android markets. In Proceedings
of the 19th Annual Network and Distributed System Security Symposium, 2012.
[140] L. K. Yan and H. Yin. Droidscope: seamlessly reconstructing the os and dalvik
semantic views for dynamic android malware analysis. In Proceedings of the
21st USENIX Security Symposium, 2012.
[141] F. Zhang, Y. Jhi, D. Wu, P. Liu, and S. Zhu. A first step towards algorithm
plagiarism detection. In Proceedings of the 2012 International Symposium on
Software Testing and Analysis, 2012.
[142] C. Zheng, S. Zhu, S. Dai, G. Gu, X. Gong, and W. Zou. Smartdroid: an auto-
matic system for revealing ui-based trigger conditions in android applications.
In Proceedings of the 2st ACM workshop on Security and privacy in smartphones
and mobile devices, 2012.
195
REFERENCES
[143] M. Zheng and J.C.S. Sun. M., Lui. Droid analytics: A signature based analytic
system to collect, extract, analyze and associate android malware. In Proceed-
ings of the International Conference on Security and Privacy in Computing and
Communications, 2013.
[144] W. Zhou, Y. Zhou, X. Jiang, and P. Ning. Detecting repackaged smartphone
applications in third-party android marketplaces. In Proceedings of the second
ACM conference on Data and Application Security and Privacy, 2012.
[145] Y. Zhou and X. Jiang. Dissecting android malware: Characterization and evo-
lution. In SP’12, IEEE Symposium on Security and Privacy, pp. 95-109, 2012.
[146] Yajin Zhou and Xuxian Jiang. Dissecting android malware: Characterization
and evolution. In Proceedings of 33rd IEEE Symposium on Security and Privacy
(Oakland 2012), 2012.
[147] Yajin Zhou and Xuxian Jiang. Android malware, springerbriefs in computer
science, 2013.
196
List of Figures
1.1 Mobile internet users exceed desktop users. . . . . . . . . . . . . . . . 19
1.2 New families and new variants of existing families discovered on differ-
ent platforms from Q1 to Q3 2013. . . . . . . . . . . . . . . . . . . . . 20
1.3 New mobile threats families and variants discovered in Q3 2013, broken
down into types. . . . . . . . . . . . . . . . . . . . . . . . . . . . . . . 21
1.4 Android threats by category, Q3 2013. . . . . . . . . . . . . . . . . . . 22
1.5 Top 15 Android malware identified in Q3 2013. . . . . . . . . . . . . . 23
1.6 Research direction in mobile malware analysis. . . . . . . . . . . . . . 26
1.7 The two-step of the features based classification process: training and
prediction. . . . . . . . . . . . . . . . . . . . . . . . . . . . . . . . . . . 27
1.8 Research overview. . . . . . . . . . . . . . . . . . . . . . . . . . . . . . 28
1.9 Overview of features extracted in my research sorted by precision ob-
tained in the evaluation phase. . . . . . . . . . . . . . . . . . . . . . . 29
2.1 Repackaging is one of the most diffused techniques to include mali-
cious payloads into legitimate applications. Malware writers locate and
download popular apps, disassemble them, enclose malicious payloads,
re-assemble and then make the modified application available to end
users. Often users are tempted to download applications from third-
party markets as they are free versions of paid applications available
on the official market. . . . . . . . . . . . . . . . . . . . . . . . . . . . 38
2.2 An overview of Android malware classified by malicious payload clas-
sified for installation and activation time (I/II) [146]. . . . . . . . . . . 43
2.3 An overview of Android malware classified by malicious payload clas-
sified for installation and activation time (II/II) [146]. . . . . . . . . . 44
197
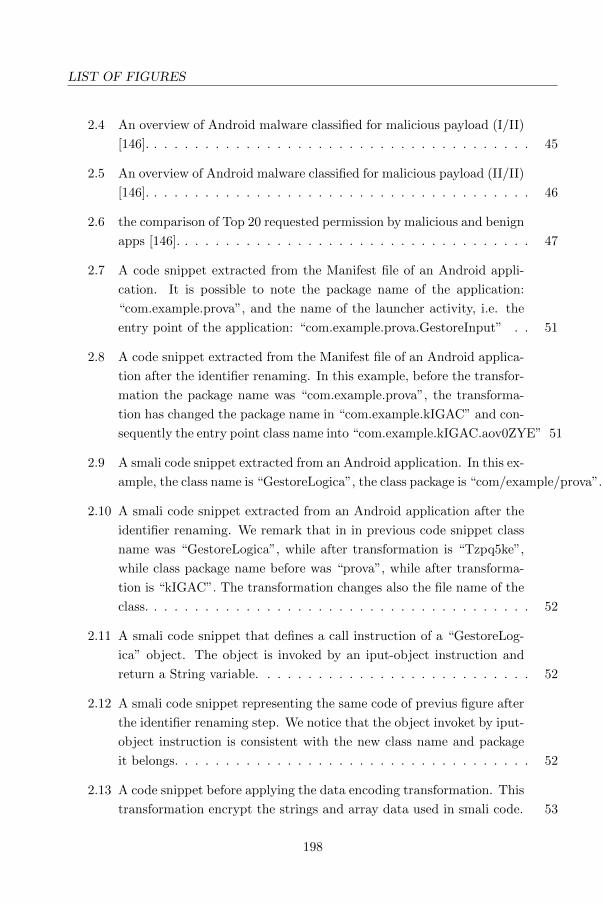
LIST OF FIGURES
2.4 An overview of Android malware classified for malicious payload (I/II)
[146]. . . . . . . . . . . . . . . . . . . . . . . . . . . . . . . . . . . . . . 45
2.5 An overview of Android malware classified for malicious payload (II/II)
[146]. . . . . . . . . . . . . . . . . . . . . . . . . . . . . . . . . . . . . . 46
2.6 the comparison of Top 20 requested permission by malicious and benign
apps [146]. . . . . . . . . . . . . . . . . . . . . . . . . . . . . . . . . . . 47
2.7 A code snippet extracted from the Manifest file of an Android appli-
cation. It is possible to note the package name of the application:
“com.example.prova”, and the name of the launcher activity, i.e. the
entry point of the application: “com.example.prova.GestoreInput” . . 51
2.8 A code snippet extracted from the Manifest file of an Android applica-
tion after the identifier renaming. In this example, before the transfor-
mation the package name was “com.example.prova”, the transforma-
tion has changed the package name in “com.example.kIGAC” and con-
sequently the entry point class name into “com.example.kIGAC.aov0ZYE” 51
2.9 A smali code snippet extracted from an Android application. In this ex-
ample, the class name is “GestoreLogica”, the class package is “com/example/prova”. 52
2.10 A smali code snippet extracted from an Android application after the
identifier renaming. We remark that in in previous code snippet class
name was “GestoreLogica”, while after transformation is “Tzpq5ke”,
while class package name before was “prova”, while after transforma-
tion is “kIGAC”. The transformation changes also the file name of the
class. . . . . . . . . . . . . . . . . . . . . . . . . . . . . . . . . . . . . . 52
2.11 A smali code snippet that defines a call instruction of a “GestoreLog-
ica” object. The object is invoked by an iput-object instruction and
return a String variable. . . . . . . . . . . . . . . . . . . . . . . . . . . 52
2.12 A smali code snippet representing the same code of previus figure after
the identifier renaming step. We notice that the object invoket by iput-
object instruction is consistent with the new class name and package
it belongs. . . . . . . . . . . . . . . . . . . . . . . . . . . . . . . . . . . 52
2.13 A code snippet before applying the data encoding transformation. This
transformation encrypt the strings and array data used in smali code. 53
198
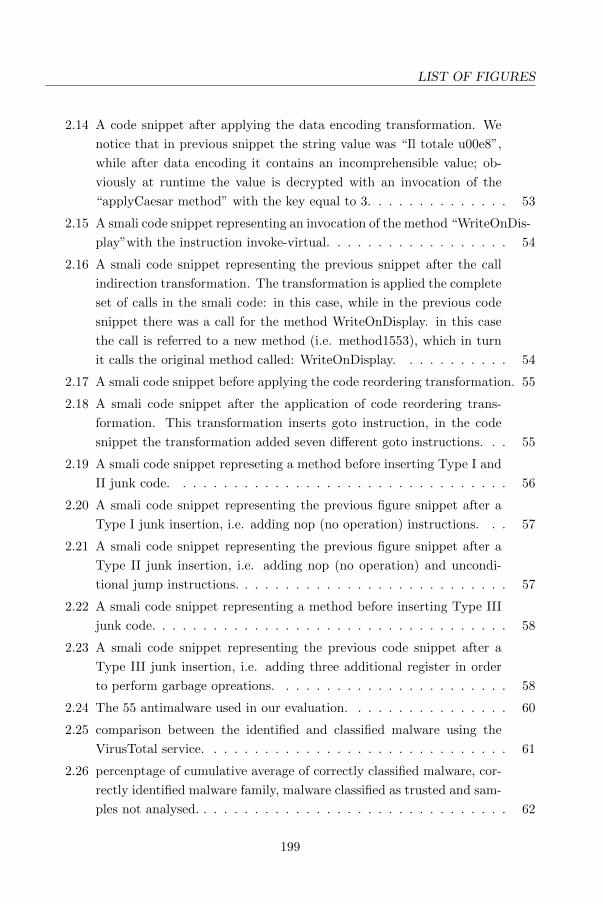
LIST OF FIGURES
2.14 A code snippet after applying the data encoding transformation. We
notice that in previous snippet the string value was “Il totale u00e8”,
while after data encoding it contains an incomprehensible value; ob-
viously at runtime the value is decrypted with an invocation of the
“applyCaesar method” with the key equal to 3. . . . . . . . . . . . . . 53
2.15 A smali code snippet representing an invocation of the method “WriteOnDis-
play”with the instruction invoke-virtual. . . . . . . . . . . . . . . . . . 54
2.16 A smali code snippet representing the previous snippet after the call
indirection transformation. The transformation is applied the complete
set of calls in the smali code: in this case, while in the previous code
snippet there was a call for the method WriteOnDisplay. in this case
the call is referred to a new method (i.e. method1553), which in turn
it calls the original method called: WriteOnDisplay. . . . . . . . . . . 54
2.17 A smali code snippet before applying the code reordering transformation. 55
2.18 A smali code snippet after the application of code reordering trans-
formation. This transformation inserts goto instruction, in the code
snippet the transformation added seven different goto instructions. . . 55
2.19 A smali code snippet represeting a method before inserting Type I and
II junk code. . . . . . . . . . . . . . . . . . . . . . . . . . . . . . . . . 56
2.20 A smali code snippet representing the previous figure snippet after a
Type I junk insertion, i.e. adding nop (no operation) instructions. . . 57
2.21 A smali code snippet representing the previous figure snippet after a
Type II junk insertion, i.e. adding nop (no operation) and uncondi-
tional jump instructions. . . . . . . . . . . . . . . . . . . . . . . . . . . 57
2.22 A smali code snippet representing a method before inserting Type III
junk code. . . . . . . . . . . . . . . . . . . . . . . . . . . . . . . . . . . 58
2.23 A smali code snippet representing the previous code snippet after a
Type III junk insertion, i.e. adding three additional register in order
to perform garbage opreations. . . . . . . . . . . . . . . . . . . . . . . 58
2.24 The 55 antimalware used in our evaluation. . . . . . . . . . . . . . . . 60
2.25 comparison between the identified and classified malware using the
VirusTotal service. . . . . . . . . . . . . . . . . . . . . . . . . . . . . . 61
2.26 percenptage of cumulative average of correctly classified malware, cor-
rectly identified malware family, malware classified as trusted and sam-
ples not analysed. . . . . . . . . . . . . . . . . . . . . . . . . . . . . . . 62
199
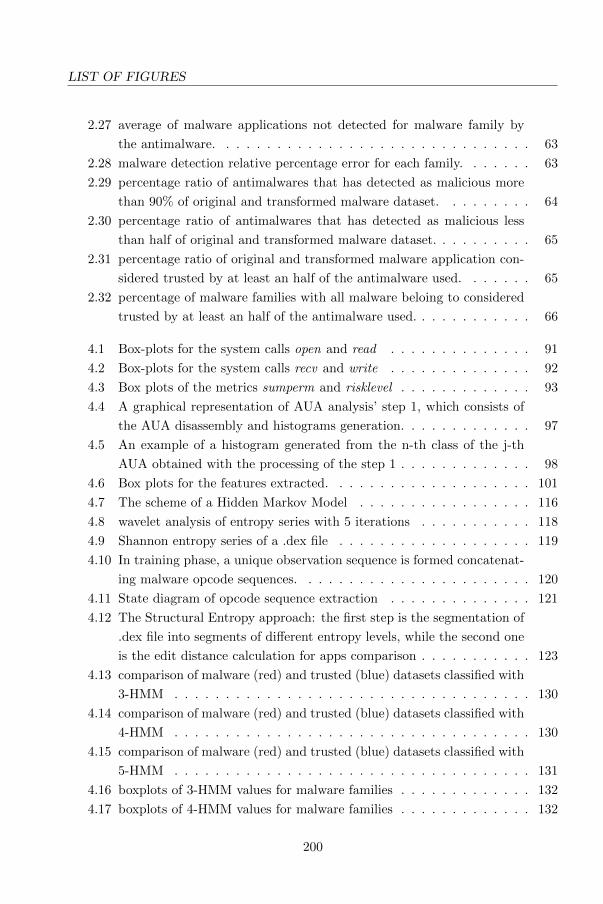
LIST OF FIGURES
2.27 average of malware applications not detected for malware family by
the antimalware. . . . . . . . . . . . . . . . . . . . . . . . . . . . . . . 63
2.28 malware detection relative percentage error for each family. . . . . . . 63
2.29 percentage ratio of antimalwares that has detected as malicious more
than 90% of original and transformed malware dataset. . . . . . . . . 64
2.30 percentage ratio of antimalwares that has detected as malicious less
than half of original and transformed malware dataset. . . . . . . . . . 65
2.31 percentage ratio of original and transformed malware application con-
sidered trusted by at least an half of the antimalware used. . . . . . . 65
2.32 percentage of malware families with all malware beloing to considered
trusted by at least an half of the antimalware used. . . . . . . . . . . . 66
4.1 Box-plots for the system calls open and read . . . . . . . . . . . . . . 91
4.2 Box-plots for the system calls recv and write . . . . . . . . . . . . . . 92
4.3 Box plots of the metrics sumperm and risklevel . . . . . . . . . . . . . 93
4.4 A graphical representation of AUA analysis’ step 1, which consists of
the AUA disassembly and histograms generation. . . . . . . . . . . . . 97
4.5 An example of a histogram generated from the n-th class of the j-th
AUA obtained with the processing of the step 1 . . . . . . . . . . . . . 98
4.6 Box plots for the features extracted. . . . . . . . . . . . . . . . . . . . 101
4.7 The scheme of a Hidden Markov Model . . . . . . . . . . . . . . . . . 116
4.8 wavelet analysis of entropy series with 5 iterations . . . . . . . . . . . 118
4.9 Shannon entropy series of a .dex file . . . . . . . . . . . . . . . . . . . 119
4.10 In training phase, a unique observation sequence is formed concatenat-
ing malware opcode sequences. . . . . . . . . . . . . . . . . . . . . . . 120
4.11 State diagram of opcode sequence extraction . . . . . . . . . . . . . . 121
4.12 The Structural Entropy approach: the first step is the segmentation of
.dex file into segments of different entropy levels, while the second one
is the edit distance calculation for apps comparison . . . . . . . . . . . 123
4.13 comparison of malware (red) and trusted (blue) datasets classified with
3-HMM . . . . . . . . . . . . . . . . . . . . . . . . . . . . . . . . . . . 130
4.14 comparison of malware (red) and trusted (blue) datasets classified with
4-HMM . . . . . . . . . . . . . . . . . . . . . . . . . . . . . . . . . . . 130
4.15 comparison of malware (red) and trusted (blue) datasets classified with
5-HMM . . . . . . . . . . . . . . . . . . . . . . . . . . . . . . . . . . . 131
4.16 boxplots of 3-HMM values for malware families . . . . . . . . . . . . . 132
4.17 boxplots of 4-HMM values for malware families . . . . . . . . . . . . . 132
200
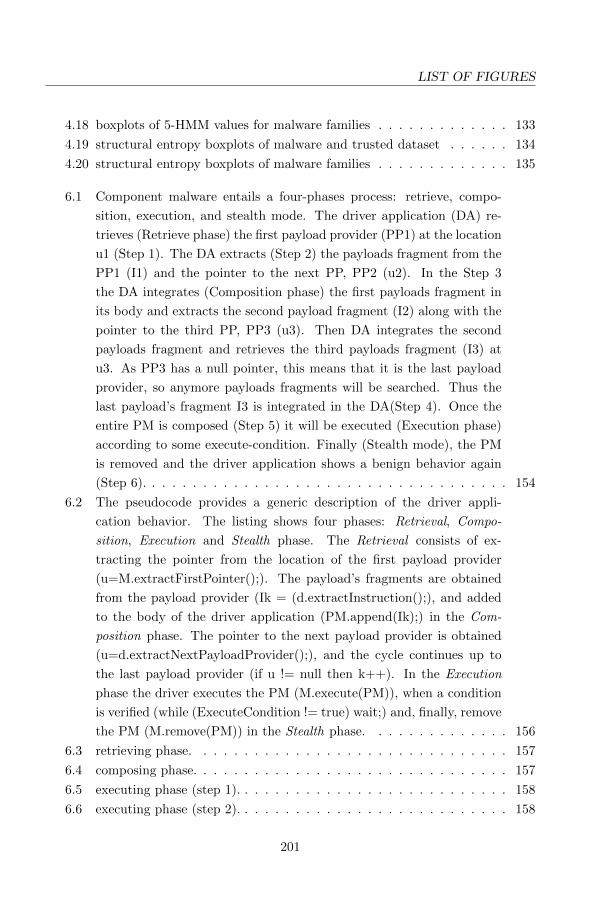
LIST OF FIGURES
4.18 boxplots of 5-HMM values for malware families . . . . . . . . . . . . . 133
4.19 structural entropy boxplots of malware and trusted dataset . . . . . . 134
4.20 structural entropy boxplots of malware families . . . . . . . . . . . . . 135
6.1 Component malware entails a four-phases process: retrieve, compo-
sition, execution, and stealth mode. The driver application (DA) re-
trieves (Retrieve phase) the first payload provider (PP1) at the location
u1 (Step 1). The DA extracts (Step 2) the payloads fragment from the
PP1 (I1) and the pointer to the next PP, PP2 (u2). In the Step 3
the DA integrates (Composition phase) the first payloads fragment in
its body and extracts the second payload fragment (I2) along with the
pointer to the third PP, PP3 (u3). Then DA integrates the second
payloads fragment and retrieves the third payloads fragment (I3) at
u3. As PP3 has a null pointer, this means that it is the last payload
provider, so anymore payloads fragments will be searched. Thus the
last payload’s fragment I3 is integrated in the DA(Step 4). Once the
entire PM is composed (Step 5) it will be executed (Execution phase)
according to some execute-condition. Finally (Stealth mode), the PM
is removed and the driver application shows a benign behavior again
(Step 6). . . . . . . . . . . . . . . . . . . . . . . . . . . . . . . . . . . . 154
6.2 The pseudocode provides a generic description of the driver appli-
cation behavior. The listing shows four phases: Retrieval, Compo-
sition, Execution and Stealth phase. The Retrieval consists of ex-
tracting the pointer from the location of the first payload provider
(u=M.extractFirstPointer();). The payload’s fragments are obtained
from the payload provider (Ik = (d.extractInstruction();), and added
to the body of the driver application (PM.append(Ik);) in the Com-
position phase. The pointer to the next payload provider is obtained
(u=d.extractNextPayloadProvider();), and the cycle continues up to
the last payload provider (if u != null then k++). In the Execution
phase the driver executes the PM (M.execute(PM)), when a condition
is verified (while (ExecuteCondition != true) wait;) and, finally, remove
the PM (M.remove(PM)) in the Stealth phase. . . . . . . . . . . . . . 156
6.3 retrieving phase. . . . . . . . . . . . . . . . . . . . . . . . . . . . . . . 157
6.4 composing phase. . . . . . . . . . . . . . . . . . . . . . . . . . . . . . . 157
6.5 executing phase (step 1). . . . . . . . . . . . . . . . . . . . . . . . . . . 158
6.6 executing phase (step 2). . . . . . . . . . . . . . . . . . . . . . . . . . . 158
201
LIST OF FIGURES
6.7 executing phase (step 3). . . . . . . . . . . . . . . . . . . . . . . . . . . 159
6.8 stealth mode phase. . . . . . . . . . . . . . . . . . . . . . . . . . . . . 159
6.9 Composition-malware with a single payload provider: the ARS ap-
plication implements this model. ARS is initially composed only by
the App Component A, thus the Injector Server sends the malicious
payload (App Component B): the dashed red box represents the trans-
ferred payload from the Injector Server to the Driver Application (AD).
The payload provider host is hardcoded in the Driver Application. . . 160
6.10 the two fragments of code show the difference in the code of the driver
application when the attacker does not send the malicious payload (a)
when the malicious payload is sent (b). In the second case the resulting
behavior is to alter the state of object Mail adding two addresses in
the BCC. . . . . . . . . . . . . . . . . . . . . . . . . . . . . . . . . . . 161
6.11 Composition-malware with multiple payload providers: the FindMe
application implements this model. The payload is composed of a series
of fragments retrieved from different payload providers (the CodeBase
Servers). First of all FindMe retrieves the CodeBase servers addresses
from the Driver Server; then it receives the payload fragments from the
different Codebase Servers and composes the final payload. The model
is distributed, both the CodeBase Server and the Driver Server that
can be replicated. . . . . . . . . . . . . . . . . . . . . . . . . . . . . . . 162
6.12 An exemplar configuration file with three Codebase servers addresses. 162
6.13 the two fragments of code show the difference in the code of the driver
application when the attacker does not send the malicious payload (a)
when the malicious payload is sent (b). In the second case the resulting
behavior is to add a displacement of 0.0025 degrees to the latitude and
longitude of a Location object already instanced. . . . . . . . . . . . . 163
6.14 the two fragments of code show the difference in the code of the driver
application when the attacker does not send the malicious payload (a)
when the malicious payload is sent (b). In the second case the resulting
behavior is to add a malicious link to a Mail object already instanced. 164
7.1 Baseline accuracy for value of varying from 25 to 750. . . . . . . . . . 170
7.2 Technique #1 classification results: the second group of metrics (sumperm
and risklevel) obtained the best accuracy value. . . . . . . . . . . . . . 171
7.3 Technique #2 classification results with the single features . . . . . . . 172
7.4 Technique #2 classification results with the three feature groups. . . . 173
202
LIST OF FIGURES
7.5 Technique #3 classification results with frequency op-code features. . 173
7.6 Technique #4 classification results with the features: 3-HMM, 4-HMM,
5-HMM and entropy. . . . . . . . . . . . . . . . . . . . . . . . . . . . . 175
7.7 Technique #4 classification results with the 5-HMM feature. . . . . . . 176
7.8 Technique #4 classification results with the structural entropy feature. 177
7.9 Technique #5 classification results using system call frequencies as fea-
ture. . . . . . . . . . . . . . . . . . . . . . . . . . . . . . . . . . . . . . 178
7.10 best feature comparison in terms of accuracy . . . . . . . . . . . . . . 179
7.11 comparison between the 5-HMM and the structural entropy features
to identify the malware family . . . . . . . . . . . . . . . . . . . . . . . 179
203

List of Tables
3.1 Comparison of the related approaches along with the correspondent set
of features used for detecting malware. . . . . . . . . . . . . . . . . . . 77
3.2 Comparison of the related approaches along with the correspondent
dataset used for detecting malware and obtained results (M=malware,
T=trusted, 3=third party markets) . . . . . . . . . . . . . . . . . . . . 82
4.1 Number of samples for the top 10 families with installation details
(standalone, repackaging, update), kind of attack (trojan, botnet) and
events that trigger malicious payload. . . . . . . . . . . . . . . . . . . 84
4.2 Baseline results. . . . . . . . . . . . . . . . . . . . . . . . . . . . . . . . 87
4.3 The couples (permission, weight) of the subset of permissions used in
the metric sumperm. . . . . . . . . . . . . . . . . . . . . . . . . . . . . 89
4.4 The couples (permissions combination, risklevel) of the subset of per-
missions used in the metric risklevel. . . . . . . . . . . . . . . . . . . . 90
4.5 Results of the test of the null hypothesis H0 . . . . . . . . . . . . . . . 91
4.6 The values of accuracy, recall and roc area for classifying Malware (M)
and Trusted (T) applications, calculated with the metrics oft he First
Group (FG), the Second Group (SG), and the Third Group (TG), with
the algorithms J48, LadTree, NBTree, RandomForest, Randomfree and
RepTree. . . . . . . . . . . . . . . . . . . . . . . . . . . . . . . . . . . . 94
4.7 Results of the test of the null hypothesis H0 . . . . . . . . . . . . . . . 102
4.8 Classification Results: Accuracy, Recall and RocArea for classifying
Malware and Trusted applications, computed with the single features,
with the algorithms J48, LadTree, NBTree, RandomForest, RandomTree
and RepTree . . . . . . . . . . . . . . . . . . . . . . . . . . . . . . . . 107
205
LIST OF TABLES
4.9 Classification Results: Accuracy, Recall and RocArea for classifying
Malware and Trusted applications, computed with the three groups of
features, with the algorithms J48, LadTree, NBTree, RandomForest,
RandomTree and RepTree. . . . . . . . . . . . . . . . . . . . . . . . . 108
4.10 Results in terms of accuracy (%) on training and testing . . . . . . . . 114
4.11 Mean and standard deviation values of the detection rate (%) on dif-
ferent families, with n = 2 and k = 1000 . . . . . . . . . . . . . . . . . 115
4.12 The number of samples for each family considered in the HMM exper-
iments. The test set is approximately the 20% of subset considered. . 124
4.13 Results of the test of the null hypothesis H0 . . . . . . . . . . . . . . . 127
4.14 Comparing Accuracy, Recall and RocArea of 3-HMM (f1), 4-HMM
(f2), 5-HMM (f3) detector and Structural Entropy (f4) based detector
for malware classification with the algorithms J48, LadTree, NBTree,
RandomForest, RandomTree and RepTree. . . . . . . . . . . . . . . . 128
4.15 Accuracy, Recall and RocArea obtained by classifying Malicious fami-
lies dataset, with the algorithms J48 (A1), LadTree (A2), NBTree (A3),
RandomForest (A4), RandomTree (A5) and RepTree (A6). . . . . . . 136
5.1 Statistics about the length |t| of collected sequences forming our dataset.145
5.2 Percentage of ten most occurring system calls in our dataset, divided
between traces collected for trusted (left) and malware (right) applica-
tions. . . . . . . . . . . . . . . . . . . . . . . . . . . . . . . . . . . . . . 146
5.3 Results on unseen execution traces. . . . . . . . . . . . . . . . . . . . . 147
5.4 Results on unseen applications, with n = 3. . . . . . . . . . . . . . . . 149
5.5 FNR on unseen families, with n = 3 and k = 750. . . . . . . . . . . . . 150
6.1 The complete list of the antimalware used to evaluate the composition-
malware case study implementations. . . . . . . . . . . . . . . . . . . . 165
206