Ruggieri tutto quello che sappiamo
81
TUTTO QUELLO CHE SAPPIAMO SULL’ENERGIA Gianluca Ruggieri È
-
Upload
wwf-italia -
Category
Environment
-
view
952 -
download
5
Transcript of Ruggieri tutto quello che sappiamo
TUTTO QUELLO CHE SAPPIAMO SULL’ENERGIA
Gianluca Ruggieri
È


È GIUSTO TRIVELLARE PER CERCARE PETROLIO E GAS
CI GUADAGNIAMO

In Italia le Royalties sul petrolio e il gas sono pari al 10%
poi ci sono le tasse
che però non è difficile eludere
Il 10% di quanto estratto viene dato allo stato
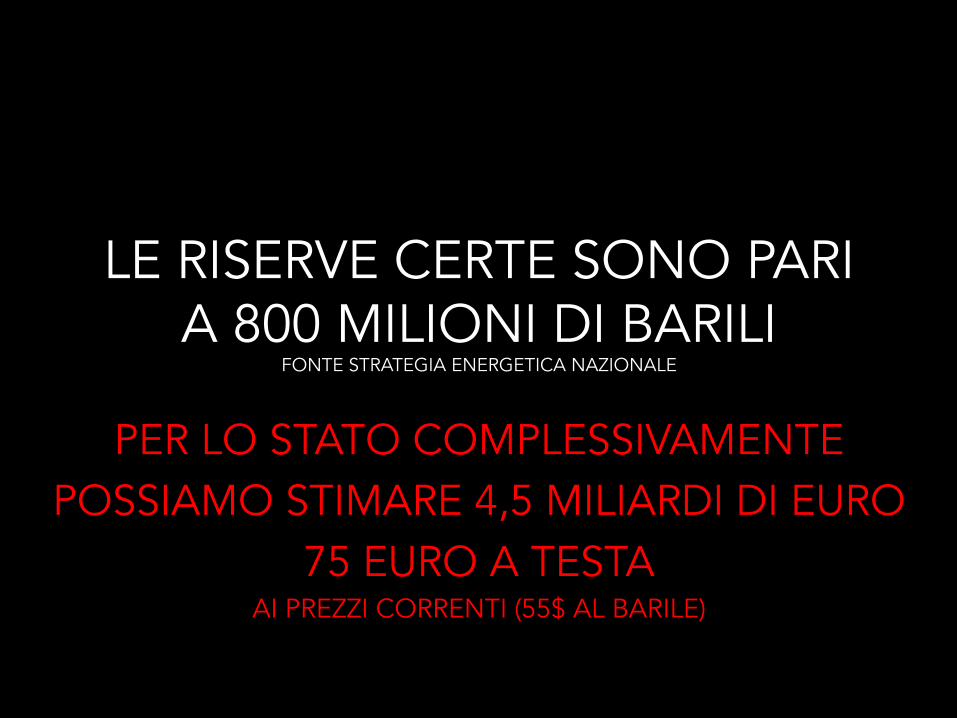
LE RISERVE CERTE SONO PARI A 800 MILIONI DI BARILI
FONTE STRATEGIA ENERGETICA NAZIONALE
PER LO STATO COMPLESSIVAMENTE POSSIAMO STIMARE 4,5 MILIARDI DI EURO
75 EURO A TESTA AI PREZZI CORRENTI (55$ AL BARILE)
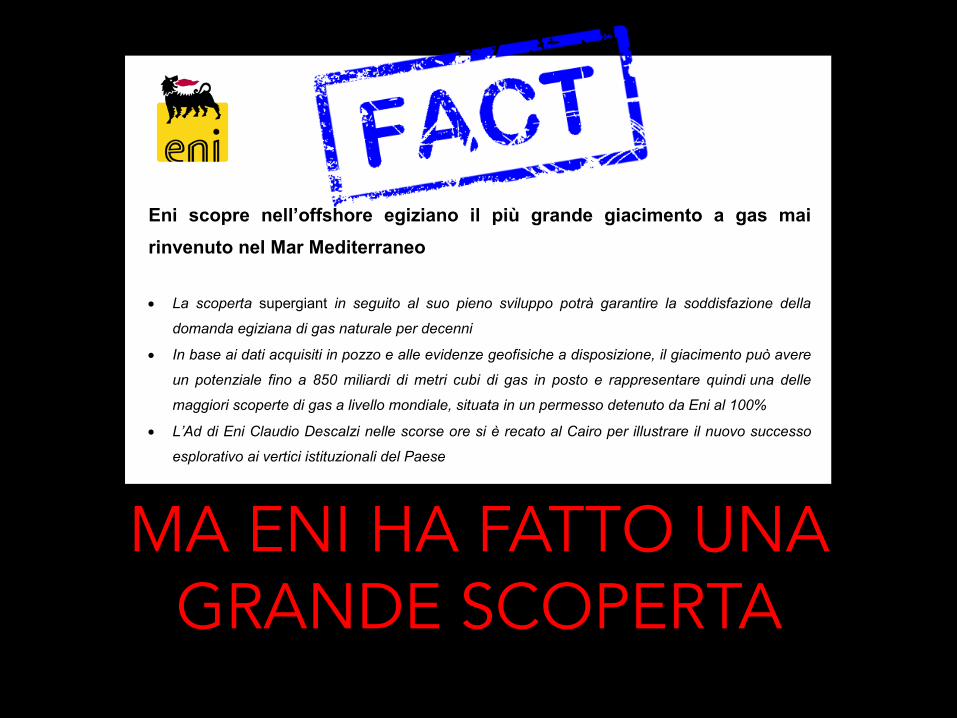
Eni scopre nell’offshore egiziano il più grande giacimento a gas mai
rinvenuto nel Mar Mediterraneo
• La scoperta supergiant in seguito al suo pieno sviluppo potrà garantire la soddisfazione della
domanda egiziana di gas naturale per decenni
• In base ai dati acquisiti in pozzo e alle evidenze geofisiche a disposizione, il giacimento può avere
un potenziale fino a 850 miliardi di metri cubi di gas in posto e rappresentare quindi una delle
maggiori scoperte di gas a livello mondiale, situata in un permesso detenuto da Eni al 100%
• L’Ad di Eni Claudio Descalzi nelle scorse ore si è recato al Cairo per illustrare il nuovo successo
esplorativo ai vertici istituzionali del Paese
San Donato Milanese (MI), 30 agosto 2015 – Eni ha effettuato una scoperta di gas di rilevanza
mondiale nell'offshore egiziano del Mar Mediterraneo, presso il prospetto esplorativo denominato
Zohr. Il pozzo Zohr 1X, attraverso il quale è stata effettuata la scoperta, è situato a 1.450 metri di
profondità d’acqua, nel blocco Shorouk, siglato nel gennaio 2014 con il Ministero del Petrolio egiziano
e con la Egyptian Natural Gas Holding Company (EGAS) a seguito di una gara internazionale
competitiva.
Dalle informazioni geologiche e geofisiche disponibili, e dai dati acquisiti nel pozzo di scoperta, il
giacimento supergiant presenta un potenziale di risorse fino a 850 miliardi di metri cubi di gas in
posto (5,5 miliardi di barili di olio equivalente) e un’estensione di circa 100 chilometri quadrati. Zohr
rappresenta la più grande scoperta di gas mai effettuata in Egitto e nel mar Mediterraneo e può
diventare una delle maggiori scoperte di gas a livello mondiale. Questo successo esplorativo offrirà un
contributo fondamentale nel soddisfare la domanda egiziana di gas naturale per decenni.
Eni svolgerà nell’immediato le attività di delineazione del giacimento per assicurare lo sviluppo
accelerato della scoperta che sfrutti al meglio le infrastrutture già esistenti, a mare e a terra.
1
MA ENI HA FATTO UNA
GRANDE SCOPERTA

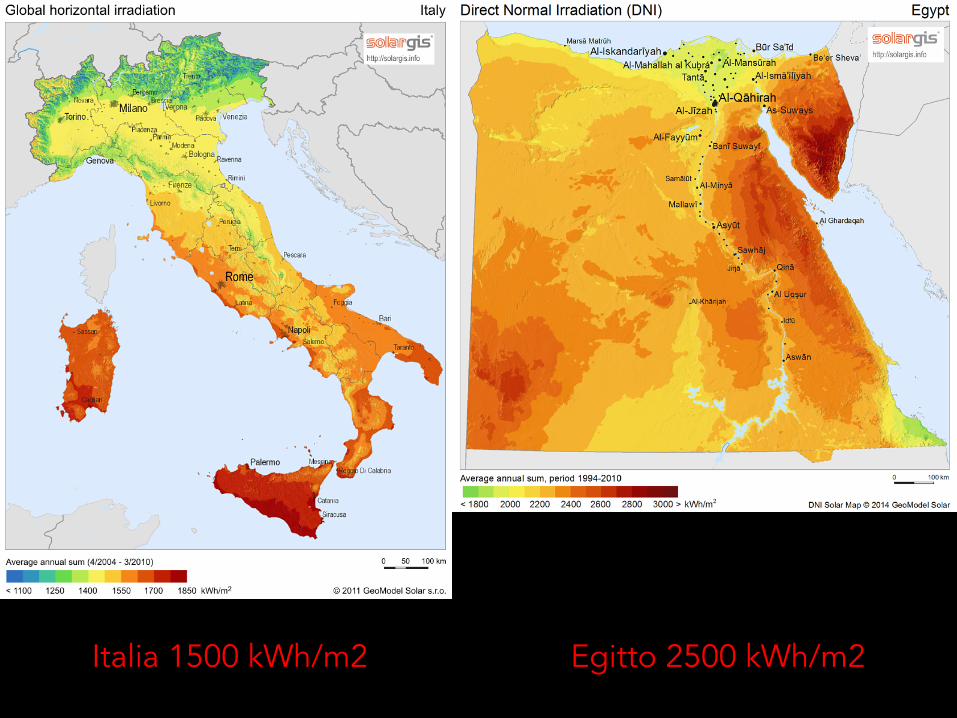
Italia 1500 kWh/m2 Egitto 2500 kWh/m2
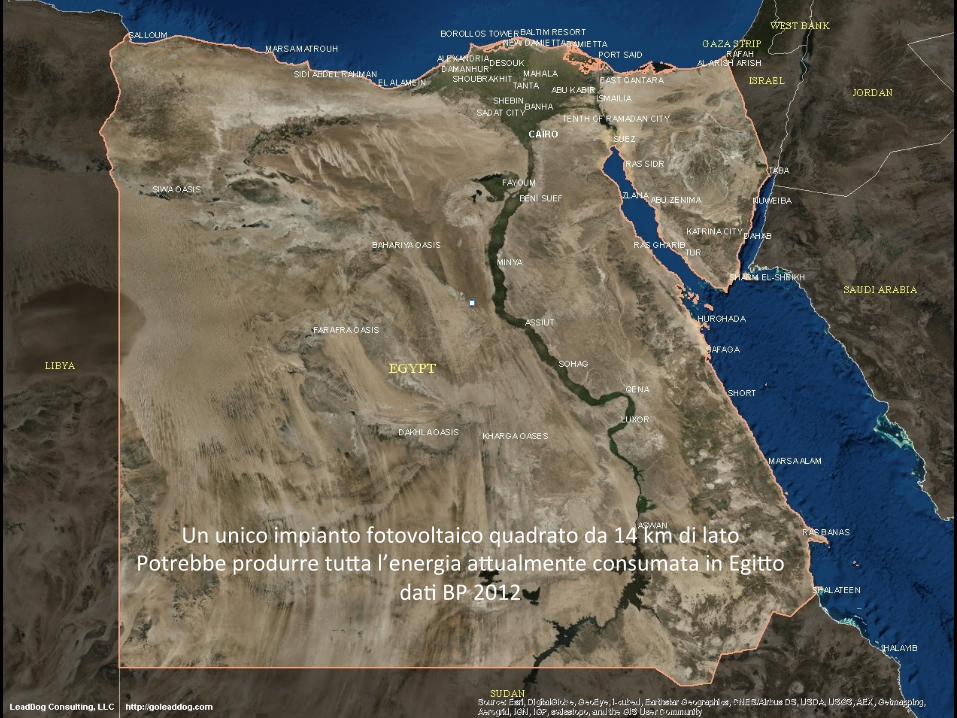
Un unico impianto fotovoltaico quadrato da 14 km di lato Potrebbe produrre tu9a l’energia a9ualmente consumata in Egi9o
da> BP 2012

MERCATO SOLARE IN EGITTO SI STIMA 2-3 GW/ANNO
INVESTIMENTI DA 3 MILIARDI €/ANNO

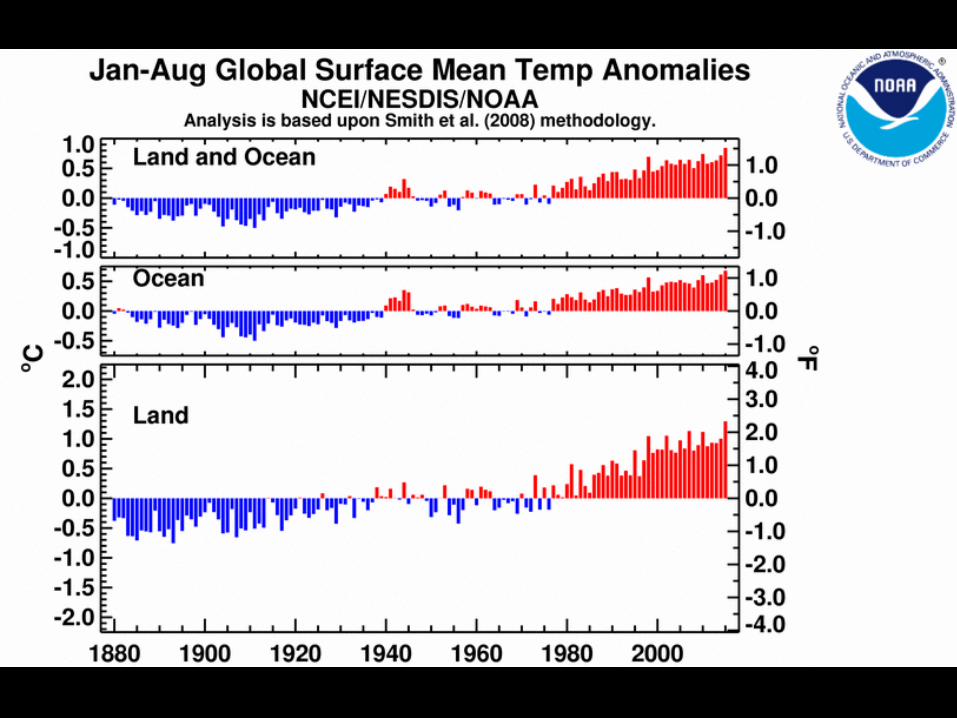
IL GAS È PULITO
NON C’ENTRA CON IL CAMBIAMENTO CLIMATICO
CO2 EMISSIONS FROM FUEL COMBUSTION Highlights (2014 Edition) - 9
INTERNATIONAL ENERGY AGENCY
Figure 4. Change in CO2 emissions (2011-12) MtCO
2
Key point: In 2012, emissions from coal and oil in-creased in non-Annex I countries and decreased in Annex I countries.
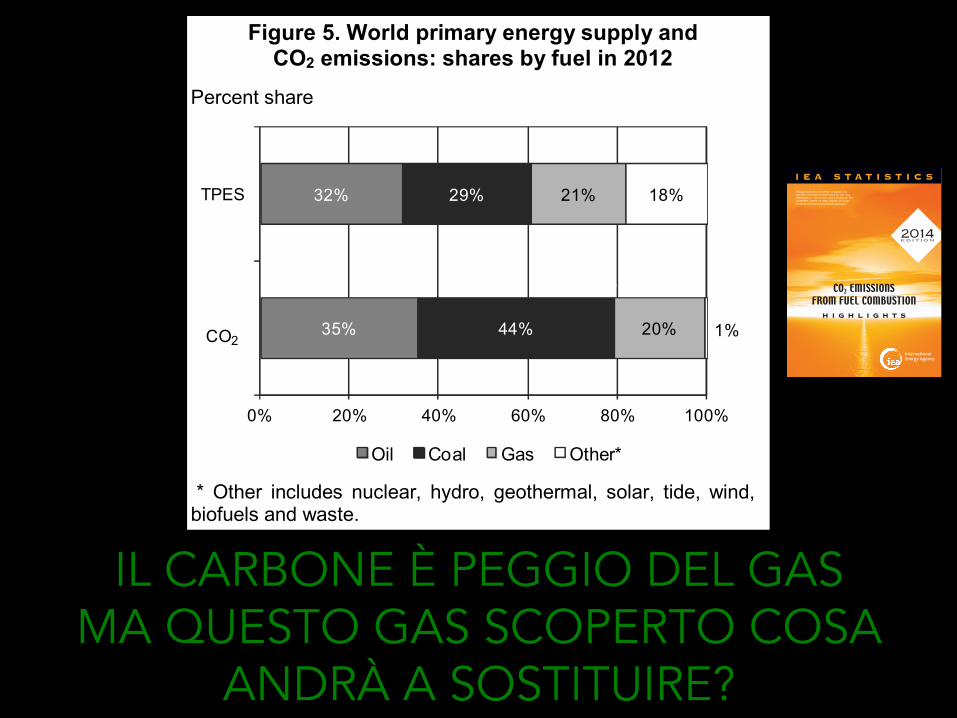
Emissions by fuel Although coal represented 29% of the world TPES in 2012, it accounted for 44% of the global CO2 emis-sions due to its heavy carbon content per unit of en-ergy released, and to the fact that 18% of the TPES derives from carbon-neutral fuels (Figure 5). As compared to gas, coal is nearly twice as emission intensive on average.5
Figure 5. World primary energy supply and CO2 emissions: shares by fuel in 2012
Percent share
* Other includes nuclear, hydro, geothermal, solar, tide, wind,
biofuels and waste.
Key point: Globally, coal combustion generates the largest share of CO2 emissions, although oil still is the largest energy source.
5. Default carbon emission factors from the Revised 1996 IPCC Guidelines: 15.3 tC/TJ for gas, 16.8 to 27.5 tC/TJ for oil products, 25.8 to 29.1 tC/TJ for primary coal products.
Those shares evolved significantly during the last decade, following ten years of rather stable relative contributions among fuels. In 2002 in fact, oil still held the largest share of emissions (41%), three per-centage points ahead of coal (Figure 6).
Figure 6. Fuel shares in global CO2 emissions
Key point: The fossil fuel mix changed significantly in the last 10 years, with coal replacing oil as the largest source of CO2 emissions.
In 2012, CO2 emissions from the combustion of coal increased by 1.3% to 13.9 GtCO2. Currently, coal fills much of the growing energy demand of those devel-oping countries (such as China and India) where en-ergy-intensive industrial production is growing rapidly and large coal reserves exist with limited re-serves of other energy sources.
Emissions by region Non-Annex I countries, collectively, represented 55% of global CO2 emissions in 2012. At the regional level, annual growth rates varied greatly: emissions growth in China (3.1%) was lower than in previous years, however, emissions grew strongly in Africa (5.6%), Asia excluding China (4.9%) and the Middle East (4.5%). Emissions in Latin America6 (4.1%) and Annex II Asia Oceania (2.5%) grew at a more moder-ate rate, while emissions decreased in Annex II North America (-3.7%), Annex II Europe (-0.5%) and Annex I EIT (-0.8%) (Figure 7). Regional differences in contributions to global emis-sions conceal even larger differences among individ-ual countries. Nearly two-thirds of global emissions for 2012 originated from just ten countries, with the shares of China (26%) and the United States (16%) far surpassing those of all others. Combined, these two countries alone produced 13.3 GtCO2. The top-10 emitting countries include five Annex I countries and five non-Annex I countries (Figure 8).
6. For the purposes of this discussion, Latin America includes non-OECD Americas and Chile.
-300
-200
-100
0
100
200
300
400
500
600
700
Coal Oil Gas Other Total
Annex I Non-Annex I
35%
32%
44%
29%
20%
21% 18%
0% 20% 40% 60% 80% 100%
CO2
TPES
Oil Coal Gas Other*
CO2
CO2
CO2
CO2
1%
82%
10%
20%
30%
40%
50%
60%
1971 1976 1981 1986 1991 1996 2001 2006 2012
Coal Oil Gas
IL CARBONE È PEGGIO DEL GAS MA QUESTO GAS SCOPERTO COSA
ANDRÀ A SOSTITUIRE?
CO2 EMISSIONSFROM FUEL COMBUSTION
I E A S T A T I S T I C S
InternationalEnergy Agency
H I G H L I G H T S
Please note that this PDF is subject to specific restrictions that limit its use and distribution. The terms and conditions are available online at http://www.iea.org/termsandconditionsuseandcopyright/
2014EDIT ION
SONO PREOCCUPATO PER IL CAMBIAMENTO CLIMATICO
PER QUELLO CHE LASCERÒ AI MIEI NIPOTI
SONO PREOCCUPATO PER IL CAMBIAMENTO CLIMATICO
PER IL FUTURO DEL PIANETA
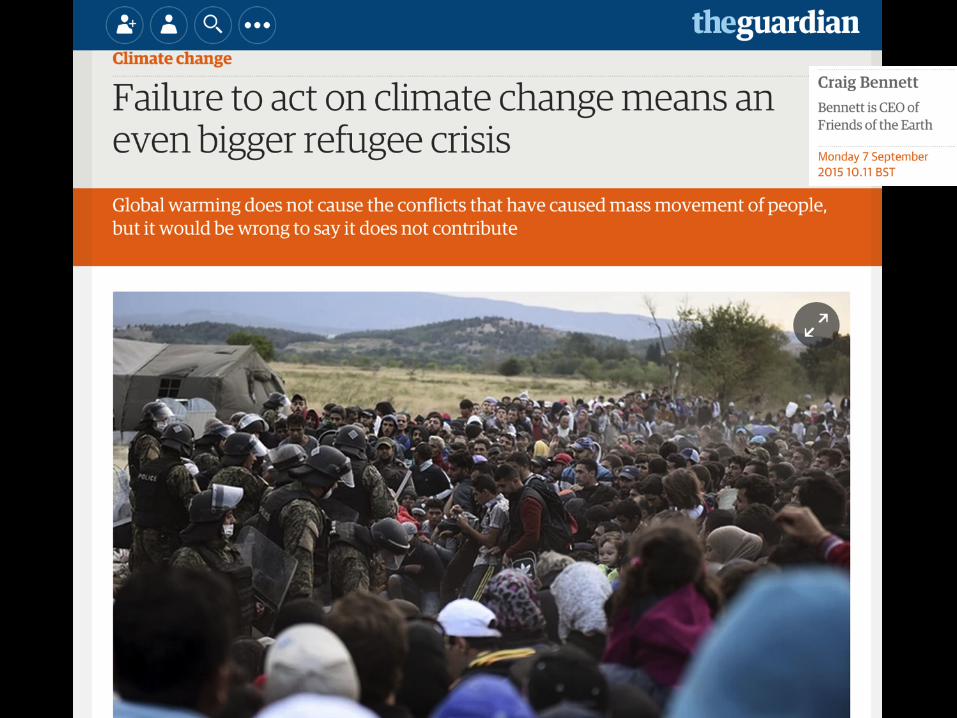

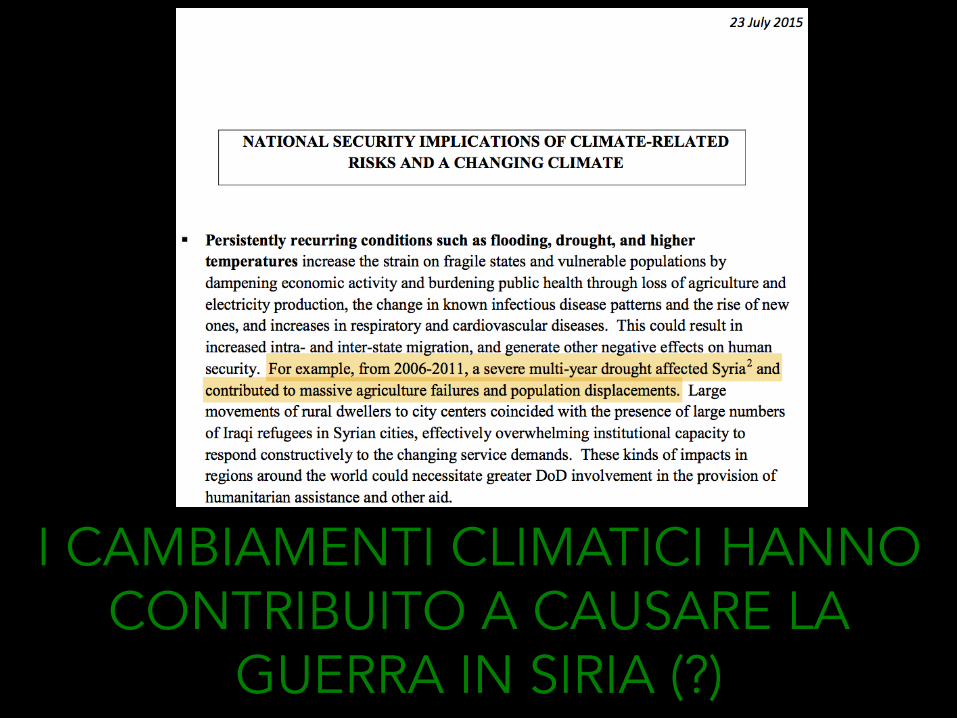
I CAMBIAMENTI CLIMATICI HANNO CONTRIBUITO A CAUSARE LA
GUERRA IN SIRIA (?)
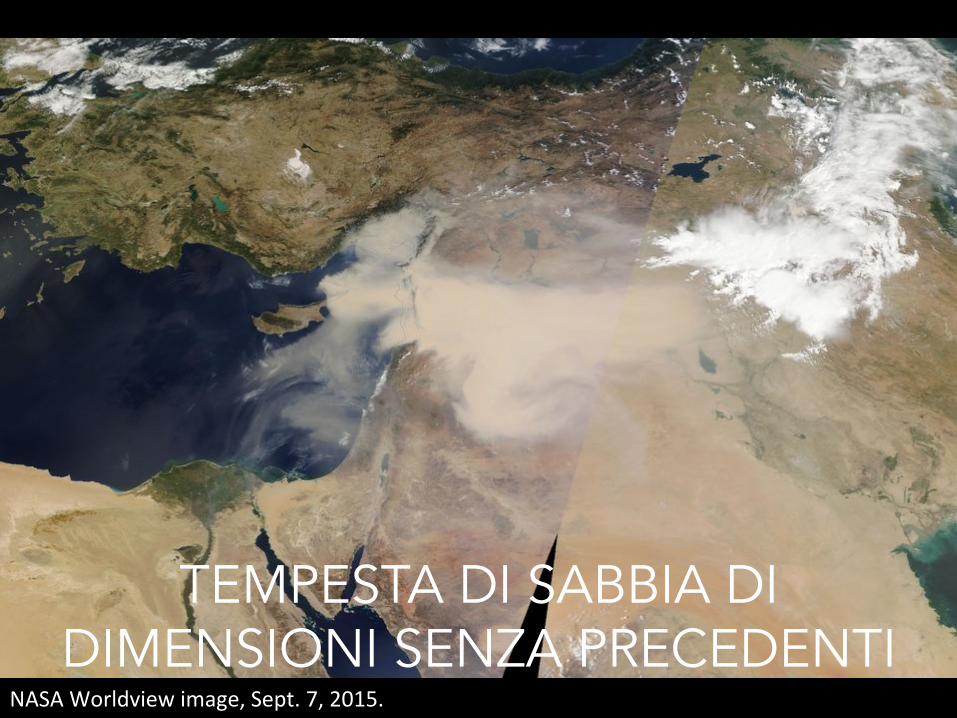
NASA Worldview image, Sept. 7, 2015.
TEMPESTA DI SABBIA DI DIMENSIONI SENZA PRECEDENTI
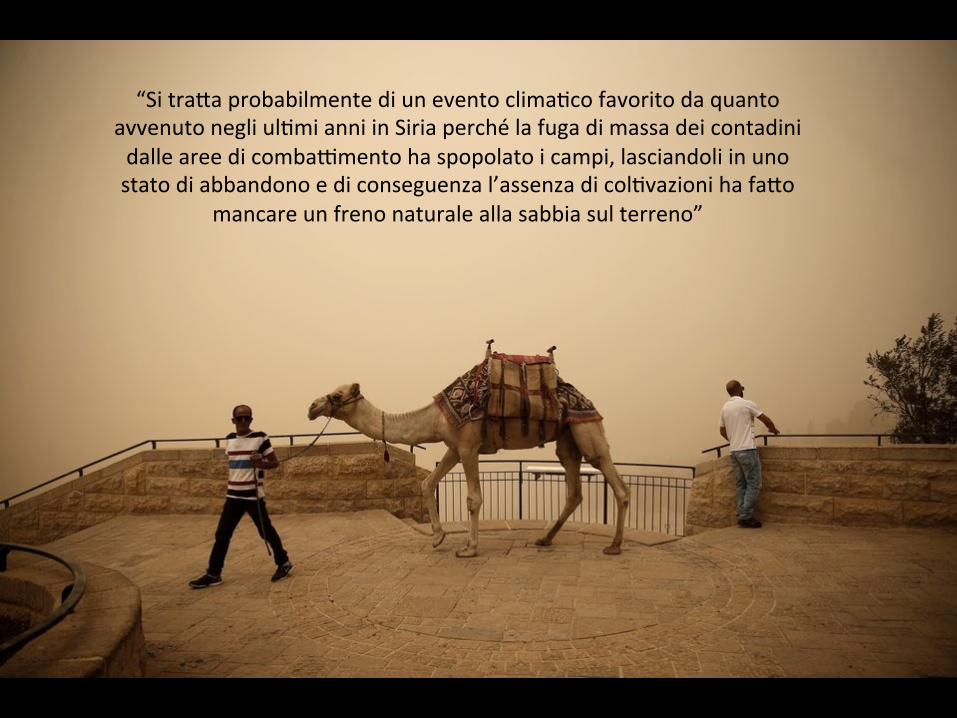
“Si tra9a probabilmente di un evento clima>co favorito da quanto avvenuto negli ul>mi anni in Siria perché la fuga di massa dei contadini dalle aree di combaNmento ha spopolato i campi, lasciandoli in uno stato di abbandono e di conseguenza l’assenza di col>vazioni ha fa9o
mancare un freno naturale alla sabbia sul terreno”
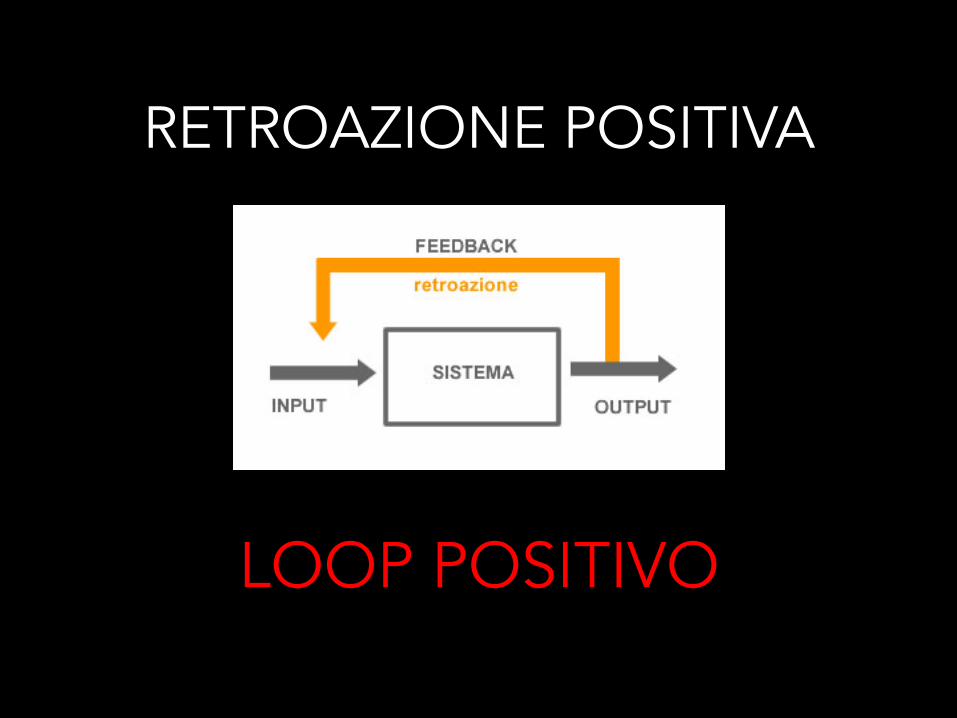
RETROAZIONE POSITIVA
LOOP POSITIVO
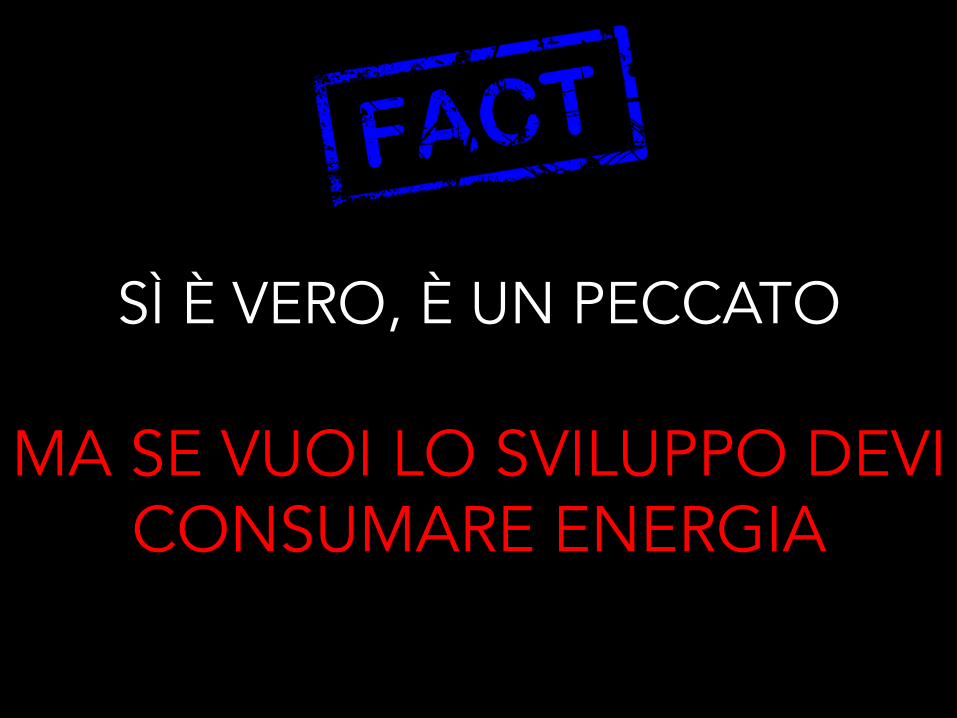
SÌ È VERO, È UN PECCATO
MA SE VUOI LO SVILUPPO DEVI CONSUMARE ENERGIA
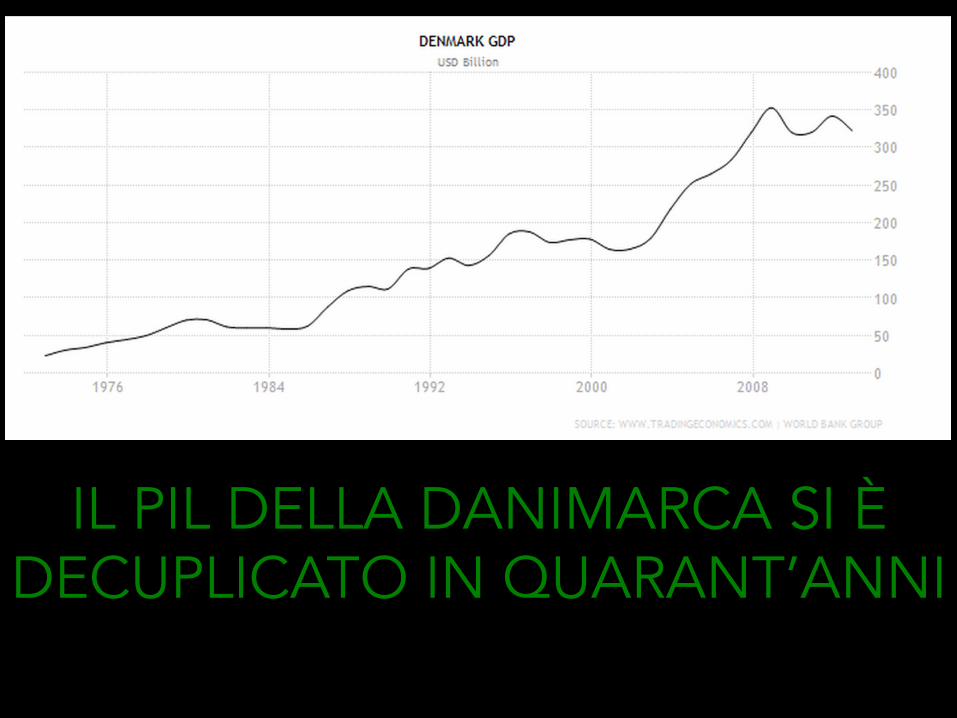
IL PIL DELLA DANIMARCA SI È DECUPLICATO IN QUARANT’ANNI
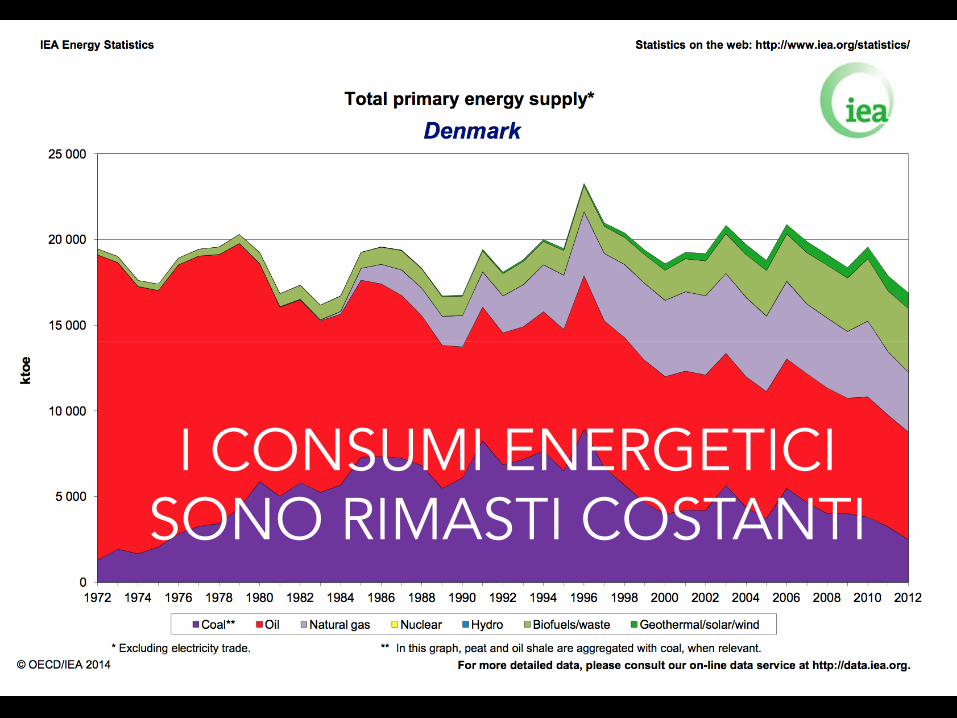
I CONSUMI ENERGETICI SONO RIMASTI COSTANTI
LA DANIMARCA…
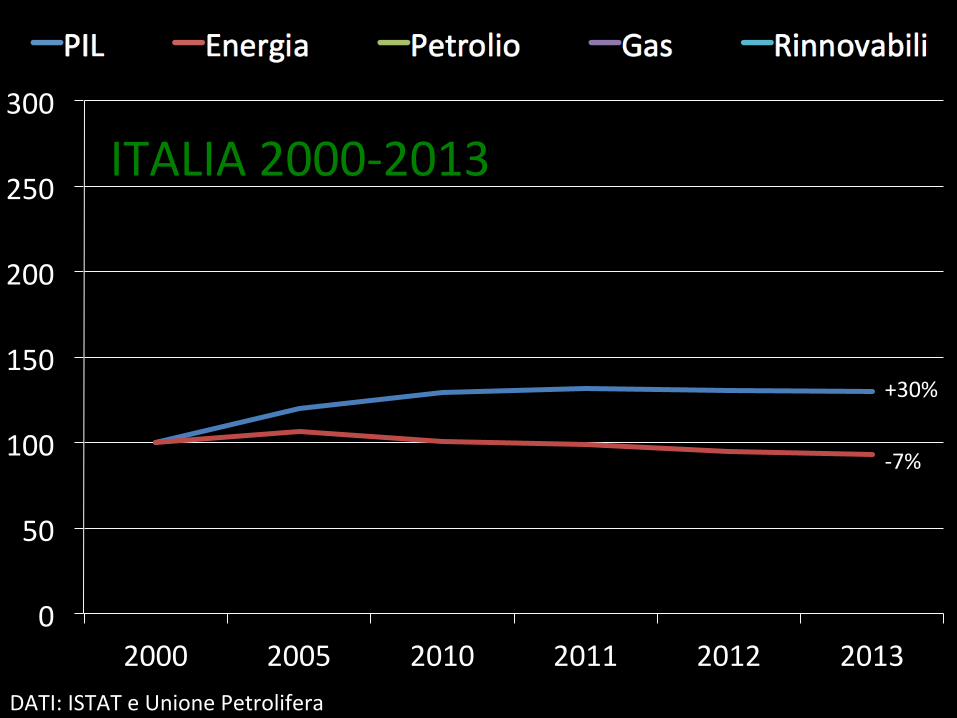
MA NOI SIAMO IN ITALIA!!!

0
50
100
150
200
250
300
2000 2005 2010 2011 2012 2013
ITALIA 2000-‐2013
DATI: ISTAT e Unione Petrolifera
+30%
0
50
100
150
200
250
300
2000 2005 2010 2011 2012 2013
ITALIA 2000-‐2013
DATI: ISTAT e Unione Petrolifera
+30%
-‐7%
0
50
100
150
200
250
300
2000 2005 2010 2011 2012 2013
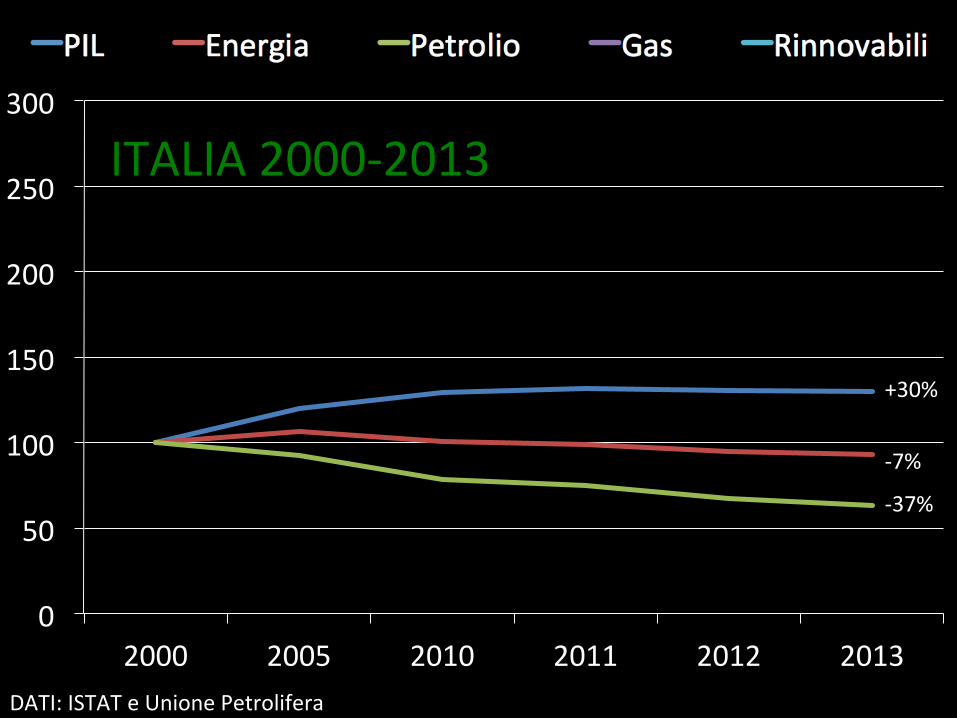
ITALIA 2000-‐2013
DATI: ISTAT e Unione Petrolifera
+30%
-‐7%
-‐37%
0
50
100
150
200
250
300
2000 2005 2010 2011 2012 2013
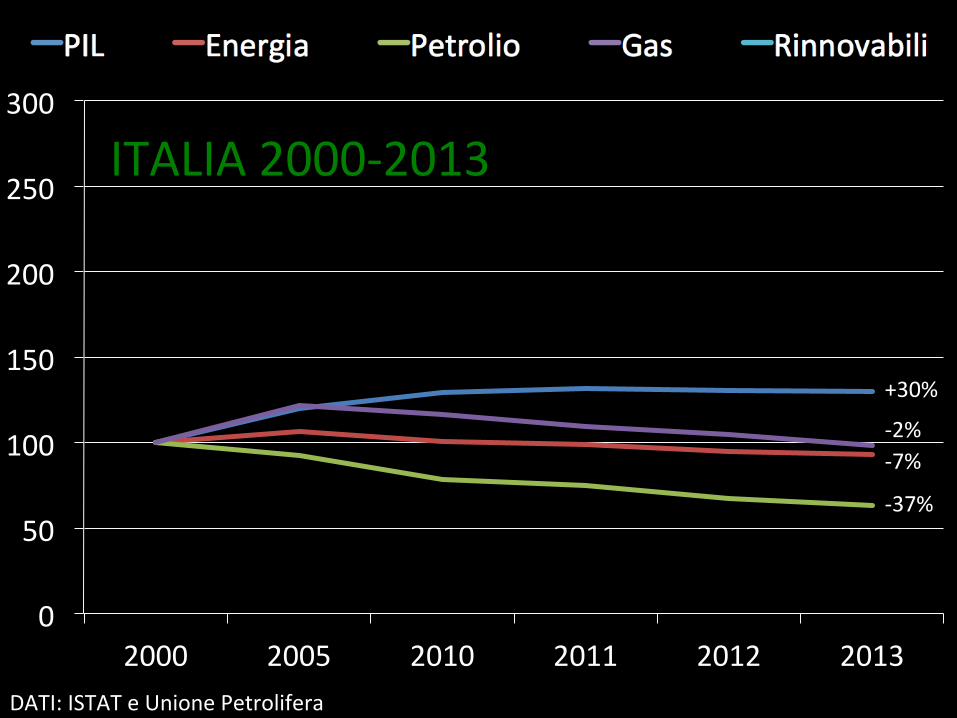
ITALIA 2000-‐2013
DATI: ISTAT e Unione Petrolifera
+30%
-‐7%
-‐37%
-‐2%
0
50
100
150
200
250
300
2000 2005 2010 2011 2012 2013
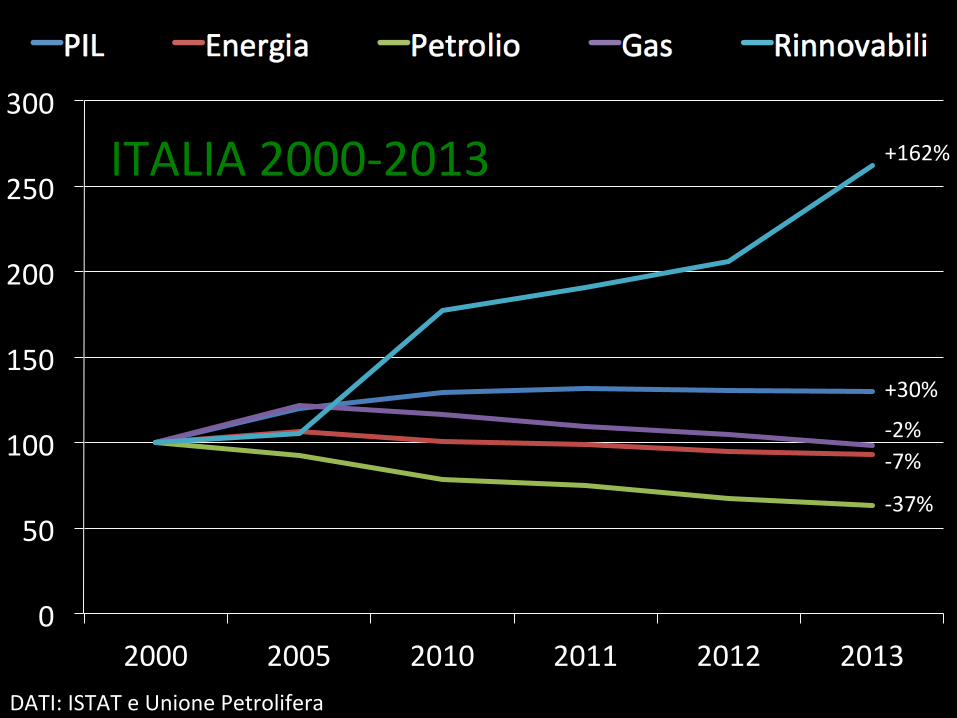
ITALIA 2000-‐2013
DATI: ISTAT e Unione Petrolifera
+30%
-‐7%
-‐37%
+162%
-‐2%

IN ITALIA I CONSUMI ENERGETICI CALANO A PIL COSTANTE I CONSUMI DI PETROLIO CALANO DRASTICAMENTE
LA PRODUZIONE DA RINNOVABILI CRESCE VERTIGINOSA
ENERGIA E PETROLIO IN ITALIA
DATABOOK2015
Produzione nazionale di idrocarburi71
1990 1995 2000 2005 2010 2011 2012 2013
Petroliogreggio(migliaiaditonn.) 4.641 5.208 4.555 6.084 5.081 5.286 5.377 5.483
Condensatidagas(migliaiaditonn.) 27 28 31 27 25 23 20 19
Gasnaturale(*)(milionidim3) 17.296 20.383 16.633 12.071 8.406 8.449 8.510 7.735
(*)Ivaloriesprimono:metricubifisicifinoal1990emetricubida38,1MJdal1995.Fonte: Ministero dello Sviluppo Economico
1990 1995 2000 2005 2010 2015 2020 20250
10
20
30Totale olio combustibile *
Olio combustibile per uso termoelettrico **
Gasolio auto
Gasolio riscaldamento
Benzina
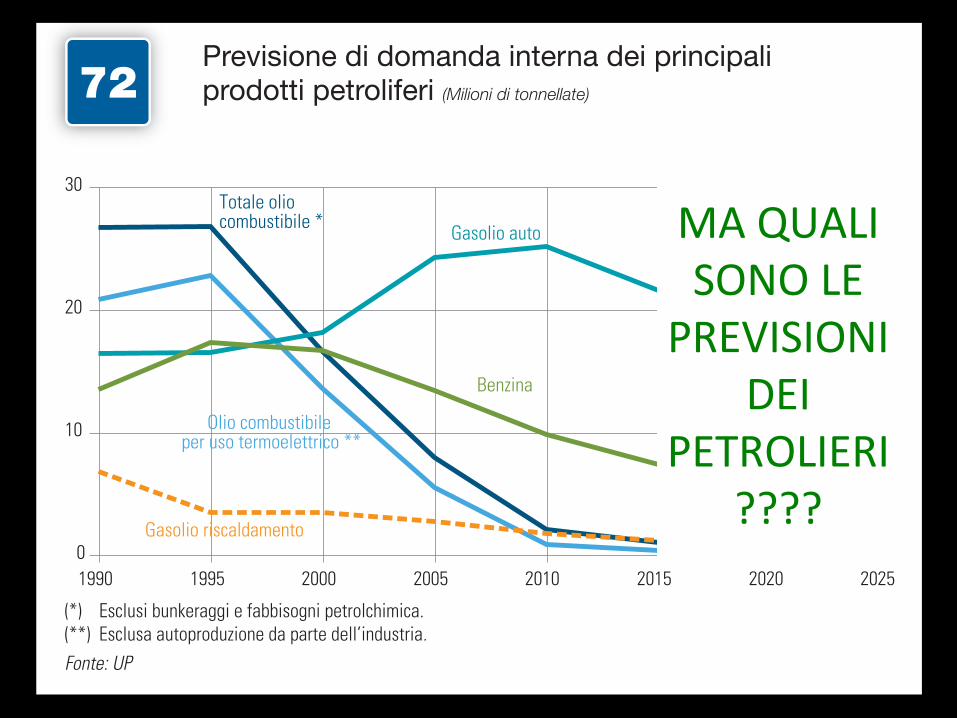
(*) Esclusibunkeraggiefabbisognipetrolchimica.(**) Esclusaautoproduzionedapartedell’industria.Fonte: UP
Previsione di domanda interna dei principali prodotti petroliferi (Milioni di tonnellate)72
MA QUALI SONO LE
PREVISIONI DEI
PETROLIERI????

ENERGIA E PETROLIO IN ITALIA
DATABOOK2015
Produzione nazionale di idrocarburi71
1990 1995 2000 2005 2010 2011 2012 2013
Petroliogreggio(migliaiaditonn.) 4.641 5.208 4.555 6.084 5.081 5.286 5.377 5.483
Condensatidagas(migliaiaditonn.) 27 28 31 27 25 23 20 19
Gasnaturale(*)(milionidim3) 17.296 20.383 16.633 12.071 8.406 8.449 8.510 7.735
(*)Ivaloriesprimono:metricubifisicifinoal1990emetricubida38,1MJdal1995.Fonte: Ministero dello Sviluppo Economico
1990 1995 2000 2005 2010 2015 2020 20250
10
20
30Totale olio combustibile *
Olio combustibile per uso termoelettrico **
Gasolio auto
Gasolio riscaldamento
Benzina
(*) Esclusibunkeraggiefabbisognipetrolchimica.(**) Esclusaautoproduzionedapartedell’industria.Fonte: UP
Previsione di domanda interna dei principali prodotti petroliferi (Milioni di tonnellate)72

BELLO, BELLO
MA LO SAPPIAMO TUTTI CHE LE RINNOVABILI NON
CONVENGONO
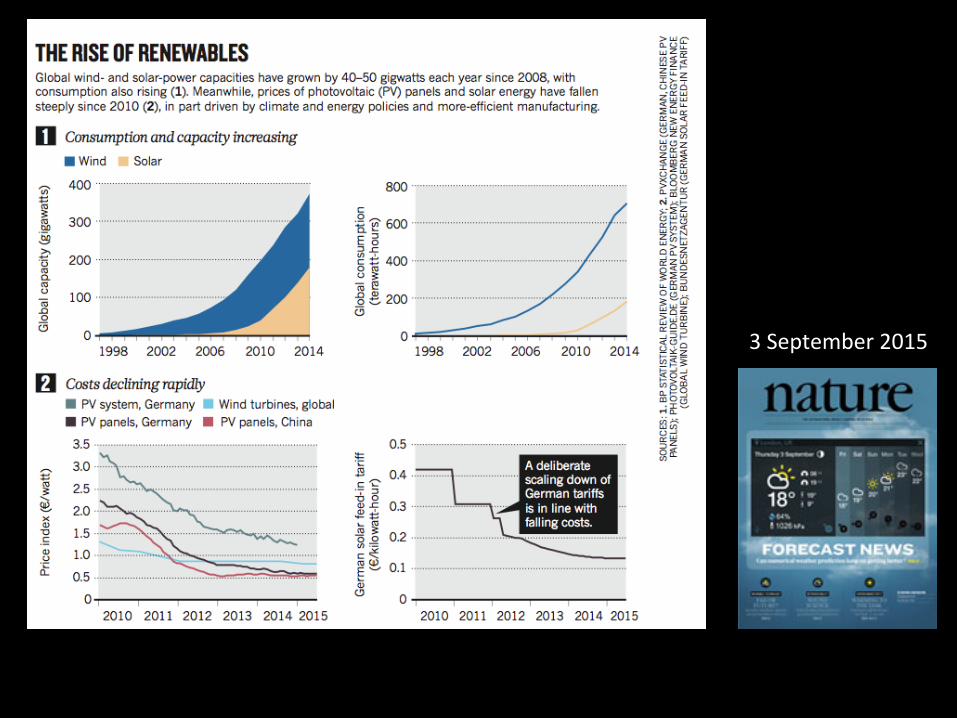
3 September 2015
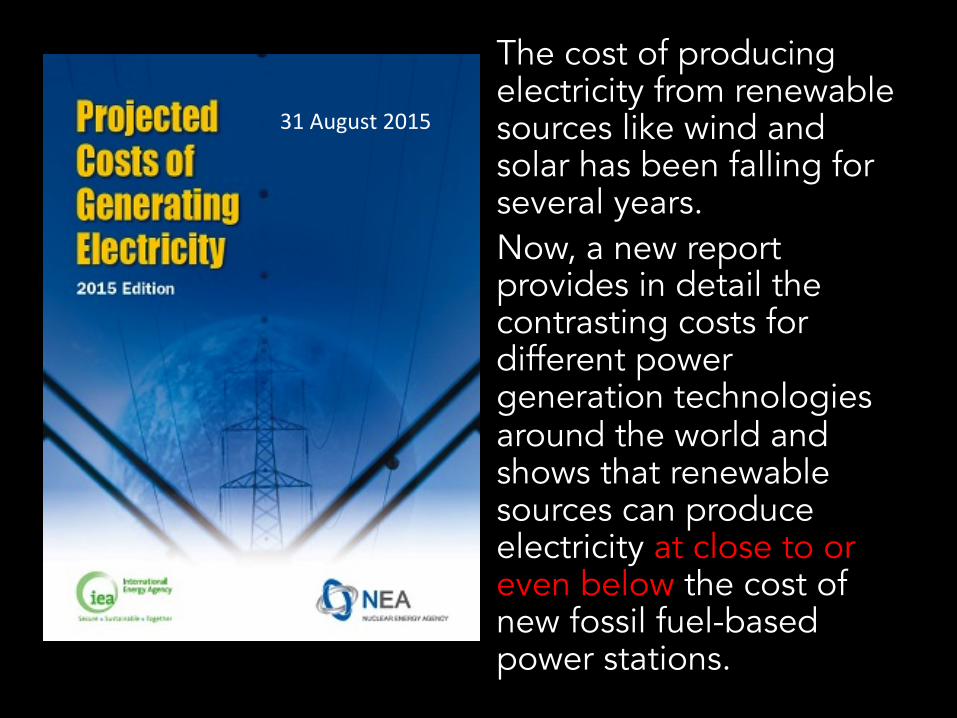
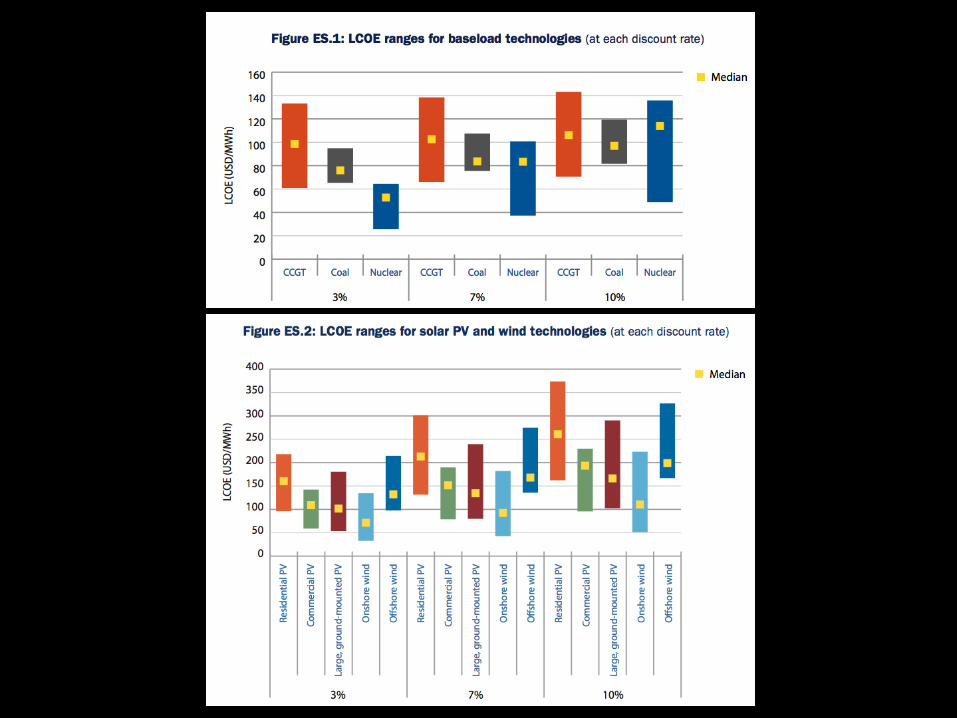
The cost of producing electricity from renewable sources like wind and solar has been falling for several years. Now, a new report provides in detail the contrasting costs for different power generation technologies around the world and shows that renewable sources can produce electricity at close to or even below the cost of new fossil fuel-based power stations.
31 August 2015

SONO QUASI CONVINTO
PERÒ LE RINNOVABILI PESANO SOLO PER LO ZERO VIRGOLA

Nel 2014 in Italia le rinnovabili hanno prodotto
Il 38% dell’elettricità
complessivamente prodotta
Il 33% dell’elettricità complessivamente consumata
Il 21% dell’energia
complessivamente consumata
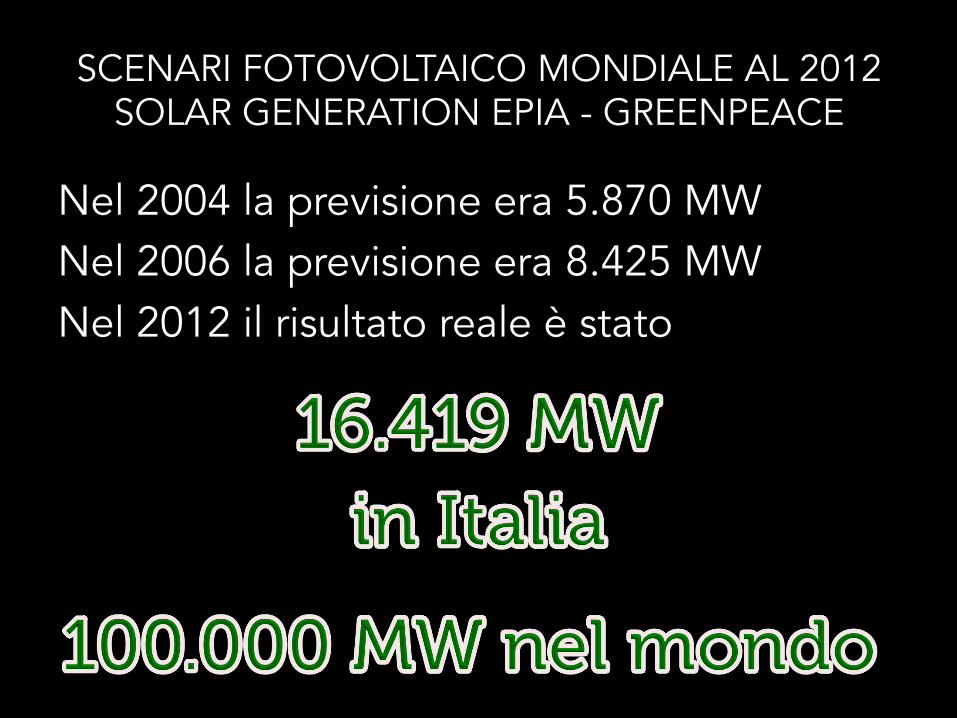
SCENARI FOTOVOLTAICO MONDIALE AL 2012 SOLAR GENERATION EPIA - GREENPEACE
Nel 2004 la previsione era 5.870 MW Nel 2006 la previsione era 8.425 MW Nel 2012 il risultato reale è stato
NOI FACCIAMO SEMPRE LA NOSTRA PARTE
MA SE POI GLI USA NON FANNO NIENTE…

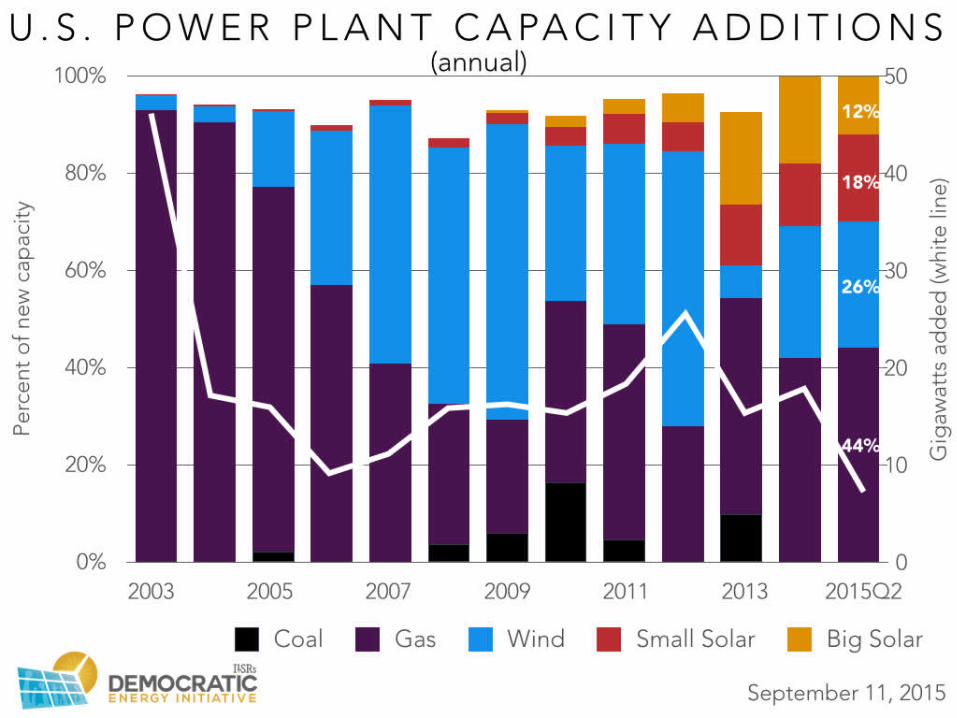
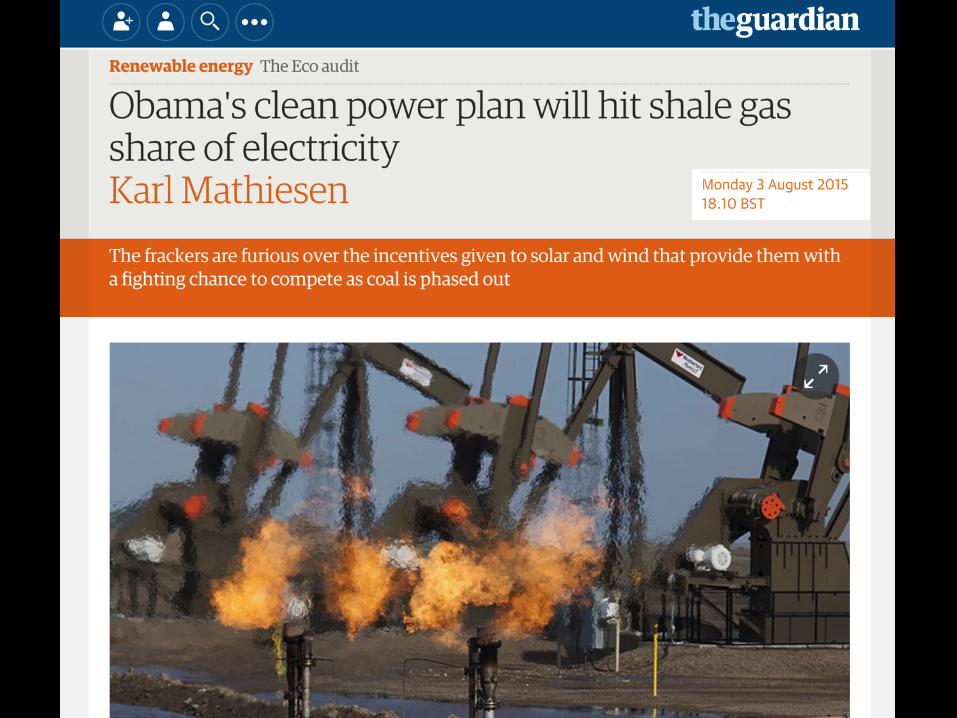
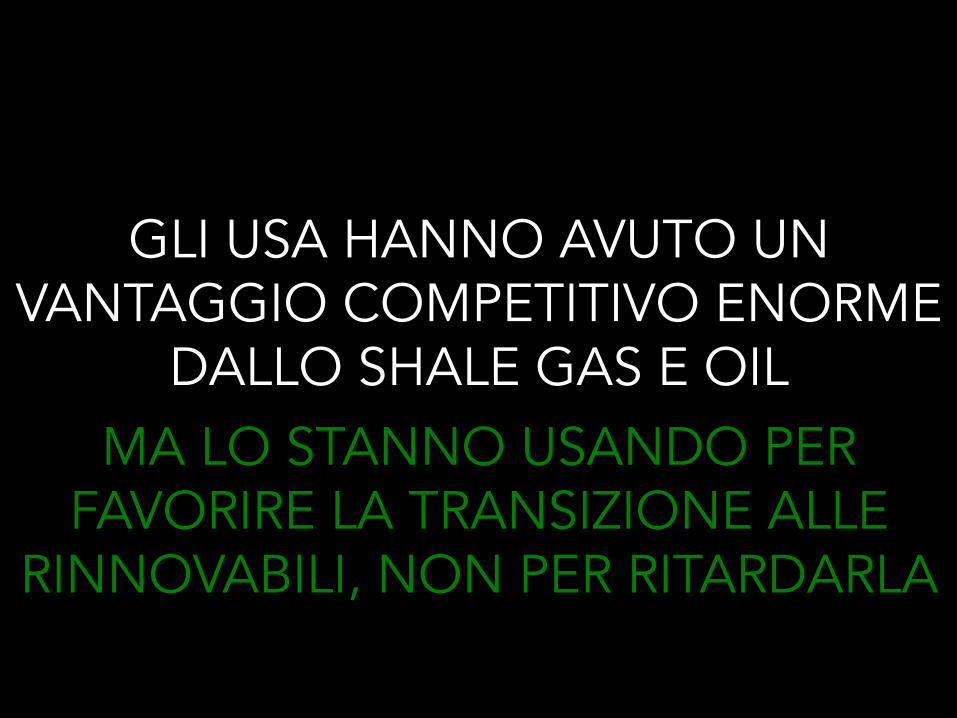
GLI USA HANNO AVUTO UN VANTAGGIO COMPETITIVO ENORME
DALLO SHALE GAS E OIL MA LO STANNO USANDO PER
FAVORIRE LA TRANSIZIONE ALLE RINNOVABILI, NON PER RITARDARLA
NOI FACCIAMO SEMPRE LA NOSTRA PARTE
E LA CINA?!
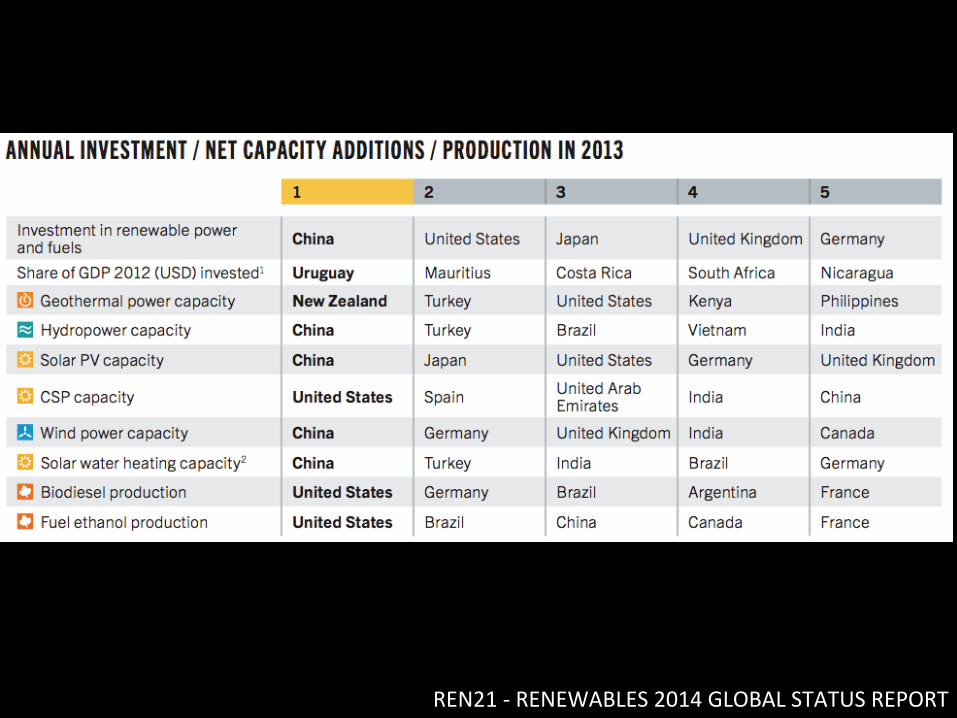
REN21 -‐ RENEWABLES 2014 GLOBAL STATUS REPORT

REN21 -‐ RENEWABLES 2014 GLOBAL STATUS REPORT
PRIMA IL LAVORO!
SE CHIUDIAMO LE CENTRALI POI COSA FACCIAMO?
63
02
R E N E W A B L E S 2 0 1 4 G L O B A L S T A T U S R E P O R T
World China Brazil United States India Bangla-
deshEuropean Unionm
Germany Spain Rest of EUThousand Jobs
Biomassa,b 782 240 152h 58 52 44 210
Biofuels 1,453 24 820f 236i 35 26 3 82
Biogas 264 90 85 9.2 49 0.5 19
Geothermala 184 35 17 1.4 82
Hydropower (Small)c
156 12 8 12 4.7 13 1.5 18
Solar PV 2,273 1,580e 112 100k 56 11 153
CSP 43 143 j 1 28 0
Solar Heating / Cooling
503 350 30g 41 11 1 31
Wind Power 834 356 32 51 48 0.1 138 24 166
Total 6,492d 2,640 894 625 391 114 371l 114 760
TABLE 1. ESTIMATED DIRECT AND INDIRECT JOBS IN RENEWABLE ENERGY WORLDWIDE, BY INDUSTRY
Data source: IRENAa - Power and heat applications. b - Traditional biomass is not included. c - Employment information for large-scale hydropower is incomplete, and therefore focuses on small hydro. Although 10 MW is often used as a threshold, definitions are inconsistent across countries. d - The total for “World” is calculated by adding the individual totals of the technologies. e - Previous estimates were substantially lower (in the 300,000–500,000 range), but installation jobs have expanded massively. f - About 331,000 jobs in sugar cane and 208,000 in ethanol processing in 2012; also includes 200,000 indirect jobs in equipment manufacturing, and 81,800 jobs in biodiesel. g - Equipment manufacturing; installation jobs not included. h - Biomass power direct jobs run only to 15,500. i - Includes 173,667 jobs for ethanol and 62,200 jobs for biodiesel in 2013. j - All solar technologies combined, with solar PV estimated at close to 100,000 jobs. k - Direct jobs only. l - Data for 2013. Includes 8,000 jobs in publicly funded R&D and administration; not broken down by technology. m - All data are from 2012, except for Germany. The “World” total and the “Rest of EU” total are calculated using the EU country data for 2012 (even if 2013 data for a specific country are available, e.g., Germany).Note: Data are principally for 2012–2013, with dates varying by country and technology. Some of the data for India and China are older. Totals may not add up due to rounding.
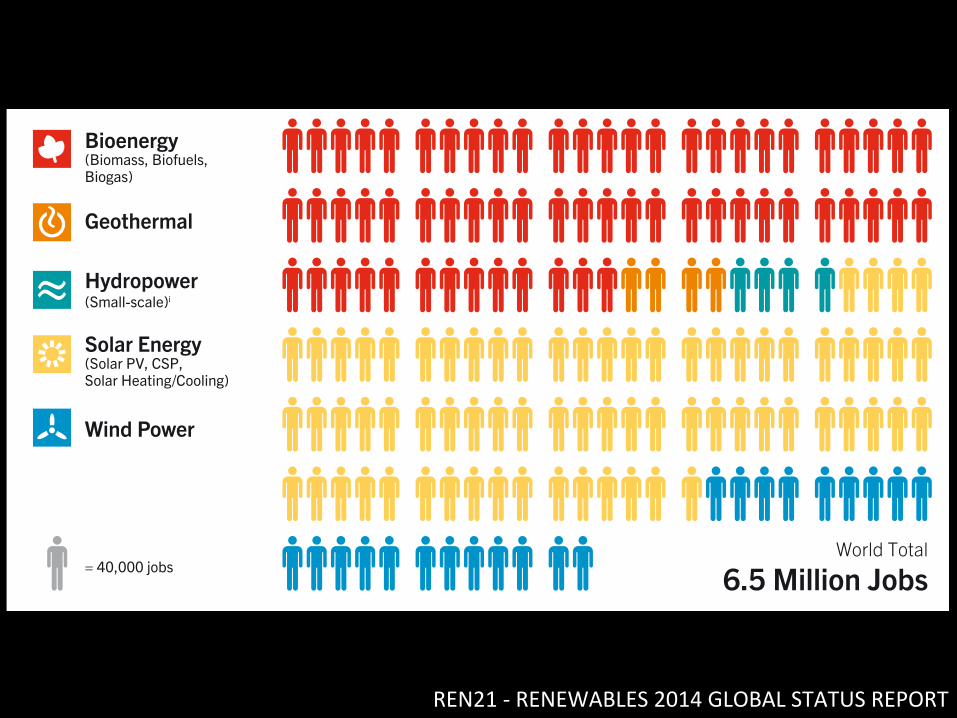
Figure 22. Jobs in Renewable Energy
Bioenergy (Biomass, Biofuels, Biogas)
Geothermal
Hydropower (Small-scale)i
Solar Energy(Solar PV, CSP, Solar Heating/Cooling)
Wind Power
= 40,000 jobs
i - Employment information for large-scale hydropower is incomplete and not included
World Total
6.5 Million Jobsi - Employment information for large-scale hydropower is incomplete and not included.
Figure 22. Jobs in Renewable Energy
JOBS IN RENEWABLE ENERGY
REN21 -‐ RENEWABLES 2014 GLOBAL STATUS REPORT


MA NON STARETE MICA PER CASO DICENDO
CHE DAVVERO
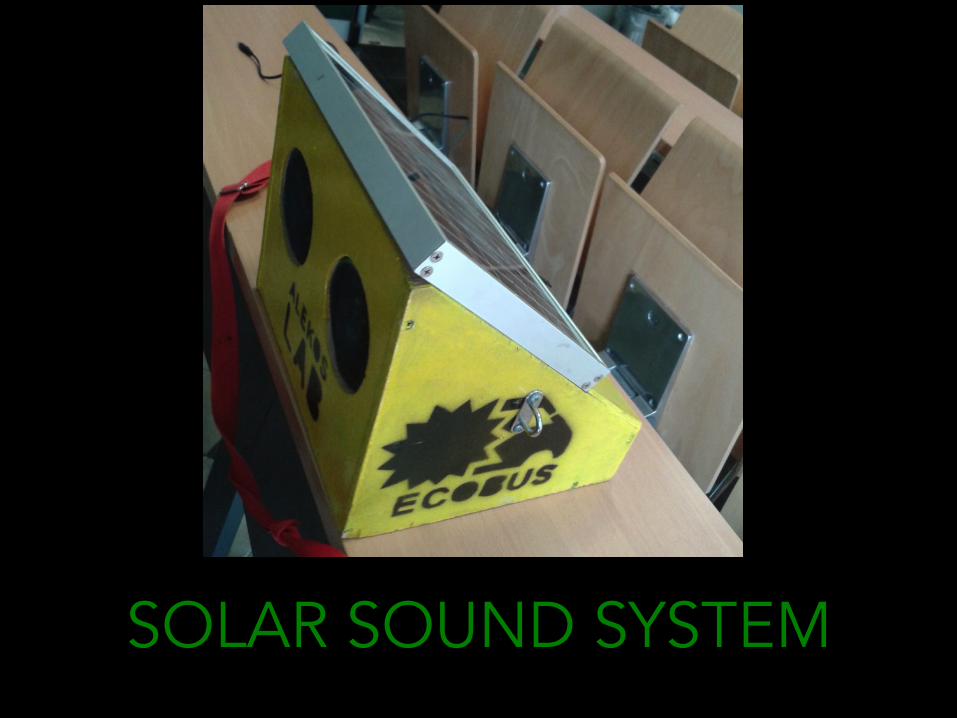
SOLAR SOUND SYSTEM

DAL PICCOLO AL GRANDE
DA UN GIOCO AL PIÙ GRANDE PAESE
EUROPEO
!"#$%&'()*+$",-."
!#,$%#/'"&"#(/ 0"$%&0 .)0%/
2)&$1+:"($I+0327+/+0'21(%*3".'+$70+I04%';+'K" "#!
!(+$+)* %I)&3 <"6"*)$ ')'9+'+$78 &2+ 3+E7E"$%% /%3+$0%42*)$ 1(+/01%4 0':&23$84
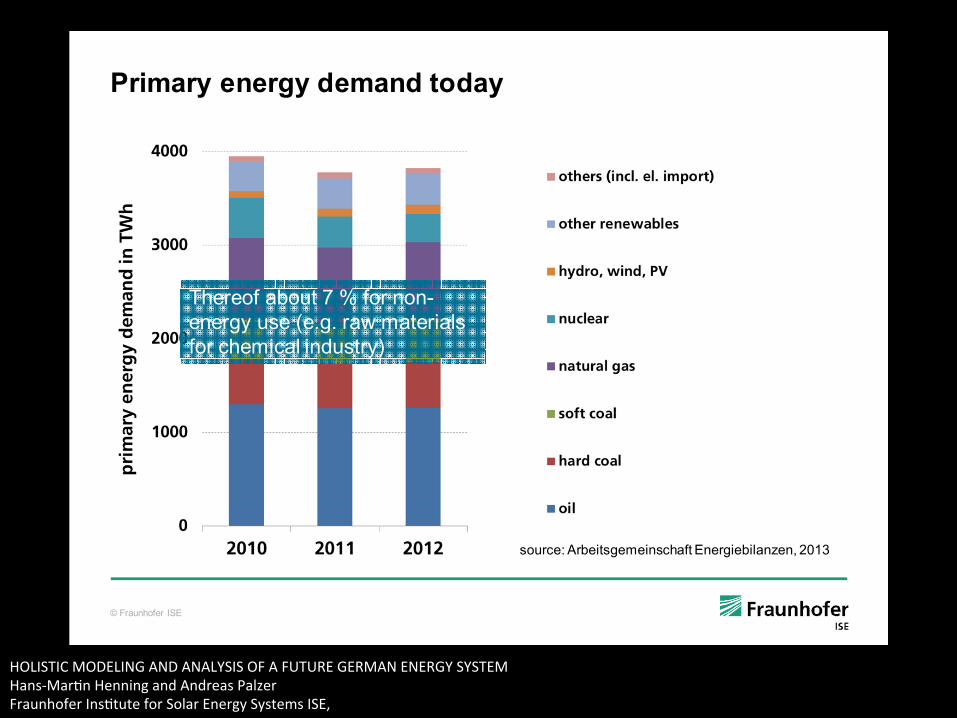
HOLISTIC MODELING AND ANALYSIS OF A FUTURE GERMAN ENERGY SYSTEM Hans-‐Mar>n Henning and Andreas Palzer Fraunhofer Ins>tute for Solar Energy Systems ISE,

!"#$%&'()*+$",-."
!&.,$,/%.,)&')3'.!"'!"#$%&'3*.*#"'"&"#(/'+/+."$'%%+"0')&'!)*#5/'$)0"5,&(
!67)0"$*+'+%%I4+.'+$78 O):+4"KQ+&321(4%':"
.4+13$01038 7+'+$%30)'K"23)$%7+ %': +':9&2+
#&+42 30'14&:0'7I0)/%22 %':(8:$)7+'"%':
/+3(%'+ *$)/ *.4
O)I04038"3+4+13$01K"R K"*&+424
,':&23$8D$)1+22+2
R+%3 3I&04:0'72K"0'14&:0'7 23)$%7+%': (+%30'7 '+3%)$/24
HOLISTIC MODELING AND ANALYSIS OF A FUTURE GERMAN ENERGY SYSTEM Hans-‐Mar>n Henning and Andreas Palzer Fraunhofer Ins>tute for Solar Energy Systems ISE,

!"#$%&'()*+$",-."
!&.,$,/%.,)& )3 .!" !"#$%&'3*.*#" "&"#(/ +/+."$ %%+"0)&'!)*#5/ $)0"5,&(
!67)0"$*+'+%%I4+.'+$78 O):+4"KQ+&321(4%':"
HOLISTIC MODELING AND ANALYSIS OF A FUTURE GERMAN ENERGY SYSTEM Hans-‐Mar>n Henning and Andreas Palzer Fraunhofer Ins>tute for Solar Energy Systems ISE,
!"#$%&'()*+$",-."
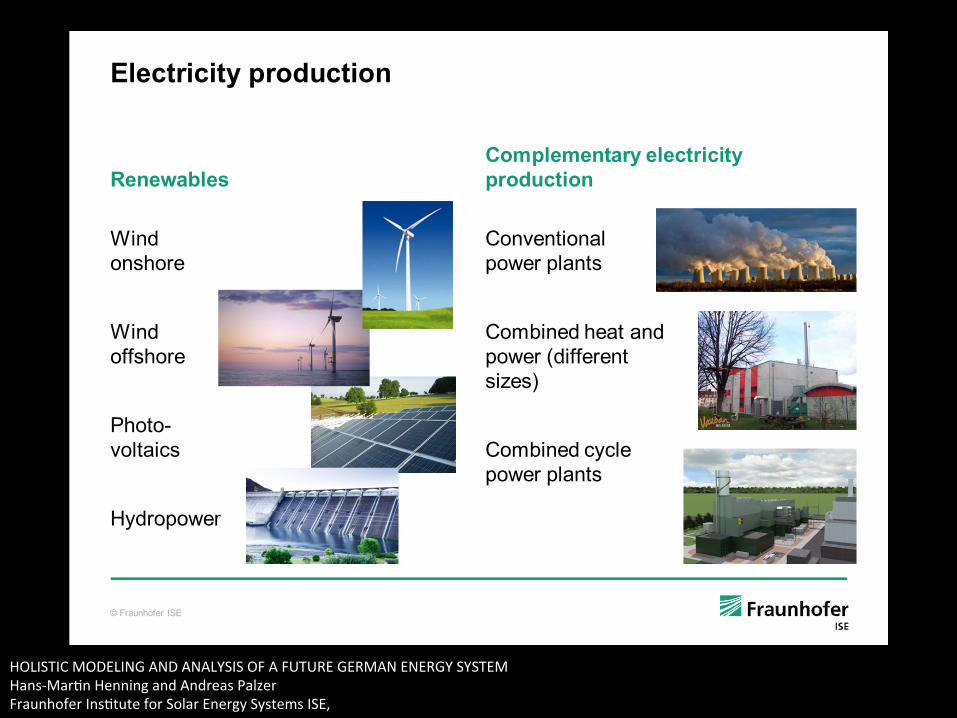
65":.#,:,./ &#)0*:.,)&
!"&";%%5"+
"0':")'2()$+
"0':")**2()$+
S()3)9+)43%012
R8:$)D)%+$
!)$&5"$"&.%#/ "5":.#,:,./&#)0*:.,)&
-)'++'30)'%4D)%+$"D4%'32
-)/I0'+: (+%3 %':D)%+$"3:0**+$+'3"20;+24
-)/I0'+: 1814+D)%+$"D4%'32
HOLISTIC MODELING AND ANALYSIS OF A FUTURE GERMAN ENERGY SYSTEM Hans-‐Mar>n Henning and Andreas Palzer Fraunhofer Ins>tute for Solar Energy Systems ISE,
!"#$%&'()*+$",-."
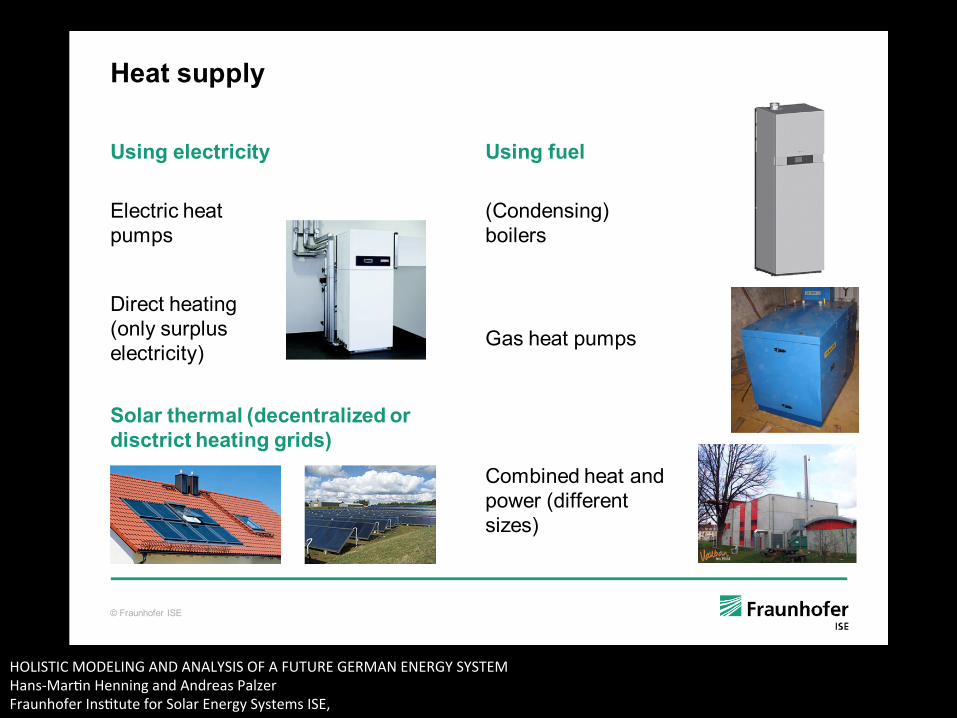
<"%. +*&&5/
2+,&( "5":.#,:,./
.4+13$01 (+%3D&/D2
Q0$+13 (+%30'73)'48 2&$D4&2+4+13$010384
2+,&( 3*"5
3-)':+'20'74"I)04+$2
&%2"(+%3 D&/D2
-)/I0'+: (+%3 %':D)%+$"3:0**+$+'3"20;+24
>)5%#'.!"#$%5'?0":"&.#%5,/"0 )#0,+:.#,:. !"%.,&( (#,0+@
HOLISTIC MODELING AND ANALYSIS OF A FUTURE GERMAN ENERGY SYSTEM Hans-‐Mar>n Henning and Andreas Palzer Fraunhofer Ins>tute for Solar Energy Systems ISE,
!"#$%&'()*+$",-."
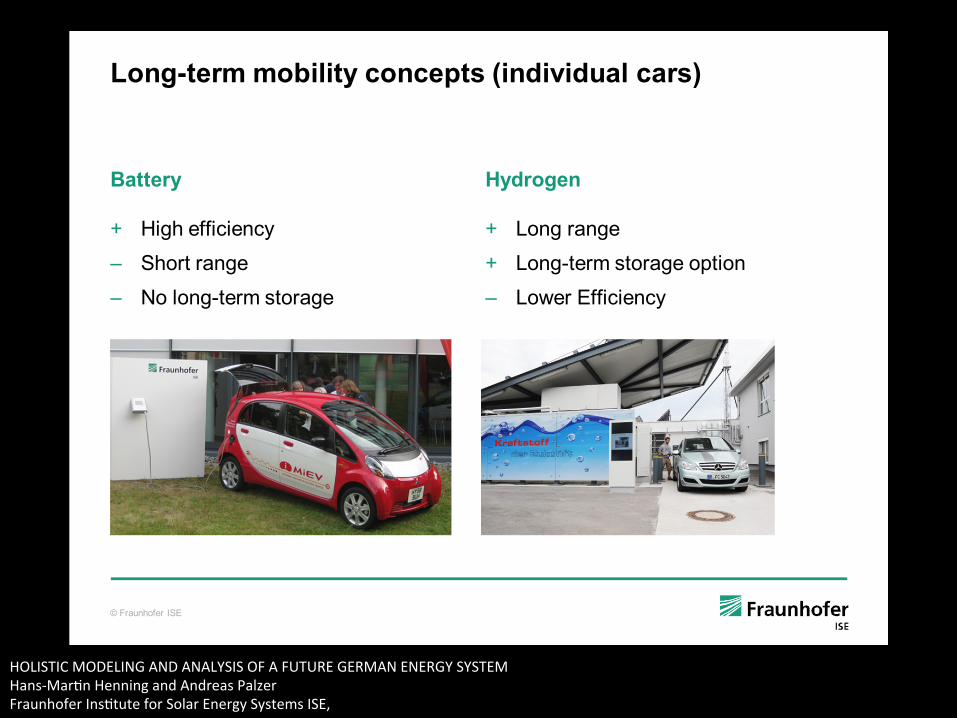
!)&("."#$'$)%,5,./ :)&:"&.+ ?,&0,A,0*%5':%#+@
!%.."#/
L R07("+**010+'18K -()$3"$%'7+K ,) 4)'793+$/"23)$%7+
</0#)("&
L !)'7"$%'7+L !)'793+$/"23)$%7+ )D30)'K !)%+$ .**010+'18
HOLISTIC MODELING AND ANALYSIS OF A FUTURE GERMAN ENERGY SYSTEM Hans-‐Mar>n Henning and Andreas Palzer Fraunhofer Ins>tute for Solar Energy Systems ISE,
!"#$%&'()*+$",-."
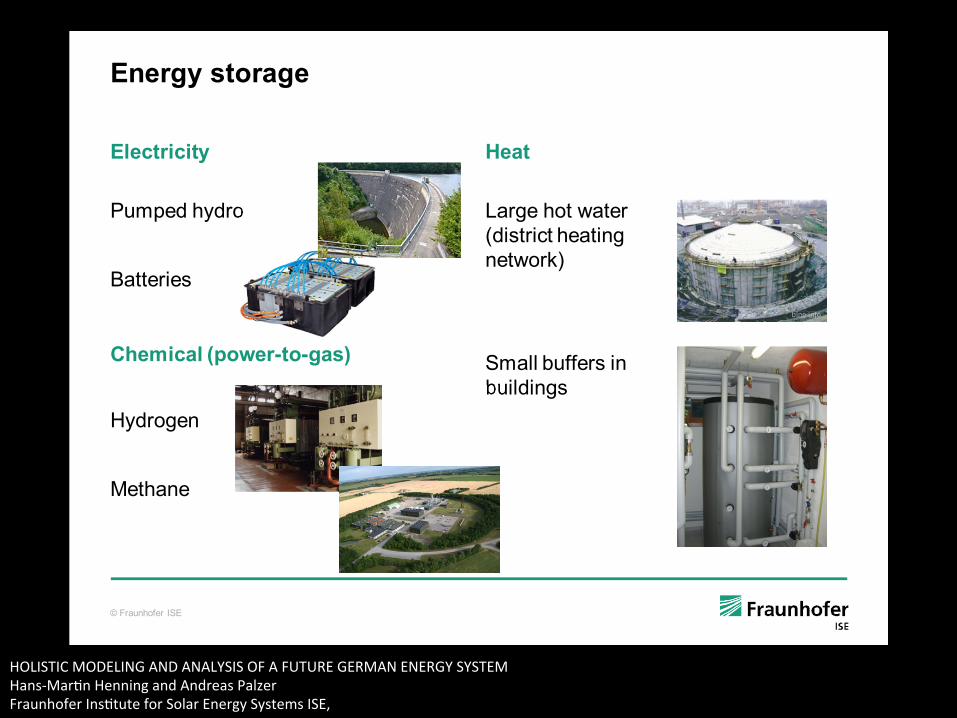
6&"#(/ +.)#%("
65":.#,:,./
S&/D+: (8:$)
F%33+$0+2
<"%.
!%$7+"()3 %%3+$3:023$013 (+%30'7'+3%)$/4
-/%44"I&**+$2 0'"I&04:0'72
!!"$,:%5'?&);"#".)"(%+@
R8:$)7+'
O+3(%'+
HOLISTIC MODELING AND ANALYSIS OF A FUTURE GERMAN ENERGY SYSTEM Hans-‐Mar>n Henning and Andreas Palzer Fraunhofer Ins>tute for Solar Energy Systems ISE,

!"#$%&'()*+$",-."
>.#)$""#/"*(*&(
S()3)+)43%012! #$<"&"+4
O+:0&/"%': 4%$7+"20;+ -RS"31)''+13+: 3) :023$013 (+%30'74
! 8""&"+4
9'2()$+" 0':
! # ""&"+4
9**2()$+"" 0':! ! "&"+4
HOLISTIC MODELING AND ANALYSIS OF A FUTURE GERMAN ENERGY SYSTEM Hans-‐Mar>n Henning and Andreas Palzer Fraunhofer Ins>tute for Solar Energy Systems ISE,
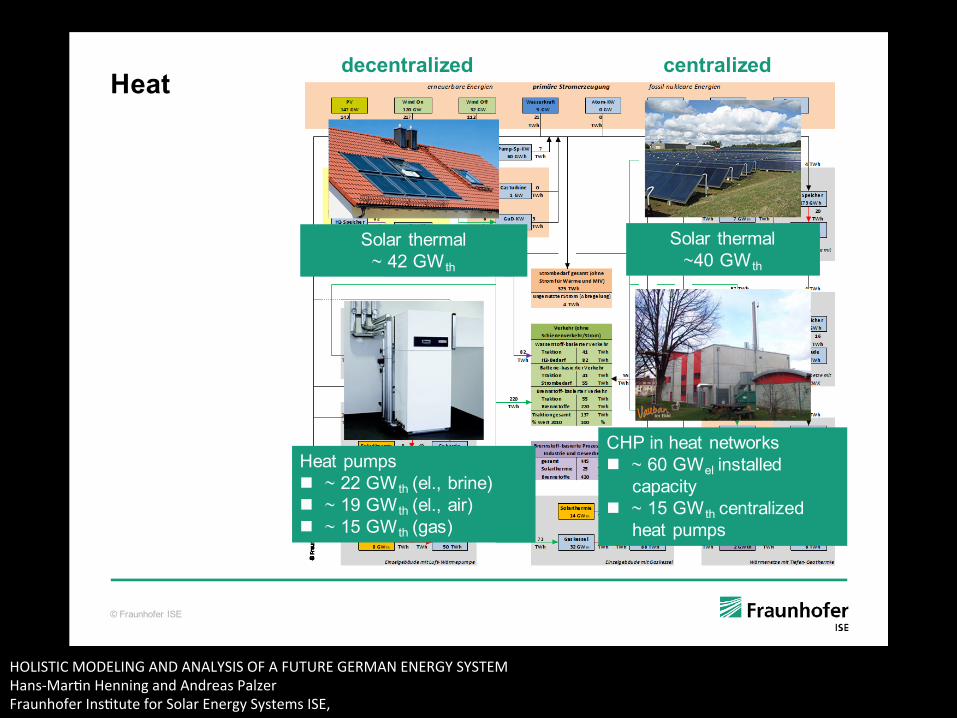
!"#$%&'()*+$",-."
<"%.
-)4%$" 3(+$/%4! $ "&" 3(
R+%3 D&/D2! ! "&" 3( 3+4EK"I$0'+4! ! #7"&" 3( 3+4EK"%0$4! ! #)"&" 3( 37%24
-)4%$" 3(+$/%4"!$""&" 3(
-RS"0'"(+%3 '+3%)$/2! ! 8""&"+4 0'23%44+:
1%D%1038! ! #)"&" 3( 1+'3$%40;+:
(+%3 D&/D2
0":"&.#%5,/"0 :"&.#%5,/"0
HOLISTIC MODELING AND ANALYSIS OF A FUTURE GERMAN ENERGY SYSTEM Hans-‐Mar>n Henning and Andreas Palzer Fraunhofer Ins>tute for Solar Energy Systems ISE,

!"#$%&'()*+$",-."
>.)#%("
!%.."#/ +.)#%(" ?('1"!@,&/I+$ (DD$E5"O0) E'032!)3%4 1%D%1038 $ &"(.1&E"*&44 1814+2 #8< 9
65":.#)5/+"#+!)3%4"1%D%1038 !! &"+4#&44 4)%: ()&$2 $5) (9'48 '++:+: *)$ /)I04038 3')3"*)$+4+13$01038 %': (+%3 2+13)$4
$":"&.#%5,/"0 !"%. +.)#%(" ?#EE'!,."#@,&/I+$ (DD$E<"O0) E'032!)3%4"1%D%1038 !#7 &"(.1&E"*&44 1814+2 #!5 9
!"&.#%5,/"0 !"%. +.)#%(" ?FE5EEE'$7@,&/I+$ (DD$E#)" E'032!)3%4"1%D%1038 !$8 &"(.1&E"*&44 1814+2 #"$ 9
!*$&"0 +.)#%(" &);"#'&5%&.+,&/I+$ $ E'032!)3%4"1%D%1038 8" &"(.1&E"*&44 1814+2 ##< 9
HOLISTIC MODELING AND ANALYSIS OF A FUTURE GERMAN ENERGY SYSTEM Hans-‐Mar>n Henning and Andreas Palzer Fraunhofer Ins>tute for Solar Energy Systems ISE,

!"#$%&'()*+$",-."
!"6&"%$&$", "1 &4$6.40 +,+4-0 $,(%+#+'&+* =>?>(%0%&+6! /$7;%$:"+'+$8: @+;%'@ %=)&6 (%9*")* 6)@%:! *."*$%?67)' )* >$7;%$: +'+$8: @+;%'@ %=)&6 8""6! *+@&?67)' )* +'+$8:4$+9%6+@ -9 "+;7337)'3 =: 5#"6
HOLISTIC MODELING AND ANALYSIS OF A FUTURE GERMAN ENERGY SYSTEM Hans-‐Mar>n Henning and Andreas Palzer Fraunhofer Ins>tute for Solar Energy Systems ISE,
!"#$%&'()*+$",-."
-"#$%&'$"&%(#%5(%*#$+ ,-$. /0%& 1"(%1..5(6 &5*5
#&+/"0$12+ 1'2$+%3+ "6"!2&6&/%71++/9 %+)1:+: *&+/ 2)37!6;8(%1..5(6
""6"! ))6(%1..5(6
# 6"! #(6(%1..5(6
2&6&/%71++ 1'++376+'73 ;+6(%1..5(6
=%%-'&&10"%" *&+/ 2)37 7):%9
)"O=@!(" 2&$7%1/6+'7 )*
*/&27&%71'A*."#""6")* +'+$A9
HOLISTIC MODELING AND ANALYSIS OF A FUTURE GERMAN ENERGY SYSTEM Hans-‐Mar>n Henning and Andreas Palzer Fraunhofer Ins>tute for Solar Energy Systems ISE,
!"#$%&'()*+$",-."
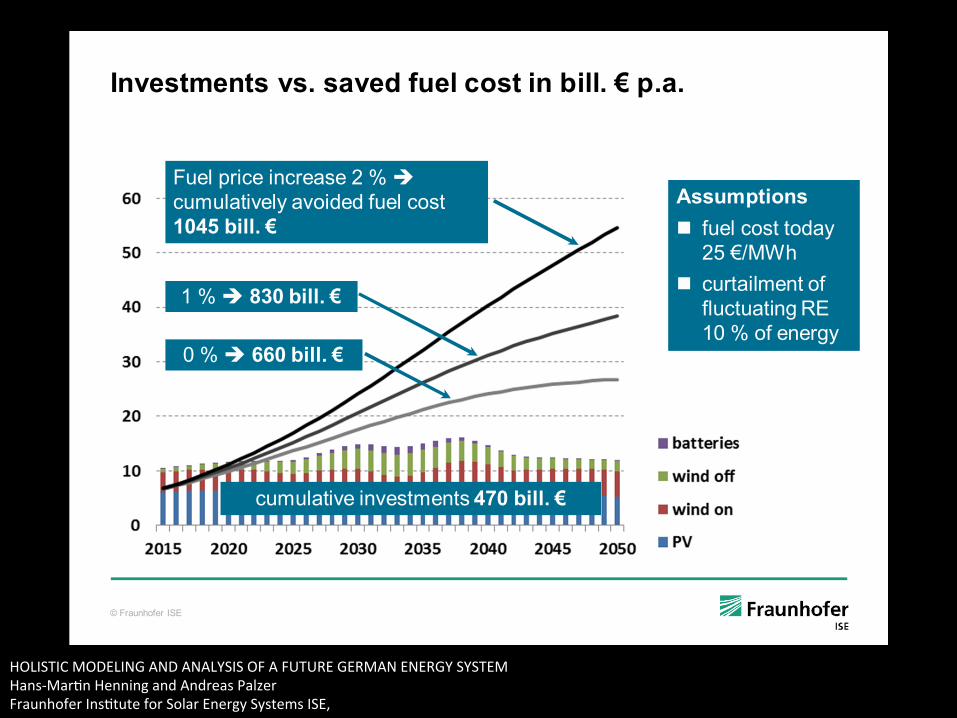
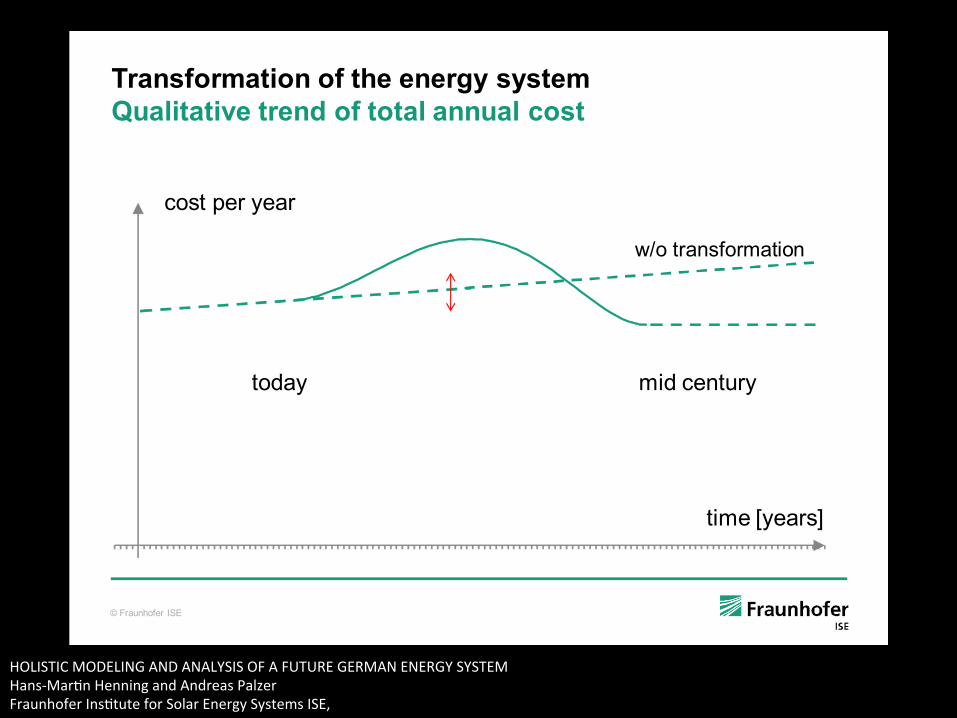
,#%&+3)#$%.,)&')3'.!"'"&"#(/'+/+."$=*%5,.%.,A"'.#"&0')3'.).%5'%&&*%5':)+.
1)23"D+$"8+%$
3):%8"""""""""""""""""""""""""""""""""""""""""""""""""""""/0:"1+'3&$8"
30/+"P8+%$2Q
%=)"3$%'2*)$/%30)'
HOLISTIC MODELING AND ANALYSIS OF A FUTURE GERMAN ENERGY SYSTEM Hans-‐Mar>n Henning and Andreas Palzer Fraunhofer Ins>tute for Solar Energy Systems ISE,

MA QUALE MODELLO ECONOMICO VIENE
SUGGERITO?
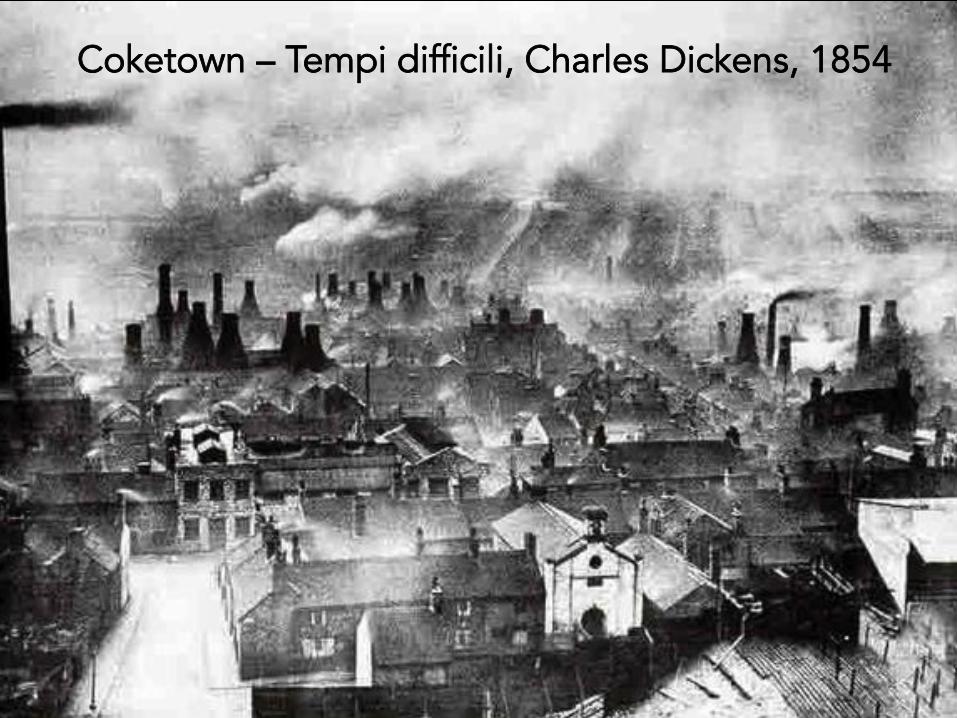
Coketown – Tempi difficili, Charles Dickens, 1854

Motown – Berry Gordy, 1959
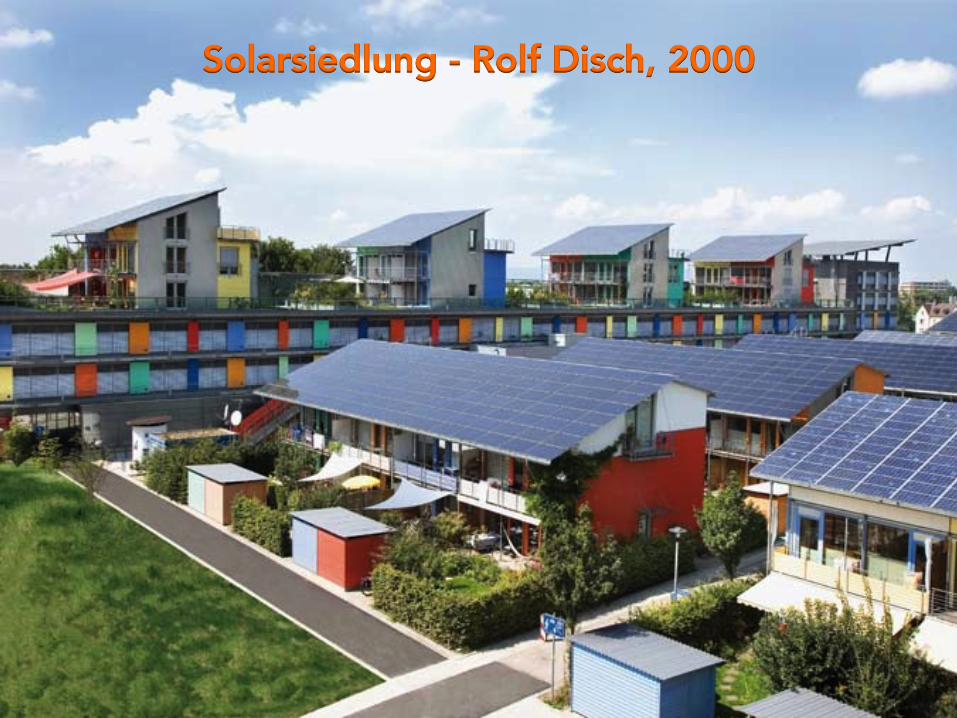
Solarsiedlung - Rolf Disch, 2000