Richieste Finanziarie€¦ · V. Manzari Riunione Referee INFN – Roma, 26 Maggio 2016 3 M&O Cat....
16
Richieste Finanziarie Integra)ve 2016 Generali Preliminari 2017 Riunione Referee INFN – Roma, 26 Maggio 2016
Transcript of Richieste Finanziarie€¦ · V. Manzari Riunione Referee INFN – Roma, 26 Maggio 2016 3 M&O Cat....

RichiesteFinanziarieIntegra)ve2016
GeneraliPreliminari2017
RiunioneRefereeINFN–Roma,26Maggio2016

2 V. Manzari Riunione Referee INFN – Roma, 26 Maggio 2016
M&O Cat. A - Contributi 2002-2015 M&O Cat. A contributions 2002-2015 as of 31/12/2015 in CHF
ALICE | RRB | 27 April 2016 | AT
Outstanding contributions:• Greece• Romania ISS• Armenia• Brazil• China Beijing• Mexico• Ukraine
2016 advanced payments:• Denmark• France CEA• Germany BMBF• Spain• Japan• USA DOE• USA NSF
MS: 99% receivedNMS: 98% receivedTotal: 99% received
5
2015 2002-2015 2002-2015 2016
Country Invoiced Received In-kind Due Invoiced Received In-kindEnergy rebate Due
advanced payments
CERN 410'234 410'234 4'914'971 4'914'971Czech Republic 91'163 91'163 980'101 980'101Denmark 60'775 60'775 537'397 537'397 60'541Finland 45'582 45'582 478'064 478'064France CEA 53'178 53'178 561'612 561'612 52'973France IN2P3 349'458 349'458 4'114'331 4'114'331Germany BMBF 288'683 288'683 3'037'269 3'037'269 499'985Germany GSI 151'938 151'938 1'791'248 1'791'248Greece 22'791 22'791 324'975 279'441 45'534Hungary 37'985 37'985 300'480 300'480Italy Centro Fermi 45'582 45'582 263'060 263'060Italy INFN 744'498 714'498 30'000 9'189'915 9'159'915 30'000Netherlands 98'760 98'760 890'231 890'231Norway 144'341 144'341 1'354'048 1'354'048Poland 136'744 136'744 1'468'811 1'468'811Romania ISS 53'178 22'792 30'386 157'127 123'291 3'450 30'386Romania NIPNE 53'178 53'178 221'582 215'552 6'030Slovakia 91'163 91'163 1'013'895 1'013'895Spain 7'597 7'597 410'914 410'914 6'774Sweden 30'388 30'388 375'222 375'222United Kingdom 91'163 91'163 740'794 740'794
MS Total 3'008'379 2'925'202 30'000 83'177 33'126'047 33'010'647 30'000 9'480 75'920 620'273Armenia 11'513 11'513 197'815 172'002 12'497 13'316Brazil 126'639 126'639 612'344 424'726 47'197 140'421China Wuhan CCNU 57'565 57'565 442'649 341'042 60'080 42'847 -1'320China Beijing 11'511 11'511 140'194 46'603 62'690 19'390 11'511Croatia 69'076 69'076 500'032 465'755 34'277India 453'270 453'270 3'758'567 3'516'650 241'917Japan 113'552 113'552 935'309 870'240 65'069 26'307JINR 92'101 92'101 967'454 516'054 399'172 52'228Mexico 218'740 218'740 1'365'817 1'040'613 106'464 218'740Republic of Korea NRF 138'152 138'152 944'292 882'013 62'279Republic of Korea KISTI 23'025 23'025 76'093 76'093Pakistan 34'538 34'538 87'606 87'606Peru 11'513 11'513 54'659 53'906 862 -109Romania ISS 253'952 219'158 34'794Romania NIPNE 462'175 415'944 46'231Russia 428'484 407'280 21'204 4'473'705 4'209'800 10'100 258'520 -4'715South Africa 80'588 80'588 645'496 606'029 39'467Thailand 11'513 11'513 20'236 20'236Turkey 23'025 23'025 40'470 40'470Ukraine 23'025 23'025 389'730 303'082 28'000 33'148 25'500USA DOE 455'938 455'938 3'215'129 3'007'416 207'847 -134 21'294USA NSF 56'993 35'181 21'812 524'861 469'761 34'080 21'020 24'246
NMS Total 2'440'761 2'006'317 434'444 20'108'585 17'785'198 560'042 1'339'114 424'231 71'847Grand Total 5'449'140 4'931'519 30'000 517'621 53'234'632 50'795'844 590'042 1'348'594 500'152 692'120
MS: 99% received NMS: 98% received Total: 99% received

3 V. Manzari Riunione Referee INFN – Roma, 26 Maggio 2016
M&O Cat. B – Contributi 2015
Maintenance and Operation Category B (sub-systems specific) as of 31/12/2015 in kCHF
ALICE | RRB | 27 April 2016 | AT
Note that the Muon Tracking detector reports a negative balance at the end of 2015 mainly due to the repairing of LV power supplies. The in-kind contributions in man-months for Technical manpower from collaborating institutes at CERN in 2015 have been: • 14 man-months for ITS-SSD • 19 man-months for TRD • 69 man-months for PHOS • 13.7 man-months for PMD • 24 man-months for Central Trigger
Project 2015
budget 2015
Payments 2015 Open
CommitmentsBalance
(budget -payments)ITS Common 128 128 0ITS-SPD 84 87 -3ITS-SDD 125 104.2 6.2 20.8ITS-SSD 72.5 71.5 1TPC 135 101.1 33.9TRD 133.5 134.0 -1TOF 81 78 3HMPID 82.5 94 -11.5PHOS 56 42.2 13.8EMCAL-DCAL 67 65.5 1.5FMD 25 25 0T0 48 59 -11V0A 10 9.4 0.6V0C 7 10.6 -3.6PMD 20 12.7 7.3ZDC 29 11 18ACORDE 10 3 7MUON TRACKING 118 157 -39MUON TRIGGER 76 75.9 0.1CENTRAL TRIGGER 20 24 -4Grand Total 1327.5 1293.2 6.2 34.3
21
Riparazione LV power supply

4 V. Manzari Riunione Referee INFN – Roma, 26 Maggio 2016
M&O Cat. A - Contributi 2016
Contributo INFN (102 Fisici) dovuto: 771˙893 CHF pagato: 671˙760 CHF (622k€ x 1.08) richiesta integrativa: ~100 kCHF à 92 k€
Riunione Bilancio Sett. 2015
richiesta: 710 k€ (x 1.05 = 746 kCHF) assegnazione: 622 k€ (x 1.20 = 622 kCHF)
2016 M&O-A contributions in kCHF as of 26/04/2016
Percentage of received contributions for 2016:MS: 47% NMS: 11%Total: 32%
10
2016 2002-2016 2002-2016
Country Invoiced Received In-kind Due Invoiced Received In-kindEnergy rebate Due
Austria 37'838 37'838 37'838 37'838CERN 401'082 401'082 5'316'053 5'316'053Czech Republic 113'514 113'514 1'093'615 980'101 113'514Denmark 60'541 60'541 597'938 597'938Finland 45'405 45'405 523'469 523'469France CEA 52'973 52'973 614'585 614'585France IN2P3 302'703 302'703 4'417'034 4'114'331 302'703Germany BMBF 287'568 499'985 -212'417 3'324'837 3'537'254 -212'417Germany GSI 166'487 166'487 1'957'735 1'957'735Greece 15'135 15'135 340'110 279'441 60'669Hungary 45'405 45'405 345'885 345'885Italy Centro Fermi 37'838 37'838 300'898 263'060 37'838Italy INFN 771'893 771'893 9'961'808 9'159'915 30'000 771'893Netherlands 75'676 75'676 965'907 890'231 75'676Norway 143'784 143'784 1'497'832 1'354'048 143'784Pakistan 37'838 37'838 37'838 37'838Poland 136'216 136'216 1'605'027 1'605'027Romania ISS 45'405 45'405 202'532 123'291 3'450 75'791Romania NIPNE 45'405 45'405 266'987 215'552 6'030 45'405Slovakia 105'946 105'946 1'119'841 1'013'895 105'946Spain 7'568 6'774 794 418'482 417'688 794Sweden 30'270 30'270 405'492 405'492Turkey 7'568 7'568 7'568 7'568United Kingdom 75'676 75'676 816'470 740'794 75'676
MS Total 3'049'734 1'445'138 1'604'596 36'175'781 34'455'785 30'000 9'480 1'680'516Armenia 10'647 10'647 208'462 172'002 12'497 23'963Brazil UFRGS 10'647 10'647 10'647 10'647Brazil RENAFAE 117'113 117'113 729'457 438'508 47'197 243'752China Wuhan CCNU 74'526 74'526 517'175 341'042 60'080 42'847 73'206China Beijing 10'647 10'647 150'841 46'603 62'690 19'390 22'158Croatia 63'880 63'880 563'912 529'635 34'277India 451'688 451'688 4'210'255 3'516'650 241'917 451'688Indonesia 10'647 10'647 10'647 10'647Japan 115'751 26'307 89'444 1'051'060 896'547 65'069 89'444JINR 85'173 85'173 1'052'627 601'227 399'172 52'228Mexico 159'699 159'699 1'525'516 1'259'353 106'464 159'699Republic of Korea NRF 127'759 127'759 1'072'051 882'013 62'279 127'759Republic of Korea KISTI 10'647 10'647 86'740 86'740Pakistan 87'606 87'606Peru 21'293 21'293 75'952 53'906 862 21'184Romania ISS 253'952 219'158 34'794Romania NIPNE 462'175 415'944 46'231Russia 412'090 412'090 4'885'795 4'209'800 10'100 258'520 407'375South Africa 74'526 74'526 720'022 606'029 39'467 74'526Thailand 10'647 10'647 30'883 20'236 10'647Turkey 40'470 40'470Ukraine 10'647 10'647 400'377 304'082 28'000 33'148 35'147USA DOE 454'124 21'294 432'830 3'669'253 3'028'710 207'847 432'696USA NSF 52'784 24'246 28'538 577'645 516'807 34'080 26'758
NMS Total 2'284'935 242'194 2'042'741 22'393'520 18'283'714 560'042 1'339'114 2'210'650Grand Total 5'334'669 1'687'332 3'647'337 58'569'301 52'739'498 590'042 1'348'594 3'891'167
Received contributions 26/04/2016 MS: 47% NMS: 11% Total: 32%

5 V. Manzari Riunione Referee INFN – Roma, 26 Maggio 2016
M&O Cat. A – Common Fund Upgrade
Common fund for upgrade contributions as of 31/12/2015 in kCHF
34% of contributions have been received
Note that we have received in 2016: • 148 kCHF from Norway • 9 kCHF from Hungary As of 26/04/2016
ALICE | RRB | 27 April 2016 | AT
Funding Agency Due 2012 2013 2014 2015 Total received OutstandingCERN 471'499 471'499 471'499Czech Republic 87'315 87'315 87'315Denmark 69'852 69'852 69'852Finland 34'926 34'926France CEA 52'389 52'389 52'389France IN2P3 401'647 66'119 67'108 67'108 200'335 201'312Germany BMBF 340'527 340'367 340'367 160Germany GSI 200'824 200'824Greece 26'194 26'194Hungary 43'657 8'732 8'732 17'464 26'193Italy Centro Fermi 61'120 61'120Italy INFN 873'147 873'147Netherlands 122'241 122'241Norway 148'435 148'435Poland 165'898 165'898Romania ISS 43'657 43'657Romania NIPNE 61'120 10'000 10'000 10'000 30'000 31'120Slovakia 87'315 87'315 87'315Spain 43'657 43'657Sweden 43'657 43'657United Kingdom 96'046 96'046 96'046MS Total 3'475'123 76'119 1'107'262 269'201 1'452'583 2'022'540Armenia 17'463 17'463Brazil 69'852 69'852China 43'657 43'657Croatia 52'389 52'389India 357'990 357'990Japan 78'583 3'056 40'166 11'787 55'009 23'574JINR 78'583 24'613 24'613 53'970Mexico 104'778 104'778 104'778Pakistan 26'194 26'194Peru 8'731 8'731Republic of Korea - NRF 96'046 19'200 19'200 76'846Republic of Korea - KISTI 26'194 26'194Russia 357'990 357'990South Africa 61'120 24'448 12'224 36'672 24'448Thailand 8'731 8'731Turkey 17'463 17'463 17'463Ukraine Kiev 26'194 26'194USA DOE 349'259 72'998 72'998 276'262USA NSF 43'657 4'429 11'242 1'806 1'821 19'298 24'359NMS Total 1'824'874 4'429 14'298 188'661 142'642 350'030 1'474'844Grand Total 5'299'997 4'429 90'417 1'295'924 411'843 1'802'613 3'497'384
Contributo INFN dovuto: 873˙147 CHF pagato: 108˙000 CHF (100k€ x 1.08) richiesta: 50 k€ (come da richiesta Sett. 2015, totale distribuito su ~5 anni)

6 V. Manzari Riunione Referee INFN – Roma, 26 Maggio 2016
Richieste Finanziarie 2016 – Integrative
M&O Cat. A: 92 k€ per completamento contributo dovuto per il 2016
M&O Cat. B: ---- per far fronte ai tagli applicati, potrebbero essere necessarie integrazioni a Settembre dell’ordine di qualche k€
Upgrade Common Fund 50 k€ per coprire circa 1/5 del totale dovuto, assumendo di distribuirlo su un periodo di 5 anni (2016÷2020)
Missioni 75 k€ diverse Sezioni hanno già speso il 60% e oltre delle assegnazioni, una ragionevole previsione del fabbisogno suppletivo necessario fino a fine anno è pari a circa 90 k€ di cui 26 k€ sono disponibili attraverso lo sblocco del sj
Consumo 15 k€ Per la Sezione di Ts: Upgrade del software del sistema di visione del Mitutoyo per l’ispezione ottica e le verifiche dimensionali degli FPC 16 k€ Per la Sezione di Ct: Realizzazione sistema per il test elettrico degli FPC
7 V. Manzari Riunione Referee INFN – Roma, 26 Maggio 2016
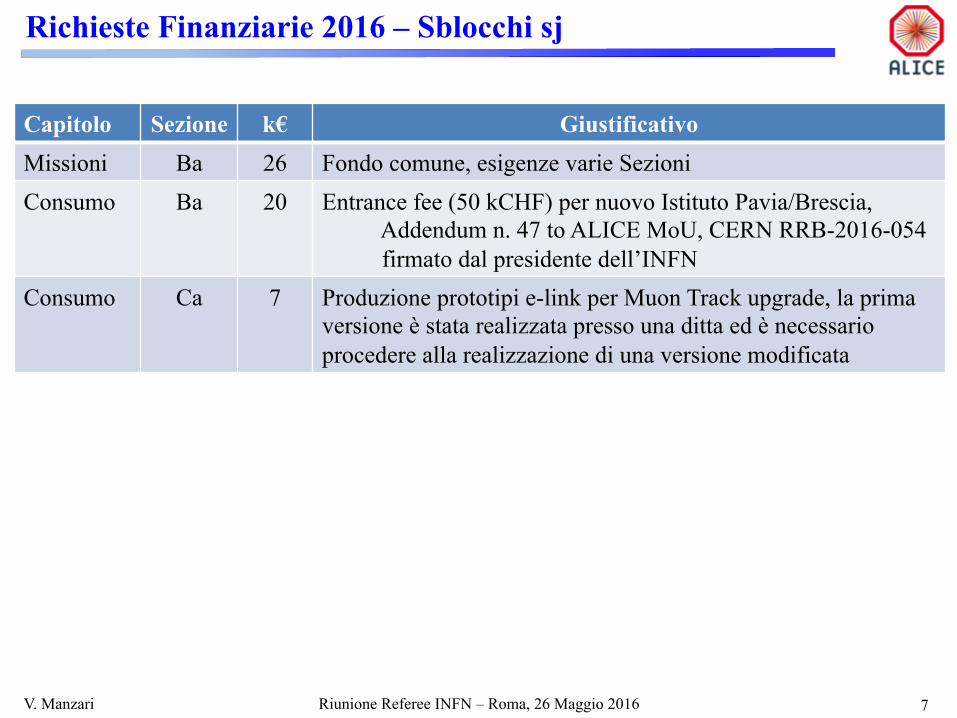
Richieste Finanziarie 2016 – Sblocchi sj
Capitolo Sezione k€ Giustificativo Missioni Ba 26 Fondo comune, esigenze varie Sezioni Consumo Ba 20 Entrance fee (50 kCHF) per nuovo Istituto Pavia/Brescia,
Addendum n. 47 to ALICE MoU, CERN RRB-2016-054 firmato dal presidente dell’INFN
Consumo Ca 7 Produzione prototipi e-link per Muon Track upgrade, la prima versione è stata realizzata presso una ditta ed è necessario procedere alla realizzazione di una versione modificata
8 V. Manzari Riunione Referee INFN – Roma, 26 Maggio 2016
Richieste Generali 2017 - M&O Cat. A
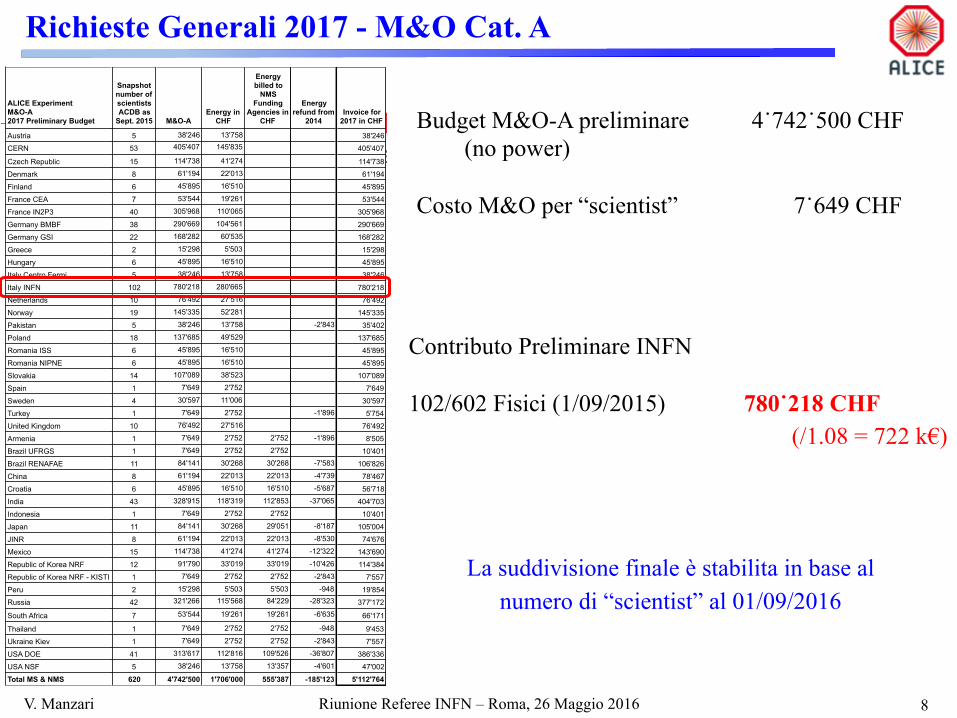
Contributo Preliminare INFN 102/602 Fisici (1/09/2015) 780˙218 CHF
(/1.08 = 722 k€)
Sharing of the preliminary 2017 budget
ALICE | RRB | 27 April 2016 | AT
Final sharing is established as soon as the scrutiny of the preliminary budget is done and scientists head count is done as 01/09/2016.
2017 DRAFT M&O-A Budget no power 4’742’500 CHF 2017 Power 1’706’000 CHF ALICE DB as 01/09/2015 620 scientists Cost M&O per scientist 7’649 CHF Cost Power per scientist 2’752 CHF
ALICE ExperimentM&O-A2017 Preliminary Budget
Austria
CERN
Czech Republic
Denmark
Finland
France CEA
France IN2P3
Germany BMBF
Germany GSI
Greece
Hungary
Italy Centro Fermi
Italy INFN
Netherlands
Norway
Pakistan
Poland
Romania ISS
Romania NIPNE
Slovakia
Spain
Sweden
Turkey
United Kingdom
Armenia
Brazil UFRGS
Brazil RENAFAE
China
Croatia
India
Indonesia
Japan
JINR
Mexico
Republic of Korea NRF
Republic of Korea NRF - KISTI
Peru
Russia
South Africa
Thailand
Ukraine Kiev
USA DOE
USA NSF
Total MS & NMS
Snapshot number of scientists ACDB as
Sept. 2015 M&O-AEnergy in
CHF
Energy billed to
NMS Funding
Agencies in CHF
5 38'246 13'758
53 405'407 145'835
15 114'738 41'274
8 61'194 22'013
6 45'895 16'510
7 53'544 19'261
40 305'968 110'065
38 290'669 104'561
22 168'282 60'535
2 15'298 5'503
6 45'895 16'510
5 38'246 13'758
102 780'218 280'665
10 76'492 27'516
19 145'335 52'281
5 38'246 13'758
18 137'685 49'529
6 45'895 16'510
6 45'895 16'510
14 107'089 38'523
1 7'649 2'752
4 30'597 11'006
1 7'649 2'752
10 76'492 27'516
1 7'649 2'752 2'752
1 7'649 2'752 2'752
11 84'141 30'268 30'268
8 61'194 22'013 22'013
6 45'895 16'510 16'510
43 328'915 118'319 112'853
1 7'649 2'752 2'752
11 84'141 30'268 29'051
8 61'194 22'013 22'013
15 114'738 41'274 41'274
12 91'790 33'019 33'019
1 7'649 2'752 2'752
2 15'298 5'503 5'503
42 321'266 115'568 84'229
7 53'544 19'261 19'261
1 7'649 2'752 2'752
1 7'649 2'752 2'752
41 313'617 112'816 109'526
5 38'246 13'758 13'357
620 4'742'500 1'706'000 555'387
Energy refund from
2014Invoice for
2017 in CHF
38'246
405'407
114'738
61'194
45'895
53'544
305'968
290'669
168'282
15'298
45'895
38'246
780'218
76'492
145'335-2'843 35'402
137'685
45'895
45'895
107'089
7'649
30'597-1'896 5'754
76'492-1'896 8'505
10'401-7'583 106'826-4'739 78'467-5'687 56'718
-37'065 404'703
10'401-8'187 105'004-8'530 74'676
-12'322 143'690-10'426 114'384
-2'843 7'557-948 19'854
-28'323 377'172-6'635 66'171
-948 9'453-2'843 7'557
-36'807 386'336-4'601 47'002
-185'123 5'112'764
18
Budget M&O-A preliminare 4˙742˙500 CHF (no power)
Costo M&O per “scientist” 7˙649 CHF
La suddivisione finale è stabilita in base al numero di “scientist” al 01/09/2016

9 V. Manzari Riunione Referee INFN – Roma, 26 Maggio 2016
Richieste Generali 2017 - M&O Cat. B
M&O-B preliminary budget for 2017 and estimates for 2018-2020 in kCHF
These numbers are based on long period of runs with short technical stops during winter periods in 2017 and 2018 followed by a long period of shutdown starting in January 2019 and continuing until the end of 2020.
The preliminary budget will be reviewed in detail over the summer with the Scrutiny Group, and presented for final approval at the October RRB meeting. ALICE | RRB | 27 April 2016 | AT
Project 2012 2013 2014 2015 2016 Prelim. 2017 2018 2019 2020ITS Common 128 88 98 128 128 128 128 60 0ITS-SPD 95 75 75 84 110 110 110 50 25ITS-SDD 237 180 130 125 115 95 90 55 30ITS-SSD 183 153 86.5 72.5 119.1 119.1 122 88.9 47.7TPC 145 160 160 135 135 180 185 195 156TRD 164 134 134 134 133.5 153.5 154 153.5 153.5TOF 120 94 92 81 62 62 62 60 55HMPID 145 92.5 92.5 82.5 82.5 82.5 82.5 86 73.5PHOS 158 93 142 56 56 56 56 56 56EMCAL-DCAL 77.7 49 69 67 67 96 98.9 101.9 104.9FMD 25 25 25 25 25 25 25 16 10T0 48.4 65 53 48 48 26 20 5.5 0V0A 14 52.5 52.5 10 5 5 5 10 0V0C 11 55.5 55.5 7 7 7 7 7 0PMD 29 36 26 20 15 15 15 0 0ZDC 35 26 30 29 26 26 22 17 17ACORDE 15 15 10 10 9 10 7 8 13MUON TRACKING 87 164 164 118 145 149 151 169 153MUON TRIGGER 75 81 81 76 76 69 69 71 69CENTRAL TRIGGER 20 20 20 20 20 11 11 20 20Grand Total 1811 1658 1596 1328 1384 1425.1 1420 1230 983.6
23
Budget per il 2017 e stime per il periodo 2018-2020 (kCHF)
Queste stime sono basate sull’assunzione di run lunghi nel corso degli anni 2017 e 2018 con brevi technical stop durante il periodo invernale, seguiti da un lungo shutdown da Gennaio 2019 a fine 2020
10 V. Manzari Riunione Referee INFN – Roma, 26 Maggio 2016
Richieste Generali 2017 - M&O Cat. B
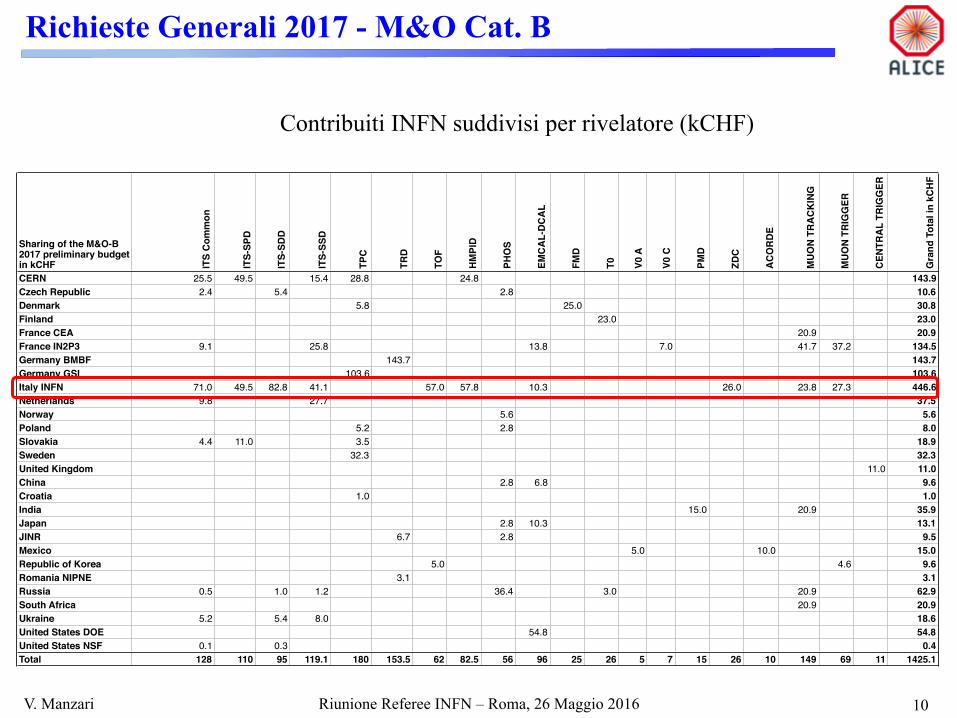
Sharing of the preliminary 2017 M&O-B budget
ALICE | RRB | 27 April 2016 | AT
Sharing of the M&O-B 2017 preliminary budget in kCHF IT
S Co
mm
on
ITS-
SPD
ITS-
SDD
ITS-
SSD
TPC
TRD
TOF
HMPI
D
PHO
S
EMCA
L-DC
AL
FMD
T0 V0 A
V0 C
PMD
ZDC
ACO
RDE
MUO
N TR
ACKI
NG
MUO
N TR
IGG
ER
CENT
RAL
TRIG
GER
Gra
nd T
otal
in k
CHF
CERN 25.5 49.5 15.4 28.8 24.8 143.9Czech Republic 2.4 5.4 2.8 10.6Denmark 5.8 25.0 30.8Finland 23.0 23.0France CEA 20.9 20.9France IN2P3 9.1 25.8 13.8 7.0 41.7 37.2 134.5Germany BMBF 143.7 143.7Germany GSI 103.6 103.6Italy INFN 71.0 49.5 82.8 41.1 57.0 57.8 10.3 26.0 23.8 27.3 446.6Netherlands 9.8 27.7 37.5Norway 5.6 5.6Poland 5.2 2.8 8.0Slovakia 4.4 11.0 3.5 18.9Sweden 32.3 32.3United Kingdom 11.0 11.0China 2.8 6.8 9.6Croatia 1.0 1.0India 15.0 20.9 35.9Japan 2.8 10.3 13.1JINR 6.7 2.8 9.5Mexico 5.0 10.0 15.0Republic of Korea 5.0 4.6 9.6Romania NIPNE 3.1 3.1Russia 0.5 1.0 1.2 36.4 3.0 20.9 62.9South Africa 20.9 20.9Ukraine 5.2 5.4 8.0 18.6United States DOE 54.8 54.8United States NSF 0.1 0.3 0.4Total 128 110 95 119.1 180 153.5 62 82.5 56 96 25 26 5 7 15 26 10 149 69 11 1425.1
26
Contribuiti INFN suddivisi per rivelatore (kCHF)
11 V. Manzari Riunione Referee INFN – Roma, 26 Maggio 2016
Richieste Generali 2017
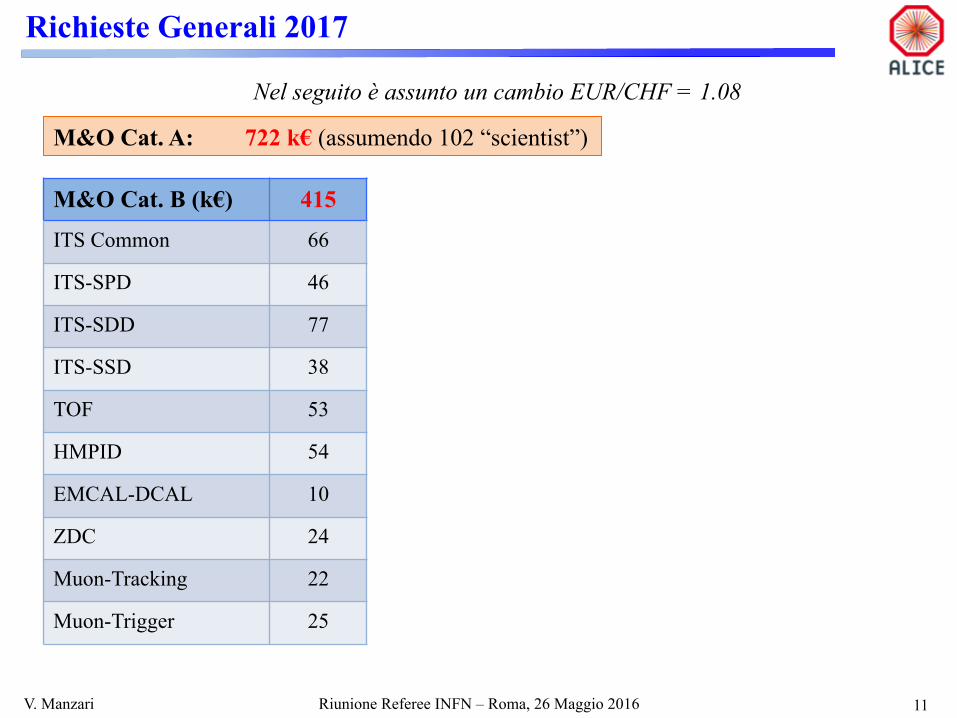
Nel seguito è assunto un cambio EUR/CHF = 1.08
M&O Cat. A: 722 k€ (assumendo 102 “scientist”)
M&O Cat. B (k€) 415
ITS Common 66
ITS-SPD 46
ITS-SDD 77
ITS-SSD 38
TOF 53
HMPID 54
EMCAL-DCAL 10
ZDC 24
Muon-Tracking 22
Muon-Trigger 25
12 V. Manzari Riunione Referee INFN – Roma, 26 Maggio 2016
Richieste Generali 2017
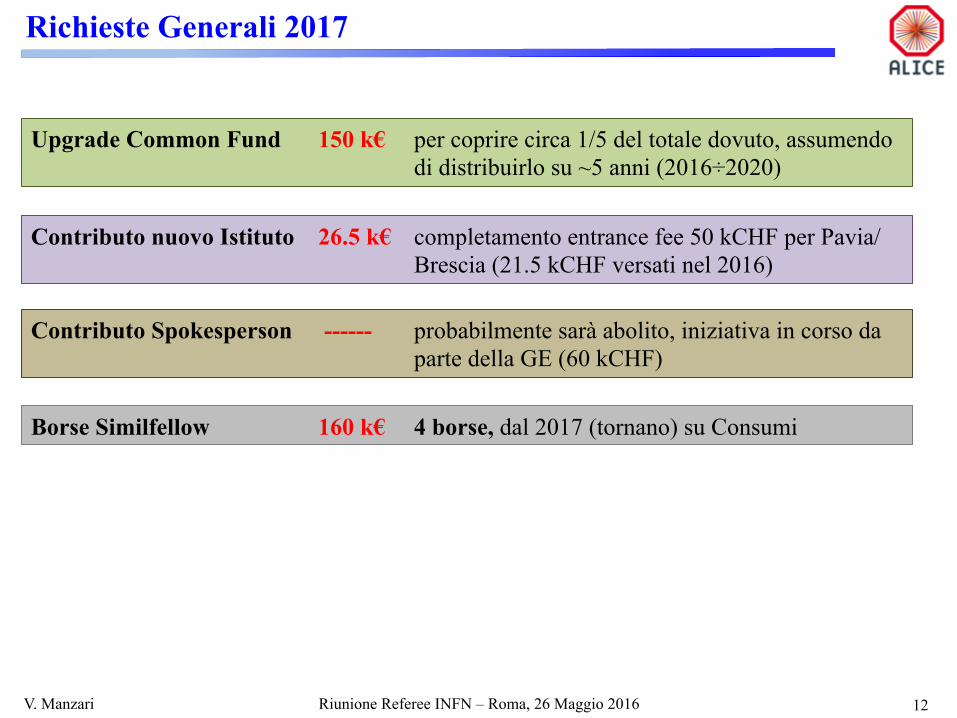
Upgrade Common Fund 150 k€ per coprire circa 1/5 del totale dovuto, assumendo di distribuirlo su ~5 anni (2016÷2020)
Contributo nuovo Istituto 26.5 k€ completamento entrance fee 50 kCHF per Pavia/ Brescia (21.5 kCHF versati nel 2016)
Contributo Spokesperson ------ probabilmente sarà abolito, iniziativa in corso da parte della GE (60 kCHF)
Borse Similfellow 160 k€ 4 borse, dal 2017 (tornano) su Consumi

13 V. Manzari Riunione Referee INFN –Roma, 26 Maggio 2016
Richieste UCG 2017 per ITS Upgrade
Attività k€ Sezione
Contributo al 3° e 4° Lotto della Produzione dei Pixel Chip (200 kCHF/lotto à 200/1.08/lotto = 185k€/lotto)
370
Bari
Contributo thinning e dicing 83 Bari
Completamento della produzione, assemblaggio e test degli FPC 71 Trieste
Realizzazione del tooling e materiale di consumo per la costruzione dei Moduli 30 Bari
Realizzazione del tooling e materiale di consumo per la costruzione degli Stave 25 Torino
Realizzazione del ooling e materiale di consumo per la costruzione degli Stave 25 LNF
Completamento End-wheels e Cylindrical Structural Shell, Meccanica di supporto per Middle e Outer Layer 96 Padova
Sistema di alimentazione 700 Bari
Totale 1400
Richiesta alla CSN3: non etichettare come UCG richieste che non sono state come tali sotto a meno di preventiva consultazione con me

14 V. Manzari Riunione Referee INFN –Roma, 26 Maggio 2016
Stato Finanziamento - ITS Upgrade
2013 2014 2015 2016 2017 2018 2019 Total
R&D (kEur) 258 458 243 959
UCG (kEur) 353 847 1400 143 145 2888
Finanziamento previsto in origine: R&D 1000 kEur, Costruzione 2900 kEur
15 V. Manzari Riunione Referee INFN – Roma, 26 Maggio 2016
Richieste Generali 2017
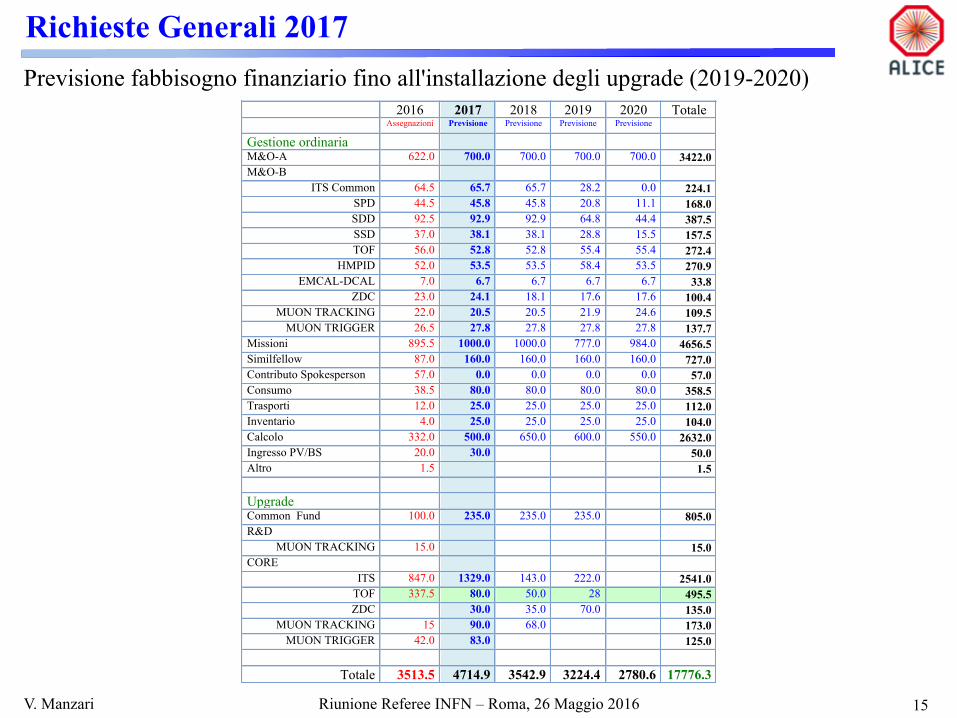
2016 2017 2018 2019 2020 Totale Assegnazioni Previsione Previsione Previsione Previsione Gestione ordinaria M&O-A 622.0 700.0 700.0 700.0 700.0 3422.0 M&O-B
ITS Common 64.5 65.7 65.7 28.2 0.0 224.1 SPD 44.5 45.8 45.8 20.8 11.1 168.0 SDD 92.5 92.9 92.9 64.8 44.4 387.5 SSD 37.0 38.1 38.1 28.8 15.5 157.5 TOF 56.0 52.8 52.8 55.4 55.4 272.4
HMPID 52.0 53.5 53.5 58.4 53.5 270.9 EMCAL-DCAL 7.0 6.7 6.7 6.7 6.7 33.8
ZDC 23.0 24.1 18.1 17.6 17.6 100.4 MUON TRACKING 22.0 20.5 20.5 21.9 24.6 109.5
MUON TRIGGER 26.5 27.8 27.8 27.8 27.8 137.7 Missioni 895.5 1000.0 1000.0 777.0 984.0 4656.5 Similfellow 87.0 160.0 160.0 160.0 160.0 727.0 Contributo Spokesperson 57.0 0.0 0.0 0.0 0.0 57.0 Consumo 38.5 80.0 80.0 80.0 80.0 358.5 Trasporti 12.0 25.0 25.0 25.0 25.0 112.0 Inventario 4.0 25.0 25.0 25.0 25.0 104.0 Calcolo 332.0 500.0 650.0 600.0 550.0 2632.0 Ingresso PV/BS 20.0 30.0 50.0 Altro 1.5 1.5 Upgrade Common Fund 100.0 235.0 235.0 235.0 805.0 R&D
MUON TRACKING 15.0 15.0 CORE
ITS 847.0 1329.0 143.0 222.0 2541.0 TOF 337.5 80.0 50.0 28 495.5 ZDC 30.0 35.0 70.0 135.0
MUON TRACKING 15 90.0 68.0 173.0 MUON TRIGGER 42.0 83.0 125.0
Totale 3513.5 4714.9 3542.9 3224.4 2780.6 17776.3
Previsione fabbisogno finanziario fino all'installazione degli upgrade (2019-2020)
Thank you !
V. Manzari 16 Commissione Scientifica III – LNF, 15 Giugno 2015