Removal of carbon and nutrients from wastewater in a...
14
Removal of carbon and nutrients from wastewater in a moving bed membrane biofilm reactor: the influence of the sludge retention time Giorgio Mannina*, Marco Capodici*, Alida Cosenza*, Daniele Di Trapani* * Dipartimento di Ingegneria Civile, Ambientale, Aerospaziale, dei Materiali, Università di Palermo, Viale delle Scienze, Ed. 8, 90128, Palermo, Italy (E-mail: [email protected]) Abstract A University of Cape Town (UCT) pilot plant combining both membrane bioreactor (MBR) and moving bed biofilm reactor (MBBR) technology was monitored. Three experimental Phases were carried out by varying the mixed liquor sludge retention time (SRT) (indefinite, 30 and 15 days, respectively). The system performance has been investigated during experiments in terms of: organic carbon, nitrogen and phosphorus removal, biokinetic/stoichiometric constants, membrane fouling tendency and sludge dewaterability. The observed results showed that by decreasing the SRT the UCT pilot plant was able to maintain very high total COD removal efficiencies, whilst the biological COD removal efficiency showed a slight decrease. Nitrification was only slightly affected by the decrease of the mixed liquor SRT, showing high performance (as average). This result could be related to the presence of the biofilm able to sustain nitrification throughout experiments. Conversely, the average P removal efficiency was quite moderate, likely due to the increase of the ammonium loading rate that could promote an increased NO 3 -N recycled from the anoxic to the anaerobic tank, interfering with phosphorus accumulating organisms (PAOs) activity inside the anaerobic tank. Membrane fouling increased at 30 days SRT likely due to a reduction of protective cake pre-filter effect. Moreover, it was noticed the increase of the resistance due to pore blocking and a general worsening of the membrane filtration properties. Keywords UCT; MBBR; nutrients removal; MBR; membrane fouling. INTRODUCTION Nowadays the increasing urbanization, coupled to industrial development, have caused a significant increase of consumption of water resources as well as their deterioration (Martìn-Pascual et al., 2015), contributing to make water a global concern. Moreover, it is well known that nutrients (particularly, nitrogen and phosphorus compounds) may have adverse environmental impacts (e.g., eutrophication, toxicity towards the aquatic organisms, etc.) (Wang et al., 2006). Therefore, their removal from wastewater is an imperative requirement, especially when discharging in sensitive areas (Li et al., 2013). In the last years, several biological and physic-chemical methods have been developed to remove nutrients from wastewater. Among these methods, biological treatments are the most cost-effective methods (Chu and Wang, 2011). In the last years, biological nutrient removal (BNR) from domestic wastewater has been extensively investigated and developed and it is usually based on anaerobic, anoxic and aerobic reactors linked in-series (among others, Wanner et al., 1992; Lu et al., 2015). In BNR processes, N and P removal is accomplished, respectively, by heterotrophic denitrifying bacteria and polyphosphate-accumulating organisms (PAOs) which require carbon source (Naessens et al., 2012). In particular, the biological phosphorous removal is commonly conducted by exploiting the ability of PAOs to accumulate P and to store it as intracellular polyphosphate (poly-P) under alternating anaerobic/aerobic conditions (Li et al., 2013). However, despite conventional activated sludge (CAS) processes are effective for removal of organic and nutrients compounds, the overall efficiency is strictly related to the performance of the solid-liquid separation into the final settler, which may suffer of separation problems (Wanner, 2002). In this context, membrane bioreactor (MBR) technology may represent a useful solution, since it enables to disconnect the efficiency of the biological processes from the biomass settling properties. Indeed, MBRs have attracted considerable interest due to various advantages compared
Transcript of Removal of carbon and nutrients from wastewater in a...

Removal of carbon and nutrients from wastewater in a moving
bed membrane biofilm reactor: the influence of the sludge
retention time
Giorgio Mannina*, Marco Capodici*, Alida Cosenza*, Daniele Di Trapani*
* Dipartimento di Ingegneria Civile, Ambientale, Aerospaziale, dei Materiali, Università di Palermo, Viale
delle Scienze, Ed. 8, 90128, Palermo, Italy (E-mail: [email protected])
Abstract
A University of Cape Town (UCT) pilot plant combining both membrane bioreactor (MBR) and
moving bed biofilm reactor (MBBR) technology was monitored. Three experimental Phases were
carried out by varying the mixed liquor sludge retention time (SRT) (indefinite, 30 and 15 days,
respectively). The system performance has been investigated during experiments in terms of:
organic carbon, nitrogen and phosphorus removal, biokinetic/stoichiometric constants, membrane
fouling tendency and sludge dewaterability.
The observed results showed that by decreasing the SRT the UCT pilot plant was able to maintain
very high total COD removal efficiencies, whilst the biological COD removal efficiency showed a
slight decrease. Nitrification was only slightly affected by the decrease of the mixed liquor SRT,
showing high performance (as average). This result could be related to the presence of the biofilm
able to sustain nitrification throughout experiments. Conversely, the average P removal efficiency
was quite moderate, likely due to the increase of the ammonium loading rate that could promote an
increased NO3-N recycled from the anoxic to the anaerobic tank, interfering with phosphorus
accumulating organisms (PAOs) activity inside the anaerobic tank. Membrane fouling increased at
30 days SRT likely due to a reduction of protective cake pre-filter effect. Moreover, it was noticed
the increase of the resistance due to pore blocking and a general worsening of the membrane
filtration properties.
Keywords
UCT; MBBR; nutrients removal; MBR; membrane fouling.
INTRODUCTION
Nowadays the increasing urbanization, coupled to industrial development, have caused a significant
increase of consumption of water resources as well as their deterioration (Martìn-Pascual et al.,
2015), contributing to make water a global concern. Moreover, it is well known that nutrients
(particularly, nitrogen and phosphorus compounds) may have adverse environmental impacts (e.g.,
eutrophication, toxicity towards the aquatic organisms, etc.) (Wang et al., 2006). Therefore, their
removal from wastewater is an imperative requirement, especially when discharging in sensitive
areas (Li et al., 2013). In the last years, several biological and physic-chemical methods have been
developed to remove nutrients from wastewater. Among these methods, biological treatments are
the most cost-effective methods (Chu and Wang, 2011). In the last years, biological nutrient
removal (BNR) from domestic wastewater has been extensively investigated and developed and it is
usually based on anaerobic, anoxic and aerobic reactors linked in-series (among others, Wanner et
al., 1992; Lu et al., 2015). In BNR processes, N and P removal is accomplished, respectively, by
heterotrophic denitrifying bacteria and polyphosphate-accumulating organisms (PAOs) which
require carbon source (Naessens et al., 2012). In particular, the biological phosphorous removal is
commonly conducted by exploiting the ability of PAOs to accumulate P and to store it as
intracellular polyphosphate (poly-P) under alternating anaerobic/aerobic conditions (Li et al., 2013).
However, despite conventional activated sludge (CAS) processes are effective for removal of
organic and nutrients compounds, the overall efficiency is strictly related to the performance of the
solid-liquid separation into the final settler, which may suffer of separation problems (Wanner,
2002). In this context, membrane bioreactor (MBR) technology may represent a useful solution,
since it enables to disconnect the efficiency of the biological processes from the biomass settling
properties. Indeed, MBRs have attracted considerable interest due to various advantages compared
to conventional process that originate from the use of a membrane for solid–liquid separation (Fu et
al., 2009). In particular, MBRs generally feature high quality effluent, small footprint and low
sludge production rates compared to CAS systems (Stephenson et al., 2000). Therefore, in the last
years the integration of BNR process with MBRs has been proposed for the wastewater treatment to
treat the quality of the effluent, including such BNR processes as University of Cape Town (UCT)
process, anoxic/oxic (A/O) process and anaerobic/anoxic/oxic (A2O) process (Hu et al., 2014).
However, a major drawback of MBRs is still represented by fouling phenomena that may severely
affect the filtration properties of the membrane modules (Judd and Judd, 2010). In particular, the
mixed liquor suspended solid (MLSS) concentration has been recognized to play a significant effect
on membrane fouling (Poyatos et al., 2008; Di Trapani et al., 2014). An alternative to manage this
problem is to couple a MBR system with a moving bed biofilm reactor (MBBR) for the
simultaneous growth of suspended biomass and biofilm into the system, realizing a so-called
moving bed membrane bioreactor (MBMBR) (among others, Leyva-Díaz et al., 2013; Yang et al.,
2014). MBMBR systems are amongst the new advanced wastewater treatments with the potential to
utilize the best characteristics of biofilm processes and membrane separation (Leiknes and
Ødegaard, 2007; Ivanovic and Leiknes, 2008). Briefly, MBBR technology relies on the use of small
plastic carrier elements that are kept in constant motion throughout the entire volume of the reactor,
for biofilm attachment and growth (Ødegaard, 2006). These systems are particularly useful when
slowly growing organisms as nitrifiers have to be retained inside a wastewater treatment plant
(WWTP) (Kermani et al., 2008). By using this technology, it is possible to reduce the MLSS
concentration (while maintaining the same total biomass content) thus reducing the extent of
membrane fouling. Nevertheless, MBMBRs are relatively new, especially when referring to system
performance, biomass biokinetic activity and membrane fouling tendency. Very few studies have
been reported so far for BNR systems adopting hybrid MBMBR processes (Yang et al., 2010).
Therefore, to date there is a dearth of knowledge regarding the suitability of such systems as well as
the influence that specific parameters may have on system performance. As an example, the sludge
retention time (SRT) of the mixed liquor can exert a key role on the performance of a complex
system conceived for nutrients removal and characterized by the simultaneous presence of
suspended and attached biomass. Bearing in mind such considerations, the aim of the present
research is to gain insights about the performance of a University of Cape Town (UCT) pilot plant,
combining both MBR and MBBR technology (UCT-MBMBR), for the treatment of domestic
wastewater and how the mixed liquor SRT influences physical (fouling) and biological
performances. In particular, a UCT-MBMBR pilot plant was monitored for almost 150 days with
the aim to investigate the system performance in terms of organic carbon and nutrient removal,
biomass biokinetic behavior and membrane fouling tendency and sludge features.
MATERIAL AND METHODS
The pilot plant
The UCT-MBMBR pilot plant was built at the Laboratory of Sanitary and Environmental
Engineering of Palermo University (Figure 1). The pilot plant consisted of an anaerobic (volume 62
L), an anoxic (volume 102 L) and an aerobic (volume 211 L) tanks according to the UCT scheme
(Ekama et al., 1983). The solid-liquid separation phase was carried out by means of one
ultrafiltration hollow fibre membrane module (PURON®). The membrane module was located
inside an aerated tank (MBR tank) (36 L). An oxygen depletion reactor (ODR) allowed the oxygen
stripping/consumption in the mixed liquor recycled from the MBR tank to the anoxic one (QRAS).
The membrane was periodically backwashed (every 9 min for a period of 1 min) by pumping, from
the Clean In Place (CIP) tank a volume of permeate back through the membrane module. The
anoxic and aerobic compartments were filled with suspended plastic carriers (carriers density = 0.95
g cm-3
; carriers specific surface = 500 m2 m
-3), with a 15 and 40% filing ratio, corresponding to a
net surface area of 75 and 200 m2 m
-3 in the anoxic and aerobic reactor, respectively. In Figure 1 a
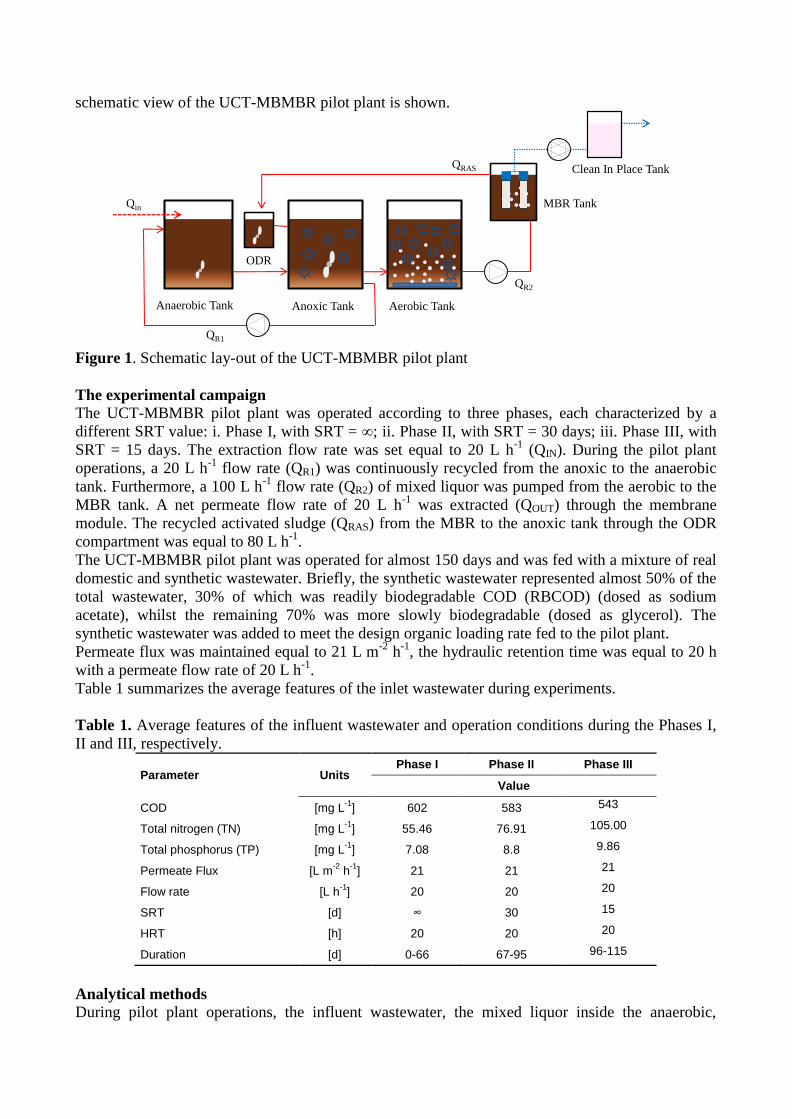
schematic view of the UCT-MBMBR pilot plant is shown.
Anaerobic Tank Anoxic Tank Aerobic Tank
MBR Tank
Clean In Place Tank
ODR
Qin
QR2
QR1
QRAS
Figure 1. Schematic lay-out of the UCT-MBMBR pilot plant
The experimental campaign
The UCT-MBMBR pilot plant was operated according to three phases, each characterized by a
different SRT value: i. Phase I, with SRT = ∞; ii. Phase II, with SRT = 30 days; iii. Phase III, with
SRT = 15 days. The extraction flow rate was set equal to 20 L h-1
(QIN). During the pilot plant
operations, a 20 L h-1
flow rate (QR1) was continuously recycled from the anoxic to the anaerobic
tank. Furthermore, a 100 L h-1
flow rate (QR2) of mixed liquor was pumped from the aerobic to the
MBR tank. A net permeate flow rate of 20 L h-1
was extracted (QOUT) through the membrane
module. The recycled activated sludge (QRAS) from the MBR to the anoxic tank through the ODR
compartment was equal to 80 L h-1
.
The UCT-MBMBR pilot plant was operated for almost 150 days and was fed with a mixture of real
domestic and synthetic wastewater. Briefly, the synthetic wastewater represented almost 50% of the
total wastewater, 30% of which was readily biodegradable COD (RBCOD) (dosed as sodium
acetate), whilst the remaining 70% was more slowly biodegradable (dosed as glycerol). The
synthetic wastewater was added to meet the design organic loading rate fed to the pilot plant.
Permeate flux was maintained equal to 21 L m-2
h-1
, the hydraulic retention time was equal to 20 h
with a permeate flow rate of 20 L h-1
.
Table 1 summarizes the average features of the inlet wastewater during experiments.
Table 1. Average features of the influent wastewater and operation conditions during the Phases I,
II and III, respectively.
Parameter Units Phase I Phase II Phase III
Value
COD [mg L-1
] 602 583 543
Total nitrogen (TN) [mg L-1
] 55.46 76.91 105.00
Total phosphorus (TP) [mg L-1
] 7.08 8.8 9.86
Permeate Flux [L m-2
h-1
] 21 21 21
Flow rate [L h-1
] 20 20 20
SRT [d] ∞ 30 15
HRT [h] 20 20 20
Duration [d] 0-66 67-95 96-115
Analytical methods
During pilot plant operations, the influent wastewater, the mixed liquor inside the anaerobic,
anoxic, aerobic and MBR tank and the effluent permeate have been sampled and analysed for TSS,
volatile suspended solids (VSS), total chemical oxygen demand (CODTOT), supernatant COD
(CODSUP), ammonium nitrogen (NH4-N), nitrite nitrogen (NO2-N), nitrate nitrogen (NO3- N), total
nitrogen (TN), phosphate (PO4-P), total phosphorus (TP). All analyses were carried out according to
the Standard Methods (APHA, 2005); pH, dissolved oxygen (DO) and temperature were also
monitored in each tank by using a multi-parameter probe. Referring to the COD removal, in order to
distinguish the removal due to the biological processes from that one due to the filtration operated
by the membrane, two different removal efficiencies have been calculated (Di Trapani et al., 2014):
the biological removal efficiency and the total removal efficiency. The biological COD removal
efficiency was calculated as the difference between the CODTOT value in the influent and the
CODSUP measured in the supernatant of mixed liquor samples (filtered at 0.45 m) withdrawn from
the MBR tank. Conversely, the total COD removal efficiency (including the removal contribution
due to membrane filtration) was assessed as the difference between the inlet and the permeate
CODTOT, respectively. Periodic test on carrier samples were carried out, in order to establish the
biofilm growth on the carriers; briefly, a carriers sample was taken from the anoxic and aerobic
reactors (10 and 15 carriers, respectively), dried in an oven for one night at 105°C and then
weighted (W1). After biofilm was removed, the carriers were dried another night at 105°C and then
weighted again (W2); thereafter, the amount of the attached biomass was then calculated as W1−
W2. For further details, the reader is addressed to literature (Di Trapani et al., 2013-2014).
Respirometric batch tests were carried out by means of a “flowing gas/static-liquid” respirometer to
evaluate the kinetic and stoichiometric parameters for both autotrophic and heterotrophic biomass
(Di Trapani et al., 2015). Briefly, the suspended biomass samples were taken from the aerobic
reactor and eventually diluted with permeate in order to obtain a VSS concentration in the range of
2.0–3.0 g L-1
. The batch tests on biofilm were performed with carriers and permeate, by imposing in
the respirometer the same filling fraction of the UCT-MBMBR pilot plant.
In the batch tests aimed at assessing the heterotrophic biokinetic parameters, the nitrifying biomass
was inhibited by adding 10 mg L-1
of Allylthiourea (ATU), whilst the exogenous oxygen uptake
rate (OUR) was enhanced by the addition of a readily biodegradable organic substrate (sodium
acetate in this case). The substrate biodegradation rate was then assumed proportional to the
exogenous OUR. On the other hand, the estimation of the kinetic parameters for the autotrophic
population was carried out with a very similar procedure. Nevertheless, no inhibiting substance like
ATU was added and ammonium chloride (NH4Cl) was spiked to evaluate the biokinetic parameters.
During the batch tests, the pH values were constantly monitored to avoid the process inhibition.
Moreover, the evaluation of the nitrification as well as denitrification rate, ammonium utilization
rate (AUR) and nitrate utilization rate (NUR) tests were performed by adopting a modified protocol
derived by Kristensen et al. (1992).
The soluble EPSs or soluble microbial products (SMPs) were obtained by centrifugation at 5000
rpm for 5 min, whilst the bound EPSs (EPSBound) were extracted by means of the thermal extraction
method (among others et al., 2013b). The extracted EPSBound and the SMP were then analysed for
proteins by using the Folin method with bovine serum albumin as the standard (Lowry et al., 1951),
whereas the carbohydrates were measured according to DuBois et al. (1956), which yields results as
glucose equivalent. Moreover, the sum of proteins and carbohydrates was considered as the total
EPSs (EPST), according to the following expression:
SMP
CP
EP S
CPT SMPSMPEPSEPSEPS
Bound (1)
where the subscripts ‘‘P’’ and ‘‘C’’ indicate the content of proteins and carbohydrates respectively
in the EPSBound and SMP, that typically constitute the main fractions.
Membrane fouling has been analysed by monitoring the total resistance (RT) to membrane filtration
which is calculated according to Equation 2, derived by the Darcy’s law:
J
TMPRT (2)
where TMP is the transmembrane pressure (Pa), the permeate viscosity (Pa.s) and J the
permeation flux (m s-1
).
RT can be expressed as the sum between the intrinsic resistance of membrane (Rm) and the
resistance due to membrane fouling (RF). This latter can be fractionated according to Equation 3.
mTrev,Cirr,CPBF RRRRRR (3)
where: RPB is the irreversible resistance due to colloids and particles deposition into the membrane
pore; RC,irr is the fouling resistance related to superficial cake deposition that can be only removed
by physical cleanings (hydraulic/sponge scrubbing); RC,rev is the fouling resistance related to
superficial cake deposition that can be removed by ordinary backwashing.
In order to analyse the specific fouling mechanisms the resistance-in-series (RIS) resistances
method according to Di Trapani et al. (2014) has been applied.
The capillary suction time (CST) and the specific resistance to filtration (SRF) were measured in
order to investigate the sludge dewaterability features (Veselind, 1988; Peng et al., 2011). CST and
SFR were measured in accordance with EN 14701-1 (2006) and EN 14701-2 (2006), by analyzing
fresh samples collected from the anaerobic, anoxic, aerobic and MBR tanks. For further details on
the adopted procedure, the reader is kindly referred to literature (Mannina et al., 2016).
RESULTS AND DISCUSSION
Pilot plant performance
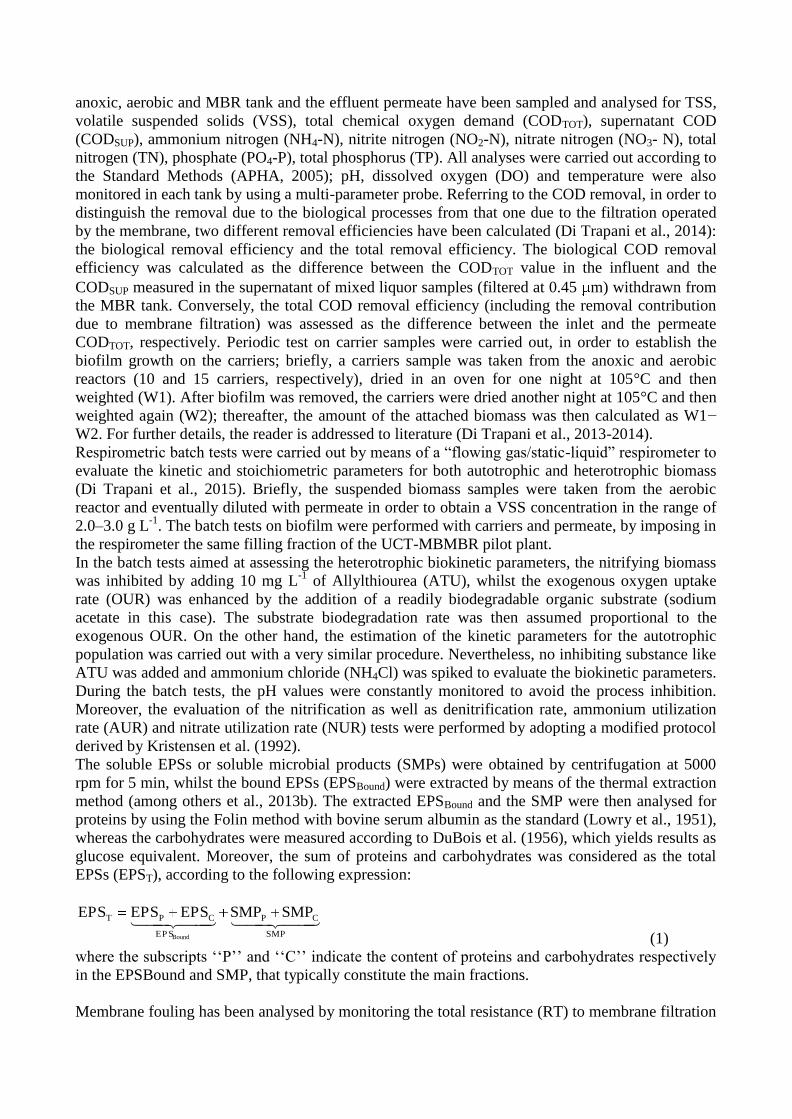
Figure 2 depicts the pattern of influent (CODIN), MBR supernatant (CODSUP,MBR) and effluent COD
(CODOUT) (Figure 2a) as well as the COD removal efficiencies, expressed as total ( TOT), biological
( BIO) and physical contribution due to membrane filtration ( PHYS) throughout experiments.
0
200
400
600
800
1000
0 20 40 60 80 100 120
Concen
tra
tio
n [m
g L
-1]
Time [d]
CODIN CODOUT CODMBRCODIN CODOUT
(a)
CODSUP,MBR
Phase I Phase II Phase III
0
20
40
60
80
100
0 20 40 60 80 100 120
CO
D e
ffic
iency r
em
oval [%
]
Time [d]
bio
tot
phys
BIO
TOT
PHYS
(b)
Phase I Phase II Phase III
Figure 2. Pattern of influent, effluent and MBR supernatant COD (a); pattern of COD removal
efficiencies expressed as biological ( BIO), physical ( PHYS) and total ( TOT) removal (b).
The results showed that, despite the fluctuations of the influent concentration, a quite high total
COD removal efficiency was achieved during the three phases (Phase I: 97%; Phase II: 98%; Phase
III: 99%) (Figure 2b). Referring to COD biological removal, it is worth noting that it was affected
by the SRT variation. Indeed, when the SRT was decreased from indefinite to 30 days, the
supernatant COD in the MBR compartment decreased from 135 mg L-1
to 114 mg L-1
(Figure 2a),
highlighting an increase of the biological performance. This result might be due to the reduced
competition between the suspended biomass and the biofilm attached to the carriers as confirmed by
the respirometric tests as well as to a “renewal” of the suspended biomass due to sludge
withdrawals. Conversely, when the SRT was decreased down to 15 days, the biological COD
removal slightly decreased (Figure 2b), with a minimum value equal to 70.4% during the Phase III.
Nevertheless, it has to be stressed the effect of membrane filtration that contributed to retain inside
the bioreactor the particulate COD as well as the portion of the soluble COD characterized by
average size higher than membrane porosity (0.03 m). The achieved results confirmed the
robustness of MBR systems towards organic carbon removal.
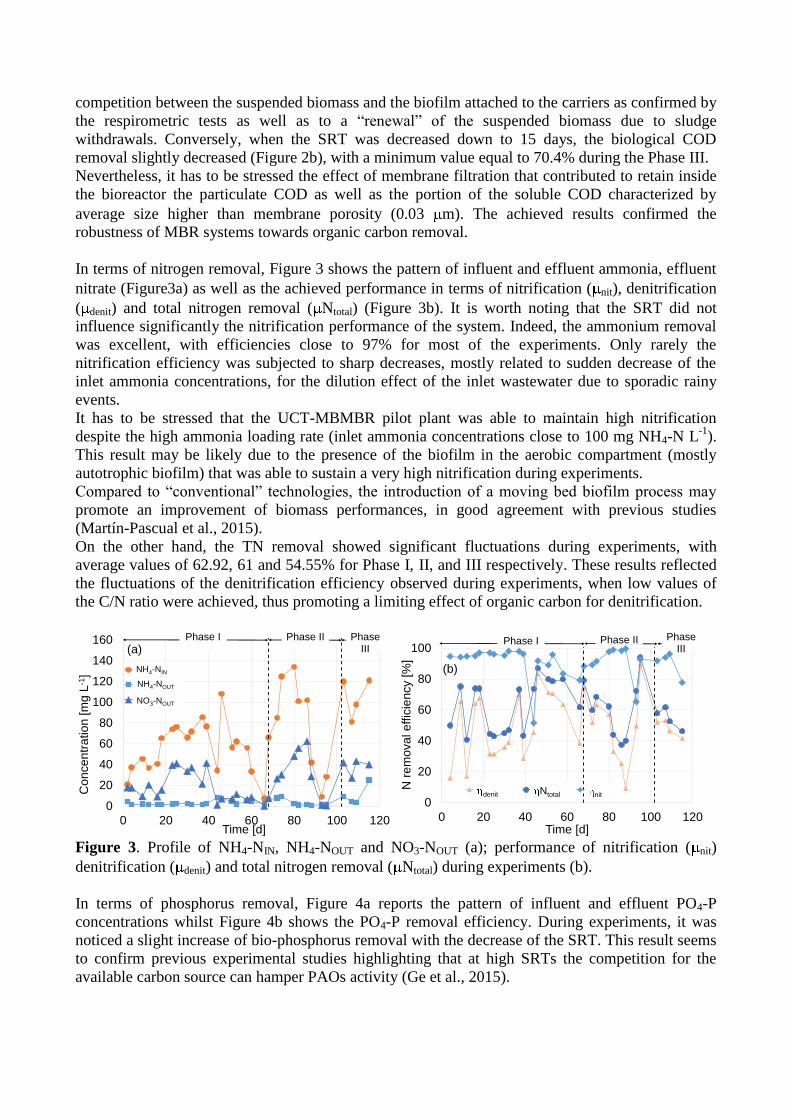
In terms of nitrogen removal, Figure 3 shows the pattern of influent and effluent ammonia, effluent
nitrate (Figure3a) as well as the achieved performance in terms of nitrification ( nit), denitrification
( denit) and total nitrogen removal ( Ntotal) (Figure 3b). It is worth noting that the SRT did not
influence significantly the nitrification performance of the system. Indeed, the ammonium removal
was excellent, with efficiencies close to 97% for most of the experiments. Only rarely the
nitrification efficiency was subjected to sharp decreases, mostly related to sudden decrease of the
inlet ammonia concentrations, for the dilution effect of the inlet wastewater due to sporadic rainy
events.
It has to be stressed that the UCT-MBMBR pilot plant was able to maintain high nitrification
despite the high ammonia loading rate (inlet ammonia concentrations close to 100 mg NH4-N L-1
).
This result may be likely due to the presence of the biofilm in the aerobic compartment (mostly
autotrophic biofilm) that was able to sustain a very high nitrification during experiments.
Compared to “conventional” technologies, the introduction of a moving bed biofilm process may
promote an improvement of biomass performances, in good agreement with previous studies
(Martín-Pascual et al., 2015).
On the other hand, the TN removal showed significant fluctuations during experiments, with
average values of 62.92, 61 and 54.55% for Phase I, II, and III respectively. These results reflected
the fluctuations of the denitrification efficiency observed during experiments, when low values of
the C/N ratio were achieved, thus promoting a limiting effect of organic carbon for denitrification.
0
20
40
60
80
100
120
140
160
0 20 40 60 80 100 120
Co
nce
ntr
atio
n [m
g L
-1]
Time [d]
NH4_IN
NHout
No3_out
NH4-NIN
NH4-NOUT
NO3-NOUT
(a)Phase I Phase II Phase
III
0
20
40
60
80
100
0 20 40 60 80 100 120
N r
em
ova
l e
ffic
ien
cy [%
]
Time [d]
hdenitr [%] htotale[%] hnitr [%]denit Ntotal nit
(b)
Phase I Phase II Phase III
Figure 3. Profile of NH4-NIN, NH4-NOUT and NO3-NOUT (a); performance of nitrification ( nit)
denitrification ( denit) and total nitrogen removal ( Ntotal) during experiments (b).
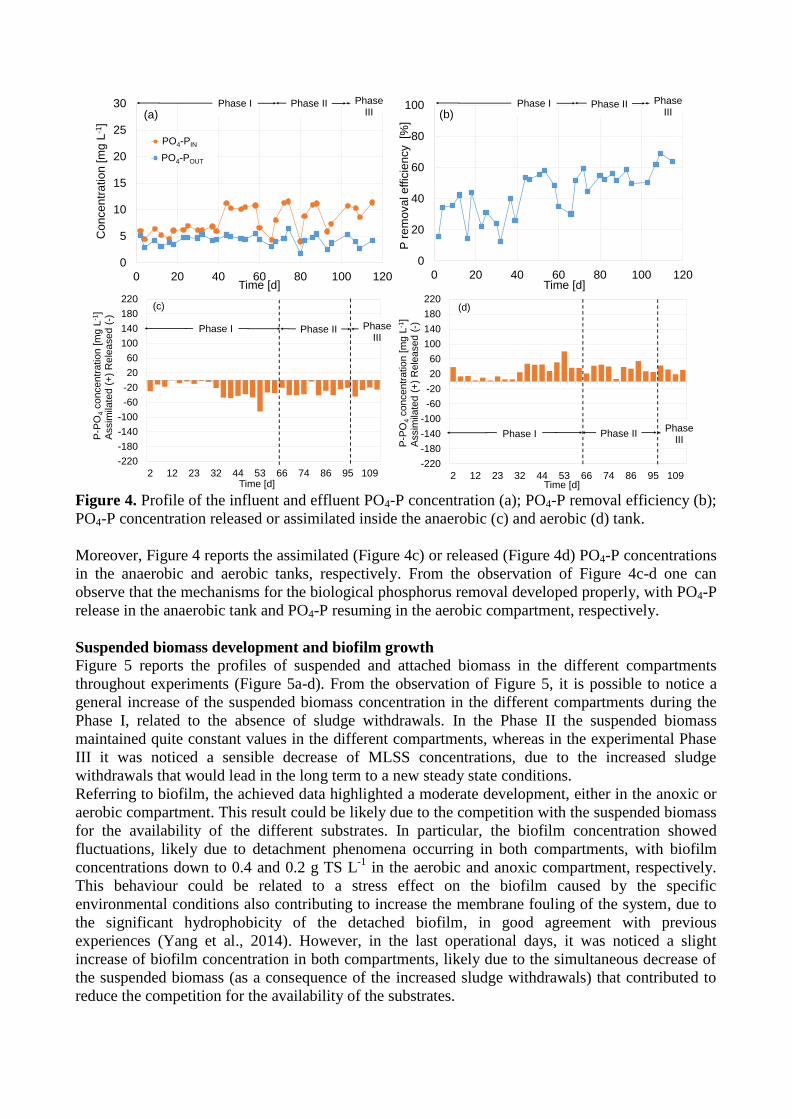
In terms of phosphorus removal, Figure 4a reports the pattern of influent and effluent PO4-P
concentrations whilst Figure 4b shows the PO4-P removal efficiency. During experiments, it was
noticed a slight increase of bio-phosphorus removal with the decrease of the SRT. This result seems
to confirm previous experimental studies highlighting that at high SRTs the competition for the
available carbon source can hamper PAOs activity (Ge et al., 2015).
0
5
10
15
20
25
30
0 20 40 60 80 100 120
Co
nce
ntr
atio
n [m
g L
-1]
Time [d]
PO4_IN
PO4_out
PO4-PIN
PO4-POUT
(a)Phase I Phase II Phase
III
0
20
40
60
80
100
0 20 40 60 80 100 120
P r
em
ova
l e
ffic
ien
cy [%
]
Time [d]
tot(b)
Phase I Phase II Phase III
-220
-180
-140
-100
-60
-20
20
60
100
140
180
220
2 12 23 32 44 53 66 74 86 95 109
P-P
O4
co
ncen
tra
tion
[m
g L
-1]
Assim
ilate
d (
+)
Rele
ase
d (
-)
Time [d]
(c)
Phase I Phase II Phase III
-220
-180
-140
-100
-60
-20
20
60
100
140
180
220
2 12 23 32 44 53 66 74 86 95 109
P-P
O4
co
ncen
tra
tion
[m
g L
-1]
A
ssim
ilate
d (
+)
Rele
ase
d (
-)
Time [d]
(d)
Phase I Phase II Phase
III
Figure 4. Profile of the influent and effluent PO4-P concentration (a); PO4-P removal efficiency (b);
PO4-P concentration released or assimilated inside the anaerobic (c) and aerobic (d) tank.
Moreover, Figure 4 reports the assimilated (Figure 4c) or released (Figure 4d) PO4-P concentrations
in the anaerobic and aerobic tanks, respectively. From the observation of Figure 4c-d one can
observe that the mechanisms for the biological phosphorus removal developed properly, with PO4-P
release in the anaerobic tank and PO4-P resuming in the aerobic compartment, respectively.
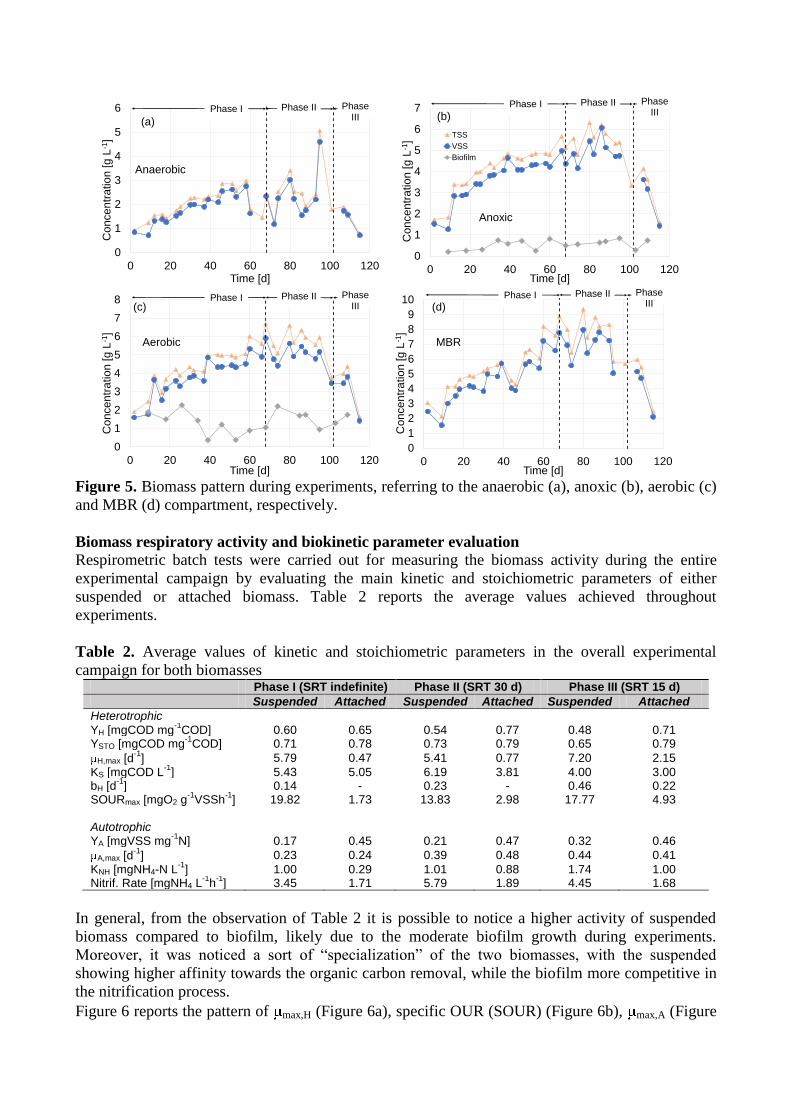
Suspended biomass development and biofilm growth
Figure 5 reports the profiles of suspended and attached biomass in the different compartments
throughout experiments (Figure 5a-d). From the observation of Figure 5, it is possible to notice a
general increase of the suspended biomass concentration in the different compartments during the
Phase I, related to the absence of sludge withdrawals. In the Phase II the suspended biomass
maintained quite constant values in the different compartments, whereas in the experimental Phase
III it was noticed a sensible decrease of MLSS concentrations, due to the increased sludge
withdrawals that would lead in the long term to a new steady state conditions.
Referring to biofilm, the achieved data highlighted a moderate development, either in the anoxic or
aerobic compartment. This result could be likely due to the competition with the suspended biomass
for the availability of the different substrates. In particular, the biofilm concentration showed
fluctuations, likely due to detachment phenomena occurring in both compartments, with biofilm
concentrations down to 0.4 and 0.2 g TS L-1
in the aerobic and anoxic compartment, respectively.
This behaviour could be related to a stress effect on the biofilm caused by the specific
environmental conditions also contributing to increase the membrane fouling of the system, due to
the significant hydrophobicity of the detached biofilm, in good agreement with previous
experiences (Yang et al., 2014). However, in the last operational days, it was noticed a slight
increase of biofilm concentration in both compartments, likely due to the simultaneous decrease of
the suspended biomass (as a consequence of the increased sludge withdrawals) that contributed to
reduce the competition for the availability of the substrates.
0
1
2
3
4
5
6
0 20 40 60 80 100 120
Co
nce
ntr
atio
n [g
L-1
]
Time [d]
(a)
Phase I Phase II Phase III
0
1
2
3
4
5
6
7
0 20 40 60 80 100 120
Co
nce
ntr
atio
n [g
L-1
]
Time [d]
TSS
VSS
Biofilm
(b)Phase I Phase II Phase
III
0
1
2
3
4
5
6
7
8
0 20 40 60 80 100 120
Co
nce
ntr
atio
n [g
L-1
]
Time [d]
(c)Phase I Phase II Phase
III
0
1
2
3
4
5
6
7
8
9
10
0 20 40 60 80 100 120
Co
nce
ntr
atio
n [g
L-1
]
Time [d]
(d)Phase I Phase II Phase
III
Anaerobic
Anoxic
Aerobic MBR
Figure 5. Biomass pattern during experiments, referring to the anaerobic (a), anoxic (b), aerobic (c)
and MBR (d) compartment, respectively.
Biomass respiratory activity and biokinetic parameter evaluation
Respirometric batch tests were carried out for measuring the biomass activity during the entire
experimental campaign by evaluating the main kinetic and stoichiometric parameters of either
suspended or attached biomass. Table 2 reports the average values achieved throughout
experiments.
Table 2. Average values of kinetic and stoichiometric parameters in the overall experimental
campaign for both biomasses Phase I (SRT indefinite) Phase II (SRT 30 d) Phase III (SRT 15 d)
Suspended Attached Suspended Attached Suspended Attached
Heterotrophic YH [mgCOD mg
-1COD] 0.60 0.65 0.54 0.77 0.48 0.71
YSTO [mgCOD mg-1
COD] 0.71 0.78 0.73 0.79 0.65 0.79
H,max [d-1
] 5.79 0.47 5.41 0.77 7.20 2.15
KS [mgCOD L-1
] 5.43 5.05 6.19 3.81 4.00 3.00 bH [d
-1] 0.14 - 0.23 - 0.46 0.22
SOURmax [mgO2 g-1
VSSh-1
] 19.82 1.73 13.83 2.98 17.77 4.93 Autotrophic YA [mgVSS mg
-1N] 0.17 0.45 0.21 0.47 0.32 0.46
A,max [d-1
] 0.23 0.24 0.39 0.48 0.44 0.41
KNH [mgNH4-N L-1
] 1.00 0.29 1.01 0.88 1.74 1.00 Nitrif. Rate [mgNH4 L
-1h
-1] 3.45 1.71 5.79 1.89 4.45 1.68
In general, from the observation of Table 2 it is possible to notice a higher activity of suspended
biomass compared to biofilm, likely due to the moderate biofilm growth during experiments.
Moreover, it was noticed a sort of “specialization” of the two biomasses, with the suspended
showing higher affinity towards the organic carbon removal, while the biofilm more competitive in
the nitrification process.
Figure 6 reports the pattern of max,H (Figure 6a), specific OUR (SOUR) (Figure 6b), max,A (Figure

6c) and nitrification rates (Figure 6d) for both suspended and attached biomass during experiments.
0
2
4
6
8
10
0 20 40 60 80 100 120 140
ma
x,H
[d-1
]
Time [d]
Suspended Biomass
Biofilm
Phase I Phase II Phase III
0
5
10
15
20
25
0 20 40 60 80 100 120 140
SO
UR
[m
gO
2g
-1V
SS
h-1
]
Time [d]
Suspended Biomass
Biofilm
Phase I Phase II Phase III
0
0.15
0.3
0.45
0.6
0 20 40 60 80 100 120 140
ma
x,A
[d-1
]
Time [d]
Suspended Biomass
Biofilm
Phase I Phase II Phase III
(a) (b)
(c) (d)
0
2
4
6
8
0 20 40 60 80 100 120 140
Nitri
fi.
rate
[m
gN
H4-N
L-1
h-1
]
Time [d]
Suspended Biomass
Biofilm
Phase I Phase II Phase III
Figure 6. Pattern of maximum heterotrophic growth (a), specific OUR (b), maximum autotrophic
growth (c) and nitrification rate (d) throughout experiments
It was noticed a significant influence of the MLSS SRT on the activity of the heterotrophic species.
As noticeable from Figure 6a, the maximum growth rate of the suspended biomass showed a slight
decrease in the Phase I, characterized by no sludge withdrawals (indefinite SRT). Conversely, it
was observed a significant increase of max,H in the Phases II and III, when the SRT was reduced at
30 and 15 days, with a maximum value equal to 7.2 d-1
reached at SRT=15. Indeed, when the UCT-
MBMBR pilot plant was operated without sludge withdrawals a sort of suspended biomass
“ageing” occurred, while the sludge withdrawals promoted a “renewal” of biomass, thus increasing
its growth rate. Indeed, it was observed an increase of the NUR values of the suspended biomass
from 3.79 to 7.13 mgNO3-N g-1
VSS h-1
in the Phases I and II, respectively.
On the other hand, the maximum growth rate for the biofilm assumed much lower values compared
to the suspended biomass. This result can be likely related to the aforementioned specialization of
the two biomasses as well as to detachment biofilm phenomena occurring inside the bioreactor.
The respirometric batch tests carried out on nitrifying species revealed that the autotrophic activity
was more pronounced in the attached biomass, thus confirming the “specialization” of the two
biomasses (suspended and attached) within a hybrid configuration, with the biofilm more affine
towards the nitrification of the influent ammonia loading rate. Nevertheless, also the suspended
biomass of the UCT-MBMBR pilot plant showed good nitrification activity, thus suggesting the
occurrence of the “seeding” effect of nitrifiers from the biofilm to the mixed liquor, as highlighted
in previous experiences (Di Trapani et al., 2013). This result seems to be strengthened by an
interesting aspect that was observed during experiments (Figure 6c-d). Indeed, the maximum
growth rate of the suspended biomass showed an increasing trend when decreasing the MLSS SRT

from indefinite (no sludge withdrawals) to 30 and 15 days, respectively (Figure 6c). This result,
apparently surprising for a pure activated sludge reactor working under the same operational
conditions, is likely related to the aforementioned “seeding” effect due to the detached biofilm as
well as the simultaneous growth of the biofilm during experiments that was able to support
nitrification even in the mixed liquor. This result was confirmed by the increase of the AUR values
of the suspended biomass from 1.33 to 2.34 mg NH4-N g-1
VSS h-1
, in the Phases I and II,
respectively.
EPS production
Figure 7 reports the average values of specific EPS concentration (i.e., referred to MLSS
concentration) during experiments, expressed as carbohydrates and proteins in microbial flocs
(EPSBound) and dissolved in the bulk liquid (SMP). From the observation of Figure 7, it is possible
to appreciate that SMP were significantly lower compared to EPSBound, excepting some
experimental days, at the beginning of the Phase I and during the Phase III. On the other hand, the
protein fraction of EPSBound was predominant and showed a general decrease from Phase I to Phase
II, while it increased again during the Phase III. The observed values were higher compared to what
achieved in previous experiences with UCT-MBR systems (Cosenza et al., 2013). This result could
be likely due to biofilm detachment that might have promoted the increase of the mixed liquor
hydrophobicity, contributing to worsen the membrane filtration properties compromising the
filtration properties of the cake layer, as better outlined in the following section.
0
100
200
300
400
EP
S [
mg g
TS
S-1
]
0
50
100
150
200
250
300
350
EP
S [
mg
gT
SS
-1]
0
50
100
150
200
250
300
350
EP
S [
mg
gT
SS
-1]
0
100
200
300
400
500
600
EP
S [
mg
gT
SS
-1]
Phase I
SRT = ∞
Phase II
SRT = 30 dPhase III
SRT = 15 d
(a1) (a2) (a3)
(b1) (b2) (b3)
(c1) (c2) (c3)
(d1) (d2) (d3)
EPSP
EPSC
SMPP
SMPC
Phase II
SRT = 30 dPhase III
SRT = 15 dPhase I
SRT = ∞
Anaerobic
Anoxic
Aerobic
MBR
Figure 7. Average values of specific EPSBound and SMP inside the anaerobic (a1-a3), anoxic (b1-
b3), aerobic (c1-c3) and MBR (d1-d3) compartment, respectively.
Sludge dewaterability
The achieved results highlighted that the UCT-MBMBR pilot plant showed a good sludge
dewaterability. The CST values were almost constant and slightly affected by the MLSS
concentration, with average values of 15.27, 17.27, 15.07 and 18.93 s for the anaerobic, anoxic,
aerobic and MBR compartment, respectively.
Furthermore, also the low SRF values confirmed the good sludge filtration properties, with average
values for the different compartment close to 4 1012
m kg-1
, significantly lower compared to what
obtained by the same authors in previous experiences, when treating saline wastewater
contaminated by hydrocarbons (Mannina et al., 2016). Moreover, the activated sludge filterability
was mostly influenced by the specific EPSBound concentration (i.e., referred to MLSS concentration).
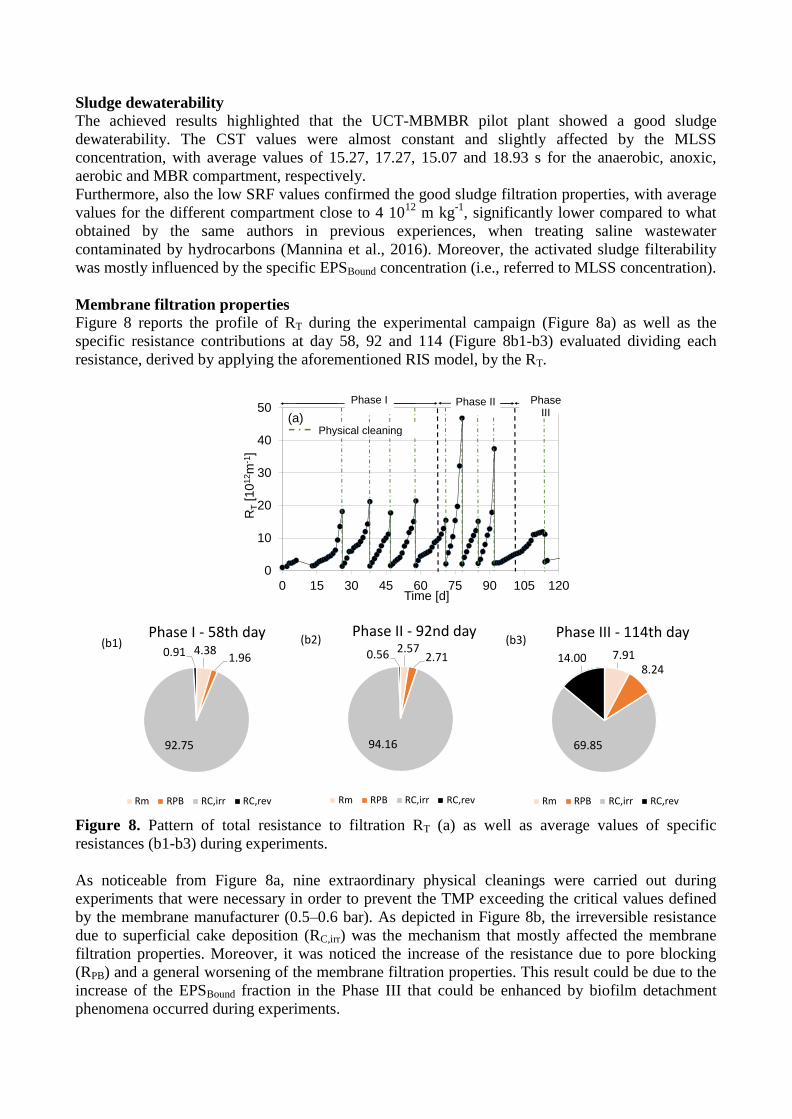
Membrane filtration properties
Figure 8 reports the profile of RT during the experimental campaign (Figure 8a) as well as the
specific resistance contributions at day 58, 92 and 114 (Figure 8b1-b3) evaluated dividing each
resistance, derived by applying the aforementioned RIS model, by the RT.
4.381.96
92.75
0.91
Phase I - 58th day
Rm RPB RC,irr RC,rev
(b1) 2.572.71
94.16
0.56
Phase II - 92nd day
Rm RPB RC,irr RC,rev
(b2)7.91
8.24
69.85
14.00
Phase III - 114th day
Rm RPB RC,irr RC,rev
(b3)
0
10
20
30
40
50
0 15 30 45 60 75 90 105 120
RT
[10
12m
-1]
Time [d]
Physical cleaning(a)
Phase I Phase II Phase III
Figure 8. Pattern of total resistance to filtration RT (a) as well as average values of specific
resistances (b1-b3) during experiments.
As noticeable from Figure 8a, nine extraordinary physical cleanings were carried out during
experiments that were necessary in order to prevent the TMP exceeding the critical values defined
by the membrane manufacturer (0.5–0.6 bar). As depicted in Figure 8b, the irreversible resistance
due to superficial cake deposition (RC,irr) was the mechanism that mostly affected the membrane
filtration properties. Moreover, it was noticed the increase of the resistance due to pore blocking
(RPB) and a general worsening of the membrane filtration properties. This result could be due to the
increase of the EPSBound fraction in the Phase III that could be enhanced by biofilm detachment
phenomena occurred during experiments.

CONCLUSIONS
The current study explored the influence of SRT in a UCT-MB-MBR pilot plant fed with a mixture
of synthetic and real domestic wastewater. In the light of the results obtained during experiments,
the following conclusions can be drawn:
- the UCT-MBMBR pilot plant provided very high total COD removal efficiencies
throughout experiments: therefore, the SRT did not produce a significant effect, despite a
slight reduction in the biological COD removal was observed;
- the nitrification efficiency was maintained even for the lowest SRT, thanks to the presence
of the attached biomass, naturally characterized by high retention times. Moreover, thanks to
the “seeding” effect of nitrifiers from the biofilm to the mixed liquor, the suspended biomass
showed good nitrification ability;
- the reduction of the SRT suggested an increase of the PAOs activity, since the competition
for the carbon source availability was reduced, increasing the biological phosphorus removal
of the system, while maintaining high nitrification efficiency.
- the respirometric batch tests highlighted a sort of specialization of the two biomasses, with
the suspended one more affine towards the carbon removal, whilst the biofilm towards the
ammonia oxidation.
In view of the achieved results, the hybrid MB-MBR system highlight higher potentiality and
process flexibility for nutrients biological removal, since it is possible to operate the system at lower
SRTs, while maintaining high performance. Moreover, thanks to the biofilm, it is possible to
operate the system at lower MLSS concentrations, thus enhancing the reduction of energy demand
as well as fouling mitigation.
ACNOWLEDGEMENTS
This work forms part of a research project supported by grant of the Italian Ministry of Education,
University and Research (MIUR) through the Research project of national interest PRIN2012 (D.M.
28 dicembre 2012 n. 957/Ric − Prot. 2012PTZAMC) entitled “Energy consumption and
GreenHouse Gas (GHG) emissions in the wastewater treatment plants: a decision support system
for planning and management − http://ghgfromwwtp.unipa.it” in which the first author of this paper
is the Principal Investigator.
REFERENCES
APHA, 2005. Standard Methods for the Examination of Water and Wastewater. APHA, AWWA
and WPCF, Washington DC, USA.
Chu, L., Wang, J., 2011. Comparison of polyurethane foam and biodegradable polymer as carriers
in moving bed biofilm reactor for treating wastewater with a low C/N ratio. Chemosph. 83, 63–68.
Cosenza, A., Di Bella, G., Mannina, G., Torregrossa, 2013. The role of EPS in fouling and foaming
phenomena for a membrane bioreactor. Bioresour. Technol. 147, 184–192.
Di Trapani, D., Christensson, M., Torregrossa, M., Viviani, G., Ødegaard, H., 2013. Performance of
a hybrid activated sludge/biofilm process for wastewater treatment in a cold climate region:
influence of operating conditions. Biochem. Eng. J. 77, 214–219.
Di Trapani, D., Di Bella, G., Mannina, G., Torregrossa, M., Viviani, G., 2014. Comparison between
moving bed-membrane bioreactor (MB-MBR) and membrane bioreactor (MBR) systems: Influence
of wastewater salinity variation. Bioresour. Technol. 162, 60–69.
Di Trapani, D., Di Bella, G., Mannina, G., Torregrossa, M., Viviani, G., 2015. Effect of C/N shock
variation on the performances of a moving bed membrane bioreactor. Bioresour. Technol. 189,
250–257
DuBois, M., Gilles, K.A., Hamilton, J.K., Rebers, P.A., Smith, F., 1956. Colorimetric method for
determination of sugars and related substances. Anal. Chem. 28, 350–356.
EN 14701-1. European Standard. Characterization of sludges - Filtration properties – Part 1:
Capillary Suction Time (CST). European Committee for Standardization. March 2006.
EN 14701-2. European Standard. Characterization of sludges - Filtration properties – Part 2:
Determination of the specific resistance to filtration. European Committee for Standardization.
March 2006.
Ekama, G.A., Siebritz, I.P., Marais, G.R., 1983. Considerations in the process design of nutrient
removal activated sludge processes. Wat. Sci. Tech. 15 (3-4), 283 – 318.
Fu, Z., Yang, F., Zhou, F., Xue, Y., 2009. Control of COD/N ratio for nutrient removal in a
modified membrane bioreactor (MBR) treating high strength wastewater. Bioresour. Technol. 100,
136–141.
Ge, H., Batstone, D.J., Keller, J., 2015. Biological phosphorus removal from abattoir wastewater at
very short sludge ages mediated by novel PAO clade Comamonadaceae. Water Res. 69, 173-182.
Hauduc, H., Rieger, L., Ohtsuki, T., Shaw, A., Takács, I., Winkler, S., Héduit, A., Vanrolleghem,
P.-A., Gillot, S., 2011. Activated sludge modelling: development and potential use of a practical
applications database. Water Sci. Technol. 63, 2164–2182.
Hu, X., Xie, L., Shim, H., Zhang, S. and Yang, D. 2014. Biological Nutrient Removal in a Full
Scale Anoxic/Anaerobic/Aerobic/ Pre-anoxic-MBR Plant for Low C/N Ratio Municipal
Wastewater Treatment. Chinese J. Chem. Eng., 22(4) 447—454.
Ivanovic, I., and Leiknes, T. 2008. Impact of aeration rates on particle colloidal fraction in the
biofilm membrane bioreactor (BF-MBR). Desalin. 231(1–3), 182–190.
Jenkins, D., Richard, M.G., Daigger, G.T., 2003. Manual on the Causes and Control of Activated
Sludge Bulking, Foaming and Other Solids Separation Problems. IWA Publishing, London.
Judd, S.J., Judd, C., 2010. Principles and Applications of Membrane Bioreactors in Water and
Wastewater Treatment, second ed. Elsevier, London, UK.
Kermani, M., Bina, B., Movahedian, H., Ami, M.M., Nikaein, M., 2008. Application of moving bed
biofilm process for biological organics and nutrients removal from municipal wastewater. Am J.
Environ. Sci. 4(6), 675–682.
Kristensen, G.H., Jørgensen, P.E., Henze, M., 1992. Characterization of functional microorganism
groups and substrate in activated sludge and wastewater by AUR, NUR and OUR. Water Sci.
Technol. 25, 43–57.
Leiknes, T. Ødegaard H. 2007. The development of a biofilm membrane bioreactor, Desalin., 202
(2007), 135–143.
Leyva-Díaz, J.C., Calderón, K., Rodríguez, F.A., González-López, J., Hontoria, E., Poyatos, J.M.,
2013. Comparative kinetic study between moving bed biofilm reactor-membrane bioreactor and
membrane bioreactor systems and their influence on organic matter and nutrients removal.
Biochem. Eng. J. 77, 28–40.
Li, C., Wang, T., Zheng, N., Zhang, J., Ngo, H.H., Guo, W., Liang, S. 2013. Influence of organic
shock loads on the production of N2O in denitrifying phosphorus removal process. Bioresour.
Technol. 141, 160–166.
Lowry, O.H., Rosebrough, N.J., Farr, A.L., Randall, R.J., 1951. Protein measurement with the Folin
phenol reagent. J. Biol. Chem. 193, 265–275.
Lu, Q., Wu, H., Li, H., Yang, D., 2015. Enhanced biological nutrient removal in modified carbon
source division anaerobic anoxic oxic process with return activated sludge preconcentration.
Chinese J. Chem. Eng. 23, 1027–1034.
Majone, M., Dircks, K., Beun, J.J., 1999. Aerobic storage under dynamic conditions in activated
sludge processes. The state of the art. Water Sci. Technol. 39, 61–73.
Mannina, G., Cosenza, A. Di Trapani, D., Capodici, M., Viviani, G. 2016. Membrane bioreactors
for treatment of saline wastewater contaminated by hydrocarbons (diesel fuel): An experimental
pilot plant case study, Chem. Eng. J., 291(1), 269–278.
Martín-Pascual, J., Reboleiro-Rivas, P., López- López, C., Leyva-Díaz, J.C., Jover, M., Muño,
M.M., González-López, J., Poyatos, J.M., 2015. Effect of the Filling Ratio, MLSS, Hydraulic

Retention Time, and Temperature on the behavior of the Hybrid Moving Bed Membrane Bioreactor
plant to treat urban wastewater. J. Env. Eng. (ASCE) 141(7).
Naessens, W., Maere, T., Nopens, I., 2012. Critical review of membrane bioreactor models – Part 1:
biokinetic and filtration models. Bioresour. Technol. 122, 95–106.
Ødegaard, H., 2006. Innovations in wastewater treatment: the moving bed biofilm process. Water
Sci. Technol. 53, 17–33.
Peng, G., Ye, F., Li, Y., 2011. Comparative investigation of parameters for determining the
dewaterability of activated sludge. Water Environ. Res. 83(7), 667-671.
Poyatos, J. M., Molina-Muñoz, M. A., Delgado, F., González-López, J. and Hontoria, E. 2008. Flux
influence on membrane fouling in a membrane bioreactor system under real conditions with urban
wastewater. J. Environ. Sci. Health A., 43(14), 1685–1691.
Stephenson, T., Judd, S.J., Jefferson, B., Brindle, K., 2000. Membrane Bioreactors for Wastewater
Treatment. IWA Publishing, London, UK.
Veselind P.A., 1988. Capillary suction time as a fundamental measure of sludge dewaterability. J.
Water Pollut. Control Fed. 60, 215-220.
Wang, X.J., Xia, S.Q., Chen, L., Zhao, J.F., Renault, N.J., Chovelon, J.M., 2006. Nutrients removal
from municipal wastewater by chemical precipitation in a moving bed biofilm reactor, Process
Biochem. 41(4), 824–828.
Wanner, J., Cech, J.S., Kos, M., 1992. New process design for biological nutrient removal, Water
Sci. Technol. 25(4-5), 445–448.
Wanner, J. 2002. Control of filamentous bulking in activated sludge. In: Encyclopedia of
Environmental Microbiology, Bitton G Ed., 1306-1315. John Wiley & Sons Inc. New York USA.
Yang, S., Yang, F., Fu, Z., Wang, T., Lei, R. 2010. Simultaneous nitrogen and phosphorus removal
by a novel sequencing batch moving bed membrane bioreactor for wastewater treatment. J. Hazard.
Mat. 175 551–557.
Yang, W., Syed, W., Zhou, H., 2014. Comparative study on membrane fouling between membrane-
coupled moving bed biofilm reactor and conventional membrane bioreactor for municipal
wastewater treatment. Water Sci. Technol. 69, 1021–1027.