Portafoglio: Il Mio Portafoglio Data: 31 ottobre...
15
Data: 31 ottobre 2013 Portafoglio: Il Mio Portafoglio
Transcript of Portafoglio: Il Mio Portafoglio Data: 31 ottobre...

Data: 31 ottobre 2013Portafoglio: Il Mio Portafoglio

Performance Generale | Il Mio Portafoglio | ottobre 2013
Il Mio PortafoglioIndice di riferimento Rendimento portafoglio (%) Rendimento indice (%) Mese di riferimento
Azionari Italia 5.13 10.36 ott 2013
Rendimento
Crescita di 10000 EUR Portafoglio Benchmark
5
10
15
20
25
Rendimenti trimestrali rispetto al Benchmark
2004 2005 2006 2007 2008 2009 2010 2011 2012 2013
1 Mese 3 Mesi 6 Mesi YTD 1 Anno 3 Anni 5 Anni 10 Anni Da AcquistoRendimento portafoglio (%) 5.13 4.79 7.23 4.55 3.60 19.17 - - 21.57Azionari Italia (%) 10.36 16.69 19.02 27.73 32.65 3.99 5.61 2.08 7.08
Valuta EURBilancio corrente 37183.15
I migliori 5
Nome MorningstarRating™
MorningstarAnalyst Rating™
Valore diMercato
1 Mese (%) Peso (%)
Allianz Azioni Italia All Stars QQQQ ‰ 93,16 11,20 0,25Apple Inc QQQ - 7867,01 9,17 21,16Volkswagen AG QQQ - 7510,00 7,66 20,20Fidelity Funds - Italy Fund A-EUR QQQQQ „ 623,20 5,68 1,68ING (L) Invest US High Dividend X USD Acc QQQ ‰ 5717,22 4,12 15,38
I peggiori 5
Non ci sono performance negative nel tuo portafoglio
Scenari ipotetici fino a 30 anni
0
200,000
400,000
600,000
800,000
Anni: 5 10 15 20 25 3075% Probabilità 47551.16 67004.08 95933.88 138493.81 200993.18 292793.1
50% Probabilità 56114.26 84683.81 127799.02 192865.55 291059.51 439247.13
25% Probabilità 66219.43 107028.53 170248.4 268583.28 421485.14 658956.91
In questa sezione forniamo unaprevisione ipotetica sulle performancefuture del portafoglio, evidenziando leprobabilità associate al raggiungimentodei valori rappresentati.
© 2013 Morningstar. Tutti i diritti riservati. Le informazioni, i dati, le analisi e le opinioni (“Informazioni”) contenuti nel presente documento: (1) comprendono informazioni di proprietà di Morningstar e dei suoi licenziatari; (2) non possono esserecopiate o diffuse se non con autorizzazione; (3) non costituiscono consigli all’investimento; (4) sono fornite unicamente a scopi informativi; (5) non sono garantite per quanto riguarda la loro completezza, accuratezza o tempestività; e (6) possonoessere estratte da dati relativi ai fondi pubblicati in date diverse. Morningstar non è responsabile per alcuna decisione commerciale, danni o altre perdite associate alle Informazioni o al loro utilizzo. Si raccomanda di verificare tutte le Informazioniprima di utilizzarle e di non prendere decisioni d’investimento prima di consultare un consulente finanziario qualificato. I risultati realizzati in passato non garantiscono quelli futuri. Il valore e il reddito generato da investimenti possono aumentareo diminuire.
ß®

Portafoglio Raggi-X | Il Mio Portafoglio | ottobre 2013
Asset Allocation Stile Investimento
Port. (%)
Azioni 66.41 Obbligazioni 30.61 Liquidità 2.57 Altro 0.41 Non Classificato 0.00
Stile Azionario
11 70 8
5 2 1
1 1 0
Value Blend Growth
LargeM
idSm
all
0-10 10-2525-50>50
Stile Reddito Fisso
0 0 0
0 28 0
36 0 36
Short Interm Long
High
Med
Low
0-10 10-2525-50>50
Lo Stile di Investimento identifica ilposizionamento in termini percentualidella componente azionaria eobbligazionaria all’interno della matrice3x3, nota come Style Box.
Settori Azionari Aree Geografiche
Port. (%)h Ciclico 41.32r Materie Prime 1.97t Beni di Consumo Ciclici 32.70y Finanza 6.38u Immobiliare 0.27
j Sensibile 42.45i Telecomunicazioni 2.73o Energia 1.71p Beni Industriali 1.01a Tecnologia 37.00
j Difensivo 9.59i Beni Difensivi 5.05o Salute 2.69p Servizi di Pubblica Utilità 1.85
Non Classificato 6.64
Port. (%)Europa 40.57Regno Unito 1.14Europa Occid - Euro 38.63Europa Occid - Non Euro 0.69Europa dell'est 0.08Medio Oriente / Africa 0.03
America 51.92Stati Uniti 48.40Canada 3.39America Centrale & Latina 0.13
Asia 0.89Giappone 0.02Australasia 0.01Asia 4 Tigri 0.41Asia Emerg. Ex 4 Tigri 0.45
Non Classificato 6.62
Profilo Rischio/Rendimento Matrice di Correlazione
Titoli Sottostanti Portafoglio Benchmark Rend.medio 3a
Deviazione Standard a 3 Anni
-20.00-10.00 0.00 10.00 20.00 30.00 40.00 50.00 60.00 70.00-40.00
-20.00
0.00
20.00
40.00
60.00
12
345 6789
10
1 2 3 4 5 6 7 8 9 10
1 1.00
2 0.93 1.00
3 0.04 0.08 1.00
4 0.52 0.55 0.01 1.00
5 -0.01 0.02 0.30 0.12 1.00
6 0.46 0.53 0.14 0.41 0.04 1.00
7 0.55 0.60 0.43 0.41 0.27 0.49 1.00
8 -0.29 -0.31 0.37 -0.21 0.42 -0.09 0.20 1.00
9 0.60 0.70 0.36 0.57 0.33 0.51 0.77 0.17 1.00
10 0.08 0.08 0.63 0.15 0.40 0.32 0.63 0.71 0.50 1.00
1.00 a 0.60 0.60 a 0.20 0.20 a -0.20 -0.20 a -0.60 -0.60 a -1.00
Misure di rischio dei primi 10 titoli in portafoglioNome Tipo Data port. titolo Dev Std Media Peso (%)
1 Apple Inc Azione 7 ott 2013 27,43 23,88 21,16
2 Volkswagen AG Azione 22 nov 2013 30,02 27,83 20,20
3 ING (L) Invest US High Dividend X USD Acc Fondo 31 ago 2013 9,55 11,83 15,38
4 M&G Optimal Income Fund Euro Class A-H Gross Share Fondo 31 ago 2013 5,41 7,48 9,46
5 Amundi Funds Bond Europe ME-C Class Fondo 31 ago 2013 6,12 4,77 6,93
6 iShares J.P. Morgan $ Emerging Markets Bond UCITS Fondo 31 ott 2013 9,41 1,79 6,44
7 DWS Concept DJE Alpha Renten Global LC Fondo 30 set 2013 5,10 4,42 4,41
8 BlackRock Global Funds - Euro Corporate bond E5 EU Fondo 31 ott 2013 4,47 4,67 3,09
9 Lemanik MC Dynamic Flex Cap. Inst. Eur Fondo 31 ott 2013 5,32 5,77 2,80
10 UniCredit SpA Rsp Azione 22 nov 2013 46,66 -22,93 2,74
Portafoglio - - 15.04 18.75 -Benchmark - - 20.63 6.02 -
Profilo Rischio/Rendimento mostra unoscatter plot del rischio/rendimento diciascun titolo nel corso degli ultimi 3anni. Il rischio è misurato dalladeviazione standard dei rendimentinell’ultimo triennio. Il graficorappresenta anche il profilo rischio/rendimento del portafoglio. La Matricedi Correlazione esamina quanto irendimenti degli investimenti presentiin portafoglio siano tra loro correlati,calcolando la correlazionestatistica tra irendimenti a 3 anni di ciascuna coppiadi titoli.
© 2013 Morningstar. Tutti i diritti riservati. Le informazioni, i dati, le analisi e le opinioni (“Informazioni”) contenuti nel presente documento: (1) comprendono informazioni di proprietà di Morningstar e dei suoi licenziatari; (2) non possono esserecopiate o diffuse se non con autorizzazione; (3) non costituiscono consigli all’investimento; (4) sono fornite unicamente a scopi informativi; (5) non sono garantite per quanto riguarda la loro completezza, accuratezza o tempestività; e (6) possonoessere estratte da dati relativi ai fondi pubblicati in date diverse. Morningstar non è responsabile per alcuna decisione commerciale, danni o altre perdite associate alle Informazioni o al loro utilizzo. Si raccomanda di verificare tutte le Informazioniprima di utilizzarle e di non prendere decisioni d’investimento prima di consultare un consulente finanziario qualificato. I risultati realizzati in passato non garantiscono quelli futuri. Il valore e il reddito generato da investimenti possono aumentareo diminuire.
ß®

Dettaglio Titoli | Il Mio Portafoglio | ottobre 2013
Dettaglio Titoli in Portafoglio
Nome Morningstar Rating™ Morningstar AnalystRating™
1 Mese(%)
3 Mesi(%)
1 Anno(%)
3 Anni ann.(%)
5 Anni ann.(%)
Peso(%)
Apple Inc QQQ - 9,17 13,56 -14,31 22,22 36,04 21,16Volkswagen AG QQQ - 7,66 5,46 22,19 26,27 -17,18 20,20ING (L) Invest US High Dividend X USD Acc QQQ ‰ 4,12 0,17 19,57 12,01 11,41 15,38M&G Optimal Income Fund Euro Class A-H Gross Share QQQQQ „ 1,73 1,80 7,89 7,59 13,48 9,46Amundi Funds Bond Europe ME-C Class QQQQQ - 2,14 2,64 5,55 4,69 8,41 6,93
iShares J.P. Morgan $ Emerging Markets Bond UCITS QQQ - 1,82 -0,36 -12,48 1,37 9,20 6,44DWS Concept DJE Alpha Renten Global LC QQQQ „ 1,29 1,42 7,69 4,38 6,80 4,41BlackRock Global Funds - Euro Corporate bond E5 EU QQ ´ 1,27 1,55 3,73 4,67 - 3,09Lemanik MC Dynamic Flex Cap. Inst. Eur QQQQ - 1,88 1,98 10,06 5,78 3,54 2,80UniCredit SpA Rsp - - 3,64 5,00 -12,25 -28,28 -20,56 2,74
Capital International Emerging Markets Total Oppor QQQQQ - 2,64 2,33 -1,29 3,83 11,40 2,62Fidelity Funds - Italy Fund A-EUR QQQQQ „ 5,68 16,73 26,89 5,00 3,45 1,68BancoPosta Mix 1 QQQQ - 1,00 1,47 3,80 4,24 4,72 1,46AXA World Funds Framlington Europe Small Cap A Cap QQQQ ´ 4,10 8,18 26,12 12,19 16,43 1,38Allianz Azioni Italia All Stars QQQQ ‰ 11,20 17,79 29,66 4,03 5,37 0,25
© 2013 Morningstar. Tutti i diritti riservati. Le informazioni, i dati, le analisi e le opinioni (“Informazioni”) contenuti nel presente documento: (1) comprendono informazioni di proprietà di Morningstar e dei suoi licenziatari; (2) non possono esserecopiate o diffuse se non con autorizzazione; (3) non costituiscono consigli all’investimento; (4) sono fornite unicamente a scopi informativi; (5) non sono garantite per quanto riguarda la loro completezza, accuratezza o tempestività; e (6) possonoessere estratte da dati relativi ai fondi pubblicati in date diverse. Morningstar non è responsabile per alcuna decisione commerciale, danni o altre perdite associate alle Informazioni o al loro utilizzo. Si raccomanda di verificare tutte le Informazioniprima di utilizzarle e di non prendere decisioni d’investimento prima di consultare un consulente finanziario qualificato. I risultati realizzati in passato non garantiscono quelli futuri. Il valore e il reddito generato da investimenti possono aumentareo diminuire.
ß®
Duplicazione Titoli | Il Mio Portafoglio | ottobre 2013
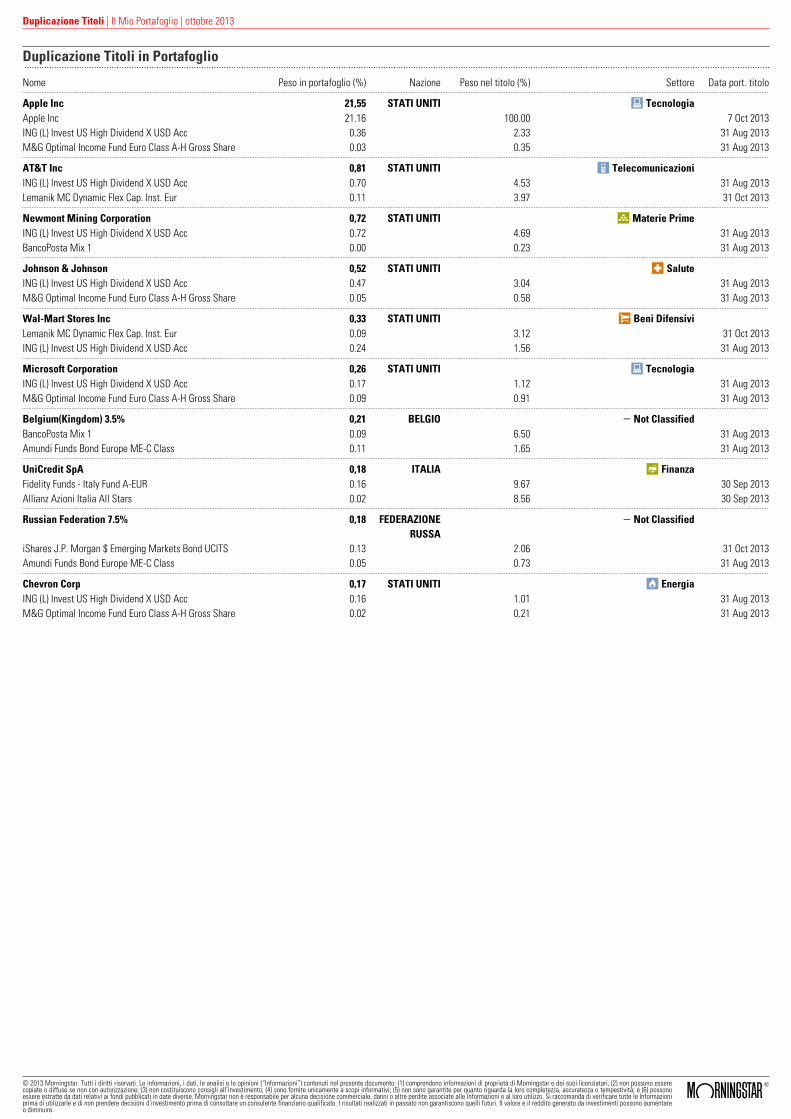
Duplicazione Titoli in Portafoglio
Nome Peso in portafoglio (%) Nazione Peso nel titolo (%) Settore Data port. titolo
Apple Inc 21,55 STATI UNITI a TecnologiaApple Inc 21.16 100.00 7 Oct 2013ING (L) Invest US High Dividend X USD Acc 0.36 2.33 31 Aug 2013M&G Optimal Income Fund Euro Class A-H Gross Share 0.03 0.35 31 Aug 2013
AT&T Inc 0,81 STATI UNITI i TelecomunicazioniING (L) Invest US High Dividend X USD Acc 0.70 4.53 31 Aug 2013Lemanik MC Dynamic Flex Cap. Inst. Eur 0.11 3.97 31 Oct 2013
Newmont Mining Corporation 0,72 STATI UNITI r Materie PrimeING (L) Invest US High Dividend X USD Acc 0.72 4.69 31 Aug 2013BancoPosta Mix 1 0.00 0.23 31 Aug 2013
Johnson & Johnson 0,52 STATI UNITI d SaluteING (L) Invest US High Dividend X USD Acc 0.47 3.04 31 Aug 2013M&G Optimal Income Fund Euro Class A-H Gross Share 0.05 0.58 31 Aug 2013
Wal-Mart Stores Inc 0,33 STATI UNITI s Beni DifensiviLemanik MC Dynamic Flex Cap. Inst. Eur 0.09 3.12 31 Oct 2013ING (L) Invest US High Dividend X USD Acc 0.24 1.56 31 Aug 2013
Microsoft Corporation 0,26 STATI UNITI a TecnologiaING (L) Invest US High Dividend X USD Acc 0.17 1.12 31 Aug 2013M&G Optimal Income Fund Euro Class A-H Gross Share 0.09 0.91 31 Aug 2013
Belgium(Kingdom) 3.5% 0,21 BELGIO - Not ClassifiedBancoPosta Mix 1 0.09 6.50 31 Aug 2013Amundi Funds Bond Europe ME-C Class 0.11 1.65 31 Aug 2013
UniCredit SpA 0,18 ITALIA y FinanzaFidelity Funds - Italy Fund A-EUR 0.16 9.67 30 Sep 2013Allianz Azioni Italia All Stars 0.02 8.56 30 Sep 2013
Russian Federation 7.5% 0,18 FEDERAZIONERUSSA
- Not Classified
iShares J.P. Morgan $ Emerging Markets Bond UCITS 0.13 2.06 31 Oct 2013Amundi Funds Bond Europe ME-C Class 0.05 0.73 31 Aug 2013
Chevron Corp 0,17 STATI UNITI o EnergiaING (L) Invest US High Dividend X USD Acc 0.16 1.01 31 Aug 2013M&G Optimal Income Fund Euro Class A-H Gross Share 0.02 0.21 31 Aug 2013
© 2013 Morningstar. Tutti i diritti riservati. Le informazioni, i dati, le analisi e le opinioni (“Informazioni”) contenuti nel presente documento: (1) comprendono informazioni di proprietà di Morningstar e dei suoi licenziatari; (2) non possono esserecopiate o diffuse se non con autorizzazione; (3) non costituiscono consigli all’investimento; (4) sono fornite unicamente a scopi informativi; (5) non sono garantite per quanto riguarda la loro completezza, accuratezza o tempestività; e (6) possonoessere estratte da dati relativi ai fondi pubblicati in date diverse. Morningstar non è responsabile per alcuna decisione commerciale, danni o altre perdite associate alle Informazioni o al loro utilizzo. Si raccomanda di verificare tutte le Informazioniprima di utilizzarle e di non prendere decisioni d’investimento prima di consultare un consulente finanziario qualificato. I risultati realizzati in passato non garantiscono quelli futuri. Il valore e il reddito generato da investimenti possono aumentareo diminuire.
ß®

Analysis Digest | Il Mio Portafoglio | ottobre 2013
ING (L) Invest US High Dividend X USD Acc04/11/2013 | Jeffrey Schumacher, CFA
Analyst Rating
‰Stile di investimento:For dividend investors requiring positions in the US this fund may be a core investment.
Persone:Adour Sarkissian has been the manager since May 2007 for this high-dividend fund focusedon the US.Società:It is still unclear how strongly ING IM will emerge from the recent separations.Processo:Bottom-up stock selection with strong focus on valuations.Rendimenti:Performance is good and has been achieved with lower volatility relative to the categoryaverage.Prezzi:The cost level is around the category median.
L' Opinione di Morningstar:This is a decent choice for exposure to US dividend shares. Adour Sarkissian has gainedexperience as an analyst for US equity prior to joining ING in May 2007 to manage this fund.He has developed his own management style, clearly implementing his own preferences inthe portfolio. However, this means that he has to do a considerable share of the equity researchhimself because the analyst team at ING does not cover all shares in the portfolio. We feelthat Sarkissian is a skilled manager but he is largely left to his own devices, which mayconstitute a risk. The strategy focuses on the selection of sound dividend shares identified viaan extensive fundamental and financial analysis, focussing on valuations. This makes thesector positioning of this fund deviate from comparable funds’. Sarkissian is less interestedin the industrials, cyclical consumer products and energy sectors, but is biased towardtraditional dividend sectors such as utilities and defensive consumer goods. The strongunderweighting of the financials sector is notable. Sarkissian expects little growth in thissector and feels that at the current valuation it is expensive. He prefers sectors such astechnology. As of Oct 2013, the portfolio has a relatively high cash position of 12%, whichhelps the return hold up in falling markets but limits its upside in rising markets. Sarkissian’sachievements since his arrival in May 2007 are sound, particularly taking into account thesomewhat lower risk. The category and benchmark are not totally relevant. Therefore, it wouldbe better to compare this fund with the MSCI USA High Dividend Yield Index. Measured againstthis index, the fund falls behind over three and five years. A comparison with other dividendfunds focused on the US provides a mixed picture. On the whole, we feel this fund is a decentoption for US dividend shares. We give the fund a Neutral rating.
© 2013 Morningstar. Tutti i diritti riservati. Le informazioni, i dati, le analisi e le opinioni (“Informazioni”) contenuti nel presente documento: (1) comprendono informazioni di proprietà di Morningstar e dei suoi licenziatari; (2) non possono esserecopiate o diffuse se non con autorizzazione; (3) non costituiscono consigli all’investimento; (4) sono fornite unicamente a scopi informativi; (5) non sono garantite per quanto riguarda la loro completezza, accuratezza o tempestività; e (6) possonoessere estratte da dati relativi ai fondi pubblicati in date diverse. Morningstar non è responsabile per alcuna decisione commerciale, danni o altre perdite associate alle Informazioni o al loro utilizzo. Si raccomanda di verificare tutte le Informazioniprima di utilizzarle e di non prendere decisioni d’investimento prima di consultare un consulente finanziario qualificato. I risultati realizzati in passato non garantiscono quelli futuri. Il valore e il reddito generato da investimenti possono aumentareo diminuire.
ß®

Analysis Digest | Il Mio Portafoglio | ottobre 2013
Apple Inc - AAPL | QQQ29/10/2013 | Brian Colello, CPA
Pro• Gartner expects the smartphone market to essentially double from 2012 to 2015, providing
Apple with avenues for iPhone growth.• Apple appears poised to generate strong revenue growth from the iPad in the years ahead
as tablets cannibalize PCs.• For each iOS device purchased, customers may be less likely to switch to another provider
and more likely to buy repeat Apple products, which we view as a good sign for long-termiPhone, iPad, and Mac sales, as well as an ability to see any new devices like a revised AppleTV or iWatch.
Contro• Apple’s recent decisions to maintain a premium pricing strategy may help fend off gross
margin compression but may also limit unit sales and market share as the low end of thesmartphone space will likely grow faster than the premium market.
• Whereas Apple focuses on a handful of key products, Samsung has emerged as a strong rivalby offering highly competitive devices of all sizes and prices at all times of the year.
• Apple may have lost much of its vision and creativity with the passing of cofounder SteveJobs in October 2011.
Note dell'Analista29/10/2013
Apple's strong, fiscal fourth-quarter results came in ahead of both the Street's, and our own,expectations. More importantly, Apple's solid December-quarter outlook points to healthydemand for the company’s new iPhones and iPads. We're maintaining our $600-per-share fairvalue estimate, and our narrow economic moat rating. For the September quarter, revenue of$37.5 billion and EPS of $8.26 also exceeded the company’s prior forecast. We suspect that thestrong results were driven by a tremendous iPhone launch during the quarter's closing days.Apple’s iPhone unit sales held up well, at 33.8 million units, while a 1% sequential decline inthe average selling price, or ASP, appears reasonable in light of Apple selling older iPhonesduring most of the reporting period. Apple's iPad unit sales and revenue declined modestly, butagain pertains to the sale of older models, as customers likely pushed out new iPad purchasesuntil the new lineup of tablets rolls out in November. Apple’s strong outlook for the Decemberquarter still points to robust ongoing iOS adoption, and we continue to view Apple's shares as
modestly undervalued. We calculate that revenue in the range of $55 billion to $58 billion likelyimplies iPhone unit sales in the low-to-mid 50 million-unit range, ahead of unit sales of 47 millionduring last year's iPhone 5 launch. We attribute most of the projected unit growth to new carrierdeals with NTT DoCoMo and T-Mobile, as well as launching iPhones in China a quarter earlierthan usual. The guidance also hints at strong, but not exponential, iPad growth from new productlaunches, although even the company is unsure whether it can fulfill all iPad Mini demand thisholiday season. Gross margin of 37% is a nice forecast, in our view, once adjusted upward byabout 150 basis points for deferred revenue associated with free software giveaways.
Valutazione:Our fair value estimate for Apple is $600 per share, which implies fiscal 2014 (ending September2014) price/earnings of 14 times, and only 10.5 times after excluding $139 per share of net cashon hand as of September 2013. We project revenue growth of 13% in fiscal 2014, thanks to asuccessful launch of new devices such as the iPhone 5s and iPad Air during the 2013 holidayseason. We also project that Apple will strike a carrier partnership with China Mobile in early2014, which will bring the iPhone to the world’s largest carrier and drive solid iPhone unit growthin the near term. Longer term, Apple should still attract late smartphone adopters in developedmarkets and new customers in emerging markets, especially if and when a China Mobile dealoccurs. As more and more consumers are previous smartphone owners, rather than first-timebuyers, we think Apple has a good chance to retain a sizable portion of its iOS user base today,and perhaps gain further share at the high end of the market. However, the next big wave ofsmartphone adoption will likely come from low-end phones sold in emerging markets, and wedon't foresee Apple being a major player in the low end. We also foresee a less favorable mixshift toward older, lower-priced iPhones that may weigh on revenue and gross margins. In turn,we currently model only low- to mid-single-digit growth in fiscal 2015 and beyond.We projectsolid iPad revenue growth in fiscal 2014 and 2015, as this device both displaces PCs and ispurchased as a third device alongside PCs and phones, but minimal growth thereafter as Applemaintains premium pricing on these devices but fails to recognize exponential unit growth as inyears past. We assume Apple's line of Mac PCs will see minimal revenue growth, as Macs gainshare in the declining PC industry. We also do not make any profitability assumptions for anApple TV or iWatch but recognize that future innovations may provide upside to our valuation.Weanticipate that Apple's gross margins peaked at 44% in fiscal 2012, as they fell to 38% in fiscal2013. We project mid-30% gross margins in the long term, as Apple maintains its focus onpremium pricing, but likely recognizes relatively slower unit sales growth. In turn, operatingmargins of 35% in fiscal 2012 should fall to the mid-20% range five years out. Our fair valueuncertainty rating for Apple is high.
Per maggiori dettagli, si prega di leggere l'analisi su www.morningstar.it
© 2013 Morningstar. Tutti i diritti riservati. Le informazioni, i dati, le analisi e le opinioni (“Informazioni”) contenuti nel presente documento: (1) comprendono informazioni di proprietà di Morningstar e dei suoi licenziatari; (2) non possono esserecopiate o diffuse se non con autorizzazione; (3) non costituiscono consigli all’investimento; (4) sono fornite unicamente a scopi informativi; (5) non sono garantite per quanto riguarda la loro completezza, accuratezza o tempestività; e (6) possonoessere estratte da dati relativi ai fondi pubblicati in date diverse. Morningstar non è responsabile per alcuna decisione commerciale, danni o altre perdite associate alle Informazioni o al loro utilizzo. Si raccomanda di verificare tutte le Informazioniprima di utilizzarle e di non prendere decisioni d’investimento prima di consultare un consulente finanziario qualificato. I risultati realizzati in passato non garantiscono quelli futuri. Il valore e il reddito generato da investimenti possono aumentareo diminuire.
ß®

Analysis Digest | Il Mio Portafoglio | ottobre 2013
Volkswagen AG - VOW | QQQ22/03/2013 | Richard Hilgert
Pro• With a substantial cash hoard on the automotive division balance sheet and conservatively
financed capital structure, Volkswagen has a high degree of financial flexibility.• Volkswagen's presence in global markets reduces reliance on any one regional economy and
improves growth prospects as developing markets offset mature ones.• Manufacturing entry-level to ultra-luxury as well as small delivery vehicles to the largest of
on-highway heavy trucks, Volkswagen's dependence on a single vehicle segment is limited.• The Volkswagen brand commands a premium among consumers in many parts of the world.• Premium and ultra-premium brands enrich the mix and tend to be less vulnerable to swings
in economic activity.
Contro• Volkswagen is in the highly cyclical, capital-intensive, high-volume automotive business,
where overcapacity restricts pricing and constrains economic profits.• While Volkswagen's goal of toppling Toyota as the world's largest automaker is attainable,
the firm needs another plank in its platform to support this objective: a meaningful presencein the U.S. market.
• Substantial ownership by the state of Lower Saxony in Germany, where Volkswagen is based,allows the state the right to block major decisions, leaving management open to thegovernment's agenda.
• While Volkswagen has had favorable union relations, heavily unionized work forces tend tolimit profit because of wage demands in prosperous times and work rules that reducemanufacturing flexibility.
Note dell'Analista01/08/2013
No-moat and negative moat trend-rated Volkswagen reported second-quarter earnings per shareof EUR 5.86, down EUR 2.75 (before special items) versus the same period last year. The lowerEPS resulted primarily from a higher effective tax rate in the second quarter 2013, and therevaluation of the Porsche options in the prior year. However, management reiterated its full-year guidance for revenue to exceed--and for operating profit to be flat with--the previous year'slevels (both on a consolidated basis). We continue to expect Volkswagen to benefit from thescale of its global operations, the rollout of a manufacturing system that enables greater costsavings, and an eventual recovery in Europe. However, the Street thinks so too, bidding the stockup to 3-stars, only a 12% discount to our EUR 195 fair value estimate.Second-quarter 2013results were aided by the inclusion of Porsche AG, which was consolidated for the first time inthe third quarter of 2012. On an as-reported basis, automotive revenue showed a healthy upturnof 8.9% while a like-for-like comparison (excluding Porsche from the current quarter) results inonly a slight 1.8% year-over-year increase. Excluding financial services and intersegmentamounts, as-reported automotive revenue was up by 7.5%. Unlike the second quarter of 2012,German new vehicle demand was affected by Europe's economic woes, declining by 3.7% thisyear. Despite the headwind, revenue for Volkswagen's European region rose by 5.4%. NorthAmerica was the bright spot in Volkswagen's second quarter results, with revenue up 20.6% ona 4.9% increase in units sold, mainly attributable to Porsche but also market penetration byVolkswagen and Audi brands in the U.S. Additionally, other world regions like South Americaand Asia contributed 12.7% and 8.2% increases to the year-over-year improvement inVolkswagen automotive revenue, respectively.
Tesi:In our view, Volkswagen is successfully executing a global automotive strategy. Geographicallydiverse and profitable operations reduce the company's dependence on domestic volume. Abroad array of brands, serving multiple segments, reduces reliance on any one vehicle category.
The group's captive finance business enables funding for many of Volkswagen's customers'purchases while capturing financing profits and returning dividends to the parent.Geographicdiversity has buffered Volkswagen from the downturn in European vehicle demand. In2009, global vehicle production volume was down 14.1% from the prior year, Volkswagen'sproduction was off only 4.6%. We believe global industry volume will improve due to demand inBrazil, Russia, India, China, as well as other developing markets. As a market leader in China(around a 15% share), the company should benefit from a growing population of vehicle owners.To capture the growth opportunity, Volkswagen intends to expand its already well-establishedChinese dealer network.The company also possesses a diverse set of product offerings inpractically every vehicle segment. In total, Volkswagen has 12 brands that cater to nearly everycustomer's needs, passenger and commercial. For investors, the downside is that having morebrands requires higher marketing and distribution costs. If executed poorly, Volkswagen couldfall prey to the same-badge engineering that once plagued General Motors GM--thinlydifferentiated vehicles with only the brand's badge on the grille to tell the them apart.In ourview, Volkswagen has successfully differentiated its brands while using common vehiclearchitectures. On the upside, a diversified portfolio reduces exposure to any single vehiclesegment that might perform better or worse depending on economic conditions or changes inconsumer buying habits. Super-luxury segment brands such as Lamborghini, Bugatti, and Bentleygenerally perform independently of general business conditions as these customers' buyinghabits are usually much less affected by economic uncertainty than mass-market vehiclecustomers.We view Volkswagen's financial services group as an integral part of the entire entity.The captive finance business enables management to set credit policies so that dealers havefunding to stock inventory and so consumers can obtain financing. Management can also useits captive finance subsidiary to provide incentives without cheapening a brand by placing anoutright rebate on any one particular model. Given the interdependence of the automotivebusiness and its captive finance subsidiary, we model Volkswagen's financial subsidiaries onan equity basis, enabling analysis of auto operations while capturing the value of the captivefinance group in our fair value estimate.Valutazione:We raised our fair value estimate to EUR 195 from EUR 160 mainly due to an increase in ourrevenue per unit assumptions over the course of our five-year explicit forecast period, despitea 1.0 percentage point approximate reduction in margin compared with our previousassumptions. In addition to higher average revenue per unit ARU from the consolidation ofPorsche and MAN, the main considerations behind our fair value estimate increase include theinitiation of modular transverse matrix, or MTM, manufacturing (increases commonality, reducescost, improves efficiency), the automaker's growth in markets outside of Europe, and the resultingestimated cash generation.Since 2001, Volkswagen's average revenue per unit has grown at anannualized rate of 3.6% while our forecast assumes a 3.3% average annual growth. We hadpreviously been forecasting a decline through this year and over our five-year forecast on ourbelief that there would be substantial degradation in European pricing as well as our assumptionthat European consumer preferences would shift to more value-oriented, plain-Jane modelsunder weak economic conditions. While we still assume a decline in ARU in our new DCF modelover our five-year explicit forecast period, we hold average revenue per unit to a range ofapproximately 21,300 to 21,800. Owing to volume increases and higher ARU, total revenueexcluding financial services, increases at an annualized rate of 8.0% over our explicit five-yearforecast versus our previous forecast of 5.3%.Over the course of our forecast, we assumedeclining margin owing to the auto sector's extreme competition, higher distribution expenseon increased volume, rising R&D expense as more models are converted to MTM manufacturing,but partially offset by operating leverage as European volume recovers and efficiency improveson more utilization of MTM in the latter part of our forecast. As a result of our assumptions,operating margin declines 1.2 percentage points from an estimated 6.7% at the initial year to5.5% in the final year of our five-year explicit forecast. Our previous forecast had margin decliningfrom 7.0% to 6.5%.
Per maggiori dettagli, si prega di leggere l'analisi su www.morningstar.it
© 2013 Morningstar. Tutti i diritti riservati. Le informazioni, i dati, le analisi e le opinioni (“Informazioni”) contenuti nel presente documento: (1) comprendono informazioni di proprietà di Morningstar e dei suoi licenziatari; (2) non possono esserecopiate o diffuse se non con autorizzazione; (3) non costituiscono consigli all’investimento; (4) sono fornite unicamente a scopi informativi; (5) non sono garantite per quanto riguarda la loro completezza, accuratezza o tempestività; e (6) possonoessere estratte da dati relativi ai fondi pubblicati in date diverse. Morningstar non è responsabile per alcuna decisione commerciale, danni o altre perdite associate alle Informazioni o al loro utilizzo. Si raccomanda di verificare tutte le Informazioniprima di utilizzarle e di non prendere decisioni d’investimento prima di consultare un consulente finanziario qualificato. I risultati realizzati in passato non garantiscono quelli futuri. Il valore e il reddito generato da investimenti possono aumentareo diminuire.
ß®

Analysis Digest | Il Mio Portafoglio | ottobre 2013
iShares J.P. Morgan $ Emerging Markets Bond UCITSETF (EUR) EEMB26/06/2013 | Jose Garcia-Zarate
Profilo Societario:The iShares JP Morgan Emerging Markets Bond ETF offers investors exposure to the USD-denominated segment of the emerging market (EM) sovereign debt market. Historically, EMgovernment debt has been mostly issued in USD or other developed nation currencies to makeit more palatable to global investors. Despite the recent growth in issuance of local currencyEM bonds, USD-denominated EM bonds retain the lion’s share of the EM sovereign debtlandscape. The search for higher yield and capital gains vis-à-vis developed bond marketsremains the key selling point of emerging market government debt. Notwithstanding shiftingperceptions about country risk borne out of the global financial crisis, financial vehicles offeringexposure to emerging market debt are still likely to be rolled out as satellite components of aninvestment portfolio; a yield-enhancing complement to lower-risk core developed market fixedincome building blocks. Additionally, investors have also been attracted to EM debt by virtue ofits low correlation to traditional (e.g. developed economies) fixed income investments. Europe-based investors considering this ETF should take into account a fair array of risk considerationsincluding: currency, country and duration. This ETF is a USD-denominated monthly-dividend-distributing vehicle; hence foreign exchange considerations are to have a regular impact on theexpected income stream. As per country risk, the ETF does not discriminate betweengeographical areas; thus making it a good vehicle for those wanting to maximise diversification,but a poor one for those wanting to target a specific area or country. Finally, this ETF has arelatively high modified duration (e.g. around 7-8%). This is reflective of the still generally long-term maturity bias of emerging market issuing governments. However, closely interlinked withcurrency exposure, it adds a further layer of performance risk ultimately dependant on USmonetary policy moves. The long duration of this ETF makes it vulnerable to proportionally highercapital losses when the Federal Reserve raises interest rates.Foundamental View: Emerging markets (EM) are routinely described as one of the main financial markets successstories of the last two decades. Significant structural changes to the way these economies aregoverned have facilitated large capital inflows, in turn leading to a significant shift ininternational investors’ asset allocation trends. As such, EM exposure is now part and parcel ofmost investment portfolios, with investors lured by comparatively high returns and a perceptionof diminished risk. The good performance of EM government bonds over the past few years hastaken a turn for the worse in 2013. Although it is fair to continue saying that EM economies areweathering the global crisis in much better shape than their developed counterparts, the fact isthat key EM countries are now showing worrying signs of growth slowdown. Furthermore, socialprotests in countries such as Turkey and Brazil have come as a reminder to investors that “politicalrisk” has not disappeared from EM, although it now takes a different shape. Adding to thesedomestic worries, EM valuations have also been very negatively affected by the US Fed’s hintsto an earlier-than-expected end to its QE programme. In a way, the events in 2013 have exposedone of the key weaknesses of the rationale for investing in EM. The success of emerging marketeconomies has been predicated on an export-oriented model whereby they have become thesuppliers of choice to consumption-driven developed partners. As the latter struggled under theburden of public and private debt, EM economies have little option but to promote their internalsources of growth. However, in order to fully incentivise local consumption, EM economies mayhave to develop and/or considerably extend publicly-funded social safety nets. This, for instance,has been one of the key reasons behind the social protests in Brazil. Clearly, not all EM countriesare the same, but any move to provide for extended social programmes (e.g. health, education)may lead to increased government expenditure in the future. This, in turn, could weigh on EMgovernment bond valuations. Even accounting for these important shortcomings, the factremains that, overall, EM economies are still seen as source of global growth. In fact, theconsensus is that EM economies should continue outpacing their developed peers by aconsiderable margin. It is important to note that some of these economies still benefit fromsizeable current account surpluses that might, if sensibly used, be deployed to cater for thegrowing social needs of their populations. Despite the fast-growing importance of local currency-denominated EM bond markets, a significant share of emerging market government bond
issuance is still conducted in USD. As such, would-be investors need to consider the impact thatUS monetary policy decisions may have on performance. As we write (e.g. mid June 2013) theUS Federal Reserve remains committed to maintaining very accommodative conventional policysettings for a protracted period. However, going forward, any substantive move foretelling theend of QE should be seen as USD supportive. Portfolio Construction:The JP Morgan EMBI Global Core Index is a subset of the broader JP Morgan EMBI Global Indexand measures the performance of most liquid USD-denominated emerging market sovereign orquasi-sovereign bonds. The EMBI Global Core Index includes fixed, floating rate and capitalisingbonds with a minimum outstanding of USD 1bn and minimum remaining maturity of 2.5 years.Eligible countries are those classed by the World Bank as having low or medium per capitaincome for two consecutive years, or countries that have restructured their external debt overthe last decade. The index is calculated every business day of the year, as defined by the USbond market calendar. Valuations are calculated on best offer/bid prices submitted by a selectedgroup of emerging market brokers or JP Morgan traders if prices from selected brokers are notavailable. This is a diversified index which limits the weights of countries with higher debtoutstanding. The index is rebalanced on the last business day of each month. Income arisingfrom coupon payments is reinvested in the index on the date paid.Fund Construction:iShares uses physical replication to track the performance of the JP Morgan EMBI Global CoreIndex. Given the large number of index constituents. iShares uses statistical sampling toconstruct the fund. As we write (e.g. mid June 2013) the number of fund constituents was 150,with Turkey, Brazil, Philippines, Indonesia, Mexico and Russia as the top six issuers in valueterms (e.g. 35-40% of the fund’s basket). The fund has a bias towards long-dated bonds, withsome 70% of constituents having remaining maturity above seven years and close to 35% withremaining maturity above 15 years. This ETF was launched in February 2008 and is domiciled inIreland. This ETF distributes dividends on a monthly basis. According to our research, trackingdifference for this ETF, measured in terms of annualised total returns after fees (note – theannual total expense ratio is 0.45%), has tended to come in above the TER by a non-negligiblemeasure. Market volatility since the fund’s inception, as well as performance divergences bornout of the fact that the fund’s basket is sampled rather than fully replicated, may account for asignificant share of tracking difference. iShares may engage in securities lending in order tooptimise the ETF’s tracking performance. BlackRock acts as investment manager on behalf ofiShares. The amount of securities that can be lent out is capped to 50% per fund. Lendingoperations are hedged by taking UCITS-approved collateral greater than the loan value and byrevaluing loans and collateral on a daily basis. The collateral is held in a ringfenced account bya third party custodian. The degree of overcollateralisation is a function of the assets providedas collateral, but typically ranges from 102.5% to 112%. Lending revenue is split 60/40 betweenthe ETF and BlackRock, respectively.Commissioni:The total annual expense ratio (TER) for this ETF is 0.45%. This sits mid-way in the 0.30-0.55%TER range for ETFs providing exposure to the USD-denominated segment of the EM governmentdebt market. Additional costs potentially borne by investors and not included in the TER includebid/offer spreads and brokerage fees when buy/sell orders are placed for ETF shares.Alternatives:The iShares JP Morgan USD EM Bond ETF is European market leader in this segment by asubstantial margin vs. its few competitors. Amongst these, we find the db x-trackers II EM LiquidEuroBond ETF. Using synthetic replication, the db x-trackers ETF carries a higher TER of 0.55%and its returns are hedged in EUR, which may be seen as an advantage for some investors –particularly Eurozone-based - either unwilling or unable to deal with FX considerations. As wewrite, its assets under management (AUM) are around 20% of those placed in the iSharesETF.Another alternative is the Amundi Global Emerging Bond Markit iBoxx ETF, a USD-denominated fund launched in 2010 charging a TER of 0.30%. Despite a more competitive TER,its AUM remain a fraction of those held by iShares and also lag behind by a good margin vs. thedb x-trackers ETF. European investors also have access to ETFs providing exposure to localcurrency EM government debt, which tends to be issued mostly in short-to-medium maturities.The SPDR Barclays Capital EM Local Bond ETF (TER 0.55%), the iShares Barclays Capital EMLocal Government Bond (TER 0.50%) and the PIMCO Source Advantage Local Bond ETF (TER0.60%) offer this exposure. They all are physically replicated.
© 2013 Morningstar. Tutti i diritti riservati. Le informazioni, i dati, le analisi e le opinioni (“Informazioni”) contenuti nel presente documento: (1) comprendono informazioni di proprietà di Morningstar e dei suoi licenziatari; (2) non possono esserecopiate o diffuse se non con autorizzazione; (3) non costituiscono consigli all’investimento; (4) sono fornite unicamente a scopi informativi; (5) non sono garantite per quanto riguarda la loro completezza, accuratezza o tempestività; e (6) possonoessere estratte da dati relativi ai fondi pubblicati in date diverse. Morningstar non è responsabile per alcuna decisione commerciale, danni o altre perdite associate alle Informazioni o al loro utilizzo. Si raccomanda di verificare tutte le Informazioniprima di utilizzarle e di non prendere decisioni d’investimento prima di consultare un consulente finanziario qualificato. I risultati realizzati in passato non garantiscono quelli futuri. Il valore e il reddito generato da investimenti possono aumentareo diminuire.
ß®

Analysis Digest | Il Mio Portafoglio | ottobre 2013
Fidelity Funds - Italy Fund A-EUR10/04/2013 | Dario Portioli, CFA
Analyst Rating
„Stile di investimento:Data la concentrazione del mercato azionario italiano per emittenti e settori, questa strategiaè adatta a rappresentare solo una componente di supporto di un portafoglio diversificato.
Persone:Da ottobre 2008, Alberto Chiandetti è alla guida del fondo. Il gestore vanta 12 anni diesperienza.Società:Fidelity gode di un robusto team di analisti, in linea con il focus sulla ricerca "bottom-up".Processo:La costruzione del portafoglio (composto tra i 30 e i 50 titoli) si basa sull'analisi fondamentale.Rendimenti:Buoni risultati per i sottoscrittori pronti ad affrontare un'elevata volatilità.Prezzi:Costi inferiori alla mediana di categoria.
L' Opinione di Morningstar:La recente performance di Fidelity Italy rappresenta un'ulteriore conferma delle sue qualità.Dopo un 2011 in chiaroscuro, il fondo è tornato ai vertici della categoria Morningstar AzionariItalia. Il 2012, infatti, è stato un anno di grande successo, come testimoniato dal piazzamentonel primo percentile di categoria per i rendimenti realizzati. Tra le scelte che hanno contribuitoa tale risultato, vi è stato il focus su società più esposte ai mercati internazionali e, diconseguenza, il sottopeso di quelle legate alla debole economia domestica, tra cui le utilitiesitaliane. A nostro avviso, però, le qualità del fondo vanno ben oltre i recenti successi. AlbertoChiandetti è il gestore da ottobre 2008. Riteniamo che l'esperienza complessivamentematurata dal gestore, pur non particolarmente lunga, unita alla sua approfondita conoscenzadelle società quotate italiane e all'accesso alla robusta ricerca proprietaria di Fidelityrappresentino dei punti di forza a vantaggio dei sottoscrittori del fondo. Ai fini della costruzionedel portafoglio, Chiandetti seleziona 30-50 titoli, tra large e small-cap italiane, partendo dallaricerca bottom-up, ma senza trascurare il quadro "macro". Riteniamo che questo approccionon dogmatico e con una connotazione "contrarian" sia in grado di fare la differenza sottodiverse condizioni di mercato. Tuttavia, richiede la condivisione da parte dei sottoscrittori diun orizzonte di lungo termine e un buon appetito per il rischio. Per coloro che hanno talipreferenze, l'investimento nel fondo è premiante. Nel tempo, come dimostrano i rendimentirelativi da ottobre 2008 a marzo 2013 (+430 punti base rispetto alla media di categoria), questoapproccio ha ripagato in termini relativi. A partire da agosto 2011, Chiandetti ha assuntol’incarico di gestione anche per un altro fondo, Fidelity Switzerland. Sicuramente il carico dilavoro è aumentato in modo significativo per il gestore, ma questo non ci preoccupa alla lucedei punti di forza che abbiamo citato in precedenza. Confermiamo, il nostro giudizio positivosul fondo, attribuendo il rating “Silver”.
© 2013 Morningstar. Tutti i diritti riservati. Le informazioni, i dati, le analisi e le opinioni (“Informazioni”) contenuti nel presente documento: (1) comprendono informazioni di proprietà di Morningstar e dei suoi licenziatari; (2) non possono esserecopiate o diffuse se non con autorizzazione; (3) non costituiscono consigli all’investimento; (4) sono fornite unicamente a scopi informativi; (5) non sono garantite per quanto riguarda la loro completezza, accuratezza o tempestività; e (6) possonoessere estratte da dati relativi ai fondi pubblicati in date diverse. Morningstar non è responsabile per alcuna decisione commerciale, danni o altre perdite associate alle Informazioni o al loro utilizzo. Si raccomanda di verificare tutte le Informazioniprima di utilizzarle e di non prendere decisioni d’investimento prima di consultare un consulente finanziario qualificato. I risultati realizzati in passato non garantiscono quelli futuri. Il valore e il reddito generato da investimenti possono aumentareo diminuire.
ß®

Analysis Digest | Il Mio Portafoglio | ottobre 2013
BlackRock Global Funds - Euro Corporate bond E5EUR31/01/2013 | Anthony McDonald
Analyst Rating
´Stile di investimento:Core. Euro investment-grade corporate bonds would typically form the core of many euroinvestors’ portfolios and this fund is designed to offer steady exposure to the universe.
Persone:Tom Mondelaers is an established member of a high-quality portfolio management team.Società:BlackRock's size has yet to mean better stewardship.Processo:A diversified, relative value process through which the manager seeks to deliver consistentreturns.Rendimenti:Performance has been strong since the manager assumed responsibility for the fund.Prezzi:An A share TER of 1.15% is above the retail category median but not significantly so.
L' Opinione di Morningstar:We believe BGF Euro Corporate Bond is an attractive way to gain exposure to euro-denominated investment-grade credit. In our view, the quality of the portfolio managementteam is one of the fund’s key attractions. Tom Mondelaers is an experienced credit managerand is part of Michael Krautzberger’s established euro fixed-income team that incorporatesfund managers and analysts covering both sovereign and corporate bonds. He further usesBlackRock’s global credit analyst team for bottom-up research and can leverage the group’snetwork of global fund managers and strategies for investment views. Mondelaers is true tothe team’s philosophy of building diversified portfolios that emphasise relative valuestrategies. Over time, around half of the fund’s added value is expected to come from thebottom-up security selection and sector rotation, with the team’s top-down views driving therest of performance across currency, duration and overall credit risk in the portfolio.Furthermore, the manager’s willingness to trade around his strategic views according to hisassessment of shorter-term risks, opportunities and market positioning is important to thefund. This is an approach that was first adopted for the fund in July 2009, when Mondelaersassumed management responsibility. From that date to the end of 2012, he delivered verystrong performance that was ahead of the fund’s benchmark and the Morningstar categoryaverage. The fund participated well in the credit rally in 2009-10 before moving to morecautious positioning ahead of the downturn in credit markets in the third quarter of 2012.While performance over the last six months of 2012 was anaemic, in part because of anunderweight in financials, the track record under Mondelaers remains very strong. Whilst weacknowledge that the fund’s TER is higher than the retail category median, we believe thatthe proven strength of the team and process are nevertheless sufficient to overcome thisheadwind, and we therefore award the fund a Bronze rating.
© 2013 Morningstar. Tutti i diritti riservati. Le informazioni, i dati, le analisi e le opinioni (“Informazioni”) contenuti nel presente documento: (1) comprendono informazioni di proprietà di Morningstar e dei suoi licenziatari; (2) non possono esserecopiate o diffuse se non con autorizzazione; (3) non costituiscono consigli all’investimento; (4) sono fornite unicamente a scopi informativi; (5) non sono garantite per quanto riguarda la loro completezza, accuratezza o tempestività; e (6) possonoessere estratte da dati relativi ai fondi pubblicati in date diverse. Morningstar non è responsabile per alcuna decisione commerciale, danni o altre perdite associate alle Informazioni o al loro utilizzo. Si raccomanda di verificare tutte le Informazioniprima di utilizzarle e di non prendere decisioni d’investimento prima di consultare un consulente finanziario qualificato. I risultati realizzati in passato non garantiscono quelli futuri. Il valore e il reddito generato da investimenti possono aumentareo diminuire.
ß®

Analysis Digest | Il Mio Portafoglio | ottobre 2013
Allianz Azioni Italia All Stars31/01/2012 | Dario Portioli
Analyst Rating
‰Stile di investimento:Questo fondo, che investe sia in titoli large-cap, sia small-cap, può essere utilizzato a supportodi una strategia di diversificazione della componente azionaria del portafoglio.
Persone:Massimo Cavalli segue la gestione del fondo sin dalla sua costituzione.Società:Buona trasparenza e accessibilità di informazioni. In Italia, però, i costi sono oltre la media.Processo:Il gestore investe con un orizzonte di lungo termine su 50 titoli large e small-cap.Rendimenti:Dall'adozione del nuovo benchmark (novembre 2011), la performance presa in esame è ancorabreve.Prezzi:I costi di questo fondo sono un aspetto da migliorare, in quanto superiori alla media dicategoria.
L' Opinione di Morningstar:Sotto una nuova veste, Allianz Azioni Italia All Stars ripropone aspetti che già conoscevamo.Con il primo novembre 2011, è stata effettuata una fusione per incorporazione di Allianz AzioniItalia (incorporato) in Allianz Azioni All Stars (incorporante). In tale occasione, l’universo diinvestimento di quest’ultimo fondo (in precedenza, small-cap Italia) è cambiato: ora il gestore,Massimo Cavalli, si confronta con tutte le capitalizzazioni di Borsa Italiana, investendo sia intitoli small-cap (circa 40% dell’attivo), sia in titoli mid/large-cap (60%). Questo cambiamentorappresenta una maggiore sfida per il gestore, date le diverse specificità delle imprese piccolee grandi. A tal riguardo, riteniamo che la precedente esperienza sia di aiuto, anche se Cavallidovrà ora dimostrare le sue abilità con un unico portafoglio più eterogeneo. Sebbene questanuova versione del fondo non sia l'esatta somma delle due precedenti strategie, possiamofare una valutazione parziale esaminando il track record prima della fusione. Allianz AzioniItalia All Stars vantava una buona performance relativa rispetto al proprio peer group. Infatti,nel periodo osservato, da gennaio 2008 a novembre 2011, ha battuto la media di circa 300punti base, con un minor grado di rischio. Il fondo incorporato, Allianz Azioni Italia (prima dellafusione, azionario large-cap), ha una storia più lunga, fatta di risultati leggermente inferiorialla media di categoria Morningstar Azionari Italia. Il nostro Analyst Rating per quest’ultimofondo era in precedenza “Negative” per due ragioni principali: un grado contenuto di gestioneattiva, associato a costi elevati. Con la nuova strategia, il primo aspetto è stato migliorato, inquanto il gestore ha maggiore libertà in termini di deviazioni dal benchmark. I costi, invece, anostro avviso continuano a rappresentare un limite anche per Allianz Azioni Italia All Starsdopo novembre 2011. Non riteniamo competitive l’attuale commissione di gestione di 2,35%e la struttura delle commissioni di incentivo, senza high-watermak. Allo stato, il nostro ratingè Neutral.
© 2013 Morningstar. Tutti i diritti riservati. Le informazioni, i dati, le analisi e le opinioni (“Informazioni”) contenuti nel presente documento: (1) comprendono informazioni di proprietà di Morningstar e dei suoi licenziatari; (2) non possono esserecopiate o diffuse se non con autorizzazione; (3) non costituiscono consigli all’investimento; (4) sono fornite unicamente a scopi informativi; (5) non sono garantite per quanto riguarda la loro completezza, accuratezza o tempestività; e (6) possonoessere estratte da dati relativi ai fondi pubblicati in date diverse. Morningstar non è responsabile per alcuna decisione commerciale, danni o altre perdite associate alle Informazioni o al loro utilizzo. Si raccomanda di verificare tutte le Informazioniprima di utilizzarle e di non prendere decisioni d’investimento prima di consultare un consulente finanziario qualificato. I risultati realizzati in passato non garantiscono quelli futuri. Il valore e il reddito generato da investimenti possono aumentareo diminuire.
ß®

Analysis Digest | Il Mio Portafoglio | ottobre 2013
M&G Optimal Income Fund Euro Class A-H GrossShares Acc (Hedged)14/12/2011 | Factsheet Analysts
Analyst Rating
„Stile Investimento:The fund offers investors a diversified portfolio of predominantly fixed-interest securities thatis strategic in nature, with the manager making significant moves between gilts, investment-grade bonds, and high-yield bonds depending on where value is identified. The manager mayalso implement his strategy through derivatives and equities.
Obiettivo d'Investimento Dichiarato:The fund aims to provide a total return based on exposure to optimal income streams ininvestment markets. The manager is willing to make significant asset allocation and bottom-upinvestment allocations between investment-grade corporate bonds, high-yield bonds,government debt, convertible and preference stocks, as well as money market instruments,equities, and derivatives. Over the business cycle, the manager aims to outperform the peergroup of funds in the government bond, investment-grade bond, and high-yield categories. Thefund has no target income or yield--the focus is on total return whether income or growth. Fundmanager Richard Woolnough joined M&G in Jan 2004 and is a member of the retail fixed-interest team, which is part of the wider fixed-interest group. He has managed this fund sinceits launch in Dec 2006. He works closely with his colleagues in the retail team and benefits from
the significant resources of the broader fixed-interest team, including the credit analysts, adealing team, a money market team, and other specialised units. Stefan Isaacs is the deputymanager for this fund. From a security selection point of view, the manager focuses on identifyingthe most attractive part of a company’s capital structure, or, in other words, investing in theoptimal income stream. The approach combines macroeconomic assessment, which determinesthe portfolio’s duration and the asset allocation between gilts, investment-grade corporatebonds, and high-yield bonds, with a market judgement that takes into account default risk,liquidity, and supply. These also help determine the sector and rating band allocations. M&Gbelieves that the key to any credit analysis is avoiding the losers, not picking the winners. Alarge team of credit analysts conducts the appropriate due diligence at the time of a new issueand will have always met a company’s management before investing. Ongoing analysis isconducted according to a disciplined and structured process. The key factors in the analysis ofeach company are assessments of its business and the industry in which it operates; cash flowand the ability to service debt after all liabilities have been met; susceptibility to event risk; andthe structure and covenant protection of each bond. The team also lists and closely monitorscredits that it deems are at risk of default in the next 12 months and those on watch (those thatare at risk of a two-notch or more downgrade over the next 12 months). The fund makes significantuse of the broader powers allowed under UCITS III regulation and can therefore use a range ofinvestment strategies. These include structured credit up to 10% of the fund, credit defaultswaps up to 50%, collateralised debt obligatons (CDOs) up to 5%, and a maximum of 10% inother assets including equities. The fund is unlikely to have more than 10% in cash. It will holda maximum of 5% in securities from a single issuer. These wide-ranging investment powers aretempered by M&G’s sophisticated risk management systems and the manager’s qualitativeviews on risk management and diversification. At least 80% of the portfolio will be denominatedin sterling or hedged back into sterling.
© 2013 Morningstar. Tutti i diritti riservati. Le informazioni, i dati, le analisi e le opinioni (“Informazioni”) contenuti nel presente documento: (1) comprendono informazioni di proprietà di Morningstar e dei suoi licenziatari; (2) non possono esserecopiate o diffuse se non con autorizzazione; (3) non costituiscono consigli all’investimento; (4) sono fornite unicamente a scopi informativi; (5) non sono garantite per quanto riguarda la loro completezza, accuratezza o tempestività; e (6) possonoessere estratte da dati relativi ai fondi pubblicati in date diverse. Morningstar non è responsabile per alcuna decisione commerciale, danni o altre perdite associate alle Informazioni o al loro utilizzo. Si raccomanda di verificare tutte le Informazioniprima di utilizzarle e di non prendere decisioni d’investimento prima di consultare un consulente finanziario qualificato. I risultati realizzati in passato non garantiscono quelli futuri. Il valore e il reddito generato da investimenti possono aumentareo diminuire.
ß®
Analysis Digest | Il Mio Portafoglio | ottobre 2013
AXA World Funds Framlington Europe Small Cap ACapitalisation EUR20/10/2009 | Mathieu Caquineau, CFA
Analyst Rating
´Stile di investimento:Il fondo può essere utilizzato come complemento di altri prodotti che investono in societàeuropee large-cap.
Persone:Dopo i diversi cambiamenti di gestione, Isabelle de Gavoty ha assunto la guida del fondonell’ottobre del 2008, oltre alla responsabilità del team specializzato sulle small-cap.Società:Apprezziamo la cultura di AXA IM, che è generalmente rivolta all’interesse dei sottoscrittori.Processo:Il lavoro di selezione delle società, fortemente collaborativo, conduce a un portafogliodiversificato tra gli 80 e 120 titoli.Rendimenti:Il fondo ha prodotto una buona performance nel lungo termine, dimostrando l’efficiacia delsuo processo. I risultati raggiunti dal gestore si riferiscono ancora a un periodo breve, ma sonoincoraggianti.Prezzi:Il TER del fondo è vicino alla mediana della categoria.
L' Opinione di Morningstar:Questo fondo è, a nostro avviso, una buona opzione per gli investitori che desideranodiversificare i propri investimenti sulle piccole e medie società europee. Isabella Gavoty haassunto la piena gestione del fondo nel mese di ottobre 2008, essendosi già occupata di unastrategia simile per un breve periodo tra il 2006 e il 2007. Dopo aver subito diversi cambiamentidal 2006, tra cui l'uscita del precedente gestore lo scorso anno, il team sembra essersi ormaistabilizzato sotto la direzione di Gavoty. Quest'ultima conosce bene i componenti del teamcon i quali lavora già da 7 anni. Sia i gestori che gli analisti hanno una comprovata conoscenzadi questo segmento di mercato e circa 13 anni di esperienza in media. La forza di questasquadra ci sembra particolarmente importante, dato l'approccio collegiale messo in pratica,che ha contribuito a limitare gli effetti negativi dei frequenti cambi di gestione. Il grupposuddivide l'universo di investimento in funzione delle competenze settoriali di ciascuno.L’universo è filtrato con l’aiuto dei classici criteri quantitativi (crescita, valorizzazione,momentum), mentre il team cerca di identificare le potenzialità di crescita a un prezzoragionevole (approccio GARP). Questo si traduce nell'orientamento alla crescita ("growth) delportafoglio all’interno della Morningstar Style Box, che porta ad aumentare il profilo di rischiodel fondo rispetto ai suoi concorrenti. A seguito di una dettagliata ricerca fondamentale, checomprende anche gli incontri con i dirigenti delle società, le migliori idee di ciascun gestoresi ritrovano in un portafoglio modello, costruito senza sbilanciamenti settoriali. Questoprocesso permette a nostro avviso una ripartizione efficace delle migliori idee di investimento.De Gavoty utilizza generalmente dal 70 all’80% del portafoglio modello, ma non rinuncia autilizzare i margini di manovra a sua disposizione per mettere in pratica chiare scommesse.Così, a partire da aprile, il portafoglio è stato progressivamente riposizionato verso i titolifinanziari e ciclici, comprese le imprese esportatrici che, secondo il gestore, dovrebberobeneficiare della ripresa economica globale. Se le scommesse settoriali sono parte integrantedello stile di gestione, il portafoglio resta al momento ben diversificato, anche sui vari paesieuropei. La gestione del rischio liquidità, più significativo per le società a media e piccolacapitalizzazione, è ben integrata nel processo di investimento. Il fondo beneficia di un buontrack record di lungo periodo e sovraperforma la categoria sui 5 anni. Tale performance nonè completamente attribuibile all'attuale gestore che, dall’ottobre del 2008, ha comunquemostrato risultati incoraggianti. Nonostante i cambiamenti nel team in passato, siamosoddisfatti della sua stabilità sotto la guida di Gavoty. Il fondo dispone a nostro avviso di puntiforti per poter superare i suoi concorrenti nel lungo periodo: una squadra con esperienza, unapproccio coerente e costi ragionevoli. Questi elementi ci danno la tranquillità necessaria perassegnare il nostro giudizio “Superiore”.
© 2013 Morningstar. Tutti i diritti riservati. Le informazioni, i dati, le analisi e le opinioni (“Informazioni”) contenuti nel presente documento: (1) comprendono informazioni di proprietà di Morningstar e dei suoi licenziatari; (2) non possono esserecopiate o diffuse se non con autorizzazione; (3) non costituiscono consigli all’investimento; (4) sono fornite unicamente a scopi informativi; (5) non sono garantite per quanto riguarda la loro completezza, accuratezza o tempestività; e (6) possonoessere estratte da dati relativi ai fondi pubblicati in date diverse. Morningstar non è responsabile per alcuna decisione commerciale, danni o altre perdite associate alle Informazioni o al loro utilizzo. Si raccomanda di verificare tutte le Informazioniprima di utilizzarle e di non prendere decisioni d’investimento prima di consultare un consulente finanziario qualificato. I risultati realizzati in passato non garantiscono quelli futuri. Il valore e il reddito generato da investimenti possono aumentareo diminuire.
ß®

Disclosure | Il Mio Portafoglio | ottobre 2013
Il report sintetizza,, su base mensile la composizione del portafoglio creato in MyPortfolio. Considera l'asset allocation e l'esposizione geografica, lo stile azionario e l'esposizione settoriale peraiutare a capire il reale livello di diversificazione del portafoglio, i suoi potenziali rischi e i possibili comportamenti nel futuro. Le informazioni mostrate in questo report provengono dai dati disponibilidi Morningstar e possono o non possono essere un accurato riflesso della corrente composizione dei titoli inclusi nel portafoglio preso in considerazione.
Indice di riferimentoL'indice di riferimento è l'indice di categoria Morningstar scelto al momento della creazione del portafolio in MyPortfolio.
Rendimento – Grafico di crescitaIl grafico mette a confronto la crescita del portafoglio con quella dell'indice di riferimento. Le commissioni di entrata potrebbero ridurre la performance riportata. L’indice è un portafoglio non gestitodi specifici titoli e non riflette alcuna commissione iniziale o corrente. I titoli che compongono il portafoglio di un fondo possono differire sostanzialmente da quelli inclusi nell’indice. L’indice diriferimento è l'indice della categoria Morningstar e può differire sostanzialmente da quello indicato nel Prospetto Informativo dei singoli titoli in portafoglio.
Scenari ipotetici fino a 30 anniLa tabella e la sua rappresentazione grafica indica una previsione ipotetica sulle performance future del portafoglio, evidenziando le probabilità associate al raggiungimento dei valori rappresentati.
Asset AllocationIl grafico a torta e la tabella mostrano l'esposizione del portafoglio alle seguenti asset class: azioni, obbligazioni, liquidità e Altro. Per "Altro" si intendono strumenti diversi che Morningstar identifica,ma che non appartengono alle altre classi di investimento. (Per esempio, l'investimento diretto in immobili è tipicamente classificato come Altro). In "Non classificato" sono compresi quegli strumentiche Morningstar non identifica e di cui non raccoglie i dati. I numeri adiacenti al grafico mostrano la percentuale netta delle diverse classi sul totale del portafoglio, includendo nel calcolo, sia leposizioni lunghe (attività) che le posizioni marginali o corte (passività).
Aree geografiche e Settori AzionariLa sezione fornisce la suddivisione dell'esposizione geografica del portafoglio, per regione e livello di sviluppo del mercato. Nel determinare le esposizioni sono prese in considerazione solo leposizioni azionarie. "Non Classificato” indica la percentuale del portafoglio azionario per la quale Morningstar non è in grado di attribuire la regione o l'origine. La tabella mostra la percentuale delportafoglio azionario investita in ciascuno dei seguenti macro-settori (Ciclico, Sensibile e Difensivo) e gli 11 maggiori sottosettori. In "Non classificato" sono compresi i titoli che Morningstar nonidentifica e di cui non raccoglie i dati.
Grafico Profilo rischio/rendimento e tabella Misure di Rischio dei primi 10 titoli in portafoglioLo scatter plot rischio/rendimento è basato sul rischio/rendimento di ciascun titolo nel corso degli ultimi tre anni. Il Rischio è misurato dalla deviazione standard dei rendimenti nell'ultimo triennio,utilizzando la media dei rendimenti degli ultimi 3 anni. Il grafico rappresenta anche il profilo rischio/rendimento del portafoglio. La Deviazione Standard misura la volatilità dei rendimenti di unfondo. Il Rendimento Medio rappresenta la performance media (Morningstar utilizza la media geometrica) ottenuta dal fondo negli ultimi 3 anni.
Matrice di CorrelazioneLa Matrice di Correlazione esamina quanto i rendimenti degli investimenti presenti in portafoglio siano tra loro correlati, calcolando la correlazione statistica tra irendimenti a 3 anni di ciascunacoppia di titoli. “1” significa che due titoli si muovono nella stessa direzione, “-1” è il massimo della diversificazione tra due titoli.
Duplicazione TitoliLa Duplicazione Titoli è la visualizzazione di quante volte un singolo titolo è presente nei fondi che compongono il portafoglio. Sotto il nome del titolo sono elencati i fondi che investono in esso, difianco sono riportati i pesi percentuali relativi.
Morningstar RatingIl rating di Morningstar è una scala di misurazione del rendimento corretto per il rischio e i costi sostenuti da ogni fondo, calcolato all'interno di ciascuna categoria Morningstar. Il rating vienecalcolato solo per i fondi che dispongono di dati su almeno 3 anni. Ordinati i fondi secondo la metodologia MRAR (Morningstar Risk Adjust Return), il primo 10% di fondi di una categoria riceve lecinque stelle, il successivo 22.5% quattro stelle, l'ulteriore 35% tre stelle, mentre al successivo 22.5% e all'ulteriore 10% vengono assegnate rispettivamente due e una stella. Nel caso in cui iltitolo in portafoglio sia un'azione, le stelle indicano invece il Morningstar Rating per le Azioni, che ha l’obiettivo di individuare quelle azioni che sono sopravvalutate e sottovalutate dal mercatorispetto alla valutazione del loro prezzo obiettivo. Tale giudizio, che va da un minimo di una a un massimo di cinque stelle (per quelle maggiormente a sconto), integra valutazioni di caratterequalitativo, circa il posizionamento dell’azienda all’interno del settore, con analisi quantitative che si realizzano nella stima del prezzo obiettivo del titolo.
Morningstar Analyst RatingIl Morningstar Analyst Rating è una valutazione soggettiva della potenzialità di un fondo in chiave prospettica. Tale giudizio si basa sulle ricerche fondamentali condotte dagli analisti di Morningstarin tutto il mondo. La scala di rating presenta una distribuzione asimmetrica, con tre possibili giudizi positivi - Gold, Silver, Bronze - uno neutrale e uno negativo. Per assegnare un rating, gli analisticonsiderano fattori sia quantitativi che qualitativi e valutano cinque pilastri di ricerca, che la nostra esperienza ci porta a ritenere determinanti per il futuro successo di un fondo: Persone, Società,Processo, Performance e Prezzo.
Gold è un giudizio assegnato nei confronti di un fondo che si distingue per ciascuno dei cinque pilastri di ricerca presi in esame e, pertanto, gode della più alta valutazione da parte degli analisti.Silver è il rating assegnato a un fondo con numerosi punti di forza, ma che può presentare alcuni aspetti da migliorare con riferimento a uno o più dei cinque pilastri presi in esame. Bronze è assegnatoa un fondo che ha un numero di punti di forza che superano i punti di debolezza, consentendo così agli analisti di esprimere un giudizio complessivamente positivo. Neutral è un fondo che, sullabase dei fattori presi in esame, non presenta né significativi limiti, né particolari aspetti positivi. Infine, Negative è un rating assegnato nei confronti di un fondo che presenta almeno un pilastronegativo che, secondo gli analisti, ne determina dei limiti rispetto ad altri fondi simili. Gli Analyst Rating sono rivisti almeno ogni 14 mesi.
Il Morningstar Analyst Rating non dovrebbe essere utilizzato come unica base per valutare un fondo. I Morningstar Analyst Rating si fondano sulle aspettative degli analisti di Morningstar su eventifuturi; per tale motivo, in alcun modo Morningstar rappresenta i propri rating come garanzie di risultato, né tantomeno gli investitori dovrebbero considerarli come tali. I Morningstar Analyst Ratingaffrontano rischi sconosciuti e incertezze, che possono determinare dei risultati anche di gran lunga diversi rispetto a quelli attesi.
© 2013 Morningstar. Tutti i diritti riservati. Le informazioni, i dati, le analisi e le opinioni (“Informazioni”) contenuti nel presente documento: (1) comprendono informazioni di proprietà di Morningstar e dei suoi licenziatari; (2) non possono esserecopiate o diffuse se non con autorizzazione; (3) non costituiscono consigli all’investimento; (4) sono fornite unicamente a scopi informativi; (5) non sono garantite per quanto riguarda la loro completezza, accuratezza o tempestività; e (6) possonoessere estratte da dati relativi ai fondi pubblicati in date diverse. Morningstar non è responsabile per alcuna decisione commerciale, danni o altre perdite associate alle Informazioni o al loro utilizzo. Si raccomanda di verificare tutte le Informazioniprima di utilizzarle e di non prendere decisioni d’investimento prima di consultare un consulente finanziario qualificato. I risultati realizzati in passato non garantiscono quelli futuri. Il valore e il reddito generato da investimenti possono aumentareo diminuire.
ß®


![[DINO_EXOR][portafoglio investimenti en]](https://static.fdocumenti.com/doc/165x107/55b3db6ebb61eb0a528b462b/dinoexorportafoglio-investimenti-en.jpg)