
Partecipazione alle attività della Task 40 ‘Net Zero ... · emissioni di gas serra. ... TRNSYS,...
30
RICERCA DI SISTEMA ELETTRICO Partecipazione alle attività della Task 40 ‘Net Zero Energy Buildings’ joint project SHC Task 40 /ECBCS Annex 52 Maurizio Cellura, Aldo Orioli Report RdS/2011/38 Agenzia Nazionale per le Nuove Tecnologie, l’Energia e lo Sviluppo Economico Sostenibile
Transcript of Partecipazione alle attività della Task 40 ‘Net Zero ... · emissioni di gas serra. ... TRNSYS,...

RICERCA DI SISTEMA ELETTRICO
Partecipazione alle attività della Task 40 ‘Net Zero Energy Buildings’ joint project SHC Task 40 /ECBCS Annex 52
Maurizio Cellura, Aldo Orioli
Report RdS/2011/38
Agenzia Nazionale per le Nuove Tecnologie, l’Energia e lo Sviluppo Economico Sostenibile
PARTECIPAZIONE ALLE ATTIVITÀ DELLA TASK 40 ‘NET ZERO ENERGY BUILDINGS’ JOINT
PROJECT SHC TASK 40 /ECBCS ANNEX 52”
Maurizio Cellura, Aldo Orioli (Università degli Studi di Palermo, Dipartimento Energia)
Settembre 2011
Report Ricerca di Sistema Elettrico
Accordo di Programma Ministero dello Sviluppo Economico – ENEA
Area: Razionalizzazione e risparmio nell’uso dell’energia elettrica
Progetto: Studi e valutazioni sull’uso razionale dell’energia: Tecnologie per il risparmio elettrico
nel settore civile
Responsabile Progetto: Gaetano Fasano, ENEA
Pagina 3 di 30
RAPPORTO FINALE DELLA RICERCA
1) Introduzione
Il presente Rapporto Finale è volto a descrivere dettagliatamente gli studi e le attività svolte in seno
al progetto di ricerca “Partecipazione alle attività della Task 40 “Net Zero Energy Buildings”
dell’International Energy Agency”; tali attività si inseriscono nell’ambito del Tema di ricerca
5.4.1.1/2:“Determinazione dei fabbisogni e dei consumi energetici dei sistemi edificio-impianto, in
particolare nella stagione estiva e per uso terziario e abitativo e loro razionalizzazione, interazione
condizionamento e illuminazione”.
La suddetta ricerca fa riferimento al Piano dell’Accordo di Programma tra il Ministero dello
Sviluppo Economico (MSE) ed ENEA stipulato in dato 21 Giugno 2007 per l’esecuzione delle linee
di attività indicate nell’Allegato I del Decreto Ministeriale 23 Marzo 2006, concernente
l’approvazione del Piano Triennale della Ricerca di Sistema e Piano Operativo Annuale per le
attività di Ricerca e Sviluppo di Interesse Generale per il Sistema Elettrico Nazionale e attribuzione
delle risorse del Fondo, di cui al Decreto Interministeriale 26 gennaio 2000.
In particolare i temi sviluppati nell’ambito dell’ accordo di collaborazione stipulato tra l’ENEA ed il
Dipartimento dell’Energia (ex Dipartimento di Ricerche Energetiche ed Ambientali (DREAM))
dell’Università degli Studi di Palermo, si collocano nel contesto delle azioni volte a ridurre i
consumi energetici e le emissioni climalteranti per la climatizzazione degli edifici, come
ampiamente ed espressamente richiamato nel vasto corpus legislativo e nel processo di emanazione
di normative tecniche di supporto a livello comunitario e di stati membri.
Obiettivi generali dell’attività
Gli obiettivi generali si collocano nell’ambito dell’individuazione di metodi e sistemi per la
progettazione dei sistemi edificio-impianto ed energia netta zero, anche alla luce dei più recenti
indirizzi europei di politica energetica degli edifici (DIRETTIVA 2010/31/UE del 19 maggio 2010
sulla prestazione energetica nell’edilizia) e degli obiettivi di risparmio energetico e limitazione delle
emissioni di gas serra.
Pagina 4 di 30
La ricerca è stata svolta all’interno di un organismo internazionale, l’International Energy Agency
(IEA), che si occupa del più vasto tema dell’efficienza e del risparmio energetico nell’edilizia.
Le attività sono state svolte in seno alla Task 40, avente come obiettivo lo studio di edifici ad
energia netta zero o quasi, al fine di sviluppare un framework di definizioni, conoscenze comuni,
strumenti atti allo studio degli NZEBs (Net Zero Energy Building), soluzioni innovative e linee
guida per le industrie.
Il lavoro della task 40 è suddiviso all’interno di quattro differenti subtask, denominate con le lettere
dalla A alla D, e il gruppo di ricerca del Dipartimento dell’Energia, ex DREAM, ha svolto attività in
seno alla Sub Task A e alla Sub Task B.
L’obiettivo della STA è quello di stabilire degli standard internazionali sugli NZEB basati su di una
metodologia comune attraverso i mezzi seguenti:
- Studio delle definizioni e dei dati esistenti circa gli edifici ad energia netta zero,
- Studio del mismatching e dei problemi di interazione con la rete,
- Sviluppo di un framework di definizioni per il concetto di NZEB considerando implicazioni
di larga scala, exergia e interazioni con la rete .
La Subtask B si pone come obiettivo l’analisi degli strumenti utili alla progettazione. In particolare:
- Approfondimento di casi studio e di esempi rilevanti di NZEBs,
- Identificazione di una suite di strumenti atti al supporto della fase progettuale degli
NZEBs.
Ogni caso studio deve essere analizzato nel dettaglio sviluppando quando possibile i seguenti punti
di interesse :
1) Descrizione dell’edificio;
2) Obiettivi dell’edificio;
3) Design team;
4) Descrizione del processo di progettazione;
5) Limitazioni degli strumenti utilizzati e consigli per migliorarne l’efficacia;
6) Redesign.

Pagina 5 di 30
La ricerca è stata condotta lungo due direzioni: la prima tocca approfondimenti metodologici sui
“Net Zero Energy Buildings” (NZEB); la seconda affronta lo sviluppo e l’analisi dei software di
simulazione termofisica degli edifici, ponendo in evidenza lacune e problemi che si riscontrano nel
caso di applicazione dei suddetti software ai NZEB.
Nell’ambito dei lavori della Subtask A (STA) si è collaborato al fine di individuare una definizione
condivisa di NZEB, mentre i lavori della Subtask B (STB) hanno condotto all’analisi delle
prestazioni del software TRNSYS (versione 16.1) confrontando i risultati delle analisi dinamiche
con i dati di monitoraggio forniti dal sistema di sensori di cui l’edificio scelto come caso studio è
dotato.
Il lavoro è stato svolto secondo quanto previsto dall’Allegato Tecnico all’Accordo di
Collaborazione tra l’ENEA e l’ex DREAM, adesso Dipartimento dell’Energia dell’Università di
Palermo.
Nel seguito si presenteranno brevemente le condizioni dello scenario zero (edificio esistente) del
caso studio prescelto, al fine di potere quindi approfondire in seguito la descrizione del modello
costruito in ambiente TRNSYS ed i risultati ottenuti, la validazione dello strumento ottenuto tramite
valutazioni su base annuale, mensile e giornaliera di bilanci di energia primaria e quindi le opzioni
proposte al fine di migliorare le performances energetiche dell’edificio. Saranno altresì descritte le
attività svolte nell’ambito della Task 40, le pubblicazioni internazionali redatte e le lacune
riscontrate nel software di simulazione prescelto.
Pagina 6 di 30
2) Caso studio Leaf House: approfondimenti e simulazione termofisica dinamica in
ambiente TRNSYS
I lavori che trovano riferimento al contesto della Subtask B riguardano l’approfondimento del caso
studio Leaf House, situato ad Angeli di Rosora (Ancona) nel dettaglio, la sua simulazione in
TRNSYS, la calibrazione del modello e la valutazione di eventuali lacune presenti nello strumento
oltre alla compilazione di diversi questionari e modeler’s worksheets volti alla condivisione
nell’ambito della Subtask B dei risultati ottenuti dal gruppo di lavoro del dipartimento dell’energia.
Una prima fase preparatoria è stata caratterizzata dalla raccolta dei dati climatici relativi alla località
in cui sorge la Leaf House, oltre ai dati riportati dai contatori di calore e dai sensori installati, al fine
di poter ottenere riscontri precisi e dettagliati, una volta costruito il modello.
Ogni singolo componente dell’impianto termico è stato studiato in dettaglio e le specifiche tecniche
acquisite, dati tecnici sono stati inoltre acquisiti circa ogni componente dei muri interni,
dell’involucro esterno e di ogni finestra.
E’ stato inoltre iniziato uno studio sull’embodied energy dei materiali impiegati nella costruzione.
Tale parte della ricerca sarà comunque sviluppata, con maggiore dettaglio, nel seguito delle attività
che saranno sviluppate in seno alla task.
Sono stati altresì analizzati nel dettaglio i dati di consumo di energia elettrica delle abitazioni su
scala oraria, e raffrontati nel dettaglio con la produzione di energia elettrica allo stesso livello di
dettaglio.
Si è proceduto quindi alla creazione del modello in ambiente TRNSYS 16.1. L’approccio con cui si
è effettuata tale operazione ha avuto un taglio rivolto sia all’ottenimento di uno strumento in grado
di descrivere il caso-studio, sia alla valutazione del software TRNSYS nelle simulazioni di NZEB.
L’analisi delle lacune del software è stata dunque svolta parallelamente e in funzione delle necessità
di modellazione proprie dello studio svolto sul caso studio Leaf House.
Nel corso del processo di descrizione del sistema in TRNSYS sono state riscontrate diverse carenze
proprie del software a livello sia operativo e di funzionalità delle librerie, sia di descrizione dei
componenti d’impianto: le principali riguardavano le scarse possibilità di controllo del sistema di
modellazione dei pannelli radianti, il basso grado di dettaglio raggiungibile nella descrizione dei
componenti d’impianto del sistema fotovoltaico e la presenza di alcune librerie descriventi
componenti reali e perfettamente adattabili al caso studio leaf house dal funzionamento parziale o
insoddisfacente.

Pagina 7 di 30
D’altro canto, alcune scelte impiantistiche della Leaf House sono estremamente complesse e
estremamente difficili da riprodurre in ambiente TRNSYS: la soluzione di compromesso prescelta è
stata quella di optare per una semplificazione mantenendo un controllo costante sulla variabilità dei
risultati e sulla credibilità degli stessi.
La simulazione è stata svolta suddividendo la descrizione del macro-sistema Leaf House in due
differenti sottosistemi: sistema termico e sistema fotovoltaico.
In entrambi i casi si è utizzato un file climatico creato dai dati ricavati dalla stazione metereologica
della Leaf House. Trnsys, infatti, utilizza un anno tipo, costruito a partire dai dati ricavati da
decenni di rilevazioni. Appare quindi evidente come l’utilizzo di tale strumento possa essere utile al
fine di una prima valutazione di massima, ma non per confrontare dati reali con quelli estratti dal
modello al fine di valutarne la bontà.
Il sistema termico è stato simulato descrivendo nel dettaglio ogni componente, le connessioni
relative ai vari componenti e all’interfaccia casa-impianto.
La simulazione ha toccato diversi aspetti:
- Descrizione degli scambi termici ( Sistema geotermico e free cooling, solare termico, pompa
di calore, apporti gratuiti, volti alla generazione di un fluido termovettore ad una
temperatura adeguata che verrà utilizzato nei pannelli radianti),
- Descrizione dei sistemi di trattamento d’aria,
- Descrizione della Leaf House nel dettaglio: orientazione, componenti trasparenti ed opachi,
involucro, suddivisione in zone termiche, pavimenti e mura, pavimenti radianti e
connessione al sistema termico,
- Sistemi di controllo volti alla regolazione tramite temperature di setup e modifiche legate
alla stagione dell’anno.
Il modello è particolarmente flessibile e permette tramite semplici modifiche di sviluppare studi di
sensibilità al variare di qualunque parametro.
Il sistema fotovoltaico comprende la descrizione dei pannelli fotovoltaici effettivamente esistenti
secondo la loro reale interconnessione. Oltre alla descrizione in ambiente Trnsys è stata svolta
parallelamente una seconda analisi utilizzando il software PVSYST ottenendo risultati
sostanzialmente analoghi. Si rimanda agli allegati per valutazioni più dettagliate dei risultati delle
simulazioni.

Pagina 8 di 30
Completata la creazione del modello è stata necessaria una fase di calibrazione dei risultati che,
sebbene risultassero di ordini di grandezza ovviamente paragonabili con le grandezze registrate nel
sito, necessitavano di un allineamento particolarmente elevato rispetto i dati reali.
Il modello è spesso oggetto di modifiche e miglioramenti al fine di tendere a risultati sempre più
vicini ai dati reali sempre migliori: si riporta di seguito un confronto su base annuale tra dati
monitorati e simulati, per la versione attuale dello stesso.
Nel corso dell’anno 2009 il sistema fotovoltaico ha prodotto 25.650 kWh. I collettori solari hanno
fornito 4227 kWh, coprendo il 63 % del fabbisogno di acqua calda sanitaria. I consumi elettrici per
riscaldamento e raffrescamento della pompa di calore sono stati pari a 5,3 MWh e 2,6
rispettivamente. La simulazione fornisce come risultato su base annuale il valore di consumo
elettrico pari a 7,5 MWh, con uno scarto rispetto al reale del 6 %. Per quel che concerne la
simulazione del sistema fotovoltaico i dati monitorati relativi al 2009 mostrano una produzione di
energia pari a 25651 kWh mentre la produzione simulata risulta essere 25143 kWh, con uno scarto
di circa il 2 %. La simulazione PVSYST è caratterizzata da uno scarto lievemente maggiore ma
comparabile. I fabbisogni stimati per raffrescamento e riscaldamento sono rispettivamente 12,7
MWh e 9 MWh per l’anno considerato.
Si è proceduto quindi ad un’analisi più dettagliata con valutazione di bilanci di energia e
approfondimento di alcuni parametri di bontà della simulazione su base mensile e giornaliera.
Si riportano a titolo di esempio medie mensili delle temperatura dell’aria interna in due differenti
zone termiche.
La linea rossa rappresenta i dati simulati, quella blu i dati monitorati.
La differenza media tra dati monitorati e simulati è 0,8°C nel primo caso e 0,6 °C nel secondo. La
differenza più alta tra dati monitorati e simulati è 1,5 °C nel primo grafico, circa 1°C nel secondo.

Pagina 9 di 30
Sono stati quindi estrapolati dei dati orari climatici (temperatura, umidità e irraggiamento) per
identificare i giorni annuali più significativi (il giorno soleggiato più caldo, il giorno soleggiato più
freddo, il giorno nuvoloso più caldo e il giorno nuvoloso più freddo). Per quest’analisi sono stati
utilizzati i dati di monitoraggio forniti dalla stazione meteo installata sulla Leaf House e relativi
all’anno 2009. I dati risultanti dalle simulazioni sono stati raccolti, studiati e confrontati con i dati
risultanti dal monitoraggio. E’ stata studiata la risposta del modello nell’analizzare alcuni giorni
particolarmente rilevanti, in termini di radiazione solare e temperature esterne riscontrate.
I giorni prescelti sono stati quattro:
1. 24 Gennaio( Cloudy cold ),
2. 6 Marzo (Sunny cold),
3. 24 Luglio(Sunny hot),
4. 4 Agosto (Cloudy hot).
Per i giorni considerati e per ogni zona termica di ogni appartamento sono stati
rappresentati graficamente gli andamenti delle seguenti grandezze:
1. Produzione simulata dell’impianto fotovoltaico;
2. Confronto con la produzione reale;
3. Load Match Index;
4. Radiazione solare incidente,
5. Temperatura esterna,
6. Temperatura dell’aria interna monitorata,
7. Temperatura dell’aria interna simulata.
Pagina 10 di 30
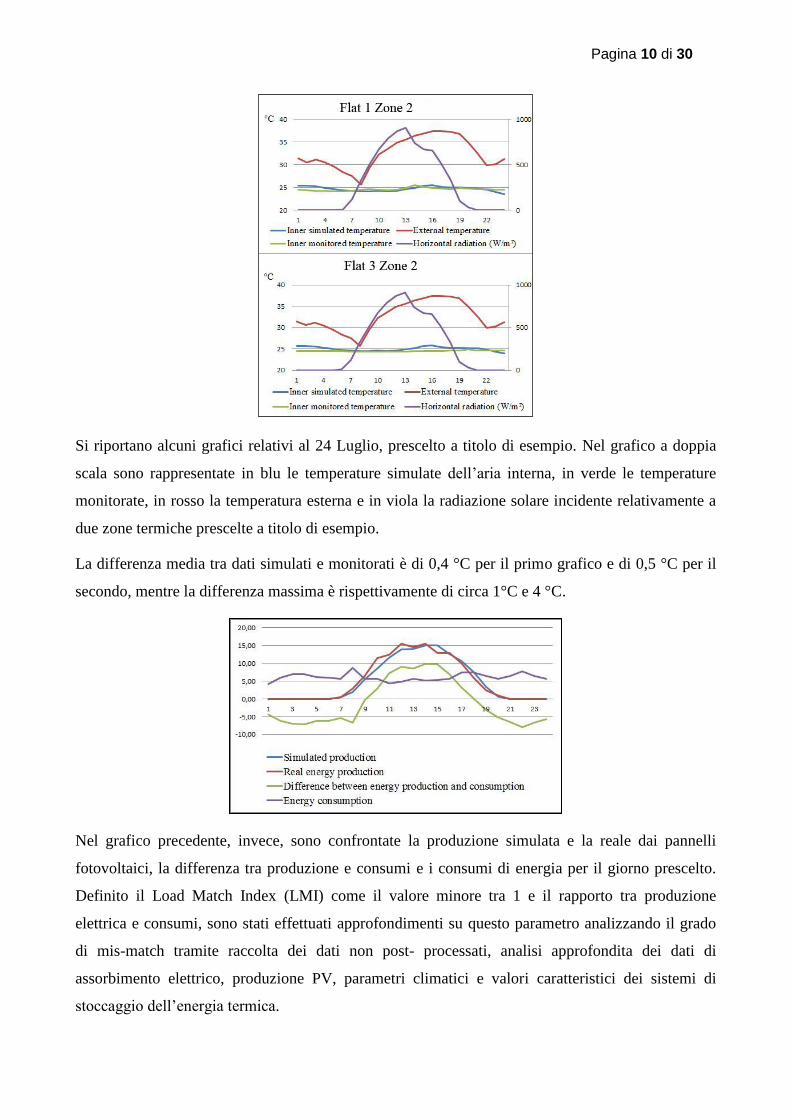
Si riportano alcuni grafici relativi al 24 Luglio, prescelto a titolo di esempio. Nel grafico a doppia
scala sono rappresentate in blu le temperature simulate dell’aria interna, in verde le temperature
monitorate, in rosso la temperatura esterna e in viola la radiazione solare incidente relativamente a
due zone termiche prescelte a titolo di esempio.
La differenza media tra dati simulati e monitorati è di 0,4 °C per il primo grafico e di 0,5 °C per il
secondo, mentre la differenza massima è rispettivamente di circa 1°C e 4 °C.
Nel grafico precedente, invece, sono confrontate la produzione simulata e la reale dai pannelli
fotovoltaici, la differenza tra produzione e consumi e i consumi di energia per il giorno prescelto.
Definito il Load Match Index (LMI) come il valore minore tra 1 e il rapporto tra produzione
elettrica e consumi, sono stati effettuati approfondimenti su questo parametro analizzando il grado
di mis-match tramite raccolta dei dati non post- processati, analisi approfondita dei dati di
assorbimento elettrico, produzione PV, parametri climatici e valori caratteristici dei sistemi di
stoccaggio dell’energia termica.

Pagina 11 di 30
Nell’analisi del caso studio italiano si è voluto porre l’attenzione sulla rispondenza dell’edificio ai
criteri che devono rispettare i NZEBs. Nel calcolo del bilancio energetico è stata considerata tutta
l’energia primaria prodotta mediante l’impianto fotovoltaico da 20 kW integrato nella copertura
dell’edificio e tutta l’energia consumata, misurazioni che sono state rese possibili grazie al sistema
di sensori presenti nell’edificio. Si è così riscontrato che il consumo energetico nel primo anno di
monitoraggio, è stato superiore alla produzione per come è verificabile nella tabella riassuntiva
seguente.
ENERGIA MWH %
PRODUZIONE 25,65 87,72
CONSUMI 30,38 100,00 PRODUZIONE-
CONSUMI -4,73 -12,28
Nel simulare il comportamento dinamico del sistema edificio-impianto sono stati ipotizzati degli
scenari migliorativi che vengono di seguito riportati:
1. Sostituzione dei pannelli fotovoltaici,
2. Sostituzione della pompa di calore geotermica con un modello più efficiente,
3. Eliminazione dello scambiatore connesso alla pompa di calore geotermica e conseguente
connessione diretta del fluido caldo\freddo con la tubazione principale,
4. Modifica della composizione del tetto per ottenere un valore di U inferiore (0.15
W/m2°C);
5. Combinazione delle ipotesi 1,2,3.

Pagina 12 di 30
Dati più dettagliati sono riportati in appendice.
Sebbene si consideri la qualità dell’involucro e dell’isolamento come decisamente superiore agli
standards, si è ugualmente deciso di provare a valutare il consumo di energia ipotizzando un valore
di U inferiore. Simulando quest’ultima opzione si è ottenuta una lieve diminuzione dei consumi
durante la stagione invernale ma anche un aumento più marcato durante quella estiva: globalmente
è stato riscontrato un aumento complessivo dei consumi elettrici per la sola pompa di calore di circa
300 kWh per l’anno in esame.
Dall’analisi dei vari scenari è emerso come la sola sostituzione dei pannelli fotovoltaici possa
coprire il fabbisogno elettrico dell’edificio, ma ai fini di ottenere migliori performance e rispettare i
criteri di efficienza energetica in edilizia dettati anche dalla normativa nazionale è risultato evidente
come la combinazione delle ipotesi 1, 2 e 3 sia la soluzione energeticamente più efficiente. Una
parte di queste analisi è stata presentata nell’articolo pubblicato negli atti del convegno ASHRAE
svoltosi a Montreal nel mese di Giugno, come riportato nella sezione Pubblicazioni del presente
rapporto tecnico.
Pagina 13 di 30
3) Partecipazione a gruppi di lavoro internazionali – IEA TASK 40 “ Net Zero Energy
Buildings”
Il Dipartimento ha partecipato ai lavori del gruppo di esperti IEA della Task 40 “Net Zero Energy
Solar Buildings”. Le attività finora realizzate hanno previsto la partecipazione a due meeting
internazionali tra il 2010 e il 2011, il primo si è svolto a Graz nei giorni 27-28 Settembre, il secondo
a Golden (Colorado-USA) dal 4 al 6Aprile 2010, il terzo si svolgerà a Basilea (Svizzera) dal 4 al 7
Ottobre 2011 ed inoltre hanno visto la partecipazione del Prof. Maurizio Cellura quale docente
all’interno della prima Summer School sui NZEBs svoltasi a Montreal, presso la Concordia
University, dal 20 al 25 giugno 2011.
Durante i meeting sono state coordinate le attività di ricerca in itinere e sono stati pianificati gli
obiettivi da raggiungere in vista dei successivi incontri.
Nel corso del primo meeting di Graz si è stabilito di svolgere le attività menzionate nelle pagine
precedenti: studio dell’interazione con la rete, monitoraggio dell’energia prodotta e consumata
dall’edificio, la modellazione con il software TRNSYS del caso studio.
Durante il meeting svoltosi in Colorado si è discusso dei risultati ottenuti dalle simulazioni
effettuate con i diversi software ed in particolare sono stati presentati i dati ottenuti dalla
valutazione delle prestazioni nei giorni di maggiore interesse. Il gruppo di ricerca italiano ha
riscontrato le elevate prestazioni del software TRNSYS nella simulazione del comportamento
termico dell’edificio.
Nel corso del meeting svoltosi in Colorado si è inoltre deciso il programma didattico della prima
scuola estiva internazione sui NZEBs che si è svolta a Montreal nella settimana dal 21 al 26 Giugno
2011. Il Prof. Cellura è stato inserito tra i docenti della scuola ed ha svolto lezioni sulle seguenti
tematiche: “Embodied Energy in Buildings”, “Transfer function method” , “Numerical simulation
of heat transfer within multilayered walls. Single thermal zone balance solved by Transfer Function
Method” . Il gruppo di ricerca italiano ha posto l’attenzione sul contributo dato dall’energia
incorporata nei materiali e sull’importanza dello studio dell’intero ciclo di vita dell’edificio
piuttosto che della sola fase di uso/gestione.
Infine si è scelto di iniziare un monitoraggio delle condizioni di comfort degli occupanti in
collaborazione con i rappresentanti del Politecnico di Milano, è stata inoltre prevista l’installazione
di sistemi di monitoraggio ad hoc. I risultati delle analisi saranno presentati al meeting che avrà
luogo a Basilea dal 4 al 7 Ottobre 2011.

Pagina 14 di 30
4) Pubblicazioni
Sono stati inoltre redatti gli articoli che sono di seguito elencati:
Design, Optimization, and Modeling Issues of Net-Zero Energy Solar Buildings, Andreas
Athienitis, Paul Torcellini, Adam Hirsch, William O’Brien, Maurizio Cellura, Ralf Klein,
Veronique Delisle, Shady Attia. Eurosun 2010, Graz 26 Settembre- 1 Ottobre 2010.
The Evaluation of Energy Performances of a Net Zero Energy Building: an Italian Case
Study, Maurizio Cellura, Lucia Campanella, GiuseppinaCiulla, Mario Fontana, Valerio Lo
Brano and Davide Nardi Cesarini, Maddalena Spallacci. Eurosun 2010, Graz 26 Settembre-
1 Ottobre 2010.
The redesign of an Italian building to reach net zero energy performances: a case study of
the SHC Task 40-ECBS annex 52. Maurizio Cellura, Lucia Campanella, Giuseppina Ciulla,
Francesco Guarino, Valerio Lo Brano, Davide Nardi Cesarini and Aldo Orioli. ASHRAE
Conference 21-26 Giugno 2011, ASHRAE Transaction Volume 117, Part 2.
Inoltre verrà pubblicato il seguente articolo nel volume degli atti della conferenza internazionale
IBPSA che si svolgerà in concomitanza all’evento Building Simulation 2011 a Sydney nel mese
di Novembre:
A Net Zero Energy Building in Italy: design studies to reach the net zero Energy target.
Maurizio Cellura, Lucia Campanella, Giuseppina Ciulla, Francesco Guarino, Valerio Lo
Brano, Davide Nardi Cesarini, and Aldo Orioli.

Pagina 15 di 30
ALLEGATO : NZEB CASE STUDY
Framework on NZEBs case-studies
Each case study should include, but is not limited to, the following information. It is recognized
that some information may not be publically available for all projects.
1. Description of the building, as it was built (or will be built).. This section should contain the
geometrical, thermophysical, occupancy, site, climate, and other energy characteristics. Special
attention should be given to how the site topology may impact incident solar energy on the
building.
Predicted and measured performance data (if available) should be provided. If both are
available, the two should be compared, and differences should be explained.
2. Objectives of building (net-energy, net-emissions, other sustainability-related goals). This
links to the definitions generated by STA. Other non-energy related goals should also be
described to provide an understanding of the motivation of the design team/owner.
3. Contractual arrangement. Are projects design-build or design-bid-build (or other
arrangements) and how did this affect the design and construction process? Also, if net zero is
built into the contractual incentives, how did this guide the process?
4. The design team and the responsibilities distribution. This section is used to describe how
each party in the design team contributed to the final building design, and particularly how the
NZEB objective is maintained by all.
5. The design process. Ideally in flowchart form, or at least chronological order, this section
provides the design process for the building in detail. It should include everything from
conception to commissioning or occupancy. This section is critical and should include:
a. A detailed description of each significant design decision, who it was made by, and how it
was made (e.g., building form, location on site, avoiding shading, etc.), and;
b. A list of design tools that were used, including: how they were selected, the design stage(s)
that they were used at, what data was obtained from them, who (which design team party) used
the tool/created the model, and the continuity between tools.
6. Advice and limitations of the process and tools. This section should identify all aspects of
the design process that could be improved. Namely, it should include parts of the design process
and limitations of the tools that were used. These lessons are intended to be informative for the
design of future NZEBs.

Pagina 16 di 30
One or both of 7 and 8 are to be performed. This section examines some hypothetical situations
in which a design or optimization process is applied to the same site, requirements, and
constraints, to determine how the building might have been built differently. The intended
process is for the energy model(s) to be altered to observe the effect. This could include a
change in form, technology, or wall construction, for example. These hypothetical case studies
allow the designer to explore design decisions for which they may not have had sufficient
resources or tools (e.g., if tools have advanced considerably since the building was originally
designed). Also, if the building is low-energy or near net-zero energy, this study can examine
how to achieve net-zero energy performance. Two processes can be applied:
7. Redesign (heuristic) with consideration to different technologies, controls, tools, procedures
or other building characteristics. The following steps should be performed.
a. If the model has not already been created in one (or a set of complimentary) simulation
tools, create it/them. All inputs should be clearly documented according to the template. If the
simulation tool has any particular assumptions or simplifications, they should be documented.
b. If the building is built and has been monitored, compare simulation results to measured data.
c. Brainstorm potential new concepts that could lead to performance improvements, just as in
early stage design. Document the brainstorming process.
d. Implement the new concepts either in the model or simplified calculation methods. The
base model from step (a) should be adapted to include the new concepts. The concepts can either
be sequentially or simultaneously (of course, the most rigorous approach would be to apply all
possible subsets of the new concepts). This process should be thoroughly documented to discuss
why and how things were done (e.g., why one tool was used over another or why a certain level
of model resolution (i.e. level of complexity) was used).
e. The results should be tabulated to clearly compare the performance of all new design
concepts with the original.
8. Optimization of the design with consideration of different technologies, controls, tools,
procedures, or other building characteristics.
a. The model should be created and set up such that variables of interest can be easily
modified, as required for batch simulations.
b. All variables, constrains, and the cost function should be carefully documented. The
thought process behind the selection of these three components is particularly important.

Pagina 17 di 30
c. Perform the optimization. Clearly document which tool was used or whether it was custom
tool.
d. Describe the optimal design, as determined by the optimization. Document the performance
of the optimization process (e.g., number of simulations performed and duration of process).
e. How realistic is the optimal design? Do all of the optimal variables make sense?
The Leaf House
The LH is located in Angeli di Rosora (Ancona, Italy), the latitude and longitude of the site are
respectively 43°28'43.16N, 13°04'03.65E while the altitude is 130 m (426ft) above the sea level.
The site is characterized by a moderate climate (mean annual temperature of 15.8 °C (60.44 °F),
mean humidity of 67% and mean horizontal solar radiation of 302 W/m2 (95.76 Btu/(h ft2))). The
house has a rectangular shape and is composed of six flats with an inner symmetrical division.
Its net conditioned floor area is 477 m2 (5134ft2). Four apartments are occupied by two people each
while two apartments are only occasionally occupied.
Plant of the Leaf House
The initial goal of the design was to develop a carbon neutral house, but during the design stage the
NZEB concept was added. This house is an application of new concepts of the architectural design:
comfort, sustainability, energy and economy.
It was also built as a laboratory where new sustainable technologies are studied and further
developed; indeed in the building there is a monitoring system able to record data about the quality
Pagina 18 di 30
of the air, the humidity, the CO2 level by means of several sensors that are installed in all the rooms
of the six apartments.
Description of the thermal plant
In the LH the heat and cold generation is carried out by a geothermal heat pump (GHP) that
exchanges with the ground through three vertical probes (100 m). In each flat of the LH there is a
radiant floor supplied by the GHP. During the summer season, the cooling system uses free cooling
provided by a ground coupled heat exchanger.
In the LH there is a mechanical ventilation system with heat recovery and pre-conditioning in an
underground duct. The ventilation rate is automatically provided according to the CO2 levels
registered in the rooms. The efficiency of the heat recovery system is 80%.
The electric energy needs of the heat pump are covered by the energy produced on site by the
photovoltaic panels covering the roof facing the south.
The LH energy system includes seven sub-systems:
The solar collector system;
The geothermal probes;
The heat pump;
The air handling unit (AHU);
The auxiliary boiler;
The photovoltaic system;
The radiating floors.
The solar collector system
Seven solar thermal collectors (2.6 m2 each) integrate, or completely replace (according to the
season), the heat pump in the production of domestic hot water. A recirculation system allows the
occupants to immediately get hot water reducing water wastes. The heat is transferred from the
solar collectors to the coil of the storage tank by means of a glycol-water mixture. A pump drives
the fluid back to the collectors. The difference between the outlet water temperature of the solar
panels and the water inside the storage tank is less than 10 degrees; otherwise the pump is turned
off.
Pagina 19 di 30
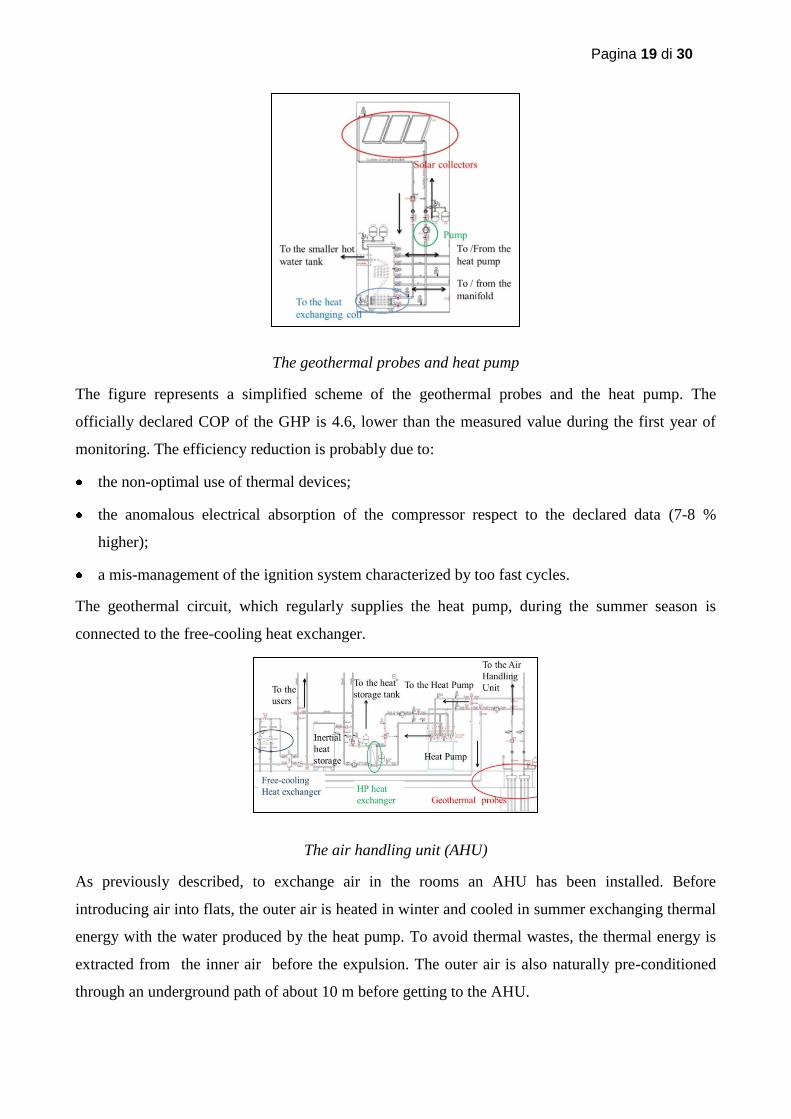
The geothermal probes and heat pump
The figure represents a simplified scheme of the geothermal probes and the heat pump. The
officially declared COP of the GHP is 4.6, lower than the measured value during the first year of
monitoring. The efficiency reduction is probably due to:
the non-optimal use of thermal devices;
the anomalous electrical absorption of the compressor respect to the declared data (7-8 %
higher);
a mis-management of the ignition system characterized by too fast cycles.
The geothermal circuit, which regularly supplies the heat pump, during the summer season is
connected to the free-cooling heat exchanger.
The air handling unit (AHU)
As previously described, to exchange air in the rooms an AHU has been installed. Before
introducing air into flats, the outer air is heated in winter and cooled in summer exchanging thermal
energy with the water produced by the heat pump. To avoid thermal wastes, the thermal energy is
extracted from the inner air before the expulsion. The outer air is also naturally pre-conditioned
through an underground path of about 10 m before getting to the AHU.
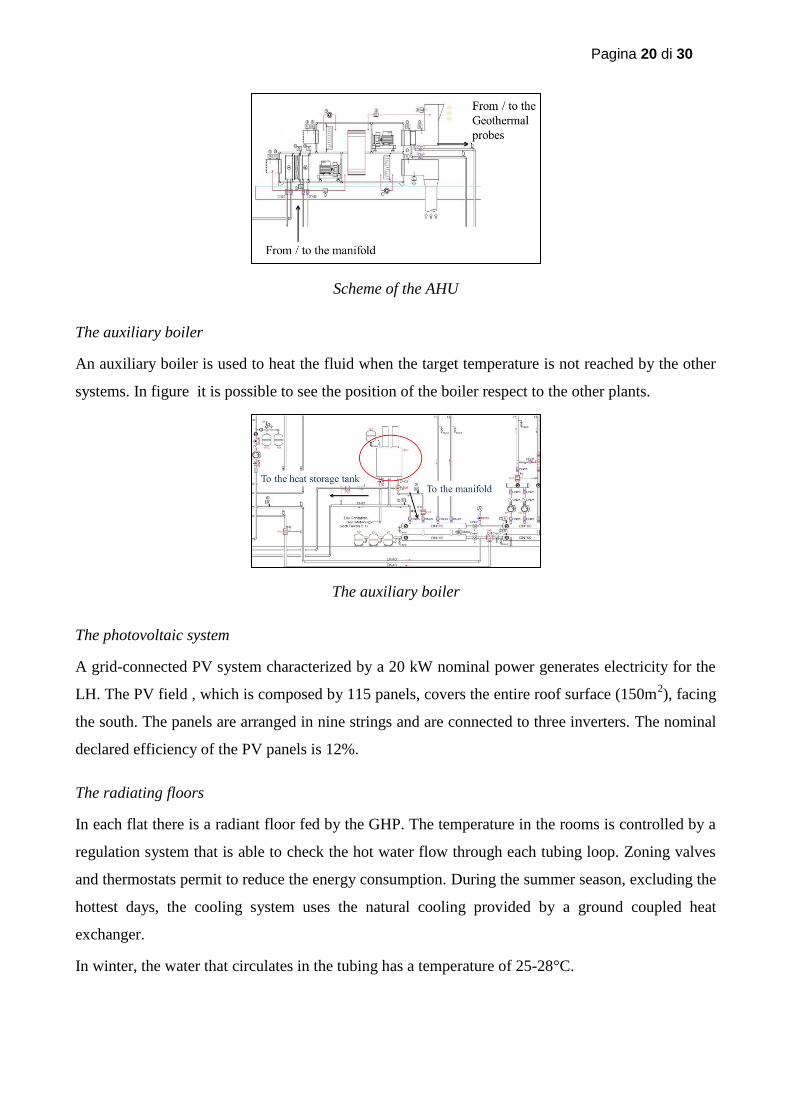
Pagina 20 di 30
Scheme of the AHU
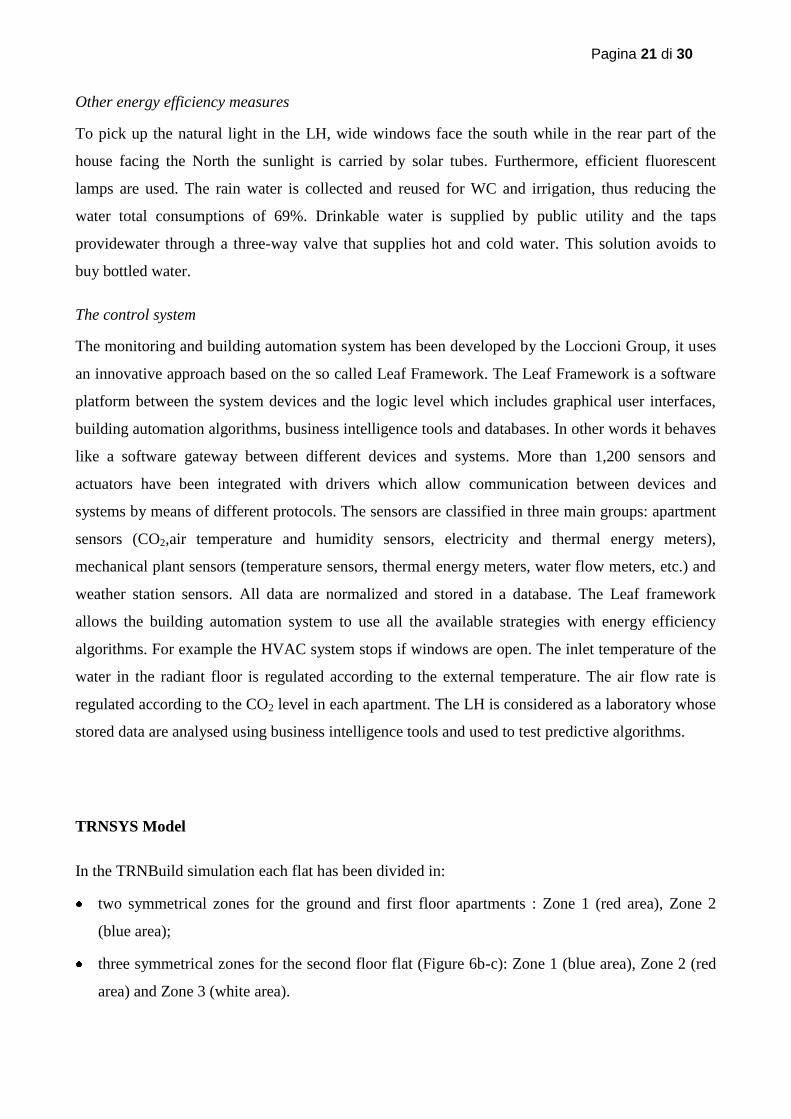
The auxiliary boiler
An auxiliary boiler is used to heat the fluid when the target temperature is not reached by the other
systems. In figure it is possible to see the position of the boiler respect to the other plants.
The auxiliary boiler
The photovoltaic system
A grid-connected PV system characterized by a 20 kW nominal power generates electricity for the
LH. The PV field , which is composed by 115 panels, covers the entire roof surface (150m2), facing
the south. The panels are arranged in nine strings and are connected to three inverters. The nominal
declared efficiency of the PV panels is 12%.
The radiating floors
In each flat there is a radiant floor fed by the GHP. The temperature in the rooms is controlled by a
regulation system that is able to check the hot water flow through each tubing loop. Zoning valves
and thermostats permit to reduce the energy consumption. During the summer season, excluding the
hottest days, the cooling system uses the natural cooling provided by a ground coupled heat
exchanger.
In winter, the water that circulates in the tubing has a temperature of 25-28°C.
Pagina 21 di 30
Other energy efficiency measures
To pick up the natural light in the LH, wide windows face the south while in the rear part of the
house facing the North the sunlight is carried by solar tubes. Furthermore, efficient fluorescent
lamps are used. The rain water is collected and reused for WC and irrigation, thus reducing the
water total consumptions of 69%. Drinkable water is supplied by public utility and the taps
providewater through a three-way valve that supplies hot and cold water. This solution avoids to
buy bottled water.
The control system
The monitoring and building automation system has been developed by the Loccioni Group, it uses
an innovative approach based on the so called Leaf Framework. The Leaf Framework is a software
platform between the system devices and the logic level which includes graphical user interfaces,
building automation algorithms, business intelligence tools and databases. In other words it behaves
like a software gateway between different devices and systems. More than 1,200 sensors and
actuators have been integrated with drivers which allow communication between devices and
systems by means of different protocols. The sensors are classified in three main groups: apartment
sensors (CO2,air temperature and humidity sensors, electricity and thermal energy meters),
mechanical plant sensors (temperature sensors, thermal energy meters, water flow meters, etc.) and
weather station sensors. All data are normalized and stored in a database. The Leaf framework
allows the building automation system to use all the available strategies with energy efficiency
algorithms. For example the HVAC system stops if windows are open. The inlet temperature of the
water in the radiant floor is regulated according to the external temperature. The air flow rate is
regulated according to the CO2 level in each apartment. The LH is considered as a laboratory whose
stored data are analysed using business intelligence tools and used to test predictive algorithms.
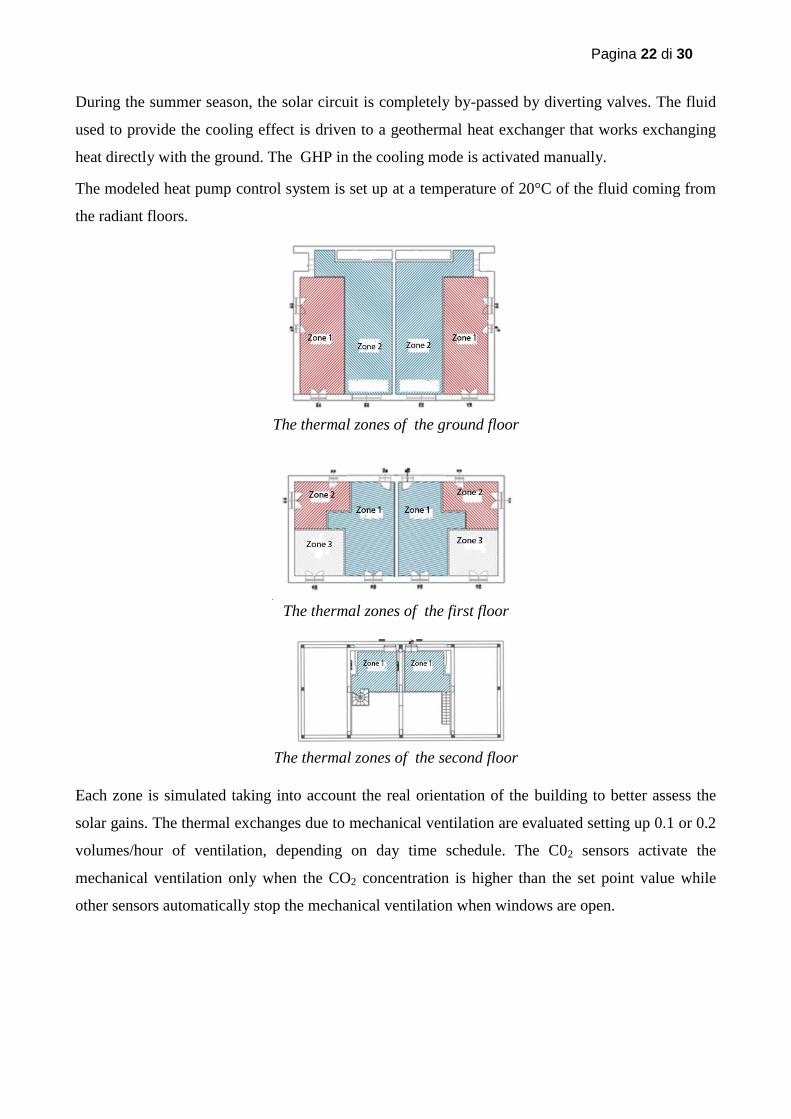
TRNSYS Model
In the TRNBuild simulation each flat has been divided in:
two symmetrical zones for the ground and first floor apartments : Zone 1 (red area), Zone 2
(blue area);
three symmetrical zones for the second floor flat (Figure 6b-c): Zone 1 (blue area), Zone 2 (red
area) and Zone 3 (white area).
Pagina 22 di 30
During the summer season, the solar circuit is completely by-passed by diverting valves. The fluid
used to provide the cooling effect is driven to a geothermal heat exchanger that works exchanging
heat directly with the ground. The GHP in the cooling mode is activated manually.
The modeled heat pump control system is set up at a temperature of 20°C of the fluid coming from
the radiant floors.
The thermal zones of the ground floor
The thermal zones of the first floor
The thermal zones of the second floor
Each zone is simulated taking into account the real orientation of the building to better assess the
solar gains. The thermal exchanges due to mechanical ventilation are evaluated setting up 0.1 or 0.2
volumes/hour of ventilation, depending on day time schedule. The C02 sensors activate the
mechanical ventilation only when the CO2 concentration is higher than the set point value while
other sensors automatically stop the mechanical ventilation when windows are open.

Pagina 23 di 30
Example of the mechanical ventilation daily schedule for flats 1-4
The thermal gains of the zones are calculated through the TRNSYS “Gains” function : a detailed
function that considers the number of people inside the house at all hours of the day, every day.
Furthermore, different activity levels for the people in the house were set up.
To obtain reliable results we have developed a data climate file containing the climate time series of
2009 collected by the LH weather station.
Example of the occupancy level daily schedule for flats 1-4
Results of the simulation
Photovoltaic model
The monitored data for 2009 show an energy production of 25651 kWh from the photovoltaic
panels. The simulated production from TRNSYS is 25143 kWh for the year, while the PVSYST

Pagina 24 di 30
simulation gives as result 24160 kWh / year. The precision of the two results is high enough to
consider significant and solid the two models.
Both approaches give a lower value than the monitored one : the TRNSYS model has an error of the
2 %, while the PVSYST reaches the 6 %.
The results are summarized in the following graph.
Monitored and simulated photovoltaic energy production
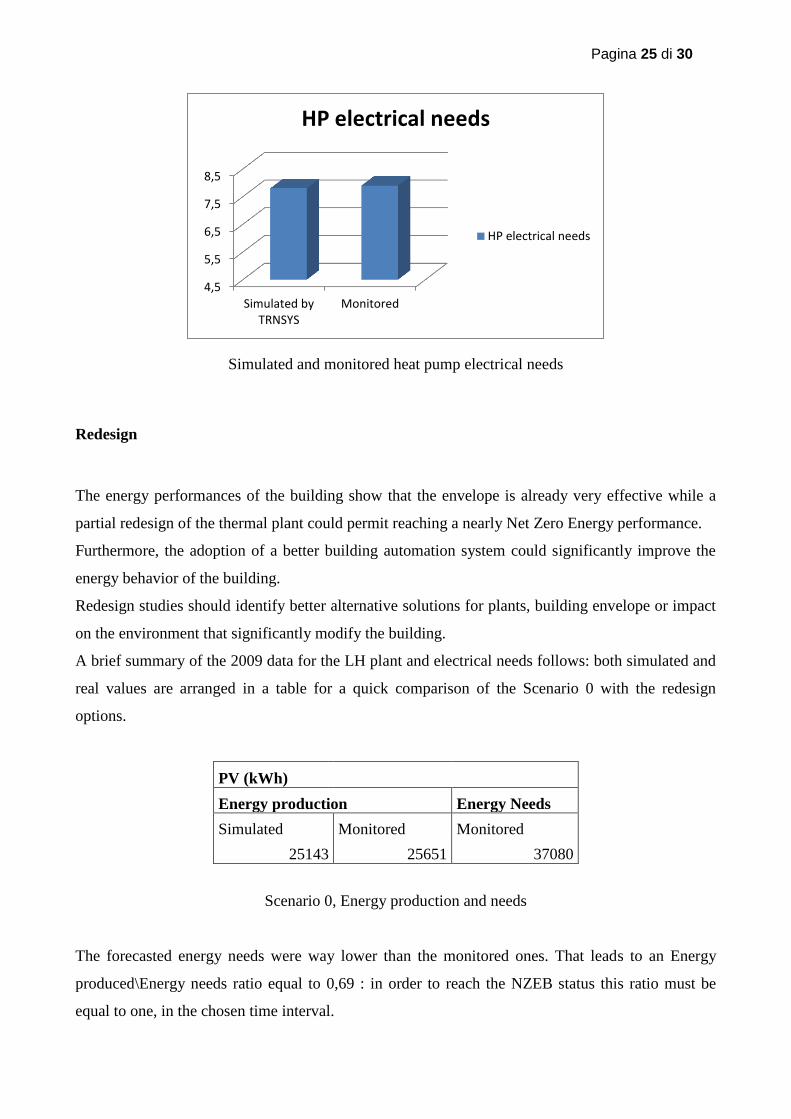
HVAC model
The calibration of the model has been made on both the temperature results compared to the
average values in the year and on the heat pump electricity demands, calculated by TRNSYS.
The heat pump electricity absorption results will be briefly described.
The real HP uses nearly 5.3 MWh for the heating season and 2.6 MWh for the cooling one. The
simulated data for the heating season is close to 4,7 MWh while the simulated cooling consumption
is 2.7 MWh. Those data are close enough to claim the simulation results as acceptable: the
difference between simulated and monitored data is around 6 %.
16000
18000
20000
22000
24000
26000
PV Energy production
PV Energy production
Pagina 25 di 30
Simulated and monitored heat pump electrical needs
Redesign
The energy performances of the building show that the envelope is already very effective while a
partial redesign of the thermal plant could permit reaching a nearly Net Zero Energy performance.
Furthermore, the adoption of a better building automation system could significantly improve the
energy behavior of the building.
Redesign studies should identify better alternative solutions for plants, building envelope or impact
on the environment that significantly modify the building.
A brief summary of the 2009 data for the LH plant and electrical needs follows: both simulated and
real values are arranged in a table for a quick comparison of the Scenario 0 with the redesign
options.
PV (kWh)
Energy production Energy Needs
Simulated Monitored Monitored
25143 25651 37080
Scenario 0, Energy production and needs
The forecasted energy needs were way lower than the monitored ones. That leads to an Energy
produced\Energy needs ratio equal to 0,69 : in order to reach the NZEB status this ratio must be
equal to one, in the chosen time interval.
4,5
5,5
6,5
7,5
8,5
Simulated byTRNSYS
Monitored
HP electrical needs
HP electrical needs
Pagina 26 di 30
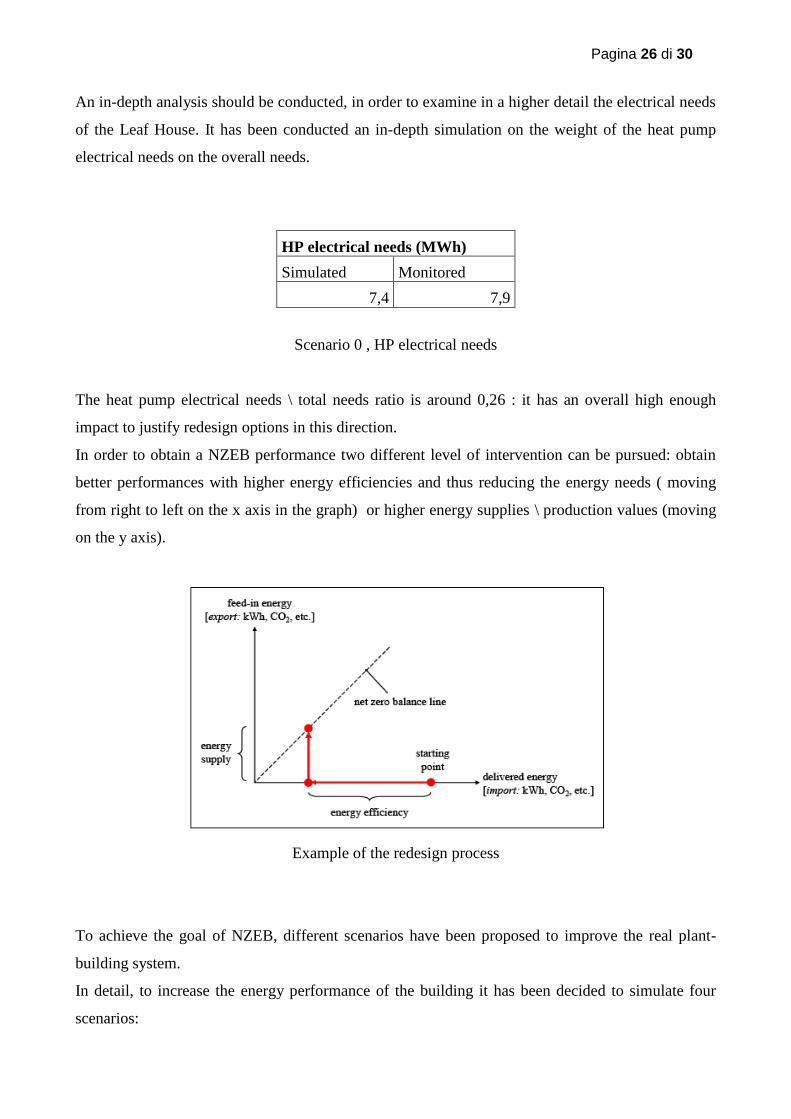
An in-depth analysis should be conducted, in order to examine in a higher detail the electrical needs
of the Leaf House. It has been conducted an in-depth simulation on the weight of the heat pump
electrical needs on the overall needs.
HP electrical needs (MWh)
Simulated Monitored
7,4 7,9
Scenario 0 , HP electrical needs
The heat pump electrical needs \ total needs ratio is around 0,26 : it has an overall high enough
impact to justify redesign options in this direction.
In order to obtain a NZEB performance two different level of intervention can be pursued: obtain
better performances with higher energy efficiencies and thus reducing the energy needs ( moving
from right to left on the x axis in the graph) or higher energy supplies \ production values (moving
on the y axis).
Example of the redesign process
To achieve the goal of NZEB, different scenarios have been proposed to improve the real plant-
building system.
In detail, to increase the energy performance of the building it has been decided to simulate four
scenarios:
Pagina 27 di 30
Scenario 1: Increase PV energy production;
Scenario 2: A more efficient GHP (COP 4.6);
Scenario 3 : Elimination of the heat pump heat exchanger and the use of glycol-water in the
main system line,
Scenario 4 : Combination of scenario 2 and 3.
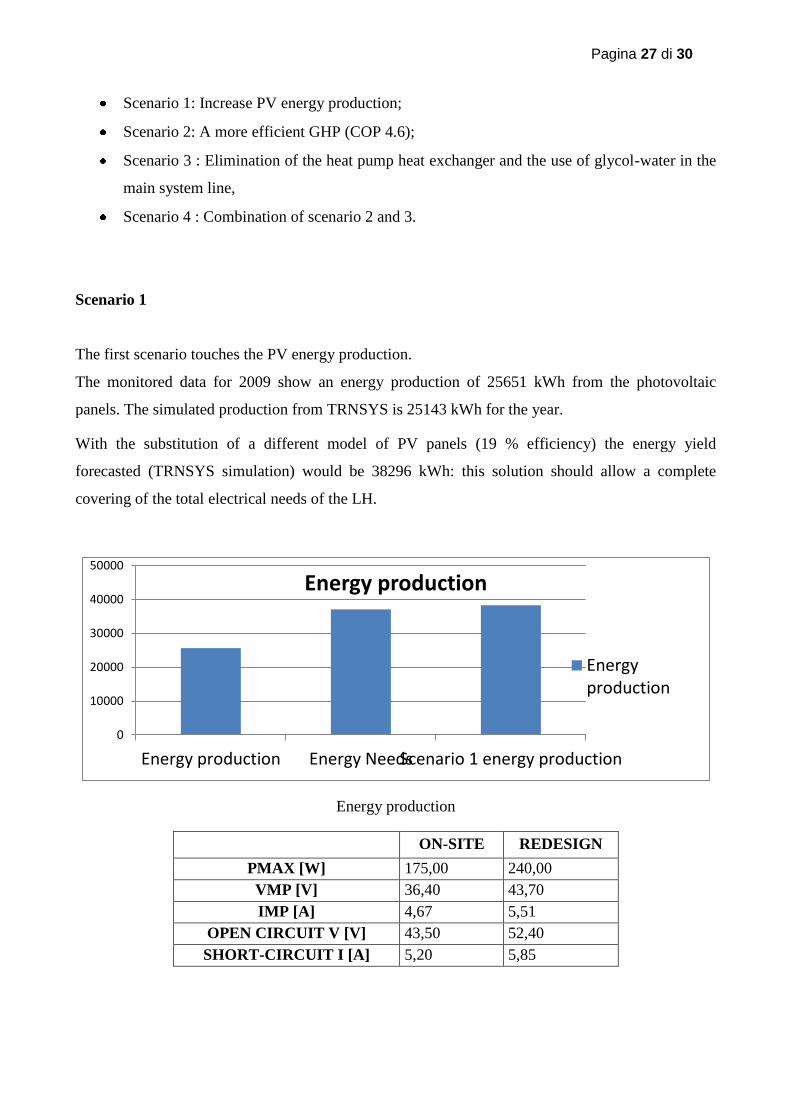
Scenario 1
The first scenario touches the PV energy production.
The monitored data for 2009 show an energy production of 25651 kWh from the photovoltaic
panels. The simulated production from TRNSYS is 25143 kWh for the year.
With the substitution of a different model of PV panels (19 % efficiency) the energy yield
forecasted (TRNSYS simulation) would be 38296 kWh: this solution should allow a complete
covering of the total electrical needs of the LH.
Energy production
ON-SITE REDESIGN
PMAX [W] 175,00 240,00
VMP [V] 36,40 43,70
IMP [A] 4,67 5,51
OPEN CIRCUIT V [V] 43,50 52,40
SHORT-CIRCUIT I [A] 5,20 5,85
0
10000
20000
30000
40000
50000
Energy production Energy NeedsScenario 1 energy production
Energy production
Energyproduction

Pagina 28 di 30
Scenario 2
The second scenario takes in consideration a COP higher than the one resulting from monitored
data. A 4.6 COP heat pump simulated with the same model and assumptions gives an overall yearly
data of around 5.4 MWh.
This value is 2 MWh (26 % lower ) lower than the scenario 0 simulated one.
Scenario 2
Scenario 3
The third hypothesis was the elimination of the heat pump heat exchanger and the use of glycol-
water in the main system line.
Real plant scheme Scenario 3
0 2000 4000 6000 8000
4.6COP
RealCOP
HP electrical needs
HP electricalneeds

Pagina 29 di 30
The impact on the overall electrical needs was significant: around 500 kWh were saved during the
year. While simulated needs were 7524 kWh, the simulated results of this redesign option are 7020
kWh.
Hp electrical needs, scenario 3
Scenario 4
The combination of the adoption of a more efficient GHP proposed in the scenario 2 and the new
system configuration described in the scenario 3 leads to an energy saving of around 400 kWh on
the energy needs forecasted in the second scenario.
The energy needs forecasted are around 5 MWh for the year taken in consideration.
HP energy needs ( kWh)
0 2000 4000 6000 8000
Simulated needs
Simulated needs,redesign
HP Electrical needs
HP electrical needs
0
1000
2000
3000
4000
5000
6000
Scenario 4 Scenario 2
Energy needs

Pagina 30 di 30
The substitution of the PV panels allows the possibility to reach the NZEB standards with no other
interventions. However further investigations on the GHP shows that achieving 2 MWh savings or
more is possible by choosing another heat pump with better performances.
The results are summarized in the following tabs.
Scenario Simulated PV production MonitoredPV production Energy needs
0 25143 25651 37080
1 38296 37080
PV re-design options (kWh)
Scenario Monitored Simulated
0 7,9 7,5
2 5,4
3 7
4 5
HP-related re-design options (MWh)
The best option is the combination of scenarios 1 and 4.