Ovary Reserve Dr. Vincenzo Volpicelli. Legge 40/2004 esclude la fecondazione eterologa permette la...
37
Ovary Ovary Reserve Reserve Dr. Vincenzo Volpicell
-
Upload
briana-hampton -
Category
Documents
-
view
219 -
download
0
Transcript of Ovary Reserve Dr. Vincenzo Volpicelli. Legge 40/2004 esclude la fecondazione eterologa permette la...

Ovary Ovary
ReserveReserve
Dr. Vincenzo Volpicelli

Legge 40/2004Legge 40/2004esclude la esclude la fecondazione eterologafecondazione eterologa permette la permette la fecondazione assistitafecondazione assistita solo alle solo alle coppie eterosessuali in età fertile e dopo coppie eterosessuali in età fertile e dopo accertamento di sterilità o infertilità accertamento di sterilità o infertilità fecondazione ≤3 ovuli fecondazione ≤3 ovuli E-T di tutti gli embrioni ottenuti E-T di tutti gli embrioni ottenuti congelamento degli embrioni congelamento degli embrioni costringe la donna all'impianto di tutti gli costringe la donna all'impianto di tutti gli embrioni ottenuti (anche quelli malati) senza che embrioni ottenuti (anche quelli malati) senza che vi sia la possibilità per la donna di interrompere il vi sia la possibilità per la donna di interrompere il trattamento trattamento ammette l’obiezione di coscienza ammette l’obiezione di coscienza

Art. 13 legge 40Art. 13 legge 40
PGDPGD

Legge 19 febbraio 2004, n. 40"Norme in materia di procreazione medicalmente assistita"
pubblicata nella Gazzetta Ufficiale n. 45 del 24 febbraio 2004
ReferendumReferendum
Giugno 2005Giugno 2005


hypothalam
us hypophysis
ovaryaxis
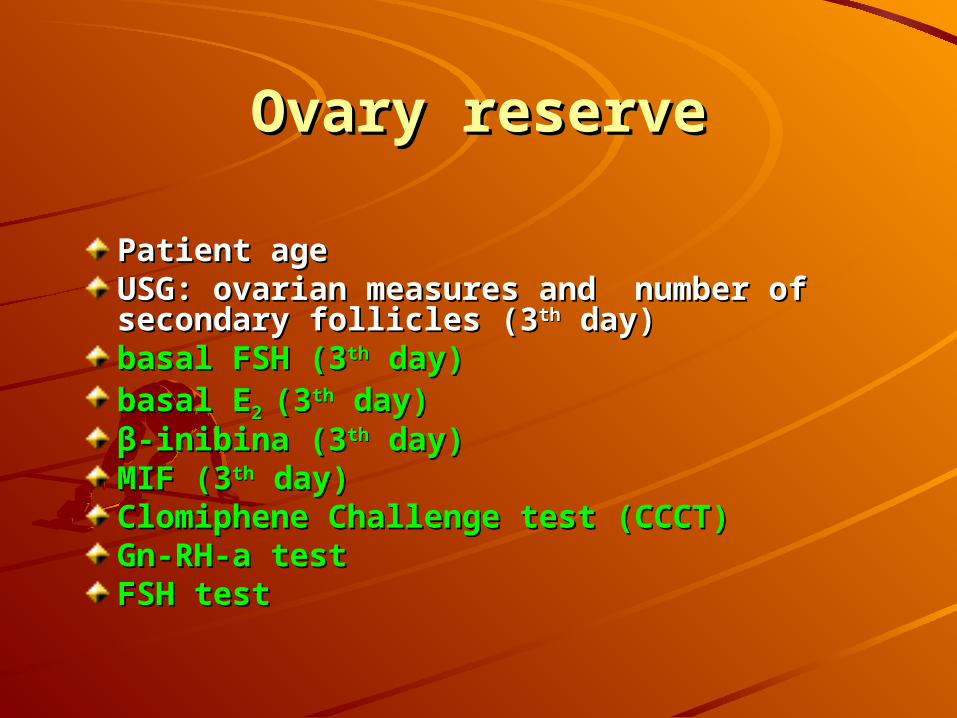
Ovary reserveOvary reserve
Patient agePatient ageUSG: ovarian measures and number of USG: ovarian measures and number of secondary follicles (3secondary follicles (3thth day) day)basal FSH (3basal FSH (3thth day) day) basal Ebasal E2 2 (3(3thth day) day) ββ-inibina (3-inibina (3thth day) day) MIF (3MIF (3thth day) day) Clomiphene Challenge test (CCCT)Clomiphene Challenge test (CCCT)Gn-RH-a testGn-RH-a testFSH testFSH test

Female age•is very important in consideration of probability for conception because it is very much related to egg quality.
•A 45 year old can have good quality eggs (for her age) and still be fertile, although this is quite uncommon.
•At the other extreme, a 25 year old can have very poor quality eggs and be infertile - unless she uses donor eggs.
•These are extreme examples, but the point is that egg quantity and quality tends to decline significantly in the 30s and faster in the early 40s, but egg quantity and quality in an individual woman can be average for her age, better than average, or worse than average.

median volumes of the left and right median volumes of the left and right ovariesovaries
no significant differences no significant differences
4.6 and 4.8 cm4.6 and 4.8 cm33, respectively; , respectively; interquartile range 3.0–7.3 and 3.1–interquartile range 3.0–7.3 and 3.1–7.9; 7.9; PP = .79). = .79).

Age/FSH/follicles/ovarian volumeAge/FSH/follicles/ovarian volume
significant significant positive correlation between age and FSH level positive correlation between age and FSH level ((RR = .372, = .372, PP < .001), < .001),
but not between age and ovarian volumebut not between age and ovarian volume ( (RR = .039, = .039, PP = .69). = .69).
A significant relation between FSH and the number of A significant relation between FSH and the number of folliclesfollicles ( (HH = 20.8, = 20.8, PP < .001), < .001), but not between FSH and but not between FSH and volumevolume ( (RR = .102, = .102, PP = .29). = .29).
There is There is a significant decrease in the number of a significant decrease in the number of folliclesfollicles and a higher cycle cancellation rate in women with and a higher cycle cancellation rate in women with volume smaller than volume smaller than 3 cm3 cm33 compared with those with compared with those with volume greater than 3 cmvolume greater than 3 cm33..
The mean ovarian volume was 6.0 ± 4.7 cm3 (67).The mean ovarian volume was 6.0 ± 4.7 cm3 (67).

Age/n. folliclesAge/n. follicles
red line: 37.5 yearsred line: 37.5 years
n. follicles: 25.000n. follicles: 25.000

Oocyte-sperm interaction Oocyte-sperm interaction

n. follicles/patient’s agen. follicles/patient’s age
0
0,5
1
1,5
2
2,5
3
3,5
4
4,5
5
5,5
6
6,5
7
7,5
8
0 w
4 w
8 w
12
w
16
w
20
w
24
w
28
w
32
w
36
w
40
w
bo
rne
10
y
16
y
20
y
30
y
40
y
50
y
60
y
mil
lio
n
0102030405060
<5 >5 >7
number of eggs retrieved
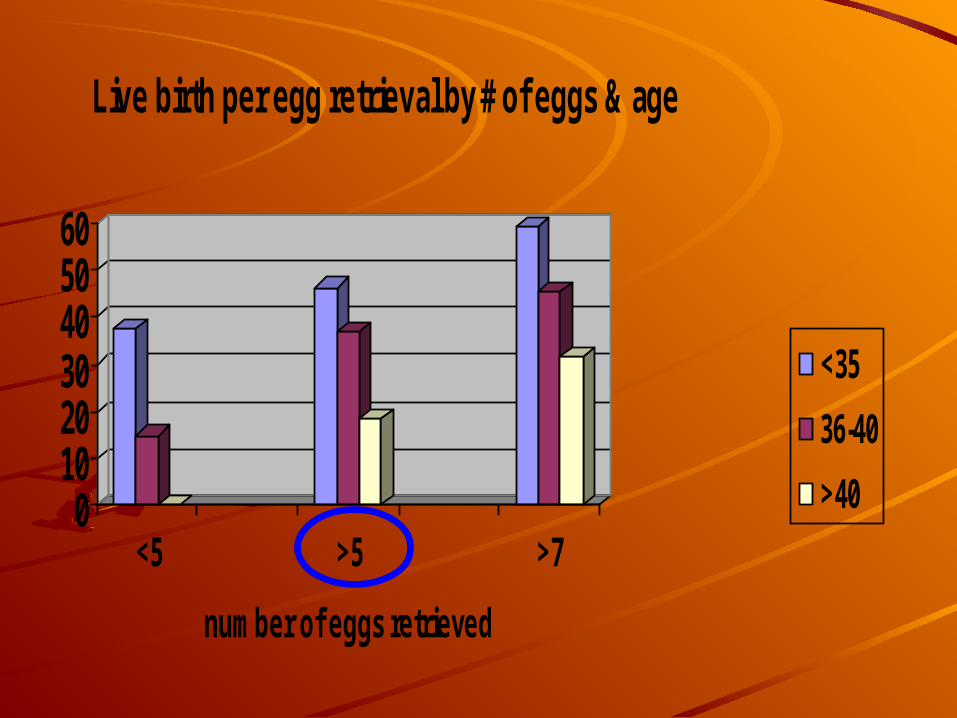
Live birth per egg retrieval by # of eggs & age
<35
36-40
>40

Number of eggs retrieved and IVF pregnancy Number of eggs retrieved and IVF pregnancy and success rates according to female ageand success rates according to female age
The data in the graph above indicates that:The data in the graph above indicates that:
Women under 35 in our IVF program (on the average) Women under 35 in our IVF program (on the average) have good live birth rates, even with less than 5 eggs, have good live birth rates, even with less than 5 eggs, and do better if we get more than 5 eggs, and best and do better if we get more than 5 eggs, and best with more than 7 eggswith more than 7 eggsWomen 35-39 (on the average) have low live birth Women 35-39 (on the average) have low live birth rates with less than 5 eggs, which are substantially rates with less than 5 eggs, which are substantially better with 5-7, and best with more than 7 eggsbetter with 5-7, and best with more than 7 eggsWomen 40-42 do very poorly if we get less than 5 Women 40-42 do very poorly if we get less than 5 eggs, have reasonable live birth rates with 5-7 eggs, eggs, have reasonable live birth rates with 5-7 eggs, and best with more than 7 eggsand best with more than 7 eggs
This is another example of decreasing egg quality This is another example of decreasing egg quality with increasing female age. As women age, we need with increasing female age. As women age, we need more eggs to be able to make IVF work - because the more eggs to be able to make IVF work - because the lower quality of the eggs.lower quality of the eggs.

Graf. 1 - In vitro fertilization performance and pregnancy outcome according to age and basal FSH levels
0
5
10
15
20
25
30
35
40
16 18 20 22 24 26 28 30 32 34 36 38 40 42
years
Volume ovarico
Follic FSH <10
Follicoli FSH >10
FSH base
FSH/LH
Fertil FSH >10
Fertil FSH <10
Ongoing preg FSH<10Ongoing preg FSH>10Peaked E2 <10
Peaked E2 >10
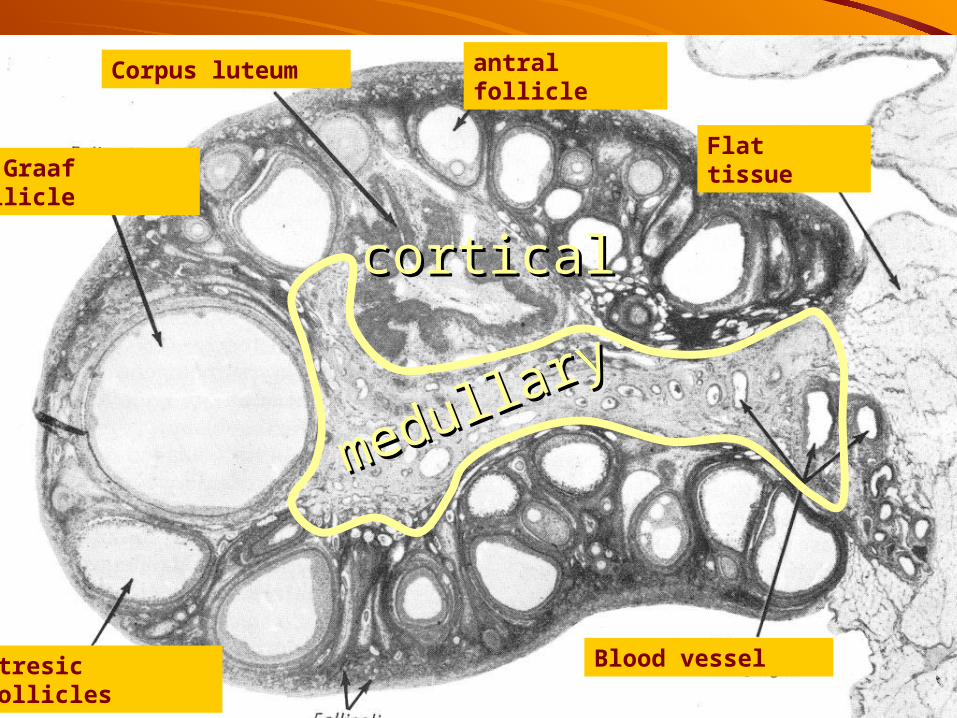
corticalcortical
medullary
medullary
primary follicles
atresic follicles
de Graaf follicle
Blood vessel
Flat tissue
antral follicleCorpus luteum
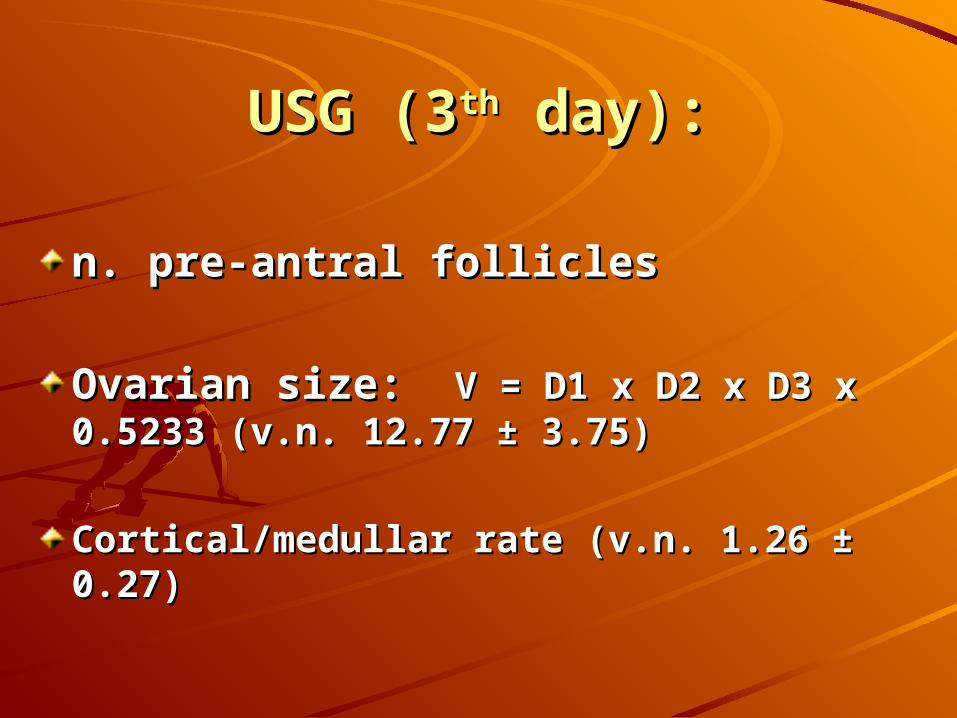
USG (3USG (3thth day): day):
n. pre-antral follicles n. pre-antral follicles
Ovarian size: Ovarian size: V = D1 x D2 x D3 x V = D1 x D2 x D3 x 0.5233 (v.n. 12.77 0.5233 (v.n. 12.77 ± 3.75)± 3.75)
Cortical/medullar rate (v.n. 1.26 Cortical/medullar rate (v.n. 1.26 ± 0.27)± 0.27)

Number of eggs retrieved and IVF pregnancy Number of eggs retrieved and IVF pregnancy success rates according to female agesuccess rates according to female age
antral follicles count is the best predictor of the response that the ovaries will give, and the number of eggs that will be retrieved.To some extent, the more eggs we have to work with, the greater the chance that IVF will be successful. There are several issues involved with this:
1. More eggs - will give more fertlized eggs 2. More embryos for E-T 3. Women that respond well to the drugs sometimes
will also have better quality eggs as well - which will be more likely to develop into quality embryos
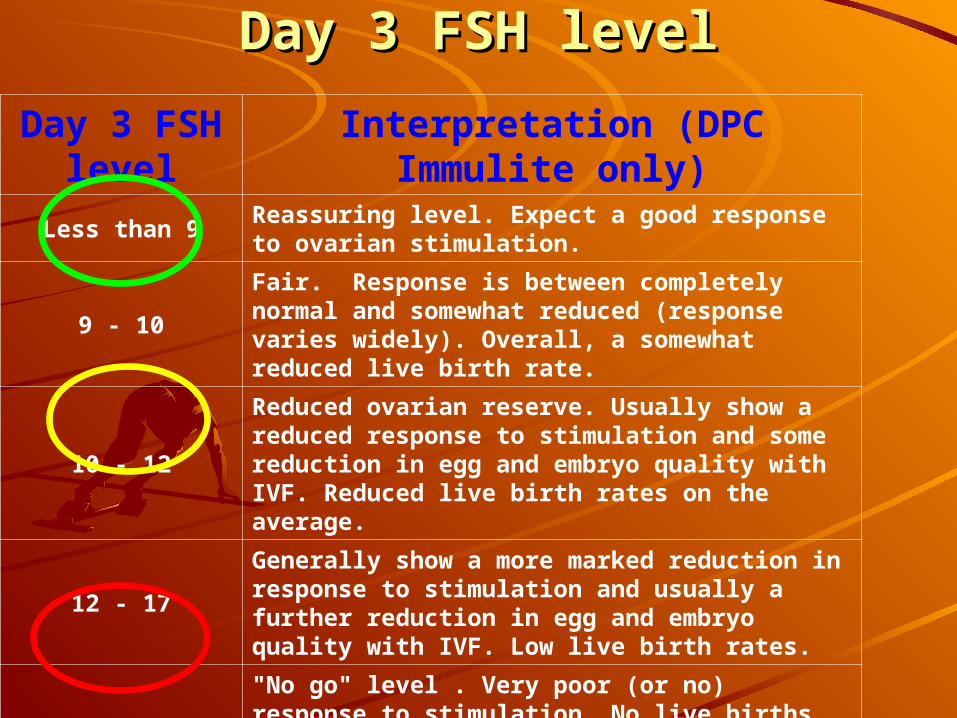
Day 3 FSH level
Interpretation (DPC Immulite only)
Less than 9Reassuring level. Expect a good response to ovarian stimulation.
9 - 10Fair. Response is between completely normal and somewhat reduced (response varies widely). Overall, a somewhat reduced live birth rate.
10 - 12
Reduced ovarian reserve. Usually show a reduced response to stimulation and some reduction in egg and embryo quality with IVF. Reduced live birth rates on the average.
12 - 17Generally show a more marked reduction in response to stimulation and usually a further reduction in egg and embryo quality with IVF. Low live birth rates.
Over 17"No go" level . Very poor (or no) response to stimulation. No live births. "No go" levels must be individualized for the particular lab assay and IVF center.
Day 3 FSH levelDay 3 FSH level
Some caveats about day 3 FSH Some caveats about day 3 FSH testingtesting
In general, ovarian reserve and egg quantity is as In general, ovarian reserve and egg quantity is as bad as worst FSH. bad as worst FSH. If you have an FSH of 15 in one cycle and have it If you have an FSH of 15 in one cycle and have it repeated in another cycle and get a 7 - the situation repeated in another cycle and get a 7 - the situation is not improving. Some women do "bounce around" is not improving. Some women do "bounce around" with FSH levels in the normal to abnormal range - with FSH levels in the normal to abnormal range - but they will generally respond and have chances for but they will generally respond and have chances for pregnancy more like those women who are pregnancy more like those women who are consistently at their higher FSH level.consistently at their higher FSH level.Waiting for a menstrual cycle with a lower FSH level Waiting for a menstrual cycle with a lower FSH level and then stimulating quickly for IVF is probably of no and then stimulating quickly for IVF is probably of no benefit at all.benefit at all.Young (e.g. under 35) women with elevated FSH Young (e.g. under 35) women with elevated FSH levels stimulate better and have a higher pregnancy levels stimulate better and have a higher pregnancy potential than "older" women.potential than "older" women.
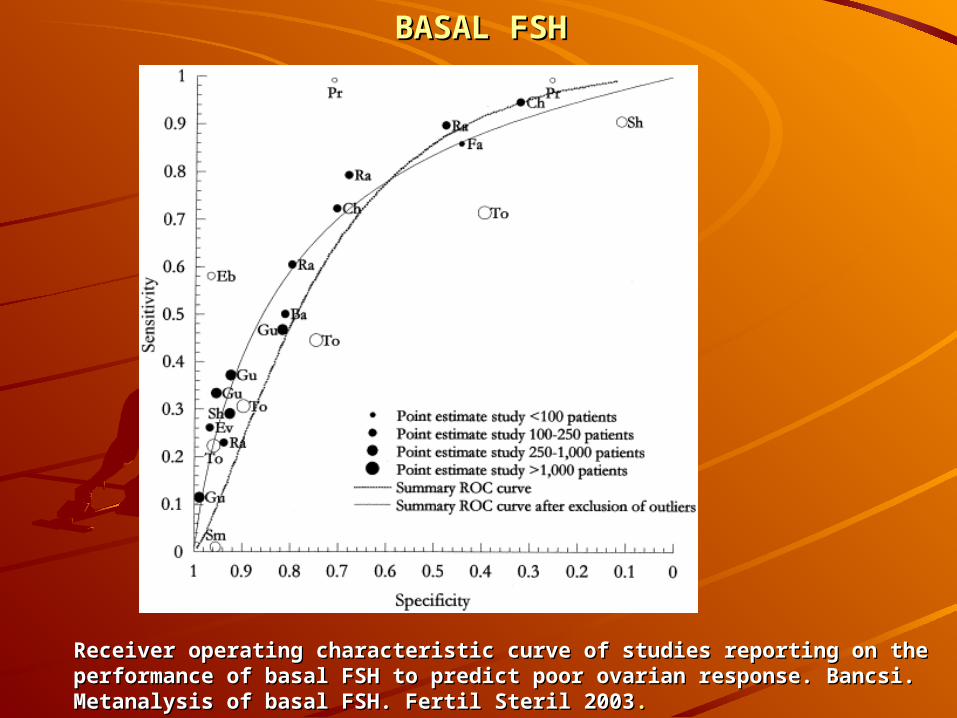
BASAL FSHBASAL FSH
Receiver operating characteristic curve of studies reporting on the Receiver operating characteristic curve of studies reporting on the performance of basal FSH to predict poor ovarian response. Bancsi. performance of basal FSH to predict poor ovarian response. Bancsi. Metanalysis of basal FSH. Fertil Steril 2003Metanalysis of basal FSH. Fertil Steril 2003..

Day 3 estradiolDay 3 estradiol
relatively newrelatively new about 80 pg/mlabout 80 pg/ml "masking" the "masking" the poor ovarian poor ovarian reservereserve
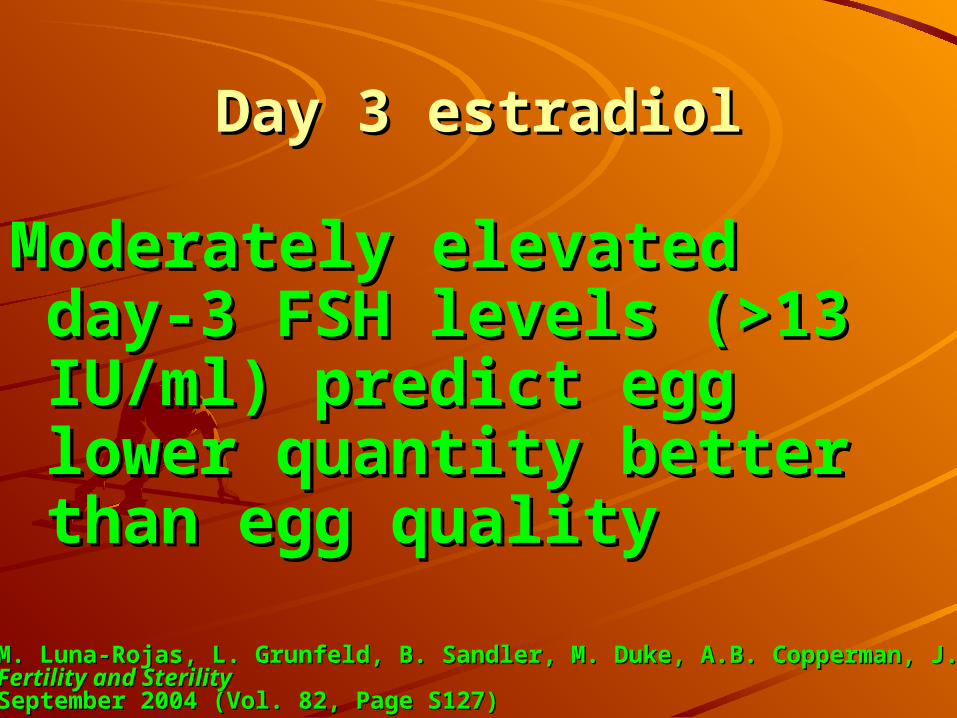
Day 3 estradiolDay 3 estradiol
Moderately elevated Moderately elevated day-3 FSH levels (>13 day-3 FSH levels (>13 IU/ml) predict egg IU/ml) predict egg lower quantity better lower quantity better than egg qualitythan egg quality
M. Luna-Rojas, L. Grunfeld, B. Sandler, M. Duke, A.B. Copperman, J. Barritt M. Luna-Rojas, L. Grunfeld, B. Sandler, M. Duke, A.B. Copperman, J. Barritt Fertility and SterilityFertility and Sterility September 2004 (Vol. 82, Page S127)September 2004 (Vol. 82, Page S127)

ββ--inhibininhibin
ββ-inhibin (granulosa cells): -inhibin (granulosa cells):
<45 pg/ml <45 pg/ml PR 28% PR 28%
≥≥45 pg/ml 45 pg/ml PR 95% PR 95%
very low in women over 35 of agevery low in women over 35 of age
ββ-inhibin physiology-inhibin physiology
FSH + + + FSH + + +
IGF-1 + + + IGF-1 + + +
Gn- RH - - -Gn- RH - - -
In turn, inhibin suppresses In turn, inhibin suppresses FSHFSH

ββ-inhibin-inhibin valuesvalues
<45 pg/ml <45 pg/ml PR 28% PR 28%
≥≥45 pg/ml 45 pg/ml PR 95% PR 95%
over 35 and endometriosi over 35 and endometriosi

Clomiphene challenge test Clomiphene challenge test
CCCT is a dynamic type of test CCCT is a dynamic type of test that can discover some cases of that can discover some cases of poor ovarian reserve that are poor ovarian reserve that are still showing a normal day 3 FSH. still showing a normal day 3 FSH.
hypothalamic-hypophysial-hypothalamic-hypophysial-ovarian axis completenessovarian axis completeness

Clomiphene challenge test Clomiphene challenge test This test is done by:This test is done by:
1. Obtaining a day 3 FSH and estradiol1. Obtaining a day 3 FSH and estradiol 2. The woman takes two tablets of 2. The woman takes two tablets of
clomiphene (100 mg) on days 5-9 of the clomiphene (100 mg) on days 5-9 of the cyclecycle
3. Repeat an FSH level on day 10 of the 3. Repeat an FSH level on day 10 of the cyclecycle
The normal test would show:The normal test would show:– a low FSH, LH and Ea low FSH, LH and E22 on day 3 on day 3– more 2 increased FSH, LH and Emore 2 increased FSH, LH and E22 on day 10 on day 10

Clomiphene challenge testClomiphene challenge test
Expected Values:Expected Values:
cycle day 3 cycle day 3 E2 65-E2 65-7070
FSH <10 FSH <10
cycle day cycle day 10-11 10-11
LH <10 LH <10 FSH <10 FSH <10

Response to to ovarian stimulation with FSH Response to to ovarian stimulation with FSH and antral follicles countand antral follicles count
This is not really a "test" that we do to help This is not really a "test" that we do to help us determine egg quantity and quality - it is us determine egg quantity and quality - it is part of a treatment for infertility. part of a treatment for infertility. However, the response of the ovaries when However, the response of the ovaries when the woman takes the woman takes injectable FSHinjectable FSH for for stimulation is often very predictive of the stimulation is often very predictive of the egg quantity and, therefore, also the egg quantity and, therefore, also the relative chances for success with infertility relative chances for success with infertility treatment.treatment.Response to stimulation and antral follicle countsResponse to stimulation and antral follicle counts are important predictors of outcome, and are important predictors of outcome, and are discussed in detail on the next slide.are discussed in detail on the next slide.

Response to ovarian stimulation with Response to ovarian stimulation with FSH and EFSH and E22 testing testing
75 UI FSH injection on day 3 75 UI FSH injection on day 3
testing both the baseline and 24 hour testing both the baseline and 24 hour post-injection estradiolpost-injection estradiol
If the estradiol response and antral If the estradiol response and antral follicle number are poor, ovarian follicle number are poor, ovarian reserve and egg quantity are also reserve and egg quantity are also likely to be poor. likely to be poor.

Gn-RH-a test/EGn-RH-a test/E2 rising2 rising
Pattern APattern A: early rising followed by : early rising followed by fall of estradiol level after 4 daysfall of estradiol level after 4 days
Pattern BPattern B: estradiol slow rising and : estradiol slow rising and slow fall on 6slow fall on 6th th day day
Pattern CPattern C: persistent estradiol rising: persistent estradiol rising
Pattern DPattern D: no answer: no answer

Gn-RH-a pattern/PRGn-RH-a pattern/PR
0%
10%
20%
30%
40%
50%
A B C D

Poor responsePoor response— the devil is in the definition — the devil is in the definition
The original definition of low The original definition of low response to ovarian response by response to ovarian response by Garcia et Acosta was based on low Garcia et Acosta was based on low peak E2 concentrations alone. peak E2 concentrations alone.
They stimulated patients with hMG They stimulated patients with hMG (150 IU IM daily) and defined low (150 IU IM daily) and defined low responders as patients with a peak responders as patients with a peak E2 concentration of <300 pg/mL E2 concentration of <300 pg/mL

Poor responders Poor responders
diminished ovarian reserve diminished ovarian reserve
EE22 < 500 pg/mL on day of hCG < 500 pg/mL on day of hCG
<4 de Graaf follicles on day of hCG<4 de Graaf follicles on day of hCG
lower fertilization rates lower fertilization rates
lower cleavage rates lower cleavage rates
lower resulting embryoslower resulting embryos
lower pregnancy rates lower pregnancy rates

THE THE ENDEND