Observation of electromagnetic interactions of high energy muons deep underground
11
PHYSICAL REVIEW D VOLUME 52, NUMBER 5 1 SEPTEMBER 1995 Observation of electromagnetic interactions of high energy muons deep underground C. Castagnoli, A. Castellina, and 0. Saavedra Istituto di Cosmogeofisica del Consiglio Nazionale delle Ricerche, cs. Fiume 4, 10133 Torino, Italy and Istituto di Fisica Genemle dell'Universita' di Torino, Torino, Italy T. M. Kirina, R. P. Kokoulin, and A. A. Petrukhin Moscow Engineering Physics Institute, 115409 Moscow, Russia (Received 10 May 1994) The first experimental measurement of the spectrum of cascade showers produced by cosmic ray muon interactions deep underground in the transferred energy range 0.4-200 GeV has been performed by means of the NUSEX calorimeter at a depth of about 5000 hg/cm2, the average muon energy being close to 360 GeV. The spectrum of energy transfers is in good agreement with calculations based on the commonly used theoretical formulas for muon interaction cross sections and on a conservative picture of the formation of muon energy spectrum at great depths. The present data do not confirm the deficit of the cross section at low energy transfers for the 1 TeV muon energy recently reported by the CCFR Collaboration. A possible explanation of the difference between the observed and the expected stochastic energy loss distributions presented by the CCFR group is discussed. PACS number(s): 95.85.Ry, 13.10.+q, 95.55.Vj I. INTRODUCTION A correct knowledge of the muon interaction cross sec- tion and energy loss rate is important for the interpreta- tion of experimental results and the planning of new ex- periments both at accelerators and in cosmic rays. The attention to this problem is also raised by some evidence for a deviation of the cross section from the commonly used theoretical formulas. For example, in the recently published results of the CCFR Collaboration [I], the ob- served stochastic energy loss distribution for high muon energies (around 1 TeV) at low energy transfers appears considerably lower than the expected one, indicating a 30% deficit of the cross section in comparison with the theoretical prediction at relative transfers v e Only a few measurements of the electromagnetic interac- tion cross sections for high energy muons exist. Because of the absence of high energy muon beams at accelera- tors and of a rather slow progress in their creation, most of these experiments have been performed by studying muons in the cosmic ray flux. A comprehensive survey of the different techniques used for muon cross section investigations in cosmic rays and a critical analysis of the earlier experimental results may be found in [2]. Two methods are most widely ap- plied to check the energy dependence of the muon inter- action cross section. One of them is based on the use of combined arrangements including a target calorime- ter for the detection of the interactions and a magnetic spectrometer for the muon momentum evaluation. How- ever, this approach requires the creation of powerful spec- trometers, the necessary sizes of which grow too fast with increasing muon energy. Because of this, the sec- ond method is most often used, requiring only detectors for muon interactions. In this case, the transferred en- ergy spectrum, which is the convolution of the differen- tial cross section a(E, E) with the muon energy spectrum at the detector site, is measured. Conclusions about the cross section behavior are obtained by comparing the ob- served and the expected interaction rates, presuming a sufficiently accurate knowledge of the local muon spec- trum, which is taken either from independent measure- ments or calculated. Earlier experiments of this kind were performed at shallow depths underground corre- sponding to average muon energies below 10' GeV. Deep underground investigations of muon interactions are of special interest. Owing to the features of the energy dependence of cosmic ray muon flux and muon interaction in rock, the differential muon spectrum at large depths is essentially flat at low energies (up to sev- eral tens of GeV) and is largely enriched by high energy muons, the average local muon energy approaching 300- 400 GeV. In addition to a high value of the average en- ergy, the deep underground muon spectrum is character- ized by a rather weak dependence of the spectrum shape on the depth, which greatly simplifies calculations of the expected spectrum of muon-induced cascades. No di- rect measurements of the muon energy spectrum at such depths exist; therefore, in the muon interaction analy- sis one has to use the spectrum obtained by calculating the cosmic ray muon flux penetration through a large thickness of rock assuming an a priori knowledge of the cross sections. Because of this, some logical contradiction appears here: to estimate the cross section, we need to know it in advance. Luckily, the shape of the local muon energy spectrum is mainly determined by the muon spec- trum slope at the surface, by the total muon energy loss, and (to a lower extent, through the fluctuation effect) by the cross section energy dependence at large energy transfers (v 11 1); however, it practically does not depend @ 1995 The American Physical Society
Transcript of Observation of electromagnetic interactions of high energy muons deep underground
PHYSICAL REVIEW D VOLUME 52, NUMBER 5 1 SEPTEMBER 1995
Observation of electromagnetic interactions of high energy muons deep underground
C. Castagnoli, A. Castellina, and 0. Saavedra Istituto di Cosmogeofisica del Consiglio Nazionale delle Ricerche, cs. Fiume 4, 10133 Torino, Italy
and Istituto di Fisica Genemle dell'Universita' di Torino, Torino, Italy
T. M. Kirina, R. P. Kokoulin, and A. A. Petrukhin Moscow Engineering Physics Institute, 115409 Moscow, Russia
(Received 10 May 1994)
The first experimental measurement of the spectrum of cascade showers produced by cosmic ray muon interactions deep underground in the transferred energy range 0.4-200 GeV has been performed by means of the NUSEX calorimeter at a depth of about 5000 hg/cm2, the average muon energy being close to 360 GeV. The spectrum of energy transfers is in good agreement with calculations based on the commonly used theoretical formulas for muon interaction cross sections and on a conservative picture of the formation of muon energy spectrum at great depths. The present data do not confirm the deficit of the cross section at low energy transfers for the 1 TeV muon energy recently reported by the CCFR Collaboration. A possible explanation of the difference between the observed and the expected stochastic energy loss distributions presented by the CCFR group is discussed.
PACS number(s): 95.85.Ry, 13.10.+q, 95.55.Vj
I. INTRODUCTION
A correct knowledge of the muon interaction cross sec- tion and energy loss rate is important for the interpreta- tion of experimental results and the planning of new ex- periments both a t accelerators and in cosmic rays. The attention to this problem is also raised by some evidence for a deviation of the cross section from the commonly used theoretical formulas. For example, in the recently published results of the CCFR Collaboration [I], the ob- served stochastic energy loss distribution for high muon energies (around 1 TeV) at low energy transfers appears considerably lower than the expected one, indicating a 30% deficit of the cross section in comparison with the theoretical prediction at relative transfers v e Only a few measurements of the electromagnetic interac- tion cross sections for high energy muons exist. Because of the absence of high energy muon beams a t accelera- tors and of a rather slow progress in their creation, most of these experiments have been performed by studying muons in the cosmic ray flux.
A comprehensive survey of the different techniques used for muon cross section investigations in cosmic rays and a critical analysis of the earlier experimental results may be found in [2]. Two methods are most widely ap- plied to check the energy dependence of the muon inter- action cross section. One of them is based on the use of combined arrangements including a target calorime- ter for the detection of the interactions and a magnetic spectrometer for the muon momentum evaluation. How- ever, this approach requires the creation of powerful spec- trometers, the necessary sizes of which grow too fast with increasing muon energy. Because of this, the sec- ond method is most often used, requiring only detectors for muon interactions. In this case, the transferred en-
ergy spectrum, which is the convolution of the differen- tial cross section a ( E , E) with the muon energy spectrum at the detector site, is measured. Conclusions about the cross section behavior are obtained by comparing the ob- served and the expected interaction rates, presuming a sufficiently accurate knowledge of the local muon spec- trum, which is taken either from independent measure- ments or calculated. Earlier experiments of this kind were performed at shallow depths underground corre- sponding to average muon energies below 10' GeV.
Deep underground investigations of muon interactions are of special interest. Owing to the features of the energy dependence of cosmic ray muon flux and muon interaction in rock, the differential muon spectrum a t large depths is essentially flat a t low energies (up to sev- eral tens of GeV) and is largely enriched by high energy muons, the average local muon energy approaching 300- 400 GeV. In addition to a high value of the average en- ergy, the deep underground muon spectrum is character- ized by a rather weak dependence of the spectrum shape on the depth, which greatly simplifies calculations of the expected spectrum of muon-induced cascades. No di- rect measurements of the muon energy spectrum at such depths exist; therefore, in the muon interaction analy- sis one has to use the spectrum obtained by calculating the cosmic ray muon flux penetration through a large thickness of rock assuming an a priori knowledge of the cross sections. Because of this, some logical contradiction appears here: to estimate the cross section, we need to know it in advance. Luckily, the shape of the local muon energy spectrum is mainly determined by the muon spec- trum slope at the surface, by the total muon energy loss, and (to a lower extent, through the fluctuation effect) by the cross section energy dependence at large energy transfers (v 11 1); however, it practically does not depend
@ 1995 The American Physical Society

2674 C. CASTAGNOLI et al.
on the details of the differential cross section behavior a t low relative energy transfers (v << I ) , thus leaving us the possibility to consistently check the interaction cross section in this domain.
In the present paper, the results on the first deep un- derground study of the transferred energy spectrum are reported. Electromagnetic interactions of high energy muons in the NUSEX detector [3] were analyzed. The apparatus was located at a depth of about 5000 hg/cm2 underground, the average muon energy being close to 360 GeV. The fine structure of the detector allowed us to detect cascades with energies as low as 0.4 GeV. The experimental data collected during 1982-1988 have been used in the analysis.
11. EXPERIMENTAL ARRANGEMENT
The NUSEX detector is a digital tracking calorime- ter, consisting of 134 horizontal iron plates 3.5 mx3.5 m x 1 cm thick, interleaved by 3.5-m-long plastic streamer tubes with 9 x 9 mm2 inner cross section. The detector height is 3.7 m and the total mass N 150 tons. The average mass composition of the calorimeter is given by 90% iron and 10% polyvinylchloride. The average layer thickness (including chamber material and spac- ers) equals 0.62 radiation lengths (r.1.). The tube cham- ber planes are equipped with a two-dimensional exter- nal strip readout system. X-coordinate pickup strips are parallel to the tubes, 0.4 cm wide and positioned in correspondence of each tube wire (1 cm pitch). Y strips (orthogonal to wires) are 1 cm wide and have 1.2 cm pitch. The detection efficiency for charged particles crossing a tube is greater than 98%. The multihit proba- bility (i.e., the probability of detecting an induced signal on a strip adjacent to the hit tube) was estimated by muon track analysis and amounted to approximately 7% for the X view, while for Y strips typically 2 or 3 hits per plane for a single muon track were detected. Because of this, only the X-strips information has been consid- ered in the present analysis for the quantitative descrip- tion of the showers, while the Y-strips data were used only for the geometrical reconstruction of muon tracks. The detector was operated with very soft trigger con- ditions, thus providing a registration efficiency for cos- mic ray muons close to 100%. A test module of the NUSEX detector 131, having an almost identical struc- ture, was calibrated at the CERN Proton Synchrotron (PS) accelerator, and the response of the calorimeter for electromagnetic cascade showers was measured up to in- cident electron energies 1.2 GeV.
The NUSEX detector was installed in the Mont Blanc tunnel; the rock thickness exceeded 4800 hg/cm2 in every direction. The average composition of the sur- rounding rock is characterized by the following param- eters: (ZIA) = 0.494, (Z2/A) = 5.12, p = 2.68 g/cm3. NUSEX was a multipurpose detector: while its main goal was the study of nucleon stability, important results have been reached in the investigations of primary cosmic ray composition and spectrum and detection of muon signals from celestial sources; neutrino oscillation, v,/v, ratio, and dark matter studies were also performed [4-81.
111. MUON SELECTION
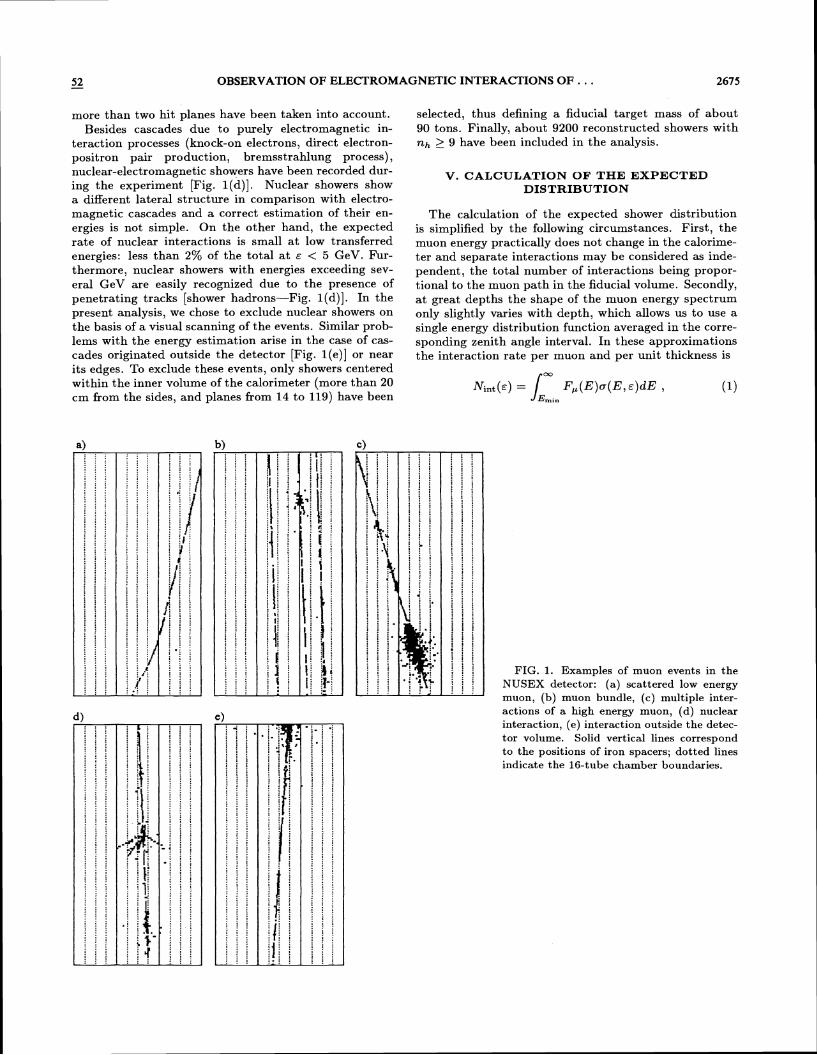
In a preliminary step, all events with at least one straight penetrating track crossing any 50 planes of the calorimeter have been selected from raw data. These data have been used in order to study the detector per- formances in operation. The time intervals of improper operation for some parts of the detector and the chan- nels often producing false signals could be recognized and excluded on the basis of these considerations. Typically, the number of such channels did not exceed 1% of the to- tal. Examples of muon events ( X view) registered by the NUSEX detector are given in Fig. 1. Only muons crossing at least 90 consecutive planes (213 of the detector height) with projected zenith angles 1 5 40" have been used for the physical analysis. Muon tracks appreciably dis- torted by multiple scattering have been rejected [as an example, an end-of-range track is shown in Fig. l(a)]. For this purpose, the linear fit of the entire track has been compared with the partial fits of two halves of the track. The track was excluded if the maximum devia- tion between these fits exceeded 0.8 cm in the X view or 2.0 cm in the Y view. The Monte Carlo simulation of multiple scattering of muons in the detector showed that this selection corresponded to an effective cutoff en- ergy Emin - 4 GeV. The total amount of rejected scat- tered tracks (about 2%) is in reasonable agreement with the expected muon spectrum at the observation depth. In addition to single muons, muon bundle events have been observed [Fig, l (b)] . Individual muons from these bundles, satisfying the above selection criteria, have also been included in the analysis. In all, about 1 . 7 ~ lo4 muon tracks have been selected for the present muon interac- tion study.
IV. SELECTION OF CASCADE SHOWERS
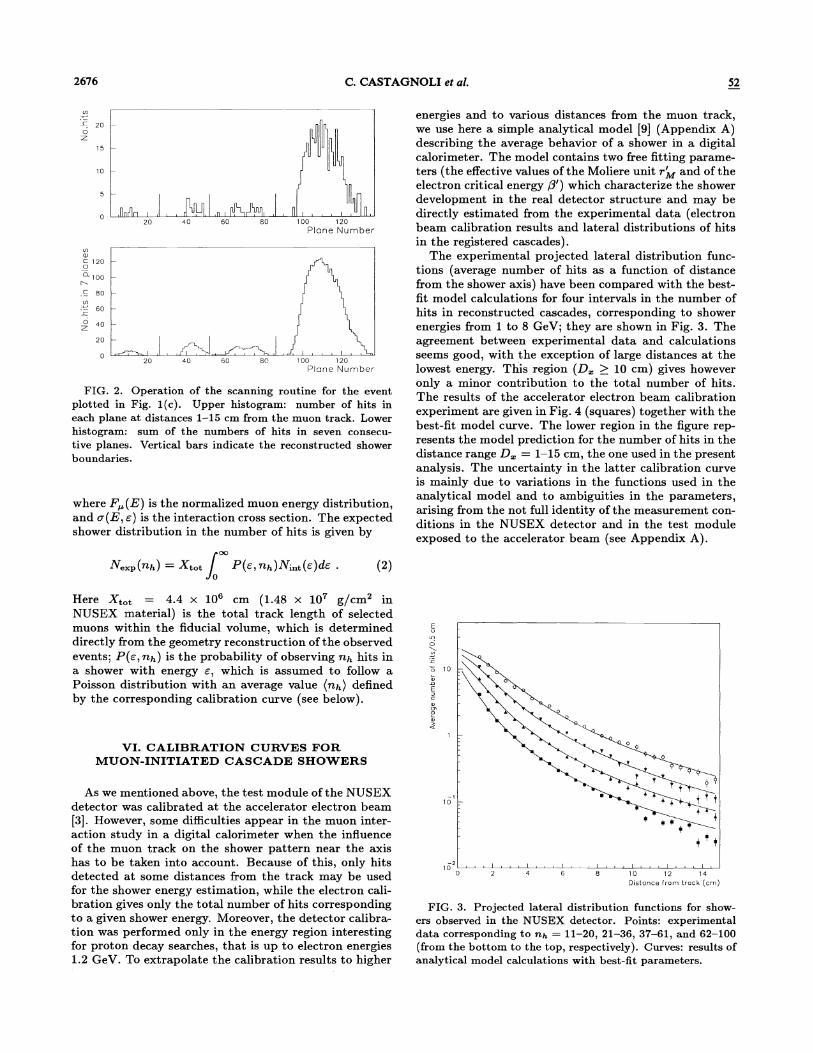
An automatic scanning procedure has been applied to find cascade showers initiated by muon interactions. Only hits detected at projected distances D, > 1.0 cm from the track fit have been used for cascade recognition and energy estimation. The average background caused by induced signals from muon track and by secondary particles produced in low energy interactions was esti- mated from experimental data and amounted to 0.07 hits per plane for D, > 1.0 cm. An example of the opera- tion of the scanning routine [for the event presented in Fig. l(c)] is given in Fig. 2. First, the number of hits in each plane within a road D, = 1-15 cm along the track is calculated (upper histogram in the figure). Then, the running sum of the numbers of hits in seven consecutive planes is computed (lower histogram), thus producing a smoothed longitudinal profile of the event with an averag- ing window of about four radiation lengths. Two showers are considered separated if the minimum observed in the smoothed profile is less than one-half of each of the cor- responding maxima. Only showers with a total number of hits outside the muon track nh 2 9 have been consid- ered. To suppress the background, only structures with
52 - OBSERVATION OF ELECTROMAGNETIC INTERACTIONS OF . . . 2675
more than two hit planes have been taken into account. Besides cascades due to purely electromagnetic in-
teraction processes (knock-on electrons, direct electron- positron pair production, bremsstrahlung process), nuclear-electromagnetic showers have been recorded dur- ing the experiment [Fig. l (d)] . Nuclear showers show a different lateral structure in comparison with electro- magnetic cascades and a correct estimation of their en- ergies is not simple. On the other hand, the expected rate of nuclear interactions is small a t low transferred energies: less than 2% of the total a t E < 5 GeV. Fur- thermore, nuclear showers with energies exceeding sev- eral GeV are easily recognized due to the presence of penetrating tracks [shower hadrons-Fig. l (d)] . In the present analysis, we chose to exclude nuclear showers on the basis of a visual scanning of the events. Similar prob- lems with the energy estimation arise in the case of cas- cades originated outside the detector [Fig. l(e)] or near its edges. To exclude these events, only showers centered within the inner volume of the calorimeter (more than 20 cm from the sides, and planes from 14 to 119) have been
selected, thus defining a fiducial target mass of about 90 tons. Finally, about 9200 reconstructed showers with n h 2 9 have been included in the analysis.
V. CALCULATION OF T H E EXPECTED DISTRIBUTION
The calculation of the expected shower distribution is simplified by the following circumstances. First, the muon energy practically does not change in the calorime- ter and separate interactions may be considered as inde- pendent, the total number of interactions being propor- tional to the muon path in the fiducial volume. Secondly, at great depths the shape of the muon energy spectrum only slightly varies with depth, which allows us to use a single energy distribution function averaged in the corre- sponding zenith angle interval. In these approximations the interaction rate per muon and per unit thickness is
FIG. 1. Examples of muon events in the NUSEX detector: (a) scattered low energy muon, (b) muon bundle, (c) multiple inter- . . actions of a high energy muon, (4 nuclear interaction, (e) interaction outside the detec- tor volume. Solid vertical lines correspond to the positions of iron spacers; dotted lines indicate the 16-tube chamber boundaries.
2676 C. CASTAGNOLI et al. - 52
Plane Number
energies and to various distances from the muon track, we use here a simple analytical model [9] (Appendix A) describing the average behavior of a shower in a digital calorimeter. The model contains two free fitting parame- ters (the effective values of the Moliere unit r;M and of the electron critical energy P') which characterize the shower development in the real detector structure and may be directly estimated from the experimental data (electron beam calibration results and lateral distributions of hits in the registered cascades).
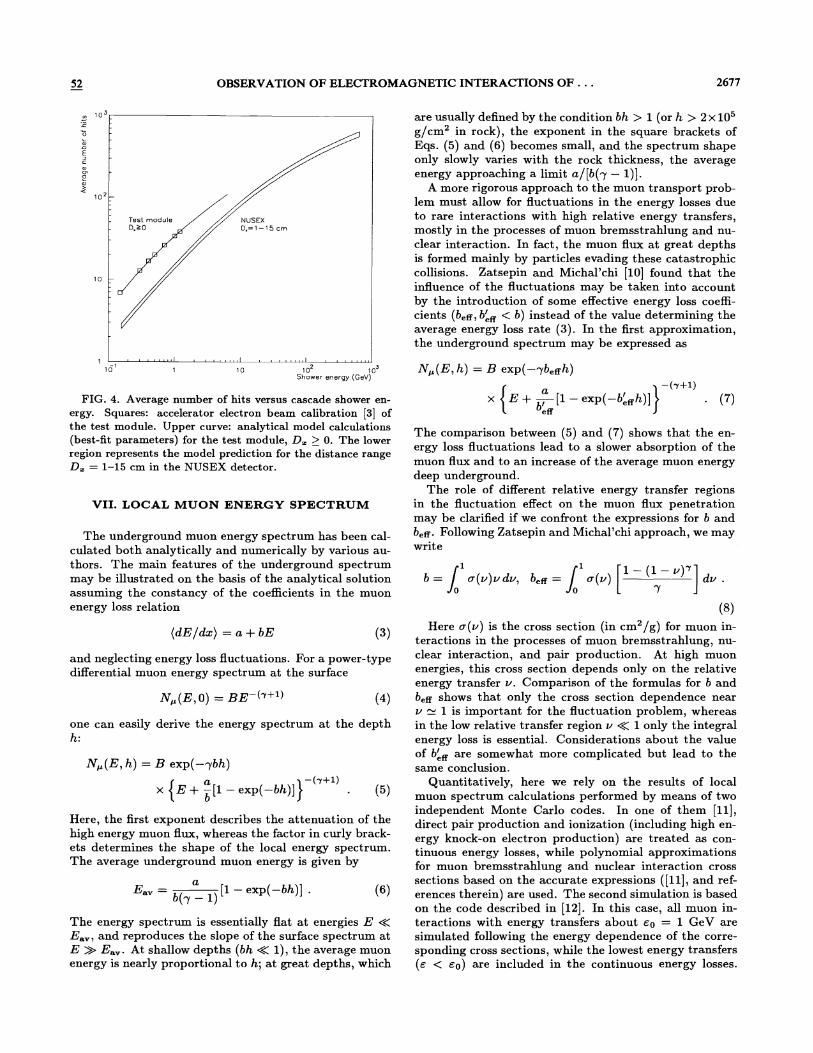
The experimental projected lateral distribution func- tions (average number of hits as a function of distance from the shower axis) have been compared with the best- fit model calculations for four intervals in the number of hits in reconstructed cascades, corresponding to shower energies &om 1 to 8 GeV; they are shown in Fig. 3. The agreement between experimental data and calculations seems good, with the exception of large distances a t the lowest energy. This region (D, 2 10 cm) gives however only a minor contribution to the total number of hits.
FIG. 2. Operation of the scanning routine for the event The results of the accelerator electron beam calibration plotted in Fig. l(c). Upper histogram: number of hits in each plane at distances 1-15 cm from the muon track. Lower experiment are given in Fig. 4 (squares) together with the
histogram: sum of the numbers of hits in seven consecu- best-fit model curve. The lower region in the figure rep-
tive planes. Vertical bars indicate the reconstructed shower resents the model prediction for the number of hits in the
boundaries. distance range D, = 1-15 cm, the one used in the present analysis. The uncertainty in the latter calibration curve is mainly due to variations in the functions used in the analytical model and to ambiguities in the parameters,
where F,(E) is the normalized muon energy distribution, arising from the not full identity of the measurement con- and a ( E , e ) is the interaction cross section. The expected ditions in the NUSEX detector and in the test module shower distribution in the number of hits is given by exposed to the accelerator beam (see Appendix A).
Here Xtot = 4.4 x lo6 cm (1.48 x lo7 g/cm2 in NUSEX material) is the total track length of selected muons within the fiducial volume, which is determined directly from the geometry reconstruction of the observed events; P(E, nh) is the probability of observing nh hits in a shower with energy E, which is assumed to follow a Poisson distribution with an average value (nh) defined by the corresponding calibration curve (see below).
VI. CALIBRATION CURVES FOR MUON-INITIATED CASCADE SHOWERS
As we mentioned above, the test module of the NUSEX detector was calibrated a t the accelerator electron beam [3]. However, some difficulties appear in the muon inter- action study in a digital calorimeter when the influence of the muon track on the shower pattern near the axis has to be taken into account. Because of this, only hits detected at some distances from the track may be used for the shower energy estimation, while the electron cali- bration gives only the total number of hits corresponding to a given shower energy. Moreover, the detector calibra- tion was performed only in the energy region interesting for proton decay searches, that is up to electron energies 1.2 GeV. To extrapolate the calibration results to higher
l i 2 d , 1 , , , 1 , , , I I , , , / , 0 2 4 6 8 10 12 14
D i s tonce from t rack (cm)
FIG. 3. Projected lateral distribution functions for show- ers observed in the NUSEX detector. Points: experimental data corresponding to n h = 11-20, 21-36, 37-61, and 62-100 (from the bottom to the top, respectively). Curves: results of analytical model calculations with best-fit parameters.
52 - OBSERVATION OF ELECTROMAGNETIC INTERACTIONS O F . . . 2677
I , 3 8 , 8 I , , , , , I , , , , , , , , , , I '16 ' 1 1 0 1 02 1 0'
Shower energy (GeV)
FIG. 4. Average number of hits versus cascade shower en- ergy. Squares: accelerator electron beam calibration [3] of the test module. Upper curve: analytical model calculations (best-fit parameters) for the test module, D, > 0. The lower region represents the model prediction for the distance range D, = 1-15 cm in the NUSEX detector.
VII. LOCAL MUON ENERGY SPECTRUM
The underground muon energy spectrum has been cal- culated both analytically and numerically by various au- thors. The main features of the underground spectrum may be illustrated on the basis of the analytical solution assuming the constancy of the coefficients in the muon energy loss relation
and neglecting energy loss fluctuations. For a power-type differential muon energy spectrum at the surface
one can easily derive the energy spectrum at the depth h:
Here, the first exponent describes the attenuation of the high energy muon flux, whereas the factor in curly brack- ets determines the shape of the local energy spectrum. The average underground muon energy is given by
The energy spectrum is essentially flat at energies E << E,,, and reproduces the slope of the surface spectrum at E >> E,,. At shallow depths (bh << l ) , the average muon energy is nearly proportional to h; at great depths, which
are usually defined by the condition bh > 1 (or h > 2 x lo5 g/cm2 in rock), the exponent in the square brackets of Eqs. (5) and (6) becomes small, and the spectrum shape only slowly varies with the rock thickness, the average energy approaching a limit a/[b(y - I)].
A more rigorous approach to the muon transport prob- lem must allow for fluctuations in the energy losses due to rare interactions with high relative energy transfers, mostly in the processes of muon bremsstrahlung and nu- clear interaction. In fact, the muon flux at great depths is formed mainly by particles evading these catastrophic collisions. Zatsepin and Michal'chi [lo] found that the influence of the fluctuations may be taken into account by the introduction of some effective energy loss coeffi- cients (bee, bkff < b) instead of the value determining the average energy loss rate (3) . In the first approximation, the underground spectrum may be expressed as
The comparison between ( 5 ) and (7) shows that the en- ergy loss fluctuations lead to a slower absorption of the muon flux and to an increase of the average muon energy deep underground.
The role of different relative energy transfer regions in the fluctuation effect on the muon flux penetration may be clarified if we confront the expressions for b and bee. Following Zatsepin and Michal'chi approach, we may write
(8) Here u(v) is the cross section (in cm2lg) for muon in-
teractions in the processes of muon bremsstrahlung, nu- clear interaction, and pair production. At high muon energies, this cross section depends only on the relative energy transfer v. Comparison of the formulas for b and be* shows that only the cross section dependence near v 1: 1 is important for the fluctuation problem, whereas in the low relative transfer region v << 1 only the integral energy loss is essential. Considerations about the value of bkff are somewhat more complicated but lead to the same conclusion.
Quantitatively, here we rely on the results of local muon spectrum calculations performed by means of two independent Monte Carlo codes. In one of them [ll], direct pair production and ionization (including high en- ergy knock-on electron production) are treated as con- tinuous energy losses, while polynomial approximations for muon bremsstrahlung and nuclear interaction cross sections based on the accurate expressions ([Ill, and ref- erences therein) are used. The second simulation is based on the code described in [12]. In this case, all muon in- teractions with energy transfers about EO = 1 GeV are simulated following the energy dependence of the corre- sponding cross sections, while the lowest energy transfers ( E < E ~ ) are included in the continuous energy losses.
2678 C. CASTAGNOLI et al. 52
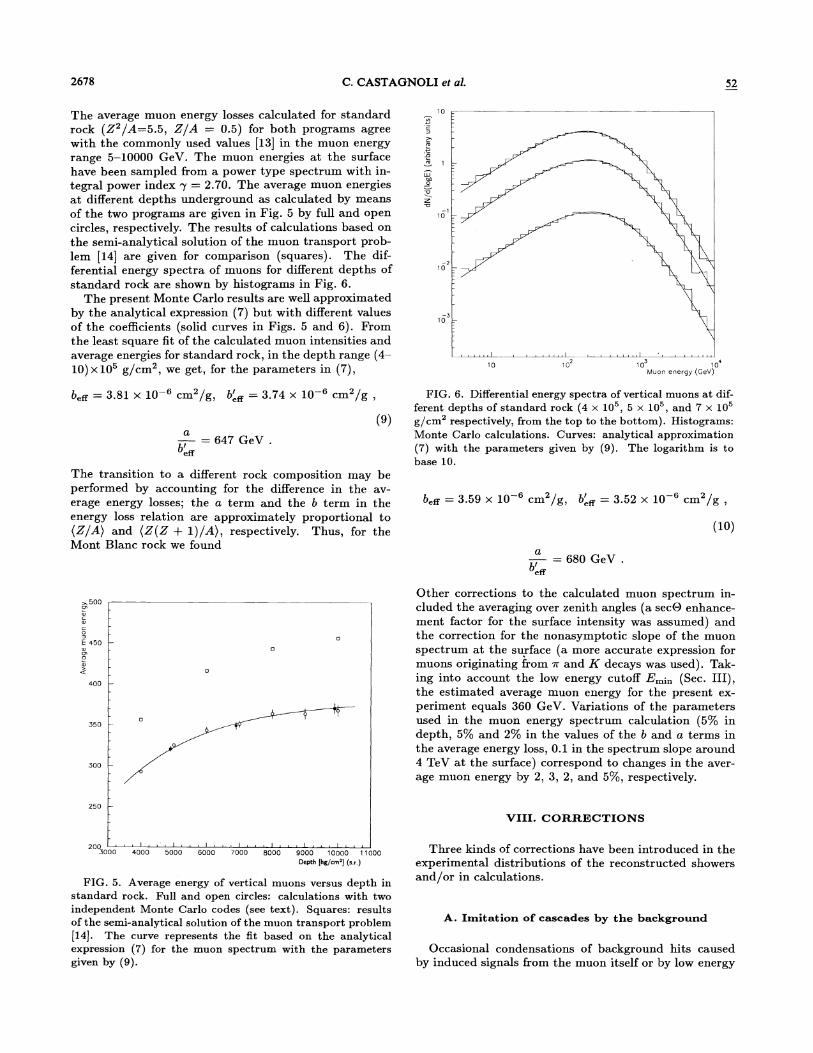
The average muon energy losses calculated for standard rock (Z2/A=5.5, Z / A = 0.5) for both programs agree with the commonly used values 1131 in the muon energy range 5-10000 GeV. The muon energies a t the surface have been sampled from a power type spectrum with in- tegral power index y = 2.70. The average muon energies a t different depths underground as calculated by means of the two programs are given in Fig. 5 by full and open circles, respectively. The results of calculations based on the semi-analytical solution of the muon transport prob- lem [14] are given for comparison (squares). The dif- ferential energy spectra of muons for different depths of standard rock are shown by histograms in Fig. 6.
The present Monte Carlo results are well approximated by the analytical expression (7) but with different values of the coefficients (solid curves in Figs. 5 and 6). From the least square fit of the calculated muon intensities and average energies for standard rock, in the depth range (4- 10) x lo5 g/cm2, we get, for the parameters in (7),
a - = 647 GeV . b : ff
The transition to a different rock composition may be performed by accounting for the difference in the av- erage energy losses; the a term and the b term in the energy loss relation are approximately proportional to (Z/A) and ( Z ( Z + l ) /A), respectively. Thus, for the Mont Blanc rock we found
~ ~ ' ~ ' ~ ' ~ ~ ~ ' ~ ~ ~ ~ ~ ' " ~ ' ~ ' ~ " ~ ~ ~ " 3000 4000 5000 6000 7000 8000 9000 10000 11000
Depth [hg/crn2] (3.r.)
FIG. 5. Average energy of vertical muons versus depth in standard rock. Full and open circles: calculations with two independent Monte Carlo codes (see text). Squares: results of the semi-analytical solution of the muon transport problem [14]. The curve represents the fit based on the analytical expression (7) for the muon spectrum with the parameters given by (9).
FIG. 6. Differential energy spectra of vertical muons a t dif- ferent depths of standard rock (4 x lo5, 5 x lo5, and 7 x 10' g/cm2 respectively, from the top to the bottom). Histograms: Monte Carlo calculations. Curves: analytical approximation (7) with the parameters given by (9). The logarithm is to base 10.
a - = 680 GeV . bLff
Other corrections to the calculated muon spectrum in- cluded the averaging over zenith angles (a secO enhance- ment factor for the surface intensity was assumed) and the correction for the nonasymptotic slope of the muon spectrum at the syface (a more accurate expression for muons originating from .rr and K decays was used). Tak- ing into account the low energy cutoff Emin (Sec. 111), the estimated average muon energy for the present ex- periment equals 360 GeV. Variations of the parameters used in the muon energy spectrum calculation (5% in depth, 5% and 2% in the values of the b and a terms in the average energy loss, 0.1 in the spectrum slope around 4 TeV at the surface) correspond to changes in the aver- age muon energy by 2, 3, 2, and 5%, respectively.
VIII. CORRECTIONS
Three kinds of corrections have been introduced in the experimental distributions of the reconstructed showers and/or in calculations.
A. Imitation of cascades by the background
Occasional condensations of background hits caused by induced signals from the muon itself or by low energy
52 - OBSERVATION OF ELECTROMAGNETIC INTERACTIONS O F . . . 2679
secondaries along the track may imitate false cascades in the shower reconstruction procedure. The number of such cases has been estimated via a Monte Carlo simula- tion based on the experimental distribution of the num- ber of hits (at distances 1-15 cm from the track) in iso- lated planes with "clean environment" (no hits outside the track in the five nearest planes above and below). The estimated fraction of false cascades is about 10% a t nh = 9 and falls off rapidly with nh, and it is negligible a t nh > 15. The estimated spectrum of these false cascades has been subtracted from the experimental distribution.
B. Overestimation of cascade shower energy
Background hits that occur near the muon track close to the true shower before or after it may be added to the cascade by the shower reconstruction procedure. The av- erage number of such hits per shower may be estimated as a double width of the averaging window multiplied by the number of background hits per plane. Thus, on average, the number of hits in a real shower is overestimated by Anh = 2 x 7 x 0.07 .v 1.0. The corresponding correction is relatively large owing to the falling spectrum of cas- cades. It has been taken into account in the calculations of the expected spectrum (2) by substituting the average number of hits (nh), determined by the calibration curve, with the corrected increased value ( (nh) + Anh).
C. Correction for shower superposition
At high muon energies, the mean free path for muon interactions is not large in comparison with the typic,al longitudinal size of the shower. If the distance between two interactions is less than the length of the shower, two cascades overlap each other and cannot be distinguished.
The superposition of the cascades leads to two com- peting effects ( [15], Appendix B): first, the loss of some interactions with small energy transfers, the effect being dominant a t relative energy transfers v < 3 x sec- ond, an overestimation of the energy of one of the interac- tions. In comparison with analog calorimeters (with am- plitude measurements), the latter effect is enhanced for digital ones because of the nonlinearity of their response, since two overlapping (but shifted in depth) showers, on the average, produce a larger number of hits than one shower with the same total energy. For the present analysis, the correction for cascade shower superposition has been calculated by means of the Monte Carlo tech- nique. Muons have been sampled from the local energy spectrum, and interactions with energy transfers greater than 0.1 GeV have been simulated. The lateral and lon- gitudinal distributions in the number of cascade parti- cles have been calculated using the analytical model (see Appendix A) and then converted into event longitudi- nal profiles in the number of hits. Finally, the simulated events have been analyzed by the standard shower recon- struction routine. The correction factor has been esti- mated as the ratio of the reconstructed spectra with and without shower superposition. The value of the corre-
sponding correction to the expected cascade distribution is of about -15% at nh = 10, crosses 0 near nh = 20- 25, and becomes positive a t larger nh (about 16% above nh = 80).
IX. RESULTS A N D DISCUSSION
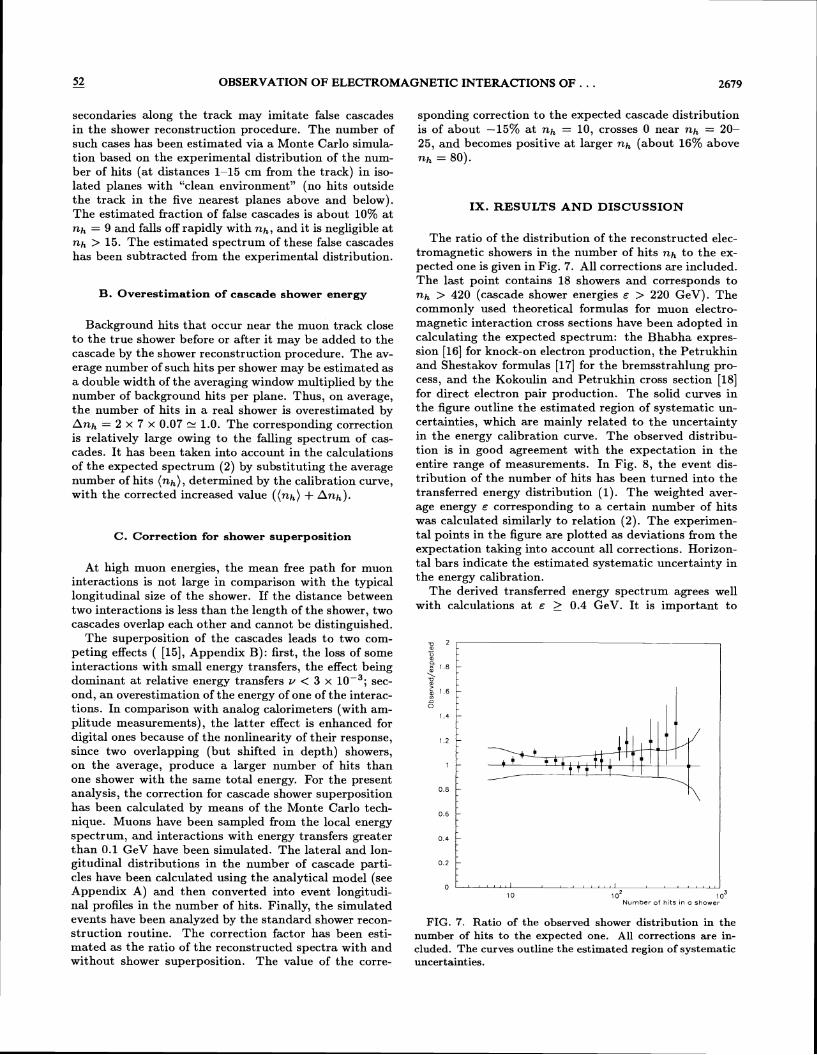
The ratio of the distribution of the reconstructed elec- tromagnetic showers in the number of hits nh to the ex- pected one is given in Fig. 7. All corrections are included. The last point contains 18 showers and corresponds to nh > 420 (cascade shower energies E > 220 GeV). The commonly used theoretical formulas for muon electro- magnetic interaction cross sections have been adopted in calculating the expected spectrum: the Bhabha expres- sion [16] for knock-on electron production, the Petrukhin and Shestakov formulas [17] for the bremsstrahlung pro- cess, and the Kokoulin and Petrukhin cross section 1181 for direct electron pair production. The solid curves in the figure outline the estimated region of systematic un- certainties, which are mainly related to the uncertainty in the energy calibration curve. The observed distribu- tion is in good agreement with the expectation in the entire range of measurements. In Fig. 8, the event dis- tribution of the number of hits has been turned into the transferred energy distribution (1). The weighted aver- age energy E corresponding to a certain number of hits was calculated similarly to relation (2). The experimen- tal points in the figure are plotted as deviations from the expectation taking into account all corrections. Horizon- tal bars indicate the estimated systematic uncertainty in the energy calibration.
The derived transferred energy spectrum agrees well with calculations a t E 2 0.4 GeV. It is important to
1 0 : o2 1 o3 N ~ r n b e r o f h i t s 8n o shower
FIG. 7. Ratio of the observed shower distribution in the number of hits to the expected one. All corrections are in- cluded. The curves outline the estimated region of systematic uncertainties.
2680 C . CASTAGNOLI et al. 52 -
Transferred energy E (GeV)
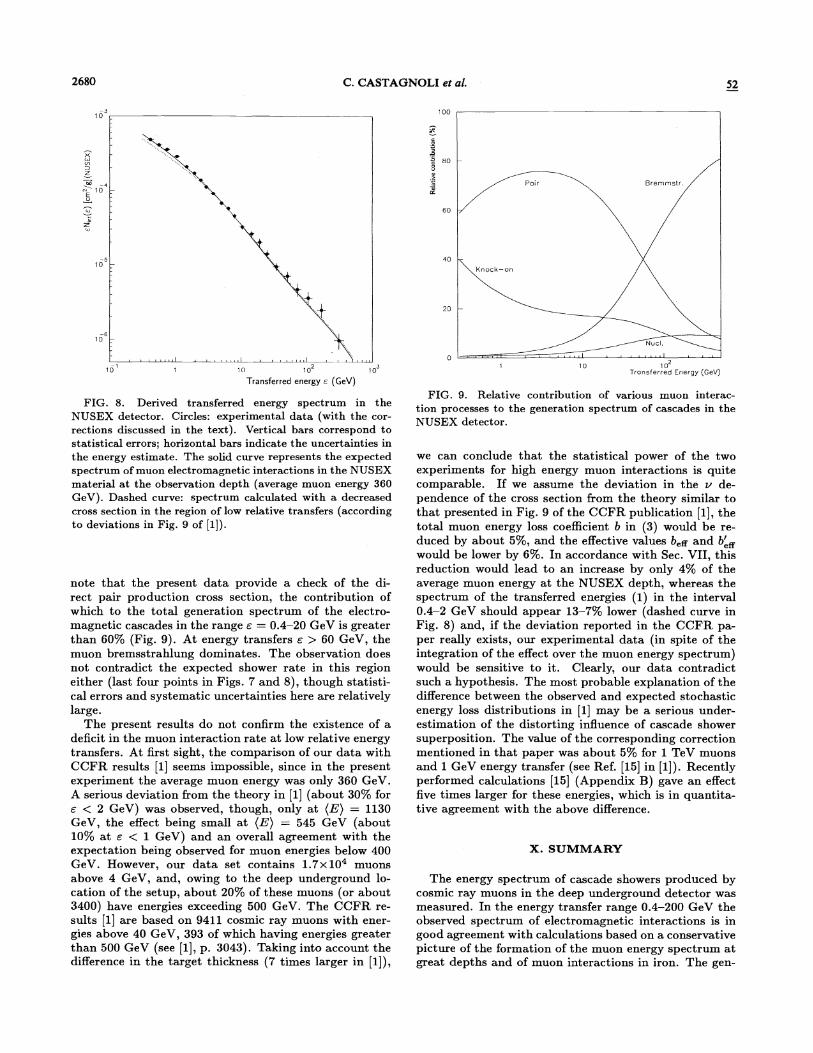
FIG. 8. Derived transferred energy spectrum in the NUSEX detector. Circles: experimental data (with the cor- rections discussed in the text). Vertical bars correspond to statistical errors; horizontal bars indicate the uncertainties in the energy estimate. The solid curve represents the expected spectrum of muon electromagnetic interactions in the NUSEX material at the observation depth (average muon energy 360 GeV). Dashed curve: spectrum calculated with a decreased cross section in the region of low relative transfers (according to deviations in Fig. 9 of [I]).
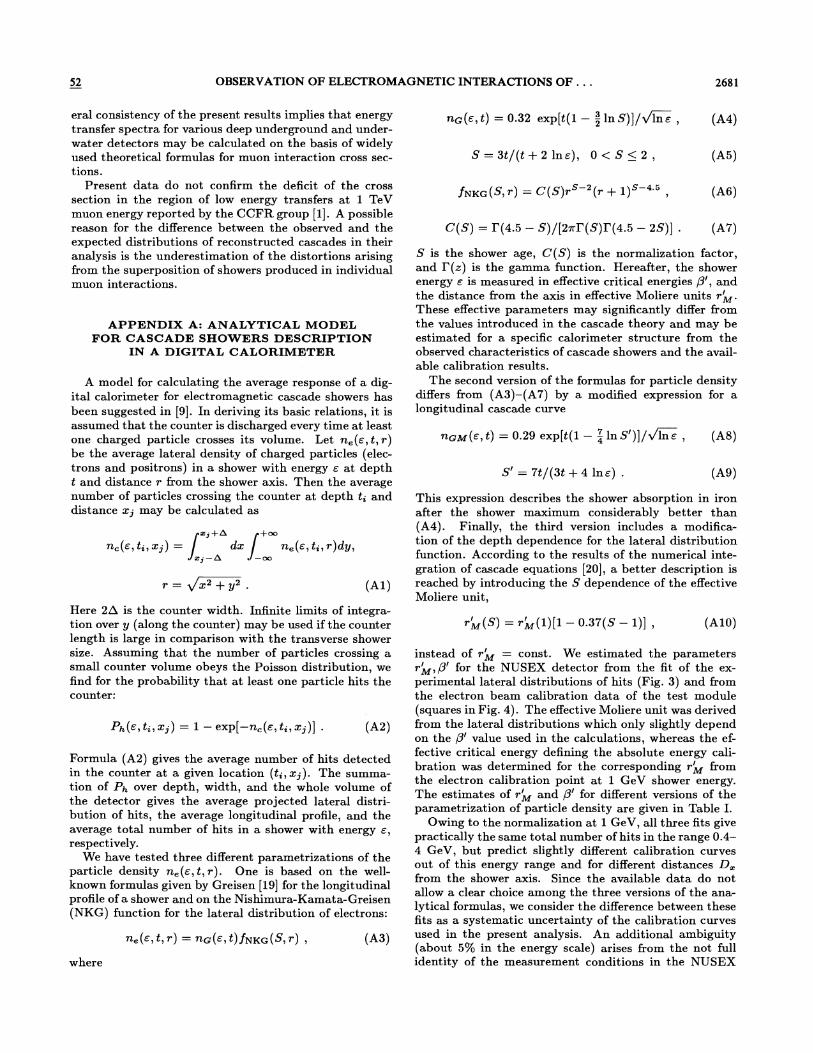
note that the present data provide a check of the di- rect pair production cross section, the contribution of which to the total generation spectrum of the electro- magnetic cascades in the range E = 0.4-20 GeV is greater than 60% (Fig. 9). At energy transfers E > 60 GeV, the muon bremsstrahlung dominates. The observation does not contradict the expected shower rate in this region either (last four points in Figs. 7 and 8), though statisti- cal errors and systematic uncertainties here are relatively large. -
The present results do not confirm the existence of a deficit in the muon interaction rate at low relative energy transfers. At first sight, the comparison of our data with CCFR results [l] seems impossible, since in the present experiment the average muon energy was only 360 GeV. A serious deviation &om the theory in [l] (about 30% for E < 2 GeV) was observed, though, only at ( E ) = 1130 GeV, the effect being small at ( E ) = 545 GeV (about 10% at E < 1 GeV) and an overall agreement with the expectation being observed for muon energies below 400 GeV. However, our data set contains 1 . 7 ~ 1 0 ~ muons above 4 GeV, and, owing to the deep underground lo- cation of the setup, about 20% of these muons (or about 3400) have energies exceeding 500 GeV. The CCFR re- sults [l] are based on 9411 cosmic ray muons with ener- gies above 40 GeV, 393 of which having energies greater than 500 GeV (see [I], p. 3043). Taking into account the difference in the target thickness (7 times larger in [I]),
1 10 1 o2 Transferred Energy (GeV)
FIG. 9. Relative contribution of various muon interac- tion processes to the generation spectrum of cascades in the NUSEX detector.
we can conclude that the statistical power of the two experiments for high energy muon interactions is quite comparable. If we assume the deviation in the v de- pendence of the cross section from the theory similar to that presented in Fig. 9 of the CCFR publication [I], the total muon energy loss coefficient b in (3) would be re- duced by about 5%, and the effective values befl and bLR would be lower by 6%. In accordance with Sec. VII, this reduction would lead to an increase by only 4% of the average muon energy a t the NUSEX depth, whereas the spectrum of the transferred energies (1) in the interval 0.4-2 GeV should appear 13-7% lower (dashed curve in Fig. 8) and, if the deviation reported in the CCFR pa- per really exists, our experimental data (in spite of the integration of the effect over the muon energy spectrum) would be sensitive to it. Clearly, our data contradict such a hypothesis. The most probable explanation of the difference between the observed and expected stochastic energy loss distributions in [l] may be a serious under- estimation of the distorting influence of cascade shower superposition. The value of the corresponding correction mentioned in that paper was about 5% for 1 TeV muons and 1 GeV energy transfer (see Ref. [15] in [I]). Recently performed calculations [15] (Appendix B) gave an effect five times larger for these energies, which is in quantita- tive agreement with the above difference.
X. SUMMARY
The energy spectrum of cascade showers produced by cosmic ray muons in the deep underground detector was measured. In the energy transfer range 0.4-200 GeV the observed spectrum of electromagnetic interactions is in good agreement with calculations based on a conservative picture of the formation of the muon energy spectrum a t great depths and of muon interactions in iron. The gen-
52 - OBSERVATION OF ELECTROMAGNETIC INTERACTIONS O F . . . 2681
era1 consistency of the present results implies that energy transfer spectra for various deep underground and under- water detectors may be calculated on the basis of widely used theoretical formulas for muon interaction cross sec- tions.
Present data do not confirm the deficit of the cross section in the region of low energy transfers at 1 TeV muon energy reported by the CCFR group [I]. A possible reason for the difference between the observed and the expected distributions of reconstructed cascades in their analysis is the underestimation of the distortions arising from the superposition of showers produced in individual muon interactions.
A P P E N D I X A: ANALYTICAL MODEL FOR CASCADE SHOWERS DESCRIPTION
I N A DIGITAL CALORIMETER
A model for calculating the average response of a dig- ital calorimeter for electromagnetic cascade showers has been suggested in 191. In deriving its basic relations, it is assumed that the counter is discharged every time at least one charged particle crosses its volume. Let ne(e, t , r ) be the average lateral density of charged particles (elec- trons and positrons) in a shower with energy E at depth t and distance r from the shower axis. Then the average number of particles crossing the counter at depth ti and distance x j may be calculated as
Here 2A is the counter width. Infinite limits of integra- tion over y (along the counter) may be used if the counter length is large in comparison with the transverse shower size. Assuming that the number of particles crossing a small counter volume obeys the Poisson distribution, we find for the probability that at least one particle hits the counter:
Formula (A2) gives the average number of hits detected in the counter at a given location (ti, x j ) . The summa- tion of Ph over depth, width, and the whole volume of the detector gives the average projected lateral distri- bution of hits, the average longitudinal profile, and the average total number of hits in a shower with energy E ,
respectively. We have tested three different parametrizations of the
particle density ne(&, t , r ) . One is based on the well- known formulas given by Greisen [19] for the longitudinal profile of a shower and on the Nishimura-Kamata-Greisen (NKG) function for the lateral distribution of electrons:
S is the shower age, C ( S ) is the normalization factor, and I'(z) is the gamma function. Hereafter, the shower energy E is measured in effective critical energies f?', and the distance from the axis in effective Moliere units r;M. These effective parameters may significantly differ from the values introduced in the cascade theory and may be estimated for a specific calorimeter structure from the observed characteristics of cascade showers and the avail- able calibration results.
The second version of the formulas for particle density differs from (A3)-(A7) by a modified expression for a longitudinal cascade curve
This expression describes the shower absorption in iron after the shower maximum considerably better than (A4). Finally, the third version includes a modifica- tion of the depth dependence for the lateral distribution function. According to the results of the numerical inte- gration of cascade equations 1201, a better description is reached by introducing the S dependence of the effective Moliere unit,
instead of r;M = const. We estimated the parameters r;M,,B1 for the NUSEX detector from the fit of the ex- perimental lateral distributions of hits (Fig. 3) and from the electron beam calibration data of the test module (squares in Fig. 4). The effective Moliere unit was derived from the lateral distributions which only slightly depend on the 0' value used in the calculations. whereas the ef- fective critical energy defining the absolute energy cali- bration was determined for the corresponding r;M from the electron calibration point a t 1 GeV shower energy. The estimates of r L and ,B1 for different versions of the parametrization of particle density are given in Table I.
Owing to the normalization a t 1 GeV, all three fits give practically the same total number of hits in the range 0.4- 4 GeV, but predict slightly different calibration curves out of this energy range and for different distances D, from the shower axis. Since the available data do not allow a clear choice among the three versions of the ana- lytical formulas, we consider the difference between these fits as a systematic uncertainty of the calibration curves used in the present analysis. An additional ambiguity (about 5% in the energy scale) arises from the not full identity of the measurement conditions in the NUSEX
C. CASTAGNOLI et al.
TABLE I. Best-fit values of the parameters for different parametrizations of cascade particle density.
Formulas used Best-fit parameters (A3)-(A7) b' = 26.8 MeV, rh = 1.87 cm (-43), (-48)-(A9), (A5)-(A7) b' = 27.4 MeV, r h = 1.67 cm
(A3), (A8)-(-49), (A5)-(A7), (-410) b' = 29.0 MeV, rh (1) = 2.11 cm
detector and in the test module exposed a t the accelera- tor beam (multihit probability, orientation of the shower axes, influence of spacers, etc.). The overall region of calibration curve uncertainties is given in Fig. 4.
APPENDIX B: DISTORTION OF THE ENERGY SPECTRUM
OF RECONSTRUCTED CASCADES DUE TO SHOWER SUPERPOSITION
The superposition of showers originated from individ- ual muon interactions leads to a distortion of the energy distribution of reconstructed cascades in comparison with the true one, the value of the distortion depending on the reconstruction procedure and on the sampling thickness (if the latter is not negligibly small in comparison with the longitudinal shower size). A quantitative considera- tion of this effect has been given in [15].
A Monte Carlo simulation of the response of a sam- pling calorimeter for high energy muons has been per- formed. Interaction points and energy transfers above the threshold so=0.05 GeV have been selected according to the muon interaction cross section. In order to ob- tain the pure effect of shower superposition, the following
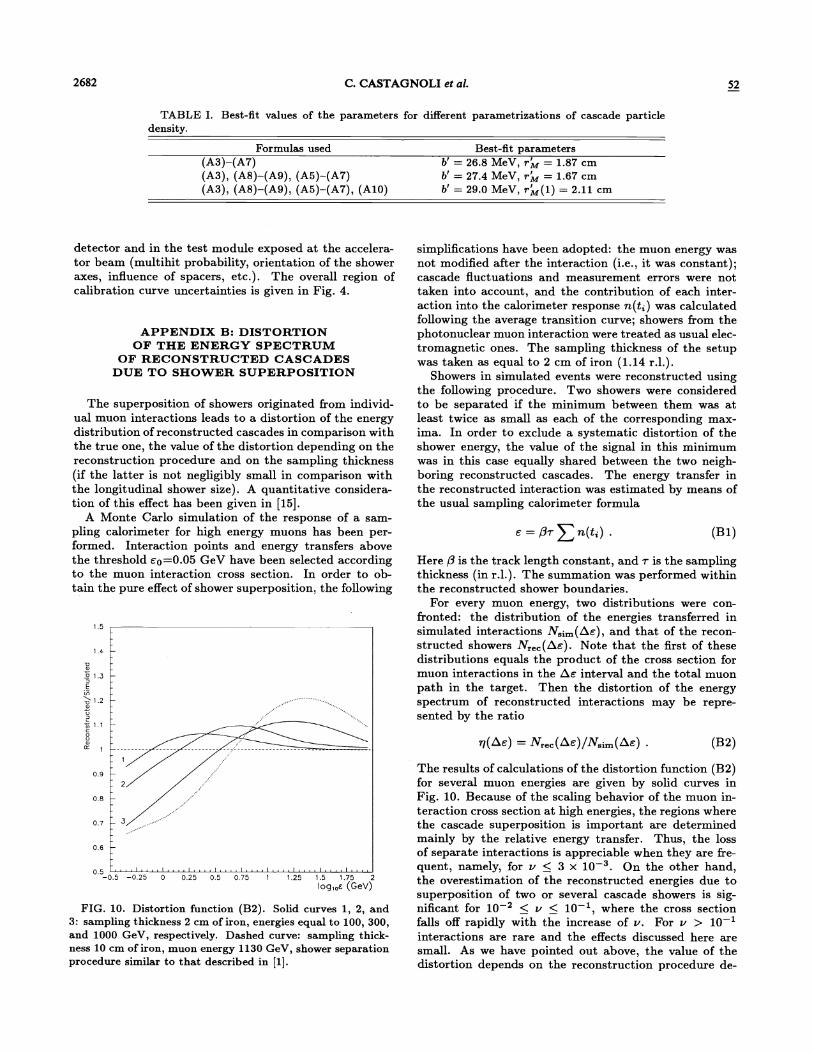
FIG. 10. Distortion function (B2). Solid curves 1, 2, and 3: sampling thickness 2 cm of iron, energies equal to 100, 300, and 1000 GeV, respectively. Dashed curve: sampling thick- ness 10 cm of iron, muon energy 1130 GeV, shower separation procedure similar to that described in [I].
simplifications have been adopted: the muon energy was not modified after the interaction (i.e., it was constant); cascade fluctuations and measurement errors were not taken into account, and the contribution of each inter- action into the calorimeter response n(ti) was calculated following the average transition curve; showers from the photonuclear muon interaction were treated as usual elec- tromagnetic ones. The sampling thickness of the setup was taken as equal to 2 cm of iron (1.14 r.1.).
Showers in simulated events were reconstructed using the following procedure. Two showers were considered to be separated if the minimum between them was a t least twice as small as each of the corresponding max- ima. In order to exclude a systematic distortion of the shower energy, the value of the signal in this minimum was in this case equally shared between the two neigh- boring reconstructed cascades. The energy transfer in the reconstructed interaction was estimated by means of the usual sampling calorimeter formula
Here 0 is the track length constant, and 7 is the sampling thickness (in r.1.). The summation was performed within the reconstructed shower boundaries.
For every muon energy, two distributions were con- fronted: the distribution of the energies transferred in simulated interactions Nsim(A&), and that of the recon- structed showers N,,,(AE). Note that the first of these distributions equals the product of the cross section for muon interactions in the AE interval and the total muon path in the target. Then the distortion of the energy spectrum of reconstructed interactions may be repre- sented by the ratio
The results of calculations of the distortion function (B2) for several muon energies are given by solid curves in Fig. 10. Because of the scaling behavior of the muon in- teraction cross section at high energies, the regions where the cascade superposition is important are determined mainly by the relative energy transfer. Thus, the loss of separate interactions is appreciable when they are fre- quent, namely, for v 5 3 x On the other hand, the overestimation of the reconstructed energies due to superposition of two or several cascade showers is sig- nificant for 5 v < lo-', where the cross section falls off rapidly with the increase of v. For v > 10-I interactions are rare and the effects discussed here are small. As we have ~ o i n t e d out above. the value of the distortion depends on the reconstruction procedure de-
52 - OBSERVATION OF ELECTROMAGNETIC INTERACTIONS OF . . . 2683
tails and on the sampling thickness. T h e dashed curve in Fig. 10 was calculated for conditions close t o those of the C C F R experiment [I]. Similarly t o the procedure adopted there, in order t o separate two neighboring show- ers a d i ~ between them below a fixed discrimination level (about two equivalent particles above the single muon signal) was required. The calculated distortion (about 30% around 1 GeV energy transfer) is in quantitative
agreement with the difference between the measured and - expected stochastic energy loss distributions reported by the C C F R ErouD. ., -
Obviously, the overlap of separate cascades in a usual (analog) calorimeter does not influence the measurements of the total muon energy loss rate ( d E / d x ) and the C C F R results concerning the lat ter value are not affected by this effect.
[I] W. K. Sakumoto et al., Phys. Rev. D 45, 3042 (1992). [2] C. Grupen, Fortschr. Phys. 23, 127 (1976). 131 G. Battistoni et al., Nucl. Instrum. Methods A245, 277
(1986). 141 G. Battistoni et al., Phys. Lett. 133B, 454 (1983). 151 M. Aglietta et al., Nucl. Phys. B14, 193 (1990). [6] M. Aglietta et al., Europhys. Lett. 8, 611 (1989). [7] G. Battistoni et al., Nucl. Phys. B14, 211 (1990). [8] M. Aglietta et al., Europhys. Lett. 15 , 559 (1991). [9] R. P. Kokoulin, Moscow Engineering Physics Institute
Report No. 019-93, 1993 (unpublished). [lo] G. T. Zatsepin and E. D. Mikhal'chi, Izv. Akad. Nauk
SSSR, Ser. Fiz. 30, 1679 (1966); V. I. Gurentsov, G. T. Zatsepin, and E. D. Mikhal'chi, Sov. J. Nucl. Phys. 23, 527 (1976).
ill] H. Bilokon et al., Nucl. Instrum. Methods A303, 381 (1991).
[12] R. P. Kokoulin, Institute for Cosmic Ray Research, Uni- versity of Tokyo, Report No. 102-82-5, 1982 (unpub- lished).
[13] W. Lohmann, R. Kopp, and R. Voss, CERN Report No. 85-03, Geneva, 1985 (unpublished).
[14] V. I. Gurentsov, Institute for Nuclear Research Report No. 0380, Moscow, 1984 (in Russian) (unpublished).
[15] R. P. Kokoulin and A. A. Petrukhin, Moscow Engineering Physics Institute Report No. 020-93, 1993 (unpublished).
[16] H. J. Bhabha, Proc. R. Soc. A164, 257 (1938). [17] A. A. Petrukhin and V. V. Shestakov, Can. J. Phys. 46,
S377 (1968). [IS] R. P. Kokoulin and A. A. Petrukhin, in Proceedings of
the 11th International Conference on Cosmic Rays, Bu- dapest, Hungary, 1969 [Acta Phys. Acad. Sci. Hung. 29, Suppl. 4, 277 (1970)l; in Proceedings of the 12th Inter- national Conference on Cosmic Rays, Hobart, Australia, 1971 (unpublished), Vol. 6, p. 2436.
[19] K. Greisen, in Progress in Cosmic Ray Physics, edited by J. G. Wilson (Wiley, New York, 1956), Vol. 3, p. 1.
[20] A. A. Lagutin, thesis, Moscow Engineering Physics Insti- tute, 1979.