Mario Pianta, Il benessere equo e sostenibile in Italia
28
Il benessere equo e sostenibile in Italia Mario Pianta Università di Urbino Carlo Bo Istat, 14 dicembre 2016
-
Upload
istituto-nazionale-di-statistica -
Category
Economy & Finance
-
view
726 -
download
0
Transcript of Mario Pianta, Il benessere equo e sostenibile in Italia

Il benessere equo e sostenibile in Italia
Mario PiantaUniversità di Urbino Carlo Bo
Istat, 14 dicembre 2016
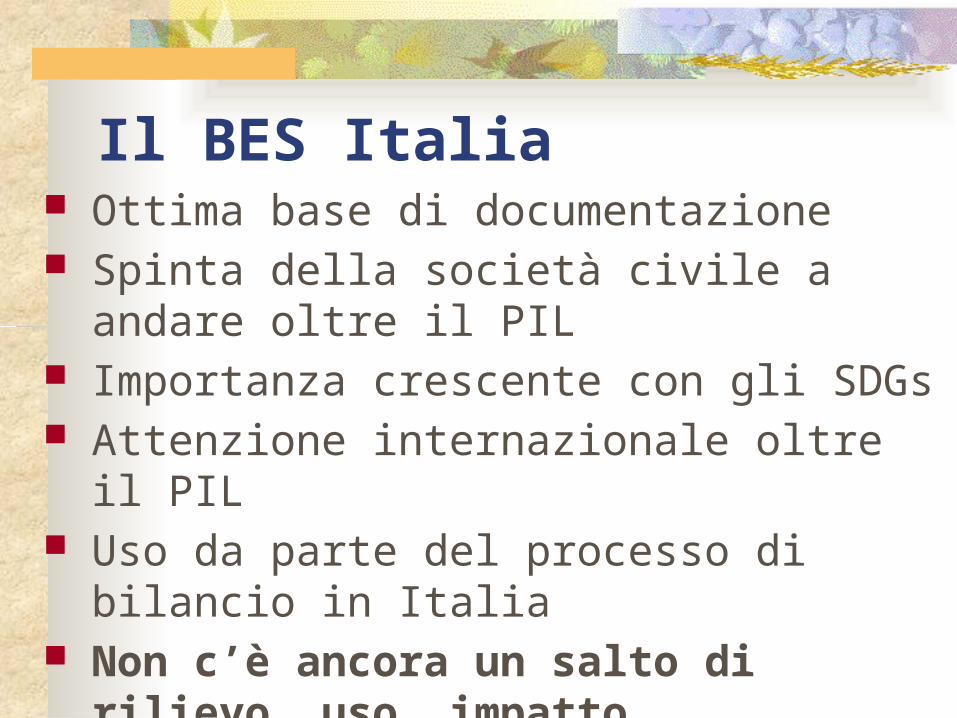
Il BES Italia Ottima base di documentazione Spinta della società civile a andare oltre il PIL Importanza crescente con gli SDGs Attenzione internazionale oltre il PIL Uso da parte del processo di bilancio in Italia Non c’è ancora un salto di rilievo, uso, impatto Manca un indicatore aggregato, ma si può
costruire
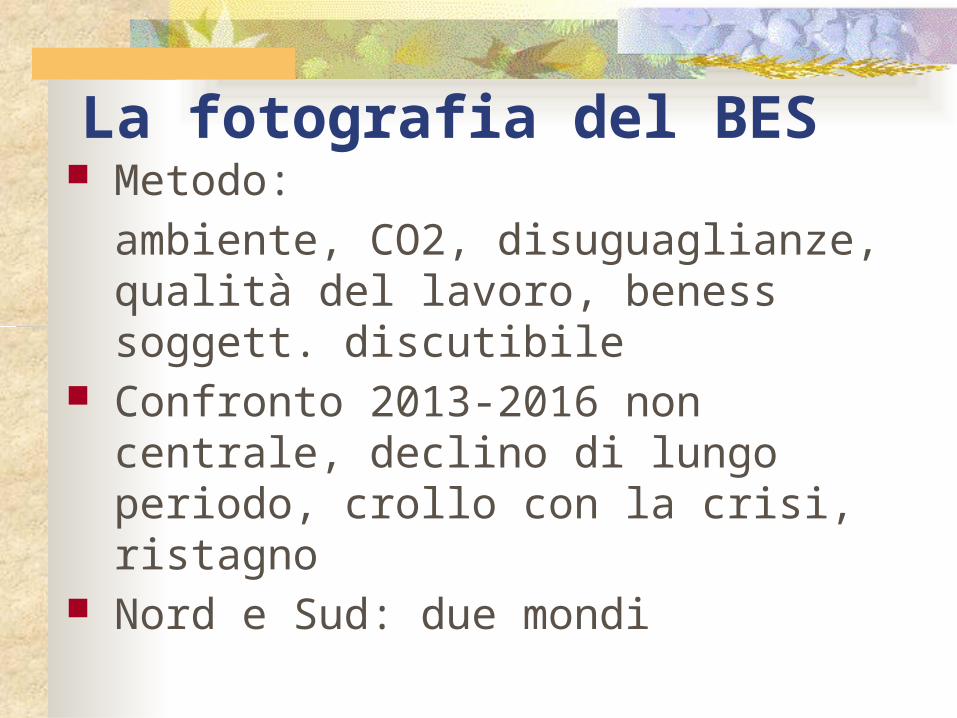
La fotografia del BES Metodo:
ambiente, CO2, disuguaglianze, qualità del lavoro, beness soggett. discutibile
Confronto 2013-2016 non centrale, declino di lungo periodo, crollo con la crisi, ristagno
Nord e Sud: due mondi
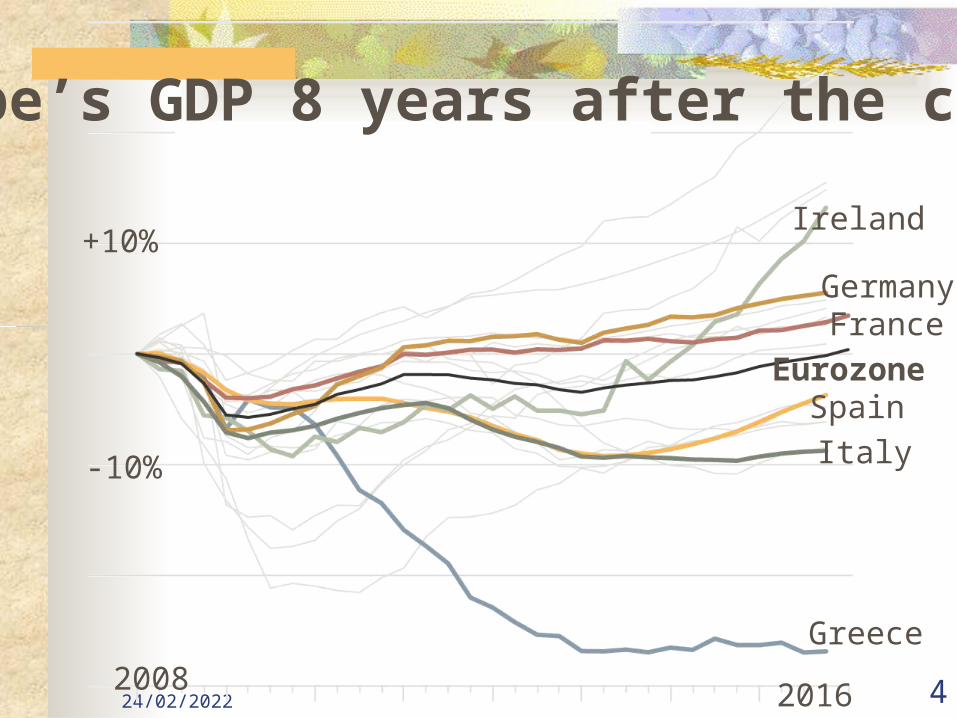
02/05/2023 42008 2016
Eurozone
Ireland
GermanyFrance
SpainItaly
Greece
Europe’s GDP 8 years after the crisis
-10%
+10%
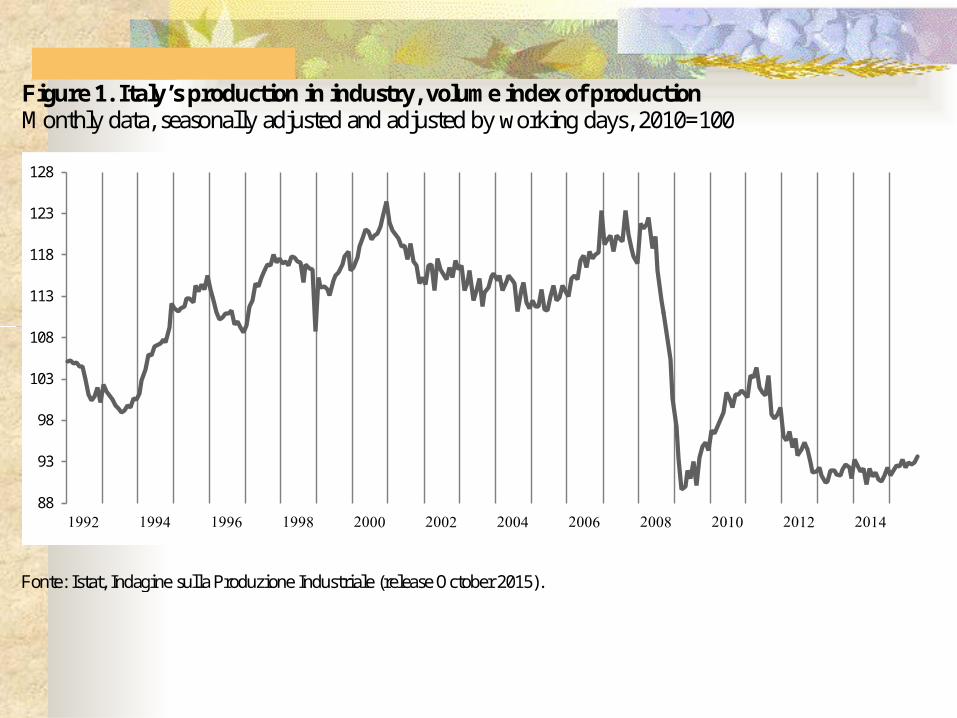
Figure 1. Italy’s production in industry, volume index of production Monthly data, seasonally adjusted and adjusted by working days, 2010=100
Fonte: Istat, Indagine sulla Produzione Industriale (release October 2015).
88
93
98
103
108
113
118
123
128
0,3
0,35
0,4
0,45
0,5
0,55
France Germany Netherlands Denmark Sweden Italy UK US
1985 1995 2010
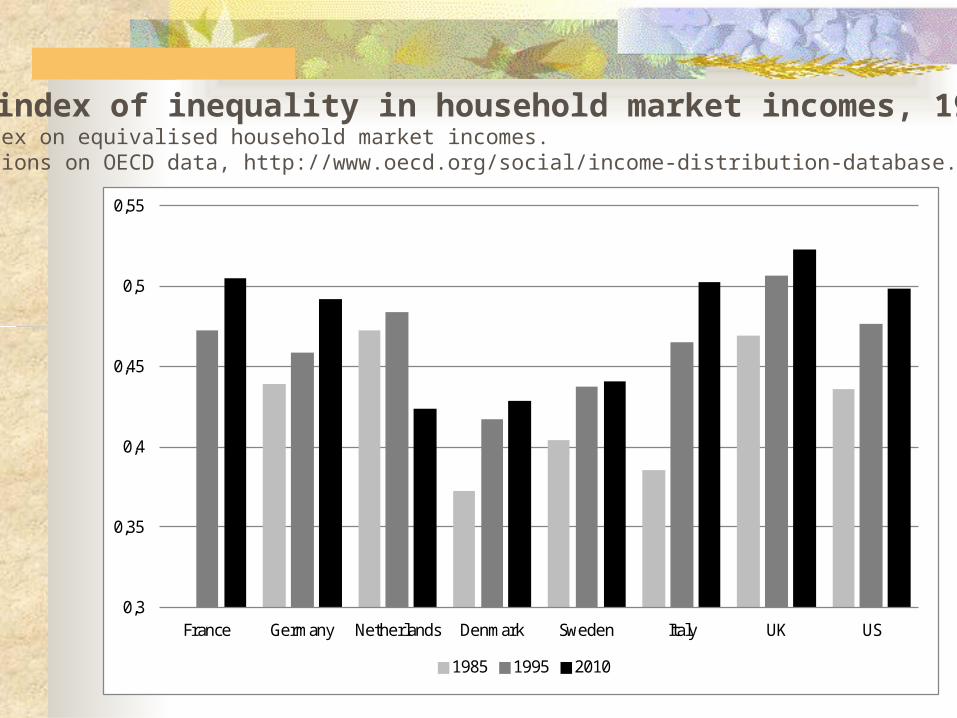
Gini index of inequality in household market incomes, 1985-2010Gini index on equivalised household market incomes.Calculations on OECD data, http://www.oecd.org/social/income-distribution-database.htm

Un tentativo di aggregazione e calcolo monetario
degli indicatori di benessere è in Mirko Armiento, A monetary alternative to
GDP: The Sustainable Welfare Index for Italy, 1960-2013, Ph.D. Thesis, Sapienza Università di Roma, 2016
Ascesa e declino del benessere sostenibile in Italia, 1960-2013, Rivista delle Politiche Sociali / Italian Journal of Social Policy, 4/2015 205
Ecological Economics (under revision)

ISEW = C + S - D - E - N - L +/- KC = private consumption expenditureS = services: household work, durable goods (annual stock value minus expenses), half of public expenditure in health and higher education, streets and highways D = “defensive” expenditures and social costs: income inequality, half of private expenses in health and education, vehicle accidents, commuting and national advertisingE = environmental degradation costs: water, noise and air pollution, urbanizationN = natural capital depletion: cumulative loss of wetlands and farmlandsL = long term damages: depletion of non-renewable resources and cost of climate changeK = capital adjustments: net capital growth and variation of net international investment position
Calcolo dell’ Indice di Benessere Sostenibileche modifica l’Index of Sustainable Economic Welfare (ISEW), Daly and Cobb (1989) sintetico e monetario+
+
-
---
+/-

ISEW: a review
Source: Jackson and Stymne (1996)

PIL per abitante
Indice di benessere sost. per abitante
Il lungo declino italianoPil e indice monetario di benessere sostenibile

The components of Italy’s SWI
Absolute values

DisuguaglianzeAspetto chiave: influisce sul livello di benessere È un modo di interpretare i dati La distribuzione funzionale del reddito conta, i
salari contano 20% più ricco-20% più povero non coglie la
dinamica, EUSILC si perde gli estremi Il reddito medio è sempre meno significativo, i
dati devono essere riaggregati per quintili di reddito, per gruppi sociali rilevanti
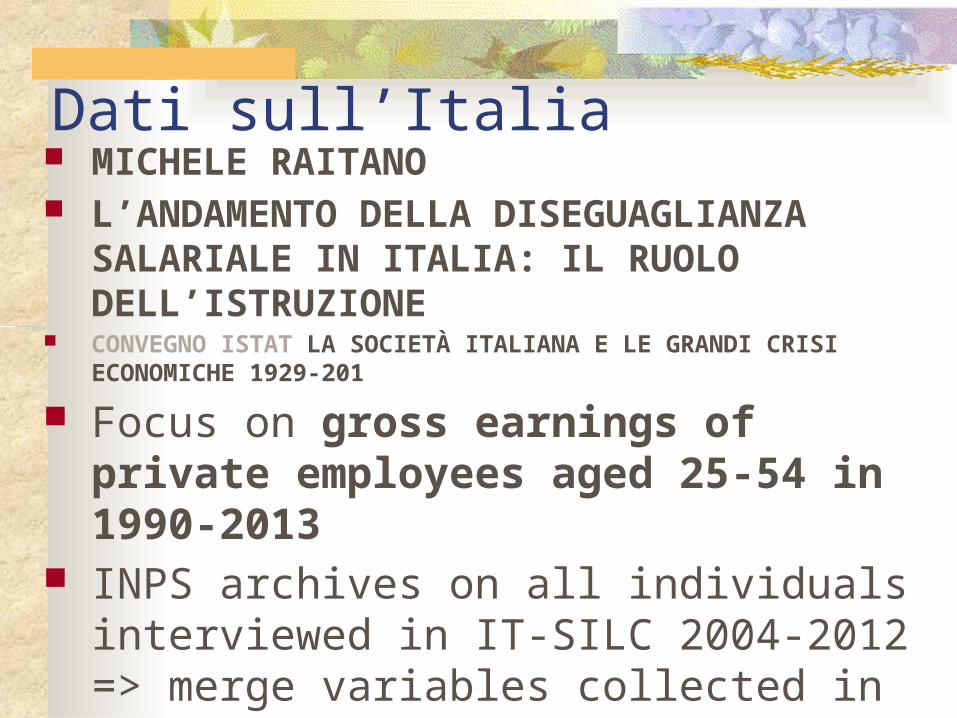
Dati sull’Italia MICHELE RAITANO L’ANDAMENTO DELLA DISEGUAGLIANZA
SALARIALE IN ITALIA: IL RUOLO DELL’ISTRUZIONE
CONVEGNO ISTAT LA SOCIETÀ ITALIANA E LE GRANDI CRISI ECONOMICHE 1929-201
Focus on gross earnings of private employees aged 25-54 in 1990-2013
INPS archives on all individuals interviewed in IT-SILC 2004-2012 => merge variables collected in SILC (at most for 4 years) with longitudinal variables recorded in INPS archives.
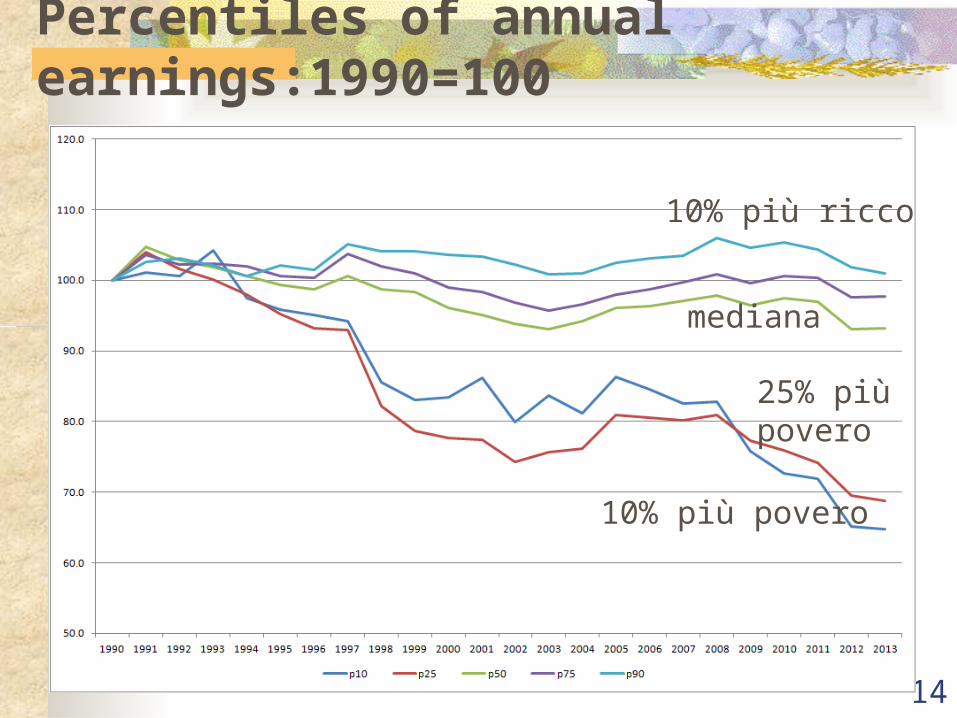
Percentiles of annual earnings:1990=100
14
10% più povero
25% più povero
mediana
10% più ricco

B) Gini of annual earnings by education
15
0.200
0.225
0.250
0.275
0.300
0.325
0.350
0.375
0.400
0.425
0.450
0.475
0.500
0.525
0.550
1990 1991 1992 1993 1994 1995 1996 1997 1998 1999 2000 2001 2002 2003 2004 2005 2006 2007 2008 2009 2010 2011 2012 2013
At most lower secondary Upper secondary Tertiary All workers
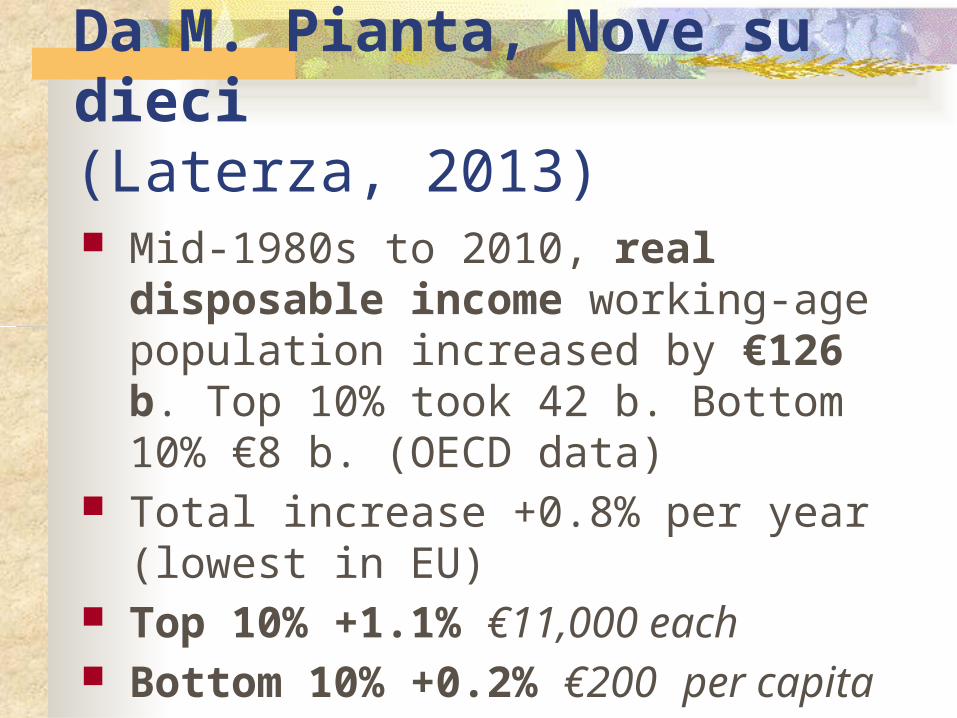
Da M. Pianta, Nove su dieci (Laterza, 2013) Mid-1980s to 2010, real disposable income
working-age population increased by €126 b. Top 10% took 42 b. Bottom 10% €8 b. (OECD data)
Total increase +0.8% per year (lowest in EU) Top 10% +1.1% €11,000 each Bottom 10% +0.2% €200 per capita
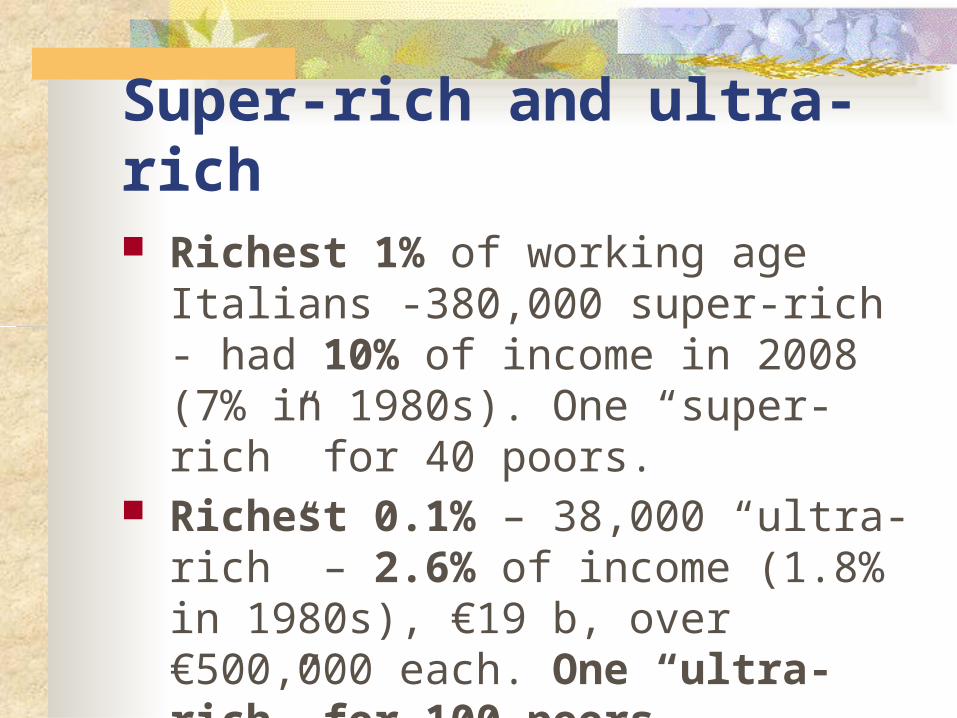
Super-rich and ultra-rich Richest 1% of working age Italians -
380,000 super-rich - had 10% of income in 2008 (7% in 1980s). One “super-rich” for 40 poors.
Richest 0.1% – 38,000 “ultra-rich” – 2.6% of income (1.8% in 1980s), €19 b, over €500,000 each. One “ultra-rich” for 100 poors.
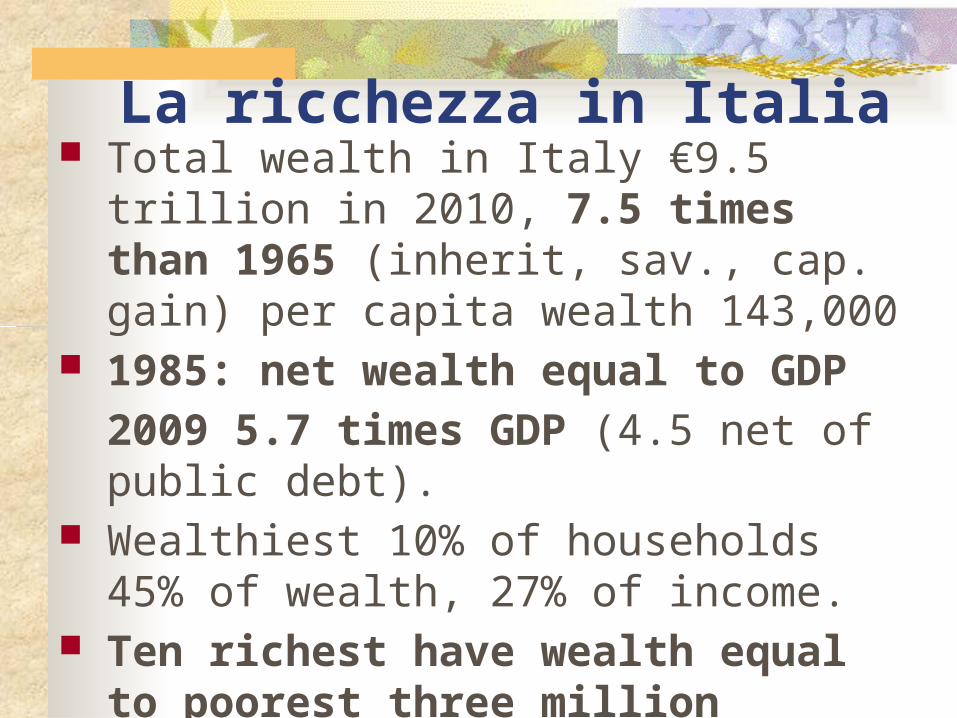
La ricchezza in Italia Total wealth in Italy €9.5 trillion in 2010, 7.5
times than 1965 (inherit, sav., cap. gain) per capita wealth 143,000
1985: net wealth equal to GDP 2009 5.7 times GDP (4.5 net of public debt).
Wealthiest 10% of households 45% of wealth, 27% of income.
Ten richest have wealth equal to poorest three million (Cannari and D’Alessio, 2006). One rich for 300,000 poors
0%
2%
4%
6%
8%
10%
12%
14%
16%
18%
20%
France Germany Netherlands Sweden Italy UK US
1980 1990 2000 2010
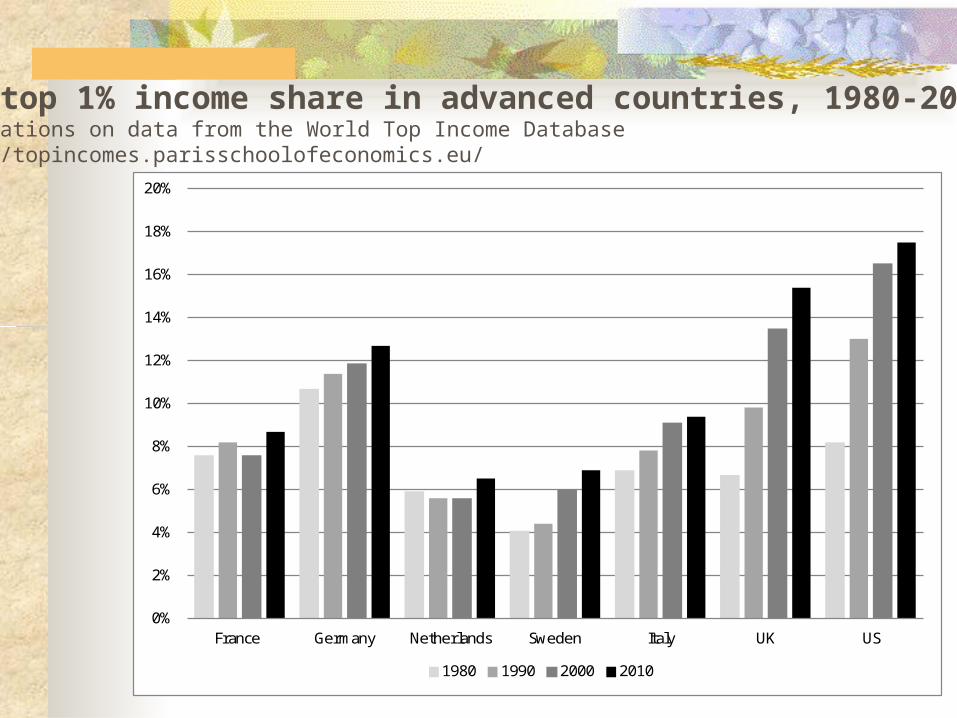
The top 1% income share in advanced countries, 1980-2010Calculations on data from the World Top Income Databasehttp://topincomes.parisschoolofeconomics.eu/
0,15
0,2
0,25
0,3
0,35
0,4
France Germany Netherlands Denmark Sweden Italy UK US
1985 1995 2010
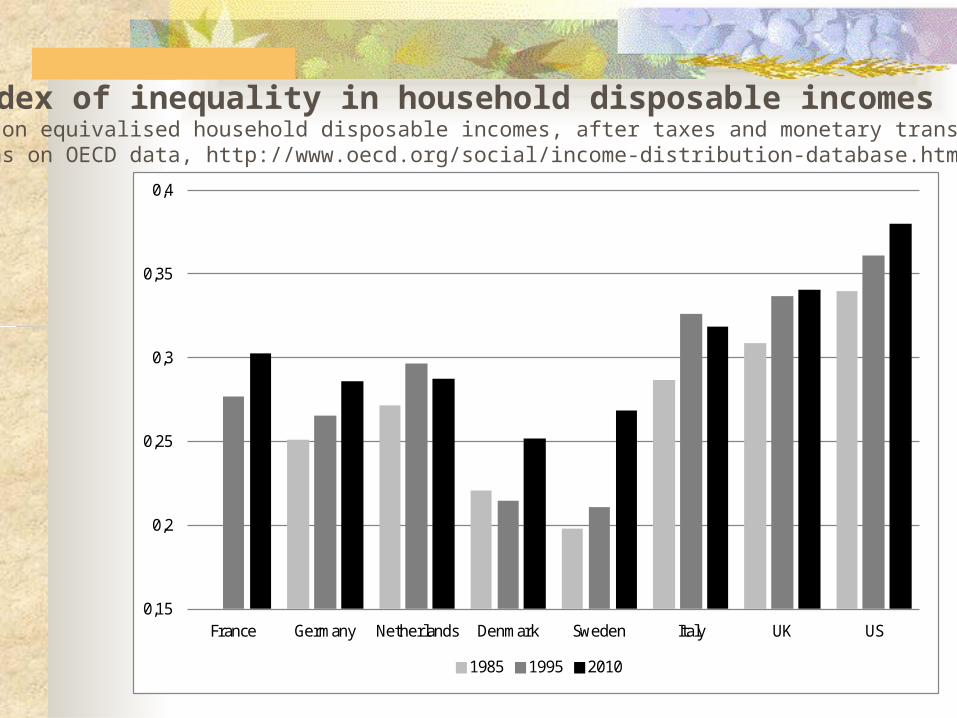
Gini index of inequality in household disposable incomesGini index on equivalised household disposable incomes, after taxes and monetary transfers.Calculations on OECD data, http://www.oecd.org/social/income-distribution-database.htm
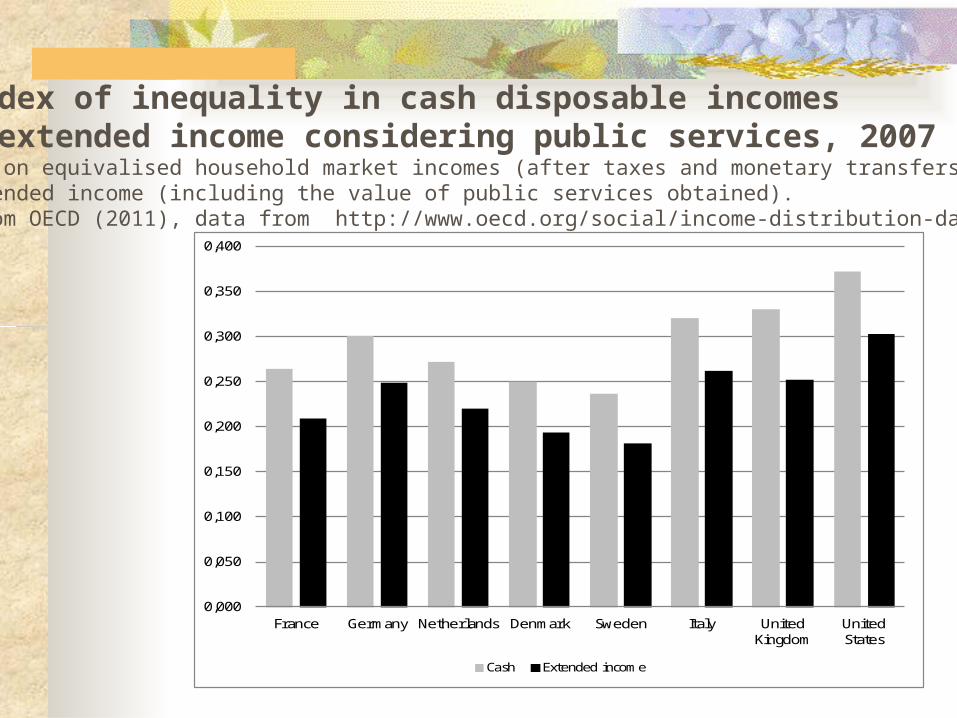
0,000
0,050
0,100
0,150
0,200
0,250
0,300
0,350
0,400
France Germany Netherlands Denmark Sweden Italy United Kingdom
United States
Cash Extended income
Gini index of inequality in cash disposable incomes and in extended income considering public services, 2007Gini index on equivalised household market incomes (after taxes and monetary transfers) and on extended income (including the value of public services obtained).Adapted from OECD (2011), data from http://www.oecd.org/social/income-distribution-database.htm
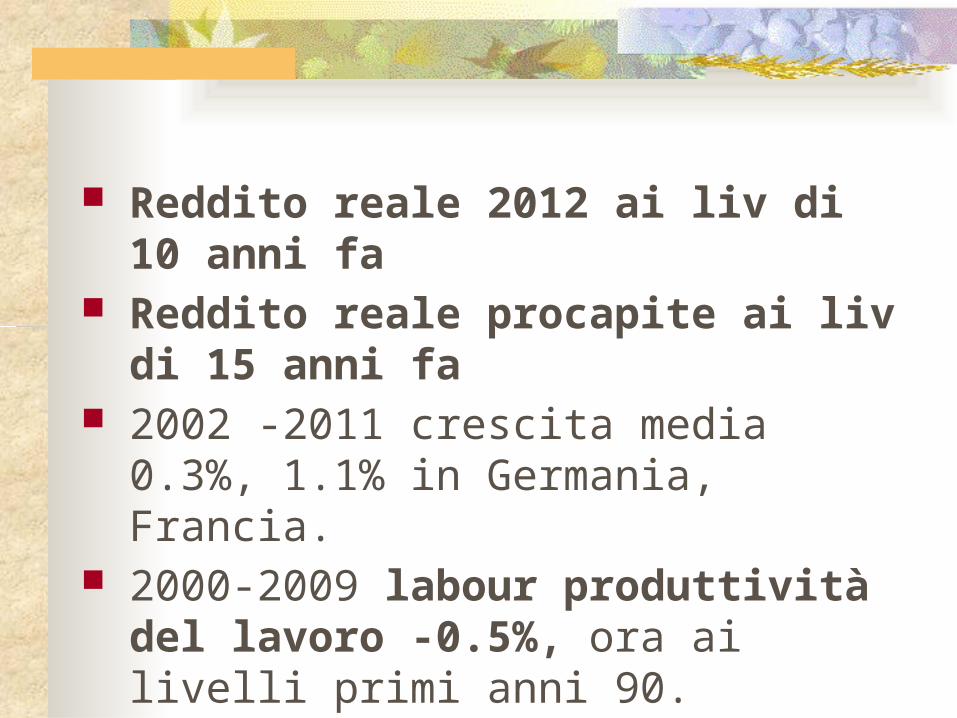
Reddito reale 2012 ai liv di 10 anni fa Reddito reale procapite ai liv di 15 anni fa 2002 -2011 crescita media 0.3%, 1.1% in
Germania, Francia. 2000-2009 labour produttività del lavoro -
0.5%, ora ai livelli primi anni 90.

0,20
0,25
0,30
0,35
0,40
0,45
0,10 0,15 0,20 0,25 0,30 0,35 0,40 0,45 0,50 0,55
US
UK
ItalySwitzerlandFrance
Spain
Japan
Germany
Sweden
New Zealand
Australia
Canada
Denmark
Finland
Norway
Degree of intergenerational transmission
Gini index ondisposableincome
The reproduction of inequalities“Great Gatsby curve” (Corak,2013, Krueger,2012).
Conclusioni Un indice aggregato di benessere è utile, sia
monetario che come numero indice Vanno esplicitate le teorie/interpretazioni dietro
gli indicatori considerati I fenomeni rilevanti e oggetto di politiche (CO2,
disuguaglianza) devono essere colti appieno I pesi delle diverse dimensioni sono oggetto di
valutazione politica e dibattito nella società La politica deve utilizzare questi indicatori Diffusione dati e accesso
02/05/2023 26
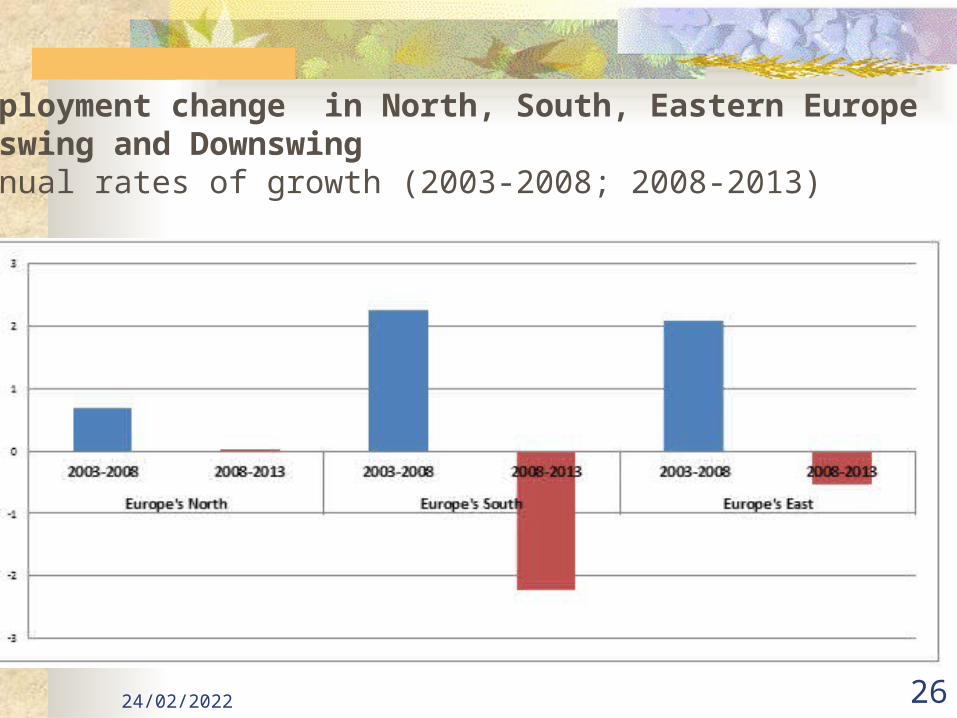
Employment change in North, South, Eastern EuropeUpswing and DownswingAnnual rates of growth (2003-2008; 2008-2013)
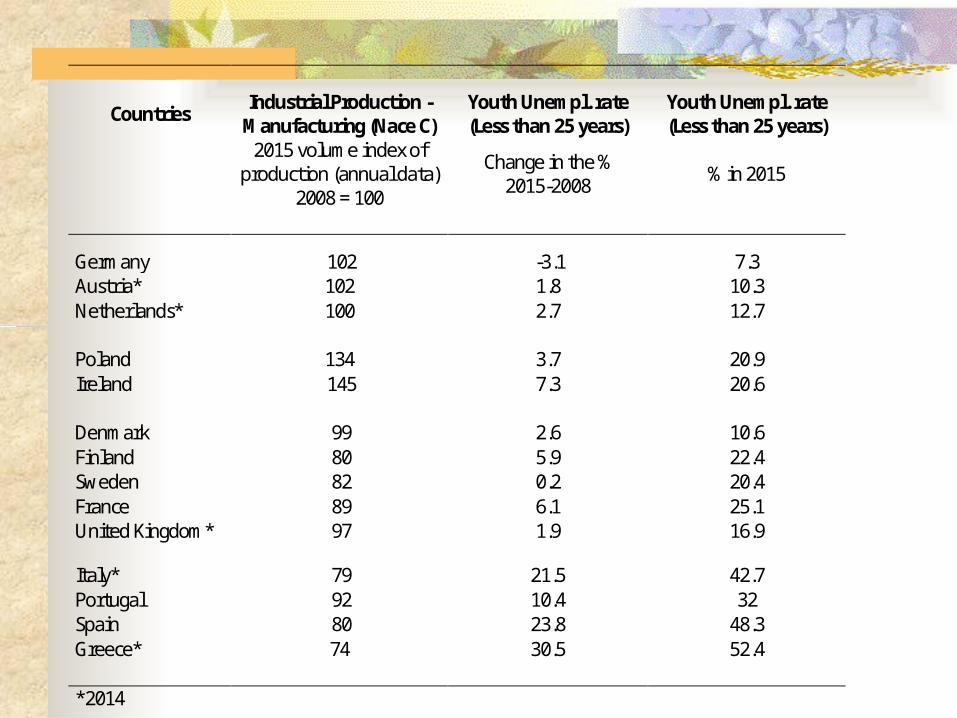
Countries Industrial Production -Manufacturing (Nace C)
Youth Unempl. rate (Less than 25 years)
Youth Unempl. rate (Less than 25 years)
2015 volume index of production (annual data)
2008 = 100
Change in the % 2015-2008 % in 2015
Germany 102 -3.1 7.3 Austria* 102 1.8 10.3 Netherlands* 100 2.7 12.7
Poland 134 3.7 20.9 Ireland 145 7.3 20.6
Denmark 99 2.6 10.6 Finland 80 5.9 22.4 Sweden 82 0.2 20.4 France 89 6.1 25.1 United Kingdom* 97 1.9 16.9
Italy* 79 21.5 42.7 Portugal 92 10.4 32 Spain 80 23.8 48.3 Greece* 74 30.5 52.4 *2014

Figure 3. Index of production in manufacturing for EU28 and selected European economies, January 2008=100. Monthly data, seasonally adjusted and adjusted by working days.
Source: Eurostat, Short-term business statistics, Industry.
60
70
80
90
100
110
120
130
140
2008 2009 2010 2011 2012 2013 2014 2015
European Union (28 countries)
France
Germany
Italy
Poland
Spain
United Kingdom