Larese Filon Francesca - sdp.univ.fvg.it · Francesca Larese Filon – UCO Medicina del Lavoro –...
57
Francesca Larese Filon – UCO Medicina del Lavoro – Università di Trieste Giovanni Maina – Dip. Ortopedia, Traumatologia e Medicina del Lavoro – Università di Torino Larese Filon Francesca Roma 12 dicembre 2009
Transcript of Larese Filon Francesca - sdp.univ.fvg.it · Francesca Larese Filon – UCO Medicina del Lavoro –...

Francesca Larese Filon –
UCO Medicina del Lavoro – Università
di Trieste
Giovanni Maina –
Dip. Ortopedia, Traumatologia e Medicina del Lavoro –
Università
di Torino
Larese Filon FrancescaRoma 12 dicembre 2009

La necessità
di valutare lo stress lavoro
correlato utilizzando metodi fisiologici- biologici
L’utilità
di studiare la relazione tra marcatori
fisiologici di stress e risposte a questionari per la valutazione dello stress autopercepito
Larese Filon FrancescaRoma 12 dicembre 2009

Lavoro automatico e con ritmi imposti non controllabili (Norman et al 2004)
Alto turnover e assenteismo a testimoniare elevati livelli di stress (Benninghoven, 2005, Holman, 2002)
Durante il lavoro devono essere sempre “amichevoli”
e questo
causa elevato carico emozionale (Cox-
Fuenzalida, 2007)Larese Filon FrancescaRoma 12 dicembre 2009

Larese Filon FrancescaRoma 12 dicembre 2009
Lo stress causa una disregolazione dell’asse ipotalamo-ipofisi-surrene (Mc Even 1998) con aumento o riduzione dei livelli di cortisolo ematico
Può essere misurato facilmente nella saliva (Kirschbaum 1994)
Conosciamo abbastanza bene le variazioni circadiane (Edwards et al 2001)
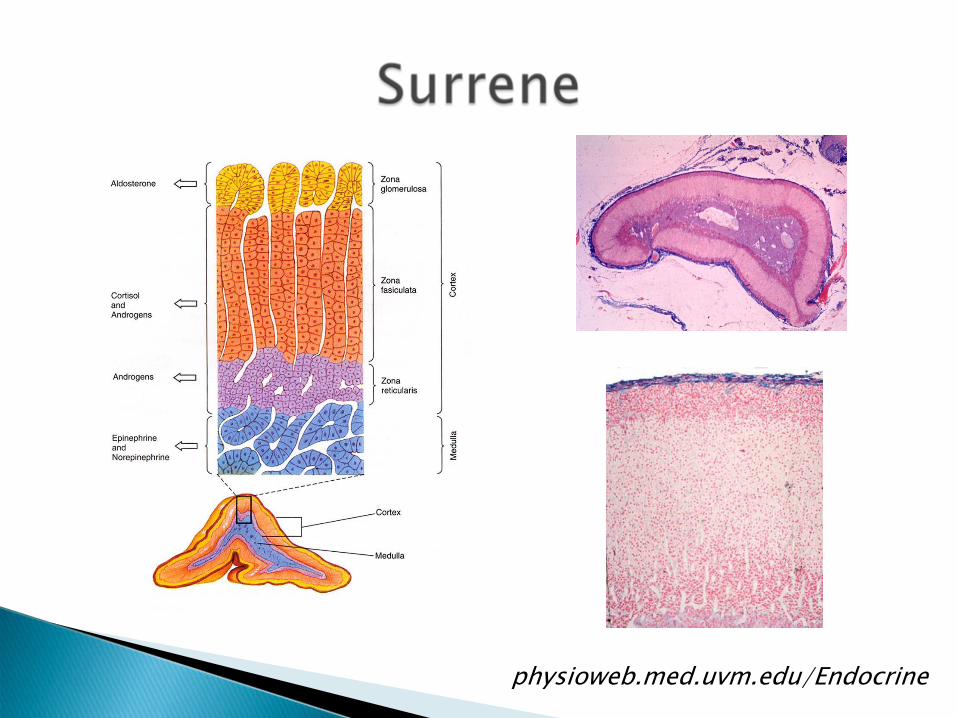
physioweb.med.uvm.edu/Endocrine

STRESS
CORTISOL
CATECHOLAMINES
(WHEATER)
A MOST INTERESTING ASPECTOF ADRENAL BLOOD CIRCULATION
physioweb.med.uvm.edu/Endocrine

DAILY SECRETION: CORTISOL
Pulsatile signals from pituitaryDiurnal changes in the feedback SET POINT
physioweb.med.uvm.edu/Endocrine

Mean salivary cortisol on waking (wake), 15 (wake+15) and 30 (wake+30)
min later, and then
at 1000–1030
h, 1600–1630
h and 2000–2030
h in men (solid line) and women (dashed line). (Steptoe, 2006)

E’ nota la relazione fra job strain e ipertensione (Belkic et al, 2004. Scand J Work Environ Health, 30: 85-128)
La relazione è migliore analizzando la pressione arteriosa in modo continuativo (Holter).
Ci sono numerosi studi che hanno correlato elevati livelli di pressione arteriosa con alto job strain valutato con il metodo di Karasek

10
employees exposed to high strain have higher SBP and DBP
during work
1 workday (24h)cross–sectional117 f and 124 m
white collar
Rau, 2004
high job demand predicted higher SBP in workday
1 workday and 1 day off
no sleep measures
cross–sectional159 nurses (f)
Riese et al, 2004
in nurses (but no in teachers) low control and SBP and DBP were inversely related in both
work and home settings
1 workday (24h)cross–sectional
147 females (92 teachers, 55 nurses)
Brown et al, 2006
job strain and marital cohesion were associated with SBP
increase(+ 3 mm Hg) in both sex
1 workday (24h)follow-up (1 year)229 healthy workers
(123 f, 106 m)
Tobe et al, 2007
in both sex work SBP and DBP were higher in job-strains
compared with other categories (6.5 mmHg SBP, 3.1
mmHg DBP)
1 workday (24h)case-control 178 healthy workers
Clays et al, 2007
RESULTS RESULTS SAMPLING STRATEGYSAMPLING STRATEGYSTUDY POPULATIONSTUDY POPULATIONAUTHORAUTHOR

11
job strain associated with higher DBP during working hours (4.5 mmHg)
1 workday (24h)cross–sectional70 chemical workers
Fauvel et al, 2000
inconsistent evidence for hypothesis of rapid induction /recovery from job strain and BP
1 workday (24h)longitudinal study 213 employed men
Landsbergis et al, 2003
high strains with lower SES have SBP (2.7-11.8 mmHg) and DBP (1.9-
6.1 mmHg)
1 workday (24h)cross–sectional283 white and bleu-
collar men
Landsbergis et al, 2003
no association between job strain and ABP
1 workday (24h)cross–sectional59 nurses
Brown et al, 2003
SBP and DBP were greater in low than high job control (125.7/81.5 versus 122.4/78.6 mmHg)
1 workdayno sleep measures
cross–sectional227 subjects (106 f, 121 m)
Steptoe, 2004
RESULTSRESULTSSAMPLING STRATEGYSAMPLING STRATEGYSTUDY POPULATIONSTUDY POPULATIONAUTHORAUTHOR
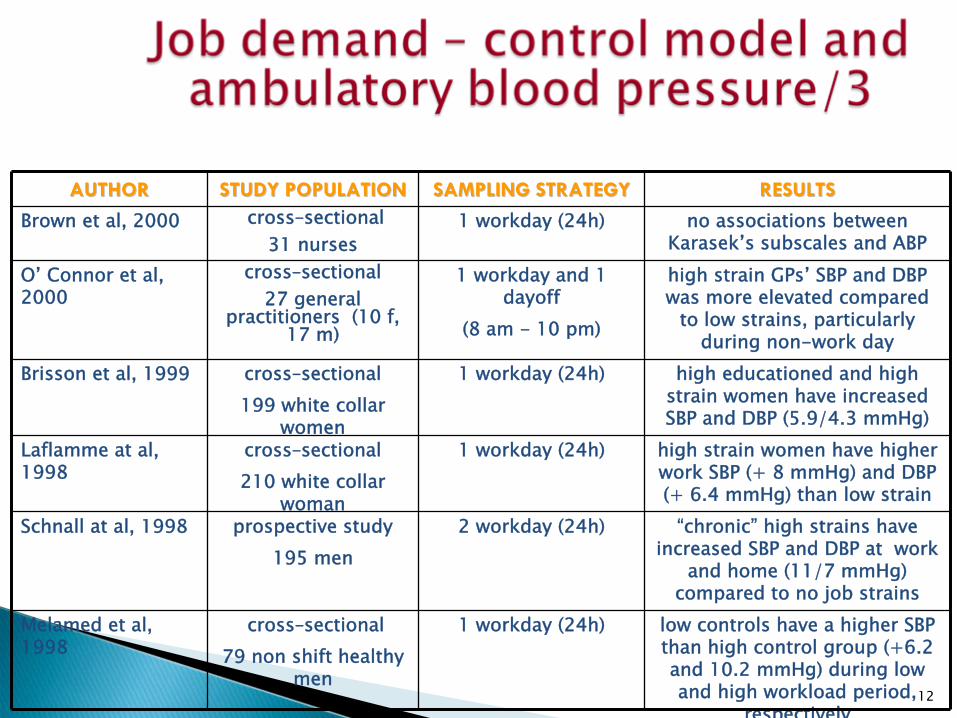
12
“chronic”
high strains have increased SBP and DBP at work
and home (11/7 mmHg) compared to no job strains
2 workday (24h)prospective study195 men
Schnall at al, 1998
low controls have a higher SBP than high control group (+6.2 and 10.2 mmHg) during low and high workload period,
respectively
1 workday (24h)cross–sectional79 non shift healthy
men
Melamed et al, 1998
high strain women have higher work SBP (+ 8 mmHg) and DBP (+ 6.4 mmHg) than low strain
1 workday (24h)cross–sectional210 white collar
woman
Laflamme at al, 1998
high educationed and high strain women have increased SBP and DBP (5.9/4.3 mmHg)
1 workday (24h)cross–sectional199 white collar
women
Brisson et al, 1999
high strain GPs’
SBP and DBP was more elevated compared
to low strains, particularly during non-work day
1 workday and 1 dayoff
(8 am -
10 pm)
cross–sectional27 general
practitioners (10 f, 17 m)
O’
Connor et al, 2000
no associations between Karasek’s subscales and ABP
1 workday (24h)cross–sectional31 nurses
Brown et al, 2000RESULTSRESULTSSAMPLING STRATEGYSAMPLING STRATEGYSTUDY POPULATIONSTUDY POPULATIONAUTHORAUTHOR

13
high strain men have a greater increases in
working hours than low strains (SBP: +9.9 ; DBP:
+7.9 mHg)
1 workday (8h)cross–sectional129 healthy subjects
(64 f, 65 m)
Light at al, 1992
job strain was associated with
increased SBP (+6.8 mmHg) and increased DBP (+2.8 mmHg) at
work
1 workday (24h)case-control 88 and 176 control men
Schnall et al, 1992
job strains have work SBP higher (+ 6,7
mmHg) and DBP (+ 2,7 mmHg) than other
employees
1 workday (24h)cross–sectional262 men
Landsbergis et al, 1994
among normotensive, SBP show the following
trand: high strain > passive > active > low
strain
1 workday (24h)cross-sectional527 normotensive and
mild hypertensive nonmedicated men
Cesana et al, 1996
RESULTS RESULTS SAMPLING STRATEGYSAMPLING STRATEGYSTUDY POPULATIONSTUDY POPULATIONAUTHORAUTHOR

14
Effort-
reward imabalance model and ambulatory blood
pressure
no associations in females
work and home SBP higher in
overcommited (132 mmHg) than control group (125 mmHg)
1 workday during waking hours only
cross–sectional197 subjects (105 m,
92 f)
Steptoe et al, 2004
overcommitment not affects SBP and
DBPwork and home SBP
higher in imbalanced men
(mean 3.9 mmHg)
2 workday and 1 day off during
waking hours only
cross–sectional109 white collar men
Vrijkotte et al,1999
RESULTS RESULTS SAMPLING STRATEGYSAMPLING STRATEGYSTUDY POPULATIONSTUDY POPULATIONAUTHORAUTHOR
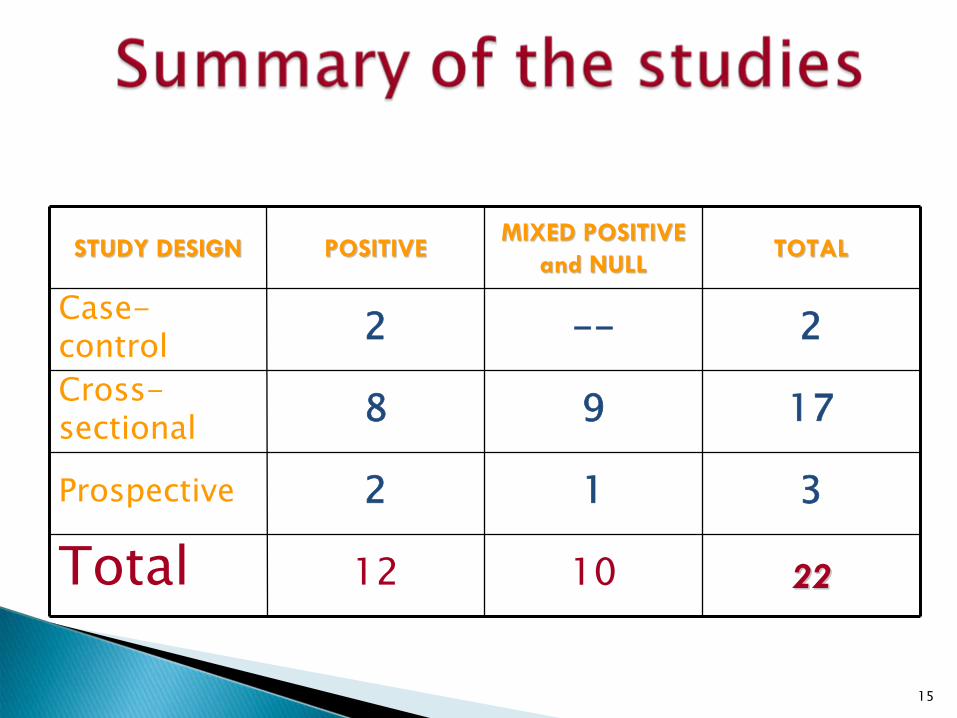
15
312Prospective
10
9
--
MIXED POSITIVEMIXED POSITIVEand NULLand NULL
222212Total
178Cross- sectional
22Case- control
TOTALTOTALPOSITIVEPOSITIVESTUDY DESIGNSTUDY DESIGN

Valutare l’associazione fra job strain, cortisolo salivare e monitoraggio continuo della pressione arteriosa

17
Study design:
cross-sectional
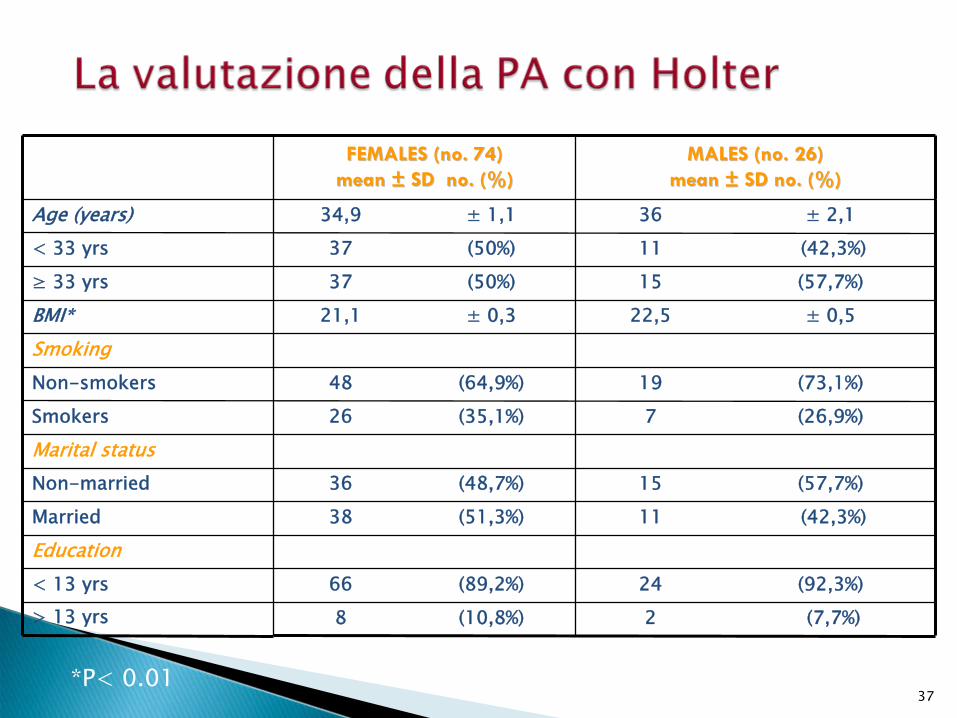
Population:
100 call-centres operators (2 call-centres)
In work site settings:
medical examination: height (m) & weight (Kg): BMI (Kg/ m2)
self administered questionnaires:
job-content questionnaire (no.11 items): job demand no.5, job control no.6
effort-reward imbalance questionnaire (no.21 items): effort no.5, reward no.11, overcommitment no.5
Exclusion criteria:
medication for hypertension
previous hospitalization for CHD
METHODS (1)

18
24 HOUR-MONITORING:
blood
pressure measurements in 2
workdays (pleasant, unpleasant) using bp one OPCB ABP
from 7 am till 10 pm: every ½hour
from 10 pm till 6 am: every hour

◦
Cortisolo salivare raccolto con Saliviette tubes (Sarstedt Ltd Leicester UK)◦
7 campioni per 3 giorni: 2 giorni di lavoro (turno gradito e turno sgradito) e 1 giorno di riposo
Al risveglio
Dopo 30 minuti
Dopo 60 minuti
E ogni 3 ore per 4 volte
TOTALE DI 1450 CAMPIONI
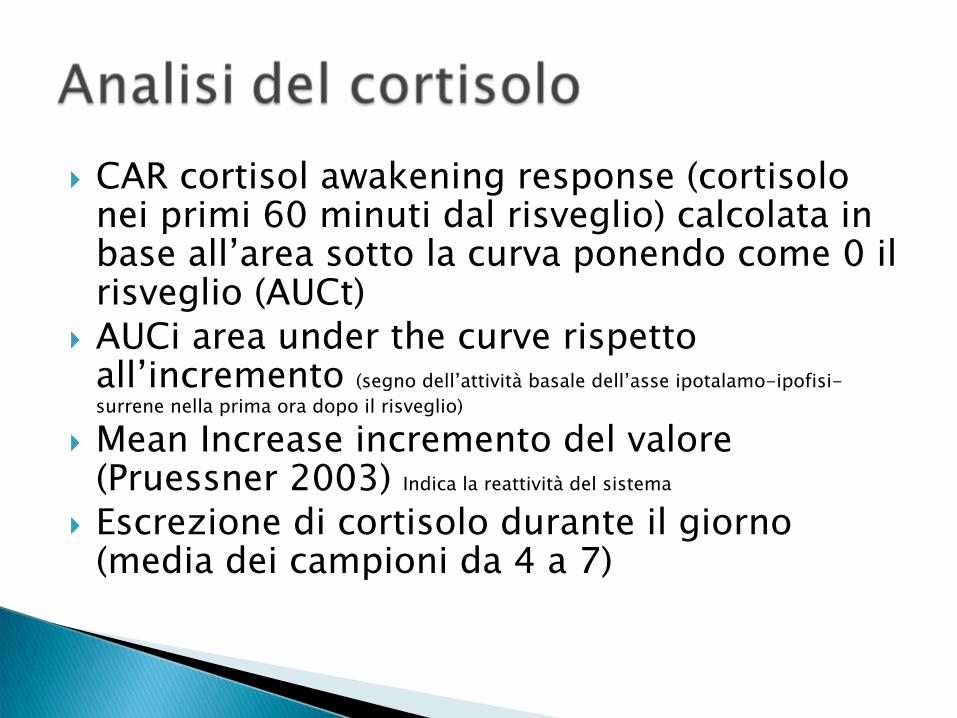
CAR cortisol awakening response (cortisolo nei primi 60 minuti dal risveglio) calcolata in base all’area sotto la curva ponendo come 0 il risveglio (AUCt)
AUCi area under the curve rispetto all’incremento (segno dell’attività
basale dell’asse ipotalamo-ipofisi-
surrene nella prima ora dopo il risveglio)
Mean Increase incremento del valore (Pruessner 2003) Indica la reattività
del sistema
Escrezione di cortisolo durante il giorno (media dei campioni da 4 a 7)

21
DATA PROCESSING
Average ABP: night (no. 1550 obs), rest (no. 3361obs), work 8-14, work 14-20 (no. 2057 obs)
(MAP: (SBP+2D)/3)
Statistical methods:
X2
Spearman rank
Analyses of variance
generalized estimating equations (GEE)

22Image courtesy of J. Siegrist

23Image courtesy of J. Siegrist


Il job strain influenza l’increzione di cortisolo al risveglio in senso positivo (hi strain vs low strain)
Le donne presentano valori di cortisolo più
elevate e significativamente maggiori nei giorni di lavoro ripetto ai giorni di riposo
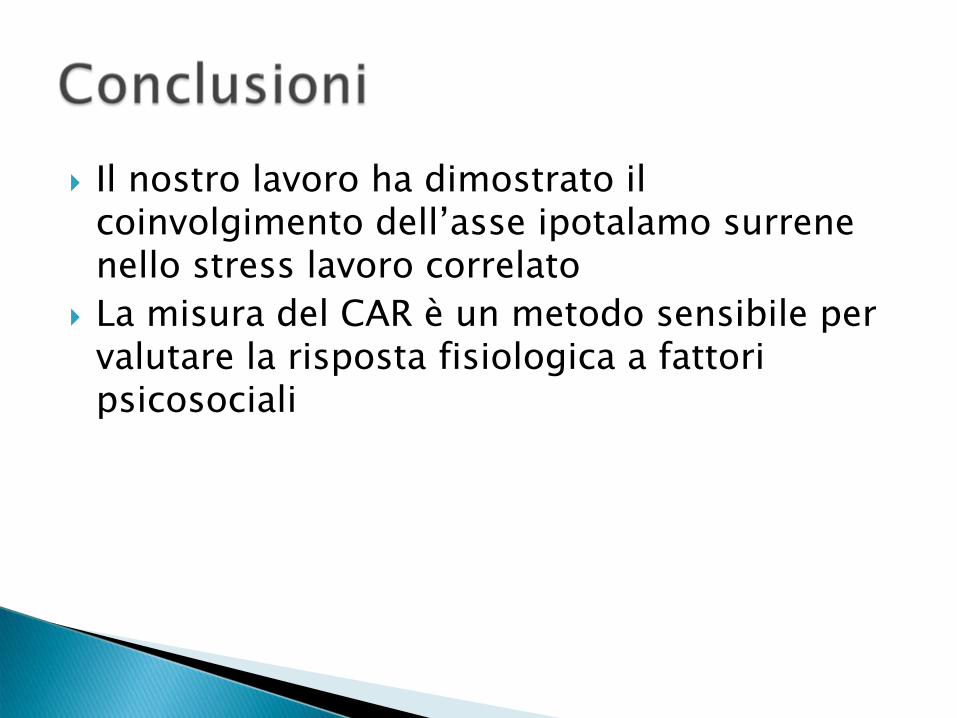
Il nostro lavoro ha dimostrato il coinvolgimento dell’asse ipotalamo surrene nello stress lavoro correlato
La misura del CAR è
un metodo sensibile per
valutare la risposta fisiologica a fattori psicosociali

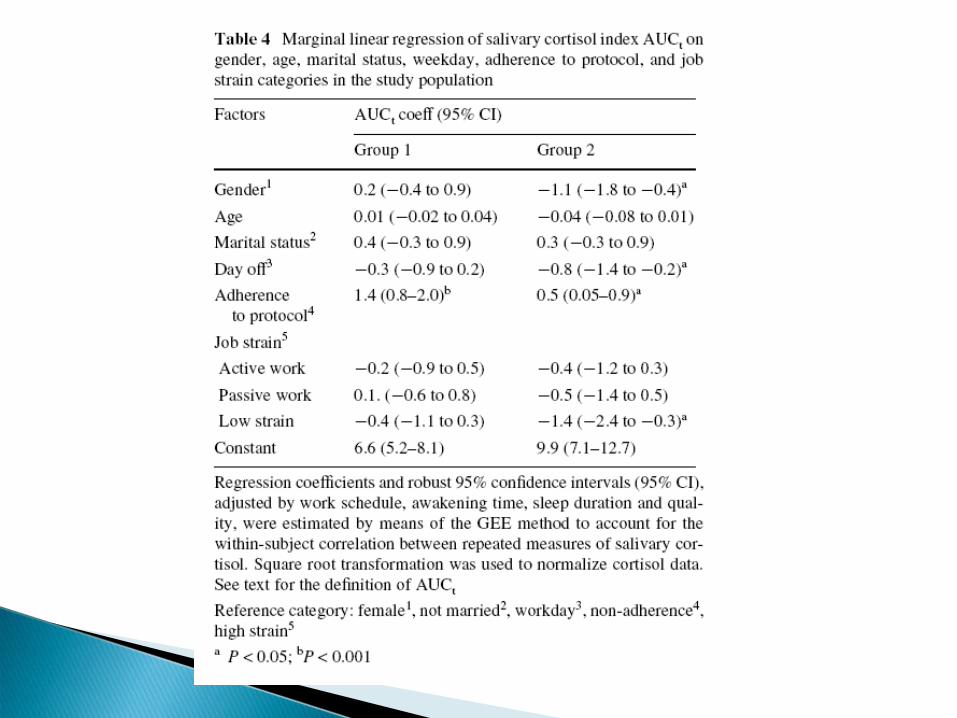
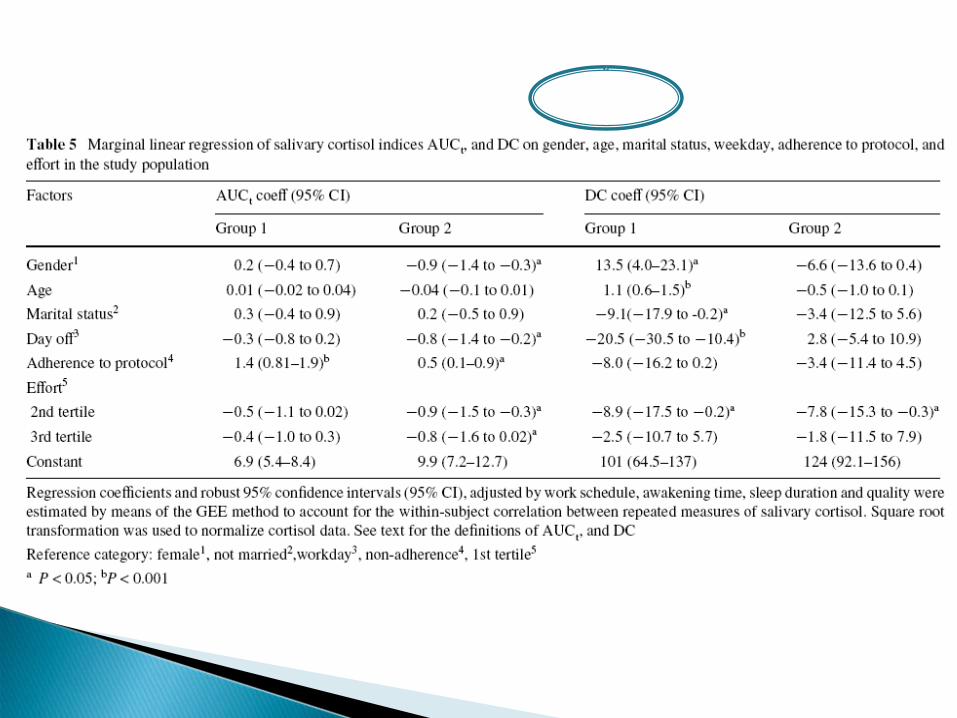


Il cortisolo escreto nel periodo di risveglio è
associato positivamente al job strain
Il cortisolo escreto nel periodo di risveglio risulta più
basso nei soggetti con alto
sbilanciamento impegno/ricompensa secondo il modello di Siegrist
37
2
24
11
15
7
19
22,5
15
11
36
8
66
38
36
26
48
21,1
37
37
34,9
MALES (no. 26)MALES (no. 26)mean mean ±±
SD no. (%)SD no. (%)FEMALES (no. 74)FEMALES (no. 74)
mean mean ±±
SD no. (%)SD no. (%)
(42,3%)(51,3%)Married
Education
(57,7%)(48,7%)Non-married
(92,3%)(89,2%)< 13 yrs
±
2,1 ± 1,1Age (years)(42,3%) (50%)< 33 yrs
(7,7%)(10,8%)> 13 yrs
Marital status(26,9%)(35,1%)Smokers
(73,1%)(64,9%)Non-smokers
Smoking±
0,5 ± 0,3BMI*(57,7%)(50%)≥
33 yrs
*P< 0.01

38
9
17
10
16
5
5
9
7
26
48
33
41
17
15
21
21
(19,2%)(23%)Low Strain
Job Control(61,5%)(55,4%)Low
(38,5%)(44,6%)High
Job Demand(65,4%)(64,9%)Low
(34,6%)(35,1%)High
(19,2%)(20,3%)Passive
Karasek classification
Males (no. 26)Males (no. 26)
mean mean ±±
SD no. (%)SD no. (%)
Females (no. 74)Females (no. 74)
mean mean ±±
SD no. (%)SD no. (%)
(34,6%)(28,4%)Active
(26,9%)(28,4%)High strain

39
1313
7 19
1214
917
3539
1361
3143
2648
Reward
(65,4%)(64,9%)Low(3,4%)(35,1%)High
Effort
(53,9%)(58,1%)Low(46,1%)(41,9%)High
Imbalance(73,1%)(82,4%)Low(26,9%)(17,6%)High
Overcomitment(50%)(52,7%)Low
Males (no. 26)Males (no. 26)
mean mean ±±
SD no. (%)SD no. (%)
Females (no. 74)Females (no. 74)
mean mean ±±
SD no. (%)SD no. (%)
(50%)(47,3%)High
40
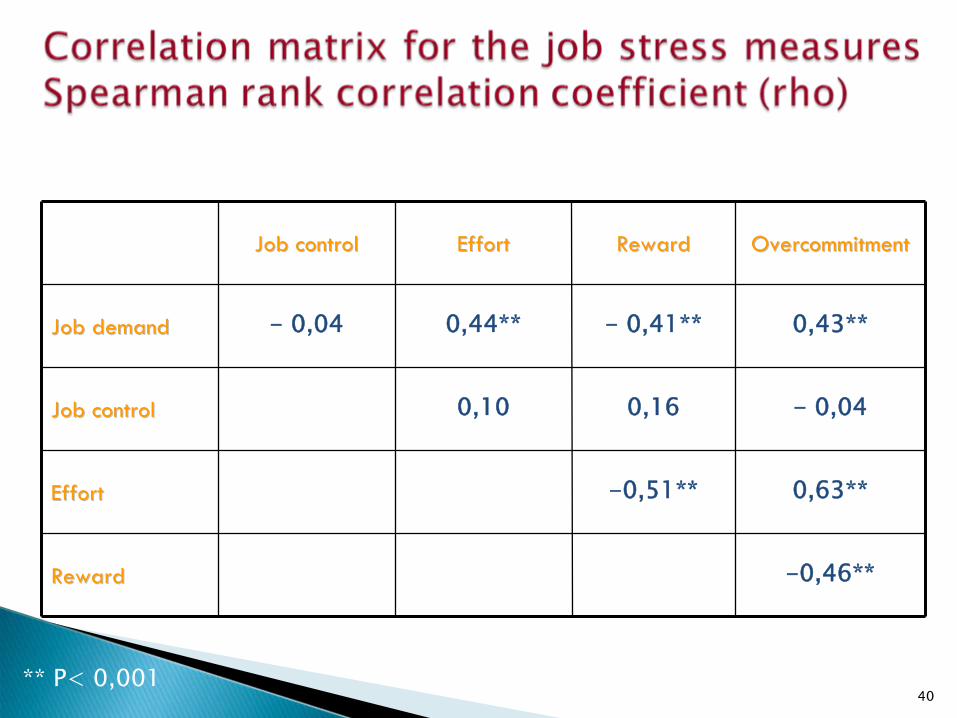
-0,46**RewardReward
0,63**-0,51**EffortEffort
- 0,040,160,10Job controlJob control
0,43**- 0,41**0,44**- 0,04Job demandJob demand
OvercommitmentOvercommitmentRewardRewardEffortEffortJob controlJob control
** P< 0,001
41
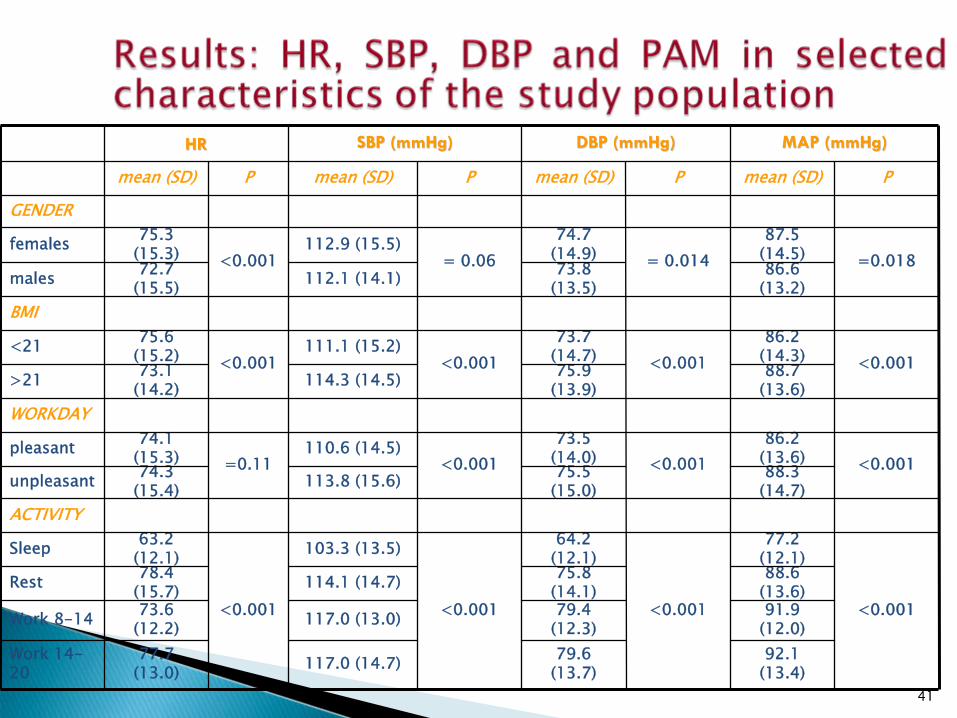
88.6 (13.6)
75.8 (14.1)114.1 (14.7)78.4
(15.7)Rest
92.1 (13.4)
79.6 (13.7)
<0.001
117.0 (14.7)77.7 (13.0)
Work 14-
20
91.9 (12.0)
79.4 (12.3)117.0 (13.0)73.6
(12.2)Work 8-14 <0.001
77.2 (12.1)
<0.001
64.2 (12.1)103.3 (13.5)
<0.001
63.2 (12.1)Sleep
ACTIVITY
88.3 (14.7)
75.5 (15.0)113.8 (15.6)74.3
(15.4)unpleasant<0.001
86.2 (13.6)<0.001
73.5 (14.0)<0.001
110.6 (14.5)=0.11
74.1 (15.3)pleasant
WORKDAY
88.7 (13.6)
75.9 (13.9)114.3 (14.5)73.1
(14.2)>21<0.001
86.2 (14.3)<0.001
73.7 (14.7)<0.001
111.1 (15.2)<0.001
75.6 (15.2)<21
BMI
86.6 (13.2)
73.8 (13.5)112.1 (14.1)72.7
(15.5)males=0.018
87.5 (14.5)= 0.014
74.7 (14.9)= 0.06
112.9 (15.5)<0.001
75.3 (15.3)females
GENDER
Pmean (SD)Pmean (SD)Pmean (SD)Pmean (SD)
MAP (mmHg)MAP (mmHg)DBP (mmHg)DBP (mmHg)SBP (mmHg)SBP (mmHg)HRHR

42
63,6 62,7
78,7 78,174,1 72,9
77,9 77,4
0
10
20
30
40
50
60
70
80
sleep rest work 8-14 work 14-20
pleasant unpleasant
bts/
min
P=0.20 P=0.28 P=0.25 P=0.43

43
101,8104,8
113,1 115,1 116,8 117,8 114,4 118,2
0
20
40
60
80
100
120
sleep rest work 8-14 work 14-20
pleasant unpleasant
mm
Hg
SBP, activity, workshift
P<0.001 P<0.001 P<0.83 P<0.001

44
63,3 65
74,9 76,8 78,6 80 78,181,2
0
10
20
30
40
50
60
70
80
90
sleep rest work 8-14 work 14-20
pleasant unpleasant
mm
Hg
DBP, activity, workshift
P=0,007 P<0,001 P=0,44 P<0,001

45
76,278,3
87,6 89,5 91,3 92,6 90,2 93,6
0
10
20
30
40
50
60
70
80
90
100
sleep rest work 8-14 work 14-20
pleasant unpleasant
mm
Hg
MAP, activity, workshift
P=0,001 P<0,001 P=0,64 P<0,001
46
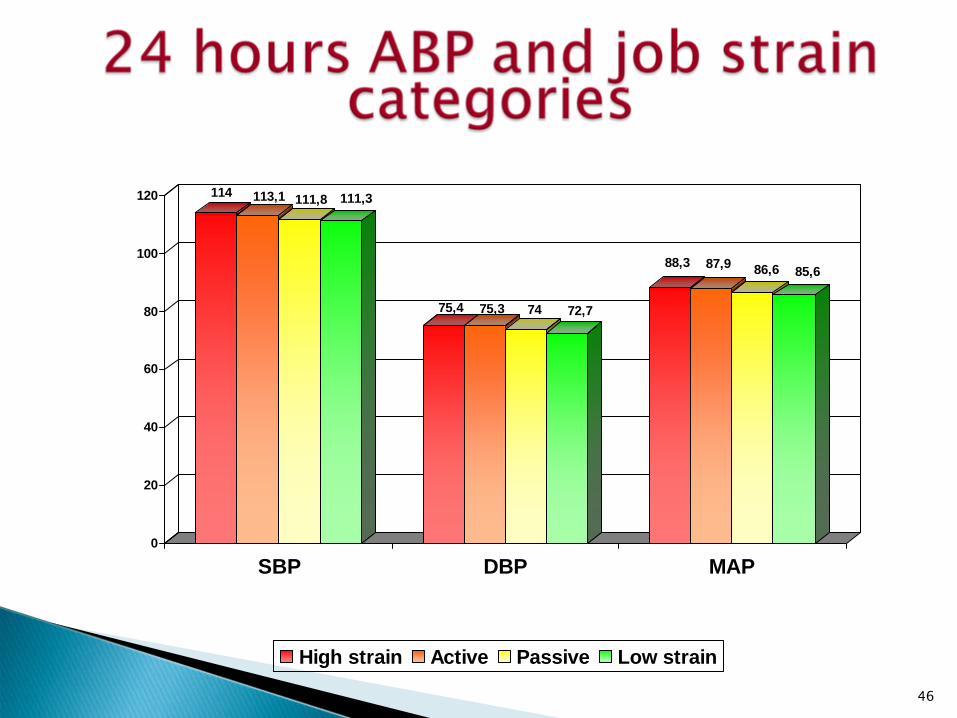
114 113,1 111,8 111,3
75,4 75,3 74 72,7
88,3 87,9 86,6 85,6
0
20
40
60
80
100
120
SBP DBP MAP
High strain Active Passive Low strain
mm
Hg
P<0,001 P<0,001 P<0,001

47
111,3 113,7 113,3 112,2
73,275,4 75 74,1 75,9
88,2 87,8 86,8
0
20
40
60
80
100
120
SBP DBP MAP
High control Low control High demand Low demand
mm
Hg
P<0,001 P<0,01 P<0,001P<0,005 P=0,13 P=0,004

48
113,9 112,1 111,4 113,7
75,9 73,7 73,4 75,3
88,686,5 86 88,1
0
20
40
60
80
100
120
SBP DBP MAP
High Effort Low Effort Istogram. 3D 3 High Reward Low Reward
mm
Hg
P<0,001 P<0,001 P<0,001P<0,001 P<0,001 P<0,001 P<0,001

49
115,1 112,1 113,1 112,3
76,6 73,9 74,9 74,1
89,4 86,6 87,6 86,9
0
20
40
60
80
100
120
SBP DBP MAP
High Imbalance Low Imbalance Istogram. 3D 7High Overcommitment Low Overcommitment
mm
Hg
P=0,051P<0,001 P<0,001 P<0,001P=0,018 P=0,022
50
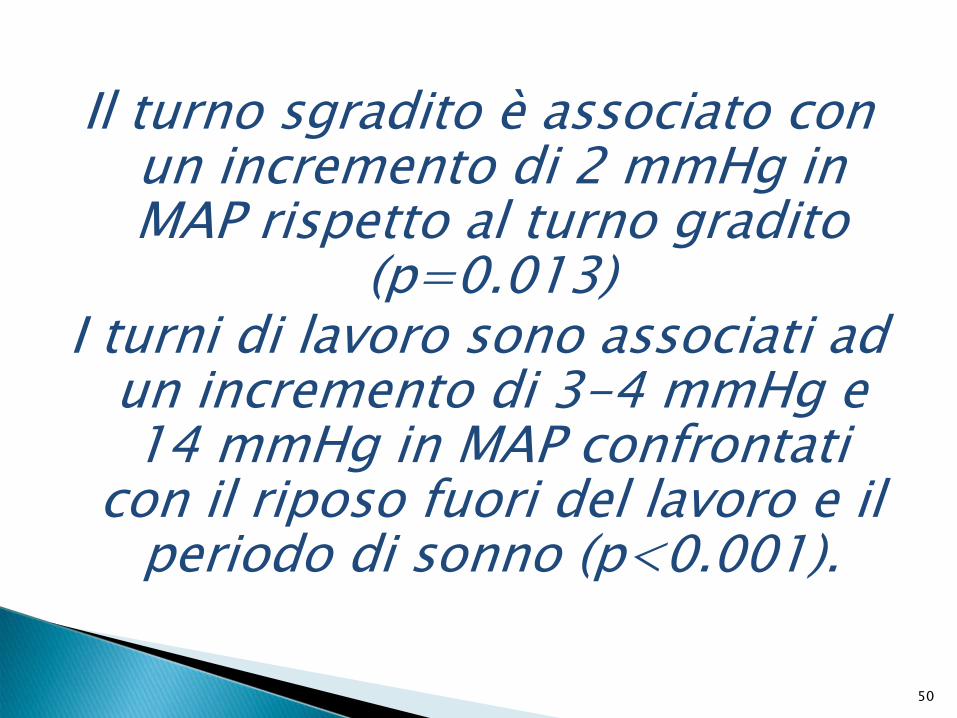
Il turno sgradito è associato con un incremento di 2 mmHg in MAP rispetto al turno gradito
(p=0.013) I turni di lavoro sono associati ad
un incremento di 3-4 mmHg e 14 mmHg in MAP confrontati
con il riposo fuori del lavoro e il periodo di sonno (p<0.001).

51
58,4 (47,1 to 69,7)**47,2 (36,6 to 57,8)**80,9 (67,4 to 94,5)**72,8 (59 to 86,5)**Constant
-1,2 (-5,4 to 2,9)-1,1 (-5 to 2,8)-1,5 (-6,3 to 3,3)1,1 (-3,9 to 6,2)Low strain
-0,6 (-3,9 to 2,7)-0,4 (-3,5 to 2,7)-1,2 (-5,2 to 2,8)3,5 (-0,5 to 7,6)Passive
0,5 (-3,1 to 4,1)0,9 (-2,6 to 4,4)-0,3 (-4,4 to 3,8)1,3 (-2,5 to 5,2)Active
Karasek classification9
14,9 (12,8 to 17)**15,7 (13,6 to 17,7)**13,2 (10,9 to 15,6)**16,5 (14,5 to 18,5)**Work 14-20 h
14,4 (12,5 to 16,3)**14,8 (12,9 to 16,6)**13,6 (11,5 to 15,6)**12 (10,3 to 13,7)**Work 8-14 h
11,4 (10,1 to 12,7)**11,7 (10,3 to 13)**10,8 (9,4 to 12,2)**15,1 (13,9 to 16,4)**Rest
Activity8
2 (0,4 to 3,6)*1,9 (0,4 to 3,4)*2,2 (0,4 to 4)*-0,8 (-2,2 to 0,6)Workday7
3,1 (-4,4 to 10,6)3,5 (-3,4 to 10,5)2,3 (-6,8 to 11,4)-0,9 (-7 to 5,3)Univ. Degree
2,3 (-2,6 to 7,1)2,2 (-1,9 to 6,4)2,4 (-4,2 to 9)0,5 (-3,7 to 4,7)Diploma
Education Level6-0,2 (-3,7 to 3,3)0,2 (-3,1 to 3,4)-1 (-5 to 3)-2,4 (-6,1 to 1,3)Marital status5
1,9 (-0,7 to 4,5)1,9 (-0,6 to 4,4)1,8 (-1,2 to 4,8)0,8 (-2,6 to 4,1)Smoking4
0,7 (0,2 to 1,1)*0,6 (0,1 to 1)*0,8 (0,4 to 1,3)*-0,5 (-1,1 to 0,1)BMI3
-1,8 (-4,4 to 0,8)-1,7 (-4,1 to 0,7)-2 (-5,1 to 1)-1,9 (-5,5 to 1,8)Gender2
0,1 (-0,1 to 0,2)0 (-0,1 to 0,2)0,1 (-0,1 to 0,3)0 (-0,2 to 0,2)Age1
MAP Coef (95%Cl)DBP Coef (95%Cl)SBP Coef (95%Cl)HR Coef (95% Cl)Factors
* P < 0,05 ** P = 0.000 Reference category: age <33 yrs1, female2, BMI < 213, non smokers4, non married5
, primary school6, pleasant7, night8, high strain9

52
59,1 (48,1 to 70.2)**48,2 (37,8 to 58,5)**81,4 (68,5 to 94,2)**74,1 (61,0 to 87,3)**Constant
0.1 (-2,8 to 3,0)-0,1 (-2,9 to 2,6)0,6 (-2,8 to 4,0)1,0 (-2,2 to 4,3)Job demand10
-1,4 (-3,9 to 1,0)-1,4 (-3,7 to 0,9)-1,6 (-4,6 to 1,4)1,3 (-1,7 to 4,4)Job control9Karasek dimensions
14,8 (12,7 to 17,0)**15,6 (13,6 to 17,7)**13,2 (10,8 to 15,5)**16,4 (14,4 to 18,5)**Work 14-20 h
14,4 (12,5 to 16,2)**14,7 (12,9 to 16,6)**13,6 (11,5 to 15,6)**12,0 (10,3 to 13,7)**Work 8-14 h
11,4 (10,1 to 12,7)**11,7 (10,3 to 13,0)**10,8 (9,4 to 12,1)**15,2 (14,0 to 16,4)**Rest
Activity8
2,0 (0,4 to 3,6)*1,9 (0,4 to 3,4)*2,2 (0,4 to 4,0)*-0,8 (-2,2 to 0,6)Workday7
2,9 (-4,3 to 10,0)3,2 (-3,3 to 9,8)2,0 (-6,7 to 10,8)-1,9 (-8,2 to 4,4)Univ. Degree
2,1 (-2,6 to 6,8)2,0 (-2,0 to 6,0)2,3 (-4,3 to 8,8)-0,3 (-4,6 to 4,0)Diploma
Education Level6-0,2 (-3,6 to 3,2)0,2 (-3,0 to 3,4)-1,0 (-4,9 to 2,9)-2,4 (-6,2 to 1,4)Marital status 51,7 (-0,9 to 4,4)1,7 (-0,8 to 4,2)1,7 (-1,4 to 4,8)0,3 (-3,0 to 3,6)Smoking4
0,6 (0,2 to 1,1)*0,5 (0,1 to 1,0)*0,8 (0,4 to 1,3)*-0,5 (-1,1 to 0,1)BMI3
-1,8 (-4,3 to 0,7)-1,7 (-4,1 to 0,7)-2,1 (-5,1 to 1,0)-1,8 (-5,4 to 1,8)Gender2
0,1 (-0,1 to 0,2)0,1 (-0,1 to 0,2)0 (-0,2 to 0,3)0 (-0,2 to 0,2)Age1
MAP Coef (95%Cl)DBP Coef (95%Cl)SBP Coef (95%Cl)HR Coef (95% Cl)Factors
* P < 0,05 ** P = 0.000 Reference category: age <33 yrs1, female2, BMI < 213, non smokers4, non married5
, primary school 6, pleasant7, night8, low control9, low demand10

53
2,4 (-2,1 to 6,7)1,9 (-2,3 to 6,1)3,3 (-1,7 to 8,3)-0,6 (-4,7 to 3,5)Imbalance11
-0,4 (-3,1 to 2,4)-0,3 (-2,9 to 2,4)-0,6 (-3,6 to 2,5)-1,9 (-5,0 to 1,2)Reward10
56,5(44,9 to 68,2)**45,7 (34,5 to 60,0)**78,3 (65,2 to 91,5)**76,1 (63,1 to 89,1)**Constant
-1,2 (-4,1 to 1,6)-1,1 (-3,7 to 1,6)-1,5 (-4,8 to1,8)-2,4 (-5,7 to 0,8)Overcommitment12
1,0 (-2,3 to 4,4)1,3 (-1,9 to 4,6)0,5 (-3,2 to 4,2)2,7 (-0,7 to 6,1)Effort9
ERI MODEL
14,8 (12,8 to 16,8)**15,6 (13,6 to 17,,6)**13,2 (10,9 to 15,5)**16,4 (14,4 to 18,4)**Work 14-20 h
14,4 (12,6 to 16,2)**14,8 (13,0 to 16,7)**13,6 (11,5 to 15,6)**12,0 (10,4 to 13,7)**Work 8-14 h
11,4 (10,1 to 12,7)**11,7 (10,4 to 13,0)**10,8 (9,4 to 12,1)**15,1 (13,9 to 16,4)**Rest
Activity8
2,0 (0,4 to 3,6)*1,9 (0,4 to 3,4)*2,2 (0,4 to 4,0)*-0,7 (-2,1 to 0,7)Workday7
2,2 (-4,9 to 9,3)2,5 (-4,1 to 9,1)1,7 (-6,9 to 10,2)-1,6 (-7,2 to 4,0)Univ. Degree
1,9 (-3,2 to 7,0)1,6 (-2,9 to 6,1)2,3 (-4,2 to 8,8)0,3 (-3,4 to 4,1)Diploma
Education Level6-1,0 (-4,4 to 2,4)-0,5 (-3,8 to 2,8)-2,0 (-5,8 to 1,9)-2,4 (-6,2 to 1,4)Marital status5
1,6 (-0,9 to 4,1)1,6 (-0,7 to 4,0)1,7 (-1,2 to 4,6)0,3 (-2,8 to 3,4)Smoking4
0,7 (0,3 to 1,2)*0,6 (0,2 to 1,0)*0,9 (0,4 to 1,4)*-0,5 (-1,1 to 0,1)BMI3
-2,1 (-4,8 to 0,5)-1,9 (-4,4 to 0,6)-2,5 (-5,6 to 0,7)-1,7 (-5,3 to 1,9)Gender2
0,1 (-0,1 to 0,2)0,1 (-0,1 to 0,2)0,1 (-0,1 to 0,3)0 (-0,1 to 0,2)Age1
MAP Coef (95%Cl)DBP Coef (95%Cl)SBP Coef (95%Cl)HR Coef (95% Cl)Factors
P < 0,05 ** P = 0.000 Reference category: age <33 yrs1, female2, BMI < 213, non smokers4, non married5
, primary school6, pleasant7, night8, low effort9, low reward10, low imbalance111, low overcommitment12

54
I nostri risultati suggeriscono che I fattori biologici e
situazionali sono I principali determinanti della pressiona
arteriosa ambulatoriale (Holter)
55
La varianza della pressione arteriosa non è significativamente associata
alle classi di rischio valutate in base ai modelli di Karasek e
Siegrist.

L’uso di marcatori fisiologici dello stress è
un’importante frontiera per lo sviluppo delle conoscenze su questo argomento e per cercare di dare oggettività
ad un argomento
così
controverso