LA RIVISTA ITALIANA SOSTANZE DELLE 1 GRASSE …extranet.innovhub-ssi.it/allstd/risg/2016-RISG...
76
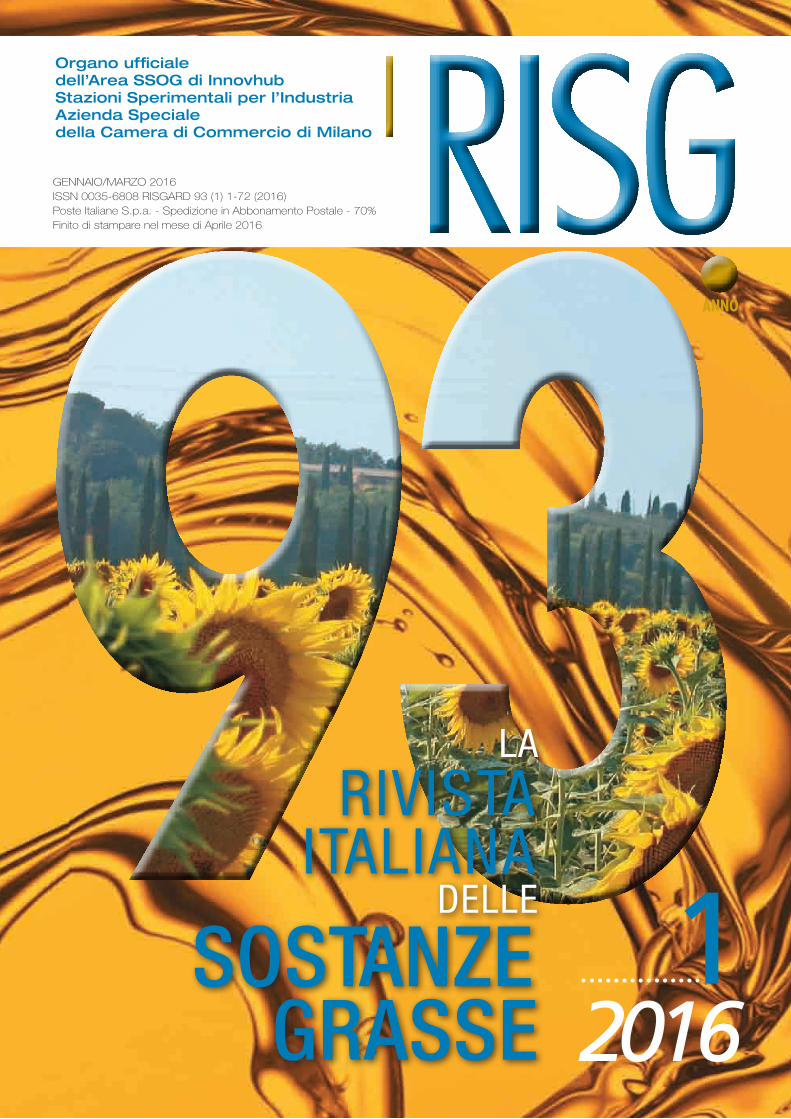
ANNO Organo ufficiale dell’Area SSOG di Innovhub Stazioni Sperimentali per l’Industria Azienda Speciale della Camera di Commercio di Milano 2016 LA RIVIS TA IT ALIANA DELL SOST A NZE GRASSE E GENNAIO/MARZO 2016 ISSN 0035-6808 RISGARD 93 (1) 1-72 (2016) Poste Italiane S.p.a. - Spedizione in Abbonamento Postale - 70% Finito di stampare nel mese di Aprile 2016 1
Transcript of LA RIVISTA ITALIANA SOSTANZE DELLE 1 GRASSE …extranet.innovhub-ssi.it/allstd/risg/2016-RISG...
ANNO
Organo ufficialedell’Area SSOG di InnovhubStazioni Sperimentali per l’IndustriaAzienda Specialedella Camera di Commercio di Milano
2016
RISG
LA
RIVISTAITALIANA
DELL
SOSTANZEGRASSE
E
GENNAIO/MARZO 2016ISSN 0035-6808 RISGARD 93 (1) 1-72 (2016)Poste Italiane S.p.a. - Spedizione in Abbonamento Postale - 70%Finito di stampare nel mese di Aprile 2016
1
________________________________
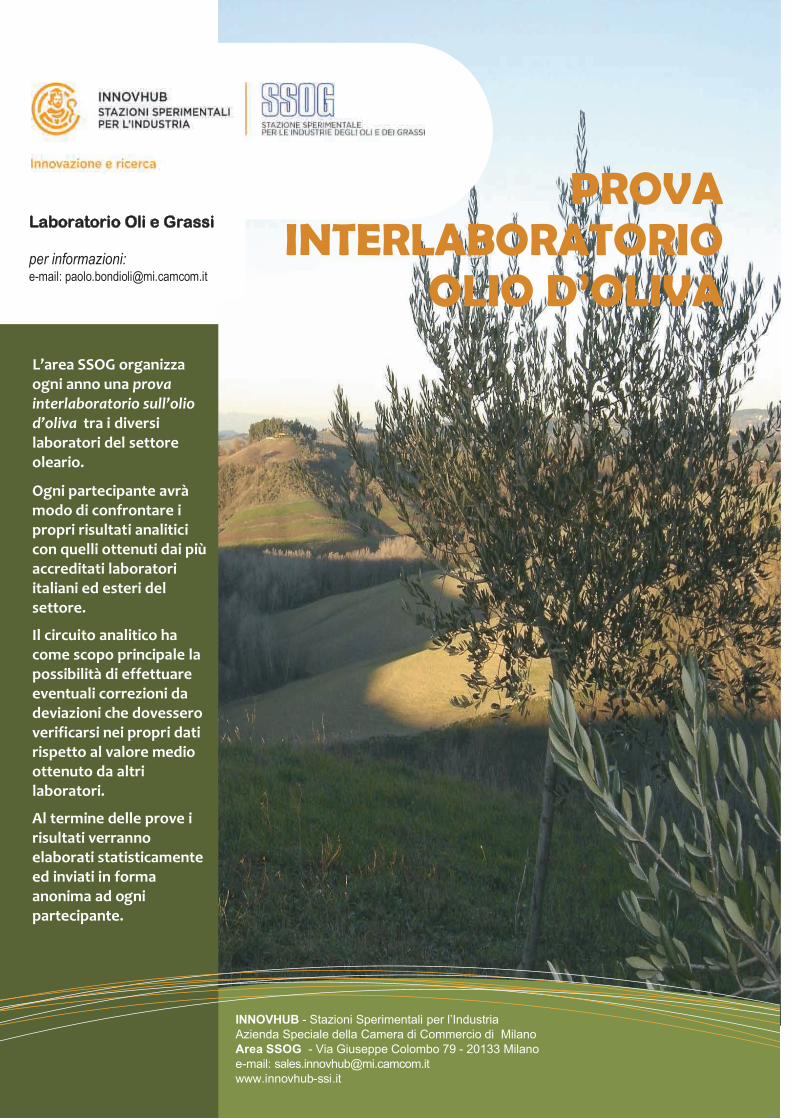
L’area SSOG organizza ogni una prova interlaboratorio sull’olio d’oliva tra i diversi laboratori del settore oleario.
anno
Ogni partecipante avrà modo di confrontare i propri risultati analitici con quelli ottenuti dai più accreditati laboratori italiani ed esteri del settore.
Il circuito analitico ha come scopo principale la possibilità di effettuare eventuali correzioni da deviazioni che dovessero verificarsi nei propri dati rispetto al valore medio ottenuto da altri laboratori.
Al termine delle prove i risultati verranno elaborati statisticamente ed inviati in forma anonima ad ogni partecipante.
INNOVHUB - Stazioni Sperimentali per l’Industria Azienda Speciale della Camera di Commercio di Milano Area SSOG - Via Giuseppe Colombo 79 - 20133 Milano e-mail: [email protected] www.innovhub-ssi.it
PROVA INTERLABORATORIO
OLIO D’OLIVA
Laboratorio Oli e Grassi
per informazioni: e-mail: [email protected]
Sito web: www.innovhub-ssi.it100,00 200,00
umero singolo 30,00
ORGANO UFFICIALE DELLA DIVISIONE SSOG DI INNOVHUB
STAZIONI SPERIMENTALI PER L’INDUSTRIA
AZIENDA SPECIALE DELLA CAMERA DI COMMERCIO DI MILANO
E–mail: [email protected] – Sito web: www.ssog.it
100,00 200,00umero singolo 30,00
SSOG_1_ok:Layout 1 22-02-2013 9:01 Pagina 1
direttore responsabile: M. Surdiredazione: F. paparella
GraFiCa, iMpaGinazione e staMpa
Grafiche parole Nuove srlVia Garibaldi 58 - Brugherio
1 d u e m i l a s e d i c iGENNAIO/MARZO 2016 - ANNO XCIII
abbonaMenti e [email protected]
Sommario
3 La scomparsa di Enzo FedeliP. Bondioli, L. Della Bella, G. Rivolta
5 Preparation of methyl 9,10dihydroxystearic acid using a solid catalyst
D. Kowalska,E. Gruczynska
11 Short note - The physico-chemical properties and oxidative stabilities of enzymatically interesterified lard and rapeseed oil blends containing 35 and 25% of lard
F. MansouriA. Benmoumen, G. RichardM.L. Fauconnier, M. SindicH. Serghini-CaidA. Elamrani
21 Characterization of monovarietal virgin olive oils from introduced cultivars in eastern Morocco
K.B. DaouedM. Chouaibi, N. GaoutO. Bel Haj, S. Hamdi
31 Chemical composition and antioxidant activities of cold pressed lentisc (Pistacia lentiscus L.) seed oil
W. HerchiK. Ben AmmarF. Sakouhi, H. KallelS. Boukhchina
39 Effect of harvest year on triglyceride composition and tocochromanols contents of flaxseed oil (Linum usitatissimum L.)
Ö. GültekinM.M. ÖzcanF. Al Juhaimi
47 Short note - Some physicochemical properties, fatty acid composition, and tocopherol contents of Citrus seed oils
M. Sala, F. Taormina,R. Maina, P. Ruggieri
53 Nota tecnica. Lubrificanti. Corrispondenze tra metodi analitici (gennaio-dicembre 2015)
Notiziario 65Indice annata 2015 69

Comitato di redazione
P. BONDIOLI settore tecnologie olearie e oleochimiche
L. FOLEGATTI settore sostanze grasse e proteine vegetali
S. TAGLIABUE settore cosmetica
G. GASPERINI settore prodotti vernicianti
P. ROVELLINI settore qualità/genuinità (micronutrienti e sicurezza
alimentare)
D. MARIANI settore detersivi e tensioattivi
M. SALA settore lubrificanti
Comitato di Referee
R. APARICIO Istituto de la Grasa y sus Derivados – Siviglia (E)
G. CONTARINI Istituto Lattiero Caseario - Lodi
L. CONTE Dipartimento di Scienza degli Alimenti – Università di Udine
G. DONATI Istituto Superiore Sanità – Roma
A. FABERI Ministero delle Politiche Agricole Alimentari e Forestali – Roma
C. GIGLIOTTI Dipartimento di Scienze Biomediche e Biotecnologiche –
Università di Brescia
F. LACOSTE Institut des Corps Gras – ITERG – Pessac (F)
G. LERCKER Dipartimento di Scienze Alimentari – Università di Bologna
L. MANNINA Facoltà di Agraria – Università degli Studi di Campobasso
M.C. SARAI AGUSTIN SALAZAR - Departamento de Investigaciones
Cientificas y Tecnologicas - Universidad de Sonora - Mexico
R. SACCHI Dipartimento Scienze Alimentari – Università Federico II – Portici
(NA)
C. SCESA Corso di Laurea in Tecniche Erboristiche – Facoltà di Farmacia –
Università di Urbino
M. SERVILI Dipartimento di Scienze Economico-Estimative e degli Alimenti –
Università di Perugia
L. SISTI Henkel – Divisione Tensioattivi – Lomazzo (CO)
Ö. TOKUŞOĞLU Celal Bayar University - Engineering Faculty – Manisa Turkey
G. LITWINIENKO University of Warsaw - Faculty of Chemistry - Poland
Indexed and Abstracted in:• Thomson Scientific Service: Science Citation Index Expanded
(SciSearch), Journal Citation/Science Edition, Current Contents/Clinical Medicine
• Chemical Abstracts• Elsevier Bibliographic Databases: SCOPUS• FSTA – Food Science and Technology Abstract (IFIS Publishing – UK)
IMPACT FACTOR 2015: 0,417
La RIVISTA ITALIANA DELLE SOSTANZE GRASSEè l’organo ufficiale della Divisione SSOG di Innovhub
- Stazioni Sperimentali per l’Industria - Azienda Speciale della Camera di Commercio di Milano. Ha
periodicità trimestrale e la scientificità dei contenuti è garantita da un Comitato Internazionale di Referee.
Pubblica lavori originali e sperimentali di autori italiani ed esteri riguardanti la chimica, la biochimica, l’analisi e la tecnologia nei settori: sostanze grasse e
loro derivati, tensioattivi, detersivi, cosmetici, oli minerali.
Pubblica un Notiziario con informazioni su congressi, notizie in breve e libri.
La Rivista viene distribuita e consultata in Italia dalle industrie produttrici ed esportatrici di oli e grassi
alimentari ed industriali, dalle industrie chimiche, da laboratori di enti statali, da istituti di ricerca e facoltà
universitarie, da dove provengono diversi lavori scientifici.
È inoltre distribuita all’estero in vari Paesi come Spagna, Principato di Monaco, Canada, Paesi
Bassi, Svizzera, Slovenia, Regno Unito, Turchia, Lussemburgo, Malaysia, Grecia, Francia, Germania, Tunisia, Nigeria, Congo, Polonia, Romania, Bulgaria,
Russia, Stati Uniti, Brasile, Cina, Giappone.

La rivista itaLiana deLLe sostanze grasse - voL. XCiii - gennaio/Marzo 2016
3
la scomparsa di enzo Fedeli
Il giorno 25 Gennaio 2016 si è spento tra le sue montagne il Prof. Enzo Fedeli, da tutti conosciuto come uno dei più importanti ricercatori e co-noscitori delle sostanze grasse. Dopo la Laurea in Chimica Industriale, conseguita presso l’Università di Milano intraprese per un breve periodo la carriera universitaria, per passare poi al laboratorio ricerche di una im-portante azienda farmaceutica. Molto presto tuttavia la passione per la ricerca scientifica lo indirizzò verso il Centro Nazionale per la Lipochimica del CNR, che era stato fondato con i finanziamenti del piano Marshall ed era dislocato presso i laboratori dell’allora Stazione Sperimentale per le Industrie degli Oli e Grassi, diretta dal Prof. Giovanni Jacini. In questa struttura ebbe inizio il lavoro del Prof. Fedeli sulle sostanze grasse e in poco tempo divenne Direttore del Centro stesso. Nel 1978, con il ritiro del Prof. Jacini, il Prof. Fedeli divenne Direttore della Stazione Sperimentale, incarico che mantenne fino al 1995. In seguito ricoprì per alcuni anni l’in-carico di Direttore dell’Istituto Sperimentale di San Michele all’Adige e di Presidente del Consiglio di Amministrazione della Stazione Sperimentale Oli e Grassi. Negli ultimi anni si era ritirato in Svizzera, a coltivare la sua passione per le montagne e per la pittura. Autore di più di 400 pubblica-zioni scientifiche, insignito nel 1983 della Medaglia Chevreul, per molti anni nel comitato scientifico del Consiglio Oleicolo Internazionale, ha in-segnato all’Università di Milano ed è stato Visiting Professor in numerose Università del Brasile e degli Stati Uniti. Il Prof. Fedeli lascia una traccia indelebile nella storia della chimica e tec-nologia delle sostanze grasse.
Il Professor Enzo Fedeli, ha rappresentato la mia guida alla SSOG fin da quando sono entrata in borsa di studio dopo l’esame di maturità. Ho avu-to l’onore e il piacere di poter lavorare e collaborare direttamente con la sua persona di grande valore scientifico internazionale, carismatica e nello stesso tempo moderna, sensibile ed umana. Quando veniva in laboratorio a lavorare insieme al nostro gruppo mi metteva timore, in particolare se poi mi lasciava qualche reazione da controllare o da portare a termine, ma nello stesso tempo riusciva a trasmettermi il suo entusiasmo per quello che è la ricerca e i suoi misteri.Nonostante le diverse occasioni di lavoro e i concorsi vinti all’esterno, de-cisi di rimanere a lavorare alla SSOG, in quanto laboratorio di ricerca, e la soddisfazione professionale che provavo era molto elevata.Ricordo la sua insistenza alla partecipazione ai Congressi Nazionali e Inter-nazionali e la formazione, in particolare in spettrometria di massa: mi per-mise di fare esperienza nei laboratori di ricerca all’ospedale San Raffaele di Milano e di partecipare ai corsi di ossidazione lipidica nei paesi nordici diverse volte. Mi propose di andare per un periodo a lavorare in USA, nelle
La rivista itaLiana deLLe sostanze grasse - voL. XCiii - gennaio/Marzo 2016
4
Università in cui lui aveva lavorato prima, a fianco del Prof. Frankel, emerito nel campo dello stato ossidativo lipidico e anche suo carissimo amico, ma la mia ancora non piena formazione mi vide restia. Mi pento ancora oggi di questa mancata opportunità.Fu uno dei primi ad acquistare uno spettrometro di massa collegato all’HPLC con il quale si sviluppò la mia passione per questa tecnica.Fu il correlatore della mia tesi di laurea che mi suggerì di presentare su-bito ad un congresso CID a Roma. Il giorno della mia tesi era presente accanto alla mia famiglia e ricordo che al mio grazie finale, in quanto la tesi aveva avuto una valutazione addirittura superiore al massimo dei punteggi consentiti, rispose che dovevo ringraziare solo me stessa. Questa frase raccoglie quello che lui era ed è per me indimenticabile. Le pubblica-zioni scientifiche eseguite con lui, prima e dopo la mia laurea, e i progetti di ricerca sviluppati insieme erano e restano per me motivo di orgoglio sempre.La sua presenza rimane sentita nei nostri laboratori, nonostante la sua scomparsa, perché alto è il valore di quello che ha saputo trasferire.
Pierangela Rovellini
Ho conosciuto il Prof. Fedeli nel 1979 da studente, frequentando il suo corso di Tecnologia degli Oli e Grassi e Derivati presso la Facoltà di Agraria dell’Università degli Studi di Milano. Ricordo ancora il momento dell’esa-me, sostenuto nel suo ufficio di Direttore della Stazione Sperimentale e la sua presenza carismatica, un misto di autorevolezza e physique du rôle. Mi diede 30 e lode e forse fu anche per questo che alcuni anni dopo iniziai la mia carriera presso il suo Istituto, carriera che continua ancor oggi. La dif-ferenza di età e di posizione gerarchica non mi ha mai consentito rapporti meno che formali con il Prof. Fedeli, tuttavia ricordo con grande piacere e riconoscenza le opportunità di crescita che mi sono state offerte, qua-li la partecipazione a Congressi Internazionali, Missioni nella Repubblica Popolare Cinese aggregato al Ministero degli Affari Esteri, esperienze in Europa sulle tecniche di separazione al tempo innovative. Forse l’unico momento di confidenza che abbiamo avuto si è verificato il giorno suc-cessivo a quello in cui vinsi il concorso per Sperimentatore delle Stazioni Sperimentali Industria. Lo incontrai nel corridoio e sorridendo mi disse in dialetto: “Cuntent ?”. Mi piace pensare che in quel sorriso e in quella pa-rola ci fosse un poco di compiacimento e di soddisfazione.Ricordo anche il mio terrore nel 1991 quando mi ordinò di prendere parte al primo progetto di ricerca Europeo a livello dimostrativo sul biodiesel. Quel giorno ero molto contrariato, dovendo rinunciare alla mia attività di sempre, orientata verso le tecnologie alimentari. A distanza di venticinque anni lo devo al contrario ringraziare per l’opportunità che mi è stata offer-ta di addentrarmi nei problemi dell’oleochimica, con risultati che penso possano averlo soddisfatto. Rivolgo un ultimo pensiero al suo spirito di squadra e alla difesa dell’istituzione che rappresentava. Nel corso della normale attività era possibile commettere errori: in questo caso il Prof. Fedeli era sempre pronto ad assumere la responsabilità dell’accaduto nei confronti dell’esterno, salvo poi ricorrere a grandi lavate di capo in camera caritatis. Questo esempio ha sempre rappresentato per me un riferimento importante e penso sia uno degli elementi che distinguono la figura di un vero leader da quella di un capo.
Paolo Bondioli

La rivista itaLiana deLLe sostanze grasse - voL. XCiii - gennaio/Marzo 2016
5
preparation of methyl 9, 10 dihydroxystearic acid using a solid
catalyst
P. Bondioli*L. Della Bella
G. Rivolta
INNOVHUB - SSIAzienda Speciale della
Camera di Commercio di MilanoArea SSOG - Milano
(*) CORRESPONDING AUTHOR:Dr. Paolo Bondioli
Innovhub – SSIVia Giuseppe Colombo 79
20133 Milano ItalyTel. +39 02 7064 9765Fax. + 39 02 2363 953
E-mail [email protected]
Dihydroxystearic acid (DHSA) is becoming a very interesting chemical for the preparation of a number of different derivatives, such as polymers, ester lubricants and azelaic/pelargonic acids from renewable feedstocks. The classic preparation technology is represented by a one or two-step reaction carried out with hydrogen peroxyde via a peroxyacid such as performic or peracetic acid and catalyzed by a strong mineral acid. The reaction was carried out using methyl oleate as a starting material in order to avoid the formation of estolides. From oleic acid methylester an oxirane derivative on double bond is prepared and finally hydrolized to produce MeDHSA. This reaction is classically carried out using an homogenuous catalyst. During the preparation of epoxymethyl oleate catalyzed by an ion exchange resin using the in situ process via H
2O
2/peracetic acid it is possible, by using a catalyst with the same
properties but different cross-linking characteristics, to drive the reaction towards a solid product that was identified as MeDHSA. The reason for this unusual behaviour stands in a different cross linkage of the ion exchange resin used. When using a resin with a low cross-linking level, the active internal acidic moieties are available for small molecules as acetic/peracetic acid as well as bigger molecules such as epoxyoleate. In this way, the hydrolisis for oxyrane moiety to MeDHSA takes place. In this paper, the main reaction conditions along with some kinetic experiments are reported and discussed.Keywords: dihydroxystearic acid, biolubricant, green chemistry, oleochemistry.
Preparazione del metil 9, 10 acido diidrossistearico usando un catalizzatore solidoL’acido 9, 10 diidrossistearico (DHSA) è una molecola molto interessante per la preparazione di una grande varietà di derivati, quali polimeri, esteri destinati alla lubrificazione e come molecola di partenza per la preparazione degli acidi azelaico e pelargonico.La classica tecnologia di preparazione consiste in uno o più step di reazione realizzate con acqua ossigenata, utilizzando un perossiacido quale ad esempio l’acido performico o l’acido peracetico catalizzata da un acido minerale forte. Dall’estere metilico dell’acido oleico è possibile preparare un derivato ossianico sul doppio legame e quindi procedere all’idrolisi per ottenere MeDHSA. La reazione è normalmente realizzata utilizzando un catalizzatore omogeneo. Per la reazione di preparazione dell’epossimetile oleato è anche possibile utilizzare come catalizzatore una resina a scambio ionico acida, utilizzando il cosiddetto processo in situ con H
2O
2/acido peracetico. In questo caso è possibile, utilizzando la stessa
resina scambiatrice di ioni ma con differenti caratteristiche di reticolazione, indirizzare la reazione per la produzione di MeDHSA. La ragione di questo comportamento del catalizzatore risiede nel diverso livello di cross linking dei due diversi tipi di resina. Utilizzando una resina con basso grado di cross linking i siti attivi acidi interni alla struttura sono accessibili alle piccole molecole (acido acetico/acido peracetico) così come a quelle di dimensioni maggiori come il metile epossioleato. In questo modo l’idrolisi del gruppo ossianico con produzione di DHSA può avere luogo. In questo articolo sono descritte e discusse le principali condizioni di reazione, unitamente ad alcuni esperimenti di cinetica di reazione.Parole chiave: acido diidrossistearico, biolubrificanti, chimica verde, oleochimica.

La rivista itaLiana deLLe sostanze grasse - voL. XCiii - gennaio/Marzo 2016
6
INTRODUCTION
The request for oleochemical specialties is in great growth thanks to the development of the so-called “green chemistry”. During the last years, a number of different products and applications for biofuels, biolubricants, biosolvents, biopolymers, etc. entered the market. As an example, in biolubricant market we may say that we are now assisting to the third gen-eration of products, the first being represented by na-tive oils, the second by hindered esters, and the third by molecules having no unsaturated systems.This last family is composed of estolides [1-3] and complex esters [4] allowed to overcome the classical gap of natural oils and fats caused by the presence of double bonds in the molecule, which represents a point of weakness in terms of oxidation stability. The third generation of products, having iodine value close to zero, demonstrated also a good properties at cold temperatures, thanks to the number of branched chains in its composition. This trend in preparations requires, for the future, the availability of building blocks containing two or more functional groups, such as diols, dicarboxylic acids, hydroxyacids, etc. The most important representative of this last group is ricinoleic acid (12-hydroxy octadecenoic acid) that can be found in castor oil in high concentration (> 85%). Thanks to the presence of a double bond on carbon atoms 9 and 10 and of an –OH group on car-bon atom 12 it is a versatile feedstock for chemical transformation including dehydration, water addition at double bond, hydrogenation, esterificaton, oxida-tion leading lower MW molecules, etc.Another very interesting chemical is 9,10 hydrox-ystearic acid (DHSA), which has one acidic and two alcoholic groups in his molecule. Contrarily to ricino-leic acid, DHSA is not recovered in huge amounts in natural oils, but it can be prepared from them us-ing oleic acid as a raw material. The US Patent No. 7,560,578 [5] contains the description of the prepa-ration of DHSA from a palm oil-based oleic acid, by means of an oxidation reaction carried out using 30% hydrogen peroxyde as an oxidative agent and formic acid as the carrier for oxidation equivalents. The reaction is catalyzed by sulphuric acid. This reac-tion has several similitudes with the reaction for the epoxidation of olefinic systems. In fact, the produc-tion of diols is a side reaction of epoxydation and in this case it is oriented toward the production of di-ols. Other interesting possibility for DHSA preparation starts from epoxidized Oleic Acid and is described by Noorfazlida et al. [6]. In this case the opening of oxy-rane ring by hydrolisis takes place in mild conditions (55°C) in presence of water. Alumina is used as a heterogeneous catalyst. Seo et al. [7] reported about the preparation of 10,12 DHSA from ricinoleic acid, using an enzyme (oleate hydratase) obtained from Lysinibacillus fusiformis. Among the multiple uses of DHSA we can list the gold-catalyzed preparation
of azelaic and pelargonic acids described by Kulik et al. [8,9], the synthesis of esters for biolubricant pro-duction recently published by Salih et al. [10]. About the properties and the potential uses of DHSA and its derivatives the review of Koay et al. [11] represents a milestone in this field.The experience we are here going to report comes from an observation we did during a usual prepara-tion of epoxydized methyl oleate. The reaction was carried out with 30% hydrogen peroxide, acetic acid as carrier for oxidation and a sulphonic ion exchange resin as a catalyst. This reaction is well known and widely described in literature [12-14] and in few hours it allows reaching the quantitative conversion of oleate to epoxyoleate. The course of the reaction can be easily monitored by means of oxirane oxygen deter-mination, according to the classic AOCS method [15] and the final product is liquid at ambient temperature. During this preparation something unusual appeared: the oxirane value did not raise as expected and the intermediate and final reaction mixture was solid. A case analysis allowed to understand that instead of the usual Dowex® 50WX8 resin we used the similar Dowex® 50WX2 one. Both resins were wet and in hy-drogen form, particle size was 50-100 mesh in both cases, but the catalytic behaviour was dramatically different. The structural difference between the two resins stands in the amount of divinylbenzene used for the polystirene resin preparation. Divinylbenzene is used as a cross linking agent to create a tridimen-sional structure within the spheres of the resins. The amount of divinylbenzene in the preparation affects the number and the dimension of pores as well as the accessibility of active sites of the catalyst. In a recent past Rios et al. published a similar experience [16]. Starting from this observation and from these previ-ous results we did a study to better understand this reaction with the final aim of orienting it toward the production of DHSA in good yield using methyloleate as a raw material. Tests were carried out using Methyl Oleate and not Oleic Acid, in order to avoid the for-mation of estolides.
MATERIALS AND METHODS
MATERIALSMethyl Oleate was prepared by alkaline transesteri-fication with methanol from refined High Oleic Sun-flower Oil (HOSO). Dowex® 50WX2 ion exchange resin was obtained from Acros Organics (Geel, BE), code no. 203025000. Hydrogen Peroxide 30% H2O2 was obtained from Sigma Aldrich (Steinheim, DE), code no. 31642. All other chemicals were analytical grade.
WORKING METHODSAll reactions were carried out in a 250 ml glass re-actor, equipped with three necks and condenser, thermometer, and sampling neck. A typical reaction
La rivista itaLiana deLLe sostanze grasse - voL. XCiii - gennaio/Marzo 2016
7
mixture was constituted of 100 g of technical meth-yloleate from HOSO (Oleic Acid methylester 82.6%, IV 83.5, maximum Oxirane Oxigen achievable 5.28), corresponding to 0.33 moles of C=C structure, 57.5 g of 30% hydrogen peroxyde solution, correspond-ing to 0.54 moles of H2O2, 16 g of acetic acid, glacial (0.27 moles) and 3 g of dried resin Dowex® 50WX2, corresponding to 15 g of wet product. The reaction mixture was heated up to the working temperature and maintained in these conditions; under vigorous stirring until the reaction end. Samples were periodi-cally taken for analysis.
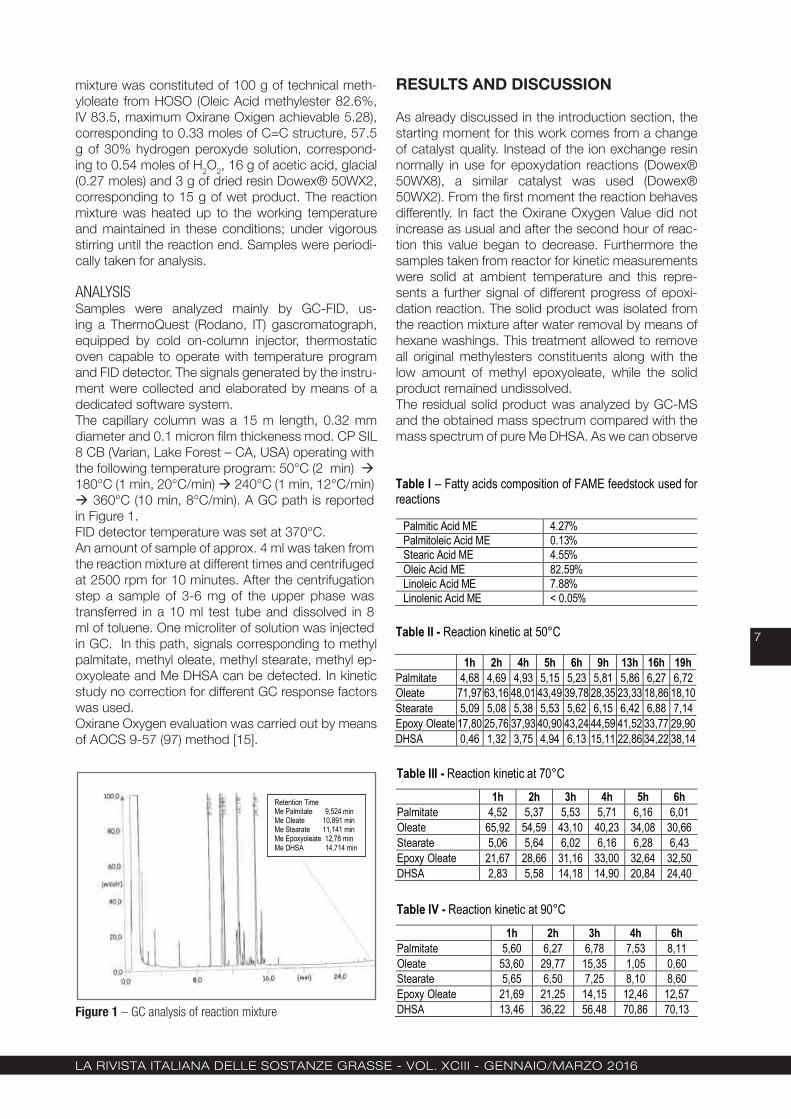
ANALYSISSamples were analyzed mainly by GC-FID, us-ing a ThermoQuest (Rodano, IT) gascromatograph, equipped by cold on-column injector, thermostatic oven capable to operate with temperature program and FID detector. The signals generated by the instru-ment were collected and elaborated by means of a dedicated software system.The capillary column was a 15 m length, 0.32 mm diameter and 0.1 micron film thickeness mod. CP SIL 8 CB (Varian, Lake Forest – CA, USA) operating with the following temperature program: 50°C (2 min) 180°C (1 min, 20°C/min) 240°C (1 min, 12°C/min) 360°C (10 min, 8°C/min). A GC path is reported in Figure 1.FID detector temperature was set at 370°C.An amount of sample of approx. 4 ml was taken from the reaction mixture at different times and centrifuged at 2500 rpm for 10 minutes. After the centrifugation step a sample of 3-6 mg of the upper phase was transferred in a 10 ml test tube and dissolved in 8 ml of toluene. One microliter of solution was injected in GC. In this path, signals corresponding to methyl palmitate, methyl oleate, methyl stearate, methyl ep-oxyoleate and Me DHSA can be detected. In kinetic study no correction for different GC response factors was used.Oxirane Oxygen evaluation was carried out by means of AOCS 9-57 (97) method [15].
RESULTS AND DISCUSSION
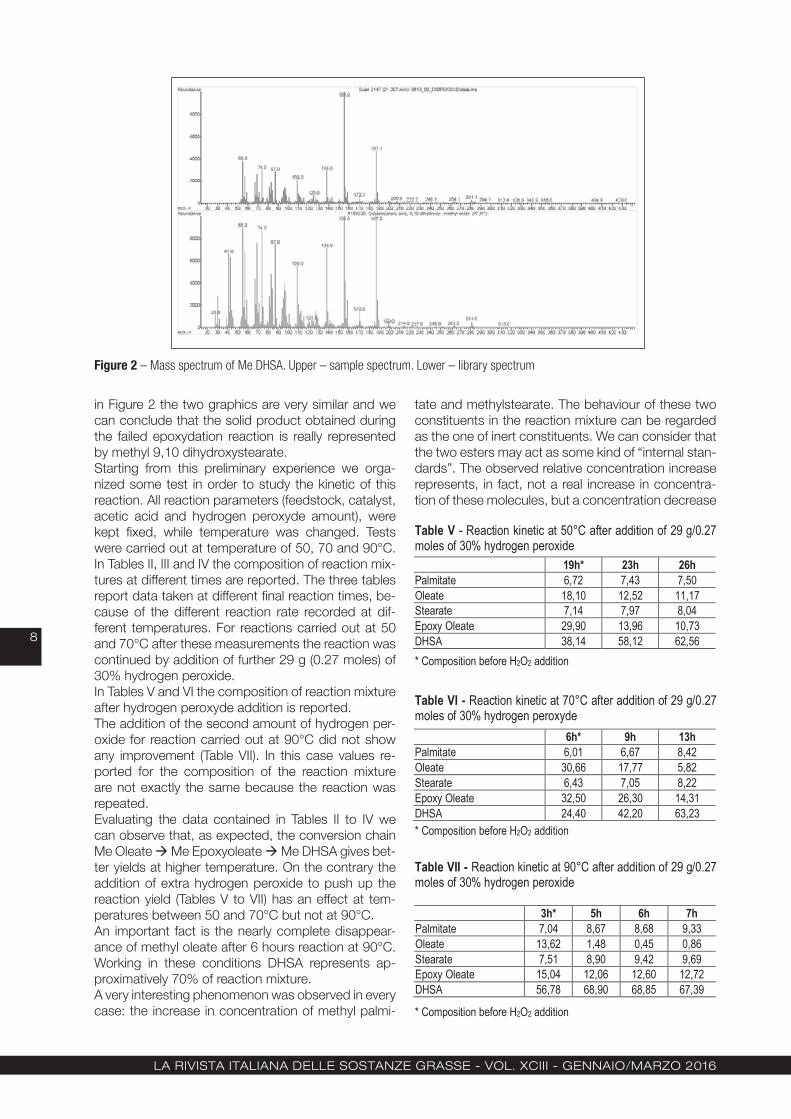
As already discussed in the introduction section, the starting moment for this work comes from a change of catalyst quality. Instead of the ion exchange resin normally in use for epoxydation reactions (Dowex® 50WX8), a similar catalyst was used (Dowex® 50WX2). From the first moment the reaction behaves differently. In fact the Oxirane Oxygen Value did not increase as usual and after the second hour of reac-tion this value began to decrease. Furthermore the samples taken from reactor for kinetic measurements were solid at ambient temperature and this repre-sents a further signal of different progress of epoxi-dation reaction. The solid product was isolated from the reaction mixture after water removal by means of hexane washings. This treatment allowed to remove all original methylesters constituents along with the low amount of methyl epoxyoleate, while the solid product remained undissolved.The residual solid product was analyzed by GC-MS and the obtained mass spectrum compared with the mass spectrum of pure Me DHSA. As we can observe
Figure 1 – GC analysis of reaction mixture
Retention Time Me Palmitate 9,524 min Me Oleate 10,891 min Me Stearate 11,141 min Me Epoxyoleate 12,78 min Me DHSA 14,714 min
Figure 1 – GC analysis of reaction mixture
Table I – Fatty acids composition of FAME feedstock used for reactions
Table II - Reaction kinetic at 50°C
Table III - Reaction kinetic at 70°C
1h 2h 3h 4h 5h 6h Palmitate 4,52 5,37 5,53 5,71 6,16 6,01 Oleate 65,92 54,59 43,10 40,23 34,08 30,66 Stearate 5,06 5,64 6,02 6,16 6,28 6,43 Epoxy Oleate 21,67 28,66 31,16 33,00 32,64 32,50 DHSA 2,83 5,58 14,18 14,90 20,84 24,40
Table IV - Reaction kinetic at 90°C
1h 2h 3h 4h 6h Palmitate 5,60 6,27 6,78 7,53 8,11 Oleate 53,60 29,77 15,35 1,05 0,60 Stearate 5,65 6,50 7,25 8,10 8,60 Epoxy Oleate 21,69 21,25 14,15 12,46 12,57 DHSA 13,46 36,22 56,48 70,86 70,13
Palmitic Acid ME 4.27% Palmitoleic Acid ME 0.13% Stearic Acid ME 4.55% Oleic Acid ME 82.59% Linoleic Acid ME 7.88% Linolenic Acid ME < 0.05%
1h 2h 4h 5h 6h 9h 13h 16h 19h Palmitate 4,68 4,69 4,93 5,15 5,23 5,81 5,86 6,27 6,72 Oleate 71,97 63,16 48,01 43,49 39,78 28,35 23,33 18,86 18,10 Stearate 5,09 5,08 5,38 5,53 5,62 6,15 6,42 6,88 7,14 Epoxy Oleate 17,80 25,76 37,93 40,90 43,24 44,59 41,52 33,77 29,90 DHSA 0,46 1,32 3,75 4,94 6,13 15,11 22,86 34,22 38,14
La rivista itaLiana deLLe sostanze grasse - voL. XCiii - gennaio/Marzo 2016
8
in Figure 2 the two graphics are very similar and we can conclude that the solid product obtained during the failed epoxydation reaction is really represented by methyl 9,10 dihydroxystearate.Starting from this preliminary experience we orga-nized some test in order to study the kinetic of this reaction. All reaction parameters (feedstock, catalyst, acetic acid and hydrogen peroxyde amount), were kept fixed, while temperature was changed. Tests were carried out at temperature of 50, 70 and 90°C. In Tables II, III and IV the composition of reaction mix-tures at different times are reported. The three tables report data taken at different final reaction times, be-cause of the different reaction rate recorded at dif-ferent temperatures. For reactions carried out at 50 and 70°C after these measurements the reaction was continued by addition of further 29 g (0.27 moles) of 30% hydrogen peroxide. In Tables V and VI the composition of reaction mixture after hydrogen peroxyde addition is reported.The addition of the second amount of hydrogen per-oxide for reaction carried out at 90°C did not show any improvement (Table VII). In this case values re-ported for the composition of the reaction mixture are not exactly the same because the reaction was repeated. Evaluating the data contained in Tables II to IV we can observe that, as expected, the conversion chain Me Oleate Me Epoxyoleate Me DHSA gives bet-ter yields at higher temperature. On the contrary the addition of extra hydrogen peroxide to push up the reaction yield (Tables V to VII) has an effect at tem-peratures between 50 and 70°C but not at 90°C.An important fact is the nearly complete disappear-ance of methyl oleate after 6 hours reaction at 90°C. Working in these conditions DHSA represents ap-proximatively 70% of reaction mixture.A very interesting phenomenon was observed in every case: the increase in concentration of methyl palmi-
tate and methylstearate. The behaviour of these two constituents in the reaction mixture can be regarded as the one of inert constituents. We can consider that the two esters may act as some kind of “internal stan-dards”. The observed relative concentration increase represents, in fact, not a real increase in concentra-tion of these molecules, but a concentration decrease
Figure 2 – Mass spectrum of Me DHSA. Upper – sample spectrum. Lower – library spectrum Figure 2 – Mass spectrum of Me DHSA. Upper – sample spectrum. Lower – library spectrum
Table V - Reaction kinetic at 50°C after addition of 29 g/0.27 moles of 30% hydrogen peroxide
* Composition before H2O2 addition
Table VI - Reaction kinetic at 70°C after addition of 29 g/0.27 moles of 30% hydrogen peroxyde
* Composition before H2O2 addition
Table VII - Reaction kinetic at 90°C after addition of 29 g/0.27 moles of 30% hydrogen peroxide 3h* 5h 6h 7h Palmitate 7,04 8,67 8,68 9,33 Oleate 13,62 1,48 0,45 0,86 Stearate 7,51 8,90 9,42 9,69 Epoxy Oleate 15,04 12,06 12,60 12,72 DHSA 56,78 68,90 68,85 67,39
* Composition before H2O2 addition
19h* 23h 26h Palmitate 6,72 7,43 7,50 Oleate 18,10 12,52 11,17 Stearate 7,14 7,97 8,04 Epoxy Oleate 29,90 13,96 10,73 DHSA 38,14 58,12 62,56
6h* 9h 13h Palmitate 6,01 6,67 8,42 Oleate 30,66 17,77 5,82 Stearate 6,43 7,05 8,22 Epoxy Oleate 32,50 26,30 14,31 DHSA 24,40 42,20 63,23
La rivista itaLiana deLLe sostanze grasse - voL. XCiii - gennaio/Marzo 2016
9
of other constituents (Me Oleate, Me Epoxyoleate, Me DHSA). From these data we can speculate that the concentration decrease comes from the degra-dation of one or two of these reactive molecules. To clarify this aspect, the GC analysis was repeated with a longer (30 metres) and thicker (film thickness 0.25 micron) capillary column coupled to a mass detec-tor. Working in this mode allowed us to detect some extra molecules having lower MW and representing degradation products of both Me Epoxyoleate and Me DHSA, namely Nonanale, Nonanoic acid 9-oxo-methyl ester, Octadecanoic acid 10 oxo methyl es-ter.This study allows considering that the reaction chain is more complicate than we would expect and after the formation of Me DHSA it proceeds toward the for-mation of low molecular weight intermediates. Look-ing at the best yields in Me DHSA obtained at differ-ent temperatures with or without second addition of hydrogen peroxyde, we can estimate the degradation reaction as reported in Table VIII.Using the reported data we can observe that, even in the best conditions a little less than 50% of starting material is lost by degradation effect (Me Palmitate tfinal/ Me Palmitate t=0).
CONCLUSIONS
This experience at the moment does not allow practi-cal uses but it represents a contribution to the knowl-edge of the complex system existing when oxidation of double bond is carried out by means of hydrogen peroxide. Some key points can be underlined:
the nature of the solid acidic catalyst has a dra- -matic impact on the final result of oxydation re-action. Using, as in this case, an ion exchange resin with a low degree of cross linkage results in a different final product. We can suppose that the huge dimension of the pores allows the contact not only for acetic acid and hydrogen peroxyde, for the in situ generation of peroxyacetic acid but also for Me epoxyoleate and water leading to the production of Me DHSA. On the contrary using the right resin with a higher crosslinkage degree the degradation of Me epoxyoleate to Me DHSA does not take place because of the difficulty to access the active sites of the catalyst;
thanks to this different behaviour a new possibility -for the preparation of Me DHSA from Me Oleate was found. The reaction needs to be optimized and this paper only represents a preliminary study. The possibility to use a solid catalyst for the prep-aration of Me DHSA looks very interesting;for the time being the reaction studied does not -provide quantitative yields, in some experimental conditions it is possible to make nearly zero the Me Oleate content, while some Me Epoxyoleate still remains in the reaction mixture. Further study will be necessary to find the best reaction condi-tions;finally, other interesting observations come from -the possibility to produce low molecular weight products such as nonanale and nonanoic acid 9-oxo-methyl ester mainly, representing a step before the production of pelargonic (nonanoic) and azelaic acid. In every case Me DHSA repre-sents an intermediate for the preparation of these products, according to the papers published by Kulik et al. [8, 9] where pure oxygen in presence of a gold catalyst was used.
REFERENCES
[1] S.C. Cermak, T.A. Isbell, Synthesis and physical properties of monoestolides with varying chain lenghts. Industrial Crops and Products 29, 205-213 (2009).
[2] S.C. Cermak, T.A. Isbell, Physical properties of saturated estolides and their 2-ethylhexyl es-ters. Industrial Crops and Products 16, 119-127 (2002).
[3] L.A. Garcia-Zapatero, J.M. Franco, C. Valencia, M.A. Delgado, C. Gallegos, M.V. Ruiz-Mendez, Chemical, thermal and viscous characterization of high-oleic sunflower and olive pomace acid oils and derived estolides. Grasas y Aceites 64, 497-508 (2013).
[4] P. Bondioli, L. Della Bella, A. Manglaviti, Synthe-sis of biolubricants with high viscosity and high oxidation stability. OCL – Oleagineux, Corps Gras et Lipides 10, 150-154 (2003)
[5] S. Ahmad, S. Hoong, N. Sattar, Y.A. Yusof, H.A. Hassan, R. Awang, Palm based hydroxy fatty acid. United States Patent no. US 7,560,578 B2, 14 Jul. 2009
[6] M. Noorfazlida, M.J Jalid, S.K. Jamaludin, A.R.M. Daud, Formation of dihydroxystearic acid from hydrolisis of palm kernel oil based epoxidized oleic acid. Journal of Applied Sci-ence and Agriculture, 9, 86-92, [2014]
[7] M.H. Seo, K.R. Kim, D.K. Oh, Production of a novel compound, 10,12 dihydroxystearic acid from ricinoleic acid by an oleate hydratase from Lysinibacillus fusiformis. Applied Microbiology and Biotechnology 97, 8987-8995, (2013)
Table VIII - Summary of different reaction conditions, impact on the degradation of the final product
(*) from Table I
50°C 70°C 90°C Max concentration of Me DHSA, % 62.56 63.23 70.13 Reaction time, hours 26 13 6 H2O2 extra addition Y Y N Me Palmitate t=0 (*), % 4.27 4.27 4.27 Me Palmitate tfinal, % 7.50 8.42 8.11 Me Palmitate tfinal/ Me Palmitate t=0 1.76 1,97 1.90
La rivista itaLiana deLLe sostanze grasse - voL. XCiii - gennaio/Marzo 2016
10
[8] A. Kulik, A. Janz, M.M. Pohl, A. Martin, A. Kock-ritz, Gold catalyzed synthesis of dicarboxylic and monocarboxylic acids. Eur. J. Lipid S ci. Technol. 114, 1327-1332 (2012)
[9] A. Kulik, A. Martin, M.M. Pohl, C. Fischer, A. Kockritz, Insights into gold-catalyzed synthesis of azelaic acid. Green Chemistry 16, 1799-1806 (2014)
[10] N. Salih, J. Salimon, E. Yousif, Synthesis of oleic acid based esters as potential basestock for bi-olubricant production. Turkish J. Eng. Env. Sci. 35, 115-123, (2011)
[11] G.F.L. Koay, T.G. Chuah, S. Zainal-Abidin, S. Ahmad, T.S.Y. Choong, Development, charac-terization and commercial application of palm based dihydroxystearic acid and its derivatives: an overview. Journal of Oleo Science 60, 237-265, (2011)
[12] R.J. Gall, F.P. Greenspan, Recent advances in in-situ epoxidation reactions with resin catalysts. J. Am. Oil Chem. Soc. 34, 161-163, (1957)
[13] R. Mungroo, N.C. Pradhan, V.V. Goud, A.K. Dalai, Epoxidation of canola oil with hydrogen peroxyde catalyzed by acidic ion exchange res-in. J. Am. Oil Chem. Soc., 85, 887-896, (2008)
[14] V.V. Goud, A.V. Patwardhan, S. Dinda, N.C. Pradhan, Epoxidation of karanja (Pongamia gla-bra) oil catalyzed by acidic ion exchange resin. Eur. J. Lipid Sci. Technol. 109, 575-584 (2007)
[15] AOCS Official Method Cd 9-57 (97) – Oxirane Oxygen
[16] L.A. Rios, D.A. Echeverri, A. Franco, Epoxida-tion of Jatropha oil using heterogeneous cata-lyst suitable for the Prileschajew reaction: acidic resins and immobilizer lipase. Applied Catalysis A: General 394, 132-137, (2011)
La rivista itaLiana deLLe sostanze grasse - voL. XCiii - gennaio/Marzo 2016
11
D. Kowalska*E. Gruczynska
University of Life SciencesFaculty of Food Sciences
Warsaw, Poland
(*) CORRESPONDENCE AUTHOR:Dr. Dorota Kowalska
University of Life Sciences (SGGW)Faculty of Food SciencesDepartment of Chemistry
159C Nowoursynowska Street02-787 Warsaw, Poland
E-mail: [email protected]
short note the physico-chemical properties and oxidative stabilities of enzymatically interesterified lard and rapeseed oil
blends containing 35 and 25% of lard The mixtures of lard and rapeseed oil containing 35 and 25% of lard were interesterified using as catalysts immobilized lipases (8 wt-%) from Rhizomucor miehei (Lipozyme RM IM) and Candida antarctica (Novozym 435). Interesterifications were carried out at 60°C for 8 h with Lipozyme RM IM and at 80°C for 4 h with Novozym 435. The starting blends were quantitatively separated by column chromatography into triacylglycerol fraction (98.9 ± 0.1%), and a nontriacylglycerol fraction containing free fatty acids (0.2%) and mono- and diacylglycerols (0.9 ± 0.1%). It was found that after interesterification the contents of free fatty acids and of mono- and diacylglycerols in both blends increased to 3.2% and 6.2 ± 0.1% or to 4.5 ± 0.1% when Lipozyme RM IM or Novozym 435 were used, respectively.The slip melting temperatures and solid fat contents of the triacylglycerol fractions separated from interesterified samples were lower compared with the nonesterified blends. The sn-2 and sn-1,3 distribution of fatty acids in the triacylglycerol fractions before and after interesterification showed that they were near random when Novozym 435 was used. When Lipozyme RM IM was used, the fatty acid composition at the sn-2 position remained almost unchanged, compared with the starting blend. The interesterifications have greatly influenced on the DSC melting profiles of products. The interesterified fats had reduced oxidative stabilities, as assessed by Dynamic DSC and Isothermal PDSC measurements. The Arrhenius kinetic parameters for fats oxidation based on DSC and PDSC measurements were also calculated.Keywords: Interesterification, lard, lipases, oxidative stability, rapeseed oil
Proprietà fisico-chimiche e stabilità ossidative di miscele di strutto e olio di colza interesterificati enzimaticamente contenenti il 35 e il 25% di struttoLe miscele di strutto e olio di colza contenenti il 35 e il 25% di strutto sono state interesterificate utilizzando come catalizzatori lipasi immobilizzate (8% in peso) da Rhizomucor miehei (Lipozyme RM IM) e Candida antarctica (Novozym 435). Le interesterificazioni sono state condotte a 60°C per 8 h con Lipozyme RM IM e a 80°C per 4 h con Novozym 435. Le miscele di partenza erano quantitativamente separate mediante cromatografia su colonna in una frazione di triacilglicerolo (98,9 ± 0,1%) e in una frazione di non-triacilglicerolo contenente acidi grassi liberi (0,2%) e mono e diacilgliceroli (0,9 ± 0,1%). È stato trovato che dopo l’interesterificazione il contenuto di acidi grassi liberi e dei mono e diacilgliceroli in entrambe le miscele aumentavano a 3,2% e 6,2 ± 0,1% o a 4,5 ± 0,1% quando erano usati rispettivamente Lipozyme RM IM o Novozym 435. Le temperature di fusione e i contenuti dei grassi solidi delle frazioni triacilgliceroli separate da campioni interesterificati sono state più basse rispetto alle miscele non esterificate. La distribuzione sn-2 e sn-1,3 degli acidi grassi nelle frazioni triacilgliceroliche prima e dopo interesterificazione hanno mostrato che erano pressoché casuali quando è stato utilizzato Novozym 435. Quando è stata usata Lipozyme RM IM, la composizione degli
La rivista itaLiana deLLe sostanze grasse - voL. XCiii - gennaio/Marzo 2016
12
acidi grassi in posizione sn-2 è rimasta quasi invariata, rispetto alla miscela iniziale. Le interesterificazioni hanno fortemente influenzato i profili di fusione DSC dei prodotti. I grassi interesterificati avevano stabilità ossidative ridotte, come valutato dalle misure dinamiche DSC e isotermiche PDSC. I parametri cinetici di Arrhenius per l’ossidazione dei grassi erano calcolati sulla base delle misurazioni DSC e PDSC. Parole chiave: Interesterificazione, lardo, lipasi, stabilità ossidativa, olio di colza.
La rivista itaLiana deLLe sostanze grasse - voL. XCiii - gennaio/Marzo 2016
13
1. INTRODUCTION
Lard is a fat extracted from the adipose tissues of swine by a rendering process. Due to its specific com-positional, physical and functional characteristics, this fat has found numerous uses in the food and human nutrition industry. The worldwide annual production of lard was estimated for 2008 – 2012 at about 7.7 mil-lion tons [1] with the annual production in Poland be-ing about 0.12 million tons. Nowadays, the produc-tion of lard has a tendency to decrease. It is a result of trends in pigs breeding (younger pigs with lower fat contents), increase in vegetable oils production and consumer preference for eating less saturated fats. Nonetheless, lard still remains the most important fat within the meat industry, and is still a popular subject of interest for food chemists.Some papers on physicochemical, structural and sensorial properties of lard were mentioned and briefly discussed in a previous article [2]. Current studies on lard are concerned mainly with analytical, nutritional and technological problems. Lard is a fat that can be adulterated by less valuable fats, [3] but more often it can serve as an adulterant [4 - 7]. Adulteration of vegetable oils and fats by lard is important for those consumers whose religious restriction prevents the use of such products [4, 6]. Recently, Marikkar and Yanty [8] have reviewed the chemical and enzymatic modification on the identity characteristics of lard and products derived from lard. Despite lard’s complicated structural and functional properties, its fatty acids composition (1.0-1.8% myristic, 23.7-29.0% palmitic, 1.5-2.8% palmitoleic, 12.7-17.9% stearic, 34.7-51.2% oleic, 5.7-13.2% linoleic) is relatively simple [7 - 9]. The substantial concentration of palmitic acid at sn-2 position of lard triacylglycerols has a positive influence on the use of lard as a substrate for enzymatic synthesis of human milk fat substitutes [10 - 13]. One of the strategies in lard modification lies in its interesterification with vegetable oils. Such interesterification increases the concentration of unsaturated fatty acids, thus greatly improving the nutritional and functional properties of the interesterified products [14, 15]. The objective of this study is to investigate selected chemical and physical properties of lard and rapeseed oil blends containing 35% and 25% of lard modified by enzymatic interesterification. The properties of interesterified fats were compared with those of the starting blends. The interesterified products were in-tended as shortenings and/or components of frying fats; their oxidative stabilities at high temperatures were therefore also investigated in detail by the DSC/PDSC techniques. The rapeseed oil was selected be-cause of the annual production of this oil in Poland amounting to 0.94 million tonns (food 0.34, non-food 0.60 million tonns). Thus, the method that coupled lard and rapeseed oil has no material restrictions and can be implemented on industrial scale.
2. MATERIALS AND METHODS
MATERIALSRapeseed oil (RSO) and lard (L) were commercial products purchased on local market. The parameters of RSO were as follows: acid value (AV, mg KOH/g) = 0.1, free fatty acids (FFA, %) = 0.05, triacylglycerols content (TAG, %) = 99.4, and the sum of monoacyl-glycerols and diacylglycerols (MAG + DAG, %) = 0.55. The parameters of lard were: AV = 1.3 mg KOH/g, FFA = 0.6%, TAG = 97.7%, (MAG + DAG) = 1.7% and the slip melting point (SMP) = 38.2°C. The main fatty acids composition of RSO and L and their sn-1,3 and sn-2 distribution are given in another paper [2]. The content of trans fatty acids in lard is low (1.1% of 18:1 trans and 0.2% of 18:2 trans). The blends 35% L + 65% RSO and 25% L + 75% RSO were prepared by mixing and homogenizing lard with rapeseed oil at 70°C under nitrogen. The mixture con-taining 35% of L displayed the AV = 0.5 mg KOH/g, and the SMP of 29.2°C. The mixture containing 25% of L showed AV = 0.4 mg KOH/g, and the SMP of 27.2°C. The fatty acid compositions and their posi-tional distribution (sn-2 position) for starting (initial) mixtures are given in Table I. The FFA, (MAG + DAG) and TAG contents in the initial mixtures are given in Table II. The DSC melting profiles of initial mixtures and the temperature profiles of their solid fat contents (SFC) are illustrated in Figs.1 and 2, respectively.
CATALYSTSAs catalysts for enzymatic interesterification two com-mercial preparations Lipozyme RM IM and Novozym 435 (Novozymes A/S, Bagsvaerd, Denmark) were used. Lipozyme RM IM contains immobilized lipase from Rhizomucor miehei, and Novozym 435 contains immobilized lipase from Candida antarctica. Com-mercial Lipozyme RM IM and Novozym 435 prepara-tions contained 4% and 2% of water, respectively.
ENZYMATIC INTERESTERIFICATIONAfter thermal equilibration of fat blend at desired tem-perature (80°C for Novozym 435 or 60°C for Lipozyme RM IM) 8% of enzymatic catalysts was added. The in-teresterifications were performed through continuous shaking for 4 h (Novozyme 435) or 8 h (Lipozyme RM IM). The catalysts load, times and temperatures of in-teresterifications were selected based on the earlier works [16, 17]. After predetermined time of interester-ification filtering off the catalyst stopped the reaction. Since the filtering bed contained a drying agent (SiO2 + MgSO4), water (from catalyst and hygroscopic) was removed from interesterified fat.
DETERMINATIONS AND ANALYSESThe fatty acids composition of the fats was deter-mined by gas-liquid chromatography (GLC) following the conversion of fats into fatty acids methyl esters. The apparatus and procedure have been reported
La rivista itaLiana deLLe sostanze grasse - voL. XCiii - gennaio/Marzo 2016
14
elsewhere [18, 19]. The positional distributions of fatty acids between sn-2 and sn-1,3 positions of triacyl-glycerols were determined using the method based on the ability of an enzyme pancreatic lipase, to se-lectively hydrolyse ester bonds in the sn-1,3 positions of TAG [20]. Free fatty acids (FFA) were determined by titration of fat sample dissolved in a mixture of ethanol: diethyl ether (1:1 vol/vol) with 0.1 M ethanolic potassium hydroxide solution. Fats before and after interesteri-fications were separated by column chromatography on silica gel into triacylglycerols (TAG) and non-TAG fraction, referred to as polar fraction (PF), which contained FFA, monoacylglycerols (MAG) and dia-cylglycerols (DAG). The contents of the TAG and the PF were determined by weight, after evaporation of eluting solvent. The slip melting point (SMP, °C) – the temperature at which the fat confined in open capil-lary immersed in water is moving upward – was de-termined for pure TAG fractions in accordance with Polish Standard PN ISO 638, 1991.The solid fat content (SFC, %) of TAG as a function of temperature (5-50°C) was determined by a pulse nuclear magnetic resonance on a Brucker Minispec 120 NMR Analyzer. Samples for SFC determinations
were prepared according to the Polish Standard PN ISO 8292, 1995. The melting profiles of fats, before and after interest-erifications, were determined using DSC Q200 Model equipped with Refrigerated Cooling Systems (RCS 90), both of TA Instruments, New Castle, Delaware, USA. The instrument was calibrated by using indium and n-dodecane, melting temperatures 156.6°C and -9.6°C, respectively. A pan with a weighed sample of initial fat, or pure TAG fraction (5.5 ± 0.5 mg), was po-sitioned at the DSC chamber; an empty pan served as reference. The fat was melted under flowing ni-trogen at 75°C and stored for 10 min.; it was then cooled to -80°C and kept in store for 20 minutes. Then, the melting scan was performed (-80 to 70°C, heating rate β = 10°C/min). The oxidative stabilities of fats (before interesterification and interesterified pure TAG fractions) were studied by Dynamic DSC and by Isothermal PDSC. The Q20P pressure differential scanning calorimeter (TA Instru-ments, New Castle, Delaware, USA) with high pres-sure DSC cell (Q Series DSC Pressure Cell, PDSC) was used. The dynamic DSC experiments were performed under normal (atmospheric) oxygen pressure, flowing at a rate of 6 L/h. The instrument was calibrated using
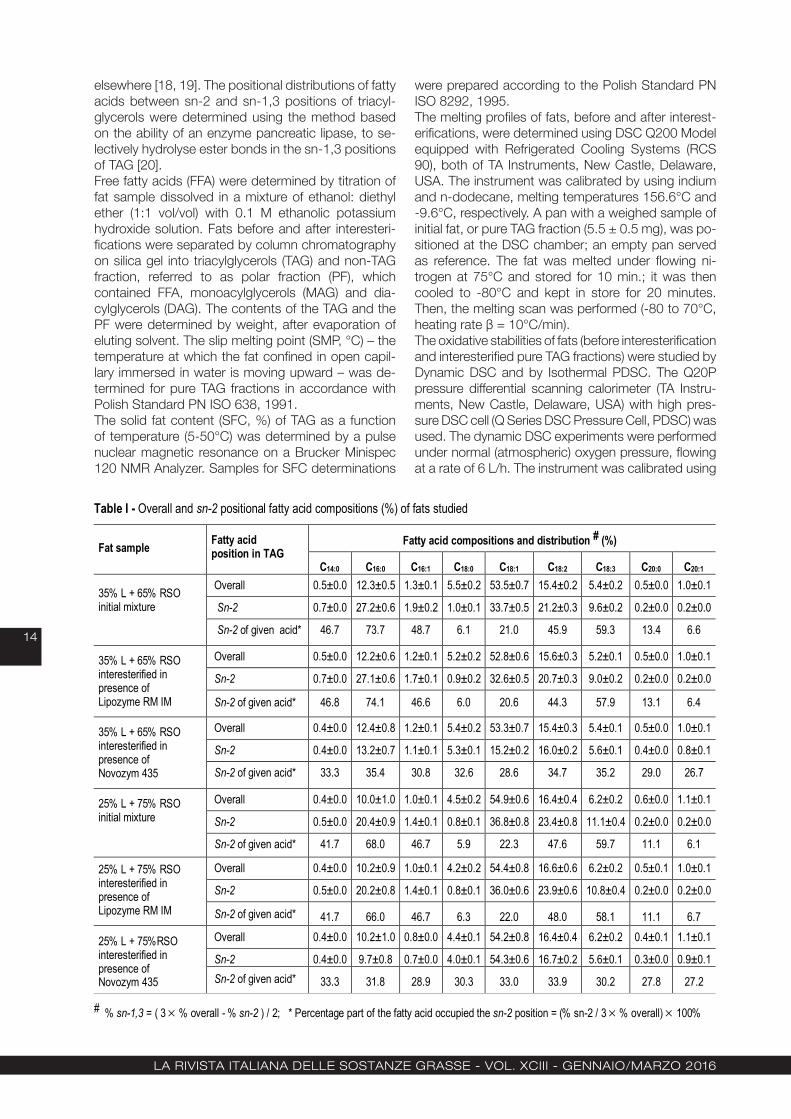
Table I - Overall and sn-2 positional fatty acid compositions (%) of fats studied
# % sn-1,3 = ( 3 % overall - % sn-2 ) / 2; * Percentage part of the fatty acid occupied the sn-2 position = (% sn-2 / 3 % overall) 100%
Fat sample Fatty acid position in TAG
Fatty acid compositions and distribution # (%)
C14:0 C16:0 C16:1 C18:0 C18:1 C18:2 C18:3 C20:0 C20:1
35% L + 65% RSO initial mixture
Overall 0.5±0.0 12.3±0.5 1.3±0.1 5.5±0.2 53.5±0.7 15.4±0.2 5.4±0.2 0.5±0.0 1.0±0.1
Sn-2 0.7±0.0 27.2±0.6 1.9±0.2 1.0±0.1 33.7±0.5 21.2±0.3 9.6±0.2 0.2±0.0 0.2±0.0
Sn-2 of given acid* 46.7 73.7 48.7 6.1 21.0 45.9 59.3 13.4 6.6
35% L + 65% RSO interesterified in presence of Lipozyme RM IM
Overall 0.5±0.0 12.2±0.6 1.2±0.1 5.2±0.2 52.8±0.6 15.6±0.3 5.2±0.1 0.5±0.0 1.0±0.1
Sn-2 0.7±0.0 27.1±0.6 1.7±0.1 0.9±0.2 32.6±0.5 20.7±0.3 9.0±0.2 0.2±0.0 0.2±0.0
Sn-2 of given acid* 46.8 74.1 46.6 6.0 20.6 44.3 57.9 13.1 6.4
35% L + 65% RSO interesterified in presence of Novozym 435
Overall 0.4±0.0 12.4±0.8 1.2±0.1 5.4±0.2 53.3±0.7 15.4±0.3 5.4±0.1 0.5±0.0 1.0±0.1
Sn-2 0.4±0.0 13.2±0.7 1.1±0.1 5.3±0.1 15.2±0.2 16.0±0.2 5.6±0.1 0.4±0.0 0.8±0.1
Sn-2 of given acid* 33.3 35.4 30.8 32.6 28.6 34.7 35.2 29.0 26.7
25% L + 75% RSO initial mixture
Overall 0.4±0.0 10.0±1.0 1.0±0.1 4.5±0.2 54.9±0.6 16.4±0.4 6.2±0.2 0.6±0.0 1.1±0.1
Sn-2 0.5±0.0 20.4±0.9 1.4±0.1 0.8±0.1 36.8±0.8 23.4±0.8 11.1±0.4 0.2±0.0 0.2±0.0
Sn-2 of given acid* 41.7 68.0 46.7 5.9 22.3 47.6 59.7 11.1 6.1
25% L + 75% RSO interesterified in presence of Lipozyme RM IM
Overall 0.4±0.0 10.2±0.9 1.0±0.1 4.2±0.2 54.4±0.8 16.6±0.6 6.2±0.2 0.5±0.1 1.0±0.1
Sn-2 0.5±0.0 20.2±0.8 1.4±0.1 0.8±0.1 36.0±0.6 23.9±0.6 10.8±0.4 0.2±0.0 0.2±0.0
Sn-2 of given acid* 41.7 66.0 46.7 6.3 22.0 48.0 58.1 11.1 6.7
25% L + 75%RSO interesterified in presence of Novozym 435
Overall 0.4±0.0 10.2±1.0 0.8±0.0 4.4±0.1 54.2±0.8 16.4±0.4 6.2±0.2 0.4±0.1 1.1±0.1
Sn-2 0.4±0.0 9.7±0.8 0.7±0.0 4.0±0.1 54.3±0.6 16.7±0.2 5.6±0.1 0.3±0.0 0.9±0.1
Sn-2 of given acid* 33.3 31.8 28.9 30.3 33.0 33.9 30.2 27.8 27.2
La rivista itaLiana deLLe sostanze grasse - voL. XCiii - gennaio/Marzo 2016
15
high-purity indium metal standard. Fat samples 3.0 ± 0.3 mg were placed in an aluminum open sample pan and inserted into the heating chamber of the PDSC cell; a reference pan was left empty. The sample and reference pans were heated at rates of 4.0, 6.0, 7.5, 10.0, 12.5°C/min; for each scan an onset oxidation temperature (tON) was measured as the intersection of extrapolated base line and the tangent line (leading edge). The isothermal PDSC measurements for fats studied (sample mass 3.5 ± 0.5 mg) were carried out at four selected temperatures from the range of 105 – 140°C and under of 1400 kPa of oxygen flowing at the rate of 6 L/h. From the PDSC heat flow curve, the time for reaching its maximum (τmax) was determined. The details for each determinations and measurements are given in earlier papers [2, 16-19, 21, 22].
3. RESULTS AND DISCUSSION
FATS BEFORE INTERESTERIFICATION The fatty acid compositions and distributions (position sn-2) of the initial (starting) blends L + RSO containing 35 and 25% of L are listed in Table I. The FFA, (MAG + DAG) and TAG data and SMP values for the blends L + RSO are shown in Table II and in Materials and Methods. Earlier determinations [21, 22] of tocophe-rols (TOC) in RSO (489 ± 20 mg kg-1) and preliminary determination of TOC in L (<20 mg kg-1) showed that the content of TOC in the blends depends on the pro-portions of RSO used.
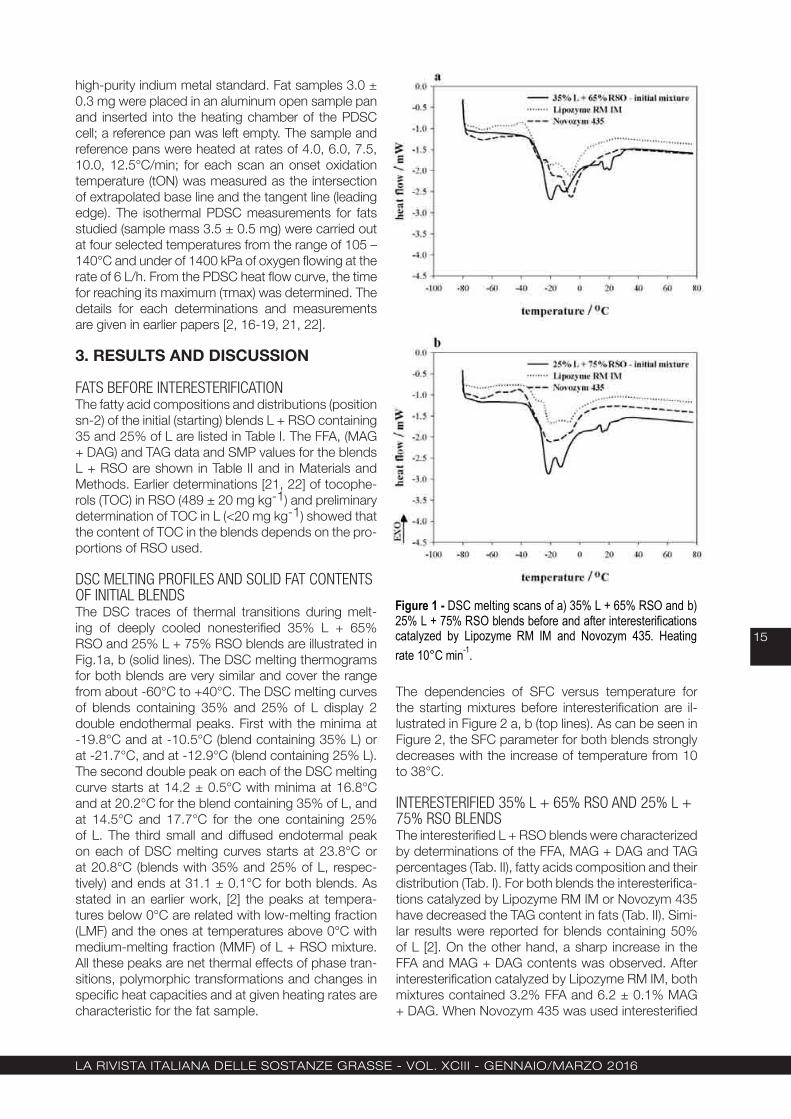
DSC MELTING PROFILES AND SOLID FAT CONTENTS OF INITIAL BLENDSThe DSC traces of thermal transitions during melt-ing of deeply cooled nonesterified 35% L + 65% RSO and 25% L + 75% RSO blends are illustrated in Fig.1a, b (solid lines). The DSC melting thermograms for both blends are very similar and cover the range from about -60°C to +40°C. The DSC melting curves of blends containing 35% and 25% of L display 2 double endothermal peaks. First with the minima at -19.8°C and at -10.5°C (blend containing 35% L) or at -21.7°C, and at -12.9°C (blend containing 25% L). The second double peak on each of the DSC melting curve starts at 14.2 ± 0.5°C with minima at 16.8°C and at 20.2°C for the blend containing 35% of L, and at 14.5°C and 17.7°C for the one containing 25% of L. The third small and diffused endotermal peak on each of DSC melting curves starts at 23.8°C or at 20.8°C (blends with 35% and 25% of L, respec-tively) and ends at 31.1 ± 0.1°C for both blends. As stated in an earlier work, [2] the peaks at tempera-tures below 0°C are related with low-melting fraction (LMF) and the ones at temperatures above 0°C with medium-melting fraction (MMF) of L + RSO mixture. All these peaks are net thermal effects of phase tran-sitions, polymorphic transformations and changes in specific heat capacities and at given heating rates are characteristic for the fat sample.
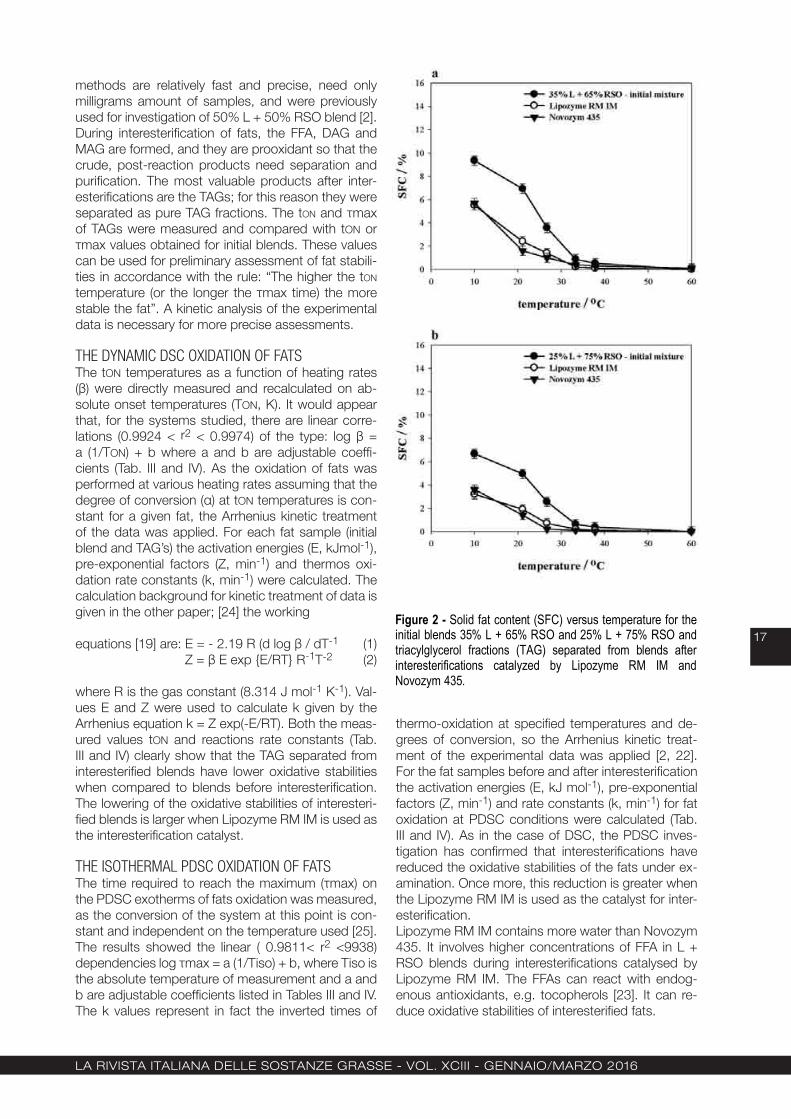
The dependencies of SFC versus temperature for the starting mixtures before interesterification are il-lustrated in Figure 2 a, b (top lines). As can be seen in Figure 2, the SFC parameter for both blends strongly decreases with the increase of temperature from 10 to 38°C.
INTERESTERIFIED 35% L + 65% RSO AND 25% L + 75% RSO BLENDS The interesterified L + RSO blends were characterized by determinations of the FFA, MAG + DAG and TAG percentages (Tab. II), fatty acids composition and their distribution (Tab. I). For both blends the interesterifica-tions catalyzed by Lipozyme RM IM or Novozym 435 have decreased the TAG content in fats (Tab. II). Simi-lar results were reported for blends containing 50% of L [2]. On the other hand, a sharp increase in the FFA and MAG + DAG contents was observed. After interesterification catalyzed by Lipozyme RM IM, both mixtures contained 3.2% FFA and 6.2 ± 0.1% MAG + DAG. When Novozym 435 was used interesterified
Figure 1 - DSC melting scans of a) 35% L + 65% RSO and b) 25% L + 75% RSO blends before and after interesterifications catalyzed by Lipozyme RM IM and Novozym 435. Heating rate 10°C min-1.
Figure 1 - DSC melting scans of a) 35% L + 65% RSO and b) 25% L + 75% RSO blends before and after interesterifications catalyzed by Lipozyme RM IM and Novozym 435. Heating rate 10°C min-1.
La rivista itaLiana deLLe sostanze grasse - voL. XCiii - gennaio/Marzo 2016
16
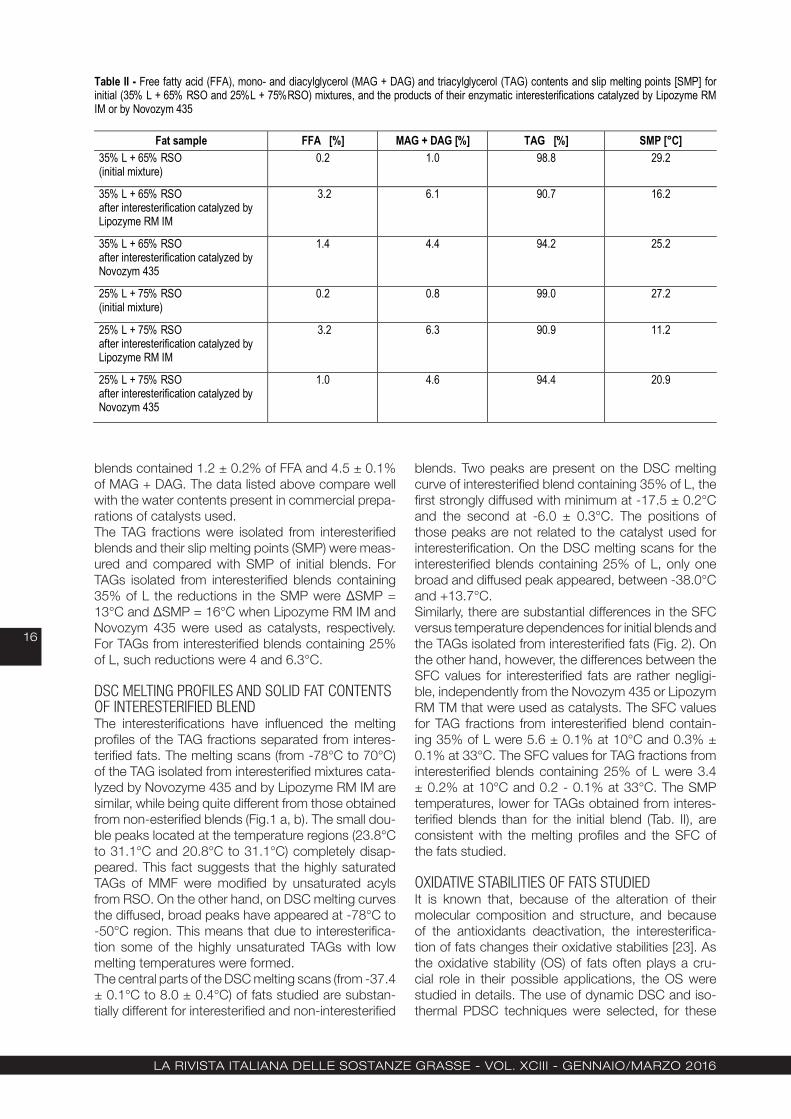
blends contained 1.2 ± 0.2% of FFA and 4.5 ± 0.1% of MAG + DAG. The data listed above compare well with the water contents present in commercial prepa-rations of catalysts used. The TAG fractions were isolated from interesterified blends and their slip melting points (SMP) were meas-ured and compared with SMP of initial blends. For TAGs isolated from interesterified blends containing 35% of L the reductions in the SMP were ΔSMP = 13°C and ΔSMP = 16°C when Lipozyme RM IM and Novozym 435 were used as catalysts, respectively. For TAGs from interesterified blends containing 25% of L, such reductions were 4 and 6.3°C.
DSC MELTING PROFILES AND SOLID FAT CONTENTS OF INTERESTERIFIED BLEND The interesterifications have influenced the melting profiles of the TAG fractions separated from interes-terified fats. The melting scans (from -78°C to 70°C) of the TAG isolated from interesterified mixtures cata-lyzed by Novozyme 435 and by Lipozyme RM IM are similar, while being quite different from those obtained from non-esterified blends (Fig.1 a, b). The small dou-ble peaks located at the temperature regions (23.8°C to 31.1°C and 20.8°C to 31.1°C) completely disap-peared. This fact suggests that the highly saturated TAGs of MMF were modified by unsaturated acyls from RSO. On the other hand, on DSC melting curves the diffused, broad peaks have appeared at -78°C to -50°C region. This means that due to interesterifica-tion some of the highly unsaturated TAGs with low melting temperatures were formed.The central parts of the DSC melting scans (from -37.4 ± 0.1°C to 8.0 ± 0.4°C) of fats studied are substan-tially different for interesterified and non-interesterified
blends. Two peaks are present on the DSC melting curve of interesterified blend containing 35% of L, the first strongly diffused with minimum at -17.5 ± 0.2°C and the second at -6.0 ± 0.3°C. The positions of those peaks are not related to the catalyst used for interesterification. On the DSC melting scans for the interesterified blends containing 25% of L, only one broad and diffused peak appeared, between -38.0°C and +13.7°C.Similarly, there are substantial differences in the SFC versus temperature dependences for initial blends and the TAGs isolated from interesterified fats (Fig. 2). On the other hand, however, the differences between the SFC values for interesterified fats are rather negligi-ble, independently from the Novozym 435 or Lipozym RM TM that were used as catalysts. The SFC values for TAG fractions from interesterified blend contain-ing 35% of L were 5.6 ± 0.1% at 10°C and 0.3% ± 0.1% at 33°C. The SFC values for TAG fractions from interesterified blends containing 25% of L were 3.4 ± 0.2% at 10°C and 0.2 - 0.1% at 33°C. The SMP temperatures, lower for TAGs obtained from interes-terified blends than for the initial blend (Tab. II), are consistent with the melting profiles and the SFC of the fats studied.
OXIDATIVE STABILITIES OF FATS STUDIEDIt is known that, because of the alteration of their molecular composition and structure, and because of the antioxidants deactivation, the interesterifica-tion of fats changes their oxidative stabilities [23]. As the oxidative stability (OS) of fats often plays a cru-cial role in their possible applications, the OS were studied in details. The use of dynamic DSC and iso-thermal PDSC techniques were selected, for these
Table II - Free fatty acid (FFA), mono- and diacylglycerol (MAG + DAG) and triacylglycerol (TAG) contents and slip melting points [SMP] for initial (35% L + 65% RSO and 25%L + 75%RSO) mixtures, and the products of their enzymatic interesterifications catalyzed by Lipozyme RM IM or by Novozym 435
Fat sample FFA [%] MAG + DAG [%] TAG [%] SMP [°C] 35% L + 65% RSO (initial mixture)
0.2 1.0 98.8 29.2
35% L + 65% RSO after interesterification catalyzed by Lipozyme RM IM
3.2 6.1 90.7 16.2
35% L + 65% RSO after interesterification catalyzed by Novozym 435
1.4 4.4 94.2 25.2
25% L + 75% RSO (initial mixture)
0.2 0.8 99.0 27.2
25% L + 75% RSO after interesterification catalyzed by Lipozyme RM IM
3.2 6.3 90.9 11.2
25% L + 75% RSO after interesterification catalyzed by Novozym 435
1.0 4.6 94.4 20.9
La rivista itaLiana deLLe sostanze grasse - voL. XCiii - gennaio/Marzo 2016
17
methods are relatively fast and precise, need only milligrams amount of samples, and were previously used for investigation of 50% L + 50% RSO blend [2]. During interesterification of fats, the FFA, DAG and MAG are formed, and they are prooxidant so that the crude, post-reaction products need separation and purification. The most valuable products after inter-esterifications are the TAGs; for this reason they were separated as pure TAG fractions. The tON and τmax of TAGs were measured and compared with tON or τmax values obtained for initial blends. These values can be used for preliminary assessment of fat stabili-ties in accordance with the rule: “The higher the tON temperature (or the longer the τmax time) the more stable the fat”. A kinetic analysis of the experimental data is necessary for more precise assessments.
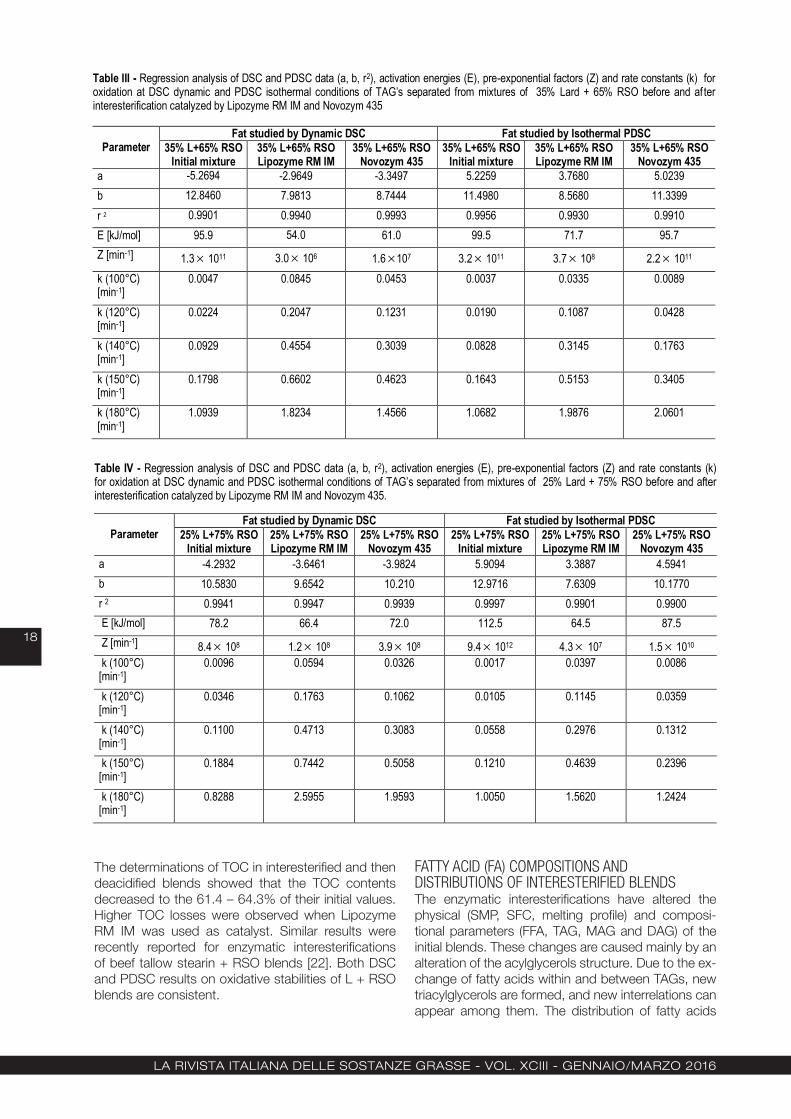
THE DYNAMIC DSC OXIDATION OF FATSThe tON temperatures as a function of heating rates (β) were directly measured and recalculated on ab-solute onset temperatures (TON, K). It would appear that, for the systems studied, there are linear corre-lations (0.9924 < r2 < 0.9974) of the type: log β = a (1/TON) + b where a and b are adjustable coeffi-cients (Tab. III and IV). As the oxidation of fats was performed at various heating rates assuming that the degree of conversion (α) at tON temperatures is con-stant for a given fat, the Arrhenius kinetic treatment of the data was applied. For each fat sample (initial blend and TAG’s) the activation energies (E, kJmol-1), pre-exponential factors (Z, min-1) and thermos oxi-dation rate constants (k, min-1) were calculated. The calculation background for kinetic treatment of data is given in the other paper; [24] the working
equations [19] are: E = - 2.19 R (d log β / dT-1 (1) Z = β E exp {E/RT} R-1T-2 (2)
where R is the gas constant (8.314 J mol-1 K-1). Val-ues E and Z were used to calculate k given by the Arrhenius equation k = Z exp(-E/RT). Both the meas-ured values tON and reactions rate constants (Tab. III and IV) clearly show that the TAG separated from interesterified blends have lower oxidative stabilities when compared to blends before interesterification. The lowering of the oxidative stabilities of interesteri-fied blends is larger when Lipozyme RM IM is used as the interesterification catalyst.
THE ISOTHERMAL PDSC OXIDATION OF FATSThe time required to reach the maximum (τmax) on the PDSC exotherms of fats oxidation was measured, as the conversion of the system at this point is con-stant and independent on the temperature used [25]. The results showed the linear ( 0.9811< r2 <9938) dependencies log τmax = a (1/Tiso) + b, where Tiso is the absolute temperature of measurement and a and b are adjustable coefficients listed in Tables III and IV. The k values represent in fact the inverted times of
thermo-oxidation at specified temperatures and de-grees of conversion, so the Arrhenius kinetic treat-ment of the experimental data was applied [2, 22]. For the fat samples before and after interesterification the activation energies (E, kJ mol-1), pre-exponential factors (Z, min-1) and rate constants (k, min-1) for fat oxidation at PDSC conditions were calculated (Tab. III and IV). As in the case of DSC, the PDSC inves-tigation has confirmed that interesterifications have reduced the oxidative stabilities of the fats under ex-amination. Once more, this reduction is greater when the Lipozyme RM IM is used as the catalyst for inter-esterification.Lipozyme RM IM contains more water than Novozym 435. It involves higher concentrations of FFA in L + RSO blends during interesterifications catalysed by Lipozyme RM IM. The FFAs can react with endog-enous antioxidants, e.g. tocopherols [23]. It can re-duce oxidative stabilities of interesterified fats.
Figure 2 - Solid fat content (SFC) versus temperature for the initial blends 35% L + 65% RSO and 25% L + 75% RSO and triacylglycerol fractions (TAG) separated from blends after interesterifications catalyzed by Lipozyme RM IM and Novozym 435.
La rivista itaLiana deLLe sostanze grasse - voL. XCiii - gennaio/Marzo 2016
18
The determinations of TOC in interesterified and then deacidified blends showed that the TOC contents decreased to the 61.4 – 64.3% of their initial values. Higher TOC losses were observed when Lipozyme RM IM was used as catalyst. Similar results were recently reported for enzymatic interesterifications of beef tallow stearin + RSO blends [22]. Both DSC and PDSC results on oxidative stabilities of L + RSO blends are consistent.
FATTY ACID (FA) COMPOSITIONS AND DISTRIBUTIONS OF INTERESTERIFIED BLENDSThe enzymatic interesterifications have altered the physical (SMP, SFC, melting profile) and composi-tional parameters (FFA, TAG, MAG and DAG) of the initial blends. These changes are caused mainly by an alteration of the acylglycerols structure. Due to the ex-change of fatty acids within and between TAGs, new triacylglycerols are formed, and new interrelations can appear among them. The distribution of fatty acids
Table III - Regression analysis of DSC and PDSC data (a, b, r2), activation energies (E), pre-exponential factors (Z) and rate constants (k) for oxidation at DSC dynamic and PDSC isothermal conditions of TAG’s separated from mixtures of 35% Lard + 65% RSO before and af ter interesterification catalyzed by Lipozyme RM IM and Novozym 435
Parameter
Fat studied by Dynamic DSC Fat studied by Isothermal PDSC 35% L+65% RSO
Initial mixture 35% L+65% RSO Lipozyme RM IM
35% L+65% RSO Novozym 435
35% L+65% RSO Initial mixture
35% L+65% RSO Lipozyme RM IM
35% L+65% RSO Novozym 435
a -5.2694 -2.9649 -3.3497 5.2259 3.7680 5.0239 b 12.8460 7.9813 8.7444 11.4980 8.5680 11.3399 r 2 0.9901 0.9940 0.9993 0.9956 0.9930 0.9910 E [kJ/mol] 95.9 54.0 61.0 99.5 71.7 95.7 Z [min-1] 1.3 1011 3.0 106 1.6 107 3.2 1011 3.7 108 2.2 1011
k (100°C) [min-1]
0.0047 0.0845 0.0453 0.0037 0.0335 0.0089
k (120°C) [min-1]
0.0224 0.2047 0.1231 0.0190 0.1087 0.0428
k (140°C) [min-1]
0.0929 0.4554 0.3039 0.0828 0.3145 0.1763
k (150°C) [min-1]
0.1798 0.6602 0.4623 0.1643 0.5153 0.3405
k (180°C) [min-1]
1.0939 1.8234 1.4566 1.0682 1.9876 2.0601
Table IV - Regression analysis of DSC and PDSC data (a, b, r2), activation energies (E), pre-exponential factors (Z) and rate constants (k) for oxidation at DSC dynamic and PDSC isothermal conditions of TAG’s separated from mixtures of 25% Lard + 75% RSO before and after interesterification catalyzed by Lipozyme RM IM and Novozym 435.
Parameter
Fat studied by Dynamic DSC Fat studied by Isothermal PDSC 25% L+75% RSO
Initial mixture 25% L+75% RSO Lipozyme RM IM
25% L+75% RSO Novozym 435
25% L+75% RSO Initial mixture
25% L+75% RSO Lipozyme RM IM
25% L+75% RSO Novozym 435
a -4.2932 -3.6461 -3.9824 5.9094 3.3887 4.5941 b 10.5830 9.6542 10.210 12.9716 7.6309 10.1770 r 2 0.9941 0.9947 0.9939 0.9997 0.9901 0.9900 E [kJ/mol] 78.2 66.4 72.0 112.5 64.5 87.5 Z [min-1] 8.4 108 1.2 108 3.9 108 9.4 1012 4.3 107 1.5 1010
k (100°C) [min-1]
0.0096 0.0594 0.0326 0.0017 0.0397 0.0086
k (120°C) [min-1]
0.0346 0.1763 0.1062 0.0105 0.1145 0.0359
k (140°C) [min-1]
0.1100 0.4713 0.3083 0.0558 0.2976 0.1312
k (150°C) [min-1]
0.1884 0.7442 0.5058 0.1210 0.4639 0.2396
k (180°C) [min-1]
0.8288 2.5955 1.9593 1.0050 1.5620 1.2424
La rivista itaLiana deLLe sostanze grasse - voL. XCiii - gennaio/Marzo 2016
19
between the sn-1,3 and sn-2 positions was deter-mined for the blends studied before and after inter-esterifications. When the catalyst Novozym 435 was used, the FA compositions (Tab. I) suggest that some positional randomization of FA in TAGs after interest-erification has occurred, but its degree is still far from statistical (33.3%). When as the catalyst the Lipozyme RM IM preparation was used a different situation was observed. Due to positional (sn-1,3) specificity, the enzyme reacts on the sn-1,3 ester linkages, so that the percentage of particular fatty acids in the sn-2 position of TAG, in comparison with their counter-parts in the initial blend, remains virtually unchanged. The small variations in fatty acids at the sn-2 posi-tions may result in part from experimental analytical precision and from acyl migration in the TAG species during interesterification time [26, 27]. The total fatty acid composition of blends before and after enzymatic interesterification remains essentially unchanged (Tab. I). However, the comparison between fatty acid com-positions of lard and TAGs from interesterified blends clearly shows an increase of unsaturated fatty acids content in the interesterified products. The RSO and lard contained in total 0.6% and 1.3% trans isomers, respectively. Blending reduced the total concentration of trans isomers. After interesterification, regardless of the catalyst used, their content is < 0.85% or < 0.78% for blends containing 35% or 25% of L, respectively, which is well below the recommended levels.
CONCLUSIONS
The results obtained in this work show that enzymatic interesterifications of lard + rapeseed oil blends pro-duce new fats with high level of unsaturated fatty ac-ids and low level of trans isomers. Additionally, the interesterified blends of lard and rapeseed oil boast acceptable melting properties and reology. After puri-fication, such fats can be used for edible purposes (i. e. as food components) and as heat transfer media in food production (cooking, frying), although they need an appropriate formulation to improve their resist-ance to thermooxidative degradation (RTD). The RTD of the examined blends decreases according to the sequence: physical blends > blends interesterified in presence of Novozym 435 > blends interesterified in presence of Lipozyme RM IM. The results obtained in this work are consistent with those reported in an-other paper, [2] where the blend lard + rapeseed oil containing 50% of lard was studied.
REFERENCES
[1] M.J. Haas, M.J. Animal Fats. Chapter 5, 161-212. In: Bailey`s Industrial Oil and Fat Products, Six Edition, Six Volume Set, Edited by F.Shahidi, 2005 John Wiley & Sons, Inc.
[2] E. Gruczynska, D. Kowalska, M. Kozlowska, M. Kowalska, B. Kowalski, Enzymatic interesterifi-
cation of a lard and rapeseed oil equal-weight blend. J. Oleo Sci. 62,187-193 (2013).
[3] B. Kowalski, Sub-ambient differential scanning calorimetry of lard and lard contaminated by tallow. Int J. Food Sci. Technol. 24, 415-420 (1989).
[4] J.M.N. Marikkar, O.M. Lai, H.M. Ghazali, Y.B. Che Man, Detection of lard and randomized lard as adulterants in refined-bleached-deodorized palm oil by differential scanning calorimetry. J. Am. Oil Chem. Soc. 78, 1113-1119 (2001).
[5] J.M.N. Marikkar, M.H. Dzulkifly, M.Z. Nor Nor-diha, Y.B.Che Man, Detection of animal fat con-taminations in sunflower oil by differential scan-ning calorimetry. Int. J. Food Prop. 15, 683-690 (2012).
[6] J.M.N. Marikkar, O.M. Lai, H.M. Ghazali, Y.B.Che Man, Compositional and thermal analysis of RBD palm oil adulterated with lipase-catalyzed interesterified lard. Food Chem. 76, 249-258 (2002).
[7] K.A. Rashood, R.R.A. Shaaban, E.M.A. Moety, A. Rauf, Compositional and thermal characteri-zation of genuine and randomized lard: A com-parative study. J. Am. Oil Chem. Soc. 73, 303-309 (1996).
[8] J.M.N. Marikkar, N.A.M. Yanty, Effect of chemi-cal and enzymatic modifications on the identity characteristics of lard: A review. Int. J. Food Prop. 17, 321-330 (2014).
[9] Ch. Lopez, D.J.E. Kalnin, M.R. Ollivon, Coupling of differential scanning calorimetry and X-ray dif-fraction to the study crystallization properties and polymorphism of triacylglycerols. Chapter 8, 169-197. In Calorimetry in Food Processing: Analysis and Design of Food Systems (Kaletunc G - Editor). Wiley-Blackwell Publication. IFT Press, 1-392, (2009)
[10] T. Yang, X. Xu, C. He, L. Li, Lipase catalyzed modification of lard to produce human milk fat substitutes. Food Chem. 80, 473-481 (2003).
[11] Y.H. Wang, X.L. Quin, Q.S. Zhu, R. Zhou, L. Li, B. Yang, Lipase-catalized acidolysis of lard for the production of human milk fat substitute. Eur Food Res Technol. 230, 769-777 (2010).
[12] N.S. Nielsen, T.Yang, X. Xu, C. Jacobsen, Pro-duction and oxidative stability of a human milk fat substitute produced from lard by enzyme technology in a pilot packed-bed reactor. Food Chem. 94, 53-60 (2006).
[13] R.C. Silva, L.N. Cotting, T.P. Poltronieri, V. Bal-cao, L.A. Gioielli, Physical properties of struc-tured lipids from lard and soybean oil produced by enzymatic interesterification. Cienc. Technol. Aliment. 29, 652-660 (2009).
[14] L.Z. Cheong, X. Xu, Lard based fats healthier than lard: Enzymatic synthesis, physico-chem-ical properties and applications. Lipid Technol. 32, 6-9 (2011).
La rivista itaLiana deLLe sostanze grasse - voL. XCiii - gennaio/Marzo 2016
20
[15] V. Seriburi, C.C. Akoh, Enzymatic interesterifica-tion of lard and high oleic sunflower oil with Can-dida antarctica lipase to produce plastic fats. J. Am. Oil Chem. Soc. 75, 1339-1345 (1998).
[16] B. Kowalski, K. Tarnowska, E. Gruczynska, W. Bekas, Chemical and enzymatic inter esterifi-cation of a beef tallow and rapeseed oil equal-weight blend. Eur. J. Lipid Sci. Technol. 106, 655-664 (2004).
[17] B. Kowalski, K. Tarnowska, E. Gruczynska, W. Bekas, Chemical and enzymatic interesterifica-tion of beef tallow and rapeseed oil blend with low content of tallow. J.Oleo Sci. 53, 479-488 (2004).
[18] B. Kowalski, E. Gruczynska, K. Maciaszek, Ki-netics of rapeseed oil oxidation by pressure dif-ferential scanning calorimetry measurements. Eur. J. Lipid Sci. Technol. 102, 337-341 (2000).
[19] E. Ostrowska-Ligeza, W. Bekas, D. Kowalska, M. Łobacz, B. Kowalski, Kinetics of commercial olive oil oxidation: Dynamic differential scanning calorimetry and Rancimat studies. Eur. J. Lipid Sci. Technol. 112, 268-274 (2010).
[20] H. Brockerhoff, A stereospecific analysis of triglicerides. J. Lipid Res. 6, 10-15 (1965).
[21] D. Kowalska, M. Kostecka, K. Tarnowska, B. Kowalski, Oxidative stabilities of enzymatically interesterified goose fat and rapeseed oil blend by rancimat and PDSC. J. Therm. Anal. Calorim. 115, 2063-2072 (2014).
[22] D. Kowalska, E. Gruczynska, M. Kowalska, The effect of enzymatic interesterification on the physico-chemical properties and thermo-oxida-tive stabilities of beef tallow stearin and rape-seed oil blends. J. Therm. Anal. Calorim. 120, 507-517 (2015).
[23] D. Martin, G. Reglero, F.J. Seniorans, Oxida-tive stability of structured lipids. Eur. Food Res. Technol. 231, 635-653 (2010).
[24] M. Kozlowska, D. Kowalska, E. Gruczynska, B. Kowalski, Effect of ethanolic extracts from mar-joram thyme and oregano on thermooxidative degradation of rapeseed oil. Riv. Ital. Sostanze Grasse 90, 41-46 (2013).
[25] B. Kowalski, Thermokinetic analysis of vegeta-ble oil oxidation as an autocatalytic reaction. Polish J. Food Nutr. Sci.1/42, 51-60 (1992).
[26] X. Xu, A.R.H. Skands, C-E. Hoy, H. Mu, S. Bal-chen, J. Adler-Nissen’ Production of specific structured lipids by enzymatic interesterification: elucidation of acyl migration by responce sur-face design. J. Am. Oil Chem. Soc. 75, 1179-1186 (1998).
[27] J. Svensson, P. Adlercreutz, Effect of acyl migra-tion in Lipozyme TL IM-catalyzed interesterifica-tion using a triacylglycerol model system. Eur. J. Lipid Sci. Technol. 113, 1258-1265 (2011).
Received December 17, 2014Accepted February 10, 2015

La rivista itaLiana deLLe sostanze grasse - voL. XCiii - gennaio/Marzo 2016
21
F. Mansouri1*A. Benmoumen1
G. Richard2
M.L. Fauconnier2
M. Sindic3
H. Serghini-Caid1
A. Elamrani1
1 Laboratoire de Biologie des Planteset des Microorganismes
Faculté des Sciences Université Mohammed Premier
Oujda, Maroc
2 Unité de Chimie Générale et OrganiqueGembloux Agro-BioTech
Université de LiègeGembloux, Belgique
3 Laboratoire Qualité et sécuritédes produits agroalimentaires
Unité Analyse, Qualité et RisquesGembloux Agro-BioTech
Université de LiègeGembloux, Belgique
(*) CORRESPONDING AUTHOR:Farid Mansouri
Mobile: +212 664 469076Work: +212 536 500601Fax: + 212 536 500 603
Email: [email protected]
Characterization of monovarietal virgin olive oils from introduced cultivars in
eastern Morocco
The aim of this study was to characterize monovarietal virgin olive oils (VOOs) of new high-density planting system of three European cultivars (Arbequina, Arbosana and Koroneiki), recently introduced in eastern Morocco. VOOs’ characterization has been carried out by analyzing several parameters, such as quality indexes, fatty acid contents, minor components, and olive oils’ oxidative stability index (OSI). In this study, we have also conducted a comparison between these monovarietal VOOs and olive oils of autochthones cultivar Picholine marocaine. Significant differences between the analyzed VOOs were highlighted. Koroneiki’s VOO had a high phenols content (493.66 mg/kg) and, consequently, the best oxidative stability (94.83 h); Arbrosana’s VOO was distinguished by its abundance of α-tocopherol (460.07 mg/kg) and by an intermediate OSI (64.83 h). In addition, results showed, firstly, that in all the analyzed oils decarboxymethyl ligstroside aglycone and decarboxymethyl oleuropein aglycone were the main phenolic compounds, and, secondly, that VOOs of Koroneiki and Arbosana seem to have similar profiles, with a high content of natural antioxidants and a high oleic/linoleic ratio, thus boasting a better shelf life.Keywords: virgin olive oil, Arbequina, Arbosana, Koroneiki, Picholine marocaine, fatty acids, phenols, tocopherols, oxidative stability. (OSI).
Caratterizzazione degli oli vergini di oliva monovarietali da cultivar introdotte nel Marocco orientaleLo scopo di questo studio è stato quello di caratterizzare gli oli vergini di oliva monovarietali (VOOs) ottenuti da nuove piantagioni ad alta densità di tre cultivar europee (Arbequina, Arbosana e Koroneiki), recentemente introdotte nel Marocco orientale.La caratterizzazione dei VOOs è stata effettuata analizzando diversi parametri, quali ad esempio indici di qualità, contenuto di acidi grassi, componenti minori, e l’indice di stabilità ossidativa degli oli (OSI).In questo studio, abbiamo anche condotto un confronto tra questi VOOs monovarietali e l’olio ottenuto da olive di cultivar autoctone quali la Picholine marocaine. Sono state evidenziate differenze significative tra i VOOs analizzati: l’olio di oliva vergine ottenuto dalla Koroneiki aveva un alto contenuto di fenoli (493,66 mg/kg) e di conseguenza la massima stabilità ossidativa (94.83 h); l’ olio di oliva vergine ottenuto da Arbosana si distingueva per la sua ricchezza di α-tocoferolo (460,07 mg/kg) e da un OSI intermedio (64.83 h). I risultati mostrano inoltre che l’aglicone del decarbossimetil ligstroside e della decarbossimetil oleuropeina sono stati i principali composti fenolici in tutti gli oli analizzati e che gli VOOs di Koroneiki e Arbosana sembravano avere profili simili con un alto contenuto di antiossidanti naturali e un alto rapporto oleico/linoleico, e di conseguenza hanno mostrato la migliore shelf-life.Parole chiave: olio extravergine di oliva, Arbequina, Arbosana, Koroneiki, Picholine marocaine, acidi grassi, fenoli, tocoferoli, stabilità ossidativa (OSI).
La rivista itaLiana deLLe sostanze grasse - voL. XCiii - gennaio/Marzo 2016
22
1. INTRODUCTION
Olive oil enjoys a privileged position among edible vegetable oils and is appreciated for its particular aro-ma, taste, and nutritional values. Olive oil is the key component of the Mediterranean diet, and it attracts the interest of scientists due to the health benefits as-sociated with its consumption. It is recommended for the prevention of cardio circulatory diseases and for its anti-oxidative capacity [1, 2, 3]. Extra virgin olive oil (EVOO) presents biochemical properties and contains biomolecules that make it a functional food [2]. From a chemical point of view, olive oil can be divided into major and minor fractions. The major fraction includes acylglycerols, which represent approximately 98% of olive oil composition. In the minor fraction, different chemical compounds, such as phenols, tocopherols, aliphatic and triterpenic alcohols, sterols, aromatic hy-drocarbons, and volatile compounds can be found. Some studies indicate that these phytochemicals, especially phenols, display high free-radical scaveng-ing activity [4, 5]. Also, phenols have important orga-noleptic and technological values due to their influ-ence on sensory characteristics and the shelf life of olive oil [6, 7, 8]. The most important classes of phe-nolic compounds in olive fruit include: phenolic acids, phenolic alcohols, lignans, flavonoids and secoiridoid derivatives [9]. Particular taste and oxidative stability (OSI) of an olive oil depend on its content of specific phenolic compounds, e.g. secoiridoids, which are the main agents responsible for the resistance against autoxidation and photoxidation [10]. Moreover, it is widely known that the quality of virgin olive oil (VOO) is influenced by various agronomic factors, such as olive cultivar [11], climatic conditions [12], production proc-ess [13], and the degree of maturation and agronomic practices related to the irrigation treatment [14, 15]. In Morocco, olive groves are dominated by Picholine marocaine, a variety spread throughout all olive trees growing in sub regions and covering approximately 96% of Moroccan olive plantations [16]. Picholine marocaine is very resistant to drought, and can serve a double purpose: oil production and conservation as table olive. However, the fruit production is highly changeable. Aiming to improve olive-oil production in Morocco, new European olive cultivars (Arbequina, Arbosana, and Koroneiki) have been recently intro-duced in irrigated areas in the form of high-density planting (HDP) systems around Marrakech, Benimel-lal, Meknes and Oujda. The advantage of the HDP system lies in the use of time saving and highly ef-ficient machines. The remarkable harvesting capacity makes it possible to pick up large quantities of per-fectly ripe olives on large-scale plantations. In some cases, olive processing can be carried out immedi-ately, since it has become increasingly common for HDP plantations to build on-site olive mills. This HDP allows reduction in expenses and could provide olive oils from good to superior qualities [17].
Eastern Morocco is a potential olive field expansion zone. Indeed, in some areas, the introduction of new olive plantations, as well as the renewing of extant plantations has been significant in the region. The aim is to develop the olive oil industry by improving the productivity and quality of olive oils produced in this region of Morocco. Likewise, three European culti-vars (Arbequina, Arbosana and Koroneiki) have been recently introduced recently in the region under irri-gated HDP system. Therefore, the aim of this work is to compare the biochemical and qualitative charac-teristics of those European olive oil cultivars that have been newly introduced in this region with the local Picholine marocaine variety. This work was carried out in collaboration with the HDP olive groves owners around Oujda.
2. MATERIAL AND METHODS
2.1 OLIVE OIL SAMPLESSamples of monovarietal VOOs produced during the 2012/2013 crop season are taken from four varieties grown in eastern Morocco: Arbequina, Arbosana as Spanish varieties; Koroneiki as a Greek olive variety, and Picholine marocaine as an autochthonous vari-ety. The European cultivars were conducted under irrigated an HDP system with a frame of 1,5 m/4 m and a density of 1666 trees/ha. The local cultivar is conducted under rain-fed condition. The irrigation pe-riod for the HDP system was 9 months per year, from January to September, with daily irrigation using drip-pers placed around the trees delivering water flow of 1.2 L/h. The climate is a Mediterranean one, with hot, dry summers and an annual average rainfall ranging from 275.3 to 516.0 mm.The olive fruits came from groves located in the “Ouj-da-Angad” region; they were directly processed by a “continuous industrial 2-phase system” at the com-pany “Huiles d’olive de la Méditerranée”. The physic-ochemical parameters analysis of monovarietal VOOs was carried out within 7 days from production; in the meantime, 500 mL samples were stored in dark bot-tles with no space at the top, at a temperature of 4°C, for other, further analysis.
2.2 ANALYTICAL METHODS
2.2.1 Physicochemical parametersFree acidity (g/100 g oleic acid), peroxide value (meq O2/kg of olive oil) and ultraviolet absorption indexes (K232, K270 and ΔK) were determined according to the official European methods [18].
2.2.2 Fatty acid analysisBefore analysis, fatty acids were converted into fatty acid methyl esters by shaking a solution of 10 mg oil and 0.2 mL of hexane with 0.5 mL of solution A (A: 55 mL of dry methanol + 20 mL of hexane + 25 mL of BF3 at 14% weight in methanol), and then placing it in
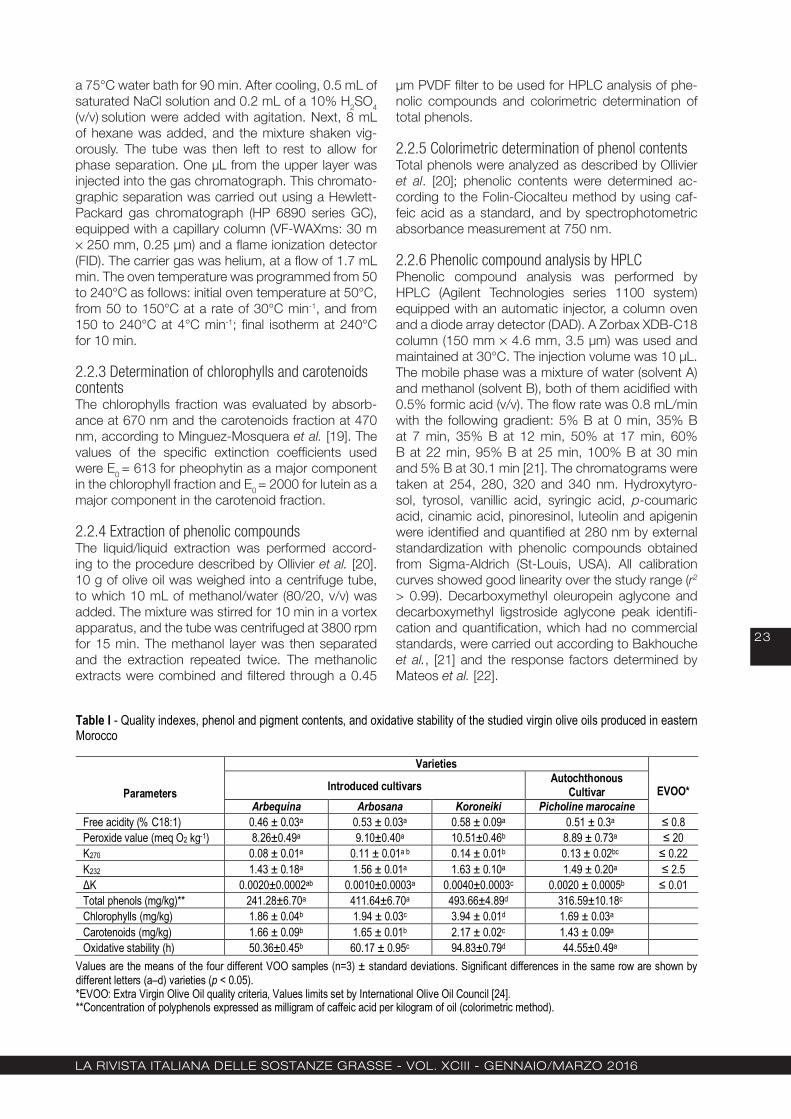
La rivista itaLiana deLLe sostanze grasse - voL. XCiii - gennaio/Marzo 2016
23
a 75°C water bath for 90 min. After cooling, 0.5 mL of saturated NaCl solution and 0.2 mL of a 10% H2SO4 (v/v) solution were added with agitation. Next, 8 mL of hexane was added, and the mixture shaken vig-orously. The tube was then left to rest to allow for phase separation. One µL from the upper layer was injected into the gas chromatograph. This chromato-graphic separation was carried out using a Hewlett-Packard gas chromatograph (HP 6890 series GC), equipped with a capillary column (VF-WAXms: 30 m × 250 mm, 0.25 μm) and a flame ionization detector (FID). The carrier gas was helium, at a flow of 1.7 mL min. The oven temperature was programmed from 50 to 240°C as follows: initial oven temperature at 50°C, from 50 to 150°C at a rate of 30°C min-1, and from 150 to 240°C at 4°C min-1; final isotherm at 240°C for 10 min.
2.2.3 Determination of chlorophylls and carotenoids contents The chlorophylls fraction was evaluated by absorb-ance at 670 nm and the carotenoids fraction at 470 nm, according to Minguez-Mosquera et al. [19]. The values of the specific extinction coefficients used were E0 = 613 for pheophytin as a major component in the chlorophyll fraction and E0 = 2000 for lutein as a major component in the carotenoid fraction.
2.2.4 Extraction of phenolic compoundsThe liquid/liquid extraction was performed accord-ing to the procedure described by Ollivier et al. [20]. 10 g of olive oil was weighed into a centrifuge tube, to which 10 mL of methanol/water (80/20, v/v) was added. The mixture was stirred for 10 min in a vortex apparatus, and the tube was centrifuged at 3800 rpm for 15 min. The methanol layer was then separated and the extraction repeated twice. The methanolic extracts were combined and filtered through a 0.45
μm PVDF filter to be used for HPLC analysis of phe-nolic compounds and colorimetric determination of total phenols.
2.2.5 Colorimetric determination of phenol contentsTotal phenols were analyzed as described by Ollivier et al. [20]; phenolic contents were determined ac-cording to the Folin-Ciocalteu method by using caf-feic acid as a standard, and by spectrophotometric absorbance measurement at 750 nm.
2.2.6 Phenolic compound analysis by HPLCPhenolic compound analysis was performed by HPLC (Agilent Technologies series 1100 system) equipped with an automatic injector, a column oven and a diode array detector (DAD). A Zorbax XDB-C18 column (150 mm × 4.6 mm, 3.5 µm) was used and maintained at 30°C. The injection volume was 10 μL. The mobile phase was a mixture of water (solvent A) and methanol (solvent B), both of them acidified with 0.5% formic acid (v/v). The flow rate was 0.8 mL/min with the following gradient: 5% B at 0 min, 35% B at 7 min, 35% B at 12 min, 50% at 17 min, 60% B at 22 min, 95% B at 25 min, 100% B at 30 min and 5% B at 30.1 min [21]. The chromatograms were taken at 254, 280, 320 and 340 nm. Hydroxytyro-sol, tyrosol, vanillic acid, syringic acid, p-coumaric acid, cinamic acid, pinoresinol, luteolin and apigenin were identified and quantified at 280 nm by external standardization with phenolic compounds obtained from Sigma-Aldrich (St-Louis, USA). All calibration curves showed good linearity over the study range (r2
> 0.99). Decarboxymethyl oleuropein aglycone and decarboxymethyl ligstroside aglycone peak identifi-cation and quantification, which had no commercial standards, were carried out according to Bakhouche et al., [21] and the response factors determined by Mateos et al. [22].
Table I - Quality indexes, phenol and pigment contents, and oxidative stability of the studied virgin olive oils produced in eastern Morocco
Values are the means of the four different VOO samples (n=3) ± standard deviations. Significant differences in the same row are shown by different letters (a–d) varieties (p < 0.05). *EVOO: Extra Virgin Olive Oil quality criteria, Values limits set by International Olive Oil Council [24].**Concentration of polyphenols expressed as milligram of caffeic acid per kilogram of oil (colorimetric method).
Parameters
Varieties
EVOO* Introduced cultivars Autochthonous
Cultivar Arbequina Arbosana Koroneiki Picholine marocaine
Free acidity (% C18:1) 0.46 ± 0.03a 0.53 ± 0.03a 0.58 ± 0.09a 0.51 ± 0.3a ≤ 0.8 Peroxide value (meq O2 kg-1) 8.26±0.49a 9.10±0.40a 10.51±0.46b 8.89 ± 0.73a ≤ 20 K270 0.08 ± 0.01a 0.11 ± 0.01a b 0.14 ± 0.01b 0.13 ± 0.02bc ≤ 0.22 K232 1.43 ± 0.18a 1.56 ± 0.01a 1.63 ± 0.10a 1.49 ± 0.20a ≤ 2.5 ΔK 0.0020±0.0002ab 0.0010±0.0003a 0.0040±0.0003c 0.0020 ± 0.0005b ≤ 0.01 Total phenols (mg/kg)** 241.28±6.70a 411.64±6.70a 493.66±4.89d 316.59±10.18c Chlorophylls (mg/kg) 1.86 ± 0.04b 1.94 ± 0.03c 3.94 ± 0.01d 1.69 ± 0.03a Carotenoids (mg/kg) 1.66 ± 0.09b 1.65 ± 0.01b 2.17 ± 0.02c 1.43 ± 0.09a Oxidative stability (h) 50.36±0.45b 60.17 ± 0.95c 94.83±0.79d 44.55±0.49a

La rivista itaLiana deLLe sostanze grasse - voL. XCiii - gennaio/Marzo 2016
24
2.2.7 Tocopherols analysisThe α-tocopherol, β-tocopherol, γ-tocopherol and δ-tocopherol were evaluated following the AOCS Method Ce 8-89 [23]. A solution of oil in hexane was analyzed by HPLC (Agilent Technologies series 1200 system) equipped with an automatic injector, on Up-tisphere 120Ǻ NH2 column (150 mm × 3 mm, 3 μm), maintained at 30°C. The injection volume was 10 μL. The mobile phase was hexane/2-propanol (99/1, v/v), eluted at a flow rate of 1 mL/min. An ultraviolet detec-tor was used for absorbance measurements. Toco-pherols were identified and quantified at 292 nm by external standardization with tocopherols obtained from Sigma-Aldrich (St-Louis, USA).
2.2.8 Evaluation of oxidative stabilityOxidative stability of olive oils was evaluated by the Rancimat method, and was expressed as the lipid oxidation induction period (hours), measured with a Metrohm Rancimat 743 apparatus using an olive oil sample of 3 g warmed to 100°C, and an air flow of 15 L/h.
2.2.9 Statistical analysisAll analytical determinations were performed at least in triplicate. Values of different parameters were ex-pressed as the mean ± standard deviation (x ± SD). Significant differences between mean (p < 0.05) were determined by ANOVA test using IBM SPSS software for Windows (IBM SPSS. 20, USA). Data of oxidative stability and some oil chemical characteristics were submitted to a linear correlation, using the Pearson bivariate test to establish which compound better explained the oxidative stability. Furthermore, all the
obtained data were submitted to a classification by hierarchical-cluster analysis (HCA) using the XLSTAT software for Windows, version 2013.5.06 (Addin-soft).
3. RESULTS AND DISCUSSION
3.1 OLIVE OIL’S PHYSICOCHEMICAL INDEXESAnalyzed VOOs showed low values for the evaluated physicochemical parameters: acidity ≤ 0.8%; perox-ide value ≤ 20 meqO2 kg-1; K270 ≤ 0.22; K232 ≤ 2.5, and ΔK ≤ 0.01 (Tab. I). All results were easily within the limits set by the International Olive Oil Council [24] for the extra virgin olive oil category. This proofs of proper olive oil extraction and storage conditions also guar-antee the freshness of oil. The low values for those parameters translate to a good quality of those olive oils obtained from fresh and healthy olives harvested at the optimal ripening point, followed by immediate extraction without olives storage. However, according to the olive cultivar, significant differences have been observed for peroxide index and UV absorbance (K270 and ΔK) (p < 0.05). It is known that olives at late rip-ening stages give olive oils with higher levels of free acidity, as a result of undergoing an increase in en-zymatic activity, especially lipolytic enzymes, and are more sensitive to pathogenic infections and mechani-cal damage [25].
3.2 FATTY ACID COMPOSITION The fatty acid composition has previously been used as a parameter for oil classification because of its importance in the description and determination of adulteration [26]. Table II shows fatty acids composi-
Table II - Fatty acid compositions of the studied virgin olive oils produced in eastern Morocco
Values are the means of the four different VOO samples (n=3) ± standard deviations. Significant differences in the same row are shown by different letters (a–d) varieties (p<0.05). SFA, saturated fatty acid; MUFA, monounsaturated fatty acid; PUFA, polyunsaturated fatty acid; O/L, oleic/linoleic ratio; ND, not detected. *EVOO: Extra Virgin Olive Oil quality criteria, Values limits set by International Olive Oil Council [24].
Fatty acids
(%)
Varieties
EVOO* Introduced cultivars Autochthonous cultivar
Arbequina Arbosana Koroneiki Picholine marocaine Palmitic acid 16.96±0.75b 13.72±0.34a 15.70±0.37ab 15.93±2.30ab 7,5 - 20,0 Palmitoleic acid 1.82±0.21b 1.27±0.03a 1.23±0.06a 1.20±0.20a 0,3 - 3,5 Heptadecanoic acid 0.11±0.01b 0.15±0.00c NDa NDa ≤ 0,3 Heptadecenoic acid 0.24±0.02b 0.34±0.00c NDa NDa ≤ 0,3 Stearic acid 1.79±0.41b 1.91±0.36b 0.51±0.12a 1.60±0.07b 0,5 - 5,0 Oleic acid 69.72±1.03a 75.69±0.56b 76.24±0.52b 67.49±2.55a 55,0 - 83,0 Linoleic acid 8.21±0.10c 5.66±0.06b 5.26±0.07a 12.85±0.02d 3,5 - 21,0 Linolenic acid 0.54±0.01a 0.64±0.02b 0.64±0.01a 0.93±0.01c ≤ 1,0 Arachidic acid 0.32±0.05c 0.37±0.01c 0.24±0.01b NDa ≤ 0,6 Gadoleic acid 0.28±0.06c 0.26±0.00c 0.18±0.01b NDa ≤ 0,4 ƩSFAs 19.19±0.74a 16.14±0.64a 16.45±0.46a 17.53±2.33a ƩMUFAs 72.06±0.79b 77.56±0.57c 77.65±0.51c 68.69±2.36a ƩPUFAs 8.75±0.10c 6.30±0.07b 5.90±0.08a 13.78±0.03d O/L ratio 8.49±0.21b 13.37±0.05c 14.50±0.25d 5.25±0.21a
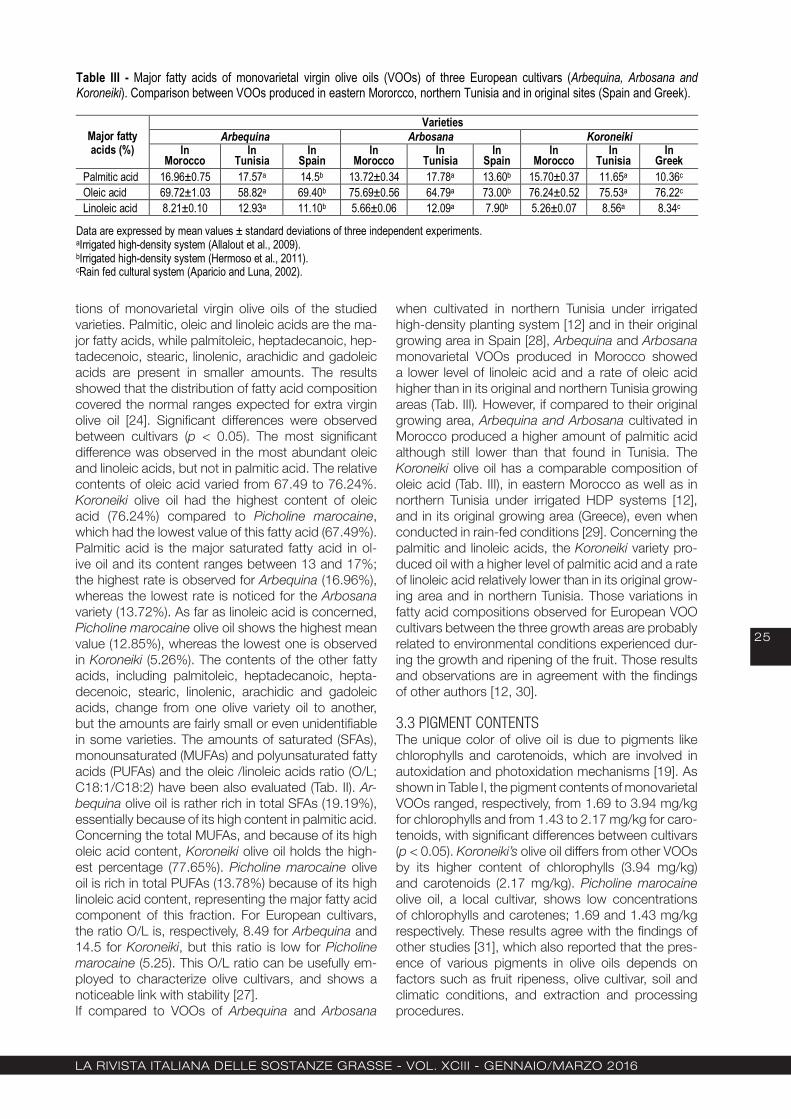
La rivista itaLiana deLLe sostanze grasse - voL. XCiii - gennaio/Marzo 2016
25
tions of monovarietal virgin olive oils of the studied varieties. Palmitic, oleic and linoleic acids are the ma-jor fatty acids, while palmitoleic, heptadecanoic, hep-tadecenoic, stearic, linolenic, arachidic and gadoleic acids are present in smaller amounts. The results showed that the distribution of fatty acid composition covered the normal ranges expected for extra virgin olive oil [24]. Significant differences were observed between cultivars (p < 0.05). The most significant difference was observed in the most abundant oleic and linoleic acids, but not in palmitic acid. The relative contents of oleic acid varied from 67.49 to 76.24%. Koroneiki olive oil had the highest content of oleic acid (76.24%) compared to Picholine marocaine, which had the lowest value of this fatty acid (67.49%). Palmitic acid is the major saturated fatty acid in ol-ive oil and its content ranges between 13 and 17%; the highest rate is observed for Arbequina (16.96%), whereas the lowest rate is noticed for the Arbosana variety (13.72%). As far as linoleic acid is concerned, Picholine marocaine olive oil shows the highest mean value (12.85%), whereas the lowest one is observed in Koroneiki (5.26%). The contents of the other fatty acids, including palmitoleic, heptadecanoic, hepta-decenoic, stearic, linolenic, arachidic and gadoleic acids, change from one olive variety oil to another, but the amounts are fairly small or even unidentifiable in some varieties. The amounts of saturated (SFAs), monounsaturated (MUFAs) and polyunsaturated fatty acids (PUFAs) and the oleic /linoleic acids ratio (O/L; C18:1/C18:2) have been also evaluated (Tab. II). Ar-bequina olive oil is rather rich in total SFAs (19.19%), essentially because of its high content in palmitic acid. Concerning the total MUFAs, and because of its high oleic acid content, Koroneiki olive oil holds the high-est percentage (77.65%). Picholine marocaine olive oil is rich in total PUFAs (13.78%) because of its high linoleic acid content, representing the major fatty acid component of this fraction. For European cultivars, the ratio O/L is, respectively, 8.49 for Arbequina and 14.5 for Koroneiki, but this ratio is low for Picholine marocaine (5.25). This O/L ratio can be usefully em-ployed to characterize olive cultivars, and shows a noticeable link with stability [27]. If compared to VOOs of Arbequina and Arbosana
when cultivated in northern Tunisia under irrigated high-density planting system [12] and in their original growing area in Spain [28], Arbequina and Arbosana monovarietal VOOs produced in Morocco showed a lower level of linoleic acid and a rate of oleic acid higher than in its original and northern Tunisia growing areas (Tab. III). However, if compared to their original growing area, Arbequina and Arbosana cultivated in Morocco produced a higher amount of palmitic acid although still lower than that found in Tunisia. The Koroneiki olive oil has a comparable composition of oleic acid (Tab. III), in eastern Morocco as well as in northern Tunisia under irrigated HDP systems [12], and in its original growing area (Greece), even when conducted in rain-fed conditions [29]. Concerning the palmitic and linoleic acids, the Koroneiki variety pro-duced oil with a higher level of palmitic acid and a rate of linoleic acid relatively lower than in its original grow-ing area and in northern Tunisia. Those variations in fatty acid compositions observed for European VOO cultivars between the three growth areas are probably related to environmental conditions experienced dur-ing the growth and ripening of the fruit. Those results and observations are in agreement with the findings of other authors [12, 30].
3.3 PIGMENT CONTENTSThe unique color of olive oil is due to pigments like chlorophylls and carotenoids, which are involved in autoxidation and photoxidation mechanisms [19]. As shown in Table I, the pigment contents of monovarietal VOOs ranged, respectively, from 1.69 to 3.94 mg/kg
for chlorophylls and from 1.43 to 2.17 mg/kg for caro-tenoids, with significant differences between cultivars (p < 0.05). Koroneiki’s olive oil differs from other VOOs by its higher content of chlorophylls (3.94 mg/kg) and carotenoids (2.17 mg/kg). Picholine marocaine olive oil, a local cultivar, shows low concentrations of chlorophylls and carotenes; 1.69 and 1.43 mg/kg respectively. These results agree with the findings of other studies [31], which also reported that the pres-ence of various pigments in olive oils depends on factors such as fruit ripeness, olive cultivar, soil and climatic conditions, and extraction and processing procedures.
Table III - Major fatty acids of monovarietal virgin olive oils (VOOs) of three European cultivars (Arbequina, Arbosana and Koroneiki). Comparison between VOOs produced in eastern Mororcco, northern Tunisia and in original sites (Spain and Greek).
Data are expressed by mean values ± standard deviations of three independent experiments. aIrrigated high-density system (Allalout et al., 2009). bIrrigated high-density system (Hermoso et al., 2011). cRain fed cultural system (Aparicio and Luna, 2002).
Major fatty acids (%)
Varieties Arbequina Arbosana Koroneiki
In Morocco
In Tunisia
In Spain
In Morocco
In Tunisia
In Spain
In Morocco
In Tunisia
In Greek
Palmitic acid 16.96±0.75 17.57a 14.5b 13.72±0.34 17.78a 13.60b 15.70±0.37 11.65a 10.36c Oleic acid 69.72±1.03 58.82a 69.40b 75.69±0.56 64.79a 73.00b 76.24±0.52 75.53a 76.22c Linoleic acid 8.21±0.10 12.93a 11.10b 5.66±0.06 12.09a 7.90b 5.26±0.07 8.56a 8.34c

La rivista itaLiana deLLe sostanze grasse - voL. XCiii - gennaio/Marzo 2016
26
3.4 TOTAL PHENOLS CONTENTThe phenolic compounds present in VOO are among the reasons of the nutritional importance and shelf life of this oil. This is a desirable characteristic because of the beneficial effects of these components on hu-man health. Phenols correlate with key sensory oil properties, such as the bitterness and sharpness that are associated to olive oil. The classification of olive oil as mild, medium or robust can be linked to the total phenols content. R. Aparicio and Luna G. [29] and M. P. Aguilera, Beltrán G. [27] reported that amount of total phenols usually ranges from 50 to 1000 mg/kg, and depends on several factors, such as variety, agricultural practices, olives ripeness at harvest, type of crushing machine, and oil extraction procedures. In this study, the concentrations of total phenols in analyzed VOOs range between 241.28 and 493.66 mg/kg, and significant differences between olive varieties were noticed (Tab. I). Koroneiki olive oil has the highest total phenols content (493.66 mg/kg), whereas the Arbequina variety shows the lowest value (241.28 mg/kg). Arbosana and Picholine olive oils have intermediate contents (411.64 mg/kg and 316.59 mg/kg, respectively).
3.5 PHENOLIC COMPOUNDSThe olive fruit contains simple and complex phe-nolic compounds, many of which are transferred into the oil during olive oil processing, thus improv-ing its taste and increasing its oxidative stability. The analysis of phenolic compounds in VOOs was per-formed by high-performance liquid chromatography (HPLC-DAD) method. The HPLC profiles of the phe-nolic compound vary according to the olive variety. As shown in Figure 1 and Table IV, twelve phenolic com-pounds were identified, and significant differences between cultivars were observed. Phenolic fraction was divided into five main groups: phenolic alcohols, phenolic acids, lignans, secoiridoids derivatives and flavonoids. In all analyzed VOOs, secoiridoids deriva-
tives were the most abundant, followed by phenolic alcohols, flavonoids, lignans and phenolic acids. As shown in Table IV, the major secoiridoid deriva-tive compounds quantified were decarboxymethyl-ated from oleuropein aglycone (DOA) and decar-boxymethylated form ligstroside aglycone (DLA). As expected, Koroneiki‘s VOO shows the highest values of DOA and DLA, up to 146.72 and 165.56 mg/kg, respectively. Conversely, Picholine marocaine olive oil presents the lowest contents of DOA (26.35 mg/kg) and DLA (75.41 mg/kg). As far as the group of phe-nolic alcohols is concerned, hydroxytyrosol and ty-rosol were the only two compounds identified in all analyzed VOOs, and hydroxytyrosol contents ranged from 1.51 mg/kg in VOO of Picholine marocaine to 14.17 mg/kg in VOO of Koroneiki, respectively, while tyrosol contents ranged from 1.49 mg/kg in VOO of Arbequina to 8.04 mg/kg in VOO of Picholine maro-caine. In addition, and with the exception of the Pi-choline marocaine variety, tyrosol is present in lesser amounts than hydroxytyrosol in VOOs of European cultivars. This remarkable disparity is in accordance with previous data found in same European cultivars cultivated in Tunisia [12].Table IV shows also quantitative differences in pinoresinol, the highest content of which was ob-served in the Arbosana oil (7.08 mg/kg), whereas the lowest was observed for Picholine marocaine oil (2.93 mg/kg); VOOs of Arbequina and Koroneiki both have intermediate amounts of pinoresinol, with, 5.24 and 4.79 mg/kg, respectively. As regards flavonoids such as luteolin and apigenin, considerable amounts were found in the analyzed VOOs. Olive oils of the three European cultivars showed comparable pro-files for luteolin, their quantities ranging from 6.54 to 6.89 mg/kg. However, olive oil of Picholine marocaine showed the lowest flavonoids content, with 2.9 mg/kg for luteolin and 1.74 for apigenin. The major concen-tration of apigenin was detected in Arbosana olive oil (7.55 mg/kg).
Table IV - Phenolic compounds composition of the studied virgin olive oils produced in eastern Morocco
Values are the means of the four different VOO samples (n=3) ± standard deviations. Significant differences in the same row are shown by different letters (a-d) (p < 0.05). tr, traces.
Table V - Tocopherols composition of the studied virgin olive oils produced in eastern Morocco
Values are the means of the four different VOO samples (n=3) ± standard deviations. Significant differences in the same row are shown by different letters (a-d) (p < 0.05).
Table VI - Correlations (r 2) between oxidative stability of monovarietal virgin olive oils; their oleic/linoleic ratio (O/L), and their phenols and tocopherols contents.
PeakPhenolic compounds
(mg/kg)
Varieties
Introduced cultivars Autochthonous cultivar Arbequina Arbosana Koroneiki Picholine marocaine
1 Hydroxytyrosol 1.94±0.03 b 9.75±0.19c 14.17±0.16d 1.51±0.01a
2 Tyrosol 1.49±0.03a 4.66±0.08b 6.97±0.17c 8.04±0.04d 3 Vanillic acid 0.41±0.00c 0.25±0.00b 0.43±0.00c 0.15±0.02a 4 Syringic acid 0.37±0.02a 0.78±0.01b tr tr 5 Vanillin 0.22±0.00b 0.29±0.00c 0.18±0.03ab 0.17±0.01a 6 p-Coumaric acid 0.13±0.00c 0.07±0.00a 0.12±0.01b 0.14±0.00d 7 Decarboxymethyl oleuropein aglycone 85.37±1.43b 128.53±0.20c 146.72±1.79d 26.35±0.27a 8 Pinoresinol 5.24±0.09c 7.08±0.04d 4.79±0.07b 2.93±0.08a 9 Decarboxymethyl ligstroside aglycone 108.33±1.82b 157.16±0.50c 165.56±1.84d 75.41±1.39a 10 Cinamic acid 0.12±0.00a 0.17±0.02b 0.55±0.01d 0.44±0.01c 11 Luteolin 6.89±0.11b 6.71±0.03b 6.54±0.39b 2.9±0.15a 12 Apigenin 3.33±0.06b 7.55±0.05 3.55±0.05 1.74±0.09a
Tocopherols (mg/kg)
Varieties Introduced cultivars Autochthonous cultivar
Arbequina Arbosana Koroneiki Picholine marocaine α-Tocopherol 322.36±11.05b 460.07±12.38c 344.58±9.42b 243.42±5.55a
β-Tocopherol 1.83±0.16a 4.73±0.22c 4.79±0.19c 2.45±0.20b
γ-Tocopherol 2.1±0.54a 6.32±0.22b 8.69±0.82c 8.72±0.85c Total tocopherols 326.30±10.77b 471.13±12.29d 358.06±10.42c 254.13±6.13a
Oxidative stability Oleic acid/linoleic acid 0.918 Total phenols 0.915 Decarboxymethyl ligstroside aglycone 0.909 Decarboxymethyl oleuropein aglycone 0.893 Total tocopherols 0.515 α-Tocopherol 0.489
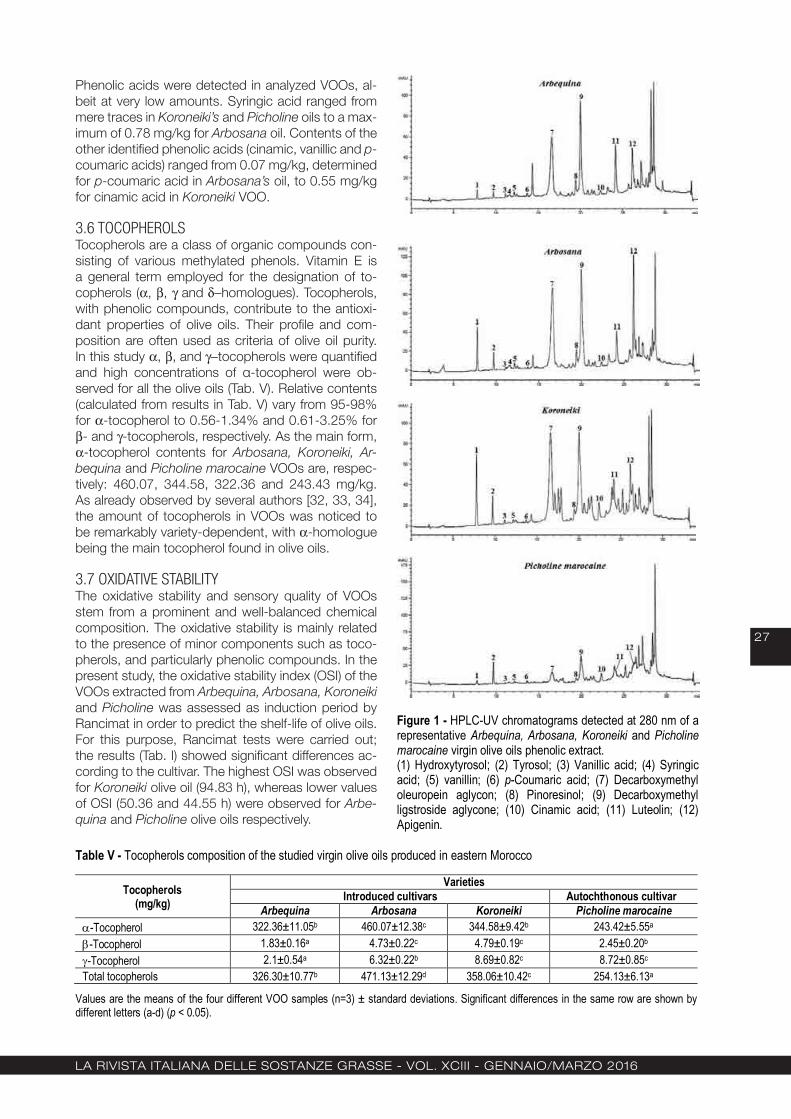
La rivista itaLiana deLLe sostanze grasse - voL. XCiii - gennaio/Marzo 2016
27
Phenolic acids were detected in analyzed VOOs, al-beit at very low amounts. Syringic acid ranged from mere traces in Koroneiki’s and Picholine oils to a max-imum of 0.78 mg/kg for Arbosana oil. Contents of the other identified phenolic acids (cinamic, vanillic and p-coumaric acids) ranged from 0.07 mg/kg, determined for p-coumaric acid in Arbosana’s oil, to 0.55 mg/kg for cinamic acid in Koroneiki VOO.
3.6 TOCOPHEROLSTocopherols are a class of organic compounds con-sisting of various methylated phenols. Vitamin E is a general term employed for the designation of to-copherols (α, β, γ and δ−homologues). Tocopherols, with phenolic compounds, contribute to the antioxi-dant properties of olive oils. Their profile and com-position are often used as criteria of olive oil purity. In this study α, β, and γ−tocopherols were quantified and high concentrations of α-tocopherol were ob-served for all the olive oils (Tab. V). Relative contents (calculated from results in Tab. V) vary from 95-98% for α-tocopherol to 0.56-1.34% and 0.61-3.25% for β- and γ-tocopherols, respectively. As the main form, α-tocopherol contents for Arbosana, Koroneiki, Ar-bequina and Picholine marocaine VOOs are, respec-tively: 460.07, 344.58, 322.36 and 243.43 mg/kg. As already observed by several authors [32, 33, 34], the amount of tocopherols in VOOs was noticed to be remarkably variety-dependent, with α-homologue being the main tocopherol found in olive oils.
3.7 OXIDATIVE STABILITYThe oxidative stability and sensory quality of VOOs stem from a prominent and well-balanced chemical composition. The oxidative stability is mainly related to the presence of minor components such as toco-pherols, and particularly phenolic compounds. In the present study, the oxidative stability index (OSI) of the VOOs extracted from Arbequina, Arbosana, Koroneiki and Picholine was assessed as induction period by Rancimat in order to predict the shelf-life of olive oils. For this purpose, Rancimat tests were carried out; the results (Tab. I) showed significant differences ac-cording to the cultivar. The highest OSI was observed for Koroneiki olive oil (94.83 h), whereas lower values of OSI (50.36 and 44.55 h) were observed for Arbe-quina and Picholine olive oils respectively.
Figure 1 - HPLC-UV chromatograms detected at 280 nm of a representative Arbequina, Arbosana, Koroneiki and Picholine marocaine virgin olive oils phenolic extract. (1) Hydroxytyrosol; (2) Tyrosol; (3) Vanillic acid; (4) Syringic acid; (5) vanillin; (6) p-Coumaric acid; (7) Decarboxymethyl oleuropein aglycon; (8) Pinoresinol; (9) Decarboxymethyl ligstroside aglycone; (10) Cinamic acid; (11) Luteolin; (12) Apigenin.
Table IV - Phenolic compounds composition of the studied virgin olive oils produced in eastern Morocco
Values are the means of the four different VOO samples (n=3) ± standard deviations. Significant differences in the same row are shown by different letters (a-d) (p < 0.05). tr, traces.
Table V - Tocopherols composition of the studied virgin olive oils produced in eastern Morocco
Values are the means of the four different VOO samples (n=3) ± standard deviations. Significant differences in the same row are shown by different letters (a-d) (p < 0.05).
Table VI - Correlations (r 2) between oxidative stability of monovarietal virgin olive oils; their oleic/linoleic ratio (O/L), and their phenols and tocopherols contents.
PeakPhenolic compounds
(mg/kg)
Varieties
Introduced cultivars Autochthonous cultivar Arbequina Arbosana Koroneiki Picholine marocaine
1 Hydroxytyrosol 1.94±0.03 b 9.75±0.19c 14.17±0.16d 1.51±0.01a
2 Tyrosol 1.49±0.03a 4.66±0.08b 6.97±0.17c 8.04±0.04d 3 Vanillic acid 0.41±0.00c 0.25±0.00b 0.43±0.00c 0.15±0.02a 4 Syringic acid 0.37±0.02a 0.78±0.01b tr tr 5 Vanillin 0.22±0.00b 0.29±0.00c 0.18±0.03ab 0.17±0.01a 6 p-Coumaric acid 0.13±0.00c 0.07±0.00a 0.12±0.01b 0.14±0.00d 7 Decarboxymethyl oleuropein aglycone 85.37±1.43b 128.53±0.20c 146.72±1.79d 26.35±0.27a 8 Pinoresinol 5.24±0.09c 7.08±0.04d 4.79±0.07b 2.93±0.08a 9 Decarboxymethyl ligstroside aglycone 108.33±1.82b 157.16±0.50c 165.56±1.84d 75.41±1.39a 10 Cinamic acid 0.12±0.00a 0.17±0.02b 0.55±0.01d 0.44±0.01c 11 Luteolin 6.89±0.11b 6.71±0.03b 6.54±0.39b 2.9±0.15a 12 Apigenin 3.33±0.06b 7.55±0.05 3.55±0.05 1.74±0.09a
Tocopherols (mg/kg)
Varieties Introduced cultivars Autochthonous cultivar
Arbequina Arbosana Koroneiki Picholine marocaine α-Tocopherol 322.36±11.05b 460.07±12.38c 344.58±9.42b 243.42±5.55a
β-Tocopherol 1.83±0.16a 4.73±0.22c 4.79±0.19c 2.45±0.20b
γ-Tocopherol 2.1±0.54a 6.32±0.22b 8.69±0.82c 8.72±0.85c Total tocopherols 326.30±10.77b 471.13±12.29d 358.06±10.42c 254.13±6.13a
Oxidative stability Oleic acid/linoleic acid 0.918 Total phenols 0.915 Decarboxymethyl ligstroside aglycone 0.909 Decarboxymethyl oleuropein aglycone 0.893 Total tocopherols 0.515 α-Tocopherol 0.489
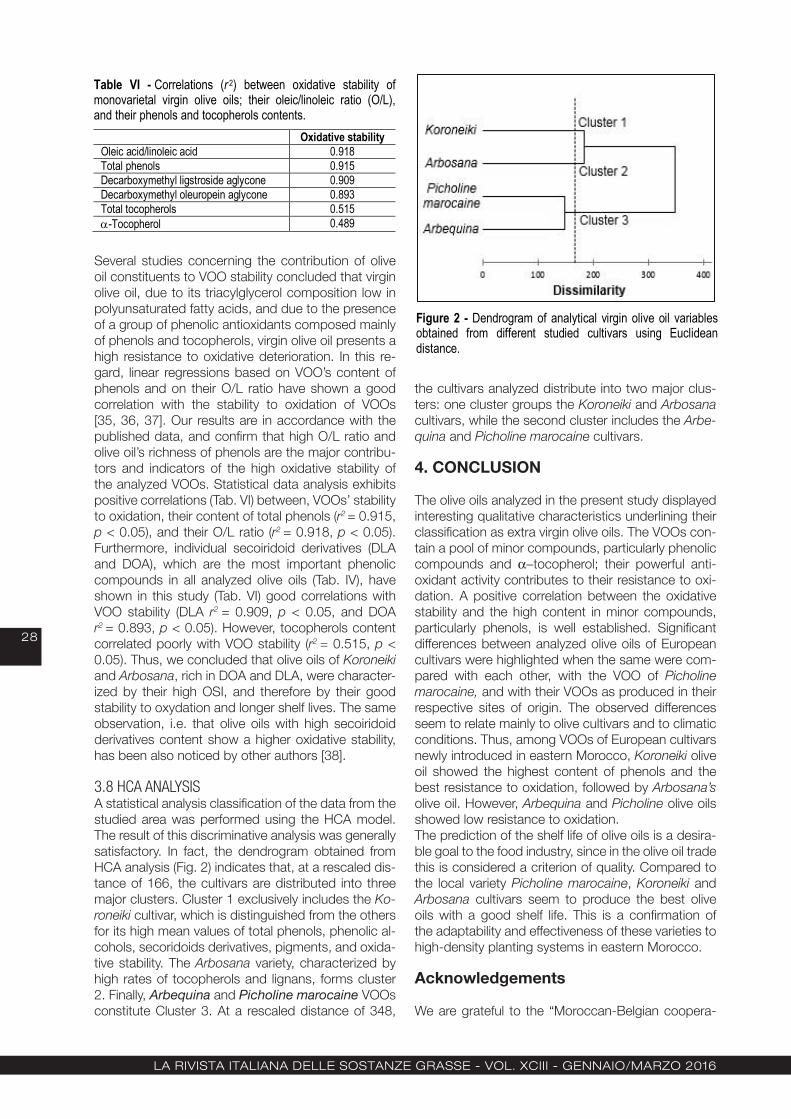
La rivista itaLiana deLLe sostanze grasse - voL. XCiii - gennaio/Marzo 2016
28
Several studies concerning the contribution of olive oil constituents to VOO stability concluded that virgin olive oil, due to its triacylglycerol composition low in polyunsaturated fatty acids, and due to the presence of a group of phenolic antioxidants composed mainly of phenols and tocopherols, virgin olive oil presents a high resistance to oxidative deterioration. In this re-gard, linear regressions based on VOO’s content of phenols and on their O/L ratio have shown a good correlation with the stability to oxidation of VOOs [35, 36, 37]. Our results are in accordance with the published data, and confirm that high O/L ratio and olive oil’s richness of phenols are the major contribu-tors and indicators of the high oxidative stability of the analyzed VOOs. Statistical data analysis exhibits positive correlations (Tab. VI) between, VOOs’ stability to oxidation, their content of total phenols (r2 = 0.915, p < 0.05), and their O/L ratio (r2 = 0.918, p < 0.05). Furthermore, individual secoiridoid derivatives (DLA and DOA), which are the most important phenolic compounds in all analyzed olive oils (Tab. IV), have shown in this study (Tab. VI) good correlations with VOO stability (DLA r2 = 0.909, p < 0.05, and DOA r2 = 0.893, p < 0.05). However, tocopherols content correlated poorly with VOO stability (r2 = 0.515, p < 0.05). Thus, we concluded that olive oils of Koroneiki and Arbosana, rich in DOA and DLA, were character-ized by their high OSI, and therefore by their good stability to oxydation and longer shelf lives. The same observation, i.e. that olive oils with high secoiridoid derivatives content show a higher oxidative stability, has been also noticed by other authors [38].
3.8 HCA ANALYSIS A statistical analysis classification of the data from the studied area was performed using the HCA model. The result of this discriminative analysis was generally satisfactory. In fact, the dendrogram obtained from HCA analysis (Fig. 2) indicates that, at a rescaled dis-tance of 166, the cultivars are distributed into three major clusters. Cluster 1 exclusively includes the Ko-roneiki cultivar, which is distinguished from the others for its high mean values of total phenols, phenolic al-cohols, secoridoids derivatives, pigments, and oxida-tive stability. The Arbosana variety, characterized by high rates of tocopherols and lignans, forms cluster 2. Finally, Arbequina and Picholine marocaine VOOs constitute Cluster 3. At a rescaled distance of 348,
the cultivars analyzed distribute into two major clus-ters: one cluster groups the Koroneiki and Arbosana cultivars, while the second cluster includes the Arbe-quina and Picholine marocaine cultivars.
4. CONCLUSION
The olive oils analyzed in the present study displayed interesting qualitative characteristics underlining their classification as extra virgin olive oils. The VOOs con-tain a pool of minor compounds, particularly phenolic compounds and α−tocopherol; their powerful anti-oxidant activity contributes to their resistance to oxi-dation. A positive correlation between the oxidative stability and the high content in minor compounds, particularly phenols, is well established. Significant differences between analyzed olive oils of European cultivars were highlighted when the same were com-pared with each other, with the VOO of Picholine marocaine, and with their VOOs as produced in their respective sites of origin. The observed differences seem to relate mainly to olive cultivars and to climatic conditions. Thus, among VOOs of European cultivars newly introduced in eastern Morocco, Koroneiki olive oil showed the highest content of phenols and the best resistance to oxidation, followed by Arbosana’s olive oil. However, Arbequina and Picholine olive oils showed low resistance to oxidation.The prediction of the shelf life of olive oils is a desira-ble goal to the food industry, since in the olive oil trade this is considered a criterion of quality. Compared to the local variety Picholine marocaine, Koroneiki and Arbosana cultivars seem to produce the best olive oils with a good shelf life. This is a confirmation of the adaptability and effectiveness of these varieties to high-density planting systems in eastern Morocco.
Acknowledgements
We are grateful to the “Moroccan-Belgian coopera-
Table IV - Phenolic compounds composition of the studied virgin olive oils produced in eastern Morocco
Values are the means of the four different VOO samples (n=3) ± standard deviations. Significant differences in the same row are shown by different letters (a-d) (p < 0.05). tr, traces.
Table V - Tocopherols composition of the studied virgin olive oils produced in eastern Morocco
Values are the means of the four different VOO samples (n=3) ± standard deviations. Significant differences in the same row are shown by different letters (a-d) (p < 0.05).
Table VI - Correlations (r 2) between oxidative stability of monovarietal virgin olive oils; their oleic/linoleic ratio (O/L), and their phenols and tocopherols contents.
PeakPhenolic compounds
(mg/kg)
Varieties
Introduced cultivars Autochthonous cultivar Arbequina Arbosana Koroneiki Picholine marocaine
1 Hydroxytyrosol 1.94±0.03 b 9.75±0.19c 14.17±0.16d 1.51±0.01a
2 Tyrosol 1.49±0.03a 4.66±0.08b 6.97±0.17c 8.04±0.04d 3 Vanillic acid 0.41±0.00c 0.25±0.00b 0.43±0.00c 0.15±0.02a 4 Syringic acid 0.37±0.02a 0.78±0.01b tr tr 5 Vanillin 0.22±0.00b 0.29±0.00c 0.18±0.03ab 0.17±0.01a 6 p-Coumaric acid 0.13±0.00c 0.07±0.00a 0.12±0.01b 0.14±0.00d 7 Decarboxymethyl oleuropein aglycone 85.37±1.43b 128.53±0.20c 146.72±1.79d 26.35±0.27a 8 Pinoresinol 5.24±0.09c 7.08±0.04d 4.79±0.07b 2.93±0.08a 9 Decarboxymethyl ligstroside aglycone 108.33±1.82b 157.16±0.50c 165.56±1.84d 75.41±1.39a 10 Cinamic acid 0.12±0.00a 0.17±0.02b 0.55±0.01d 0.44±0.01c 11 Luteolin 6.89±0.11b 6.71±0.03b 6.54±0.39b 2.9±0.15a 12 Apigenin 3.33±0.06b 7.55±0.05 3.55±0.05 1.74±0.09a
Tocopherols (mg/kg)
Varieties Introduced cultivars Autochthonous cultivar
Arbequina Arbosana Koroneiki Picholine marocaine α-Tocopherol 322.36±11.05b 460.07±12.38c 344.58±9.42b 243.42±5.55a
β-Tocopherol 1.83±0.16a 4.73±0.22c 4.79±0.19c 2.45±0.20b
γ-Tocopherol 2.1±0.54a 6.32±0.22b 8.69±0.82c 8.72±0.85c Total tocopherols 326.30±10.77b 471.13±12.29d 358.06±10.42c 254.13±6.13a
Oxidative stability Oleic acid/linoleic acid 0.918 Total phenols 0.915 Decarboxymethyl ligstroside aglycone 0.909 Decarboxymethyl oleuropein aglycone 0.893 Total tocopherols 0.515 α-Tocopherol 0.489
Figure 2 - Dendrogram of analytical virgin olive oil variables obtained from different studied cultivars using Euclidean distance.
La rivista itaLiana deLLe sostanze grasse - voL. XCiii - gennaio/Marzo 2016
29
tion program” for the financial support given to this re-search through the “WBI-Projet 2/9, 2012-2014”. We also wish to thank the company “Huiles d’olive de la Méditerranée” for its collaboration, and Mr. Stephen Chmelewski for the time spent in reviewing this pa-per.
REFERENCES
[1] L. Ferrara, Clinical effects of virgin olive oil poly-phenols: between myth and reality, Nutr. Metab. Cardiovas. 10(3), 109 (2000).
[2] J. Elloumi, R. Ben-Ayed, S. Aifa, An overview of olive oil biomolecules, Curr Biotechnol 1(2), 115-124 (2012).
[3] R. Ben‐Ayed, N. Kamoun‐Grati, A. Rebai, An overview of the authentication of olive tree and oil, Compr. Rev. Food Sci. F. 12(2), 218-227 (2013).
[4] F. Visioli, G. Bellomo, C. Galli, Free radical-sca-venging properties of olive oil polyphenols, Bio-chem. Biophys. Res. Commun. 247(1), 60-64 (1998).
[5] F. Visioli, P. Bogani, S. Grande, C. Galli, Olive oil and oxidative stress, Grasas y Aceites 55(1), 66-75 (2004).
[6] O. Baccouri, M. Guerfel, B. Baccouri, L. Cerreta-ni, A. Bendini, G. Lercker, M. Zarrouk, D. Daoud Ben Miled, Chemical composition and oxidative stability of Tunisian monovarietal virgin olive oils with regard to fruit ripening, Food Chem. 109(4), 743-754 (2008).
[7] A. Bendini, L. Cerretani, A. Carrasco-Pancorbo, A.M. Gómez-Caravaca, A. Segura-Carretero, A. Fernández-Gutiérrez, G. Lercker, Phenolic molecules in virgin olive oils: a survey of their sensory properties, health effects, antioxidant activity and analytical methods. An overview of the last decade Alessandra, Molecules 12(8), 1679-1719 (2007).
[8] A. Carrasco-Pancorbo, L. Cerretani, A. Bendini, A. Segura-Carretero, M. Del Carlo, T. Gallina-Toschi, G. Lercker, D. Compagnone, A. Fernan-dez-Gutierrez, Evaluation of the antioxidant ca-pacity of individual phenolic compounds in virgin olive oil, J. Agric. Food. Chem. 53(23), 8918-8925 (2005).
[9] L. S. Artajo, M. P. Romero, M. Suárez, M. J. Mo-tilva, Partition of phenolic compounds during the virgin olive oil industrial extraction process, Eur. Food Res. Technol. 225(5-6), 617-625 (2007).
[10] J. Botia, A. Ortuno, O. Benavente-Garcia, A. Baidez, J. Frias, D. Marcos, J. Del Río, Mo-dulation of the Biosynthesis of Some Phenolic Compounds in Olea e uropaea L. Fruits: Their Influence on Olive Oil Quality, J. Agric. Food. Chem. 49(1), 355-358 (2001).
[11] D. Tura, C. Gigliotti, S. Pedò, O. Failla, D. Bassi, A. Serraiocco, Influence of cultivar and site of
cultivation on levels of lipophilic and hydrophilic antioxidants in virgin olive oils ( Olea Europea L.) and correlations with oxidative stability, Sci. Hor-tic. 112(1), 108-119 (2007).
[12] A. Allalout, D. Krichène, K. Methenni, A. Taa-malli, I. Oueslati, D. Daoud, M. Zarrouk, Charac-terization of virgin olive oil from super intensive Spanish and Greek varieties grown in northern Tunisia, Sci. Hortic. 120(1), 77-83 (2009).
[13] J. Lozano-Sanchez, L. Cerretani, A. Bendini, A. Segura-Carretero, A. Fernández-Gutiérrez, Filtration process of extra virgin olive oil: effect on minor components, oxidative stability and sensorial and physicochemical characteristics, Trends Food Sci. Tech. 21(4), 201-211 (2010).
[14] M. Patumi, R. d’Andria, V. Marsilio, G. Fontanaz-za, G. Morelli, B. Lanza, Olive and olive oil quali-ty after intensive monocone olive growing (Olea europaea L., cv. Kalamata) in different irrigation regimes, Food Chem. 77(1), 27-34 (2002).
[15] A. Lazzez, E. Perri, M.A. Caravita, M. Khlif, M. Cossentini, Influence of olive maturity stage and geographical origin on some minor components in virgin olive oil of the Chemlali variety, J. Agric. Food. Chem. 56(3), 982-988 (2008).
[16] A. Mahhou, Z. Taiebi, A. Hadiddou, A. Ouka-bli, and A. Mamouni, Performance et qualité de production des variétés d’olivier Arbéquine, Koroneiki et Picholine marocaine conduites en irrigué dans la région de Settat (Maroc), Olivae 116, 44-59 (2011).
[17] A. Ait-Hmida, Rentabilité de l’olivier en modes de production intensif et super-intensif dans le Ha-ouz au Maroc, New Medit 9(1), 31-34 (2010).
[18] European Union Commission Regulation, On the characteristics of olive and olive pomace oils and their analytical methods, EEC/2568/91, Of-fic. J. Eur. Commun. L248, 1-112 (1991).
[19] M.I. Minguez-Mosquera, L. Rejano-Navarro, B. Gandul-Rojas, A.H. Sanchez Gomez, J. Garri-do-Fernandez, Color-pigment correlation in vir-gin olive oil, J. Am. Oil Chem. Soc. 68(5), 332-336 (1991).
[20] D. Ollivier, E. Boubault, C. Pinatel, S. Souillol, M. Guérère, J. Artaud. Analyse de la fraction phé-nolique des huiles d’olive vierges, J. in Annales des falsifications de l’expertise chimique et toxi-cologique (2004).
[21] A. Bakhouche, J. Lozano-Sánchez, R. Bel-trán-Debón, J. Joven, A. Segura-Carretero, A. Fernández-Gutiérrez, Phenolic characterization and geographical classification of commercial Arbequina extra-virgin olive oils produced in southern Catalonia, Food Res. Int. 50(1), 401-408 (2013).
[22] R. Mateos, J.L. Espartero, M. Trujillo, J. Rios, M. León-Camacho, F. Alcudia, A. Cert, Deter-mination of phenols, flavones, and lignans in virgin olive oils by solid-phase extraction and
La rivista itaLiana deLLe sostanze grasse - voL. XCiii - gennaio/Marzo 2016
30
high-performance liquid chromatography with diode array ultraviolet detection, J. Agric. Food. Chem. 49(5), 2185-2192 (2001).
[23] AOCS, Determination of tocopherols and toco-trienols in vegetable oils and fats by HPLC, Of-fic. Method (Ce 8–89) (1989).
[24] COI/T. 15/NC nº 3/Rév. 7, Norme commercia-le applicable aux huiles d’olive et aux huiles de grignons d’olive, International Olive Oil Council (2013).
[25] M. Salvador, F. Aranda, S. Gómez-Alonso, G. Fregapane, Cornicabra virgin olive oil: a study of five crop seasons. Composition, quality and oxidative stability, Food Chem. 74(3), 267-274 (2001).
[26] European Union Commission Regulation, Cha-racteristics of olive and olive-pomace oils and on their analytical methods. Modify at Regulation EEC/1989/03, Offic. J. Eur. Commun. L295(13), 57-77 (2003).
[27] M.P. Aguilera, G. Beltrán, D. Ortega, A. Fernán-dez, A. Jiménez, M. Uceda, Characterisation of virgin olive oil of Italian olive cultivars: Fran-toio’andLeccino’, grown in Andalusia, Food Chem. 89(3), 387-391 (2005).
[28] J. Hermoso, A. Ninot, A. Romero, J. Tous, Me-diterranean clonal selections evaluated for mo-dern hedgerow olive oil production in Spain, Ca-lif. Agr. 65(1), 34-40 (2011).
[29] R. Aparicio, G. Luna, Characterisation of mono-varietal virgin olive oils, Eur. J. Lipid Sci. Technol 104, 614-627 (2002).
[30] J.R. Morelló, M. J. Motilva, M. J. Tovar, M. P. Ro-mero, Changes in commercial virgin olive oil (cv Arbequina) during storage, with special empha-sis on the phenolic fraction, Food Chem. 85(3),
357-364 (2004).[31] E. Psomiadou, M. Tsimidou, Pigments in Greek
virgin olive oils: occurrence and levels, J. Sci. Food Agric. 81(7), 640-647 (2001).
[32] M. Baldioli, M. Servili, G. Perretti, G. Montedoro, Antioxidant activity of tocopherols and pheno-lic compounds of virgin olive oil, Journal of the American Oil Chemists’ Society 73(11), 1589-1593 (1996).
[33] E. Psomiadou, M. Tsimidou, D. Boskou, α-Tocopherol content of Greek virgin olive oils, J. Agric. Food. Chem. 48(5), 1770-1775 (2000).
[34] M. Deiana, A. Rosa, C.F. Cao, F.M. Pirisi, G. Bandino, M.A. Dessi, Novel approach to study oxidative stability of extra virgin olive oils: impor-tance of α-tocopherol concentration, J. Agric. Food. Chem. 50(15), 4342-4346 (2002).
[35] R. Aparicio, L. Roda, M.A. Albi, F. Gutiérrez, Effect of various compounds on virgin olive oil stability measured by Rancimat, J. Agric. Food. Chem. 47(10), 4150-4155 (1999).
[36] J. Velasco, C. Dobarganes, Oxidative stabili-ty of virgin olive oil, Eur. J. Lipid Sci. Technol. 104(9‐10), 661-676 (2002).
[37] F.M. Haddada, D. Krichène, H. Manai, I. Ouesla-ti, D. Daoud, M. Zarrouk, Analytical evaluation of six monovarietal virgin olive oils from Northern Tunisia, Eur. J. Lipid Sci. Technol. 110(10), 905-913 (2008).
[38] N. Mulinacci, C. Giaccherini, M. Innocenti, A. Ro-mani, F.F. Vincieri, F. Marotta, A. Mattei, Analysis of extra virgin olive oils from stoned olives, J. Sci. Food Agric. 85(4), 662-670 (2005).
Received February 11, 2015Accepted May 5, 2015

La rivista itaLiana deLLe sostanze grasse - voL. XCiii - gennaio/Marzo 2016
31
K.B. Daoued3
M. Chouaibi1, 2*
N. Gaout2
O. Bel Haj3
S. Hamdi2
1 Dipartimento di Ingegneria chimicae Alimentare - Salerno Italy
2 Food Preservation LaboratoryHigh Institute of Food Industry
Elkhadra City - Tunis Tunisia
3 Tunis El Manar UniversityCollege of Science
Biochemistry DepartmentTunis - Tunisia
(*) CORRESPONDING AUTHORDipartimento di Ingegneria chimica e
AlimentareVia Ponte Don Melillo
84084 Salerno ItalyTel: +21671770399Fax +21671771192
E-mail address: [email protected]
Chemical composition and antioxidant activities of cold pressed lentisc
(Pistacia lentiscus l.) seed oil
Fruits of Pistacia lentiscus L. were analysed for their main chemical composition and antioxidant activities. Fourteen fatty acids, with oleic acid accounting for 50.39% of the total fatty acids, followed by palmitic and linoleic acids, accounting for 26.19 and 18.74% respectively of the total fatty acids, were identified. The total sterols content was estimated to be 385.56 mg/100 g oil. β-sitosterol accounted for 82.80% of the total sterols. Other representative sterols were sitostanol, campesterol, and stigmasterol, which accounted for 22.55, 20.47 and 7.14 mg/100 g oil, respectively.δ-tocopherol was the predominant tocol at 111.07 mg/100 g seed oil. This was equivalent to 61.08% of the total tocols followed by α-tocopherol and δ-tocotorienol (37.38 and 16.12 mg/100 g oil, respectively). Seven phenolic acids (protocatechuic, caffeic, syringic, gallic, p-coumaric, p-hydroxybenzoic and ferulic acids) were detected, the caffeic acid being the predominant one (9.71 mg/100 g oil).The antioxidant activity of seed oil was assessed by means of 2,2-diphenyl-1-picrylhydrazyl (DPPH) radical-scavenging assay and β-carotene bleaching test. Both methods demonstrated a notable antioxidant activity of seed oil, one that is nearly comparable to the references ascorbic acid and butylated hydroxytoluene (BHT). Keywords: Pistacia lentiscus L., fatty acid composition, tocols, sterols, phenolic acids, antioxidant activity.
Composizione chimica e attività antiossidante dell’olio di semi di lentisco pressato a freddo (Pistacia lentiscus L.) I frutti di Pistacia lentiscus L. sono stati analizzati per la loro composizione chimica principale e per le loro attività antiossidanti.Sono stati identificati quattordici acidi grassi di cui l’acido oleico pari al 50,39% degli acidi grassi totali, seguito da acido palmitico e linoleico, pari al 26,19 e 18,74% rispettivamente. Il contenuto totale di steroli è stato stimato essere pari a 385,56 mg/100 g di olio. Il β-sitosterolo era rappresentato per l’82,80% degli steroli totali. Altri steroli quali il sitostanolo, il campesterolo e lo stigmasterolo, rappresentavano il 22,55, 20,47 e 7,14 mg/100 g di olio, rispettivamente.Il δ-tocoferolo era il tocoferolo predominante dell’olio di semi, pari al 111,07 mg/100 g. Questo dato era pari al 61,08% dei tocoferoli totali seguiti da α-tocoferolo e δ-tocotrienolo (37,38 e 16,12 mg/100 g di olio, rispettivamente). Sono stati rilevati sette acidi fenolici (protocatetico, caffeico, siringico, gallico, p-cumarico, p-idrossibenzoico e acido ferulico): l’acido caffeico era il predominante (9,71 mg/100 g olio). L’attività antiossidante dell’olio di semi è stata valutata mediante il test del 2,2-difenil-1-picrylhydrazyl (DPPH) radical-scavenging e del β-carotene. Entrambi i metodi hanno dimostrato notevole attività antiossidante dell’olio di semi, quasi paragonabile a quella dell’acido ascorbico e dell’idrossitoluene butilato (BHT).Parole chiave: Pistacia lentiscus L., composizione in acidi grassi, tocoferoli, steroli, acidi fenolici, attività antiossidante.
La rivista itaLiana deLLe sostanze grasse - voL. XCiii - gennaio/Marzo 2016
32
INTRODUCTION
Pistacia lentiscus L. is an evergreen member of the Anacardiaceae family, largely distributed in “extreme” ecosystems of Mediterranean basin characterized by a scarcity of nutrients and water and which are expo-sed to long periods of high solar radiation, reaching high temperatures [1]. The essential oil of Pistacia len-tiscus L. was obtained by hydrodistillation of fruits or from trunk exudates called mastic gum [2]. This es-sential oil has been proven to exhibit antioxidant, anti-inflammatory, antimicrobial [3], antifungal, [4] and an-tiatherogenic activities [5]. The fruits give edible oil that is used in the treatment of scabies, rheumatism and in the manufacture of antidiarrhoea pills [6]. A num-ber of authors has carried out studies of the chemical composition of seed oil [7-9]. These authors, showed that the said oil has good nutritional quality because of its content in unsaturated and saturated fatty acids. They also showed that the Pistacia lentiscus seed oil was characterized by β-sitosterol, which accounted for 6.65% w/w of oil. However, so far no study con-cerning the tocopherol, phenolic acid composition as well as their antioxidant activities has been publishedThe purpose of this study is therefore to investigate some aspects of the chemical composition as well as antioxidant activities of Pistacia lentiscus seed oil with a view to their potential use in cosmetic, pharma-ceutical, and food industries. The data obtained from this study will contribute to better valorize the seed oil extracted from this species within the food industry, and also to confirm product authenticity.
2. MATERIAL AND METHODS
2.1. SEEDSFruits of Pistacia lentiscus L. samples were collected from December 2013 in Jendouba, situated in the north of Tunisia. After botanical identification by the Food Preservation Laboratory at the High Institute of Food Industry (Tunis, Tunisia), they were immediately air-dried. Seeds were stored in the dark at -20°C in bags and under nitrogen atmosphere, until assays were performed.All chemicals and solvents used were analytical grade (Merck and Baker). Fatty acid methyl esters (FAME), tocopherols and sterols standards were purchased from Sigma-Aldrich (St. Louis, MO, USA).
2.2. LIPID EXTRACTIONThe seeds of Pistacia lentiscus were pressed at room temperature (20°C) with a cold-pressing machine (CA59G, German Monforts Group, Moenchenglad-bach, Germany), and the cold-pressed seed oils were centrifuged (Avanti J-26 XP, Beckman Coulter Inc., Brea, CA, USA) at 3000 g for 5 min. Seed oils were stored in the dark at -20°C in bags under nitrogen atmosphere, until assays were performed. Total lipid extraction was made in triplicate.
2.3. FATTY ACID ANALYSISFatty acid composition was determined as fatty acid methyl esters (FAME). The samples (0.05 g) were weighed and dissolved in 1 mL of hexane. To the mix-tures was added a sodium methoxide solution (0.2 mL of CH3ONa 2 M in anhydrous methanol) which was then mixed for 1 min using a vortex mixer. After sedimentation of sodium glycerolate, 1 μL of the clear supernatant was injected (Perkin Elmer Wallac Auto System XL autoinjector, San Jose, CA, USA) into a Supelco, Sp™ 2340 fused silica capillary column (60 m × 0.25 mm, 0.20 μm film thickness; Supelco, Inc., Bellefonte, PA, USA) and analyzed using a Perkin El-mer Auto System XL gas chromatograph equipped with a flame ionization detector (Perkin Elmer Cor-poration, Norwalk, CT, USA). Injection temperature was 250°C. The oven temperature was programmed as follows: heat from 130 to 170°C (20°C/min), heat from 170 to 230°C (10°C/min), hold at 230°C for 10 min, heat from 230 to 250°C (30°C/min) and hold for 1 min at 250°C. The carrier gas (nitrogen) flow rate was 50 ml/min. The FAME peaks were identified by comparison with the retention times of a standard mixture. The peak areas were computed, and the percentages of the FAME were obtained as area per-centages by direct normalization method.
2.4. TRIACYLGLYCEROL ANALYSISTriacylglycerol (TAG) profile was obtained by high-performance liquid chromatography (HPLC) (Agilent 1100, Santa Clara, CA, USA), equipped with an auto-injector and refractive index detector. The triacylglyc-erols were separated using a RP-18 column (250 × 4 mm) with a particle size of 5 μm and eluted from the column with a mixture of acetonitrile/acetone (25:75) at a flow rate of 1 ml/min. Twenty microlitres of the mixture (0.05 g of oil diluted in 1 mL of choloroform/ acetone (50/50 (v/v)) were injected into the HPLC col-umn; the total run time was 1 h. Triacylglycerol peaks observed in the HPLC chromatograph were identified by comparison with the retention times of standard TAG peaks and with the retention times observed in the chromatographs of other vegetable oils (olive, sunflower, soybean and corn oils), analyzed under similar analytical conditions, as previously described by Nehdi et al. [10].
2.5. TOCOPHEROLS ANALYSISTocopherols were analyzed by a high performance liq-uid chromatography system (Hewlett-Packard, series 1100, Santa Clara, CA, USA), equipped with a model 168 UV detector (Beckman Coulter, Inc., Fullerton, CA, USA) at a wavelength of 292 nm, according to the AOCS Method [11]. The column was a Lichrosorb Si60 (Merck, Darmstadt, Germany) with a 7 μm silica particle size. About 2 g of Pistacia lentiscus seed oil were dissolved in 10 mL of hexane. A 15 μL of the mixture was injected and the flow rate of mobile phase (1% 2-propanol/hexane) was set at 0.65 mL/
La rivista itaLiana deLLe sostanze grasse - voL. XCiii - gennaio/Marzo 2016
33
min. The identification of peaks of tocols was based on the retention time of standards.
2.6. STEROLS ANALYSISSterol separation was performed according to the NF EN ISO 12228 method [12]. Pistacia lentiscus seed oil (250 mg) was refluxed for 15 min with 5 mL of ethanolic KOH solution (3%, w/v) after adding 1 mg of FLUKA cholesterol as an internal standard and a few antibumping granules. The mixture was immediately diluted with 5 ml of ethanol. The unsaponifiable part was eluted over a glass column packed with a slurry of aluminium oxide (Scharlau) in ethanol (1:2, w/v) with 5 mL of ethanol and 30 ml of diethyl ether at a flow rate of 2 mL/min. The extract was evaporated in a rotary evaporator at 40°C under reduced pressure; subsequently, ether was completely evaporated un-der a nitrogen stream. For the characterization of ste-rols, a FLUKA silica gel F254 plate was developed in the solvent system n-hexane/diethyl ether (1:1, v/v). Similarly, for the detection of sterols, the thin-layer plate was sprayed with methanol (revelation reagent); the sterol bands were scraped from the plate and re-covered by extraction with diethyl ether. The trimeth-ylsilyl ether sterols (TMS) derivatives were prepared by adding 100 µL of a silylant reagent N-methyl-N-(trimethylsilyl) trifluoroacetamide/pyridine (1:10, v/v) in a capped glass vial and heated at 105°C for 15 min.A mixture of standard solutions of sterols was pre-pared by derivatisation (cholesterol, sitosterol, stig-masterol, ergosterol and campesterol). The trimethyl-silyl ether sterols derivatives were analysed using the GC system (Agilent 6890 N, CA, USA) equipped with a FID and the GC Chemstation software. An HP-5 (5% pheynyl methyl polysiloxane column) was used (0.32 mm i.d. × 30 m inlength; 0.25 µm film thickness, CA, USA). The carrier gas (helium) flow was 1.99 ml/min (split-splitness) injection with a split ratio of 1:200. Both the detector and the injector were set at 320°C, and the injected volume was of 1 µL. The total analy-ses were set at 71 min to ensure the elution of all sterols. The operational conditions were as follows: injector temperature at 320°C; column temperature: a gradient of 4°C/min from 240°C to 255°C. Sterols peak identification was carried out according to the “Norme Française” NF EN ISO 12228 method12 and confirmed by GC-MS NIST database whilst operating under similar conditions as to that of the GC-FID.
2.7. PHENOLIC COMPOUNDS
2.7.1. Total phenolic (TP) and total flavonoid (TF) contentFor total phenolic (TP) and total flavonoid (TF) con-tents, a solution of 10 mL MeOH containing a pre-cisely weighed amount (aprox. 1 mg/mL) of each ex-tract or fraction was used. The TFs in the samples was determined as previously reported [13]. Quer-cetin was used as a reference for the calibration
curve. The absorbance of the reaction mixture was measured at 415 nm. Results were expressed as mg quercetin equivalents per 100 g oil. Data are reported as mean ± SD for at least three replications. The TPs were determined by the Folin and Ciocalteu’s reagent method [14]. Briefly, the appropriate extract dilution was oxidized with the Folin-Ciocalteu reagent, and the reaction was neutralized with sodium carbon-ate. The absorbance of the resulting blue color was measured at 700 nm after 30 min using a Hekios UV/vis spectrophotometer (RV-3.06, Unicam, Germany). The calibration curve was performed with gallic acid, and the results were expressed as mg of gallic acid equivalents per 100 g of oil.
2.7.2. Phenolic acidsThe phenolic acids were isolated from the Pistacia lentiscus seed oil using the liquid-liquid extraction method reported by Owen et al. [15]. The phenolic acids were analyzed by reversed phase-HPLC-DAD on a C18 μ-Bondapak column (3.9 × 300 mm, 10 μm, Waters, Milford, MA, USA). The flow rate was 0.85 ml min-1 and the column was thermostatically controlled at 30°C. The wavelengths were set at 240, 278, and 320 nm. The mobile phases A and B were water with TFA 0.1% and acetonitrile, respectively. The chromatographic method consisted of a linear gradient: 0 min, 100% A; 2 min, 95% A; 10 min, 75% A; 10-20 min, 60% A; 20-30 min, 50% A; 30-40 min 100% B. The injection volume was 20 μL and run time was 30 min. The identification of all the phenolic acids was made possible through the co-injection of the corresponding commercial standards (Extrasyn-these, Genay Cedex, France) injected in the same experimental condition used for the analysis.
2.8. ANTIOXIDANT ACTIVITIES
2.8.1. DPPH radical scavenging assayThe scavenging activity of the Pistacia lentiscus seed oil towards DPPH radical was determined according to the method of Amarowicz et al. [16]. In short, 0.1 ml seed oil was mixed with 2.2 ml of 0.004% DPPH in ethanol. Subsequently, the mixture was shaken vig-orously and left in darkness for 60 min. Finally, the absorbance of the mixture was measured at 515 nm. Ascorbic acid was added as a synthetic reference, and the anti-radical activities of the sample were cal-culated from the following equation:
Where Acontrol and Asample were the absorbance values of the blank as well as the tested sample, respec-tively.
2.8.2. β-carotene bleaching testThe β-carotene bleaching test was conducted as de-

La rivista itaLiana deLLe sostanze grasse - voL. XCiii - gennaio/Marzo 2016
34
scribed by Taga et al [17]. Briefly, 10 mg of β-carotene was dissolved in 10 mL of chloroform. About 0.2 mL of the mixture (β-carotene + chloroform) was pipetted into a boiling flask containing 20 mg linoleic acid and 200 mg of Tween 40. The chloroform was removed un-der vacuum using a rotary evaporator at 40°C. Then, 50 ml of ultrapure water was added to the residue un-der vigorous shaking in order to form an emulsion. The emulsion (5 ml) was added to a tube containing 0.2 ml of seed oil, and the absorbance was immediately measured at 470 nm against a blank, consisting of an emulsion without β-carotene. The tubes were placed in a water bath at 50°C; the oxidation of the emulsion was monitored spectrophotometrically by measuring the absorbance at 470 nm over a 60 min period. The control samples contained 200 μL water instead of seed oil. The antioxidant activity was expressed as in-hibition percentage with reference to the control after a 60 min incubation using the following equation:
where DRC was the degradation rate of the control, DRS the degradation rate in the presence of the sam-ple, and a and b the absorbances at zero time and 60 min, respectively.
Synthetic antioxidant reagents, butylatedhydroxyani-sole (BHT) and L-ascorbic acid were used as posi-tive controls and all tests were carried out in triplicate. Pistacia lentiscus L. seed oil concentration providing 50% inhibition (IC50) was calculated from the linear re-gression algorithm of the graph which plotted inhibi-tion percentage against seed oil concentration. For the calculation of these values, the Sigmaplot Sot-ware (version 10) was used.
2.9. STATISTICAL ANALYSISAll experiments were performed in triplicate and data are expressed as mean ± standard deviation using SPSS Software statistical package (SPSS Inc., Chi-cago, IL), version 18.0.
3. RESULTS AND DISCUSSION
3.1. FATTY ACID COMPOSITIONThe oil from the seeds of Pistacia lentiscus L. con-stituted 38.83% on the basis of dry matter weight. The results of fatty acid composition of Pistacia lenti-scus L. seed oil are summarised in Table I. It has been found that oleic acid (50.39%) was the major acid, followed by palmitic acid (26.19%), and linoleic acid; the three dominant acids accounted for nearly 96% of
Table I - Composition of fatty acids and triacyglycerols of lentisc (Pistacia lentiscus L.) seed oil.
Compounds Symbols Levels Fatty acids % total fatty acids
Myristic C14:0 0.03±0.01 Palmitic C16:0 26.19±0.06
Palmitoleic C16:1 2.24±0.02 Heptadecanoic C17:0 0.05±0.01 Heptadecenoic C17:1 0.08±0.01
Stearic C18:0 1.33±0.02 Oleic C18:1 50.39±0.04
Linoleic C18:2 18.74±0.03 Linolenic C18:3 0.16±0.02 Arachidic C20:0 0.43±0.03 Gadoleic C20:1 0.14±0.02 Behenic C22:0 0.07±0.01 Erucic C22:1 0.04±0.01
Lignoceric C24:0 0.05±0.01 Monounsaturated fatty acids MUFA 52.90
Saturated fatty acids SFA 27.85 Polyunsaturated fatty acids PUFA 19.23
Triacyglycerols TAGs ECN % total TAGs LLL 42 1.36±0.02 OLL 44 12.23±0.03 POL 46 34.49±0.04 OOO 48 49.70±0.07 SOO 50 2.22±0.01
Values given are the means of three replicates ± standard deviation; MUFA: monounsaturated fatty acids; SFA: saturated fatty acids; PUFA: polyunsaturated fatty acids. ECN: equivalent carbon number; LLL: glycerol-trilinoleate; OLL: glycerol-oleate-dilinoleate; POL: glycerol-palmitate-oleate-linoleate; OOO: glycerol-trioleate; SOO; glycerol-stearate-dioleate; TAGs: triacyglycerols.
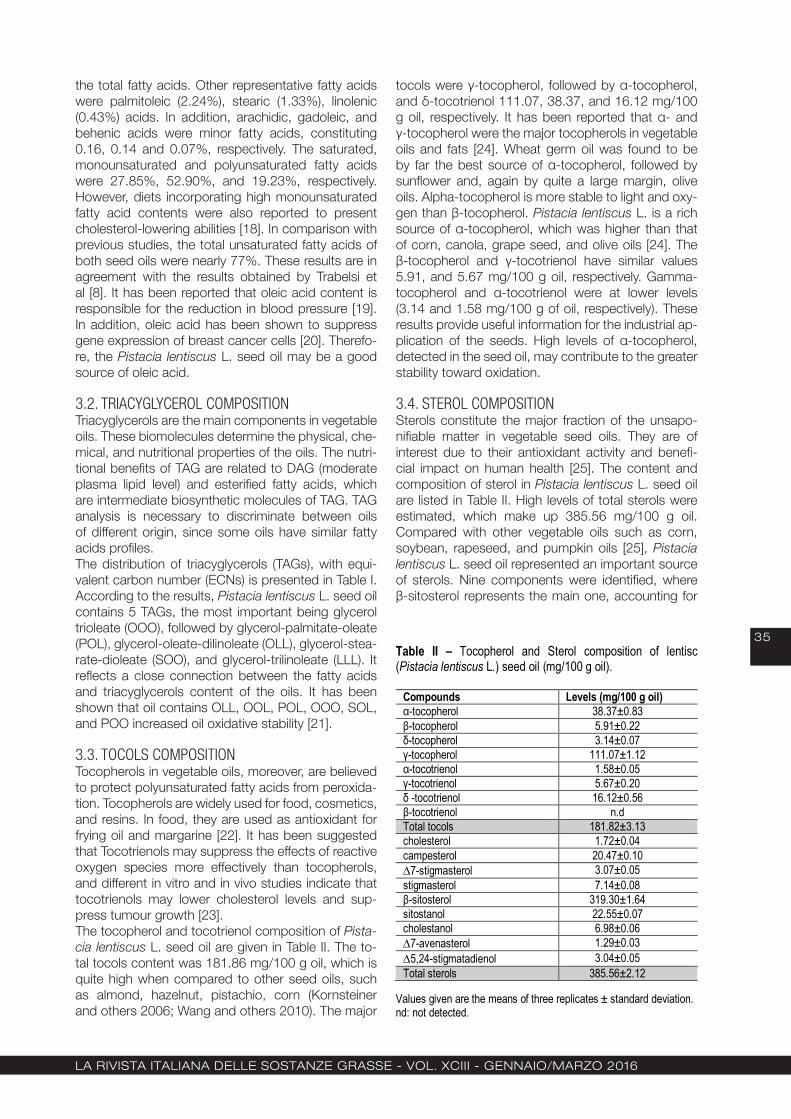
La rivista itaLiana deLLe sostanze grasse - voL. XCiii - gennaio/Marzo 2016
35
the total fatty acids. Other representative fatty acids were palmitoleic (2.24%), stearic (1.33%), linolenic (0.43%) acids. In addition, arachidic, gadoleic, and behenic acids were minor fatty acids, constituting 0.16, 0.14 and 0.07%, respectively. The saturated, monounsaturated and polyunsaturated fatty acids were 27.85%, 52.90%, and 19.23%, respectively. However, diets incorporating high monounsaturated fatty acid contents were also reported to present cholesterol-lowering abilities [18]. In comparison with previous studies, the total unsaturated fatty acids of both seed oils were nearly 77%. These results are in agreement with the results obtained by Trabelsi et al [8]. It has been reported that oleic acid content is responsible for the reduction in blood pressure [19]. In addition, oleic acid has been shown to suppress gene expression of breast cancer cells [20]. Therefo-re, the Pistacia lentiscus L. seed oil may be a good source of oleic acid.
3.2. TRIACYGLYCEROL COMPOSITIONTriacyglycerols are the main components in vegetable oils. These biomolecules determine the physical, che-mical, and nutritional properties of the oils. The nutri-tional benefits of TAG are related to DAG (moderate plasma lipid level) and esterified fatty acids, which are intermediate biosynthetic molecules of TAG. TAG analysis is necessary to discriminate between oils of different origin, since some oils have similar fatty acids profiles. The distribution of triacyglycerols (TAGs), with equi-valent carbon number (ECNs) is presented in Table I. According to the results, Pistacia lentiscus L. seed oil contains 5 TAGs, the most important being glycerol trioleate (OOO), followed by glycerol-palmitate-oleate (POL), glycerol-oleate-dilinoleate (OLL), glycerol-stea-rate-dioleate (SOO), and glycerol-trilinoleate (LLL). It reflects a close connection between the fatty acids and triacyglycerols content of the oils. It has been shown that oil contains OLL, OOL, POL, OOO, SOL, and POO increased oil oxidative stability [21].
3.3. TOCOLS COMPOSITIONTocopherols in vegetable oils, moreover, are believed to protect polyunsaturated fatty acids from peroxida-tion. Tocopherols are widely used for food, cosmetics, and resins. In food, they are used as antioxidant for frying oil and margarine [22]. It has been suggested that Tocotrienols may suppress the effects of reactive oxygen species more effectively than tocopherols, and different in vitro and in vivo studies indicate that tocotrienols may lower cholesterol levels and sup-press tumour growth [23].The tocopherol and tocotrienol composition of Pista-cia lentiscus L. seed oil are given in Table II. The to-tal tocols content was 181.86 mg/100 g oil, which is quite high when compared to other seed oils, such as almond, hazelnut, pistachio, corn (Kornsteiner and others 2006; Wang and others 2010). The major
tocols were γ-tocopherol, followed by α-tocopherol, and δ-tocotrienol 111.07, 38.37, and 16.12 mg/100 g oil, respectively. It has been reported that α- and γ-tocopherol were the major tocopherols in vegetable oils and fats [24]. Wheat germ oil was found to be by far the best source of α-tocopherol, followed by sunflower and, again by quite a large margin, olive oils. Alpha-tocopherol is more stable to light and oxy-gen than β-tocopherol. Pistacia lentiscus L. is a rich source of α-tocopherol, which was higher than that of corn, canola, grape seed, and olive oils [24]. The β-tocopherol and γ-tocotrienol have similar values 5.91, and 5.67 mg/100 g oil, respectively. Gamma-tocopherol and α-tocotrienol were at lower levels (3.14 and 1.58 mg/100 g of oil, respectively). These results provide useful information for the industrial ap-plication of the seeds. High levels of α-tocopherol, detected in the seed oil, may contribute to the greater stability toward oxidation.
3.4. STEROL COMPOSITIONSterols constitute the major fraction of the unsapo-nifiable matter in vegetable seed oils. They are of interest due to their antioxidant activity and benefi-cial impact on human health [25]. The content and composition of sterol in Pistacia lentiscus L. seed oil are listed in Table II. High levels of total sterols were estimated, which make up 385.56 mg/100 g oil. Compared with other vegetable oils such as corn, soybean, rapeseed, and pumpkin oils [25], Pistacia lentiscus L. seed oil represented an important source of sterols. Nine components were identified, where β-sitosterol represents the main one, accounting for
Table II – Tocopherol and Sterol composition of lentisc (Pistacia lentiscus L.) seed oil (mg/100 g oil).
Values given are the means of three replicates ± standard deviation. nd: not detected.
Compounds Levels (mg/100 g oil) α-tocopherol 38.37±0.83 β-tocopherol 5.91±0.22 δ-tocopherol 3.14±0.07 γ-tocopherol 111.07±1.12 α-tocotrienol 1.58±0.05 γ-tocotrienol 5.67±0.20 δ -tocotrienol 16.12±0.56 β-tocotrienol n.d Total tocols 181.82±3.13 cholesterol 1.72±0.04 campesterol 20.47±0.10 ∆7-stigmasterol 3.07±0.05 stigmasterol 7.14±0.08 β-sitosterol 319.30±1.64 sitostanol 22.55±0.07 cholestanol 6.98±0.06 ∆7-avenasterol 1.29±0.03 ∆5,24-stigmatadienol 3.04±0.05 Total sterols 385.56±2.12
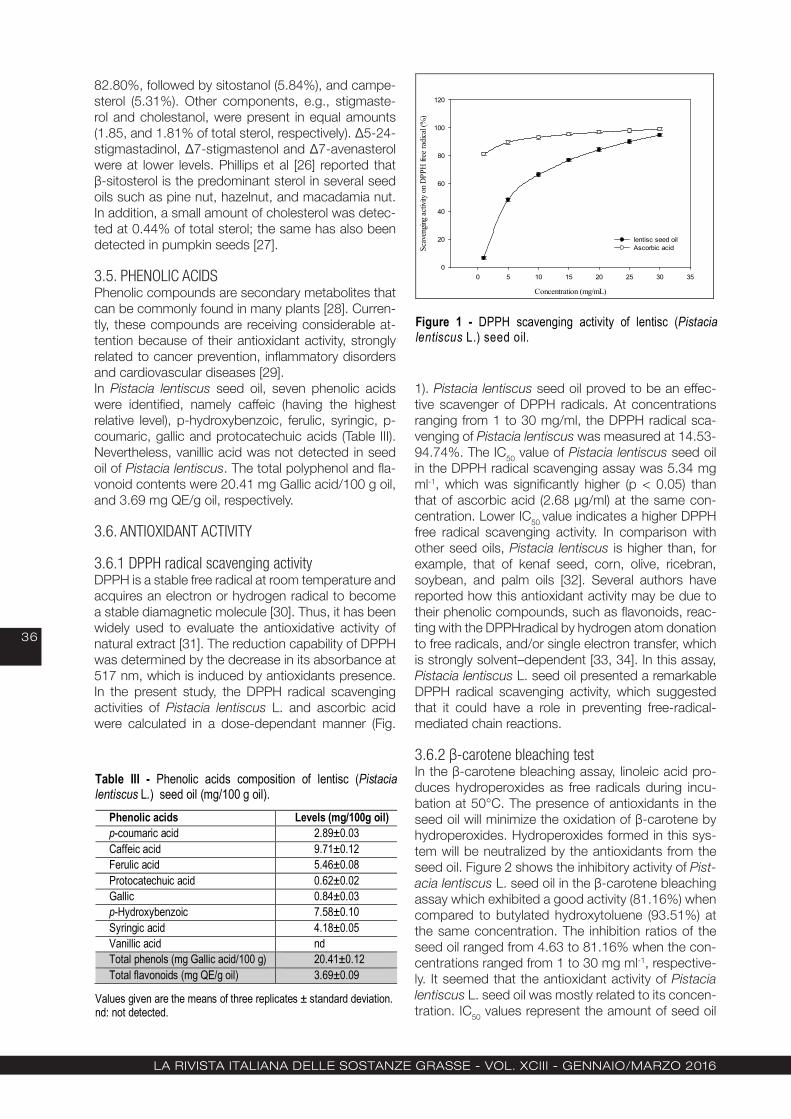
La rivista itaLiana deLLe sostanze grasse - voL. XCiii - gennaio/Marzo 2016
36
82.80%, followed by sitostanol (5.84%), and campe-sterol (5.31%). Other components, e.g., stigmaste-rol and cholestanol, were present in equal amounts (1.85, and 1.81% of total sterol, respectively). Δ5-24-stigmastadinol, Δ7-stigmastenol and Δ7-avenasterol were at lower levels. Phillips et al [26] reported that β-sitosterol is the predominant sterol in several seed oils such as pine nut, hazelnut, and macadamia nut. In addition, a small amount of cholesterol was detec-ted at 0.44% of total sterol; the same has also been detected in pumpkin seeds [27].
3.5. PHENOLIC ACIDSPhenolic compounds are secondary metabolites that can be commonly found in many plants [28]. Curren-tly, these compounds are receiving considerable at-tention because of their antioxidant activity, strongly related to cancer prevention, inflammatory disorders and cardiovascular diseases [29].In Pistacia lentiscus seed oil, seven phenolic acids were identified, namely caffeic (having the highest relative level), p-hydroxybenzoic, ferulic, syringic, p-coumaric, gallic and protocatechuic acids (Table III). Nevertheless, vanillic acid was not detected in seed oil of Pistacia lentiscus. The total polyphenol and fla-vonoid contents were 20.41 mg Gallic acid/100 g oil, and 3.69 mg QE/g oil, respectively.
3.6. ANTIOXIDANT ACTIVITY
3.6.1 DPPH radical scavenging activity DPPH is a stable free radical at room temperature and acquires an electron or hydrogen radical to become a stable diamagnetic molecule [30]. Thus, it has been widely used to evaluate the antioxidative activity of natural extract [31]. The reduction capability of DPPH was determined by the decrease in its absorbance at 517 nm, which is induced by antioxidants presence. In the present study, the DPPH radical scavenging activities of Pistacia lentiscus L. and ascorbic acid were calculated in a dose-dependant manner (Fig.
1). Pistacia lentiscus seed oil proved to be an effec-tive scavenger of DPPH radicals. At concentrations ranging from 1 to 30 mg/ml, the DPPH radical sca-venging of Pistacia lentiscus was measured at 14.53-94.74%. The IC50 value of Pistacia lentiscus seed oil in the DPPH radical scavenging assay was 5.34 mg ml-1, which was significantly higher (p < 0.05) than that of ascorbic acid (2.68 µg/ml) at the same con-centration. Lower IC50 value indicates a higher DPPH free radical scavenging activity. In comparison with other seed oils, Pistacia lentiscus is higher than, for example, that of kenaf seed, corn, olive, ricebran, soybean, and palm oils [32]. Several authors have reported how this antioxidant activity may be due to their phenolic compounds, such as flavonoids, reac-ting with the DPPHradical by hydrogen atom donation to free radicals, and/or single electron transfer, which is strongly solvent–dependent [33, 34]. In this assay, Pistacia lentiscus L. seed oil presented a remarkable DPPH radical scavenging activity, which suggested that it could have a role in preventing free-radical-mediated chain reactions.
3.6.2 β-carotene bleaching testIn the β-carotene bleaching assay, linoleic acid pro-duces hydroperoxides as free radicals during incu-bation at 50°C. The presence of antioxidants in the seed oil will minimize the oxidation of β-carotene by hydroperoxides. Hydroperoxides formed in this sys-tem will be neutralized by the antioxidants from the seed oil. Figure 2 shows the inhibitory activity of Pist-acia lentiscus L. seed oil in the β-carotene bleaching assay which exhibited a good activity (81.16%) when compared to butylated hydroxytoluene (93.51%) at the same concentration. The inhibition ratios of the seed oil ranged from 4.63 to 81.16% when the con-centrations ranged from 1 to 30 mg ml-1, respective-ly. It seemed that the antioxidant activity of Pistacia lentiscus L. seed oil was mostly related to its concen-tration. IC50 values represent the amount of seed oil
Table III - Phenolic acids composition of lentisc (Pistacia lentiscus L.) seed oil (mg/100 g oil).
Phenolic acids Levels (mg/100g oil) p-coumaric acid 2.89±0.03 Caffeic acid 9.71±0.12 Ferulic acid 5.46±0.08 Protocatechuic acid 0.62±0.02 Gallic 0.84±0.03 p-Hydroxybenzoic 7.58±0.10 Syringic acid 4.18±0.05 Vanillic acid nd Total phenols (mg Gallic acid/100 g) 20.41±0.12 Total flavonoids (mg QE/g oil) 3.69±0.09
Values given are the means of three replicates ± standard deviation. nd: not detected.
Concentration (mg/mL)
0 5 10 15 20 25 30 35
Scav
engi
ng a
ctiv
ity o
n D
PPH
free
radi
cal (
%)
0
20
40
60
80
100
120
lentisc seed oilAscorbic acid
Figure 1 - DPPH scavenging activity of lentisc (Pistacia lentiscus L.) seed oil.
Concentration (mg/mL)
0 5 10 15 20 25 30 35
Inhi
btio
n ra
tio
(%)
0
20
40
60
80
100
lentisc seed oilBHT
Figure 2 - Beta-carotene bleaching test of lentisc (Pistacia lentiscus L.) seed oil.

La rivista itaLiana deLLe sostanze grasse - voL. XCiii - gennaio/Marzo 2016
37
required to inhibit 50% of β-carotene. Thus, higher IC50 values mean lower antioxidant activity. The IC50 was 7.42 ± 0.94 mg ml-1 which was significantly higher (p < 0.05) than those of BHT (67.89 ± 0.78 μg mL-1). Frankel and Meyer [35] reported that hydro-phobic antioxidants in the β-carotene bleaching test by orienting themselves in the lipid phase and the oil water interface, thus directly combating lipid radi-cal formation and β-carotene oxidation. The strong activity of Pistacia lentiscus seed oil’s minor compo-nents may be due to their higher level of hydropho-bic antioxidants, such as tocopherols and phenolic compounds.
4. CONCLUSION
According to the described results, Pistacia len-tiscus L. seed oil can be proposed for several uses. The high oleic acid content suggests the utilization of Pistacia lentiscus seed as a low-cost renewable source of fatty acids and sterols for industrial pro-cessing in the fields of cosmetics, medicines, and food industry. As to the levels of tocopherols, Pistacia lentiscus seeds stood out and proved a good source vitamin E and antioxidant, mainly due to the amount of α- and γ-tocopherol. The present work therefore demonstrates that Pistacia lentiscus seeds might be a natural source of bioactive compounds that could be incorporated into new health-related products or substitute synthetic compounds of questionable safety, thus promoting human health and reducing disease risks.
Acknowledgement
This work had been carried out as part of a National Research Project (2010). We thank the Ministry of Hi-gher Education, Scientific Research and Technology for financially supporting this program.
REFERENCES
[1] N.S. Margaris, Adaptive strategies in plants dominating Mediterranean type ecosytems. In: di Castri R., Goodall DW, Specht RI. (Eds.), Eco-systems the World. Mediterraanean type Shru-blands, Elsevier Science, pp 309-315 (1981).
[2] V. Castola, A. Bighelli, J. Casanova, Intraspecific chemical variability of the essential oil of Pistacia lentiscus L. from Corsica, Biochem. Syst Ecol 28, 79-88 (2000).
[3] N. Benhammou, F.A. Bekkara, T.K. Panovska, Antioxidant and antimicrobial activities of the Pistacia lentiscus and atlantica extracts, Afr. J. Pharm Pharm 2(2), 22-28 (2008).
[4] M.E. Duru, A. Cahir, S.Kordali, H. Zengin, M. Harmandar, S. Izumi, T. Hirata, Chemical com-position and antifungal properties of essential oils of three Pistacia species, Fitoterapia 74, 170-176 (2003).
[5] G.V.Z. Dedoussis, A.C. Kaliora, S. Psarras, A. Mylona, A. Chiou, N.G. Papadopoulos, N.K. An-drikopoulos, Antiatherogenic effect of Pistacia lentiscus via GSH restoration and down regula-tion of CD36 mRNA expression, Atherosclerosis 174, 293-303 (2004).
[6] E. Le Floc’h, M.A. Nabli, Programme flore et végétation Tunisiennes. In: Contribution à une étude ethnobotanique de la flore Tunisienne. Tu-nis. Ministère de l’enseignement supérieur et de la recherche scientifique, imprimerie officielle de la république tunisienne, pp. 144-145 (1993).
[7] M. Charef, M. Yousfi, M. Saidi, P. Stoccker, Determination of the fatty acid composition of Acorn (Quercus), Pistacia lentiscus seeds grow-ing in Algeria, J. Am. Oil Chem. Soc. 85, 921-924 (2008).
[8] H. Trabelsi, O.A. Cherif, F. Sakouhi, P. Villeneuve, J. Renaud, N. Barouh, S. Boukhchina, P. Mayer, Total lipid content, fatty acid and 4-desmethys-terols accumulation in developping fruit of Pista-cia lentiscus L. growing in Tunisia, Food Chem 114, 968-973 (2011).
[9] H. Trabelsi, F. Sakouhi, J. Renaud, P. Villeneuve, M.L. Khouja, P. Mayer, Fatty acids, 4-desmeth-ylsterols, and triterpene alcohols from Tunisian lentisc (Pistacia lentiscus L.) fruits, Eur. J. Lipid Sci. Technol 116 (2), 153-159 (2012).
[10] I. Nehdi, Characteristics, chemical composition and utilization of Albizia julibrissin seed oil. Ind. Crops Prod. 33, 30-34 (2011).
[11] AOCS, Determination of Tocopherols and To-cotrienols in Vegetable Oils and Fats by HPLC. AOCS pp. 8-89 (1993).
[12] NF EN ISO 12228, Association Française de Normalisation, European Norm, NF EN ISO 12228 May 1999; French norm T60-258: animal and vegetable fats and oils-determination of in-dividual and total sterols contents-gas chroma-
Concentration (mg/mL)
0 5 10 15 20 25 30 35
Scav
engi
ng a
ctiv
ity o
n D
PPH
free
radi
cal (
%)
0
20
40
60
80
100
120
lentisc seed oilAscorbic acid
Figure 1 - DPPH scavenging activity of lentisc (Pistacia lentiscus L.) seed oil.
Concentration (mg/mL)
0 5 10 15 20 25 30 35
Inhi
btio
n ra
tio
(%)
0
20
40
60
80
100
lentisc seed oilBHT
Figure 2 - Beta-carotene bleaching test of lentisc (Pistacia lentiscus L.) seed oil.
La rivista itaLiana deLLe sostanze grasse - voL. XCiii - gennaio/Marzo 2016
38
tographic method. AFNOR. Paris. pp 18 (1999).[13] M.J. Simirgiotis, S. Adachi, S. To, H. Yang, K.A.
Reynertson, M.J. Basile, et al, Cytotoxic chal-cones and antioxidants from the fruits of Syzy-gium samarangense (Wax Jambu), Food Chem. 107, 813-819 (2008).
[14] A. Yildirim, A. Mavi, A. Kara, Determination of antioxidant and antimicrobial activities of Rumex crispus L. extracts, J. Agric. Food Chem. 49, 4083-4089 (2001).
[15] R.W. Owen, A. Giacosa, W.E. Hull, R. Haubner, B. Spiegelhalder, H. Bartsh, The antioxidant/an-ticancer potential of phenolic compounds isolat-ed from olive oil. Eur. J. Cancer. 36, 1235-1247 (2000).
[16] R. Amarowicz, R.B. Pegg, P.R. Moghaddam, B. Barl, J.A. Weil, Free-radical scavenging capacity and antioxidant activity of selected plant species from Canadian prairies. Food Chem. 84, 551-562 (2004).
[17] M.S. Taga, E.E. Miller, D.E. Pratt, Chia seeds as a source of natural lipid antioxidant. J. Am. Oil Chem. Soc. 61, 928-931 (1984).
[18] J.A.J. David, C. Laura, M.W.W. Julia, K. Cyril, F.L. Gary, V. Edward et al, Adding monounsatu-rated fatty acids to a dietary portfolio of cho-lesterollowering foods in hypercholesterolemia. Can. Med. Assoc J. 182(18): doi:10.1503/cmaj.092128 (2010).
[19] S. Teres, G. Barcelo-Coblijn, M. Benet, R. Al-varez, R. Bressani, J.E. Halver et al, Oleic acid content is responsible for the reduction in blood pressure induced by olive oil, Proceedings of the National Academy of Sciences of the United States of America 105, 13811-13816 (2008).
[20] J.A. Menendez, L. Vellon, R. Colomer, R. Lupu, Oleic acid, the main monounsaturated fatty acid of olive oil, suppresses Her-2/neu (erb B-2) espression and synergistically enhances the growth inhibitory effects of trastuzumab (Her-ceptin™ in breast cancer cells with Her-2/neu oncogene amplification, Ann. Oncol. 16(3), 359-371 (2005).
[21] W.E. Neff, T.L. Mounts, W.M. Rinsch, K. Koni-shi, EI. Agaimy, Triacylglycerols with altered fatty acid compositions as affected by triacylglycerol composition and structure, J. Am. Oil Chem. Soc. 71, 1101-1109 (1994).
[22] C.C. Akoh, Handbook of functional lipids. In J. H. Lee, & D.B. Min (Eds). Nutraceuticals, aging and food oxidation (pp. 325-350). Taylor & Fran-cis Group. CRC Press (2006).
[23] S. Schaffer, W.E. Muller, G.P. Ecket, Tocotrienol: constitutional effects in aging and disease, J. Nutr. 135, 151-154 (2005).
[24] P. Adhikari, K.T. Hwang, M.K. Shin, B.K. Lee, S.K. Kim, S.Y. Kim, KT. Lee, S.Z. Kim, Tocols in caneberry seed oils, Food Chem. 111, 687-690 (2008).
[25] J. Schmidt, B. Spengler, G. Adam, H. Budzik-iewicz, Sterol 444 constituents in seeds of Or-nithopus sativus, Phytochem 33(2), 506-507 (1993).
[26] K.M. Phillips, D.M. Ruggio, J.I. Toivo, M.A. Swank, A.H. Simpkins, Free and esterified ster-ol composition of edible oils and fats, J. Food. Comp. Anal. 15, 123-142(2002).
[27] L. Rezig, M. Chouaibi, K. Mssada, S. Hamdi, Chemical composition and profile characteriza-tion of pumpkin (Cucurbita maxima) seed oil, Ind. Crops. Prod. 37, 82-87 (2012).
[28] J. Bernal, J.A. Mendiola, E. Ibanez, A. Cifuentes, Advanced analysis of nutraceuticals, J. Pharma. Biom. Anal. 55, 758-774 (2010).
[29] S.H. Omar, Oleuropein in olive and its phar-macological effects, Sci. Pharma 78, 133-154 (2010).
[30] J.R. Soares, T.C.P. Dinis, A.P. Cunha, L.M. Almeida, Antioxidant activities of some extracts of Thymus zygi, Free Radical. Res 26, 469-478 (1997).
[31] G. Ahn, K. Kim, S. Cha, C. Song, J. Lee, M. Heo, I. Yeo, N. Lee, Y. Jee, J. Kim, M. Heu, Y. Jeon, Antioxidant activities of phlorotannins purified from Ecklonia cava on free radical scav-enging using ESR and H2O2-mediated DNA damage, Eur. Food Res. Technol. 226, 71-79 (2007).
[32] K.W. Chan, M. Ismail, Supercrictical carbon di-oxide fluid extraction of Hibiscus cannabinus L. seed oil: A potential solvent-free and high anti-oxidative eddible oil, Food Chem. 114, 970-975 (2009).
[33] C.A. Calliste, P. Trouillas, D.P. Allais, A. Simon, J.L. Duroux, Free radical scavenging activities of mesured by electron spin resonance spectros-copy and B16 cell antiproliferative behaviors of seven plants, J. Agric. Food Chem. 49, 3321-3327 (2001).
[34] C.A. Rice-Evans, N.J. Miller, G. Paganga, Structure-antioxidant activity relationship of fla-vonoids and phenolic acids, Free. Radical. Biol Med 20(7), 933-956 (1996).
[35] E.N. Frankel, A.S. Meyer, The problems of us-ing one-dimensional methods to evaluate mul-tifunctional food and biological antioxidants, J. Sci. Food Agric. 80, 1925-1940 (2000).
Received October 15, 2014Accepted April 16, 2015
La rivista itaLiana deLLe sostanze grasse - voL. XCiii - gennaio/Marzo 2016
39
W. Herchi1*K. Ben Ammar2
F. Sakouhi1
H. Kallel1
S. Boukhchina1
1 Laboratoire de Biochimie des LipidesDépartement de Biologie
Faculté des Sciences de TunisELmanar-Tunisia
2 Office National de l’huile de TunisieTunisia
*CORRESPONDING AUTHORe-mail: [email protected]
effect of harvest year on triglyceride composition and tocochromanols
contents of flaxseed oil (Linum usitatissimum l)
Triacylglycerols, tocochromanols and stability characteristics of flaxseed oil produced in Tunisia were analyzed over five harvest years, 2005-2006-2007-2008-2009. Content of TAG composed of tri-PUFA ranged between 52.66% (2007) and 53.95% (2008). The equivalent carbon number
36 (ECN
36) content ranged from 24.18% to 25.95%.
Triacylglycerols were significantly affected by the harvest year. Among the analyzed samples, the sample harvested on 2008 had the highest amount of total tocochromanols (397 mg/kg oil), while the 2007 harvesting year had the lowest (367 mg/kg oil). Tocochromanols were also influenced by harvest year. There were differences among harvesting years in the quality and stability characteristics of flaxseed oil. The total polyphenol content and antioxidant activity of flaxseed oil were determined in the range of 110 – 120 mg gallic acid/kg of oil and 52.81 - 58.33%, respectively.Keywords: Oil, Flaxseed, Harvest year, Triacylglycerols, Tocopherols, Antioxidant activity
Effetto dell’epoca di raccolta sulla composizione dei trigliceridi e dei tocoferoli e tocotrienoli, in olio di semi di lino (Linum usitatissimum L.) Sono stati analizzati trigliceridi, tococromanoli e le caratteristiche di stabilità dell’olio di lino prodotto in Tunisia in cinque anni di raccolta 2005-2006-2007-2008-2009.Il Contenuto di TAG composto da tri-PUFA era compreso tra 52,66% (2007) e il 53,95% (2008). Il contenuto del numbero
36 di carbonio equivalente (ECN36) variava da 24,18% a
25,95%. I trigliceridi erano significativamente influenzati dall’anno di raccolta.Tra i campioni analizzati, il campione raccolto nel 2008 ha avuto la più alta quantità di tococromanoli totali (397 mg/kg), mentre l’anno di raccolta 2007 ha avuto il più basso (367 mg/kg di olio). I tococromanoli sono stati influenzati dall’anno di raccolta. Per quanto riguarda le caratteristiche di qualità e stabilità (caratteristiche dell’olio di semi di lino) ci sono state differenze tra gli anni di raccolta. Il contenuto totale di polifenoli e l’attività antiossidante dell’olio di semi di lino sono stati determinati nell’intervallo di 110- 120 mg di acido gallico/kg di olio e 52,81-58,33%, rispettivamente.Parole chiave: olio, semi di lino, anno di raccolta, Triacilgliceroli, tocoferoli, attività antiossidante
La rivista itaLiana deLLe sostanze grasse - voL. XCiii - gennaio/Marzo 2016
40
INTRODUCTION
Flaxseed (Linum usitatissimum L.) is a globally impor-tant agricultural crop grown both for its seed oil and its stem fiber. Canada is the leading country in pro-ducing and exporting oil-type flaxseed. The renewed interest in flaxseed as a food source is due to its health benefits attributed to its components including lignans (secoisolariciresinol diglucoside (SDG) being the predominant form (Hall et al., 2006) [1]. The seed oil has multiple industrial applications, such as in the manufacture of linoleum and paints and in preserving wood and concrete. Flaxseed oil is a typical drying oil, mainly used for industrial purposes, such as the pro-duction of varnishes, inks, and cosmetics. Flaxseed oil is becoming popular for its pharmaceutical uses. In fact, studies have proven that flaxseed oil has a posi-tive effect on many diseases, such as, for example, hyperlipidemia, colon tumor, mammary cancer, and atherosclerosis (Zhang et al., 2011) [2].The beneficial effects are mostly due to flaxseed lip-ids. Flaxseed oil is the richest plant source of linoleic (omega-6) and linolenic (omega-3) polyunsaturated fatty acids (PUFA), which are essential for humans. A number of studies has demonstrated the effective-ness of lipid unsaponifiable matters in retarding oil deterioration (Jaswir et al., 2005) [3]. In flaxseed, lip-ids are protected against oxidation by various mech-anisms, e. g. the presence of antioxidants such as lignans and tocopherols (Ahmed et al., 2005) [4]. In addition to preventing fat rancidity, these antioxidants could increase commercial value of food products and have beneficial effects on human health. When consumed together with essential unsaturated fatty acids, they can reduce the risk of various diseases (Tokuda et al., 2014) [5]. The antioxidant ability of phenols and tocopherols is related to the presence of OH groups, which may directly bind to free radicals and chelate metals (Herchi et al., 2014a) [6]. Many analyses have been conducted on flaxseed oil: Zhang et al., (2011) [2] have studied the characteristics of
flaxseed oil from two different flaxseed plants. Yalcin et al., (2011) [7] have reported the influence of harvest year and fertilizer on the fatty acid composition and some physicochemical properties of linseed (Linum usitatissimum L). However, there is no information on the effect of harvest year on the stability characteris-tics of flaxseed oil produced in Tunisia. Therefore, the aim of this study is to determine the effect of year-to-year variations on triglycerides, tocopherols, tocot-rienols and antioxidant activity of flaxseed oil.
MATERIALS AND METHODS
CHEMICALS AND REAGENTS All solvents and standards used in the experiments were purchased from the Fisher Scientific Company (Ottawa, Ontario, Canada).
PLANT MATERIAL The variety of flaxseed “H52” was acquired from In-stitut National Recherche Agronomie Tunis (INRAT), Tunisia. This variety of flaxseed (L. usitatissimum L.) is grown in restricted zones (15 m × 3 m) on the Agro-nomy farm of the INRAT, each year from the middle of November until the end of June. Moisture and seeds weights were determined by weighing 100 seeds be-fore and after drying to constant weight in a vacuum oven at 80°C for 72 h. Seeds lengths were measured using a micrometer (Table I).
OIL EXTRACTION The total lipids were extracted following the method of Folch et al. (1957) [8] as adapted by Bligh et al. (1959) [9]. Flaxseeds (100 g) were washed in boiling water for 5 min so as to denature the phospholipases (Douce, 1964) [10], and then crushed in a mortar with a mixture of CHCl3-MeOH (2:1, v/v). Fixing water was added, and the homogenate was centrifuged at 3000 rpm for 15 min. The lower chloroformic phase contai-ning the total lipids was dried in a rotary evaporator at 40°C.
Table I- Environmental and Morphological characteristics of flaxseed during the five harvest year
Means with different letters (a–c) within a row are significantly different at (p ≤ 0.05)
Years Variety Period Characteristic of the station INRA-Tunis
Ripening stage Seed
length (mm)
Seed dry weight
(mg/seed) Altitude Latitude Longitude
2005 H52 November 2004 - June 2005
10 m 36°51' 10°11' mature-seed stage 6.1±0.1a 9.6±1.4a
2006 H52 November 2005 - June 2006
10 m 36°51' 10°11' mature-seed stage 6.3±0.2a 11.2±0.8b
2007 H52 November 2006 - June 2007
10 m 36°51' 10°11' mature-seed stage 6.2±0.1a 10.8±1.1a
2008 H52 November 2007 - June 2008
10 m 36°51' 10°11' mature-seed stage 6.6±0.4b 12.1±0.7b
2009 H52 November 2008 - June 2009
10 m 36°51' 10°11' mature-seed stage 6.4±0.2b 11.5±0.8b
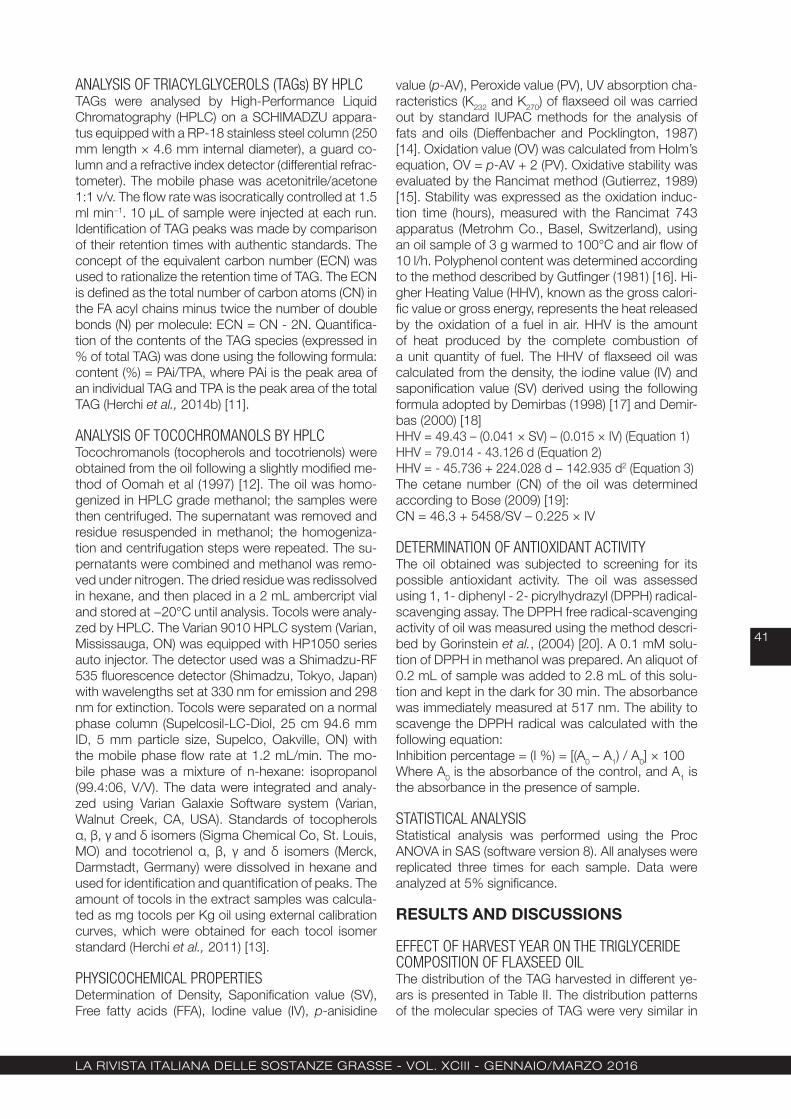
La rivista itaLiana deLLe sostanze grasse - voL. XCiii - gennaio/Marzo 2016
41
ANALYSIS OF TRIACYLGLYCEROLS (TAGs) BY HPLC TAGs were analysed by High-Performance Liquid Chromatography (HPLC) on a SCHIMADZU appara-tus equipped with a RP-18 stainless steel column (250 mm length × 4.6 mm internal diameter), a guard co-lumn and a refractive index detector (differential refrac-tometer). The mobile phase was acetonitrile/acetone 1:1 v/v. The flow rate was isocratically controlled at 1.5 ml min−1. 10 µL of sample were injected at each run. Identification of TAG peaks was made by comparison of their retention times with authentic standards. The concept of the equivalent carbon number (ECN) was used to rationalize the retention time of TAG. The ECN is defined as the total number of carbon atoms (CN) in the FA acyl chains minus twice the number of double bonds (N) per molecule: ECN = CN - 2N. Quantifica-tion of the contents of the TAG species (expressed in % of total TAG) was done using the following formula: content (%) = PAi/TPA, where PAi is the peak area of an individual TAG and TPA is the peak area of the total TAG (Herchi et al., 2014b) [11].
ANALYSIS OF TOCOCHROMANOLS BY HPLC Tocochromanols (tocopherols and tocotrienols) were obtained from the oil following a slightly modified me-thod of Oomah et al (1997) [12]. The oil was homo-genized in HPLC grade methanol; the samples were then centrifuged. The supernatant was removed and residue resuspended in methanol; the homogeniza-tion and centrifugation steps were repeated. The su-pernatants were combined and methanol was remo-ved under nitrogen. The dried residue was redissolved in hexane, and then placed in a 2 mL ambercript vial and stored at −20°C until analysis. Tocols were analy-zed by HPLC. The Varian 9010 HPLC system (Varian, Mississauga, ON) was equipped with HP1050 series auto injector. The detector used was a Shimadzu-RF 535 fluorescence detector (Shimadzu, Tokyo, Japan) with wavelengths set at 330 nm for emission and 298 nm for extinction. Tocols were separated on a normal phase column (Supelcosil-LC-Diol, 25 cm 94.6 mm ID, 5 mm particle size, Supelco, Oakville, ON) with the mobile phase flow rate at 1.2 mL/min. The mo-bile phase was a mixture of n-hexane: isopropanol (99.4:06, V/V). The data were integrated and analy-zed using Varian Galaxie Software system (Varian, Walnut Creek, CA, USA). Standards of tocopherols α, β, γ and δ isomers (Sigma Chemical Co, St. Louis, MO) and tocotrienol α, β, γ and δ isomers (Merck, Darmstadt, Germany) were dissolved in hexane and used for identification and quantification of peaks. The amount of tocols in the extract samples was calcula-ted as mg tocols per Kg oil using external calibration curves, which were obtained for each tocol isomer standard (Herchi et al., 2011) [13].
PHYSICOCHEMICAL PROPERTIES Determination of Density, Saponification value (SV), Free fatty acids (FFA), Iodine value (IV), p-anisidine
value (p-AV), Peroxide value (PV), UV absorption cha-racteristics (K232 and K270) of flaxseed oil was carried out by standard IUPAC methods for the analysis of fats and oils (Dieffenbacher and Pocklington, 1987) [14]. Oxidation value (OV) was calculated from Holm’s equation, OV = p-AV + 2 (PV). Oxidative stability was evaluated by the Rancimat method (Gutierrez, 1989) [15]. Stability was expressed as the oxidation induc-tion time (hours), measured with the Rancimat 743 apparatus (Metrohm Co., Basel, Switzerland), using an oil sample of 3 g warmed to 100°C and air flow of 10 l/h. Polyphenol content was determined according to the method described by Gutfinger (1981) [16]. Hi-gher Heating Value (HHV), known as the gross calori-fic value or gross energy, represents the heat released by the oxidation of a fuel in air. HHV is the amount of heat produced by the complete combustion of a unit quantity of fuel. The HHV of flaxseed oil was calculated from the density, the iodine value (IV) and saponification value (SV) derived using the following formula adopted by Demirbas (1998) [17] and Demir-bas (2000) [18]HHV = 49.43 – (0.041 × SV) – (0.015 × IV) (Equation 1)HHV = 79.014 - 43.126 d (Equation 2)HHV = - 45.736 + 224.028 d − 142.935 d2 (Equation 3)The cetane number (CN) of the oil was determined according to Bose (2009) [19]:CN = 46.3 + 5458/SV – 0.225 × IV
DETERMINATION OF ANTIOXIDANT ACTIVITY The oil obtained was subjected to screening for its possible antioxidant activity. The oil was assessed using 1, 1- diphenyl - 2- picrylhydrazyl (DPPH) radical-scavenging assay. The DPPH free radical-scavenging activity of oil was measured using the method descri-bed by Gorinstein et al., (2004) [20]. A 0.1 mM solu-tion of DPPH in methanol was prepared. An aliquot of 0.2 mL of sample was added to 2.8 mL of this solu-tion and kept in the dark for 30 min. The absorbance was immediately measured at 517 nm. The ability to scavenge the DPPH radical was calculated with the following equation:Inhibition percentage = (I %) = [(A0 − A1) / A0] × 100Where A0 is the absorbance of the control, and A1 is the absorbance in the presence of sample.
STATISTICAL ANALYSIS Statistical analysis was performed using the Proc ANOVA in SAS (software version 8). All analyses were replicated three times for each sample. Data were analyzed at 5% significance.
RESULTS AND DISCUSSIONS
EFFECT OF HARVEST YEAR ON THE TRIGLYCERIDE COMPOSITION OF FLAXSEED OIL The distribution of the TAG harvested in different ye-ars is presented in Table II. The distribution patterns of the molecular species of TAG were very similar in
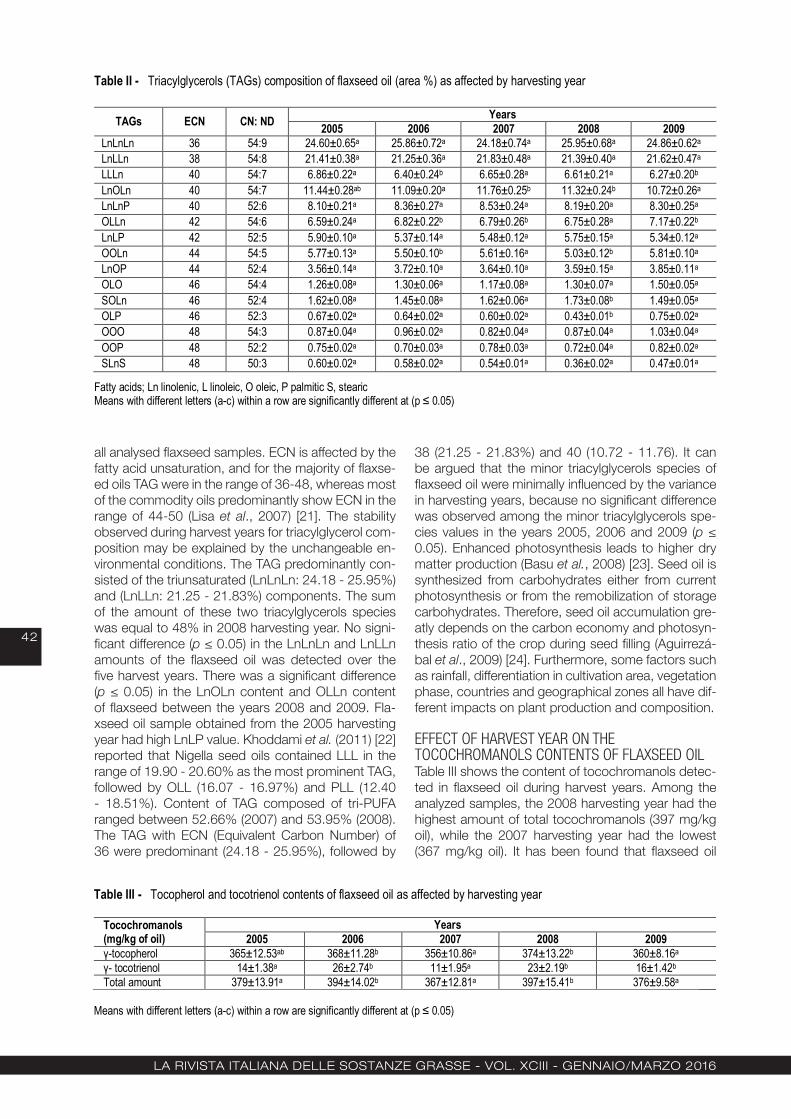
La rivista itaLiana deLLe sostanze grasse - voL. XCiii - gennaio/Marzo 2016
42
all analysed flaxseed samples. ECN is affected by the fatty acid unsaturation, and for the majority of flaxse-ed oils TAG were in the range of 36-48, whereas most of the commodity oils predominantly show ECN in the range of 44-50 (Lisa et al., 2007) [21]. The stability observed during harvest years for triacylglycerol com-position may be explained by the unchangeable en-vironmental conditions. The TAG predominantly con-sisted of the triunsaturated (LnLnLn: 24.18 - 25.95%) and (LnLLn: 21.25 - 21.83%) components. The sum of the amount of these two triacylglycerols species was equal to 48% in 2008 harvesting year. No signi-ficant difference (p ≤ 0.05) in the LnLnLn and LnLLn amounts of the flaxseed oil was detected over the five harvest years. There was a significant difference (p ≤ 0.05) in the LnOLn content and OLLn content of flaxseed between the years 2008 and 2009. Fla-xseed oil sample obtained from the 2005 harvesting year had high LnLP value. Khoddami et al. (2011) [22] reported that Nigella seed oils contained LLL in the range of 19.90 - 20.60% as the most prominent TAG, followed by OLL (16.07 - 16.97%) and PLL (12.40 - 18.51%). Content of TAG composed of tri-PUFA ranged between 52.66% (2007) and 53.95% (2008). The TAG with ECN (Equivalent Carbon Number) of 36 were predominant (24.18 - 25.95%), followed by
38 (21.25 - 21.83%) and 40 (10.72 - 11.76). It can be argued that the minor triacylglycerols species of flaxseed oil were minimally influenced by the variance in harvesting years, because no significant difference was observed among the minor triacylglycerols spe-cies values in the years 2005, 2006 and 2009 (p ≤ 0.05). Enhanced photosynthesis leads to higher dry matter production (Basu et al., 2008) [23]. Seed oil is synthesized from carbohydrates either from current photosynthesis or from the remobilization of storage carbohydrates. Therefore, seed oil accumulation gre-atly depends on the carbon economy and photosyn-thesis ratio of the crop during seed filling (Aguirrezá-bal et al., 2009) [24]. Furthermore, some factors such as rainfall, differentiation in cultivation area, vegetation phase, countries and geographical zones all have dif-ferent impacts on plant production and composition.
EFFECT OF HARVEST YEAR ON THE TOCOCHROMANOLS CONTENTS OF FLAXSEED OIL Table III shows the content of tocochromanols detec-ted in flaxseed oil during harvest years. Among the analyzed samples, the 2008 harvesting year had the highest amount of total tocochromanols (397 mg/kg oil), while the 2007 harvesting year had the lowest (367 mg/kg oil). It has been found that flaxseed oil
Table II - Triacylglycerols (TAGs) composition of flaxseed oil (area %) as affected by harvesting year
TAGs ECN CN: ND Years
2005 2006 2007 2008 2009 LnLnLn 36 54:9 24.60±0.65a 25.86±0.72a 24.18±0.74a 25.95±0.68a 24.86±0.62a LnLLn 38 54:8 21.41±0.38a 21.25±0.36a 21.83±0.48a 21.39±0.40a 21.62±0.47a LLLn 40 54:7 6.86±0.22a 6.40±0.24b 6.65±0.28a 6.61±0.21a 6.27±0.20b LnOLn 40 54:7 11.44±0.28ab 11.09±0.20a 11.76±0.25b 11.32±0.24b 10.72±0.26a LnLnP 40 52:6 8.10±0.21a 8.36±0.27a 8.53±0.24a 8.19±0.20a 8.30±0.25a OLLn 42 54:6 6.59±0.24a 6.82±0.22b 6.79±0.26b 6.75±0.28a 7.17±0.22b LnLP 42 52:5 5.90±0.10a 5.37±0.14a 5.48±0.12a 5.75±0.15a 5.34±0.12a OOLn 44 54:5 5.77±0.13a 5.50±0.10b 5.61±0.16a 5.03±0.12b 5.81±0.10a LnOP 44 52:4 3.56±0.14a 3.72±0.10a 3.64±0.10a 3.59±0.15a 3.85±0.11a OLO 46 54:4 1.26±0.08a 1.30±0.06a 1.17±0.08a 1.30±0.07a 1.50±0.05a SOLn 46 52:4 1.62±0.08a 1.45±0.08a 1.62±0.06a 1.73±0.08b 1.49±0.05a OLP 46 52:3 0.67±0.02a 0.64±0.02a 0.60±0.02a 0.43±0.01b 0.75±0.02a OOO 48 54:3 0.87±0.04a 0.96±0.02a 0.82±0.04a 0.87±0.04a 1.03±0.04a OOP 48 52:2 0.75±0.02a 0.70±0.03a 0.78±0.03a 0.72±0.04a 0.82±0.02a SLnS 48 50:3 0.60±0.02a 0.58±0.02a 0.54±0.01a 0.36±0.02a 0.47±0.01a
Fatty acids; Ln linolenic, L linoleic, O oleic, P palmitic S, stearic Means with different letters (a-c) within a row are significantly different at (p ≤ 0.05)
Table III - Tocopherol and tocotrienol contents of flaxseed oil as affected by harvesting year
Tocochromanols (mg/kg of oil)
Years 2005 2006 2007 2008 2009
γ-tocopherol 365±12.53ab 368±11.28b 356±10.86a 374±13.22b 360±8.16a γ- tocotrienol 14±1.38a 26±2.74b 11±1.95a 23±2.19b 16±1.42b Total amount 379±13.91a 394±14.02b 367±12.81a 397±15.41b 376±9.58a
Means with different letters (a-c) within a row are significantly different at (p ≤ 0.05)
Table IV - Quality indices and antioxidant activity of flaxseed oil as affected by harvesting year
Parameters Years
2005 2006 2007 2008 2009 FFA 0.50±0.10a 0.35±0.08b 0.40±0.06b 0.45±0.08a 0.42±0.05ab PV (meq O2 /kg oil) 1.7±0.20a 1.6±0.10a 1.8±0.14a 1.5±0.18a 1.8±0.15a p-AV 0.9±0.09a 0.7±0.08a 1.0±0.10a 0.6±0.05a 0.9±0.08a OV 4.3±0.38a 3.9±0.32a 4.6±0.42a 3.6±0.35a 4.5±0.30a K232 1.95±0.14a 1.90±0.12a 2.10±0.14a 1.85±0.16a 2.06±0.12a K270 0.16±0.04a 0.14±0.02a 0.18±0.02a 0.12±0.02a 0.18±0.04a R-value (K232/K270) 12.18±0.15ª 13.57±0.16b 11.66±0.18b 15.41±0.10b 11.44±0.12a Total polyphenol (as mg gallic acid/kg of oil)
110±1.41a 118±1.86b 115±1.58b 120±1.95b 112±1.72a
Oil stability (h) 1.3±0.04a 1.3±0.06a 1.1±0.04a 1.4±0.02a 1.2±0.02a Inhibition (%) 55.12±3.34ab 57.74±2.60b 52.81±2.25a 58.33±3.14b 54.26±2.68a
Means with different letters (a-c) within a row are significantly different at (p ≤ 0.05)

La rivista itaLiana deLLe sostanze grasse - voL. XCiii - gennaio/Marzo 2016
43
is an excellent source of γ-tocopherol (Herchi et al., 2011) [13]. γ-tocopherol was the predominant isomer found, constituting over 90% of the total tocochro-manols (Table III). There was significant difference (p ≤ 0.05) in the γ-tocopherol amounts of flaxseed over the five harvest years. The amounts of γ-tocopherol ranged from 356 mg/kg oil (2007) to 374 mg/kg oil (2008) (Table III). Flaxseed oil can be considered a good source of vitamin E together with the excel-lent composition of triacylglycerols. γ-tocotrienol was found in flaxseed oils, with amounts ranging from 11 mg/kg (2007) to 26 mg/kg (2006). There was signifi-cant difference (p ≤ 0.05) between the γ-tocotrienol amounts of flaxseed over the five harvest years. The high level of tocochromanols may contribute to the health benefits offered by flaxseed. It has been clai-med that tocopherols protects cell membranes from oxidation by transferring lipid radicals into unreactive compounds (Seppanen et al., 2010) [25]. The diffe-rences in γ-tocopherol and γ-tocotrienol contents between harvest years could be explained by the activities variance of “2, 3-dimethyl-5- phytylbenzo-quinol specific translocase” and “‘tocopherol cycla-se”, respectively, over the five years. Piao et al. (2014) [26], who have studied the effects of harvest year on tocopherol content of sunflower (Helianthus annuus L.) Germplasm, have reported that all tocopherol sho-wed significant differences between two years. Solar radiation reaching the earth surface varies from year to year (Liepert, 2002) [27]. This change in solar ra-diation may cause an alteration in the photosynthe-sis ratio of agricultural crops and the composition of oilseeds. Aguirrezábal et al. (2009) [24] reported that intercepted radiation per plant, temperature, foliar diseases, sowing date and sowing density all have direct effects on seed oil concentration. However, dif-ferences in temperature and solar radiation per year are unavoidable. These factors could potentially cau-se more severe effects on crops, resulting in modifi-cations over the years (Spiertz et al., 2006) [28].
EFFECT OF HARVEST YEAR ON THE QUALITY CHARACTERISTICS AND ANTIOXIDANT ACTIVITY OF FLAXSEED OIL Quality and stability characteristics of different flaxse-ed oils during harvest years are shown in Table IV. FFA was determined in the range of 0.35 - 0.50. FFA is formed by hydrolysis of triacylglycerol by lipase in the mesocarp of the flaxseed. This enzyme is activated at maturity by bruising the seed and, to some extent, by microbial contamination (Ebongue et al., 2006) [29]. FFA was highly influenced by harvest year. The PV (mequiv/kg of oil) and p-anisidine value (p-AV) measu-re hydroperoxides and secondary oxidation products, i.e. aldehydes, of the oils, respectively (Dabbou et al., 2010) [30]. In this study, the PV ranged from 1.5 to 1.8 (meq O2 /kg oil), values lower than those described in the EU Regulations (20 meq O2/kg oil). This parame-ter is influenced by natural circumstances (e.g. tem-peratures below freezing, dacic infestations, drought, etc.), seeds incorrectly harvested, bad processing during milling, incorrect hygiene in the flaxseed-press and/or of the vessels and storage conditions such as prolonged exposure of the oil to light or heat sources (Dabbou et al., 2010) [30]. No significant differences were observed in the PV over the five studied years. The highest p-AV was found in 2007 harvesting year. The p-AV values of 0.6-1.0 anisidine units suggest the lack of significant amounts of secondary oxidation products in the test oil samples. p-AV was not affec-ted by harvest year. There was no significant differen-ce (p ≤ 0.05) in the OV (3.6 - 4.6) over the five studied years. In Table IV it can be seen that conjugated diene levels were not influenced by harvest year. Total po-lyphenol content ranged from 110 to 120 mg gallic acid/kg of oil (Table IV). In flaxseed oils the maximum content of total polyphenol content was detected in harvesting year 2008. These results show that the oil obtained in the year 2008 had better stability than the others. Harvest year had a significant effect (p ≤ 0.05) on total polyphenol content. The Rancimat method is
Table III - Tocopherol and tocotrienol contents of flaxseed oil as affected by harvesting year
Tocochromanols (mg/kg of oil)
Years 2005 2006 2007 2008 2009
γ-tocopherol 365±12.53ab 368±11.28b 356±10.86a 374±13.22b 360±8.16a γ- tocotrienol 14±1.38a 26±2.74b 11±1.95a 23±2.19b 16±1.42b Total amount 379±13.91a 394±14.02b 367±12.81a 397±15.41b 376±9.58a
Means with different letters (a-c) within a row are significantly different at (p ≤ 0.05)
Table IV - Quality indices and antioxidant activity of flaxseed oil as affected by harvesting year
Parameters Years
2005 2006 2007 2008 2009 FFA 0.50±0.10a 0.35±0.08b 0.40±0.06b 0.45±0.08a 0.42±0.05ab PV (meq O2 /kg oil) 1.7±0.20a 1.6±0.10a 1.8±0.14a 1.5±0.18a 1.8±0.15a p-AV 0.9±0.09a 0.7±0.08a 1.0±0.10a 0.6±0.05a 0.9±0.08a OV 4.3±0.38a 3.9±0.32a 4.6±0.42a 3.6±0.35a 4.5±0.30a K232 1.95±0.14a 1.90±0.12a 2.10±0.14a 1.85±0.16a 2.06±0.12a K270 0.16±0.04a 0.14±0.02a 0.18±0.02a 0.12±0.02a 0.18±0.04a R-value (K232/K270) 12.18±0.15ª 13.57±0.16b 11.66±0.18b 15.41±0.10b 11.44±0.12a Total polyphenol (as mg gallic acid/kg of oil)
110±1.41a 118±1.86b 115±1.58b 120±1.95b 112±1.72a
Oil stability (h) 1.3±0.04a 1.3±0.06a 1.1±0.04a 1.4±0.02a 1.2±0.02a Inhibition (%) 55.12±3.34ab 57.74±2.60b 52.81±2.25a 58.33±3.14b 54.26±2.68a
Means with different letters (a-c) within a row are significantly different at (p ≤ 0.05)
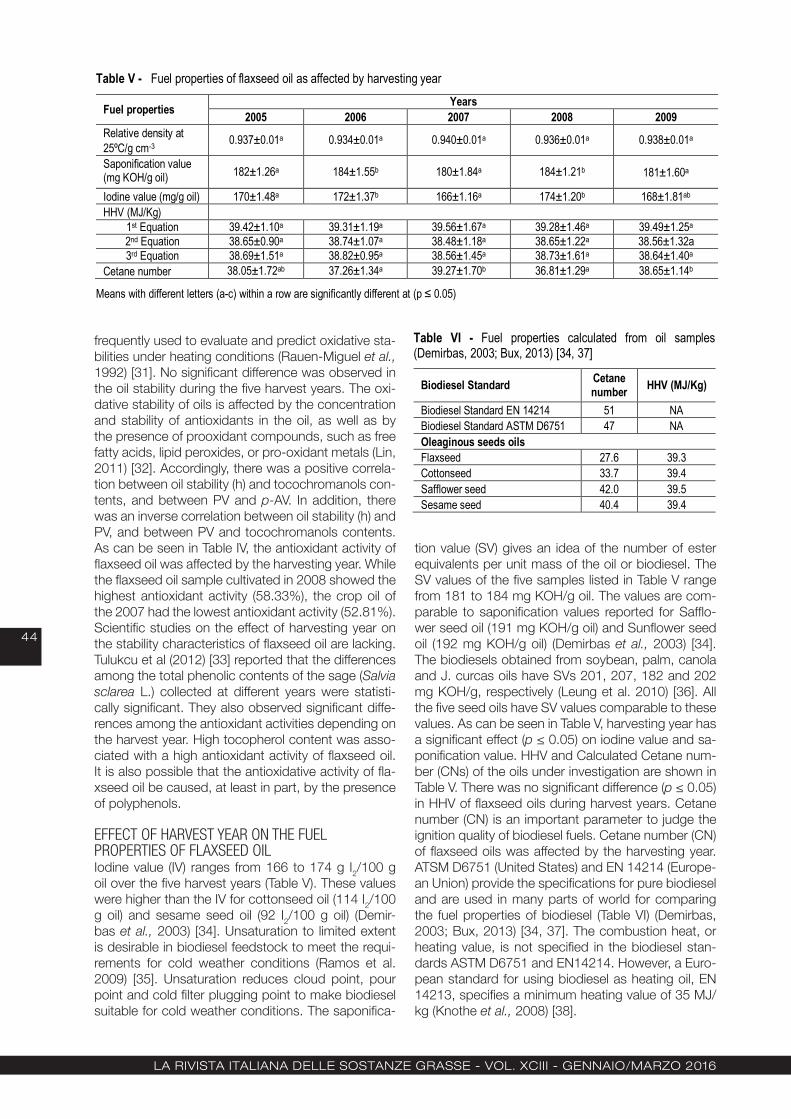
La rivista itaLiana deLLe sostanze grasse - voL. XCiii - gennaio/Marzo 2016
44
frequently used to evaluate and predict oxidative sta-bilities under heating conditions (Rauen-Miguel et al., 1992) [31]. No significant difference was observed in the oil stability during the five harvest years. The oxi-dative stability of oils is affected by the concentration and stability of antioxidants in the oil, as well as by the presence of prooxidant compounds, such as free fatty acids, lipid peroxides, or pro-oxidant metals (Lin, 2011) [32]. Accordingly, there was a positive correla-tion between oil stability (h) and tocochromanols con-tents, and between PV and p-AV. In addition, there was an inverse correlation between oil stability (h) and PV, and between PV and tocochromanols contents. As can be seen in Table IV, the antioxidant activity of flaxseed oil was affected by the harvesting year. While the flaxseed oil sample cultivated in 2008 showed the highest antioxidant activity (58.33%), the crop oil of the 2007 had the lowest antioxidant activity (52.81%). Scientific studies on the effect of harvesting year on the stability characteristics of flaxseed oil are lacking. Tulukcu et al (2012) [33] reported that the differences among the total phenolic contents of the sage (Salvia sclarea L.) collected at different years were statisti-cally significant. They also observed significant diffe-rences among the antioxidant activities depending on the harvest year. High tocopherol content was asso-ciated with a high antioxidant activity of flaxseed oil. It is also possible that the antioxidative activity of fla-xseed oil be caused, at least in part, by the presence of polyphenols.
EFFECT OF HARVEST YEAR ON THE FUEL PROPERTIES OF FLAXSEED OIL Iodine value (IV) ranges from 166 to 174 g I2/100 g oil over the five harvest years (Table V). These values were higher than the IV for cottonseed oil (114 I2/100 g oil) and sesame seed oil (92 I2/100 g oil) (Demir-bas et al., 2003) [34]. Unsaturation to limited extent is desirable in biodiesel feedstock to meet the requi-rements for cold weather conditions (Ramos et al. 2009) [35]. Unsaturation reduces cloud point, pour point and cold filter plugging point to make biodiesel suitable for cold weather conditions. The saponifica-
tion value (SV) gives an idea of the number of ester equivalents per unit mass of the oil or biodiesel. The SV values of the five samples listed in Table V range from 181 to 184 mg KOH/g oil. The values are com-parable to saponification values reported for Safflo-wer seed oil (191 mg KOH/g oil) and Sunflower seed oil (192 mg KOH/g oil) (Demirbas et al., 2003) [34]. The biodiesels obtained from soybean, palm, canola and J. curcas oils have SVs 201, 207, 182 and 202 mg KOH/g, respectively (Leung et al. 2010) [36]. All the five seed oils have SV values comparable to these values. As can be seen in Table V, harvesting year has a significant effect (p ≤ 0.05) on iodine value and sa-ponification value. HHV and Calculated Cetane num-ber (CNs) of the oils under investigation are shown in Table V. There was no significant difference (p ≤ 0.05) in HHV of flaxseed oils during harvest years. Cetane number (CN) is an important parameter to judge the ignition quality of biodiesel fuels. Cetane number (CN) of flaxseed oils was affected by the harvesting year. ATSM D6751 (United States) and EN 14214 (Europe-an Union) provide the specifications for pure biodiesel and are used in many parts of world for comparing the fuel properties of biodiesel (Table VI) (Demirbas, 2003; Bux, 2013) [34, 37]. The combustion heat, or heating value, is not specified in the biodiesel stan-dards ASTM D6751 and EN14214. However, a Euro-pean standard for using biodiesel as heating oil, EN 14213, specifies a minimum heating value of 35 MJ/kg (Knothe et al., 2008) [38].
Table V - Fuel properties of flaxseed oil as affected by harvesting year
Fuel properties Years
2005 2006 2007 2008 2009 Relative density at 25ºC/g cm-3
0.937±0.01a 0.934±0.01a 0.940±0.01a 0.936±0.01a 0.938±0.01a
Saponification value (mg KOH/g oil) 182±1.26a 184±1.55b 180±1.84a 184±1.21b 181±1.60a
Iodine value (mg/g oil) 170±1.48a 172±1.37b 166±1.16a 174±1.20b 168±1.81ab HHV (MJ/Kg)
1st Equation 39.42±1.10a 39.31±1.19a 39.56±1.67a 39.28±1.46a 39.49±1.25a 2nd Equation 38.65±0.90a 38.74±1.07a 38.48±1.18a 38.65±1.22a 38.56±1.32a 3rd Equation 38.69±1.51a 38.82±0.95a 38.56±1.45a 38.73±1.61a 38.64±1.40a
Cetane number 38.05±1.72ab 37.26±1.34a 39.27±1.70b 36.81±1.29a 38.65±1.14b
Means with different letters (a-c) within a row are significantly different at (p ≤ 0.05)
Table VI - Fuel properties calculated from oil samples (Demirbas, 2003; Bux, 2013) [34, 37]
Biodiesel Standard Cetane number
HHV (MJ/Kg)
Biodiesel Standard EN 14214 51 NA Biodiesel Standard ASTM D6751 47 NA Oleaginous seeds oils Flaxseed 27.6 39.3 Cottonseed 33.7 39.4 Safflower seed 42.0 39.5 Sesame seed 40.4 39.4
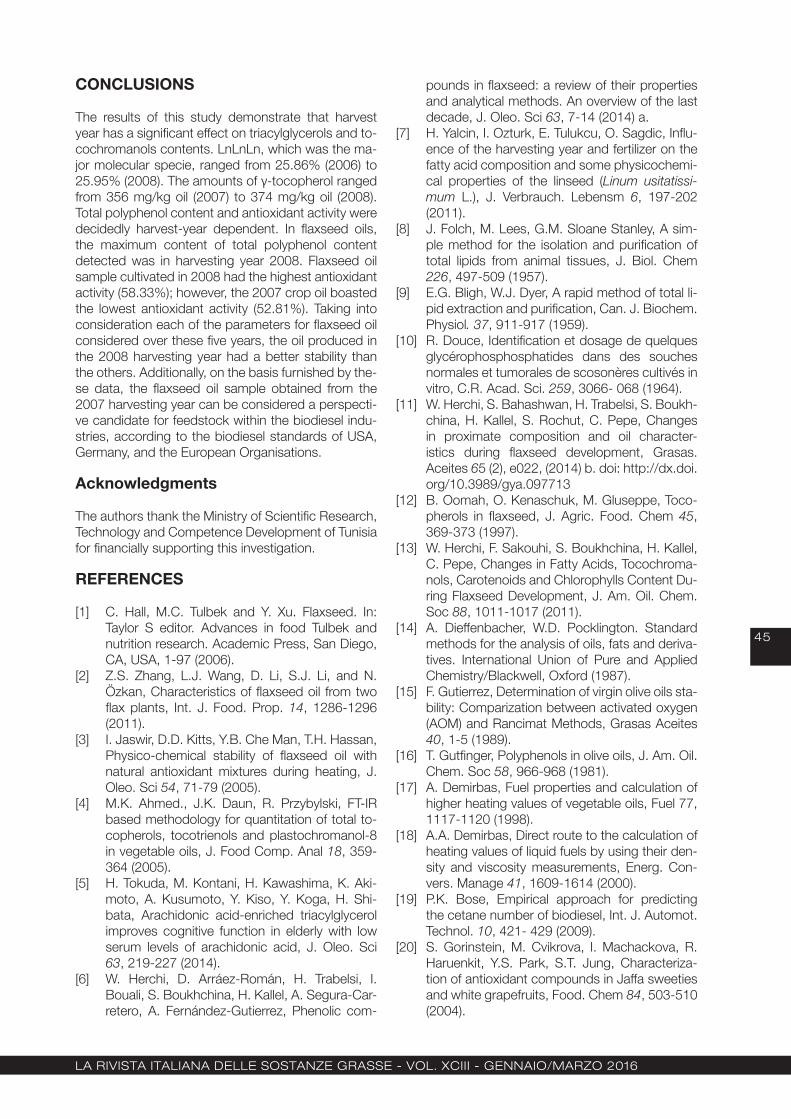
La rivista itaLiana deLLe sostanze grasse - voL. XCiii - gennaio/Marzo 2016
45
CONCLUSIONS
The results of this study demonstrate that harvest year has a significant effect on triacylglycerols and to-cochromanols contents. LnLnLn, which was the ma-jor molecular specie, ranged from 25.86% (2006) to 25.95% (2008). The amounts of γ-tocopherol ranged from 356 mg/kg oil (2007) to 374 mg/kg oil (2008). Total polyphenol content and antioxidant activity were decidedly harvest-year dependent. In flaxseed oils, the maximum content of total polyphenol content detected was in harvesting year 2008. Flaxseed oil sample cultivated in 2008 had the highest antioxidant activity (58.33%); however, the 2007 crop oil boasted the lowest antioxidant activity (52.81%). Taking into consideration each of the parameters for flaxseed oil considered over these five years, the oil produced in the 2008 harvesting year had a better stability than the others. Additionally, on the basis furnished by the-se data, the flaxseed oil sample obtained from the 2007 harvesting year can be considered a perspecti-ve candidate for feedstock within the biodiesel indu-stries, according to the biodiesel standards of USA, Germany, and the European Organisations.
Acknowledgments
The authors thank the Ministry of Scientific Research, Technology and Competence Development of Tunisia for financially supporting this investigation.
REFERENCES
[1] C. Hall, M.C. Tulbek and Y. Xu. Flaxseed. In: Taylor S editor. Advances in food Tulbek and nutrition research. Academic Press, San Diego, CA, USA, 1-97 (2006).
[2] Z.S. Zhang, L.J. Wang, D. Li, S.J. Li, and N. Özkan, Characteristics of flaxseed oil from two flax plants, Int. J. Food. Prop. 14, 1286-1296 (2011).
[3] I. Jaswir, D.D. Kitts, Y.B. Che Man, T.H. Hassan, Physico-chemical stability of flaxseed oil with natural antioxidant mixtures during heating, J. Oleo. Sci 54, 71-79 (2005).
[4] M.K. Ahmed., J.K. Daun, R. Przybylski, FT-IR based methodology for quantitation of total to-copherols, tocotrienols and plastochromanol-8 in vegetable oils, J. Food Comp. Anal 18, 359-364 (2005).
[5] H. Tokuda, M. Kontani, H. Kawashima, K. Aki-moto, A. Kusumoto, Y. Kiso, Y. Koga, H. Shi-bata, Arachidonic acid-enriched triacylglycerol improves cognitive function in elderly with low serum levels of arachidonic acid, J. Oleo. Sci 63, 219-227 (2014).
[6] W. Herchi, D. Arráez-Román, H. Trabelsi, I. Bouali, S. Boukhchina, H. Kallel, A. Segura-Car-retero, A. Fernández-Gutierrez, Phenolic com-
pounds in flaxseed: a review of their properties and analytical methods. An overview of the last decade, J. Oleo. Sci 63, 7-14 (2014) a.
[7] H. Yalcin, I. Ozturk, E. Tulukcu, O. Sagdic, Influ-ence of the harvesting year and fertilizer on the fatty acid composition and some physicochemi-cal properties of the linseed (Linum usitatissi-mum L.), J. Verbrauch. Lebensm 6, 197-202 (2011).
[8] J. Folch, M. Lees, G.M. Sloane Stanley, A sim-ple method for the isolation and purification of total lipids from animal tissues, J. Biol. Chem 226, 497-509 (1957).
[9] E.G. Bligh, W.J. Dyer, A rapid method of total li-pid extraction and purification, Can. J. Biochem. Physiol. 37, 911-917 (1959).
[10] R. Douce, Identification et dosage de quelques glycérophosphosphatides dans des souches normales et tumorales de scosonères cultivés in vitro, C.R. Acad. Sci. 259, 3066- 068 (1964).
[11] W. Herchi, S. Bahashwan, H. Trabelsi, S. Boukh-china, H. Kallel, S. Rochut, C. Pepe, Changes in proximate composition and oil character-istics during flaxseed development, Grasas. Aceites 65 (2), e022, (2014) b. doi: http://dx.doi.org/10.3989/gya.097713
[12] B. Oomah, O. Kenaschuk, M. Gluseppe, Toco-pherols in flaxseed, J. Agric. Food. Chem 45, 369-373 (1997).
[13] W. Herchi, F. Sakouhi, S. Boukhchina, H. Kallel, C. Pepe, Changes in Fatty Acids, Tocochroma-nols, Carotenoids and Chlorophylls Content Du-ring Flaxseed Development, J. Am. Oil. Chem. Soc 88, 1011-1017 (2011).
[14] A. Dieffenbacher, W.D. Pocklington. Standard methods for the analysis of oils, fats and deriva-tives. International Union of Pure and Applied Chemistry/Blackwell, Oxford (1987).
[15] F. Gutierrez, Determination of virgin olive oils sta-bility: Comparization between activated oxygen (AOM) and Rancimat Methods, Grasas Aceites 40, 1-5 (1989).
[16] T. Gutfinger, Polyphenols in olive oils, J. Am. Oil. Chem. Soc 58, 966-968 (1981).
[17] A. Demirbas, Fuel properties and calculation of higher heating values of vegetable oils, Fuel 77, 1117-1120 (1998).
[18] A.A. Demirbas, Direct route to the calculation of heating values of liquid fuels by using their den-sity and viscosity measurements, Energ. Con-vers. Manage 41, 1609-1614 (2000).
[19] P.K. Bose, Empirical approach for predicting the cetane number of biodiesel, Int. J. Automot. Technol. 10, 421- 429 (2009).
[20] S. Gorinstein, M. Cvikrova, I. Machackova, R. Haruenkit, Y.S. Park, S.T. Jung, Characteriza-tion of antioxidant compounds in Jaffa sweeties and white grapefruits, Food. Chem 84, 503-510 (2004).
La rivista itaLiana deLLe sostanze grasse - voL. XCiii - gennaio/Marzo 2016
46
[21] M. Lisa, F. Lynen, M. Holcapek, P. Sandra, Quantitation of triacylglycerols from plant oils using charged aerosol detection with gradient compensation, J. Chromatogr. A 1176, 135-142 (2007).
[22] A. Khoddami, H.M. Ghazali, A. Yassoralipour, Y. Ramakrishnan, A. Ganjloo, Physicochemical characteristics of Nigella Seed (Nigella sativa L.) oil as affected by different extraction methods. J. Am. Oil. Chem. Soc 88, 533-540 (2011).
[23] M. Basu, P.B.S. Bhadoria, S.C. Mahapatra, Growth, nitrogen fixation, yield and kernel qual-ity of peanut in response to lime, organic and inorganic fertilizer levels, Bioresour. Technol 99, 4675-4683 (2008).
[24] L. Aguirrezábal, P. Martre, G. Pereyra-Irujo, N. Izquierdo, V. Allard. Management and breeding strategies for the improvement of grain and oil quality. In: Sadras O., Calderini D. (Eds.), Crop Physiology. Academic Press, 387-411 (2009).
[25] C.M. Seppanen, Q. Song, A.S. Csallany, The antioxidant functions of tocopherol and tocotrie-nol homologues in oils, fats, and food systems, J. Am. Oil. Chem. Soc 87, 469-481 (2010).
[26] X.M. Piao, S.Y. Choi, Y.S. Jang, Y.S. So, J.W. Chung, S.Y. Lee, J.H. Jong, H.S. Kim, Effect of Genotype, Growing Year and Planting Date on Agronomic Traits and Chemical Composition in Sunflower (Helianthus annuus L.) Germplasm, Plant. Breed. Biotech 2, 35-47 (2014).
[27] B.G. Liepert, Observed reductions of surface solar radiation at sites in the United States and worldwide from 1961 to 1990, Geophy. Res. Lett 29, 1421-1426 (2002).
[28] J.H.J. Spiertz, R.J. Hamer, H. Xu, C. Primo-Mar-tin, C. Don, P.E.L Van Der Putten, Heat stress in wheat (Triticum aestivum L.), effects on grain growth and quality traits, Eur. J. Agron 25, 89-95 (2006).
[29] G.F.N. Ebongue, R. Dhouib, F. Carrière, P.H. Amvam Zollo, V. Arondel, Assaying lipase activ-
ity from oil palm fruit (Elaeis guineensis Jacq.) mesocarp, Plant Physiol. Bioch 44, 611-617 (2006).
[30] S. Dabbou, F. Brahmi, A. Taamali, M. Issaoui, Y. Ouni, M. Braham, M. Zarrouk, M. Hammami, Extra Virgin Olive Oil Components and Oxidative Stability from Olives Grown in Tunisia, J. Am. Oil. Chem. Soc 87, 1199-1209 (2010).
[31] A.M.O. Rauen-Miguel, W. Esteves, D. Barrera-Arellano, Determinación del período de induc-ción de aceite de soja. Correlación entre el Rancimat y otros índices, Grasas Aceites 43, 119-122 (1992).
[32] S.W. Lin. Vegetable oils in food technology: com-position, properties and use. Blackwell Publish-ing, Iowa, 59-93. Palm oil en F.D. Gunstone (1th Ed.) (2011).
[33] E. Tulukcu, H. Yalcin, I. Ozturk, O. Sagdic, Changes in the fatty acid compositions and bio-activities of clary sage seeds depending on har-vest year, Ind. Crop. Prod 39, 69-73 (2012).
[34] A. Demirbas, Chemical and fuel properties of seventeen vegetable oils. Energ. Sources 25, 721-728 (2003).
[35] M.J. Ramos, C.M. Fernandez, A. Casas, L. Ro-driguez, A. Perez, Influence of fatty acid compo-sition of raw materials on biodiesel properties, Bioresour. Technol 100, 261-268 (2009).
[36] D.Y.C. Leung, X. Wu, M.K.H. Leung, A review on biodiesel production using catalyzed transeste-rification, Appl. Energ 87, 1083–1095 (2010).
[37] F. Bux, Biotechnological Applications of Microal-gae. Biodiesel and Value-Added Products. CRC Press, Boca Raton, Florida, 239 pp (2013).
[38] G. Knothe, “Designer” Biodiesel: Optimizing Fatty Ester Composition to Improve Fuel Pro-perties. Ener. Fuels 22, 1358-1364 (2008).
Received, January 7, 2015Accepted, March 15, 2015

La rivista itaLiana deLLe sostanze grasse - voL. XCiii - gennaio/Marzo 2016
47
Ö. Gültekina
M.M. Özcan*b
F. Al Juhaimi3
aThe Ministry of Food, Agriculture and Livestock, Mersin Provincial Directory,
Mersin/TURKEY
bSelcuk University, Faculty of Agriculture, Department of Food
Engineering, Konya/TURKEY
cDepartment of Food Science & Nutrition, College of Food and
Agricultural Sciences, King Saud University,Riyadh-Saudi Arabia
(*) CORRESPONDING AUTHOR:M.M. ÖZCAN
Selcuk University, Faculty of Agriculture, Department of Food Engineering
42079, Konya/TURKEYTel: +90 332 223 2933
e-mail: [email protected]
short notesome physicochemical properties,
fatty acid composition, and tocopherol contents of Citrus seed oils
In this study, the refractive index, viscosity and specific gravity values do not show any important variation between different species and locations. As regards the fatty acid composition, major fatty acids are palmitic acid, stearic acid and arachidic acid as SFA (saturated fatty acid); oleic acid as MUFA (monounsaturated fatty acid); linoleic acid and linolenic acid as PUFA (polyunsaturated fatty acid). While linoleic acid contents are found to be between 35.99% (Interdonato) and 44.86% (Encore), oleic acid contents are found as 21.72% (Robinson) and 32.16% (Interdonato) for the 2008 harvest year. In addition, linolenic acid contents are valued at 3.58% and 8.69% for lemon seed oils and 4.56% and 4.96% for orange seed oils for 2009 harvest year, respectively. The palmitic acid content of samples is assessed between 23.29% (Interdonato-Lemon) and 28.62% (dörtyol domestic-orange) for 2008 harvest year. α, β, γ and δ-tocopherol contents of citrus seed oils are found between 9.74-699.37, 0.00-0.05, 0.00-7.34, 0.00-0.46 mg/kg, respectively.Keywords: Citrus seed oil, Physicochemical properties, Fatty acid, Tocopherol
Proprietà fisico-chimiche, composizione degli acidi grassi e dei tocoferoli contenuti negli oli di semi di agrumi I valori dell’indice di rifrazione, viscosità e del peso specifico non hanno evidenziato alcune differenze significative a seconda della specie e della località.Nella composizione degli acidi grassi, i principali erano acido palmitico, acido stearico e arachidico come SFA (acidi grassi saturi); acido oleico come MUFA (acido grasso monoinsaturo); acido linoleico e acido linolenico come PUFA (acidi grassi polinsaturi). Per l’anno di raccolta 2008 mentre il contenuto di acido linoleico era tra il 35,99% (Interdonato) e 44,86% (Encore), il contenuto di acido oleico era tra il 21,72% (Robinson) e 32,16% (Interdonato).Per l’anno di raccolta 2009 i contenuti di acido linolenico sono stati stabiliti in 3,58% e 8,69% per gli oli di semi di limone, 4,56% e 4,96% per gli oli di semi d’arancio, rispettivamente. Il contenuto di acido palmitico dei campioni era tra il 23,29% (Interdonato-Limone) e 28,62% (Dörtyol domestico-arancio) per l’anno di raccolta 2008.I contenuti di α, β, γ e δ-tocoferolo degli oli di semi di agrumi si trovano tra 9,74-699,37; 0,00-0,05; 0,00-7,34; 0,00-0,46 mg/kg, rispettivamente.Parole chiave: Olio di semi di agrumi, Proprietà fisico-chimiche, Acidi grassi, Tocoferolo

La rivista itaLiana deLLe sostanze grasse - voL. XCiii - gennaio/Marzo 2016
48
1. INTRODUCTION
Citrus genus includes various species, such as Citrus sinensis (orange), Citrus reticulata (mandarin) and Citrus limon (lemon) [1]. Citrus fruits are mostly used for juice, marmalade, jam and canned fruit produc-tion. 50% of processed fruit becomes waste [2, 3]. The seeds located in the fruit amount to 0.1-5.0% by mass; this percentage may differ according to spe-cies and varieties. Seeds are used for oil extraction and recovery of terpenoids [4]. Nowadays, there is a shortage of common oil sources and identifying alter-native oil seeds and kernels has become a necessity [5]. Seeds can be seen as a useful oil source [6], for they contain nearly 36% crude oil [7]. Today, Citrus seeds, so far seen as an industrial waste, have be-come important in the search for new, edible oils [8]. Tocopherols show antioxidant activity, binding hydro-gen of hydroxyl group to lipid peroxyl radical. This is thought to be effective on the increasing oxidative stability and decreasing oxidation rate as the tempe-rature increases [9]. The aim of the present study is to determine the phy-sico-chemical properties, fatty acid composition and tocopherol contents of some Citrus seed oils.
2. MATERIAL AND METHODS
This study has employed seeds of mandarin, orange and lemon fruits obtained for 2 years from Antalya, Mersin, Hatay and Aydin locations of Turkey. Oil was extracted from the seeds using a cold extraction me-thod with n-hexane. The refractive index was mea-sured with an abbe refractometer (Atago RX-7000α) at 25°C. Viscosity of the seed oils was measured at 25°C with a viscometer (AND-SV-10; 0.3-10000 Pa.s, Japan). Color values (L*, a*, b*) were measured by Minolta Chroma Meter CR 400 (Minolta Co., Osa-ka, Japan). These values were calculated according to the method in AOCS [10, 11]. Methyl esters of the fatty acids are formed following the “boiling” method
[12]. GC conditions are given below:Temperature:Injection: 260°C Temperature of detector: 260°CMobile phase: NitrogenTotal flow rate (ml/min): 80 Flow rate (N2) (ml/min): 1.51Split ratio (ml/min): 1/40Column: Fused silica (capiler) column (Teknokroma TR-CN 100, Barcelona, Spain, 60 mm × 0.25 mm i.d.; film thickness 0.20 µm)Injection: 0.1 µmTemperature program: first wait 7 minutes at 90°C, then increase the temperature to 240˚C with an 5˚C /sec upgrade ratio and finally keep it at this tempera-ture for 15 minutes. It is analyzed at 295 nm with photodiode array detec-tor (Shimadzu SPD-M20 A). 0,6 g oil was solved in 4 mL mobile phase (% 0,5 n-hexane with isopropa-nole) and then injected (20 μL) into the colomn (Li-ChroCART, Si 60, 250 mm, 4 mm i.d., 5 μm, Merck, Darmstadt, Germany). The flow rate was adjusted to 1 mL/min. Tocopherol contents of the oils were de-termined by comparison with the result obtained from the standard peaks. The results were given as mg/kg [13]. The means were compared by employing one-way variance analyses (ANOVA); the differences between the values were analyzed by Duncan multiple compa-rison test. Significance of the differences between the means was set according to p ≤ 0.01 and p ≤ 0.05 significance thresholds.
3. RESULTS AND DISCUSSION
Physico-chemical properties of Citrus seed oils are given in Table I. Refractive index, viscosity and spe-cific gravity values did not show any important differ-ence between species and locations. El-Adawy et al. [14] reported that viscosity values were respectively 0.07 and 0.08 Pa.s; refractive index values are 1.468
Table I - Physico-chemical properties of Citrus seed oils
* : mean ± standard deviation
Table II - Fatty acid composition of Citrus seed oils
Citrus Varieties Locations
Fatty acids (%)
Palmitic Stearic Arachidic Oleic Linoleic Linolenic
2008 2009 2008 2009 2008 2009 2008 2009 2008 2009 2008 2009
Mandarin Robinson Antalya 25.50±0.52* 24.62±0.36 4.53±0.01 4.46±0.43 0.50±0.03 0.39±0.07 21.72±0.18 21.35±0.43 43.60±0.28 44.62±0.48 4.14±0.09 4.56±0.10
Encore Mersin 23.46±0.15 23.41±0.46 5.28±0.23 5.41±0.37 0.49±0.09 0.64±0.02 21.95±0.21 23.41±0.46 44.86±0.04 45.34±0.44 3.96±0.08 4.96±0.71
Orange
Dörtyol domestic Hatay 28.62±0.15 28.75±0.82 4.92±0.20 5.05±0.26 0.48±0.01 0.47±0.05 23.86±0.12 23.96±0.60 38.29±0.01 37.33±0.01 3.83±0.08 4.44±0.10
Sultanhisar Aydın 25.21±0.42 26.26±0.28 5.39±0.35 5.30±0.53 0.45±0.06 0.45±0.03 27.02±0.38 23.85±0.29 38.54±0.27 39.76±0.51 3.38±0.06 4.02±0.25
Lemon Interdonato Mersin 23.29±0.59 22.06±0.12 4.66±1.24 4.37±0.97 0.44±0.07 0.42±0.03 32.16±0.09 29.91±0.03 35.99±0.66 39.66±1.10 3.46±0.01 3.58±0.01
Karalimon Antalya 24.87±0.76 23.18±0.03 4.54±0.18 4.28±0.36 0.40±0.02 0.40±0.02 28.37±0.14 26.46±0.16 36.20±0.43 36.99±0.07 6.66±0.49 8.69±0.14
Physico Analyses
Citrus Varieties Locations Refractive Index
Viscosity (Pa.s; 25°C)
Specific gravity (mg/ml; 25°C)
2008 2009 2008 2009 2008 2009
Mandarin Robinson Antalya
1.549±0.004* 1.466±0.000 0.0379±0.0025 0.0371±0.0017 0.84±0.04 0.84±0.04
Encore Mersin 1.553±0.002 1.460±0.000 0.0549±0.0073 0.0549±0.0073 0.91±0.00 0.87±0.00
Orange Dörtyol domestic
Hatay 1.550±0.007 1.463±0.000 0.0438±0.0050 0.0482±0.0070 0.88±0.00 0.84±0.01
Sultanhisar Aydın 1.558±0.005 1.464±0.000 0.0573±0.0118 0.0484±0.0029 0.86±0.00 0.88±0.02
Lemon Interdonato Mersin 1.469±0.000 1.469±0.000 0.0577±0.0004 0.0539±0.0008 0.90±0.00 0.84±0.01 Karalimon Antalya 1.554±0.001 1.467±0.000 0.2423±0.1978 0.0444±0.0001 0.87±0.00 0.86±0.01
1
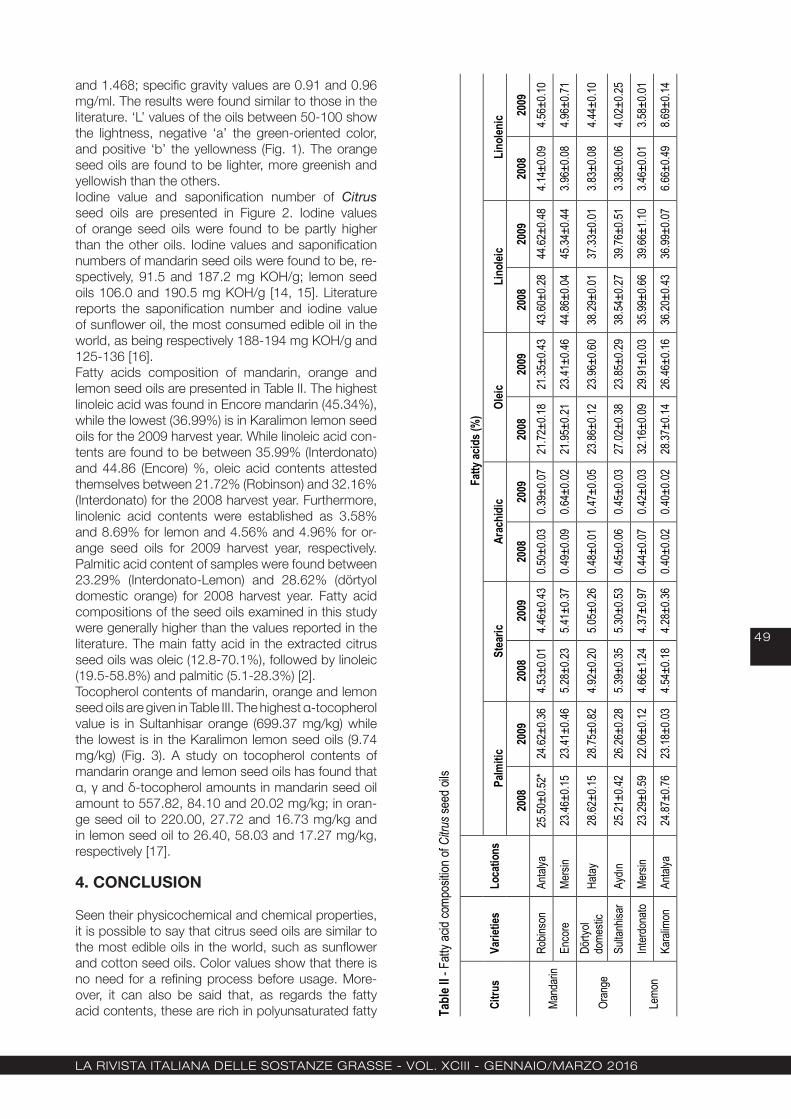
La rivista itaLiana deLLe sostanze grasse - voL. XCiii - gennaio/Marzo 2016
49
and 1.468; specific gravity values are 0.91 and 0.96 mg/ml. The results were found similar to those in the literature. ‘L’ values of the oils between 50-100 show the lightness, negative ‘a’ the green-oriented color, and positive ‘b’ the yellowness (Fig. 1). The orange seed oils are found to be lighter, more greenish and yellowish than the others.Iodine value and saponification number of Citrus seed oils are presented in Figure 2. Iodine values of orange seed oils were found to be partly higher than the other oils. Iodine values and saponification numbers of mandarin seed oils were found to be, re-spectively, 91.5 and 187.2 mg KOH/g; lemon seed oils 106.0 and 190.5 mg KOH/g [14, 15]. Literature reports the saponification number and iodine value of sunflower oil, the most consumed edible oil in the world, as being respectively 188-194 mg KOH/g and 125-136 [16]. Fatty acids composition of mandarin, orange and lemon seed oils are presented in Table II. The highest linoleic acid was found in Encore mandarin (45.34%), while the lowest (36.99%) is in Karalimon lemon seed oils for the 2009 harvest year. While linoleic acid con-tents are found to be between 35.99% (Interdonato) and 44.86 (Encore) %, oleic acid contents attested themselves between 21.72% (Robinson) and 32.16% (Interdonato) for the 2008 harvest year. Furthermore, linolenic acid contents were established as 3.58% and 8.69% for lemon and 4.56% and 4.96% for or-ange seed oils for 2009 harvest year, respectively. Palmitic acid content of samples were found between 23.29% (Interdonato-Lemon) and 28.62% (dörtyol domestic orange) for 2008 harvest year. Fatty acid compositions of the seed oils examined in this study were generally higher than the values reported in the literature. The main fatty acid in the extracted citrus seed oils was oleic (12.8-70.1%), followed by linoleic (19.5-58.8%) and palmitic (5.1-28.3%) [2].Tocopherol contents of mandarin, orange and lemon seed oils are given in Table III. The highest α-tocopherol value is in Sultanhisar orange (699.37 mg/kg) while the lowest is in the Karalimon lemon seed oils (9.74 mg/kg) (Fig. 3). A study on tocopherol contents of mandarin orange and lemon seed oils has found that α, γ and δ-tocopherol amounts in mandarin seed oil amount to 557.82, 84.10 and 20.02 mg/kg; in oran-ge seed oil to 220.00, 27.72 and 16.73 mg/kg and in lemon seed oil to 26.40, 58.03 and 17.27 mg/kg, respectively [17].
4. CONCLUSION
Seen their physicochemical and chemical properties, it is possible to say that citrus seed oils are similar to the most edible oils in the world, such as sunflower and cotton seed oils. Color values show that there is no need for a refining process before usage. More-over, it can also be said that, as regards the fatty acid contents, these are rich in polyunsaturated fatty Ta
ble
I - P
hysi
co-c
hem
ical
pro
perti
es o
f Citr
us s
eed
oils
* : m
ean
± st
anda
rd d
evia
tion
Tabl
e II
- Fat
ty a
cid
com
posi
tion
of C
itrus
see
d oi
ls
Citr
us
Varie
ties
Loca
tions
Fatty
aci
ds (%
)
Palm
itic
St
earic
A
rach
idic
O
leic
Li
nole
ic
Lino
leni
c
2008
20
09
2008
20
09
2008
20
09
2008
20
09
2008
20
09
2008
20
09
Man
darin
R
obin
son
Anta
lya
25.5
0±0.
52*
24.6
2±0.
36
4.53
±0.0
1 4.
46±0
.43
0.50
±0.0
3 0.
39±0
.07
21.7
2±0.
18
21.3
5±0.
43
43.6
0±0.
28
44.6
2±0.
48
4.14
±0.0
9 4.
56±0
.10
Enco
re
Mer
sin
23.4
6±0.
15
23.4
1±0.
46
5.28
±0.2
3 5.
41±0
.37
0.49
±0.0
9 0.
64±0
.02
21.9
5±0.
21
23.4
1±0.
46
44.8
6±0.
04
45.3
4±0.
44
3.96
±0.0
8 4.
96±0
.71
Ora
nge
Dör
tyol
do
mes
tic
Hat
ay
28.6
2±0.
15
28.7
5±0.
82
4.92
±0.2
0 5.
05±0
.26
0.48
±0.0
1 0.
47±0
.05
23.8
6±0.
12
23.9
6±0.
60
38.2
9±0.
01
37.3
3±0.
01
3.83
±0.0
8 4.
44±0
.10
Sulta
nhis
ar
Aydın
25
.21±
0.42
26
.26±
0.28
5.
39±0
.35
5.30
±0.5
3 0.
45±0
.06
0.45
±0.0
3 27
.02±
0.38
23
.85±
0.29
38
.54±
0.27
39
.76±
0.51
3.
38±0
.06
4.02
±0.2
5
Lem
on
Inte
rdon
ato
Mer
sin
23.2
9±0.
59
22.0
6±0.
12
4.66
±1.2
4 4.
37±0
.97
0.44
±0.0
7 0.
42±0
.03
32.1
6±0.
09
29.9
1±0.
03
35.9
9±0.
66
39.6
6±1.
10
3.46
±0.0
1 3.
58±0
.01
Kara
limon
An
taly
a 24
.87±
0.76
23
.18±
0.03
4.
54±0
.18
4.28
±0.3
6 0.
40±0
.02
0.40
±0.0
2 28
.37±
0.14
26
.46±
0.16
36
.20±
0.43
36
.99±
0.07
6.
66±0
.49
8.69
±0.1
4
Phys
ico
Ana
lyse
s
Citr
us
Varie
ties
Loca
tions
R
efra
ctiv
e In
dex
Visc
osity
(P
a.s;
25°
C)
Spec
ific
grav
ity
(mg/
ml;
25°C
)
2008
20
09
2008
20
09
2008
20
09
Man
darin
R
obin
son
Anta
lya
1.
549±
0.00
4*
1.46
6±0.
000
0.03
79±0
.002
5 0.
0371
±0.0
017
0.84
±0.0
4 0.
84±0
.04
Enco
re
Mer
sin
1.55
3±0.
002
1.46
0±0.
000
0.05
49±0
.007
3 0.
0549
±0.0
073
0.91
±0.0
0 0.
87±0
.00
Ora
nge
Dör
tyol
do
mes
tic
Hat
ay
1.55
0±0.
007
1.46
3±0.
000
0.04
38±0
.005
0 0.
0482
±0.0
070
0.88
±0.0
0 0.
84±0
.01
Sulta
nhis
ar
Aydın
1.
558±
0.00
5 1.
464±
0.00
0 0.
0573
±0.0
118
0.04
84±0
.002
9 0.
86±0
.00
0.88
±0.0
2
Lem
on
Inte
rdon
ato
Mer
sin
1.46
9±0.
000
1.46
9±0.
000
0.05
77±0
.000
4 0.
0539
±0.0
008
0.90
±0.0
0 0.
84±0
.01
Kara
limon
An
taly
a 1.
554±
0.00
1 1.
467±
0.00
0 0.
2423
±0.1
978
0.04
44±0
.000
1 0.
87±0
.00
0.86
±0.0
1
1

La rivista itaLiana deLLe sostanze grasse - voL. XCiii - gennaio/Marzo 2016
50
Figure 1 - Iodine value and Saponification number (mg KOH/g) of oil samples
Figure 2 - Color values of oil samples
Figure 1 - Iodine value and Saponification number (mg KOH/g) of oil samples
Figure 2 - Color values of oil samples
Figure 3 - α-Tocopherol contents of oil samples (mg/Kg)
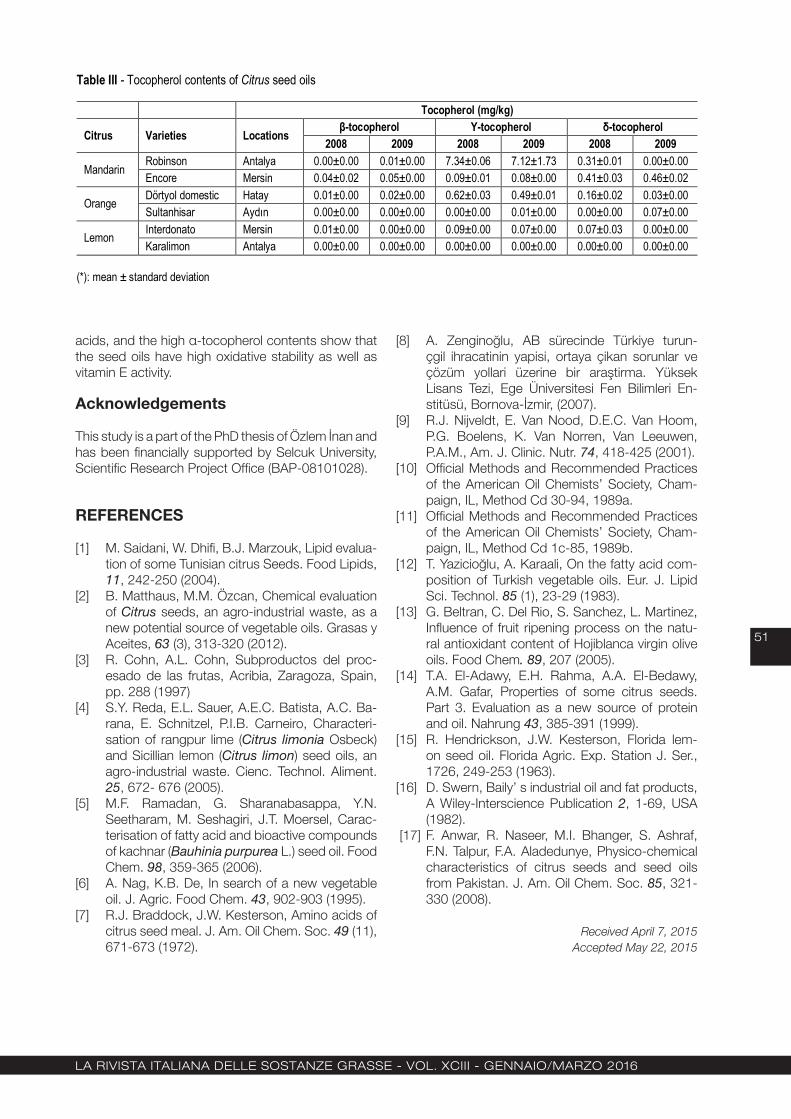
La rivista itaLiana deLLe sostanze grasse - voL. XCiii - gennaio/Marzo 2016
51
acids, and the high α-tocopherol contents show that the seed oils have high oxidative stability as well as vitamin E activity.
Acknowledgements
This study is a part of the PhD thesis of Özlem İnan and has been financially supported by Selcuk University, Scientific Research Project Office (BAP-08101028).
REFERENCES
[1] M. Saidani, W. Dhifi, B.J. Marzouk, Lipid evalua-tion of some Tunisian citrus Seeds. Food Lipids, 11, 242-250 (2004).
[2] B. Matthaus, M.M. Özcan, Chemical evaluation of Citrus seeds, an agro-industrial waste, as a new potential source of vegetable oils. Grasas y Aceites, 63 (3), 313-320 (2012).
[3] R. Cohn, A.L. Cohn, Subproductos del proc-esado de las frutas, Acribia, Zaragoza, Spain, pp. 288 (1997)
[4] S.Y. Reda, E.L. Sauer, A.E.C. Batista, A.C. Ba-rana, E. Schnitzel, P.I.B. Carneiro, Characteri-sation of rangpur lime (Citrus limonia Osbeck) and Sicillian lemon (Citrus limon) seed oils, an agro-industrial waste. Cienc. Technol. Aliment. 25, 672- 676 (2005).
[5] M.F. Ramadan, G. Sharanabasappa, Y.N. Seetharam, M. Seshagiri, J.T. Moersel, Carac-terisation of fatty acid and bioactive compounds of kachnar (Bauhinia purpurea L.) seed oil. Food Chem. 98, 359-365 (2006).
[6] A. Nag, K.B. De, In search of a new vegetable oil. J. Agric. Food Chem. 43, 902-903 (1995).
[7] R.J. Braddock, J.W. Kesterson, Amino acids of citrus seed meal. J. Am. Oil Chem. Soc. 49 (11), 671-673 (1972).
[8] A. Zenginoğlu, AB sürecinde Türkiye turun-çgil ihracatinin yapisi, ortaya çikan sorunlar ve çözüm yollari üzerine bir araştirma. Yüksek Lisans Tezi, Ege Üniversitesi Fen Bilimleri En-stitüsü, Bornova-İzmir, (2007).
[9] R.J. Nijveldt, E. Van Nood, D.E.C. Van Hoom, P.G. Boelens, K. Van Norren, Van Leeuwen, P.A.M., Am. J. Clinic. Nutr. 74, 418-425 (2001).
[10] Official Methods and Recommended Practices of the American Oil Chemists’ Society, Cham-paign, IL, Method Cd 30-94, 1989a.
[11] Official Methods and Recommended Practices of the American Oil Chemists’ Society, Cham-paign, IL, Method Cd 1c-85, 1989b.
[12] T. Yazicioğlu, A. Karaali, On the fatty acid com-position of Turkish vegetable oils. Eur. J. Lipid Sci. Technol. 85 (1), 23-29 (1983).
[13] G. Beltran, C. Del Rio, S. Sanchez, L. Martinez, Influence of fruit ripening process on the natu-ral antioxidant content of Hojiblanca virgin olive oils. Food Chem. 89, 207 (2005).
[14] T.A. El-Adawy, E.H. Rahma, A.A. El-Bedawy, A.M. Gafar, Properties of some citrus seeds. Part 3. Evaluation as a new source of protein and oil. Nahrung 43, 385-391 (1999).
[15] R. Hendrickson, J.W. Kesterson, Florida lem-on seed oil. Florida Agric. Exp. Station J. Ser., 1726, 249-253 (1963).
[16] D. Swern, Baily’ s industrial oil and fat products, A Wiley-Interscience Publication 2, 1-69, USA (1982).
[17] F. Anwar, R. Naseer, M.I. Bhanger, S. Ashraf, F.N. Talpur, F.A. Aladedunye, Physico-chemical characteristics of citrus seeds and seed oils from Pakistan. J. Am. Oil Chem. Soc. 85, 321-330 (2008).
Received April 7, 2015Accepted May 22, 2015
Table III - Tocopherol contents of Citrus seed oils
(*): mean ± standard deviation
Tocopherol (mg/kg)
Citrus Varieties Locations β-tocopherol Y-tocopherol δ-tocopherol
2008 2009 2008 2009 2008 2009
Mandarin Robinson Antalya 0.00±0.00 0.01±0.00 7.34±0.06 7.12±1.73 0.31±0.01 0.00±0.00 Encore Mersin 0.04±0.02 0.05±0.00 0.09±0.01 0.08±0.00 0.41±0.03 0.46±0.02
Orange Dörtyol domestic Hatay 0.01±0.00 0.02±0.00 0.62±0.03 0.49±0.01 0.16±0.02 0.03±0.00 Sultanhisar Aydın 0.00±0.00 0.00±0.00 0.00±0.00 0.01±0.00 0.00±0.00 0.07±0.00
Lemon Interdonato Mersin 0.01±0.00 0.00±0.00 0.09±0.00 0.07±0.00 0.07±0.03 0.00±0.00 Karalimon Antalya 0.00±0.00 0.00±0.00 0.00±0.00 0.00±0.00 0.00±0.00 0.00±0.00
2
Please fill in and send by mail to: [email protected]
r
O R D E R F O R M
ITALY € 100,00 (- 10% DISCOUNT FOR BOOKSELLERS AND SSOG TAXPAYERS)
OTHER COUNTRY € 200,00 (- 10% DISCOUNT FOR BOOKSELLERS)
SEND JOURNAL TO:
Company : ……………………………………………………………………………………………………………………………………………………………………………
Company : ……………………………………………………………………………………………………………………………………………………………………………
Street and House number : …………………………………………………………………………………………………………………………………………………
City Post Code : ………………………………………………………………………………………………………………………………………………………………...…
City: ……………………………………………………………………………………… Country : …………………………………………………………………………..
e-mail: ………………………………………………………………………………………………………………
INVOICE INFORMATION :
Company : ……………………………………………………………………………………………………………………………………………………………………………
Street and House number : …………………………………………………………………………………………………………………………………………………
City Post Code : ………………………………………………………………………………………………………………………………………………………………...…
City: …………………………………………………………………………………… Country : …………………………………………………………………………...
V.A.T. : ……..…………………………………………………….………… C.F. : ……..………………….……………………….……………………………
e-mail: ………………………………………………………………………………………………………………
SUBSCRIPTION
2016
RISGLA RIVISTA ITALIANA
DELLE SOSTANZE GRASSE

La rivista itaLiana deLLe sostanze grasse - voL. XCiii - gennaio/Marzo 2016
53
nota tecnicalubrificanti
Corrispondenze tra metodi analitici
(gennaio-dicembre 2015)
M. Sala1*F. Taormina1
R. Maina2
P. Ruggieri3
1 INNOVHUB - SSIAzienda Speciale della
Camera di Commercio di MilanoArea SSOG - Milano
2 Sea Marconi Technologies S.a.sTorino
3 ENI SpA – Refining & MarketingMilano
*CORRISPONDENZA AUTOREE-mail: [email protected]
Da diversi anni viene pubblicata una guida, a disposizione di chi lavora nel settore dei lubrificanti, in cui sono riportati i controlli maggiormente utilizzati per la caratterizzazione dei prodotti petroliferi e lubrificanti e i relativi metodi di analisi pubblicati da Enti Nazionali ed Internazionali (UNI, CEI, ASTM, IP, ISO, IEC, EN).Quest’anno è stata fatta la revisione della tabella con un aggiornamento di tutti i metodi pubblicati da gennaio a dicembre 2015.La struttura base della tabella non è stata modificata rispetto alla versione precedente: nella prima colonna si riporta il parametro analitico, cui corrispondono i numeri di norma/metodo riportati nelle colonne successive.I riferimenti normativi sono sempre divisi in quattro classi: EN - ISO - IEC; Metodi Italiani (UNI - UNI EN - UNI EN ISO - CEI – NOM); IP; ASTM.Tutti i metodi che durante l’anno hanno avuto revisioni o modifiche sono evidenziati con lo sfondo grigio.La nuova versione dei metodi ASTM è stata confrontata con l’edizione precedente e nel foglio “Commento alle nuove revisioni” si riportano i risultati di tale confronto. Quando compare la dizione “equivalente” significa che c’è una perfetta rispondenza tra le metodiche; differenze non sostanziali tra i vari metodi sono riassunte nell’espressione “tecnicamente equivalenti”; per i metodi in cui è stata riscontrata anche una sola, ma significativa differenza, viene riportata l’espressione “non equivalente”. Per i metodi IP si rimanda al sito http://ein.powerweb.co.uk/cssiptmqbe.htm dove è disponibile l’elenco aggiornato dei metodi e un loro confronto con i metodi ASTM e ISO.Preso atto della velocità di cambiamento dei metodi in ambito normativo, soprattutto dei metodi ASTM, si ricorda che la presente guida, non potendo essere aggiornata in tempo reale, ma facendo riferimento ad una valutazione temporale pari a un anno solare, ha delle lacune, insite proprio nella modalità in cui è stato concepito il lavoro di revisione. (Per questo motivo alcuni metodi ASTM hanno come data di revisione il 2014, anche se l’ultima ricerca condotta a Dicembre 2014 non li citava come metodi in revisione).
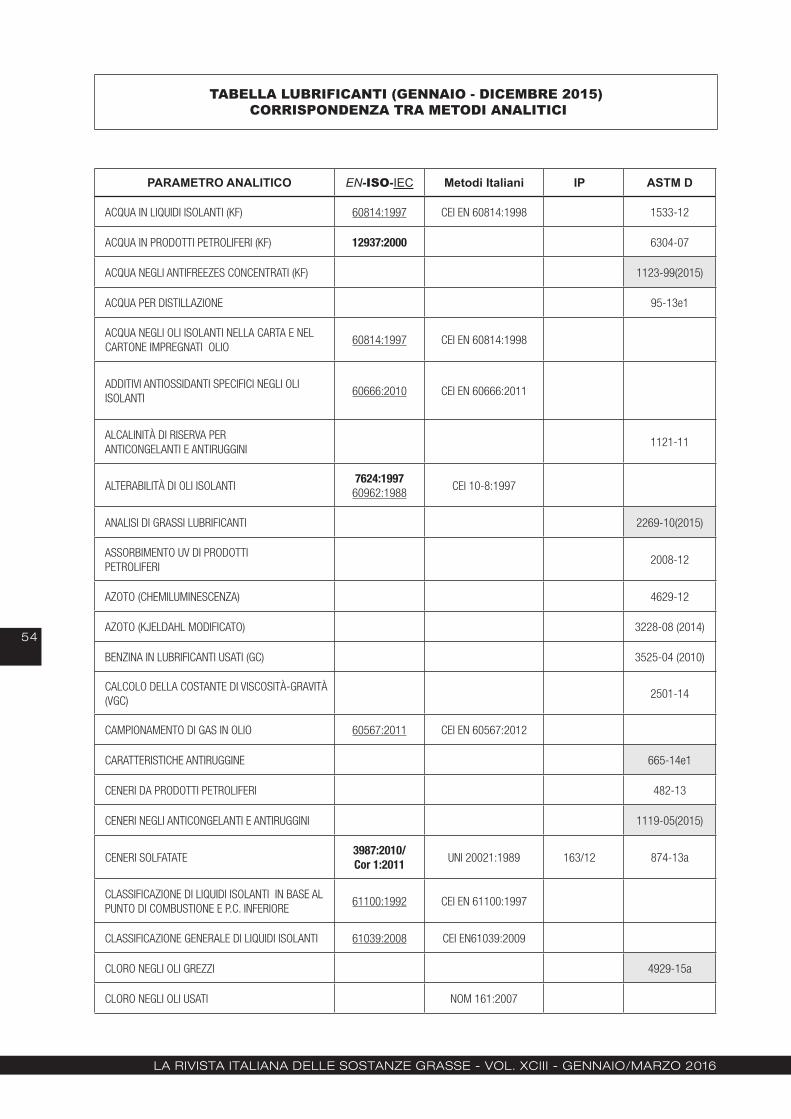
La rivista itaLiana deLLe sostanze grasse - voL. XCiii - gennaio/Marzo 2016
54
TABELLA LUBRIFICANTI (GENNAIO - DICEMBRE 2015) CORRISPONDENZA TRA METODI ANALITICI
PARAMETRO ANALITICO EN-ISO-IEC Metodi Italiani IP ASTM D
ACQUA IN LIQUIDI ISOLANTI (KF) 60814:1997 CEI EN 60814:1998 1533-12
ACQUA IN PRODOTTI PETROLIFERI (KF) 12937:2000 6304-07
ACQUA NEGLI ANTIFREEZES CONCENTRATI (KF) 1123-99(2015)
ACQUA PER DISTILLAZIONE 95-13e1
ACQUA NEGLI OLI ISOLANTI NELLA CARTA E NEL CARTONE IMPREGNATI OLIO
60814:1997 CEI EN 60814:1998
ADDITIVI ANTIOSSIDANTI SPECIFICI NEGLI OLI ISOLANTI
60666:2010
CEI EN 60666:2011
ALCALINITÀ DI RISERVA PER ANTICONGELANTI E ANTIRUGGINI
1121-11
ALTERABILITÀ DI OLI ISOLANTI7624:1997
60962:1988CEI 10-8:1997
ANALISI DI GRASSI LUBRIFICANTI 2269-10(2015)
ASSORBIMENTO UV DI PRODOTTI PETROLIFERI
2008-12
AZOTO (CHEMILUMINESCENZA) 4629-12
AZOTO (KJELDAHL MODIFICATO) 3228-08 (2014)
BENZINA IN LUBRIFICANTI USATI (GC) 3525-04 (2010)
CALCOLO DELLA COSTANTE DI VISCOSITÀ-GRAVITÀ (VGC)
2501-14
CAMPIONAMENTO DI GAS IN OLIO 60567:2011 CEI EN 60567:2012
CARATTERISTICHE ANTIRUGGINE 665-14e1
CENERI DA PRODOTTI PETROLIFERI 482-13
CENERI NEGLI ANTICONGELANTI E ANTIRUGGINI 1119-05(2015)
CENERI SOLFATATE3987:2010/Cor 1:2011 UNI 20021:1989 163/12 874-13a
CLASSIFICAZIONE DI LIQUIDI ISOLANTI IN BASE AL PUNTO DI COMBUSTIONE E P.C. INFERIORE
61100:1992 CEI EN 61100:1997
CLASSIFICAZIONE GENERALE DI LIQUIDI ISOLANTI 61039:2008 CEI EN61039:2009
CLORO NEGLI OLI GREZZI 4929-15a
CLORO NEGLI OLI USATI NOM 161:2007
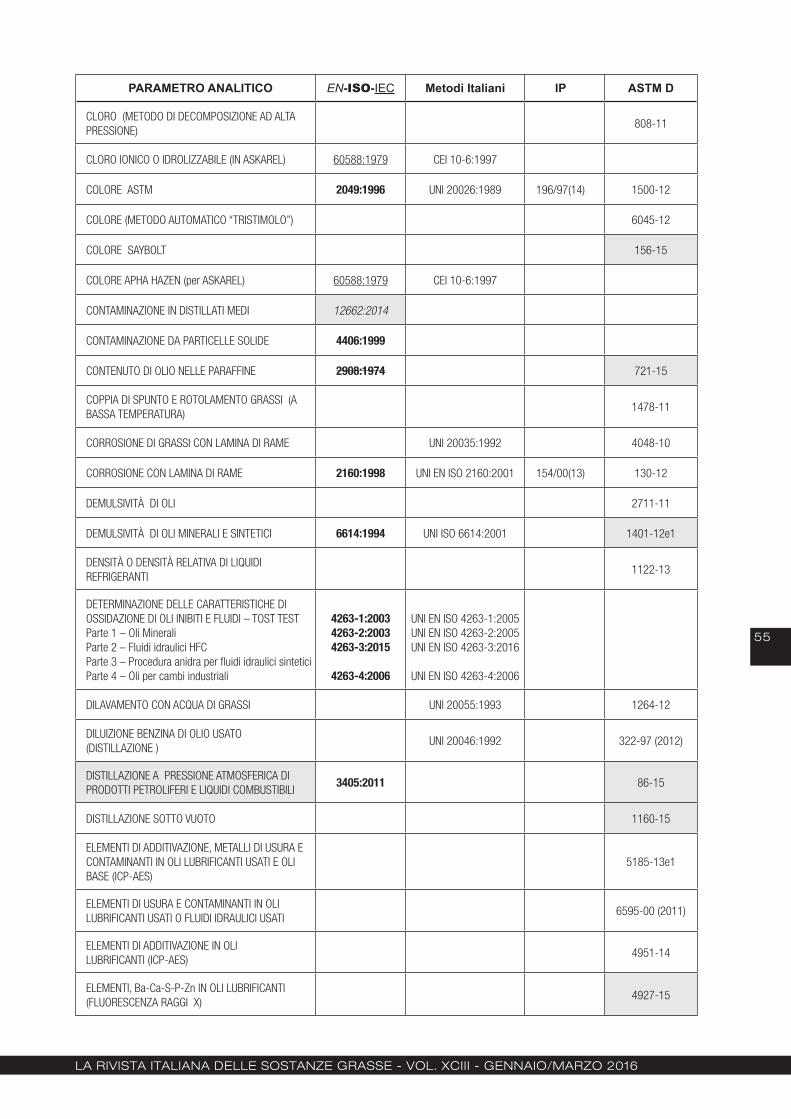
La rivista itaLiana deLLe sostanze grasse - voL. XCiii - gennaio/Marzo 2016
55
PARAMETRO ANALITICO EN-ISO-IEC Metodi Italiani IP ASTM D
CLORO (METODO DI DECOMPOSIZIONE AD ALTA PRESSIONE)
808-11
CLORO IONICO O IDROLIZZABILE (IN ASKAREL) 60588:1979 CEI 10-6:1997
COLORE ASTM 2049:1996 UNI 20026:1989 196/97(14) 1500-12
COLORE (METODO AUTOMATICO “TRISTIMOLO”) 6045-12
COLORE SAYBOLT 156-15
COLORE APHA HAZEN (per ASKAREL) 60588:1979 CEI 10-6:1997
CONTAMINAZIONE IN DISTILLATI MEDI 12662:2014
CONTAMINAZIONE DA PARTICELLE SOLIDE 4406:1999
CONTENUTO DI OLIO NELLE PARAFFINE 2908:1974 721-15
COPPIA DI SPUNTO E ROTOLAMENTO GRASSI (A BASSA TEMPERATURA)
1478-11
CORROSIONE DI GRASSI CON LAMINA DI RAME UNI 20035:1992 4048-10
CORROSIONE CON LAMINA DI RAME 2160:1998 UNI EN ISO 2160:2001 154/00(13) 130-12
DEMULSIVITÀ DI OLI 2711-11
DEMULSIVITÀ DI OLI MINERALI E SINTETICI 6614:1994 UNI ISO 6614:2001 1401-12e1
DENSITÀ O DENSITÀ RELATIVA DI LIQUIDI REFRIGERANTI
1122-13
DETERMINAZIONE DELLE CARATTERISTICHE DI OSSIDAZIONE DI OLI INIBITI E FLUIDI – TOST TESTParte 1 – Oli MineraliParte 2 – Fluidi idraulici HFCParte 3 – Procedura anidra per fluidi idraulici sinteticiParte 4 – Oli per cambi industriali
4263-1:20034263-2:20034263-3:2015
4263-4:2006
UNI EN ISO 4263-1:2005UNI EN ISO 4263-2:2005UNI EN ISO 4263-3:2016
UNI EN ISO 4263-4:2006
DILAVAMENTO CON ACQUA DI GRASSI UNI 20055:1993 1264-12
DILUIZIONE BENZINA DI OLIO USATO(DISTILLAZIONE )
UNI 20046:1992 322-97 (2012)
DISTILLAZIONE A PRESSIONE ATMOSFERICA DI PRODOTTI PETROLIFERI E LIQUIDI COMBUSTIBILI
3405:2011 86-15
DISTILLAZIONE SOTTO VUOTO 1160-15
ELEMENTI DI ADDITIVAZIONE, METALLI DI USURA E CONTAMINANTI IN OLI LUBRIFICANTI USATI E OLI BASE (ICP-AES)
5185-13e1
ELEMENTI DI USURA E CONTAMINANTI IN OLI LUBRIFICANTI USATI O FLUIDI IDRAULICI USATI
6595-00 (2011)
ELEMENTI DI ADDITIVAZIONE IN OLI LUBRIFICANTI (ICP-AES)
4951-14
ELEMENTI, Ba-Ca-S-P-Zn IN OLI LUBRIFICANTI (FLUORESCENZA RAGGI X)
4927-15
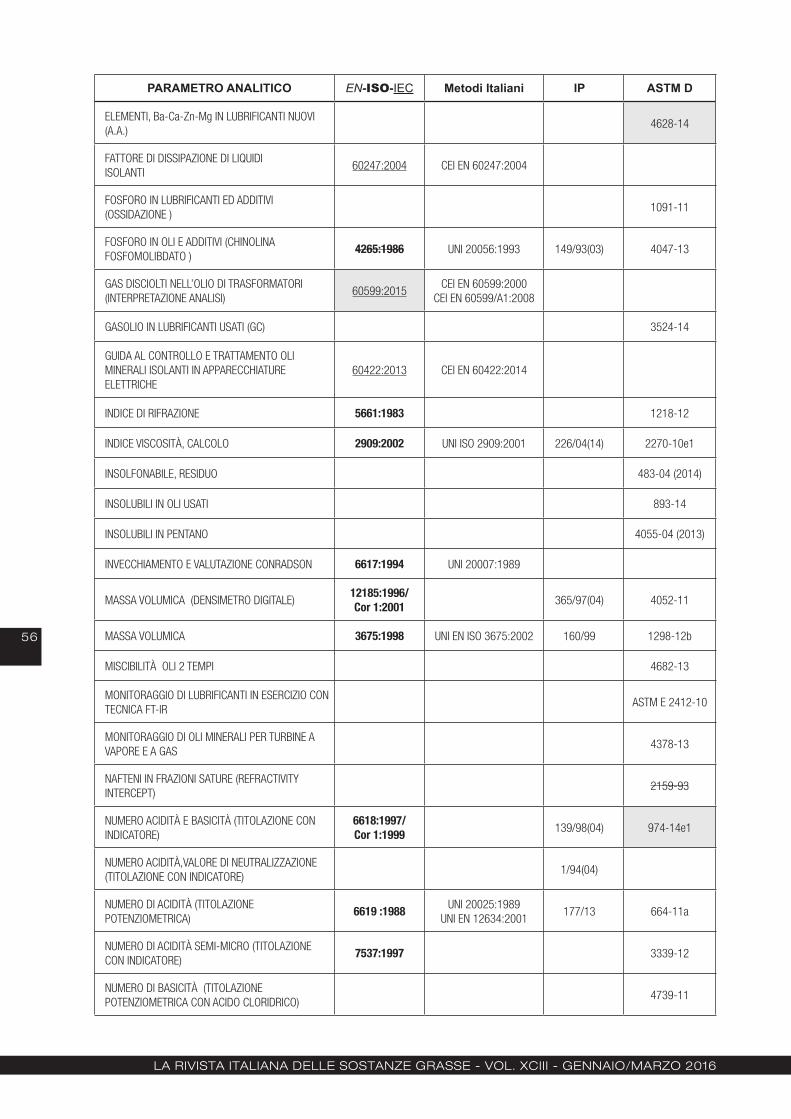
La rivista itaLiana deLLe sostanze grasse - voL. XCiii - gennaio/Marzo 2016
56
PARAMETRO ANALITICO EN-ISO-IEC Metodi Italiani IP ASTM D
ELEMENTI, Ba-Ca-Zn-Mg IN LUBRIFICANTI NUOVI (A.A.)
4628-14
FATTORE DI DISSIPAZIONE DI LIQUIDI ISOLANTI
60247:2004 CEI EN 60247:2004
FOSFORO IN LUBRIFICANTI ED ADDITIVI(OSSIDAZIONE )
1091-11
FOSFORO IN OLI E ADDITIVI (CHINOLINA FOSFOMOLIBDATO )
4265:1986 UNI 20056:1993 149/93(03) 4047-13
GAS DISCIOLTI NELL’OLIO DI TRASFORMATORI (INTERPRETAZIONE ANALISI)
60599:2015CEI EN 60599:2000
CEI EN 60599/A1:2008
GASOLIO IN LUBRIFICANTI USATI (GC) 3524-14
GUIDA AL CONTROLLO E TRATTAMENTO OLIMINERALI ISOLANTI IN APPARECCHIATURE ELETTRICHE
60422:2013 CEI EN 60422:2014
INDICE DI RIFRAZIONE 5661:1983 1218-12
INDICE VISCOSITÀ, CALCOLO 2909:2002 UNI ISO 2909:2001 226/04(14) 2270-10e1
INSOLFONABILE, RESIDUO 483-04 (2014)
INSOLUBILI IN OLI USATI 893-14
INSOLUBILI IN PENTANO 4055-04 (2013)
INVECCHIAMENTO E VALUTAZIONE CONRADSON 6617:1994 UNI 20007:1989
MASSA VOLUMICA (DENSIMETRO DIGITALE)12185:1996/Cor 1:2001 365/97(04) 4052-11
MASSA VOLUMICA 3675:1998 UNI EN ISO 3675:2002 160/99 1298-12b
MISCIBILITÀ OLI 2 TEMPI 4682-13
MONITORAGGIO DI LUBRIFICANTI IN ESERCIZIO CON TECNICA FT-IR
ASTM E 2412-10
MONITORAGGIO DI OLI MINERALI PER TURBINE A VAPORE E A GAS
4378-13
NAFTENI IN FRAZIONI SATURE (REFRACTIVITY INTERCEPT)
2159-93
NUMERO ACIDITÀ E BASICITÀ (TITOLAZIONE CON INDICATORE)
6618:1997/Cor 1:1999 139/98(04) 974-14e1
NUMERO ACIDITÀ,VALORE DI NEUTRALIZZAZIONE (TITOLAZIONE CON INDICATORE)
1/94(04)
NUMERO DI ACIDITÀ (TITOLAZIONE POTENZIOMETRICA)
6619 :1988 UNI 20025:1989 UNI EN 12634:2001
177/13 664-11a
NUMERO DI ACIDITÀ SEMI-MICRO (TITOLAZIONE CON INDICATORE)
7537:1997 3339-12
NUMERO DI BASICITÀ (TITOLAZIONE POTENZIOMETRICA CON ACIDO CLORIDRICO)
4739-11
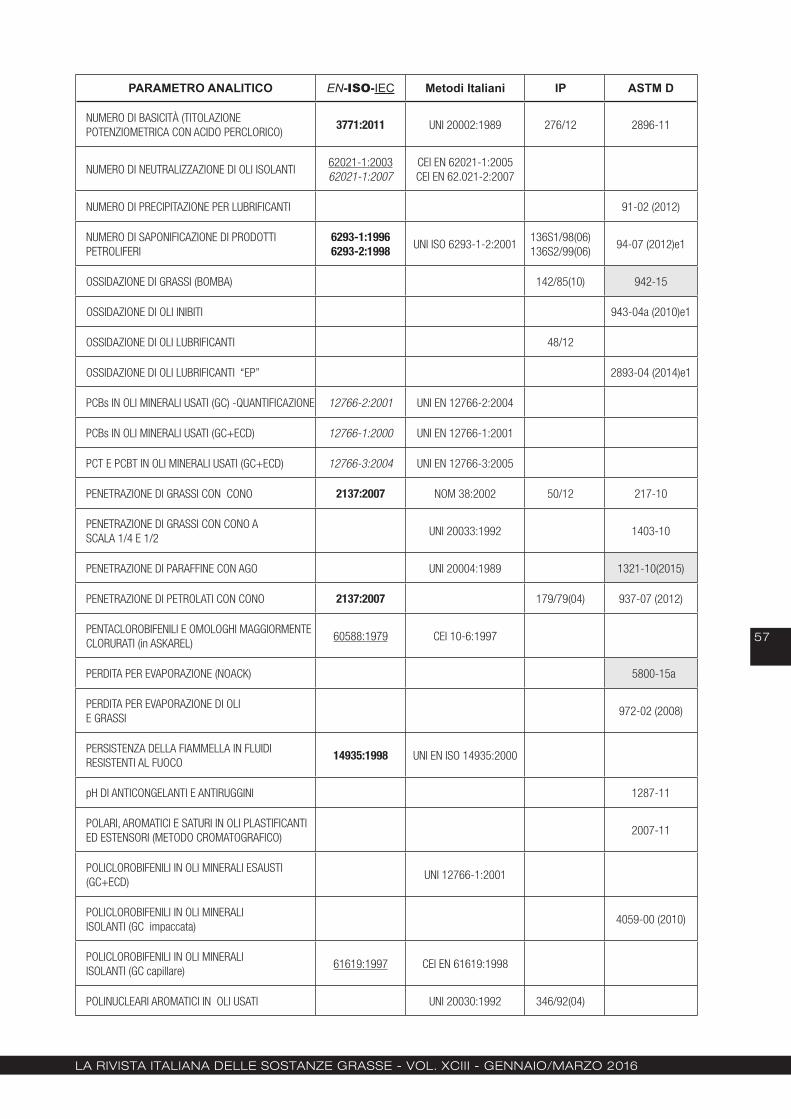
La rivista itaLiana deLLe sostanze grasse - voL. XCiii - gennaio/Marzo 2016
57
PARAMETRO ANALITICO EN-ISO-IEC Metodi Italiani IP ASTM D
NUMERO DI BASICITÀ (TITOLAZIONEPOTENZIOMETRICA CON ACIDO PERCLORICO)
3771:2011 UNI 20002:1989 276/12 2896-11
NUMERO DI NEUTRALIZZAZIONE DI OLI ISOLANTI62021-1:200362021-1:2007
CEI EN 62021-1:2005 CEI EN 62.021-2:2007
NUMERO DI PRECIPITAZIONE PER LUBRIFICANTI 91-02 (2012)
NUMERO DI SAPONIFICAZIONE DI PRODOTTI PETROLIFERI
6293-1:1996 6293-2:1998 UNI ISO 6293-1-2:2001
136S1/98(06) 136S2/99(06)
94-07 (2012)e1
OSSIDAZIONE DI GRASSI (BOMBA) 142/85(10) 942-15
OSSIDAZIONE DI OLI INIBITI 943-04a (2010)e1
OSSIDAZIONE DI OLI LUBRIFICANTI 48/12
OSSIDAZIONE DI OLI LUBRIFICANTI “EP” 2893-04 (2014)e1
PCBs IN OLI MINERALI USATI (GC) -QUANTIFICAZIONE 12766-2:2001 UNI EN 12766-2:2004
PCBs IN OLI MINERALI USATI (GC+ECD) 12766-1:2000 UNI EN 12766-1:2001
PCT E PCBT IN OLI MINERALI USATI (GC+ECD) 12766-3:2004 UNI EN 12766-3:2005
PENETRAZIONE DI GRASSI CON CONO 2137:2007 NOM 38:2002 50/12 217-10
PENETRAZIONE DI GRASSI CON CONO A SCALA 1/4 E 1/2
UNI 20033:1992 1403-10
PENETRAZIONE DI PARAFFINE CON AGO UNI 20004:1989 1321-10(2015)
PENETRAZIONE DI PETROLATI CON CONO 2137:2007 179/79(04) 937-07 (2012)
PENTACLOROBIFENILI E OMOLOGHI MAGGIORMENTE CLORURATI (in ASKAREL)
60588:1979 CEI 10-6:1997
PERDITA PER EVAPORAZIONE (NOACK) 5800-15a
PERDITA PER EVAPORAZIONE DI OLI E GRASSI
972-02 (2008)
PERSISTENZA DELLA FIAMMELLA IN FLUIDI RESISTENTI AL FUOCO
14935:1998 UNI EN ISO 14935:2000
pH DI ANTICONGELANTI E ANTIRUGGINI 1287-11
POLARI, AROMATICI E SATURI IN OLI PLASTIFICANTI ED ESTENSORI (METODO CROMATOGRAFICO)
2007-11
POLICLOROBIFENILI IN OLI MINERALI ESAUSTI (GC+ECD)
UNI 12766-1:2001
POLICLOROBIFENILI IN OLI MINERALI ISOLANTI (GC impaccata)
4059-00 (2010)
POLICLOROBIFENILI IN OLI MINERALI ISOLANTI (GC capillare)
61619:1997 CEI EN 61619:1998
POLINUCLEARI AROMATICI IN OLI USATI UNI 20030:1992 346/92(04)

La rivista itaLiana deLLe sostanze grasse - voL. XCiii - gennaio/Marzo 2016
58
PARAMETRO ANALITICO EN-ISO-IEC Metodi Italiani IP ASTM D
PRODOTTI PETROLIFERI, TABELLE DI CONVERSIONE 1250-08 (2013)e1
PROPRIETÀ “EP” DI OLI(MACCHINA 4 SFERE )
UNI 20029:1992 239/07(14) 2783-03 (2014)
PROPRIETÀ “EP” DI GRASSI(MACCHINA 4 SFERE )
2596-15
PUNTO DI ANILINA 611-12
PUNTO DI CONGELAMENTO DI FLUIDI REFRIGERANTI PER MOTORI
1177-12
PUNTO DI EBOLLIZIONE DI FLUIDI REFRIGERANTI PER MOTORI
1120-11e1
PUNTO DI FUSIONE DI PARAFFINE3841:19776244:1982 UNI ISO 3841:2001 87-09 (2014)
PUNTO DI GOCCIOLAMENTO DI CERE E PETROLATI 6244:1982 UNI 20034:1992 133/79(01) 127-08(2015)
PUNTO DI GOCCIOLAMENTO DI GRASSI2176:1995/Cor 1:2001 132/96(04) 566-02 (2009)
PUNTO DI GOCCIOLAMENTO DI GRASSI CON PIÙ ALTO RANGE DI TEMPERATURA
2265-15
PUNTO DI INFIAMMABILITÀ IN VASO APERTO CLEVELAND
2592:2000 36/02 92-12b
PUNTO DI INFIAMMABILITÀ IN VASO CHIUSO (PENSKY MARTENS)
2719:2002 34/03 93-15a
PUNTO DI INFIAMMABILITÀ TAG (aperto) 1310-14
PUNTO DI INFIAMMABILITÀ TAG (chiuso) 56-05 (2010)
PUNTO DI INTORBIDAMENTO(RAFFREDDAMENTO LINEARE)
3015:1992 2500-11
PUNTO DI SCORRIMENTO 3016:1994 UNI 20065:1997 15/95(14) 97-15
PUNTO DI SCORRIMENTO AUTOMATIZZATO 6892-03 (2014)
PUNTO DI SOLIDIFICAZIONE DI PARAFFINEE PETROLATI
2207:1980 UNI 20005:1989 76/70(04) 938-12
RESIDUO CARBONIOSO CONRADSON 6615:1993 189-06 (2014)
RESIDUO CARBONIOSO RAMSBOTTOM 4262:1993 UNI 20042:1992 524-15
RESIDUO CARBONIOSO, METODO MICRO 10370:2014 UNI EN ISO 10370:2015 4530-15
RIGIDITÀ DIELETTRICA DI OLI ISOLANTI 60156:1995
RILASCIO ARIA DI OLI BASE IDROCARBURICI 9120:1997 NOM 121:2002 3427-15
RUGGINE, PROVA DINAMICA PER GRASSI
(EMCOR )UNI 20036:1992
SCHIUMEGGIAMENTO DI ANTICONGELANTI 1881-97 (2009)
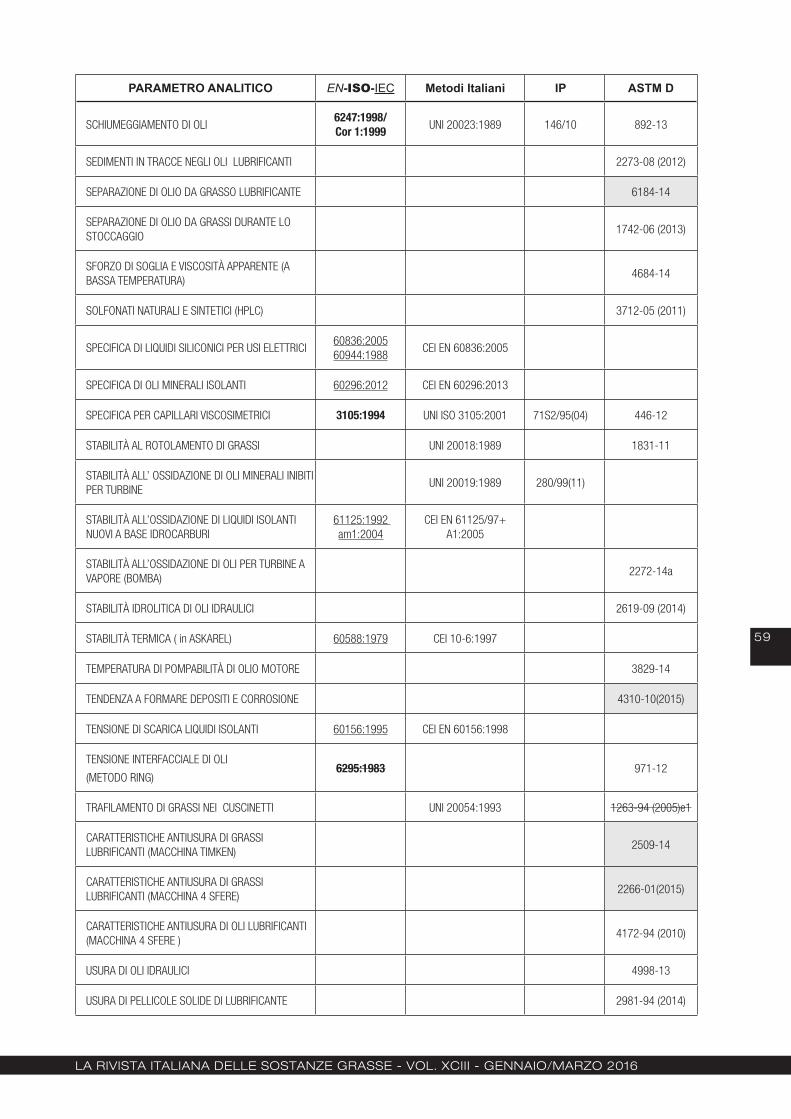
La rivista itaLiana deLLe sostanze grasse - voL. XCiii - gennaio/Marzo 2016
59
PARAMETRO ANALITICO EN-ISO-IEC Metodi Italiani IP ASTM D
SCHIUMEGGIAMENTO DI OLI6247:1998/Cor 1:1999 UNI 20023:1989 146/10 892-13
SEDIMENTI IN TRACCE NEGLI OLI LUBRIFICANTI 2273-08 (2012)
SEPARAZIONE DI OLIO DA GRASSO LUBRIFICANTE 6184-14
SEPARAZIONE DI OLIO DA GRASSI DURANTE LO STOCCAGGIO
1742-06 (2013)
SFORZO DI SOGLIA E VISCOSITÀ APPARENTE (A BASSA TEMPERATURA)
4684-14
SOLFONATI NATURALI E SINTETICI (HPLC) 3712-05 (2011)
SPECIFICA DI LIQUIDI SILICONICI PER USI ELETTRICI60836:200560944:1988
CEI EN 60836:2005
SPECIFICA DI OLI MINERALI ISOLANTI 60296:2012 CEI EN 60296:2013
SPECIFICA PER CAPILLARI VISCOSIMETRICI 3105:1994 UNI ISO 3105:2001 71S2/95(04) 446-12
STABILITÀ AL ROTOLAMENTO DI GRASSI UNI 20018:1989 1831-11
STABILITÀ ALL’ OSSIDAZIONE DI OLI MINERALI INIBITI PER TURBINE
UNI 20019:1989 280/99(11)
STABILITÀ ALL’OSSIDAZIONE DI LIQUIDI ISOLANTI NUOVI A BASE IDROCARBURI
61125:1992 am1:2004
CEI EN 61125/97+ A1:2005
STABILITÀ ALL’OSSIDAZIONE DI OLI PER TURBINE A VAPORE (BOMBA)
2272-14a
STABILITÀ IDROLITICA DI OLI IDRAULICI 2619-09 (2014)
STABILITÀ TERMICA ( in ASKAREL) 60588:1979 CEI 10-6:1997
TEMPERATURA DI POMPABILITÀ DI OLIO MOTORE 3829-14
TENDENZA A FORMARE DEPOSITI E CORROSIONE 4310-10(2015)
TENSIONE DI SCARICA LIQUIDI ISOLANTI 60156:1995 CEI EN 60156:1998
TENSIONE INTERFACCIALE DI OLI
(METODO RING)6295:1983 971-12
TRAFILAMENTO DI GRASSI NEI CUSCINETTI UNI 20054:1993 1263-94 (2005)e1
CARATTERISTICHE ANTIUSURA DI GRASSI LUBRIFICANTI (MACCHINA TIMKEN)
2509-14
CARATTERISTICHE ANTIUSURA DI GRASSI LUBRIFICANTI (MACCHINA 4 SFERE)
2266-01(2015)
CARATTERISTICHE ANTIUSURA DI OLI LUBRIFICANTI (MACCHINA 4 SFERE )
4172-94 (2010)
USURA DI OLI IDRAULICI 4998-13
USURA DI PELLICOLE SOLIDE DI LUBRIFICANTE 2981-94 (2014)
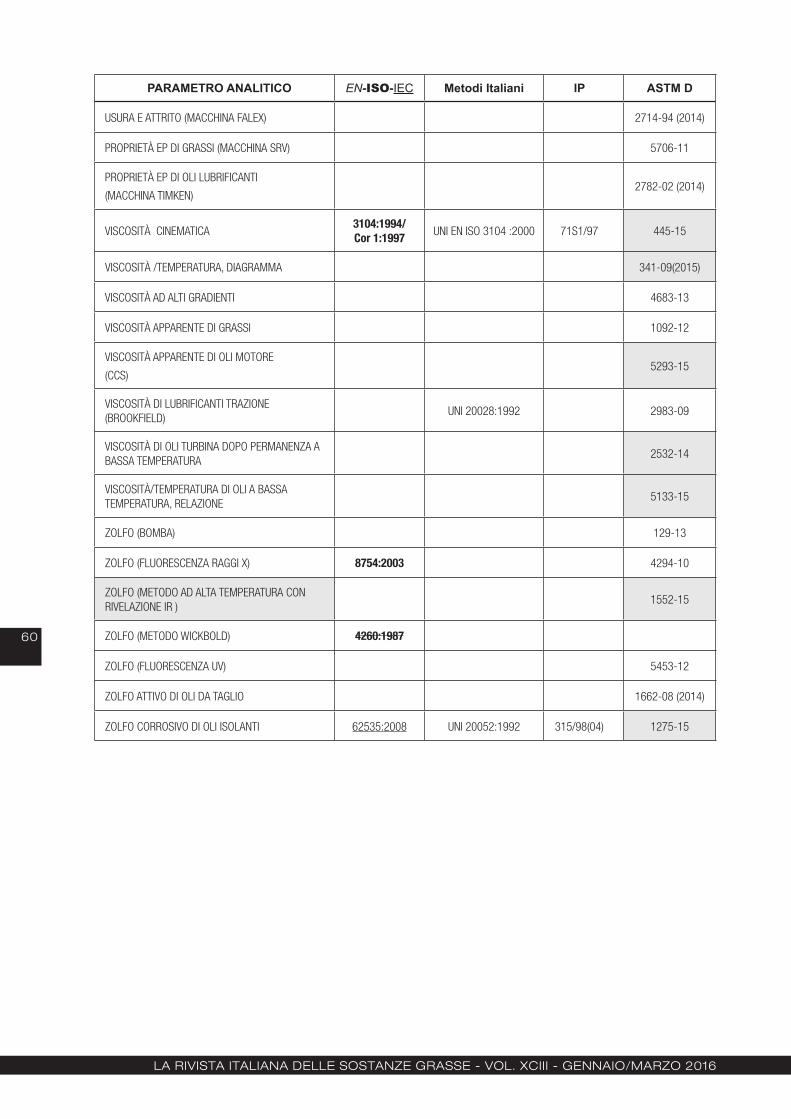
La rivista itaLiana deLLe sostanze grasse - voL. XCiii - gennaio/Marzo 2016
60
PARAMETRO ANALITICO EN-ISO-IEC Metodi Italiani IP ASTM D
USURA E ATTRITO (MACCHINA FALEX) 2714-94 (2014)
PROPRIETÀ EP DI GRASSI (MACCHINA SRV) 5706-11
PROPRIETÀ EP DI OLI LUBRIFICANTI
(MACCHINA TIMKEN)2782-02 (2014)
VISCOSITÀ CINEMATICA3104:1994/Cor 1:1997 UNI EN ISO 3104 :2000 71S1/97 445-15
VISCOSITÀ /TEMPERATURA, DIAGRAMMA 341-09(2015)
VISCOSITÀ AD ALTI GRADIENTI 4683-13
VISCOSITÀ APPARENTE DI GRASSI 1092-12
VISCOSITÀ APPARENTE DI OLI MOTORE
(CCS)5293-15
VISCOSITÀ DI LUBRIFICANTI TRAZIONE (BROOKFIELD)
UNI 20028:1992 2983-09
VISCOSITÀ DI OLI TURBINA DOPO PERMANENZA A BASSA TEMPERATURA
2532-14
VISCOSITÀ/TEMPERATURA DI OLI A BASSA TEMPERATURA, RELAZIONE
5133-15
ZOLFO (BOMBA) 129-13
ZOLFO (FLUORESCENZA RAGGI X) 8754:2003 4294-10
ZOLFO (METODO AD ALTA TEMPERATURA CON RIVELAZIONE IR )
1552-15
ZOLFO (METODO WICKBOLD) 4260:1987
ZOLFO (FLUORESCENZA UV) 5453-12
ZOLFO ATTIVO DI OLI DA TAGLIO 1662-08 (2014)
ZOLFO CORROSIVO DI OLI ISOLANTI 62535:2008 UNI 20052:1992 315/98(04) 1275-15
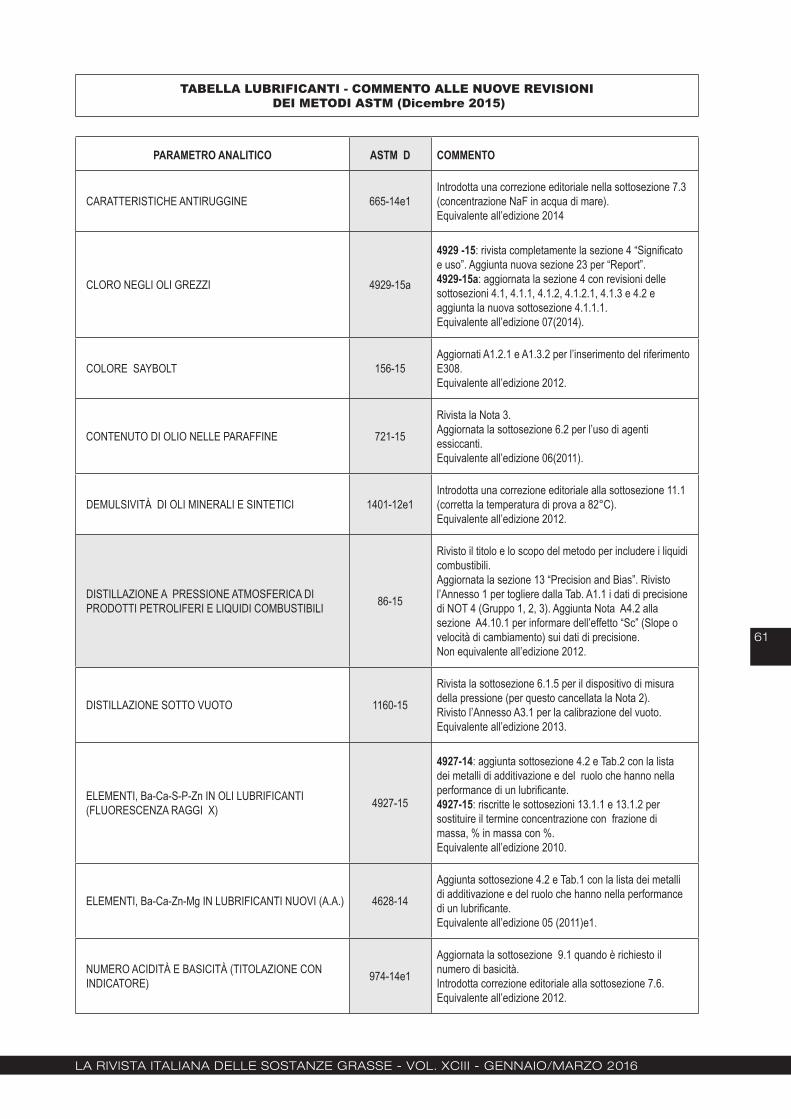
La rivista itaLiana deLLe sostanze grasse - voL. XCiii - gennaio/Marzo 2016
61
TABELLA LUBRIFICANTI - COMMENTO ALLE NUOVE REVISIONI DEI METODI ASTM (Dicembre 2015)
PARAMETRO ANALITICO ASTM D COMMENTO
CARATTERISTICHE ANTIRUGGINE 665-14e1Introdotta una correzione editoriale nella sottosezione 7.3 (concentrazione NaF in acqua di mare).Equivalente all’edizione 2014
CLORO NEGLI OLI GREZZI 4929-15a
4929 -15: rivista completamente la sezione 4 “Significato e uso”. Aggiunta nuova sezione 23 per “Report”.4929-15a: aggiornata la sezione 4 con revisioni delle sottosezioni 4.1, 4.1.1, 4.1.2, 4.1.2.1, 4.1.3 e 4.2 e aggiunta la nuova sottosezione 4.1.1.1. Equivalente all’edizione 07(2014).
COLORE SAYBOLT 156-15Aggiornati A1.2.1 e A1.3.2 per l’inserimento del riferimento E308.Equivalente all’edizione 2012.
CONTENUTO DI OLIO NELLE PARAFFINE 721-15
Rivista la Nota 3.Aggiornata la sottosezione 6.2 per l’uso di agenti essiccanti.Equivalente all’edizione 06(2011).
DEMULSIVITÀ DI OLI MINERALI E SINTETICI 1401-12e1Introdotta una correzione editoriale alla sottosezione 11.1 (corretta la temperatura di prova a 82°C).Equivalente all’edizione 2012.
DISTILLAZIONE A PRESSIONE ATMOSFERICA DI PRODOTTI PETROLIFERI E LIQUIDI COMBUSTIBILI
86-15
Rivisto il titolo e lo scopo del metodo per includere i liquidi combustibili.Aggiornata la sezione 13 “Precision and Bias”. Rivisto l’Annesso 1 per togliere dalla Tab. A1.1 i dati di precisione di NOT 4 (Gruppo 1, 2, 3). Aggiunta Nota A4.2 alla sezione A4.10.1 per informare dell’effetto “Sc” (Slope o velocità di cambiamento) sui dati di precisione.Non equivalente all’edizione 2012.
DISTILLAZIONE SOTTO VUOTO 1160-15
Rivista la sottosezione 6.1.5 per il dispositivo di misura della pressione (per questo cancellata la Nota 2).Rivisto l’Annesso A3.1 per la calibrazione del vuoto. Equivalente all’edizione 2013.
ELEMENTI, Ba-Ca-S-P-Zn IN OLI LUBRIFICANTI (FLUORESCENZA RAGGI X)
4927-15
4927-14: aggiunta sottosezione 4.2 e Tab.2 con la lista dei metalli di additivazione e del ruolo che hanno nella performance di un lubrificante.4927-15: riscritte le sottosezioni 13.1.1 e 13.1.2 per sostituire il termine concentrazione con frazione di massa, % in massa con %.Equivalente all’edizione 2010.
ELEMENTI, Ba-Ca-Zn-Mg IN LUBRIFICANTI NUOVI (A.A.) 4628-14
Aggiunta sottosezione 4.2 e Tab.1 con la lista dei metalli di additivazione e del ruolo che hanno nella performance di un lubrificante. Equivalente all’edizione 05 (2011)e1.
NUMERO ACIDITÀ E BASICITÀ (TITOLAZIONE CON INDICATORE)
974-14e1
Aggiornata la sottosezione 9.1 quando è richiesto il numero di basicità.Introdotta correzione editoriale alla sottosezione 7.6. Equivalente all’edizione 2012.
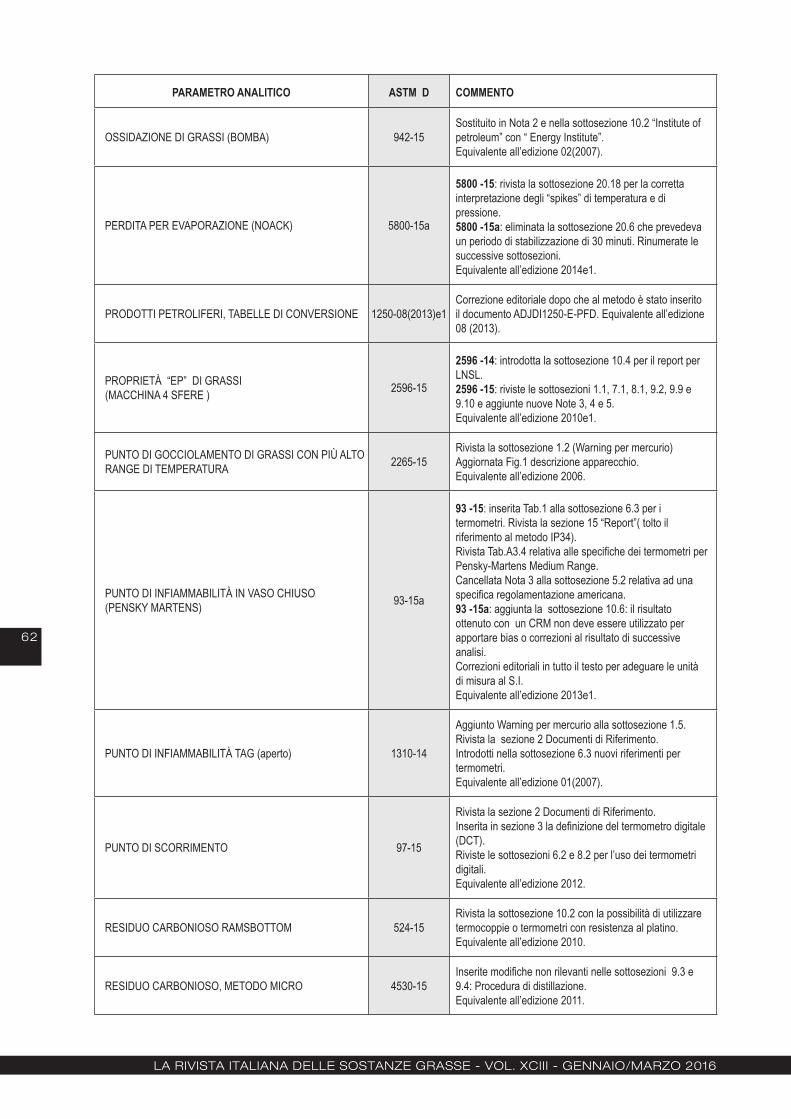
La rivista itaLiana deLLe sostanze grasse - voL. XCiii - gennaio/Marzo 2016
62
PARAMETRO ANALITICO ASTM D COMMENTO
OSSIDAZIONE DI GRASSI (BOMBA) 942-15Sostituito in Nota 2 e nella sottosezione 10.2 “Institute of petroleum” con “ Energy Institute”.Equivalente all’edizione 02(2007).
PERDITA PER EVAPORAZIONE (NOACK) 5800-15a
5800 -15: rivista la sottosezione 20.18 per la corretta interpretazione degli “spikes” di temperatura e di pressione.5800 -15a: eliminata la sottosezione 20.6 che prevedeva un periodo di stabilizzazione di 30 minuti. Rinumerate le successive sottosezioni.Equivalente all’edizione 2014e1.
PRODOTTI PETROLIFERI, TABELLE DI CONVERSIONE 1250-08(2013)e1Correzione editoriale dopo che al metodo è stato inserito il documento ADJDI1250-E-PFD. Equivalente all’edizione 08 (2013).
PROPRIETÀ “EP” DI GRASSI(MACCHINA 4 SFERE )
2596-15
2596 -14: introdotta la sottosezione 10.4 per il report per LNSL.2596 -15: riviste le sottosezioni 1.1, 7.1, 8.1, 9.2, 9.9 e 9.10 e aggiunte nuove Note 3, 4 e 5.Equivalente all’edizione 2010e1.
PUNTO DI GOCCIOLAMENTO DI GRASSI CON PIÙ ALTO RANGE DI TEMPERATURA
2265-15Rivista la sottosezione 1.2 (Warning per mercurio)Aggiornata Fig.1 descrizione apparecchio.Equivalente all’edizione 2006.
PUNTO DI INFIAMMABILITÀ IN VASO CHIUSO (PENSKY MARTENS)
93-15a
93 -15: inserita Tab.1 alla sottosezione 6.3 per i termometri. Rivista la sezione 15 “Report”( tolto il riferimento al metodo IP34).Rivista Tab.A3.4 relativa alle specifiche dei termometri per Pensky-Martens Medium Range.Cancellata Nota 3 alla sottosezione 5.2 relativa ad una specifica regolamentazione americana.93 -15a: aggiunta la sottosezione 10.6: il risultato ottenuto con un CRM non deve essere utilizzato per apportare bias o correzioni al risultato di successive analisi.Correzioni editoriali in tutto il testo per adeguare le unità di misura al S.I.Equivalente all’edizione 2013e1.
PUNTO DI INFIAMMABILITÀ TAG (aperto) 1310-14
Aggiunto Warning per mercurio alla sottosezione 1.5.Rivista la sezione 2 Documenti di Riferimento.Introdotti nella sottosezione 6.3 nuovi riferimenti per termometri.Equivalente all’edizione 01(2007).
PUNTO DI SCORRIMENTO 97-15
Rivista la sezione 2 Documenti di Riferimento.Inserita in sezione 3 la definizione del termometro digitale (DCT).Riviste le sottosezioni 6.2 e 8.2 per l’uso dei termometri digitali.Equivalente all’edizione 2012.
RESIDUO CARBONIOSO RAMSBOTTOM 524-15Rivista la sottosezione 10.2 con la possibilità di utilizzare termocoppie o termometri con resistenza al platino.Equivalente all’edizione 2010.
RESIDUO CARBONIOSO, METODO MICRO 4530-15Inserite modifiche non rilevanti nelle sottosezioni 9.3 e 9.4: Procedura di distillazione.Equivalente all’edizione 2011.
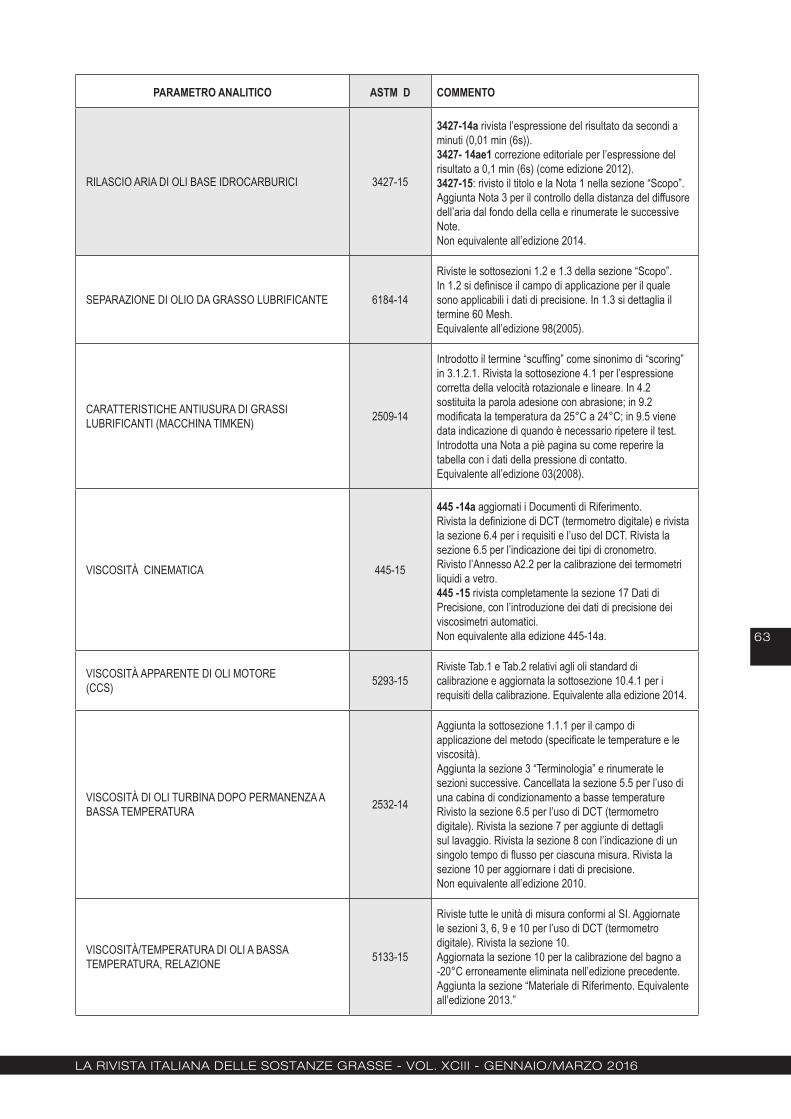
La rivista itaLiana deLLe sostanze grasse - voL. XCiii - gennaio/Marzo 2016
63
PARAMETRO ANALITICO ASTM D COMMENTO
RILASCIO ARIA DI OLI BASE IDROCARBURICI 3427-15
3427-14a rivista l’espressione del risultato da secondi a minuti (0,01 min (6s)).3427- 14ae1 correzione editoriale per l’espressione del risultato a 0,1 min (6s) (come edizione 2012).3427-15: rivisto il titolo e la Nota 1 nella sezione “Scopo”. Aggiunta Nota 3 per il controllo della distanza del diffusore dell’aria dal fondo della cella e rinumerate le successive Note.Non equivalente all’edizione 2014.
SEPARAZIONE DI OLIO DA GRASSO LUBRIFICANTE 6184-14
Riviste le sottosezioni 1.2 e 1.3 della sezione “Scopo”.In 1.2 si definisce il campo di applicazione per il quale sono applicabili i dati di precisione. In 1.3 si dettaglia il termine 60 Mesh.Equivalente all’edizione 98(2005).
CARATTERISTICHE ANTIUSURA DI GRASSI LUBRIFICANTI (MACCHINA TIMKEN)
2509-14
Introdotto il termine “scuffing” come sinonimo di “scoring” in 3.1.2.1. Rivista la sottosezione 4.1 per l’espressione corretta della velocità rotazionale e lineare. In 4.2 sostituita la parola adesione con abrasione; in 9.2 modificata la temperatura da 25°C a 24°C; in 9.5 viene data indicazione di quando è necessario ripetere il test.Introdotta una Nota a piè pagina su come reperire la tabella con i dati della pressione di contatto. Equivalente all’edizione 03(2008).
VISCOSITÀ CINEMATICA 445-15
445 -14a aggiornati i Documenti di Riferimento.Rivista la definizione di DCT (termometro digitale) e rivista la sezione 6.4 per i requisiti e l’uso del DCT. Rivista la sezione 6.5 per l’indicazione dei tipi di cronometro.Rivisto l’Annesso A2.2 per la calibrazione dei termometri liquidi a vetro.445 -15 rivista completamente la sezione 17 Dati di Precisione, con l’introduzione dei dati di precisione dei viscosimetri automatici.Non equivalente alla edizione 445-14a.
VISCOSITÀ APPARENTE DI OLI MOTORE(CCS)
5293-15Riviste Tab.1 e Tab.2 relativi agli oli standard di calibrazione e aggiornata la sottosezione 10.4.1 per i requisiti della calibrazione. Equivalente alla edizione 2014.
VISCOSITÀ DI OLI TURBINA DOPO PERMANENZA A BASSA TEMPERATURA
2532-14
Aggiunta la sottosezione 1.1.1 per il campo di applicazione del metodo (specificate le temperature e le viscosità).Aggiunta la sezione 3 “Terminologia” e rinumerate le sezioni successive. Cancellata la sezione 5.5 per l’uso di una cabina di condizionamento a basse temperature Rivisto la sezione 6.5 per l’uso di DCT (termometro digitale). Rivista la sezione 7 per aggiunte di dettagli sul lavaggio. Rivista la sezione 8 con l’indicazione di un singolo tempo di flusso per ciascuna misura. Rivista la sezione 10 per aggiornare i dati di precisione.Non equivalente all’edizione 2010.
VISCOSITÀ/TEMPERATURA DI OLI A BASSA TEMPERATURA, RELAZIONE
5133-15
Riviste tutte le unità di misura conformi al SI. Aggiornate le sezioni 3, 6, 9 e 10 per l’uso di DCT (termometro digitale). Rivista la sezione 10. Aggiornata la sezione 10 per la calibrazione del bagno a -20°C erroneamente eliminata nell’edizione precedente.Aggiunta la sezione “Materiale di Riferimento. Equivalente all’edizione 2013.”

La rivista itaLiana deLLe sostanze grasse - voL. XCiii - gennaio/Marzo 2016
64
PARAMETRO ANALITICO ASTM D COMMENTO
ZOLFO (METODO AD ALTA TEMPERATURA CON RIVELAZIONE IR )
1552-15
Rivisto il titolo.Mantenuta solo la terza procedura (sistema di rilevazione con IR) e cancellate tutte le sezioni che trattavano il sistema di rilevazione con lo iodato.Non equivalente all’edizione 08(2014)e1.Solo per il sistema di rilevazione con IR il metodo è equivalente all’edizione 08(2014)e1.
ZOLFO CORROSIVO DI OLI ISOLANTI 1275-15Si applica solo il metodo di prova B. Equivalente all’edizione 2006 solo per metodo B.

La rivista itaLiana deLLe sostanze grasse - voL. XCiii - gennaio/Marzo 2016
65
Notiziario• • • • • • • • • • • • • • CONGRESSI
14th International High-end Health Edible Oil and Olive Oil (Beijing) ExpoApril 14-16, 2016 – Beijing ChinaVenue: China International Exhibition CenterGlobal Oil has been organized for 12 times since 2006, which is the biggest,most influential, most authorative oil expo in China, and gets the strong support from government leaders and international organizations. The showing space is increasing and many new products appearing, popular in the the society,companies and customers.Comply with the demand of the market, and the request of the exhi-bitors, from 2013 the Global Oil will be held in spring in Beijing, and held in autumn in Shanghai, in order to set up nationwide sales platform. No matter your purpose is to enter Chinese market or Export foreign country, here you all could find your best cooperator and partner. Global Oil always opens for you and wel-come you.Organizing Committee:Beijing Shibowei International Exposition Co., LtdAddress: Room 904, Cell 4, Building 1, No 69 (Fortune street), Chao Yang Road, Chao Yang District, Beijing, China, 100123Contact: Cathy, ZhaoE-mail: [email protected] information and uptades:http://en.oilexpo.com.cn/
Global Nanotechnology Congress and ExpoApril 21-23, 2016 - Dubai United Arab EmiratesWe look forward to welcoming delegates to this excit-ing conference which will bring together world leaders in their respective fields in the fascinating environment of Dubai. Nanotech-2016 will host leading scientists from aca-demia and industry worldwide, to discuss the latest developments in the fields of Nanoscience & Nano-technology. The conference aims to provide many in-teresting perspectives on how science and technolo-gy of materials from nano to macro level are changing rapidly, thereby providing new opportunities and chal-lenges to explore to the scientists and engineers. Scientific Federation aims to bring together front-line experts from multidisciplinary research and applica-tion areas to join this conference, to discuss the ben-efits of Nanotechnology and materials science in their Research and Development efforts to advance the networking, and collaborating between different aca-demia, research and market leaders in the field and to stimulate the exchange of educational concepts. Nanotech-2016 will introduce the delegates to the
new developments and breakthroughs in many dis-ciplines of nanotechnology and materials science through various speakers and workshop sessions. It will feature a scientific program of Keynote lectures and invited talks by world-eminent personalities, spe-cial sessions, debates, scientific discussions, oral and poster presentations of peer-reviewed contribu-tions to share the most recently breaking research development, discovery and industrial progress from different disciplines in Nanotechnology and Materials Science.Scientific Session/Tracks:
Nanomaterials• Synthesis of Nanomaterials and Nanoparticles -Recent trend in nanotechnology -Emerging areas of materials science -
Carbon Nanomaterials• Graphene Technologies -Carbon based device and Nanocomposites -
Nanomedicine and Biomedical Engineering• Nanomedical approaches for diagnostics and -treatmentsCancer nanaotechnology & tissue engineering -Druy delivery sistems -
Advancements in Material Science• Polymer based Nanocomposites -Multifunctional Nanobiomaterials -
Nanoelectronics• Quantum dots -Electronic, optical and magnetic materials -
Nanodevices & Nanosensors• Nanosensoring in diagnostics and industry -Nanorobots -Nanophotonics materials -
Nanotechnology for Energy and the Environment• Materials science and engineering -Green nanotechnology. -
http://www.scientificfederation.com/nanotech-con-gress/
Trends in Margarine and Shortening Manufacture, Non-Trans Products April 24-28, 2016 - Food Protein Research & Development Center Texas Engineering Experiment Station. The Texas A&M University System - College Station - TexasPractical Short Course on Trends in Margarine and Shortening Manufacture, Non-Trans ProductsObjectives of Short CourseTrain production personnel in principles and practices of:
Production of margarines, low fat and non-trans • spreadsProcessing techniques• Ensuring product quality• Product demonstrations using soybean, cotton-• seed, corn, and palm oils
http://annualmeeting.aocs.org/shortcourses/index.cfm?ItemNumber=41334&navItemNumber=41347

La rivista itaLiana deLLe sostanze grasse - voL. XCiii - gennaio/Marzo 2016
66
Notiz
iario 107th AOCS Annual Meeting & Expo
May 1-4, 2016, Salt Palace Convention Center, Salt Lake City, Utah, USAOrganizer: Sefa Koseoglu, Filtration and Membrane World LLC, USAFundamentals of Edible Oil ProcessingThis program offers an overview of oils and fats chem-istry, processing steps, and product development as related to product quality. Speakers from industry and academia will discuss unit operations and parameters necessary to assure a final quality product. Attendees can expect a valuable experience that will provide so-lutions for practical problems by learning from the ex-periences of industrial experts, while also developing their business through meetings with speakers and other attendees.This short course will appeal to a diverse group of participants in the fats and oils and related industries, including:
New Engineers• Chemists• Technicians and Plant Staff• Market Managers• Anyone wanting to refresh their understanding of • oils and fats processing
Update on New Technologies and Processes in Oils and FatsTopics to be addressed throughout this one-day pro-gram include: energy savings and waste water re-duction in oils and fats, and increase of productivity in every step of unit operations as it to relates to soy-bean, sunflower, corn, palm, and other tropical oils. In addition, new developments, technologies, and methodologies will update attendees on the status of recent developments in the edible oil-processing field.Attendees will have unique and valuable experiences that provide opportunities to solve practical problems by learning from the knowledge of industrial experts, while also developing their business through meetings with speakers and other attendees.The global fats and oils community is continually look-ing for innovative methods, novel commercial tech-nologies/processes, unique products, and new appli-cations to reduce energy usage, increase productivity, reduce waste, and increase profitability.This short course will appeal to a diverse group of participants in the fats and oils industry, including:
Scientists• Technicians• Equipment Manufacturers• Product Formulators• Plant Engineers• Processors• Chemists• Sales and Marketing Executives•
For information and uptades:http://annualmeeting.aocs.org/shortcourses/index.cfm?ItemNumber=41334&navItemNumber=41347
LIPID MAPS Annual Meeting 2016May 17-18, 2016, La Jolla, CALipidomics Impact on Metabolic, Cancer, Cardiovas-cular and Inflammatory DiseasesThis is an exciting time for the emerging field of lipid-omics. With the development and evolution of sophis-ticated mass spectrometers linked to highly efficient liquid chromatography systems, individual molecular species of lipids can now be isolated and identified, allowing us to begin to understand lipid metabolism and the treatment of lipid-based diseases (such as atherosclerosis and inflammatory disease as well as arthritis, cancer, diabetes and Alzheimer’s disease). Recent awareness that each category of lipid consists of thousands if not tens of thousands of individual molecular species requires sophisticated informat-ics to ensure consistent databasing and annotation of the numerous lipid molecular species and analysis of tremendous quantities of experimental data. The goal of this meeting is to bring together biological and biomedical scientists in a wide range of fields to share new findings and methods in the broader lipidomics field and to explore joint efforts to extend the use of these powerful new methods to new applications.Presentations will provide an excellent introduction for scientists new to these methods, and are sure to be of interest to lipidomics veterans who wish to learn about the latest techniques and research results.The meeting program tentatively features the follow-ing sessions:
From Cancer Stem Cells to Fatty Liver Disease• Metabolomics• Metabolic Diseases• Eicosadomics and Inflammation• Cholesterolomics, Oxidized Lipids and Cardiovas-• cular DiseaseLipid Mediators and Cancer•
For information and uptades:http://www.lipidmaps.org/meetings/2016annual/in-dex.html
Vegetable Oil Frying: Live demonstrations, Oil Analyses and Product Evaluation - Prac-tical Short CourseMay 22-24, 2016 - College Station USAObjectives of Short CourseOne of a kind practical Vegetable Oil Frying course to learn:
The art of Frying with various selected frying oils, • including palm oilWhat different oils offer and what to use for spe-• cific applicationsHow to handle frying foods• Onsite frying of french fries and breaded chicken• Fried food safety•
and much more!For information:http://foodprotein.tamu.edu/fatsoils/scfrying.php
La rivista itaLiana deLLe sostanze grasse - voL. XCiii - gennaio/Marzo 2016
67
NotiziarioInternational Sunflower Oil Quality Sympo-siumMay 31, 2016 - Edirne, TURKEYThe conference is being organized by International Sunflower Association (ISA) and Trakya University (TU) in Edirne, Turkey. The conference is intended to present scientific subjects of broad interest to the sunflower community by providing an opportunity to present their work as oral or poster presentations that can be of great value for global sunflower production and trade.The organizers intend to bring together three com-munities: science, research, and private investment in a friendly environment of Edirne, Turkey to share their interests and ideas and to benefit from interac-tion with each other.VenueThe Conference will take place in Balkan Congress Center in TU, Edirne, Turkey.http://www-en.trakya.edu.tr/pages/balkan-confer-ence-venueConference ProgramDuring the Conference, there will be concurrent ses-sions based on the participant’s presentations about different aspects of sunflower covering relevant top-ics from genetics to genomics and from production to trade. The presen tations will continue three days, Monday through Wednesday. In Thursday morning it will be a technical tour in research fields of Trakya Ag-ricultural Research Institute and in the afternoon, will be Edirne city excursion. On Friday, there will be a full day post conference excursion to Istanbul including a city tour and Bosphorus Yacht Tour with an evening dinner.SubjectsProduction, Agronomy, Breeding and Genetics, Ge-nomics, Genetic Resources, Physiology, Biology, Bio-technology, Plant Protection, Trade and Economy.LanguageOfficial Conference language is English.Registration FeesRegistration fee covers attending all conference ses-sions, conference materials (bag, CD, etc.), all lunch-es, dinners, transfers between the congress center and hotels during the conference (May 30th – June 1st), technical tour and Edirne city excursion, coffee breaks, and gala dinner on Thursday June 2nd.For updates and information:http://www.isc2016.org/
International Symposium on lipid Oxidation and AntioxidantsJune 5-7, 2016 – Porto, PortugalWe are delighted to be hosting the 1st International Symposium on Lipid Oxidation and Antioxidants or-ganized by Euro Fed Lipid, which will be held in Porto, Portugal, from 5-7 June 2016. The symposium will be held at the Faculty of Sciences, the oldest faculty at
the University of Porto, with origins dating back to the eighteenth century. This meeting will be a great opportunity to discuss var-ious aspects of lipid oxidation and it will be a chance for fruitful discussions of state-of-the-art knowledge and applications in lipid oxidation prevention. Since lipid oxidation is the main cause of chemical degrada-tion of foods, which decreases the commercial shelf-life of products and deteriorates the sensory prop-erties of foods and reduces consumer acceptability, the technical program of the symposium will cover all aspects necessary for a better understanding of the lipid oxidation process and will show possibilities to improve the quality and oxidative stability of food lip-ids. Discussions will take place on scientific and tech-nological developments in lipid oxidation and anti-oxidants in seven sessions covering antioxidant and lipid oxidation evaluation methods, elucidation of lipid oxidation and antioxidant mechanisms, lipid oxidation in multiphase and complex systems, control of lipid oxidation, lipid oxidation and deep frying, extraction of new dietary antioxidants, and nutritional and physi-ological effects of oxidized lipids and antioxidants. Main Topics:1 - Antioxidant and Lipid Oxidation Evaluation Meth-
ods2 - Elucidation of lipid Oxidation and Antioxidant
Mechanisms 3 - Lipid Oxidation in Multiphase and Complex Sys-
tems 4 - Control of Lipid Oxidation5 - Lipid Oxidation and Deep Frying6 - Extraction, Isolation, Structural Characterization of
New Dietary Antioxidants7 - Nutritional and Physiological Effects of Oxidized
Lipids and AntioxidantsFor information and uptades:http://www.eurofedlipid.org/meetings/porto2016/index.php
11th International Symposium on Adjuvants for Agrochemicals (ISAA 2016) 20 - 24 June 2016 - Monterey USACreating, Bridging and Sharing the Values of Adju-vant Technology. That is the inspiring theme for the 11th International Symposium on Adjuvants for Agro-chemicals (ISAA 2016).ISAA 2016 will be held in the Monterey Conference Center, Monterey, California, USA, during June 20-24, 2016. The coming months we will you inform more in detail about ISAA 2016 and about the diverse venue of this event.ProgrammeISAA 2016 will focus on bridging adjuvant knowledge from those in industry, academia, and national labo-ratories in all areas of agrochemicals, from pesticide formulations to effective applications and new com-plementary technologies.

La rivista itaLiana deLLe sostanze grasse - voL. XCiii - gennaio/Marzo 2016
68
Notiz
iario As the 2016 Symposium is in California, some focus
will be given to updated registration requirements for inerts in agrochemicals on the global, national, and local levels.Our comprehensive symposium programme includes sessions, workshops on these topics:
Formulation and Adjuvant Technology• Soil Adjuvant Technology• Adjuvants and Formulations for Bio-Pesticides• Regulatory Topics Affecting Agrochemical Formu-• lationsModelling and Understanding of Adjuvants’ Mode • of ActionBiological Performance• Future Trends in Adjuvants Research•
The programme will also feature a general poster ses-sion and technical excursions that will highlight some of the exciting aspects and challenges facing growers in this very diverse agricultural area.For updates:http://events.isaa-online.org/page/269/welcome-to-isaa-2016.html
22nd International Symposium on Plant Lipids03-08 July 2016 - Goettingen, GermanyWe are pleased to invite you to attend the 22nd Inter-national Symposium on Plant Lipids to be held in the City of Goettingen, Germany.The scientific program will present contributions from the most important topics in plant lipid research, such as seed oil formation, function of lipids in biotic and abiotic stress as well as their formation in algae and other microorganisms. Key note lectures will allow glimpses into exciting areas of lipid research hitherto not included in plant lipid meetings. Moreover, short talks will be selected from submitted abstracts. These will be supplemented by two poster sessions.Scientific ProgrammeMain Topics and Sessions:Session 1: Lipids and Environment - Abiotic Interac-tions Keynote speaker Ute Roessner “Uncovering salinity stress tolerance mechanisms using spatially resolved lipid analysis in barley roots” Session 2: Understanding Plant Lipid Metabolism Through Flux Analysis and Metabolic ModelingKeynote speaker Doug Allen “Using isotopically non-stationary metabolic flux analysis to investigate plant lipid metabolism” Session 3: Lipids and Environment - Biotic Interac-tions Keynote speaker Katayoon Dehesh “Network Analy-ses of How Plants Sense and Transduce Stress si-gnals”
Session 4: Lipid Droplets and OleosomesKeynote speaker Günther Daum “Regulation of non-polar lipid synthesis, storage and mobilization in ye-ast” Session 5: Lipid Trafficking and ChannelingKeynote speaker Vytas Bankaitis “Sec14-nodulin proteins andhow plants convert large membrane sur-faces to high definition lipid signaling screens” Session 6: GlycerolipidsKeynote speaker Yuki Nakamura “Phosphatidylcholi-ne in Arabidopsis: biosynthesis and function in plant development” Session 7: SphingolipidsKeynote speaker Markus Wenk “Chemical diversity and natural variation of sphingosine-phosphates” Session 8: IsoprenoidsKeynote speaker Stefan Hörtensteiner “Biochemical and molecular analysis of chlorophyll breakdown” Session 9: Surface LipidsKeynote speaker Owen Rowland Session 10: Algae and Microbial LipidsKeynote speaker Yonghua Li-Beisson “Advances in biosynthesis and degradation of lipids in microalgae” Session 11: Lipid BiotechnologyKeynote speaker Uwe Bornscheuer Session 12: Short poster presentationsOrganiser:European Federation for the Science and Technology of Lipids e.V.Postfach 90 04 4060444 Frankfurt/MainPhone: +49 69/79 17-533Fax: +49 69/79 17-564E-Mail: [email protected] updates:http://www.eurofedlipid.org/meetings/goettingen2016/index.php#programme
12th Congress of the International Society for the Study of Fatty Acids and LipidsSeptember 6-10, 2016 - Stellenbosch, Western Cape South AfricaISSFAL 2016 will invite leading scientists in the are of lipid and fatty acid research, particularly those who-se work can be linked to human health. By inviting outstanding basic scientists who can translate the relevance of their work for health, we aim to attract more than 500 delegates worldwide, from a wide range of disciplines linked to lipids and health. The meeting will also feature the presentations of the pre-stigious Alexander Leaf Award and the ISSFAL Early Career Award. Save the date. More information will be announced as it becomes available.http://www.issfal.org/2016
La rivista itaLiana deLLe sostanze grasse - voL. XCiii - gennaio/Marzo 2016
69
indice 2015• • • • • • • • • • • • • • • • auTOri
Pag.
ABENOZA M. . . . . . . . . . . . . . . . . . . . . . . . . . . . . . . . . . . . 83ABENOZA M. . . . . . . . . . . . . . . . . . . . . . . . . . . . . . . . . . . 243ADEFEGHA S.A. . . . . . . . . . . . . . . . . . . . . . . . . . . . . . . . 257ADEYEYE E.I. . . . . . . . . . . . . . . . . . . . . . . . . . . . . . . . . . 123AKKAYA M.R. . . . . . . . . . . . . . . . . . . . . . . . . . . . . . . . . . . 227ALTINÖZ L. . . . . . . . . . . . . . . . . . . . . . . . . . . . . . . . . . . . . 61ALTISSIMI S. . . . . . . . . . . . . . . . . . . . . . . . . . . . . . . . . . . 235ANGELOVA-ROMOVA M.J. . . . . . . . . . . . . . . . . . . . . . . . . 279ANTOVA G.A. . . . . . . . . . . . . . . . . . . . . . . . . . . . . . . . . . . 279ARICI M. . . . . . . . . . . . . . . . . . . . . . . . . . . . . . . . . . . . . . . 187ARSLAN D. . . . . . . . . . . . . . . . . . . . . . . . . . . . . . . . . . . . . 61ASDRUBALI F. . . . . . . . . . . . . . . . . . . . . . . . . . . . . . . . . . 235AY O. . . . . . . . . . . . . . . . . . . . . . . . . . . . . . . . . . . . . . . . . 187BACHROUCH O. . . . . . . . . . . . . . . . . . . . . . . . . . . . . . . . 113BAGLIO D. . . . . . . . . . . . . . . . . . . . . . . . . . . . . . . . . . . . . . 17BENITO M. . . . . . . . . . . . . . . . . . . . . . . . . . . . . . . . . . . . . . 83BENITO M. . . . . . . . . . . . . . . . . . . . . . . . . . . . . . . . . . . . . 243BERETTA S. . . . . . . . . . . . . . . . . . . . . . . . . . . . . . . . . . . . . 11BONDIOLI P. . . . . . . . . . . . . . . . . . . . . . . . . . . . . . . . . . . . 11BOSCHI A. . . . . . . . . . . . . . . . . . . . . . . . . . . . . . . . . . . . . . 11BOUKHCHINA S. . . . . . . . . . . . . . . . . . . . . . . . . . . . . . . . 201BRANCIARI R. . . . . . . . . . . . . . . . . . . . . . . . . . . . . . . . . . 235CAGLA DULGER G. . . . . . . . . . . . . . . . . . . . . . . . . . . . . . 187CAPRI S. . . . . . . . . . . . . . . . . . . . . . . . . . . . . . . . . . . . . . . . 3CATANIA P. . . . . . . . . . . . . . . . . . . . . . . . . . . . . . . . . . . . . . 43CECCHINI M. . . . . . . . . . . . . . . . . . . . . . . . . . . . . . . . . . . 155ÇETIN A.E. . . . . . . . . . . . . . . . . . . . . . . . . . . . . . . . . . . . . 227CHERIF A. . . . . . . . . . . . . . . . . . . . . . . . . . . . . . . . . . . . . 201CICHELLI A. . . . . . . . . . . . . . . . . . . . . . . . . . . . . . . . . . . . . 25COLOMBO CASTELLI G. . . . . . . . . . . . . . . . . . . . . . . . . . 253CONTINI M. . . . . . . . . . . . . . . . . . . . . . . . . . . . . . . . . . . . 155D’ALESSANDRO N. . . . . . . . . . . . . . . . . . . . . . . . . . . . . . . 25DELLA BELLA L. . . . . . . . . . . . . . . . . . . . . . . . . . . . . . . . . . 11DESSI M.A. . . . . . . . . . . . . . . . . . . . . . . . . . . . . . . . . . . . . 39DIMITROVA R.D. . . . . . . . . . . . . . . . . . . . . . . . . . . . . . . . 279DUMAN E. . . . . . . . . . . . . . . . . . . . . . . . . . . . . . . . . . . . . 183DURAN H. . . . . . . . . . . . . . . . . . . . . . . . . . . . . . . . . . . . . 107EL IRAKI S.M. . . . . . . . . . . . . . . . . . . . . . . . . . . . . . . . . . . 139FARAGÒ . . . . . . . . . . . . . . . . . . . . . . . . . . . . . . . . . . . . . . 11FEBO P. . . . . . . . . . . . . . . . . . . . . . . . . . . . . . . . . . . . . . . . 43FENERCIOĞLU H. . . . . . . . . . . . . . . . . . . . . . . . . . . . . . . 107FIDAN S. . . . . . . . . . . . . . . . . . . . . . . . . . . . . . . . . . . . . . . 93FOLEGATTI L. . . . . . . . . . . . . . . . . . . . . . . . . . . . . . . . . . . 17FRANCESCHINI R. . . . . . . . . . . . . . . . . . . . . . . . . . . . . . 235GECGEL U. . . . . . . . . . . . . . . . . . . . . . . . . . . . . . . . . . . . 187GECGEL U. . . . . . . . . . . . . . . . . . . . . . . . . . . . . . . . . . . . 187
GIACALONE R. . . . . . . . . . . . . . . . . . . . . . . . . . . . . . . . . . 99GIULIANI A.A. . . . . . . . . . . . . . . . . . . . . . . . . . . . . . . . . . . . 25GIULIANO S. . . . . . . . . . . . . . . . . . . . . . . . . . . . . . . . . . . . 99GOMAA E.G. . . . . . . . . . . . . . . . . . . . . . . . . . . . . . . . . . . 139GUILLAUME C. . . . . . . . . . . . . . . . . . . . . . . . . . . . . . . . . . 53HAFF R.P. . . . . . . . . . . . . . . . . . . . . . . . . . . . . . . . . . . . . 155HAMMAMI M. . . . . . . . . . . . . . . . . . . . . . . . . . . . . . . . . . . 113HERCHI W. . . . . . . . . . . . . . . . . . . . . . . . . . . . . . . . . . . . 201IVANOVA M. . . . . . . . . . . . . . . . . . . . . . . . . . . . . . . . . . . . 175KABBARY SHEREEN A. . . . . . . . . . . . . . . . . . . . . . . . . . . 139KALLEL H. . . . . . . . . . . . . . . . . . . . . . . . . . . . . . . . . . . . . 201KANCHEVA V.D. . . . . . . . . . . . . . . . . . . . . . . . . . . . . . . . . 175KOLA O. . . . . . . . . . . . . . . . . . . . . . . . . . . . . . . . . . . . . . . 107KOLA O. . . . . . . . . . . . . . . . . . . . . . . . . . . . . . . . . . . . . . . 211KOLA O. . . . . . . . . . . . . . . . . . . . . . . . . . . . . . . . . . . . . . . 227KOWALSKA M. . . . . . . . . . . . . . . . . . . . . . . . . . . . . . . . . . 269KRZTON-MAZIOPA A. . . . . . . . . . . . . . . . . . . . . . . . . . . . 269LASA J.M. . . . . . . . . . . . . . . . . . . . . . . . . . . . . . . . . . . . . . . 83LIMAM F. . . . . . . . . . . . . . . . . . . . . . . . . . . . . . . . . . . . . . 113MARCHEVA M. . . . . . . . . . . . . . . . . . . . . . . . . . . . . . . . . . 279MARIANI D. . . . . . . . . . . . . . . . . . . . . . . . . . . . . . . . . . . . . . 3MARONGUI B. . . . . . . . . . . . . . . . . . . . . . . . . . . . . . . . . . . 39MARZOUK B. . . . . . . . . . . . . . . . . . . . . . . . . . . . . . . . . . . 113MASSANTINI R. . . . . . . . . . . . . . . . . . . . . . . . . . . . . . . . . 155MIRAGLIA D. . . . . . . . . . . . . . . . . . . . . . . . . . . . . . . . . . . 235MOMCHILOVA S.M. . . . . . . . . . . . . . . . . . . . . . . . . . . . . . 279MONARCA D. . . . . . . . . . . . . . . . . . . . . . . . . . . . . . . . . . . 155MOSCETTI R. . . . . . . . . . . . . . . . . . . . . . . . . . . . . . . . . . 155MSAADA K. . . . . . . . . . . . . . . . . . . . . . . . . . . . . . . . . . . . 113OBOH G. . . . . . . . . . . . . . . . . . . . . . . . . . . . . . . . . . . . . . 257ODUBANJO T. . . . . . . . . . . . . . . . . . . . . . . . . . . . . . . . . . 257OGUNSUYI O.B. . . . . . . . . . . . . . . . . . . . . . . . . . . . . . . . 257ORIA R. . . . . . . . . . . . . . . . . . . . . . . . . . . . . . . . . . . . . . . . 83ORIA R. . . . . . . . . . . . . . . . . . . . . . . . . . . . . . . . . . . . . . . 243ORRÙ M. . . . . . . . . . . . . . . . . . . . . . . . . . . . . . . . . . . . . . 235OSMAN H.O.A. . . . . . . . . . . . . . . . . . . . . . . . . . . . . . . . . . 139ÖZCAN M.M. . . . . . . . . . . . . . . . . . . . . . . . . . . . . . . . . . . . 39ÖZCAN M.M. . . . . . . . . . . . . . . . . . . . . . . . . . . . . . . . . . . . 61ÖZCAN M.M. . . . . . . . . . . . . . . . . . . . . . . . . . . . . . . . . . . . 93ÖZCAN M.M. . . . . . . . . . . . . . . . . . . . . . . . . . . . . . . . . . . 183ÖZER M.S. . . . . . . . . . . . . . . . . . . . . . . . . . . . . . . . . . . . . 107ÖZER M.S. . . . . . . . . . . . . . . . . . . . . . . . . . . . . . . . . . . . . 227PAKSOY M. . . . . . . . . . . . . . . . . . . . . . . . . . . . . . . . . . . . . 93PALLOTTI G. . . . . . . . . . . . . . . . . . . . . . . . . . . . . . . . . . . . . 3PIRAS A. . . . . . . . . . . . . . . . . . . . . . . . . . . . . . . . . . . . . . . 39PLANETA D. . . . . . . . . . . . . . . . . . . . . . . . . . . . . . . . . . . . . 43POLESELLO S. . . . . . . . . . . . . . . . . . . . . . . . . . . . . . . . . . . 3PORTA M.R. . . . . . . . . . . . . . . . . . . . . . . . . . . . . . . . . . . . . 17PRESTI G. . . . . . . . . . . . . . . . . . . . . . . . . . . . . . . . . . . . . . 99RANUCCI D. . . . . . . . . . . . . . . . . . . . . . . . . . . . . . . . . . . . 235RAVASIO N. . . . . . . . . . . . . . . . . . . . . . . . . . . . . . . . . . . . 253

La rivista itaLiana deLLe sostanze grasse - voL. XCiii - gennaio/Marzo 2016
70
indic
e 201
5 RAVETTI R. . . . . . . . . . . . . . . . . . . . . . . . . . . . . . . . . . . . . 53RIVOLTA G. . . . . . . . . . . . . . . . . . . . . . . . . . . . . . . . . . . . . 11ROSA A. . . . . . . . . . . . . . . . . . . . . . . . . . . . . . . . . . . . . . . . 39SALEM N. . . . . . . . . . . . . . . . . . . . . . . . . . . . . . . . . . . . . . 113SÁNCHEZ-GIMENO A.C. . . . . . . . . . . . . . . . . . . . . . . . . . . 83SÁNCHEZ-GIMENO A.C. . . . . . . . . . . . . . . . . . . . . . . . . . 243SCALICI D. . . . . . . . . . . . . . . . . . . . . . . . . . . . . . . . . . . . . . 99SEBEI K. . . . . . . . . . . . . . . . . . . . . . . . . . . . . . . . . . . . . . 201SELMI S. . . . . . . . . . . . . . . . . . . . . . . . . . . . . . . . . . . . . . 113SEYMEN M. . . . . . . . . . . . . . . . . . . . . . . . . . . . . . . . . . . . . 93SLAVOVA-KAZAKOVA A. . . . . . . . . . . . . . . . . . . . . . . . . . 175SRITI J. . . . . . . . . . . . . . . . . . . . . . . . . . . . . . . . . . . . . . . 113STELLA E. . . . . . . . . . . . . . . . . . . . . . . . . . . . . . . . . . . . . 155SUKRU DEMIRCI A. . . . . . . . . . . . . . . . . . . . . . . . . . . . . . 187TAMMAR S. . . . . . . . . . . . . . . . . . . . . . . . . . . . . . . . . . . . 113TASAN M. . . . . . . . . . . . . . . . . . . . . . . . . . . . . . . . . . . . . . 187TERZIEVA A. . . . . . . . . . . . . . . . . . . . . . . . . . . . . . . . . . . 175TONUCCI L. . . . . . . . . . . . . . . . . . . . . . . . . . . . . . . . . . . . . 25TRIMIGNO E. . . . . . . . . . . . . . . . . . . . . . . . . . . . . . . . . . . . . 3TSRUNCHEV T. . . . . . . . . . . . . . . . . . . . . . . . . . . . . . . . . 175TÜRKMEN Ö. . . . . . . . . . . . . . . . . . . . . . . . . . . . . . . . . . . . 93ÜNVER A. . . . . . . . . . . . . . . . . . . . . . . . . . . . . . . . . . . . . . . 61USLU N. . . . . . . . . . . . . . . . . . . . . . . . . . . . . . . . . . . . . . . . 93VALIANI A. . . . . . . . . . . . . . . . . . . . . . . . . . . . . . . . . . . . . 235VALLONE M. . . . . . . . . . . . . . . . . . . . . . . . . . . . . . . . . . . . 43ZACCHERIA F. . . . . . . . . . . . . . . . . . . . . . . . . . . . . . . . . . 253ZIOMEK M. . . . . . . . . . . . . . . . . . . . . . . . . . . . . . . . . . . . . 269ZLATANOV M.D. . . . . . . . . . . . . . . . . . . . . . . . . . . . . . . . . 279
• • • • • • arTiCOli puBBliCaTiPag.
Nota tecnica. Determinazione di tensioattivi anionici e non ionici in matrici acquose mediante cromatografia liquida ad alta prestazione (HPLC) accoppiata a rivelatori UV ed evaporativi
3
Study of biodiesel solid contaminants by means of Scan Electron Microscosopy (SEM)
11
Comparazione dei differenti sistemi di iniezione gascromatografici per la rilevazione di grassi vegetali diversi dal burro di cacao nei cioccolati fondenti
17
Chlorophyll photosensitized oxidation of virgin olive oil: a comparison between selected unsaturated model esters and real oil samples
25
Short note. Monitoring of the fatty acid compositions of some olive oils
39
Instrumental evaluation of the texture of cv. Nocellara del Belice table olives
43
Technical note - Technological and agronomical factors affecting sterols in Australian olive oils
53
Short note - Physical and chemical characteristics of oils of some olive varieties in Turkey
61
The evolution of Arbequina olive oil quality during ripening in a commercial super-high density orchard in north-east Spain
83
Short note. Evaluation of fatty acid composition, oil yield and total phenol content of various pumpkin seed genotypes
93
Short note. Solid Phase Extraction and isotope-labelled internal standards for the determination of Aflatoxin B1 in vegetable oils by using High Performance Liquid Chromatography - Tandem Mass Spectrometry
99
Fatty acid profile determination of cold pressed oil of some nut fruits
107
Regional effect on total lipids and fatty acid composition of some aromatic and medicinal plants growing wild in Tunisia
113
Short note. Fatty acids, sterols and phospholipids levels in the muscle of Acanthurus montoviae and Lutjanus goreensis fish
123
Evaluation of eight fungal strains propagated on two synthetic media for lipid production
139
Recenti sviluppi sull’impiego della spettroscopia NIR per il controllo qualitativo e la tutela degli oli extravergini di oliva
155
Assessing the potential of some traditional Bulgarian teas in scavenging free radicals and their antioxidant activity after gamma-irradiation
175
Short note - Proximate analysis and fatty acid composition assessment of three different colored poppy seed oils
183
Some physicochemical properties, fatty acid composition and antimicrobial characteristics of diffe-rent cold-pressed oils
187
Effects of different extraction methods and storage conditions on the quality characteristics and antioxidant activity of flaxseed oil (Linum usitatissimum L) grown in Tunisia
201
Short note - Comparative analysis of physicochemical characteristics and fatty acid composition of seeds of black cumin, poppy, safflower and sesame
211
Physical and chemical characterization of different varieties of hazelnut grown in Sakarya, Turkey
227
Profilo acidico e caratteristiche sensoriali di un preparato a base di polpa di pesce del lago Trasimeno
235
Effect of low-temperature storage under optimal conditions on olive oil quality and its nutritional parameters
243

La rivista itaLiana deLLe sostanze grasse - voL. XCiii - gennaio/Marzo 2016
71
indice 2015Nota breve - Thlaspi arvense oil: content and potential use for biodiesel production
253
A comparative study on the antioxidative activities,anticholinesterase properties and essential oil composition of Clove (Syzygium aromaticum) bud and Ethiopian pepper (Xylopia aethiopica)
257
Studies in the stability of carrot oil emulsions formulated according to the optimization software
269
Detailed characterization of lipids in safflower varieties grown in Bulgaria
279
• • • • • • • • • • • • • NOTiZiariOCONGRESSI
EUBCE 2015. 23rd European Biomass Conference and Exhibition. June 1-4, 2015. Vienna, Austria
69
28th Nordic Lipidforum Symposium. June 3-6, 2015. Reykjavik Iceland
69
1st Sustainable Oils & Fats International Congress. June 16 - 17, 2015 - Paris, France
69
Personal & Home Care, Cosmetics & Foods Industry Focus at the Tech-Connect World Innovation Conference. June 15-18, 2015. Washington DC USA
70
Industrial Biotechnology Congress Milestones of Innovative Scientific Research in Biotechnology & its Industrial Applications. August 10-12, 2015. Birmingham, United Kingdom
70
4th International Conference and Exhibition on Food Processing & Technology. Food Technology: Trends and Strategies for Innovation of Sustainable Foods. August 10-12, 2015. London, UK
71
2nd High Oleic Oil Congress - HOC 2015. September 2-4, 2015. Paris, France
71
Oils+Fats. September 16-18, 2015. Messe München´s MOC Germany
71
7th International Conference on Information and Communication Technologies in Agriculture, Food and Environment (HAICTA 2015). September 17-20, 2015 - Kavala, Greece
72
23rd IFSCC Conference 2015. September 21-23, 2015 - Zürich
72
13th Euro Fed Lipid Congress “Fats, Oils and Lipids: New Challenges in Technology, “Quality Control and Health”. September 27-30, 2015 - Florence, Italy
72
Practical Short Course on Vegetable Oil Processing and Products of Vegetable Oil/Biodiesel. October 4-8, 2015. College Station, Texas
73
PIPOC 2015. The Premier Oil Palm event is back! October 6-8, 2015. Kuala Lumpur Convention Centre, Malaysia
74
Shaping the Future of Food Safety, Together. Milan - Italy, 14-16 October 2015
74
SODEOPEC 2015 Soaps, Detergents, Oleochemicals, and Personal Care. October 27-30, 2015. Miami, Florida, USA
74
World Congress on Oils & Fats and 31st ISF Lectureship Series “Evoluzione, innovazione e sfide per un Futuro Sostenibile”. October 31 - November 4, 2015. Rosario Argentina
76
AOCS Oils and Fats World Market Update 2015. 12-13 November 2015 - Dublin, Ireland
76
SCS FORMULATE 2015. 17-18 November 2015 76
8th International Symposium on Deep Frying -Better understanding, better fried products. 15-17 September 2015, Munich, Germany
149
Oils+Fats. September 15-17, 2015 – Messe München´s MOC, Germany
149
7th International Conference on Information and Communication Technologies in Agriculture, Food and Environment (HAICTA 2015). September 17-20, 2015, Kavala, Greece
149
22nd Annual Practical Short Course on Aquaculture Feed Extrusion, Nutrition, & Feed Management. September 20-25, 2015 - College Station, Texas
150
23rd IFSCC Conference 2015. September 21-23, 2015 - Zürich
150
13th Euro Fed Lipid Congress “Fats, Oils and Lipids: New Challenges in Technology, “Quality Control and Health”. September 27-30 2015 - Florence, Italy hosted by SISSG
150
Practical Short Course on Vegetable Oil Processing and Products of Vegetable Oil/Biodiesel. October 4-8, 2015 - College Station, Texas
151
PIPOC 2015 - The Premier Oil Palm event is back!. October 6-8, 2015 - Kuala Lumpur Convention Centre, Malaysia
152
62nd SEPAWA Congress and European Detergents conference. October 14-16, 2015 – Fulda, Germany
152
Shaping the Future of Food Safety, Together. October 14-16, 2015- Milan, Italy
152
The Emerald Conference. Exploring the Science of Cannabis.January 21-22, 2016 - Las Vegas, Nevada USA
222
American Cleaning Institute Annual Meeting & Industry Convention.January 25 - 30, 2016 - Orlando, Florida, USA
222
ENERCHEM-1 - I Congresso Nazionale del Gruppo Interdivisionale Enerchem.18-20 Febbraio 2016 - Firenze
222
2nd Food Structure and Functionality Forum Symposium. From Molecules to Functionality.28 February - 2 March 2016 - Singex, Singapore
222
La rivista itaLiana deLLe sostanze grasse - voL. XCiii - gennaio/Marzo 2016
72
Notiz
iario Global Nanotechnology Congress and Expo.
April 21-23, 2016 - Dubai United Arab Emirates222
International Symposium on lipid Oxidation and Antioxidants.June 5-7, 2016 – Porto, Portugal
223
11th International Symposium on Adjuvants for Agrochemicals (ISAA 2016).20 - 24 June 2016 - Monterey USA
223
22nd International Symposium on Plant Lipids.03-08 July 2016 - Goettingen, Germany
224
12th Congress of the International Society for the Study of Fatty Acids and Lipids.September 6-10, 2016 - Stellenbosch, Western Cape South Africa
224
14th International High-end Health Edible Oil and Olive Oil (Beijing) ExpoApril 14-16, 2016 – Beijing ChinaVenue: China International Exhibition Center
289
Global Nanotechnology Congress and ExpoApril 21-23, 2016 - Dubai United Arab Emirates
289
International Symposium on lipid Oxidation and AntioxidantsJune 5-7, 2016 – Porto, Portugal
289
11th International Symposium on Adjuvantsfor Agrochemicals (ISAA 2016)20 - 24 June 2016 - Monterey USA
291
22nd International Symposium on Plant Lipids03-08 July 2016 - Goettingen, Germany
291
12th Congress of the International Society for the Study of Fatty Acids and LipidsSeptember 6-10, 2016 - Stellenbosch, Western Cape South Africa
292
14th Euro Fed Lipid CongressSeptember 18-21, 2016 - Ghent Belgium
292
OFIC 2016: Global Trends of Oils & Fats Up To 2015October 19-21, 2016 - Kuala Lumpur Malaysia
292
29th IFSCC CongressOctober 23-27, 2016 - Orlando, Florida USA
292
ATTIVITà EDITORIALE DELLA DIVISIONE SSOGANNO 2014
Olive oils from Algeria: Phenolic compounds, antioxidant and antibacterial activities.F. Laincer, R. Laribi, A. Tamendjari, L. Arrar, P. Rovellini, S. Venturini
219
Caratterizzazione chimica della farina ottenuta dopo la spremitura a freddo dei semi di Cannabis sativa L.L. Folegatti, P. Rovellini, D. Baglio, S. De Cesarei, P. Fusari, S. Venturini, A. Cavalieri
219
Nota breve. Olio di semi: profilo trigliceridrico e qualità nutrizionale.P. Rovellini, P. Fusari, S. Venturini
219
Alchil esteri e composti correlati in oli d’oliva vergini: loro evoluzione nel tempo.L. Conte, C. Mariani, T. Gallina Toschi, S. Tagliabue
220
Oli di semi di spremitura: una nuova categoria di oli vegetali ed una opportunità per i piccoli produttori.P. Bondioli
220
I prodotti secondari della tecnologia olearia e oleo-chimica.P. Bondioli
220
Evaluation of total hydroxytyrosol and tyrosol in extra virgin olive oils.G. Purcaro, R. Codony, L. Pizzale, C. Mariani, L. Conte
221
Composition and antioxidant activity of some Algerian wild extra virgin olive oil.S. Boucheffa, A. Tamendjadi, P. Rovellini, S. Venturini
221
Nota Tecnica. Lubrificanti. Corrispondenze tra metodi analitici (gennaio-dicembre 2014).M. Sala, F. Taormina, R. Maina, P. Ruggeri
221
INDICE ANNATA 2014 79
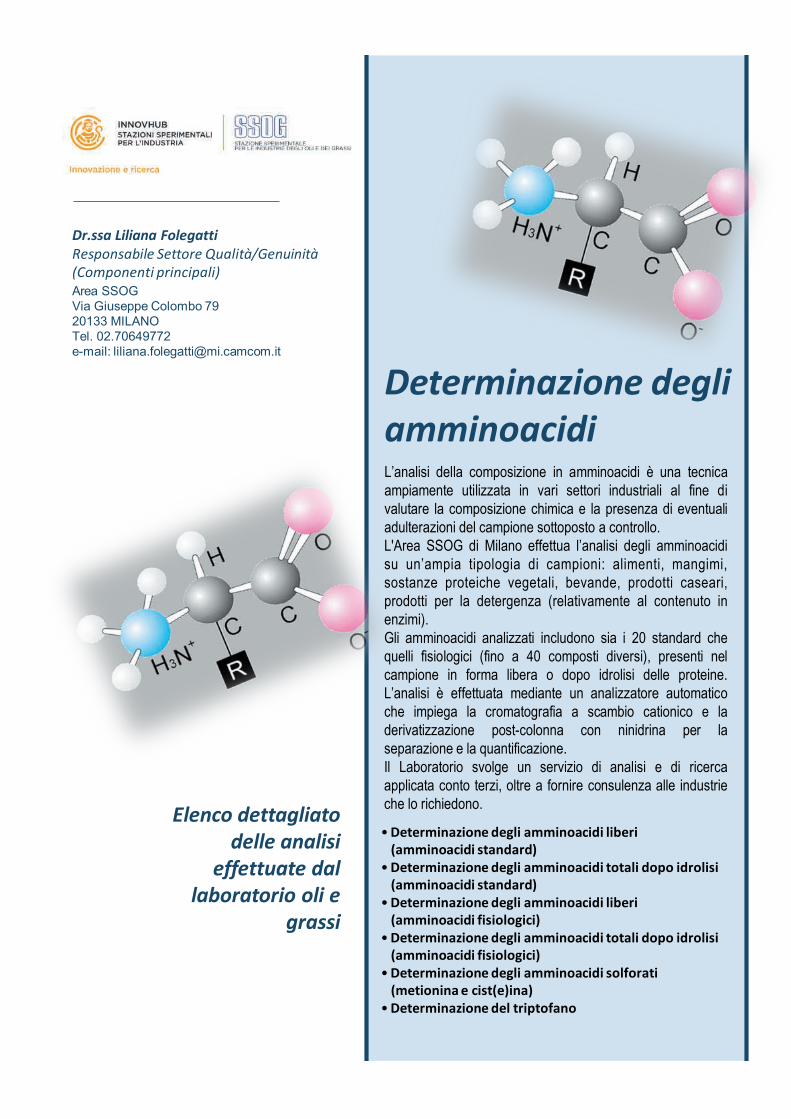
Dr.ssa Liliana Folegatti Responsabile Settore Qualità/Genuinità (Componenti principali) Area SSOGVia Giuseppe Colombo 79 20133 MILANO Tel. 02.70649772 e-mail: [email protected]
Determinazione degli amminoacidi
•Determinazione degli amminoacidi liberi(amminoacidi standard)
•Determinazione degli amminoacidi totali dopo idrolisi(amminoacidi standard)
•Determinazione degli amminoacidi liberi(amminoacidi fisiologici)
•Determinazione degli amminoacidi totali dopo idrolisi(amminoacidi fisiologici)
•Determinazione degli amminoacidi solforati(metionina e cist(e)ina)
•Determinazione del triptofano
Elenco dettagliato delle analisi
effettuate dal laboratorio oli e
grassi
L’analisi della composizione in amminoacidi è una tecnica ampiamente utilizzata in vari settori industriali al fine di valutare la composizione chimica e la presenza di eventuali adulterazioni del campione sottoposto a controllo. L'Area SSOG di Milano effettua l’analisi degli amminoacidi su un’ampia tipologia di campioni: alimenti, mangimi, sostanze proteiche vegetali, bevande, prodotti caseari, prodotti per la detergenza (relativamente al contenuto in enzimi). Gli amminoacidi analizzati includono sia i 20 standard che quelli fisiologici (fino a 40 composti diversi), presenti nel campione in forma libera o dopo idrolisi delle proteine. L’analisi è effettuata mediante un analizzatore automatico che impiega la cromatografia a scambio cationico e la derivatizzazione post-colonna con ninidrina per la separazione e la quantificazione. Il Laboratorio svolge un servizio di analisi e di ricerca applicata conto terzi, oltre a fornire consulenza alle industrie che lo richiedono.
INNOVHUB - Stazioni Sperimentali per l’IndustriaAzienda Speciale della Camera di Commercio di Milano
Area SSOGVia Giuseppe Colombo 79 - 20133 MILANOTel. +39 02 7064971 - Fax +39 02 2363953
e-mail: [email protected] - sito web: www.innovhub-ssi.it