Jad Chaaban, Nisreen Salti, Hala Ghattas, · Al Khateeb, Woroud Abdul Rahim, Mohammad Ghuneim, Rita...
241
Transcript of Jad Chaaban, Nisreen Salti, Hala Ghattas, · Al Khateeb, Woroud Abdul Rahim, Mohammad Ghuneim, Rita...
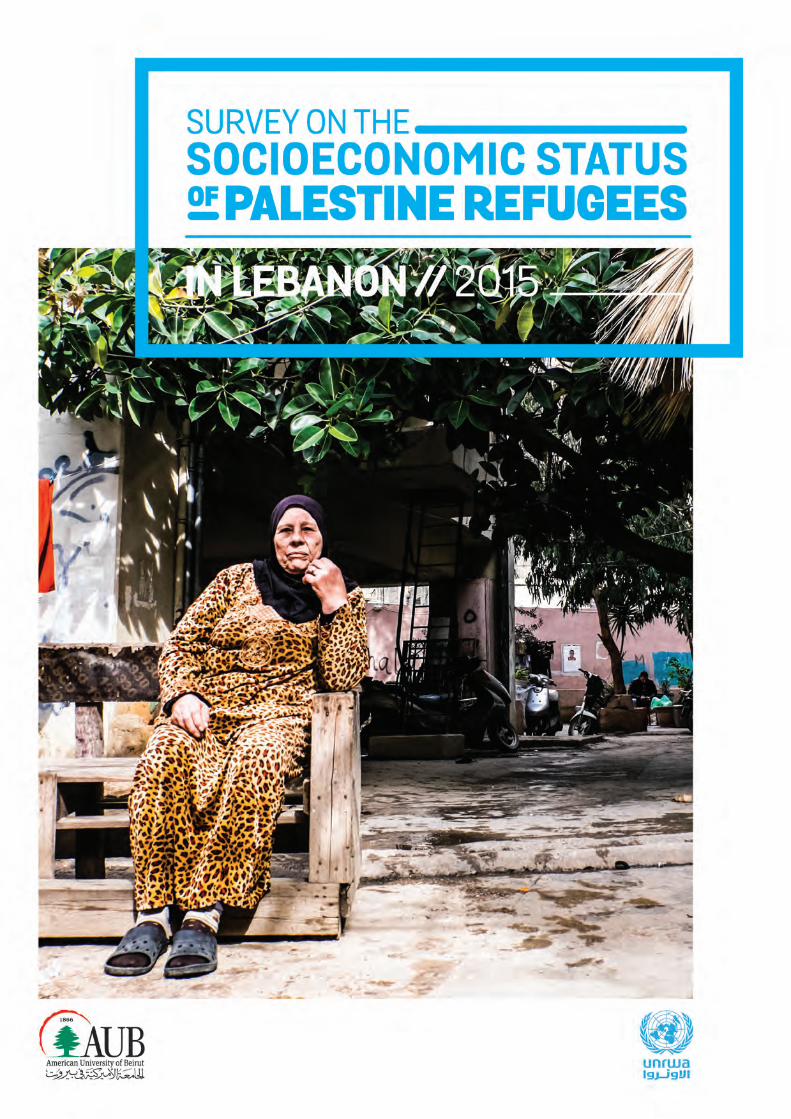
Jad Chaaban, Nisreen Salti, Hala Ghattas,Alexandra Irani, Tala Ismail and Lara Batlouni
Cover photo, © 2016 UNRWA / Francesco Romagnolo
Citation: Chaaban, J., Salti, N., Ghattas, H., Irani, A., Ismail, T.,Batlouni, L. (2016), “Survey on the Socioeconomic Status of Palestine Refugees in Lebanon 2015”, Report published by the American University of Beirut (AUB) and the United Nations Relief and Works Agency for Palestine Refugees in the Near East (UNRWA).
The report was designed by Dina Alwani and printed by Dar El Kotob s.a.l
Printed withthe support of
UNICEF
In 2015, the American University of Beirut (AUB) undertook a critical survey into the implications of both the protracted displacement for Palestine refugees living in Lebanon since the Arab Israeli War in 1948 – 49 and the more recent one due to the Syria crisis. Some of the findings are deeply concerning for the refugees, for UNRWA and for the country that has hosted them since their displacements.
Only five years after the original AUB Socioeconomic Survey of Palestine refugees in Lebanon, some 65 per cent of Palestine refugees from Lebanon (PRL) still live in poverty (it was 66 per cent in the 2010 survey). Some 90 percent of Palestine refugees from Syria (PRS) live in poverty, including 9 per cent living in extreme poverty unable to meet even their most essential food requirements.
The report highlights critical differences between the two displaced communities. There are specific challenges with respect to legal stay for PRS, and their access to employment and jobs with decent work conditions. Unemployment is comparatively of concern at 23.2 per cent for PRL and 52.5 per cent for PRS. The reality of poverty makes it challenging for many families to afford basic needs and to access services in times of need such as hospitalization and specialist care. PRS are almost completely reliant on UNRWA to cover their health needs.
Concerns expressed by refugees during my discussions with them reflect the findings of the survey. In the absence of a just solution many refugees are unsurprisingly deeply anxious and worried about living in poverty and about the lack of perspectives for living a life in greater dignity. The human development and emergency work of UNRWA is increasingly vital in this respect, as is the support that the international community, other UN agencies and non-governmental organizations render to Palestine refugees.
UNRWA has been running its core education, health, relief and social and camp improvement services for Palestine refugees in Lebanon since 1950. There are an estimated 260,000 to 280,000 of the 450,000 registered Palestine refugees from Lebanon who continue to depend on UNRWA’s work as they are unable to access the public systems. And at May 2016, there were a bit more than 40,000 Palestine refugees from
foreword
Syria (PRS) living in Lebanon, to whom UNRWA is providing lifesaving humanitarian assistance in addition to including them in ongoing core UNRWA services.
We should all acknowledge the important role the government and people of Lebanon have played in supporting Palestine refugees in Lebanon, and my sincere wish is that this will continue. With proper support, Palestine refugees are important contributors to the economic progress and stability of Lebanon. Not least in the interest of a stable Lebanon more should and can be done to open up employment and livelihoods opportunities for Palestine refugees.
As we have started the implementation of the Agency’s overall medium-term strategy for 2016 to 2021, UNRWA will continue to not only implement its government-like services and complementary programmes but also to advocate on behalf of and with the Palestine refugees in Lebanon for improvements to their rights and capabilities and the conditions in which they live. In this respect the AUB survey is an important document and tool that we are committed to use both for advocacy purposes and the improvement of our work. In line with our medium-term strategy, we will increasingly focus on ensuring that complementary support and services are prioritized for the most poor, on engaging with the youth more effectively and on facilitating greater access to livelihood opportunities.
Finally, I would like to express my appreciation for the donors who have contributed to the development of the AUB survey, through the Lebanon Crisis Response Plan/UNRWA Syria Emergency Appeal, the European Union, UNICEF and to those who continue to support UNRWA through advocacy and generous financial donations to support its operations. I would like to thank the American University of Beirut for its research and advocacy on behalf of Palestine refugees in Lebanon and the region.
Matthias SchmaleDirector of UNRWA Affairs, Lebanon
FOREWORD //2
We would like to express our gratitude and appreciation to the many people who worked on putting this report together. This report would have been impossible without their hard work and support. First and foremost we would like to thank the Palestine Central Bureau of Statistics (PCBS) for the generous contribution of previous datasets to inform the development of the sampling methodology for the survey. In addition, the expertise of Youssef Madi was instrumental in supporting the development of the survey sample, the data collection training and the survey pilot.
We would like to thank our Field Coordinators Jumana El Haj, Varihan Al Qassem, Suleiman Zeiter, Thaer El Miari and Ghanem El Hadi who provided great insight in the questionnaire development and sampling, coordination of the field work and submission of reviewed and final questionnaires. The field supervisors Salim Al Haj Mussa, Huda Al Ali, Nadia Ardat, Ramia Nouf, Rita Jammal, Wardeh Ayna, Hanan Qaddoura, Fayzeh Khalaf, Riham Kilani, Mezyad Masri and Ahlam Ali provided invaluable support in managing the day to day activities of the data collectors and guiding them throughout the process.
We are grateful to the dedicated team of data collectors who worked in challenging weather and field conditions and finished ahead of schedule. Many thanks to Layan Salhani, Bissan El Achwah, Hanan Ramadan, Ahmad Ibrahim, Maha Khalil, Mahmoud Sharary, Marwa Mustafam, Reem Yaccoub, Israa Sitrallah, Mohammad Al Issa, Hiba Al Khalil, Ahmad Kayed, Ali Saleh, Mahmoud Hasan, Mahmoud Awad, Sara
acknowledgements
Nhaili, Riham Al Aina, Mostafa Younes, Ahmad Mustafa, Huda Halimeh, Asleh Al Saadi, Israa Jomaa, Samar Jumaa, Marwa Kilani, Maha Al Asadi, Rabei Qassim, Samiha Saidawi, Jinan Awdi, Hiba Al Mawed, Reem Hourani, Sara Al Hayek, Ahmad Al Khatib, Emarat Sabha, Ahmad Kayed, Tamam Alaa Eldein, Ahmad Issawi, Mohamad Mawed, Rahma Abou Salah, Marwa Al Khatib, Ahmad Abdull Hamid, Barakat Barakat, Youssef Al Khalil, Mohamad Al Sayed, Fatima Al Khader, Mohamad Ibrahem, Khalid Zamzam, Aya Al Bdeiwi, Ali Audi, Juliana Kassim, Safaa Al Sowan, Nawal Al Awad, Hiba Amer, Alaa Mansour, Sabren Al Khateeb, Woroud Abdul Rahim, Mohammad Ghuneim, Rita Taha, Ola Sweidan, Amani Abdel Alall, Tahani Rasheed, Nadine Obeid, Yosif Taha, Iman Khawaled and Riham Ahmad.
We would also like to thank Leila Kaissi, Fadi Fares, Anne Colquhoun, Brooke Winterburn, Coline Grunblatt, Ola Atout and Peter Target for their help in the conceptualisation and design of the survey and report and their invaluable coordination and logistical support.
Great thanks go to Rami Rajeh for his work on reviewing and editing the report. Last but not least, we thank our research assistants Jowel Choufani, Ali Abazeed, Hina Shaheed, Jana Mourad, Rima Al Mokdad, Jenny Tabet and Anniebelle Sassine and our interns Maya Chmayaah, Danielle Challita, Randa Talhouk, Fady Nakouzi, Sami Zoughaib, Mohamad Khattab, Fouad Homsy, Jana Kontar and Suzanne Hejjaoui who worked hard throughout the project to ensure its success.
3// ACKNOWLEDGEMENTS

AFFSS
ATM
AUB
CLA
DPRA
HDDS
HDI
ICIP
ILO
IRB
JICA
KFW
LAF
LFPR
MHI-5
MPI
NBC
NLA
PCBS
PLO
PRL
PRS
RRIS
RSS
SHC
SRH
SSN or SSNP
UNRWA
ANERA
TVET
STC
EMIS
PMTF
NSSF
NGO
HH
WASH
Arab Family Food Security Scale
Automatic Teller Machine
American University of Beirut
Central Lebanon Area
Directorate General of Political and Refugees Affairs
Household Dietary Diversity Score
Human Development Index
Infrastructure and CampImprovement Program
International Labour Organization
Institutional Review Board
Japan International Cooperation Agency
Federal Bank of Development
Lebanese Armed Forces
Labour Force Participation Rate
Mental Health Inventory
Multidimensional Poverty Index
Nahr el Bared Camp
North Lebanon Area
Palestine Central Bureau of Statistics
Palestine Liberation Organization
Palestine Refugees in Lebanon
Palestine Refugees from Syria livingin Lebanon
Refugee Registration andInformation System
Relief and Social Services
Special Hardship Cases
Self-Rated Health Question
Social Safety Net Programme
United Nations Relief and Works Agency
American Near East Refugee Aid
Technical and VocationalEducation & Training
Siblin Training Centre
Education ManagementInformation System
Proxy Means Test Formula
National Social Security Fund
Non Governmental Organization
Household
Water, Sanitation and Hygiene
acronyms and abbreviations
ACRONYMS AND ABBREVIATIONS //4

EXECUTIVE SUMMARY

EXECUTIVE SUMMARY //6
1 UNHCR. (2015). Vulnerability Assessment of Syrian Refugees in Lebanon.
background
regardless of their time of entry, their registration status with UNRWA and their legal status vis-à-vis the Lebanese authorities. The scale and depth of the data in the report are intended to inform programs and policies for improving the living conditions and livelihoods of PRL and PRS.
Data on PRL and PRS are presented separately, based on the reasoning that PRL, who have been in Lebanon since 1948, have a different situation than PRS, who have only recently taken refuge in Lebanon as a result of the Syria crisis. PRS are regarded as wartime refugees; their status in the eyes of the Lebanese government and the international community is wholly different to that of PRL, who are now in their third generation of displacement.
The living conditions for most Palestine refugees in Lebanon are precarious: this fact was established in the report of the foundational AUB-UNRWA study of Palestine refugees in Lebanon in 2010. The current study updates many of the findings of the original flagship report, and tracks key aspects of PRL and PRS lives, with the 2010 findings serving as a benchmark for the current living conditions and well-being of PRL. In keeping with the approach of the 2010 report, the poverty status of Palestine refugees is measured through a multidimensional approach, including not only the lack of income or assets, but also looking at education, health, food security and other relevant indicators.
This report summarizes the findings from a survey conducted by the American University of Beirut (AUB) on behalf of the United Nations Relief and Works Agency for Palestine refugees (UNRWA) to assess current socioeconomic issues for Palestine refugees living in Lebanon. The survey comes at a critical time: in the context of the Syria crisis, it shows the impact that 68 years of displacement have had on Palestine refugees in Lebanon (PRL), in a country which today also hosts more than 1.1 million registered Syrian refugees.1 The study is all the more important as it also documents the situation of over 42,000 Palestine refugees from Syria living in Lebanon (PRS) at the time of the survey. As such, the report covers the situation of all Palestine refugees residing in Lebanon
7// SOCIAL EXCLUSION OF PALESTINE REFUGEES IN LEBANON
2 Amendment (296 of 20 March 2001) to the existing presidential decree 11614.
Despite the August 2010 amendments to Article 59 of the Labour Law and Article 9 of the Social Security Law which resulted in waiving work permit fees for Palestine refugees born in Lebanon, and which revoked the reciprocity of treatment policy for end-of-service and work-related injuries compensation, these amendments have not significantly affected the quality of employment for PRL; this study finds that less than3.3 per cent have an official employment contract by a public notary that enables them to apply for a work permit.
Due to restrictions and limitations on many of their rights, refugees have relied on UNRWA as their main source of assistance and service provision since 1950. In Lebanon, UNRWA provides primary, secondary and vocational education, health care, relief and social services, infrastructure and camp improvement, protection and emergency response. The Agency also works closely with government authorities and other international and non-profit organizations to provide resources and services to refugees.
Still, Palestine refugees in Lebanon (PRL) face one of the worst socioeconomic conditions in the region, and these have been deteriorating given the country’s weakening socioeconomic situation and the prolonged Syria crisis. A little short of two thirds of the PRL population is poor, a proportion that has not changed since 2010, and the discriminatory laws against them hinder their ability to improve their living conditions and livelihoods. Decaying infrastructure, a dearth of recreational spaces, insufficient access to roads, deteriorated water and sewage treatment systems, contaminated water, and jerry-rigged electrical wires along with open drainage ditches paint a gloomy picture of camps where over63 per cent of PRL reside.
The Palestine refugee presence in Lebanon dates back to the Nakba in 1948. Today, the state of PRL is considered as one of protracted refugees, rather than refugees fleeing from recent conflict. More than 67 years after their initial presence in Lebanon, Palestine refugees are still considered as foreigners under Lebanese law, which does not grant them any special legal status and deprives them from basic rights enjoyed by the Lebanese. This prolonged foreigner status mainly stems from the strong rejection by the Lebanese authorities of the naturalization of Palestine refugees, which is sometimes used as justification for the various discriminatory policies against them. On a political level, Palestine refugees have also opposed naturalization. Accordingly, despite their longstanding presence in the country as refugees, PRL remain excluded from key aspects of social, political, and economic life. They face legal and institutional discrimination; they are denied the right to own property2 and face restrictive employment measures such as a ban from some liberal and syndicate professions.
social exclusion of palestine refugees in lebanon

In May 2014, the Ministry of Interior announced its intention to set restrictions on PRS entering at the border. Accordingly, entry into Lebanon was severely restricted. Entry at the border is now only granted to PRS who either have a verified embassy appointment in Lebanon, or a flight ticket and visa to a third country. UNRWA has recorded a very limited number of new arrivals in its emergency database in the months prior to the publication of this report.
In addition, PRS currently residing in Lebanon face challenges in regularizing their legal status or residency. Since the arrival of PRS in the country, the General Security Office (GSO) has issued several circulars enabling PRS to renew the required residency permit. Most of these circulars have been valid for a period of one to three months, and many were issued with some intervals between them, during which time theoretically no renewal was possible. The renewal of residency was free of charge for the first year. During 2014 and part of 2015, the cost of renewing legal residency documents was US$ 200 per person per year for those who have exceeded one year of stay. It seems likely that many PRS did not approach the GSO for fear of arrest and deportation or due to the length and cost of the process. Since
17 October 2015 several memos have been issued periodically allowing for a renewal of residency documents, free of charge. Some PRS with expired residency permits have been issued a departure order, though it is noted that these have not been enforced.
UNRWA has been struggling to ensure adequate shelter, education, health care and other services to PRS, who now represent an approximate 20 per cent increase of beneficiaries in need of assistance in Lebanon. As the primary provider of assistance to PRS, UNRWA instituted in February 2014 programs of monthly cash assistance for food (US$ 30 per person) and housing (US$ 100 per family). In April 2015 food assistance was reduced from US$ 30 to US$ 27, and in May 2015, due to financial constraints, UNRWA announced a suspension of cash for housing assistance to PRS, effective in July 2015. This suspension in aid comes at a time when PRS are becoming increasingly vulnerable, with UNRWA cash assistance representing the main source of income for 92.6 per cent of the population, according to the survey.
The neighbouring Syria crisis has led many to seek refuge in Lebanon, which now hosts over 1.1 million registered Syrian refugees3 and over 42,000 Palestine refugees from Syria, making Lebanon the largest per-capita recipient of refugees in the world. Since 2011, when the conflict in Syria began, an increasing number of Palestine refugees from Syria have sought safety and refuge in Lebanon. According to UNRWA registration figures, their numbers were 42,284 (as of November 2015). The arrival of PRS has added further pressure on the infrastructure and services within existing Palestine refugee camps and the areas outside the camps.
Before the outbreak of the conflict in Syria, Lebanese border restrictions treated Syrians and PRS as foreigners wishing to enter the country. Once the Syria crisis broke out, entry procedures were eased between February and August 2013, to treat Syrians and PRS as refugees fleeing a crisis. This is the period during which the majority of PRS arrived in Lebanon. Entry then became more restricted and a screening system for entry was set up at the border in August 2013, although the criteria for entry were never officially published. UNRWA has, on rare occasions, been able to intervene on behalf of some PRS to secure their entry.
palestine refugees from syria living in lebanon:
a brief overview
3 UNHCR. (2015). Vulnerability Assessment of Syrian Refugees in Lebanon.
EXECUTIVE SUMMARY //8
4 Central Administration of Statistics. (2012). Households budget survey. Retrieved January 31, 2016, from http://goo.gl/9CxsTv.
main survey findings
camps is in Ein El Hilweh camp in Saida and in Rashidieh camp in Tyre, where respectively 15 per cent and 12 per cent of PRL currently reside. South Lebanon accommodates the largest portion of PRL – 52 per cent reside in Saida and Tyre – whereas the smallest share of PRL resides in the Beqaa, at 4 per cent. NLA hosts around 20 per cent while the CLA is home to around 24 per cent. PRS are also mostly concentrated in Ein El Hilweh 13.7 per cent, and 52.9 of PRS more generally live in south Lebanon,
by 9 per cent and the Beqaa by 2 per cent. Poverty affects young refugees most, with 74 per cent of adolescents living in poverty, and 5 per cent living in extreme poverty.
An even larger proportion of PRS are poor. Nine per cent are extremely poor (3,500 are estimated to be unable to meet essential food requirements); while 89.1 per cent are generally poor (35,000 could not meet their basic food and non-food needs).
Both extreme and overall poverty rates are higher inside the camps than out. In the NLA and the Beqaa, areas adjacent
figures similar to those for PRL for these regions. The Beqaa hosts 14 per cent of PRS, NLA 18 per cent, and CLA 15 per cent.
On average, the PRS population, with a mean age of 25.6 years, is five years younger than the PRL population. PRS also account for bigger households than PRL at 5.6, compared to 4.5 household members for PRL. The average age of the PRS household head is 46, younger than the average age of the head of a PRL household, at 55.
to Syria, poverty levels are at 94.1 per cent for PRS. PRS poverty is lowest in CLA at 77 per cent. Extreme poverty incidence in NLA is 15.6 per cent while it is 11.3 per cent in the Beqaa. Providing PRS with economic opportunities is extremely important to lift them out of poverty, even if these opportunities are provided through the informal economy.
PRL monthly per-capita spending is under half the average spending of the Lebanese, at US$ 195 compared toUS$ 4294, respectively. PRS monthly per-capita spending is even lower than PRL at US$ 140.
The survey spanned the 12 refugee camps and areas outside the camps in Lebanon and included 2,974 PRL households and 1,050 PRS households. Sixty-three per cent of PRL live in refugee camps compared to 54.8 per cent of PRS, while the rest of the population lives in areas outside the camps. Palestine refugees are distributed over five Lebanese regions, namely the Beqaa, North Lebanon Area (NLA), Central Lebanon Area (CLA), Saida, and Tyre. The largest concentration of PRL in
While extreme poverty rates have halved for PRL since 2010 from 6.6 per cent to 3.1 per cent, general poverty rates have remained the same over the past five years at 65 per cent. This drop in extreme poverty is worth investigating in future studies to help shed light on the reduced rate. There are, however, variations in these poverty dynamics among the various regions. General poverty rates have declined slightly in south Lebanon, but they have slightly increased in NLA, Beqaa and CLA. Poverty levels in Saida have dropped by 8 per cent. In addition, Tyre has also witnessed a 9 per cent drop in poverty rates. However, poverty has increased in NLA by 11 per cent, in CLA
Demographics
Money-metric Poverty
9// MAIN SURVEY FINDINGS
5 Legislators, senior officials, managers and professionals.
have a lower enrolment rate than PRL, and the reasons for non-enrolment range from distance from schools and universities, to restrictions on mobility, and a lack of means to purchase school supplies. PRL and PRS enrolment rates vary by educational cycle. While PRL enrolment is close to 97.2 per cent in elementary, 84.2 per cent in preparatory and 61.2 per cent in secondary schools, PRS enrolment is 88.3, 69.6 and 35.8
employment at 41 per cent, followed by wage labour at 37.8 per cent, and UNRWA assistance through the SSN programme at 33.5 per cent.
Not only are PRL and PRS struggling with unemployment, the majority of those who are employed work in low-paying, low-skilled jobs that are more often than not subject to harsh, exploitive and insecure working conditions. For instance, 53.4 per cent of the employed
least one family member suffering from a chronic illness. That rate is 83 per cent among PRS households. Sixty-three per cent of PRL respondents and 75 per cent of PRS respondents report at least one household member who suffered from
per cent for the same respective cycles respectively for the same year. PRS enrolment is significantly higher for camp residents (93.7 per cent) compared to students residing in areas outside the camps (82.6 per cent), indicating the negative impact that restrictions on movement and a lack of access to means of transportation may have on children accessing education outside of camps.
PRS are paid on a daily basis, while the vast majority (97.7 per cent) only have verbal agreements with their employers, meaning that employment could be terminated at any time without notice. Moreover, 98.2 per cent do not have sick or annual leave. All professions, except the senior ‘white collar’ occupations,5 show poverty rates higher than 50 per cent, reflecting the low pay and precarious work conditions PRL still experience.
an acute illness in the past six months. Both PRL and PRS reported 10 per cent who suffer from a disability. Both PRL and PRS health conditions improve with increasing educational attainment and employment levels.
Educational attainment and decent employment opportunities are protective against poverty. Higher educational attainment and higher attendance rates, for both PRL and PRS, correlate with higher spending. It is worth noting that PRL educational enrolment is particularly high, especially at the elementary level. Secondary level enrolment has increased for PRL since 2010 from 51.1 to 61.2 per cent. PRS
Another factor that ties into PRL and PRS poverty is unemployment. The PRL unemployment rate stands at 23 per cent (a significant increase from the 2010 rate of 8 per cent); this rate is around 31 per cent for women. The PRS unemployment rate, in comparison, is at an alarming 52.5 per cent, 48.5 per cent for men and a staggering 68.1 per cent for women. Around 80 per cent of employed PRL are self-employed and wage labourers. The main source of income for PRL is self-
PRL and PRS health conditions and access to health services are highly dependent on UNRWA services. An almost unanimous count responded that they have access to UNRWA health services. 81.3 per cent of PRL report at
Education
Labour Market Outcomes
Health
EXECUTIVE SUMMARY //10
classified as moderately food insecure. Among PRL, 38 per cent reported being food secure, 38 per cent moderately food insecure and 24 per cent severely food insecure. An alarming 27 per cent of PRL children live in severely food insecure households. PRS have been found to be far more vulnerable: a mere 6 per cent are food secure, and 63 per cent are
both PRL and PRS living in camps across Lebanon.
While 46 per cent of PRS report living in overcrowded conditions, the number is much lower at 9 per cent for PRL. Seventy eight per cent of PRL households complain from dampness in their dwelling, 62 per cent of houses suffer
fear being deported (in the Beqaa,83.3 per cent fear deportation), and67.8 per cent report being concerned for their family’s safety (85.5 per cent in the NLA). Furthermore, 57.1 per cent
a multidimensional poverty index that includes education and employment in addition to expenditures, around a quarter of PRL are poor, compared to 64 per cent of PRS. Any policy that ties into improving labour market access, work conditions and employment
severely food insecure. PRS are subject to legal and mobility restrictions. Their access to the labour market is insecure and they experience exploitive working conditions. These factors likely explain the gap between PRL and PRS when it comes to food security rates.
from water leakages, 52 per cent suffer from poor ventilation and 55.2 per cent are affected by darkness. Similarly, 81.1 per cent of PRS households are affected by dampness, 68 per cent of houses suffer from water leakages, 56.4 per cent suffer from poor ventilation and 57.6 per cent of homes are too dark.
of PRS report feeling insecure due to the physical and social environment around them (70.1 per cent in CLA and the Beqaa).
opportunities and increasing education enrolment and the quality of education across the various educational cycles and levels will serve both PRL and PRS mental, physical and financial interests.
Overall, food insecurity levels of PRL are similar to 2010. While overall (moderate and severe) food insecurity prevalence rates are almost unchanged from the 2010 survey (61.5 per cent in 2010 compared to 62.2 per cent in 2015), there is a four percentage-point increase in severe food insecurity, with a corresponding decrease in households
While the majority of both PRL (84 per cent) and PRS (79 per cent) have access to potable water, their housing conditions are still considered poor. Houses suffer from a lack of maintenance, power supply, proper sewage networks and waste disposal, and homes are damp and suffer from water leakages. These conditions are predominant among
PRS live in constant fear of deportation which is associated with significantly lower school enrolment for non-camp students compared to camp residents and PRL. Around 60.6 per cent of PRS
Finally, regardless of the region, camp, or population group (PRL or PRS), a respondent’s living conditions, their overall well-being and sense of security improve when they have decent opportunities of employment and advanced educational attainment. Using
Food Security
Conditions of the Dwelling
Security
Multidimensional Poverty
11// MAIN SURVEY FINDINGS

contentsForeword
Acknowledgements
AcronymsandAbbreviations
ExecutiveSummary
ListofFigures
ListofTables
ListofAppendices
Introduction
Methodology
Demographics of Palestine Refugees in LebanonPoverty Profile of Palestine Refugees in LebanonEducation Access and Attainment of Palestine Refugees in LebanonAccess to Work and Decent Working Conditions for Palestine Refugees in LebanonPopulation Health and Access to Services for Palestine Refugees in LebanonFood Security of Palestine Refugees in LebanonHousing Quality and Access to Water, Sanitation and Hygiene (WASH) for Palestine Refugees in LebanonDemographic Profile of Palestine Refugees from Syria Living in LebanonPoverty Profile of Palestine Refugees from Syria Living in LebanonEducation Access and Attainment of Palestine Refugees from Syria Living in LebanonAccess to Work and Decent Working Conditions for Palestine Refugees from Syria Living in LebanonPopulation Health and Access to Services for Palestine Refugees from Syria Living in LebanonFood Security of Palestine Refugees from Syria Living in LebanonHousing Quality and Access to Water, Sanitation and Hygiene (WASH) for Palestine Refugees from Syria living in LebanonReferenceListAppendices
ChapterOne:ChapterTwo:
ChapterThree:
ChapterFour:
ChapterFive:
ChapterSix:ChapterSeven:
ChapterEight:
ChapterNine:ChapterTen:
ChapterEleven:
ChapterTwelve:
ChapterThirteen:ChapterFourteen:
405066
80
93
108122
136
148162
176
188
204218
230234
2
3
4
5
13
15
19
20
26
CONTENTS //12
13 // LIST OF FIGURES
list of figuresPRL/PRS sample distributionPRL population distribution (per cent)PRL population pyramid by age group (per cent)PRL male/female ratio by age group (per cent)Share of PRL who live alone and remain single by gender and age group (per cent)Average household size by regionPRL gender distribution of household head (per cent)PRL age group distribution of household head (per cent)PRL poverty levels by regionPRL population pyramid by poverty, gender and age groupPRL enrolment rate by gender and education level (per cent)PRL labour force participation rate by gender and location (per cent)PRL unemployment rate by gender and location (per cent)PRL employment-to-population ratio by gender and location (per cent)PRL prevalence of chronic, acute illness, and functional disability by age group (per cent)Percentage of PRL households that have at least one person with chronic or acute illness or a functional disability by geographical region (per cent)PRL percentage of those with and without chronic illness, acute illness, or functional disability who were hospitalised in the last 12 months (per cent)PRL food security by geographic areaPRL head of household education attainment and unemployment by household food insecurity level (per cent)PRL head of household occupation categories by household food insecurity level (per cent)PRL mean total and food expenditure per capita (in US$) by household food security levelPRL mean weekly household consumption of food groups by food insecurity level (frequency/week)PRL percentage of the four most commonly reported food-related coping strategies by household food security level (per cent)PRL percentage of the four most commonly reported non-food-related coping strategies by household food security level (per cent)PRL average household expenditure by region (US$ per month)PRL household expenditure items by region (per cent)
Figure1Figure2Figure3Figure4Figure5
Figure6Figure7Figure8Figure9
Figure10Figure11Figure12Figure13Figure14
Figure15
Figure16
Figure17
Figure18Figure19
Figure20
Figure21
Figure22
Figure23
Figure24
Figure25Figure26
3844454546
474848565972858687
97
100
104
112114
114
117
119
120
120
133133
CONTENTS // 14
PRS population distribution (per cent)PRS population pyramid by age group (per cent)PRS male/female ratio by age group (per cent)PRS average household size by regionShare of PRS who live alone and remain single by gender and age group (percent)PRS gender distribution of household head (per cent)PRS age group distribution of household head (per cent)PRS arrival profile (per cent)PRS poverty levelPoverty incidence differences between PRL and PRS: Poverty line US$ 208 per person/month (per cent)Extreme poverty incidence differences between PRL and PRS: Extreme poverty line US$ 75 per person/month (per cent)PRS population pyramid by poverty, gender and age groupPRS labour force participation rate by gender and location (per cent)PRS unemployment rate by gender and location (per cent)PRS employment-to-population ratio by gender and location (per cent)PRS prevalence of chronic, acute illness and functional disability by age group (per cent)Percentage of PRS households that have at least one person with chronic, acute, or a functional disability by geographical region (per cent)PRS percentage of those with and without chronic illness, acute illness, and functional disability who were hospitalised in the last 12 months (per cent)PRS food security by geographic areaPRS head of household educational attainment and unemployment by household food insecurity level (per cent)PRS head of household occupation categories by household food insecurity level (per cent)PRS mean total and food expenditure per capita (in US$) by household food security levelPRS mean weekly household consumption of food groups by household food insecurity level (frequency/week)PRS percentage of the four most commonly reported food related coping strategies by household food security level (per cent)PRS percentage of the four most commonly reported non-food related coping strategies, by household food security level (per cent)PRS average household expenditures by region (US$ per month)PRS household expenditure items by region
Figure27Figure28Figure29Figure30Figure31
Figure32Figure33Figure34Figure35Figure36
Figure37
Figure38Figure39Figure40Figure41
Figure42
Figure43
Figure44
Figure45Figure46
Figure47
Figure48
Figure49
Figure50
Figure51
Figure52Figure53
140141142142143
144144145154155
155
157180181182
192
195
199
209211
211
214
215
216
216
228228
15// LIST OF TABLES
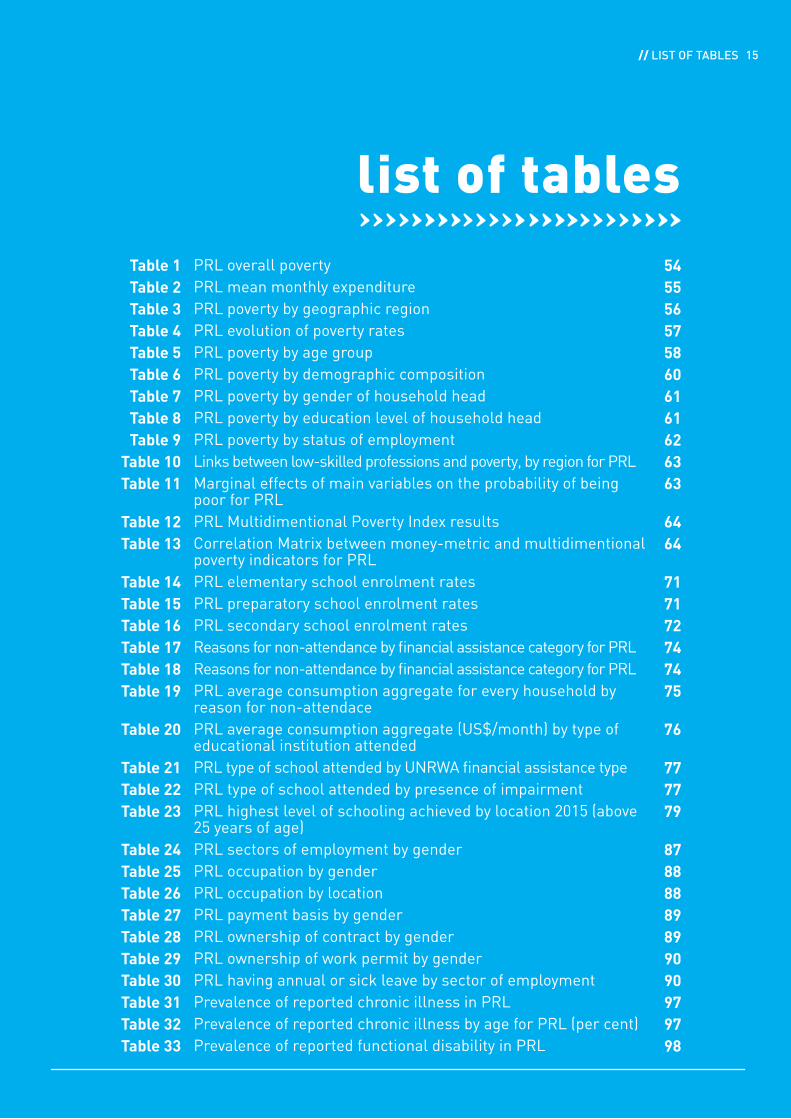
list of tablesPRL overall povertyPRL mean monthly expenditurePRL poverty by geographic regionPRL evolution of poverty ratesPRL poverty by age groupPRL poverty by demographic compositionPRL poverty by gender of household headPRL poverty by education level of household headPRL poverty by status of employmentLinks between low-skilled professions and poverty, by region for PRLMarginal effects of main variables on the probability of being poor for PRLPRL Multidimentional Poverty Index resultsCorrelation Matrix between money-metric and multidimentional poverty indicators for PRLPRL elementary school enrolment ratesPRL preparatory school enrolment ratesPRL secondary school enrolment ratesReasons for non-attendance by financial assistance category for PRLReasons for non-attendance by financial assistance category for PRLPRL average consumption aggregate for every household by reason for non-attendacePRL average consumption aggregate (US$/month) by type of educational institution attendedPRL type of school attended by UNRWA financial assistance typePRL type of school attended by presence of impairmentPRL highest level of schooling achieved by location 2015 (above 25 years of age)PRL sectors of employment by genderPRL occupation by genderPRL occupation by locationPRL payment basis by genderPRL ownership of contract by genderPRL ownership of work permit by genderPRL having annual or sick leave by sector of employmentPrevalence of reported chronic illness in PRLPrevalence of reported chronic illness by age for PRL (per cent)Prevalence of reported functional disability in PRL
Table1Table2Table3Table4Table5Table6Table7Table8Table9
Table10Table11
Table12Table13
Table14Table15Table16Table17Table18Table19
Table20
Table21Table22Table23
Table24Table25Table26Table27Table28Table29Table30Table31Table32Table33
5455565758606161626363
6464
717172747475
76
777779
87888889899090979798

CONTENTS //16
Prevalence of illness and disability in employed and unemployed PRL aged 15 years and abovePrevalence of illness and disability by educational attainment of PRL aged 15 years and abovePrevalence of illness and disability by school enrolment in school-age children (6 – 18y)Mean crowding index by PRL household health indicatorsPrevalence of at least one household health condition in non-poor, poor and extreme-poor PRL householdsAverage monthly PRL household expenditure (in US$) by household health indicatorsMean per-capita household health expenditure by PRL household health indicatorsTotal per-capital PRL household health expenditure by povertySelf-reported mental health of PRL household proxy respondent, by gender and povertySelf-rated health of PRL household proxy respondent, by gender and povertyHospitalization rates of PRL in the last 12 months, by age groupPRL access to UNRWA hospitalization servicesPRL access to UNRWA hospitalization services by eligibility for Social Safety Net assistancePRL access to UNRWA hospitalization services and non-UNRWA assistancePRL reasons for lack of access to UNRWA hospitalization services by geographical areaPRL access to UNRWA hospitalization services by socioeconomic status (as measured by average consumption aggregate US$/month)PRL household demographic characteristics by level of household food securityPRL household health characteristics by level of household food securityPRL respondent self-reported health by level of household food securityEconomic characteristics of PRL by level of household food securityPRL mean dietary diversity and food group consumption by household food security levelPRL type of residence by regionPRL type of tenure by regionPRL average consumption aggregate by participation in the shelter rehabilitation scheme of UNRWAPRL housing conditions scoresPRL crowding index by regionPRL surface area of residencesPRL sources of waterPRL per-capita expenditurePRS overall poverty
Table34
Table35
Table36
Table37Table38
Table39
Table40
Table41Table42
Table43
Table44Table45Table46
Table47
Table48
Table49
Table50
Table51Table52Table53Table54
Table55Table56Table57
Table58Table59Table60Table61Table62Table63
99
99
100
101101
101
102
102103
103
104105105
105
106
106
113
115115116118
126127128
129130130131133152
17 // LIST OF TABLES
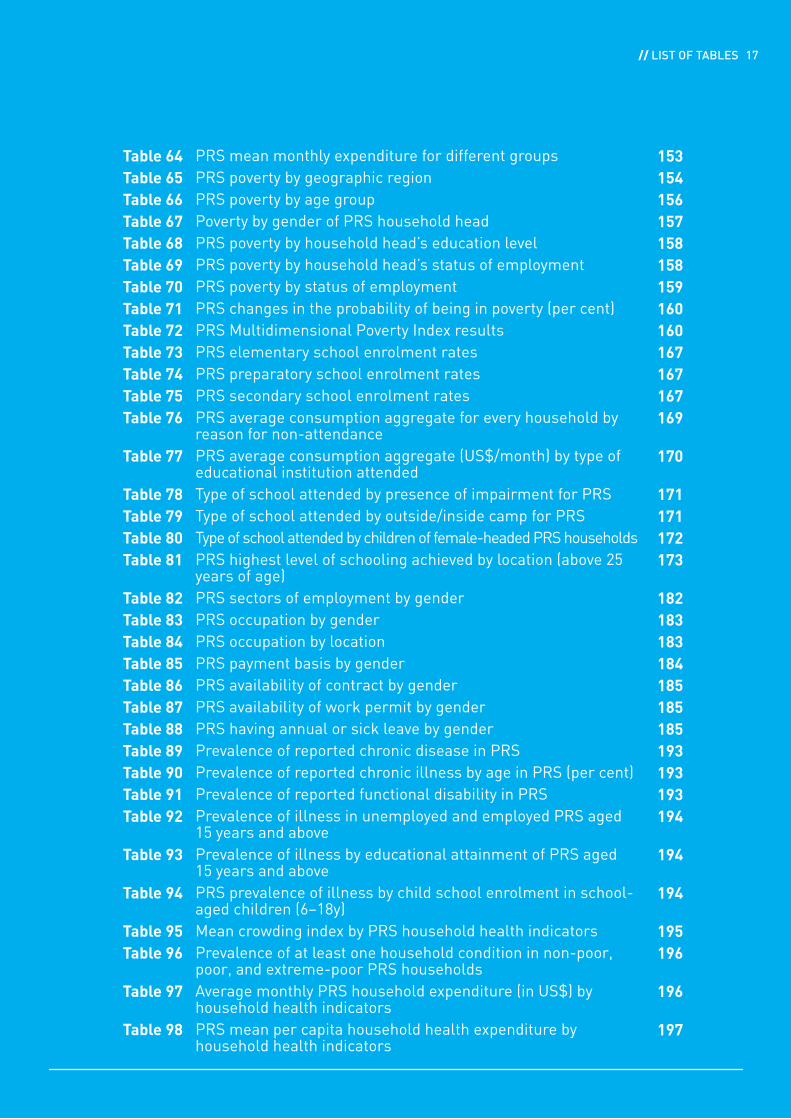
PRS mean monthly expenditure for different groupsPRS poverty by geographic regionPRS poverty by age groupPoverty by gender of PRS household headPRS poverty by household head’s education levelPRS poverty by household head’s status of employmentPRS poverty by status of employmentPRS changes in the probability of being in poverty (per cent)PRS Multidimensional Poverty Index resultsPRS elementary school enrolment ratesPRS preparatory school enrolment rates PRS secondary school enrolment ratesPRS average consumption aggregate for every household by reason for non-attendance PRS average consumption aggregate (US$/month) by type of educational institution attendedType of school attended by presence of impairment for PRSType of school attended by outside/inside camp for PRSType of school attended by children of female-headed PRS householdsPRS highest level of schooling achieved by location (above 25 years of age)PRS sectors of employment by genderPRS occupation by genderPRS occupation by locationPRS payment basis by genderPRS availability of contract by genderPRS availability of work permit by genderPRS having annual or sick leave by genderPrevalence of reported chronic disease in PRSPrevalence of reported chronic illness by age in PRS (per cent)Prevalence of reported functional disability in PRSPrevalence of illness in unemployed and employed PRS aged15 years and abovePrevalence of illness by educational attainment of PRS aged15 years and abovePRS prevalence of illness by child school enrolment in school-aged children (6–18y)Mean crowding index by PRS household health indicatorsPrevalence of at least one household condition in non-poor, poor, and extreme-poor PRS householdsAverage monthly PRS household expenditure (in US$) by household health indicatorsPRS mean per capita household health expenditure by household health indicators
Table64Table65Table66Table67Table68Table69Table70Table71Table72Table73Table74Table75Table76
Table77
Table78Table79Table80Table81
Table82Table83Table84Table85Table86Table87Table88Table89Table90Table91Table92
Table93
Table94
Table95Table96
Table97
Table98
153154156157158158159160160167167167169
170
171171172173
182183183184185185185193193193194
194
194
195196
196
197

CONTENTS // 18
PRS total per capital household health expenditure by povertySelf-reported mental health of PRS household proxy respondent, by gender and povertySelf-rated health of PRS household proxy respondent, by gender and povertyHospitalization rates of PRS in the last 12 months, by age groupPRS access to UNRWA hospitalization services by geographical regionPRS access to UNRWA hospitalization services by age groupPRS access to UNRWA hospitalization services by genderPRS access to UNRWA hospitalization services by inside/outside campPRS access to UNRWA hospitalization services by presence of disabilityPRS reasons for lack of access to UNRWA hospitalization servicesPRS average consumption aggregate by access to UNRWA hospitalization services (US$/Month)PRS household demographic characteristics by level of household food securityPRS household health characteristics by level of household food securityPRS respondent self-reported health by level of household food securityEconomic characteristics of PRS by levels of household food securityPRS mean total and food expenditure per capita (in US$) by levels of household food securityPRS type of residence by regionPRS type of tenure by regionPRS housing conditions scoresPRS crowding index by regionPRS surface area of residencesPRS sources of water
Table99Table100
Table101
Table102Table103Table104Table105Table106Table107Table108Table109
Table110
Table111Table112Table113Table114
Table115Table116Table117Table118Table119Table120
197198
198
199200200201201201202202
210
212212213215
223223224225225226

19// LIST OF APPENDICES //
The Arab Family Food Security Scale, questions and scoring of questionsPRL sample size calculationSample distribution and response rates among PRLSample distribution and response rates among PRSMultidimensional Poverty Index calculation
Appendix1
Appendix2Appendix3Appendix4Appendix5
234
235236238239
list of appendices

© 2016 UNRWA / Francesco Romagnolo

alexandra irani
INTRODUCTION
INTRODUCTION //22
level of income required to meet basic household needs. Multidimensional poverty was also calculated, which focuses on the flow of material goods and services into a household rather than income alone. Multidimensional poverty accounts for non-income related factors such as a household member’s education, health, food security and housing.
The social exclusion and precarious living conditions of Palestine refugees in Lebanon has been well documented over the past 67 years. This report contributes to previous documents on the precarious living conditions of Palestine refugees in Lebanon and also extends to evaluating poverty among Palestine refugees in light of recent developments, hoping to guide UNRWA in developing evidence-based poverty targeting and service provision strategies. In addition, the neighbouring Syria crisis has led many to seek refuge in Lebanon, which now hosts over 1.1 million registered Syrian refugees6 and over 42,000 Palestine refugees from Syria, making Lebanon the largest per-capita recipient of refugees in the world.
UNRWA is the United Nations agency responsible for the protection, care and human development of a population of some five million Palestine refugees living in the Gaza Strip, the West Bank, Jordan, Lebanon, and the Syrian Arab Republic. The Agency is committed to assisting Palestine refugees in maintaining a decent standard of living, acquiring appropriate knowledge and skills, enjoying the fullest possible extent of human rights, and leading a long and healthy life. UNRWA is the main service provider for Palestine refugees in Lebanon, providing basic and secondary education, comprehensive primary healthcare, financial support for secondary and tertiary care, emergency relief and infrastructural support amongst other social interventions and support activities. It has also been acting as the lead coordinating agency and primary provider of aid to PRS in the country. Nevertheless, the Agency has been facing challenges in providing key services to the expanding Palestine refugee population at a time when it is facing one of its most severe funding crises.
This report aims to provide an updated profile of the socioeconomic and livelihood conditions of Palestine refugees in Lebanon (PRL) and Palestine refugees from Syria living in Lebanon (PRS) who have sought refuge from the conflict in Syria, mostly in existing Palestine refugee camps and areas outside the camps in Lebanon. Commissioned by the United Nations Relief and Works Agency (UNRWA), the report builds on the first socioeconomic assessment that was held in 2010 and is based on the results of the multipurpose household survey conducted in April 2015.
Based on a nationally representative household survey targeting 3,300 PRL and 1,040 PRS households, the report draws a poverty profile for both populations following a similar methodology to the one used in 2010. Money-metric measures were used to estimate the prevalence of poverty among PRL and PRS. Through the use of poverty lines, which are benchmarked against an established welfare indicator, the level of consumption and expenditure of refugees is compared to a minimum
for each population are reported in separate chapters and are grouped by topic. This division is based on the reasoning that PRL, who have been in Lebanon since 1948, have a different situation than PRS who have recently moved into Lebanon as a result of the Syria crisis. PRS are regarded as wartime
displaced refugees; their status in the eyes of the Lebanese government and the international community is wholly different than PRL who are now in their third generation of refugees. Moreover, PRS needs are more urgent and different than PRL, even though there is some overlap in the results of the 2015 survey.
This report covers the situation of all Palestine refugees residing in Lebanon regardless of their time of entry, their registration status with UNRWA and their legal status vis-à-vis the Lebanese authorities. The findings of the surveys are divided over two populations of Palestine refugees, PRL and PRS. Results
6 United Nations High Commissioner for Refugees. (2015). Vulnerability assessment of Syrian refugees in Lebanon.
defining the palestine refugee population in lebanon

Those not registered with UNRWA but registered with DPRA are customarily called ‘Non-Registered’ refugees. They also hold the ‘Identification Card for Palestine Refugee’ issued by DPRA.
Those who are not registered with DPRA in Lebanon and have expired identification documents are called ’non-IDs.’ Some of those non-IDs are registered with UNRWA in other fields. Non-ID refugees are estimated to be around 3,000. There are some estimates that this number could be less since some of the so called ’non-IDs‘ have identification documents that have expired and could be registered with UNRWA in other areas of operations.
‘Non-IDs’ have limited access to UNRWA services and face challenging socioeconomic conditions due to their lack of valid documentation, which leads to their ineligibility to work. This current status also means their movements are restricted and they cannot leave camps or travel outside of Lebanon. Children are often unable to obtain any education beyond preparatory levels, which is the highest level available in some camps. ‘Non-IDs’ mostly entered Lebanon in the 1970s, either to fight for the Palestinian cause or simply got trapped and were refused re-entry into their previous country of residence. Primarily, the Palestine Liberation Organization (PLO) supported them at the time but they now struggle to gain access to services, employment or become part of other social and economic aspects of life.11
As of March 2015, over 495,985 PRL had registered with UNRWA in Lebanon. This figure is only partially relevant when trying to identify the total number of Palestine refugees in Lebanon given the voluntary nature of the registration system and the massive emigration of Palestine refugees abroad. It is estimated that of the total registered refugees, 260,000 – 280,000 currently reside in Lebanon.12 This figure includes non-registered refugees that are estimated to be around 35,000 according to Lebanese Government records.13 They fall outside UNRWA’s mandate because they either left Palestine after 1948, or took refuge outside UNRWA areas of operation, or left Palestine in 1948 but were not in need of humanitarian assistance and therefore did not exercise their entitlement to register with UNRWA. In January 2004, UNRWA in Lebanon expanded some of its services to assist the non-registered refugee population since they, too, are Palestinians who fled their homeland and are not serviced by the Lebanese Government.14
Palestine refugees eligible for registration by UNRWA are defined as “persons whose normal place of residence was Palestine during the period 1 June 1946 to 15 May 1948, and who lost both home and means of livelihood as a result of the 1948 conflict.”7 UNRWA services are available to all those living in its area of operations who meet this definition, who are registered with the Agency and who seek assistance. The descendants of Palestine refugee males, including adopted children, are also eligible for registration.8 Following a basis of gender equity, the descendants of refugee females from non-registered Palestine refugees are eligible for services; however they are not eligible for registration as refugees.
In addition to the recently arrived PRS population in Lebanon, we can distinguish three categories of Palestine refugees in Lebanon based on their registration status (to be referred to collectively as PRL):
Registered Palestine refugees are those registered with UNRWA and are usually also registered with the Directorate General of Political and Refugees Affairs (DPRA).9 They are registered in the UNRWA registration system and are included on the registration card of their family. They also usually hold an ’Identification Card for Palestine Refugee‘ issued by DPRA,10 which is the officially recognized identification card for Palestine refugees in Lebanon (not Palestine refugees from Syria).
23 // DEFINING THE PALESTINE REFUGEE POPULATION IN LEBANON
7 United Nations Relief and Works Agency. (n.d.). Palestine refugees. Retrieved February 29, 2016, from http://goo.gl/VNM31p.8 UNRWA Consolidated Eligibility and Registration Instructions (CERI) available at http://www.unrwa.org/what-we-do/eligibility-registration. 9 The DPRA was established on March 1959 within the Ministry of Interior of Lebanon and was tasked with the registration and civil procedures for Palestine refugees in Lebanon. In 2000, it was merged into the newly created Directorate of Political and Refugees Affairs through a governmental circular, but the mandate remains identical. 10 The Identification Card for Palestinian Refugees is the official identification card issued by DPRA for Palestine Refugees in Lebanon. These cards can be issued to people who were registered in the Lebanese Government censuses (الإحصاء) held in 1951/52 and in1961 and to their descendants. Some of those who came after the second census [1962 onward] were able to register with DPRA on a case-by-case basis, following a decision by the Ministry of Interior.11 Danish Refugee Council. (2007). Survey report on the situation of non-ID Palestinian refugees in Lebanon.12 This is the range that was estimated in the 2010 survey. Due to changes in the sampling methodology in 2015, new population estimates would include artificial changes that are misleading.13 Khalidi, A. (2011). An overview of the living conditions of Palestinian refugees residing legally in Lebanon but who are not registered with the UNRWA-Lebanon field office.14 Danish Refugee Council. (2007). Survey report on the situation of non-ID Palestinian refugees in Lebanon.

15 Suleiman, C. (2011). Language and identity in the Israel-Palestine conflict: The politics of self-perception in the Middle East. Retrieved from https://goo.gl/0ZQP3B.16 Amendment (296 of 20 March 2001) to the existing presidential decree 11614.17 Social Safety Net is the programme that assesses households against the Proxy Means Test Formula (PMTF) to rank their poverty level and prioritise those most vulnerable households for assistance.
permit fees for Palestine refugees born in Lebanon and revoked the reciprocity of treatment policy for compensation for end-of-service and work-related injuries, this amendment has not significantly affected the quality of employment for PRL since, according to the results of the household survey, less than 3.3 per cent had an official employment contract by a public notary that enables them to apply for a work permit.
Owing to their limited enjoyment of many rights, refugees have relied on UNRWA as their main source of assistance and service provision since 1950. In Lebanon, the organization provides primary, secondary and vocational education, health care, relief and social services, infrastructure and camp improvement, protection and emergency response. The Agency also works closely with government authorities and other international and non-profit organizations to provide resources and services to refugees.
Even so, Palestine refugees in Lebanon face one of the worst socioeconomic situations in the region second only to the Gaza Strip, and their conditions have been deteriorating given the country’s weakening socioeconomic situation and the prolonged Syria crisis. A little short of two thirds of the PRL population is poor and the discriminatory laws against them hinder their ability to improve their living conditions and livelihoods. In fact, there is a high number of Social Safety Net (SSN) cases (previously Special Hardship Cases)17 in Lebanon. As of July 2015, 15,971 families (61,524 individuals) were classified as SSN cases with an additional 6,500 persons on the waiting list identified as eligible but not receiving assistance due to financial constraints.
At time of writing, all SSN beneficiaries in Lebanon received a combination of food in-kind and cash assistance distributed on a quarterly basis. The assistance per beneficiary per quarter includes: three kilograms of rice, three kilograms of sugar, three litres of oil, 1.5 kilograms of milk powder, one kilogram of lentils, one kilogram of chick peas and one kilogram of white beans and US$ 10 per family member.
According to this report’s survey findings, PRL live in grim conditions and rely on assistance from UNRWA and other humanitarian organizations. These findings are for both the majority of PRL who live in camps (63.4 per cent) and the rest who reside outside the camps. The Lebanese government does not generally exercise its authority within the camps, except for Nahr el-Bared. Camps are severely overcrowded and the living environment in the camps is, without doubt, linked to the multitude of physical and mental health problems that PRL suffer from. Most of the structures that were built as temporary shelters have deteriorated from lack of proper maintenance, which requires regular funding that is unfortunately not readily available. Decaying infrastructure, a dearth of recreational spaces, insufficient access to roads, deteriorated water and sewage treatment systems, contaminated water, and jerry-rigged electrical wires along with open drainage ditches paint a gloomy picture of the camps. The high cost of materials, combined with Government restrictions imposed on bringing construction materials into the camps, has meant that refugee families have been unable to carry out substantial and much-needed repairs or maintenance.
More than 67 years after their initial presence in Lebanon, Palestine refugees are still considered as foreigners under Lebanese law, which does not grant them any special legal status and deprives them from basic rights enjoyed by the Lebanese, as well as other foreigners on Lebanese territories. They fall under the category of foreigners “who do not have documents from their country of origin and who reside in Lebanon with a residence or identity card.” 15 Lebanon is not a party to or signatory of the 1951 United Nations (UN) Convention relating to the Status of Refugees and its 1967 protocol, Article 1D. Because the Government of Lebanon has refused to sign these protocols, it is, consequently, not liable towards Palestine refugees on its territories. PRL are directly dependent on UNRWA operations to sustain their livelihoods and needs.
Furthermore, this prolonged foreigner status mainly stems from the strong rejection by the Lebanese authorities of the naturalization of Palestine refugees, which is sometimes used as justification for the various discriminatory policies against them. On a political level, Palestine refugees have also opposed it. Accordingly, despite their longstanding presence in the country as refugees, PRL remain excluded from key aspects of social, political, and economic life. They face legal and institutional discrimination; they are denied the right to own property16 and face restrictive employment measures such as the right to work in some liberal and syndicate professions due to syndicate bylaws which require members to be Lebanese or the fulfillment of the principle of reciprocity of treatment. Despite the August 2010 amendments to Article 59 of the Labour Law and Article 9 of the Social Security Law which resulted in waiving work
social exclusion of palestine refugees in lebanon (PRL)
INTRODUCTION //24
18 United Nations Relief and Works Agency. (2014). Palestinian Refugees from Syria in Lebanon. Retrieved from http://goo.gl/DQzQhK.19 Tatwir Center for Studies. (2015). Needs assessment of Palestinian refugees from Syria.
the period during which the majority of PRS arrived in Lebanon (end of 2012 till mid-2013). Before the outbreak of the conflict in Syria, the Lebanese government had border restrictions that would treat Syrians and PRS as foreigners wishing to enter the country. However, once the Syria crisis broke out, entry procedures were eased to treat Syrians and PRS as refugees fleeing a crisis. On the other hand, between August 2013 and May 2014, entry became more restricted and cases were screened for entry at the border, although the criteria were never formally published. Despite some scope for intervention with authorities and some flexibility, the restrictions still resulted in the denial of entry to PRS.
Since May 2014, the Ministry of Interior announced its intention to put in place border restrictions for PRS. Accordingly, entry into Lebanon was severely restricted by the Lebanese authorities. Access at the border is now only granted to PRS who either have a verified embassy appointment in Lebanon, or a flight ticket and visa to a third country. UNRWA has recorded a very limited number of new arrivals in its emergency database in recent months prior to publication of this report.
In addition, PRS currently residing in Lebanon face challenges in regularizing their legal status or residency namely due to the relatively high annual fee of US$ 200 per person. A circular is generally issued by the General Security Office every few months allowing PRS to renew their residency permits. At the time of this report, the last circular expired in December 2015. While PRS with expired residency permits are issued a deportation order, most have not been enforced. However, PRS are still arrested and detained for a few days and live in fear of deportation back to Syria although UNRWA has only recorded a limited number of these cases.
The 2015 Needs Assessment of Palestine Refugees from Syria, commissioned by the Royal Norwegian Embassy,19 revealed that PRS face harsh living conditions, where 39 per cent of the surveyed households emphasized third-country immigration as a top priority and that Lebanon was a mere pit stop. When asked about their basic needs, 58.6 per cent mentioned accommodation fees, 54.1 per cent food assistance and 48.5 per cent renewal of their legal residency permits.
Since the beginning of the conflict in Syria in March 2011, camps and areas outside camps in Lebanon have housed a large number of Palestine refugees from Syria, which reached a number of 53,070 in April 201418 and now stands at 40,739 individuals (or 11,175 families) registered in UNRWA records in May 2016. The Agency is the primary provider of aid to PRS in Lebanon and had been providing since February 2014 monthly cash assistance for food (US$ 30 per person) and housing (US$ 100 per family). However, in April 2015 food assistance was reduced from US$ 30 to US$ 27 in line with the World Food Programme’s regionally determined food basket, and in May 2015, due to financial constraints, UNRWA announced a suspension of cash for housing assistance to PRS which took effect in July 2015. This suspension in aid comes at a time when PRS are becoming increasingly vulnerable, with UNRWA cash assistance representing their main source of income for 92.6 per cent of the population, according to the household survey.
Relaxing the entry procedures and requirements from February to August 2013 to facilitate the crossing of PRS into Lebanese territories coincided with
palestine refugees from syria, from an emergency to a
protracted humanitarian crisis
25 // PALESTINE REFUGEES FROM SYRIA, FROM AN EMERGENCY TO A PROTRACTED HUMANITARIAN CRISIS
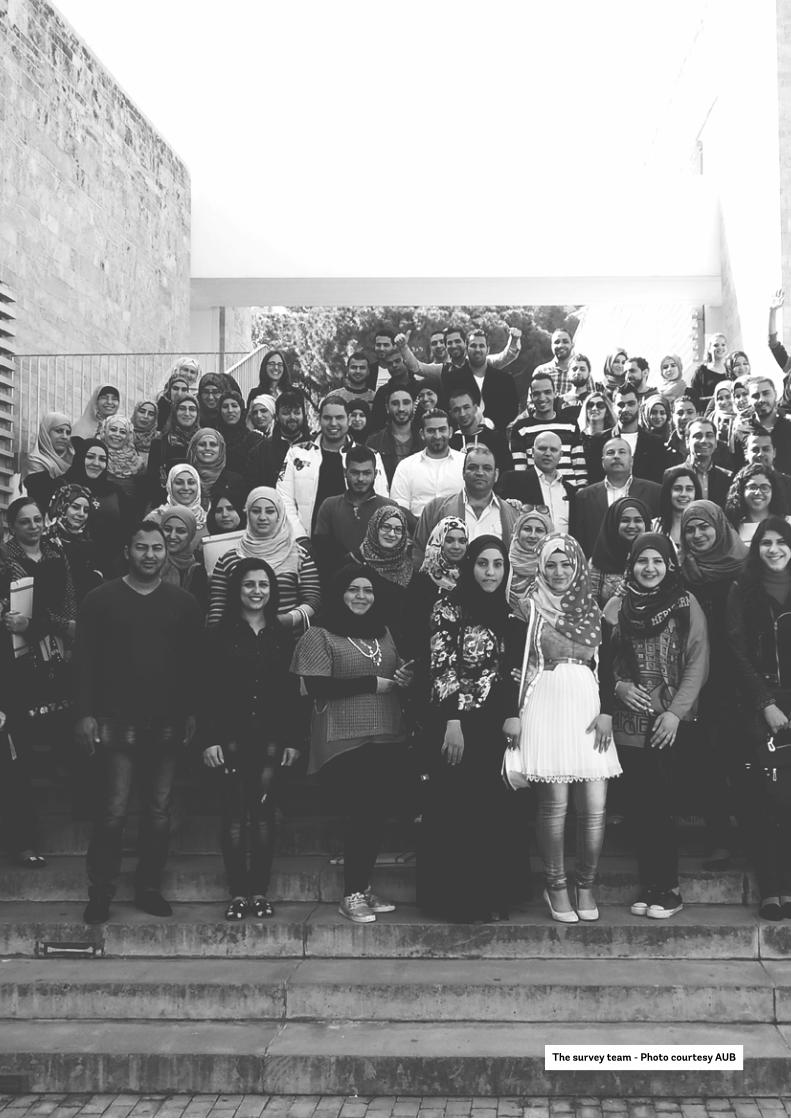
The survey team - Photo courtesy AUB

hala ghattas, alexandra irani, maya chmayaah
METHODOLOGY

The report is descriptive in nature; through the survey sample, it attempts to provide a snapshot of various aspects of the socioeconomic and living conditions of Palestine refugees in Lebanon. A profile is drawn by covering topics such as demographic characteristics, education, employment, poverty, health, food security, housing conditions, assets and expenditures. The report is limited in the sense that it cannot draw any causal inferences as to which factors lead to certain outcomes. Moreover, although both PRL and PRS are covered in the report, no attempt was made to compare the conditions of both populations as they are inherently different. While PRL have been living in Lebanon for over 67 years now and are considered protracted refugees, PRS have recently fled Syria due to the ongoing conflict, are still highly mobile and face even worse socioeconomic and living conditions. The ongoing Syria crisis paves the way for the PRS status to change into a protracted refugee crisis similar to PRL. However, the considerably longer duration of PRL in Lebanon keeps them separately classified.
A plethora of studies on Palestine refugees in Lebanon and more recently Palestine refugees from Syria living in Lebanon have been conducted exploring various livelihood topics in qualitative and quantitative details. Noteworthy is the work of Fafo, which conducted several living conditions and labour force surveys.20 Other notable studies include the 2014 UNRWA PRS Needs Assessment Study,21 the 2014 Profiling Deprivation Report by UNDP and UN Habitat22 covering the living conditions in areas outside the camps in Lebanon, the American Near East Refugee Aid (ANERA) PRL and PRS studies in 2012 and 2013 respectively,23 the 2012 International Labour Organisation (ILO) labour force survey24 and the 2011 Medical Aid For Palestinians briefing paper on the health of PRL25 among others.
This present study is unique in that it attempts to provide a comprehensive, representative overview of the living conditions of Palestine refugees, both PRL and PRS, as a baseline for other surveys and assessments. The previous 2010 report was a seminal text used as the basis for a variety of other reports. This 2015 study intends to update the 2010 findings, and capture the changes that political, social and economic conditions (including the conflict in Syria) have had on Palestine refugees living in Lebanon.
20 Ugland, O. (2003). Difficult past, uncertain future: Living conditions among Palestinian refugees in camps and gatherings in Lebanon. Fafo. (2007). Labour force survey among Palestinian refugees in Lebanon. Hanafi, S., & Tiltnes, Å. (2008). The employability of Palestinian professionals in Lebanon: Constraints and transgression. Knowledge, Work and Society, 5(1), 1–15. Tiltnes, Å. (2005). Some findings from Fafo’s 2006 study on the employability of Palestinian refugees in Lebanon. Tiltnes, Å. (2007). A socio-economic profile of the Nahr El-Bared and Beddawi refugee camps of Lebanon. Oslo: Fafo. Retrieved from http://goo.gl/UHCOsL.21 United Nations Relief and Works Agency, & World Food Programme. (2014). Needs assessment for Palestine refugees. Retrieved from https://goo.gl/1qlAQB.22 United Nations Development Programme. (2014). Profiling deprivation: An analysis of rapid needs assessment of Palestinian gatherings host communities in Lebanon. Retrieved from http://goo.gl/omwGyQ.23 American Near East Refugee Aid. (2012). Palestinian refugees from Syria in Lebanon (Vol. 3).24 International Labour Organization. (2012). Palestinian employment in Lebanon facts and challenges: Labour force survey among Palestinian refugees living in camps and gatherings In Lebanon. Retrieved February 2, 2016, from http://goo.gl/pXRvk9.25 Medical Aid for Palestinians. (2011). Terminal decline? Palestinian refugee health in Lebanon.
METHODOLOGY //28
questionnaire design
have been living in poverty for a long time, they do not capture well short-term changes in households’ material circumstances due to crises such as a sudden illness. Thus, asset-based indicators may be too late in identifying poor households.
Accordingly, a shift towards measuring multidimensional poverty occurred where the latter examines the stock of resources a household controls, unlike income-based poverty which focuses on the flow of material goods and services. That stock can be measured, either by physical and monetary assets, or by social capital (social contacts, networks, reciprocal relationships, community membership).
The reason that this approach to measuring poverty is used is that income was initially used to represent an individual’s capabilities, in the sense that capabilities depend on income. However, capabilities are more than just material factors; that is, income is not the sole determinant of well-being28. In fact, human development has come to be more concerned with the improvement
of people’s ability to function as active members of society and less concerned with increasing individuals’ levels of income.29 From another point of view, income can be seen as a means to an end, with the end being an individual’s role in society. This reasoning implies that two individuals who may have the same income are likely to have different capability sets.30 Therefore, the multidimensional approach to poverty, which accounts for these non-income related factors, could be used in measuring poverty and deprivation.
This approach to human development was introduced by Amartya Sen, whose writings on human capabilities have helped in forming the current definition and dynamics of human deprivation and development.31 Particularly, a main indicator has been developed from this approach as a measure of poverty: the Multidimensional Poverty Index (MPI).
For the purpose of this report, poverty among Palestine refugees is measured using both money-metric measures (poverty lines) and the MPI.
Poverty is frequently measured through money-metric poverty lines based on income and expenditure. Poverty measurement is done through the design of poverty lines, which are benchmarked against a welfare indicator. By doing so, the current level of consumption and expenditure is compared to a certain minimum level of income or consumption required for the satisfaction of the household’s needs.26 However, money-metric measures of poverty assume that the differences in individual welfare can be summarized by differences in income and expenditure.27 Respondents tend to give untruthful answers about income and expenditure if they are used to identify eligibility for assistance. In addition, income and expenditure flows do not capture assets such as land or other capital investments, making asset-rich households appear poorer than they are.
Asset-based indicators may also inaccurately measure poverty since they are based on correlates rather than on actual observations. Though they succeed in identifying people who
Conceptual Framework
26 El Laithy, H., Abu-Ismail, K., & Hamdan, K. Poverty, growth and income distribution in Lebanon, International Policy Centre for Inclusive Growth (2008). Retrieved from https://goo.gl/TlKZOC.27 Bourguignon, F. (2003). From income to endowments: The difficult task of expanding the income poverty paradigm. DELTA Working Papers. DELTA (Ecole normale supérieure). Retrieved from http://goo.gl/hAAt7z.28 Sen, A. (2003). Development as capability expansion. Readings in Human Development: Concepts, Measures and Policies for a Development Paradigm, 41–58.29 Fukuda-Parr, S. (2003). The human development paradigm: Operationalizing Sen’s ideas on capabilities. Feminist Economics, 9(2-3), 301–317. http://doi.org/10.1080/1354570022000077980.30 Todaro, M. P., & Smith, S. C. (2011). Economics development.31 Sen, A. (2003). Development as capability expansion. Readings in Human Development: Concepts, Measures and Policies for a Development Paradigm, 41–58.
29 // QUESTIONNAIRE DESIGN

32 Our welfare aggregate does not include a “rental equivalent” for durables, as we do not have information on the current prices, age and condition of durable goods owned by households. Moreover, the imputed expenditure value of owned cars was not included in the expenditure aggregate, as 62.5 per cent of PRL households don’t own a car or a motorcycle. The household consumption expenditure was adjusted to include equivalence scales when converting to per capita consumption. The following formula was used:
where C is the number of children, A – number of adults, and E – number of elderly in the household. Then adjusted consumption per equivalent adult would be
(normalised by the reference household) For the reference levels we took values for a “typical refugee household” containing 1 child, 4 adults and 0 elderly. We chose the following values for our parametres: , and33 The sum of a household’s expenditure on a certain bundle of goods and services (or categories), including imputed rent, that are deemed indicative of living standards. This aggregate consumption was used as a proxy to income due to the fact that the income data was seen to be unreliable and thus would lead to unreliable poverty rates.34 This specification follows common practice for defining poverty lines (Ravallion 2004). This approach identifies the cost of basic nutritional needs, taking into account different age-sex composition, household size, and prevailing prices in each region. The nutritional needs are specified in line with minimum caloric intake, using tables from the World Health Organization. These reflect different age groups, gender, and whether the individual lives in a rural or urban area. The cost of caloric intake is calculated for different regions on the basis of the consumption patterns of the population. Given individuals’ specific caloric needs, and region-specific caloric costs, the cost of meeting nutritional needs is calculated for each household. The cost of non-nutritional needs is calculated on the basis of the non-food share in household expenditure for those whose total expenditure is equal to merely the cost of basic nutritional needs. 35 In the 2010 report, the upper poverty line was equivalent to US$ 6 a day, which allows to cover basic food and non-food requirements (such as rent, transport, utilities etc.) of an adult Palestine refugee. This poverty line is based on that used by the Lebanese household survey in 2004 and by UNRWA in 2008, adjusted for inflation. The lower/extreme poverty threshold of US$ 2.17 allows purchasing enough food to satisfy the daily basic food needs of an adult Palestine refugee. Both poverty lines were inflated by 14 per cent for the current report (assuming a 14 per cent cumulative increase in prices from 2010 to 2015).
000
000*
EACEAC
EACXX
EACAE
9.0 0.1 85.0
measure, especially among persons who operate their own businesses, and because respondents may be more willing to reveal their consumption patterns rather than their income. Since the majority of refugees inside camps do not pay rent for the houses they live in, a rental value for these houses was imputed for the entire sample based on a hedonic regression on the sample
times 30.4). The extreme poverty line reflects the cost of basic food needs. The other threshold is the poverty line, set at US$ 6.8/person/day, or US$ 208/person/month, which reflects the cost of minimal food and non-food livelihood requirements.34 These lines
of households who paid rent.32 It is one measure of socioeconomic status33 of the household. The average consumption aggregate is taken to be a more reliable measure of socioeconomic status than income because it tends to be better reported, it is less volatile over time and it is more indicative of the material well-being of the household.
were computed based on an upward adjustment of the poverty lines of the American University of Beirut (AUB) and UNRWA survey in 2010, in order to control for inflation between 2010 and 2015.35
Consumption expenditure is used as the welfare indicator in the estimation of the poverty line and in making poverty assessments. It includes the consumption expenditure of households as reported in the survey, adjusted to the average consumption aggregate. Consumption is preferred to income as a welfare aggregate mainly because income is more difficult to
We use two poverty lines as benchmarks against consumption expenditure in determining the poverty status of households: the first one is the extreme (abject) poverty line, set at US$ 2.5/person/day, equivalent to US$ 75/person/month (monthly equals daily
Money-metric Poverty
Poverty Lines
METHODOLOGY //30

36 The poverty measures are defined as follows:
where n represents the total population and q represents the number of individual with consumption yi less than the poverty line z.37 Foster, J., Greer, J., & Thorebecke, E. (1984). A class of decomposable measure of poverty. Econometrica, 52(3), 761–766. Retrieved from http://goo.gl/gka3kN.38 Relief and Social Services – the UNRWA Department responsible for implementing registration of refugees and social services for those identified as the most vulnerable.39 Kovacevic, M., & Calderon, M. C. (2014). UNDP’s multidimensional poverty index: 2014 specifications, (December).40 Duclos, J. Y., & Gregoire, P. (2003). Absolute and relative deprivation and the measurement of poverty. Review of Income and Wealth, 48(4), 471–492. http://doi.org/10.1111/1475-4991.00064.
nqP 0
Qi
i
zyz
nP 11
Qi
i
zyz
nP 2
212
The mean here is formed over the entire population, counting the non-poor as having a zero poverty gap. Additionally, taking the sum of the poverty gaps aggregated across all individuals before calculating the mean returns a value, which stands for the minimum amount of consumption that needs to be transferred to the population to pull all the poor up to the poverty line.
As for the severity of poverty, it is measured by the mean of the squared proportionate poverty gaps, also known as the severity-of-poverty index (P2). Unlike the above two measures, this ratio accounts for inequality
this case, any positive value represents a deprived household. A household is considered multidimensionally poor (MPI poor) if the MPI value ranges between 0.3 and 0.5, and is considered severely MPI poor if the value is greater than 0.5.39 In general, the index defines absolutely deprived individuals as those
among the poor in that it is sensitive to the distribution of consumption among the poor. In fact, it gives heavier weights to those whose consumption falls far below the poverty line and vice versa. Furthermore, it is also more sensitive to changes in welfare of the ultra-poor than it is to those just below the poverty line.
A household’s socioeconomic vulnerability is also captured by whether it has been identified as a Social Safety Net (SSN) case by the UNRWA Relief and Social Services Programme (RSS),38 or by whether it is receiving financial assistance from an organization other than UNRWA.
who lack basic capabilities essential to their existence, and it defines relatively deprived individuals as those who are unable to live and enjoy commodities and services at the same level as the standard/average individuals of the society.40
Similar to the previous 2010 survey, we adopt three commonly used measures of money-metric poverty:36 incidence, depth and severity, each of which can be quantified by a standard aggregate poverty measure.37
The incidence of poverty is measured by the headcount index (P0), which estimates the percentage of the population that is poor. Particularly, it looks at the ratio of poor refugees to the total population of refugees.
The depth of poverty is represented by the poverty-gap index (P1). It measures the mean distance of a refugee below the poverty line as a proportion of that line.
The Multidimensional Poverty Index (MPI) is an indicator based solely on measures of deprivation. It encompasses three dimensions, all of which exclude income: education, health and living standards. The index gives equal weight to each of these dimensions and results in value ranging between 0 and 1. In
Multidimensional Poverty Index (MPI)
Poverty Measures
31 // QUESTIONNAIRE DESIGN
the instrument
41 Demographic and Health Surveys Program. (2013). Demographic and Health Surveys Methodology. Retrieved from http://goo.gl/TYt9yy.42 Demographic and Health Surveys Program. (2010). DHSQ6-DHS Model Questionnaire – Phase 6. Retrieved from http://goo.gl/rirmDJ.43 Habib, R. R., Mahfoud, Z., Fawaz, M., Basma, S. H., & Yeretzian, J. S. (2009). Housing quality and ill health in a disadvantaged urban community. Review of Income and Wealth, 123(2), 174–181. http://doi.org/10.1016/j.puhe.2008.11.002.44 Khalidi, A., & Tabbarah, R. (2009). Contributions of Palestinian refugees residing in camps and some gatherings to the Lebanese economy. Retrieved from https://goo.gl/hc101L.45 Sahyoun, N. R., Nord, M., Sassine, A. J., Seyfert, K., Hwalla, N., & Ghattas, H. (2014). Development and validation of an Arab family food security scale. The Journal of Nutrition, 144(9), 751–757. http://doi.org/10.3945/jn.113.187112.46 Maxwell, D., Caldwell, R., & Langworthy, M. (2008). Measuring food insecurity: Can an indicator based on localized coping behaviors be used to compare across contexts? Food Policy. Retrieved from http://goo.gl/5eX9os.47 Swindale, A., & Bilinsky, P. (2006). Development of a universally applicable household food insecurity measurement tool: Process, current status, and outstanding issues. The Journal of Nutrition, 136(5), 1449S–1452S.
from organizations other than UNRWA. Housing characteristics such as type of tenure, residence, walls, roofs, heating, sanitation and toilet facilities, number of rooms, area (size of the living space), dwelling conditions such as humidity and poor ventilation were also covered. All assets (transportation vehicles and electronic appliances) were recorded along with the household’s expenditures and main sources of income.
Food insecurity was measured as household experience of food insecurity, which includes issues of concern to refugees such as running out of food, reduced food quality and lesser quantities. Household food security was assessed using the seven-item Arab Family Food Security Scale (AFFSS), which has been previously validated for this population. Additional internal validity was confirmed using statistical methods based on the Rasch measurement model. This model is used to assess the psychometric characteristics of the questionnaire items and the extent to which they measure the same underlying latent trait, in this case, the severity of food insecurity. A detailed explanation of the development of the module, and the validation process has been published elsewhere.45 Appendix 1 outlines the questions used to measure household experience of food insecurity.
Positive responses were counted as one point and households were classified according to the total score: Food secure
(0–2), moderately food insecure (3–5), and severely food insecure (6–7). A food-related asset scale was derived based on the ownership of refrigerator, freezer, oven and microwave, each contributing one point to the scale. Questions on coping mechanisms were adapted from the Coping Strategies Index and were also administered to the household proxy-respondent.46
A twelve-item household dietary diversity score (HDDS) was used.47 The list was populated with culturally specific food examples. A household food-frequency module using similar items as for the HDDS asked about the frequency of consumption of food groups by household members.
The health component of the survey gathered information on a variety of health indicators including chronic and acute illness, functional disability and psychological distress. A limitation of the health section is that all health characteristics were self-reported physician-diagnosed conditions occurring within six months prior to the interview. Health data was analysed at both the individual level (to estimate prevalence/incidence of illness), as well as at the household level to examine associations between socioeconomic conditions and the presence of at least one person with a chronic illness, functional disability or acute illness in the household. Questions were also asked regarding access to and use of hospitalization services as well as insurance coverage.
The questionnaire was based on the 2010 version to ensure maximum comparability and follows the structure of standard household questionnaires such as the 2003 Measure DHS manual.41 Some adaptations have been made to include questions that are PRS specific such as the date of arrival into Lebanon. Most questions featured in the questionnaire have been validated internationally,42 as well as in Lebanon by Habib et al. in 201043 and Khalidi in 2009.44
The questionnaire included both individual-level and household-level questions. Data collected on individuals living in a household included demographics (gender, age, relationship to the head of household, marital status, pregnancy, nationality), education (enrolment, educational institution, highest level of schooling achieved, reasons for not attending) and employment, which included employment and unemployment modules and asked for reasons for not looking for work, availability to work, employment status, average working hours, work benefits, contracts and work permits, occupations based on ILO’s International Standard Classification of Occupations and payment basis.
Household-level questions enquired about remittances, immediate family and next of kin living abroad (and in Syria for PRS), questions related to SSN cases, Automatic Teller Machine (ATM) access for PRS and access to aid
METHODOLOGY //32
48 Idler, E. L., & Benyamini, Y. (1997). Self-rated health and mortality: A review of twenty-seven community studies. Journal of Health and Social Behavior. Retrieved from http://goo.gl/hOVCF1.49 Veit, C. T., & Ware, J. E. (1983). The structure of psychological distress and well-being in general populations. Journal of Consulting and Clinical Psychology, 51(5), 730–742. http://doi.org/10.1037/0022-006X.51.5.730.50 Ziadni, M., Hammoudeh, W., Abu Rmeileh, N. M. E., Hogan, D., Shannon, H., & Giacaman, R. (2011). Sources of human insecurity in post-war situations: The case of Gaza. Journal of Human Security, 7(3). http://doi.org/10.3316/JHS0703023.51 Food and Agriculture Organization of the United Nations. (2007). The Wye group handbook rural households’ livelihood and well-being statistics on rural development and agriculture household income. Retrieved from http://goo.gl/MiWN1d.
Proxy respondents were also asked about feelings of danger and worry. The questions were taken from the standard of living constructed scale that was employed in a survey in Gaza.50
The research design and questionnaire were discussed with UNRWA through several consultation meetings and reviewed and approved by the Institutional Review Board (IRB) of the American University of Beirut (AUB). The IRB aims to ensure the soundness of the research design methodology, the minimization of the risk participants may face, the selection of participants/subjects is equitable, informed consent is obtained from the participants, the participants’ privacy is respected, confidentiality of the collected data is protected and adequate monitoring is performed.
The questionnaire was designed using Kobotoolbox, a free open-source tool for mobile data collection, and was administered using the corresponding Android-based application KoboCollect. The use of tablets for the administration of the questionnaire provided several advantages over the paper-based version of 2010 including: validating collected data on a daily basis to ensure consistency and accuracy across all data collectors and regions, ensuring all questions are addressed and filled, embedded skip-logic patterns allowing the data collector to focus on questions that appear on the screen instead of having to decide which to skip, and removing the data-entry process, which is an additional source of error. The main disadvantage faced, as reported by the data collection team and previous surveys, is the small font and radio buttons that may lead the data collectors to select the wrong choice by mistake.
Data on health expenditures of the household was also collected for general health care, medication and hospitalization.
Proxy-respondents were asked about their own general health using the self-rated health question (SRH), which asks the respondent to rate how he/she perceives his/her current health, on a scale ranging from very good to not good at all. SRH is commonly utilised in social epidemiology and is a strong predictor of mortality, morbidity and biological markers.48 Mental health of proxy respondents was assessed using the five-item validated version of the Mental Health Inventory (MHI-5) in Arabic. MHI-5 is widely used in surveys of general health and is a good predictor of anxiety, depression, behavioural control and general distress.49 High scores indicate good mental health; we used a cut-off point of 52, consistent with the literature.
a common household head. The most commonly used criteria also include pooling of income and resources, sharing of expenditures and existence of family or emotional ties.51
For the purpose of the questionnaire for both PRL and PRS, the household was defined as a group of people who have
been living together for over six months and who share their food and budget. The ‘shared budget’ criterion was added to the initial definition that was used in the 2010 survey because it enables us to emphasize the economic linkage and interdependency among household members.
The way the household is defined is crucial since it influences the survey’s coverage of the population, statistics generated at the household level and comparability across surveys using different definitions. In general, household definitions require that members of the household reside in the same dwelling and acknowledge
Household
33 // THE INSTRUMENT

52 Sahyoun, N. R., Nord, M., Sassine, A. J., Seyfert, K., Hwalla, N., & Ghattas, H. (2014). Development and validation of an Arab family food security scale. The Journal of Nutrition, 144(9), 751–757. http://doi.org/10.3945/jn.113.187112.
men.52 In the absence of a senior female member at the time of the survey, data collectors were instructed to gather information from any adult family member.
More than 80 per cent of PRL respondents and 71 per cent of PRS
A four-day training session was held at the American University of Beirut (AUB) from 23 to 27 March 2015. The training session’s topics included ethics training and communication techniques, selection and location of households to be interviewed, use of the tablet for survey administration and in-depth questionnaire explanation and training. The training was followed by a one-day pilot of the survey that was held in Burj Barajneh and Shatila camps on 26 March to allow the data collection team to familiarise themselves test the data collection process and the questionnaire. The questionnaire was also adjusted based on feedback from respondents and the data collection team during the pilot.
respondents were female. A considerable portion of PRS respondents, 45.3 per cent were the head of household, of which 43.0 per cent were female. Whereas, 34.0 per cent of PRL respondents were the head of household (of which 50.2 per cent were female) and 55.1 per cent were the head’s spouse (mostly wives).
The survey, which targeted both PRL and PRS populations, was launched sequentially starting on 7 April in CLA, followed by Saida and Tyre on 8 April, NLA on 9 April and the Beqaa on 10 April. This sequence facilitated the quality assurance monitoring process and minimised errors and challenges faced. The AUB team monitored the data collection process on a daily basis, conducted random monitoring visits during interviews and provided feedback to the team to reduce variations in survey administration across data collectors and regions. Focus groups were held with the data collection team at the end of the survey implementation period to collect insights regarding daily challenges faced and to shed light on potential problematic questions in order to facilitate data screening and data analysis.
Data collectors were asked to interview a senior female member in a selected household whenever possible especially for the food-related questions. This preference is motivated by experience from previous surveys in Lebanon, which found that women answered food-related questions more easily than
A total of 65 data collectors, 11 supervisors and 5 field coordinators participated from the five regions covered by UNRWA, namely North Lebanon Area (NLA), Central Lebanon Area (CLA), Saida, Tyre and the Beqaa. The supervisors and field coordinators were selected from UNRWA current Relief and Social Services (RSS) staff, and included social workers and area relief and social services officers to ensure the smooth implementation of the survey. Some supervisors and coordinators had previous surveying experience, or had participated in the 2010 survey, and all were knowledgeable of the areas that were to be surveyed inside camps and areas outside the camps. The experience of current staff also provided useful insights during the questionnaire development phase, the sample distribution and the day-to-day activities; the staff were also helpful in responding to the challenges faced.
Proxy Respondent
Survey Process
METHODOLOGY //34

Refugee Registration and Information System (RRIS) data. These records are potentially inflated since they do not take into account the considerable emigration of Palestine refugees. Moreover, as registration updating is voluntary, it is not mandatory for all births and deaths to be registered with UNRWA. The 2010 report used UNRWA’s records to develop a sampling frame for the survey. Due to logistical considerations, in addition to the12 camps, only 20 locations were selected from the full list of gatherings/locations with a probability proportional to their populations to sample from as many Palestine refugees as possible.
Accordingly, a new sampling frame was used and the current survey was based on the total enumeration that was implemented by the Palestinian Central Bureau of Statistics in 2010 of Palestine refugees living in camps and areas outside the camps in Lebanon. Using a different sampling frame from the one used in the 2010 AUB UNRWA survey can lead to unrealistic shifts in aggregate numbers over a short period of time and raises concerns about the validity of using 2010 and 2015 survey results as a time series to examine change. Therefore, to avoid such artificial shifts, and using a cross-entropy estimation approach,54 the 2015 survey sampling weights were re-calibrated to produce consistent geographic trends by benchmarking the data using the geographic distributions of the 2010 AUB UNRWA survey. The approach minimises the average distance between the original design weights and the newly calibrated weights and has been
widely documented in the literature (Golan, Judge, & Miller, 1996; Neethling & Galpin, 2006; Wittenberg, 2010)55 and used in different locations such as South Africa (Branson & Wittenberg, 2014)56 and Madagascar (Robilliard & Robinson, 2003).57
A two-stage systematic cluster sampling with implicit stratification was implemented. The sampling frame consisted of clusters, geographical areas containing around 20 housing units, which were the primary sampling units. The clusters were systematically sampled from a geographically ordered list by using a fixed sampling interval. Dbayeh camp and other areas outside the camps that were not included in the Palestine Central Bureau of Statistics (PCBS) sampling frame were added to the selected clusters (oversampling) to make sure that all camps and key areas outside the camps were represented. Some areas outside the camps in the sample such as Tebbaneh in NLA were removed and replaced due to its sensitive security situation. While areas in Beirut’s southern Suburbs (Bourj Barajneh for PRL and Shwayfat for PRS) were initially included in the survey, access was also prevented due to the sensitive security situation.
All housing units were visited within each selected cluster. Names were excluded from the list in line with the University’s Institutional Review Board (IRB) procedures. Households inside camps were located by using the numbering of areas, roads and buildings that was provided by the Palestinian Central Bureau of Statistics. Once the
The target PRL population of the survey consists of all Palestine refugees living in the five UNRWA administrative areas: North Lebanon Area, Central Lebanon Area (CLA), Saida, Tyre and the Beqaa. This includes the 12 official Palestine refugee camps and the areas outside the camps, relatively autonomous refugee communities located outside camps where a large percentage of Palestine refugees live in relatively vulnerable conditions. Despite the prevalence of the term ‘gatherings’ in various reports and research pertaining to Palestine refugees, the list and number of gatherings is inconsistent and varies depending on the agency or entity. For the purpose of this study, gatherings are defined, in line with the 2003 Fafo report,53 as the areas outside the camps that include a minimum of 25 Palestinian households that live in close proximity and identify as a distinct group living in a geographically identified area. The survey excludes Palestine refugees who live both outside of camps (according to the above mentioned definition) and who are integrated in the Lebanese population. Tracing and surveying them is beyond the scope and budget of this survey. This method implies a potential bias in the sample since the excluded population can be considered to be relatively better off because they have managed to provide for themselves and live outside refugee communities.
UNRWA records include household estimates for the 12 camps and over 200 areas outside the camps, neighbourhoods and localities where at least 10 Palestinian households reside. These figures are based on UNRWA
Target Population and Sampling Frame
53 Ugland, O. (2003). Difficult past, uncertain future: Living conditions among Palestinian refugees in camps and gatherings in Lebanon.54 Wittenberg, M. (2010). An introduction to maximum entropy and minimum cross-entropy estimation using Stata. The Stata Journal, 10(3), 315–330. Retrieved from http://goo.gl/lMKsCD.55 Golan, A., Judge, G., & Miller, D. (1997). Maximum entropy econometrics: Robust estimation with limited data. Retrieved from http://goo.gl/QJE9x9. Neethling, A., & Galpin, J. (2006). Weighting of household survey data: A comparison of various calibration, integrated and cosmetic estimators: Theory and methods. South African Statistical Journal. Retrieved from http://goo.gl/alTIa0. Wittenberg, M. (2010). An introduction to maximum entropy and minimum cross-entropy estimation using Stata. The Stata Journal, 10(3), 315–330. Retrieved from http://goo.gl/lMKsCD.56 Branson, N., & Wittenberg, M. (2011). Re-weighting South African national household survey data to create a consistent series over time: A cross entropy estimation approach. Retrieved from http://goo.gl/xRwCmS.57 Robilliard, A., & Robinson, S. (2003). Reconciling household surveys and national accounts data using a cross entropy estimation method. Review of Income and Wealth. Retrieved from http://goo.gl/n5hVzl.
35 // TARGET POPULATION AND SAMPLING FRAME

The target PRL sample size was calculated to be 2,816 households using the formula explained in Appendix 2.
The intended sample increased to 3,300 due to the oversampling of some areas which are starred in Appendix 3. In addition, since the Beqaa counts for a small portion of the Palestine refugee population, which would lead to a very small sample size, it was sampled by twice its proportional share of the Palestine refugee population to be able to draw conclusions from the area due to its unique socioeconomic characteristics. A total of 3,476 households were reached, out of which 94 were not eligible (did not include
a Palestine member within the household), and 408 households either refused, were not at home or didn’t include at the time of the interview a qualified member (any household member who is above 18 and able to understand and respond to the survey questions). Consequently, the total effective sample, excluding non-eligible households, was 3,382, of which 2,974 completed or partially completed the interviews. The sample size is considered large enough to adequately estimate the main characteristics of the targeted population. The non-response rate was 13.9 per cent, lower than the expected 15.0 per cent rate used to calculate the sample size.
data collector reached a household, the household’s eligibility to participate in the study was assessed (the household should include a Palestine refugee) and consent was sought.
Snowball sampling technique was employed for households outside camps since addresses and numbers were not available to locate specific households. Random addresses within each cluster were used to initiate the snowballing chain. Once consent was received, the first respondent was asked to nominate other eligible respondents. A maximum of five households were included per snowballing chain.
METHODOLOGY //36
to the survey increasing the sample to 1,040 households and 17 areas outside camps. The sample distribution is found in Appendix 4.
Analysts implemented a two-stage systematic cluster sampling with implicit stratification. The sampling frame consisted of clusters, geographical areas containing around 40 housing units, which were the primary sampling units. The clusters were systematically sampled from a geographically ordered list using a fixed sampling interval. In each selected cluster, 20 out of the 40 housing units were randomly selected and interviewed. The cluster size was increased from 20 to 40 to allow for the replacement of households that could
not be reached or had changed residence due to a highly mobile PRS population. In fact, many of the PRS households that were randomly selected had moved, and the new tenants or neighbours reported their moves. Accordingly, a randomly selected household from the cluster replaced every vacant household until a total of 20 households were reached / interviewed.
Therefore, the total eligible sample was 1,177, of which 1,050 were completed or were partially completed interviews. A further 127 were either not at home or refused to participate in the survey. This response rate of 89.2 per cent for PRS households was higher than that for PRL, 87.9 per cent.
The ongoing armed conflict in Syria has led tens of thousands of Palestine refugees from Syria (PRS) to seek refuge in Lebanon. For the purpose of this study and for logistical considerations, only camps and areas outside camps that include at least 40 families were included in the sampling frame leading to a target population of 10,900 families. Aside from the Dbayeh camp (CLA) which only included eight PRS families, all camps were included along with 16 areas outside the camps. Based on available resources, budget and time the intended sample aimed to reach 1,020 households. In the Beirut region, since access was denied to Shwayfat due to the sensitive security situation, a neighbouring area outside the camps, Aramoun, was added
Palestine Refugees from Syria Living in Lebanon (PRS)
37 // PALESTINE REFUGEES FROM SYRIA LIVING IN LEBANON (PRS)

FIGURE 1: PRL/PRS SAMPLE DISTRIBUTION
METHODOLOGY //38

39 // PALESTINE REFUGEES FROM SYRIA LIVING IN LEBANON (PRS)

© 2016 UNRWA / Francesco Romagnolo

Demographics of Palestine Refugees in Lebanontala ismail
CHAPTERONE

Key Findings
THE SURVEY WAS BASED ON A SAMPLE OF3,382ELIGIBLEPRLHOUSEHOLDS, OF WHICH 2,974 WERE COMPLETED OR WERE PARTIALLY COMPLETED INTERVIEWS. FOR MORE INFORMATION ABOUT THE SAMPLING FRAME, REFER TO THE METHODOLOGY CHAPTER, TARGETPOPULATION AND SAMPLINGFRAME SECTION.
OF THE PRL POPULATION ARE SETTLED IN THE 12 CAMPS AROUND LEBANON
OF THE PRL POPULATION AGED OVER 18 ARE MARRIED
LIVE OUTSIDE CAMPS AND IN OTHER AREAS AROUND THE COUNTRY
THE LARGEST CONCENTRATION OF PRL IS IN THE EIN EL-HILWEH CAMP IN SAIDA
THE AVERAGE AGE OFPRL POPULATION IS
63%
56%
37%15%
30.3 YRS
30% ARE SINGLE
7% ARE WIDOWED
CHAPTER ONE // DEMOGRAPHICS OF PALESTINE REFUGEES IN LEBANON42

THE AGE DEPENDENCY RATIO FOR THE PRL IS
OF HOUSEHOLD HEADS ARE BETWEEN 35 & 54 YEARS OF AGE
ARE AGED 65 AND OVER
WOMEN HEAD ONE-FIFTH (21.5%)OF THE HOUSEHOLDS
51%WHEN ACCOUNTING FORTHE UNEMPLOYED148%
52.36%34%
THE AVERAGE AGE OF HEADOF HOUSEHOLD (HH) IS 51.9 YRS
43 // KEY FINGINGS
THE AVERAGE HOUSEHOLD SIZE OF THE
PRL IS ESTIMATED AT
4.5 MEMBERS
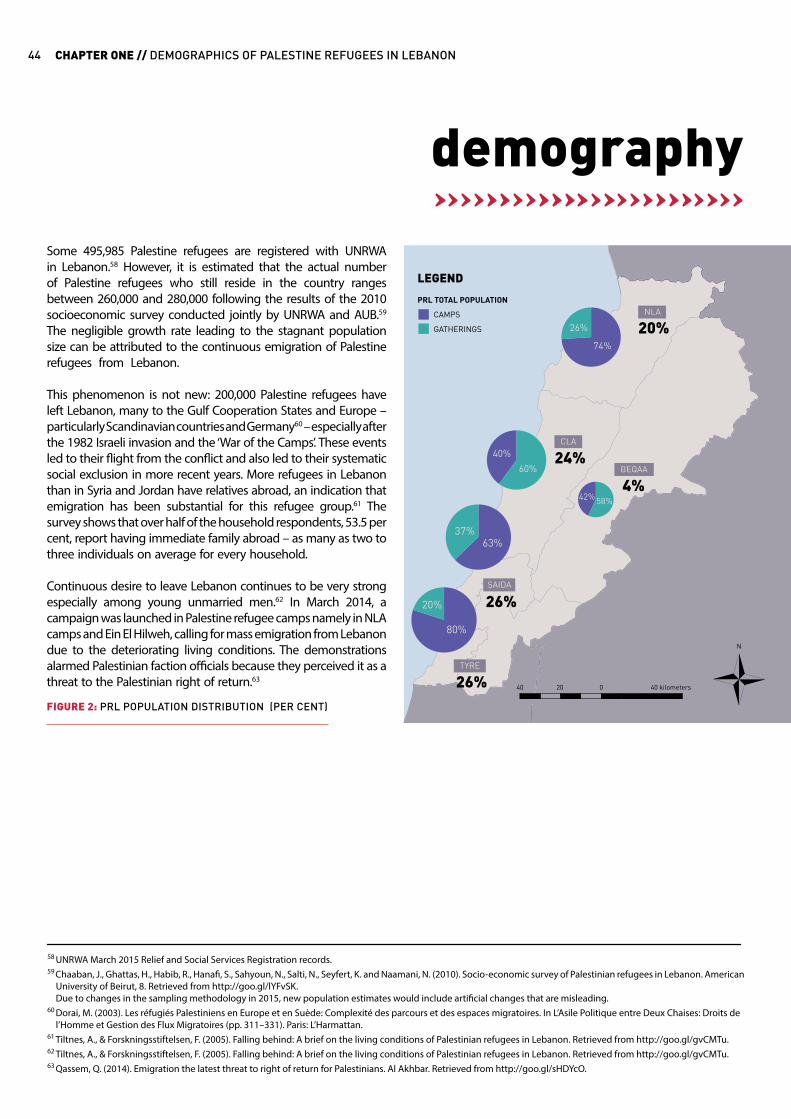
Some 495,985 Palestine refugees are registered with UNRWA in Lebanon.58 However, it is estimated that the actual number of Palestine refugees who still reside in the country ranges between 260,000 and 280,000 following the results of the 2010 socioeconomic survey conducted jointly by UNRWA and AUB.59 The negligible growth rate leading to the stagnant population size can be attributed to the continuous emigration of Palestine refugees from Lebanon.
This phenomenon is not new: 200,000 Palestine refugees have left Lebanon, many to the Gulf Cooperation States and Europe – particularly Scandinavian countries and Germany60 – especially after the 1982 Israeli invasion and the ‘War of the Camps’. These events led to their flight from the conflict and also led to their systematic social exclusion in more recent years. More refugees in Lebanon than in Syria and Jordan have relatives abroad, an indication that emigration has been substantial for this refugee group.61 The survey shows that over half of the household respondents, 53.5 per cent, report having immediate family abroad – as many as two to three individuals on average for every household.
Continuous desire to leave Lebanon continues to be very strong especially among young unmarried men.62 In March 2014, a campaign was launched in Palestine refugee camps namely in NLA camps and Ein El Hilweh, calling for mass emigration from Lebanon due to the deteriorating living conditions. The demonstrations alarmed Palestinian faction officials because they perceived it as a threat to the Palestinian right of return.63
demography
58 UNRWA March 2015 Relief and Social Services Registration records.59 Chaaban, J., Ghattas, H., Habib, R., Hanafi, S., Sahyoun, N., Salti, N., Seyfert, K. and Naamani, N. (2010). Socio-economic survey of Palestinian refugees in Lebanon. American University of Beirut, 8. Retrieved from http://goo.gl/lYFvSK. Due to changes in the sampling methodology in 2015, new population estimates would include artificial changes that are misleading.60 Dorai, M. (2003). Les réfugiés Palestiniens en Europe et en Suède: Complexité des parcours et des espaces migratoires. In L’Asile Politique entre Deux Chaises: Droits de l’Homme et Gestion des Flux Migratoires (pp. 311–331). Paris: L’Harmattan.61 Tiltnes, A., & Forskningsstiftelsen, F. (2005). Falling behind: A brief on the living conditions of Palestinian refugees in Lebanon. Retrieved from http://goo.gl/gvCMTu.62 Tiltnes, A., & Forskningsstiftelsen, F. (2005). Falling behind: A brief on the living conditions of Palestinian refugees in Lebanon. Retrieved from http://goo.gl/gvCMTu.63 Qassem, Q. (2014). Emigration the latest threat to right of return for Palestinians. Al Akhbar. Retrieved from http://goo.gl/sHDYcO.
FIGURE 2: PRL POPULATION DISTRIBUTION (PER CENT)
CHAPTER ONE // DEMOGRAPHICS OF PALESTINE REFUGEES IN LEBANON44
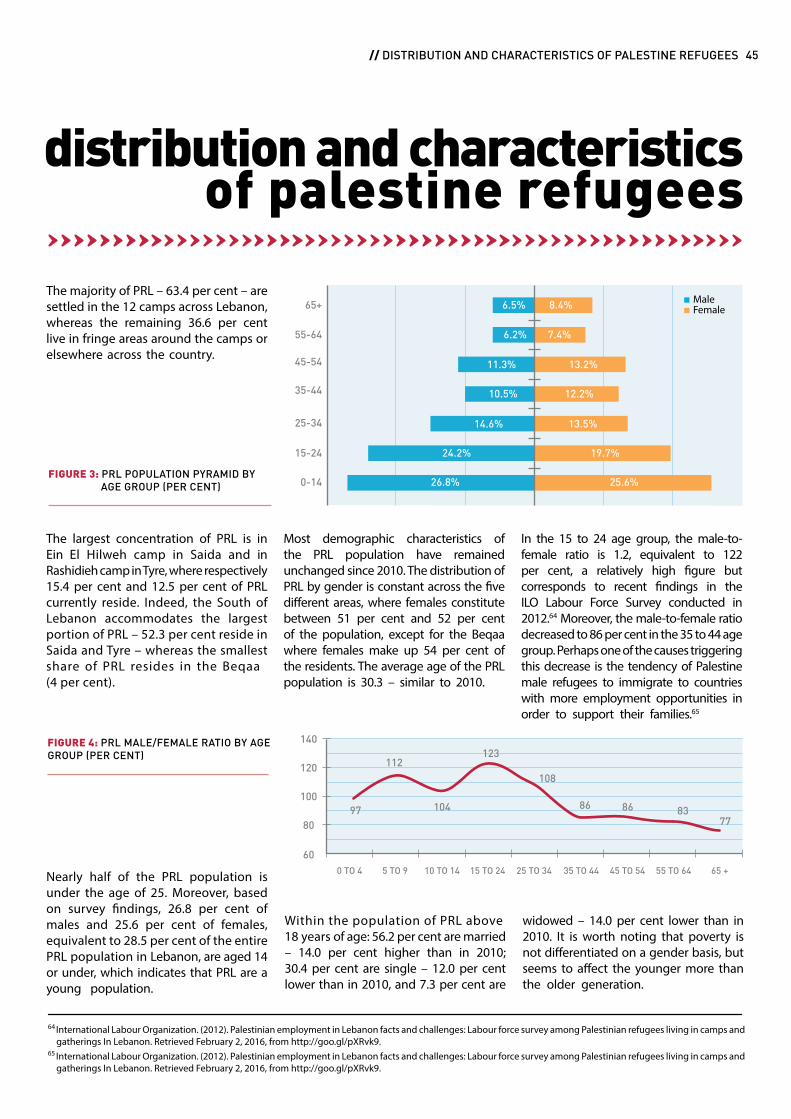
64 International Labour Organization. (2012). Palestinian employment in Lebanon facts and challenges: Labour force survey among Palestinian refugees living in camps and gatherings In Lebanon. Retrieved February 2, 2016, from http://goo.gl/pXRvk9.65 International Labour Organization. (2012). Palestinian employment in Lebanon facts and challenges: Labour force survey among Palestinian refugees living in camps and gatherings In Lebanon. Retrieved February 2, 2016, from http://goo.gl/pXRvk9.
FIGURE 3: PRL POPULATION PYRAMID BY AGE GROUP (PER CENT)
The majority of PRL – 63.4 per cent – are settled in the 12 camps across Lebanon, whereas the remaining 36.6 per cent live in fringe areas around the camps or elsewhere across the country.
The largest concentration of PRL is in Ein El Hilweh camp in Saida and in Rashidieh camp in Tyre, where respectively15.4 per cent and 12.5 per cent of PRL currently reside. Indeed, the South of Lebanon accommodates the largest portion of PRL – 52.3 per cent reside in Saida and Tyre – whereas the smallest share of PRL resides in the Beqaa(4 per cent).
Nearly half of the PRL population is under the age of 25. Moreover, based on survey findings, 26.8 per cent of males and 25.6 per cent of females, equivalent to 28.5 per cent of the entire PRL population in Lebanon, are aged 14 or under, which indicates that PRL are a young population.
Within the population of PRL above18 years of age: 56.2 per cent are married – 14.0 per cent higher than in 2010; 30.4 per cent are single – 12.0 per cent lower than in 2010, and 7.3 per cent are
widowed – 14.0 per cent lower than in 2010. It is worth noting that poverty is not differentiated on a gender basis, but seems to affect the younger more than the older generation.
Most demographic characteristics of the PRL population have remained unchanged since 2010. The distribution of PRL by gender is constant across the five different areas, where females constitute between 51 per cent and 52 per cent of the population, except for the Beqaa where females make up 54 per cent of the residents. The average age of the PRL population is 30.3 – similar to 2010.
In the 15 to 24 age group, the male-to-female ratio is 1.2, equivalent to 122 per cent, a relatively high figure but corresponds to recent findings in the ILO Labour Force Survey conducted in 2012.64 Moreover, the male-to-female ratio decreased to 86 per cent in the 35 to 44 age group. Perhaps one of the causes triggering this decrease is the tendency of Palestine male refugees to immigrate to countries with more employment opportunities in order to support their families.65
distribution and characteristicsof palestine refugees
65+
25-34
55-64
15-24
45-54
0-14
35-44
26.8% 25.6%
24.2% 19.7%
14.6% 13.5%
10.5% 12.2%
11.3% 13.2%
6.2%
6.5% 8.4%
7.4%
FemaleMale
0 TO 4
60
80
100
120
97
112
104
123
108
86 86 8377
140
10 TO 14 15 TO 24 25 TO 34 35 TO 44 45 TO 54 55 TO 64 65 +5 TO 9
FIGURE 4: PRL MALE/FEMALE RATIO BY AGE GROUP (PER CENT)
45 // DISTRIBUTION AND CHARACTERISTICS OF PALESTINE REFUGEES

The age dependency ratio66 measures the size of the burden that the working-age population (between 15 and 64) has to bear in order to provide for the non-working-age or dependent population, which includes children (younger than 15) and the elderly (older than 64).
The age dependency ratio attained is 0.5, equivalent to 51 per cent. This figure is 16.4 per cent lower than the age dependency ratio67 reported by the ILO Labour Force Survey (61 per cent) for Palestine refugees residing in Lebanon. However, the version of the dependency ratio which takes into account the non-employed members is more representative of the actual pressure on the productive/employed household members.
In fact, after accounting for the non-employed population within the 15 to 64 age category, the dependency ratio increased drastically reaching 1.5. This result denotes that every non-dependent member is under pressure to provide for one to two dependent members on average.
dependency
15-24 25-34 35-44 45-54 55-64 65+
FIGURE 5: SHARE OF PRL WHO LIVE ALONE AND REMAIN SINGLE BY GENDER AND AGE GROUP (PER CENT)
FemaleMale
4.4 4.8
26.430.4
20.3
2.9
7.43.3
66 The Age Dependency Ratio is given by: the number of dependents divided by the number of non – dependents, where: Dependents = the number of people younger than 15 years old and older than 64 years old. Non – Dependents = Number of people between 15 and 64 years old.67 The Dependency Ratio is given by: the number of dependents divided by the number of non – dependents, where: Dependents = Children under 15 years old + elderly above 64 years old + non – employed adults between 15 and 64 years old. Non – Dependents = Employed adults between 15 and 64 years old.
CHAPTER ONE // DEMOGRAPHICS OF PALESTINE REFUGEES IN LEBANON46

Based on the survey findings, the average household68 size of PRL residing in Lebanon remains unchanged since 2010 and is estimated at 4.5 members.
On average, the surveyed PRL household consists of two to three adults, a child between the ages of 5 and 18, in addition to either one young child under the age of five or one elderly person above the age of 65.
Moreover, PRL household sizes are larger inside camps (4.5 members) than outside camps (4.4 members). Household sizes also vary within regions, the largest being in North Lebanon Area (5 members), followed by the Beqaa (4.6 members), Saida and the CLA (4.4 members) and the smallest in Tyre (4.3 members).
In addition, 6.4 per cent of PRL households consist of one-person families, of which 92.0 per cent are women. Interestingly, the latter are all aged 30 and above. A quarter(24.5 per cent) of females who live alone remain single, whereas 2.5 per cent are married, 3.4 per cent are divorced and 66.4 per cent are widowed.
average household sizeat 4.5 members, and their composition
68 A household was defined as a group of people who have been sharing dwelling, food and budget for at least 6 months.
47 // HEAD OF HOUSEHOLD PROFILE
NLA CLA SAIDA TYRE BEQAA
54.4 4.4 4.3 4.6
FIGURE 6: AVERAGE HOUSEHOLD SIZE BY REGION

CHAPTER ONE // DEMOGRAPHICS OF PALESTINE REFUGEES IN LEBANON48
The average age of the head of household was estimated to be 51.9 years. Women head over 21.5 per cent of households across Lebanon, which constitutes an increase from the 19.5 per cent reported by the ILO Labour Force Survey in 2012.69 This share is higher within Central Lebanon Area (CLA) where 25.5 per cent of heads of households are female.
head of household profile
FIGURE 7: PRL GENDER DISTRIBUTION OF HOUSEHOLD HEAD (PER CENT)
FemaleMale
CLA
74.5
25.5
SAIDA
78.5
21.5
TYRE
78.8
21.2
BEQAA
76.7
23.3
NLA
83.8
16.2
TOTAL
78.5
21.5
At this point, it should be indicated that Palestine refugees face the poorest socioeconomic conditions in Lebanon compared to other host countries.70 In addition, Lebanon’s unstable political situation and its discriminatory measures have exposed Palestine refugees to a very insecure environment where 60.9 per cent reported feeling insecure due to the physical and social environment surrounding them. Refugees living in Central Lebanon Area (CLA) reported feeling the most insecure (77.8 per cent of residents) followed by the Beqaa (74.1 per cent of residents). The lowest percentage within regions – 45.3 per cent – was reported in Saida.
Additionally, 56.9 per cent of PRL reported being concerned for the safety of their family, mainly in Tyre(26.7 per cent of the total) and in Saida (26.4 per cent). The highest percentage
reported when observing figures within each region is detected in North Lebanon Area (65 per cent – an above average figure).
15-24 25-34 35-44 45-54 55-64 65+
0.89.6
33.5
20.423.6
12.2
FIGURE 8: PRL AGE GROUP DISTRIBUTION OF HOUSEHOLD HEAD (PER CENT)
69 International Labour Organization. (2012). Palestinian employment in Lebanon facts and challenges: Labour force survey among Palestinian refugees living in camps and gatherings In Lebanon. Retrieved February 2, 2016, from http://goo.gl/pXRvk9.70 Shafie, S. (2007). Palestinian refugees in Lebanon. Retrieved from http://goo.gl/0QkkJe.
Over one third – 35.8 per cent – of the household heads (HH) are aged between 35 and 54 years old; in addition, a substantial portion of households – 33.6 per cent – was
headed by a member aged 65 or above. In comparison, for PRS the average age of the head of household is 47. Twenty-four per cent of PRS households are headed
by women, and 52.0 per cent of HH are aged between 35 and 54 and only12.0 per cent, compared to PRL 33.6 per cent, are aged 65 and over.

In conclusion, PRL population count has remained roughly the same since the previous 2010 survey. The majority of PRL live in refugee camps, while around a third live in areas around the camps. Their gender makeup and average age is also similar to 2010. While household size has remained unchanged since 2010, the number of households headed by women has slightly increased by around 2 per cent. Slightly more than half of PRL households report being concerned for the safety of their family.
conclusion

© 2015 UNRWA / Francesco Romagnolo

Poverty Profile of Palestine Refugees in Lebanonjad chaaban
CHAPTERTWO

Key Findings
POVERTY AMONG PALESTINE REFUGEES IN LEBANON IS MEASURED BY USING BOTHMONEY-METRICPOVERTYLINES (INCOME VS. EXPENDITURE) AND THEMULTIDIMENSIONALPOVERTYINDEX(MPI). FOR MORE INFORMATION ON METHODOLOGY, REFER TO PAGE 19 – QUESTIONNAIREDESIGN,CONCEPTUALFRAMEWORK. THE POVERTY LINE IS US$208/PERSON/MONTH AND EXTREME POVERTY IS US$75/PERSON/MONTH.
EXTREME POVERTY HAS HALVED SINCE 2010
OVERALL, THERE ARE NO SIGNIFICANT CHANGES IN GENERAL/ABSOLUTE POVERTY LEVELS FROM 2010, BUT THERE ARE GEOGRAPHIC CHANGES IN POVERTY INCIDENCE.
From 6.6 per cent to 3.1 per cent with significant declines in extreme poverty in south Lebanon (Saida/Tyre) and slight declines in the CLA (25 per cent) and the Beqaa (14 per cent). In contrast, extreme poverty has increased in NLA by 17 per cent.
Slight declines from 2010 in general poverty levels in Saida (8 per cent) and Tyre (9 per cent), but increases in North Lebanon Area (NLA) (11 per cent), the CLA (9 per cent) and the Beqaa (2 per cent).
The survey results reflect the ongoing social exclusion of Palestine refugees from labour and housing markets, and lack of access to decent work opportunities that could help lift them out of poverty.
Poverty and extreme poverty are higher for refugees living inside camps.
OF ADOLESCENTS LIVINGIN POVERTY
OF ADOLESCENTS LIVINGIN EXTREME POVERTY
74%
5%
POVERTY AFFECTS YOUNG REFUGEES MOST, WITH
CHAPTER TWO // POVERTY PROFILE OF PALESTINE REFUGEES IN LEBANON52
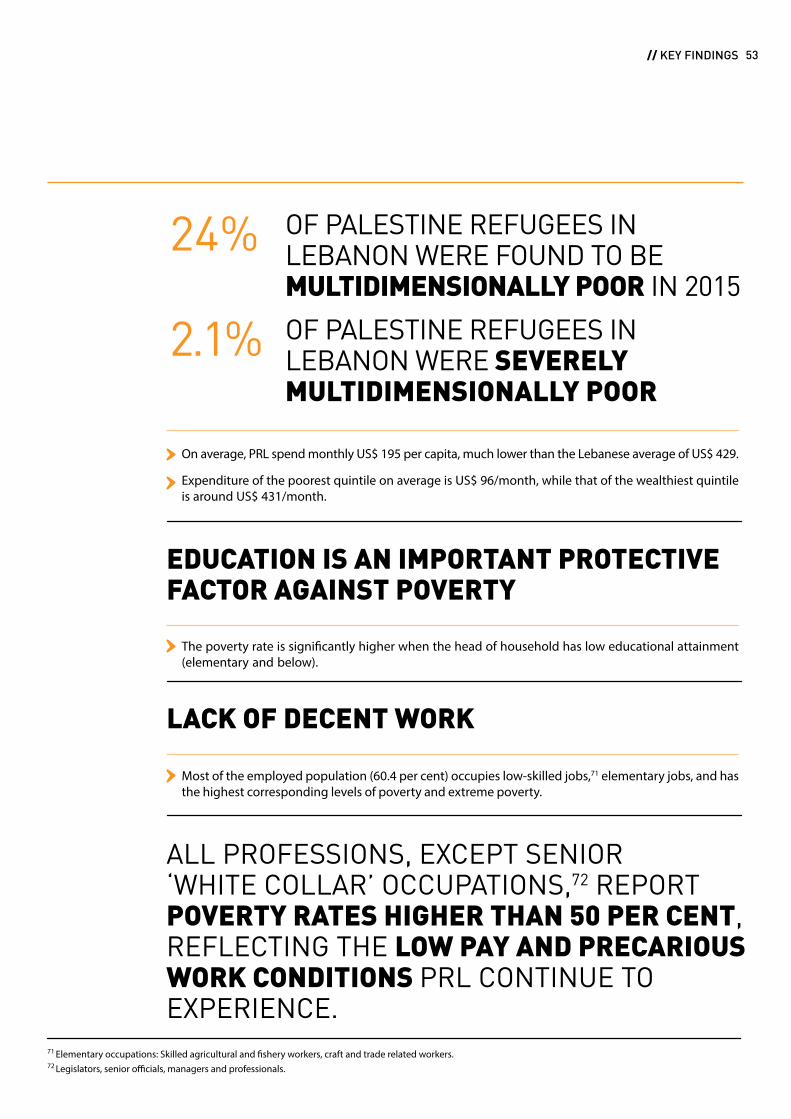
EDUCATION IS AN IMPORTANT PROTECTIVE FACTOR AGAINST POVERTY
LACK OF DECENT WORK
The poverty rate is significantly higher when the head of household has low educational attainment (elementary and below).
Most of the employed population (60.4 per cent) occupies low-skilled jobs,71 elementary jobs, and has the highest corresponding levels of poverty and extreme poverty.
24%
2.1%
ALL PROFESSIONS, EXCEPT SENIOR ‘WHITE COLLAR’ OCCUPATIONS,72 REPORT POVERTY RATES HIGHER THAN 50 PER CENT, REFLECTING THE LOW PAY AND PRECARIOUS WORK CONDITIONS PRL CONTINUE TO EXPERIENCE.
OF PALESTINE REFUGEES IN LEBANON WERE FOUND TO BE MULTIDIMENSIONALLY POOR IN 2015
OF PALESTINE REFUGEES IN LEBANON WERE SEVERELY MULTIDIMENSIONALLY POOR
On average, PRL spend monthly US$ 195 per capita, much lower than the Lebanese average of US$ 429.
Expenditure of the poorest quintile on average is US$ 96/month, while that of the wealthiest quintile is around US$ 431/month.
71 Elementary occupations: Skilled agricultural and fishery workers, craft and trade related workers.72 Legislators, senior officials, managers and professionals.
53 // KEY FINDINGS

TABLE 1: PRL OVERALL POVERTY
All tabulations were found to be significant at the 5% level using Pearson’s chi-squared test.
Poverty lineUS$ 208/person/month
Camps
Outside Camps
TOTAL
Extreme Poverty lineUS$ 75/person/month
Camps
Outside Camps
TOTAL
70.8
55.3
65.2
23.7
16.1
21.0
10.8
6.6
9.3
4.1
1.3
3.1
0.9
0.2
0.6
0.4
0.1
0.3
Poverty Headcount Rate (P0)
Poverty Gap (P1) Squared PovertyGap (P2)
Poverty among Palestine refugees reached 65 per cent in 2015, while extreme poverty reached 3 per cent (see Table 1). In terms of population levels, around 168,000 refugees could not meet their basic food and non-food needs, while there are more than 7,000 extremely poor refugees who did not meet their essential food requirements. Similar to what the UNRWA 2010 report revealed, poverty in its two forms (abject/extreme and general/absolute) was higher for refugees living inside the camps than those outside of them (the poverty headcount reached 73.2 per cent in the camps, compared to 55 per cent in gatherings, while the extreme poverty rate within camps was almost double that of surrounding areas 7.9 per cent – compared to 4.2 per cent in 2010).73
While overall poverty is found to be relatively high, especially inside the camps (as indicated by large figures for the Poverty Gap (P1) ratio), extreme poverty has recorded lower rates and has shown to be containable. Moreover, severity (as measured by the Squared Poverty Gap P2) is higher for poverty than extreme poverty, with camps still experiencing more severe poverty rates.
Low income is still the primary cause of high poverty rates among Palestine refugees. Taking consumption expenditure (which includes imputed rents, as per the earlier description) as a proxy for income, we find that in 2015 each refugee spent on average US$ 195 per month, from the 2010 average (US$ 170 per month). During the same
period, inflation in Lebanon was almost 15 per cent. This income proxy is still low, compared to an average estimated Lebanese monthly per-capita expenditure of US$ 429 in 2012.74,75 Consumption expenditure is still lower in camps than in areas outside camps (see Table 2), and is lowest in the Tyre region and highest in Central Lebanon Area (CLA), similar to the regional trends recorded in 2010. Expenditure of the poorest quintile (poorest 20 per cent of the refugee population) is around US$ 95.6/person/month, and the richest 20 per cent spend about US$ 430.6/person/month (see Table 2).
73 Chaaban, J., Ghattas, H., & Habib, R. (2010). Socio-economic survey of Palestinian refugees in Lebanon. Retrieved from http://goo.gl/9zXCg4.74 The average annual expenditure per capita was reported to be 7,715,000 LBP or US$ 429 monthly.75 Central Administration of Statistics. (2012). Households budget survey. Retrieved January 31, 2016, from http://goo.gl/9CxsTv.
CHAPTER TWO // POVERTY PROFILE OF PALESTINE REFUGEES IN LEBANON54
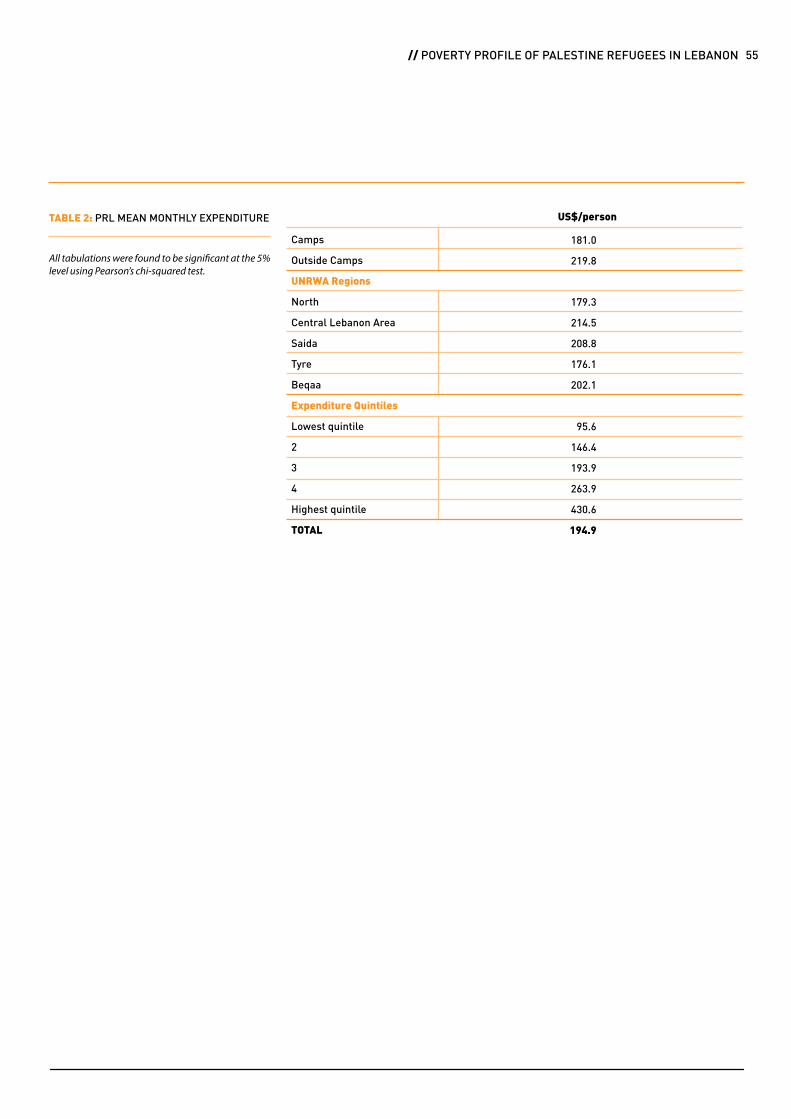
TABLE 2: PRL MEAN MONTHLY EXPENDITURE
All tabulations were found to be significant at the 5% level using Pearson’s chi-squared test.
181.0
219.8
179.3
214.5
208.8
176.1
202.1
95.6
146.4
193.9
263.9
430.6
194.9
US$/person
Camps
Outside Camps
UNRWA Regions
North
Central Lebanon Area
Saida
Tyre
Beqaa
Expenditure Quintiles
Lowest quintile
2
3
4
Highest quintile
TOTAL
55 // POVERTY PROFILE OF PALESTINE REFUGEES IN LEBANON

TABLE 3: PRL POVERTY BY GEOGRAPHIC REGION
All tabulations were found to be significant at the 5% level using Pearson’s chi-squared test.
Poverty lineUS$ 208/person/month
Central Lebanon Area
Saida
Tyre
Beqaa
North
TOTAL
Extreme Poverty lineUS$ 75/person/month
Central Lebanon Area
Saida
Tyre
Beqaa
North
TOTAL
57.8
60.0
71.8
59.8
72.3
65.2
1.2
3.3
3.7
3.8
4.1
3.1
22.0
24.3
28.4
3.7
21.6
100.0
27.1
27.2
23.8
3.4
18.5
100.0
23.6
25.9
26.4
4.0
20.0
100.0
23.6
25.9
26.4
4.0
20.0
100.0
Poverty Headcount Rate (P0)
Distribution of the Poor
Distribution of Population
While overall poverty at the national level is almost unchanged between 2010 and 2015, there were considerable regional shifts in poverty incidence in the past five years. Poverty rates still vary considerably among geographic locations; however while Tyre was the poorest region in 2010, it now ranks better than NLA (see Table 3). In 2010, Tyre region alone accounted for more than 34 per cent of all the poor, while in 2015 this share has dropped to 28 per cent. Extreme poverty is now higher in NLA and Beqaa areas, compared to 2010 where Saida and Tyre had the highest rates.
geographical differences
FIGURE 9: PRL POVERTY LEVEL BY REGION
CHAPTER TWO // POVERTY PROFILE OF PALESTINE REFUGEES IN LEBANON56

Overall, and as mentioned previously, the minor drop in poverty at the national level hides significant reallocation of poverty incidence at the regional level. General poverty has increased by 9 per cent and 11 per cent in CLA and NLA areas respectively; however it has dropped by 8 per cent and nine per cent in Saida and Tyre (see Table 4). An equally interesting trend is a slight drop
One can advance at least two arguments for the observed changes in poverty that occurred over the past five years:
The overall stagnation in the general poverty rate reflects the enduring social exclusion of Palestine refugees, mainly from labour and housing markets, and their continued lack of access to decent job opportunities and social mobility prospects that could help lift them out of poverty.The fact that poverty has dropped in south
(3 per cent) of poverty in camps compared to an increase of about 1 per cent outside camps. But the most significant changes in poverty incidence occurred at the extreme poverty level. Extreme poverty has halved in the past five years, which could be seen as a noteworthy achievement for the Palestine refugee community and UNRWA. However, the national trend in extreme poverty also
Lebanon, namely Saida and Tyre, compared to increases in other areas, could be the result of competition in jobs in NLA, Beqaa and CLA from Syrian refugees whose numbers have been increasing since 2011. Unskilled Syrian workers could now be competing for jobs with unskilled Palestinian labourers, mostly by accepting to work for lower wages and under harsher working conditions. The improvement in south Lebanon is however puzzling, and could be a consequence of various interventions that improved access to labour markets in this area, with an
hides sizeable regional differences: Extreme poverty has unfortunately increased in NLA by 17 per cent, and the decline in extreme poverty rates in the CLA and Beqaa regions was much lower than the decline in Saida and Tyre (see Table 4). This drop in extreme poverty rates is worth dwelling on in future reports and surveys to help find more about and explain the reduced rate.
increase in incomes as a result of more trade and services activities.
The significant drop in extreme poverty rates in all areas except the NLA could have been caused by the programmes and interventions that targeted extreme poverty incidence especially in south Lebanon, through the reformed food and cash distribution schemes following the 2010 targeting refinement.
evolution of poverty incidence in the past five years
2010 2015 DifferenceTABLE 4: PRL EVOLUTION OF POVERTY RATES
All tabulations were found to be significant at the 5% level using Pearson’s chi-squared test.
Poverty lineUS$ 208/person/month
North
Central Lebanon Area
Saida
Tyre
Beqaa
Camps
Outside Camps
TOTAL
Extreme Poverty lineUS$ 75/person/month
North
Central Lebanon Area
Saida
Tyre
Beqaa
Camps
Outside Camps
TOTAL
65.1
53.1
65.2
79.2
58.6
73.2
55
66.4
3.5
1.6
9.8
9.5
4.4
7.9
4.2
6.6
72.3
57.8
60
71.8
59.8
70.8
55.3
65.2
4.1
1.2
3.3
3.7
3.8
4.1
1.3
3.1
11%
9%
-8%
-9%
2%
-3%
1%
-2%
17%
-25%
-66%
-61%
-14%
-48%
-69%
-53%
57 // EVOLUTION OF POVERTY INCIDENCE IN THE PAST FIVE YEARS
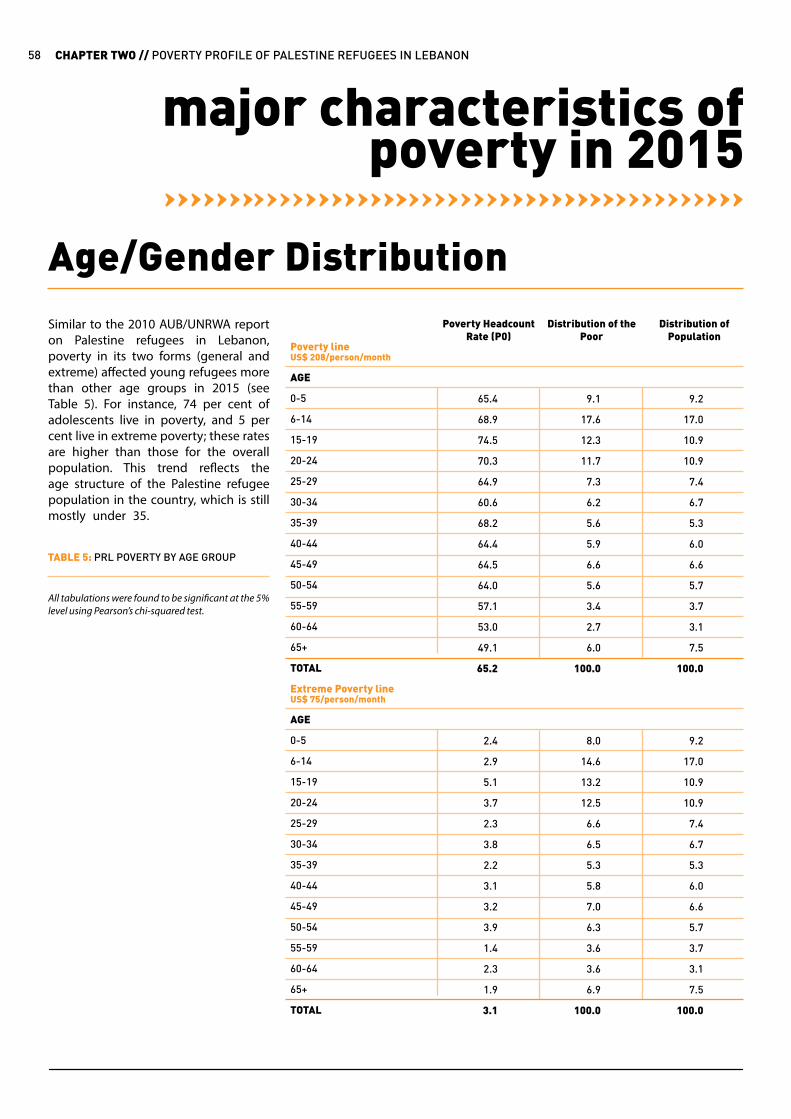
major characteristics of poverty in 2015
Similar to the 2010 AUB/UNRWA report on Palestine refugees in Lebanon, poverty in its two forms (general and extreme) affected young refugees more than other age groups in 2015 (see Table 5). For instance, 74 per cent of adolescents live in poverty, and 5 per cent live in extreme poverty; these rates are higher than those for the overall population. This trend reflects the age structure of the Palestine refugee population in the country, which is still mostly under 35.
Age/Gender Distribution
Poverty lineUS$ 208/person/month
AGE
0-5
6-14
15-19
20-24
25-29
30-34
35-39
40-44
45-49
50-54
55-59
60-64
65+
TOTAL
Extreme Poverty lineUS$ 75/person/month
AGE
0-5
6-14
15-19
20-24
25-29
30-34
35-39
40-44
45-49
50-54
55-59
60-64
65+
TOTAL
65.4
68.9
74.5
70.3
64.9
60.6
68.2
64.4
64.5
64.0
57.1
53.0
49.1
65.2
2.4
2.9
5.1
3.7
2.3
3.8
2.2
3.1
3.2
3.9
1.4
2.3
1.9
3.1
9.1
17.6
12.3
11.7
7.3
6.2
5.6
5.9
6.6
5.6
3.4
2.7
6.0
100.0
8.0
14.6
13.2
12.5
6.6
6.5
5.3
5.8
7.0
6.3
3.6
3.6
6.9
100.0
9.2
17.0
10.9
10.9
7.4
6.7
5.3
6.0
6.6
5.7
3.7
3.1
7.5
100.0
9.2
17.0
10.9
10.9
7.4
6.7
5.3
6.0
6.6
5.7
3.7
3.1
7.5
100.0
Poverty Headcount Rate (P0)
Distribution of the Poor
Distribution of Population
TABLE 5: PRL POVERTY BY AGE GROUP
All tabulations were found to be significant at the 5% level using Pearson’s chi-squared test.
CHAPTER TWO // POVERTY PROFILE OF PALESTINE REFUGEES IN LEBANON58

The figure (see Figure 10) shows the age pyramid that includes a comparison of the total and poor population for each age/gender group. The population distribution of refugees is also quite similar to that of the Lebanese population.
FIGURE 10: PRL POPULATION PYRAMID BY POVERTY, GENDER AND AGE GROUP
65+
25-34
55-64
15-24
45-54
0-14
15 10 5 0 5 10 15
35-44
Poor Male Poor FemaleNon-Poor Male Non-Poor Female
59 // MAJOR CHARACTERISTICS OF POVERTY IN 2015
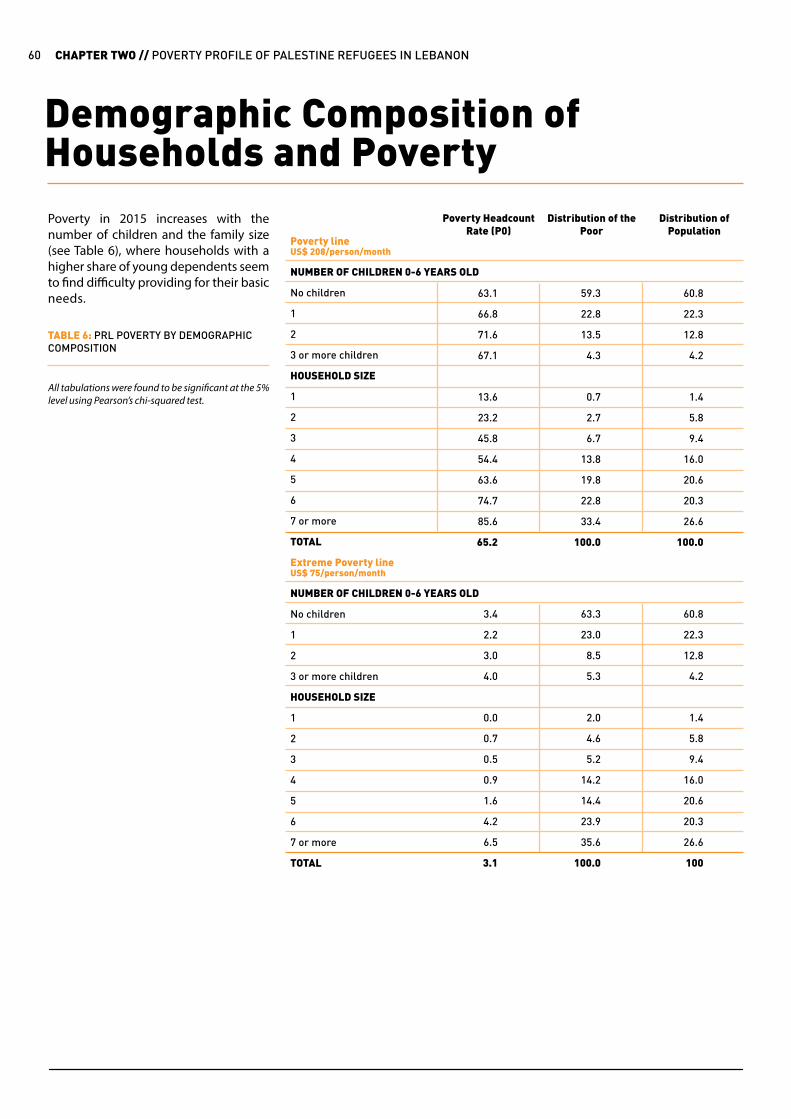
Demographic Composition of Households and PovertyPoverty in 2015 increases with the number of children and the family size (see Table 6), where households with a higher share of young dependents seem to find difficulty providing for their basic needs.
Poverty lineUS$ 208/person/month
NUMBER OF CHILDREN 0-6 YEARS OLD
No children
1
2
3 or more children
HOUSEHOLD SIZE
1
2
3
4
5
6
7 or more
TOTAL
Extreme Poverty lineUS$ 75/person/month
NUMBER OF CHILDREN 0-6 YEARS OLD
No children
1
2
3 or more children
HOUSEHOLD SIZE
1
2
3
4
5
6
7 or more
TOTAL
63.1
66.8
71.6
67.1
13.6
23.2
45.8
54.4
63.6
74.7
85.6
65.2
3.4
2.2
3.0
4.0
0.0
0.7
0.5
0.9
1.6
4.2
6.5
3.1
59.3
22.8
13.5
4.3
0.7
2.7
6.7
13.8
19.8
22.8
33.4
100.0
63.3
23.0
8.5
5.3
2.0
4.6
5.2
14.2
14.4
23.9
35.6
100.0
60.8
22.3
12.8
4.2
1.4
5.8
9.4
16.0
20.6
20.3
26.6
100.0
60.8
22.3
12.8
4.2
1.4
5.8
9.4
16.0
20.6
20.3
26.6
100
Poverty Headcount Rate (P0)
Distribution of the Poor
Distribution of Population
TABLE 6: PRL POVERTY BY DEMOGRAPHIC COMPOSITION
All tabulations were found to be significant at the 5% level using Pearson’s chi-squared test.
CHAPTER TWO // POVERTY PROFILE OF PALESTINE REFUGEES IN LEBANON60
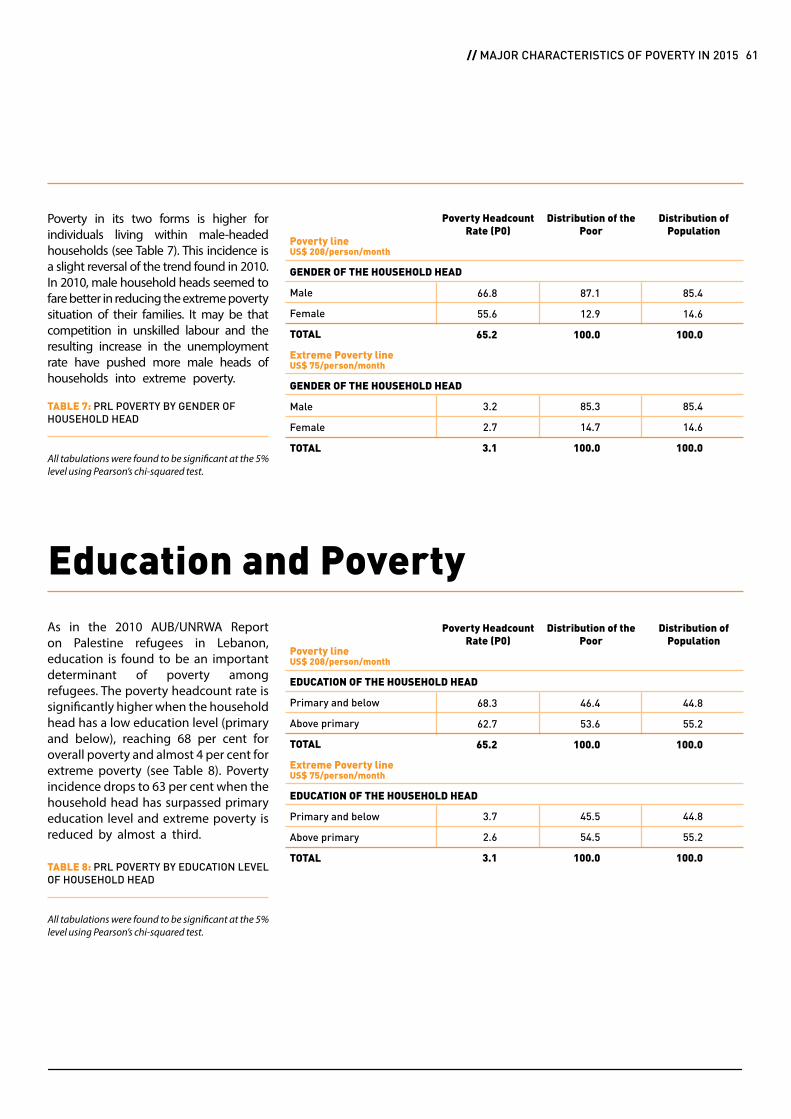
Poverty in its two forms is higher for individuals living within male-headed households (see Table 7). This incidence is a slight reversal of the trend found in 2010. In 2010, male household heads seemed to fare better in reducing the extreme poverty situation of their families. It may be that competition in unskilled labour and the resulting increase in the unemployment rate have pushed more male heads of households into extreme poverty.
Poverty lineUS$ 208/person/month
GENDER OF THE HOUSEHOLD HEAD
Male
Female
TOTAL
Extreme Poverty lineUS$ 75/person/month
GENDER OF THE HOUSEHOLD HEAD
Male
Female
TOTAL
Poverty lineUS$ 208/person/month
EDUCATION OF THE HOUSEHOLD HEAD
Primary and below
Above primary
TOTAL
Extreme Poverty lineUS$ 75/person/month
EDUCATION OF THE HOUSEHOLD HEAD
Primary and below
Above primary
TOTAL
66.8
55.6
65.2
68.3
62.7
65.2
3.2
2.7
3.1
3.7
2.6
3.1
87.1
12.9
100.0
46.4
53.6
100.0
85.3
14.7
100.0
45.5
54.5
100.0
85.4
14.6
100.0
44.8
55.2
100.0
85.4
14.6
100.0
44.8
55.2
100.0
Poverty Headcount Rate (P0)
Poverty Headcount Rate (P0)
Distribution of the Poor
Distribution of the Poor
Distribution of Population
Distribution of Population
TABLE 7: PRL POVERTY BY GENDER OF HOUSEHOLD HEAD
TABLE 8: PRL POVERTY BY EDUCATION LEVEL OF HOUSEHOLD HEAD
All tabulations were found to be significant at the 5% level using Pearson’s chi-squared test.
All tabulations were found to be significant at the 5% level using Pearson’s chi-squared test.
As in the 2010 AUB/UNRWA Report on Palestine refugees in Lebanon, education is found to be an important determinant of poverty among refugees. The poverty headcount rate is significantly higher when the household head has a low education level (primary and below), reaching 68 per cent for overall poverty and almost 4 per cent for extreme poverty (see Table 8). Poverty incidence drops to 63 per cent when the household head has surpassed primary education level and extreme poverty is reduced by almost a third.
Education and Poverty
61 // MAJOR CHARACTERISTICS OF POVERTY IN 2015

Similar to findings in 2010, employment and the type of jobs refugees are engaged in are extremely important predictors of poverty. The precarious nature and low pay of jobs that Palestine refugees typically hold in Lebanon continues to impose a negative burden on their livelihoods. Most of the employed refugee population occupies low-skilled jobs and elementary occupations (about 60 per cent), and these categories have the highest number of poor and extremely poor individuals (see Table 9). As expected, poverty decreases as the status of employment moves into higher skilled professions, but still all professions except senior ‘white collar’ ones (legislators, senior officials and managers) display poverty rates above 50 per cent. The 60 per cent prevalence of low-skilled jobs reflects the low pay and precarious work conditions Palestine refugees still experience in the country.
Employment and Poverty
Poverty lineUS$ 208/person/month
OCCUPATION
Legislators, senior officials and managers
Professionals
Technicians and associateprofessionals
Clerks
Service workers
Skilled agricultural andfishery workers
Craft and related trade workers
Plant and machine operators/assemblers
Elementary occupations
TOTAL
Extreme Poverty lineUS$ 75/person/month
OCCUPATION
Legislators, senior officials and managers
Professionals
Technicians and associateprofessionals
Clerks
Service workers
Skilled agricultural andfishery workers
Craft and related trade workers
Plant and machine operators/assemblers
Elementary occupations
TOTAL
6.8
46.3
50.8
50.2
64.0
72.3
66.4
69.4
66.3
65.2
0.0
0.3
1.6
0.4
3.7
0.0
4.0
3.1
2.9
3.1
0.0
6.0
4.8
4.0
13.6
2.6
22.5
8.9
37.6
100.0
0.0
4.5
7.9
4.9
14.7
2.9
21.9
11.7
31.5
100.0
0.4
8.0
5.2
4.6
13.4
2.2
21.7
8.0
36.5
100.0
0.4
8.0
5.2
4.6
13.4
2.2
21.7
8.0
36.5
100.0
Poverty Headcount Rate (P0)
Distribution of the Poor
Distribution of Population
TABLE 9: PRL POVERTY BY STATUS OF EMPLOYMENT
All tabulations were found to be significant at the 5% level using Pearson’s chi-squared test.
CHAPTER TWO // POVERTY PROFILE OF PALESTINE REFUGEES IN LEBANON62

A correlation analysis between the three basic occupations and poverty rates reveals interesting trends across the regions. General poverty is significantly correlated with all low-skilled occupations in the NLA, the CLA and
the Beqaa (except craft workers), while no significant correlation is found in Saida and Tyre. Extreme poverty across regions has more varied links with low-skilled professions (see Table 10). These correlations confirm the overall
regional poverty trends where unskilled Palestinian workers in the regions hosting the majority of Syrian refugees could be increasingly exposed to poverty risk as the Syria crisis intensifies.
Poverty lineUS$ 208/person/month
Craft and related trade workers
Plant and machine operators/assemblers
Elementary Occupations
Extreme Poverty lineUS$ 75/person/month
Craft and related trade workers
Plant and machine operators/assemblers
Elementary Occupations
0.11 **
0.16 **
0.15 ***
0.04 **
0
0.02
0.06
0.09
0.04
0.03
0.09 **
0.02
0.18 ***
0.15 **
0.2 ***
0
0.05 **
0.02
0.06
0.05
0.08
0.04 **
0
0
0.08
0.22 **
0.15 **
0
0.07
0.02
0.1
0.1
0.13
0.02
0.02
0.01
CLA SAIDA TYRE BEQAA NLA TOTALTABLE 10: LINKS BETWEEN LOW-SKILLED PROFESSIONS AND POVERTY, BY REGION FOR PRL
Denotes significance at the 1% level,Denotes significance at the 5% level andDenotes significance at the 10% level using Pearson’s chi-squared test.
******
A further analysis of the probability of being poor confirms the previously mentioned trends: refugees living in larger households, households headed by men, and residing in camps face a
statistically significant higher probability of being in poverty than others (with an effect ranging from 4 to 19 per cent for overall poverty) (see Table 11). Moreover, refugees in households where the head
is jobless face a 5 per cent higher chance of being poor (2.5 per cent for extremely poor) than others.
Household size
Head woman
Head has no job
Lives in Camp
DY/DX
9.5%
-5.8%
4.7%
18.6%
DY/DX
0.9%
-1.1%
2.5%
1.8%
P>Z
0
0.002
0.015
0
P>Z
0
0.029
0.024
0
POVERTY EXTREME POVERTYTABLE 11: MARGINAL EFFECTS OF MAIN VARIABLES ON THE PROBABILITY OF BEING POOR FOR PRL
Note: Marginal effects obtained after Probit regressions for poverty and extreme poverty indicators.
All tabulations were found to be significant at the 5% level using Pearson’s chi-squared test.
63 // MAJOR CHARACTERISTICS OF POVERTY IN 2015

The Multidimensional Poverty Index (MPI) for Palestine refugees in Lebanon is calculated using the methodology detailed in Appendix 5. As discussed previously, the index produces values ranging between 0 and 1. Following UNDP methodological specifications, a household is considered multidimensionally poor (or MPI poor) if the total of weighted deprivations
The MPI results are in line with the money-metric poverty findings. In fact, the Pearson correlation coefficients between MPI and overall and extreme poverty are positive and statistically
significant (see Table 13). As expected, the MPI has a higher correlation coefficient with the poverty indicator compared to the extreme poverty one, where the general poverty measure
includes household expenditures on several items other than food that fall under the MPI categories.
(deprivation score) is equal to 0.3 or more. A household is considered severely multidimensionally poor if the deprivation score is 0.5 or more. Moreover, if a household is deprived, then all of its members are deprived.Table 12 details the results of the MPI by regions and area of residence. Overall, 24.0 per cent of Palestine refugees in Lebanon were multidimensionally poor
in 2015, and 2.1 per cent were severely multidimensionally poor. The incidence of these indicators varies across regions, where NLA and the Beqaa had the highest MPI headcount, while NLA had the highest severe MPI headcount. Camps had a much higher incidence of severe multidimensional poverty than areas outside the camps.
Multidimensional Poverty
TOTAL
Camp
Outside camp
Central Lebanon Area
Saida
Tyre
Beqaa
North
MPI
Poverty
Extreme poverty
0.12
0.13
0.11
0.12
0.12
0.1
0.11
0.15
1
0.23*
0.15*
1
0.14* 1
0.005
0.005
0.012
0.011
0.010
0.008
0.010
0.016
24
24
23
26
23
21
27
27
2.10
2.50
1.40
0.92
2.60
0.60
1.50
5.40
Index value
MPI Poverty Extreme Poverty
Standard Error MPIheadcount (%)
Severe MPI headcount (%)
TABLE 12: PRL MULTIDIMENSIONAL POVERTY INDEX RESULTS
TABLE 13: CORRELATION MATRIX BETWEEN MONEY-METRIC AND MULTIDIMENSIONAL POVERTY INDICATORS FOR PRL
All tabulations were found to be significant at the 1% level using Pearson’s chi-squared test.
* Denotes significance at the 5% level using Pearson’s chi-squared test.
CHAPTER TWO // POVERTY PROFILE OF PALESTINE REFUGEES IN LEBANON64
In conclusion, while extreme PRL poverty rates have witnessed noticeable improvement by decreasing by half since the 2010 survey, general poverty rates have remained more or less the same since 2010. There has been a minor drop in poverty at the national level. However, poverty rates vary among the various regions. General poverty has increased by 9 per cent and 11 per cent in CLA and North areas respectively; however it has dropped by 8 per cent and 9 per cent in Saida and Tyre. While PRL youth are the most affected by poverty, in general, PRL expenditures per month are less than the average of their Lebanese counterparts. Moreover, refugees living in larger households, households headed by men and those residing in camps face a statistically significant higher probability of being poor than others. Finally, education is a buffer that alleviates poverty levels among PRL.
conclusion
65 // CONCUSION

© 2015 UNRWA / Maysoun Mustafa

Education Access and Attainment of Palestine Refugees in Lebanonlara batlouni, nisreen salti, alexandra irani
CHAPTERTHREE

Key Findings
NET ENROLMENT HAS IMPROVED AS THE SHARE OF OUT-OF-SCHOOL CHILDREN HAS DECREASED COMPARED TO 2010 SURVEY FINDINGS
SECONDARY SCHOOL ENROLMENT INCREASED SIGNIFICANTLY FROM
OF SCHOOL-AGE CHILDREN ARE ENROLLED AT THE ELEMENTARY SCHOOL LEVELARE ENROLLED IN PREPARATORY SCHOOL
ARE ENROLLED IN SECONDARY SCHOOL
IN2010 TO
IN2015
97%
84%
61%
51% 61%
4%
15%
THE AVERAGE DROPOUT RATE FOR SCHOOL-AGE CHILDREN IS
WHILE THE RATE OF NON-ATTENDANCE IS
CHAPTER THREE // EDUCATION ACCESS AND ATTAINMENT OF PALESTINE REFUGEES IN LEBANON68

THE AVERAGE ILLITERACY RATE IS 8%
OF 6 TO 15-YEAR-OLD STUDENTS ATTEND UNRWA SCHOOLSOF 16 TO 18-YEAR-OLD STUDENTS ATTEND UNRWA SCHOOLS
AMONGFEMALES
AMONGMALES
81%
70%
11.3% 4.1%
THE AVERAGE CONSUMPTION AGGREGATE – WHICH IS CONSIDERED A RELIABLE MEASURE OF HOUSEHOLD WELL-BEING AND SOCIOECONOMIC STATUS – IS LOWEST FOR RESPONDENTS ATTENDING UNRWA SCHOOLS
OF DISABLED CHILDREN ARE ENROLLED IN UNRWA SCHOOLS
OF DISABLED CHILDREN ARE ENROLLED IN SPECIAL EDUCATION
OF DISABLED CHILDREN ARE NOT ENROLLED IN ANY SCHOOL AT ALL
OF PRL ABOVE THE AGE OF 25 DO NOT HAVE A BREVET CERTIFICATE, 11.9% ARE BACCALAUREATE HOLDERS AND 6.2% HOLD UNIVERSITY DEGREES
62%
8.9%
28.9%
69.9%
69 // KEY FINDINGS
Palestine refugees enjoyed some of the best educational conditions until the PLO and its institutions were expelled from Lebanon in the mid-to-late-1980s.76 The constant deterioration of the economic and political situation in Lebanon coupled with the Lebanese government’s limitations on the status of Palestine refugees and restricted UNRWA budget coupled with Palestine refugees’ rising needs has negatively affected the quality of education and educational outputs for a large segment of PRL. In fact, more and more students are losing motivation and finding it hard to rationalise an investment in education due to limited and restricted access to decent job opportunities in Lebanon’s highly discriminating labour market.
Palestine refugees have been living in a paradox of inclusive exclusions.77 With respect to education, they are required to study under the Lebanese curriculum, however, access to Lebanese public schools is limited to Palestine refugees because of the availability and locations of UNRWA services.
These restrictions, which do not exist in other UNRWA fields, make Lebanon the only field of operation in which UNRWA provides secondary education, since it would otherwise not be sufficiently available to Palestine refugees. Moreover, most refugees cannot afford the high tuition fees of private schools making UNRWA educational services vital. The Agency runs 67 schools and two vocational education centres across the country providing educational services to over 38,000 PRL students (during the 2014/2015 academic school year).
Since 2011, UNRWA has embarked upon an Agency-wide Education Reform,78 working
towards improving quality, inclusive and equitable education by improving(1) Curriculum and Student Assessment; (2) Teacher Development and School Empowerment; (3) Inclusive Education; and (4) Technical and Vocational Education & Training (TVET). A new Teacher Policy was endorsed in 2013 to further professionalise the teaching workforce, and an Education Management Information System (EMIS) has recently been developed to facilitate the monitoring and evaluation of progress in UNRWA schools. The Agency has also been focusing on making education more inclusive to students with disabilities; UNRWA started training staff on an Inclusive Education Tool Kit to help teachers identify and respond to the diverse needs of students. UNRWA is also striving to innovate the quality of education for its vocational training centres (VTCs), to provide practical skills applicable in the job market, and to assure its graduates are best equipped with knowledge of what the local job market demands.
To be able to accommodate the additional 6,527 PRS students, a small number of schools (nine), at the elementary and preparatory levels, run on a double shift basis.79 Non-profit organizations complement UNRWA’s basic education programme through providing access to preschool services, additional after school recreational, psychosocial and learning support programmes, vocational training opportunities, and other specialised education services. The UNRWA Siblin Training Centre (STC) provides 28 vocational and technical training courses; 13 are annually available and the remainder are offered on an alternative basis across both South and North campuses. Out of the
28 courses, 16 are trade courses and 12 are technical/semi‐professional courses. During the 2014/15 school year 1,150 trainees were enrolled, of whom 40 per cent were women. Currently, UNRWA STC vocational education graduates are granted a certificate from the Lebanese Ministry of Foreign Affairs. UNRWA is undergoing a process of official accreditation from the Ministry of Education (MoE) so that STC graduates can be awarded an official certificate signed and recognised by the MoE. This official and certified degree will enable STC to grant its graduates a certificate equivalent to the one provided by other Lebanese institutes and to increase the potential of Palestine refugee youth through improved access to education and decent work opportunities.
At the higher education level, Palestine refugees have access to the Lebanese University; however they are subject to quotas.80 Although they are officially considered foreigners, they have been paying fees equivalent to their Lebanese peers since 2005.81 In addition, UNRWA awards a limited number of scholarships to academically outstanding students to study in universities in Lebanon, with approximately 3.5 per cent of UNRWA students receiving scholarships annually.
Despite these challenges in accessing education, net enrolment has seen improvement with the share of out-of-school children decreasing compared to 2010 findings. UNRWA is also working on continuously raising donor contributions either for the General Fund (programme budget) or for special projects and initiatives to maintain its educational services and improve the quality of the education provided.
76 Hillenkamp, B. (2008). The challenges of Palestinian education. Retrieved February 6, 2016, from http://goo.gl/ogkou8.77 Shuayb, M. (2014). The art of inclusive exclusions: Educating the Palestinian refugee students in Lebanon. Refugee Survey Quarterly (Vol. 33). Retrieved from http://goo.gl/G2IV6T.78 United Nations Relief and Works Agency. (2015). Education reform strategy. Retrieved January 31, 2016, from http://goo.gl/JCjlp2.79 In 2015/16 the number of schools running on double-shift basis to accommodate PRS has decreased to five.80 In scientific Faculties (Medicine, engineering, pharmacy) 10 per cent quota is reserved for Foreigners (which include Palestinians), while entrance to other faculties is based on entrance exam results.81 Hillenkamp, B. (2008). The challenges of Palestinian education. Retrieved February 6, 2016, from http://goo.gl/ogkou8.
CHAPTER THREE // EDUCATION ACCESS AND ATTAINMENT OF PALESTINE REFUGEES IN LEBANON70

82 The net enrollment rate is the ratio of children of official school age who are enrolled in school to the population of the corresponding official school age.
At the elementary school level, 97.2 per cent of children were enrolled in school. The highest enrolment rates are in Saida, Tyre and the CLA with 98.3 per cent,97.8 per cent and 97.3 per cent of elementary school-aged children respectively enrolled, while the lowest is in North Lebanon Area (NLA) at 95.2 per cent. Except for NLA, the gender gap is in favour of girls, where
females are higher than among males in all five regions. In Central Lebanon Area (CLA), the gender gap is largest, where 76.1 per cent of boys are enrolled in preparatory school compared to 93.2 per cent of girls.
Enrolment in the preparatory school level increased slightly over the span of
Enrolment rates82 were estimated for elementary, preparatory and secondary schools. The elementary school age bracket was taken to be between 6 and 12 years (covering grades 1 to 6), the preparatory school age bracket between 13 and 15 years (covering grades 7 to 9), and the secondary school age bracket between 16 and 18 years (covering grades 10 to 12).
In preparatory school, enrolment rates register lower values than elementary school, reaching an average of 84.2 per cent. Beqaa has the highest enrolment rate (at 90.2 per cent, registering almost equal figures for males and females) and North Lebanon Area the lowest (at77.0 per cent, driven by low male enrolment). The enrolment rates among
enrolment rates among females are higher than among males, though the difference is not statistically significant. In addition, no significant difference was observed for elementary enrolment rates between students residing inside camps and those in gatherings.
five years (2010-2015), with less than a one percentage point rise from the 2010 level of 83.3 per cent. The largest increase was in Tyre (more than seven percentage points), while the rate declined in North Lebanon Area. Surprisingly, enrolment was found to be statistically significantly higher in gatherings (88.2 per cent) than in camps (82.5 per cent).
enrolment and dropout
Male (%)
Female (%)
TOTAL (%)
96.7
98.0
97.3
97.7
97.9
97.8
96.5
93.8
95.2
97.8
98.8
98.3
90.4
98.1
94.5
97.0
97.4
97.2
CLA SAIDA TYRE BEQAA NLA TOTALTABLE 14: PRL ELEMENTARY SCHOOL ENROLMENT RATES
TABLE 15: PRL PREPARATORY SCHOOL ENROLMENT RATES
Male (%)
Female (%)
TOTAL (%)
2015
82.3
92.8
87.8
2015
78.4
86.5
82.9
2015
67.1
92.2
80.5
2015
86.7
91.8
88.9
2015
78.7
87.9
82.6
2015
76.1
90.0
83.3
2010
76.1
93.2
85.1
2010
77.4
89.6
84.3
2010
84.9
90.5
87.6
2010
90.2
90.3
90.2
2010
70.7
83.3
77.0
2010
78.6
89.4
84.2
CLA SAIDA TYRE BEQAA NLA TOTAL
71 // ENROLMENT AND DROPOUT
Denotes significance at the 1% level,Denotes significance at the 5% level andDenotes significance at the 10% level using Pearson’s chi-squared test.
******
Denotes significance at the 1% level,Denotes significance at the 5% level andDenotes significance at the 10% level using Pearson’s chi-squared test.
******
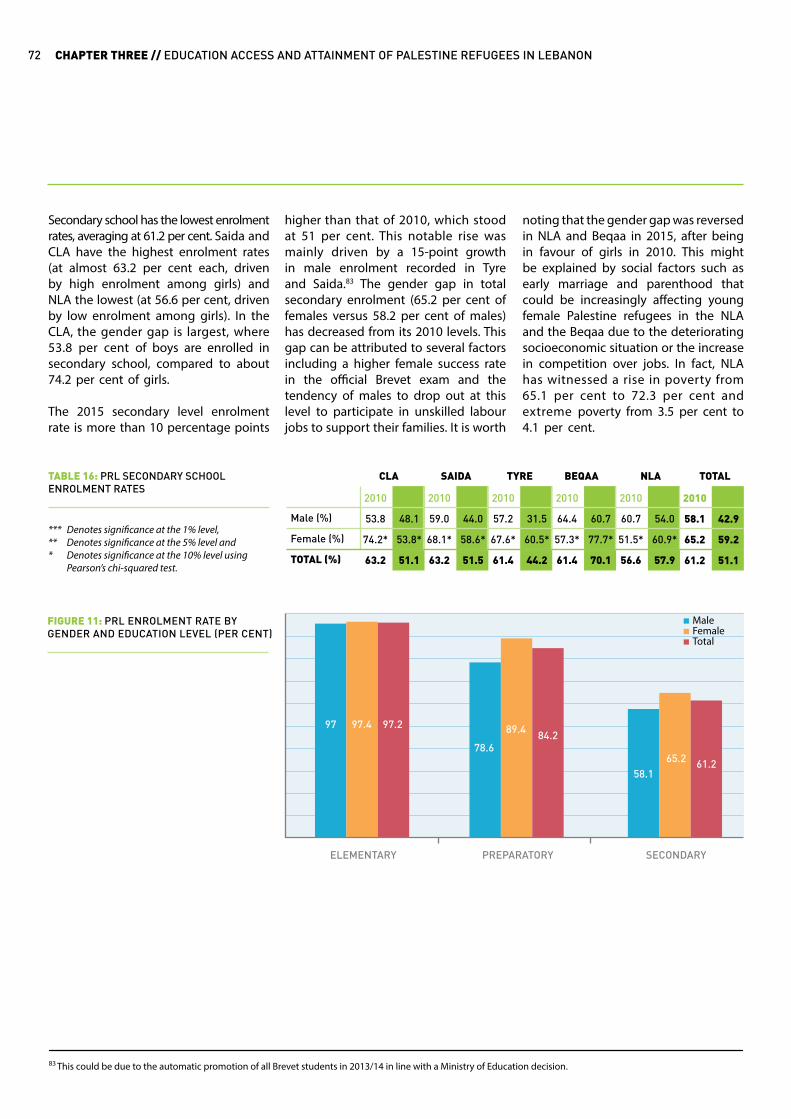
Secondary school has the lowest enrolment rates, averaging at 61.2 per cent. Saida and CLA have the highest enrolment rates (at almost 63.2 per cent each, driven by high enrolment among girls) and NLA the lowest (at 56.6 per cent, driven by low enrolment among girls). In the CLA, the gender gap is largest, where 53.8 per cent of boys are enrolled in secondary school, compared to about 74.2 per cent of girls.
The 2015 secondary level enrolment rate is more than 10 percentage points
higher than that of 2010, which stood at 51 per cent. This notable rise was mainly driven by a 15-point growth in male enrolment recorded in Tyre and Saida.83 The gender gap in total secondary enrolment (65.2 per cent of females versus 58.2 per cent of males) has decreased from its 2010 levels. This gap can be attributed to several factors including a higher female success rate in the official Brevet exam and the tendency of males to drop out at this level to participate in unskilled labour jobs to support their families. It is worth
noting that the gender gap was reversed in NLA and Beqaa in 2015, after being in favour of girls in 2010. This might be explained by social factors such as early marriage and parenthood that could be increasingly affecting young female Palestine refugees in the NLA and the Beqaa due to the deteriorating socioeconomic situation or the increase in competition over jobs. In fact, NLA has witnessed a rise in poverty from 65.1 per cent to 72.3 per cent and extreme poverty from 3.5 per cent to 4.1 per cent.
TABLE 16: PRL SECONDARY SCHOOL ENROLMENT RATES
Male (%)
Female (%)
TOTAL (%)
2015
48.1
53.8*
51.1
2015
44.0
58.6*
51.5
2015
31.5
60.5*
44.2
2015
60.7
77.7*
70.1
2015
54.0
60.9*
57.9
2015
42.9
59.2
51.1
2010
53.8
74.2*
63.2
2010
59.0
68.1*
63.2
2010
57.2
67.6*
61.4
2010
64.4
57.3*
61.4
2010
60.7
51.5*
56.6
2010
58.1
65.2
61.2
CLA SAIDA TYRE BEQAA NLA TOTAL
FIGURE 11: PRL ENROLMENT RATE BY GENDER AND EDUCATION LEVEL (PER CENT) Female
Total
Male
ELEMENTARY PREPARATORY SECONDARY
97
78.6
58.165.2 61.2
89.4 84.297.4 97.2
83 This could be due to the automatic promotion of all Brevet students in 2013/14 in line with a Ministry of Education decision.
CHAPTER THREE // EDUCATION ACCESS AND ATTAINMENT OF PALESTINE REFUGEES IN LEBANON72
Denotes significance at the 1% level,Denotes significance at the 5% level andDenotes significance at the 10% level using Pearson’s chi-squared test.
******
According to the survey findings, 4.2 per cent of PRL students enrolled but reported ‘dropping out ’ from school during the year, with males(5.8 per cent) more than twice as likely to be reported as dropping out than females (2.6 per cent). The highest dropout rate84 was reported in Central Lebanon Area (at 7.1 per cent) and the lowest in North Lebanon Area (at 0.9 per cent). Dropout rates tend to increase with age with 3 per cent and 0.9 per cent of enrolled males and females dropping out respectively from the 13 to 15 age group compared to 14.5 per cent and
8.2 per cent of enrolled males and females from the 16 to 18 age group. Females tend to be less prone to dropping out from school, as witnessed by a lower dropout rate in their age groups across all regions. Many students drop out before obtaining the Brevet, the Lebanese Government certificate obtained on successful completion of middle school that enables students to enter secondary school. This rate is evidenced by the fact that more than two-thirds (68 per cent) of those who dropout have reached the preparatory
grade without completing their Brevet. It should be noted that the calculation of the dropout rate for the purpose of this survey relies on the reporting of the proxy respondent and differs significantly from the definition used by UNRWA. According to official UNRWA enrolment records, the overall dropout rate for the PRL and PRS student population in the 2014/15 academic year did not exceed 2.3 per cent.
Dropout
84 The dropout rate is defined as the percentage of students of the total enrolled student population who enrolled in the current school year but dropped out. Differently to the UNRWA definition of the dropout rate calculated based on a student who was enrolled in an UNRWA school during a given school year but is not enrolled in any school (UNRWA or otherwise) in the following school year.
73 // ENROLMENT AND DROPOUT

that low achievement predominantly affects males. This reason is followed by mentioning that they do not like school (25.9 per cent), again with a percentage of males (17.0 per cent) that is double that of females (8.8 per cent). More than12.4 per cent mentioned they had to work, namely males (10.6 per cent), whereas a negligible percentage of females stated having to work as a reason (1.9 per cent). On the other hand, 6.8 per cent of females compared to less than 1 per cent of males mentioned that marriage is a deterrent to schooling. These findings are consistent with findings of the 2013 Dropout Study commissioned by UNRWA,85 whereby underachievement, family and economic
The proportion of school-age children (6–15 years) who are enrolled but not attending school was recorded at 7 per cent. This rate doubles (14.8 per cent) for the full school cycle of 6 to 18 years, with approximately one-third (34.3 per cent) of those aged 15 to 18 being enrolled but not attending school. In terms of location, NLA has the highest share of children who are not attending school (ages 6 to 18) at 20 per cent, while Tyre has the lowest at 12.9 per cent.
The main reason stated for not enrolling in school includes low achievement/failure (30.9 per cent), with 20.8 per cent of males and 10.1 per cent of females suggesting
issues were found to be major factors contributing to dropping out, along with early marriage, which affected 2 per cent of girls in Lebanon.
A closer look at the non-enrolled suggests that they come from more vulnerable households. Overall, around 10 per cent of respondents report receiving cash or in-kind assistance from an organization other than UNRWA. This proportion is much higher (at 17 per cent) among respondents who do not attend school86 and those who list disability or illness as a reason for non-attendance. Similarly, close to 21 per cent of respondents who were unable to register at school receive help in cash or kind.
non-attendance
Reason fornot attending
Disability or illness
Cannot afford
Work
Couldn’t register
Reason fornot attending
Disability or illness (%)
Cannot afford (%)
Work (%)
Insecurity/bullying (%)
Couldn’t register (%)
Cash or in-kind help received from an organization other than UNRWA
7.9
1.9
3.1
15.3
62.4*
49.7
35.1**
68.1
35.3
37.6*
50.4
64.7**
31.9
64.7
100.0
100.0
100.0
100.0
100.0
6.2
1.5
3.1
0.2
2.6
4.3
3.0
5.6
83.4
92.3
90.9
78.9
100
100
100
100
Yes,Cash
SSN No TOTAL
Yes,in-kind
Yes, Cash& in-kind
No TOTAL
TABLE 17: REASON FOR NON-ATTENDANCE BY FINANCIAL ASSISTANCE CATEGORY FOR PRL
TABLE 18: REASON FOR NON-ATTENDANCE BY FINANCIAL ASSISTANCE CATEGORY FOR PRL
85 United Nations Relief and Works Agency. (2013). UNRWA school dropout: An agency wide study.86 Non-attendance includes those children of school age who did not enroll in the current school year or who enrolled but dropped out or are simply not attending classes.87 Social Safety Net is the program that assesses households against the Proxy Means Test Formula (PMTF) to rank their poverty levels and prioritize those most vulnerable households for assistance.
respondents who do not attend school because they cannot afford to, or due to security and bullying concerns.
On the other hand, SSN is relatively rare among respondents who list work as the primary reason for non-attendance.
Similarly, and perhaps unsurprisingly, the percentage of Social Safety Net (SSN)87 among respondents who list disability or illness as a reason for non-attendance is significantly higher than the proportion of SSN in the overall population. There is a similar concentration of SSN among
This could be an indication that the assistance received through the SSN programme is sparing families from having to send children and youth of school age into the workforce.
CHAPTER THREE // EDUCATION ACCESS AND ATTAINMENT OF PALESTINE REFUGEES IN LEBANON74
Denotes significance at the 1% level,Denotes significance at the 5% level andDenotes significance at the 10% level using Pearson’s chi-squared test.
******
Denotes significance at the 1% level,Denotes significance at the 5% level andDenotes significance at the 10% level using Pearson’s chi-squared test.
******
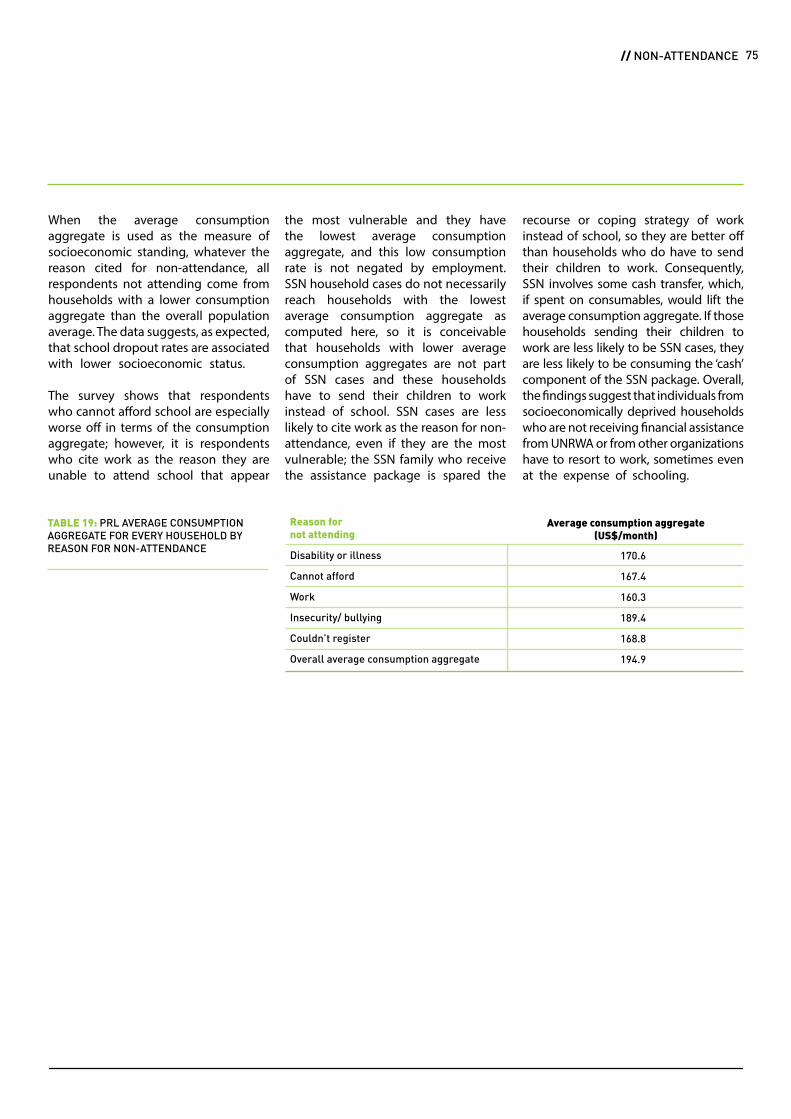
When the average consumption aggregate is used as the measure of socioeconomic standing, whatever the reason cited for non-attendance, all respondents not attending come from households with a lower consumption aggregate than the overall population average. The data suggests, as expected, that school dropout rates are associated with lower socioeconomic status.
The survey shows that respondents who cannot afford school are especially worse off in terms of the consumption aggregate; however, it is respondents who cite work as the reason they are unable to attend school that appear
the most vulnerable and they have the lowest average consumption aggregate, and this low consumption rate is not negated by employment. SSN household cases do not necessarily reach households with the lowest average consumption aggregate as computed here, so it is conceivable that households with lower average consumption aggregates are not part of SSN cases and these households have to send their children to work instead of school. SSN cases are less likely to cite work as the reason for non-attendance, even if they are the most vulnerable; the SSN family who receive the assistance package is spared the
recourse or coping strategy of work instead of school, so they are better off than households who do have to send their children to work. Consequently, SSN involves some cash transfer, which, if spent on consumables, would lift the average consumption aggregate. If those households sending their children to work are less likely to be SSN cases, they are less likely to be consuming the ‘cash’ component of the SSN package. Overall, the findings suggest that individuals from socioeconomically deprived households who are not receiving financial assistance from UNRWA or from other organizations have to resort to work, sometimes even at the expense of schooling.
Reason fornot attending
Disability or illness
Cannot afford
Work
Insecurity/ bullying
Couldn’t register
Overall average consumption aggregate
170.6
167.4
160.3
189.4
168.8
194.9
Average consumption aggregate(US$/month)
TABLE 19: PRL AVERAGE CONSUMPTION AGGREGATE FOR EVERY HOUSEHOLD BY REASON FOR NON-ATTENDANCE
75 // NON-ATTENDANCE
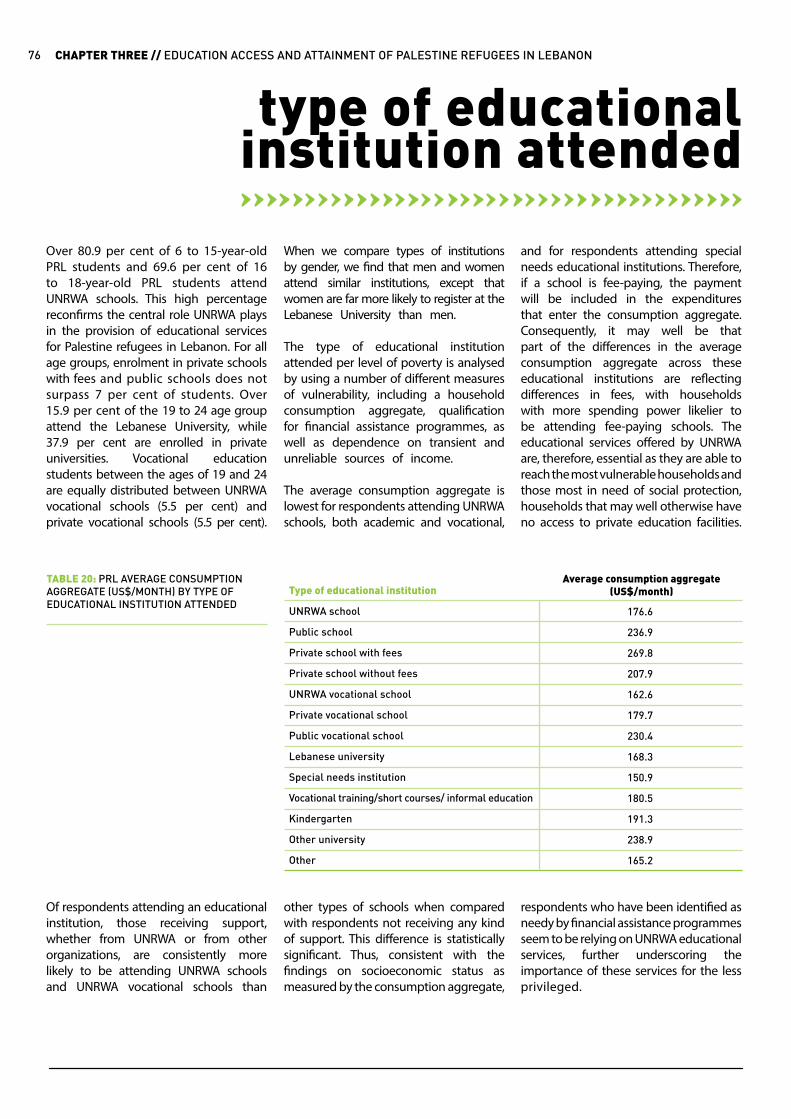
When we compare types of institutions by gender, we find that men and women attend similar institutions, except that women are far more likely to register at the Lebanese University than men.
The type of educational institution attended per level of poverty is analysed by using a number of different measures of vulnerability, including a household consumption aggregate, qualification for financial assistance programmes, as well as dependence on transient and unreliable sources of income.
The average consumption aggregate is lowest for respondents attending UNRWA schools, both academic and vocational,
other types of schools when compared with respondents not receiving any kind of support. This difference is statistically significant. Thus, consistent with the findings on socioeconomic status as measured by the consumption aggregate,
Over 80.9 per cent of 6 to 15-year-old PRL students and 69.6 per cent of 16 to 18-year-old PRL students attend UNRWA schools. This high percentage reconfirms the central role UNRWA plays in the provision of educational services for Palestine refugees in Lebanon. For all age groups, enrolment in private schools with fees and public schools does not surpass 7 per cent of students. Over15.9 per cent of the 19 to 24 age group attend the Lebanese University, while 37.9 per cent are enrolled in private universities. Vocational education students between the ages of 19 and 24 are equally distributed between UNRWA vocational schools (5.5 per cent) and private vocational schools (5.5 per cent).
Of respondents attending an educational institution, those receiving support, whether from UNRWA or from other organizations, are consistently more likely to be attending UNRWA schools and UNRWA vocational schools than
and for respondents attending special needs educational institutions. Therefore, if a school is fee-paying, the payment will be included in the expenditures that enter the consumption aggregate. Consequently, it may well be that part of the differences in the average consumption aggregate across these educational institutions are reflecting differences in fees, with households with more spending power likelier to be attending fee-paying schools. The educational services offered by UNRWA are, therefore, essential as they are able to reach the most vulnerable households and those most in need of social protection, households that may well otherwise have no access to private education facilities.
respondents who have been identified as needy by financial assistance programmes seem to be relying on UNRWA educational services, further underscoring the importance of these services for the less privileged.
type of educationalinstitution attended
Type of educational institution
UNRWA school
Public school
Private school with fees
Private school without fees
UNRWA vocational school
Private vocational school
Public vocational school
Lebanese university
Special needs institution
Vocational training/short courses/ informal education
Kindergarten
Other university
Other
176.6
236.9
269.8
207.9
162.6
179.7
230.4
168.3
150.9
180.5
191.3
238.9
165.2
Average consumption aggregate(US$/month)
TABLE 20: PRL AVERAGE CONSUMPTION AGGREGATE (US$/MONTH) BY TYPE OF EDUCATIONAL INSTITUTION ATTENDED
CHAPTER THREE // EDUCATION ACCESS AND ATTAINMENT OF PALESTINE REFUGEES IN LEBANON76
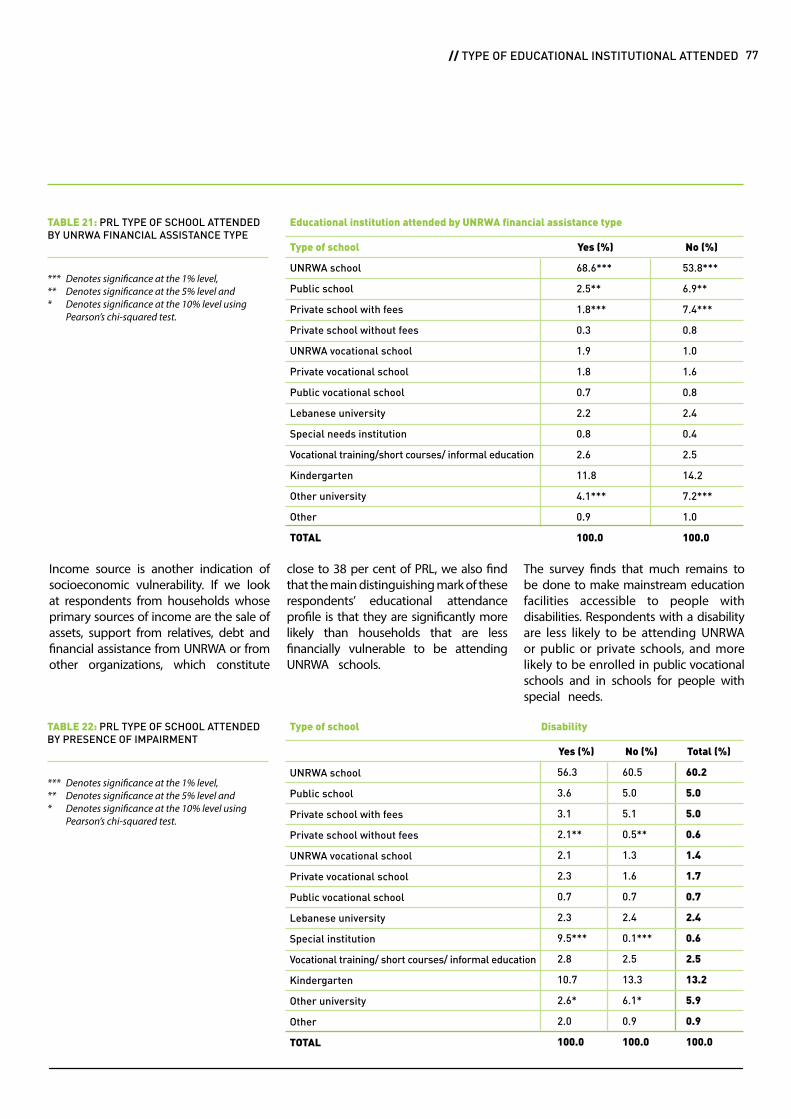
close to 38 per cent of PRL, we also find that the main distinguishing mark of these respondents’ educational attendance profile is that they are significantly more likely than households that are less financially vulnerable to be attending UNRWA schools.
Income source is another indication of socioeconomic vulnerability. If we look at respondents from households whose primary sources of income are the sale of assets, support from relatives, debt and financial assistance from UNRWA or from other organizations, which constitute
The survey finds that much remains to be done to make mainstream education facilities accessible to people with disabilities. Respondents with a disability are less likely to be attending UNRWA or public or private schools, and more likely to be enrolled in public vocational schools and in schools for people with special needs.
Type of school
UNRWA school
Public school
Private school with fees
Private school without fees
UNRWA vocational school
Private vocational school
Public vocational school
Lebanese university
Special needs institution
Vocational training/short courses/ informal education
Kindergarten
Other university
Other
TOTAL
Educational institution attended by UNRWA financial assistance type
Yes (%)
68.6***
2.5**
1.8***
0.3
1.9
1.8
0.7
2.2
0.8
2.6
11.8
4.1***
0.9
100.0
No (%)
53.8***
6.9**
7.4***
0.8
1.0
1.6
0.8
2.4
0.4
2.5
14.2
7.2***
1.0
100.0
TABLE 21: PRL TYPE OF SCHOOL ATTENDEDBY UNRWA FINANCIAL ASSISTANCE TYPE
Type of school
UNRWA school
Public school
Private school with fees
Private school without fees
UNRWA vocational school
Private vocational school
Public vocational school
Lebanese university
Special institution
Vocational training/ short courses/ informal education
Kindergarten
Other university
Other
TOTAL
Disability
Yes (%)
56.3
3.6
3.1
2.1**
2.1
2.3
0.7
2.3
9.5***
2.8
10.7
2.6*
2.0
100.0
Total (%)
60.2
5.0
5.0
0.6
1.4
1.7
0.7
2.4
0.6
2.5
13.2
5.9
0.9
100.0
No (%)
60.5
5.0
5.1
0.5**
1.3
1.6
0.7
2.4
0.1***
2.5
13.3
6.1*
0.9
100.0
TABLE 22: PRL TYPE OF SCHOOL ATTENDED BY PRESENCE OF IMPAIRMENT
77 // TYPE OF EDUCATIONAL INSTITUTIONAL ATTENDED
Denotes significance at the 1% level,Denotes significance at the 5% level andDenotes significance at the 10% level using Pearson’s chi-squared test.
******
Denotes significance at the 1% level,Denotes significance at the 5% level andDenotes significance at the 10% level using Pearson’s chi-squared test.
******

The educational institutions attended by children of female-headed households also tend to be different. They are less likely to be attending UNRWA schools, and more likely to be attending public schools as well as vocational schools. They are also significantly more likely to attend private universities rather than the public Lebanese University.
The survey found that nearly half the students attending UNRWA schools and vocational schools were from SSN households, and close to 10 per cent receive cash assistance from organizations other than UNRWA. This figure is much higher than UNRWA enrolment records for 2014/1588 where 23 per cent of students enrolled in UNRWA schools or vocation training
centres were SSN cases. Regarding students from special needs schools, the percentage from SSN households is much higher in all grades. It should also be noted that about 40 per cent of all PRL attending the Lebanese University and about 30 per cent of PRL attending other universities reported that they were part of the SSN. The percentage of students who are SSN is 47.9 per cent.
that UNRWA educational services plays in providing education to a segment of the PRL population that may otherwise have no other educational recourse to depend on.
Similarly, all respondents who attend UNRWA vocational schools have a lower average consumption aggregate
This section takes a closer look at UNRWA establishments providing educational services. The average consumption aggregate of respondents who attend UNRWA schools (US$ 176.6 per month) is substantially lower than the overall average (US$ 194.9 per month), confirming the finding reported above about the essential role
(US$ 162.6 per month) than the mean for Palestine refugees (US$ 194.9 per month). While close to 12 per cent of respondents at UNRWA vocational schools receive cash or in-kind support from organizations other than UNRWA, over 57 per cent of respondents attending UNRWA vocational schools are Social Hardship Cases (SHC).
unrwa schools
88 In the 2014/15 academic year, of 38,173 students in UNRWA schools, 8,736 were SSN and of the 1,102 students in UNRWA vocational training centre, 389 were SSN cases.
CHAPTER THREE // EDUCATION ACCESS AND ATTAINMENT OF PALESTINE REFUGEES IN LEBANON78

89 Percentage of people aged 15+ who do not read and write.90 In Lebanon, upon completion of Grade 9 (end of the basic cycle of educations) students sit for the Lebanese official Brevet Exam, with those who pass awarded the Brevet Certificate, and able to progress to Secondary education.91 The adult literacy rate is the percentage of the population aged 15 and above, who can read and write. This was reported by the proxy respondent on behalf of household members. Illiteracy is calculated by dividing the number of people who cannot read and write aged 15 years and over by the corresponding age group population and multiplying the result by 100.
About 69.9 per cent of PRL above the age of 25 do not have a Brevet certificate90 – around 11.7 per cent of whom never went to school. The share of Baccalaureate degree holders is 11.9 per cent, and university degree holders are 6.2 per cent
Approximately 62.8 per cent of the population over 15 years of age do not hold a Brevet compared to two thirds in 2010. As for those above 18, 15.2 per cent have a Baccalaureate degree compared to 14 per cent in 2010, while 6 per cent have a vocational degree, similar to 2010.
compared to 5.0 per cent in 2010. With respect to gender, the share of females that never attended school is higher than males (15.8 per cent compared to 6.7 per cent), and those who do not hold Brevet degrees is higher than males
The illiteracy rate91 is at 7.9 percent, varying between 11.3 per cent among females and 4.1 per cent among males. Illiteracy is an age-related phenomenon, where the rate is highest among those
(71.6 per cent compared to 67.7 per cent). Geographically, Tyre has a higher PRL rate of population without a Brevet (at 73.9 per cent), coupled with the lowest share of those that hold the Baccalaureate (at 9 per cent).
above the age of 65 (42.1 per cent). The rate also varies by region, with the Beqaa having the lowest rate, 6.2 per cent, and Tyre the highest at 8.4 per cent.
educational attainmentand illiteracy89
Highest level of schooling achieved
Never Attended (%)
Elementary – Not completed (%)
Elementary – completed (%)
Preparatory – No Brevet (%)
Preparatory – Brevet (%)
Secondary – Without Baccalaureate (%)
Secondary – With Baccalaureate (%)
Vocational or Technical – without Certificate (%)
Vocational or Technical – with Certificate (%)
University – without Degree (%)
University – with Degree (%)
University – Post Graduate (%)
TOTAL (%)
11.7
30.7***
6.0
23.8
7.0***
5.8
2.8***
0.6**
3.6
2.3
5.3**
0.4*
100
CLA Saida Tyre Beqaa NLA TOTAL
10.5
23.5***
6.7
23.9
9.9***
5.0
5.9***
1.0**
5.0
2.1
5.8**
0.6*
100
12.39
25.3***
5.9
30.3
5.8***
6.4
2.5***
1.3**
3.6
2.5
3.8**
0.2*
100
12.7
21.5***
7.3
27.6
5.3***
6.4
2.7***
0.2**
4.9
2.1
8.1**
1.2*
100
9.374
20.3***
7.7
26.7
8.6***
8.3
3.7***
0.4**
4.7
3.5
6.5**
0.3*
100
11.7
25.3
6.5
26.4
7.1
6.0
3.5
0.8
4.2
2.3
5.6
0.5
100
TABLE 23: PRL HIGHEST LEVEL OF SCHOOLING ACHIEVED BY LOCATION 2015 (ABOVE 25 YEARS OF AGE)
79 // EDUCATIONAL ATTAINMENT AND ILLITERACY
Denotes significance at the 1% level,Denotes significance at the 5% level andDenotes significance at the 10% level using Pearson’s chi-squared test.
******
In conclusion, PRL dropout rates have decreased and enrolment rates have risen since 2010. PRL secondary-level enrolment has witnessed an encouraging jump by 10 percentage points from 2010, while primary cycles have enrolment rates of 97 per cent. Similar to the Poverty Chapter Two finding, PRL that have attained higher education levels and those who attend school are financially better off.
conclusion
© 2012 Dani Bradford / IFPRI

Access to Work and Decent Working Conditions for Palestine Refugees in Lebanonlara batlouni, alexandra irani
CHAPTERFOUR
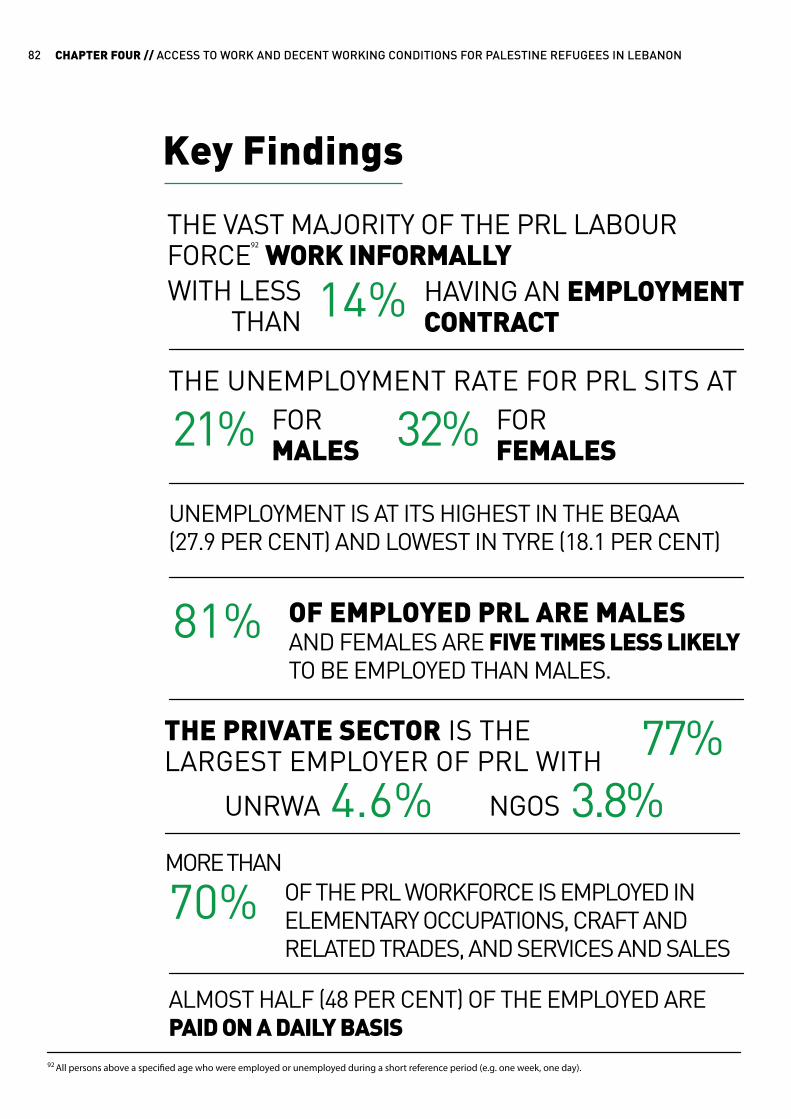
Key Findings
THE VAST MAJORITY OF THE PRL LABOUR FORCE
92
WORK INFORMALLYHAVING AN EMPLOYMENT CONTRACT
WITH LESSTHAN 14%
THE PRIVATE SECTOR IS THE LARGEST EMPLOYER OF PRL WITH
OF EMPLOYED PRL ARE MALESAND FEMALES ARE FIVE TIMES LESS LIKELY TO BE EMPLOYED THAN MALES.
OF THE PRL WORKFORCE IS EMPLOYED IN ELEMENTARY OCCUPATIONS, CRAFT AND RELATED TRADES, AND SERVICES AND SALES
81%
70%
UNEMPLOYMENT IS AT ITS HIGHEST IN THE BEQAA(27.9 PER CENT) AND LOWEST IN TYRE (18.1 PER CENT)
ALMOST HALF (48 PER CENT) OF THE EMPLOYED ARE PAID ON A DAILY BASIS
MORE THAN
THE UNEMPLOYMENT RATE FOR PRL SITS ATFORMALES
FORFEMALES21%
77%
32%
UNRWA NGOS4.6% 3.8%
92 All persons above a specified age who were employed or unemployed during a short reference period (e.g. one week, one day).
CHAPTER FOUR // ACCESS TO WORK AND DECENT WORKING CONDITIONS FOR PALESTINE REFUGEES IN LEBANON82

THE MAIN SOURCE OF INCOME FOR PRL IS SELF-EMPLOYMENT
OF HOUSEHOLDS REPORTED LOANS TO BE ONE OF THEIR SOURCES OF INCOME
SECOND SOURCE OF INCOME IS WAGE LABOUR
FOLLOWED BY UNRWA ASSISTANCE THROUGH THE SSN PROGRAMME
ARE EMPLOYED
41%
36%
38%33.5%
REMITTANCES REPRESENT A SOURCE OF INCOME FOR 18 PER CENT OF HOUSEHOLDS
OF BREVET HOLDERS
OF THE EMPLOYED PRL DO NOT HAVE CONTRACTS, AND ONLY 6.0 PER CENT HOLD WORK PERMITS
AROUND
OF BACCALAUREATE HOLDERS
OF VOCATIONAL/UNIVERSITY DEGREE HOLDERS
33%
86.5%
42%55%
Higher levels of education contribute to securing decent jobs, where 76 per cent of PRL employed in professional posts hold a university degree.
83 // KEY FINDINGS
OF THOSE AGED 21 AND ABOVE
Since 2005, Palestine refugees have been granted the right to practice in about 70 professions that were previously prohibited to them, being restricted to Lebanese nationals only. By virtue of Article 3 of the Ministerial Decision promulgated on a regular basis by the Minister of Labour93, Palestine refugees have been granted the right to practise these professions based on the decisions of consecutive Ministers of Labour since 2005.
However, Palestine refugees are still prohibited from practising several professions due to either the precondition of holding Lebanese nationality, or having to meet the reciprocity of treatment condition in order to access the profession, a condition that remains impossible to meet in light of the current circumstances linked to the establishment of the State of Palestine. It is noteworthy that in some cases Palestine refugees were able to obtain some sort of certification that allowed them to work in the 36 professions of restricted access for Palestine refugees in Lebanon; however those remain in general breach of rules that cannot be used as reference.94 A Palestine refugee who wishes to work in Lebanon in any of the allowed professions must obtain a work permit. To apply for a work permit, the following documents are required:
For the employee:a work contract signed by him/her and his/her employer a Palestine refugee registration card employer’s documents (identity card – commercial registration and notification) evidence of declaration to the National Social Security Fund (NSSF).
For the employer:a Palestine refugee registration card articles of incorporationcommercial registration and notificationevidence showing that he/she employs at least three Lebanese with his/her share of the capital being at least LBP 10 million (US$ 6,666.7).
Applications for work permits under Category One (employers and employees whose salaries are three times the minimum wage and above) require the approval of the Minister of Labour. As for applications for work permits under Category Two (a salary that is between double and three times the minimum wage) and under category three (a salary ranging between the minimum wage and its double), they require the approval of the Director General of the Ministry of Labour.
Renewal of those work permits requires the approval of the head of the department with the exception of the work permits under Category One.
Following the issuance of Law no. 129 of 2010, work permits for Palestine refugees became free of charge. As for work permits for employers, they remained at 25 per cent of the usual fees i.e. around LBP 450,000 (US$ 300). Additionally, Palestine refugees were exempted from the reciprocity of treatment condition stipulated by Article 59 of the Labour Law with regards to obtaining compensation in-lieu of dismissal and for arbitrary dismissal.
Following the issuance of Law no. 128 in 2010, Palestine refugees became eligible to end of service indemnities
(8.5 per cent), but not the sickness and maternity fund (9 per cent of which2 per cent are covered by the employee), nor the family allowances fund (6 per cent), provided they hold work permits.
Registering with the National Social Security Fund is another requirement for obtaining a work permit. It is avoided by employers given that the contributions to the fund are not commensurate with the benefits workers obtain since they only have access to the end-of-service indemnity and are excluded from health coverage or maternity benefits. In addition, despite being free of charge for PRL, work permits have to be renewed on a yearly basis, which creates another disincentive.
The presence of Syrian refugees and Palestine refugees from Syria is highly likely to be a factor contributing to an increase in unemployment rates among PRL due to higher competition for the already limited pool of low-skill jobs and elementary occupations. Efforts to integrate Palestine refugees into the Lebanese labour market are crucial to improve the social and economic well-being of refugees and to contribute to the economy and stability of Lebanon as a whole.
93 Can be reviewed via the following link http://bit.ly/1Gdz7hj.94 Khazaal for UNRWA (ENPI-Fund), ‘Professions of Restricted Access for Palestine Refugees in Lebanon’. Labour Market and Research Development Quarterly Update (LMRD), issue. 2, October 2015.
CHAPTER FOUR // ACCESS TO WORK AND DECENT WORKING CONDITIONS FOR PALESTINE REFUGEES IN LEBANON84

95 International Labour Organization. (2012). Palestinian employment in Lebanon facts and challenges: Labour force survey among Palestinian refugees living in camps and gatherings In Lebanon. Retrieved February 2, 2016, from http://goo.gl/pXRvk9.96 The labour force participation rate is defined as the share of the labour force (employed + unemployed) aged 15 years and above out of the working age population. 97 Central Administration of Statistics. (2004). Living conditions of households. Retrieved from http://goo.gl/eusmxz.
after which the rate decreases gradually. The rate is significantly lower for the 15 to 24 age category, at 38.5 per cent, which could be due to school and university enrolment.
The LFPR rate peaks in CLA at 44.9 per centcompared to a significantly lower 39.9 per cent in the Beqaa, which could be attributed to the limited work
The PRL labour force remains constant when compared to ILO 2012 Labour Force Survey findings,95 at around 80,000 workers. The Labour Force Participation Rate96 (LFPR) of 41.8 per cent also registers no change from 2012 ILO findings and is comparable to the Lebanese rate of 43 per cent.97 The LFPR peaks at the25 to 34 age category at 58.2 per cent
opportunities in the Beqaa compared to Beirut. The LFPR conceals notable gender disparity, where the female rate reaches a low of 16.9 per cent, while that of males is 69.2 per cent. The significantly lower female LFPR may be related to cultural factors and family obligations. These reasons were mentioned by over half of the surveyed women.
economic activity
MALE FEMALE CLA TYRE SAIDA NLA BEQAA TOTAL
69.2
16.9
44.9 41.1 41 40.1 39.9 41.8
FIGURE 12: PRL LABOUR FORCE PARTICIPATION RATE BY GENDER AND LOCATION (PER CENT)
85 // ECONOMIC ACTIVITY

This figure conceals notable gender disparity, where the female rate registers 32.4 per cent while that of males is20.8 per cent. Geographical variation is also noted, with unemployment reaching highest in the Beqaa (27.9 per cent)
The unemployment rate98 among PRL was comparable to the Lebanese rate of 8 per cent both in 2010 and 2012,99 however 2015 survey findings indicate a significant increase to 23.2 per cent.
The unemployment spell – the number of months spent unemployed and looking for work – increased to 9.3 months compared to 6.0 months in 2012. Unemployment duration is higher for females (10.3 months) than for males (8.9 months). It is higher for the 25 to 34 age bracket (11.7 months) than for the 15 to 24 (8.7 months) and 35 to 54 (over 7 months) age categories. The rate also varies by region, with Saida having the longest spell at 11.6 months and Tyre the shortest at 7.0 months.
and lowest in Tyre (18.1 per cent). Unemployment also disproportionally affects the youth who experience the highest rates of unemployment among all age categories (36.4 per cent).
unemployment
MALE FEMALE BEQAA CLA NLA SAIDA TYRE TOTAL
54.8
11.5
28.832.5
29.3 32.7 33.623.2
FIGURE 13: PRL UNEMPLOYMENT RATE BY GENDER AND LOCATION (PER CENT)
98 The unemployment rate is defined as the number of unemployed (have not worked last week and were actively looking for a job) divided by the labour force (employment + unemployment).99 International Labour Organization. (2012). Palestinian employment in Lebanon facts and challenges: Labour force survey among Palestinian refugees living in camps and gatherings In Lebanon. Retrieved February 2, 2016, from http://goo.gl/pXRvk9.
CHAPTER FOUR // ACCESS TO WORK AND DECENT WORKING CONDITIONS FOR PALESTINE REFUGEES IN LEBANON86
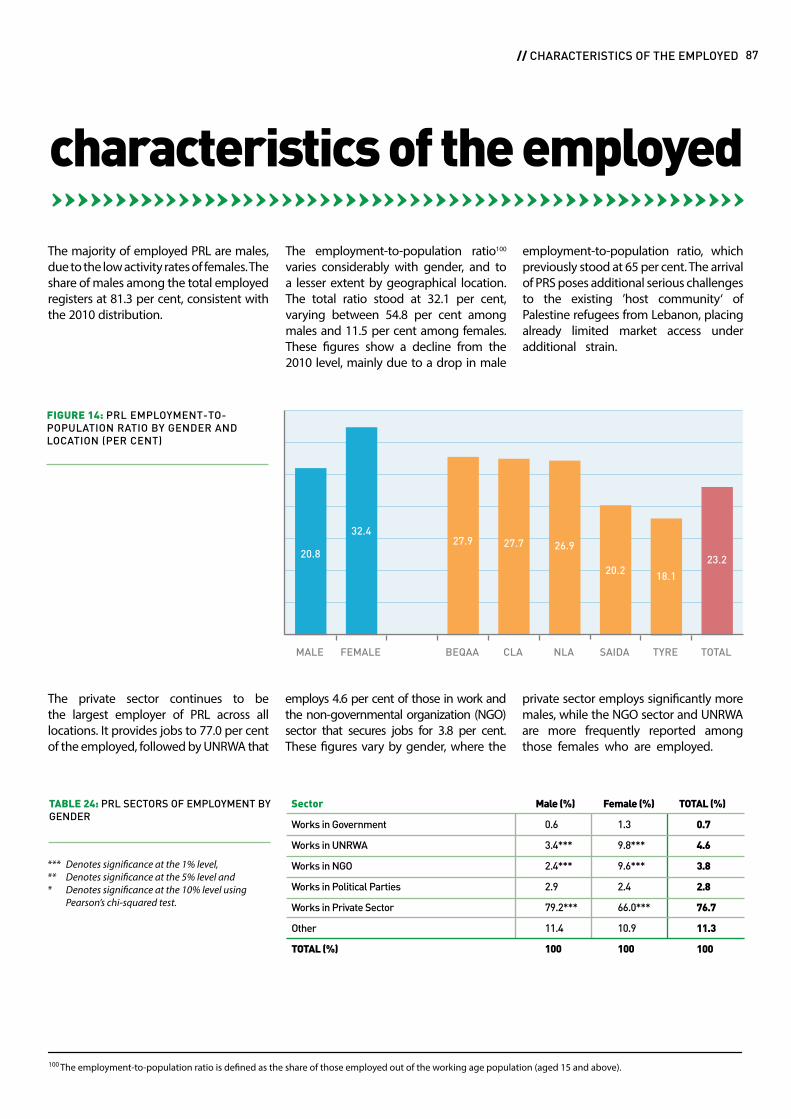
The employment-to-population ratio100 varies considerably with gender, and to a lesser extent by geographical location. The total ratio stood at 32.1 per cent, varying between 54.8 per cent among males and 11.5 per cent among females. These figures show a decline from the 2010 level, mainly due to a drop in male
The majority of employed PRL are males, due to the low activity rates of females. The share of males among the total employed registers at 81.3 per cent, consistent with the 2010 distribution.
The private sector continues to be the largest employer of PRL across all locations. It provides jobs to 77.0 per cent of the employed, followed by UNRWA that
employs 4.6 per cent of those in work and the non-governmental organization (NGO) sector that secures jobs for 3.8 per cent. These figures vary by gender, where the
private sector employs significantly more males, while the NGO sector and UNRWA are more frequently reported among those females who are employed.
employment-to-population ratio, which previously stood at 65 per cent. The arrival of PRS poses additional serious challenges to the existing ’host community‘ of Palestine refugees from Lebanon, placing already limited market access under additional strain.
characteristics of the employed
MALE FEMALE BEQAA CLA NLA SAIDA TYRE TOTAL
20.8
32.427.9 27.7 26.9
20.2 18.1
23.2
FIGURE 14: PRL EMPLOYMENT-TO-POPULATION RATIO BY GENDER AND LOCATION (PER CENT)
100 The employment-to-population ratio is defined as the share of those employed out of the working age population (aged 15 and above).
Sector
Works in Government
Works in UNRWA
Works in NGO
Works in Political Parties
Works in Private Sector
Other
TOTAL (%)
0.6
3.4***
2.4***
2.9
79.2***
11.4
100
Male (%) Female (%) TOTAL (%)
1.3
9.8***
9.6***
2.4
66.0***
10.9
100
0.7
4.6
3.8
2.8
76.7
11.3
100
TABLE 24: PRL SECTORS OF EMPLOYMENT BY GENDER
87 // CHARACTERISTICS OF THE EMPLOYED
Denotes significance at the 1% level,Denotes significance at the 5% level andDenotes significance at the 10% level using Pearson’s chi-squared test.
******

Parallel to prevalence of employment in the private sector, across all five areas the vast majority of those employed work in non-family businesses. While 68.3 per cent of the employed are ’paid for work in a non-family business’, being self-employed comes second with 18.7 per cent of the total. Some variations are noted based on gender, where being self-employed is more prevalent among males (20.2 per cent compared to 12.1 per cent of females), and being a paid worker in a non-family business is more dominant among females (77.6 per cent compared to 66.2 per cent of males).
Over half the workforce in Tyre (51.9 per cent) is employed in elementary occupations, namely in the agricultural sector according to 2010 findings, whereas the share does not exceed a third of the workforce in the remaining regions. The Beqaa (17.1 per cent) and NLA (16.7 per cent) have the highest share of high status employment, namely senior officials and managers, professionals, technicians and associate professionals; whereas in Tyre, only 11.4 per cent of workers fall under these categories.
Looking into employment from an occupational angle, data shows that the three categories of ‘elementary occupations‘ such as street vendors, shoe shiners, domestic helpers and doorkeepers, ’craft and related trades‘ and ’services and sales workers‘ hold more than 70 per cent of total employed PRL. Less than a third of Palestinians are craft and related trade workers or machine operators compared to 46 per cent in 2010. The percentage of PRL who work in elementary occupations increased from 23.0 per cent in 2010 to 36.4 per cent, which signals a transition
of a portion of the workforce to lower level and lower pay jobs.
Occupations are gender segregated, where ’services workers‘ are more prevalent among females, while ’elementary occupations‘ and ’crafts‘ are more present among males. Interestingly, the share of females working as ’professionals‘ and ’clerks‘ is more than four times the share of males, which could be explained by the larger share of women who work in NGOs and UNRWA.
Occupation
Legislators, senior officials and managers
Professionals
Technicians and associate professionals
Clerks
Service workers and shop and market sales workers
Skilled agricultural and fishery workers
Craft and related trades workers
Plant and machine operators and assemblers
Elementary occupations
TOTAL (%)
0.4
5.2***
3.5***
2.7***
12.7**
2.6***
24.5***
9.9***
38.6***
100
Male (%) Female (%) TOTAL (%)TOTAL
2010 (%)
0.4
20.4***
12.5***
13.1***
16.7**
0.6***
9.2***
0.1***
27.1***
100
0.4
8.1***
5.2***
4.6***
13.4**
2.3***
21.6***
8.1***
36.4***
100
11
5
15
0.4
46
23
100
TABLE 25: PRL OCCUPATION BY GENDER
Occupation
Legislators, senior officials and managers
Professionals
Technicians and associate professionals
Clerks
Service workers and shop and market sales workers
Skilled agricultural and fishery workers
Craft and related trades workers
Plant and machine operators and assemblers
Elementary occupations
Total (%)
0.5
7.0***
6.3
6.9***
12.9
0.8***
24.0***
11.0***
30.6***
100
CLA(%)
Saida(%)
Tyre(%)
Beqaa(%)
NLA(%)
TOTAL(%)
0.6
8.4***
4.0
4.1***
15.5
1.2***
24.8***
9.8***
31.5***
100
0.2
5.6***
5.6
2.5***
10.5
4.9***
13.8***
5.1***
51.9***
100
0.1
12.7***
3.9
5.2***
14.7
2.0***
24.5***
6.2***
30.7***
100
0.0
8.1***
9.0
6.3***
17.3
0.9***
26.8***
7.8***
23.9***
100
0.4
8.1
5.2
4.6
13.4
2.3
21.6
8.1
36.4
100
TABLE 26: PRL OCCUPATION BY LOCATION
CHAPTER FOUR // ACCESS TO WORK AND DECENT WORKING CONDITIONS FOR PALESTINE REFUGEES IN LEBANON88
Denotes significance at the 1% level,Denotes significance at the 5% level andDenotes significance at the 10% level using Pearson’s chi-squared test.
******
Denotes significance at the 1% level,Denotes significance at the 5% level andDenotes significance at the 10% level using Pearson’s chi-squared test.
******

Palestine refugees with better education are more likely to be employed. In the age bracket above 20, 33.2 per cent of Brevet holders are employed compared to 42.1 per cent of Baccalaureate holders and 55.0 per cent of vocational degree and university degree holders. These figures indicate that continued education increases the chances of employment. The impact of education on female employment is even more pronounced with over half of the women with a university degree working compared to 13.5 per cent of those with a Baccalaureate degree and 9.5 per cent of those with a Brevet degree.
The majority of the employed (86.5 per cent)do not hold a contract and are only bound to their job through an oral agreement with their employers. This
Focus group discussions showed that many interviewed PRL households did not know what a work permit was or were not aware they had an obligation and right to obtain one. This lack of awareness could explain why 6 per cent of workers were found
Higher levels of education can also contribute to obtaining better jobs. More than three quarters of employed individuals with a university degree (76 per cent) work as professionals or associated professionals, while those holding a Brevet or less mainly work in crafts and elementary occupations. Hence, major strides need to be taken to equip the Palestinian labour force with higher educational attainment because less than one tenth (9.5 per cent) holds a university degree compared to 20 per cent of the Lebanese labour force.
figure, however, conceals gender differences, where the availability of contracts (whether or not officiated by a public notary) is significantly more
to hold a work permit compared to the 2 per cent reported in both the ILO 2012 survey and the UNRWA 2010 report findings. In reality, 3.3 per cent of workers, at most, can possibly hold a work permit since this is the percentage of the employed
Most refugees who manage to obtain a job work in casual and precarious employment. This survey shows that 8.2 per cent of employed refugees work in seasonal employment and over a third (37.4 per cent) work on a by piece/service basis.
Almost half of the employed (47.7 per cent) are paid on a daily basis – in line with the fact that most of the employed work in ’elementary occupations’. The monthly payment basis is significantly higher for females, which could be explained by the fact that women are more present in UNRWA and the NGO sector.
common among females (27.5 per cent versus 10.1 per cent among males).
who have an official contract, a key required document to apply for a permit. In addition, 34.0 per cent believe that they are not able to comply with the requirements of the permit, while another 26.8 per cent see no benefit from it.
Payment basis
Daily
Weekly
Monthly
By Piece
TOTAL
47.5
11.5
11.2**
29.8
100
Male (%) Female (%) TOTAL (%)
49.6
6.1
19.1**
25.2
100
47.7
10.8
12.2
29.2
100
TABLE 27: PRL PAYMENT BASIS BY GENDER
Availability of contract
Contract, officiated by a public notary
Contract, but not officiated by a public notary
No contract, oral agreement
TOTAL
2.5***
7.6***
89.9***
100
Male (%) Female (%) TOTAL (%)
6.4***
21.1***
72.6***
100
3.3
10.3
86.5
100
TABLE 28: PRL AVAILABILITY OF CONTRACTBY GENDER
89 // CHARACTERISTICS OF THE EMPLOYED
Denotes significance at the 1% level,Denotes significance at the 5% level andDenotes significance at the 10% level using Pearson’s chi-squared test.
******
Denotes significance at the 1% level,Denotes significance at the 5% level andDenotes significance at the 10% level using Pearson’s chi-squared test.
******
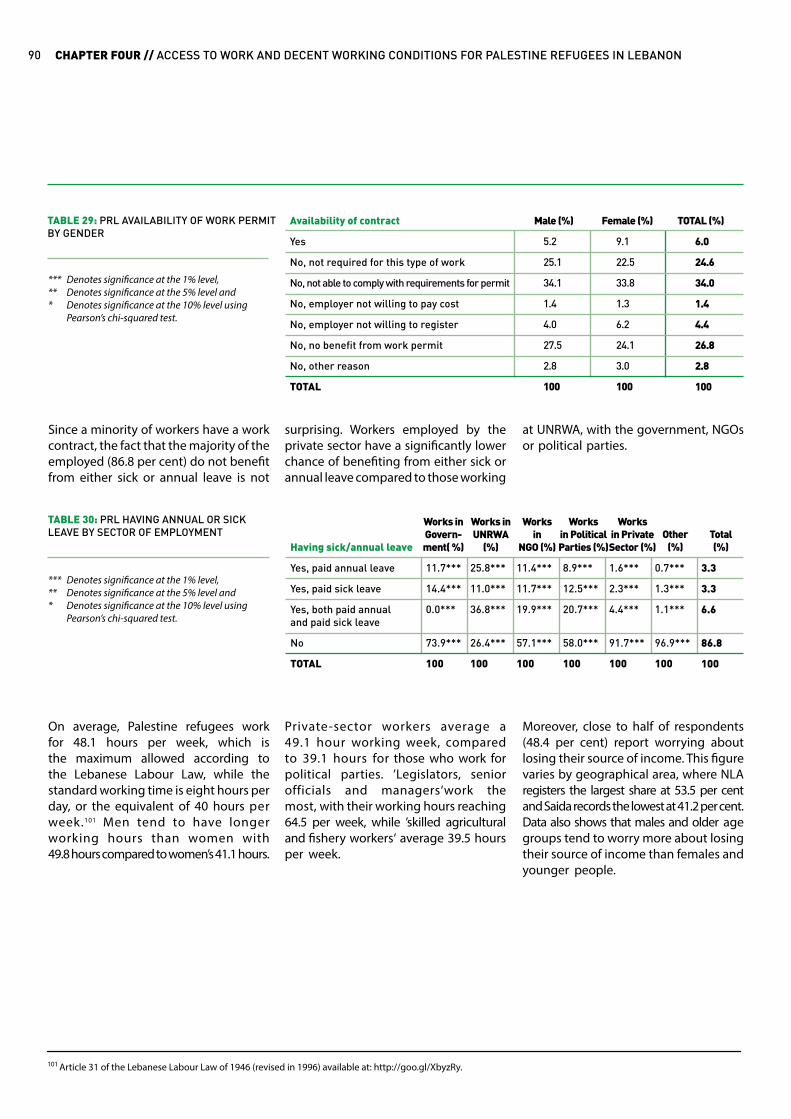
Availability of contract
Yes
No, not required for this type of work
No, not able to comply with requirements for permit
No, employer not willing to pay cost
No, employer not willing to register
No, no benefit from work permit
No, other reason
TOTAL
5.2
25.1
34.1
1.4
4.0
27.5
2.8
100
Male (%) Female (%) TOTAL (%)
9.1
22.5
33.8
1.3
6.2
24.1
3.0
100
6.0
24.6
34.0
1.4
4.4
26.8
2.8
100
TABLE 29: PRL AVAILABILITY OF WORK PERMIT BY GENDER
Since a minority of workers have a work contract, the fact that the majority of the employed (86.8 per cent) do not benefit from either sick or annual leave is not
surprising. Workers employed by the private sector have a significantly lower chance of benefiting from either sick or annual leave compared to those working
at UNRWA, with the government, NGOs or political parties.
Having sick/annual leave
Yes, paid annual leave
Yes, paid sick leave
Yes, both paid annualand paid sick leave
No
TOTAL
11.7***
14.4***
0.0***
73.9***
100
25.8***
11.0***
36.8***
26.4***
100
11.4***
11.7***
19.9***
57.1***
100
8.9***
12.5***
20.7***
58.0***
100
1.6***
2.3***
4.4***
91.7***
100
0.7***
1.3***
1.1***
96.9***
100
3.3
3.3
6.6
86.8
100
Works inGovern-ment( %)
Works inUNRWA
(%)
Worksin
NGO (%)
Worksin Political Parties (%)
Worksin PrivateSector (%)
Other(%)
Total(%)
TABLE 30: PRL HAVING ANNUAL OR SICK LEAVE BY SECTOR OF EMPLOYMENT
On average, Palestine refugees work for 48.1 hours per week, which is the maximum allowed according to the Lebanese Labour Law, while the standard working time is eight hours per day, or the equivalent of 40 hours per week.101 Men tend to have longer working hours than women with 49.8 hours compared to women’s 41.1 hours.
Private-sector workers average a 49.1 hour working week, compared to 39.1 hours for those who work for political parties. ’Legislators, senior officials and managers‘work the most, with their working hours reaching64.5 per week, while ’skilled agricultural and fishery workers‘ average 39.5 hours per week.
Moreover, close to half of respondents (48.4 per cent) report worrying about losing their source of income. This figure varies by geographical area, where NLA registers the largest share at 53.5 per cent and Saida records the lowest at 41.2 per cent. Data also shows that males and older age groups tend to worry more about losing their source of income than females and younger people.
101 Article 31 of the Lebanese Labour Law of 1946 (revised in 1996) available at: http://goo.gl/XbyzRy.
CHAPTER FOUR // ACCESS TO WORK AND DECENT WORKING CONDITIONS FOR PALESTINE REFUGEES IN LEBANON90
Denotes significance at the 1% level,Denotes significance at the 5% level andDenotes significance at the 10% level using Pearson’s chi-squared test.
******
Denotes significance at the 1% level,Denotes significance at the 5% level andDenotes significance at the 10% level using Pearson’s chi-squared test.
******

In conclusion, a clear majority of PRL is informally part of the labour force. Around 86.5 per cent of the employed PRL do not have contracts, and only 6.0 per cent hold work permits. They have verbal agreements with their employers that leave them on bottom end of the employment ladder not benefitting from leave and subsidies, and this situation leaves them feeling rather insecure in their workplace; around half of PRL are wage labourers. The private sector is the largest employer of PRL. More than 70 per cent of the PRL workforce is employed in elementary occupations, craft and related trades, and services and sales. Lastly, women are five times less likely to be employed than men.
conclusion
91 // CONCLUSION

2015 UNRWA / Firas Abo Aloul

Population Health and Access to Services for Palestine Refugees in Lebanonhala ghattas, nisreen salti, jowel choufani, hina shaheed, tala ismail
CHAPTERFIVE
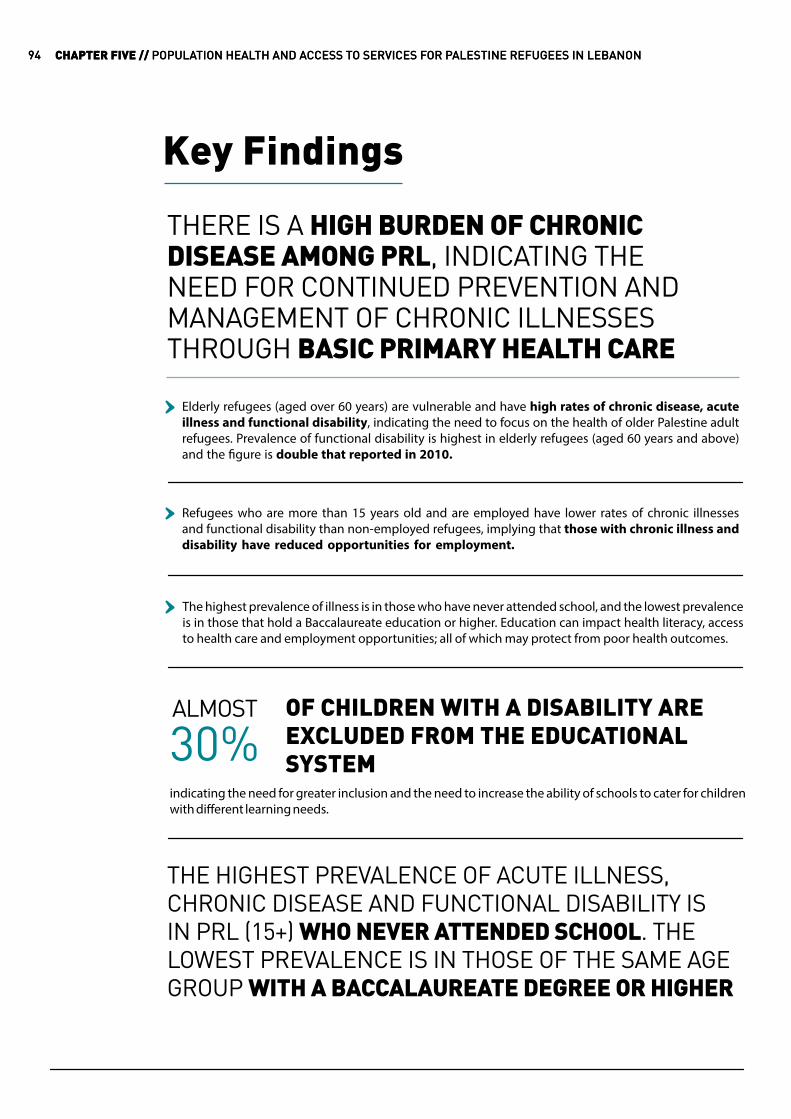
Key Findings
THERE IS A HIGH BURDEN OF CHRONIC DISEASE AMONG PRL, INDICATING THE NEED FOR CONTINUED PREVENTION AND MANAGEMENT OF CHRONIC ILLNESSES THROUGH BASIC PRIMARY HEALTH CARE
THE HIGHEST PREVALENCE OF ACUTE ILLNESS, CHRONIC DISEASE AND FUNCTIONAL DISABILITY IS IN PRL (15+) WHO NEVER ATTENDED SCHOOL. THE LOWEST PREVALENCE IS IN THOSE OF THE SAME AGE GROUP WITH A BACCALAUREATE DEGREE OR HIGHER
The highest prevalence of illness is in those who have never attended school, and the lowest prevalence is in those that hold a Baccalaureate education or higher. Education can impact health literacy, access to health care and employment opportunities; all of which may protect from poor health outcomes.
indicating the need for greater inclusion and the need to increase the ability of schools to cater for children with different learning needs.
OF CHILDREN WITH A DISABILITY ARE EXCLUDED FROM THE EDUCATIONAL SYSTEM
ALMOST
30%
Elderly refugees (aged over 60 years) are vulnerable and have high rates of chronic disease, acute illness and functional disability, indicating the need to focus on the health of older Palestine adult refugees. Prevalence of functional disability is highest in elderly refugees (aged 60 years and above) and the figure is double that reported in 2010.
Refugees who are more than 15 years old and are employed have lower rates of chronic illnesses and functional disability than non-employed refugees, implying that those with chronic illness and disability have reduced opportunities for employment.
CHAPTER FIVE // POPULATION HEALTH AND ACCESS TO SERVICES FOR PALESTINE REFUGEES IN LEBANON94 CHAPTER FIVE // POPULATION HEALTH AND ACCESS TO SERVICES FOR PALESTINE REFUGEES IN LEBANON94
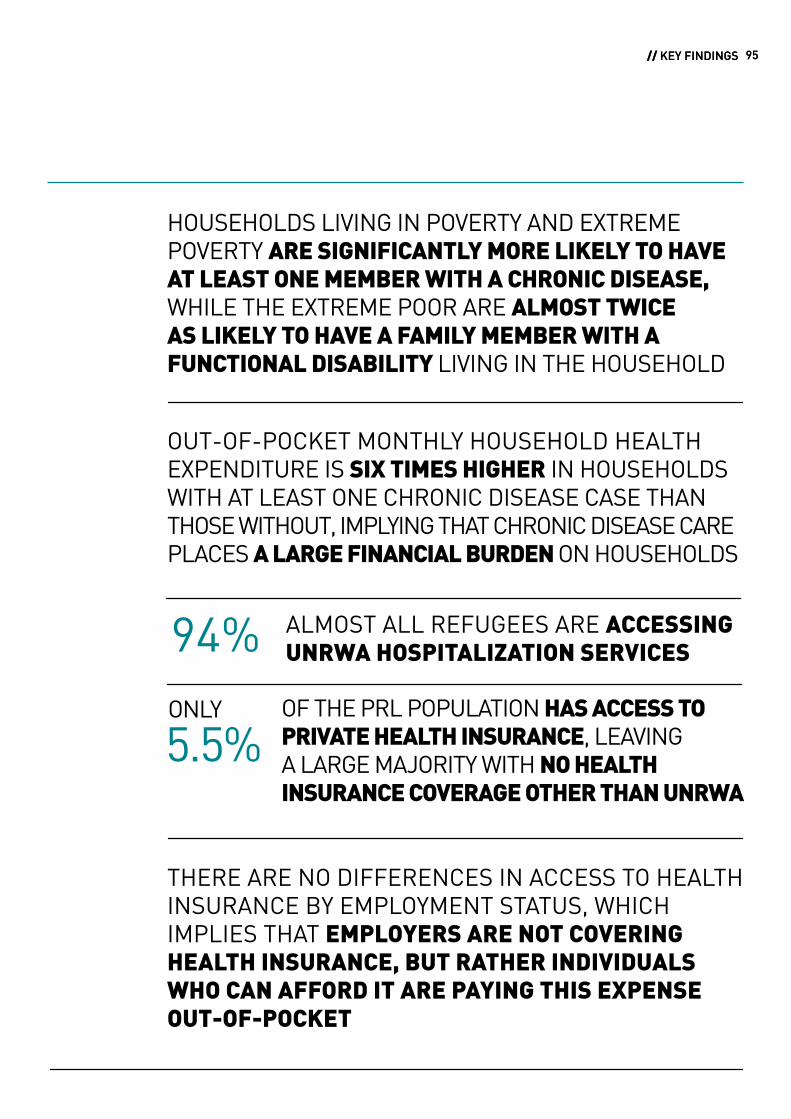
HOUSEHOLDS LIVING IN POVERTY AND EXTREME POVERTY ARE SIGNIFICANTLY MORE LIKELY TO HAVE AT LEAST ONE MEMBER WITH A CHRONIC DISEASE, WHILE THE EXTREME POOR ARE ALMOST TWICE AS LIKELY TO HAVE A FAMILY MEMBER WITH A FUNCTIONAL DISABILITY LIVING IN THE HOUSEHOLD
OUT-OF-POCKET MONTHLY HOUSEHOLD HEALTH EXPENDITURE IS SIX TIMES HIGHER IN HOUSEHOLDS WITH AT LEAST ONE CHRONIC DISEASE CASE THAN THOSE WITHOUT, IMPLYING THAT CHRONIC DISEASE CARE PLACES A LARGE FINANCIAL BURDEN ON HOUSEHOLDS
THERE ARE NO DIFFERENCES IN ACCESS TO HEALTH INSURANCE BY EMPLOYMENT STATUS, WHICH IMPLIES THAT EMPLOYERS ARE NOT COVERING HEALTH INSURANCE, BUT RATHER INDIVIDUALS WHO CAN AFFORD IT ARE PAYING THIS EXPENSE OUT-OF-POCKET
ALMOST ALL REFUGEES ARE ACCESSING UNRWA HOSPITALIZATION SERVICES94%OF THE PRL POPULATION HAS ACCESS TO PRIVATE HEALTH INSURANCE, LEAVING A LARGE MAJORITY WITH NO HEALTH INSURANCE COVERAGE OTHER THAN UNRWA
ONLY
5.5%
95 // KEY FINDINGS 95 // KEY FINDINGS

The UNRWA Health Programme delivers comprehensive primary health care services, both preventive and curative, to Palestine refugees, and helps them access secondary and tertiary health care services. The Agency provides 27 health-care facilities across the country. Palestine refugees are not covered by any public health scheme according to the Lebanese public health system and private health care can be unaffordable.
The Agency started its health reform in 2011 by implementing a new service
delivery model – the Family Health Team approach – to provide holistic primary health care at Agency health centres. During 2014, Lebanon Field Office was the first UNRWA Field that implemented the Family Health Team approach in all its health centres.
However, UNRWA facilities suffer from underfunding, and not all medical services of the comprehensive Primary Health Care package are provided in every camp. Refugees might need to visit another camp for dental work or laboratory
tests potentially incurring additional transportation costs. UNRWA provides secondary and tertiary hospitalization services to Palestine refugees through contracting with Palestine Red Crescent Society, governmental and private hospitals. Unfortunately, tertiary hospital care is often beyond the financial reach of refugees since UNRWA can only offer partial coverage in UNRWA-contracted hospitals leaving a severe burden on patients, their families or local NGOs and charities.
102 Respondents who answered positively to the question “Has (NAME) been diagnosed with a chronic disease? If yes what is the disease?” ex: “Cancer, Hypertension, Hyperlipidemia (High Cholesterol/ High Triglyceride), Other Cardiovascular diseases (Cardiomyopathy, Coronary artery disease, Cardiac failure Dysrhythmias), etc..” 103 Respondents who answered positively to the question “Has (NAME) suffered from an acute illness in the past 6 months?104 Respondents who answered positively to the question “Does (NAME) have a disability? If yes, what is the type of disability” ex: “Physical disability – affecting upper body such as arms, Physical disability - affecting lower body / ability to walk, Hearing impairment/deaf, etc.”105 Institute for Health Metrics and Evaluation (IHME). (2015). Notice of tool migration. Retrieved from http://goo.gl/VnBnNT.106 Institute for Health Metrics and Evaluation (IHME). (2015). Notice of tool migration. Retrieved from http://goo.gl/VnBnNT.
hypertension, and 37 per cent have more than one concurrent chronic disease. This data is in line with Lebanese national data – the global burden of disease project lists Ischemic heart disease, stroke and diabetes as the top three causes of death in Lebanon.105
Among PRL who suffer from a chronic disease, there is a significant gender difference in reporting of hypertension (25.9 per cent in males versus 39.1 per cent in females), chronic pulmonary diseases (21.0 per cent males versus 16.8 per cent females) and diabetes (14.6 per cent males versus 21.6 per cent females). The most common chronic disease in children (up
Health conditions were reported by a household proxy-respondent on behalf of all members of the household. Thirty-seven per cent of the PRL population have a chronic condition,102 63.0 per cent report having an acute illness103 in the last six months, and 10.3 per cent are disabled.104
As expected, chronic conditions increase with age (see Figure 15), with highest prevalence in over-60-year-olds. Of those who have a chronic disease, the most commonly reported conditions are hypertension, chronic pulmonary diseases (which include asthma), diabetes and cardiovascular diseases (see Table 31). One-third of chronic disease cases have
to 18 years of age) is chronic pulmonary disease, whereas hypertension is the most common in adults and the elderly (see Table 32).
In comparison to numbers from the 2010 Socioeconomic Survey of Palestine refugees in Lebanon,106 prevalence of chronic disease is slightly higher (37 per cent in 2015 versus 31 per cent in 2010), but this may reflect higher rates of diagnosis of chronic disease. Age trends and common illnesses mirror those previously reported. It is also noteworthy that there is a high level of reporting of ’other chronic conditions,’ possibly reflecting low health literacy in this population.
health profile of palestine refugees living in lebanon
CHAPTER FIVE // POPULATION HEALTH AND ACCESS TO SERVICES FOR PALESTINE REFUGEES IN LEBANON96
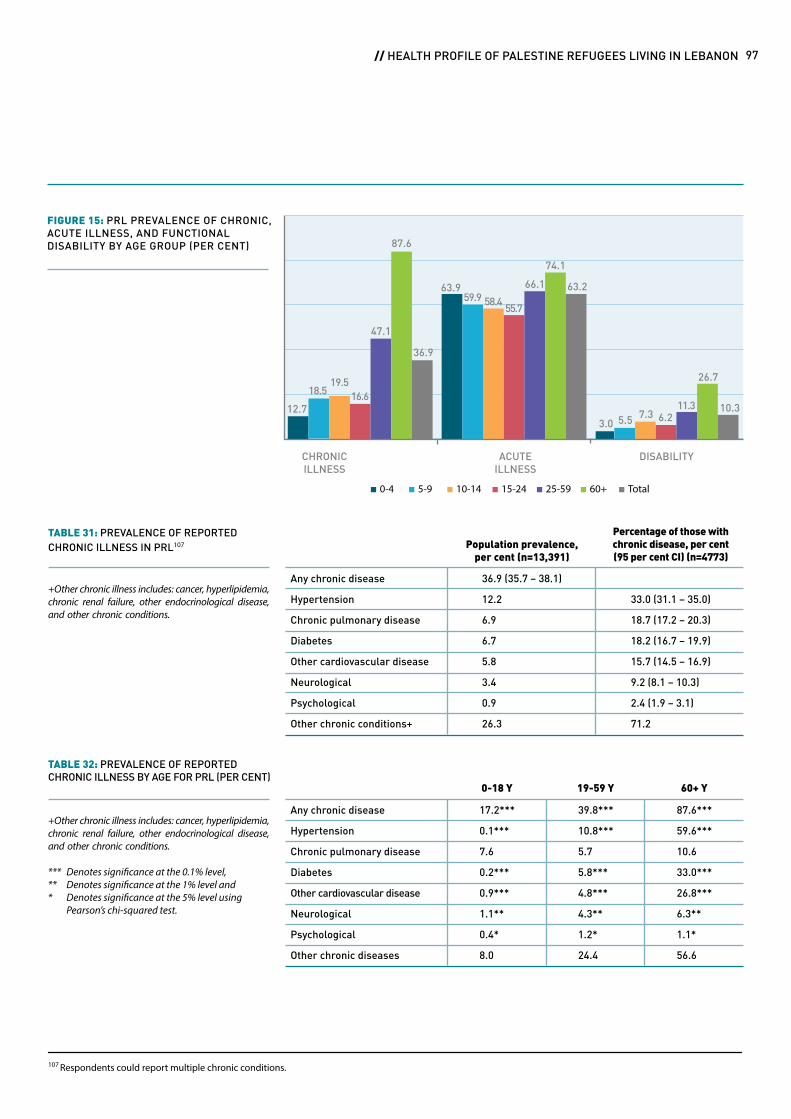
107 Respondents could report multiple chronic conditions.
CHRONIC ILLNESS
ACUTE ILLNESS
DISABILITY
12.7
63.9
3.0
18.5
59.9
5.5
16.6
55.7
6.2
19.5
58.4
7.3
47.1
66.1
11.3
36.9
63.2
10.3
87.6
74.1
26.7
FIGURE 15: PRL PREVALENCE OF CHRONIC, ACUTE ILLNESS, AND FUNCTIONAL DISABILITY BY AGE GROUP (PER CENT)
0-4 5-9 10-14 15-24 25-59 60+ Total
Any chronic disease
Hypertension
Chronic pulmonary disease
Diabetes
Other cardiovascular disease
Neurological
Psychological
Other chronic conditions+
36.9 (35.7 – 38.1)
12.2
6.9
6.7
5.8
3.4
0.9
26.3
33.0 (31.1 – 35.0)
18.7 (17.2 – 20.3)
18.2 (16.7 – 19.9)
15.7 (14.5 – 16.9)
9.2 (8.1 – 10.3)
2.4 (1.9 – 3.1)
71.2
Population prevalence,per cent (n=13,391)
Percentage of those with chronic disease, per cent(95 per cent CI) (n=4773)
TABLE 31: PREVALENCE OF REPORTED CHRONIC ILLNESS IN PRL107
+Other chronic illness includes: cancer, hyperlipidemia, chronic renal failure, other endocrinological disease, and other chronic conditions.
Any chronic disease
Hypertension
Chronic pulmonary disease
Diabetes
Other cardiovascular disease
Neurological
Psychological
Other chronic diseases
17.2***
0.1***
7.6
0.2***
0.9***
1.1**
0.4*
8.0
39.8***
10.8***
5.7
5.8***
4.8***
4.3**
1.2*
24.4
87.6***
59.6***
10.6
33.0***
26.8***
6.3**
1.1*
56.6
0-18 Y 19-59 Y 60+ Y
TABLE 32: PREVALENCE OF REPORTED CHRONIC ILLNESS BY AGE FOR PRL (PER CENT)
+Other chronic illness includes: cancer, hyperlipidemia, chronic renal failure, other endocrinological disease, and other chronic conditions.
97 // HEALTH PROFILE OF PALESTINE REFUGEES LIVING IN LEBANON
Denotes significance at the 0.1% level,Denotes significance at the 1% level andDenotes significance at the 5% level using Pearson’s chi-squared test.
******

Acute illnesses which include flu/colds, gastrointestinal infections, respiratory infections etc., were most common in over-60-year-olds, with 74 per cent reporting an acute illness in the last six months. No gender differences were
Prevalence of functional disability is highest in elderly refugees (aged 60 years and above) and the figure is double that reported in 2010. This high recording of functional disability may partly be due to slightly different age definitions and different definitions of functional disability used in the two surveys. The current report includes more inclusive
found in acute illnesses overall. Total acute illness rates are higher in 2015 than those reported in 2010, most likely due to differences in the timing of data collection, with the 2015 survey conducted in the spring, and the recall
and accurate definitions: it classifies the elderly as over 60 years of age (as opposed to over 50 in 2010), includes visual impairment not correctable by glasses (rather than total blindness used in 2010) and hearing impairment (instead of deafness used in 2010). Blindness in 2010 was 9.0 per cent of disability cases, whereas visual impairment
period covering winter months when flu/colds and respiratory infections are usually higher. On the other hand, the 2010 survey was conducted during the summer, and the recall period covered the spring months.
was 32.7 per cent of disability cases in 2015. Other categories are somewhat the same (even though categories differ slightly). The most common types of functional disability reported are physical disabilities affecting the lower body and visual impairment. Both of these are expected to increase with an ageing population (see Table 33).
Any functional disability108
Physical– affecting lower body
Physical– affecting upper body
Visual impairment
Hearing impairment
Speech difficulty
Learning disability
Intellectual disability
10.3 (9.4-11.3)
4.2
1.6
3.4
1.3
0.7
0.4
0.8
40.6 (36.9 – 44.4)
16.0 (13.8 – 18.5)
32.7 (29.5 – 36.0)
13.0 (10.9 – 15.4)
6.8 (5.5 – 8.5)
4.3 (3.1 – 6.1)
7.5 (5.8 9.7)
Population prevalence,per cent (n=13,391)
Percentage of those with functional disability, per cent
(95 per cent CI) (n=1357)
TABLE 33: PREVALENCE OF REPORTED FUNCTIONAL DISABILITY IN PRL
and economic, as well as physical environments. This section examines associations between social and
The health of individuals and communities can be affected by their context, including their social
economic factors and health outcomes in Palestine refugees living in Lebanon.
social determinants of health
108 “Functional disability” describes any long-term limitation in activity resulting from an impairment or health condition. It considers the impact of impairment on a person’s functioning, and captures the nuance that not all impairments have a “disabling” affect. For example, minor vision impairment that can be correctable through the use of glasses is not considered a “functional disability.”
CHAPTER FIVE // POPULATION HEALTH AND ACCESS TO SERVICES FOR PALESTINE REFUGEES IN LEBANON98

As expected, refugees (aged 15 years and above) in employment have lower rates of chronic illness and functional disability than those unemployed, whereas acute illness does not vary by employment status (see Table 34). This lower rate is also true in those aged 60 years and above, who are three times more likely to work if they do not have a chronic disease (27.0 per cent
Educational attainment of over-15–year-old PRL is associated with prevalence of chronic disease, acute illness and functional disability; the highest prevalence of illness is in those who
With respect to child enrolment, prevalence of functional disability and incidence of acute illness are associated with enrolment (see Table 36) where 11 per cent of those not enrolled in school have a functional disability. Sixty-two per cent of children with
of 60+ years old without a chronic disease are employed, as compared to only 9.8 per cent of those with a chronic illness, p<0.001). It may be that those with a chronic illness and disability have reduced opportunities for employment; a recent survey conducted by the International Labour Organization (ILO) stated that the main reason men reported for not
never attended school, and the lowest prevalence is found in those holding a Baccalaureate degree or higher (see Table 35). Illness and disability may stand in the way of schooling, while
disabilities are enrolled in UNRWA schools and 8.9 per cent are enrolled in special education, leaving 28.9 per cent not enrolled. It may be that children with disabilities are being excluded from the educational system, indicating the need for greater inclusion and
working was poor health.109 Alternatively, it may be that the ability of individuals to generate income protects them from chronic illnesses. For the latter to be true, working environments need to be safe and healthy; whereas data on working conditions of Palestine refugees indicate that is often not the case.110
education can impact health literacy, access to health care and employment opportunities; all of which may protect from poor health outcomes.
increasing the ability of schools to cater for children with special needs. UNRWA Education Reform is working to increase access to inclusive, quality education, in recognition of the barriers children with disability face.
relationship between employment, education and
health outcomes
46.3***
63.7
13.0*
38.4***
65.0
9.8*
Unemployed Employed
Prevalence of chronic illness (n=9898), per cent
Prevalence of acute illness in the past 6 months(n=9898), per cent
Prevalence of functional disability (n=9898), per cent
TABLE 34: PREVALENCE OF ILLNESS AND DISABILITY IN EMPLOYED AND UNEMPLOYED PRL AGED 15 YEARS AND ABOVE
Prevalence of chronic illness(n=9846), per cent
Prevalence of acute illnessin the past 6 months(n=9849), per cent
Prevalence of functionaldisability (n=9850),per cent
80.0***
75.3***
34.0***
37.8***
64.6***
8.2***
28.0***
56.5***
6.3***
52.8***
66.1***
15.3***
43.2***
65.3***
8.8***
43.9
64.2
12.0
NoneMiddle SchoolElementary Total
Brevet orVocational
Baccalau-reate or higher
TABLE 35: PREVALENCE OF ILLNESS AND DISABILITY BY EDUCATIONAL ATTAINMENT OF PRL AGED 15 YEARS AND ABOVE
109 International Labour Organization. (2012). Palestinian employment in Lebanon facts and challenges: Labour force survey among Palestinian refugees living in camps and gatherings In Lebanon. Retrieved February 2, 2016, from http://goo.gl/pXRvk9.110 International Labour Organization. (2012). Palestinian employment in Lebanon facts and challenges: Labour force survey among Palestinian refugees living in camps and gatherings In Lebanon. Retrieved February 2, 2016, from http://goo.gl/pXRvk9.
99 // RELATIONSHIP BETWEEN EMPLOYMENT, EDUCATION AND HEALTH OUTCOMES
Denotes significance at the 0.1% level,Denotes significance at the 1% level andDenotes significance at the 5% level using Pearson’s chi-squared test.
******
Denotes significance at the 0.1% level,Denotes significance at the 1% level andDenotes significance at the 5% level using Pearson’s chi-squared test.
******
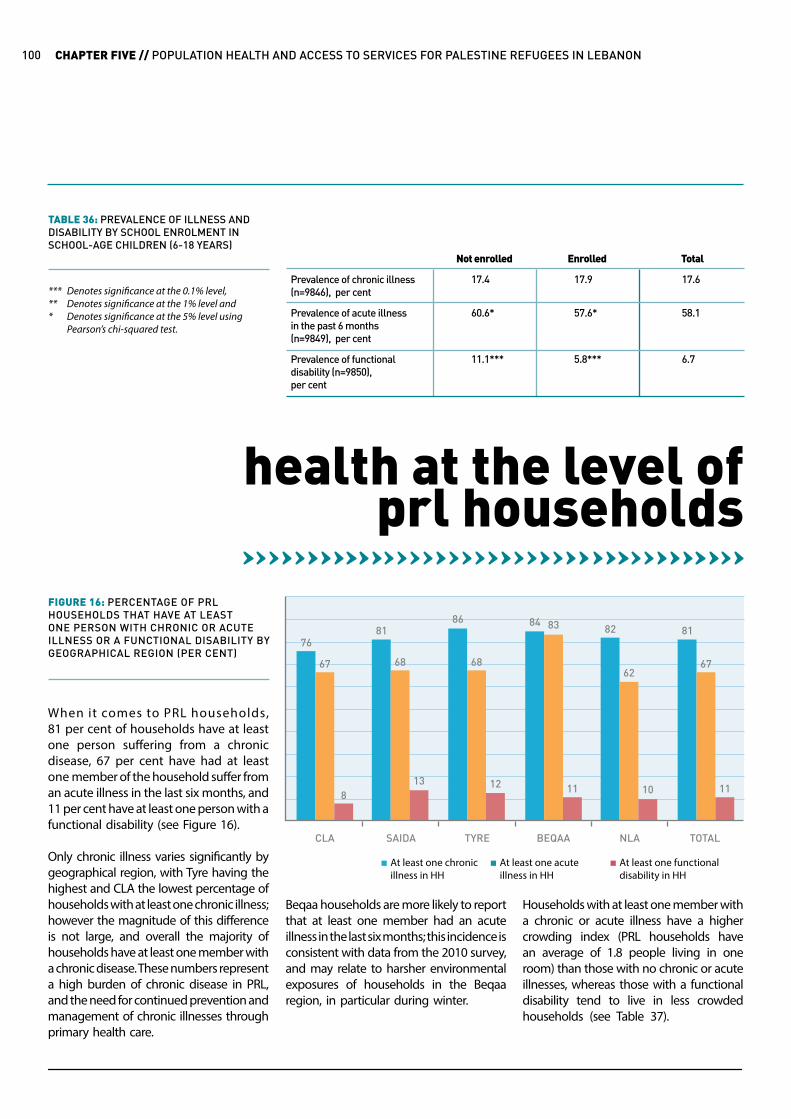
health at the level of prl households
TABLE 36: PREVALENCE OF ILLNESS AND DISABILITY BY SCHOOL ENROLMENT IN SCHOOL-AGE CHILDREN (6-18 YEARS)
Prevalence of chronic illness(n=9846), per cent
Prevalence of acute illnessin the past 6 months(n=9849), per cent
Prevalence of functionaldisability (n=9850),per cent
17.6
58.1
6.7
17.9
57.6*
5.8***
17.4
60.6*
11.1***
TotalNot enrolled Enrolled
FIGURE 16: PERCENTAGE OF PRL HOUSEHOLDS THAT HAVE AT LEAST ONE PERSON WITH CHRONIC OR ACUTE ILLNESS OR A FUNCTIONAL DISABILITY BY GEOGRAPHICAL REGION (PER CENT)
At least one chronic illness in HH
At least one acute illness in HH
At least one functional disability in HH
CLA SAIDA TYRE BEQAA NLA TOTAL
7681
86 8482 81
67 68 68
83
6267
813 12 11 10 11
Beqaa households are more likely to report that at least one member had an acute illness in the last six months; this incidence is consistent with data from the 2010 survey, and may relate to harsher environmental exposures of households in the Beqaa region, in particular during winter.
Households with at least one member with a chronic or acute illness have a higher crowding index (PRL households have an average of 1.8 people living in one room) than those with no chronic or acute illnesses, whereas those with a functional disability tend to live in less crowded households (see Table 37).
CHAPTER FIVE // POPULATION HEALTH AND ACCESS TO SERVICES FOR PALESTINE REFUGEES IN LEBANON100
Denotes significance at the 0.1% level,Denotes significance at the 1% level andDenotes significance at the 5% level using Pearson’s chi-squared test.
******
When it comes to PRL households,81 per cent of households have at least one person suffering from a chronic disease, 67 per cent have had at least one member of the household suffer from an acute illness in the last six months, and 11 per cent have at least one person with a functional disability (see Figure 16).
Only chronic illness varies significantly by geographical region, with Tyre having the highest and CLA the lowest percentage of households with at least one chronic illness; however the magnitude of this difference is not large, and overall the majority of households have at least one member with a chronic disease. These numbers represent a high burden of chronic disease in PRL, and the need for continued prevention and management of chronic illnesses through primary health care.

At least one chronicdisease in HH
At least one acute illness in HH
At least one functionaldisability in HH
TOTAL POPULATION
Yes
No
Yes
No
Yes
No
1.85 (1.8-1.9)
1.66 (1.6-1.7)
1.84 (1.8-1.9)
1.78 (1.7-1.9)
1.55*** (1.4-1.7)
1.85*** (1.8-1.9)
1.82 (1.7-1.9)
TABLE 37: MEAN CROWDING INDEX BY PRL HOUSEHOLD HEALTH INDICATORS
Crowding index, mean (95 per cent CI)
At least one chronic disease in HH***
At least oneacute illness in HH
At least one functional disability in HH*
Non-poor, per cent
Poor, per cent
Extreme Poor, per cent
77.5***
83.9***
90.4***
64.7
67.4
66.4
11.7
9.2
20.6
TABLE 38: PREVALENCE OF AT LEAST ONE HOUSEHOLD HEALTH CONDITION IN NON-POOR, POOR AND EXTREME-POOR PRL HOUSEHOLDS
Households living in poverty and extreme poverty are significantly more likely to have at least one member with
a chronic disease, while the extreme poor are almost twice as likely to have a family member with a functional
disability living in the household (see Table 38).
It is not possible to establish the direction of this association; it may be that conditions of poverty increase susceptibility to illness, or that the costs of the illness, in terms of health expenditures or caregiver time allocations, place an economic burden on households. Although it is impossible to establish causality from this cross-sectional survey, there is an indication that the latter is true, from the fact that households with
more than one illness have higher health expenditures (see Table 39).
In fact, despite the fact that almost all refugees (94 per cent) are accessing UNRWA hospitalization services, out-of-pocket monthly general household health expenditure is more than double in households with at least one chronic disease case, in comparison to those with no chronic disease. This difference is even
greater (almost four times as high) with respect to expenditure on medication (see Table 39) by households with at least one member reporting a chronic disease. Medication costs also place a higher burden on households with a disabled member with average expenditure on medication at US$ 85 per month in such households. Total household health expenditure (in US$) is very similar to numbers reported in 2010.
Generalhousehold health
expenditure(US$/month), mean
(95 per cent CI)
Household expenditure on
medication(US$/month), mean
(95 per cent CI)
Household expenditure on hospitalization
(US$/month), mean(95 per cent CI)
At least one chronic disease in HH
Yes
No
At least one acuteillness in HH
Yes
No
At least onedisability in HH
Yes
No
TOTAL POPULATION
28.6 (24.3-33.0)***
13.4 (8.0-18.9)
26.2 (19.9-32.7)*
25.6 (21.7-29.5)
31.8 (23.1-40.6)
25.1 (21.4-28.7)
25.8 (22.3-29.3)
75.1 (69.1-81.2)***
19.7 (14.2-25.2)
66.1 (60.3-71.9)
62.5 (52.0-73.1)
85.0 (71.8-98.1)***
62.4 (56.9-67.8)
64.9 (59.7-70.1)
24.7 (17.3-32.2)
12.5 (0.4-24.5)
22.5 (15.0-29.89)
22.3 (9.2-35.4)
46.9 (15.6-78.2)
19.5 (13.5-25.4)
22.4 (15.9-28.9)
TABLE 39: AVERAGE MONTHLY PRL HOUSEHOLD EXPENDITURE (IN US$) BY HOUSEHOLD HEALTH INDICATORS
101 // HEALTH AT THE LEVEL OF PRL HOUSEHOLDS
Denotes significance at the 0.1% level,Denotes significance at the 1% level andDenotes significance at the 5% level using Pearson’s chi-squared test.
******
Denotes significance at the 0.1% level,Denotes significance at the 1% level andDenotes significance at the 5% level using Pearson’s chi-squared test.
******
Denotes significance at the 0.1% level,Denotes significance at the 1% level andDenotes significance at the 5% level using Pearson’s chi-squared test.
******
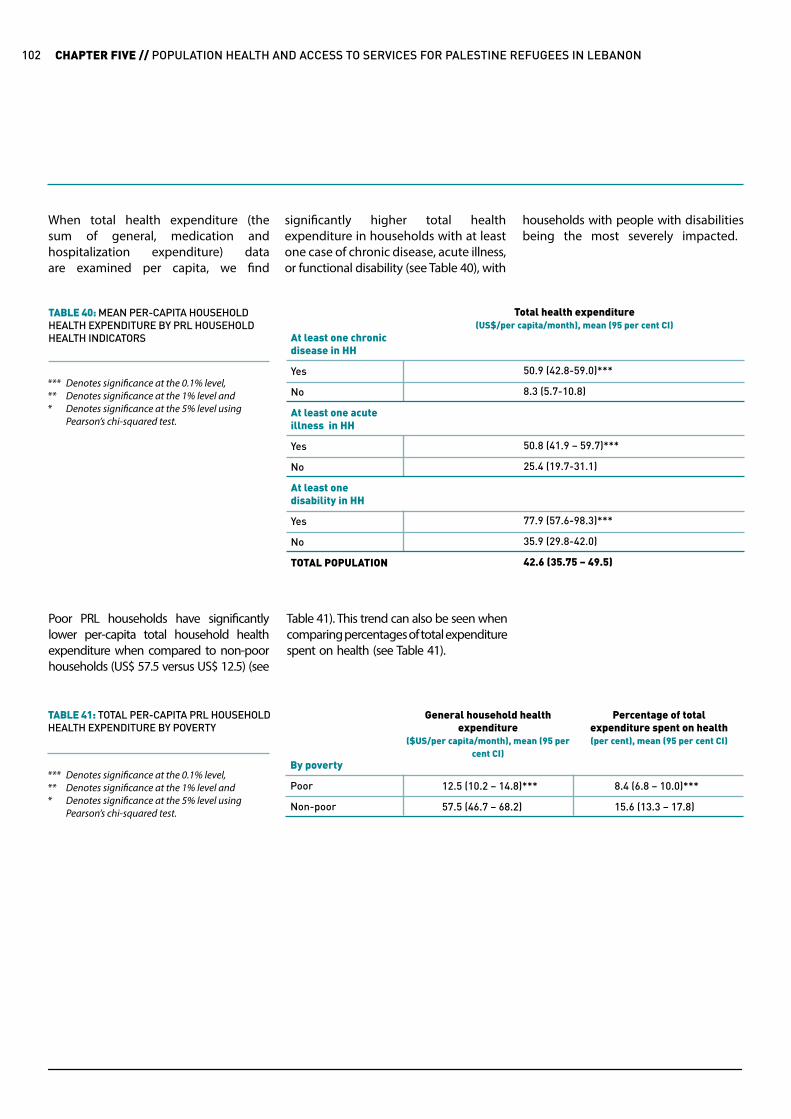
When total health expenditure (the sum of general, medication and hospitalization expenditure) data are examined per capita, we find
significantly higher total health expenditure in households with at least one case of chronic disease, acute illness, or functional disability (see Table 40), with
households with people with disabilities being the most severely impacted.
Total health expenditure(US$/per capita/month), mean (95 per cent CI)
At least one chronic disease in HH
Yes
No
At least one acuteillness in HH
Yes
No
At least onedisability in HH
Yes
No
TOTAL POPULATION
50.9 (42.8-59.0)***
8.3 (5.7-10.8)
50.8 (41.9 – 59.7)***
25.4 (19.7-31.1)
77.9 (57.6-98.3)***
35.9 (29.8-42.0)
42.6 (35.75 – 49.5)
TABLE 40: MEAN PER-CAPITA HOUSEHOLD HEALTH EXPENDITURE BY PRL HOUSEHOLD HEALTH INDICATORS
Poor PRL households have significantly lower per-capita total household health expenditure when compared to non-poor households (US$ 57.5 versus US$ 12.5) (see
Table 41). This trend can also be seen when comparing percentages of total expenditure spent on health (see Table 41).
General household healthexpenditure
($US/per capita/month), mean (95 per cent CI)
Percentage of totalexpenditure spent on health(per cent), mean (95 per cent CI)
By poverty
Poor
Non-poor
12.5 (10.2 – 14.8)***
57.5 (46.7 – 68.2)
8.4 (6.8 – 10.0)***
15.6 (13.3 – 17.8)
TABLE 41: TOTAL PER-CAPITA PRL HOUSEHOLD HEALTH EXPENDITURE BY POVERTY
CHAPTER FIVE // POPULATION HEALTH AND ACCESS TO SERVICES FOR PALESTINE REFUGEES IN LEBANON102
Denotes significance at the 0.1% level,Denotes significance at the 1% level andDenotes significance at the 5% level using Pearson’s chi-squared test.
******
Denotes significance at the 0.1% level,Denotes significance at the 1% level andDenotes significance at the 5% level using Pearson’s chi-squared test.
******
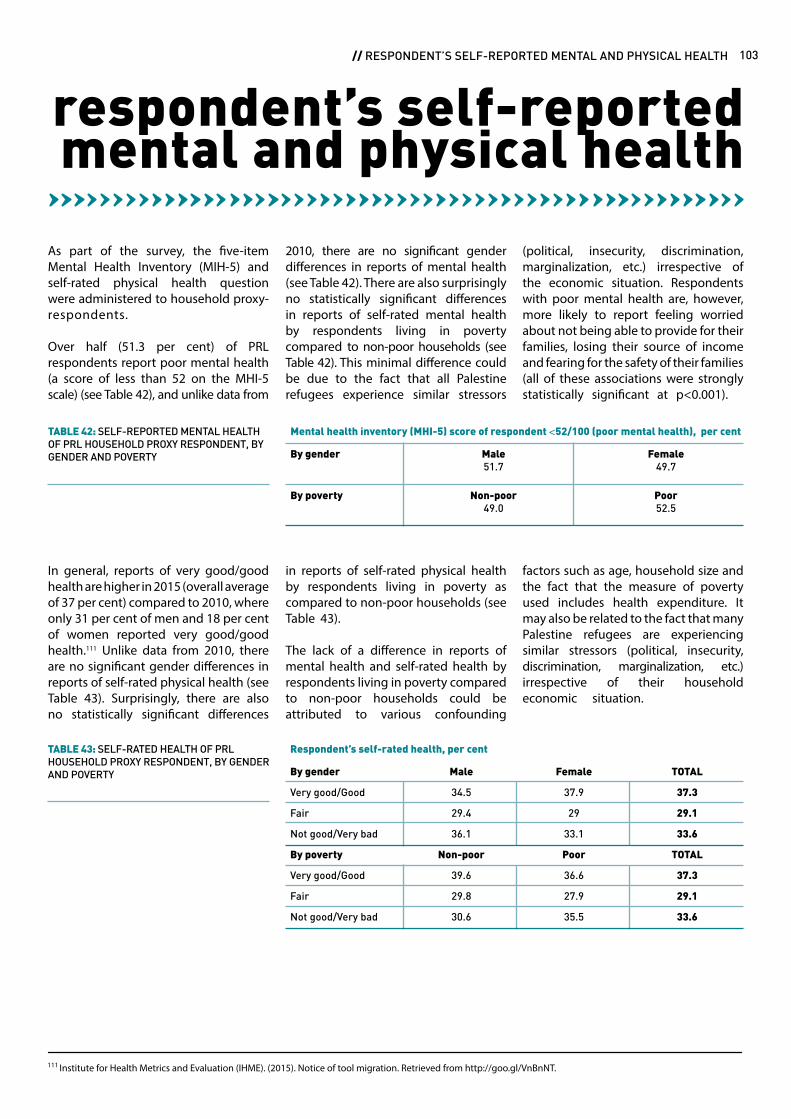
2010, there are no significant gender differences in reports of mental health (see Table 42). There are also surprisingly no statistically significant differences in reports of self-rated mental health by respondents living in poverty compared to non-poor households (see Table 42). This minimal difference could be due to the fact that all Palestine refugees experience similar stressors
As part of the survey, the five-item Mental Health Inventory (MIH-5) and self-rated physical health question were administered to household proxy-respondents.
Over half (51.3 per cent) of PRL respondents report poor mental health (a score of less than 52 on the MHI-5 scale) (see Table 42), and unlike data from
(political, insecurity, discrimination, marginalization, etc.) irrespective of the economic situation. Respondents with poor mental health are, however, more likely to report feeling worried about not being able to provide for their families, losing their source of income and fearing for the safety of their families (all of these associations were strongly statistically significant at p<0.001).
respondent’s self-reported mental and physical health
By gender
By poverty
Male51.7
Non-poor49.0
Female49.7
Poor52.5
TABLE 42: SELF-REPORTED MENTAL HEALTH OF PRL HOUSEHOLD PROXY RESPONDENT, BY GENDER AND POVERTY
Mental health inventory (MHI-5) score of respondent <52/100 (poor mental health), per cent
in reports of self-rated physical health by respondents living in poverty as compared to non-poor households (see Table 43).
The lack of a difference in reports of mental health and self-rated health by respondents living in poverty compared to non-poor households could be attributed to various confounding
In general, reports of very good/good health are higher in 2015 (overall average of 37 per cent) compared to 2010, where only 31 per cent of men and 18 per cent of women reported very good/good health.111 Unlike data from 2010, there are no significant gender differences in reports of self-rated physical health (see Table 43). Surprisingly, there are also no statistically significant differences
factors such as age, household size and the fact that the measure of poverty used includes health expenditure. It may also be related to the fact that many Palestine refugees are experiencing similar stressors (political, insecurity, discrimination, marginalization, etc.) irrespective of their household economic situation.
By gender
Very good/Good
Fair
Not good/Very bad
By poverty
Very good/Good
Fair
Not good/Very bad
Male
34.5
29.4
36.1
Non-poor
39.6
29.8
30.6
Female
37.9
29
33.1
Poor
36.6
27.9
35.5
TOTAL
37.3
29.1
33.6
TOTAL
37.3
29.1
33.6
TABLE 43: SELF-RATED HEALTH OF PRL HOUSEHOLD PROXY RESPONDENT, BY GENDER AND POVERTY
Respondent’s self-rated health, per cent
111 Institute for Health Metrics and Evaluation (IHME). (2015). Notice of tool migration. Retrieved from http://goo.gl/VnBnNT.
103 // RESPONDENT’S SELF-REPORTED MENTAL AND PHYSICAL HEALTH
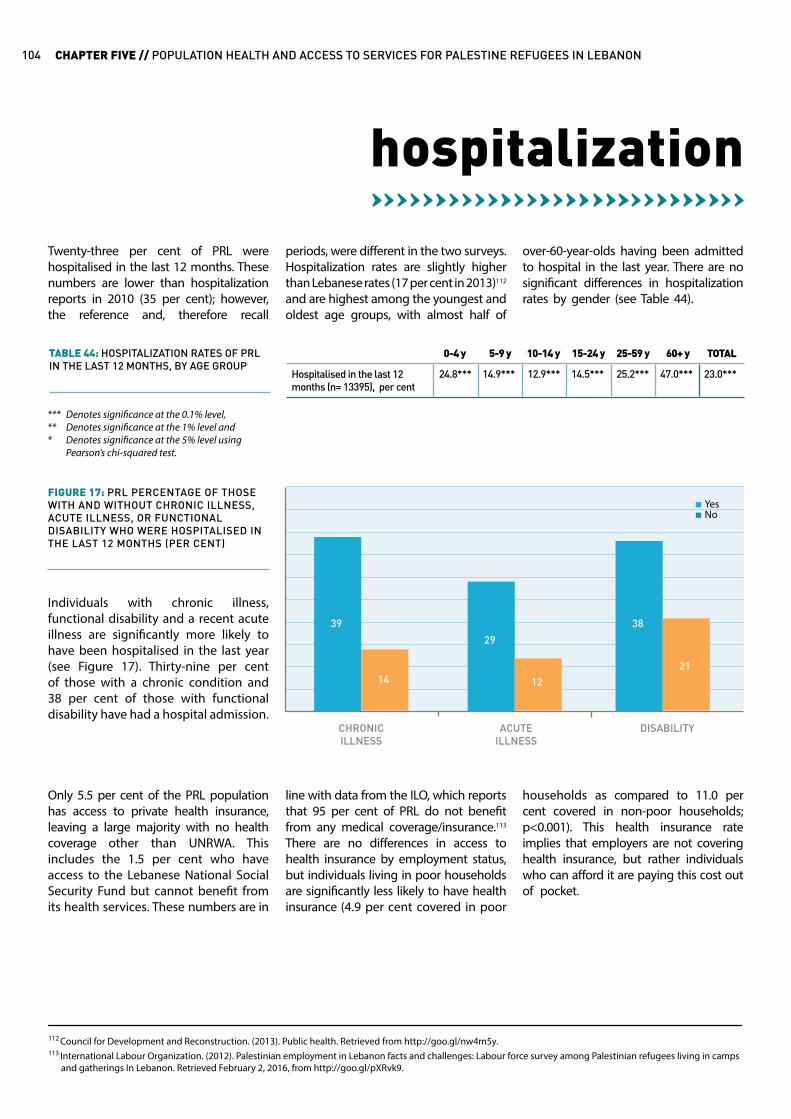
periods, were different in the two surveys. Hospitalization rates are slightly higher than Lebanese rates (17 per cent in 2013)112 and are highest among the youngest and oldest age groups, with almost half of
line with data from the ILO, which reports that 95 per cent of PRL do not benefit from any medical coverage/insurance.113 There are no differences in access to health insurance by employment status, but individuals living in poor households are significantly less likely to have health insurance (4.9 per cent covered in poor
Twenty-three per cent of PRL were hospitalised in the last 12 months. These numbers are lower than hospitalization reports in 2010 (35 per cent); however, the reference and, therefore recall
Only 5.5 per cent of the PRL population has access to private health insurance, leaving a large majority with no health coverage other than UNRWA. This includes the 1.5 per cent who have access to the Lebanese National Social Security Fund but cannot benefit from its health services. These numbers are in
over-60-year-olds having been admitted to hospital in the last year. There are no significant differences in hospitalization rates by gender (see Table 44).
households as compared to 11.0 per cent covered in non-poor households; p<0.001). This health insurance rate implies that employers are not covering health insurance, but rather individuals who can afford it are paying this cost out of pocket.
hospitalization
Hospitalised in the last 12 months (n= 13395), per cent
24.8*** 14.9*** 12.9*** 14.5*** 25.2*** 47.0*** 23.0***
0-4 y 5-9 y 10-14 y 15-24 y 25-59 y 60+ y TOTALTABLE 44: HOSPITALIZATION RATES OF PRLIN THE LAST 12 MONTHS, BY AGE GROUP
FIGURE 17: PRL PERCENTAGE OF THOSE WITH AND WITHOUT CHRONIC ILLNESS, ACUTE ILLNESS, OR FUNCTIONAL DISABILITY WHO WERE HOSPITALISED IN THE LAST 12 MONTHS (PER CENT)
39
29
38
14 1221
CHRONIC ILLNESS
ACUTE ILLNESS
DISABILITY
NoYes
Individuals with chronic illness, functional disability and a recent acute illness are significantly more likely to have been hospitalised in the last year (see Figure 17). Thirty-nine per cent of those with a chronic condition and 38 per cent of those with functional disability have had a hospital admission.
112 Council for Development and Reconstruction. (2013). Public health. Retrieved from http://goo.gl/nw4m5y.113 International Labour Organization. (2012). Palestinian employment in Lebanon facts and challenges: Labour force survey among Palestinian refugees living in camps and gatherings In Lebanon. Retrieved February 2, 2016, from http://goo.gl/pXRvk9.
CHAPTER FIVE // POPULATION HEALTH AND ACCESS TO SERVICES FOR PALESTINE REFUGEES IN LEBANON104
Denotes significance at the 0.1% level,Denotes significance at the 1% level andDenotes significance at the 5% level using Pearson’s chi-squared test.
******
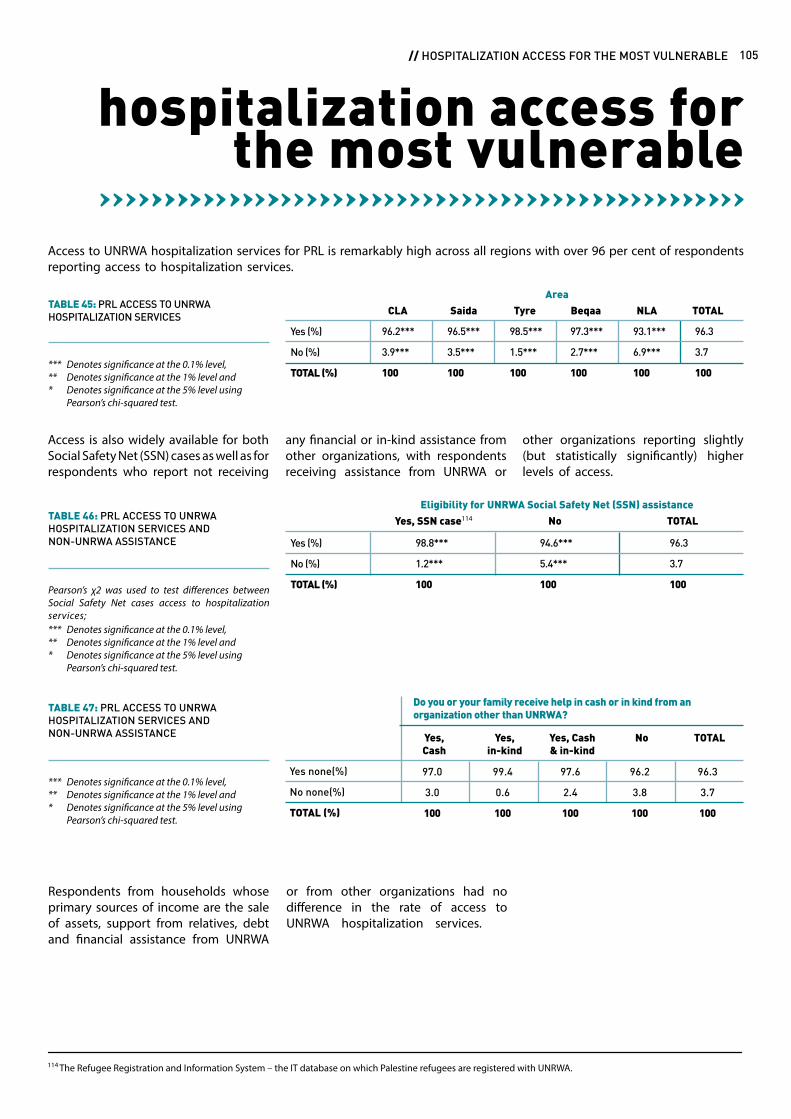
hospitalization access for the most vulnerable
Area
Yes (%)
No (%)
TOTAL (%)
96.2***
3.9***
100
96.5***
3.5***
100
98.5***
1.5***
100
97.3***
2.7***
100
93.1***
6.9***
100
96.3
3.7
100
CLA Saida Tyre Beqaa NLA TOTALTABLE 45: PRL ACCESS TO UNRWA HOSPITALIZATION SERVICES
Access to UNRWA hospitalization services for PRL is remarkably high across all regions with over 96 per cent of respondents reporting access to hospitalization services.
any financial or in-kind assistance from other organizations, with respondents receiving assistance from UNRWA or
Access is also widely available for both Social Safety Net (SSN) cases as well as for respondents who report not receiving
other organizations reporting slightly (but statistically significantly) higher levels of access.
Eligibility for UNRWA Social Safety Net (SSN) assistance
Yes (%)
No (%)
TOTAL (%)
98.8***
1.2***
100
94.6***
5.4***
100
96.3
3.7
100
Yes, SSN case114 No TOTALTABLE 46: PRL ACCESS TO UNRWA HOSPITALIZATION SERVICES ANDNON-UNRWA ASSISTANCE
Pearson’s χ2 was used to test differences between Social Safety Net cases access to hospitalization services;
TABLE 47: PRL ACCESS TO UNRWA HOSPITALIZATION SERVICES ANDNON-UNRWA ASSISTANCE
Yes none(%)
No none(%)
TOTAL (%)
Do you or your family receive help in cash or in kind from an organization other than UNRWA?
97.0
3.0
100
99.4
0.6
100
97.6
2.4
100
96.2
3.8
100
96.3
3.7
100
Yes,Cash
Yes,in-kind
Yes, Cash& in-kind
No TOTAL
Respondents from households whose primary sources of income are the sale of assets, support from relatives, debt and financial assistance from UNRWA
or from other organizations had no difference in the rate of access to UNRWA hospitalization services.
114 The Refugee Registration and Information System – the IT database on which Palestine refugees are registered with UNRWA.
105 // HOSPITALIZATION ACCESS FOR THE MOST VULNERABLE
Denotes significance at the 0.1% level,Denotes significance at the 1% level andDenotes significance at the 5% level using Pearson’s chi-squared test.
******
Denotes significance at the 0.1% level,Denotes significance at the 1% level andDenotes significance at the 5% level using Pearson’s chi-squared test.
******
Denotes significance at the 0.1% level,Denotes significance at the 1% level andDenotes significance at the 5% level using Pearson’s chi-squared test.
******
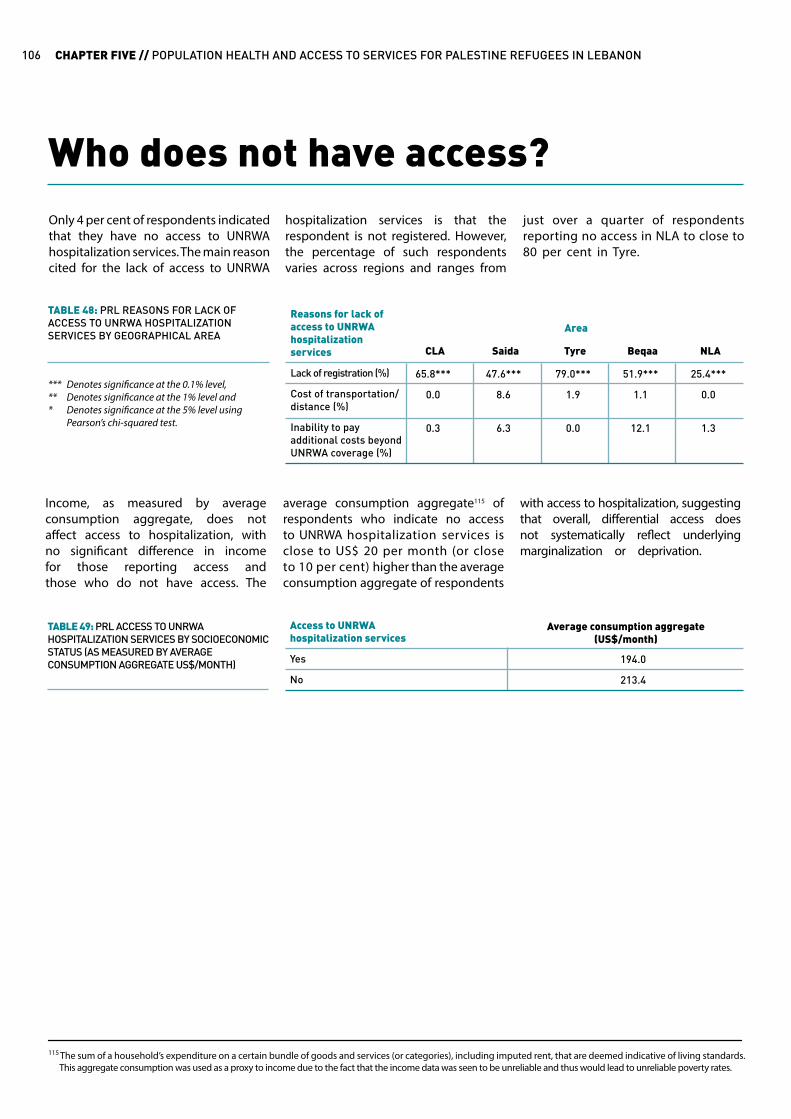
Only 4 per cent of respondents indicated that they have no access to UNRWA hospitalization services. The main reason cited for the lack of access to UNRWA
hospitalization services is that the respondent is not registered. However, the percentage of such respondents varies across regions and ranges from
just over a quarter of respondents reporting no access in NLA to close to 80 per cent in Tyre.
Who does not have access?
Reasons for lack of access to UNRWA hospitalization services
Lack of registration (%)
Cost of transportation/ distance (%)
Inability to pay additional costs beyond UNRWA coverage (%)
Area
65.8***
0.0
0.3
47.6***
8.6
6.3
79.0***
1.9
0.0
51.9***
1.1
12.1
25.4***
0.0
1.3
CLA Saida Tyre Beqaa NLA
TABLE 48: PRL REASONS FOR LACK OF ACCESS TO UNRWA HOSPITALIZATION SERVICES BY GEOGRAPHICAL AREA
average consumption aggregate115 of respondents who indicate no access to UNRWA hospitalization services is close to US$ 20 per month (or close to 10 per cent) higher than the average consumption aggregate of respondents
Income, as measured by average consumption aggregate, does not affect access to hospitalization, with no significant difference in income for those reporting access and those who do not have access. The
with access to hospitalization, suggesting that overall, differential access does not systematically reflect underlying marginalization or deprivation.
Access to UNRWAhospitalization services
Yes
No
194.0
213.4
Average consumption aggregate(US$/month)
TABLE 49: PRL ACCESS TO UNRWA HOSPITALIZATION SERVICES BY SOCIOECONOMIC STATUS (AS MEASURED BY AVERAGE CONSUMPTION AGGREGATE US$/MONTH)
115 The sum of a household’s expenditure on a certain bundle of goods and services (or categories), including imputed rent, that are deemed indicative of living standards. This aggregate consumption was used as a proxy to income due to the fact that the income data was seen to be unreliable and thus would lead to unreliable poverty rates.
CHAPTER FIVE // POPULATION HEALTH AND ACCESS TO SERVICES FOR PALESTINE REFUGEES IN LEBANON106
Denotes significance at the 0.1% level,Denotes significance at the 1% level andDenotes significance at the 5% level using Pearson’s chi-squared test.
******
In conclusion, chronic diseases are common among PRL, hence the need for universal and basic health care. Chronic diseases are more common among unemployed PRL. Moreover, out-of-pocket monthly household health expenditure is six times higher in households that report at least one chronic disease case, than those without, implying that chronic disease care places a large financial burden on households. There is also a correlation between education and the prevalence of disease; the higher the educational attainment, the lower the frequency of chronic diseases. Moreover, the higher the poverty rates among PRL, the more the prevalence of chronic diseases, too. Finally, PRL depend on UNRWA health services with the percentage of privately insured negligible.
conclusion
107 // CONCLUSION
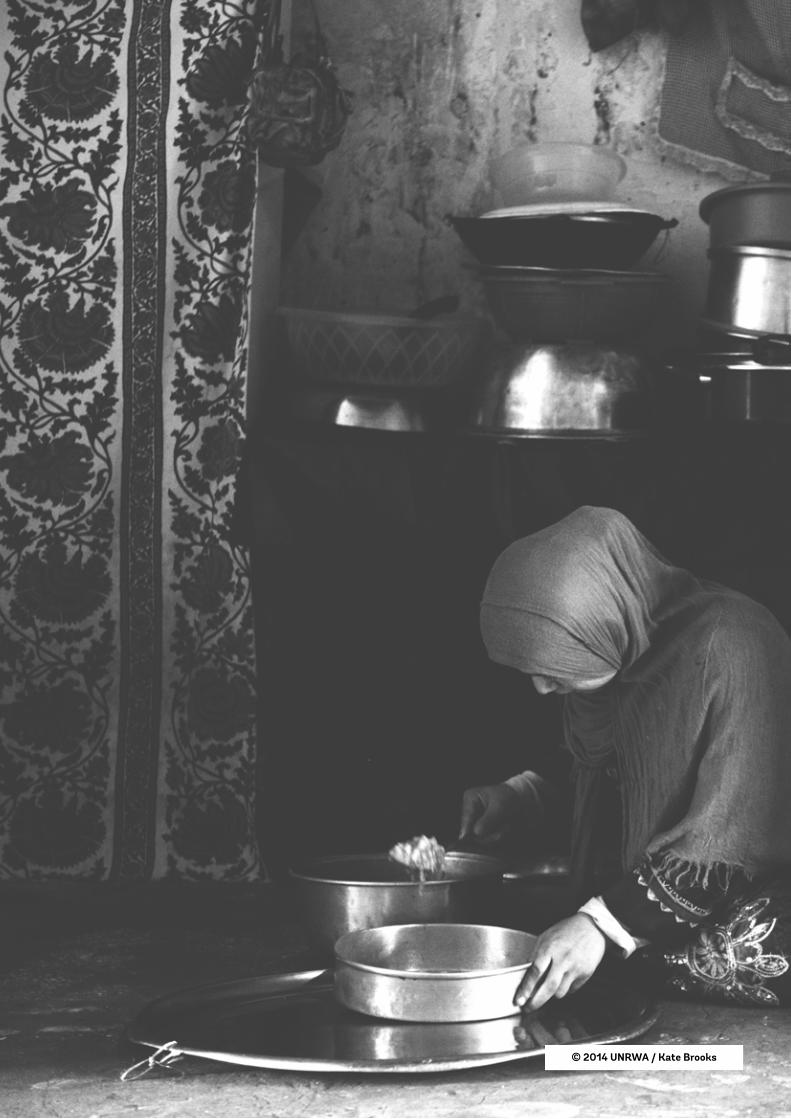
© 2014 UNRWA / Kate Brooks

Food Security of Palestine Refugees in Lebanonhala ghattas, nadine sahyoun, ali abazeed
CHAPTERSIX

Key Findings
FOOD INSECURITY IS ASSESSED USING THE SEVEN-ITEM ARAB FAMILY FOOD SECURITY SCALE IN WHICH
FOOD INSECURITY INCREASES FOR THOSE FAMILIES WHOSE HH IS UNEMPLOYED
Head of household educational attainment and employment differentiate households into food insecurity categories. A household head holding a Brevet significantly protects against food insecurity while food insecurity increases with head of household unemployment. This trend highlights the importance of continuing to support the UNRWA Education Programme, and ensuring dropout rates remain low. In addition, increasing PRL employment rights will likely translate into improvements in their food security.
OF RESPONDENTS REPORTED BEING FOOD SECURE
OF CHILDREN UNDER 15 LIVE IN SEVERELY FOOD INSECURE HOUSEHOLDS
SEVERE FOOD INSECURITYIS AT ITS HIGHEST IN CLA
MODERATELYFOOD INSECURE AND
SEVERELYFOOD INSECURE
38%
27%
30%
38.2%
24%
CHAPTER SIX // FOOD SECURITY OF PALESTINE REFUGEES IN LEBANON110
THE WORLD FOOD SUMMIT IN 1996 DEFINED FOOD SECURITY AS THECONDITIONWHENALLPEOPLEATALLTIMESHAVEACCESSTOSUFFICIENT,SAFE,NUTRITIOUSFOODTOMAINTAINAHEALTHYANDACTIVELIFE.

FOOD INSECURE HOUSEHOLDS HAVE A LARGER HOUSEHOLD SIZE, A GREATER NUMBER OF CHILDREN AND A HIGHER CROWDING INDEX
FOOD INSECURE HOUSEHOLDS ARE MORE LIKELY TO INCLUDE A MEMBER WITH A CHRONIC OR ACUTE ILLNESS THAN FOOD SECURE HOUSEHOLDS
REGIONAL TRENDS ARE DIFFERENT FROM THOSE REPORTED IN 2010, WITH HIGHER VULNERABILITY TO SEVERE FOOD INSECURITY IN CLA, BEQAA AND NLA IN 2015, WHEREAS SEVERE FOOD INSECURITY WAS HIGHEST IN TYRE, THE BEQAA AND SAIDA IN 2010
PRL WORKING IN LOWER SKILLED JOBS ARE MORE LIKELY TO EXPERIENCE MORE SEVERE FOOD INSECURITY, FORGING A DIRECT CONNECTION BETWEEN EMPLOYMENT, POVERTY AND FOOD SECURITY
Household dietary diversity score (HDDS) decreases with increasing food insecurity. Meaning that the more severely food insecure the household is, the less diversity is available in their diet. The most notable decreases are in meat and chicken, fruit, milk and dairy and vegetables.
These numbers indicate an improvement in the food security situation of PRL in south Lebanon, and a deterioration of food security in CLA and NLA.
111 // KEY FINDINGS
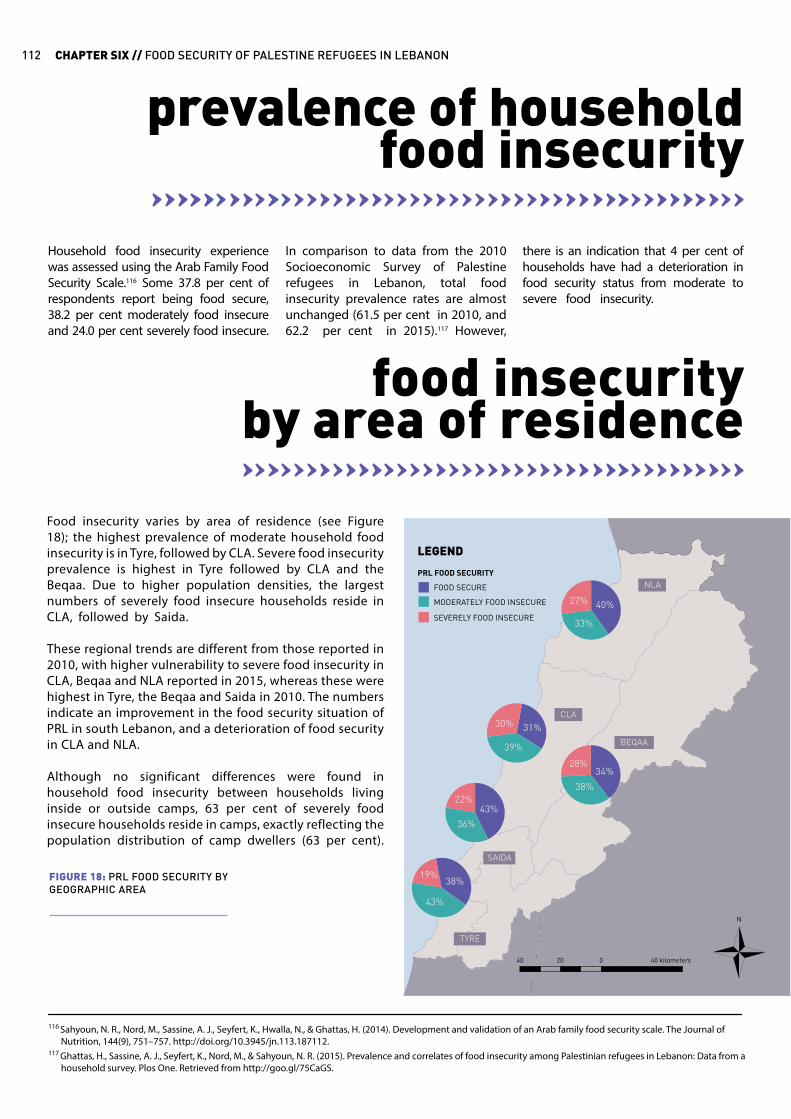
In comparison to data from the 2010 Socioeconomic Survey of Palestine refugees in Lebanon, total food insecurity prevalence rates are almost unchanged (61.5 per cent in 2010, and 62.2 per cent in 2015).117 However,
Household food insecurity experience was assessed using the Arab Family Food Security Scale.116 Some 37.8 per cent of respondents report being food secure, 38.2 per cent moderately food insecure and 24.0 per cent severely food insecure.
there is an indication that 4 per cent of households have had a deterioration in food security status from moderate to severe food insecurity.
prevalence of household food insecurity
116 Sahyoun, N. R., Nord, M., Sassine, A. J., Seyfert, K., Hwalla, N., & Ghattas, H. (2014). Development and validation of an Arab family food security scale. The Journal of Nutrition, 144(9), 751–757. http://doi.org/10.3945/jn.113.187112.117 Ghattas, H., Sassine, A. J., Seyfert, K., Nord, M., & Sahyoun, N. R. (2015). Prevalence and correlates of food insecurity among Palestinian refugees in Lebanon: Data from a household survey. Plos One. Retrieved from http://goo.gl/75CaGS.
Food insecurity varies by area of residence (see Figure 18); the highest prevalence of moderate household food insecurity is in Tyre, followed by CLA. Severe food insecurity prevalence is highest in Tyre followed by CLA and the Beqaa. Due to higher population densities, the largest numbers of severely food insecure households reside in CLA, followed by Saida.
These regional trends are different from those reported in 2010, with higher vulnerability to severe food insecurity in CLA, Beqaa and NLA reported in 2015, whereas these were highest in Tyre, the Beqaa and Saida in 2010. The numbers indicate an improvement in the food security situation of PRL in south Lebanon, and a deterioration of food security in CLA and NLA.
Although no significant differences were found in household food insecurity between households living inside or outside camps, 63 per cent of severely food insecure households reside in camps, exactly reflecting the population distribution of camp dwellers (63 per cent).
food insecurityby area of residence
FIGURE 18: PRL FOOD SECURITY BY GEOGRAPHIC AREA
CHAPTER SIX // FOOD SECURITY OF PALESTINE REFUGEES IN LEBANON112

households. Therefore, food insecure households are more likely to include children; 40 per cent of children under 15 live in moderately food insecure households, and 27 per cent in severely food insecure households. Children who live in food insecure households are more likely to have poor diet quality and poor nutritional status with potential long-term
insecurity categories. Holding a Brevet significantly protects against food insecurity at all levels of food insecurity. Eighty per cent of households reporting severe food insecurity are households where the head does not hold a Brevet (see Figure 19).
Employment status of the head of household also protects from all levels of food insecurity, with food insecurity
Average household size is higher in food insecure households, but the difference is not significant between severely food insecure and moderately food insecure households. In parallel, there is a significantly lower mean number of children under 15 in food secure households than both moderately food insecure and severely food insecure
Although a higher proportion of severely food insecure households are headed by women (24 per cent) than food secure households (21 per cent), the association between food insecurity and gender of head of household is not statistically significant.
Head of household educational attainment and employment differentiate households into food
consequences on child development.118
The data shows similarities in regard to crowding; crowding index increases with increasing severity of food insecurity (see Table 50). This increase is in line with 2010 data that shows similar patterns in regards to average household size and mean number of children under 15.
increasing with unemployment. Of the severely food insecure, 56 per cent include an unemployed head of household as compared to 44 per cent in moderately food insecure households and 42 per centin food secure households. All differences are statistically significant. These numbers compare with 2010 data, and show similar relationships between employment status and food security.
household characteristics and food security
head of household education and employment
118 Gordon, N., & Halileh, S. (2012). An analysis of cross-sectional survey data of stunting among Palestinian children less than five years of age. Maternal and Child Health Journal, 17(7), 1288–1296. http://doi.org/10.1007/s10995-012-1126-4. Hannum, E., Liu, J., & Frongillo, E. A. (2014). Poverty, food insecurity and nutritional deprivation in rural China: Implications for children’s literacy achievement. International Journal of Educational Development, 34, 90–97. Retrieved from http://goo.gl/YpStws.
HH size, mean
Number of children under 15 years of age, mean
HH crowding index, mean
2920
2813
2785
4.2a
1.1a
1.5a
4.6a
1.4
1.9b
4.7
1.5
2.1c
4.5
1.3
1.8
n Food secureModerately
food insecureSeverely food
insecure TOTALTABLE 50: PRL HOUSEHOLD DEMOGRAPHIC CHARACTERISTICS BY LEVEL OF HOUSEHOLD FOOD SECURITY
a) Significantly different from moderately and severely food insecure households (p<0.05)b) Significantly different from food secure and severely food insecure households (p<0.05)c) Significantly different from food secure and moderately food insecure households (p<0.05)
113 // HOUSEHOLD CHARACTERISTICS AND FOOD SECURITY

Food Secure Severely Food InsecureFood Insecure Total
62.8
42.3
79.5
56.4
76.1
43.7
70.5
46.3
DID NOT COMPLETE BREVET UNEMPLOYED HEAD OF HH
FIGURE 19: PRL HEAD OF HOUSEHOLD EDUCATIONAL ATTAINMENT AND UNEMPLOYMENT BY HOUSEHOLD FOOD INSECURITY LEVEL (PER CENT)
direct connection between the level of skill required in employment and food security. Data from the 2010 study show a similar pattern connection for all levels of occupation. However, currently, a higher proportion at both levels of food insecurity is found in the elementary occupations, indicating a downward shift in skill level of the occupation of the household
Similarly, food insecurity increases as the level of skill required in employment decreases. As food insecurity increases, the proportion of heads of household who work in elementary or crafts occupations also increases, while the proportion of those who work in services, associated professional, or professional occupations decreases (see Figure 20). This implies a
head. This association between food security and educational level attained highlights the importance of the UNRWA Education Programme continuing to support PRL and thus ensuring dropout rates remain low. In addition, increasing the employment rights of PRL will likely translate to improvement in food security.
Elementary Associated professionalsCrafts Service Professionals
3341 51 40
33 33
18
46
20
33 3
10
36
1
30
20
5
11
FOOD SECURE(SCORE 0-1)
SEVERELY FOOD INSECURE (SCORE 5-6)
MODERATELY FOOD INSECURE (SCORE 2-4)
TOTAL
FIGURE 20: PRL HEAD OF HOUSEHOLD OCCUPATION CATEGORIES BY HOUSEHOLD FOOD INSECURITY LEVELS (PER CENT)
CHAPTER SIX // FOOD SECURITY OF PALESTINE REFUGEES IN LEBANON114
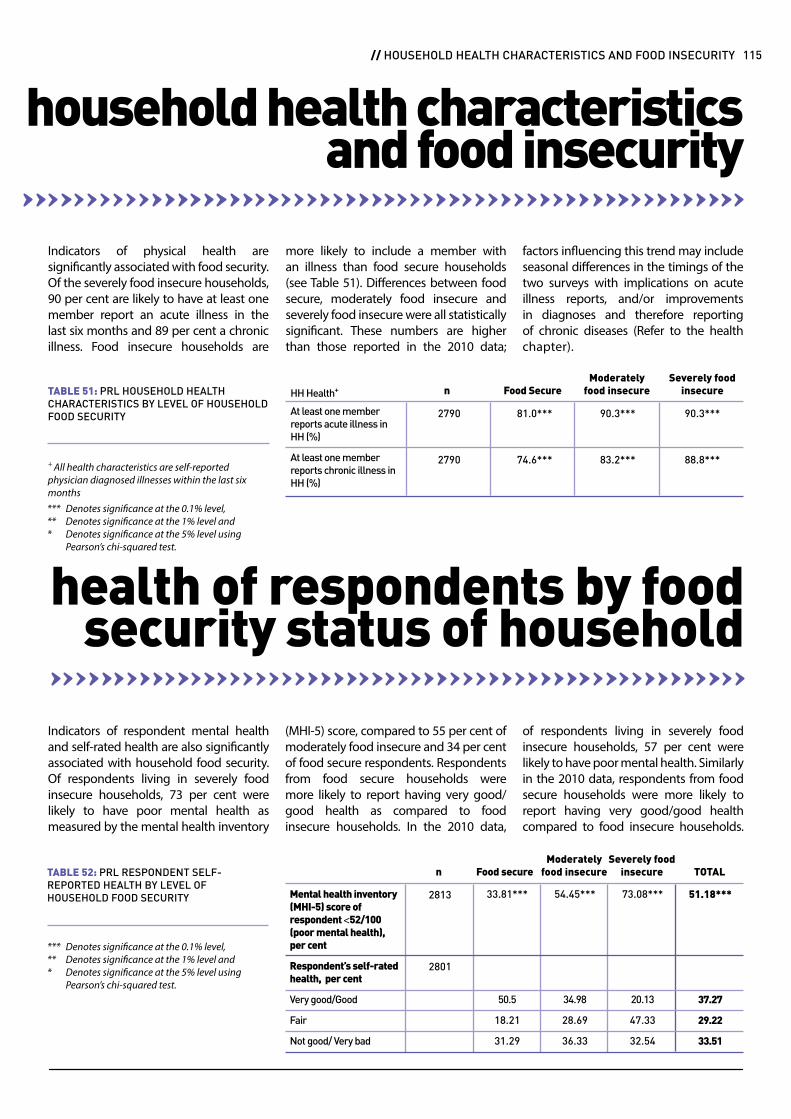
more likely to include a member with an illness than food secure households (see Table 51). Differences between food secure, moderately food insecure and severely food insecure were all statistically significant. These numbers are higher than those reported in the 2010 data;
Indicators of physical health are significantly associated with food security. Of the severely food insecure households, 90 per cent are likely to have at least one member report an acute illness in the last six months and 89 per cent a chronic illness. Food insecure households are
factors influencing this trend may include seasonal differences in the timings of the two surveys with implications on acute illness reports, and/or improvements in diagnoses and therefore reporting of chronic diseases (Refer to the health chapter).
household health characteristics and food insecurity
HH Health+
At least one member reports acute illness in HH (%)
At least one member reports chronic illness in HH (%)
2790
2790
81.0***
74.6***
90.3***
83.2***
90.3***
88.8***
n Food SecureModerately
food insecureSeverely food
insecureTABLE 51: PRL HOUSEHOLD HEALTH CHARACTERISTICS BY LEVEL OF HOUSEHOLD FOOD SECURITY
+ All health characteristics are self-reported physician diagnosed illnesses within the last six months
(MHI-5) score, compared to 55 per cent of moderately food insecure and 34 per cent of food secure respondents. Respondents from food secure households were more likely to report having very good/good health as compared to food insecure households. In the 2010 data,
of respondents living in severely food insecure households, 57 per cent were likely to have poor mental health. Similarly in the 2010 data, respondents from food secure households were more likely to report having very good/good health compared to food insecure households.
Indicators of respondent mental health and self-rated health are also significantly associated with household food security. Of respondents living in severely food insecure households, 73 per cent were likely to have poor mental health as measured by the mental health inventory
Mental health inventory (MHI-5) score of respondent <52/100 (poor mental health), per cent
Respondent’s self-rated health, per cent
Very good/Good
Fair
Not good/ Very bad
2813
2801
33.81***
50.5
18.21
31.29
54.45***
34.98
28.69
36.33
73.08***
20.13
47.33
32.54
51.18***
37.27
29.22
33.51
n Food secureModerately
food insecureSeverely food
insecure TOTALTABLE 52: PRL RESPONDENT SELF-REPORTED HEALTH BY LEVEL OFHOUSEHOLD FOOD SECURITY
health of respondents by food security status of household
115 // HOUSEHOLD HEALTH CHARACTERISTICS AND FOOD INSECURITY
Denotes significance at the 0.1% level,Denotes significance at the 1% level andDenotes significance at the 5% level using Pearson’s chi-squared test.
******
Denotes significance at the 0.1% level,Denotes significance at the 1% level andDenotes significance at the 5% level using Pearson’s chi-squared test.
******

slightly weaker association between severe food insecurity and poverty in the current survey data.
Total monthly household expenditure is significantly reduced in both moderately and severely food insecure households compared to food secure households (see Table 53). Similarly, monthly food expenditure drops fromUS$ 95.8 per capita in the food secure to US$ 78.3 per capita in the severely food insecure (see Table 53 & Figure 21). Also, food secure households have higher numbers of food-related assets (refrigerator, freezer, oven, and microwave). The decrease in the number of food-related assets and food expenditure is monotonic across the three categories of food insecurity; meaning that as food insecurity severity increases, the number of food-related assets owned by the household decreases.
The relationship between expenditures and food insecurity are similar to 2010,
In order to profile the household economic situation of food insecure and severely food insecure households, associations between different measures of poverty and household food insecurity were analysed.
Using the poverty lines defined in the Poverty chapter, there are strong correlations between poverty and food insecurity. Poor households are almost twice as likely to be severely food-insecure (odds ratio=1.97 (1.56-2.50)), whereas households living in extreme poverty are over three times as likely to be severely food insecure (odds ratio=3.04 (1.71-5.39)). Fifty-eight per cent of households experience moderate food insecurity and 68 per cent of the households experiencing severe food insecurity are classified as poor.
The associations between poverty and food insecurity are similar to those reported in 2010, with a significant, but
with average food expenditure (in US$) increasing at all levels of food security in comparison with 2010; this trend is most likely due to food price inflation of approximately 13.5 per cent.119
Severely food insecure households are more likely to receive welfare from UNRWA, with 52 per cent of severely food insecure, and 44 per cent of moderately food insecure households reporting that they benefit from the Social Safety Net programme.120 These numbers are slightly lower than proportions of households receiving assistance in 2010. However, the smallest reduction in assistance is in the severely food insecure, indicating that the programme remains well-targeted. It is likely that food aid received from UNRWA is enough to keep part of those vulnerable to food insecurity above food insecurity levels, but it is not sufficient to moderately lift them and severely food insecure households out of food insecurity.
economic susceptibilityto food insecurity
Poor, per cent
Extreme poor, per cent
Average monthly household expenditure per capita, (US$), mean
Average monthly food expenditure per capita, (US$), mean
Number of food-related assets++, mean
Receiving UNRWA welfare, per cent
2464
2464
2514
2788
2797
44.8
1.3
245.2a
95.8a
2.4a
27.5***
57.5
1.4
215.5b
78.2b
2.2b
43.5***
67.5
4.0
189.4c
68.3c
2.0c
52.0***
n Food SecureModerately
food insecureSeverely food
insecureTABLE 53: ECONOMIC CHARACTERISTICS OF PRL BY LEVELS OF HOUSEHOLD FOOD SECURITY
a) Significantly different from moderately and severely food insecure households (p<0.05)b) Significantly different from food secure and severely food insecure households (p<0.05)c) Significantly different from food secure and moderately food insecure households (p<0.05)
++Food-related assets represent the sum of fridge, freezer, oven, and microwave
119 Based on rough calculations taking the CAS CPI for 2010 and 2013.120 All SSN beneficiaries in Lebanon receive a combination of food in-kind and cash assistance distributed on quarterly basis. The assistance per beneficiary per quarter includes: 3 Kg of rice, 3 kg of sugar, 3 litres of oil, 1.5 kg of whole milk, 1 kg of lentil, 1 kg of chick peas and 1 kg of white beans and US$ 10 per family member.
CHAPTER SIX // FOOD SECURITY OF PALESTINE REFUGEES IN LEBANON116
Denotes significance at the 0.1% level,Denotes significance at the 1% level andDenotes significance at the 5% level using Pearson’s chi-squared test.
******
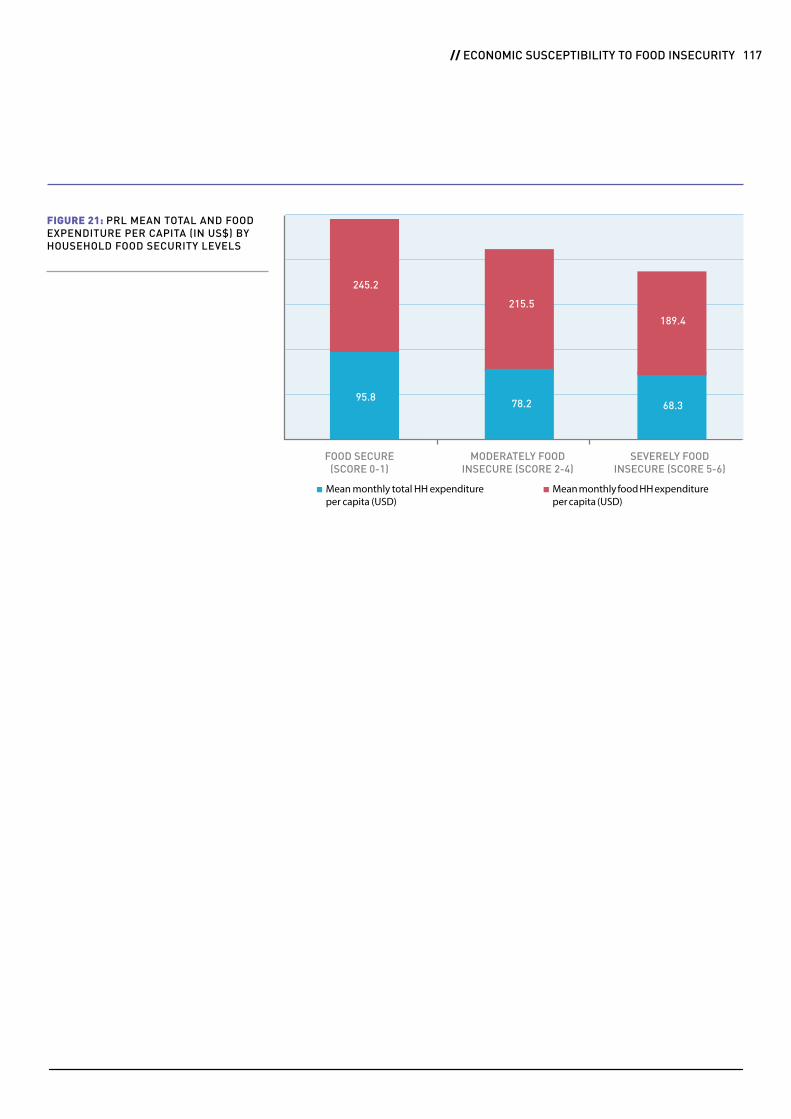
Mean monthly total HH expenditure per capita (USD)
Mean monthly food HH expenditure per capita (USD)
95.878.2 68.3
245.2
215.5
189.4
FOOD SECURE(SCORE 0-1)
SEVERELY FOOD INSECURE (SCORE 5-6)
MODERATELY FOOD INSECURE (SCORE 2-4)
FIGURE 21: PRL MEAN TOTAL AND FOOD EXPENDITURE PER CAPITA (IN US$) BY HOUSEHOLD FOOD SECURITY LEVELS
117 // ECONOMIC SUSCEPTIBILITY TO FOOD INSECURITY
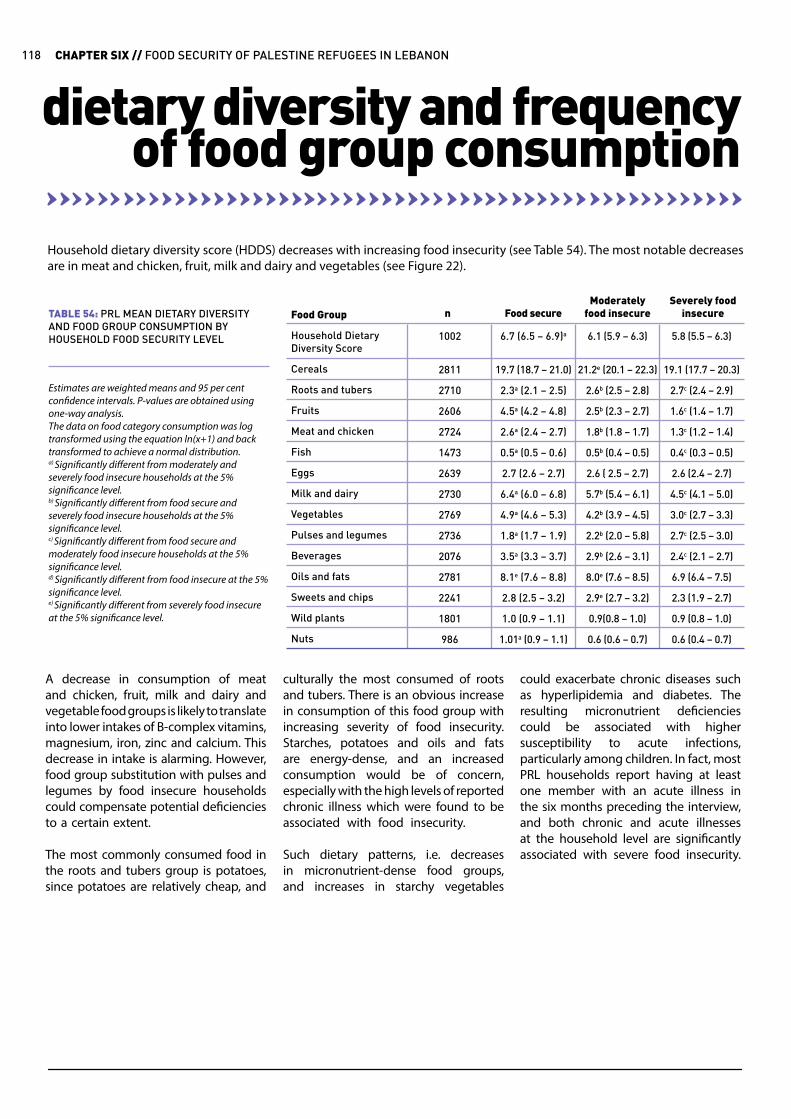
Household dietary diversity score (HDDS) decreases with increasing food insecurity (see Table 54). The most notable decreases are in meat and chicken, fruit, milk and dairy and vegetables (see Figure 22).
dietary diversity and frequency of food group consumption
Food Group
Household Dietary Diversity Score
Cereals
Roots and tubers
Fruits
Meat and chicken
Fish
Eggs
Milk and dairy
Vegetables
Pulses and legumes
Beverages
Oils and fats
Sweets and chips
Wild plants
Nuts
1002
2811
2710
2606
2724
1473
2639
2730
2769
2736
2076
2781
2241
1801
986
6.7 (6.5 – 6.9)a
19.7 (18.7 – 21.0)
2.3a (2.1 – 2.5)
4.5a (4.2 – 4.8)
2.6a (2.4 – 2.7)
0.5a (0.5 – 0.6)
2.7 (2.6 – 2.7)
6.4a (6.0 – 6.8)
4.9a (4.6 – 5.3)
1.8a (1.7 – 1.9)
3.5a (3.3 – 3.7)
8.1e (7.6 – 8.8)
2.8 (2.5 – 3.2)
1.0 (0.9 – 1.1)
1.01a (0.9 – 1.1)
6.1 (5.9 – 6.3)
21.2e (20.1 – 22.3)
2.6b (2.5 – 2.8)
2.5b (2.3 – 2.7)
1.8b (1.8 – 1.7)
0.5b (0.4 – 0.5)
2.6 ( 2.5 – 2.7)
5.7b (5.4 – 6.1)
4.2b (3.9 – 4.5)
2.2b (2.0 – 5.8)
2.9b (2.6 – 3.1)
8.0e (7.6 – 8.5)
2.9e (2.7 – 3.2)
0.9(0.8 – 1.0)
0.6 (0.6 – 0.7)
5.8 (5.5 – 6.3)
19.1 (17.7 – 20.3)
2.7c (2.4 – 2.9)
1.6c (1.4 – 1.7)
1.3c (1.2 – 1.4)
0.4c (0.3 – 0.5)
2.6 (2.4 – 2.7)
4.5c (4.1 – 5.0)
3.0c (2.7 – 3.3)
2.7c (2.5 – 3.0)
2.4c (2.1 – 2.7)
6.9 (6.4 – 7.5)
2.3 (1.9 – 2.7)
0.9 (0.8 – 1.0)
0.6 (0.4 – 0.7)
n Food secureModerately
food insecureSeverely food
insecureTABLE 54: PRL MEAN DIETARY DIVERSITYAND FOOD GROUP CONSUMPTION BY HOUSEHOLD FOOD SECURITY LEVEL
Estimates are weighted means and 95 per cent confidence intervals. P-values are obtained using one-way analysis. The data on food category consumption was log transformed using the equation ln(x+1) and back transformed to achieve a normal distribution.a) Significantly different from moderately and severely food insecure households at the 5% significance level.b) Significantly different from food secure and severely food insecure households at the 5% significance level.c) Significantly different from food secure and moderately food insecure households at the 5% significance level.d) Significantly different from food insecure at the 5% significance level.e) Significantly different from severely food insecure at the 5% significance level.
culturally the most consumed of roots and tubers. There is an obvious increase in consumption of this food group with increasing severity of food insecurity. Starches, potatoes and oils and fats are energy-dense, and an increased consumption would be of concern, especially with the high levels of reported chronic illness which were found to be associated with food insecurity.
Such dietary patterns, i.e. decreases in micronutrient-dense food groups, and increases in starchy vegetables
A decrease in consumption of meat and chicken, fruit, milk and dairy and vegetable food groups is likely to translate into lower intakes of B-complex vitamins, magnesium, iron, zinc and calcium. This decrease in intake is alarming. However, food group substitution with pulses and legumes by food insecure households could compensate potential deficiencies to a certain extent.
The most commonly consumed food in the roots and tubers group is potatoes, since potatoes are relatively cheap, and
could exacerbate chronic diseases such as hyperlipidemia and diabetes. The resulting micronutrient deficiencies could be associated with higher susceptibility to acute infections, particularly among children. In fact, most PRL households report having at least one member with an acute illness in the six months preceding the interview, and both chronic and acute illnesses at the household level are significantly associated with severe food insecurity.
CHAPTER SIX // FOOD SECURITY OF PALESTINE REFUGEES IN LEBANON118

FIGURE 22: PRL MEAN WEEKLY HOUSEHOLD CONSUMPTION OF FOOD GROUPS BY FOOD INSECURITY LEVELS (FREQUENCY/WEEK)
Dietary diversity and food group consumption data are very similar to those reported in 2010, with reductions in the same food groups by increasing severity of food insecurity (starting with the food insecure on the left of the figure, the moderately food insecure in the middle of figure and the severely food insecure on the right of the figure).
FOOD SECURE SEVERELY FOOD INSECURE
MODERATELY FOOD INSECURE
FishFruits
Roots and TubersDairy
Pulses and LegumesVegetables
Meat and ChickenOils and Fats
9
7
5
3
1
8
6
4
2
0
119 // DIETARY DIVERSITY AND FREQUENCY OF FOOD GROUP CONSUMPTION
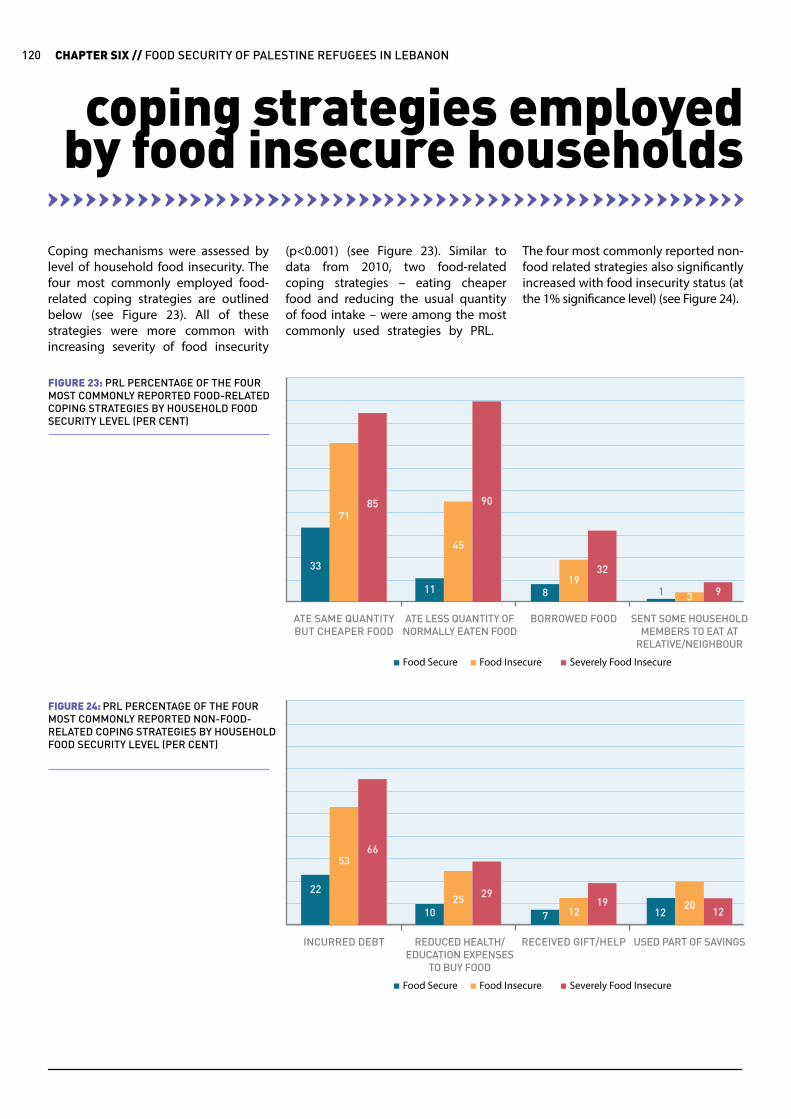
(p<0.001) (see Figure 23). Similar to data from 2010, two food-related coping strategies – eating cheaper food and reducing the usual quantity of food intake – were among the most commonly used strategies by PRL.
Coping mechanisms were assessed by level of household food insecurity. The four most commonly employed food-related coping strategies are outlined below (see Figure 23). All of these strategies were more common with increasing severity of food insecurity
The four most commonly reported non-food related strategies also significantly increased with food insecurity status (at the 1% significance level) (see Figure 24).
coping strategies employed by food insecure households
ATE SAME QUANTITY BUT CHEAPER FOOD
BORROWED FOODATE LESS QUANTITY OF NORMALLY EATEN FOOD
SENT SOME HOUSEHOLD MEMBERS TO EAT AT
RELATIVE/NEIGHBOUR
FIGURE 23: PRL PERCENTAGE OF THE FOUR MOST COMMONLY REPORTED FOOD-RELATED COPING STRATEGIES BY HOUSEHOLD FOOD SECURITY LEVEL (PER CENT)
33
11 8 1
71
45
19
85 90
32
9
Food Secure Severely Food InsecureFood Insecure
INCURRED DEBT RECEIVED GIFT/HELPREDUCED HEALTH/EDUCATION EXPENSES
TO BUY FOOD
USED PART OF SAVINGS
FIGURE 24: PRL PERCENTAGE OF THE FOUR MOST COMMONLY REPORTED NON-FOOD-RELATED COPING STRATEGIES BY HOUSEHOLD FOOD SECURITY LEVEL (PER CENT)
22
10 7
53
2512
2012
66
2919
12
Food Secure Severely Food InsecureFood Insecure
3
CHAPTER SIX // FOOD SECURITY OF PALESTINE REFUGEES IN LEBANON120
In conclusion, increasing poverty and unemployment rates and lower educational attainment come hand-in-hand with increasing food insecurity among PRL families. Moreover, just over a third of PRL survey respondents report being food secure. In addition, food insecurity increases with larger household sizes and in households that have a large number of unemployed. Food insecure households are also more likely to have a member suffer from a chronic illness.
conclusion
121 // CONCLUSION

© 2015 UNRWA / Francesco Romagnolo
Housing Quality and Access to Water, Sanitation and Hygiene (WASH) for Palestine Refugees in Lebanon lara batlouni, nisreen salti, alexandra irani
CHAPTERSEVEN
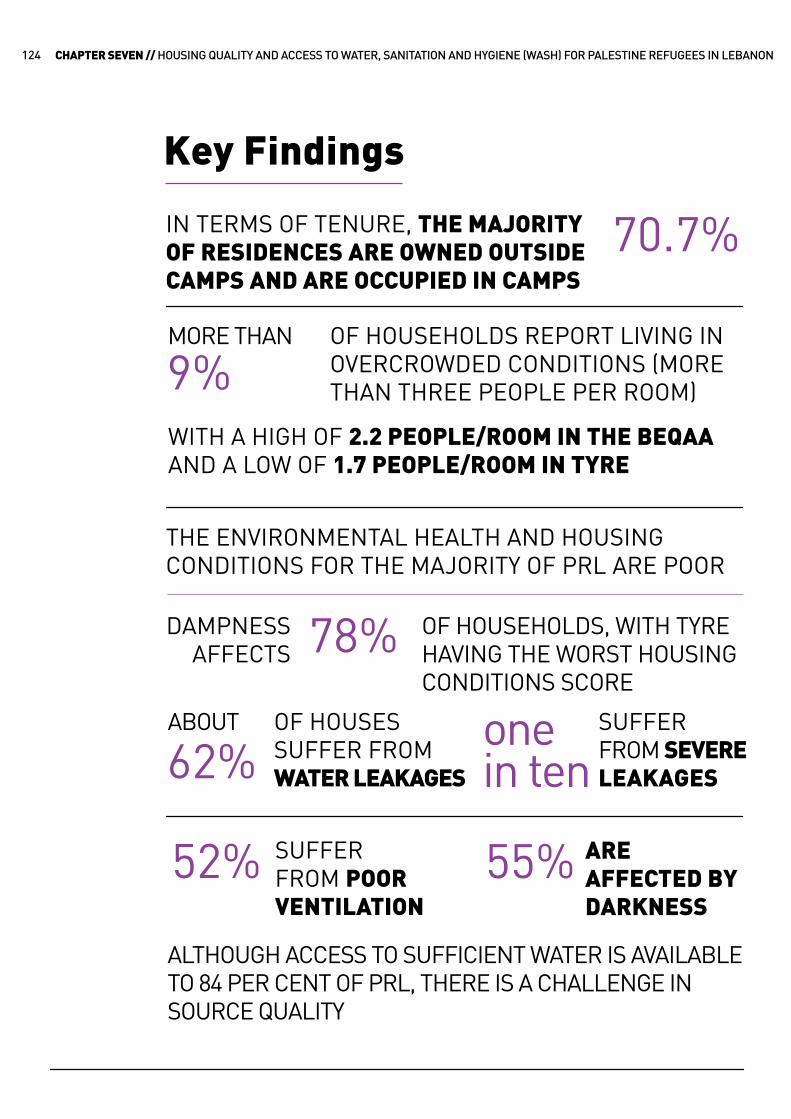
9%
62%onein ten
Key Findings
IN TERMS OF TENURE, THE MAJORITY OF RESIDENCES ARE OWNED OUTSIDE CAMPS AND ARE OCCUPIED IN CAMPS
THE ENVIRONMENTAL HEALTH AND HOUSING CONDITIONS FOR THE MAJORITY OF PRL ARE POOR
WITH A HIGH OF 2.2 PEOPLE/ROOM IN THE BEQAA AND A LOW OF 1.7 PEOPLE/ROOM IN TYRE
SUFFERFROM POOR VENTILATION
DAMPNESSAFFECTS
OF HOUSEHOLDS, WITH TYRE HAVING THE WORST HOUSING CONDITIONS SCORE
AREAFFECTED BY DARKNESS
52%
70.7%
78%
55%
OF HOUSEHOLDS REPORT LIVING IN OVERCROWDED CONDITIONS (MORE THAN THREE PEOPLE PER ROOM)
OF HOUSES SUFFER FROM WATER LEAKAGES
SUFFER FROM SEVERE LEAKAGES
MORE THAN
ABOUT
ALTHOUGH ACCESS TO SUFFICIENT WATER IS AVAILABLE TO 84 PER CENT OF PRL, THERE IS A CHALLENGE IN SOURCE QUALITY
CHAPTER SEVEN // HOUSING QUALITY AND ACCESS TO WATER, SANITATION AND HYGIENE (WASH) FOR PALESTINE REFUGEES IN LEBANON124

THE MAIN SOURCE OF WASHING WATER
IS TAP WATER
FOLLOWEDBY
WELLS
CLA HAS THE HIGHEST SHARE OF HOUSEHOLDS THAT RELY ON PURCHASED WATER
SAIDA HAS THE HIGHEST RATE OF HOUSEHOLDS THAT USE TAP WATER
PRL households rely on several sources of precarious income, ranging from self-employment and wage labour, to UNRWA assistance through the SSN programme. Half of the households (48 per cent) fear losing their source of income, and 39.6 per cent worry about meeting their family’s daily needs.
ELECTRICITY IS THE MOST COMMON MEANS USED FOR HEATING IN ALL REGIONS (39.6 PER CENT) EXCEPT FOR THE BEQAA, WHERE THE USE OF DIESEL IS WIDESPREAD (85.5 PER CENT), ESPECIALLY DURING WINTER
OF PRL HOUSEHOLDS PURCHASE WATER FOR DRINKING
OF HOUSEHOLDS USE TAP WATER FOR DRINKING
USE IT FOR COOKING, DESPITE THE FACT THAT IT IS NOT POTABLE
FORDRINKING
FORCOOKING
OF PRL HOUSEHOLDS PURCHASE WATER FOR COOKING
61%
27%
38%
94%
70% 12.9%
96%
51%
CHAPTER SEVEN // HOUSING QUALITY AND ACCESS TO WATER, SANITATION AND HYGIENE (WASH) FOR PALESTINE REFUGEES IN LEBANON 125 // KEY FINDINGS
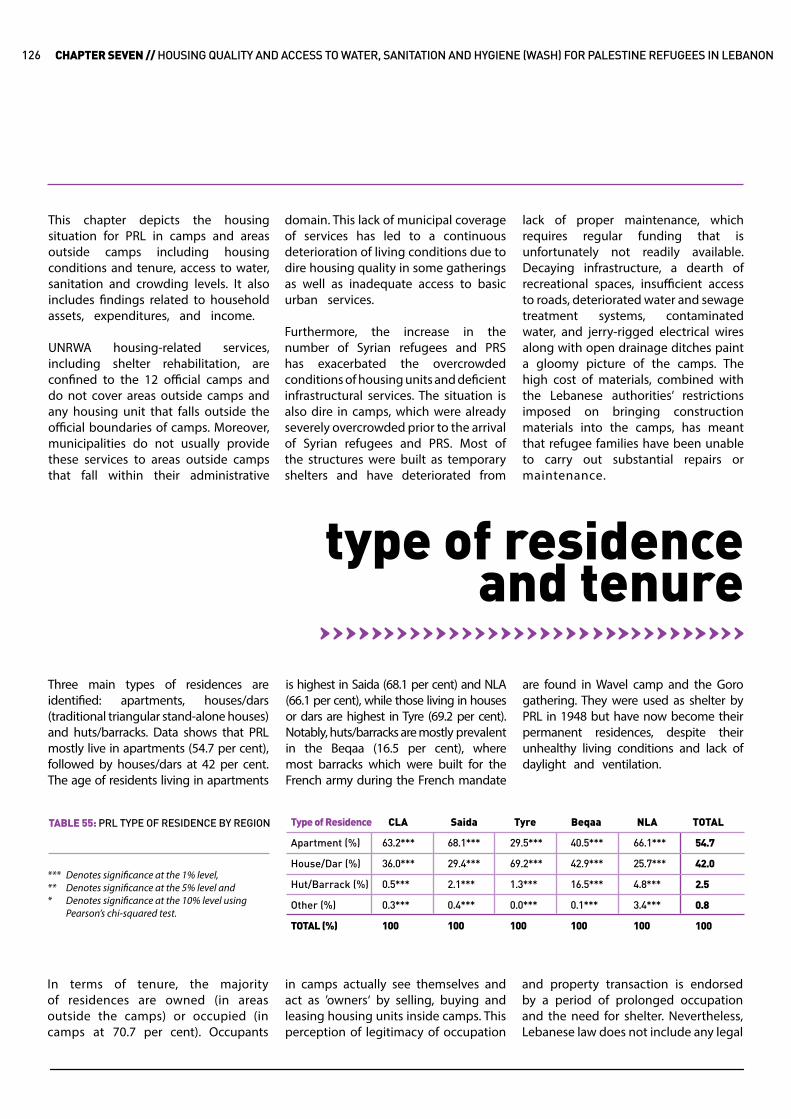
This chapter depicts the housing situation for PRL in camps and areas outside camps including housing conditions and tenure, access to water, sanitation and crowding levels. It also includes findings related to household assets, expenditures, and income.
UNRWA housing-related services, including shelter rehabilitation, are confined to the 12 official camps and do not cover areas outside camps and any housing unit that falls outside the official boundaries of camps. Moreover, municipalities do not usually provide these services to areas outside camps that fall within their administrative
domain. This lack of municipal coverage of services has led to a continuous deterioration of living conditions due to dire housing quality in some gatherings as well as inadequate access to basic urban services.
Furthermore, the increase in the number of Syrian refugees and PRS has exacerbated the overcrowded conditions of housing units and deficient infrastructural services. The situation is also dire in camps, which were already severely overcrowded prior to the arrival of Syrian refugees and PRS. Most of the structures were built as temporary shelters and have deteriorated from
lack of proper maintenance, which requires regular funding that is unfortunately not readily available. Decaying infrastructure, a dearth of recreational spaces, insufficient access to roads, deteriorated water and sewage treatment systems, contaminated water, and jerry-rigged electrical wires along with open drainage ditches paint a gloomy picture of the camps. The high cost of materials, combined with the Lebanese authorities’ restrictions imposed on bringing construction materials into the camps, has meant that refugee families have been unable to carry out substantial repairs or maintenance.
is highest in Saida (68.1 per cent) and NLA (66.1 per cent), while those living in houses or dars are highest in Tyre (69.2 per cent). Notably, huts/barracks are mostly prevalent in the Beqaa (16.5 per cent), where most barracks which were built for the French army during the French mandate
in camps actually see themselves and act as ’owners‘ by selling, buying and leasing housing units inside camps. This perception of legitimacy of occupation
Three main types of residences are identified: apartments, houses/dars (traditional triangular stand-alone houses) and huts/barracks. Data shows that PRL mostly live in apartments (54.7 per cent), followed by houses/dars at 42 per cent. The age of residents living in apartments
In terms of tenure, the majority of residences are owned (in areas outside the camps) or occupied (in camps at 70.7 per cent). Occupants
are found in Wavel camp and the Goro gathering. They were used as shelter by PRL in 1948 but have now become their permanent residences, despite their unhealthy living conditions and lack of daylight and ventilation.
and property transaction is endorsed by a period of prolonged occupation and the need for shelter. Nevertheless, Lebanese law does not include any legal
type of residenceand tenure
Type of Residence
Apartment (%)
House/Dar (%)
Hut/Barrack (%)
Other (%)
TOTAL (%)
63.2***
36.0***
0.5***
0.3***
100
68.1***
29.4***
2.1***
0.4***
100
29.5***
69.2***
1.3***
0.0***
100
40.5***
42.9***
16.5***
0.1***
100
66.1***
25.7***
4.8***
3.4***
100
54.7
42.0
2.5
0.8
100
CLA Saida Tyre Beqaa NLA TOTALTABLE 55: PRL TYPE OF RESIDENCE BY REGION
CHAPTER SEVEN // HOUSING QUALITY AND ACCESS TO WATER, SANITATION AND HYGIENE (WASH) FOR PALESTINE REFUGEES IN LEBANON126
Denotes significance at the 1% level,Denotes significance at the 5% level andDenotes significance at the 10% level using Pearson’s chi-squared test.
******
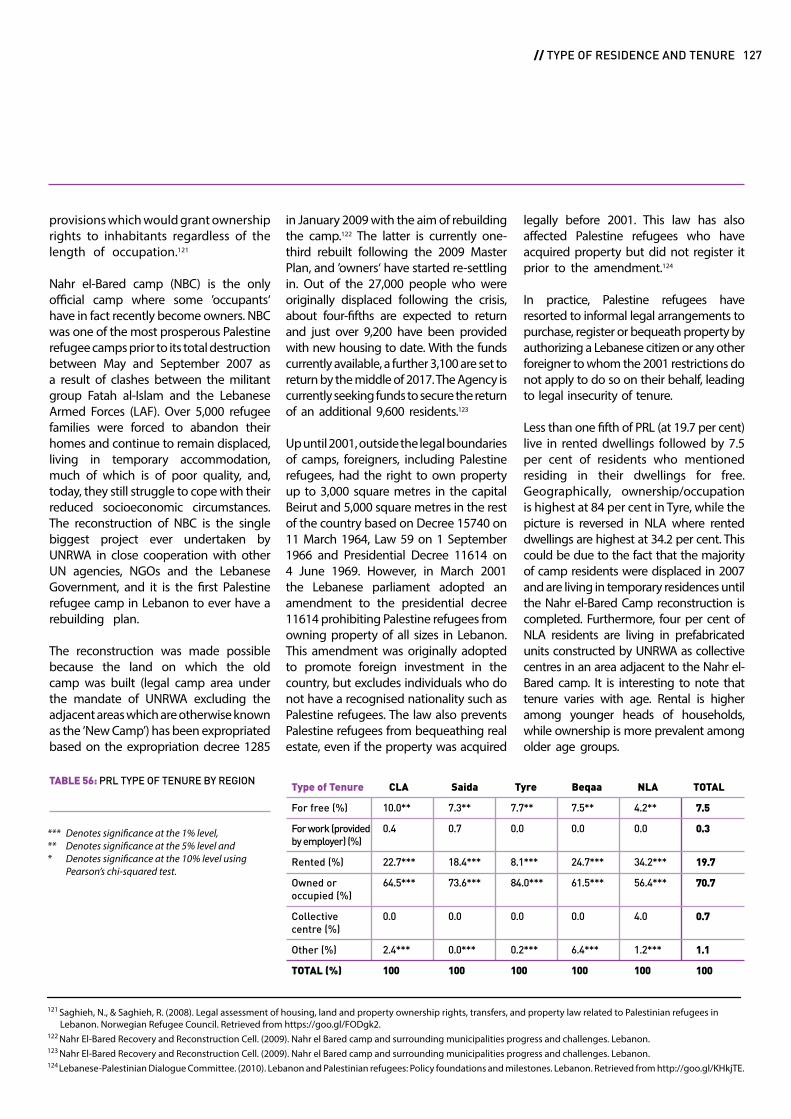
provisions which would grant ownership rights to inhabitants regardless of the length of occupation.121
Nahr el-Bared camp (NBC) is the only official camp where some ’occupants‘ have in fact recently become owners. NBC was one of the most prosperous Palestine refugee camps prior to its total destruction between May and September 2007 as a result of clashes between the militant group Fatah al-Islam and the Lebanese Armed Forces (LAF). Over 5,000 refugee families were forced to abandon their homes and continue to remain displaced, living in temporary accommodation, much of which is of poor quality, and, today, they still struggle to cope with their reduced socioeconomic circumstances. The reconstruction of NBC is the single biggest project ever undertaken by UNRWA in close cooperation with other UN agencies, NGOs and the Lebanese Government, and it is the first Palestine refugee camp in Lebanon to ever have a rebuilding plan.
The reconstruction was made possible because the land on which the old camp was built (legal camp area under the mandate of UNRWA excluding the adjacent areas which are otherwise known as the ’New Camp’) has been expropriated based on the expropriation decree 1285
in January 2009 with the aim of rebuilding the camp.122 The latter is currently one-third rebuilt following the 2009 Master Plan, and ’owners‘ have started re-settling in. Out of the 27,000 people who were originally displaced following the crisis, about four-fifths are expected to return and just over 9,200 have been provided with new housing to date. With the funds currently available, a further 3,100 are set to return by the middle of 2017. The Agency is currently seeking funds to secure the return of an additional 9,600 residents.123
Up until 2001, outside the legal boundaries of camps, foreigners, including Palestine refugees, had the right to own property up to 3,000 square metres in the capital Beirut and 5,000 square metres in the rest of the country based on Decree 15740 on 11 March 1964, Law 59 on 1 September 1966 and Presidential Decree 11614 on 4 June 1969. However, in March 2001 the Lebanese parliament adopted an amendment to the presidential decree 11614 prohibiting Palestine refugees from owning property of all sizes in Lebanon. This amendment was originally adopted to promote foreign investment in the country, but excludes individuals who do not have a recognised nationality such as Palestine refugees. The law also prevents Palestine refugees from bequeathing real estate, even if the property was acquired
legally before 2001. This law has also affected Palestine refugees who have acquired property but did not register it prior to the amendment.124
In practice, Palestine refugees have resorted to informal legal arrangements to purchase, register or bequeath property by authorizing a Lebanese citizen or any other foreigner to whom the 2001 restrictions do not apply to do so on their behalf, leading to legal insecurity of tenure.
Less than one fifth of PRL (at 19.7 per cent) live in rented dwellings followed by 7.5 per cent of residents who mentioned residing in their dwellings for free. Geographically, ownership/occupation is highest at 84 per cent in Tyre, while the picture is reversed in NLA where rented dwellings are highest at 34.2 per cent. This could be due to the fact that the majority of camp residents were displaced in 2007 and are living in temporary residences until the Nahr el-Bared Camp reconstruction is completed. Furthermore, four per cent of NLA residents are living in prefabricated units constructed by UNRWA as collective centres in an area adjacent to the Nahr el-Bared camp. It is interesting to note that tenure varies with age. Rental is higher among younger heads of households, while ownership is more prevalent among older age groups.
121 Saghieh, N., & Saghieh, R. (2008). Legal assessment of housing, land and property ownership rights, transfers, and property law related to Palestinian refugees in Lebanon. Norwegian Refugee Council. Retrieved from https://goo.gl/FODgk2.122 Nahr El-Bared Recovery and Reconstruction Cell. (2009). Nahr el Bared camp and surrounding municipalities progress and challenges. Lebanon.123 Nahr El-Bared Recovery and Reconstruction Cell. (2009). Nahr el Bared camp and surrounding municipalities progress and challenges. Lebanon.124 Lebanese-Palestinian Dialogue Committee. (2010). Lebanon and Palestinian refugees: Policy foundations and milestones. Lebanon. Retrieved from http://goo.gl/KHkjTE.
Type of Tenure
For free (%)
For work (provided by employer) (%)
Rented (%)
Owned or occupied (%)
Collectivecentre (%)
Other (%)
TOTAL (%)
10.0**
0.4
22.7***
64.5***
0.0
2.4***
100
7.3**
0.7
18.4***
73.6***
0.0
0.0***
100
7.7**
0.0
8.1***
84.0***
0.0
0.2***
100
7.5**
0.0
24.7***
61.5***
0.0
6.4***
100
4.2**
0.0
34.2***
56.4***
4.0
1.2***
100
7.5
0.3
19.7
70.7
0.7
1.1
100
CLA Saida Tyre Beqaa NLA TOTALTABLE 56: PRL TYPE OF TENURE BY REGION
CHAPTER SEVEN // HOUSING QUALITY AND ACCESS TO WATER, SANITATION AND HYGIENE (WASH) FOR PALESTINE REFUGEES IN LEBANON 127 // TYPE OF RESIDENCE AND TENURE
Denotes significance at the 1% level,Denotes significance at the 5% level andDenotes significance at the 10% level using Pearson’s chi-squared test.
******

The incidence of moving to new residences is generally low with less than 10 per cent of PRL reporting switching houses in the past year. House switching was mainly reported in NLA where 7.7 per cent of PRL have switched houses once in the past year and 3.3 per cent have switched houses between three to five times. This switching trend, too, can be attributed to the displacement of the Nahr el-Bared residents since 2007.
UNRWA provides refugees living inside camps under its Infrastructure and Camp Improvement Programme (ICIP) with infrastructure construction and improvement schemes including shelter, electricity, water and sanitation
services. This includes rehabilitating public spaces, schools, clinics and private households. The Agency also works on improving roads and controlling outbreaks of water-borne diseases. The initiative was jointly launched in 2006 with the Government of Lebanon, in coordination with the Palestine Liberation Organization (PLO). However, due to legal aspects of land ownership, UNRWA is prevented from extending those services to refugees living outside the legal boundaries of camps.
The UNRWA shelter rehabilitation scheme has benefited 9.2 per cent of total residences of Palestine refugees (compared to 5.9 per cent in 2010). This figure is highest in
Tyre at 15 per cent (in 2010 as well), and lowest in Central Lebanon Area (CLA) at 4.3 per cent. It is important to note that over 76 per cent of beneficiaries from the UNRWA Shelter Rehabilitation Programme are Social Safety Net cases. Recipients of financial or in-kind assistance from non-UNRWA programmes are also more likely to benefit from the Shelter Rehabilitation Programme. Beneficiaries of UNRWA Shelter Rehabilitation Programme have a “significantly” lower average consumption aggregate when compared to PRL who have not benefitted from the programme, which indicates that the programme is successful in targeting the most vulnerable households.
TABLE 57: PRL AVERAGE CONSUMPTION AGGREGATE BY PARTICIPATION IN THE UNRWA SHELTER REHABILITATION SCHEME
Has your household benefited from the UNRWA shelter rehabilitation scheme?
Yes
No
187.4
221.2
Average consumption aggregate(US$/month)
Between 2011 and 2014 UNRWA undertook initial assessments of 9,100 shelters across 11 Palestine refugee camps in Lebanon (excluding NBC which is under reconstruction) out of which 8,879 were deemed in need of shelter assistance. To date, 2,504 have already been rehabilitated or are in the process of being rehabilitated, of which 29 per cent are in Ein El Hilweh camp. This number of rehabilitated units leaves 6,375 shelters still in need of funding with almost a third in Ein El Hilweh alone thus indicating the dire living conditions of the camp.125 The presence of PRS is adding considerable strain on camp infrastructure such as water lines. The increased production of waste also heightens the risk of infectious disease outbreaks. UNRWA has been continuously working on upgrading water, sanitation and solid waste infrastructure to meet the additional demand.
Refugees residing in the camps are included in the planning, construction
and improvement activities. The Agency has adopted a self-help approach for shelter rehabilitation where Palestine refugees are encouraged to implement improvement work themselves and receive technical support from UNRWA engineers throughout the process.
UNRWA is currently involved in major shelter rehabilitation programmes in Rashidieh Camp in Tyre and Ein El Hilweh Camp in Saida. In Rashidieh camp, UNRWA and the Federal Republic of Germany (through the Federal Bank for Development) are managing two projects focused on water supply network improvement and shelter rehabilitation. The camp remained without a sewage network for decades after its establishment and, as a result, raw sewage flows in open drainage channels directly into the sea causing an environmental health hazard for camp residents and the Tyre population as a whole. The shelter rehabilitation project
is expected to benefit over 250 families, while the rehabilitation and upgrading of the water network will benefit all the camp’s residents.126
As for Ein El Hilweh, one of the most populous refugee camps in Lebanon, it has remained without proper infrastructure facilities for decades. The camp suffers from severe flooding during the winter, insufficient water supply and sewage leakages. Subsequently, UNRWA and the Japan International Cooperation Agency (JICA) launched a project in 2013 to rehabilitate part of the water supply and sewage system in the camp.
Other organizations complement rehabilitation schemes provided by UNRWA and have targeted 3.7 per cent of residences (3.9 per cent in 2010), the highest concentration being in Tyre at 6.3 per cent.
125 United Nations Relief and Works Agency. (2015). Shelter rehabilitation briefing note.126 United Nations Relief and Works Agency. (2010). Building better, for less. Retrieved from http://goo.gl/RQOMbd.
CHAPTER SEVEN // HOUSING QUALITY AND ACCESS TO WATER, SANITATION AND HYGIENE (WASH) FOR PALESTINE REFUGEES IN LEBANON128
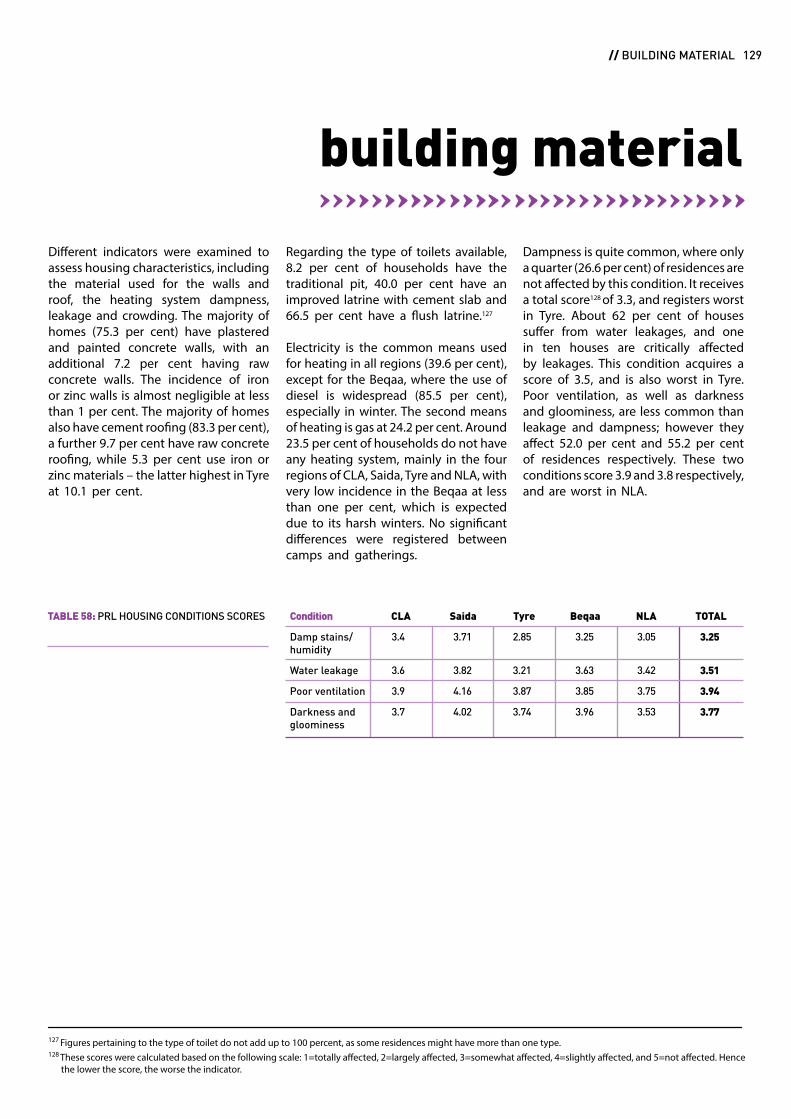
127 Figures pertaining to the type of toilet do not add up to 100 percent, as some residences might have more than one type.128 These scores were calculated based on the following scale: 1=totally affected, 2=largely affected, 3=somewhat affected, 4=slightly affected, and 5=not affected. Hence the lower the score, the worse the indicator.
building material
Regarding the type of toilets available, 8.2 per cent of households have the traditional pit, 40.0 per cent have an improved latrine with cement slab and 66.5 per cent have a flush latrine.127
Electricity is the common means used for heating in all regions (39.6 per cent), except for the Beqaa, where the use of diesel is widespread (85.5 per cent), especially in winter. The second means of heating is gas at 24.2 per cent. Around 23.5 per cent of households do not have any heating system, mainly in the four regions of CLA, Saida, Tyre and NLA, with very low incidence in the Beqaa at less than one per cent, which is expected due to its harsh winters. No significant differences were registered between camps and gatherings.
Different indicators were examined to assess housing characteristics, including the material used for the walls and roof, the heating system dampness, leakage and crowding. The majority of homes (75.3 per cent) have plastered and painted concrete walls, with an additional 7.2 per cent having raw concrete walls. The incidence of iron or zinc walls is almost negligible at less than 1 per cent. The majority of homes also have cement roofing (83.3 per cent), a further 9.7 per cent have raw concrete roofing, while 5.3 per cent use iron or zinc materials – the latter highest in Tyre at 10.1 per cent.
Dampness is quite common, where only a quarter (26.6 per cent) of residences are not affected by this condition. It receives a total score128 of 3.3, and registers worst in Tyre. About 62 per cent of houses suffer from water leakages, and one in ten houses are critically affected by leakages. This condition acquires a score of 3.5, and is also worst in Tyre. Poor ventilation, as well as darkness and gloominess, are less common than leakage and dampness; however they affect 52.0 per cent and 55.2 per cent of residences respectively. These two conditions score 3.9 and 3.8 respectively, and are worst in NLA.
Condition
Damp stains/humidity
Water leakage
Poor ventilation
Darkness and gloominess
3.4
3.6
3.9
3.7
3.71
3.82
4.16
4.02
2.85
3.21
3.87
3.74
3.25
3.63
3.85
3.96
3.05
3.42
3.75
3.53
3.25
3.51
3.94
3.77
CLA Saida Tyre Beqaa NLA TOTALTABLE 58: PRL HOUSING CONDITIONS SCORES
CHAPTER SEVEN // HOUSING QUALITY AND ACCESS TO WATER, SANITATION AND HYGIENE (WASH) FOR PALESTINE REFUGEES IN LEBANON 129 // BUILDING MATERIAL

living space
conditions – where there are more than three people per room – compared to 7.5 per cent in 2010. This figure shows regional disparities, where the index registers lowest in Tyre at 6.0 per cent
The crowding index, which is the number of people per room in the household, measures restrictions on the living space. More than 9 per cent of households reported living in overcrowded
and highest in the Beqaa at 16.3 per cent. The data also reveals that the average number of persons per room reaches 1.8 nationally, varying between a high of 2.2 in the Beqaa and a low of 1.7 in Tyre.
Number of persons
1 (%)
2-3 (%)
> 3 (%)
TOTAL
67.2**
24.4**
8.4**
100
67.9**
21.3**
10.9**
100
69.2**
24.8**
6.0**
100
46.3**
37.4**
16.3**
100
61.2**
26.9**
11.9**
100
66.0
24.7
9.3
100
57.6**
34.9**
7.5**
100
CLA Saida Tyre Beqaa NLA TOTAL 2010TABLE 59: PRL CROWDING INDEX BY REGION
Beqaa where two-thirds (68.7 per cent) of households have more than three people sleeping in a room, compared to one third (37.9 per cent) of households in CLA. On average, the number of persons sleeping in one room is 3.2 nationally. More than half the residences
Overcrowding can be also looked at from the perspective of sleeping rooms. In this respect, close to half (45.6 per cent) of households have more than three persons sleeping in the same room. This figure shows regional disparities, with overcrowding highest in the
(54.3 per cent) have a surface area of 60m2 or less. Households in the Beqaa tend to have smaller housing units, which contribute to overcrowding, while Saida has larger ones, as shown in Table 60.
Area (sq.m.)
0-10 (%)
11-20 (%)
21-40 (%)
41-60 (%)
61-100 (%)
101-200 (%)
TOTAL (%)
0.8
3.2
28.2
30.2***
30.6**
7.0***
100
0.1
2.4
19.1
16.5***
40.1**
21.9***
100
0.3
2.0
21.8
34.8***
39.0**
2.1***
100
1.3
3.7
30.1
29.0***
23.3**
12.7***
100
0.7
1.5
22.2
33.2***
35.0**
7.3***
100
0.5
2.4
23.1
28.4
35.9
9.8
100
CLA Saida Tyre Beqaa NLA TOTALTABLE 60: PRL SURFACE AREA OF RESIDENCE
CHAPTER SEVEN // HOUSING QUALITY AND ACCESS TO WATER, SANITATION AND HYGIENE (WASH) FOR PALESTINE REFUGEES IN LEBANON130
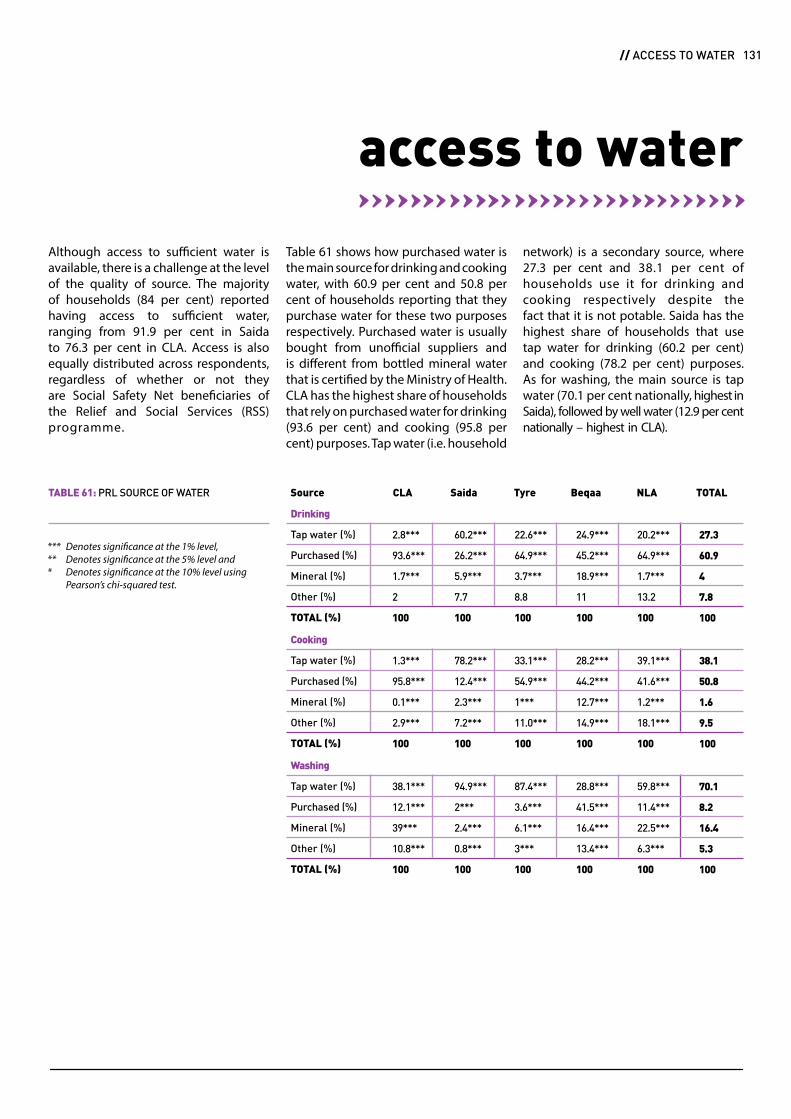
access to water
Table 61 shows how purchased water is the main source for drinking and cooking water, with 60.9 per cent and 50.8 per cent of households reporting that they purchase water for these two purposes respectively. Purchased water is usually bought from unofficial suppliers and is different from bottled mineral water that is certified by the Ministry of Health. CLA has the highest share of households that rely on purchased water for drinking (93.6 per cent) and cooking (95.8 per cent) purposes. Tap water (i.e. household
Although access to sufficient water is available, there is a challenge at the level of the quality of source. The majority of households (84 per cent) reported having access to sufficient water, ranging from 91.9 per cent in Saida to 76.3 per cent in CLA. Access is also equally distributed across respondents, regardless of whether or not they are Social Safety Net beneficiaries of the Relief and Social Services (RSS) programme.
network) is a secondary source, where 27.3 per cent and 38.1 per cent of households use it for drinking and cooking respectively despite the fact that it is not potable. Saida has the highest share of households that use tap water for drinking (60.2 per cent) and cooking (78.2 per cent) purposes. As for washing, the main source is tap water (70.1 per cent nationally, highest in Saida), followed by well water (12.9 per cent nationally – highest in CLA).
Drinking
Tap water (%)
Purchased (%)
Mineral (%)
Other (%)
TOTAL (%)
Cooking
Tap water (%)
Purchased (%)
Mineral (%)
Other (%)
TOTAL (%)
Washing
Tap water (%)
Purchased (%)
Mineral (%)
Other (%)
TOTAL (%)
2.8***
93.6***
1.7***
2
100
1.3***
95.8***
0.1***
2.9***
100
38.1***
12.1***
39***
10.8***
100
60.2***
26.2***
5.9***
7.7
100
78.2***
12.4***
2.3***
7.2***
100
94.9***
2***
2.4***
0.8***
100
22.6***
64.9***
3.7***
8.8
100
33.1***
54.9***
1***
11.0***
100
87.4***
3.6***
6.1***
3***
100
24.9***
45.2***
18.9***
11
100
28.2***
44.2***
12.7***
14.9***
100
28.8***
41.5***
16.4***
13.4***
100
20.2***
64.9***
1.7***
13.2
100
39.1***
41.6***
1.2***
18.1***
100
59.8***
11.4***
22.5***
6.3***
100
27.3
60.9
4
7.8
100
38.1
50.8
1.6
9.5
100
70.1
8.2
16.4
5.3
100
CLASource Saida Tyre Beqaa NLA TOTALTABLE 61: PRL SOURCE OF WATER
CHAPTER SEVEN // HOUSING QUALITY AND ACCESS TO WATER, SANITATION AND HYGIENE (WASH) FOR PALESTINE REFUGEES IN LEBANON 131 // ACCESS TO WATER
Denotes significance at the 1% level,Denotes significance at the 5% level andDenotes significance at the 10% level using Pearson’s chi-squared test.
******

household assets
source of income 129
ranging from 35.7 per cent in Tyre to 27.0 per cent in NLA.
On average, households owned between 9 and 10 appliances. More than half of households (58.9 per cent) own between 6 and 10 appliances and a further 33.9 per cent own between 11 and 20. In the Beqaa, 89.8 per cent of households own between 6 and 20
(35.9 per cent) of households to be one of the sources of income. Remittances represent a source of income at 18.2 per cent of households.
When asked about protection concerns, more than one third of respondents (39.6 per cent) report worrying about being unable to provide daily necessities.
Two categories of assets were looked into: ’transportation vehicles‘ and ’electronics and home appliances’.
About two thirds (62.5 per cent) of households do not possess transportation vehicles, varying from a low of 58.7 per cent in Tyre to a high of 68.8 per cent in NLA. A further 32.3 per cent of households own one vehicle,
Households rely on several sources of income. The main source of income is self-employment, whereby 41 per cent of respondents stated it to be as their source of household income. The second source is wage labour (37.8 per cent), followed by UNRWA assistance through the SSN programme (33.5 per cent). Loans were reported by more than one third
appliances compared to 94.1 per cent of households in CLA. More specifically, the survey revealed that 3.7 per cent of PRL households do not own a fridge (highest in the Beqaa and Tyre at 5 per cent), 6.1 per cent do not own a washing machine (highest in CLA at 7.5 per cent) and 6.6 per cent do not own a water heater (highest in NLA at 10.8 per cent).
This figure varies by geographical area, where CLA registers the largest share at 45.5 per cent and Saida the lowest at 35.0 per cent. Data shows that males and older age groups tend to worry more about the inability to provide for themselves and their families than females and younger people.
129 Total household expenditure was used as a proxy for the income variable, as the income variable might be underreported by households.
CHAPTER SEVEN // HOUSING QUALITY AND ACCESS TO WATER, SANITATION AND HYGIENE (WASH) FOR PALESTINE REFUGEES IN LEBANON132
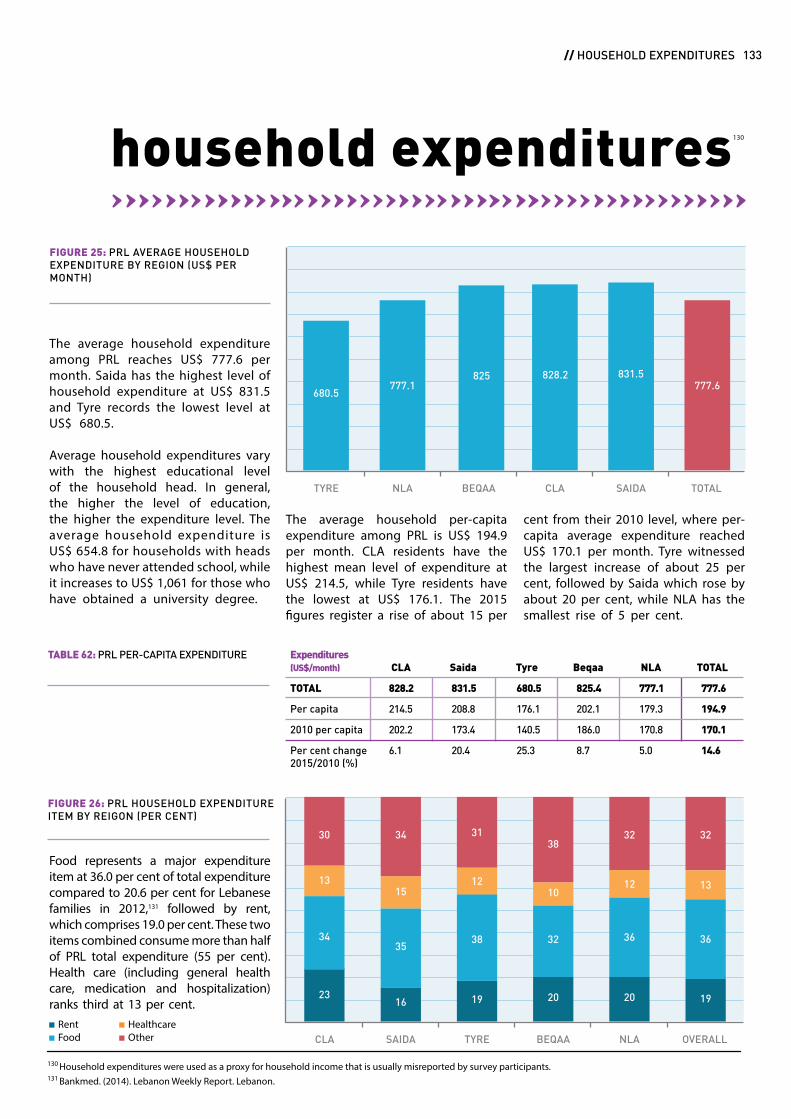
130 Household expenditures were used as a proxy for household income that is usually misreported by survey participants.131 Bankmed. (2014). Lebanon Weekly Report. Lebanon.
The average household per-capita expenditure among PRL is US$ 194.9 per month. CLA residents have the highest mean level of expenditure at US$ 214.5, while Tyre residents have the lowest at US$ 176.1. The 2015 figures register a rise of about 15 per
cent from their 2010 level, where per-capita average expenditure reached US$ 170.1 per month. Tyre witnessed the largest increase of about 25 per cent, followed by Saida which rose by about 20 per cent, while NLA has the smallest rise of 5 per cent.
Expenditures (US$/month)
TOTAL
Per capita
2010 per capita
Per cent change 2015/2010 (%)
828.2
214.5
202.2
6.1
831.5
208.8
173.4
20.4
680.5
176.1
140.5
25.3
825.4
202.1
186.0
8.7
777.1
179.3
170.8
5.0
777.6
194.9
170.1
14.6
CLA Saida Tyre Beqaa NLA TOTALTABLE 62: PRL PER-CAPITA EXPENDITURE
Food represents a major expenditure item at 36.0 per cent of total expenditure compared to 20.6 per cent for Lebanese families in 2012,131 followed by rent, which comprises 19.0 per cent. These two items combined consume more than half of PRL total expenditure (55 per cent). Health care (including general health care, medication and hospitalization) ranks third at 13 per cent.
FIGURE 26: PRL HOUSEHOLD EXPENDITURE ITEM BY REIGON (PER CENT)
CLA SAIDA TYRE BEQAA NLA OVERALL
2316 19 20 20 19
3435
38 32 36 36
1315
31
1013
30 34
12
3832 32
12
household expenditures 130
The average household expenditure among PRL reaches US$ 777.6 per month. Saida has the highest level of household expenditure at US$ 831.5 and Tyre records the lowest level at US$ 680.5.
Average household expenditures vary with the highest educational level of the household head. In general, the higher the level of education, the higher the expenditure level. The average household expenditure is US$ 654.8 for households with heads who have never attended school, while it increases to US$ 1,061 for those who have obtained a university degree.
FIGURE 25: PRL AVERAGE HOUSEHOLD EXPENDITURE BY REGION (US$ PER MONTH)
TYRE NLA BEQAA CLA SAIDA TOTAL
680.5777.1
825 828.2 831.5777.6
CHAPTER SEVEN // HOUSING QUALITY AND ACCESS TO WATER, SANITATION AND HYGIENE (WASH) FOR PALESTINE REFUGEES IN LEBANON 133 // HOUSEHOLD EXPENDITURES
RentFood
HealthcareOther
In conclusion, the majority of PRL have access to clean water, however a fair share depends on purchased water for cooking, drinking and sanitation. Electricity is the most common form of heating in PRL homes. Housing conditions are poor, in general. Lack of available funds and legal restrictions forbidding the entry of building material into the camps factor in the deterioration of PRL housing conditions.
conclusion
CHAPTER SEVEN // HOUSING QUALITY AND ACCESS TO WATER, SANITATION AND HYGIENE (WASH) FOR PALESTINE REFUGEES IN LEBANON134

CHAPTER SEVEN // HOUSING QUALITY AND ACCESS TO WATER, SANITATION AND HYGIENE (WASH) FOR PALESTINE REFUGEES IN LEBANON
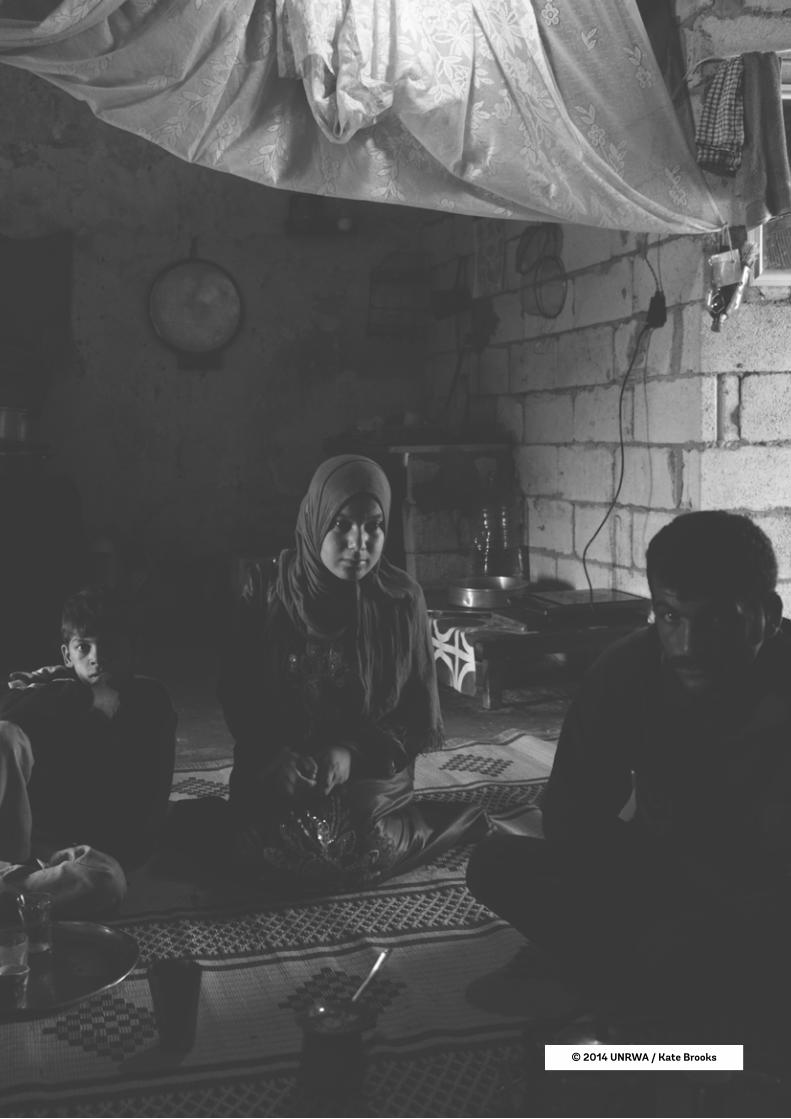
© 2014 UNRWA / Kate Brooks
137
Demographic Profile of Palestine Refugees from Syria Living in Lebanontala ismail
CHAPTEREIGHT
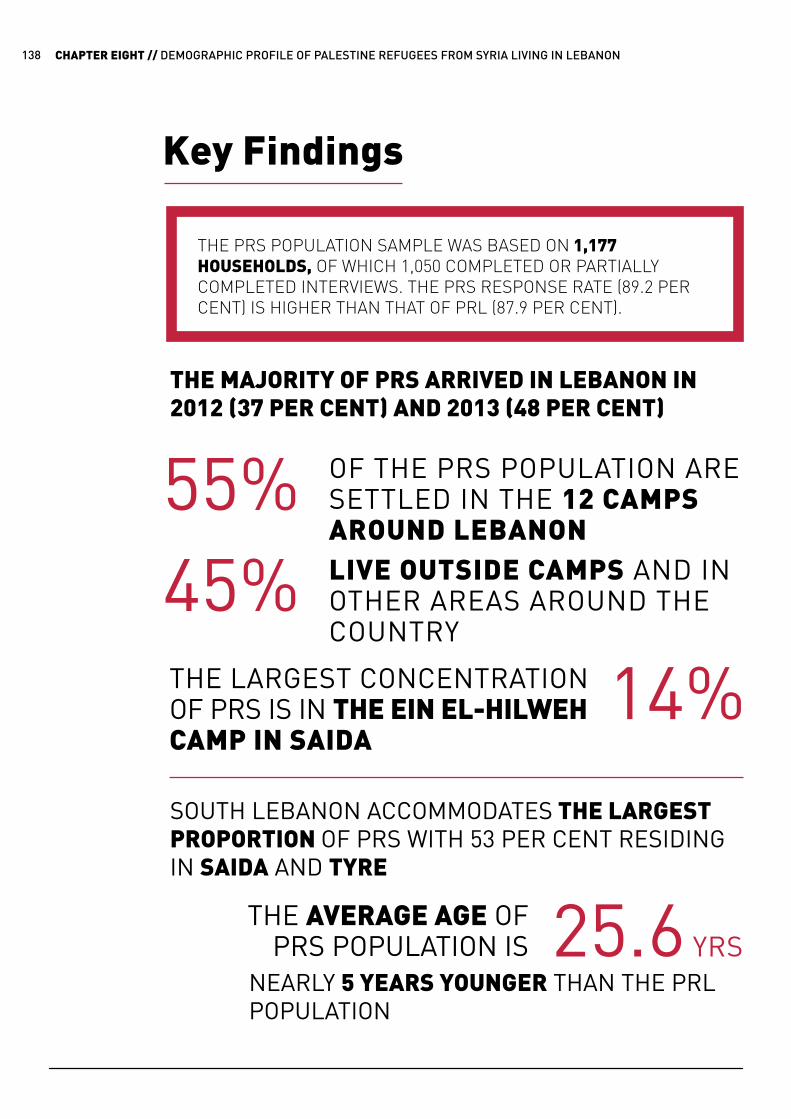
Key Findings
THE PRS POPULATION SAMPLE WAS BASED ON 1,177 HOUSEHOLDS, OF WHICH 1,050 COMPLETED OR PARTIALLY COMPLETED INTERVIEWS. THE PRS RESPONSE RATE (89.2 PER CENT) IS HIGHER THAN THAT OF PRL (87.9 PER CENT).
OF THE PRS POPULATION ARE SETTLED IN THE 12 CAMPS AROUND LEBANONLIVE OUTSIDE CAMPS AND IN OTHER AREAS AROUND THE COUNTRY
THE LARGEST CONCENTRATION OF PRS IS IN THE EIN EL-HILWEH CAMP IN SAIDA
THE AVERAGE AGE OFPRS POPULATION IS
THE MAJORITY OF PRS ARRIVED IN LEBANON IN 2012 (37 PER CENT) AND 2013 (48 PER CENT)
55%45%
14%
25.6 YRS
SOUTH LEBANON ACCOMMODATES THE LARGEST PROPORTION OF PRS WITH 53 PER CENT RESIDING IN SAIDA AND TYRE
NEARLY 5 YEARS YOUNGER THAN THE PRL POPULATION
CHAPTER EIGHT // DEMOGRAPHIC PROFILE OF PALESTINE REFUGEES FROM SYRIA LIVING IN LEBANON138
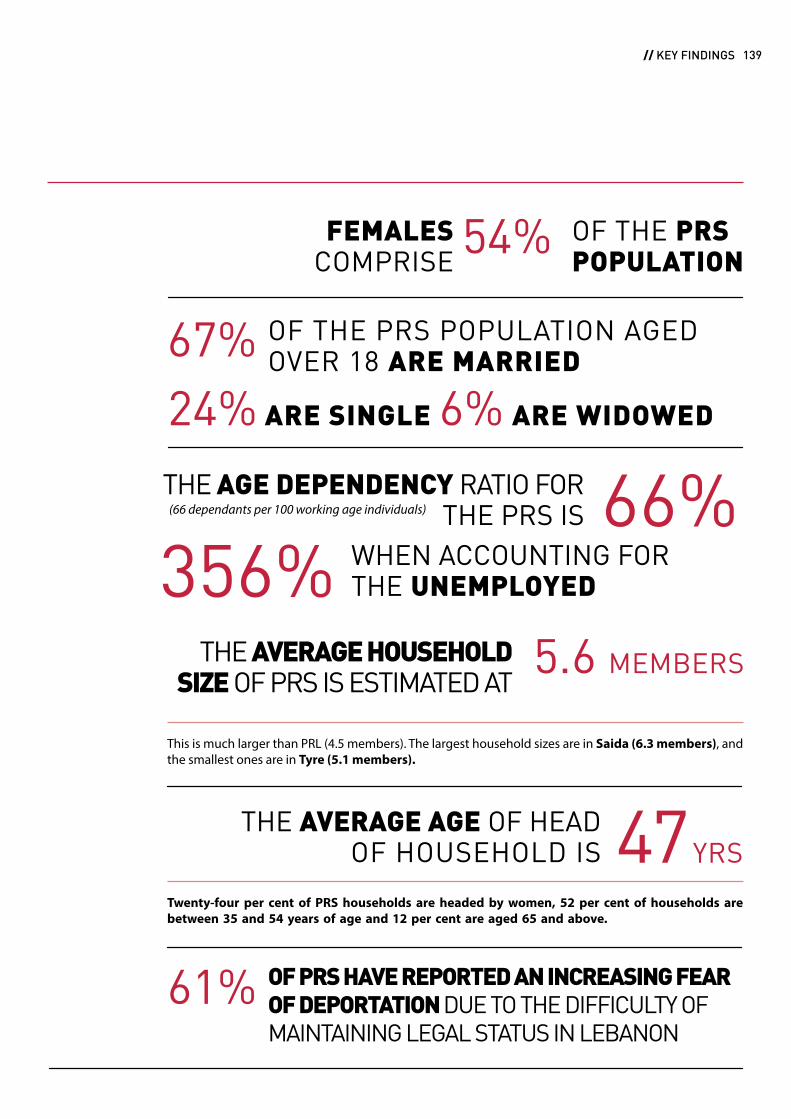
OF THE PRS POPULATION AGED OVER 18 ARE MARRIED
OF PRS HAVE REPORTED AN INCREASING FEAR OF DEPORTATION DUE TO THE DIFFICULTY OF MAINTAINING LEGAL STATUS IN LEBANON
FEMALESCOMPRISE
OF THE PRS POPULATION
54%
67%
61%
24% ARE SINGLE 6% ARE WIDOWED
THE AGE DEPENDENCY RATIO FOR THE PRS IS
THE AVERAGE HOUSEHOLD SIZE OF PRS IS ESTIMATED AT
(66 dependants per 100 working age individuals) 66%
5.6 MEMBERS
WHEN ACCOUNTING FORTHE UNEMPLOYED356%
THE AVERAGE AGE OF HEADOF HOUSEHOLD IS 47 YRS
This is much larger than PRL (4.5 members). The largest household sizes are in Saida (6.3 members), and the smallest ones are in Tyre (5.1 members).
Twenty-four per cent of PRS households are headed by women, 52 per cent of households are between 35 and 54 years of age and 12 per cent are aged 65 and above.
CHAPTER EIGHT // DEMOGRAPHIC PROFILE OF PALESTINE REFUGEES FROM SYRIA LIVING IN LEBANON 139 // KEY FINDINGS
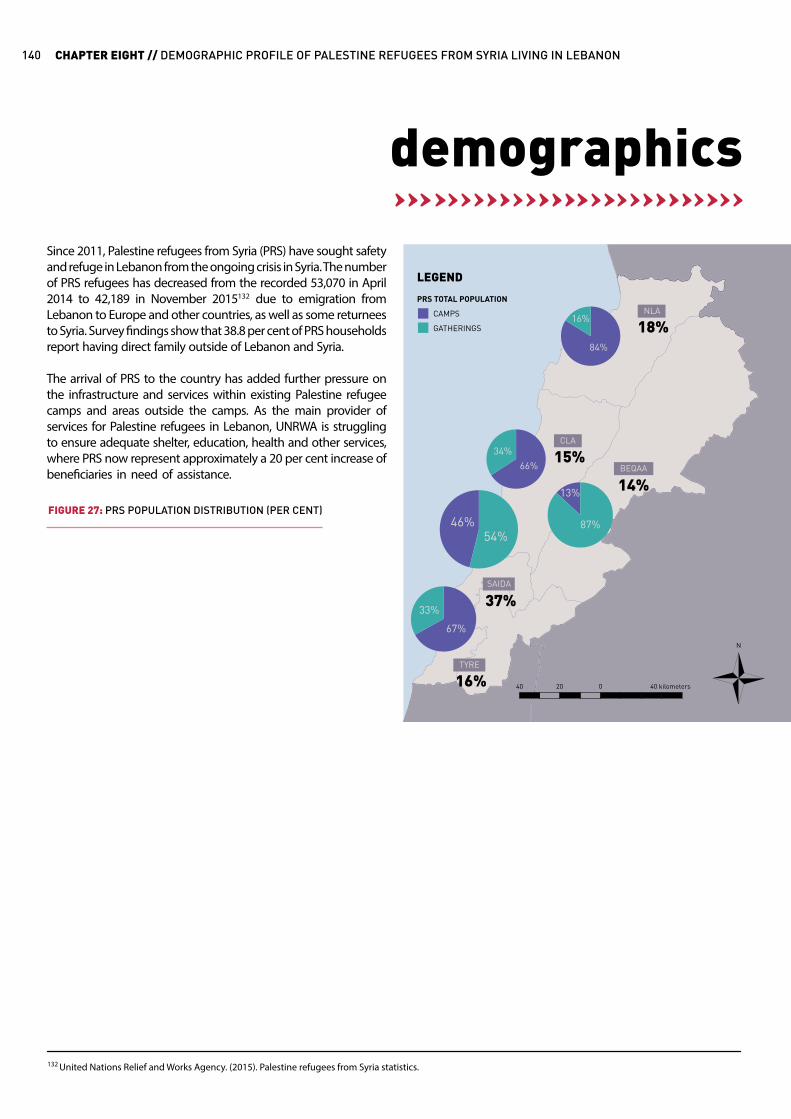
Since 2011, Palestine refugees from Syria (PRS) have sought safety and refuge in Lebanon from the ongoing crisis in Syria. The number of PRS refugees has decreased from the recorded 53,070 in April 2014 to 42,189 in November 2015132 due to emigration from Lebanon to Europe and other countries, as well as some returnees to Syria. Survey findings show that 38.8 per cent of PRS households report having direct family outside of Lebanon and Syria.
The arrival of PRS to the country has added further pressure on the infrastructure and services within existing Palestine refugee camps and areas outside the camps. As the main provider of services for Palestine refugees in Lebanon, UNRWA is struggling to ensure adequate shelter, education, health and other services, where PRS now represent approximately a 20 per cent increase of beneficiaries in need of assistance.
demographics
132 United Nations Relief and Works Agency. (2015). Palestine refugees from Syria statistics.
FIGURE 27: PRS POPULATION DISTRIBUTION (PER CENT)
CHAPTER EIGHT // DEMOGRAPHIC PROFILE OF PALESTINE REFUGEES FROM SYRIA LIVING IN LEBANON140
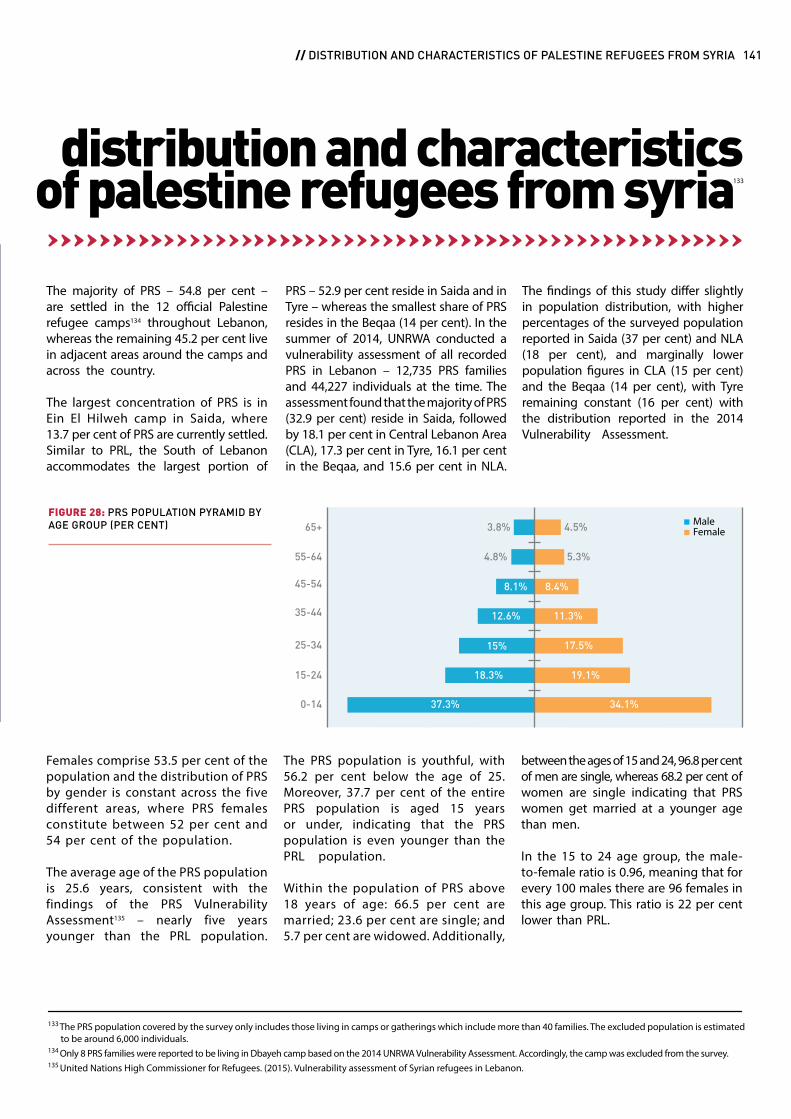
133 The PRS population covered by the survey only includes those living in camps or gatherings which include more than 40 families. The excluded population is estimated to be around 6,000 individuals.134 Only 8 PRS families were reported to be living in Dbayeh camp based on the 2014 UNRWA Vulnerability Assessment. Accordingly, the camp was excluded from the survey.135 United Nations High Commissioner for Refugees. (2015). Vulnerability assessment of Syrian refugees in Lebanon.
The majority of PRS – 54.8 per cent – are settled in the 12 official Palestine refugee camps134 throughout Lebanon, whereas the remaining 45.2 per cent live in adjacent areas around the camps and across the country.
The largest concentration of PRS is in Ein El Hilweh camp in Saida, where 13.7 per cent of PRS are currently settled. Similar to PRL, the South of Lebanon accommodates the largest portion of
PRS – 52.9 per cent reside in Saida and in Tyre – whereas the smallest share of PRS resides in the Beqaa (14 per cent). In the summer of 2014, UNRWA conducted a vulnerability assessment of all recorded PRS in Lebanon – 12,735 PRS families and 44,227 individuals at the time. The assessment found that the majority of PRS (32.9 per cent) reside in Saida, followed by 18.1 per cent in Central Lebanon Area (CLA), 17.3 per cent in Tyre, 16.1 per cent in the Beqaa, and 15.6 per cent in NLA.
The findings of this study differ slightly in population distribution, with higher percentages of the surveyed population reported in Saida (37 per cent) and NLA (18 per cent), and marginally lower population figures in CLA (15 per cent) and the Beqaa (14 per cent), with Tyre remaining constant (16 per cent) with the distribution reported in the 2014 Vulnerability Assessment.
distribution and characteristicsof palestine refugees from syria133
FIGURE 28: PRS POPULATION PYRAMID BY AGE GROUP (PER CENT) 65+
25-34
55-64
15-24
45-54
0-14
35-44
37.3% 34.1%
18.3% 19.1%
15% 17.5%
12.6% 11.3%
8.1% 8.4%
4.8%
3.8% 4.5%
5.3%
FemaleMale
Females comprise 53.5 per cent of the population and the distribution of PRS by gender is constant across the five different areas, where PRS females constitute between 52 per cent and 54 per cent of the population.
The average age of the PRS population is 25.6 years, consistent with the findings of the PRS Vulnerability Assessment135 – nearly five years younger than the PRL population.
The PRS population is youthful, with 56.2 per cent below the age of 25. Moreover, 37.7 per cent of the entire PRS population is aged 15 years or under, indicating that the PRS population is even younger than the PRL population.
Within the population of PRS above 18 years of age: 66.5 per cent are married; 23.6 per cent are single; and 5.7 per cent are widowed. Additionally,
between the ages of 15 and 24, 96.8 per cent of men are single, whereas 68.2 per cent of women are single indicating that PRS women get married at a younger age than men.
In the 15 to 24 age group, the male-to-female ratio is 0.96, meaning that for every 100 males there are 96 females in this age group. This ratio is 22 per cent lower than PRL.
CHAPTER EIGHT // DEMOGRAPHIC PROFILE OF PALESTINE REFUGEES FROM SYRIA LIVING IN LEBANON 141 // DISTRIBUTION AND CHARACTERISTICS OF PALESTINE REFUGEES FROM SYRIA

Moreover, in the 35 to 44 age group, the male-to-female ratio increases to 112 per cent, in contrast to the PRL phenomenon, which sees the male-to-female ratio decrease from 123 per cent to 86 per cent.
136 The Dependency Ratio is given by: the number of dependents divided by the number of non-dependents, where: Dependents = Children under 15 years old + elderly above 64 years old + non-employed adults between 15 and 64 years old. Non-Dependents = Employed adults between 15 and 64 years old.
0 TO 4
60
80
100
120
106
112 112
96
86
112
9791
86
140
10 TO 14 15 TO 24 25 TO 34 35 TO 44 45 TO 54 55 TO 64 65 +5 TO 9
FIGURE 29: PRS MALE/FEMALE RATIO BY AGE GROUP (PER CENT)
The age dependency ratio is estimated at 0.66, or 66 dependents per 100 working age individuals. However, this dependency ratio provides limited information regarding the actual number of active people who are supporting dependents, since it does not take into consideration their legal status and the
limited employment opportunities. Therefore, by accounting for the unemployed population within the 15 to 64 age category, the dependency ratio136 can better reflect the difficult socioeconomic conditions the PRS population experiences.
When taking into account the unemployed population, the dependency ratio increases drastically to 3.6. This high ratio means that, on average, every employed household member is supporting up to four dependents, placing a considerable and unsustainable burden on the employed person to meet the household’s basic needs.
dependency
FIGURE 30: PRS AVERAGE HOUSEHOLD SIZE BY REGION
TYRE NLABEQAACLA SAIDA
5.1
6.3
4.95.6 5.8
CHAPTER EIGHT // DEMOGRAPHIC PROFILE OF PALESTINE REFUGEES FROM SYRIA LIVING IN LEBANON142

137 A household was defined as a group of people who have been sharing dwelling, food and budget for at least 6 months.138 United Nations High Commissioner for Refugees. (2015). Vulnerability assessment of Syrian refugees in Lebanon.
15-24 25-34 35-44 45-54 55-64 65+
FIGURE 31: SHARE OF PRS WHO LIVE ALONE AND REMAIN SINGLE BY GENDER AND AGE GROUP (PER CENT) Female
Male
25.11
14.76 11.8910.3
9.27
8.23
2.54
17.9
Based on survey findings, the average household137 size of PRS families residing in Lebanon is estimated at 5.6 members. According to the PRS Needs Assessment conducted by UNRWA in early 2013,138 the average household size was equal to 6.6 members for PRS indicating that in the past two years, the average household size has decreased by one member, which could indicate that bigger households are dividing
into smaller units, some members of the household have left the country, or perhaps returned to Syria.
Also, the average household size of PRS (5.6 members) is larger than the average household size of PRL (4.5 members). The surveyed PRS household is made up of three adults on average, two children between the ages of 5 and 18, and one child under the age of 5.
Moreover, PRS household sizes vary within regions, the biggest being in Saida (6.3 members) and the smallest in Tyre (4.9 members). In addition, 2.4 per cent of PRS households are made up of one-person families, of which half are women. The latter are all aged 35 and above. Around 32.7 per cent of females who live alone are single, whereas 9.6 per cent are divorced and the remaining 57.7 per cent are widowed.
household size and composition
CHAPTER EIGHT // DEMOGRAPHIC PROFILE OF PALESTINE REFUGEES FROM SYRIA LIVING IN LEBANON 143 // DEPENDENCY
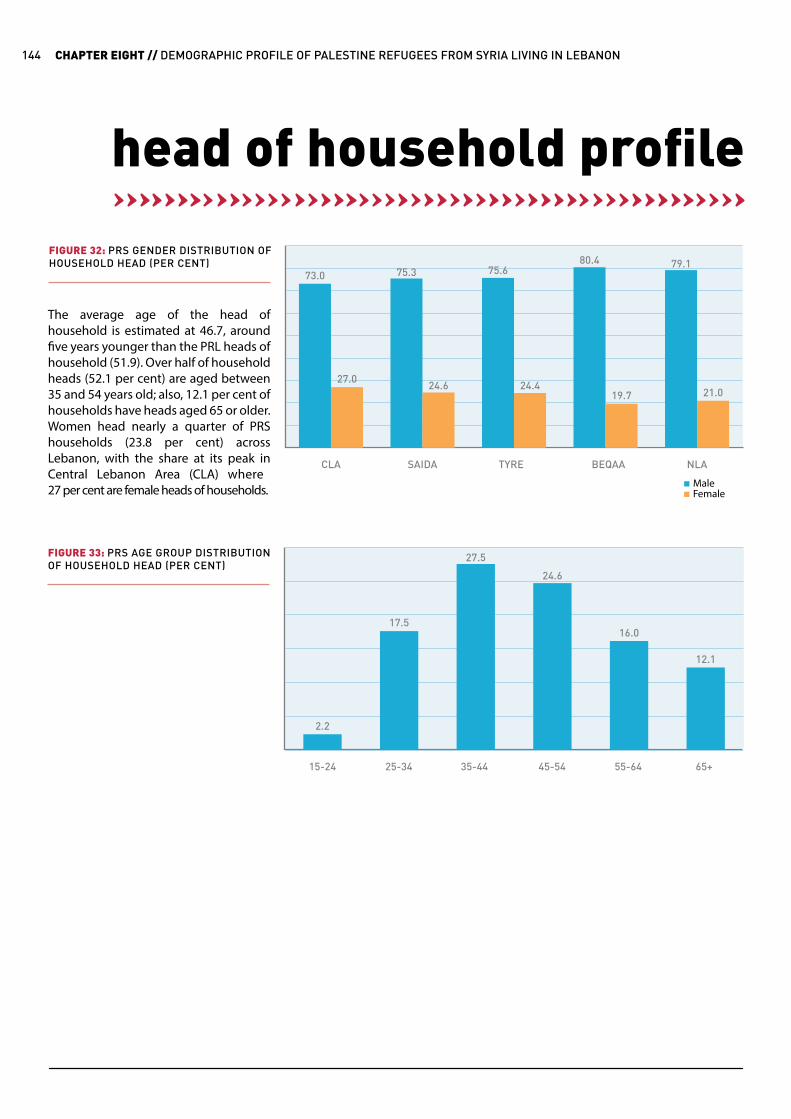
The average age of the head of household is estimated at 46.7, around five years younger than the PRL heads of household (51.9). Over half of household heads (52.1 per cent) are aged between 35 and 54 years old; also, 12.1 per cent of households have heads aged 65 or older.Women head nearly a quarter of PRS households (23.8 per cent) across Lebanon, with the share at its peak in Central Lebanon Area (CLA) where 27 per cent are female heads of households.
head of household profile
FIGURE 32: PRS GENDER DISTRIBUTION OF HOUSEHOLD HEAD (PER CENT)
FemaleMale
CLA SAIDA TYRE BEQAA NLA
73.0
27.0
75.3
24.6
75.6
24.4
80.4
19.7
79.1
21.0
15-24 25-34 35-44 45-54 55-64 65+
FIGURE 33: PRS AGE GROUP DISTRIBUTION OF HOUSEHOLD HEAD (PER CENT)
2.2
17.5
27.5
24.6
16.0
12.1
CHAPTER EIGHT // DEMOGRAPHIC PROFILE OF PALESTINE REFUGEES FROM SYRIA LIVING IN LEBANON144

arrival profile
The majority of PRS arrived in Lebanon in 2012 and 2013 – 36.8 per cent and 48.0 per cent respectively – since there were fewer restrictions on entry before August 2013. The entry peak was recorded in December 2012, which could correspond with the intensification of events in Yarmouk, the besieged suburb of Damascus. Since August 2013, arrival of PRS into Lebanon has gradually decreased due to the
increased entry restrictions that were applied at the borders targeting PRS. PRS were required to provide various forms of documentation to enter Lebanon and few refugees could meet the entry criteria defined by the Lebanese authorities. The criteria were never formally published but varied from proof of medical appointments, to enrolment in university, or proof of existing family members settled in Lebanon. In May
2014, further restrictions were applied, whereby only PRS with proof of an embassy appointment in Lebanon or with flight tickets and visas to third-party countries were allowed to enter, or with pre-approval from the General Security. While some PRS have been able to enter subsequent to this period, UNRWA has recorded an extremely limited number of new arrivals in its emergency database since May 2014.
4
10
12
14
2
8
01 1 1 1 12 2 2 2 23 3 3 3 34 4 4 4 45 5 5 56 6 6 67
2011 2012 2013 2014 2015
7 7 78 8 8 89 9 9 910 10 10 1011 11 11 1112 12 12 12
6
FIGURE 34: PRS ARRIVAL PROFILE (PER CENT)
CHAPTER EIGHT // DEMOGRAPHIC PROFILE OF PALESTINE REFUGEES FROM SYRIA LIVING IN LEBANON 145 // HEAD OF HOUSEHOLD PROFILE

PRS are finding it increasingly difficult to maintain their legal status in Lebanon, where they are faced with complex and costly processes (US$ 200/person/year) to renew or extend their residency documents. Initially, PRS were able to obtain three-month visas renewable up to 12 months at no cost upon entry into the country. Subsequently, a US$ 200 fee was required to extend their legal stay. This prohibitive cost meant that the majority did not renew their official stay and their immigration status became irregular. Many without regular status are issued with ‘departure orders’ by the Lebanese authorities and assigned departure deadlines. While these are
not being actively enforced, detention is a risk, especially when crossing checkpoints to enter or exit Palestine refugee camps.
The aforementioned regulations have contributed greatly to the increasing fear of deportation reported by 60.6 per cent of PRS in the survey. This fear is especially prominent in the Beqaa, where 83.3 per cent of PRS are afraid of being deported, followed by 69.4 per cent in NLA. Furthermore, 57.1 per cent of PRS reported feeling insecure due to the physical and social environment surrounding them. The highest percentage of respondents
who reported feelings of insecurity were in Central Lebanon Area (CLA) (70.9 per cent of residents) and the Beqaa (70.1 per cent of residents). Comparatively, respondents from Tyre reported feeling more secure, with less than half (41.8 per cent) of those surveyed reporting feelings of insecurity.
Over two thirds (67.8 per cent) of PRS reported being concerned for the safety of their family, particularly in North Lebanon Area where 85.5 per cent reported fearing for their family’s safety. These feelings of insecurity could be explained by PRS geographical proximity to the conflict in Syria.
legal status
CHAPTER EIGHT // DEMOGRAPHIC PROFILE OF PALESTINE REFUGEES FROM SYRIA LIVING IN LEBANON146

In conclusion, the majority of PRS arrived in 2012 and 2013. A little over half of PRS are females. The majority of PRS live in Palestine refugee camps, with Ein El Hilweh hosting the largest share. PRS are on average five years younger than PRL and they count for bigger households than PRL. Most PRS live in fear of being deported as a result of Lebanon’s tight restrictions on them.
conclusion
CHAPTER EIGHT // DEMOGRAPHIC PROFILE OF PALESTINE REFUGEES FROM SYRIA LIVING IN LEBANON 147 // CONCLUSION

© 2013 UNRWA / Mahmoud Kheir
Poverty Profile of Palestine Refugees from Syria Living in Lebanonjad chaaban
CHAPTERNINE
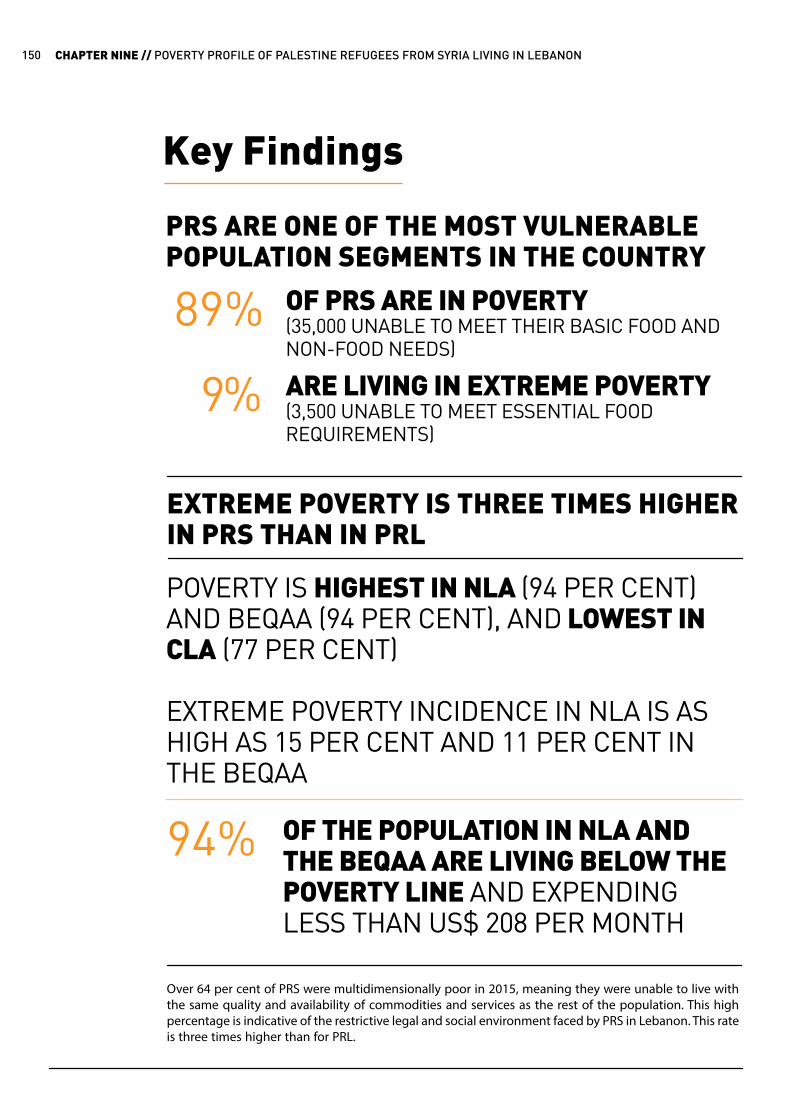
Key Findings
PRS ARE ONE OF THE MOST VULNERABLE POPULATION SEGMENTS IN THE COUNTRY
POVERTY IS HIGHEST IN NLA (94 PER CENT) AND BEQAA (94 PER CENT), AND LOWEST IN CLA (77 PER CENT)
EXTREME POVERTY INCIDENCE IN NLA IS AS HIGH AS 15 PER CENT AND 11 PER CENT IN THE BEQAA
Over 64 per cent of PRS were multidimensionally poor in 2015, meaning they were unable to live with the same quality and availability of commodities and services as the rest of the population. This high percentage is indicative of the restrictive legal and social environment faced by PRS in Lebanon. This rate is three times higher than for PRL.
OF THE POPULATION IN NLA AND THE BEQAA ARE LIVING BELOW THE POVERTY LINE AND EXPENDING LESS THAN US$ 208 PER MONTH
94%
EXTREME POVERTY IS THREE TIMES HIGHER IN PRS THAN IN PRL
89%
9%
OF PRS ARE IN POVERTY(35,000 UNABLE TO MEET THEIR BASIC FOOD AND NON-FOOD NEEDS)
ARE LIVING IN EXTREME POVERTY(3,500 UNABLE TO MEET ESSENTIAL FOOD REQUIREMENTS)
CHAPTER NINE // POVERTY PROFILE OF PALESTINE REFUGEES FROM SYRIA LIVING IN LEBANON150
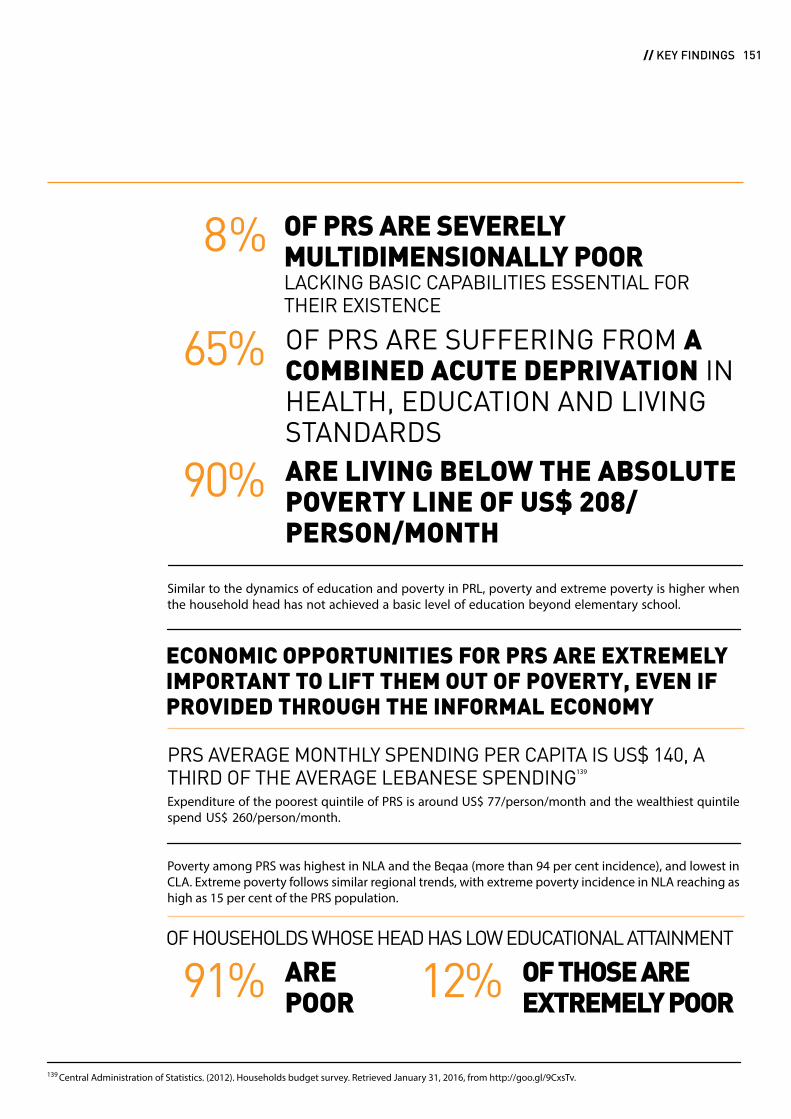
OF HOUSEHOLDS WHOSE HEAD HAS LOW EDUCATIONAL ATTAINMENT
Similar to the dynamics of education and poverty in PRL, poverty and extreme poverty is higher when the household head has not achieved a basic level of education beyond elementary school.
PRS AVERAGE MONTHLY SPENDING PER CAPITA IS US$ 140, A THIRD OF THE AVERAGE LEBANESE SPENDING139
Expenditure of the poorest quintile of PRS is around US$ 77/person/month and the wealthiest quintile spend US$ 260/person/month.
Poverty among PRS was highest in NLA and the Beqaa (more than 94 per cent incidence), and lowest in CLA. Extreme poverty follows similar regional trends, with extreme poverty incidence in NLA reaching as high as 15 per cent of the PRS population.
ECONOMIC OPPORTUNITIES FOR PRS ARE EXTREMELY IMPORTANT TO LIFT THEM OUT OF POVERTY, EVEN IF PROVIDED THROUGH THE INFORMAL ECONOMY
8%
65%
90%
91% 12%
OF PRS ARE SEVERELY MULTIDIMENSIONALLY POORLACKING BASIC CAPABILITIES ESSENTIAL FOR THEIR EXISTENCE
ARE LIVING BELOW THE ABSOLUTE POVERTY LINE OF US$ 208/PERSON/MONTH
139 Central Administration of Statistics. (2012). Households budget survey. Retrieved January 31, 2016, from http://goo.gl/9CxsTv.
OF PRS ARE SUFFERING FROM A COMBINED ACUTE DEPRIVATION IN HEALTH, EDUCATION AND LIVING STANDARDS
AREPOOR
OF THOSE ARE EXTREMELY POOR
CHAPTER NINE // POVERTY PROFILE OF PALESTINE REFUGEES FROM SYRIA LIVING IN LEBANON 151 // KEY FINDINGS
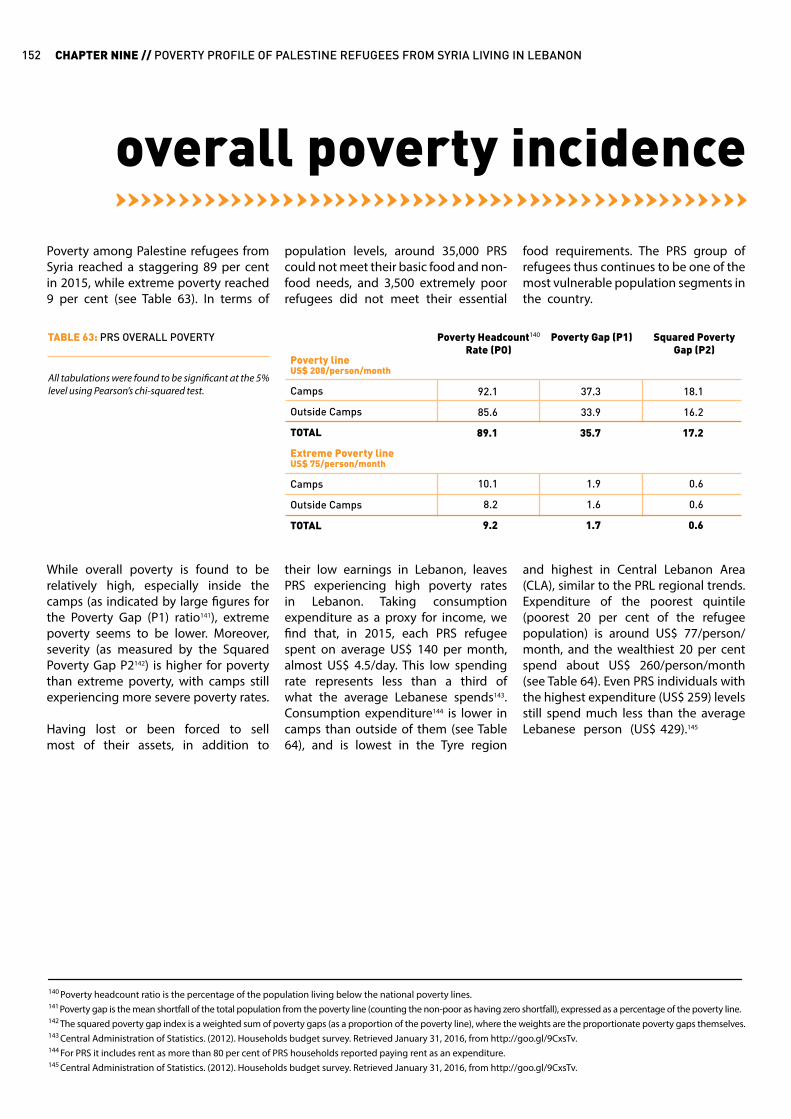
overall poverty incidence
Poverty among Palestine refugees from Syria reached a staggering 89 per cent in 2015, while extreme poverty reached 9 per cent (see Table 63). In terms of
population levels, around 35,000 PRS could not meet their basic food and non-food needs, and 3,500 extremely poor refugees did not meet their essential
food requirements. The PRS group of refugees thus continues to be one of the most vulnerable population segments in the country.
TABLE 63: PRS OVERALL POVERTY
All tabulations were found to be significant at the 5% level using Pearson’s chi-squared test.
Poverty lineUS$ 208/person/month
Camps
Outside Camps
TOTAL
Extreme Poverty lineUS$ 75/person/month
Camps
Outside Camps
TOTAL
92.1
85.6
89.1
37.3
33.9
35.7
18.1
16.2
17.2
10.1
8.2
9.2
1.9
1.6
1.7
0.6
0.6
0.6
Poverty Headcount140 Rate (PO)
Poverty Gap (P1) Squared PovertyGap (P2)
While overall poverty is found to be relatively high, especially inside the camps (as indicated by large figures for the Poverty Gap (P1) ratio141), extreme poverty seems to be lower. Moreover, severity (as measured by the Squared Poverty Gap P2142) is higher for poverty than extreme poverty, with camps still experiencing more severe poverty rates.
Having lost or been forced to sell most of their assets, in addition to
their low earnings in Lebanon, leaves PRS experiencing high poverty rates in Lebanon. Taking consumption expenditure as a proxy for income, we find that, in 2015, each PRS refugee spent on average US$ 140 per month, almost US$ 4.5/day. This low spending rate represents less than a third of what the average Lebanese spends143. Consumption expenditure144 is lower in camps than outside of them (see Table 64), and is lowest in the Tyre region
and highest in Central Lebanon Area (CLA), similar to the PRL regional trends. Expenditure of the poorest quintile (poorest 20 per cent of the refugee population) is around US$ 77/person/month, and the wealthiest 20 per cent spend about US$ 260/person/month (see Table 64). Even PRS individuals with the highest expenditure (US$ 259) levels still spend much less than the average Lebanese person (US$ 429).145
140 Poverty headcount ratio is the percentage of the population living below the national poverty lines.141 Poverty gap is the mean shortfall of the total population from the poverty line (counting the non-poor as having zero shortfall), expressed as a percentage of the poverty line.142 The squared poverty gap index is a weighted sum of poverty gaps (as a proportion of the poverty line), where the weights are the proportionate poverty gaps themselves.143 Central Administration of Statistics. (2012). Households budget survey. Retrieved January 31, 2016, from http://goo.gl/9CxsTv.144 For PRS it includes rent as more than 80 per cent of PRS households reported paying rent as an expenditure.145 Central Administration of Statistics. (2012). Households budget survey. Retrieved January 31, 2016, from http://goo.gl/9CxsTv.
CHAPTER NINE // POVERTY PROFILE OF PALESTINE REFUGEES FROM SYRIA LIVING IN LEBANON152
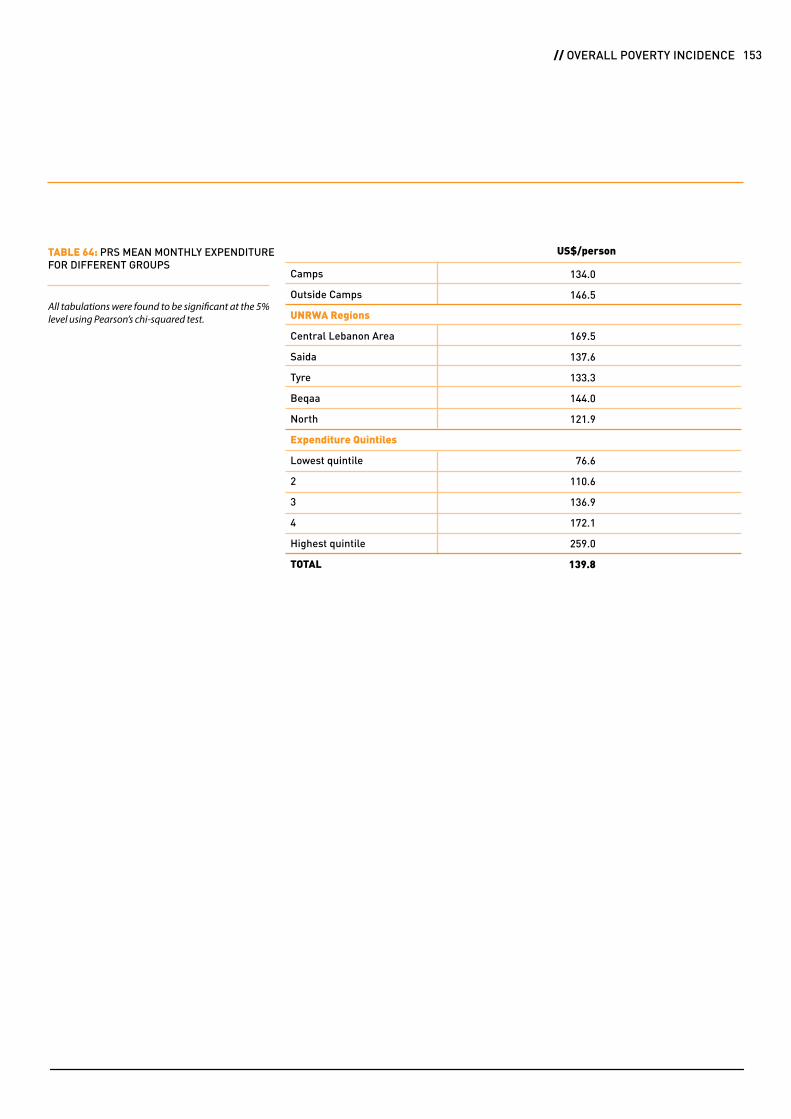
TABLE 64: PRS MEAN MONTHLY EXPENDITURE FOR DIFFERENT GROUPS
All tabulations were found to be significant at the 5% level using Pearson’s chi-squared test.
134.0
146.5
169.5
137.6
133.3
144.0
121.9
76.6
110.6
136.9
172.1
259.0
139.8
US$/person
Camps
Outside Camps
UNRWA Regions
Central Lebanon Area
Saida
Tyre
Beqaa
North
Expenditure Quintiles
Lowest quintile
2
3
4
Highest quintile
TOTAL
CHAPTER NINE // POVERTY PROFILE OF PALESTINE REFUGEES FROM SYRIA LIVING IN LEBANON 153 // OVERALL POVERTY INCIDENCE
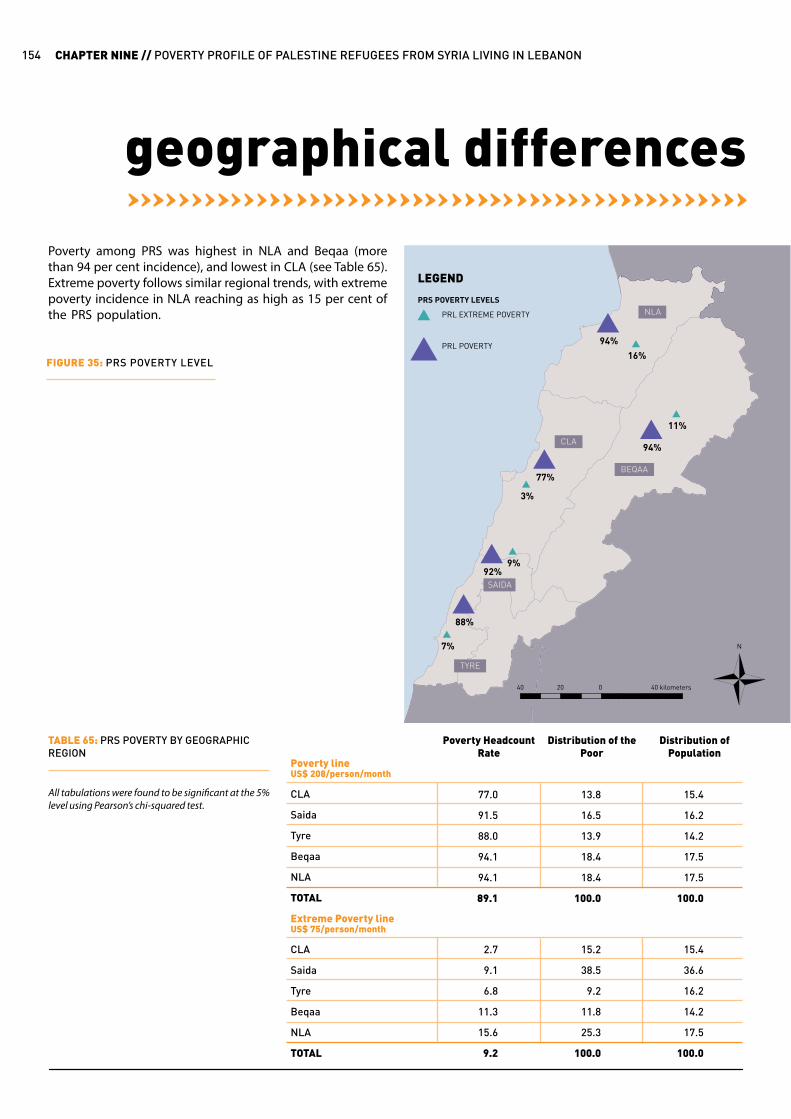
Poverty among PRS was highest in NLA and Beqaa (more than 94 per cent incidence), and lowest in CLA (see Table 65). Extreme poverty follows similar regional trends, with extreme poverty incidence in NLA reaching as high as 15 per cent of the PRS population.
geographical differences
FIGURE 35: PRS POVERTY LEVEL
TABLE 65: PRS POVERTY BY GEOGRAPHIC REGION
All tabulations were found to be significant at the 5% level using Pearson’s chi-squared test.
Poverty lineUS$ 208/person/month
CLA
Saida
Tyre
Beqaa
NLA
TOTAL
Extreme Poverty lineUS$ 75/person/month
CLA
Saida
Tyre
Beqaa
NLA
TOTAL
77.0
91.5
88.0
94.1
94.1
89.1
2.7
9.1
6.8
11.3
15.6
9.2
13.8
16.5
13.9
18.4
18.4
100.0
15.2
38.5
9.2
11.8
25.3
100.0
15.4
16.2
14.2
17.5
17.5
100.0
15.4
36.6
16.2
14.2
17.5
100.0
Poverty Headcount Rate
Distribution of the Poor
Distribution of Population
CHAPTER NINE // POVERTY PROFILE OF PALESTINE REFUGEES FROM SYRIA LIVING IN LEBANON154
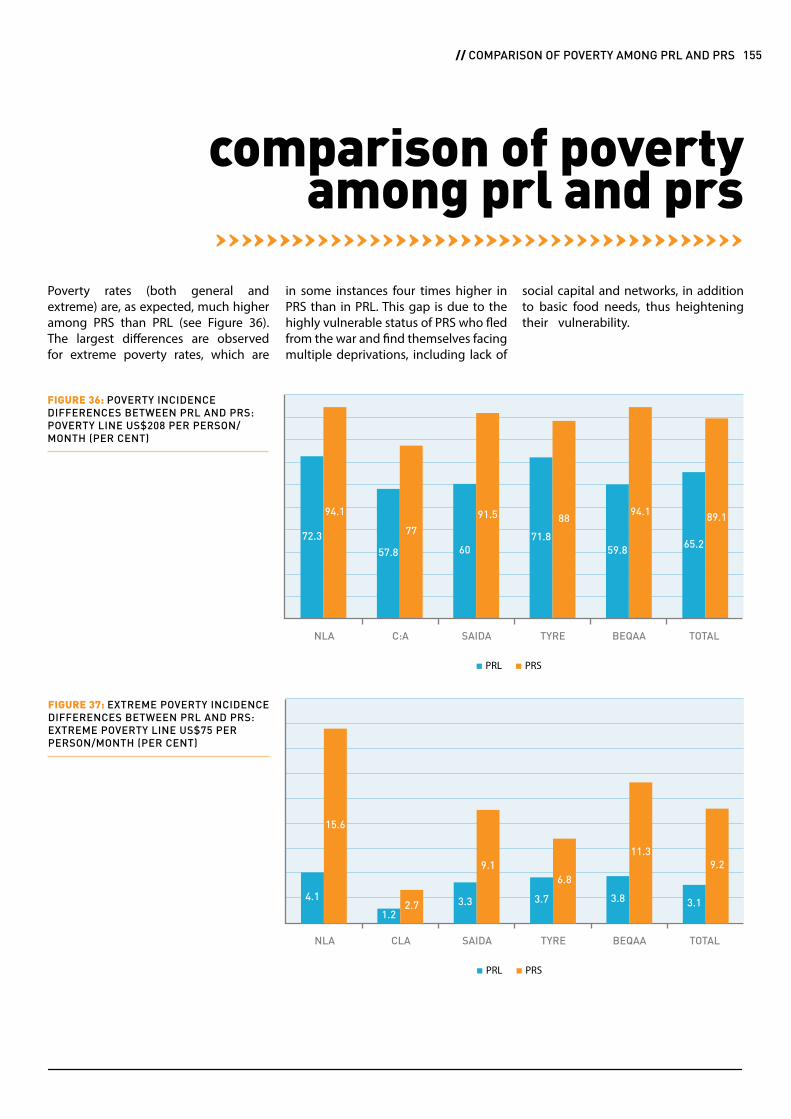
Poverty rates (both general and extreme) are, as expected, much higher among PRS than PRL (see Figure 36). The largest differences are observed for extreme poverty rates, which are
in some instances four times higher in PRS than in PRL. This gap is due to the highly vulnerable status of PRS who fled from the war and find themselves facing multiple deprivations, including lack of
social capital and networks, in addition to basic food needs, thus heightening their vulnerability.
comparison of povertyamong prl and prs
PRL PRS
FIGURE 36: POVERTY INCIDENCE DIFFERENCES BETWEEN PRL AND PRS:POVERTY LINE US$208 PER PERSON/MONTH (PER CENT)
NLA C:A SAIDA TYRE BEQAA TOTAL
72.3
94.1
57.8
77
60
91.5
71.8
88
59.8
94.1
65.2
89.1
PRL PRS
FIGURE 37: EXTREME POVERTY INCIDENCE DIFFERENCES BETWEEN PRL AND PRS:EXTREME POVERTY LINE US$75 PER PERSON/MONTH (PER CENT)
NLA CLA SAIDA TYRE BEQAA TOTAL
4.1
15.6
1.22.7 3.3
9.1
3.7
6.8
3.8
11.3
3.1
9.2
CHAPTER NINE // POVERTY PROFILE OF PALESTINE REFUGEES FROM SYRIA LIVING IN LEBANON 155 // COMPARISON OF POVERTY AMONG PRL AND PRS
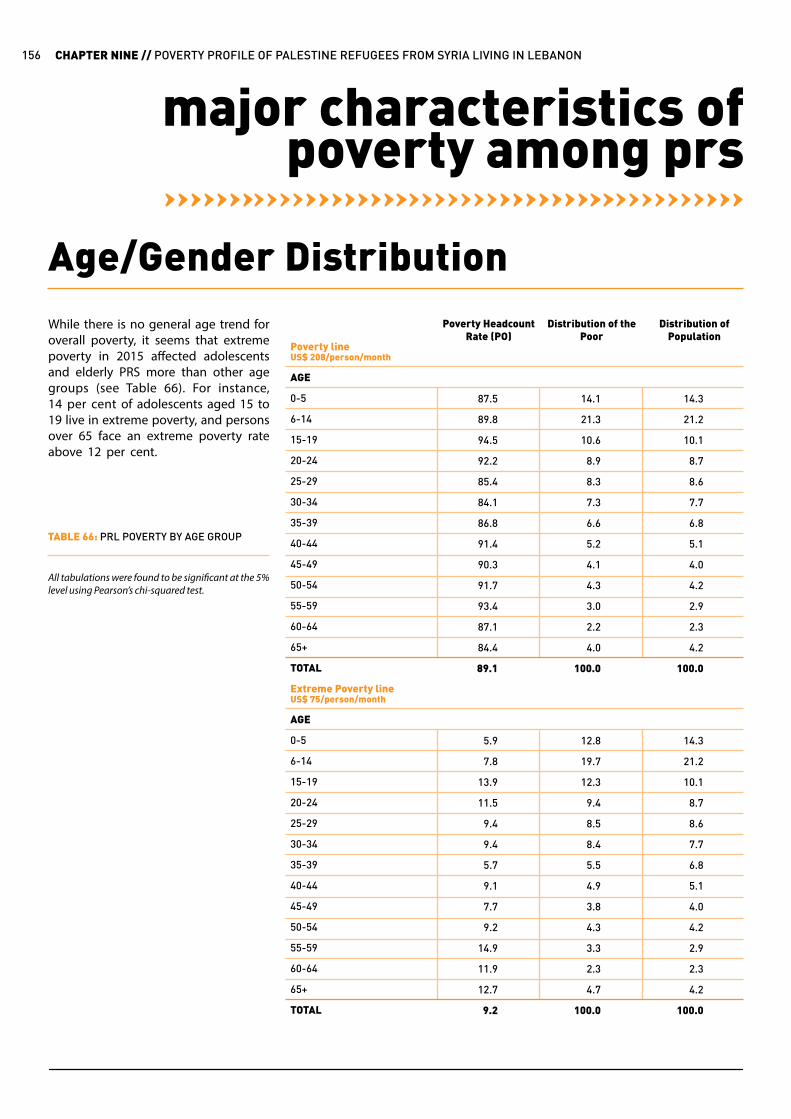
major characteristics of poverty among prs
While there is no general age trend for overall poverty, it seems that extreme poverty in 2015 affected adolescents and elderly PRS more than other age groups (see Table 66). For instance, 14 per cent of adolescents aged 15 to 19 live in extreme poverty, and persons over 65 face an extreme poverty rate above 12 per cent.
Age/Gender Distribution
TABLE 66: PRL POVERTY BY AGE GROUP
All tabulations were found to be significant at the 5% level using Pearson’s chi-squared test.
Poverty lineUS$ 208/person/month
AGE
0-5
6-14
15-19
20-24
25-29
30-34
35-39
40-44
45-49
50-54
55-59
60-64
65+
TOTAL
Extreme Poverty lineUS$ 75/person/month
AGE
0-5
6-14
15-19
20-24
25-29
30-34
35-39
40-44
45-49
50-54
55-59
60-64
65+
TOTAL
87.5
89.8
94.5
92.2
85.4
84.1
86.8
91.4
90.3
91.7
93.4
87.1
84.4
89.1
5.9
7.8
13.9
11.5
9.4
9.4
5.7
9.1
7.7
9.2
14.9
11.9
12.7
9.2
14.1
21.3
10.6
8.9
8.3
7.3
6.6
5.2
4.1
4.3
3.0
2.2
4.0
100.0
12.8
19.7
12.3
9.4
8.5
8.4
5.5
4.9
3.8
4.3
3.3
2.3
4.7
100.0
14.3
21.2
10.1
8.7
8.6
7.7
6.8
5.1
4.0
4.2
2.9
2.3
4.2
100.0
14.3
21.2
10.1
8.7
8.6
7.7
6.8
5.1
4.0
4.2
2.9
2.3
4.2
100.0
Poverty Headcount Rate (PO)
Distribution of the Poor
Distribution of Population
CHAPTER NINE // POVERTY PROFILE OF PALESTINE REFUGEES FROM SYRIA LIVING IN LEBANON156

Figure 38 shows the age pyramid, which includes a comparison of the total and poor population for each age/gender group (absolute poverty). Note that poverty affects all age groups in seemingly the same manner. Also note that compared to PRL, the age pyramid has a large base, which reflects a much younger population in comparison to PRL.
FIGURE 38: PRS POPULATION PYRAMID BY POVERTY, GENDER, AND AGE GROUP
65+
25-34
55-64
15-24
45-54
0-14
1520 10 5 0 5 10 15 20
35-44
Poor Male Poor FemaleNon-Poor Male Non-Poor Female
Poverty lineUS$ 208/person/month
GENDER OF THE HOUSEHOLD HEAD
Male
Female
TOTAL
Extreme Poverty lineUS$ 75/person/month
GENDER OF THE HOUSEHOLD HEAD
Male
Female
TOTAL
89.6
87.5
89.1
9.6
7.9
9.2
79.1
20.9
100.0
81.3
18.7
100.0
78.7
21.3
100.0
78.7
21.3
100.0
Poverty Headcount Rate (PO)
Distribution of the Poor
Distribution of Population
TABLE 67: PRS POVERTY BY GENDER OF HOUSEHOLD HEAD
All tabulations were found to be significant at the 5% level using Pearson’s chi-squared test.
Poverty in its two forms (extreme/abject and general/absolute) is slightly higher for individuals living within male-headed households (see Table 67). This might reflect the impact of some of the aid distributed by international agencies that prioritises and often targets female-headed households.
CHAPTER NINE // POVERTY PROFILE OF PALESTINE REFUGEES FROM SYRIA LIVING IN LEBANON 157 // MAJOR CHARACTERISTICS OF POVERTY AMONG PRS
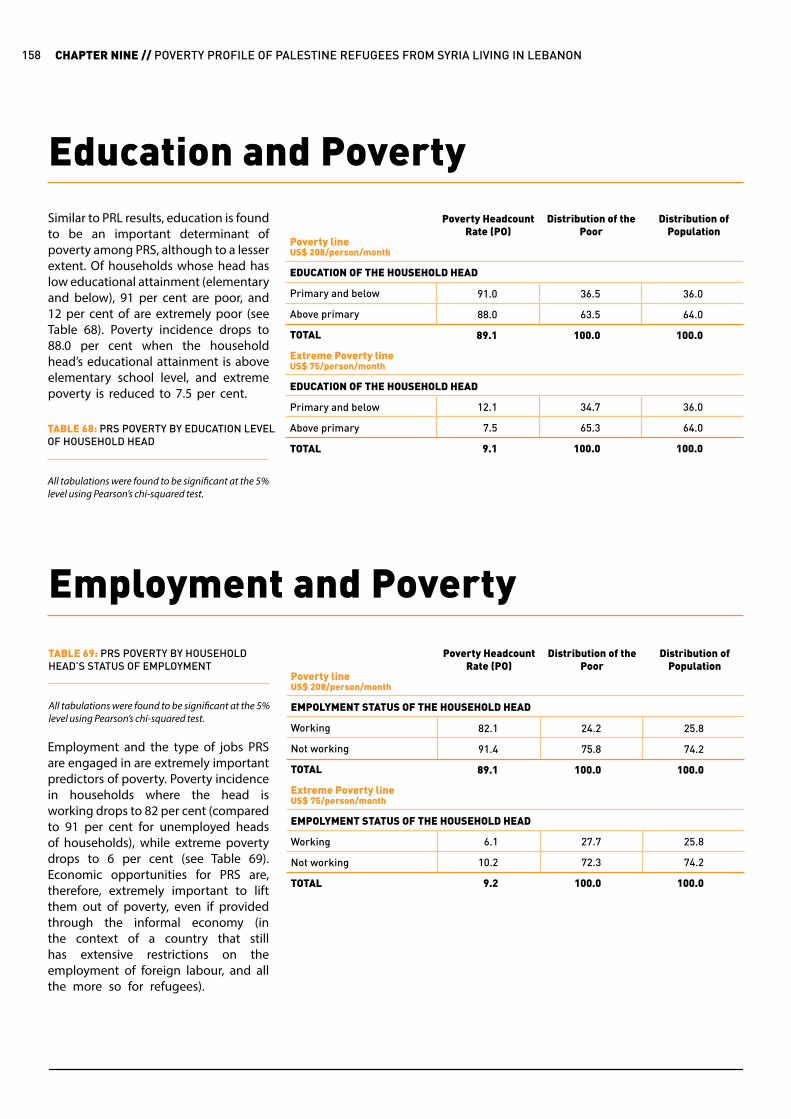
Similar to PRL results, education is found to be an important determinant of poverty among PRS, although to a lesser extent. Of households whose head has low educational attainment (elementary and below), 91 per cent are poor, and 12 per cent of are extremely poor (see Table 68). Poverty incidence drops to 88.0 per cent when the household head’s educational attainment is above elementary school level, and extreme poverty is reduced to 7.5 per cent.
Employment and the type of jobs PRS are engaged in are extremely important predictors of poverty. Poverty incidence in households where the head is working drops to 82 per cent (compared to 91 per cent for unemployed heads of households), while extreme poverty drops to 6 per cent (see Table 69). Economic opportunities for PRS are, therefore, extremely important to lift them out of poverty, even if provided through the informal economy (in the context of a country that still has extensive restrictions on the employment of foreign labour, and all the more so for refugees).
Education and Poverty
Poverty lineUS$ 208/person/month
EDUCATION OF THE HOUSEHOLD HEAD
Primary and below
Above primary
TOTAL
Extreme Poverty lineUS$ 75/person/month
EDUCATION OF THE HOUSEHOLD HEAD
Primary and below
Above primary
TOTAL
91.0
88.0
89.1
12.1
7.5
9.1
36.5
63.5
100.0
34.7
65.3
100.0
36.0
64.0
100.0
36.0
64.0
100.0
Poverty Headcount Rate (PO)
Distribution of the Poor
Distribution of Population
TABLE 68: PRS POVERTY BY EDUCATION LEVEL OF HOUSEHOLD HEAD
All tabulations were found to be significant at the 5% level using Pearson’s chi-squared test.
Employment and Poverty
Poverty lineUS$ 208/person/month
EMPOLYMENT STATUS OF THE HOUSEHOLD HEAD
Working
Not working
TOTAL
Extreme Poverty lineUS$ 75/person/month
EMPOLYMENT STATUS OF THE HOUSEHOLD HEAD
Working
Not working
TOTAL
82.1
91.4
89.1
6.1
10.2
9.2
24.2
75.8
100.0
27.7
72.3
100.0
25.8
74.2
100.0
25.8
74.2
100.0
Poverty Headcount Rate (PO)
Distribution of the Poor
Distribution of Population
TABLE 69: PRS POVERTY BY HOUSEHOLD HEAD’S STATUS OF EMPLOYMENT
All tabulations were found to be significant at the 5% level using Pearson’s chi-squared test.
CHAPTER NINE // POVERTY PROFILE OF PALESTINE REFUGEES FROM SYRIA LIVING IN LEBANON158

Poverty by profession displays a trend where skilled PRS have a higher incidence of poverty, while unskilled workers have a slightly lower risk of poverty (see Table 70). This is due to labour market restrictions on refugees and the tough competition faced by PRS when attempting to join the skilled labour market.
Poverty lineUS$ 208/person/month
OCCUPATION
Legislators, senior officials and managers
Professionals
Technicians and associateprofessionals
Clerks
Service workers
Skilled agricultural andfishery workers
Craft and related trade workers
Plant and machine operators/assemblers
Elementary occupations
TOTAL
Extreme Poverty lineUS$ 75/person/month
OCCUPATION
Legislators, senior officials and managers
Professionals
Technicians and associateprofessionals
Clerks
Service workers
Skilled agricultural andfishery workers
Craft and related trade workers
Plant and machine operators/assemblers
Elementary occupations
TOTAL
100
79.1
77.8
88.8
88.8
100.0
81.4
67.3
87.3
89.1
0.0
16.9
0.0
13.5
6.1
0.0
8.3
5.8
7.8
9.2
0.2
2.9
3.0
1.5
12.3
1.1
27.1
3.6
48.3
100.0
0.0
5.9
4.2
1.6
9.9
0.0
21.5
4.5
52.4
100.0
0.2
2.9
3.1
1.5
11.8
1.0
28.3
4.4
46.9
100.0
0.2
2.9
3.1
1.5
11.8
1.0
28.3
4.4
46.9
100.0
Poverty Headcount Rate (PO)
Distribution of the Poor
Distribution of Population
TABLE 70: PRS POVERTY BY STATUS OF EMPLOYMENT
All tabulations were found to be significant at the 5% level using Pearson’s chi-squared test.
Families with children experience heightened vulnerability to poverty. Analysing some of the cross-linking points that increase the probability of being poor, we find that refugees living in male-headed households, and households where the head is either
unemployed or has low education, increases their vulnerability to poverty. Unemployment for the head of the household increases the probability of being poor by more than 7 percentage points. This increase in the probability of being poor shows the importance
of providing job opportunities for PRS, including advocating for the right to decent work, as part of a poverty reduction strategy targeting this vulnerable population.
CHAPTER NINE // POVERTY PROFILE OF PALESTINE REFUGEES FROM SYRIA LIVING IN LEBANON 159 //EMPLOYMENT AND POVERTY
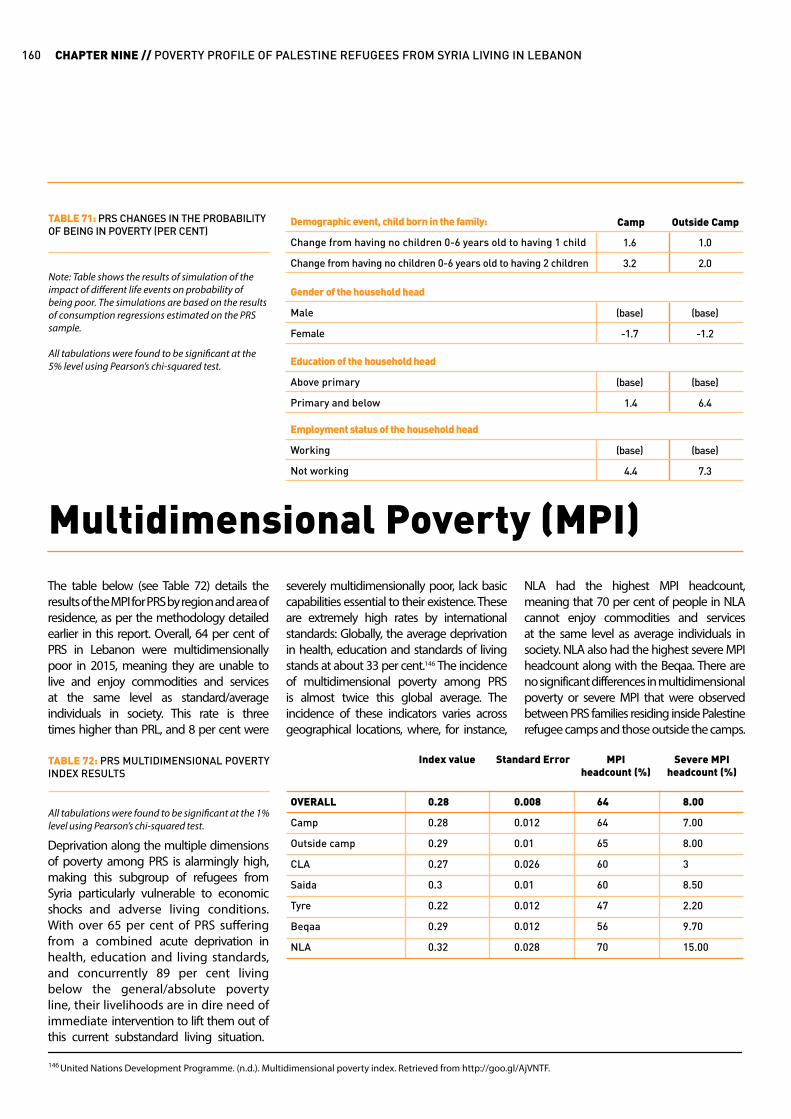
Note: Table shows the results of simulation of the impact of different life events on probability of being poor. The simulations are based on the results of consumption regressions estimated on the PRS sample.
All tabulations were found to be significant at the 5% level using Pearson’s chi-squared test.
Demographic event, child born in the family:
Change from having no children 0-6 years old to having 1 child
Change from having no children 0-6 years old to having 2 children
Gender of the household head
Male
Female
Education of the household head
Above primary
Primary and below
Employment status of the household head
Working
Not working
1.6
3.2
(base)
-1.7
(base)
1.4
(base)
4.4
1.0
2.0
(base)
-1.2
(base)
6.4
(base)
7.3
Camp Outside CampTABLE 71: PRS CHANGES IN THE PROBABILITY OF BEING IN POVERTY (PER CENT)
146 United Nations Development Programme. (n.d.). Multidimensional poverty index. Retrieved from http://goo.gl/AjVNTF.
The table below (see Table 72) details the results of the MPI for PRS by region and area of residence, as per the methodology detailed earlier in this report. Overall, 64 per cent of PRS in Lebanon were multidimensionally poor in 2015, meaning they are unable to live and enjoy commodities and services at the same level as standard/average individuals in society. This rate is three times higher than PRL, and 8 per cent were
Deprivation along the multiple dimensions of poverty among PRS is alarmingly high, making this subgroup of refugees from Syria particularly vulnerable to economic shocks and adverse living conditions. With over 65 per cent of PRS suffering from a combined acute deprivation in health, education and living standards, and concurrently 89 per cent living below the general/absolute poverty line, their livelihoods are in dire need of immediate intervention to lift them out of this current substandard living situation.
severely multidimensionally poor, lack basic capabilities essential to their existence. These are extremely high rates by international standards: Globally, the average deprivation in health, education and standards of living stands at about 33 per cent.146 The incidence of multidimensional poverty among PRS is almost twice this global average. The incidence of these indicators varies across geographical locations, where, for instance,
NLA had the highest MPI headcount, meaning that 70 per cent of people in NLA cannot enjoy commodities and services at the same level as average individuals in society. NLA also had the highest severe MPI headcount along with the Beqaa. There are no significant differences in multidimensional poverty or severe MPI that were observed between PRS families residing inside Palestine refugee camps and those outside the camps.
Multidimensional Poverty (MPI)
OVERALL
Camp
Outside camp
CLA
Saida
Tyre
Beqaa
NLA
0.28
0.28
0.29
0.27
0.3
0.22
0.29
0.32
0.008
0.012
0.01
0.026
0.01
0.012
0.012
0.028
64
64
65
60
60
47
56
70
8.00
7.00
8.00
3
8.50
2.20
9.70
15.00
Index value Standard Error MPIheadcount (%)
Severe MPI headcount (%)
TABLE 72: PRS MULTIDIMENSIONAL POVERTY INDEX RESULTS
All tabulations were found to be significant at the 1% level using Pearson’s chi-squared test.
CHAPTER NINE // POVERTY PROFILE OF PALESTINE REFUGEES FROM SYRIA LIVING IN LEBANON160

In conclusion, the survey revealed PRS to be among the most vulnerable population segment in Lebanon. They have high rates of poverty, to the extent that their extreme poverty rates are three times higher than PRL. PRS are not only predominantly poor, but they come across far fewer work opportunities and those jobs that are available are low-paying and insecure types of wage labour.
conclusion
CHAPTER NINE // POVERTY PROFILE OF PALESTINE REFUGEES FROM SYRIA LIVING IN LEBANON 161 // CONCLUSION
©2016 UNRWA / Francesco Romagnolo

Education Access and Attainment of Palestine Refugees from Syria Living in Lebanon lara batlouni, nisreen salti, alexandra irani
CHAPTERTEN

Key Findings
UNRWA IS PLAYING A CRUCIAL ROLE IN PROVIDING EDUCATIONAL SERVICES TO PRS FAMILIES
PRS RESPONDENTS OF SCHOOL AGE ARE LESS LIKELY THAN PRL TO BE ENROLLED IN SCHOOLS AT ALL EDUCATION LEVELS
OF 6 TO 12-YEAR-OLDS ATTEND UNRWA SCHOOLSOF 13 TO 15-YEAR-OLDS ARE ENROLLED
OF PRS SCHOOL-AGE CHILDREN ARE ENROLLED IN SCHOOL,AND ENROLMENT SIGNIFICANTLY DECLINES FROM ELEMENTARY TO SECONDARY CYCLES
OF 6 TO 18-YEAR-OLDS ATTEND PUBLIC SCHOOLS
84%
84.2%
64.6%
3.9%
While 88.3 per cent of PRS children are enrolled in elementary school, 69.6 per cent are enrolled in preparatory school and by secondary school only 35.8 per cent of the school-age PRS population are enrolled.
Enrolment is significantly higher for camp residents (93.7 per cent) compared to students residing outside camps (82.6 per cent) indicating the impact that restrictions on movement of PRS and transportation may have on children accessing education outside of camps.
Female PRS are three times more likely to have never attended school compared to males (9.4 per cent to 3.2 per cent). This disparity is notable compared to the respective rates for PRL (15.8 per cent and 6.7 per cent). However when they do attend, females are more likely to see schooling through to a successful completion, with the portion of those holding Baccalaureate degrees as their highest level of schooling higher than males, at 9.5 per cent compared to 6.1 per cent.
CHAPTER TEN // EDUCATION ACCESS AND ATTAINMENT OF PALESTINE REFUGEES FROM SYRIA LIVING IN LEBANON164
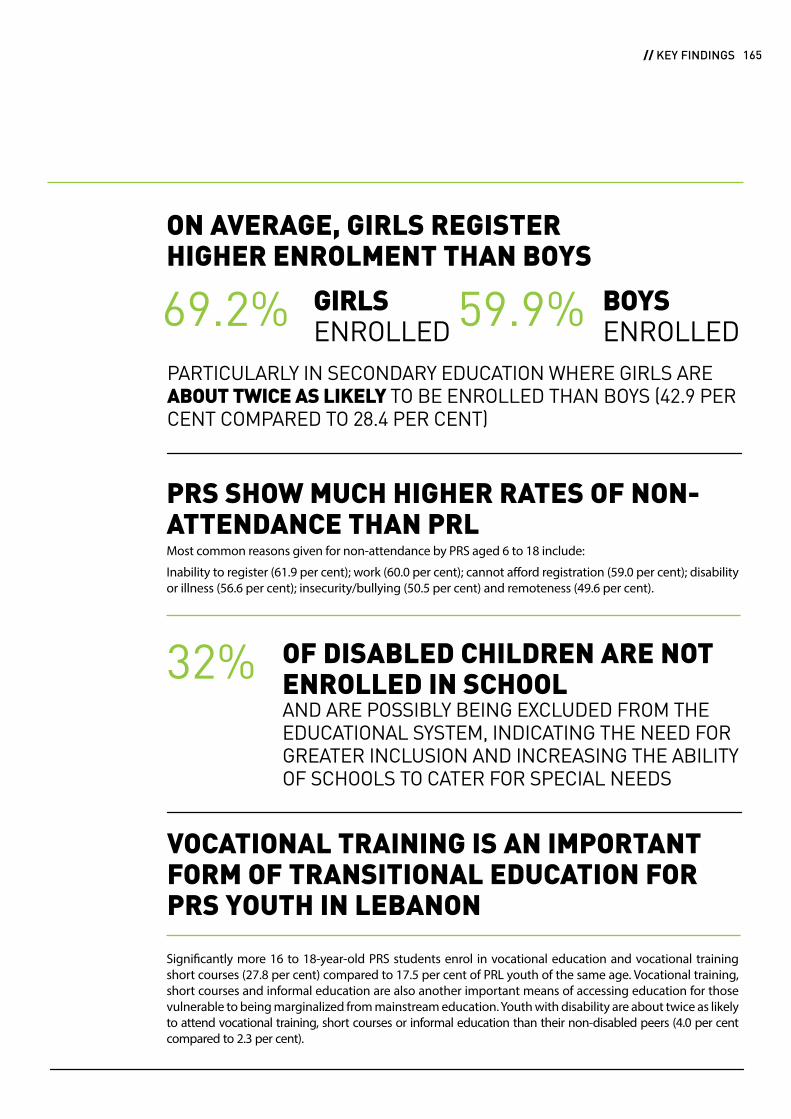
OF DISABLED CHILDREN ARE NOT ENROLLED IN SCHOOLAND ARE POSSIBLY BEING EXCLUDED FROM THE EDUCATIONAL SYSTEM, INDICATING THE NEED FOR GREATER INCLUSION AND INCREASING THE ABILITY OF SCHOOLS TO CATER FOR SPECIAL NEEDS
ON AVERAGE, GIRLS REGISTER HIGHER ENROLMENT THAN BOYS
VOCATIONAL TRAINING IS AN IMPORTANT FORM OF TRANSITIONAL EDUCATION FOR PRS YOUTH IN LEBANON
32%
PRS SHOW MUCH HIGHER RATES OF NON-ATTENDANCE THAN PRLMost common reasons given for non-attendance by PRS aged 6 to 18 include:
Inability to register (61.9 per cent); work (60.0 per cent); cannot afford registration (59.0 per cent); disability or illness (56.6 per cent); insecurity/bullying (50.5 per cent) and remoteness (49.6 per cent).
Significantly more 16 to 18-year-old PRS students enrol in vocational education and vocational training short courses (27.8 per cent) compared to 17.5 per cent of PRL youth of the same age. Vocational training, short courses and informal education are also another important means of accessing education for those vulnerable to being marginalized from mainstream education. Youth with disability are about twice as likely to attend vocational training, short courses or informal education than their non-disabled peers (4.0 per cent compared to 2.3 per cent).
PARTICULARLY IN SECONDARY EDUCATION WHERE GIRLS ARE ABOUT TWICE AS LIKELY TO BE ENROLLED THAN BOYS (42.9 PER CENT COMPARED TO 28.4 PER CENT)
GIRLSENROLLED
BOYSENROLLED69.2% 59.9%
CHAPTER TEN // EDUCATION ACCESS AND ATTAINMENT OF PALESTINE REFUGEES FROM SYRIA LIVING IN LEBANON 165 // KEY FINDINGS

Education is a fundamental human right, however Palestine refugee children who have been forced to flee with their families from Syria to Lebanon have had their access to the protective qualities of education significantly disrupted. Access to education provides more than an opportunity for academic learning for children affected by conflict. By offering safe spaces for children, schools can act as an entry point for the provision of essential support beyond the education sector, such as protection, nutrition, water and sanitation and health services. Education can also mitigate the psycho-social impact of conflict and disasters by providing a sense of routine, stability, structure and hope for the future.147
As the main provider of basic education services for Palestine refugees in Lebanon, UNRWA has been working over the past four years to accommodate an additional 11,257148 school-age children between the
ages of 6 and 18, in already overcrowded and underfunded UNRWA schools.
UNRWA has been trying to meet the needs of the 6,527149 PRS children enrolled in UNRWA schools in the 2014 – 2015 scholastic year by providing special classes on a number of core subjects such as Arabic, English and arithmetic, as well as regular classes integrating PRS pupils together with their PRL peers. The Agency is also working with partner organizations to implement a cross-cutting psycho-social programme through which UNRWA teachers, school counsellors and social workers are receiving training on education in emergency methodologies and psycho-social support to support students’ well-being.
According to the vulnerability assessment of all PRS recorded in Lebanon conducted by UNRWA in August 2014,150 57.6 per cent of
6 to 18-year-old PRS children were currently enrolled in school; around 34.1 per cent were previously enrolled and 8.3 per cent had never been enrolled in school. As was the case in the 2014 Vulnerability Assessment, enrolment is still significantly lower outside refugee camps. This low enrolment rate could be due to the fact that UNRWA schools, where the majority of PRS children are enrolled, are mainly located within refugee camps or their surroundings. While there are no fees to attend UNRWA schools, not being able to afford associated education costs (including materials and transportation costs) along with not being able to register (probably due to arrival in Lebanon in the middle of the school year) were the main reasons provided by PRS for not enrolling or attending the 2014 – 2015 school year in the current survey.
147 INEE. (2010). No Title No Title. Journal of Chemical Information and Modeling, 53(9). http://doi.org/10.1017/CBO9781107415324.004.148 United Nations Relief and Works Agency. (2015a). Palestinian refugees from Syria statistics.149 United Nations Relief and Works Agency. (2015c). Syria crisis response progress report. Retrieved from http://goo.gl/h5f0SV.150 United Nations Relief and Works Agency. (2015b). Profiling the vulnerability of Palestine refugees from Syria living in Lebanon. Retrieved from http://goo.gl/r5KeP3.
CHAPTER TEN // EDUCATION ACCESS AND ATTAINMENT OF PALESTINE REFUGEES FROM SYRIA LIVING IN LEBANON166
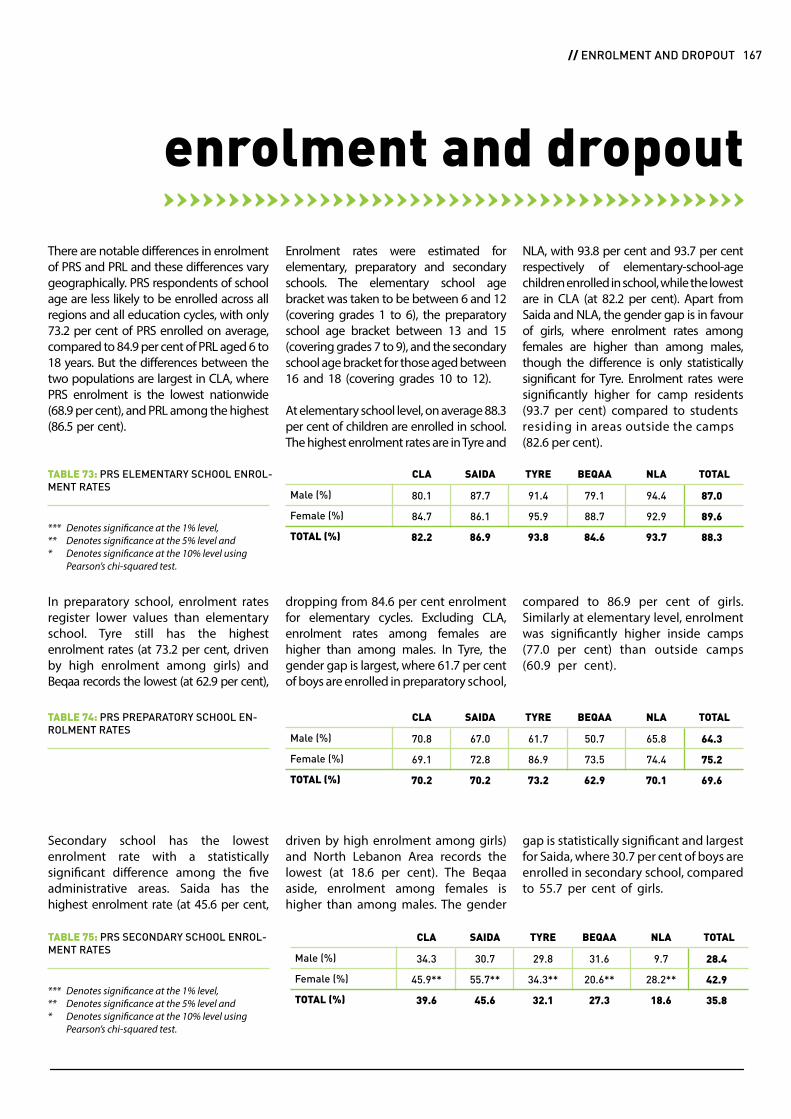
Enrolment rates were estimated for elementary, preparatory and secondary schools. The elementary school age bracket was taken to be between 6 and 12 (covering grades 1 to 6), the preparatory school age bracket between 13 and 15 (covering grades 7 to 9), and the secondary school age bracket for those aged between 16 and 18 (covering grades 10 to 12).
At elementary school level, on average 88.3 per cent of children are enrolled in school. The highest enrolment rates are in Tyre and
There are notable differences in enrolment of PRS and PRL and these differences vary geographically. PRS respondents of school age are less likely to be enrolled across all regions and all education cycles, with only 73.2 per cent of PRS enrolled on average, compared to 84.9 per cent of PRL aged 6 to 18 years. But the differences between the two populations are largest in CLA, where PRS enrolment is the lowest nationwide (68.9 per cent), and PRL among the highest (86.5 per cent).
NLA, with 93.8 per cent and 93.7 per cent respectively of elementary-school-age children enrolled in school, while the lowest are in CLA (at 82.2 per cent). Apart from Saida and NLA, the gender gap is in favour of girls, where enrolment rates among females are higher than among males, though the difference is only statistically significant for Tyre. Enrolment rates were significantly higher for camp residents (93.7 per cent) compared to students residing in areas outside the camps (82.6 per cent).
enrolment and dropout
Male (%)
Female (%)
TOTAL (%)
80.1
84.7
82.2
91.4
95.9
93.8
94.4
92.9
93.7
87.7
86.1
86.9
79.1
88.7
84.6
87.0
89.6
88.3
CLA SAIDA TYRE BEQAA NLA TOTALTABLE 73: PRS ELEMENTARY SCHOOL ENROL-MENT RATES
dropping from 84.6 per cent enrolment for elementary cycles. Excluding CLA, enrolment rates among females are higher than among males. In Tyre, the gender gap is largest, where 61.7 per cent of boys are enrolled in preparatory school,
In preparatory school, enrolment rates register lower values than elementary school. Tyre still has the highest enrolment rates (at 73.2 per cent, driven by high enrolment among girls) and Beqaa records the lowest (at 62.9 per cent),
compared to 86.9 per cent of girls. Similarly at elementary level, enrolment was significantly higher inside camps (77.0 per cent) than outside camps (60.9 per cent).
Male (%)
Female (%)
TOTAL (%)
70.8
69.1
70.2
61.7
86.9
73.2
65.8
74.4
70.1
67.0
72.8
70.2
50.7
73.5
62.9
64.3
75.2
69.6
CLA SAIDA TYRE BEQAA NLA TOTALTABLE 74: PRS PREPARATORY SCHOOL EN-ROLMENT RATES
Male (%)
Female (%)
TOTAL (%)
34.3
45.9**
39.6
29.8
34.3**
32.1
9.7
28.2**
18.6
30.7
55.7**
45.6
31.6
20.6**
27.3
28.4
42.9
35.8
CLA SAIDA TYRE BEQAA NLA TOTALTABLE 75: PRS SECONDARY SCHOOL ENROL-MENT RATES
driven by high enrolment among girls) and North Lebanon Area records the lowest (at 18.6 per cent). The Beqaa aside, enrolment among females is higher than among males. The gender
Secondary school has the lowest enrolment rate with a statistically significant difference among the five administrative areas. Saida has the highest enrolment rate (at 45.6 per cent,
gap is statistically significant and largest for Saida, where 30.7 per cent of boys are enrolled in secondary school, compared to 55.7 per cent of girls.
CHAPTER TEN // EDUCATION ACCESS AND ATTAINMENT OF PALESTINE REFUGEES FROM SYRIA LIVING IN LEBANON 167 // ENROLMENT AND DROPOUT
Denotes significance at the 1% level,Denotes significance at the 5% level andDenotes significance at the 10% level using Pearson’s chi-squared test.
******
Denotes significance at the 1% level,Denotes significance at the 5% level andDenotes significance at the 10% level using Pearson’s chi-squared test.
******

The average dropout rate151 reaches 7.1 per cent among PRS, varying between 7.5 per cent among males and 6.9 per cent among females. The highest rate is registered in Central Lebanon Area (CLA) (at 13.1 per cent) and the lowest in Tyre (at 3.0 per cent).
Dropout rates tend to increase with age with 11.3 per cent and 7.0 per cent of enrolled males and females dropping out respectively from the 13 to 15 age group compared to 21.8 per cent and 13.9 per cent of enrolled males and females from the 16 to 18 age group. These rates are higher than those observed for PRL, possibly due to PRS students facing harsher socioeconomic conditions or movement restrictions.
Females tend to be less prone to dropping out from school than males, as witnessed by a lower dropout rate in all regions except Tyre. Many students drop out before taking the Brevet, the Lebanese government exam taken on completion of middle school that enables students to enter secondary school. This dropout rate is evidenced by the fact that about two thirds (63.7 per cent) of those who drop out have reached the preparatory grade, without completing Brevet. This could be due to the difficulties PRS students face in getting an official Brevet certification in Grade 9, particularly if their legal status is irregular. This difficulty may prevent PRS students from continuing on to their secondary studies.
The share of school-age children who are not in school is 16.6 per cent, taking into account that the official school age is between 6 and 15. The rate rises to 24.0 per cent when setting the official school age from 6 to 18. Approximately 59.0 per cent of those aged 15 to 18 do not attend school. In terms of geographical locations, Central Lebanon Area (CLA) has the highest share of children who are not in school (ages 6 to 18) at 27.4 per cent, while Tyre has the lowest at 19.9 per cent.
151 The dropout rate is defined as the percentage of students of the total enrolled student population who enrolled in the current school year but dropped out. Differently to the UNRWA definition of the dropout rate being a student who was enrolled in an UNRWA school during a given school year but is not enrolled in any school (UNRWA or otherwise) in the following school year.
Dropout
CHAPTER TEN // EDUCATION ACCESS AND ATTAINMENT OF PALESTINE REFUGEES FROM SYRIA LIVING IN LEBANON168

152 Non-attendance is the percentage of school age children who either did not enrol in school for the current school year or enrolled but did not attend or dropped out.
Despite there being no cost to enrol in UNRWA schooling, close to one fifth of PRS cite an inability to afford schooling as a reason for non-attendance in CLA, the region with the lowest PRS enrolment, whereas under 6 per cent of PRL cite this reason in the same region. The region where the largest portion of PRS has financial difficulty enrolling in schools is NLA at 31 per cent. For PRL, 12 per cent of respondents in the Beqaa list financial difficulty as one of the barriers to enrolment.
Eleven per cent of PRS cite work as the reason for non-attendance in CLA, a significantly and substantially higher proportion than anywhere else in the country. For PRL, work is a far more frequent reason for non-attendance, across all areas, with around 7 per cent of PRS who do not attend school citing work as the reason for dropping out in NLA, with a high of 16 per cent in Saida.
Only a very small percentage of PRL across all regions report that they couldn’t register in schools, ranging from 1.2 per cent in Saida to less than 5.0 per cent in CLA. For PRS, on the other hand, non-registration is a far more frequent reason for non-attendance,
In a time of crisis and economic precariousness, education can serve as a protective factor for refugee children. Despite being among the most marginalized and in need of the support schooling can provide, PRS show much higher rates of non-attendance than PRL. This section looks more closely at the reasons that PRS of school age cited for not attending school, to try to identify the most significant barriers PRS face in accessing schooling in Lebanon.
Attendance rates are much lower for PRS than they are for PRL across all grades. The difference is especially large for secondary and tertiary education. A substantial proportion of those attending UNRWA schools and other vocational schools, and at the Lebanese University receive in-kind support.
PRS and PRL reasons for non-attendance152 vary by geographical area. The most salient geographic variations and the most marked differences across PRL and PRS are closely related: work and an inability to afford school. An inability (or failure) to register is also a reason that sets PRS apart from PRL.
with close to 9 per cent of ‘non-attendants’ in NLA and over 27 per cent of those not attending in the Beqaa failing to attend schools because they could not register for the current academic year.
Other reasons include not liking school (11.2 per cent) and low achievement/failure (11.2 per cent) with a significantly higher percentage of males expressing those reasons compared to females. The latter also list marriage as a reason for not enrolling.
When the average consumption aggregate is used as the measure of socioeconomic standing, the consumption aggregate is lowest for respondents who cite disability and illness as the reason for non-attendance, showing clearly the additional barriers that marginalized children for poorer families face in accessing schooling. On the other hand, respondents who are working instead of going to school have higher than average consumption aggregates, illustrating the incentive that PRS have to join the workforce at the expense of schooling.
factors preventing prs from attending school
Reason fornot attending
Disability or illness
Cannot afford
Work
No available space in school
Insecurity/ bullying
Too far
Couldn’t register
Overall average consumption aggregate
119.5
128.6
144.0
145.4
122.7
124.7
138.2
136.5
Average consumption aggregate(US$/month)
TABLE 76: PRS AVERAGE CONSUMPTION AGGREGATE FOR EVERY HOUSEHOLD BY REASON FOR NON-ATTENDANCE
169 // FACTORS PREVENTING PRS FROM ATTENDING SCHOOL

students compared to 37.9 per cent of PRL students attend other universities. This disparity could be explained by the inability to afford private tuition. Vocational training is an important form of transitional education for PRS youth in Lebanon. Significantly more 16 to 18-year-old PRS students enrol in vocational education and vocational training short courses (27.8 per cent) compared to 17.5 per cent of PRL youth of the same age.
When the average consumption aggregate is used as a measure of socioeconomic
The majority of PRS attend UNRWA schools, with 84.6 per cent of 6 to 12-year-old students and 84.2 per cent of 13 to 15-year-old students enrolled in UNRWA educational facilities. A mere 3.9 per cent of 6 to 18-year-olds attend public schools, highlighting the essential role UNRWA is playing in absorbing PRS children of school age. While university attendance is lower for PRS compared to PRL, in the 19 to 24-year-old student bracket, 9.6 per cent of PRS attend the Lebanese University compared to 15.9 per cent of PRL students. Also, 15.3 per cent of PRS
standing, households with respondents in Lebanese public or private schools without fees or attending vocational or informal training courses tend to have higher consumption aggregates than households with respondents attending UNRWA schools or kindergartens. As is the case with PRL, UNRWA seems to be playing a crucial role in providing educational services to PRS families who could not afford to send their children to the Lebanese schooling system and who would otherwise likely be dropping out of school altogether.
type of educationalinstitution attended
Type of educationalinstitution
UNRWA school
Public school
Private school with fees
Private school without fees
Vocational training / short courses / informal education
Kindergarten
133.0
168.0
214.4
130.6
140.4
137.6
Average consumption aggregate(US$/month)
TABLE 77: PRS AVERAGE CONSUMPTION AGGREGATE (US$/MONTH) BY TYPE OF EDUCATIONAL INSTITUTION ATTENDED
The survey clearly shows that PRS children and youth with disabilities do not have equal access to educational institutions as their non-disabled peers. Children with disability are less likely to be enrolled in an UNRWA school (59.1 per cent compared to 70.3 per cent of those without disability). Whereas a higher concentration of students with a disability attend private schools with fees (2.5 per cent to 1.6 per cent) and schools for children with special needs (6.2 per cent). Both of these options are likely to have significant financial
‘Income vulnerability’ can be measured by looking at respondents whose income comes primarily from transient and unreliable sources. Close to 80 per cent of PRS households report that their primary income is from the sale of assets, support from relatives, debt and financial assistance from UNRWA or from other organizations (whereas around 40 per cent of PRL are ‘income vulnerable’ according to this measure). Comparing PRS to PRL, there is roughly equal access to Lebanese educational institutions for both PRS and PRL.
implications on PRS families of children with disability – particularly since 89 per cent of PRS are living below the poverty line. Vocational training, short courses and informal education are also another important means of accessing education for those vulnerable to being marginalized from mainstream education, and youth with disability are about twice more likely to attend vocational training, short courses or informal education than their non-disabled peers (4.0 per cent compared to 2.3 per cent).
CHAPTER TEN // EDUCATION ACCESS AND ATTAINMENT OF PALESTINE REFUGEES FROM SYRIA LIVING IN LEBANON170
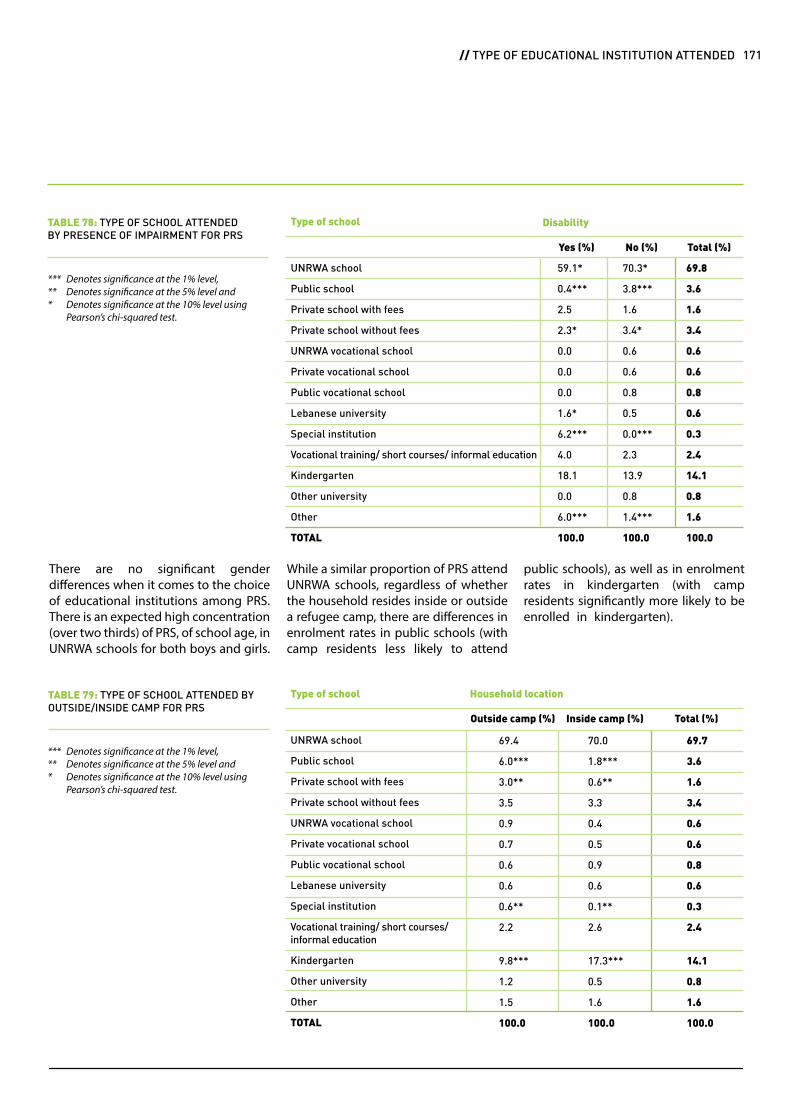
While a similar proportion of PRS attend UNRWA schools, regardless of whether the household resides inside or outside a refugee camp, there are differences in enrolment rates in public schools (with camp residents less likely to attend
There are no significant gender differences when it comes to the choice of educational institutions among PRS. There is an expected high concentration (over two thirds) of PRS, of school age, in UNRWA schools for both boys and girls.
public schools), as well as in enrolment rates in kindergarten (with camp residents significantly more likely to be enrolled in kindergarten).
Type of school
UNRWA school
Public school
Private school with fees
Private school without fees
UNRWA vocational school
Private vocational school
Public vocational school
Lebanese university
Special institution
Vocational training/ short courses/ informal education
Kindergarten
Other university
Other
TOTAL
Disability
Yes (%)
59.1*
0.4***
2.5
2.3*
0.0
0.0
0.0
1.6*
6.2***
4.0
18.1
0.0
6.0***
100.0
Total (%)
69.8
3.6
1.6
3.4
0.6
0.6
0.8
0.6
0.3
2.4
14.1
0.8
1.6
100.0
No (%)
70.3*
3.8***
1.6
3.4*
0.6
0.6
0.8
0.5
0.0***
2.3
13.9
0.8
1.4***
100.0
TABLE 78: TYPE OF SCHOOL ATTENDED BY PRESENCE OF IMPAIRMENT FOR PRS
Type of school
UNRWA school
Public school
Private school with fees
Private school without fees
UNRWA vocational school
Private vocational school
Public vocational school
Lebanese university
Special institution
Vocational training/ short courses/ informal education
Kindergarten
Other university
Other
TOTAL
Household location
69.4
6.0***
3.0**
3.5
0.9
0.7
0.6
0.6
0.6**
2.2
9.8***
1.2
1.5
100.0
69.7
3.6
1.6
3.4
0.6
0.6
0.8
0.6
0.3
2.4
14.1
0.8
1.6
100.0
70.0
1.8***
0.6**
3.3
0.4
0.5
0.9
0.6
0.1**
2.6
17.3***
0.5
1.6
100.0
TABLE 79: TYPE OF SCHOOL ATTENDED BY OUTSIDE/INSIDE CAMP FOR PRS
Outside camp (%) Inside camp (%) Total (%)
CHAPTER TEN // EDUCATION ACCESS AND ATTAINMENT OF PALESTINE REFUGEES FROM SYRIA LIVING IN LEBANON 171 // TYPE OF EDUCATIONAL INSTITUTION ATTENDED
Denotes significance at the 1% level,Denotes significance at the 5% level andDenotes significance at the 10% level using Pearson’s chi-squared test.
******
Denotes significance at the 1% level,Denotes significance at the 5% level andDenotes significance at the 10% level using Pearson’s chi-squared test.
******

One more vulnerable group is PRS children and youth living in female-headed households. This group has to cope with a heightened vulnerability
to marginalization when accessing schooling. In assessing this group, compared to the average PRS student, PRS from female-headed households
are more likely to enrol in an UNRWA school or a public school, more likely to be at university, and less likely to enrol in a private school or kindergarten.
TABLE 80: TYPE OF SCHOOL ATTENDED BY CHILDREN OF FEMALE-HEADED PRS HOUSEHOLDS
Type of school
UNRWA school
Public school
Private school with fees
Private school without fees
UNRWA vocational school
Private vocational school
Public vocational school
Lebanese university
Special institution
Vocational training/ short courses/ informal education
Kindergarten
Other university
Other
TOTAL
72.6
5.5
0.9
2.7
0.5
0.8
1.4
1.1
0.9
1.4
9.5
1.8
0.9
100.0
Percentages (%)
69.7
3.6
1.6
3.4
0.6
0.6
0.8
0.6
0.3
2.4
14.1
0.8
1.6
100.0
Total (%)
CHAPTER TEN // EDUCATION ACCESS AND ATTAINMENT OF PALESTINE REFUGEES FROM SYRIA LIVING IN LEBANON172
Denotes significance at the 1% level,Denotes significance at the 5% level andDenotes significance at the 10% level using Pearson’s chi-squared test.
******

Over half (60.2 per cent) of PRS above the age of 25 do not have a Brevet certificate, 6.6 per cent of whom never even attended school. PRS children face many challenges while trying to sit for official exams in Lebanon (Brevet and Baccalaureate), mostly due to lack of official documentation in order to receive the certification.
The share of Baccalaureate degree holders is 15.7 per cent, and that of university degree holders is a mere 4.9 per cent.
Female PRS are three times more likely to have never attended school compared to males (9.4 per cent to 3.2 per cent). However, when they do attend school, females are more likely to see schooling through to a successful completion, with those holding Baccalaureate degrees (as
their highest level of schooling) higher than that of males, 9.5 per cent compared to 6.1 per cent.
PRS residing in Tyre are least likely to hold a Brevet, with 63.4 per cent of the population over 25 years reaching preparatory school as their highest level of schooling with the official certification.Nearly all PRS holding a postgraduate university degree are based in NLA.
educational attainmentand illiteracy
153 Illiteracy rate usually measured through asking the respondent to write a short paragraph about themselves. However, due to time constraints, the Proxy respondent answered on behalf of the household members, choosing from the options of ‘illiterate’ ‘ can read and write’, ‘don’t know’ and ‘refused to answer’.
On average, 4.6 per cent of the PRS population who never attended school were reported to be illiterate by the proxy respondent.153 Females who had never attended school were nearly three times
more likely to be illiterate compared to male PRS (6.5 per cent to 2.3 per cent). As illiteracy is an age-related phenomenon, the rate is highest among those above the age of 65 who had never attended
school (34 per cent). The rate also varies by region, with North Lebanon Area having the lowest rate of 3.6 per cent and the Beqaa the highest at 5.6 per cent.
Highest level of schooling achieved
Never attended (%)
Elementary – not completed (%)
Elementary – completed (%)
Preparatory – no Brevet (%)
Preparatory – Brevet (%)
Secondary – without Baccalaureate (%)
Secondary – with Baccalaureate (%)
Vocational or technical – without certificate (%)
Vocational or technical – with certificate (%)
University – without degree (%)
University – with degree (%)
University – post graduate (%)
TOTAL (%)
7.8
18.9
7.7**
25.2
10.1
5.8
8.0**
1.3
7.5
4.3*
3.2
0.1***
100
CLA Saida Tyre Beqaa NLA TOTAL
6.2
14.5
7.4**
29.2
8.6
7.8
10.3**
1.3
6.5
2.9*
5.2
0.1***
100
6.6
23.2
4.6**
28.9
9.9
5.9
6.0**
1.9
7.4
1.3*
4.3
0.0***
100
5.8
15.8
10.6**
28.9
7.4
9.0
6.9**
1.0
5.4
2.5*
5.6
1.0***
100
7.0
14.5
10.6**
30.2
8.9
6.2
6.5**
1.0
7.2
3.3*
4.6
0.0***
100
6.6
17.1
7.9
28.5
9.0
7.0
8.0
1.3
6.8
2.8
4.7
0.2
100
TABLE 81: PRS HIGHEST LEVEL OF SCHOOLING ACHIEVED BY LOCATION (ABOVE 25 YEARS OF AGE)
CHAPTER TEN // EDUCATION ACCESS AND ATTAINMENT OF PALESTINE REFUGEES FROM SYRIA LIVING IN LEBANON 173 // EDUCATIONAL ATTAINMENT AND ILLITERACY
Denotes significance at the 1% level,Denotes significance at the 5% level andDenotes significance at the 10% level using Pearson’s chi-squared test.
******

In conclusion, UNRWA is filling a massive void when it comes to providing and offering PRS schooling and education opportunities. However, as PRS school-aged children reach secondary-age brackets, attendance rates drop. Moreover, PRS boys have lower attendance levels than girls. There needs to be more effort into increasing attendance rates and enrolment in various educational levels among PRS.
conclusion
CHAPTER TEN // EDUCATION ACCESS AND ATTAINMENT OF PALESTINE REFUGEES FROM SYRIA LIVING IN LEBANON174

CHAPTER TEN // EDUCATION ACCESS AND ATTAINMENT OF PALESTINE REFUGEES FROM SYRIA LIVING IN LEBANON

© 2014 UNRWA / Said Qazaz

177
Access to Work and Decent Work Conditions for Palestine Refugees from Syria Living in Lebanonlara batlouni, alexandra irani
CHAPTERELEVEN

Key Findings
PRS IN NLA AND THE BEQAA HAVE THE HIGHEST UNEMPLOYMENT RATES (64 PER CENT AND58 PER CENT RESPECTIVELY)
PRS THAT HAVE FOUND EMPLOYMENT WORK IN EXPLOITATIVE, INSECURE WORKING CONDITIONS
FORFEMALES
FORMALES68.1% 48.5%
52.5%
23.2%
THE UNEMPLOYMENT RATE154
AMONG PRS REACHES A STAGGERING
THE RATEINCREASES TO
COMPAREDTO
MORE THAN DOUBLE THE RATE FOR PRL
OF THE EMPLOYED ARE PAID ON A DAILY BASISThe vast majority (97.7 per cent) only have verbal agreements with their employers meaning that employment could be terminated at any time without notice.
HAVE NO SICK OR ANNUAL LEAVE ENTITLEMENTS
53.4%
98.2%
154 The unemployment rate is defined as the number of unemployed divided by the labour force (employment + unemployment).
CHAPTER ELEVEN // ACCESS TO WORK AND DECENT WORK CONDITIONS FOR PALESTINE REFUGEES FROM SYRIA LIVING IN LEBANON178

PRS FEMALES ARE ALMOST 10 TIMES MORE LIKELY TO WORK AS ‘PROFESSIONALS’ AND ‘ASSOCIATE PROFESSIONALS’ THAN MEN (25.7 PER CENT COMPARED TO 2.8 PER CENT)
WHILE HIGHER EDUCATION LEVELS INCREASE THE CHANCES OF EMPLOYMENT FOR PRL
WHILE PRS MALES ARE SIGNIFICANTLY MORE LIKELY TO BE EMPLOYED THAN FEMALES, THEY ARE EMPLOYED IN SECTORS WITH MORE PRECARIOUS WORKING CONDITIONS(DAILY PAY, NO CONTRACT, NO WORK PERMIT, AND LIMITED LEAVE ENTITLEMENTS)
Although PRS females experience much higher unemployment rates than males (only 4.5 per cent are employed compared to 34.1 per cent of males), when they are employed, they have access to a higher standard of working conditions working in professional sectors that provide contracts, leave entitlements and a monthly salary. Women are more likely to be employed in service, sales, professional and associate professional occupation. Hence, they are more likely to be paid on a monthly basis (35.0 per cent) than men (9.8 per cent). However, since females occupy only a small share (14.2 per cent) of the employed population, this equates to only 14.1 per cent of the employed population who are paid on a more secure, monthly basis.
PRS females are also more likely to work in the formal sector (UNRWA and NGOs). Furthermore, significantly more women have written contracts (12.2 per cent) than men (0.8 per cent). Therefore in Lebanon female PRS have higher job security than male PRS working in Lebanon.
This reflects the fact that the majority of PRS are employed in elementary agricultural work (47.3 per cent) and craft and trade (28.1 per cent), which do not require Baccalaureate certification. Despite higher levels of educational attainment in PRS heads of households, food insecurity remains high, implying that it is less a result of intergenerational poverty than of their recent displacement.
15.9%20.8%
THE PROBABILITY THAT A PRS BACCALAUREATE HOLDER IS EMPLOYED IS SIGNIFICANTLY LOWER THAN THAT
OF A BREVET HOLDER
CHAPTER ELEVEN // ACCESS TO WORK AND DECENT WORK CONDITIONS FOR PALESTINE REFUGEES FROM SYRIA LIVING IN LEBANON 179 // KEY FINDINGS

PRS enjoyed almost full employment rights in Syria prior to their arrival to Lebanon, where they face more restrictive employment measures and an over-saturated labour market with limited decent work opportunities. They are considered foreigners according to Ministerial Decree No. 17561 and, unlike PRL, are not exempted from work permit fees and are prohibited to work in several administrative and commercial professions that are otherwise open to PRL.
Since August 2013, various measures have been implemented regarding the entry and stay of Syrian refugees and PRS in Lebanon, which has sometimes led to confusion and resulted in instances where PRS were asked to sign papers claiming they would not seek employment during their stay in Lebanon (a measure from the Lebanese Authorities targeting Syrian refugees). In addition, due to complex residency renewal procedures, many PRS are residing without legal status in Lebanon. Without legal status, PRS face restrictions on their freedom of movement, mainly due to the
fear of arrest at checkpoints. Furthermore, in order to move in and out of Palestine refugee camps a permit is required, for which legal status is often a pre-requisite. Therefore, some PRS living without legal stay do not leave their area of residence, thereby restricting access to economic opportunities outside of the camps.
The aforementioned factors contribute to the low number of employed PRS, almost half of whom work in elementary occupations in precarious working conditions.
155 All persons above a specified age who were employed or unemployed during a short reference period (e.g. one week, one day).156 LFPR is defined as the labour force out of the working age population.
rate (LFPR) at 47.4 per cent and46.5 per cent respectively. Participation of PRS in the labour force does not vary drastically between regions, reaching highest in Central Lebanon Area (CLA)
The labour force155 participation rate (LFPR)156 among PRS is 37.7 per cent compared to 41.8 per cent for PRL. The 35 to 44 and 25 to 34 age groups have the highest Labour Force Participation
(at 41.2 per cent) and lowest in Saida (at 34.4 per cent). This LFPR conceals notable gender disparity, where the female rate registers 14.2 per cent, against 66.1 per cent for males.
economic activity
MALE FEMALE CLA NLA TYRE BEQAA SAIDA TOTAL
FIGURE 39: PRS LABOUR FORCE PARTICIPATION RATE BY GENDER AND LOCATION (PER CENT)
37.7
66.1
14.2
41.2 40.8 39 35.7 34.4
CHAPTER ELEVEN // ACCESS TO WORK AND DECENT WORK CONDITIONS FOR PALESTINE REFUGEES FROM SYRIA LIVING IN LEBANON180
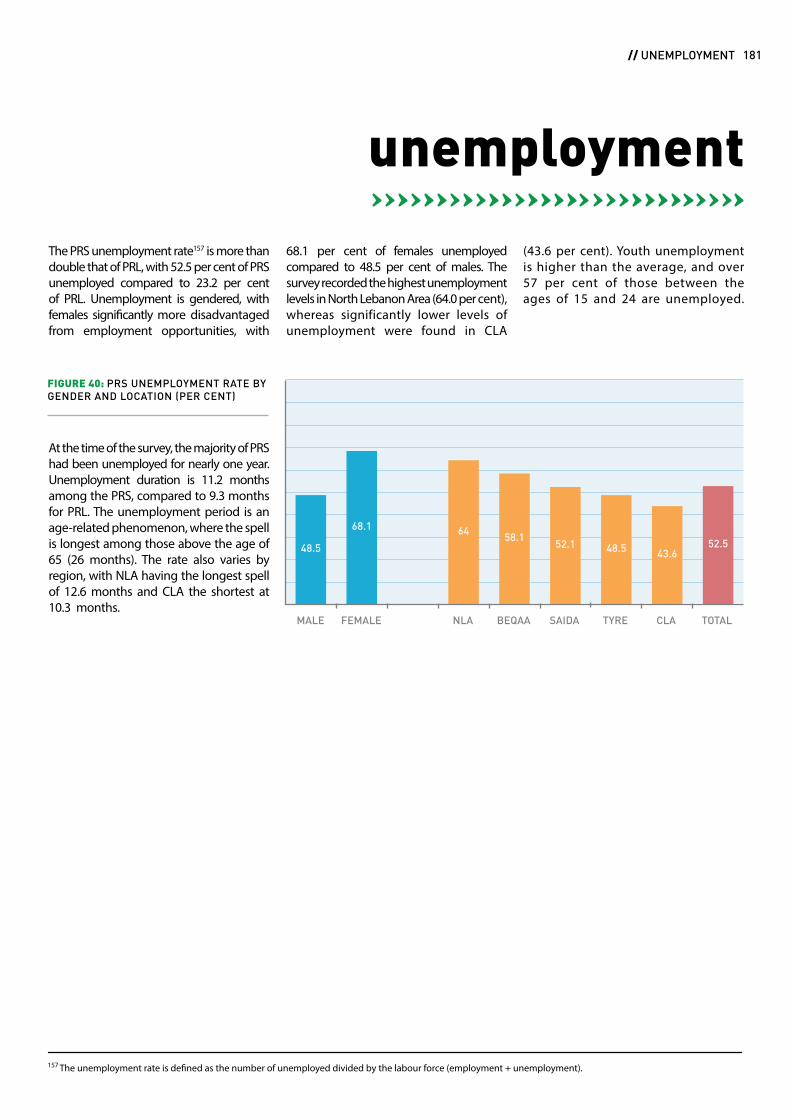
157 The unemployment rate is defined as the number of unemployed divided by the labour force (employment + unemployment).
68.1 per cent of females unemployed compared to 48.5 per cent of males. The survey recorded the highest unemployment levels in North Lebanon Area (64.0 per cent), whereas significantly lower levels of unemployment were found in CLA
The PRS unemployment rate157 is more than double that of PRL, with 52.5 per cent of PRS unemployed compared to 23.2 per cent of PRL. Unemployment is gendered, with females significantly more disadvantaged from employment opportunities, with
At the time of the survey, the majority of PRS had been unemployed for nearly one year. Unemployment duration is 11.2 months among the PRS, compared to 9.3 months for PRL. The unemployment period is an age-related phenomenon, where the spell is longest among those above the age of 65 (26 months). The rate also varies by region, with NLA having the longest spell of 12.6 months and CLA the shortest at 10.3 months.
(43.6 per cent). Youth unemployment is higher than the average, and over 57 per cent of those between the ages of 15 and 24 are unemployed.
unemployment
MALE FEMALE NLA BEQAA SAIDA TYRE CLA TOTAL
FIGURE 40: PRS UNEMPLOYMENT RATE BY GENDER AND LOCATION (PER CENT)
48.5
68.1 6458.1
52.1 48.5 43.652.5
CHAPTER ELEVEN // ACCESS TO WORK AND DECENT WORK CONDITIONS FOR PALESTINE REFUGEES FROM SYRIA LIVING IN LEBANON 181 // UNEMPLOYMENT
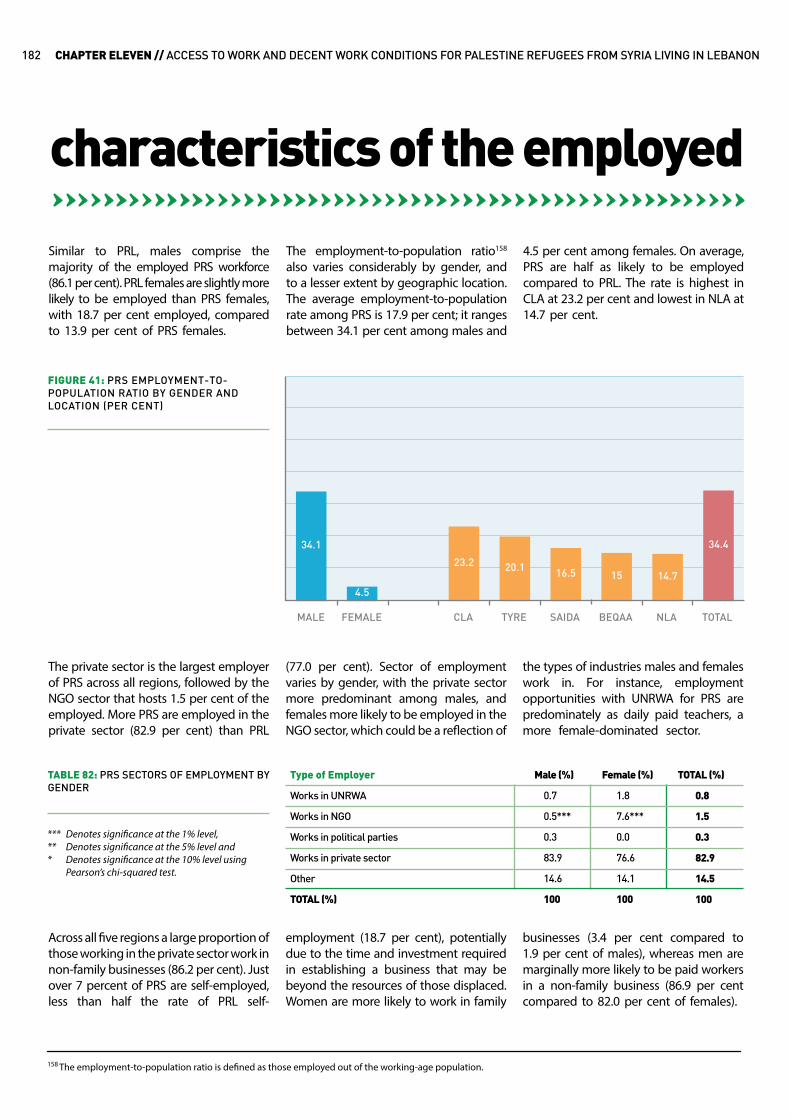
The employment-to-population ratio158 also varies considerably by gender, and to a lesser extent by geographic location. The average employment-to-population rate among PRS is 17.9 per cent; it ranges between 34.1 per cent among males and
Similar to PRL, males comprise the majority of the employed PRS workforce (86.1 per cent). PRL females are slightly more likely to be employed than PRS females, with 18.7 per cent employed, compared to 13.9 per cent of PRS females.
4.5 per cent among females. On average, PRS are half as likely to be employed compared to PRL. The rate is highest in CLA at 23.2 per cent and lowest in NLA at 14.7 per cent.
characteristics of the employed
158 The employment-to-population ratio is defined as those employed out of the working-age population.
MALE FEMALE CLA TYRE SAIDA BEQAA NLA TOTAL
FIGURE 41: PRS EMPLOYMENT-TO-POPULATION RATIO BY GENDER AND LOCATION (PER CENT)
34.1
4.5
23.2 20.1 16.5 15 14.7
34.4
The private sector is the largest employer of PRS across all regions, followed by the NGO sector that hosts 1.5 per cent of the employed. More PRS are employed in the private sector (82.9 per cent) than PRL
(77.0 per cent). Sector of employment varies by gender, with the private sector more predominant among males, and females more likely to be employed in the NGO sector, which could be a reflection of
the types of industries males and females work in. For instance, employment opportunities with UNRWA for PRS are predominately as daily paid teachers, a more female-dominated sector.
Type of Employer
Works in UNRWA
Works in NGO
Works in political parties
Works in private sector
Other
TOTAL (%)
0.7
0.5***
0.3
83.9
14.6
100
Male (%) Female (%) TOTAL (%)
1.8
7.6***
0.0
76.6
14.1
100
0.8
1.5
0.3
82.9
14.5
100
TABLE 82: PRS SECTORS OF EMPLOYMENT BY GENDER
Across all five regions a large proportion of those working in the private sector work in non-family businesses (86.2 per cent). Just over 7 percent of PRS are self-employed, less than half the rate of PRL self-
employment (18.7 per cent), potentially due to the time and investment required in establishing a business that may be beyond the resources of those displaced. Women are more likely to work in family
businesses (3.4 per cent compared to 1.9 per cent of males), whereas men are marginally more likely to be paid workers in a non-family business (86.9 per cent compared to 82.0 per cent of females).
CHAPTER ELEVEN // ACCESS TO WORK AND DECENT WORK CONDITIONS FOR PALESTINE REFUGEES FROM SYRIA LIVING IN LEBANON182
Denotes significance at the 1% level,Denotes significance at the 5% level andDenotes significance at the 10% level using Pearson’s chi-squared test.
******
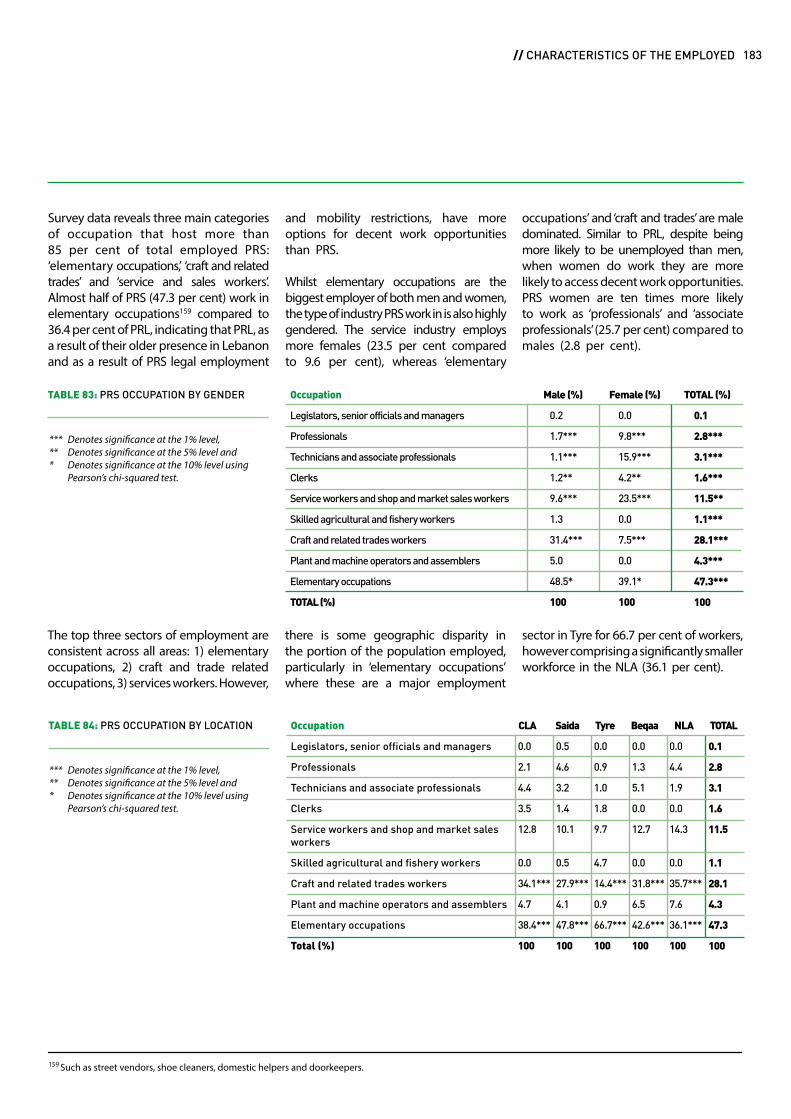
159 Such as street vendors, shoe cleaners, domestic helpers and doorkeepers.
Survey data reveals three main categories of occupation that host more than 85 per cent of total employed PRS: ‘elementary occupations,’ ‘craft and related trades’ and ‘service and sales workers’. Almost half of PRS (47.3 per cent) work in elementary occupations159 compared to 36.4 per cent of PRL, indicating that PRL, as a result of their older presence in Lebanon and as a result of PRS legal employment
and mobility restrictions, have more options for decent work opportunities than PRS.
Whilst elementary occupations are the biggest employer of both men and women, the type of industry PRS work in is also highly gendered. The service industry employs more females (23.5 per cent compared to 9.6 per cent), whereas ‘elementary
occupations’ and ‘craft and trades’ are male dominated. Similar to PRL, despite being more likely to be unemployed than men, when women do work they are more likely to access decent work opportunities. PRS women are ten times more likely to work as ‘professionals’ and ‘associate professionals’ (25.7 per cent) compared to males (2.8 per cent).
Occupation
Legislators, senior officials and managers
Professionals
Technicians and associate professionals
Clerks
Service workers and shop and market sales workers
Skilled agricultural and fishery workers
Craft and related trades workers
Plant and machine operators and assemblers
Elementary occupations
TOTAL (%)
0.2
1.7***
1.1***
1.2**
9.6***
1.3
31.4***
5.0
48.5*
100
Male (%) Female (%) TOTAL (%)
0.0
9.8***
15.9***
4.2**
23.5***
0.0
7.5***
0.0
39.1*
100
0.1
2.8***
3.1***
1.6***
11.5**
1.1***
28.1***
4.3***
47.3***
100
TABLE 83: PRS OCCUPATION BY GENDER
The top three sectors of employment are consistent across all areas: 1) elementary occupations, 2) craft and trade related occupations, 3) services workers. However,
there is some geographic disparity in the portion of the population employed, particularly in ‘elementary occupations’ where these are a major employment
sector in Tyre for 66.7 per cent of workers, however comprising a significantly smaller workforce in the NLA (36.1 per cent).
Occupation
Legislators, senior officials and managers
Professionals
Technicians and associate professionals
Clerks
Service workers and shop and market sales workers
Skilled agricultural and fishery workers
Craft and related trades workers
Plant and machine operators and assemblers
Elementary occupations
Total (%)
0.0
2.1
4.4
3.5
12.8
0.0
34.1***
4.7
38.4***
100
CLA Saida Tyre Beqaa NLA TOTAL
0.5
4.6
3.2
1.4
10.1
0.5
27.9***
4.1
47.8***
100
0.0
0.9
1.0
1.8
9.7
4.7
14.4***
0.9
66.7***
100
0.0
4.4
1.9
0.0
14.3
0.0
35.7***
7.6
36.1***
100
0.0
1.3
5.1
0.0
12.7
0.0
31.8***
6.5
42.6***
100
0.1
2.8
3.1
1.6
11.5
1.1
28.1
4.3
47.3
100
TABLE 84: PRS OCCUPATION BY LOCATION
CHAPTER ELEVEN // ACCESS TO WORK AND DECENT WORK CONDITIONS FOR PALESTINE REFUGEES FROM SYRIA LIVING IN LEBANON 183 // CHARACTERISTICS OF THE EMPLOYED
Denotes significance at the 1% level,Denotes significance at the 5% level andDenotes significance at the 10% level using Pearson’s chi-squared test.
******
Denotes significance at the 1% level,Denotes significance at the 5% level andDenotes significance at the 10% level using Pearson’s chi-squared test.
******

dangerous phenomenon that could reinforce incentives for PRS to leave school early.
Nevertheless, there is a relationship between tertiary education and access to better quality jobs. The probability of being employed is 19.1 per cent and
than half of employed men (53.4 per cent) are paid on a daily basis, indicating that the majority experience precarious sources of income. Employed PRS working in ‘service and sales’, as well as ‘professional’ and
Due to employment restrictions faced by PRS, unlike for PRL, a higher level of education does not always increase likelihood of securing employment. The probability that a PRS Baccalaureate holder is employed (15.9 per cent) is significantly lower than that of a Brevet holder (20.8 per cent), a potentially
Decent job160 opportunities are not within reach of the majority of the employed. Men are more likely to be employed and are more likely to be employed in the elementary, craft and trades sectors. More
22.1 per cent for PRS who have graduated from vocational training or university respectively. Over half of the employed university graduates (55.3 per cent) work as professionals, while the same proportion of those with an education short of a Brevet degree work in elementary occupations.
‘associate professionals’, are more likely to be paid on a monthly basis and more likely to be females since more women work in these sectors.
educational attainment and employment outcomes
access to decentwork opportunities
160 According to the ILO, decent jobs provide workers with opportunities for work that is productive and delivers a fair income, security in the workplace and social protection for families, better prospects for personal development and social integration, freedom to express their concerns, organise and participate in the decisions that affect their lives and equality of opportunity and treatment for all women and men.
Payment basis
Daily
Weekly
Monthly
By Piece
TOTAL
54.76
6.79
9.87**
28.58
100
Male (%) Female (%) TOTAL (%)
46.71
0.00
35.00**
18.29
100
53.4
5.7
14.1
26.9
100
TABLE 85: PRS PAYMENT BASIS BY GENDER
any moment – employment could be terminated without notice. Females are more likely to work in the formal sector (e.g. with UNRWA and NGOs). Consequently, significantly more women
The precarious nature of wage labour is reinforced by the fact that the majority of those employed (97.7 per cent) only have verbal agreements with their employers. This form of agreement means that – at
have written contracts (12.2 per cent) than men (0.8 per cent). Female PRS, therefore, have higher job security than male PRS.
CHAPTER ELEVEN // ACCESS TO WORK AND DECENT WORK CONDITIONS FOR PALESTINE REFUGEES FROM SYRIA LIVING IN LEBANON184
Denotes significance at the 1% level,Denotes significance at the 5% level andDenotes significance at the 10% level using Pearson’s chi-squared test.
******
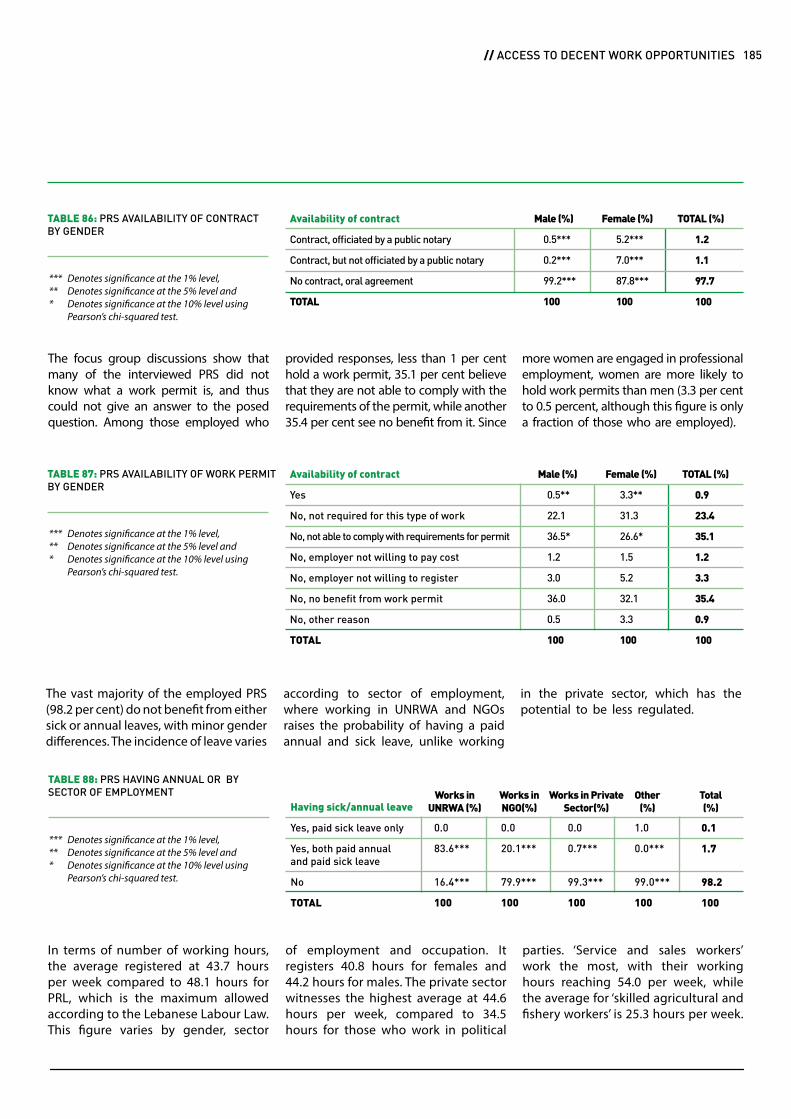
The focus group discussions show that many of the interviewed PRS did not know what a work permit is, and thus could not give an answer to the posed question. Among those employed who
provided responses, less than 1 per cent hold a work permit, 35.1 per cent believe that they are not able to comply with the requirements of the permit, while another 35.4 per cent see no benefit from it. Since
more women are engaged in professional employment, women are more likely to hold work permits than men (3.3 per cent to 0.5 percent, although this figure is only a fraction of those who are employed).
Availability of contract
Contract, officiated by a public notary
Contract, but not officiated by a public notary
No contract, oral agreement
TOTAL
0.5***
0.2***
99.2***
100
Male (%) Female (%) TOTAL (%)
5.2***
7.0***
87.8***
100
1.2
1.1
97.7
100
TABLE 86: PRS AVAILABILITY OF CONTRACTBY GENDER
Availability of contract
Yes
No, not required for this type of work
No, not able to comply with requirements for permit
No, employer not willing to pay cost
No, employer not willing to register
No, no benefit from work permit
No, other reason
TOTAL
0.5**
22.1
36.5*
1.2
3.0
36.0
0.5
100
Male (%) Female (%) TOTAL (%)
3.3**
31.3
26.6*
1.5
5.2
32.1
3.3
100
0.9
23.4
35.1
1.2
3.3
35.4
0.9
100
TABLE 87: PRS AVAILABILITY OF WORK PERMIT BY GENDER
according to sector of employment, where working in UNRWA and NGOs raises the probability of having a paid annual and sick leave, unlike working
The vast majority of the employed PRS (98.2 per cent) do not benefit from either sick or annual leaves, with minor gender differences. The incidence of leave varies
in the private sector, which has the potential to be less regulated.
Having sick/annual leave
Yes, paid sick leave only
Yes, both paid annualand paid sick leave
No
TOTAL
0.0
83.6***
16.4***
100
0.0
20.1***
79.9***
100
0.0
0.7***
99.3***
100
1.0
0.0***
99.0***
100
0.1
1.7
98.2
100
Works inUNRWA (%)
Works inNGO(%)
Works in PrivateSector(%)
Other(%)
Total(%)
TABLE 88: PRS HAVING ANNUAL OR BY SECTOR OF EMPLOYMENT
of employment and occupation. It registers 40.8 hours for females and 44.2 hours for males. The private sector witnesses the highest average at 44.6 hours per week, compared to 34.5 hours for those who work in political
In terms of number of working hours, the average registered at 43.7 hours per week compared to 48.1 hours for PRL, which is the maximum allowed according to the Lebanese Labour Law. This figure varies by gender, sector
parties. ‘Service and sales workers’ work the most, with their working hours reaching 54.0 per week, while the average for ‘skilled agricultural and fishery workers’ is 25.3 hours per week.
CHAPTER ELEVEN // ACCESS TO WORK AND DECENT WORK CONDITIONS FOR PALESTINE REFUGEES FROM SYRIA LIVING IN LEBANON 185 // ACCESS TO DECENT WORK OPPORTUNITIES
Denotes significance at the 1% level,Denotes significance at the 5% level andDenotes significance at the 10% level using Pearson’s chi-squared test.
******
Denotes significance at the 1% level,Denotes significance at the 5% level andDenotes significance at the 10% level using Pearson’s chi-squared test.
******
Denotes significance at the 1% level,Denotes significance at the 5% level andDenotes significance at the 10% level using Pearson’s chi-squared test.
******

In conclusion, unemployment is extremely high among PRS with more than half unemployed. In addition, PRS with work have been found to hold low-paying jobs under exploitative conditions. Even though women are less likely to be employed than men, when they are employed their working conditions are usually better than those for men. Compared to PRL, PRS with the same educational attainment have lower employment rates, lower pay and their sense of insecurity is high regardless of their educational achievement level, a dangerous trend that could encourage PRS to abandon enrolment.
conclusion
CHAPTER ELEVEN // ACCESS TO WORK AND DECENT WORK CONDITIONS FOR PALESTINE REFUGEES FROM SYRIA LIVING IN LEBANON186

CHAPTER ELEVEN // ACCESS TO WORK AND DECENT WORK CONDITIONS FOR PALESTINE REFUGEES FROM SYRIA LIVING IN LEBANON

© 2015 UNRWA / Firas Abo Aloul
189
Population Health and Access to Services for Palestine Refugees from Syria Living in Lebanonhala ghattas, nisreen salti, jowel choufani, hina shaheed, tala ismail
CHAPTERTWELVE
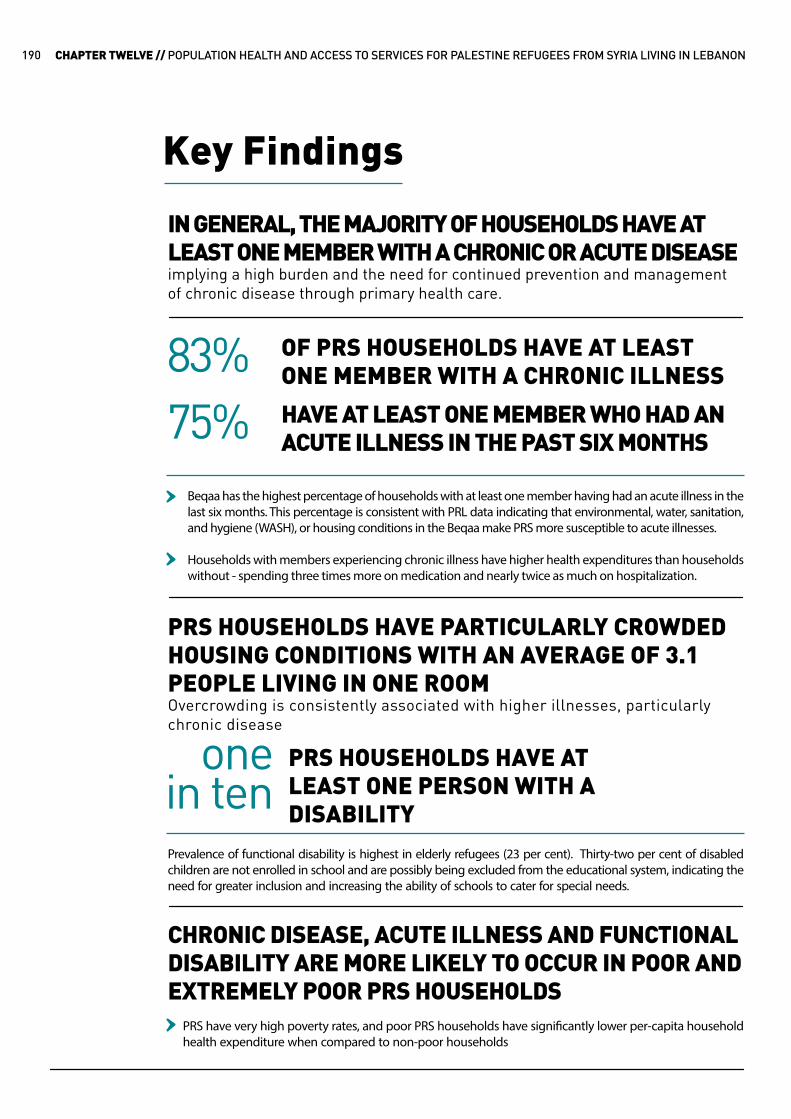
Key Findings
IN GENERAL, THE MAJORITY OF HOUSEHOLDS HAVE AT LEAST ONE MEMBER WITH A CHRONIC OR ACUTE DISEASEimplying a high burden and the need for continued prevention and management of chronic disease through primary health care.
PRS HOUSEHOLDS HAVE PARTICULARLY CROWDED HOUSING CONDITIONS WITH AN AVERAGE OF 3.1 PEOPLE LIVING IN ONE ROOMOvercrowding is consistently associated with higher illnesses, particularly chronic disease
CHRONIC DISEASE, ACUTE ILLNESS AND FUNCTIONAL DISABILITY ARE MORE LIKELY TO OCCUR IN POOR AND EXTREMELY POOR PRS HOUSEHOLDS
PRS have very high poverty rates, and poor PRS households have significantly lower per-capita household health expenditure when compared to non-poor households
Beqaa has the highest percentage of households with at least one member having had an acute illness in the last six months. This percentage is consistent with PRL data indicating that environmental, water, sanitation, and hygiene (WASH), or housing conditions in the Beqaa make PRS more susceptible to acute illnesses.
Households with members experiencing chronic illness have higher health expenditures than households without - spending three times more on medication and nearly twice as much on hospitalization.
Prevalence of functional disability is highest in elderly refugees (23 per cent). Thirty-two per cent of disabled children are not enrolled in school and are possibly being excluded from the educational system, indicating the need for greater inclusion and increasing the ability of schools to cater for special needs.
OF PRS HOUSEHOLDS HAVE AT LEAST ONE MEMBER WITH A CHRONIC ILLNESS
HAVE AT LEAST ONE MEMBER WHO HAD AN ACUTE ILLNESS IN THE PAST SIX MONTHS
83%75%
onein ten
PRS HOUSEHOLDS HAVE AT LEAST ONE PERSON WITH A DISABILITY
CHAPTER TWELVE // POPULATION HEALTH AND ACCESS TO SERVICES FOR PALESTINE REFUGEES FROM SYRIA LIVING IN LEBANON190
EMPLOYED REFUGEES OVER 15 YEARS OLD HAVE LOWER RATES OF CHRONIC ILLNESSES AND FUNCTIONAL DISABILITY THAN NON-EMPLOYED REFUGEESimplying that individuals with chronic illness and disability have reduced opportunities for employment.
THE HIGHEST PREVALENCE OF ILLNESS IS IN THOSE WHO HAVE NEVER ATTENDED SCHOOLand the lowest prevalence is in those holding a Baccalaureate degree or higher. Education can impact health literacy, access to health care, and employment opportunities – all of which may protect from poor health outcomes.
SELF-REPORTED MENTAL HEALTH: THE MAJORITY (85.0 PER CENT) OF PRS RESPONDENTS REPORT POOR MENTAL HEALTHA higher proportion of PRS are reporting poor mental health as compared to PRL; this rise could be due to high stress levels, as evidenced by a high number reporting worrying about providing for their families, losing their source of income and fearing for the safety of their families.
THE SURVEY FOUND THAT ACCESS TO UNRWA HOSPITALIZATION SERVICES FOR PRS IS REMARKABLY HIGH ACROSS ALL REGIONS, WITH OVER
When compared to PRL, rates of access to hospitalization are only slightly lower for PRS, despite their often irregular legal status in the country, their restricted movement, and their limited access to resources.
OF THE PRS POPULATION DOES NOT HAVE HEALTH INSURANCE COVERAGE OTHER THAN UNRWA
OF RESPONDENTS COUNTRY-WIDE REPORTING ACCESS
99%
95%
CHAPTER TWELVE // POPULATION HEALTH AND ACCESS TO SERVICES FOR PALESTINE REFUGEES FROM SYRIA LIVING IN LEBANON 191 // KEY FINDINGS

Lebanon continues to shoulder the bulk of Palestine refugees from Syria (PRS), putting further pressure on an already strained health system. In 2015, health centres were available to support more than 42,000 Palestine refugees from Syria.
Medical consultations have increased from 1,082,427 in 2013 to 1,276,153 in 2014 and doctors’ daily workloads have increased. Data relating to health-centre use in Lebanon has indicated that not only do PRS use health services
more frequently than their Lebanese counterparts, but they specifically see medical doctors on a more frequent basis, increasing the daily doctors’ workload.
161 UNRWA 2015. Palestine Refugees from Syria vulnerability assessment report.162 United Nations High Commissioner for Refugees. (2015). Syrian refugee and affected host population health access survey in Lebanon. Retrieved from https://goo.gl/1Q6ddH.
outlined below (see Table 89). Thirty-three per cent of chronic disease cases have hypertension and 30 per cent have more than one concurrent chronic disease.
There is a significant gender difference in the reporting of hypertension (19.6 per cent in males versus 28.5 per cent in females). This percentage is in line with data from the 2015 Vulnerability Assessment of PRS161 and a 2015 report on health access of Syrian refugees.162 Women also reported higher prevalence of diabetes (12.1 per cent in males versus in 16.6 per cent females).
A household proxy respondent reported on health conditions of all household members. One third of the PRS population have a chronic condition, two thirds report having an acute illness in the last six months, and 8.1 per cent are disabled.
As expected, chronic conditions increase with age (see Figure 42) with highest prevalence in over 60-year-olds. Among those who have a chronic disease, the most commonly reported conditions are hypertension, chronic pulmonary diseases which include asthma, diabetes and other cardiovascular diseases, which are
The most common chronic disease in children (up to 10 years of age) is chronic pulmonary disease, whereas hypertension is the most common in adults and the elderly (see Table 90), similar to the PRL population. There is also a high level of reporting of ‘other chronic conditions,’ similarly to PRL, reflecting low health literacy rates in both of these sub-populations.
In comparison to data on PRL, there are similar rates of chronic disease.
health profile of palestine refugees from syria
CHRONIC ILLNESS
ACUTE ILLNESS
DISABILITY
FIGURE 42: PRS PREVALENCE OF CHRONIC, ACUTE ILLNESS, AND FUNCTIONAL DISABILITY BY AGE GROUP (PER CENT)
0-4 5-9 10-14 15-24 25-59 60+ Total
18.3 17 18.4 16.1
46.5
85.7
33.2
64.2 64.961.3 60.9
70.273.9
66.3
4.6 6.6 5.3 4.99.5
23.1
8.1
CHAPTER TWELVE // POPULATION HEALTH AND ACCESS TO SERVICES FOR PALESTINE REFUGEES FROM SYRIA LIVING IN LEBANON192

163 UNRWA 2015. Palestine Refugees from Syria vulnerability assessment report. 164 UNRWA 2015. Palestine Refugees from Syria vulnerability assessment report.
Any chronic disease
Hypertension
Chronic pulmonary disease
Diabetes
Other cardiovascular disease
Neurological
Psychological
Other chronic conditions+
33.2 (32.0 – 34.4)
8.1
6.4
4.8
4.8
2.5
1.2
21.4
24.4 (22.0 – 27.0)
19.3 (17.3 – 21.5)
14.5 (12.8 – 16.5)
14.5 (12.6 – 16.7)
7.4 (6.2 – 8.6)
3.6 (2.6 – 4.8)
58.1
Population prevalence,per cent (n=5,791)
Percentage of those with chronic disease, per cent(95 per cent CI) (n=1,938)
TABLE 89: PREVALENCE OF REPORTED CHRONIC DISEASE IN PRS
+Other chronic illness includes: cancer, hyperlipidemia, chronic renal failure, other endocrinological disease, and other chronic conditions NB: Respondents could report multiple chronic diseases.
Total chronic disease
Hypertension
Chronic pulmonary disease
Diabetes
Other cardiovascular disease
Neurological
Psychological
Other chronic diseases
17.4***
0.1***
7.6***
0.1***
1.0***
0.9*
0.6
8.1
40.5***
9.2***
5.1***
5.2***
5.5***
3.4*
1.6
25.0
85.7***
54.2***
8.1***
34.3***
26.0***
6.4*
1.7
52.8
0-18 y 19-59 y 60+ yTABLE 90: PREVALENCE OF REPORTED CHRONIC ILLNESS BY AGE IN PRS (PER CENT)
+Other chronic illness includes: cancer, hyperlipidemia, chronic renal failure, other endocrinological disease, and other chronic conditions
This high rate in these age brackets could be due to poor access to water, sanitation and hygiene (WASH); one third of PRS reported insufficient access to water in the 2015 Vulnerability Assessment of PRS.163
Prevalence of acute illness, such as the flu or colds, gastrointestinal infections, respiratory infections, urinary infections etc., are higher in the youngest and oldest age groups, as expected (see Figure 42).
The most common types of functional disability reported are those affecting the lower body and visual impairment (see Table 91). Both of these are expected to increase with an ageing population. These are slightly lower than the prevalence of disability in PRL, but reflect 1 in 10 households having at least one person with a disability; these numbers are identical to those reported in the 2015 Vulnerability Assessment of PRS.164
There is a three percentage point higher reporting of acute illness by PRS when compared to PRL. Overall, there is no significant gender difference in reporting of acute illnesses.
Any functional disability
Physical – affecting lower body
Physical – affecting upper body
Visual impairment
Hearing impairment
Speech difficulty
Learning disability
Intellectual disability
8.1 (7.2 – 9.0)
3.4
1.3
2.2
0.8
0.7
0.3
0.6
42.2 (37.6 – 46.9)
16.4 (12.9 – 20.7)
27.6 (22.3 – 33.7)
9.3 (7.0 – 12.3)
8.6 (6.8 – 10.7)
3.6 (2.0 – 6.3)
7.2 (5.5 – 9.7)
Population prevalence,per cent (n=5,791)
Percentage of those with functional disability, per cent
(95 per cent CI) (n=1.938)
TABLE 91: PREVALENCE OF REPORTED CHRONIC ILLNESS IN PRS
CHAPTER TWELVE // POPULATION HEALTH AND ACCESS TO SERVICES FOR PALESTINE REFUGEES FROM SYRIA LIVING IN LEBANON 193 // HEALTH PROFILE OF PALESTINE REFUGEES FROM SYRIA
Denotes significance at the 0.1% level,Denotes significance at the 1% level andDenotes significance at the 5% level using Pearson’s chi-squared test.
******
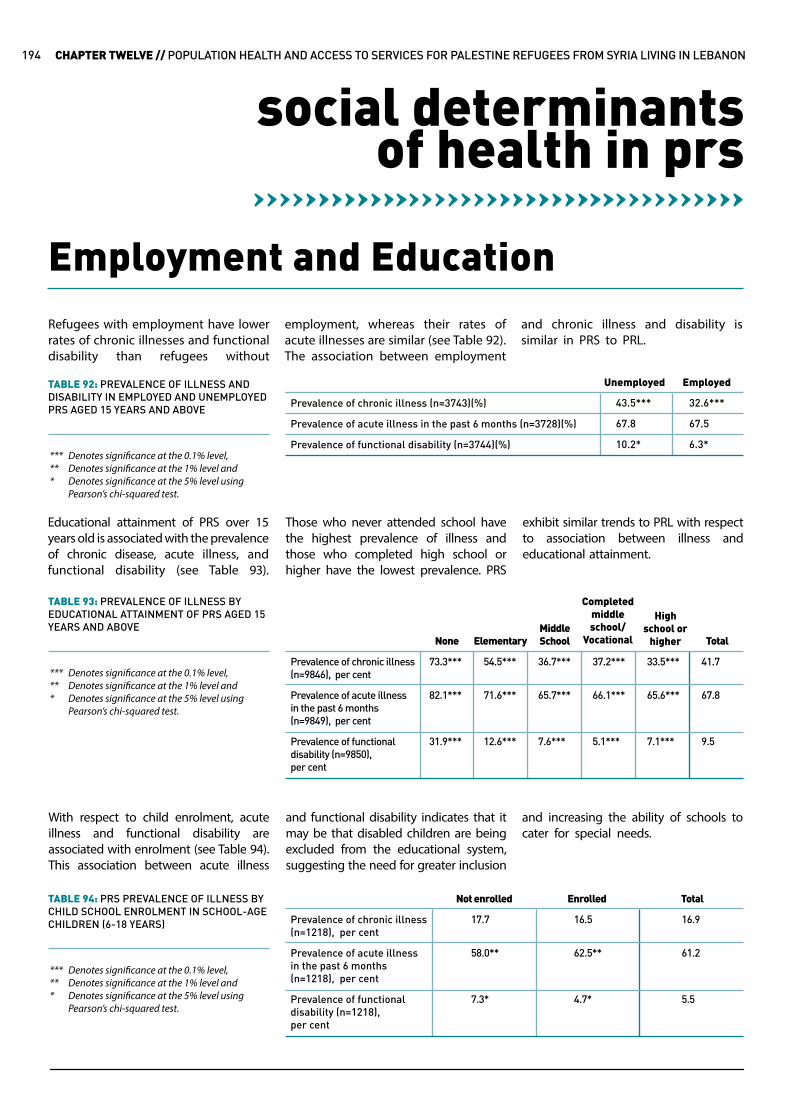
social determinantsof health in prs
Refugees with employment have lower rates of chronic illnesses and functional disability than refugees without
employment, whereas their rates of acute illnesses are similar (see Table 92). The association between employment
and chronic illness and disability is similar in PRS to PRL.
Employment and Education
43.5***
67.8
10.2*
32.6***
67.5
6.3*
Unemployed Employed
Prevalence of chronic illness (n=3743)(%)
Prevalence of acute illness in the past 6 months (n=3728)(%)
Prevalence of functional disability (n=3744)(%)
TABLE 92: PREVALENCE OF ILLNESS AND DISABILITY IN EMPLOYED AND UNEMPLOYED PRS AGED 15 YEARS AND ABOVE
Prevalence of chronic illness (n=9846), per cent
Prevalence of acute illnessin the past 6 months(n=9849), per cent
Prevalence of functionaldisability (n=9850),per cent
73.3***
82.1***
31.9***
36.7***
65.7***
7.6***
33.5***
65.6***
7.1***
54.5***
71.6***
12.6***
37.2***
66.1***
5.1***
41.7
67.8
9.5
NoneMiddle SchoolElementary Total
Completed middle school/
Vocational
High school or
higher
TABLE 93: PREVALENCE OF ILLNESS BY EDUCATIONAL ATTAINMENT OF PRS AGED 15 YEARS AND ABOVE
TABLE 94: PRS PREVALENCE OF ILLNESS BY CHILD SCHOOL ENROLMENT IN SCHOOL-AGE CHILDREN (6-18 YEARS) Prevalence of chronic illness
(n=1218), per cent
Prevalence of acute illnessin the past 6 months(n=1218), per cent
Prevalence of functionaldisability (n=1218),per cent
16.9
61.2
5.5
16.5
62.5**
4.7*
17.7
58.0**
7.3*
TotalNot enrolled Enrolled
Those who never attended school have the highest prevalence of illness and those who completed high school or higher have the lowest prevalence. PRS
Educational attainment of PRS over 15 years old is associated with the prevalence of chronic disease, acute illness, and functional disability (see Table 93).
exhibit similar trends to PRL with respect to association between illness and educational attainment.
With respect to child enrolment, acute illness and functional disability are associated with enrolment (see Table 94). This association between acute illness
and functional disability indicates that it may be that disabled children are being excluded from the educational system, suggesting the need for greater inclusion
and increasing the ability of schools to cater for special needs.
CHAPTER TWELVE // POPULATION HEALTH AND ACCESS TO SERVICES FOR PALESTINE REFUGEES FROM SYRIA LIVING IN LEBANON194
Denotes significance at the 0.1% level,Denotes significance at the 1% level andDenotes significance at the 5% level using Pearson’s chi-squared test.
******
Denotes significance at the 0.1% level,Denotes significance at the 1% level andDenotes significance at the 5% level using Pearson’s chi-squared test.
******
Denotes significance at the 0.1% level,Denotes significance at the 1% level andDenotes significance at the 5% level using Pearson’s chi-squared test.
******
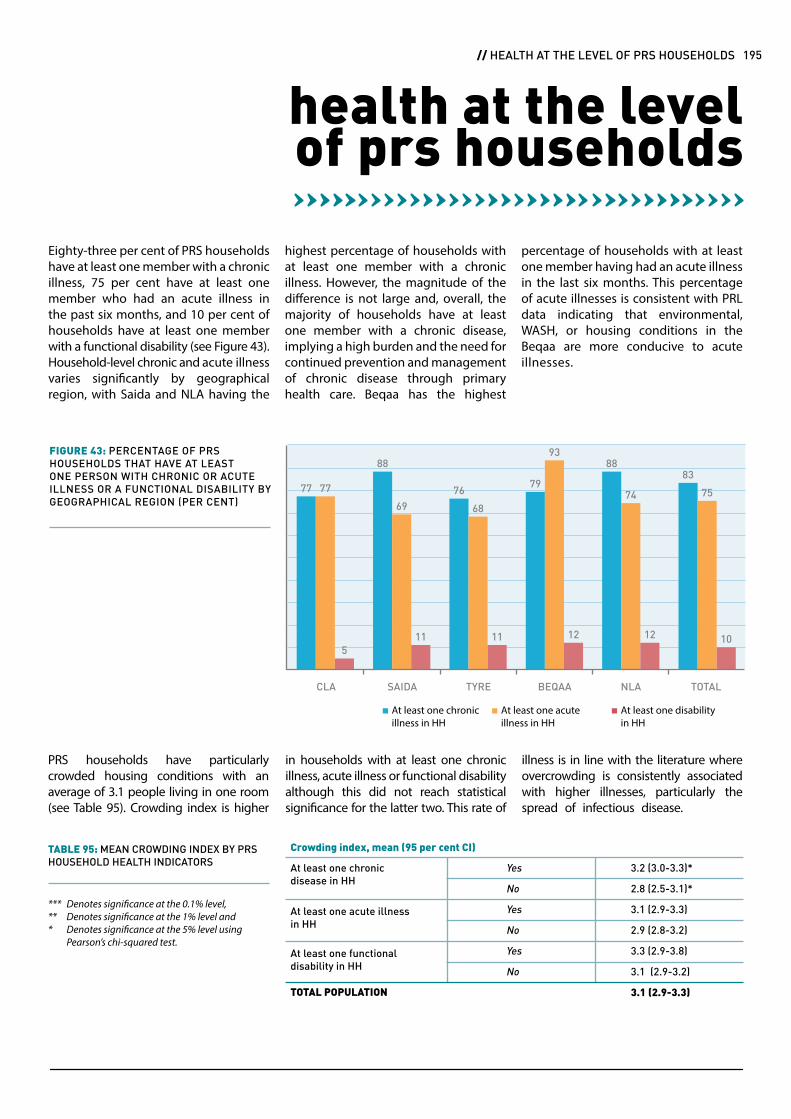
health at the levelof prs households
Eighty-three per cent of PRS households have at least one member with a chronic illness, 75 per cent have at least one member who had an acute illness in the past six months, and 10 per cent of households have at least one member with a functional disability (see Figure 43). Household-level chronic and acute illness varies significantly by geographical region, with Saida and NLA having the
highest percentage of households with at least one member with a chronic illness. However, the magnitude of the difference is not large and, overall, the majority of households have at least one member with a chronic disease, implying a high burden and the need for continued prevention and management of chronic disease through primary health care. Beqaa has the highest
percentage of households with at least one member having had an acute illness in the last six months. This percentage of acute illnesses is consistent with PRL data indicating that environmental, WASH, or housing conditions in the Beqaa are more conducive to acute illnesses.
At least one chronicdisease in HH
At least one acute illnessin HH
At least one functionaldisability in HH
TOTAL POPULATION
Yes
No
Yes
No
Yes
No
3.2 (3.0-3.3)*
2.8 (2.5-3.1)*
3.1 (2.9-3.3)
2.9 (2.8-3.2)
3.3 (2.9-3.8)
3.1 (2.9-3.2)
3.1 (2.9-3.3)
TABLE 95: MEAN CROWDING INDEX BY PRS HOUSEHOLD HEALTH INDICATORS
Crowding index, mean (95 per cent CI)
PRS households have particularly crowded housing conditions with an average of 3.1 people living in one room (see Table 95). Crowding index is higher
in households with at least one chronic illness, acute illness or functional disability although this did not reach statistical significance for the latter two. This rate of
illness is in line with the literature where overcrowding is consistently associated with higher illnesses, particularly the spread of infectious disease.
FIGURE 43: PERCENTAGE OF PRS HOUSEHOLDS THAT HAVE AT LEAST ONE PERSON WITH CHRONIC OR ACUTE ILLNESS OR A FUNCTIONAL DISABILITY BY GEOGRAPHICAL REGION (PER CENT)
At least one chronic illness in HH
At least one acute illness in HH
At least one disabilityin HH
CLA SAIDA TYRE BEQAA NLA TOTAL
77 77
5
88
69
11
76
68
11
79
93
12
88
74
12
83
75
10
CHAPTER TWELVE // POPULATION HEALTH AND ACCESS TO SERVICES FOR PALESTINE REFUGEES FROM SYRIA LIVING IN LEBANON 195 // HEALTH AT THE LEVEL OF PRS HOUSEHOLDS
Denotes significance at the 0.1% level,Denotes significance at the 1% level andDenotes significance at the 5% level using Pearson’s chi-squared test.
******
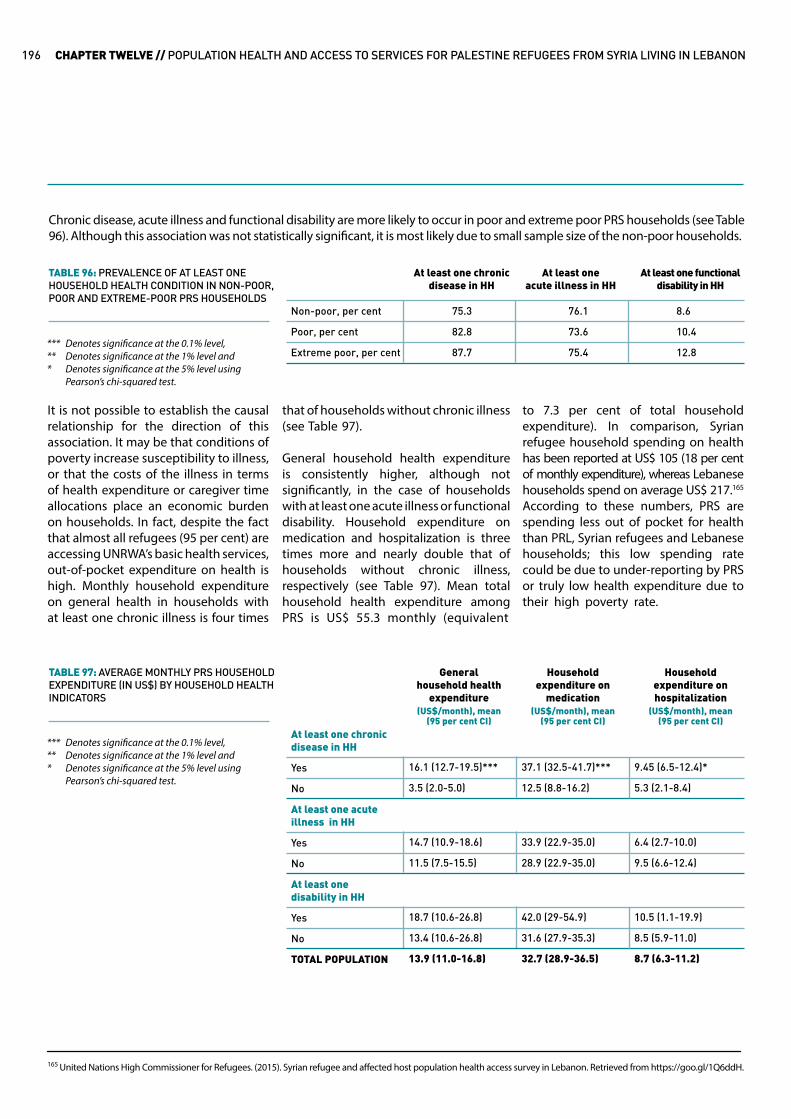
165 United Nations High Commissioner for Refugees. (2015). Syrian refugee and affected host population health access survey in Lebanon. Retrieved from https://goo.gl/1Q6ddH.
At least one chronic disease in HH
At least oneacute illness in HH
At least one functional disability in HH
Non-poor, per cent
Poor, per cent
Extreme poor, per cent
75.3
82.8
87.7
76.1
73.6
75.4
8.6
10.4
12.8
TABLE 96: PREVALENCE OF AT LEAST ONE HOUSEHOLD HEALTH CONDITION IN NON-POOR, POOR AND EXTREME-POOR PRS HOUSEHOLDS
It is not possible to establish the causal relationship for the direction of this association. It may be that conditions of poverty increase susceptibility to illness, or that the costs of the illness in terms of health expenditure or caregiver time allocations place an economic burden on households. In fact, despite the fact that almost all refugees (95 per cent) are accessing UNRWA’s basic health services, out-of-pocket expenditure on health is high. Monthly household expenditure on general health in households with at least one chronic illness is four times
that of households without chronic illness (see Table 97).
General household health expenditure is consistently higher, although not significantly, in the case of households with at least one acute illness or functional disability. Household expenditure on medication and hospitalization is three times more and nearly double that of households without chronic illness, respectively (see Table 97). Mean total household health expenditure among PRS is US$ 55.3 monthly (equivalent
to 7.3 per cent of total household expenditure). In comparison, Syrian refugee household spending on health has been reported at US$ 105 (18 per cent of monthly expenditure), whereas Lebanese households spend on average US$ 217.165 According to these numbers, PRS are spending less out of pocket for health than PRL, Syrian refugees and Lebanese households; this low spending rate could be due to under-reporting by PRS or truly low health expenditure due to their high poverty rate.
Generalhousehold health
expenditure(US$/month), mean
(95 per cent CI)
Household expenditure on
medication(US$/month), mean
(95 per cent CI)
Household expenditure on hospitalization
(US$/month), mean(95 per cent CI)
At least one chronic disease in HH
Yes
No
At least one acuteillness in HH
Yes
No
At least onedisability in HH
Yes
No
TOTAL POPULATION
16.1 (12.7-19.5)***
3.5 (2.0-5.0)
14.7 (10.9-18.6)
11.5 (7.5-15.5)
18.7 (10.6-26.8)
13.4 (10.6-26.8)
13.9 (11.0-16.8)
37.1 (32.5-41.7)***
12.5 (8.8-16.2)
33.9 (22.9-35.0)
28.9 (22.9-35.0)
42.0 (29-54.9)
31.6 (27.9-35.3)
32.7 (28.9-36.5)
9.45 (6.5-12.4)*
5.3 (2.1-8.4)
6.4 (2.7-10.0)
9.5 (6.6-12.4)
10.5 (1.1-19.9)
8.5 (5.9-11.0)
8.7 (6.3-11.2)
TABLE 97: AVERAGE MONTHLY PRS HOUSEHOLD EXPENDITURE (IN US$) BY HOUSEHOLD HEALTH INDICATORS
Chronic disease, acute illness and functional disability are more likely to occur in poor and extreme poor PRS households (see Table 96). Although this association was not statistically significant, it is most likely due to small sample size of the non-poor households.
CHAPTER TWELVE // POPULATION HEALTH AND ACCESS TO SERVICES FOR PALESTINE REFUGEES FROM SYRIA LIVING IN LEBANON196
Denotes significance at the 0.1% level,Denotes significance at the 1% level andDenotes significance at the 5% level using Pearson’s chi-squared test.
******
Denotes significance at the 0.1% level,Denotes significance at the 1% level andDenotes significance at the 5% level using Pearson’s chi-squared test.
******
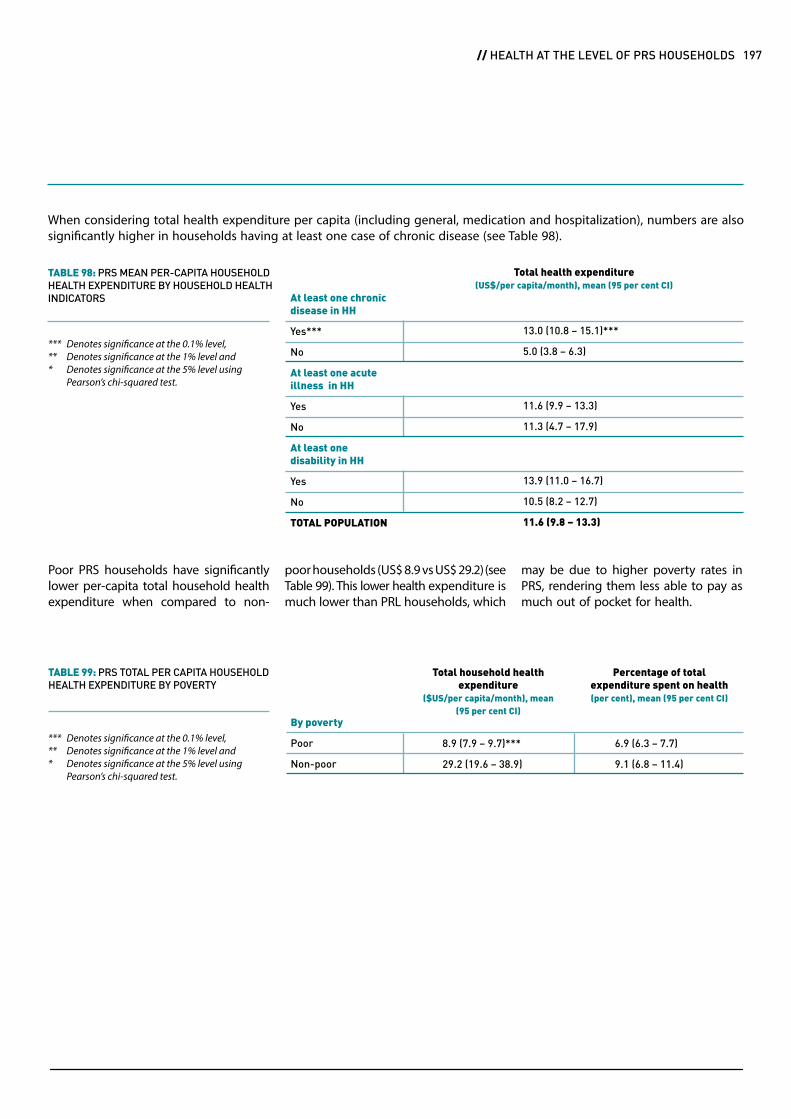
When considering total health expenditure per capita (including general, medication and hospitalization), numbers are also significantly higher in households having at least one case of chronic disease (see Table 98).
Total health expenditure(US$/per capita/month), mean (95 per cent CI)
At least one chronic disease in HH
Yes***
No
At least one acuteillness in HH
Yes
No
At least onedisability in HH
Yes
No
TOTAL POPULATION
13.0 (10.8 – 15.1)***
5.0 (3.8 – 6.3)
11.6 (9.9 – 13.3)
11.3 (4.7 – 17.9)
13.9 (11.0 – 16.7)
10.5 (8.2 – 12.7)
11.6 (9.8 – 13.3)
TABLE 98: PRS MEAN PER-CAPITA HOUSEHOLD HEALTH EXPENDITURE BY HOUSEHOLD HEALTH INDICATORS
Poor PRS households have significantly lower per-capita total household health expenditure when compared to non-
poor households (US$ 8.9 vs US$ 29.2) (see Table 99). This lower health expenditure is much lower than PRL households, which
may be due to higher poverty rates in PRS, rendering them less able to pay as much out of pocket for health.
Total household healthexpenditure
($US/per capita/month), mean(95 per cent CI)
Percentage of totalexpenditure spent on health(per cent), mean (95 per cent CI)
By poverty
Poor
Non-poor
8.9 (7.9 – 9.7)***
29.2 (19.6 – 38.9)
6.9 (6.3 – 7.7)
9.1 (6.8 – 11.4)
TABLE 99: PRS TOTAL PER CAPITA HOUSEHOLD HEALTH EXPENDITURE BY POVERTY
CHAPTER TWELVE // POPULATION HEALTH AND ACCESS TO SERVICES FOR PALESTINE REFUGEES FROM SYRIA LIVING IN LEBANON 197 // HEALTH AT THE LEVEL OF PRS HOUSEHOLDS
Denotes significance at the 0.1% level,Denotes significance at the 1% level andDenotes significance at the 5% level using Pearson’s chi-squared test.
******
Denotes significance at the 0.1% level,Denotes significance at the 1% level andDenotes significance at the 5% level using Pearson’s chi-squared test.
******

score of less than 52 on the MHI-5 scale) (see Table 100), with no significant gender difference in reports of mental health (see Table 100). There are also surprisingly no statistically significant differences in reports of self-reported mental health by respondents living in poverty as compared to non-poor households. Respondents
As part of the survey, the five-item Mental Health Inventory (MHI-5) and self-rated physical health question were administered to household proxy respondents.
The majority (85.0 per cent) of PRS respondents report poor mental health (a
with poor mental health are, however, more likely to report feeling worried about not being able to provide for their families, losing their source of income and fearing for the safety of their families (all of these associations were strongly statistically significant at the 1 per cent level).
respondentself-reported health
By gender
By poverty
Male82.6
Non-poor78.3
Female82.9
Poor83.6
TABLE 100: SELF-REPORTED MENTAL HEALTH OF PRS HOUSEHOLD PROXY RESPONDENT, BY GENDER AND POVERTY
Mental health inventory (MHI-5) score of respondent <52/100 (poor mental health), per cent
There were no statistically significant differences in gender, and there were not any differences between poor and non-poor households regarding self-rated health (see Table 101). When compared to PRL, PRS are less likely
to report their health as very good or good by approximately ten percentage points. Also regarding MHI-5, a higher proportion of PRS are reporting poor mental health compared to PRL; this higher rate of reporting could be due
to high stress levels, evident by the high number reporting worrying about providing for their families, losing their source of income and fearing for the safety of their families.
By gender
Very good/Good
Fair
Not good/Very bad
By poverty
Very good/Good
Fair
Not good/Very bad
Male
27.7
41.1
31.2
Non-poor
32.2
36.6
37.0
Female
27.3
34.2
38.5
Poor
26.4
37.8
30.0
TOTAL
27.4
36.2
36.4
TOTAL
27.4
36.2
36.4
TABLE 101: SELF-RATED HEALTH OF PRS HOUSEHOLD PROXY RESPONDENT, BY GENDER AND POVERTY
Respondent’s self-rated health, percent
CHAPTER TWELVE // POPULATION HEALTH AND ACCESS TO SERVICES FOR PALESTINE REFUGEES FROM SYRIA LIVING IN LEBANON198

highest amongst the youngest and the oldest age groups, with one third of over 60-year-olds having been admitted to
Around 20.9 per cent of PRS were hospitalised in the last 12 months (see Table 102). Hospitalization rates are
the hospital in the last year. There are no significant differences in hospitalization rates by gender.
hospitalization in prs
Hospitalised in the last 12 months** (n= 5791), per cent
25.2*** 14.7*** 14.5*** 15.5*** 23.6*** 36.2*** 20.9
0-4 y 5-9 y 10-14 y 15-24 y 25-59 y 60+ y TOTALTABLE 102: HOSPITALIZATION RATES OF PRSIN THE LAST 12 MONTHS, BY AGE GROUP
Individuals with chronic illnesses are three times more likely to be hospitalised than individuals without a chronic illness
(see Figure 44). Individuals with an acute illness or functional disability are nearly twice more likely to be hospitalised
than those who do not have an illness or disability. These numbers are very similar to those of PRL.
FIGURE 44: PRS PERCENTAGE OF THOSE WITH AND WITHOUT CHRONIC ILLNESS, ACUTE ILLNESS, OR FUNCTIONAL DISABILITY WHO WERE HOSPITALISED IN THE LAST 12 MONTHS (PER CENT)
CHRONIC ILLNESS
ACUTE ILLNESS
DISABILITY
NoYes
36
13
26
11
36
20
CHAPTER TWELVE // POPULATION HEALTH AND ACCESS TO SERVICES FOR PALESTINE REFUGEES FROM SYRIA LIVING IN LEBANON 199 // HOSPITALIZATION IN PRS
Denotes significance at the 0.1% level,Denotes significance at the 1% level andDenotes significance at the 5% level using Pearson’s chi-squared test.
******

Lebanese National Social Security Fund. These numbers are much lower than those of PRL, although they also have low access to private and public health insurance. There are no differences in access to
Ninety-nine per cent of the PRS population does not have health insurance coverage other than UNRWA, with only 0.2 per cent having access to private health insurance and 0.4 per cent having access to the
health insurance by employment status, nor by poverty level due to the negligible number that does have access.
access to healthinsurance in prs
wide reporting access (see Table 103). It is reassuring to see that, when compared to PRL, rates of access are only slightly lower for PRS, despite PRS often irregular
The survey reveals that access to UNRWA hospitalization services for PRS to be remarkably high across all regions, with over 95 per cent of respondents country-
legal status in the country, their restricted movement, and their limited access to resources.
hospitalization accessfor the most vulnerable
AreaAcess to UNRWAhospitalization services
Yes
No
TOTAL
95.6
4.4
100
96.1
3.9
100
94.9
5.1
100
92.3
7.6
100
96.8
3.2
100
95.4
4.7
100
CLA Saida Tyre Beqaa NLA TOTALTABLE 103: PRS ACCESS TO UNRWA HOSPITALIZATION SERVICES BY GEOGRAPHICAL REGION
Acess to UNRWAhospitalization services
Age group
Yes
No
TOTAL
94.6
5.4
100
95.4
4.6
100
96.6
3.4
100
93.8
6.2
100
96.5
3.5
100
95.7
4.3
100
96.1
3.9
100
96.2
3.8
100
95.4
4.6
100
0-9 10-14 15-24 25-34 35-44 45-54 55-64 65+ TOTALTABLE 104: PRS ACCESS TO UNRWA HOSPITALIZATION SERVICES BY AGE GROUP
Access seems to be relatively evenly distributed across age groups, with access rates in the range of 93.0 per cent to 96.5 per cent.
CHAPTER TWELVE // POPULATION HEALTH AND ACCESS TO SERVICES FOR PALESTINE REFUGEES FROM SYRIA LIVING IN LEBANON200
Denotes significance at the 0.1% level,Denotes significance at the 1% level andDenotes significance at the 5% level using Pearson’s chi-squared test.
******
Denotes significance at the 0.1% level,Denotes significance at the 1% level andDenotes significance at the 5% level using Pearson’s chi-squared test.
******

Similarly, there are no significant differences in access to UNRWA hospitalization services across genders,
with access in the range of 95 per cent for men and 96 per cent for women. The inclusion among UNRWA hospitalization
services or a specific programme for maternal health and obstetrics may explain this slight difference in access.
GenderAcess to UNRWAhospitalization services
Yes
No
TOTAL
94.7
5.3
100
95.9
4.1
100
95.4
4.7
100
Male Female TOTALTABLE 105: PRS ACCESS TO UNRWA HOSPITALIZATION SERVICES BY GENDER
for camp residents, close to 97 per cent; whereas around 93.5 per cent of refugees living outside the camps
When comparing access for households residing outside and inside the camps, we find that access is slightly higher
The presence of a disability has no significant effect on access to hospitalization services as shown below (see Table 107).
report having access to UNRWA hospitalization services.
Camp
Disability
Acess to UNRWAhospitalization services
Acess to UNRWAhospitalization services
Yes
No
TOTAL
Yes
No
TOTAL
93.6**
6.4**
100
94.0**
6.0**
100
95.5**
4.5**
100
96.8**
3.2**
100
95.4
4.7
100
95.4
4.7
100
Outside
Yes
Inside
No
TOTAL
TOTAL
TABLE 106: PRS ACCESS TO UNRWA HOSPITALIZATION SERVICES BY INSIDE/OUTSIDE CAMP
TABLE 107: PRS ACCESS TO UNRWA HOSPITALIZATION SERVICES BY PRESENCE OF DISABILITY
through the ATM monthly transfer system. Thus, PRS respondents from households whose primary sources of income are the sale of assets, support from relatives, debt and financial assistance from UNRWA or from other organizations, have equally high access
In the survey, respondents were identified as income-vulnerable by looking at the composition of income from all sources, rather than just by looking at respondents on social or cash assistance programmes, since the majority of PRS receive financial support
to UNRWA hospitalization services as respondents with sources of income that are considered more regular. It was beyond the survey’s scope to ask respondents which types of services were accessed.
CHAPTER TWELVE // POPULATION HEALTH AND ACCESS TO SERVICES FOR PALESTINE REFUGEES FROM SYRIA LIVING IN LEBANON 201 // HOSPITALIZATION ACCESS FOR THE MOST VULNERABLE
Denotes significance at the 0.1% level,Denotes significance at the 1% level andDenotes significance at the 5% level using Pearson’s chi-squared test.
******
Denotes significance at the 0.1% level,Denotes significance at the 1% level andDenotes significance at the 5% level using Pearson’s chi-squared test.
******
Denotes significance at the 0.1% level,Denotes significance at the 1% level andDenotes significance at the 5% level using Pearson’s chi-squared test.
******

Fewer than 5 per cent of respondents indicated that they do not have access to UNRWA hospitalization services. The most common reason cited for the lack of access to UNRWA hospitalization services is that the respondent is not
registered with UNRWA.166 However, the fraction of respondents citing lack of registration varies across regions and ranges from just under a quarter of respondents with no access to UNRWA hospitalization services in the Beqaa, to
close to 57 per cent of respondents with no access in Tyre. Cost of transportation and distance was cited as the main barrier to access by 43.7 per cent of PRS in the Beqaa who did not have access to hospitalization services.
Who does not have access?
166 Although some limited categories of non-registered refugees can still benefit from UNRWA hospitalization services, the data indicate that the lack of registration with UNRWA is the primary reason for a lack of access to UNRWA hospitalization services.167 The sum of a household’s expenditure on a certain bundle of goods and services (or categories), including imputed rent, that are deemed indicative of living standards. This aggregate consumption was used as a proxy to income due to the fact that the income data was seen to be unreliable and thus would lead to unreliable poverty rates.
Access to UNRWAhospitalization services
Yes
No
148.1
169.0
Average consumption aggregate(US$/month)
TABLE 109: PRS AVERAGE CONSUMPTION AGGREGATE BY ACCESS TO UNRWA HOSPITALIZATION SERVICES US$/MONTH)
Lack of registration
Cost of transportation/ distance
Inability to pay
Area
28.7
0.0***
0.0
46.8
0.0***
11.7
56.6
0.0***
0.0
23.5
43.7***
21.9
54.2
0.0***
0.0
CLA Saida Tyre Beqaa NLA
TABLE 108: PRS REASONS FOR LACK OF ACCESS TO UNRWA HOSPITALIZATION SERVICE
13.5 per cent) higher than the average consumption aggregate of respondents with access to hospitalization This average consumption aggregate would
The average consumption aggregate167 of respondents who indicate no access to UNRWA hospitalization services is close to US$ 20 per month (or close to
suggest that, overall, the difference in access does not systematically reflect a difference in economic well-being.
CHAPTER TWELVE // POPULATION HEALTH AND ACCESS TO SERVICES FOR PALESTINE REFUGEES FROM SYRIA LIVING IN LEBANON202
Denotes significance at the 0.1% level,Denotes significance at the 1% level andDenotes significance at the 5% level using Pearson’s chi-squared test.
******

In conclusion, while almost all PRS depend on UNRWA for their health coverage, the majority of PRS have at least one member with a chronic or acute disease, affirming the need for access to primary health care services. Acute illness is highest in Beqaa PRS households, consistent with PRL data, indicating that environmental, water, sanitation, and hygiene (WASH), or housing conditions in the Beqaa increase susceptibility of PRS to acute illness. In addition, households with members experiencing chronic illness have higher health expenditure than households without – spending three times more on medication and nearly double on hospitalization. Overcrowded homes, low education levels and poverty are all major factors affecting the high rate of illness among PRS.
conclusion
CHAPTER TWELVE // POPULATION HEALTH AND ACCESS TO SERVICES FOR PALESTINE REFUGEES FROM SYRIA LIVING IN LEBANON 203 // CONCLUSION
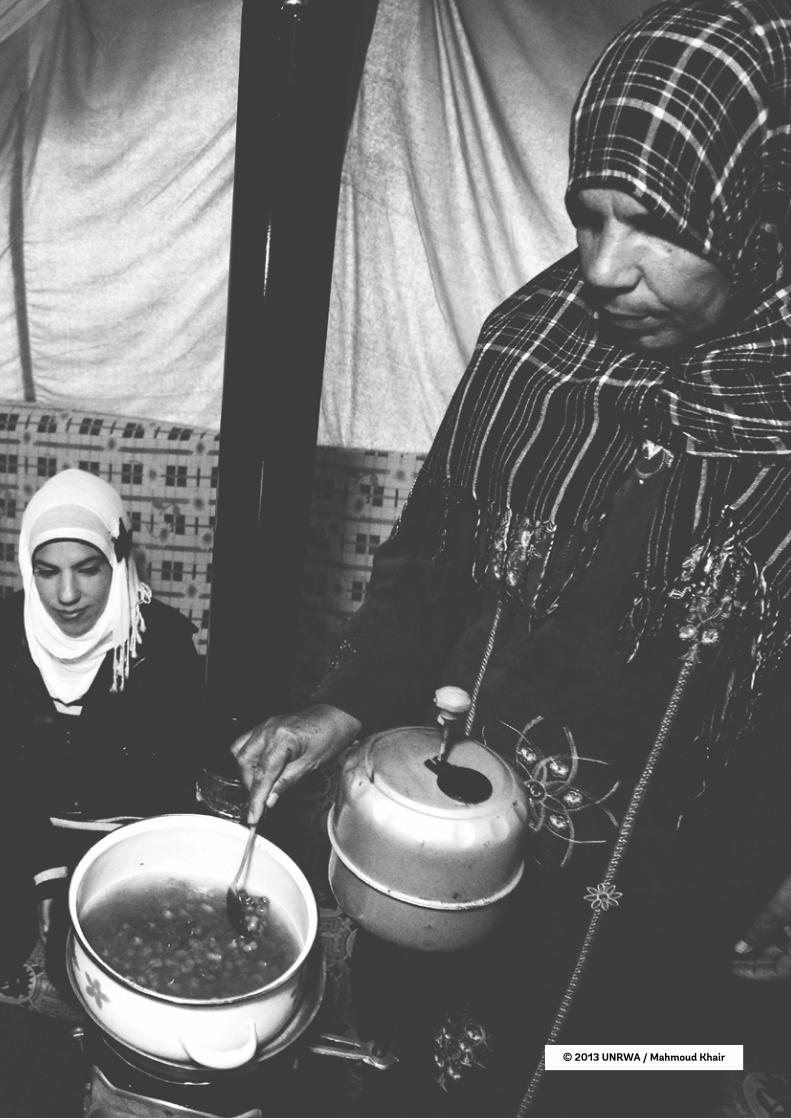
© 2013 UNRWA / Mahmoud Khair

Food Security of Palestine Refugees from Syria Living in LebanonHala Ghattas, Nadine Sahyoun, Ali Abazeed
CHAPTERTHIRTEEN
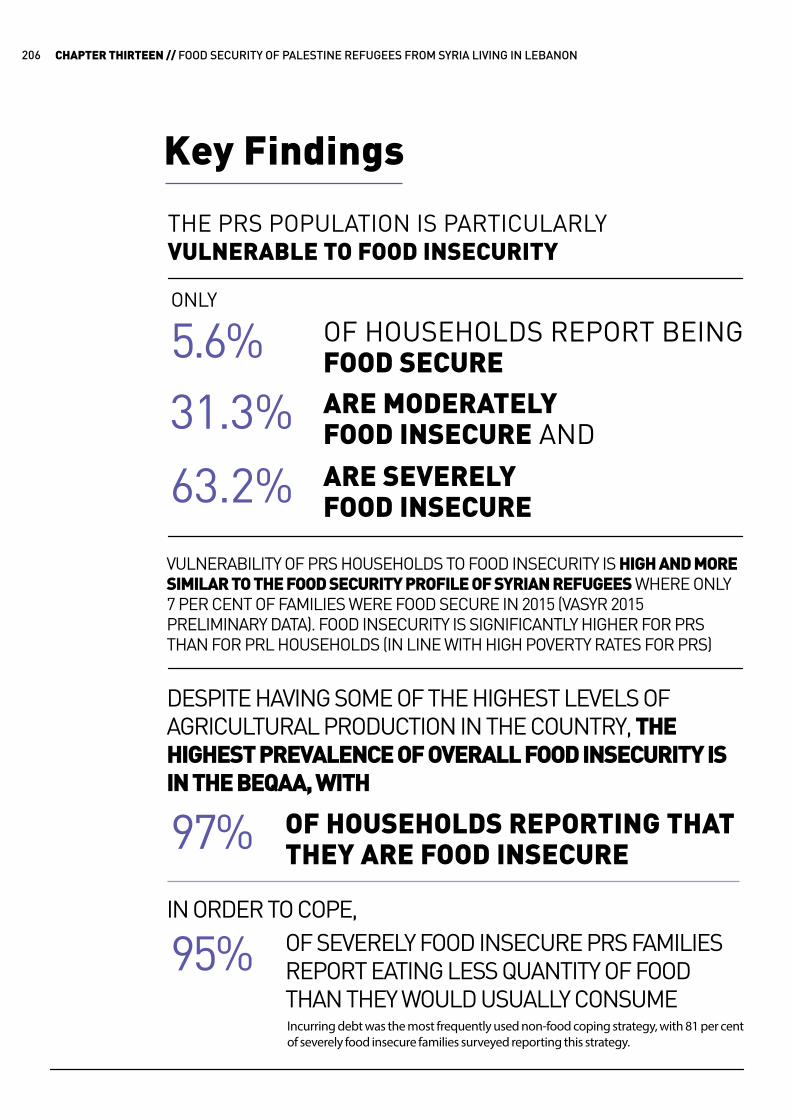
Key Findings
THE PRS POPULATION IS PARTICULARLY VULNERABLE TO FOOD INSECURITY
Incurring debt was the most frequently used non-food coping strategy, with 81 per cent of severely food insecure families surveyed reporting this strategy.
VULNERABILITY OF PRS HOUSEHOLDS TO FOOD INSECURITY IS HIGH AND MORE SIMILAR TO THE FOOD SECURITY PROFILE OF SYRIAN REFUGEES WHERE ONLY7 PER CENT OF FAMILIES WERE FOOD SECURE IN 2015 (VASYR 2015 PRELIMINARY DATA). FOOD INSECURITY IS SIGNIFICANTLY HIGHER FOR PRS THAN FOR PRL HOUSEHOLDS (IN LINE WITH HIGH POVERTY RATES FOR PRS)
DESPITE HAVING SOME OF THE HIGHEST LEVELS OF AGRICULTURAL PRODUCTION IN THE COUNTRY, THE HIGHEST PREVALENCE OF OVERALL FOOD INSECURITY IS IN THE BEQAA, WITH
IN ORDER TO COPE,
OF HOUSEHOLDS REPORT BEING FOOD SECURE
OF HOUSEHOLDS REPORTING THAT THEY ARE FOOD INSECURE
OF SEVERELY FOOD INSECURE PRS FAMILIES REPORT EATING LESS QUANTITY OF FOOD THAN THEY WOULD USUALLY CONSUME
ARE MODERATELYFOOD INSECURE ANDARE SEVERELYFOOD INSECURE
31.3%
63.2%
ONLY
5.6%
97%
95%
CHAPTER THIRTEEN // FOOD SECURITY OF PALESTINE REFUGEES FROM SYRIA LIVING IN LEBANON206

HOUSEHOLD SIZE, NUMBER OF CHILDREN PER HOUSEHOLD AND CROWDING INDEX ARE ALL HIGHER IN PRS FAMILIES THAN IN PRL FAMILIES, AND INCREASE WITH FOOD INSECURITY IN BOTH POPULATIONS
DESPITE HIGHER LEVELS OF EDUCATIONAL ATTAINMENT IN PRS HEAD OF HOUSEHOLDS, FOOD INSECURITY REMAINS HIGH IMPLYING THAT FOOD INSECURITY IS LESS A RESULT OF INTERGENERATIONAL POVERTY THAN OF THEIR RECENT DISPLACEMENT
THERE IS A STRONG ASSOCIATION BETWEEN UNEMPLOYMENT AND FOOD INSECURITY IN PRS,WHICH IS SIMILAR TO THAT OF PRL. INCREASING EMPLOYMENT OPPORTUNITIES FOR ALL PALESTINE REFUGEES IN LEBANON IS LIKELY TO TRANSLATE INTO IMPROVED FOOD ACCESS AND FOOD SECURITY
SIMILAR TO PRL HOUSEHOLDS, INDICATORS OF PHYSICAL HEALTH ARE SIGNIFICANTLY ASSOCIATED WITH FOOD SECURITYSTRONG ASSOCIATIONS BETWEEN POOR HEALTH AND FOOD INSECURITY IN PRS HOUSEHOLDS INDICATE THAT A COMPREHENSIVE APPROACH IS NEEDED TO HELP PREVENT ACUTE AND CHRONIC ILLNESSES IN THIS POPULATION
CHAPTER THIRTEEN // FOOD SECURITY OF PALESTINE REFUGEES FROM SYRIA LIVING IN LEBANON 207 // KEY FINDINGS
These numbers are significantly higher than 2015 data for PRL households, but are aligned with the high poverty rates for PRS. These numbers are also consistent with data from the UNRWA Vulnerability Assessment of PRS, which reports that 91 per cent of PRS families in Lebanon have experienced lack of food, or money needed to buy it, during the 30-day period preceding the assessment.168
Household food insecurity experience was assessed using the Arab Family Food Security Scale (AFFSS) – an experiential measure of household food insecurity. The AFFSS is explained in the methodology section and also elaborated in Appendix 1. Of the respondents, only 5.6 per cent report being food secure, 31.3 per cent were moderately food insecure, and 63.2 per cent report being severely food insecure.
This alarming response implies that the vulnerability of PRS households to food insecurity is high and is more similar to the food security profile of Syrian refugees, where only 7 per cent of families were food secure in 2015.169
prevalence of household food insecurity
168 S, A. and H. J, Palestine Refugee from Syria vulnerability assessment report. 2015, UNRWA, Lebanon.169 S, A. and H. J, Palestine Refugee from Syria vulnerability assessment report. 2015, UNRWA, Lebanon.
CHAPTER THIRTEEN // FOOD SECURITY OF PALESTINE REFUGEES FROM SYRIA LIVING IN LEBANON208
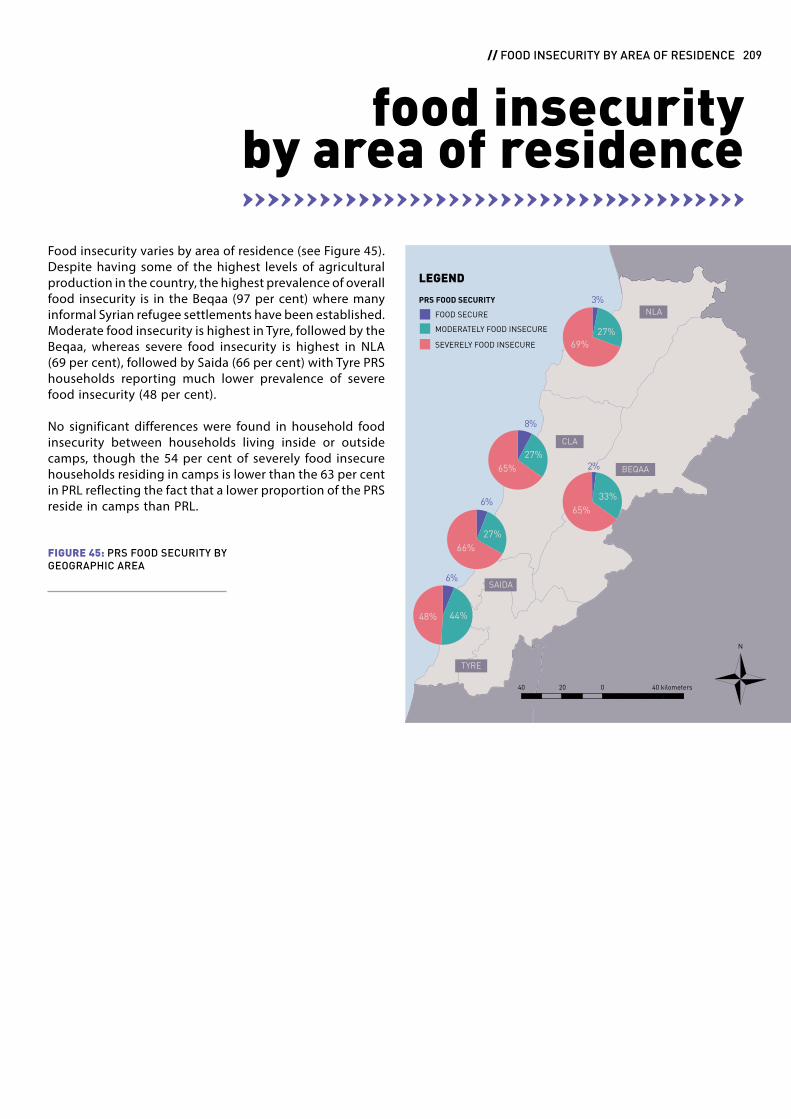
Food insecurity varies by area of residence (see Figure 45). Despite having some of the highest levels of agricultural production in the country, the highest prevalence of overall food insecurity is in the Beqaa (97 per cent) where many informal Syrian refugee settlements have been established. Moderate food insecurity is highest in Tyre, followed by the Beqaa, whereas severe food insecurity is highest in NLA (69 per cent), followed by Saida (66 per cent) with Tyre PRS households reporting much lower prevalence of severe food insecurity (48 per cent).
No significant differences were found in household food insecurity between households living inside or outside camps, though the 54 per cent of severely food insecure households residing in camps is lower than the 63 per cent in PRL reflecting the fact that a lower proportion of the PRS reside in camps than PRL.
food insecurityby area of residence
FIGURE 45: PRS FOOD SECURITY BY GEOGRAPHIC AREA
CHAPTER THIRTEEN // FOOD SECURITY OF PALESTINE REFUGEES FROM SYRIA LIVING IN LEBANON 209 // FOOD INSECURITY BY AREA OF RESIDENCE
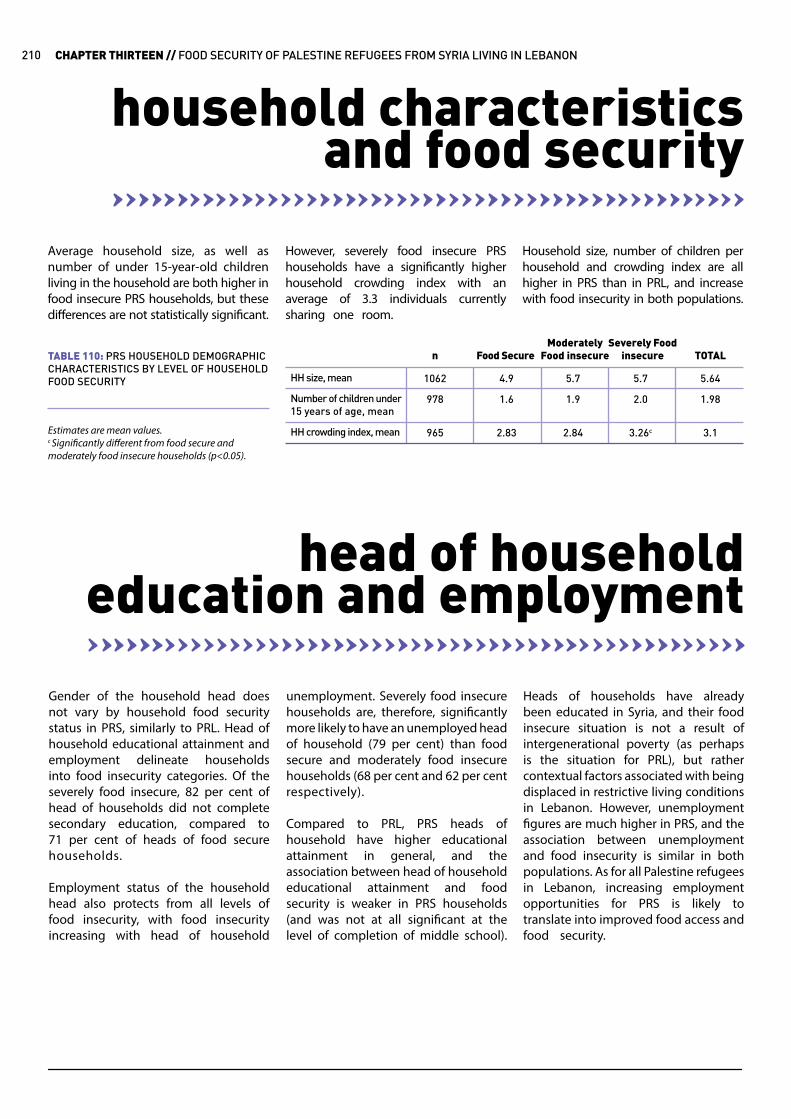
However, severely food insecure PRS households have a significantly higher household crowding index with an average of 3.3 individuals currently sharing one room.
Average household size, as well as number of under 15-year-old children living in the household are both higher infood insecure PRS households, but these differences are not statistically significant.
Household size, number of children per household and crowding index are all higher in PRS than in PRL, and increase with food insecurity in both populations.
household characteristics and food security
HH size, mean
Number of children under 15 years of age, mean
HH crowding index, mean
1062
978
965
4.9
1.6
2.83
5.7
1.9
2.84
5.7
2.0
3.26c
5.64
1.98
3.1
n Food SecureModerately
Food insecureSeverely Food
insecure TOTALTABLE 110: PRS HOUSEHOLD DEMOGRAPHIC CHARACTERISTICS BY LEVEL OF HOUSEHOLD FOOD SECURITY
Estimates are mean values.c Significantly different from food secure and moderately food insecure households (p<0.05).
unemployment. Severely food insecure households are, therefore, significantly more likely to have an unemployed head of household (79 per cent) than food secure and moderately food insecure households (68 per cent and 62 per cent respectively).
Compared to PRL, PRS heads of household have higher educational attainment in general, and the association between head of household educational attainment and food security is weaker in PRS households (and was not at all significant at the level of completion of middle school).
Gender of the household head does not vary by household food security status in PRS, similarly to PRL. Head of household educational attainment and employment delineate households into food insecurity categories. Of the severely food insecure, 82 per cent of head of households did not complete secondary education, compared to 71 per cent of heads of food secure households.
Employment status of the household head also protects from all levels of food insecurity, with food insecurity increasing with head of household
Heads of households have already been educated in Syria, and their food insecure situation is not a result of intergenerational poverty (as perhaps is the situation for PRL), but rather contextual factors associated with being displaced in restrictive living conditions in Lebanon. However, unemployment figures are much higher in PRS, and the association between unemployment and food insecurity is similar in both populations. As for all Palestine refugees in Lebanon, increasing employment opportunities for PRS is likely to translate into improved food access and food security.
head of household education and employment
CHAPTER THIRTEEN // FOOD SECURITY OF PALESTINE REFUGEES FROM SYRIA LIVING IN LEBANON210
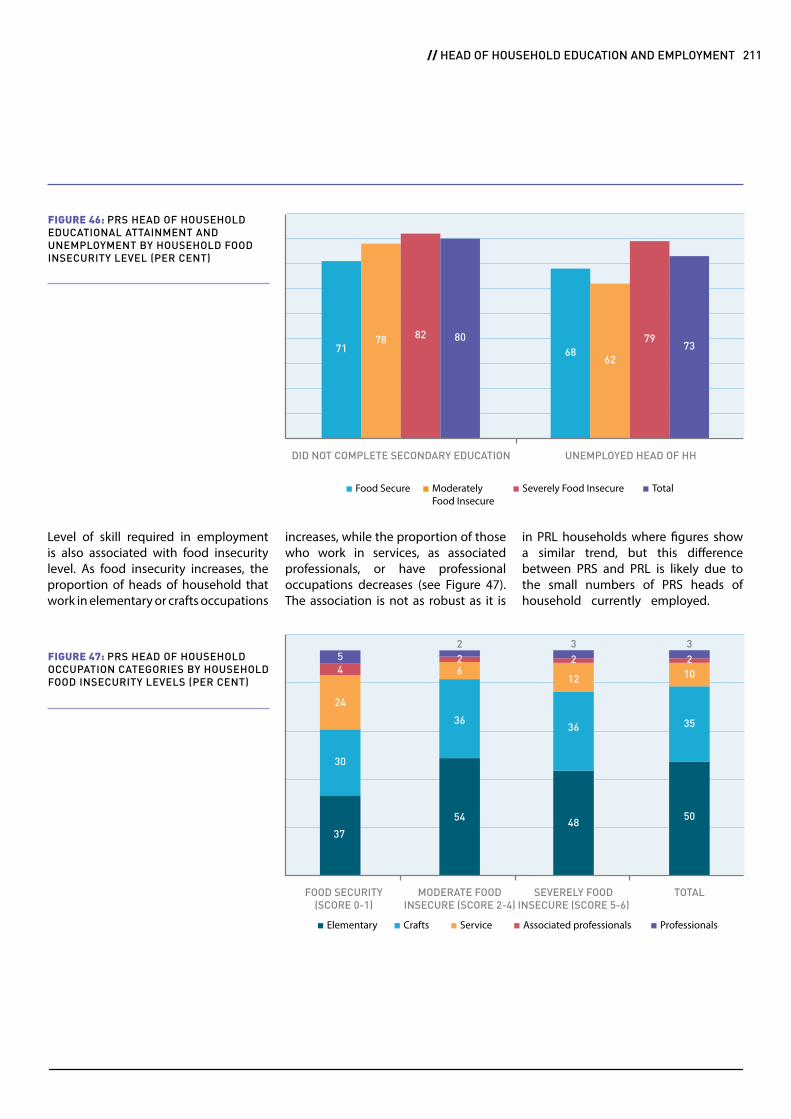
increases, while the proportion of those who work in services, as associated professionals, or have professional occupations decreases (see Figure 47). The association is not as robust as it is
Level of skill required in employment is also associated with food insecurity level. As food insecurity increases, the proportion of heads of household that work in elementary or crafts occupations
in PRL households where figures show a similar trend, but this difference between PRS and PRL is likely due to the small numbers of PRS heads of household currently employed.
Food Secure Severely Food InsecureModerately Food Insecure
Total
DID NOT COMPLETE SECONDARY EDUCATION UNEMPLOYED HEAD OF HH
FIGURE 46: PRS HEAD OF HOUSEHOLD EDUCATIONAL ATTAINMENT AND UNEMPLOYMENT BY HOUSEHOLD FOOD INSECURITY LEVEL (PER CENT)
7178 82 80
6862
7973
Elementary Associated professionalsCrafts Service Professionals
37
54 4850
36 35
10622 3 3
12
36
2 2
30
24
45
FOOD SECURITY(SCORE 0-1)
SEVERELY FOOD INSECURE (SCORE 5-6)
MODERATE FOOD INSECURE (SCORE 2-4)
TOTAL
FIGURE 47: PRS HEAD OF HOUSEHOLD OCCUPATION CATEGORIES BY HOUSEHOLD FOOD INSECURITY LEVELS (PER CENT)
CHAPTER THIRTEEN // FOOD SECURITY OF PALESTINE REFUGEES FROM SYRIA LIVING IN LEBANON 211 // HEAD OF HOUSEHOLD EDUCATION AND EMPLOYMENT

are likely to report a chronic illness. These numbers are fairly similar to those seen in PRL households where 90 per cent report an acute illness and 89 per cent report a chronic illness. Numbers are significantly lower for food secure households where 75 per cent are likely to report an acute
Similar to PRL households, indicators of physical health are significantly associated with food security. When it comes to severely food insecure households, 91 per cent are likely to have at least one member report an acute illness in the last six months, while 85 per cent
illness and 65 per cent report a chronic illness (see Table 111). Strong associations between poor health and food insecurity in PRS households indicate that a comprehensive approach is required to help prevent acute and chronic illnesses in this population.
household health characteristics and food insecurity
HH Health+
At least one member reports acute illness in HH (%)
At least one member reports chronic illness in HH (%)
978
978
75.6***
65.2**
89.6***
80.4**
91.1***
85.3**
n Food SecureModerately
Food insecureSeverely Food
insecureTABLE 111: PRS HOUSEHOLD HEALTH CHARACTERISTICS BY LEVEL OF HOUSEHOLD FOOD SECURITY
+ All health characteristics are self-reported physician diagnosed illnesses within the last six months
health of respondents by food security status of household
(MHI-5) score, compared to 79 per cent of moderately food insecure households and 53 per cent of food secure respondents. Respondents living in food secure households were also more likely to report having very good/good health at a rate of 48 per cent compared to 34 per cent
in moderately food insecure and 22 per cent in severely food insecure households. Similar trends are seen in PRL households where food insecurity is associated with poor mental health and self-rated health.
Indicators of respondent mental health and self-rated health are significantly associated with household food security. Of those respondents living in severely food insecure households, 87 per cent are likely to have poor mental health as measured by the mental health inventory
Mental health inventory (MHI-5) score of respondent <52/100, per cent
Respondent’s self-rated health, per cent
Very good/Good
Fair
Not good/ Very bad
978
969
52.6***
48.0
11.3
40.7
78.6***
34.3
26.9
38.9
87.3***
21.7
43.3
35.0
82.7
27.1
36.4
36.5
n Food SecureModerately
Food insecureSeverely Food
insecure TOTALTABLE 112: PRS RESPONDENT SELF-REPORTED HEALTH BY LEVEL OFHOUSEHOLD FOOD SECURITY
CHAPTER THIRTEEN // FOOD SECURITY OF PALESTINE REFUGEES FROM SYRIA LIVING IN LEBANON212
Denotes significance at the 0.1% level,Denotes significance at the 1% level andDenotes significance at the 5% level using Pearson’s chi-squared test.
******
Denotes significance at the 0.1% level,Denotes significance at the 1% level andDenotes significance at the 5% level using Pearson’s chi-squared test.
******

households to US$ 61 per capita in severely food insecure households (see Table 113 & Figure 48). This drop means that the difference between being food secure and food insecure is approximately US$ 20 per person, per month. Similar trends are observed in PRL households; however, expenditures are overall lower in PRS households; these numbers are very similar to those found in the recent PRS Vulnerability Assessment.170 To put this finding in perspective, severely food insecure PRL households actually have higher total monthly household expenditure per capita (at US$ 189/capita/ month) than food secure PRS households (at US$ 174/capita/month).
Similarly with PRL households, mean number of food-related assets (refrigerator, freezer, oven, and microwave) is associated with food security. However, again mean
In order to profile the household economic situation of food insecure and severely food insecure households, associations between different measures of poverty and household food insecurity were analysed.
Although food insecure PRS households are more likely to be poor than the food secure, the correlation between poverty and food security in PRS is not significant, with poverty rates remaining high even in the food secure households. In fact, the proportion of food secure households who are classified as poor is double in the PRL population.
Total monthly household expenditure is significantly reduced in food insecure households compared to food secure households (see Table 113). Similarly, monthly food expenditure drops from US$ 79 per capita in food secure
number of food-related assets are lower in food secure PRS than in severe food insecure PRL households, demonstrating the heightened vulnerability of the poorest PRS families compared to the poorest PRL households.
There is a high reliance on food assistance in PRS households with 96 per cent of PRS households receiving electronic food vouchers irrespective of food security status. Despite the wide coverage of food assistance to PRS, they remain largely vulnerable to food insecurity. In fact, 71 per cent of respondents from severely food insecure households state that they worry about being able to provide their family’s basic needs, compared to only 3 per cent of the food secure; the association between food insecurity and worry over meeting needs is strongly significant (p<0.001).
economic susceptibilityto food insecurity
Poor, per cent
Extreme poor, per cent
Average monthly household expenditure per capita, (US$), mean
Average monthly food expenditure per capita, (US$), mean
Number of food-related assets++, mean
Receiving UNRWA welfare, per cent
899
899
899
890
978
974
81.3
5.5
173.8*
79.4*
1.7
94.0
88.5
9.0
142.4
59.5*
1.6*
94.9
84.9
10.4
149
61.2
1.4
96.8
n Food secureModerately
food insecureSeverely food
insecure
++Food-related assets represent the sum of fridge, freezer, oven, and microwave
TABLE 113: ECONOMIC CHARACTERISTICS OF PRS BY LEVELS OF HOUSEHOLD FOOD SECURITY
170 United Nations High Commissioner for Refugees. (2015). Vulnerability assessment of Syrian refugees in Lebanon.
CHAPTER THIRTEEN // FOOD SECURITY OF PALESTINE REFUGEES FROM SYRIA LIVING IN LEBANON 213 // ECONOMIC SUSCEPTIBILITY TO FOOD INSECURITY
Denotes significance at the 0.1% level,Denotes significance at the 1% level andDenotes significance at the 5% level using Pearson’s chi-squared test.
******
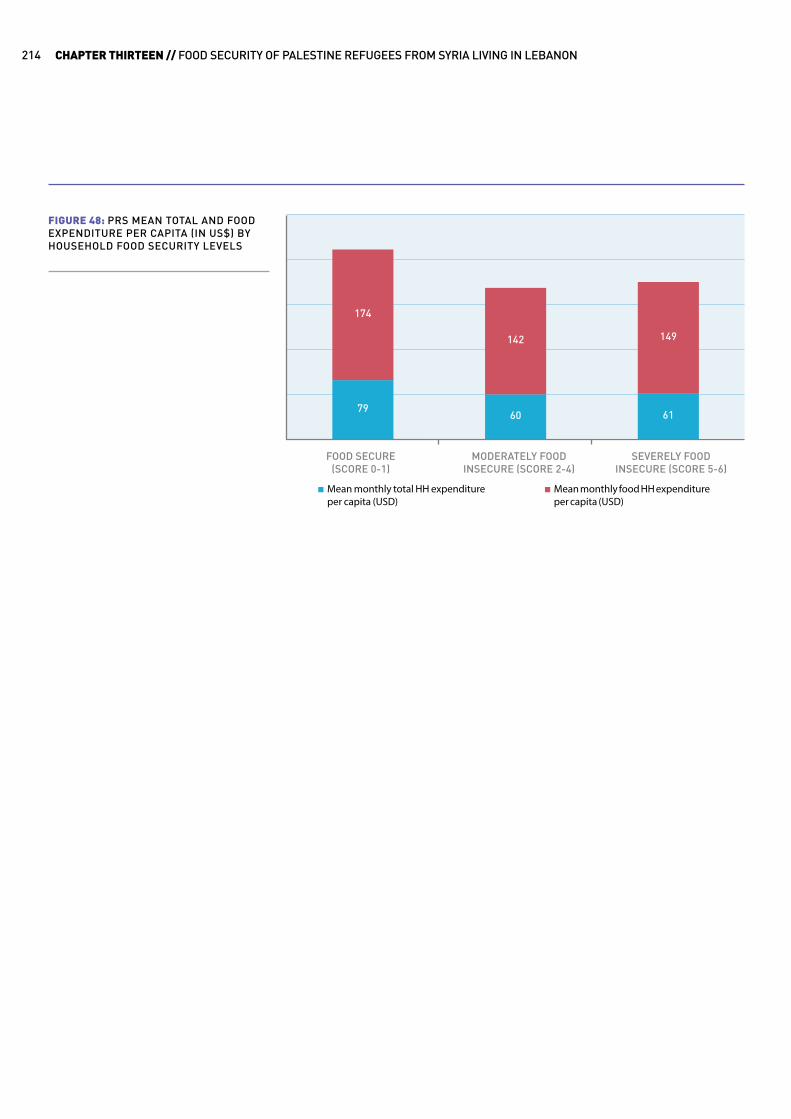
Mean monthly total HH expenditure per capita (USD)
Mean monthly food HH expenditure per capita (USD)
FOOD SECURE(SCORE 0-1)
SEVERELY FOOD INSECURE (SCORE 5-6)
MODERATELY FOOD INSECURE (SCORE 2-4)
FIGURE 48: PRS MEAN TOTAL AND FOOD EXPENDITURE PER CAPITA (IN US$) BY HOUSEHOLD FOOD SECURITY LEVELS
7960 61
174
142 149
CHAPTER THIRTEEN // FOOD SECURITY OF PALESTINE REFUGEES FROM SYRIA LIVING IN LEBANON214
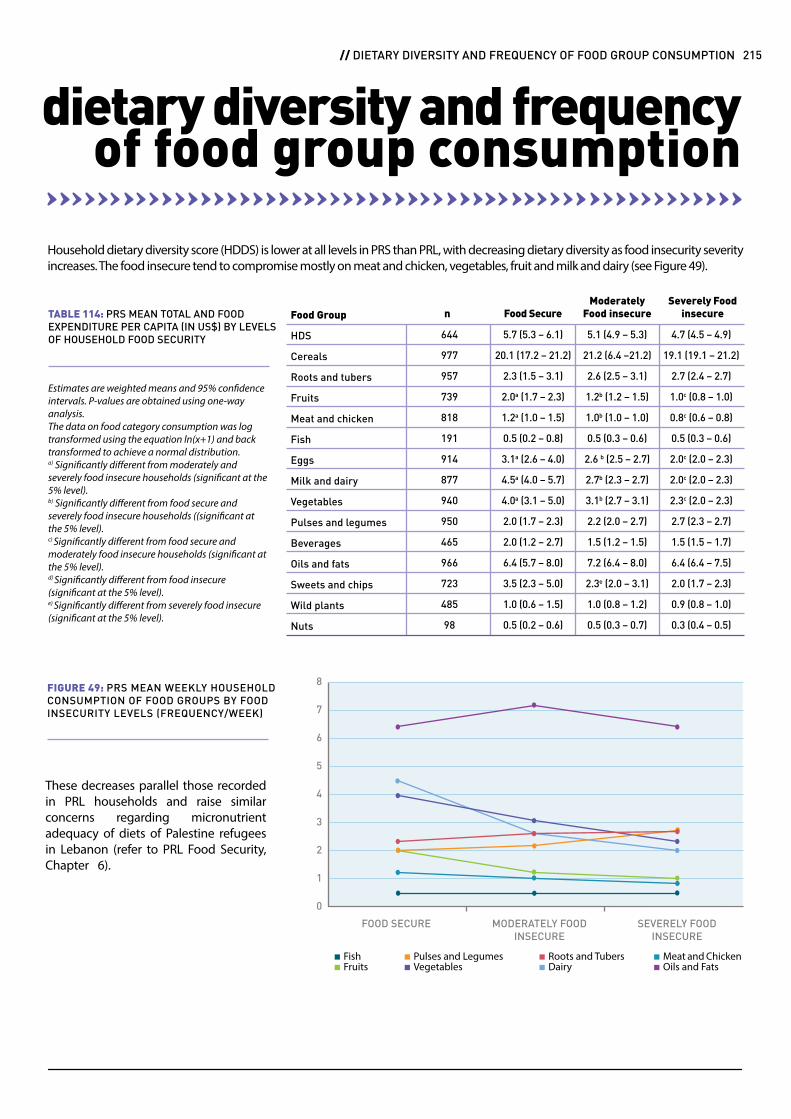
Household dietary diversity score (HDDS) is lower at all levels in PRS than PRL, with decreasing dietary diversity as food insecurity severity increases. The food insecure tend to compromise mostly on meat and chicken, vegetables, fruit and milk and dairy (see Figure 49).
dietary diversity and frequency of food group consumption
These decreases parallel those recorded in PRL households and raise similar concerns regarding micronutrient adequacy of diets of Palestine refugees in Lebanon (refer to PRL Food Security, Chapter 6).
Food Group
HDS
Cereals
Roots and tubers
Fruits
Meat and chicken
Fish
Eggs
Milk and dairy
Vegetables
Pulses and legumes
Beverages
Oils and fats
Sweets and chips
Wild plants
Nuts
644
977
957
739
818
191
914
877
940
950
465
966
723
485
98
5.7 (5.3 – 6.1)
20.1 (17.2 – 21.2)
2.3 (1.5 – 3.1)
2.0a (1.7 – 2.3)
1.2a (1.0 – 1.5)
0.5 (0.2 – 0.8)
3.1a (2.6 – 4.0)
4.5a (4.0 – 5.7)
4.0a (3.1 – 5.0)
2.0 (1.7 – 2.3)
2.0 (1.2 – 2.7)
6.4 (5.7 – 8.0)
3.5 (2.3 – 5.0)
1.0 (0.6 – 1.5)
0.5 (0.2 – 0.6)
5.1 (4.9 – 5.3)
21.2 (6.4 –21.2)
2.6 (2.5 – 3.1)
1.2b (1.2 – 1.5)
1.0b (1.0 – 1.0)
0.5 (0.3 – 0.6)
2.6 b (2.5 – 2.7)
2.7b (2.3 – 2.7)
3.1b (2.7 – 3.1)
2.2 (2.0 – 2.7)
1.5 (1.2 – 1.5)
7.2 (6.4 – 8.0)
2.3e (2.0 – 3.1)
1.0 (0.8 – 1.2)
0.5 (0.3 – 0.7)
4.7 (4.5 – 4.9)
19.1 (19.1 – 21.2)
2.7 (2.4 – 2.7)
1.0c (0.8 – 1.0)
0.8c (0.6 – 0.8)
0.5 (0.3 – 0.6)
2.0c (2.0 – 2.3)
2.0c (2.0 – 2.3)
2.3c (2.0 – 2.3)
2.7 (2.3 – 2.7)
1.5 (1.5 – 1.7)
6.4 (6.4 – 7.5)
2.0 (1.7 – 2.3)
0.9 (0.8 – 1.0)
0.3 (0.4 – 0.5)
n Food SecureModerately
Food insecureSeverely Food
insecureTABLE 114: PRS MEAN TOTAL AND FOOD EXPENDITURE PER CAPITA (IN US$) BY LEVELS OF HOUSEHOLD FOOD SECURITY
Estimates are weighted means and 95% confidence intervals. P-values are obtained using one-way analysis. The data on food category consumption was log transformed using the equation ln(x+1) and back transformed to achieve a normal distribution.a) Significantly different from moderately and severely food insecure households (significant at the 5% level).b) Significantly different from food secure and severely food insecure households ((significant at the 5% level).c) Significantly different from food secure and moderately food insecure households (significant at the 5% level).d) Significantly different from food insecure (significant at the 5% level).e) Significantly different from severely food insecure (significant at the 5% level).
FIGURE 49: PRS MEAN WEEKLY HOUSEHOLD CONSUMPTION OF FOOD GROUPS BY FOOD INSECURITY LEVELS (FREQUENCY/WEEK)
FOOD SECURE SEVERELY FOOD INSECURE
MODERATELY FOOD INSECURE
FishFruits
Roots and TubersDairy
Pulses and LegumesVegetables
Meat and ChickenOils and Fats
8
2
5
6
7
1
4
0
3
CHAPTER THIRTEEN // FOOD SECURITY OF PALESTINE REFUGEES FROM SYRIA LIVING IN LEBANON 215 // DIETARY DIVERSITY AND FREQUENCY OF FOOD GROUP CONSUMPTION
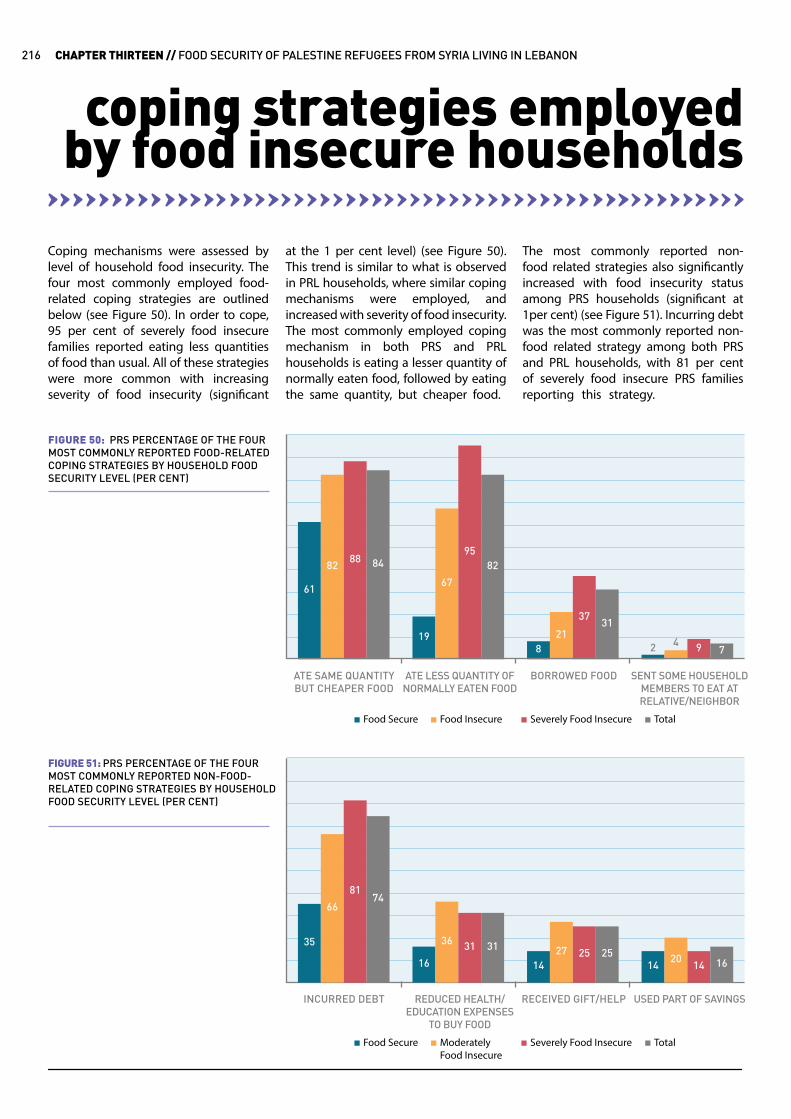
at the 1 per cent level) (see Figure 50). This trend is similar to what is observed in PRL households, where similar coping mechanisms were employed, and increased with severity of food insecurity. The most commonly employed coping mechanism in both PRS and PRL households is eating a lesser quantity of normally eaten food, followed by eating the same quantity, but cheaper food.
Coping mechanisms were assessed by level of household food insecurity. The four most commonly employed food-related coping strategies are outlined below (see Figure 50). In order to cope, 95 per cent of severely food insecure families reported eating less quantities of food than usual. All of these strategies were more common with increasing severity of food insecurity (significant
The most commonly reported non-food related strategies also significantly increased with food insecurity status among PRS households (significant at 1per cent) (see Figure 51). Incurring debt was the most commonly reported non-food related strategy among both PRS and PRL households, with 81 per cent of severely food insecure PRS families reporting this strategy.
coping strategies employed by food insecure households
ATE SAME QUANTITY BUT CHEAPER FOOD
INCURRED DEBT
BORROWED FOOD
RECEIVED GIFT/HELP
ATE LESS QUANTITY OF NORMALLY EATEN FOOD
REDUCED HEALTH/EDUCATION EXPENSES
TO BUY FOOD
SENT SOME HOUSEHOLD MEMBERS TO EAT AT RELATIVE/NEIGHBOR
USED PART OF SAVINGS
FIGURE 50: PRS PERCENTAGE OF THE FOUR MOST COMMONLY REPORTED FOOD-RELATED COPING STRATEGIES BY HOUSEHOLD FOOD SECURITY LEVEL (PER CENT)
FIGURE 51: PRS PERCENTAGE OF THE FOUR MOST COMMONLY REPORTED NON-FOOD-RELATED COPING STRATEGIES BY HOUSEHOLD FOOD SECURITY LEVEL (PER CENT)
Food Secure
Food Secure
Total
Total
Severely Food Insecure
Severely Food Insecure
Food Insecure
Moderately Food Insecure
61
8288 84
19
67
9582
821
3731
2 4 9 7
35
66
8174
16
36 31 31
1427 25 25
1420
14 16
CHAPTER THIRTEEN // FOOD SECURITY OF PALESTINE REFUGEES FROM SYRIA LIVING IN LEBANON216
In conclusion, the survey reveals high levels of insecurity among PRS. Their coping strategies include, similar to PRL, eating less quantities of food and compounding debts. Despite having some of the highest levels of agricultural production in the country, the highest prevalence of any food insecurity is in the Beqaa, with 97 per cent of households reporting that they are food insecure. Household size, number of children per household and crowding index are all higher in PRS families than PRL families, and increase with food insecurity in both populations. Despite higher levels of educational attainment in PRS head of households, food insecurity remains high implying that food insecurity is a result of their recent displacement. PRS high unemployment levels increase their levels of insecurity.
conclusion
CHAPTER THIRTEEN // FOOD SECURITY OF PALESTINE REFUGEES FROM SYRIA LIVING IN LEBANON 217 // CONCLUSION

© 2013 UNRWA / Mahmoud Khair

Housing Quality and Access to Water, Sanitation and Hygiene (WASH) for Palestine Refugees from Syria Living in Lebanon lara batlouni, nisreen salti, alexandra irani
CHAPTERFOURTEEN
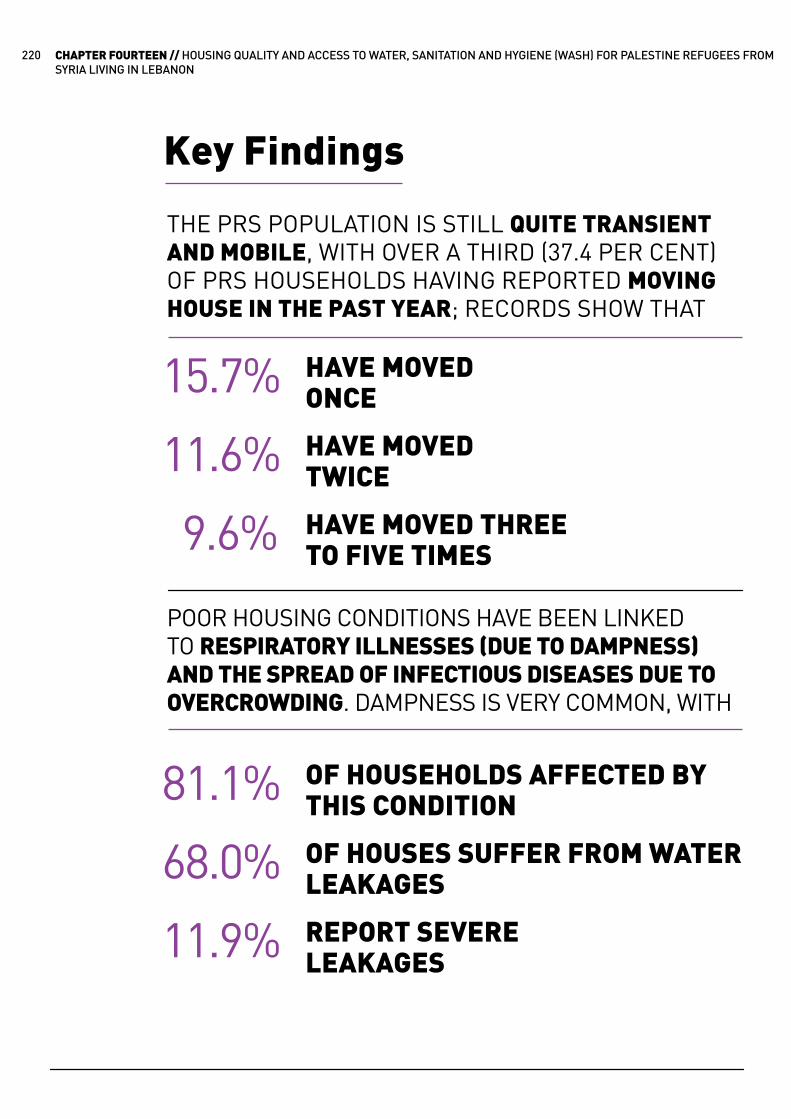
Key Findings
THE PRS POPULATION IS STILL QUITE TRANSIENT AND MOBILE, WITH OVER A THIRD (37.4 PER CENT) OF PRS HOUSEHOLDS HAVING REPORTED MOVING HOUSE IN THE PAST YEAR; RECORDS SHOW THAT
POOR HOUSING CONDITIONS HAVE BEEN LINKED TO RESPIRATORY ILLNESSES (DUE TO DAMPNESS) AND THE SPREAD OF INFECTIOUS DISEASES DUE TO OVERCROWDING. DAMPNESS IS VERY COMMON, WITH
HAVE MOVEDONCE
OF HOUSEHOLDS AFFECTED BY THIS CONDITION
HAVE MOVEDTWICE
OF HOUSES SUFFER FROM WATER LEAKAGES
HAVE MOVED THREE TO FIVE TIMES
REPORT SEVERE LEAKAGES
15.7%
81.1%
11.6%
68.0%
9.6%
11.9%
CHAPTER FOURTEEN // HOUSING QUALITY AND ACCESS TO WATER, SANITATION AND HYGIENE (WASH) FOR PALESTINE REFUGEES FROM SYRIA LIVING IN LEBANON
220

THE MAJORITY OF PRS HOUSEHOLDS (92.6 PER CENT) RELY ON UNRWA ASSISTANCE AS A MAIN SOURCE OF LIVELIHOOD
which is a substantial increase from the 80 per cent reported in the 2014 UNRWA Vulnerability Assessment.It is likely that vulnerability has increased since the time of the survey, with the suspension of the UNRWA US$ 100 (cash) housing assistance scheme in July 2015.
AROUND
OF PRS HOUSEHOLDS REPORT LIVING IN OVERCROWDED CONDITIONSwith more than three people sleeping per room. With an average number of 4.3 persons per room, overcrowding is most severe for households in the Beqaa. More than half of the residents (54.1 per cent) live in dwellings that are very small – 40m2 or smaller.
46.2%
PURCHASED WATER FOR
COOKING
ANDDRINKING
PURPOSES
51.2% 61.8%
171 United Nations High Commissioner for Refugees, United Nations Children’s Funds, & World Food Programme. (2015). Vulnerability assessment of Syrian refugees in Lebanon. Retrieved from http://goo.gl/7A2s1M.
221 // KEY FINDINGS
PRS households spend US$ 615.1 per month on average compared to PRL expenditure of US$ 777.6 per month, and US$ 762.0 for Syrian refugees.171 Average expenditures of households in camps were lower than those residing outside the camps in Saida and the Beqaa with a national average of US$ 591.6 monthly spending for households in camps compared to US$ 643.3 per month for households outside the camps.
AVERAGE HOUSEHOLD EXPENDITURES VARY WITH THE EDUCATIONAL ATTAINMENT OF THE HOUSEHOLD HEAD; THERE ARE HIGHER EXPENDITURE LEVELS FOR HIGHER EDUCATIONAL ATTAINMENT
WATER FOR DRINKING, COOKING AND WASHING WAS REPORTED TO BE SUFFICIENTLY AVAILABLE FOR THE MAJORITY OF PRS HOUSEHOLDS (78.9 PER CENT), BUT THE MAJORITY OF PRS FAMILIES RELY ON

This chapter depicts the housing situation for PRS in camps and areas outside camps, including housing conditions and tenure, access to water, sanitation and crowding levels. It also includes findings related to household assets, expenditures, and income.
UNRWA housing-related services, including shelter rehabilitation, are confined to the 12 official camps and do not cover areas outside camps or any housing unit that falls outside the official boundaries of camps. Moreover, municipalities do not usually provide these services to areas outside camps that fall within their administrative domain. This lack of municipal coverage of services has led to a continuous deterioration of living conditions due to dire housing quality in some areas outside camps as well as inadequate access to basic urban services.
PRS housing units are overcrowded and have deficient infrastructural services. Their housing situation is also dire in camps, which were already severely overcrowded prior to their arrival. As mentioned in Chapter Seven, most of these structures were built as temporary shelters and have deteriorated from lack of proper maintenance, which requires regular funding that is unfortunately not readily available. PRS, similar to PRL, live in homes with decaying infrastructure, in camps that have a dearth of recreational spaces, insufficient access to roads, deteriorated water and sewage treatment systems, contaminated water and jerry-rigged electrical wires along with open drainage ditches. The high cost of materials, combined with the Lebanese authorities’ restrictions imposed on bringing construction materials into the camps, leaves refugee families unable to carry out substantial repairs or maintenance.
The health and well-being of communities is linked to adequate housing facilities that provide healthy living environments.172 The majority (45.8 per cent) of PRS reside inside the Palestine refugee camps. These camps were already severely over-crowded prior to the arrival of Syrian refugees and PRS. This increase in the number of refugees has exacerbated the overcrowded conditions of housing units and deficient infrastructural services. Most of the structures built as temporary shelters have deteriorated from lack of proper maintenance. Decaying infrastructure, a dearth of recreational spaces, insufficient access to roads, deteriorated water and sewage treatment systems, contaminated water, and jerry-rigged electrical wires along with open drainage ditches paint a gloomy picture of the camps.
of 13.2 per cent for houses/dars and 8.0 per cent for huts/barracks. Beqaa has the lowest share of apartments (at 35.3 per cent), in parallel with a high prevalence of huts/barracks at 25.2 per cent due to the remaining French Army barracks
More than half of PRS households (55.4 per cent) live in apartments, followed by houses/dars (28.9 per cent). The percentage of households residing in apartments is highest in NLA (at 67.7 per cent), coupled with a low share
in Wavel Camp and Goro gathering. No major differences are noted at the level of age group of the household head, except for a high incidence of huts/barracks among those aged between 18 and 24 at 18.8 per cent.
type of residenceand tenure
172 Lawrence, R. (2006). Housing and health: Beyond disciplinary confinement. Journal of Urban Health, 83(3), 540–549. http://doi.org/10.1007/s11524-006-9055-4.
CHAPTER FOURTEEN // HOUSING QUALITY AND ACCESS TO WATER, SANITATION AND HYGIENE (WASH) FOR PALESTINE REFUGEES FROM SYRIA LIVING IN LEBANON
222
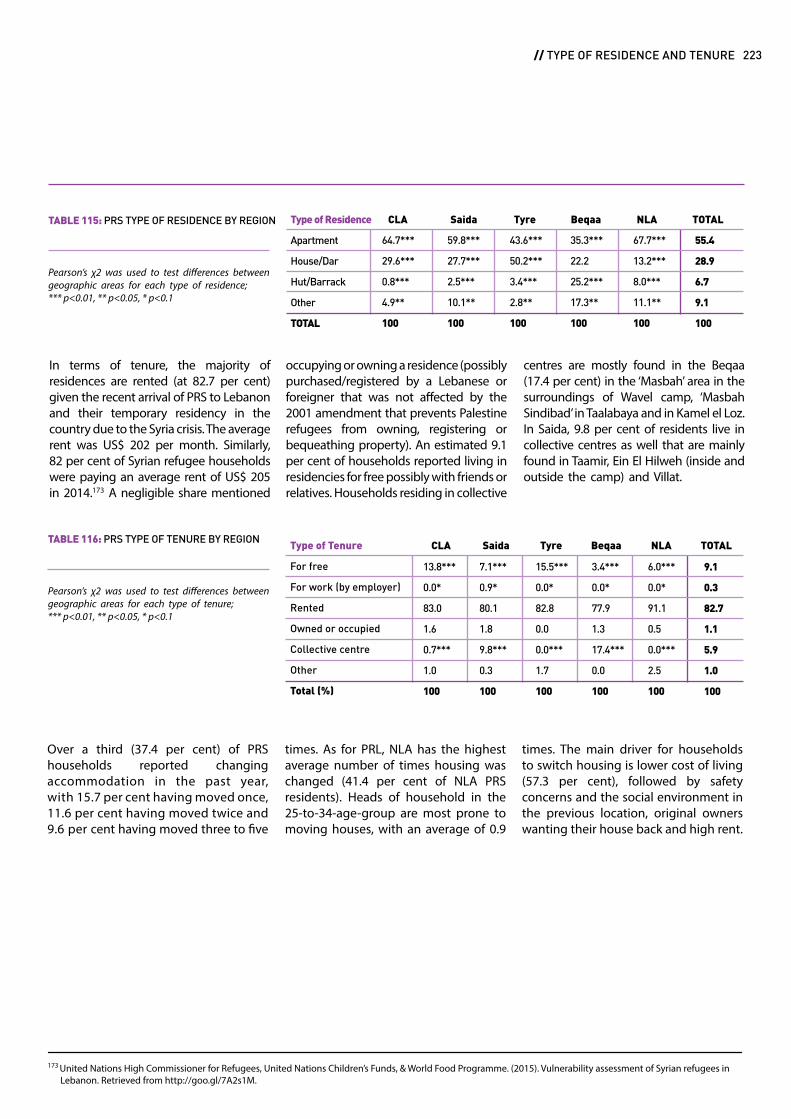
In terms of tenure, the majority of residences are rented (at 82.7 per cent) given the recent arrival of PRS to Lebanon and their temporary residency in the country due to the Syria crisis. The average rent was US$ 202 per month. Similarly, 82 per cent of Syrian refugee households were paying an average rent of US$ 205 in 2014.173 A negligible share mentioned
occupying or owning a residence (possibly purchased/registered by a Lebanese or foreigner that was not affected by the 2001 amendment that prevents Palestine refugees from owning, registering or bequeathing property). An estimated 9.1 per cent of households reported living in residencies for free possibly with friends or relatives. Households residing in collective
centres are mostly found in the Beqaa (17.4 per cent) in the ‘Masbah’ area in the surroundings of Wavel camp, ‘Masbah Sindibad’ in Taalabaya and in Kamel el Loz. In Saida, 9.8 per cent of residents live in collective centres as well that are mainly found in Taamir, Ein El Hilweh (inside and outside the camp) and Villat.
Type of Tenure
For free
For work (by employer)
Rented
Owned or occupied
Collective centre
Other
Total (%)
13.8***
0.0*
83.0
1.6
0.7***
1.0
100
7.1***
0.9*
80.1
1.8
9.8***
0.3
100
15.5***
0.0*
82.8
0.0
0.0***
1.7
100
3.4***
0.0*
77.9
1.3
17.4***
0.0
100
6.0***
0.0*
91.1
0.5
0.0***
2.5
100
9.1
0.3
82.7
1.1
5.9
1.0
100
CLA Saida Tyre Beqaa NLA TOTALTABLE 116: PRS TYPE OF TENURE BY REGION
Pearson’s χ2 was used to test differences between geographic areas for each type of tenure;*** p<0.01, ** p<0.05, * p<0.1
times. As for PRL, NLA has the highest average number of times housing was changed (41.4 per cent of NLA PRS residents). Heads of household in the 25-to-34-age-group are most prone to moving houses, with an average of 0.9
Over a third (37.4 per cent) of PRS households reported changing accommodation in the past year, with 15.7 per cent having moved once, 11.6 per cent having moved twice and 9.6 per cent having moved three to five
times. The main driver for households to switch housing is lower cost of living (57.3 per cent), followed by safety concerns and the social environment in the previous location, original owners wanting their house back and high rent.
Type of Residence
Apartment
House/Dar
Hut/Barrack
Other
TOTAL
64.7***
29.6***
0.8***
4.9**
100
59.8***
27.7***
2.5***
10.1**
100
43.6***
50.2***
3.4***
2.8**
100
35.3***
22.2
25.2***
17.3**
100
67.7***
13.2***
8.0***
11.1**
100
55.4
28.9
6.7
9.1
100
CLA Saida Tyre Beqaa NLA TOTALTABLE 115: PRS TYPE OF RESIDENCE BY REGION
Pearson’s χ2 was used to test differences between geographic areas for each type of residence;*** p<0.01, ** p<0.05, * p<0.1
173 United Nations High Commissioner for Refugees, United Nations Children’s Funds, & World Food Programme. (2015). Vulnerability assessment of Syrian refugees in Lebanon. Retrieved from http://goo.gl/7A2s1M.
223 // TYPE OF RESIDENCE AND TENURE
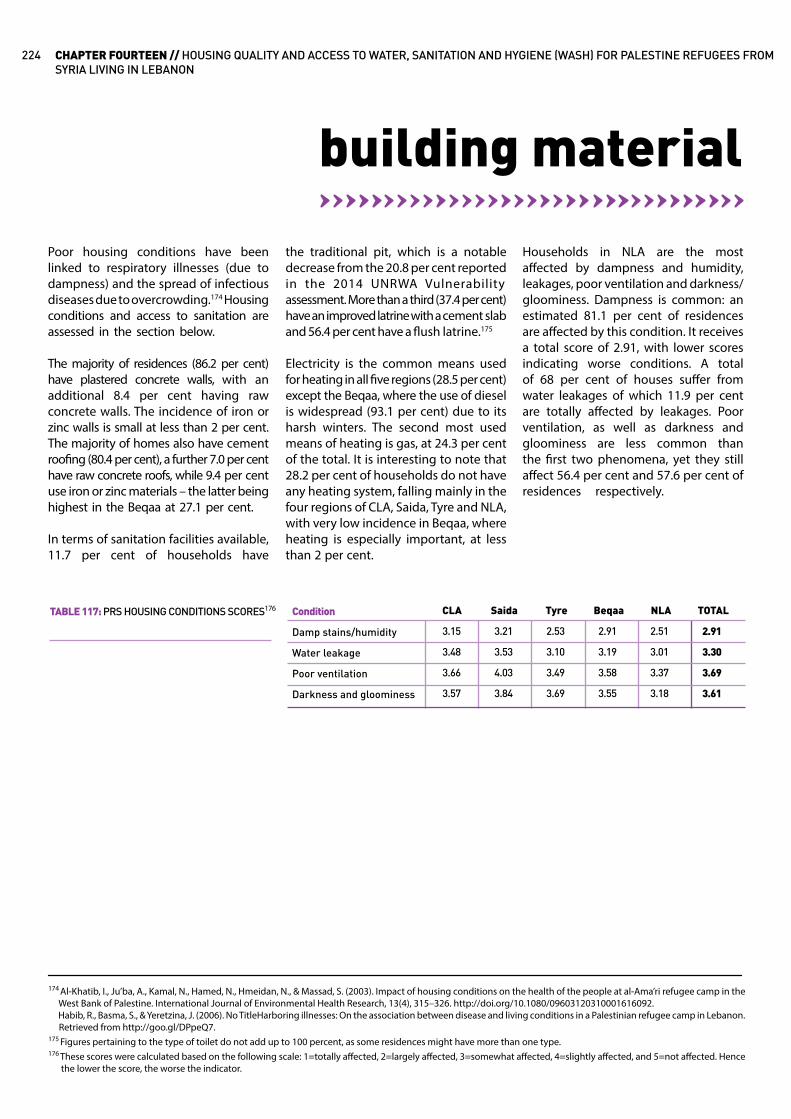
building material
the traditional pit, which is a notable decrease from the 20.8 per cent reported in the 2014 UNRWA Vulnerability assessment. More than a third (37.4 per cent) have an improved latrine with a cement slab and 56.4 per cent have a flush latrine.175
Electricity is the common means used for heating in all five regions (28.5 per cent) except the Beqaa, where the use of diesel is widespread (93.1 per cent) due to its harsh winters. The second most used means of heating is gas, at 24.3 per cent of the total. It is interesting to note that 28.2 per cent of households do not have any heating system, falling mainly in the four regions of CLA, Saida, Tyre and NLA, with very low incidence in Beqaa, where heating is especially important, at less than 2 per cent.
Poor housing conditions have been linked to respiratory illnesses (due to dampness) and the spread of infectious diseases due to overcrowding.174 Housing conditions and access to sanitation are assessed in the section below.
The majority of residences (86.2 per cent) have plastered concrete walls, with an additional 8.4 per cent having raw concrete walls. The incidence of iron or zinc walls is small at less than 2 per cent. The majority of homes also have cement roofing (80.4 per cent), a further 7.0 per cent have raw concrete roofs, while 9.4 per cent use iron or zinc materials – the latter being highest in the Beqaa at 27.1 per cent.
In terms of sanitation facilities available, 11.7 per cent of households have
Households in NLA are the most affected by dampness and humidity, leakages, poor ventilation and darkness/gloominess. Dampness is common: an estimated 81.1 per cent of residences are affected by this condition. It receives a total score of 2.91, with lower scores indicating worse conditions. A total of 68 per cent of houses suffer from water leakages of which 11.9 per cent are totally affected by leakages. Poor ventilation, as well as darkness and gloominess are less common than the first two phenomena, yet they still affect 56.4 per cent and 57.6 per cent of residences respectively.
174 Al-Khatib, I., Ju’ba, A., Kamal, N., Hamed, N., Hmeidan, N., & Massad, S. (2003). Impact of housing conditions on the health of the people at al-Ama’ri refugee camp in the West Bank of Palestine. International Journal of Environmental Health Research, 13(4), 315–326. http://doi.org/10.1080/09603120310001616092. Habib, R., Basma, S., & Yeretzina, J. (2006). No TitleHarboring illnesses: On the association between disease and living conditions in a Palestinian refugee camp in Lebanon. Retrieved from http://goo.gl/DPpeQ7.175 Figures pertaining to the type of toilet do not add up to 100 percent, as some residences might have more than one type.176 These scores were calculated based on the following scale: 1=totally affected, 2=largely affected, 3=somewhat affected, 4=slightly affected, and 5=not affected. Hence the lower the score, the worse the indicator.
Condition
Damp stains/humidity
Water leakage
Poor ventilation
Darkness and gloominess
3.15
3.48
3.66
3.57
3.21
3.53
4.03
3.84
2.53
3.10
3.49
3.69
2.91
3.19
3.58
3.55
2.51
3.01
3.37
3.18
2.91
3.30
3.69
3.61
CLA Saida Tyre Beqaa NLA TOTALTABLE 117: PRS HOUSING CONDITIONS SCORES176
CHAPTER FOURTEEN // HOUSING QUALITY AND ACCESS TO WATER, SANITATION AND HYGIENE (WASH) FOR PALESTINE REFUGEES FROM SYRIA LIVING IN LEBANON
224

living space
more than three people in one room. This figure shows regional disparities, with double the number of households classified as overcrowded in the Beqaa (67.3 per cent) compared to 36.2 per cent
The crowding index measures restrictions on the living space by the number of people per room in a household. Almost half the households (46.2 per cent) report living in overcrowded conditions – with
of households in CLA. The data also shows that the average number of persons per room reaches 3.1 nationally.
households are overcrowded compared to 69.9 per cent in CLA. The data also shows that the average number of persons sleeping in one room reaches 4.3 nationally compared to 3.2 for PRL.
More than half of the residents (54.1 per cent) live in dwellings that are 40m2 or smaller. A substantially higher percentage of PRS
Overcrowding can be also analysed by the number of sleeping rooms. Using this measure of overcrowding, more than three-quarters (78.8 per cent) of PRS households would be classified as overcrowded, having more than three persons sleeping in the same room. Again, overcrowding is significantly higher in the Beqaa where 93.7 per cent of
(17.7 per cent) live in dwellings that are between 11m2 and 20m2 than the percentage of PRL (2.4 percent) who live in same sized dwellings. Similar to PRL, PRS in the Beqaa tends to reside in smaller housing units, while PRS in Saida inhabit larger ones, as shown in Table 119.
Persons per room
1
2-3
> 3
TOTAL
34.0***
29.8
36.2***
100
28.0***
27.3
44.7***
100
24.5***
32.5
43.0***
100
5.5***
27.1
67.3***
100
24.0***
32.4
43.5***
100
24.3
29.6
46.2
100
CLA Saida Tyre Beqaa NLA TOTALTABLE 118: PRS CROWDING INDEX BY REGION
Pearson’s χ2 was used to test differences between geographic areas for each crowding bracket;*** p<0.01, ** p<0.05, * p<0.1
Area (sq.m.)
0-10
11-20
21-40
41-60
61-100
101-200
TOTAL(%)
2.2***
12.4*
51.2***
13.4***
19.8**
1.0***
100
0.0***
17.5*
23.0***
18.3***
27.7**
13.5***
100
0.0***
18.9*
42.2
23.0***
13.8**
2.1***
100
9.4***
26.7*
33.0***
12.8***
13.1***
5.1***
100
3.0***
14.2*
30.1***
31.2***
20.7**
0.8***
100
2.3
17.7
34.1
19.7
20.4
5.8
100
CLA Saida Tyre Beqaa NLA TOTALTABLE 119: PRS SURFACE AREA OF RESIDENCES
Pearson’s χ2 was used to test differences between geographic areas for each area group;*** p<0.01, ** p<0.05, * p<0.1
225 // LIVING SPACE

access to water
cooking purposes, with 96.2 per cent and 97.2 per cent respectively. Purchased water is usually bought from unofficial suppliers and is different from bottled mineral water that is certified by the Ministry of Health. Noteworthy is the very low percentage of households that purchase bottled mineral water for drinking (2.6 per cent) and cooking (1.7 per cent), and the possible health implications. Household tap water (i.e. network), which is not considered to be potable, comes as a secondary source, where 20.6 per cent and 32.3 per cent of households use it for drinking and cooking respectively. Saida has the highest share of households that use tap water for drinking and cooking
Water for drinking, cooking and washing is sufficiently available to the majority of PRS households (78.9 per cent), although regional disparities were reported, with fewer households in CLA reporting sufficient availability of water (65.3 per cent) compared to 88.2 per cent of PRS residents in Tyre. Access is equal across income vulnerability groups.177
As Table 120 shows, the main source for drinking and cooking water is purchased water, with 61.8 per cent and 51.2 per cent of households reporting having purchased water for these purposes respectively. CLA has the highest share of households that purchase water for drinking and
purposes, with respective shares of 39.5 per cent and 58.9 per cent. Households in Saida also rely on public reservoirs and standpipes (21 per cent).
The main source of washing water for two thirds of PRS households (66.8 per cent) and 89.3 per cent of PRS households in the Beqaa is household tap water. This is followed by wells, (14.9 per cent) especially for households in CLA (35.7 per cent) and the Beqaa (26.4 per cent). Over a quarter of Beqaa residents (27.1 per cent) also use the camp’s public reservoir as a source of washing water (all Wavel residents as well as ‘Masbah’ residents who mention it in their answers).
177 Income vulnerability can be measured by looking at respondents whose income comes primarily from transient and unreliable sources.
Drinking
Tap water
Purchased
Mineral
Other
TOTAL
Cooking
Tap water
Purchased
Mineral
Public reservoir
Public standpipe
Other
TOTAL
Washing
Tap water
Public reservoir
Public standpipe
Well
Other
TOTAL
1.0***
96.2***
1***
1.9***
100
1.0***
97.2***
0***
0***
0***
1.8***
100
40.2***
7.5***
1.1***
35.7***
15.5***
100
39.5***
34.8***
1.5***
24.2***
100
58.9***
20.5***
0.8***
5.7***
11***
3.1***
100
89.3***
4***
4.5***
1.2***
1***
100
5.8***
77.0***
1***
16.2***
100
14.7***
67.4***
1.5***
6.7***
2.1***
7.7***
100
85.8***
7.5***
0***
3.7***
2.9***
100
27.9***
43.0***
12***
17.5***
100
31.8***
39.4***
8.1***
2.6***
7.1***
11***
100
35.1***
27.1***
5***
26.4***
6.4***
100
14.5***
77.3***
0***
8.2***
100
33.6***
54.6***
0***
0.5***
0.8***
10.5***
100
57.6***
10.8***
0.8***
22***
8.9***
100
20.6
61.8
2.6
15.1
100
32.3
51.2
1.7
3.6
5.1
6.1
100
66.8
9.8
2.5
14.9
6
100
CLASource Saida Tyre Beqaa NLA TOTALTABLE 120: PRS SOURCE OF WATER
Pearson’s χ2 was used to test differences between geographic areas for each source of water under the drinking, cooking, and washing categories;*** p<0.01, ** p<0.05, * p<0.1
CHAPTER FOURTEEN // HOUSING QUALITY AND ACCESS TO WATER, SANITATION AND HYGIENE (WASH) FOR PALESTINE REFUGEES FROM SYRIA LIVING IN LEBANON
226

household assets
sources of income179
the protracted conflict in Syria, PRS have reported having to sell their assets as a coping mechanism to meet their basic needs. Very few PRS households do not own any electronics and home appliances; around 28.2 per cent own between two and five appliances and a further 64.1 per cent own between6 and 10. Households in Central Lebanon Area (CLA) have more assets than those
The vast majority of PRS households (95.6 per cent) do not possess transportation vehicles, with less than 5 per cent of households owning a transportation vehicle compared to10 per cent of Syrian refugees.178
The average number of household appliances owned is 6.6 compared to 9.8 for PRL. As expected four years into
in the Beqaa with 79.1 per cent owning more than six appliances compared to 43.5 per cent. The survey shows that 27.7 per cent of PRS households do not own a fridge (highest in Beqaa at 44.5 per cent), 28.3 per cent do not own a washing machine (highest in Beqaa at 51.7 per cent) and 19.2 per cent do not own a water heater (highest in Beqaa at 45.9 per cent).
178 United Nations High Commissioner for Refugees, United Nations Children’s Funds, & World Food Programme. (2015). Vulnerability assessment of Syrian refugees in Lebanon. Retrieved from http://goo.gl/7A2s1M.179 Total household expenditure was used as a proxy for the income variable, as income might be underreported by households.
The vast majority of PRS households (92.6 per cent) rely on UNRWA assistance as a main source of livelihood, which is a substantial increase from the 80 per cent reported in the 2014 UNRWA Vulnerability Assessment. The income vulnerability of PRS households is also expected to worsen due to the suspension of the US$ 100 housing assistance in July 2015 for all eligible PRS. Some funds have remained in place to continue the food assistance of US$ 27 per person (as of April 2015). Other major sources of livelihood include credit or loans (58.6 per cent), followed by wage labour (31.1 per cent) and aid from other humanitarian organizations (22.9 per cent).
Remittances also represent a source of income for 6.2 per cent of households.
Approximately three quarters of respondents (71.2 per cent) report worrying about losing their source of income compared to 48.4 per cent of PRL, which can be explained by the fact that PRS are highly dependent on UNRWA assistance with limited alternative sources of income. Households in NLA (82.5 per cent) feel their situation is more precarious and are more likely to report fear of losing their source of income, compared to households in CLA (63 per cent). Data also show that more males and younger
age groups report this worry than do females and older people respectively.
More than half the respondents (59.4 per cent) convey worry or fear of being unable to provide their daily necessities. Households in CLA felt more secure in their ability to meet their family’s daily needs (54.8 per cent), particularly compared to those in NLA (68 per cent). Furthermore, data shows that more males and older age groups report such a worry than do females and younger people respectively.
227 // HOUSEHOLD ASSETS

180, 181 United Nations High Commissioner for Refugees, United Nations Children’s Funds, & World Food Programme. (2015). Vulnerability assessment of Syrian refugees in Lebanon. Retrieved from http://goo.gl/7A2s1M.
household expenditures
PRS households spend US$ 615.1 per month on average compared to PRL expenditure of US$ 777.6 per month, and US$ 762.0 for Syrian refugees.180 Average expenditures of households in camps is lower than those residing outside the camps in Saida and the Beqaa with a national average of US$ 591.6 monthly
Average household expenditures vary with the educational attainment of the household head; there are higher expenditure levels for higher educational attainment. The average household expenditure reaches US$ 536.6 for households with heads who have never
spending for households in camps compared to US$ 643.3 per month for households outside the camps. CLA households report the highest average expenditure of US$ 668 per month while Tyre households report the lowest at US$ 518.
attended school, while it increases to US$ 745 for those who have attended university. Food represents the major item at 39 per cent of total expenditures (compared to 36 per cent for PRL), followed by rent, which comprises 30 per cent. Health care
The average per-capita expenditure among PRS is US$ 135.8 per month with the highest average expenditure per capita being reported in CLA (US$ 162.4) and the lowest in NLA (US$ 120.1).
(including general health care, medication and hospitalization) ranks third at eight per cent. These three items combined consume more than three quarters of total expenditure (77 per cent), a finding that is similar to the expenditure of Syrian refugees in 2014 on the same items.181
Total
Per capita
FIGURE 52: PRS AVERAGE HOUSEHOLD EXPENDITURE BY REGION (US$ PER MONTH)
TYRE NLA BEQAA CLA SAIDA TOTAL
518
129.2
567
120.1
628
140.7
665.4
133.7
668
162.4
615.1
135.8
Rent OtherHealthcareFood
FIGURE 53: PRS HOUSEHOLDEXPENDITURE ITEMS BY REGION
CLA SAIDA TYRE BEQAA NLA OVERALL
34 30 25 26 31 30
3838 43 38
4139
6 10 78
88
22 22 25 2820 23
CHAPTER FOURTEEN // HOUSING QUALITY AND ACCESS TO WATER, SANITATION AND HYGIENE (WASH) FOR PALESTINE REFUGEES FROM SYRIA LIVING IN LEBANON
228
In conclusion, PRS have been mobile since they moved into Lebanon. However, their housing conditions are poor and overcrowded. Poor housing conditions such as dampness have been linked to respiratory illnesses and the spread of infectious diseases has been linked to overcrowding. Dampness and water leakages are very common among PRS households. PRS are also highly dependent on purchasing potable and utility water. Almost all PRS depend on UNRWA for livelihood assistance.
conclusion
229 // CONCLUSION
reference list
American Near East Refugee Aid. (2012). Palestinian refugees from Syria in Lebanon (Vol. 3).
Bourguignon, F. (2003). From income to endowments: The difficult task of expanding the income poverty paradigm. DELTA Working Papers. DELTA (Ecole normale supérieure). Retrieved from http://goo.gl/hAAt7z.
Branson, N., & Wittenberg, M. (2011). Re-weighting South African national household survey data to create a consistent series over time: A cross entropy estimation approach. Retrieved from http://goo.gl/xRwCmS.
Chaaban, J., Ghattas, H., & Habib, R. (2010). Socio-economic survey of Palestinian refugees in Lebanon. Retrieved from http://goo.gl/9zXCg4.
Danish Refugee Council. (2007). Survey report on the situation of non-ID Palestinian refugees in Lebanon.
Demographic and Health Surveys Program. (2013). Demographic and Health Surveys Methodology. Retrieved from http://goo.gl/TYt9yy.
Demographic and Health Surveys Program. (2010). DHSQ6-DHS Model Questionnaire – Phase 6. Retrieved from http://goo.gl/rirmDJ.
Dorai, M. (2003). Les réfugiés Palestiniens en Europe et en Suède: Complexité des parcours et des espaces migratoires. In L’Asile Politique entre Deux Chaises: Droits de l’Homme et Gestion des Flux Migratoires (pp. 311–331). Paris: L’Harmattan.
Duclos, J. Y., & Gregoire, P. (2003). Absolute and relative deprivation and the measurement of poverty. Review of Income and Wealth, 48(4), 471–492. http://doi.org/10.1111/1475-4991.00064.
El Laithy, H., Abu-Ismail, K., & Hamdan, K. Poverty, growth and income distribution in Lebanon, International Policy Centre for Inclusive Growth (2008). Retrieved from https://goo.gl/TlKZOC.
Fafo. (2007). Labour force survey among Palestinian refugees in Lebanon.
Food and Agriculture Organization of the United Nations. (2007). The Wye group handbook rural households’ livelihood and well-being statistics on rural development and agriculture household income. Retrieved from http://goo.gl/MiWN1d.
Foster, J., Greer, J., & Thorebecke, E. (1984). A class of decomposable measure of poverty. Econometrica, 52(3), 761–766. Retrieved from http://goo.gl/gka3kN.
Fukuda-Parr, S. (2003). The human development paradigm: Operationalizing Sen’s ideas on capabilities. Feminist Economics, 9(2-3), 301–317. http://doi.org/10.1080/1354570022000077980.
Golan, A., Judge, G., & Miller, D. (1997). Maximum entropy econometrics: Robust estimation with limited data. Retrieved from http://goo.gl/QJE9x9.
Habib, R. R., Mahfoud, Z., Fawaz, M., Basma, S. H., & Yeretzian, J. S. (2009). Housing quality and ill health in a disadvantaged urban community. Review of Income and Wealth, 123(2), 174–181. http://doi.org/10.1016/j.puhe.2008.11.002.
Hanafi, S., & Tiltnes, Å. (2008). The employability of Palestinian professionals in Lebanon: Constraints and transgression. Knowledge, Work and Society, 5(1), 1–15.
Idler, E. L., & Benyamini, Y. (1997). Self-rated health and mortality: A review of twenty-seven community studies. Journal of Health and Social Behavior. Retrieved from http://goo.gl/hOVCF1.
International Labour Organization. (2012). Palestinian employment in Lebanon facts and challenges: Labour force survey among Palestinian refugees living in camps and gatherings In Lebanon. Retrieved February 2, 2016, from http://goo.gl/pXRvk9.
Khalidi, A. (2011). An overview of the living conditions of Palestinian refugees residing legally in Lebanon but who are not registered with the UNRWA-Lebanon field office.
Khalidi, A., & Tabbarah, R. (2009). Contributions of Palestinian refugees residing in camps and some gatherings to the Lebanese economy. Retrieved from https://goo.gl/hc101L.
Kovacevic, M., & Calderon, M. C. (2014). UNDP’s multidimensional poverty index: 2014 specifications, (December).
Introduction, Methodology, Chapter One: Demographics of Palestine Refugees in Lebanon
REFERENCES //230

Lyyra, T., Heikkinen, E., Lyyra, A., & Jylhä, M. (2006). Self-rated health and mortality: Could clinical and performance-based measures of health and functioning explain the association? Archives of Gerontology and Geriatrics, 42(3), 277–88. http://doi.org/10.1016/j.archger.2005.08.001.
Maxwell, D., Caldwell, R., & Langworthy, M. (2008). Measuring food insecurity: Can an indicator based on localized coping behaviors be used to compare across contexts? Food Policy. Retrieved from http://goo.gl/5eX9os.
Medical Aid for Palestinians. (2011). Terminal decline? Palestinian refugee health in Lebanon.
Neethling, A., & Galpin, J. (2006). Weighting of household survey data: A comparison of various calibration, integrated and cosmetic estimators: Theory and methods. South African Statistical Journal. Retrieved from http://goo.gl/alTIa0.
Qassem, Q. (2014). Emigration the latest threat to right of return for Palestinians. Al Akhbar. Retrieved from http://goo.gl/sHDYcO.
Robilliard, A., & Robinson, S. (2003). Reconciling household surveys and national accounts data using a cross entropy estimation method. Review of Income and Wealth. Retrieved from http://goo.gl/n5hVzl
Sahyoun, N. R., Nord, M., Sassine, A. J., Seyfert, K., Hwalla, N., & Ghattas, H. (2014). Development and validation of an Arab family food security scale. The Journal of Nutrition, 144(9), 751–757. http://doi.org/10.3945/jn.113.187112
Sen, A. (2003). Development as capability expansion. Readings in Human Development: Concepts, Measures and Policies for a Development Paradigm, 41–58.
Shafie, S. (2007). Palestinian refugees in Lebanon. Retrieved from http://goo.gl/0QkkJe.
Suleiman, C. (2011). Language and identity in the Israel-Palestine conflict: The politics of self-perception in the Middle East. Retrieved from https://goo.gl/0ZQP3B.
Swindale, A., & Bilinsky, P. (2006). Development of a universally applicable household food insecurity measurement tool: Process, current status, and outstanding issues. The Journal of Nutrition, 136(5), 1449S–1452S.
Tatwir Center for Studies. (2015). Needs assessment of Palestinian refugees from Syria.
Tiltnes, Å. (2005). Some findings from Fafo’s 2006 study on the employability of Palestinian refugees in Lebanon.
Tiltnes, Å. (2007). A socio-economic profile of the Nahr El-Bared and Beddawi refugee camps of Lebanon. Oslo: Fafo.Retrieved from http://goo.gl/UHCOsL.
Tiltnes, A., & Forskningsstiftelsen, F. (2005). Falling behind: A brief on the living conditions of Palestinian refugees in Lebanon. Retrieved from http://goo.gl/gvCMTu.
Todaro, M. P., & Smith, S. C. (2011). Economics development.
Ugland, O. (2003). Difficult past, uncertain future: Living conditions among Palestinian refugees in camps and gatherings in Lebanon.
United Nations Development Programme. (2014). Profiling deprivation: An analysis of rapid needs assessment of Palestinian gatherings host communities in Lebanon. Retrieved from http://goo.gl/omwGyQ.
United Nations High Commissioner for Refugees. (2015). Vulnerability assessment of Syrian refugees in Lebanon.
United Nations Relief and Works Agency. (n.d.). Palestine refugees. Retrieved February 29, 2016, from http://goo.gl/VNM31p.
United Nations Relief and Works Agency. (2014). Palestinian Refugees from Syria in Lebanon. Retrieved from http://goo.gl/DQzQhK.
United Nations Relief and Works Agency. (2015). Profiling the vulnerability of Palestine refugees from Syria living in Lebanon. Retrieved from http://goo.gl/r5KeP3.
United Nations Relief and Works Agency, & World Food Programme. (2014). Needs assessment for Palestine refugees.Retrieved from https://goo.gl/1qlAQB.
United States Agency for International Development. (2013). Demographic and health surveys methodology.
Veit, C. T., & Ware, J. E. (1983). The structure of psychological distress and well-being in general populations. Journal of Consulting and Clinical Psychology, 51(5), 730–742. http://doi.org/10.1037/0022-006X.51.5.730.
Wittenberg, M. (2010). An introduction to maximum entropy and minimum cross-entropy estimation using Stata. The Stata Journal, 10(3), 315–330. Retrieved from http://goo.gl/lMKsCD.
Ziadni, M., Hammoudeh, W., Abu Rmeileh, N. M. E., Hogan, D., Shannon, H., & Giacaman, R. (2011). Sources of human insecurity in post-war situations: The case of Gaza. Journal of Human Security, 7(3). http://doi.org/10.3316/JHS0703023.
231

Central Administration of Statistics. (2012). Households budget survey. Retrieved January 31, 2016, from http://goo.gl/9CxsTv.
Chaaban, J., Ghattas, H., & Habib, R. (2010). Socio-economic survey of Palestinian refugees in Lebanon. Retrieved from http://goo.gl/9zXCg4.
Hillenkamp, B. (2008). The challenges of Palestinian education. Retrieved February 6, 2016, from http://goo.gl/ogkou8.
Shuayb, M. (2014). The art of inclusive exclusions: Educating the Palestinian refugee students in Lebanon. Refugee Survey Quarterly (Vol. 33). Retrieved from http://goo.gl/G2IV6T.
United Nations Relief and Works Agency. (2015). Education reform strategy. Retrieved January 31, 2016, from http://goo.gl/JCjlp2.
United Nations Relief and Works Agency. (2013). UNRWA school dropout: An agency wide study.
Central Administration of Statistics. (2004). Living conditions of households. Retrieved from http://goo.gl/eusmxz.
International Labour Organization. (2012). Palestinian employment in Lebanon facts and challenges: Labour force survey among Palestinian refugees living in camps and gatherings In Lebanon. Retrieved February 2, 2016, from http://goo.gl/pXRvk9.
United Nations Relief and Works Agency. (2015). Professions of restricted access for Palestine refugees in Lebanon. Labour Market and Research Development Quarterly Update (LMRD) (Vol. October).
Council for Development and Reconstruction. (2013). Public health. Retrieved from http://goo.gl/nw4m5y.
Institute for Health Metrics and Evaluation. (2015). Notice of tool migration. Retrieved from http://goo.gl/VnBnNT.
International Labour Organization. (2012). Palestinian employment in Lebanon facts and challenges: Labour force survey among Palestinian refugees living in camps and gatherings In Lebanon. Retrieved February 2, 2016, from http://goo.gl/pXRvk9.
Ghattas, H., Sassine, A. J., Seyfert, K., Nord, M., & Sahyoun, N. R. (2015). Prevalence and correlates of food insecurity among Palestinian refugees in Lebanon: Data from a household survey. Plos One. Retrieved from http://goo.gl/75CaGS.
Gordon, N., & Halileh, S. (2012). An analysis of cross sectional survey data of stunting among Palestinian children less than five years of age. Maternal and Child Health Journal, 17(7), 1288–1296. http://doi.org/10.1007/s10995-012-1126-4.
Hannum, E., Liu, J., & Frongillo, E. A. (2014). Poverty, food insecurity and nutritional deprivation in rural China: Implications for children’s literacy achievement. International Journal of Educational Development, 34, 90–97. Retrieved from http://goo.gl/YpStws.
Sahyoun, N. R., Nord, M., Sassine, A. J., Seyfert, K., Hwalla, N., & Ghattas, H. (2014). Development and validation of an Arab family food security scale. The Journal of Nutrition, 144(9), 751–757. http://doi.org/10.3945/jn.113.187112.
Bankmed. (2014). Lebanon Weekly Report. Lebanon.
Lebanese-Palestinian Dialogue Committee. (2010). Lebanon and Palestinian refugees: Policy foundations and milestones. Lebanon. Retrieved from http://goo.gl/KHkjTE.
Nahr El-Bared Recovery and Reconstruction Cell. (2009). Nahr el Bared camp and surrounding municipalities progress and challenges. Lebanon.
Saghieh, N., & Saghieh, R. (2008). Legal assessment of housing, land and property ownership rights, transfers, and property law related to Palestinian refugees in Lebanon. Norwegian Refugee Council. Retrieved from https://goo.gl/FODgk2.
United Nations Relief and Works Agency. (2010). Building better, for less. Retrieved from http://goo.gl/RQOMbd.
Chapter Two: Poverty Profile of Palestine Refugees in Lebanon
Chapter Three: Education Access and Attainment of Palestine Refugees in Lebanon
Chapter Four: Access to Work and Decent Working Conditions for Palestine Refugees in Lebanon
Chapter Five: Population Health and Access to Services for Palestine Refugees in Lebanon
Chapter Six: Food Security of Palestine Refugees in Lebanon
Chapter Seven: Housing Quality and Access to Water, Sanitation and Hygiene (WASH) for Palestine Refugees in Lebanon
REFERENCES //232

Tatwir Center for Studies. (2015). Needs assessment of Palestinian refugees from Syria.
United Nations High Commissioner for Refugees. (2015). Vulnerability assessment of Syrian refugees in Lebanon.
United Nations Relief and Works Agency. (2015). Palestinian refugees from Syria statistics.
Central Administration of Statistics. (2012). Households budget survey. Retrieved January 31, 2016, from http://goo.gl/9CxsTv.
United Nations Development Programme. (n.d.). Multidimensional poverty index. Retrieved from http://goo.gl/AjVNTF.
United Nations Relief and Works Agency. (2015a). Palestinian refugees from Syria statistics.
United Nations Relief and Works Agency. (2015b). Profiling the vulnerability of Palestine refugees from Syria living in Lebanon. Retrieved from http://goo.gl/r5KeP3.
United Nations Relief and Works Agency. (2015c). Syria crisis response progress report. Retrieved from http://goo.gl/h5f0SV.
United Nations High Commissioner for Refugees. (2015). Syrian refugee and affected host population health access survey in Lebanon. Retrieved from https://goo.gl/1Q6ddH.
United Nations Relief and Works Agency. (n.d.). Palestine refugees from Syria vulnerability assessment report.
United Nations High Commissioner for Refugees. (2015). Vulnerability assessment of Syrian refugees in Lebanon.
Al-Khatib, I., Ju’ba, A., Kamal, N., Hamed, N., Hmeidan, N., & Massad, S. (2003). Impact of housing conditions on the health of the people at al-Ama’ri refugee camp in the West Bank of Palestine. International Journal of Environmental Health Research, 13(4), 315–326. http://doi.org/10.1080/09603120310001616092.
Habib, R., Basma, S., & Yeretzina, J. (2006). No TitleHarboring illnesses: On the association between disease and living conditions in a Palestinian refugee camp in Lebanon. Retrieved from http://goo.gl/DPpeQ7.
Lawrence, R. (2006). Housing and health: Beyond disciplinary confinement. Journal of Urban Health, 83(3), 540–549. http://doi.org/10.1007/s11524-006-9055-4.
United Nations High Commissioner for Refugees, United Nations Children’s Funds, & World Food Programme. (2015). Vulnerability assessment of Syrian refugees in Lebanon. Retrieved from http://goo.gl/7A2s1M.
Chapter Eight: Demographic Profile of Palestine Refugees from Syria Living in Lebanon
Chapter Nine: Poverty Profile of Palestine Refugees from Syria Living in Lebanon
233
Chapter Ten: Education Access and Attainment of Palestine Refugees from Syria Living in Lebanon
Chapter Thirteen: Food Security of Palestine Refugees from Syria
Chapter Twelve: Population Health and Access to Services for Palestine Refugees from Syria Living in Lebanon
Chapter Fourteen: Housing Quality and Access to Water, Sanitation and Hygiene (WASH) for Palestine Refugees from Syria Living in Lebanon

appendices
Appendix 1: The Arab Family Food Security Scale, questions and scoring of questions
Which of these sentences applies the most to the food eaten by your household during the past six months?
We had enough to eat of the kinds of food we wanted (0)
We had enough to eat but not always the kinds of food we wanted (1)
Sometimes we did not have enough to eat (1)
Often we did not have enough to eat (1)
In the last six months, was there a time when you were concerned that you would run out of food for your
household for the next month? (Yes(1)/No(0))
In the past year, has it ever happened that the food you bought was not enough and you didn’t have money to buy
more? (Yes(1)/No(0))
Were there any foods you feel your family did not eat enough of in the last six months? (Yes(1)/No(0))
In the past six months, did you or any other adult in your household ever cut the size of your meal because there was
not enough food? (Yes(1)/No(0))
In the past six months, did you or any other household members ever skip a meal because there was not enough
food? (Yes(1)/No(0))
In the past six months did you or any member in your household not eat for a whole day or go to bed hungry
because there was not enough food? (Yes(1)/No(0))
Coding: food secure 0-2, food insecure 3-5, severely food insecure 6-7
APPENDICES //234
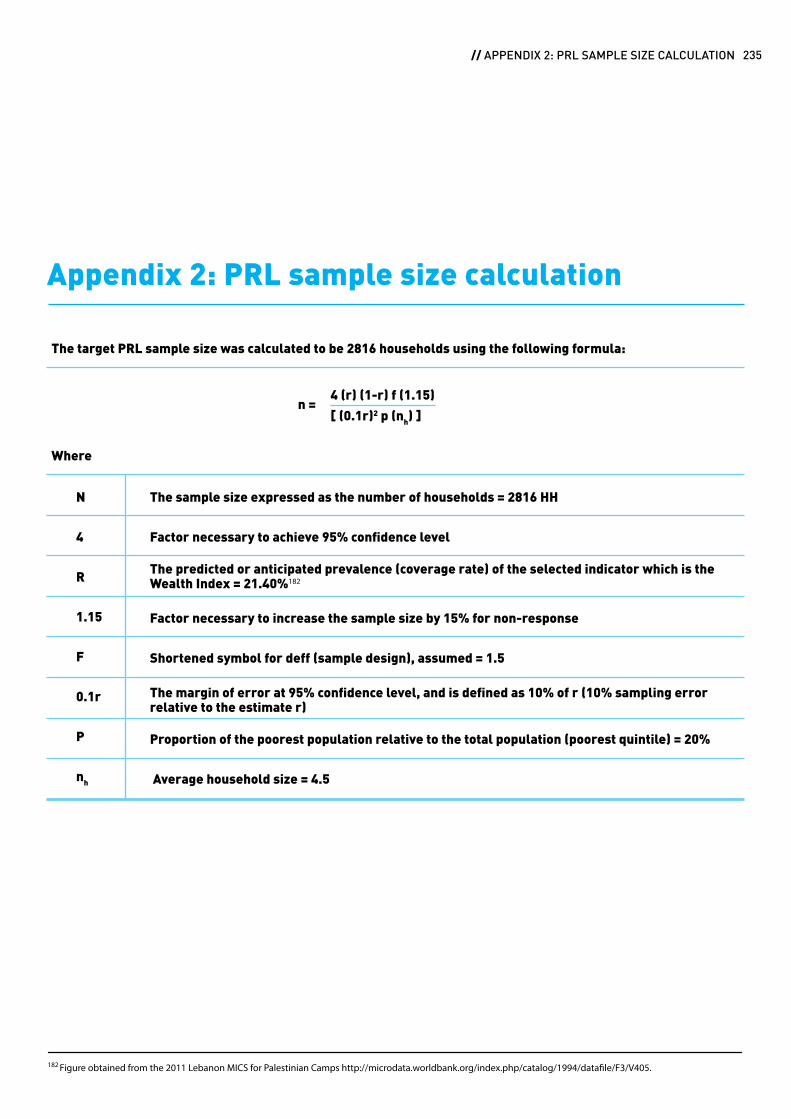
Appendix 2: PRL sample size calculation
The target PRL sample size was calculated to be 2816 households using the following formula:
Where
n =
N
4
R
1.15
F
0.1r
P
nh
The sample size expressed as the number of households = 2816 HH
Factor necessary to achieve 95% confidence level
The predicted or anticipated prevalence (coverage rate) of the selected indicator which is the Wealth Index = 21.40%182
Factor necessary to increase the sample size by 15% for non-response
Shortened symbol for deff (sample design), assumed = 1.5
The margin of error at 95% confidence level, and is defined as 10% of r (10% sampling error relative to the estimate r)
Proportion of the poorest population relative to the total population (poorest quintile) = 20%
Average household size = 4.5
4 (r) (1-r) f (1.15)
[ (0.1r)2 p (nh) ]
182 Figure obtained from the 2011 Lebanon MICS for Palestinian Camps http://microdata.worldbank.org/index.php/catalog/1994/datafile/F3/V405.
235 // APPENDIX 2: PRL SAMPLE SIZE CALCULATION
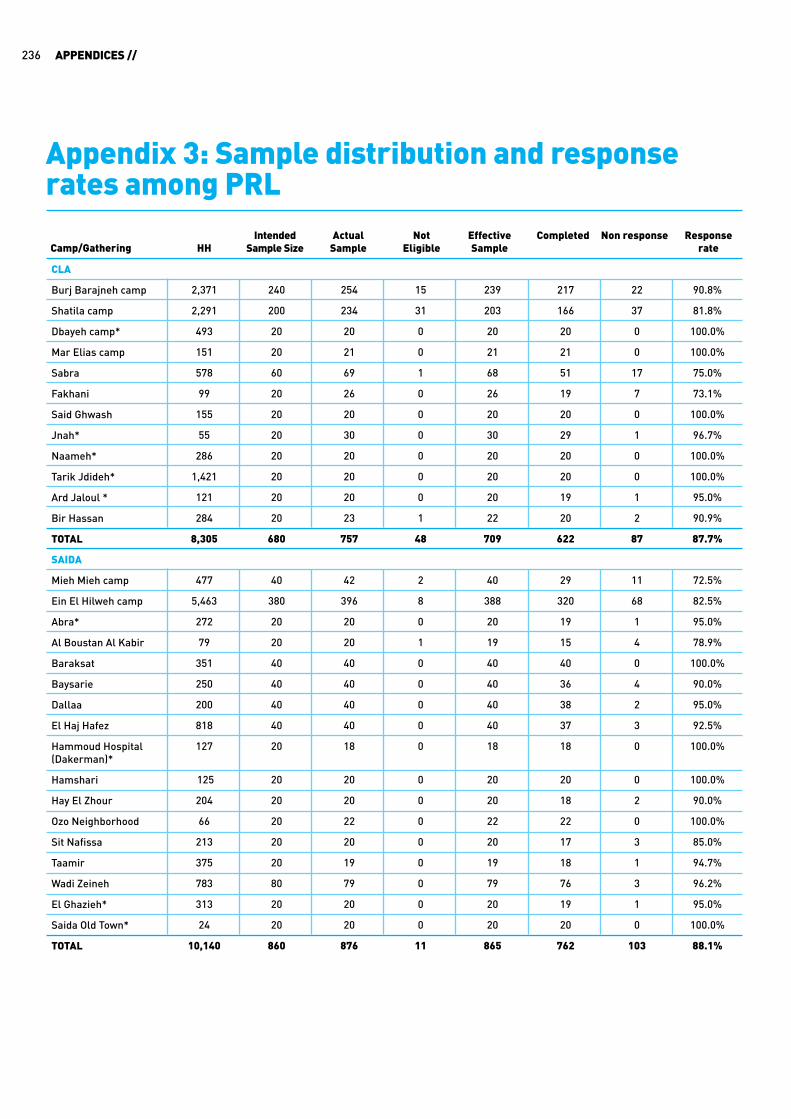
Appendix 3: Sample distribution and response rates among PRL
CLA
Burj Barajneh camp
Shatila camp
Dbayeh camp*
Mar Elias camp
Sabra
Fakhani
Said Ghwash
Jnah*
Naameh*
Tarik Jdideh*
Ard Jaloul *
Bir Hassan
TOTAL
SAIDA
Mieh Mieh camp
Ein El Hilweh camp
Abra*
Al Boustan Al Kabir
Baraksat
Baysarie
Dallaa
El Haj Hafez
Hammoud Hospital (Dakerman)*
Hamshari
Hay El Zhour
Ozo Neighborhood
Sit Nafissa
Taamir
Wadi Zeineh
El Ghazieh*
Saida Old Town*
TOTAL
2,371
2,291
493
151
578
99
155
55
286
1,421
121
284
8,305
477
5,463
272
79
351
250
200
818
127
125
204
66
213
375
783
313
24
10,140
240
200
20
20
60
20
20
20
20
20
20
20
680
40
380
20
20
40
40
40
40
20
20
20
20
20
20
80
20
20
860
254
234
20
21
69
26
20
30
20
20
20
23
757
42
396
20
20
40
40
40
40
18
20
20
22
20
19
79
20
20
876
15
31
0
0
1
0
0
0
0
0
0
1
48
2
8
0
1
0
0
0
0
0
0
0
0
0
0
0
0
0
11
239
203
20
21
68
26
20
30
20
20
20
22
709
40
388
20
19
40
40
40
40
18
20
20
22
20
19
79
20
20
865
217
166
20
21
51
19
20
29
20
20
19
20
622
29
320
19
15
40
36
38
37
18
20
18
22
17
18
76
19
20
762
22
37
0
0
17
7
0
1
0
0
1
2
87
11
68
1
4
0
4
2
3
0
0
2
0
3
1
3
1
0
103
90.8%
81.8%
100.0%
100.0%
75.0%
73.1%
100.0%
96.7%
100.0%
100.0%
95.0%
90.9%
87.7%
72.5%
82.5%
95.0%
78.9%
100.0%
90.0%
95.0%
92.5%
100.0%
100.0%
90.0%
100.0%
85.0%
94.7%
96.2%
95.0%
100.0%
88.1%
HHCamp/GatheringIntended
Sample SizeActual
SampleEffective Sample
NotEligible
Completed Non response Response rate
APPENDICES //236

TYRE
Burj Shemali Camp
El Buss Camp
Rashidieh Camp
Chabriha
Jal El Baher
Kfar Bada
Qasmiye
Masaken*
Maachouk*
TOTAL
BEQAA
Wavel Camp
Wavel Surroundings
Bar Elias
Jalala
Saadnayel
Taalabaya
Thakanat Goro
Der Zenoun
TOTAL
1,760
1,070
2,007
33
214
130
285
110
101
5,710
433
190
216
49
235
123
131
20
1,397
200
120
220
20
20
20
40
20
20
680
80
40
60
20
60
20
20
20
320
206
121
235
20
20
20
41
20
20
703
105
45
64
29
68
26
20
21
378
4
1
7
0
0
0
0
0
0
12
2
0
0
0
1
0
0
0
3
202
120
228
20
20
20
41
20
20
691
103
45
64
29
67
26
20
21
375
163
86
182
20
20
20
41
20
20
572
79
39
60
18
60
20
20
20
316
39
34
46
0
0
0
0
0
0
119
24
6
4
11
7
6
0
1
59
80.7%
71.7%
79.8%
100.0%
100.0%
100.0%
100.0%
100.0%
100.0%
82.8%
76.7%
86.7%
93.8%
62.1%
89.6%
76.9%
100.0%
95.2%
84.3%
HHCamp/GatheringIntended
Sample SizeActual
SampleEffective Sample
NotEligible
Completed Non response Response rate
NLA
Beddawi Camp
Nahr el-Bared Camp (and surroundings)
Jabal El Beddawi
Mankoubin
Zahriyeh*
El Mina*
TOTAL
OVERALL TOTAL
3,221
3,088
1,000
880
26
36
8,251
33,803
320
320
60
20
20
20
760
3,300
322
320
60
20
20
20
762
3,476
18
1
1
0
0
0
20
94
304
319
59
20
20
20
742
3,382
279
311
52
20
20
20
702
2,974
25
8
7
0
0
0
40
408
91.8%
97.5%
88.1%
100.0%
100.0%
100.0%
94.6%
87.9%
Notes:
* Areas that were not included originally and were oversampled
** Burj Barajneh village interviews (5) were added to Jnah
*** Double the originally intended sample size
237 // APPENDIX 3: SAMPLE DISTRIBUTION AND RESPONSE RATES AMONG PRL
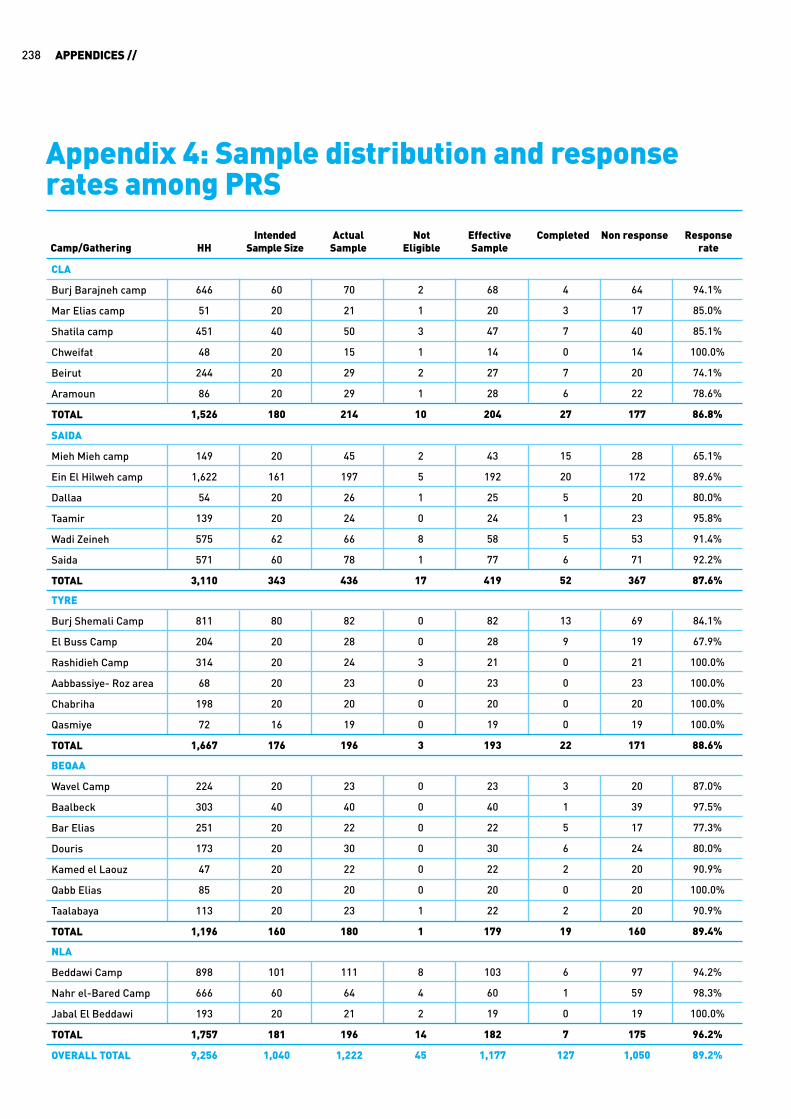
Appendix 4: Sample distribution and response rates among PRS
CLA
Burj Barajneh camp
Mar Elias camp
Shatila camp
Chweifat
Beirut
Aramoun
TOTAL
SAIDA
Mieh Mieh camp
Ein El Hilweh camp
Dallaa
Taamir
Wadi Zeineh
Saida
TOTAL
TYRE
Burj Shemali Camp
El Buss Camp
Rashidieh Camp
Aabbassiye- Roz area
Chabriha
Qasmiye
TOTAL
BEQAA
Wavel Camp
Baalbeck
Bar Elias
Douris
Kamed el Laouz
Qabb Elias
Taalabaya
TOTAL
NLA
Beddawi Camp
Nahr el-Bared Camp
Jabal El Beddawi
TOTAL
OVERALL TOTAL
646
51
451
48
244
86
1,526
149
1,622
54
139
575
571
3,110
811
204
314
68
198
72
1,667
224
303
251
173
47
85
113
1,196
898
666
193
1,757
9,256
60
20
40
20
20
20
180
20
161
20
20
62
60
343
80
20
20
20
20
16
176
20
40
20
20
20
20
20
160
101
60
20
181
1,040
70
21
50
15
29
29
214
45
197
26
24
66
78
436
82
28
24
23
20
19
196
23
40
22
30
22
20
23
180
111
64
21
196
1,222
2
1
3
1
2
1
10
2
5
1
0
8
1
17
0
0
3
0
0
0
3
0
0
0
0
0
0
1
1
8
4
2
14
45
68
20
47
14
27
28
204
43
192
25
24
58
77
419
82
28
21
23
20
19
193
23
40
22
30
22
20
22
179
103
60
19
182
1,177
4
3
7
0
7
6
27
15
20
5
1
5
6
52
13
9
0
0
0
0
22
3
1
5
6
2
0
2
19
6
1
0
7
127
64
17
40
14
20
22
177
28
172
20
23
53
71
367
69
19
21
23
20
19
171
20
39
17
24
20
20
20
160
97
59
19
175
1,050
94.1%
85.0%
85.1%
100.0%
74.1%
78.6%
86.8%
65.1%
89.6%
80.0%
95.8%
91.4%
92.2%
87.6%
84.1%
67.9%
100.0%
100.0%
100.0%
100.0%
88.6%
87.0%
97.5%
77.3%
80.0%
90.9%
100.0%
90.9%
89.4%
94.2%
98.3%
100.0%
96.2%
89.2%
HHCamp/GatheringIntended
Sample SizeActual
SampleEffective Sample
NotEligible
Completed Non response Response rate
APPENDICES //238

Appendix 5: Multidimensional Poverty Index calculationDimensions of the MPI
Education
Health
Living Standards
Given Equal Weight Of 1/3 Each
Poverty States (MPI Score)
0 – 0.2 deprived but not near-MPI poor
0.2 – 0.33 deprived & near-MPI poor
0.33 – 0.5 deprived & MPI poor
0.5+ deprived & severely MPI poor
Education
Measured based on: school enrollment and school attainment.
HH is considered to be deprived if:
1. At least one child of age between [school entering age +1] and [school entering age +8] is not enrolled in school.
2. No one in the household has 6 yrs or more education among those who are old enough to have achieved 6 yrs of education.
Weights: 1/2 on school enrollment & 1/2 on school attainment 1/2 x 1/3 = 1/6 each
Living Standards
HH is considered to be deprived if it is missing:
1. Access to improved drinking water sources
2. Access to improved sanitation
3. Heating
4. Walls
5. At least one asset that allows access to information (radio, TV, phone…) AND at least one asset that supports mobility (bike, car, cart, truck…) or livelihoods (refrigerator, land, livestock…)
Weights: 1/5 each 1/5 x 1/3 = 1/15 each
Health
Usually measured based on: child mortality & nutrition. However, since those indicators were not collected in our survey, they were substituted by a food security index. HH is considered to be deprived if it is categorized as severely food insecure.
Weight: 1/3
239 // APPENDIX 5: MULTIDIMENSIONAL POVERTY INDEX CALCULATION