IMAGING t t - Centro Ricerche Frascati — it · Quantificazione del contenuto di lipidi e...
117
TORINO 16 -19 Novembre 2013 IMAGING • • RELAZIONI A INVITO Tecniche avanzate di imaging in risonanza magnetica. M. Tosetti, Pisa Opportunità dell’imaging multimodale per la pianificazione di terapie. A. Torresin, Milano Imaging ottico di radionuclidi. A. Spinelli, Milano Le nuove frontiere: immagini da onde o da particelle? Phase contrast e photon counting. R. Longo - L. Rigon, Trieste
Transcript of IMAGING t t - Centro Ricerche Frascati — it · Quantificazione del contenuto di lipidi e...

TORINO 16-19 Novembre 2013
IMAGING ••
RELAZIONI A INVITOTecniche avanzate di imaging in risonanza magnetica. M. Tosetti, Pisa
Opportunità dell’imaging multimodale per la pianificazione di terapie. A. Torresin, Milano
Imaging ottico di radionuclidi. A. Spinelli, Milano
Le nuove frontiere: immagini da onde o da particelle? Phase contrast e photon counting. R. Longo - L. Rigon, Trieste

TORINO 16-19 Novembre 2013
IMAGING ••
RELAZIONI LIBEREInterconfronto in DWI. G. Belli, Arezzo
CAD per la detection automatica dei tumori prostatici sulla base dell’imaging RM multiparametrico. S. Mazzetti, Candiolo (TO)
Valutazione dei parametri fisici e del rapporto segnale rumore in bobine multi-array in parallel imaging: confronto tra sistemi in uso clinico. P. Berardi, Bologna
Disegno, costruzione e validazione di bobine a radio frequenza di superficie a 7T con tecnologia microstrip. M. Alecci, L’Aquila
Simulazioni Monte Carlo per l’ottimizzazione delle acquisizioni SPECT-CT nella SIRT di carcinomi epatici con microsfere di Y-90. G. Magro, Pavia
Verifica del posizionamento in trattamenti radioterapici della pelvi e del torace con un sistema a scansione laser. S. Pallotta, Firenze
Programma di qualificazione degli scanner PET dei trial clinici in Italia per studi onco-ematologici. S. Chauvie, Cuneo
Caratterizzazione delle variazioni strutturali indotte dalla radioterapia nelle parotidi attraverso analisi di tessitura. E. Scalco, Segrate (MI)
Caratterizzazione di un tomografo PET-TC per imaging con 64Cu. L. D’Ambrosio, Napoli
Valutazione in fantoccio di un algoritmo iterativo per ricostruzione di immagini TC. S. Guariglia, Verona
Implementazione di CR mammografici per ottimizzare la qualità dell’immagine in pazienti neonati. S. Maggi, Ancona
Sviluppo di un modello emodinamico per lo studio del ritorno venoso cerebrale: analisi di sensitività e confronto con i risultati sperimentali. G. Gadda, Ferrara
TORINO 16-19 Novembre 2013
IMAGING ••
POSTERRiproducibilità e stabilità del valore del SUV del fegato e del MBPS nel contesto della pratica clinica internazionale. F. Bergesio, Cuneo
Variazioni del protocollo di imaging PET nella pratica clinica internazionale per pazienti con linfoma. F. Bergesio, Cuneo
Un nuovo marker di aggressività per il carcinoma prostatico basato sulle immagini T2-pesate in risonanza magnetica. S. Mazzetti, Candiolo (TO)
Algoritmo per l’identificazione automatica del fegato in immagini PET. S Chauvie, Cuneo
Accuratezza della localizzazione per radiochirurgia stereotassica con TomoTherapy. S. Pallotta, Firenze
Computer Assisted Detection in neuroimmagini FLAIR e DT: segmentazione automatica e volumetria dei gliomi cerebrali. M. Donativi, Lecce
Validazione in fantoccio di un algoritmo a soglia adattativa per il contornamento di lesioni alla PET. L. Vigna, Novara
CR per mammografia: qualità dell’immagine e misure di dose per piastre ad aghi vs piastre tradizionali. C. Ghetti, Parma
Quantificazione del contenuto di lipidi e macromolecule per differenziare glioblastomi e metastasi: uno studio con risonanza magnetica a 3T. L. Orsingher, Parma/Roma
Confronto tra l’impiego di edge in tungsteno e rame per misure di DQE. S. Farnedi, Ravenna
Valutazione dell’incertezza del modello in funzione dei parametri di acquisizione nell’imaging del tensore di diffusione. A. Duggento, Roma
4DMPET: una tecnologia innovativa per PET con alta risoluzione e sensibilità, compatibile con la RM. F. Pennazio, Torino
L’importanza di utilizzare un fantoccio appropriato per i controlli di qualità relativi alle immagini di mammella su magneti a 3T. R. Padovani, Udine
Un metodo automatico di segmentazione delle immagini FDG-PET basato su processi di Dirichlet. C. Cavedon, Verona
Tumore gastrico: il ruolo della Diffusion Weighted Imaging nella stadiazione preoperatoria. R. Caivano, Rionero In Vulture (PZ)
Diffusion Weighted Imaging e Apparent Diffusion Coefficient nella risonanza magnetica 3T delle lesioni mammarie. R. Caivano, Rionero In Vulture (PZ)
Comparazione di metodi di analisi “Model Free” e “Model Based” in epilessia. M. Carnì, Roma
TORINO 16-19 Novembre 2013
IMAGING ••
POSTER
Immagini MRI ad alta risoluzione della regione ippocampale per la diagnosi precoce della malattia di Alzheimer. R. Longo, Trieste
Controlli di qualità su un sistema On Board Imager (OBI). D. Morelli, Catania
Interconfronto sulla valutazione del CNR in mammografia digitale, prove di misura del nuovo indice SDNR definito nel Supplemento alle Linee Guida Europee. E. M. L. Vaccara, Genova
Differenze nelle mappe di perfusione MR-DSC generate con differenti software commerciali. L. Orsingher, Parma/Roma
Segmentazione di volumi FDG-PET, tramite utilizzo del software PETVCARTM, per la definizione del biological target volume nei trattamenti radioterapici dei tumori del distretto testa-collo. D. Sardina, Catania
Standardizzazione robusta dei livelli di grigio in immagini cerebrali di risonanza magnetica. G. De Nunzio, Lecce
Precisione nella quantificazione del 2-idrossiglutarato per mezzo della 1H-MRS a 3 Tesla: uno studio su fantocci. F. Ghielmetti, Milano
Registrazione automatica di immagini prostatiche MR con contrasto e in diffusione. S. Mazzetti, Candiolo (TO)
Imaging quantitativo in 18F-FDG PET-CT con controllo del movimento respiratorio: impatto sulla stima del SUV nei tumori polmonari. E. Zivelonghi, Verona
Cone Beam Computed Tomography e Multi Slice Computed Tomography: confronto tra la qualità di immagine e la dose per un protocollo di studio dell’orecchio interno. L. Berta, Brescia/Milano
Verifica della registrazione di immagini tc-irm per la pianificazione del trattamento radioterapico con un fantoccio dedicato. S. Spampinato, Catania
Analisi delle immagini per il controllo di qualità in MSCT: software commerciale vs homemade. A. Sardo, Sanremo (IM)
Elastosonografia: tecniche e apparecchiature a confronto. A. Radice, Milano/Monza
Caratterizzazione di cristalli di scintillazione LuAP e LuYAP per imaging a raggi gamma. M. Bettiol, Roma
OFFSET: tracciatore di grande area basato su fibre scintillanti. C. Pugliatti, Catania
Un approccio con reti neurali artificiali all’analisi del task fMRI di rivalità binoculare. F. Ghielmetti, Milano
Caratterizzazione corticale e sottocorticale di metriche “diffusional kurtosis imaging” nel cervello umano. S. Lanzafame, Roma
Un approccio semi-automatico per la valutazione dell’NPV nei trattamenti MRgFUS dei fibromi uterini. G. Russo, Cefalù (PA)
TORINO 16-19 Novembre 2013
IMAGING ••
POSTER
Confronto tra diversi flussimetri per la calibrazione di un sistema Echo-Doppler con Blood Mimicking Fluid (BMF); test delle capacità di simulazione della vena giugulare interna del fantoccio Blue Phantom Training Model BPIJ500. K. Denanyoh, Ferrara
Mammografia a contrasto di fase: studi su fantocci. P. Russo, Napoli
Monitoraggio PET in terapia con protoni: confronto tra dati sperimentali acquisiti presso CATANA e simulazioni Monte Carlo. S. Ferretti, Pisa
Uno studio quantitativo sulle caratteristiche del rivelatore PICASSO per imaging in contrasto di fase con radiazione di sincrotrone. M. Longo, Roma
Valutazione di un metodo di registrazione di immagini per la deformazione delle mappe di dose in protonterapia. E. Scalco, Segrate (MI)
Un nuovo approccio metodologico per migliorare la sicurezza, qualità e riproducibilità durante studi contemporanei di EEG/fMRI: uno studio di fattibilità. P. Ferrari, Trento
Ricostruzione di dati pCT con FBP: i risultati preliminari della collaborazione PRIMA. M. Bucciolini, Firenze
Imaging di risonanza magnetica nucleare permette di valutare l’idratazione della pelle in modello ex vivo. M. Alecci, L’Aquila
Verso un metodo per ottenere immagini pesate in cellularità da immagini in intensità di segnale in T2 normalizzate e in coefficiente di diffusione apparente: descrizione del metodo ed esempi. M. Muti, Terni
Un setup compatto per migliorare la qualità di dati simultanei EEG-fMRI. P. Ferrari, Trento
Studio del software di simulazione BreastSimulator per la tomografia al seno. P. Russo, Napoli
Corso di Aggiornamento: Tecniche avanzate di imaging in Risonanza Magnetica Michela Tosetti1 (1) Laboratorio di Fisica Medica e Risonanza Magnetica - IRCCS Fondazione Stella Maris - Pisa
Con le attuali apparecchiature di Risonanza Magnetica (RM) dotate di elementi hardware opportuni (gradienti ad elevata intensità e amplificatori RF a banda larga) sono possibili studi sofisticati in vivo della struttura anatomo-funzionale del cervello umano. E’ infatti possibile ottenere informazioni sia “strutturali” tramite l’uso di sequenze speciali e di tecniche di elaborazione delle immagini in fase di post-processing, sia “ultrastrutturali”, ossia non direttamente dipendente dalla struttura anatomica dell’encefalo ma generato da peculiari caratteristiche dell’ attività cellulare del Sistema Nervoso Centrale. Le tecniche avanzate in risonanza magnetica consentono di effettuare misure su scale microscopiche misurando effetti non solo ascrivibili in termini classici alle misure dirette dei tempi di rilassamento, ma anche legate a meccanismi piu’ complessi di interazione biochimica e biofisica delle cellule stesse: lo studio della distribuzione energetica dei livelli di spin nucleare, che consente di misurare la concentrazione e la distribuzione spaziale di complessi metabolici (Spettroscopia Multinucleare, MRS); lo studio della dinamica del flusso capillare tramite la tecnica di Arterial Spin Labelling, che consente di ottenere misure non invasive di perfusione tissutale (PWI) e prima ottenibile solo con tecniche nucleari (PET, SPECT); lo studio del moto browniano delle molecole di acqua nei tessuti ad architettura cellulare tridimensionale attraverso la caratterizzazione del Tensore di Diffusione (DTI); ed infine lo studio delle perturbazioni di suscettività magnetica legate a risposte emodinamiche che in sede cerebrale corrispondono alle aree di attivazione funzionale neuronale (fMRI). Gli elevati livelli di risoluzione sia spaziale che temporale ottenibili e l’assenza di radiazioni ionizzanti e di agenti contrastografici costituiscono ulteriori punti di forza specifici delle metodiche funzionali in RM, rispetto ad altre metodi neurofunzionali ed hanno notevolmente aumentato il potere diagnostico della MRI nella pratica clinica.
Spettroscopia Multinucleare La spettroscopia con tecnica di Risonanza Magnetica (MRS) è una tecnica di studio già in applicazione clinica che consente di ottenere informazioni metaboliche e istologiche ultrastrutturali del tessuto in esame in vivo e/o in vitro. Le prime applicazioni medico-biologiche risalgono agli anni '70 e venne in principio applicata allo studio dei liquidi biologici. Nell'ultimo decennio si è assistito ad un progressivo utilizzo della MRS in vivo in ambito clinico, grazie allo sviluppo di software che implementano le comuni apparecchiature RM cliniche e che consentono di acquisire uno spettro in tempi contenuti. Il principio chimico-fisico su cui si basa la metodica è denominato "chemical-shift" e consiste nella constatazione che una determinata specie chimica presenta diverse frequenze di risonanza in rapporto all'ambiente molecolare a cui è chimicamente legato. In altri termini, differenti molecole chimiche possono essere rilevate e distinte in base alle loro diverse frequenze di risonanza. In ambito clinico i nuclei usualmente esaminati sono l'idrogeno (1H) e il fosforo (31P) perché presentano un range di chemical-shift a campi magnetici clinici sufficientemente ampio e perché sono naturalmente abbondanti. La 1H MRS rappresenta ad oggi la metodica usualmente utilizzata a scopo clinico perché permette di ottenere spettri ad alta risoluzione da piccoli volumi di interesse e consente di individuare numerosi metaboliti cerebrali con diverso significato biochimico, e variabili secondo i parametri di acquisizione (TR, TE) e il tipo di sequenza di impulsi utilizzati (STEAM, PRESS). La spettroscopia fosforica (31P MRS) é una tecnica di risonanza magnetica, con la quale è possibile implementare sistemi RM ad uso clinico, dotando l’apparecchiatura di hardware (amplificatori, pre-amplificatori, generatori di impulsi RF a frequenza opportuno, bobine) e software opportuni. Essa permette di studiare il metabolismo energetico “in vivo” dei muscoli e del cervello. Rispetto alla spettroscopia protonica quella al fosforo è caratterizzata da una bassa sensitività (a causa del basso rapporto giromagnetico della specie chimica) e da una bassa concentrazione naturale per cui i volumi del tessuto presentano un bassa risoluzione spaziale.
La sensibilità di rivelazione, e quindi la specificita’ dell’indagine, delle tecniche di spettroscopia puo’ essere implementata attraverso l’utilizzo tecniche di editing del segnale e di disaccoppiamento etero-nucleare, ottenibili attraverso generatori di opportuni impulsi RF e la programmazione di nuove sequenze di acquisizione.
Studi Di Perfusione Cerebrale in Risonanza Magnetica La misura in vivo dell'emodinamica regionale cerebrale ha enormi potenzialità cliniche, dal momento che esiste una stretta relazione tra funzionalità fisiologica, metabolismo e apporto locale di sangue. In generale, per valutare un flusso in risonanza magnetica, si registra nel tempo la risposta del sistema a un tracciante intravascolare che può essere sia esogeno che endogeno. Nel primo caso si utilizza un mezzo di contrasto paramagnetico, come i chelati di Gadolinio (GdDTPA2), e, applicando modelli matematici sperimentali sulle proprietà del trasporto del sangue e sui meccanismi di scambio con il tessuto, si risale alla misura dei parametri emodinamici, quali il flusso cerebrale di sangue (CBF), il Volume Ematico (CBV) ed il Tempo di Transito Medio (MTT) (tecnica denominata Dynamic Susceptibility Contrast Magnetic Resonance Imaging (DSC-MRI)). Un metodo alternativo consiste nell'usare come tracciante endogeno le molecole di H2O presenti nel sangue, marcando con opportuni impulsi a radiofrequenza pacchetti di spin protonici e studiandone la dinamica successiva. Analogamente alla SPECT e alla PET, tale tecnica misura specificamente il parametro CBF, ma non fornisce misure di CBV e di MTT. D’altra parte essa ha il vantaggio di non utilizzare alcun tipo di contrasto, è assolutamente non-invasiva, e quindi è riproducibile e ripetibile nel corso dello stesso studio (tecnica denominata Arterial Spin Labeling Perfusion Imaging (ASL-PI)). Lo studio della perfusione, con entrambe le tecniche, richiede alta risoluzione temporale quindi l’utilizzo di sequenze EPI, gradient-echo (GE) o spin-scho (SE). Grazie alla sua peculiare caratteristica di assoluta non invasività, la tecnica ASL risulta facilmente applicabile anche nei bambini.
Imaging del Tensore di Diffusione I tessuti umani riescono a sopravvivere solo entro uno stretto intervallo di temperature in cui la maggior parte dei componenti dei tessuti è allo stato liquido. Come conseguenza, la diffusione dell'acqua gioca un ruolo fondamentale nei processi di trasporto degli enzimi, dei substrati metabolici e dei metaboliti. Inoltre, i tessuti mostrano a livello microscopico una struttura altamente disomogenea; infatti le membrane cellulari e i vari organelli ostacolano il movimento libero dell'acqua e di altre molecole. Pertanto la misura della mobilità dell'acqua può risultare un valido strumento per descrivere la struttura dei tessuti su scale microscopica, ben oltre la capacità di risoluzione delle usuali metodiche di imaging. L' imaging pesato in diffusione (DWI) e l'imaging del tensore di diffusione (DTI) sono tecniche di Risonanza Magnetica, sensibili alle proprietà diffusive delle molecole d'acqua e si presentano come importanti strumenti per la diagnosi anche nella pratica clinica. Queste metodiche permettono di ottenere immagini in cui l'intensità del segnale è legata al movimento casuale delle molecole d'acqua, grazie all'inclusione nella sequenza di intensi impulsi di gradiente di campo magnetico, applicati prima e dopo un impulso a radiofrequenza di 180°. Il risultato è una diminuzione del segnale, che può essere ricondotto al coefficiente di diffusione D. La mappa della variazione dell'intensità del segnale (DWI) può fornire utili informazioni solo sulla diffusione lungo la direzione nella quale è stato applicato il gradiente di campo magnetico. In molti tessuti, come nella sostanza bianca cerebrale, la diffusione è anisotropa, ovvero la mobilità dell'acqua dipende dalla direzione, essendo questo un processo tridimensionale, e pertanto si descrive tramite un tensore (D), che si esprime analiticamente attraverso una matrice simmetrica 3x3. È possibile determinare i sei elementi indipendenti del tensore di diffusione con l'acquisizione di almeno sei immagini pesate in diffusione acquisite lungo direzioni non collineari e di un'immagine di riferimento non pesata in diffusione. La diagonalizzazione del tensore permette di individuare gli autovettori e gli autovalori che rappresentano rispettivamente le principali direzioni di diffusione e gli associati valori di diffusività delle molecole d'acqua. Dai dati DTI si possono estrarre mappe quantitative dei tessuti relative a due quantità scalari, come la Diffusività Media (DM) e un indice dell' anisostropia della diffusione (Anisotropia Frazionaria, FA). La Diffusività Media e l'Anisotropia Frazionaria sono quantità invarianti sotto rotazione e pertanto consentono un misura della diffusività,
indipendentemente dall'orientazione. I dati DTI possono inoltre essere usati per la mappatura tridimensionale delle fibre di sostanza bianca (Fiber Tracking). Basandosi sul principio generale che l'acqua cerebrale diffonde preferibilmente lungo la direzione delle fibre della sostanza bianca, è possible tracciare computazionalmemente i fasci di fibre con una sequenza del tensore di diffusione ottimizzata. Il punto di partenza è un modello statistico per la distribuzione delle direzioni privilegiate per la diffusione dell'acqua nel cervello che si basa su un'analisi voxel-by-voxel e fornisce in uscita l'orientamento dei fasci di sostanza bianca e la loro traiettoria. Il modello di campo di direzione assume una distribuzione gaussiana ellissoidale e usa un unico vettore per ogni voxel. L'informazione che ne risulta può essere utilizzata in molte applicazioni, come il planning pre-chirurgico (per la localizzazione accurata dei fasci di material bianca), lo studio delle alterazioni dei fasci in casi di anomalie neuro-cognitive e malattie neuro-psichiatriche, o lo studio e la visualizzazione in genere dei collegamenti funzionali tra diverse aree cerebrali. Le attuali limitazioni nella strumentazione MRI a campo magnetico clinico pongono dei limiti nella risoluzione spaziale delle acquisizioni DTI dell'ordine del millimetro. Poichè il segnale rivelato media l'informazione all'interno del singolo elemento di volume indagato (voxel), la tecnica DTI risulta inadeguata alla risoluzione di fasci di fibre in situazioni di eterogeneità all'interno di uno stesso voxel, ovvero in presenza di fasci con diversi orientamenti (fiber crossing, benching, kissing). Il modello adottato dalla tecnica DTI rappresenta infatti un modello deterministico macroscopico semplificato non in grado di rappresentare strutture microscopiche più complesse interne allo stesso voxel. Al fine di superare i limiti imposti dal modello tensoriale per la ricostruzione della funzione di diffusione è possibile utilizzare nuove tecniche di ricostruzione che determinano la diffusione attraverso funzioni probabilistiche. Queste tecniche di ricostruzione non tensoriale (Diffusion Spectrum Imaging, DSI), note anche come tecniche HARDI (High Angular Resolution Diffusion Imaging), necessitano di acquisizioni lungo un numero elevato di direzioni di gradiente e di alti b-value e consentono il calcolo di matrici di connettività strutturale e funzionale. La Risonanza Magnetica ad Ultra Alto campo L’esplorazione strutturale e funzionale dell’organismo mediante Risonanza Magnetica offre a oggi vantaggi indiscutibili, sia per la varietà di parametri fisiologici che possono essere osservati, sia per la sua non-invasività e sicurezza. Gli avanzamenti della metodica sono intrinsicamente legati alla sua sensitività che in NMR trova il fondamento nella polarizzazione che si crea nel mezzo investigato quando immerso in un campo magnetico. Per questo se ormai nella pratica clinica le apparecchiature ad alto campo si stanno sempre di più diffondendo (3 Tesla (T)), negli ultimi anni sono stati raggiunti valori sempre più elevati di campo magnetico per applicazioni di ricerca in vivo nell’uomo (da 4T a 7T fino a 9 T e 11.7 T). I primi sistemi a campo magneti elevati (4 T) sono stati realizzati alla fine degli anni ’80 da quasi tutti i costruttori di sistemi RM. Nel 1998, il primo sistema da 8 T per applicazioni nell’uomo è stato installato all’Ohio State University, seguito nel 1999 dalla prima installazione di un 7 T presso il Centro di Ricerche in Risonanza Magnetica dell’Università del Minnesota. Entrambi questi sistemi erano assolutamente sperimentali, assemblati con considerevoli sforzi e impegno da parte di laboratori di ricerca e con componenti costruiti in loco. A oggi sono circa 38 i sistemi con campo magnetico ≥ 7 T installati nel mondo e questo numero continua a crescere. La ricerca in questo settore é tesa al miglioramento della qualità delle immagini e del valore diagnostico della RM per immagini, elementi che sono determinati principalmente dalla risoluzione spaziale, dal rapporto segnale/rumore e dal contrasto fra i tessuti. Queste tre grandezze sono fra loro inter-dipendenti e, per la legge fisica alla base del principio della NMR, dipendono dal campo magnetico applicato. L’elemento fondamentale attraverso il quale l’uso di un apparecchio a campo elevato ha effetti rivoluzionari sulla ricerca prodotta consiste infatti nel grande aumento del segnale, che cresce con l’aumentare del campo magnetico. Ne consegue un forte potenziamento di tutti i parametri fisici legati all’informazione RM, come la risoluzione spaziale delle immagini, la sensibilità alle modificazioni della composizione tissutale o alla variazione di parametri fisiologici, la risoluzione temporale di fenomeni dinamici o la risoluzione spettrale del segnale. Sebbene l’utilizzazione di campi magnetici di intensità molto elevata produca notevoli vantaggi legati all' aumento del segnale RM, la complessità legate all'interazione radiazione materia, le disomogeneita' del campo magnetico,

la variazione dei tempi di rilassamento longitudinale e trasversale, la sensibilità al rumore fisiologico rendono complesso ed a volte impossibile l'ottenimento di alcuni dei risultati ottenuti a campi magnetici clinici e la semeiotica di imaging necessita di nuove strategie di acquisizione ed elaborazione del segnale. Ma grazie a nuovi sorgenti di contrasto possibili solo a campi ultra alti e a nuove tecniche di acquisizione è possibile ottenere in vivo la “microscopia” in risonanza magnetica, potendo raggiungere risoluzione spaziali di ordine sub-millimetrico. Grazie infatti all'utilizzo di nuovi contrasti legati alla fase del segnale si rendono visibili e separabili negli effetti le strutture elementari dell’organizzazione del sistema nervoso centrale e gli elementi costituenti della sua organizzazione funzionale. Avere la possibilità di dissociare i singoli strati corticali e le singole colonne neuronali durante l’analisi strutturale e funzionale può aprire la possibilità di indirizzare allo studio di singole colonne le analisi funzionali e metaboliche, così come avviene attualmente negli studi sui primati. Nell’utilizzo di Tomografi RM ad ultra-alto campo nell’uomo è necessario tenere in considerazione una serie di problematiche relative alla gestione del campo magnetico statico e dei campi elettromagnetici. Per il campo magnetico statico B0, la Food and Drug Administration ha da tempo approvato l'applicazione all'uomo di campi magnetici fino a 8T (Guidance for Industry and FDA Staff: Criteria for Significant Risk Investigations of Magnetic Resonance. Diagnostic Devices, July 14th, 2003). Studi effettuati nei diversi centri (attivi fin dal 1997) non hanno evidenziato nessun tipo di effetto sull’uomo. Per quanto riguarda le onde elettromagnetiche l’utilizzo di campi ultra elevati ha aperto nuove sfide tecnologiche in particolare legate alle disomogeneita’ del campo B1 e del SAR dovuti alle particolari interazione radiazione-materia per queste specifiche lunghezze di radiazione. La non-uniformita’ del campo B1 necessita di nuove strategie tecnologiche sia nella ricezione che nella trasmissione del segnale e tecniche avanzate di shimming RF. Nessun effetto biologico o fisiologico, ampiamente studiati e monitorati in questo decennio, è stato comunque rilevato. References: [1] Magnetic Resonance Imaging: Physical Principles and Sequence Design. E.M Haacke, R W. Brown, M.R. Thompson, R. Venkatesan. Ed Wiley-Liss, 1999. [2] In Vivo NMR Spectroscopy: Principles and Techniques. Robin A. de Graaf. Ed. John Wiley & Sons, 2013. [3]Quantitative MRI of the Brain: Measuring Changes Caused by Disease. Paul Tofts. Ed. John Wiley and Sons, 2003. [4] Ultra High Field Magnetic Resonance Imaging. Pierre-Marie Robitaille, Lawrence Berliner. Ed. Springer, 2007.
Opportunità dell'imaging multimodale per la pianificazione di terapie Opportunities for therapy planning by multimodal images A. Torresin 1
(1) A.O. Niguarda Ca’ Granda, Struttura Complessa di Fisica Sanitaria, Milano This paper provides an overview of images used for computer-aided radiotherapy and surgery planning; for examples, it will be discussed some aspect of image application in Oncology and Radiotherapy, Neurosurgery, General Surgery, Orthopedics, Cardiology. All the processes (data acquisition, post processing, planning, display and storage) will be analyzed with critical approach. In Oncology and Radiotherapy the imaging plays a crucial role in characterization and pretreatment planning of incidentally detected or suspected masses. Knowledge of differential diagnosis, imaging features, management trends and image algorithmic approach to define the different lesions and target definition is important for optimal clinical management and multi-modality approach in the diagnosis of a specific tumor. Modern three-dimensional radiotherapy treatment planning of cancer demands uses volumetric image data sets to design the conformal therapy of tumors, and conformal avoidance of the proximal, dose limiting, organs at risk. High precision conformal radiotherapy planning requires sophisticated imaging modalities usable for their specific information for target definition. Magnetic Resonance Imaging (MRI) has therefore become an important imaging modality in radiotherapy planning, complementing the use of Computed Tomography (CT) and introducing several additional benefits. The interest of Positron Emission Tomography (PET) complementary information for the delineation of the target volume in radiotherapy is increasing. However, respiratory motion requires the determination of a functional internal target volume on PET images for which several strategies have been proposed; in general magnitudes and variability of motion of various structures and organs, and how the motion affects images by producing artifacts and blurring should be studied using complementary images techniques. Planning approaches need multimodal images, correct methods for the automatic images segmentation used for radiotherapy treatment planning and image registration experience; finally the capability to quantify the global accuracy and precision of the process should be evaluated. In Neurosurgery contemporary imaging modalities can now provide the surgeon with high quality three- and four-dimensional images depicting not only normal anatomy and pathology, but also vascularity and function. Preoperative simulation employing 3D computer graphics (interactive computer graphics) to fuse all imaging data now is necessary, and follows the state of the art; MRI, C-arm cone-beam CT (CBCT), functional MRI (fMRI), Diffusion Tensor Imaging (DTI) must be fused in the same reference system. Normalized mutual information method and deformable image registration technique applied to preoperative imaging are fused and then reconstructed by a hybrid method combining surface rendering and volume rendering methods. Intraoperative imaging is increasingly being used in brain pathologies supported by neuronavigation approach; neuronavigation is the set of computer-assisted technologies used by neurosurgeons to guide or "navigate” within the confines of the skull or vertebral column during surgery; multimodal images are the base for this surgical planning. The time required for reconstruction of 3D images for planning depends on computer graphics capabilities and Medical Physics Expert activities should support proposal for planning optimization and reduction of processing time.

In Orthopedics the application of advanced 3D visualization techniques to determine the optimal implant design and position in hip joint replacement planning will be discussed briefly. Planning method combines volume rendering and projection X-Ray methods. Very important is to evaluate the accuracy of preoperative planning and the navigation system. CBCT can provide intraoperative 3D imaging capability for surgical guidance, but workflow and radiation dose are the significant barriers to broad utilization. One main reason is that each 3D image acquisition requires a complete scan with a full radiation dose to present a completely new 3D image every time. In Surgery some liver analysis will be discussed able to support the surgeon for hepatic surgery planning in estimating liver volumes and better vessel visibility. Multimodal rigid and deformable registration technique should be applied to compare different images or automatic image analysis able to quantify the liver anatomical structure. New approach for planning are coming now: for examples hybrid tracers that are both radioactive and fluorescent help extend the use of fluorescence-guided surgery to deeper structures. Such hybrid tracers facilitate preoperative surgical planning using (3D) scintigraphic images and enable synchronous intraoperative radio- and fluorescence guidance. All the new planning approach in therapy should be evaluated and the critical aspects need to be analyzed. The role of the Medical Physics Expert will be discussed in more detail during the presentation; he has the ability - to verify the technology used; - to support and verify image acquisition and patient set up; - to evaluate the patient dose and risks for image acquisition; - to verify the image post processing methods and to evaluate the accuracy and precision; - to discuss the infrastructure required for successful implementation of therapy planning; - to support the medical staff for education and training; - to analyze medical data; - to develop ad support new methods able to follow new application of planning.

Optical imaging of radionuclides
A. E. Spinelli1, F. Boschi
2
(1) Medical Physics Department and Center for Experimental Imaging, San Raffaele Scientific Institute, Milan
(2) Department of Neurological, Neuropsychological, Morphological and Motor Sciences, University of Verona
1. Introduction
In the past three years there has been a rapid and growing interest in using small animal optical imaging systems to
image in vitro and in vivo several radiopharmaceuticals1. Such interest can be understood by considering the
scientific and practical advantages of this novel imaging approach as will be discussed in this contribution. Most of
the early papers focused on the detection of Cerenkov radiation (CR) induced by both beta plus and beta minus
particles as they travel into a biological tissue with a velocity greater than the speed of light in the medium. This
condition is satisfied by a plethora of beta emitters normally used in nuclear medicine departments for both
imaging and for therapeutic applications. This partially explains the great interest in this novel pre-clinical imaging
tool.
In this paper attention will be given not only to present an overview of the literature but also to provide also a short
historical prospective regarding the contribution of the different authors.
2. Historic overview
2.1 The discovery of Cerenkov Radiation
In 1932 Pavel Alekseyevich Cerenkov began his PhD under the supervision of Ivanovich Vavilov in Saint
Petersburg on a project entitled: “Luminescence of uranyl salts solutions under the action of gamma rays2”.
At that time of course there were not photomultiplier tubes or charge coupled device (CCD) detectors and
Cerenkov used to sit the darkness for 1 hour before beginning any measurements since the detectors were his eyes.
He performed experiments by irradiating several pure liquids (distilled water, glycerine etc.) with gamma rays from
a radium source and founds that the emitted light was polarized, the intensity was approximately the same despite
changes in concentration, temperature, and liquid viscosity3,4
. He also found no intensity reduction by adding
different quenching agents. Based on these evidences Cerenkov and his supervisor realised that the light was not
fluorescence but a new phenomenon. Vavilov then sent Cerenkov’s results to Frank and Tamm and in 1937 they
provide a theoretical treatment based on classical electrodynamics.
2.2 Development of in vivo Cerenkov luminescence imaging
Robertson and colleagues5 and our group
6 were working independently and almost at the same time on the
development of in vivo Cerenkov luminescence imaging (CLI) using beta plus emitters and small animal optical
imaging systems.
As mentioned in the introduction, CLI is based on the detection of CR due to the beta particles travelling in the
tissues with energy greater than the Cerenkov threshold. For a beta particle in water7 the energy threshold such that
>1/n is only 260 keV and, thus, most of the isotopes used in nuclear medicine satisfy this condition. In order to
investigate the possibility of detecting in vivo CR both ref. 5 and 6 used a small animal optical imaging system
composed by a back-thinned, back-illuminated CCD camera, several filters and lens. The instrument was used in
bioluminescence mode and, thus, without using any excitation lamp.
2.3 Validation of CLI
Shortly after the first papers on CLI two excellent papers8,9
validated and expanded the findings of ref 5 and 6 by
investigating the Cerenkov light emission of several beta emitters. In ref 8 Liu and colleagues it has been studied
both β+ emitters like
18F and
64Cu and β
− emitters as
131I,
90Y, and
177Lu. In ref. 9 the authors investigated the
Cerenkov light emission of 18
F, 64
Cu, 124
I, 131
I and 89
Zr. All the measurements with these radioisotopes confirmed
that radioisotopes with higher end point energy emit a greater number of Cerenkov photons.
Liu and colleagues also performed a series of in vivo imaging experiment using different radiopharmaceuticals.
More precisely the authors had shown a micro-PET and CLI images comparison of [18
F]FDG uptake in a
xenografts mice model of glioma and bone uptake of [18
F]Na. They also presented an example of thyroid CLI using
[131
I]Na and [90
Y]RGD-BBN in nude mice bearing a PC3 tumor.
In Ruggero et al9 the authors performed a comparison between PET and CLI for the localization of [
89Zr]DFO-J591
using a xenograft mice model of human LNCaP tumors. Both groups found a good agreement between PET and
CLI, this was further confirmed also with ex vivo CLI images of the different animal organs.
Our group10
did as well a comparison between micro-PET and CLI using an experimental model of mammary
carcinoma (BB1). The tumours were obtained by subcutaneous injection of BB1 cells, which are epithelial cells,
from spontaneous mammary carcinomas of transgenic mice for HER-2/neuT oncogene.
3. Three dimensional Cerenkov imaging
3.1 Source depth estimation using planar images
Light absorption is greater at smaller wavelengths with respect to longer wavelengths, and, the differences of light
absorption can be used to estimate the sources depth inside the mouse using a single view system. This method,
called multispectral approach, can be applied in the case of CR because of the wide light spectrum ranging from
500 to 700 nm
We showed that the source depth can be obtained by fitting a slab model describing the propagation of light, or by
including the 1/2 spectral distribution of the Cerenkov emission
6, 10. In order to determine the errors in recovering
the source depth a small capillary source was placed at known depths inside slices of chicken breast. The position
of the capillary was then compared with the depth derived using both methods. The maximum difference between
the known and estimated depths was less than 23%. In an in vivo example we applied these two approaches to
estimate the heart depth of a mouse injected with [18
F]FDG. The two models give a source depth d respectively
equal to 1 mm and 1.6 mm with an uncertainty δd/d approximately equal to 25%. By using anatomical data
obtained with magnetic resonance images (MRI) we found that the upper part of the myocardium that emits of the
greatest part of the Cerenkov light is located about 1.5 mm under the surface of the animals. These results
suggested that by including the spectral distribution of the CR it is possible to obtain a better estimate of the
Cerenkov source depth.
3.2 Tomographic reconstruction of Cerenkov images
The source depth estimation methods described in the previous section are region of interest (ROI) methods and,
thus, they does not allow to obtain a 3D image of the Cerenkov source. In order to obtained a 3D CLI Li and
colleagues11
acquired projections of the animal by using two mirrors placed on each side of the mouse, their image
reconstruction approach was based on a finite element method for forward modelling. More precisely they acquired
images over one bandpass between 695-770 nm and image reconstruction inverse problem is treated using a pre-
conditioned conjugate gradient method.
Hu and co-authors proposed a tomographic approach where multiple views of the animal using a rotation stage
were acquired through a single bandpass 675-775 nm filter12
. The methods introduced by Liu et al and Hu et al can
be considered bioluminescence tomography approaches applied to Cerenkov sources. More precisely they did not
include in the reconstruction algorithms the peculiar 1/2 spectral distribution typical of the Cerenkov radiation.
The other practical disadvantages of such methods is that dedicated optical imaging systems need to be developed
in order to include the rotation step or a set of mirrors to obtain different views of the animal.
To overcome these two problems we investigated a multispectral 3D approach called multi spectral Cerenkov
luminescence tomography13
(msCLT). The msCLT approach offers depth resolution and localization without
requiring multiple views of the animal, and, thus in can be applied to the commercially available small animal
optical imaging systems. More precisely the msCLT method is based on a set of 2D planar images acquired using a
series of narrow bandpass filters centered on wavelengths 20 nm apart, and the distinctive information content at
each wavelength is used in the 3D image reconstruction process. The msCLT approach has been tested by using ex
vivo tissue phantom and by injecting nude mice with [32
P]ATP. The results obtained with phantom data showed
that for a line source placed 6 mm below the surface the spatial resolution is 1.5 mm, this is an encouraging result
considering that we are dealing with an optical imaging method.
4. Radio luminescence imaging
4.1 Light detection using alpha emitters
In Ruggero et al9
it has been reported the detection of an intense light emission when using an alpha emitter like 225
Ac. In this case given the mass of the alpha particles the generation of optical photons cannot be explained in
terms of Cerenkov effect and, thus, alternative explanations are needed. For example in ref. 9 it has been suggested
that even if the origin of optical emission from 225
Ac is uncertain it can be linked to CR emitted from the beta
minus short lived daughter nuclides like for example 213
Bi. This appears to be a plausible and interesting
hypothesis, however a more general explanation of the intense light emission of 225
Ac can be the combination of
both Cerenkov photons generated by the beta particles emitted by daughter nuclides and fluorescence induced by
alpha particles. In a recent proof of principle work14
we investigated the latter effect in different experimental
conditions.
Fluorescence induced by alpha particles was simulated using GEANT4 and measured using a commercial CCD
based small animal optical imaging system. More precisely we measured the light emission induced by a 241
Am
source in different experimental conditions. This isotope is interesting since the principal decay modes of 241
Am are
mainly alpha emission and low energy gamma radiations.
These physical properties of 241
Am are quite useful since allow us to exclude any possible contribution from
Cerenkov light photons generated by high energy electrons and, thus, gave us the possibility to estimate the
contribution of alpha particles induced fluorescence only.
4.2 Light detection using gamma emitters
In a preliminary work15
we investigated the in vivo imaging of [99m
Tc]MDP by using a small animal optical
imaging system and covering the animal with and without slabs of bismuth germanate (BGO) scintillating material.
In a more recent paper16
we focused our attention on investigating in vitro and in vivo without the use of any
scintillating material the more weaker luminescence signals induced by 99m
Tc. In particular in vivo imaging was
performed by using nude mice models in order to allow the detection of a smaller number of optical photons.
We showed that ex vivo and in vivo results further confirms the findings obtained by imaging [99m
Tc]MDP in a
water solution. More precisely in both cases a luminescence signal was distinguishable and correctly localized in
regions where a higher concentration of 99m
Tc was expected. In particular the results of RLI in vivo imaging
showed that the luminescence signal agrees with the well-known bladder accumulation commonly found with
SPECT imaging.
The detected radiance has a lower magnitude in comparison with Cerenkov luminescence obtained when using
radiopharmaceuticals labeled with beta emitters. The lower light output can to some extent limit the detectability of
visible photons coming from inner and smaller structures and/or in regions with a modest radiopharmaceutical
uptake.
5. Brief overview of novel uses of CR in radiotherapy and radiopharmacy
5.1 On line linac beam monitoring using Cerenkov radiation
The on-line monitoring of high-energy X-Rays in Radiotherapy is a very important topic especially considering the
advent of increasingly complex machines delivering intensity modulated beams. A careful comparison between the
delivered and the planned dose distribution is a challenge and is generally performed on dedicated phantoms
miming the patient using 2D/3D arrays of ionization chambers or diodes, radiographic or radiochromic films or,
alternatively using planar dosimeters positioned in correspondence of the beam exit, such as EPID devices.
In a preliminary work21
we showed by using Monte Carlo simulations that it is possible to measure the beam X-
Rays dose/fluence by the detection of Cerenkov radiation. More precisely by detecting Cerenkov photons generated
in a lead glass Cerenkov radiator placed just below the linac multi leaf collimator.
5.2 Cerenkov radiation induced fluorescence using a linac
A recent paper22
showed that it is possible to use the CR generated by electron or photon beams from a
radiotherapy linac to excite a fluorophore as protoporphyrin IX (PpIX). The interesting aspects of PpIX it that it has
photosensitizing properties and shows also a selective accumulation in brain tumor.
The authors performed experiments by irradiating with gamma (6, 18 MV) and electron beam (6, 9, 15, 18 MeV) a
tissue mimicking phantom. The water based phantom contains a mixture of intralipid and PpIX. All the images
were acquired using a CMOS camera with an integration time of 8 seconds.
5.3 Quantitative measurements of beta particles in a microfluidic chip using CR
In 2008 and 2009 Cho and colleagues23,24
introduced a pioneering method for quantitative imaging of beta particles
in a microfluidic chip by using Cerenkov radiation detected using CCD. Microfluidic chips have multiple
applications and are used in radiochemistry in order to perform on-demand synthesis of FDG.
Cho and collaborators nicely demonstrated that the spectrum of the visible light generated in microfluidic chips
filled with 18
F is consistent with the 1/2 dependence typical of CR. They also interestingly showed that it is
possible to distinguish a microchannel having a width 200 of microns.
The authors claims that the low sensitivity of this methodology with respect to scintillator based approaches is not a
serious problems since the microchannel typically contains enough activity to compensate for the low sensitivity of
Cerenkov imaging.
6. Conclusions
In this contribution we presented an overview of the most recent results on the use of optical techniques to image
radiotracers for small animal pre-clinical imaging. This novel research area has rapidly gain attention of several
research groups and this provided a significant boost in the development of this field. There are several very
interesting aspects related to either CLI or RLI imaging. The most important one is the intrinsic multimodal nature
of these imaging techniques since it has been shown the most important radiopharmaceuticals used in nuclear
medicine typically detected using PET or SPECT scanners can be also imaged without any modification using
optical imaging systems. These results lead to several advantages since for example optical imaging systems are
generally cheaper with respect to dedicated PET or SPECT scanners and can be also used to perform conventional
bioluminescence or fluorescence imaging experiments. Optical imaging offers the advantages of studying more
animals at once and it is possible to acquire whole body planar images of small animals within few minutes. We
also showed that dynamic CLI can be easily performed in order to study the whole body biodistribution of the
radiopharmaceuticals.
References:
[1] A. E. Spinelli, Optical imaging using radioisotopes a novel multimodal approach to molecular imaging, Q. Jour.
Nuc. Med. (2012), 56, 279-289.
[2] E.P. Cherenkova, The discovery of the Cherenkov radiation. Nucl. Instr. Meth. A (2008), 595(1), 8-11.
[3] P.A. Cerenkov, Visible emission of clean liquids by action of γ radiation. Dokl. Akad. Nauk. SSSR 1934; 2:
451–4.
[4] J.V. Jelley, Cerenkov Radiation and Its Applications. London: Pergamon, (1958).
[5] R. Robertson, Optical imaging of Cerenkov light generation from positron-emitting radiotracers Phys. Med.
Biol. (2009), 54, N355–65.
[6] A.E. Spinelli, Cerenkov radiation allows in vivo optical imaging of positron emitting radiotracers. Phys. Med.
Biol. (2010), 55(2), 483–495.
[7] H.H Ross, Measurement of β-emitting nuclides using Cerenkov radiation Anal. Chem. (1969), 41, 1260–5.
[8] H. Liu, Molecular optical imaging with radioactive probes. PLoS ONE (2010), 5(3), e9470.
[9] A. Ruggiero, J. Nucl. Med. (2010), 51(7), 1123–1130.
[10] F. Boschi, In vivo (18)F-FDG tumour uptake measurements in small animals using Cerenkov radiation. Eur. J.
Nucl. Med. 2011; 38(1): 120–127.
[11] C. Li, Cerenkov luminescence tomography for small-animal imaging. Opt. Lett. (2010), 35(7), 1109–1111
[12] Z. Hu, Experimental Cerenkov luminescence tomography of the mouse model with SPECT imaging
validation. Opt. Expr. 2010; 18(24): 24441–24450.
[13] A.E. Spinelli, Multispectral Cerenkov luminescence tomography for small animal optical imaging. Opt.
Express (2011), 19, 12605–12618.
[14] F. Boschi, Optical imaging of alpha emitters: simulations, phantoms and in vivo results, imaging J. Biomed.
Opt. (2011), 16(12).
[15] F. Boschi, Combined optical and single photon emission imaging: preliminary results Phys. Med. Biol. (2009),
54, L57–62.
[16] A.E. Spinelli, Optical Imaging of Tc-99m based tracers, in vitro and in vivo results. J. Biomed. Opt. (2011),
16(11).
[17] H. Liu, Radiation-luminescenceexcited quantum dots for in vivo multiplexed optical imaging. Small. (2010),
6, 1087–1091.
[18] R.S. Dothager, Cerenkov radiation energy transfer (CRET) imaging: a novel method for optical imaging of
PET isotopes in biological systems. PLoS ONE. (2010), 5:e13300.
[19] M.A Lewis, On the potential for molecular imaging with Cerenkov luminescence Opt. Lett. (2010), 35(23),
3889–3891.
[20] C. Ran, In Vivo Photoactivation Without "Light": Use of Cherenkov Radiation to Overcome the Penetration
Limit of Light. Molecular Imaging (2011).
[21] S. Lo Meo, Optimization of a Novel Cerenkov Detector for Radiotherapy Applications Using GEANT 4 and
FLUKA IEEE Nucl. Sci. Symp. (2011).
[22] J Axelsson, Cerenkov emission induced by external beam radiation stimulates molecular fluorescence. Med
Phys. (2011), 38(7), 4127-32.
[23] J. S. Chow, Cerenkov radiation imaging as a method for quantitative measurements of beta particles in
microfluidic chip IEEE Nucl. Sci. Symp. (2008), 4510–15.
[24] J.S. Cho, Cerenkov radiation imaging as a method for quantitative measurements of beta particles in a
microfluidic chip Phys. Med. Biol. (2009), 54, 6757–71.
Imaging radiologico con sistemi a conteggio di fotoni. R. Longo - Dipartimento di Fisica e INFN sezione di Trieste, Università di Trieste
Introduzione I sistemi di imaging per radiologia diagnostica basati sul conteggio dei fotoni, anziché sull’integrazione del segnale, sono ancora poco diffusi ma hanno straordinarie potenzialità, sia per l’ottimo rapporto segnale su rumore che per il così detto “spectral imaging”, come dimostrato da alcuni studi pilota di recente pubblicazione. Infatti i nuovi detector a conteggio di fotoni con soglia multipla rendono possibile l’acquisizione di immagini relative a molteplici intervalli spettrali con una singola acquisizione da un comune spettro policromatico. In questo contributo faremo una breve storia delle applicazioni radiologiche dei detector a conteggio di fotoni, a partire dalle prime immagini di mammografia digitale con luce di sincrotrone, per soffermarci sui più recenti sviluppi di “spectral imaging” sia in imaging planare che tomografico. I detector a conteggio di fotoni I detector a conteggio di fotoni associano a ciascun pixel una catena elettronica che confronta l’entità di ogni segnale generato nel semiconduttore con il valore di una o più soglie ed incrementa il contatore ogni volta che il segnale raccolto e’ maggiore della soglia associata a quel contatore [1]. In questo modo è possibile separare il segnale dovuto a fotoni, che superando il valore della soglia viene contato, dal rumore che genera impulsi piccoli che non superano il valore di soglia. Idealmente quindi all’immagine contribuiscono solamente i fotoni incidenti sul detector e l’immagine e’ caratterizzata solo dalla statistica di Poisson del fascio di raggi X, senza altri contributi di rumore. Le difficoltà associate allo sviluppo di questi rivelatori sono molteplici, soprattutto nel caso delle applicazioni radiologiche. Ad esempio la realizzazione di un’elettronica molto veloce nel trattare ciascun segnale in modo da poter contare correttamente il grande valore di flusso di fotoni (dell’ordine di 104-105 conteggi al secondo per pixel [1]), senza subire effetti di saturazione per l’alto flusso che riducono il contrasto delle immagini. Inoltre combinare l’elevata risoluzione spaziale, con pixel di circa 100x100 µm2, con grandi campi di vista, e quindi numeri enormi di pixels, pone in modo cruciale la questione della miniaturizzazione dell’elettronica, essendo necessaria una catena elettronica per ogni pixel, contrariamente a quanto avviene per CCD o flat pannel. Non essendo ancora stato realizzato un detector a conteggio di fotoni con la risoluzione spaziale e l’area sensibile adeguata alla radiologia diagnostica, i rivelatori dei sistemi mammografici a conteggio di fotoni sono detector lineari e l’acquisizione delle immagini avviene per scansione [2,3]. La geometria lineare dei detector a conteggio di fotoni di grandi dimensioni ha suggerito, in modo quasi “naturale”, il loro utilizzo in sistemi CT [4, 5]. Recentemente sono stati realizzati rivelatori con soglia multipla, con la capacità quindi di discriminare in energia i fotoni incidenti [1]. Ad esempio nel caso di un sistema a doppia soglia il contatore associato alla soglia più bassa conta tutti i segnali maggiori del livello del rumore elettronico, mentre la seconda soglia, corrispondente ad un segnale maggiore, permette il conteggio dei fotoni di più alta energia. Si generano così contemporaneamente due immagini relative una a tutto lo spettro e la seconda ottenuta solo dalla componente spettrale di energia più elevata [2]. La prima applicazione clinica: la mammografia La mammografia è stata il primo esame radiologico per cui sia stato sviluppato un detector a conteggio di fotoni [6,7,2]: la sperimentazione su oggetti test e poi la pratica clinica hanno dimostrato che le immagini ottenute hanno un ottimo rapporto segnale su rumore e quindi ottima risoluzione in contrasto, idealmente la soglia permette il conteggio dei fotoni senza nessuna contaminazione di rumore elettronico. Inoltre abbinando l’elettronica a conteggio di fotoni a detector a microstrip di silicio orientate parallelamente al fascio di raggi X si ottiene un’efficienza molto alta con relativa riduzione della dose alla paziente a parità di qualità complessiva dell’immagine. Studi clinici hanno dimostrato che a parità di accuratezza diagnostica i sistemi a conteggio di fotoni con detector a microstrip di silicio permettono una riduzione di dose media del 40% [8].
Le prime tomografie mammarie, su tessuti operatori da mastectomia, sono state acquisite con luce di sincrotrone e detector a conteggio di fotoni, dimostrando la fattibilità della breast CT a dosi confrontabili con la mammografia clinica [4]. L’introduzione di detector a doppia soglia ha permesso fare esami con mezzo di contrasto ed acquisire contemporaneamente un’ immagine da tutto lo spettro ed una immagine con la soglia posta immediatamente sopra il k-edge dello iodio. Dalla combinazione delle 2 immagini è possibile mettere in evidenza la lesione anche con una bassa concentrazione di mezzo di contrasto [2]. Le CT con detector multi-soglia. Le potenzialità della CT a doppia energia è nota: la possibilità di discriminare la composizione chimica dei tessuti e quindi creare mappe specifiche per tessuti o strutture anatomiche. Gli approcci tecnici sono molteplici, basati su una coppia di tubi o su un unico generatore di raggi X che oscilla velocemente tra 2 tensioni. Nessuna però di queste soluzioni è ottimale, sia in termini di dose al paziente che di qualità dell’immagine [1]. Lo sviluppo di sistemi CT basati su detector a conteggio di fotoni con soglie multiple potrebbero essere una soluzione elegante ed efficiente a questo problema: usa sola acquisizione con uno spettro policromatico permette la ricostruzione di un numero di immagini pari al numero delle soglie associate a ciascun pixel e relative a intervalli spettrali diversi. Attualmente non ci sono sistemi tomografici clinici a conteggio di fotoni ma c’è una ricca attività di ricerca in questo campo, documentata da un gran numero di articoli scientifici. Interessanti sono i risultati ottenuti con un prototipo il cui campo di vista è pari a 20 cm [5] e quindi non lontano da uno sviluppo clinico. Questo tomografo ha il sistema di rivelatori equipaggiato con ben 6 soglie, ottenendo quindi, in seguito ad una singola esposizione del campione, immagini associate a 6 intervalli di energia, alcuni anche di soli 10 keV. Questa molteplicità di informazioni ben si presta ad esempio all’uso di mezzi di contrasto diversi nello stesso esame, che essendo caratterizzati da diversi valori di k-edge possono essere visualizzati in modo quantitativo ed indipendente, come ad esempio il gadolinio e lo iodio. L’incontro tra questa tecnologia e la ricerca nel campo dei mezzi di contrasto e delle nanotecnologie suggerisce l’utilizzo di nuovi mezzi di contrasto basati su itterbio, bario e nanoparticelle di oro. Studi ex-vivo dimostrano la possibilità di discriminare la presenza di placche nei vasi in presenza di gadolinio e di uno stent, ricostruendo a 50 keV (K-edge del gadolinio 50.2 keV). Inoltre in modelli animali e’ stata dimostrata la capacità di questi sistemi tomografici di distinguere tra l’attenuazione dovuta al mezzo di contrasto basato su nanoparticella d’oro, quella basata sullo iodio e quella dovuta alla calcificazione [9]. Conclusioni La ricerca nel campo dell’imaging medico con raggi X per anni si è concentrata sull’ottimizzazione dello spettro dei raggi X, cercando di ridurne l’ampiezza in un intervallo ottimale per ciascuna applicazione. Con questa prospettiva era iniziata anche l’avventura dell’applicazione della radiazione di sincrotrone, monocromatica, all’imaging diagnostico, in particolare per l’angiografia coronarica in doppia energia [10]. Oggi i rivelatori a conteggio di fotoni con soglia multipla promettono di rendere lo spettro policromatico non più uno strumento un po’ approssimativo ma una ricca sorgente di informazioni che lo “spectral imaging” scompone in immagini relative a ben definite bande spettrali. PS: Nel frattempo si è visto che la radiazione di sincrotrone permette di sfruttare le proprietà ondulatorie dei raggi X per modulare il contrasto delle immagini e quindi la motivazione per l’imaging medico con luce di sincrotrone si è rafforzata ma questo è il contributo di Luigi Rigon in questa stessa sezione.
References: [1] K. Taguchi and J.S. Iwanczyk, Vision 20/20: Single photon counting x-ray detectors in medical imaging. Medical Physics (2013) 40, 100901-1 [2] E. Fredenberg et al., Contrast-enhanced spectral mammography with a photon-counting detector, Medical Physics (2010) 37, 2017-29
[3] F.C. Lopez et al., Development of a fast read-out system of a single photon counting detector for mammography with synchrotron radiation. Journal of Instrumentation (2011) 6, C12031 [4] S. Pani et al. Breast tomography with synchrotron radiation: preliminary results. Phys. Med. Biol. (2004) 49 1739–1754 [5] J.P. Schlomka et al., Experimental feasibility of multi-energy photon-counting K-edge imaging in pre-clinical computed tomography, Phys Med Biol (2008) 53, 4031–4047 [6] F. Arfelli et al, Mammography of a Phantom and Breast Tissue with Synchrotron Radiation and a Linear-Array Silicon Detector, Radiology (1998) 208, 709-715 [7] R. Longo et al. Morphological breast imaging: tomography and digital mammography with synchrotron radiation. Nuclear Instruments and Methods in Physics Research A (2003) 497, 9–13 [8] E. Cole et al. Comparison of radiologist performance with photon-counting full-field digital mammography to conventional full-field digital mammography. Academic Radiology (2012) 19, 916-922 [9] D.P. Cormode et al. Atherosclerotic Plaque Composition: Analysis with Multicolor CT and Targeted Gold Nanoparticles. Radiology (2010) 256, 774–782 [10] P. Suortti and W. Thomlinson. Medical applications of synchrotron radiation. Phys. Med. Biol. (2003) 48 R1–R35
Phase contrast X-ray imaging L. Rigon1,2
(1) Physics Department, University of Trieste (2) INFN, Trieste.
Most clinicians and researchers, including myself, usually think of X-rays as a beam of little bullets, that are thrown on the sample and that can be absorbed or scattered by it. In this picture, the physics of X-ray imaging can basically be outlined as follows. A photon that is absorbed or deviated at large angle is attenuated, i.e. will not be collected by the X-ray detector. Image formation occurs because some features or details in the sample attenuate X-rays differently than the surrounding background. This simple model is sufficiently accurate to explain nearly all the diagnostic techniques that are used in conventional X-ray imaging, including planar radiographs, computed tomography scans, and contrast agents which selectively enhance the X-ray attenuation in certain features. As a matter of fact, all clinical X-ray imaging techniques, albeit modern, rely on the attenuation of X-rays, i.e. on the same principle that was used by Roentgen in 1895 to image his wife’s hand, obtaining a strong contrast for the bones and the ring, due to their higher capability of absorbing X-rays, as compared to the soft tissues.Nowadays it is well known that X-rays are electromagnetic waves, exactly as visible light, only with a much (ten thousand times) shorter wavelength. However, due to this very short wavelength, Roentgen and his followers were not able to measure reflection or refraction from X-rays, and only a few decades later these laws of optics were gradually found to have a parallel in the realm of X-rays. In his Nobel Lecture given on December 12, 1927, with the very suggestive title “X-rays as a Branch of Optics”, A. H. Compton underlines the wave nature of X-rays, but also admits that the final word on this wave-particle debate “has not yet been said!” [1].In a sense, the problem was ill-posed: X-rays are both waves and “bullets”, i.e. photons. This wave-particle duality, that is a fundamental concept in quantum mechanics, is anyway usually disregarded in the conventional techniques of diagnostic X-ray imaging, since the particle model satisfactorily represents the imaging formation principles. Yet, in this talk I will introduce some novel X-ray imaging techniques which can be fully understood only considering the wave model. They are the so-called phase sensitive techniques. In a model regarding X-rays as waves, the interaction of X-rays with matter can be described by means of the refraction index n, which, being a complex number, is usually written as n=1-δ+iβ, where i is the imaginary unit, δ is called the refractive index decrement and β represents the imaginary part. While β is the responsible of the attenuation of the wave, which clearly corresponds to the attenuation of the X-ray beam in the particle model, δ introduces a position-dependent phase shift ϕ which does not have a parallel in the particle model. Such phase shift ϕ can in principle be considered an additional pool of contrast for X-ray imaging, thus leading to phase contrast X-ray imaging. Noteworthy, although both δ and β are rather small numbers, for biological samples and at X-ray energies typical of biomedical imaging the refractive index decrement δ is typically one thousand times larger than the imaginary part β. For instance, for soft tissue at X-ray energies typical of mammography (15-25 keV) δ can be quoted in 10-6 – 10-7, while β is in the order of 10-8 – 10-10 [2]. As a consequence, phase contrast could be much more relevant than the conventional absorption contrast.Conventional X-ray imaging is not capable to highlight the phase shift ϕ, because X-ray detectors are sensitive only to the intensity of the radiation and not to its phase. In order to highlight the phase shift and to use it as an additional pool of contrast in the X-ray image, it must first be converted into an intensity modulation. This is the goal of phase-sensitive X-ray imaging techniques, which thus allow to reveal the contrast hidden in the phase shift term ϕ. Phase contrast techniques in optics (with visible light) were known since the first half of the twentieth century but their application were boosted in the sixties by the laser invention. Likewise, the use of X-ray phase sensitive techniques was introduced in the sixties but remained rather marginal until the mid-nineties, until the spread of third-generation synchrotron-radiation sources, capable of producing X-ray beams with unprecedented brilliance and coherence. Since then, several research groups began approaching phase sensitive X-ray imaging.
Phase-sensitive X-ray imaging techniques have the potential to revolutionize X-ray imaging, with particular regard to the biomedical applications. As mentioned earlier, the phase shift effects induced by the sample can be much larger than the absorption effects, which are the bases of image formation in conventional X-ray imaging. This suggests that the sensitivity of X-ray imaging can be strongly enhanced, particularly when the absorption contrast is not sufficient to differentiate tiny details embedded in a similar background, which can be the case, for instance, of a breast cancer in healthy glandular tissue.Several phase-sensitive X-ray imaging techniques have been developed in the last two decades. However, most of them have strong requirements in terms of beam coherence and severe limitations regarding the field of view, the exposure time and the thermal/mechanical stability of the system. In my talk, I will focus on five different methods, which are briefly summarized hereafter [2, 3].1. Propagation-Based Phase-Contrast Imaging (PPCI). PPCI implementation is very simple, provided that the
source has a sufficient degree of lateral coherence (such as synchrotrons or micro-focus X-Ray tubes). In fact, in this case it is sufficient to place the detector not immediately behind the object, where only absorption contrast would be obtained, but rather at a suitable distance, and an edge-enhancement will take place [4].
2. Analyzer-Based Imaging (ABI). ABI relies on the use of an analyzer crystal placed between the sample and the detector, usually combined with a monochromatic and highly collimated X-ray beam. The analyzer crystal acts as an angular band-pass filter, which modulates the intensity of the X-ray beam reaching the detector. Thus, refraction and scattering effects can be exploited and provide extra contrast in addition to X-ray absorption [5].
3. Coded Apertures X-ray Phase-Contrast Imaging (CAXPCI). This method is an extension of the so-called edge-illumination technique and consists to illuminate the pixels of the detector only partially, and at one edge, in order to become sensitive to X-ray refraction and scattering [6].
4. X-ray Interferometry. This was actually the first technique to be implemented, as early as 1965. The interferometer introduced by Bonse and Hart [7] is made up of three perfect crystals, which the beam traverses in the Laue geometry, thus revealing directly the phase shift ϕ.
5. Grating Interferometry, which is obtained by means of two gratings placed between the sample and the imaging detector, thus avoiding the use of crystals and relaxing the requirements in terms of beam coherence and of mechanical and thermal stability [8].
Phase sensitive techniques have already shown great potential in the biomedical imaging field, particularly in the fields of mammography [9], joint and cartilage imaging [10] and of small-animal imaging [11]. Anyway, the phase contrast X-ray imaging is still evolving: new approaches are being developed at an increasingly rapid pace, often stimulated by technological developments, and could possibly be translated soon in the clinical practice.References:[1] A. H. Compton, X-rays as a Branch of Optics, in “Nobel Lectures, Physics 1922-1941”, Amsterdam, Elsevier Publishing Company (1965).[2] S.-A. Zhou and A. Brahme, Development of phase-contrast x-ray imaging techniques and potential medical applications, Phys. Med. (2008) 24, 129–148.[3] A. Bravin, P. Coan and P. Suortti, X-ray phase-contrast imaging: from pre-clinical applications towards clinics, Phys. Med. Biol. (2013) 58, R1-R35.[4] S. W. Wilkins et al., Phase-contrast imaging using polychromatic hard x-rays, Nature (1996) 384, 335–338.[5] D. Chapman et al., Diffraction enhanced x-ray imaging, Phys. Med. Biol. (1997) 42, 2015–2025.[6] A. Olivo et al., Noninterferometric phase-contrast images obtained with incoherent x-ray sources, Appl. Opt. (2011) 50, 1765–1769.[7] U. Bonse and M. Hart, An x-ray interferometer. Appl. Phys. Lett. (1965) 6, 155–156.[8] F. Pfeiffer et al., Phase retrieval and differential phase-contrast imaging with low-brilliance x-ray sources, Nat. Phys. (2006) 2, 258–261.
[9] E. Castelli et al., Mammography with synchrotron radiation: first clinical experience with phase-detection technique, Radiology (2011) 259, 684–694.[10] S. Majumdar et al., Diffraction enhanced imaging of articular cartilage and comparison with micro computed tomography of the underlying bone structure, Eur. Radiol. (2004) 14, 1440–1448.[11] A. Fouras et al., Altered lung motion is a sensitive indicator of regional lung disease, Annals of Biomedical Engineering (2012) 40, 1160–1169.
Diffusion Weighted Imaging (DWI) intercomparison
G. Belli1, S. Busoni
2, A. Ciccarone
3, M. Esposito
4, M. Giannelli
5, C. Gori
2, L.N. Mazzoni
2, L. Nocetti
6, R.
Tarducci7, D. Scelfo
8, G. Zatelli
4, R.A. Anoja
9, G. Belmonte
10, N. Bertolino
11, M. Betti
12, C. Biagini
12, A.
Coniglio13
, F. Cretti14
, E. Fabbri15
, S. Filice16
, C. Fulcheri2, C. Gasperi
1, P.A. Mangili
17, S. Mazzocchi
4, G.
Meliadò18
, S. Morzenti19
, L. Noferini2, N. Oberhofer
20, N. Parruccini
19, G. Princigalli
21, M.G. Quattrocchi
22, R.
Sghedoni23
, G. Vilches Freixas24
, I. Zucca11
, G. Gobbi7
(1) USL 8, Arezzo (2) A.O.U. Careggi, Firenze (3) A.O.U. Meyer, Firenze (4) Azienda Sanitaria di Firenze (5)
A.O.U. Pisana, Pisa (6) A.O.U. Policlinico, Modena (7) A.O. di Perugia (8) IFC-CNR, Pisa (9) A.O. Pugliese-
Ciaccio, Catanzaro (10) A.O.U. Senese, Siena (11) IRCSS Istituto Neurologico Carlo Besta, Milano (12) Centro
Oncologico Fiorentino, Sesto Fiorentino (13) Ospedale S.Giovanni Calibita-Fatebenefratelli, Roma (14) A.O. Papa
Giovanni XXIII, Bergamo (15) Policlinico S.Orsola-Malpighi, Bologna (16) A.O.U. di Parma (17) Istituto
Scientifico San Raffaele, Milano (18) A.O.U. Integrata, Verona (19) A.O. San Gerardo, Monza (20) Azienda
Sanitaria dell’Alto Adige, Ospedale Bolzano (21) FISMECO srl, Roma (22) ASL 2, Lucca (23) IRCCS
Arcispedale Santa Maria Nuova, Reggio Emilia (24) Fondazione CNAO, Pavia
This work is a pilot study of the Italian Association of Physics in Medicine (AIFM) Working Group on MR
intercomparison.
Purpose Quantitative estimation that can be obtained from DWI measurements using different DWI signal models are under
consideration to identify and stage different kind of neoplastic diseases and to monitor patient response to radiation
and chemo therapy [1].
This scenario opens the problem of adequately assess the repeatability and the reproducibility of DWI
measurements, especially in multi-centric frameworks: in particular, phantom studies are recommended [2-4].
Recent papers face the problem of developing a phantom that could be suitable for inter-centre intercomparison
[5,6], that should be easy to be developed, safe and temperature controlled, given the strong dependence of DWI
signal intensities on water temperature. In particular a temperature controlled water-ice phantom has been recently
proposed [6].
Clearly, the simpler is the phantom, the wider and immediate is its usability. From this point of view, the best
solution would be to use standard proprietary phantoms provided by MR vendors, which are available at every MR
site. In this case results dependence on phantom differences has to be investigated.
Secondly, there are many different technical factors depending on scanner performance that influence DWI
quantitative estimation, that became significant in different b-value ranges and therefore in different clinical
applications. The most important are the interaction of diffusion sensitizing gradients and encoding gradients at low
b-values and the Rician noise influence at high b-values. To monitor these effects different sequences must be
adopted. Moreover, there are only few literature data assessing the extent of DWI measurements agreement in in-
vitro inter-centre intercomparison and there is a lack of standardized DWI quality assurance procedure, which
should include information about the phantom and the acquisition protocol.
Given this background, the aim of our study was to develop and test a quality assurance procedure (phantom and
acquisition protocol) for DWI measurements as simple as possible to ensure a large and easy applicability. This
protocol could be used to verify intra-centre repeatability and inter-centre reproducibility of DWI measurements,
taking into account the influence of different factors depending on scanner performance at different b-values. In
particular, all the procedures were applied on liquid vendor provided phantoms and were repeated on a standard
liquid phantom assigned to every participant centre.
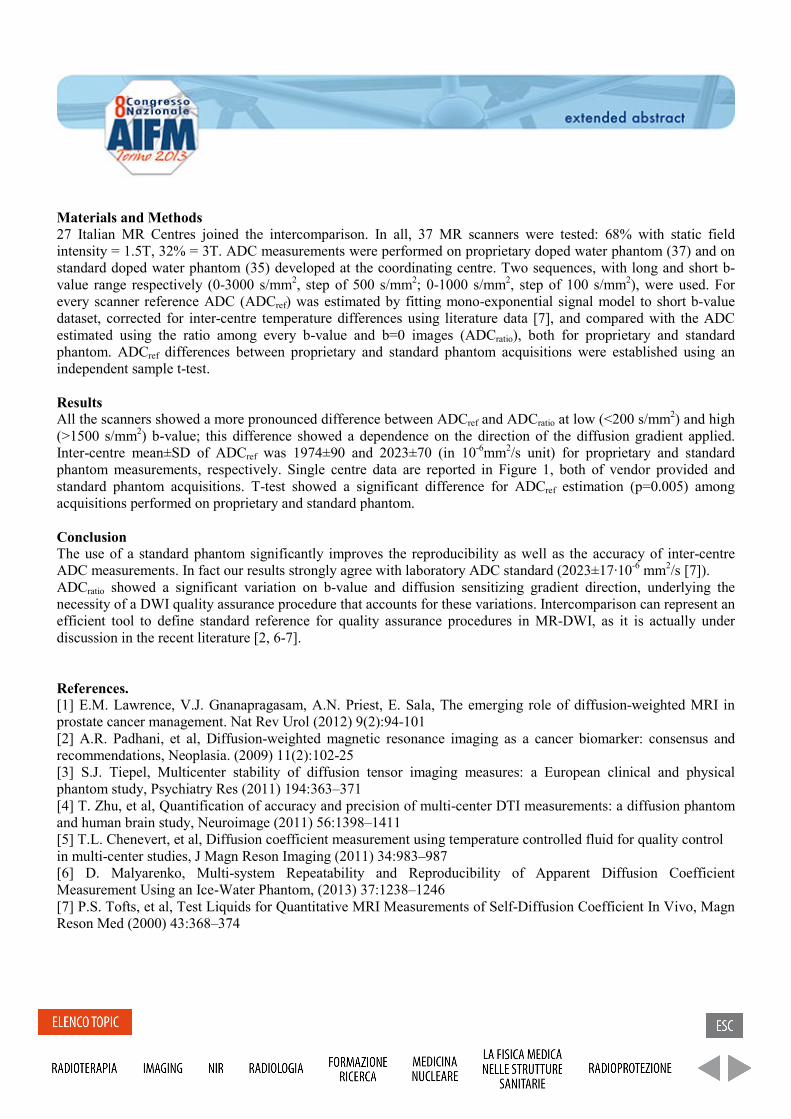
Materials and Methods 27 Italian MR Centres joined the intercomparison. In all, 37 MR scanners were tested: 68% with static field
intensity = 1.5T, 32% = 3T. ADC measurements were performed on proprietary doped water phantom (37) and on
standard doped water phantom (35) developed at the coordinating centre. Two sequences, with long and short b-
value range respectively (0-3000 s/mm2, step of 500 s/mm
2; 0-1000 s/mm
2, step of 100 s/mm
2), were used. For
every scanner reference ADC (ADCref) was estimated by fitting mono-exponential signal model to short b-value
dataset, corrected for inter-centre temperature differences using literature data [7], and compared with the ADC
estimated using the ratio among every b-value and b=0 images (ADCratio), both for proprietary and standard
phantom. ADCref differences between proprietary and standard phantom acquisitions were established using an
independent sample t-test.
Results
All the scanners showed a more pronounced difference between ADCref and ADCratio at low (<200 s/mm2) and high
(>1500 s/mm2) b-value; this difference showed a dependence on the direction of the diffusion gradient applied.
Inter-centre mean±SD of ADCref was 1974±90 and 2023±70 (in 10-6
mm2/s unit) for proprietary and standard
phantom measurements, respectively. Single centre data are reported in Figure 1, both of vendor provided and
standard phantom acquisitions. T-test showed a significant difference for ADCref estimation (p=0.005) among
acquisitions performed on proprietary and standard phantom.
Conclusion The use of a standard phantom significantly improves the reproducibility as well as the accuracy of inter-centre
ADC measurements. In fact our results strongly agree with laboratory ADC standard (2023±17·10-6
mm2/s [7]).
ADCratio showed a significant variation on b-value and diffusion sensitizing gradient direction, underlying the
necessity of a DWI quality assurance procedure that accounts for these variations. Intercomparison can represent an
efficient tool to define standard reference for quality assurance procedures in MR-DWI, as it is actually under
discussion in the recent literature [2, 6-7].
References.
[1] E.M. Lawrence, V.J. Gnanapragasam, A.N. Priest, E. Sala, The emerging role of diffusion-weighted MRI in
prostate cancer management. Nat Rev Urol (2012) 9(2):94-101
[2] A.R. Padhani, et al, Diffusion-weighted magnetic resonance imaging as a cancer biomarker: consensus and
recommendations, Neoplasia. (2009) 11(2):102-25
[3] S.J. Tiepel, Multicenter stability of diffusion tensor imaging measures: a European clinical and physical
phantom study, Psychiatry Res (2011) 194:363–371
[4] T. Zhu, et al, Quantification of accuracy and precision of multi-center DTI measurements: a diffusion phantom
and human brain study, Neuroimage (2011) 56:1398–1411
[5] T.L. Chenevert, et al, Diffusion coefficient measurement using temperature controlled fluid for quality control
in multi-center studies, J Magn Reson Imaging (2011) 34:983–987
[6] D. Malyarenko, Multi-system Repeatability and Reproducibility of Apparent Diffusion Coefficient
Measurement Using an Ice-Water Phantom, (2013) 37:1238–1246
[7] P.S. Tofts, et al, Test Liquids for Quantitative MRI Measurements of Self-Diffusion Coefficient In Vivo, Magn
Reson Med (2000) 43:368–374
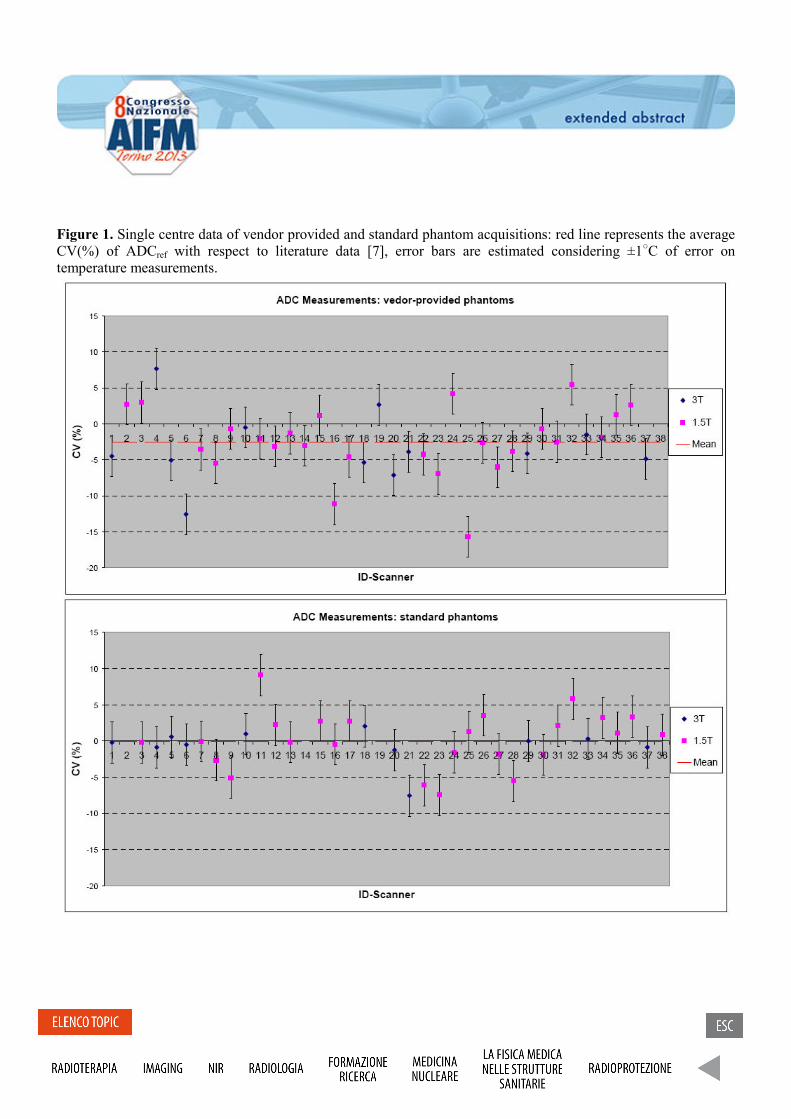
Figure 1. Single centre data of vendor provided and standard phantom acquisitions: red line represents the average
CV(%) of ADCref with respect to literature data [7], error bars are estimated considering ±1○C of error on
temperature measurements.
Automatic detection of prostate cancer by computer-aided multi-parametric magnetic resonance imaging S. Mazzetti1, V. Giannini2, A. Vignati2, F. Russo2, D. Regge2, M. Stasi1 (1) Medical Physics Unit, IRCCS Candiolo (TO) (2) Radiology Unit, IRCCS Candiolo (TO)
Purpose: Prostate cancer (PCa) is the second most common cause of cancer and the third leading cause of cancer death among men [1]. With the use of prostate-specific antigen (PSA) screening, up to 80% of diagnosed PCas are designated as “clinically insignificant” [2]. However, for patients with elevated PSA and/or abnormal digital rectal examination (DRE), the current screening approach, which includes random systematic transrectal ultrasound (TRUS) biopsy, has a considerable false negative rate [3]. Recently, multiparametric (mp) magnetic resonance imaging (MRI) has shown promise in localizing PCa and it is largely exploited in clinical routine to visualise and characterise tumours, thus improving the detection and staging of PCa. In addition to morphological information coming from T2-weighted (T2-w) images, mainly used for local staging, the mp-MRI approach allows for an estimation of physiological properties of tissues, coming from diffusion-weighted (DW) images and dynamic contrast-enhanced (DCE) sequences. The study here presented aims to increase objectivity and reproducibility of prostate MRI interpretation by developing an automated interpretation approach for ultimate use in computer-aided diagnosis (CAD) systems, combining MRI parameters in order to calculate a pixel-wise malignancy probability map. This method can be of benefit to improve the diagnostic accuracy of the radiologist, reduce reader variability and speed up reading time, automatically highlighting probably cancer suspicious regions.
Methods and materials: The dataset included 20 men (mean age: 66 years old), with a PSA lever greater than 4 ng/ml (mean PSA = 6.7 ng/ml; range 4.1-12.3 ng/ml) and confirmed PCa by TRUS guided biopsy. All patients underwent MRI at 1.5 T using an endorectal coil with integrated pelvic phased multi-coil array (Signa LX, GE Healthcare, Milwaukee, WI). A conventional axial T2-w sequence was obtained to depict the prostate anatomy using the following protocol: TR/TE, 2960/85 ms; FOV, 16 cm; slice thickness, 3 mm; acquisition matrix, 384 x 288; reconstruction matrix, 512 x 512. After the T2-w series, DW acquisition was performed using the following parameters: TR, 7000 ms; TE, minimum; FOV, 16 cm; slice thickness, 3 mm; acquisition and reconstruction matrix, 128 x 128; b-value, 1000 s/mm2. Finally, DCE sequence was performed using 26 frames, one at baseline and 25 after contrast administration, at 13 s time resolution acquired with an axial 3D Spoiled Gradient echo (SPGR) sequence using the following parameters: TR/TE/FA, 3.6 ms/1.3 ms/20°; FOV, 20 cm; slice thickness, 3 mm; acquisition matrix, 256 x 192; reconstruction matrix, 512 x 512. Scanning started simultaneously with the intravenous injection of 0.1 mmol/kg gadobutrol (Gadovist, Bayer Schering, Berlin, Germany) through a peripheral line at 0.7 ml/s, using a power injector (Medrad Spectris, Maastricht The Netherlands), followed by an infusion of 20 cc normal saline at same rate. Within 3 months of MRI all patients underwent radical prostatectomy. Each prostate was cut into axial sections of the same thickness and orientation as the axial MR images. Foci of cancer were contoured on each slide with ink by the pathologist to create the standard of reference and then histological samples were digitalized. MRI sequences and digitalized histopathology sections were stored in a workstation for image contouring and data analysis. A radiologist, with more than 5 years of experience in interpreting prostate MRI, compared imaging with histopathology and reported malignant regions of interest (ROI) on T2-w images in correspondence of each foci marked on the prostate specimen by the pathologist. For each patient a ROI, with extension similar to the tumoural region, was also drawn on the non-tumoural tissue located in the contralateral peripheral zone. A total of 23 tumours (mean tumour volume: 0.77 ± 0.46 cc) and located in the PZ were included in the dataset. The first step for the CAD system implementation was registration between T2-w, DW and DCE datasets. In order to include DW images into mp analysis, geometric distortions and chemical shift artefacts caused by susceptibility effects needed to be corrected. The registration method was based on the automatic segmentation of the bladder and the endorectal coil on T2-w and DW images. An affine transform was found coupling the border points of the
bladder segmentation masks on the T2-w and DW images, respectively. Afterward, a non rigid registration step with a deformation field T was performed, starting from the upper border of the coil automatically segmented by the algorithm [4]. In the case of prostate DCE to T2-w image registration, a rigid transformation with a multi-resolution algorithm based on the mutual information (MI) similarity was used [5, 6]. The MI metric is a measure of statistical dependency between two datasets, therefore it is independent from the pixel intensity values. Finding the maximum of similarity measure between the two datasets is a multidimensional optimization problem, that requires an iterative approach, in which an initial estimate of the transformation is gradually refined by trial and error. In each iteration the current estimate of the transformation is used to calculate a similarity measure. The optimization algorithm then makes another estimate of the transformation, evaluates the similarity measure again, and continues until the algorithm converges, at which point no transformation can be found that results in a better value of the similarity measure, to within a pre-set tolerance [7]. Having all the datasets registered, each pixel could be represented like a vector containing scalar values such as T2-w signal intensity, the apparent diffusion coefficient and quantitative physiological parameters (e.g. kep, Ktrans) obtained from DCE-MRI datasets [8, 9, 10]. Next, all these parameters were fed into a support vector machine (SVM) classifier in order to provide a classification that maximized the detection of true positives, minimizing the false positive benign area [11]. A parametric color-coded map of the prostate was created and colours assigned on the basis of the probability of cancer in each pixel. The performance of the classifier was evaluated through the area under the ROC curve (AUROC) and since the available dataset was not large enough to build two separated subsets, one for training and the other for testing, the performance of the algorithm was estimated by exploiting the leave-one-out (LOO) method. Pixels belonging to the testing patient were analysed by the classifier to give the corresponding malignancy probability estimation and AUROC calculation, repeating this procedure until all cases were included in the analysis. Results: The area under the ROC curve for the SVM classifier was equal to 0.93. Sensitivity and specificity were equal to 0.84 and 0.85, respectively. Discussion: The CAD system here presented is able to perform a reliable mp analysis supported by a preliminary registration step. Our study aims to increase objectivity and reproducibility of prostate MRI interpretation, providing clinicians with malignancy probability maps of the prostate. Those maps synthesized the morphological and physiological information extracted from different MRI sequences. Although a larger study group is needed to confirm the reported preliminary results, this method is able to produce a quantitative map of malignancy probability, providing a unique information that might be difficult to be extracted by visually comparing each MR sequence separately. Conclusions: The application of a CAD system based on mp-MRI information that automatically highlights cancer suspicious regions will improve the diagnostic accuracy of the radiologist, reducing reader variability and speeding up the reading time. Acknowledgments: This work was founded by grant IG-10668 from the Italian Association for Cancer Research. References: [1] J. Ferlay, Cancer incidence and mortality patterns in Europe: estimates for 40 countries in 2012, Eur. J. Cancer. (2013) 49, 1374-1403 [2] F. Cornud, Value of Multiparametric MRI in the Work-up of Prostate Cancer, Curr. Urol. Rep. (2012) 13, 82-92 [3] B. Turkbey, Multiparametric MRI and prostate cancer diagnosis and risk stratification, Curr. Opin. Urol. (2012) 22, 310-315
[4] P. Jezzard, Correction for geometric distortion in echo planar images from B0 field variations, MRM (1995) 34, 65-73 [5] D. Rueckert, Nonrigid registration using free-form deformations: application to breast MR images, IEEE Trans. Med. Imaging (1999) 18, 712-721 [6] D. Mattes, PET-CT image registration in the chest using free-form deformations, IEEE Trans. Med. Imaging (2003) 22, 120-128 (2003) [7] F. Maes, Comparative evaluation of multiresolution optimization strategies for multimodality image registration by maximization of mutual information, Med. Image Anal. (1999) 3, 373-386 [8] M.A. Horsfield, Algorithms for calculation of kinetic parameters from T1-weighted dynamic contrast-enhanced magnetic resonance imaging, J. Magn. Reson. Im. (2004) 20, 723-729 [9] J. Chen, Automatic determination of arterial input function for dynamic contrast enhanced MRI in tumor assessment, Med. Image Comput. Assist. Interv. (2008) 11, 594-601 [10] P. Castorina, Classification Scheme for Phenomenological Universalities in Growth Problems in Physics and Other Sciences, Phys. Rev. Lett. (2006) 96, 188701 [11] W.L. Martinez, Computational Statistics Handbook with MATLAB, Chapman & Hall/CRC (2002), 319-331 contrast enhanced T1-weighted MRI, Phys. Med. Biol. (2010) 55, 1719-1734
Valutazione dei parametri fisici e del rapporto segnale rumore in bobine multi-array in parallel
imaging: confronto tra sistemi in uso clinico. E. Fabbri1, L.Pagan2, G. Maestri1, N. Cavazzoni2, M. D’Esposito2, P. Berardi1 (1) A.O.U. Policlinico S.Orsola Malpighi, Bologna (2) AUSL Ospedale Maggiore, Bologna Scopo del lavoro è stato determinare le prestazioni della tecnica di imaging parallelo MRI, attraverso la misura del SNR, la valutazione dell'uniformità di immagine (IU) e della variazione di intensità del segnale (SIV), per aggiornare ed ottimizzare il protocollo dei controlli di qualità (QA); abbiamo confrontato tre bobine phased-array multi-canale per indagini neurovascolari (cervello, spina dorsale pelvico, tronco) su tre scanner RM corpo intero da 1,5T. Le misurazioni sono state effettuate su fantocci-test in dotazione, utilizzando due sistemi RM 1.5T GE SIGNA HDX (33mT/m maximum gradient capability, slew rate=120T/m/s) ed un sistema RM 1.5T Philips Achieva (33mT/m maximum gradient capability, slew rate=180T/m/s), utilizzando una bobina CTL-Spine Premium 9000 phased-array 8 canali -12 elementi solo ricevente, una bobina Head-Neck-Spine phased-array HNS 16 canali -29 elementi rice-trasmittente ed una bobina SENSE Head-Spine da 31 canali -33 elementi rice-trasmittente, data dalla combinazione delle bobine Neurovascular e Spine. Il protocollo di acquisizione usato per i due sistemi RM GE è stato lo stesso: sequenze SpinEcho, TR = 500ms, TE = 30ms, FOV = 40mm2, matrice = 256x256, slice thickness = 5mm, bandwidth = 15.63 Hz/pixel, sagital plane; invece il protocollo usato con il sistema Philips è stato: SpinEcho sequence, TR = 250, TE = 30, FOV = 50mm2 , matrice = 256x256, slice thickness = 5mm, bandwith = 15.63 Hz/pixel, axial plane. Per la determinazione dei profili di sensibilità di ciascun canale delle bobine nei sistemi GE, viene attivata una particolare modalità di acquisizione (Research Operation - Service), che consente di salvare le immagini corrispondenti a ciascun canale ricevente ed emittente: si effettuano diverse acquisizioni scegliendo le varie configurazioni possibili delle bobine spine, con determinati numeri di coppie di elementi attivi. Per l’apparecchiatura Philips sono stati utilizzati i protocolli dedicati al controllo delle bobine presenti nella macchina che automaticamente acquisiscono le immagini di ciascun canale. E’ stata fatta l’analisi qualitativa delle immagini acquisite, successivamente sono stati ricavati i profili di sensibilità per ciascun canale, poi è stata effettuata la misura del segnale nelle immagini acquisite (VM,SD,MAX, MIN) di ciascun canale; il rapporto segnale-rumore SNR è stato calcolato utilizzando il metodo AAPM , impostando una ROI (60-70% dell'area del fantoccio) uguali su tutte le immagini, ed una ROI nel fondo (S/R = 0.655* MVimm / SDfondo). L’uni formità è stata calcolata utilizzando il metodo del segmento (U = [Ssmall - Slarge] / Slarge ) dove Ssmall e Slarge rappresentano il valore medio del segnale all’interno delle 5 roi piccole e della ROI grande rispettivamente; si selezionano 5 piccole ROIs (10% circa dell’area del fantoccio) una centrale e le altre rispettivamente ad ore 3,6,9,12; le 5 roi devono essere incluse in un ROI grande (90% dell’area del fantoccio). Infine abbiamo misurato la variazione di intensità del segnale nell’immagine SIV = (|SIc – ASIp| / ASIa) * 100%, dove SIc è l’intensità dell’immagine nella ROIs al centro e ASIp è il valor medio delle intensità di segnale in 4 piccole ROIs periferiche, ASIa è il valor medio delle intensità di segnale di tutte le 5 ROIs considerate. Il sistema Philips per ogni acquisizione fornisce il valore di SAR nel HEADER DICOM, mentre per i sistemi GE il SAR può essere cercato nel DICOM viewer del sistema PACS di visualizzazione delle immagini acquisite. Abbiamo utilizzato per tutte le misure il software IQWorks e ImageJ.

profili sensibilità bobina CTL 8 canali GE
0
50
100
150
200
0 50 100 150
u.a.
Inte
nsità
seg
nale
profili sensibilità bobina HNS 16 canali GE
0
50
100
150
200
250
300
350
0 50 100 150
u.a.
sign
ae c
anai
l
profili sensibilità bobina PHILIPS 15 canali parte SPINE
0500
10001500200025003000350040004500
0 100 200 300 400 500
u.a.
segn
ale
cana
le
profili sensibilità bobina PHILIPS 16 canali parte NEURO
-5000
5001000
150020002500
30003500
40004500
0 50 100 150 200 250
u.a.
segn
ale
cana
li
Dai risultati ottenuti la bobina SENSE Philips a 16 canali ha evidenziato una maggior sensibilità, un valore di IU simile a quello delle atre bobine, un SNR confrontabile a quello dell’altra bobina HNS GE a 16 canali ed una minor SIV, rispetto la bobina HNS GE a 16 canali e quella CTL ad 8 canali; i migliori valori di SNR per canale sono stati ottenuti con la bobina CTL spine ad 8 canali GE di sola ricezione, la miglior IU è stata ottenuta con la bobina HNS GE 16 canali, che però ha evidenziato una maggiore SIV.
confronto SNR delle 3 bobine
1
51101
151
201
251301
351
401
0 5 10 15 20
CTL GE 8 chan
HNS GE 16chan
SENSE PH 16chan neuro
SENSE PH 15chan spine
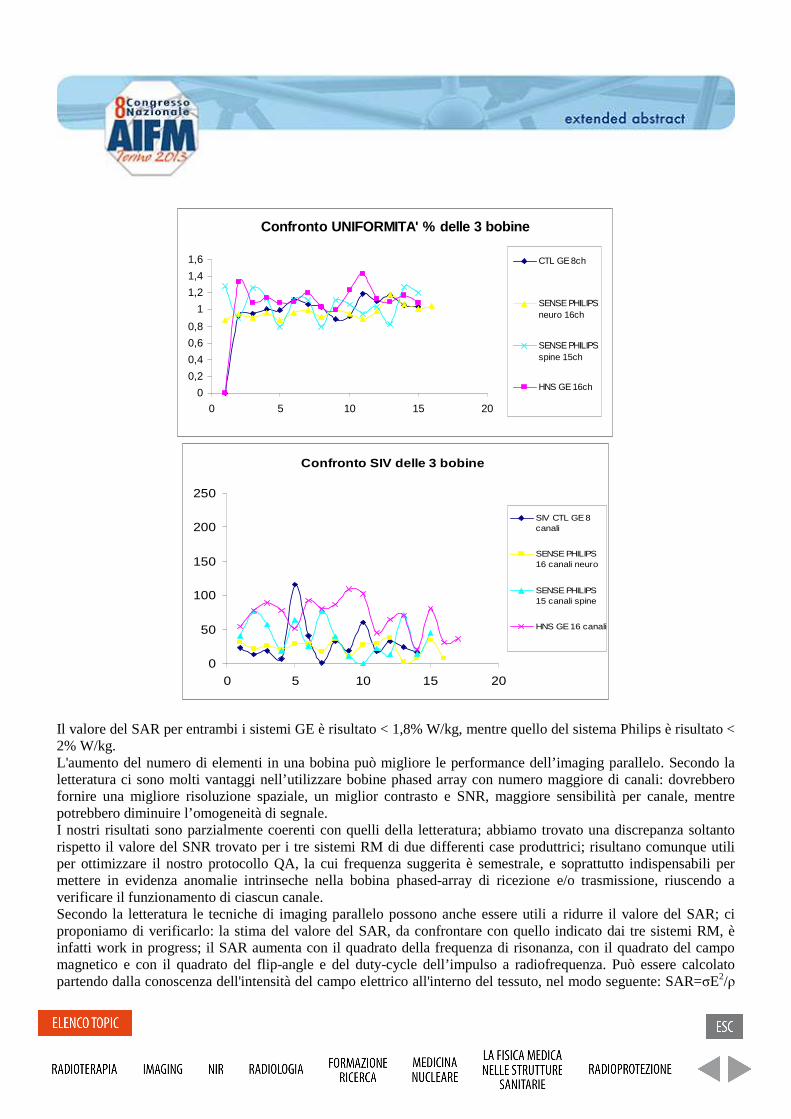
Confronto UNIFORMITA' % delle 3 bobine
0
0,2
0,4
0,6
0,8
1
1,2
1,4
1,6
0 5 10 15 20
CTL GE 8ch
SENSE PHILIPSneuro 16ch
SENSE PHILIPSspine 15ch
HNS GE 16ch
Confronto SIV delle 3 bobine
0
50
100
150
200
250
0 5 10 15 20
SIV CTL GE 8canali
SENSE PHILIPS16 canali neuro
SENSE PHILIPS15 canali spine
HNS GE 16 canali
Il valore del SAR per entrambi i sistemi GE è risultato < 1,8% W/kg, mentre quello del sistema Philips è risultato < 2% W/kg. L'aumento del numero di elementi in una bobina può migliore le performance dell’imaging parallelo. Secondo la letteratura ci sono molti vantaggi nell’utilizzare bobine phased array con numero maggiore di canali: dovrebbero fornire una migliore risoluzione spaziale, un miglior contrasto e SNR, maggiore sensibilità per canale, mentre potrebbero diminuire l’omogeneità di segnale. I nostri risultati sono parzialmente coerenti con quelli della letteratura; abbiamo trovato una discrepanza soltanto rispetto il valore del SNR trovato per i tre sistemi RM di due differenti case produttrici; risultano comunque utili per ottimizzare il nostro protocollo QA, la cui frequenza suggerita è semestrale, e soprattutto indispensabili per mettere in evidenza anomalie intrinseche nella bobina phased-array di ricezione e/o trasmissione, riuscendo a verificare il funzionamento di ciascun canale. Secondo la letteratura le tecniche di imaging parallelo possono anche essere utili a ridurre il valore del SAR; ci proponiamo di verificarlo: la stima del valore del SAR, da confrontare con quello indicato dai tre sistemi RM, è infatti work in progress; il SAR aumenta con il quadrato della frequenza di risonanza, con il quadrato del campo magnetico e con il quadrato del flip-angle e del duty-cycle dell’impulso a radiofrequenza. Può essere calcolato partendo dalla conoscenza dell'intensità del campo elettrico all'interno del tessuto, nel modo seguente: SAR=σE2/ρ
dove σ è la conduttività elettrica del campione, E è il valore efficace (RMS) dell'intensità del campo elettrico e ρ è la densità del campione. Inoltre è legato alle variazioni di temperatura dalla relazione: SAR=CdT/dt. References:
[1] Acceptance testing of magnetic resonance imaging systems: Report of AAPM Nuclear Magnetic Resonance Task Group No.6 - Med.Phys. (1992) 19 (1):217-229.
[2] Quality Assurance methods and phantoms for magnetic Resonance Imaging: Report of AAPM Nuclear Magnetic Resonance Task Group No.1 - Med.Phys. (1990) 17 (2):287-295.
[3] IPEM Report n. 80 (1998) [4] ASSET Parallel Imaging on the GE Scanner; Kevin F. King GE Healthcare, Milwaukee, WI (2005) [5] An introduction to coil array design for parallel MRI; Michael A.Ohliger and Daniel K. Sodickson NMR
Biomed. (2006); 19: 300–315 [6] Coil sensitivity map-based filter for phased-array image reconstruction in Magnetic Resonance Imaging;
Giulio Giovannetti Int. J. Biomedical Engineering and Technology, Vol. 1, No. 1, 2007 [7] Sensitivity of an Eight-element Phase Array Coil in 3 Tesla MR Imaging: a basic analysis; Yoshiyasu
Hiratsuka, Magn Reson Med Sci Vol. 6 No. 3 pp. 177-181 (2007) [8] MRI of the Wrist at 7 Tesla using an 8 Channel Array Coil Combined with Parallel Imaging: Preliminary
Results; Gregory Chang, M.D J Magn Reson Imaging. 2010 March; 31(3): 740–746. [9] Evaluation of Virtual Observation Points for Local SAR Monitoring of Multi-Channel Transmit RF Coils
at 7 Tesla ; 1Erwin L. Hahn Institute for MRI, University of Duisburg-Essen, Essen, Germany, Proc. Intl. Soc. Mag. Reson. Med. 21 (2013)
[10] Comparison of three multichannel transmit/receive radiofrequency coil configurations for anatomic and functional cardiac MRI at 7.0T: implications for clinical imaging; L. Winter, P. Kellman, W. Renz, A. Gräßl, F. Hezel, C. Thalhammer, F. Knobelsdorff-Brenkenhoff, Eur Radiol DOI 10.1007/s00330-012-2487-1
[11] Evaluation of Image Quality of a 32-Channel versus a 12-Channel Head Coil at 1.5T for MR Imaging of the Brain; P.T. Parikh G.S. Sandhu K.A. Blackham M.D. Coffey D. Hsu K. Liu J. Jesberger M. Griswold J.L. Sunshine, AJNR Am J Neuroradiol 32:365–73 Feb 2011

Disegno, Costruzione e Validazione di Bobine a Radio Frequenza di Superficie a 7T con Tecnologia Microstrip
Design, Construction and Testing of 7T RF Surface Coils with Microstrip Technology
A. Vitacolonna 1,2, A. Retico 3, M. Alfonsetti 1,2, A. Galante 1,2, N. Fontana 3,4, A. Monorchio 3,4, G. Manara 3,4, R. Stara 3,5, G. Tiberi 6, M. Tosetti 7, and M. Alecci 1,2
(1) Dipartimento Medicina Clinica, Sanita’ Pubblica, Scienze della Vita e dell'Ambiente, Universita’ degli Studi dell'Aquila, Via Vetoio 10, Coppito, L'Aquila 67100, Italy. (2) Istituto Nazionale di Fisica Nucleare, Laboratori Nazionali del Gran Sasso, S.S. 17 bis km 18910, Assergi, L'Aquila 67010, Italy. (3) Istituto Nazionale di Fisica Nucleare, Sezione di Pisa, Largo B. Pontecorvo 3, Pisa 56127, Italy. (4) Dipartimento di Ingegneria dell'Informazione, Universita’ di Pisa, Via G. Caruso 16, Pisa 56122, Italy. (5) Dipartimento di Fisica, Universita’ di Pisa, Largo B. Pontecorvo 3, Pisa 56127, Italy. (6) Fondazione IMAGO7, Viale del Tirreno 341, Calambrone, Pisa 56128, Italy. (7) IRCSS Fondazione Stella Maris, Viale del Tirreno 341, Calambrone, Pisa 56128, Italy.
Purpose: In the past decade Ultra-High-Field (7-9.4T) human MRI scanners have been developed with the aims to improve SNR, spatial/spectral resolution and observe the signal from nuclei other then proton [1]. Such UHF applications require the development of specially designed Radio Frequency (RF) coils [2]. We report the design, construction and testing of 7T RF surface coils made with microstrip technology. We developed a 7T double-tuned (31P/1H) RF coil suitable for the lower limbs (DT) and a 7T single-tuned (1H) RF coil for the neck (NEC). Methods: The adopted DT design is made by 3 microstrip line elements (lenght 190 mm) tuned at the relevant 7T frequencies by means of chip capacitors connected at each end. The central microstrip is used for 1H MR imaging and the two lateral microtrips for 31P MR spectroscopy. A segmented copper RF shield has been used to maintain RF ground continuity. The single tuned RF NEC is made by 3 identical short length copper strips (lenght 100 mm) with equal separation of 5 mm. The strips are positioned on top of a copper ground plane. EM numerical models of both prototypes have been carried out by using the commercial software HFSS11.0. The eigenvalue method was used to characterize the magnetic/electric field distributions of each resonant mode. Results: The 7T DT prototype was tested on the workbench by using a network analyser. The comparison between the model and experimental data shows a good agreement of the resonant frequencies (deviation<4%). The MRI testing was performed on the 7T General Electric Scanner of the Imago7 Foundation, Pisa. A phantom made by a plastic rectangular bottle containing2 litres of a 0.1M KH2PO4 water solution was used for testing. At a first stage, the 1H channel of the RF coil was tested using a SPGR (TR=11ms, TE=6ms, NEX=8, FOV=240mm). The measured SNR was about 600. Finally, the 31P channel was tested with a spectroscopic sequence (TR=2000ms, FA=90). The SNR of the 31P spectrum was about 180. The EM modelling of the NEC coil required a chip capacitor of 4.10pF, giving the first useful mode at 300MHz. Work is in progress to build a 7T NEC prototype corresponding to the EM model. Conclusions: We have designed and tested novel RF surface coils suitable for 7T MRI. Work is in progress to test the microstrip RF coils with volunteers. References: [1] Kilsdonk ID, et al. J Neurol Neurosurg Psychiatry. 2013. [2] M. Alecci et al. RM2007A000585, 12 novembre 2007.

Monte Carlo simulations in SPECT-CT imaging for Selective Internal Radiation Therapy of liver
malignancies with Y-90 microspheres. G. Magro
1,2, F. Longo
3,4, F. Bonutti
5, A. Cecotti
6, R. Padovani
5.
(1) CNAO National Center for Oncological Hadrontherapy, Pavia (2) University of Pavia (3) University of Trieste
(4) INFN, Trieste (5) A.O.U. S. Maria della Misericordia – Medical Physics Dept., Udine (6) A.O.U. S. Maria della
Misericordia – Nuclear Medicine Dept., Udine
Purpose: the quality of Bremsstrahlung images of patients treated with Y-90 is poor, mainly because of scattered
radiation and collimator septa penetration. To find the best energy window for the imaging that minimizes these
effects, a MC simulation of a SPECT acquisition on a Y-90 phantom was made with the Geant4/Gate software, [1].
Methods and materials: we tested the code in simulating the decay kinetic and the SPECT scanner geometry by
using two different models for the EM-Physics, to find the best setup to reproduce the real experiment, in terms of
scanner geometry and energy resolution: the Penelope (PEN), [2], and the Standard (STD) model. The PEN model
was specifically developed for MC and great care is given to the low energy description (atomic effects). The code
validation was performed with a cylindrical phantom filled with a water solution of Tc-99m.
Results: we found that PEN is more accurate in reproducing the experimental data, but not useful if the primary
component of the acquired spectrum is needed, since characteristic X-rays are included if having not experienced
any scatter interaction. We also found that the best fit on the data resulting from the bin-by-bin subtraction between
PEN and STD can be obtained with the sum of 6 Gaussians, each one reproducing the expected characteristic
emission together with its Iodine escape peak. We took this as a proof of the reusability of the STD model for our
purposes. The use of the STD model not only guarantees for the correct division of the total spectrum, but also
halves the computation time. The spectrum decomposition obtained for Y-90 showed that the clinical image
reconstruction is mainly due to scattered photons: primaries amount to 30% of total counts. The primary photons
fraction shows a minimum of 1/5 around 47 keV, then it increases with energy and reaches a ratio of 1/3 at 250
keV, suggesting that the spatial resolution should also increase with energy. To verify the MC results, we prepared
a linear source of Y-90 inserted into a PMMA phantom for the CTDI measurement to reproduce the scatter
medium and acquired it using 6 adjacent energy windows. Then, the activity profiles were measured. The Full
Width at the n% of the Maximum were assessed to find how the spatial resolution changes with energy.
Conclusion: a minimum around 140 keV for the FW@n%M was found, that corresponds to a compromise
between maximizing the primary photons fraction and minimizing the collimator septa penetration.
References
[1] Jan, GATE: a simulation toolkit for PET and SPECT, Phys Med Biol (2004) 49, 4543-61
[2] Barò, PENELOPE: an algorithm for MC simulation of the penetration and energy loss of electrons and
positrons in matter, Nucl Instr Meth Phys Res B (1995) 100, 31-46
Verifica del posizionamento in trattamenti radioterapici della pelvi e del torace con un
sistema a scansione laser.
Setup verification of radiotherapy treatments in pelvic and thoracic regions with a laser based
scanning system.
S. Pallotta1,2
, G. Simotacchi2, M. Ceroti
3, L. Marrazzo
2, F. Paiar
2, G. Biti
1,2, M. Bucciolini
1,2
(1)University of Florence, (2) Azienda Ospedaliero-Universitaria Careggi, Firenze, (3) ISPO, Firenze
Purpose: Most of the setup verification systems employed in radiotherapy treatments use ionizing
radiation to visualize bone structures. Alternatively external body surfaces can be acquired with
optical systems that, due to the absence of any additional radiation exposure, are interesting solutions
for daily repositioning checks The aim of this work is to investigate the performances of Sentinel a
laser/camera surface imaging system, when used on patients treated in pelvic and thoracic regions.
The system accuracy was evaluated comparing registrations results from concurrent Sentinel and
CBCT acquisitions.
Methods and materials: The system was tested on 14 patients: 6 were treated for cancer in the
pelvic region and 8 in the thorax region. For all of them the reproducibility of external body surfaces
was optimized and a wide surface (larger than the region to be treated) was captured. As reference
external body surfaces extracted from planning CT and surface data captured by Sentinel system at
the first treatment were employed. All patients were treated using an Elekta Synergy® beam
modulator Linac equipped with an HexaPOD RT CouchTop and an XVI CBCT. The system
accuracy was evaluated comparing registrations results from concurrent Sentinel and CBCT
acquisitions.
Results
Mean absolute differences between CBCT and Sentinel registration results were less than 2.7 mm
and 0.9° and 2.8mm and 1° for thorax and pelvis respectively. No advantage in considering surface
data captured by Sentinel as a reference instead of the surface extracted from the planning CT was
observed. For a small percentage of the considered cases, differences of up to 8mm between CBCT
and Sentinel were obtained. Differences between CBCT and Sentinel registration parameters resulted
less than 5.7 mm and 2° in the 90% of the pelvis and thorax considered cases.
Conclusions Differences between Sentinel and CBCT registration results are for some patient comparable to PTV
margins. This issue requires attention for a Sentinel routinely use even if good performances can be
obtained paying attention to the reproducibility of external body surfaces.

Programma di qualificazione degli scanner PET dei trial clinici in Italia per studi onco-ematologici.
PET scanner Clinical Trial Qualification program in Italy for onco-haematological studies Stéphane Chauvie1, Federica Fioroni2 Marco Brambilla3 on behalf of AIFM in joint AIFM-AIMN-FIL commission (1) Santa Croce e Carle Hospital, Cuneo (2) IRCCS Arcispedale S. Maria Nova, Reggio Emilia, (3) Ospedale Maggiore della Carita’, Novara
Purpose: the aim of this work is to perform the Clinical Trial Qualification (CTQ) of the PET scanners used to scan patients performing clinical trials managed by the Italian Foundation on Lymphoma (FIL). Methods and materials: A questionnaire regarding quality assurance (QA) program has been circulated among PET sites. Uniform and image quality NEMA/IEC phantoms acquired with standard acquisition and reconstruction techniques are uploaded to a central server and analysed within the CoreLab. Measured activity concentration is compared to expected one in the uniform phantom. Recovery coefficient curve is calculated in the NEMA/IEC phantom and compared to EANM guidelines (Boellard, 2010). Results: In the first year of activity of the CoreLab 62 PET sites required CTQ and 52 sites uploaded images for 53 PET scanners. At now 38 scanners were CTQed and 14 are in progress. The CTQ was carried out in a single iteration in 22% of sites, in 2 in 27%, in 3 in 27% and in more than 3 in 24%. The principal problems arising during CTQ related to the image quality phantom were 5 cases in which not all the sphere were filled with concentration higher than background, 2 cases in which the sphere not properly filled (presence of bubbles), in 14 cases the measured activity was different respect to expected one and in 10 cases data for calculation were missing. Problems in uniform phantom were due in 14 cases to difference between measured and expected activity and in 6 cases data for calculation were missing. PET images of uniform phantom were not uploaded in 5 cases and CT’s in 3. Moreover uploaded images were not in DICOM format in 1 case and in 2 cases a wrong reconstruction algorithm was applied to the images. Two PET sites acquired a NEMA/IEC phantom after CTQ request and 1 a dose calibrator source. Conclusion: unless the AIFM and AIMN recommendation not all the Italian PET sites have a thorough quality assurance program for PET scanners in place. Further work should be done to facilitate the PET scanner qualification process in sites were not adequate personnel time is dedicated to PET QA.

Caratterizzazione delle variazioni strutturali indotte dalla Radioterapia nelle parotidi attraverso analisi di tessitura.
Characterization of structural changes induced by Radiotherapy in parotid glands through texture analysis. E. Scalco1, C. Fiorino2, G.M. Cattaneo2, G. Sanguineti3, G. Rizzo1. (1) Istituto di Bioimmagini e Fisiologia Molecolare, CNR, Segrate (Milano) (2) Dipartimento di fisica medica, Ospedale San Raffaele, Milano (3) Dept of Radiation Oncology and Molecular Radiation Sciences, Johns Hopkins University, Baltimore (MD), USA
Purpose: During Radiotherapy (RT) of head-and-neck cancer, parotid glands undergo significant anatomic, functional and structural variations. These changes are likely to be pre-clinical signs of increased risk of acute (and late) xerostomia and could also be correlated to the severity of symptoms. Aim of this work was to propose texture analysis in order to characterize parotid gland structure and its changes induced by RT. Moreover, we investigated if early variations of textural features can be used to assess parotid shrinkage at the end of RT. Methods and materials: Texture analysis was performed on 42 parotid glands using CT images of 21 patients treated with IMRT. Statistical indices (mean intensity (µ), variance (σ2), global and local entropy (S1 and S2), homogeneity (H)), fractal dimension (FD) and volume (V) were extracted on parotids on the first, second and last week of RT. t-test between parameters estimated on first and second week and on first and last week was performed to individuate which indices significantly varied during RT (significance level at p<0.05). Fisher's linear discriminant function analysis was applied to these significant variations in the first two weeks of RT, in order to assess the power of textural indices in predicting parotid shrinkage. A priori classification was based on the amount of total parotid volume decrease. Discriminant analysis was applied to each index and to different combinations of parameters and accuracy of classification was estimated. Results: A significant decrease was found in V, µ, S2 and FD during the first two weeks and during the whole treatment (ΔV=-2cm3 and -7cm3, Δµ=-2.4HU and -4.5HU, ΔS2=-0.06 and -0.32, ΔFD=-0.015 and -0.025). Accuracy of discriminant analysis was higher for combination of parameters than for single indexes, and the combination of V and FD reached the best performance (accuracy of 71%). Conclusion: Texture analysis could be used to characterize structural modifications on parotid glands during the course of RT. The significant decrease in µ, S2 and FD could be related to the loss of acinar cells after irradiation and a consequent decrease in tissue complexity. Significant changes in the first two weeks of RT, estimated by multi-parametric analysis, promise to be able to early predict final shrinkage. In particular, the use of FD in addition to V reached the best classification, not improved when other textural parameters were included.
Caratterizzazione di un tomografo PET-TC per imaging con 64Cu
PET-CT imaging with 64Cu: performance measurements and optimization L.D'Ambrosio1,2, L.Aloj1, P.Chiaramida3, G.Valentini4, D.Martini4, P.Gaballo1, E.Squame1, S.Lastoria1
(1) SC Medicina Nucleare, Istituto Nazionale Tumori, Fondazione "G. Pascale", IRCCS, Napoli; (2) UOSD Fisica Sanitaria, Istituto Nazionale Tumori, Fondazione "G. Pascale", IRCCS, Napoli; (3) GE Healthcare, Roma, ITALY (4) ACOM S.p.A, Montecosaro (MC)
Purpose Non-traditional positron-emitting radionuclides, particularly those of the transition metals, have gained considerable interest for imaging PET because of increased production and availability. Significant research effort has been devoted to 64Cu because of its longer half-life (t1/2=12.7 h) and decay properties [beta+ emission (655 keV-17.4%) and beta- emission (573 keV-39.0%)], making it suitable for PET imaging and radionuclide therapy. PET imaging allows pre-treatment dosimetry studies and response evaluation in the post-treatment phase. We have characterized the imaging properties of this isotope with a Discovery 600 (General Electric) PET-CT system in this study. Methods and materials A well counter correction calibration was performed to obtain absolute quantitation estimates from the PET images. Sensitivity and spatial resolution were measured following NEMA NU-2-2007 procedures. PET image quality (IQ) was evaluated with the NEMA IEC Body phantom with only hot lesions in cold and warm background (sphere/background activity lesion ratio of 32:1). The hot sphere contrast recovery coefficient (CRC) and background variability (BV) ratios are used as measures of image quality. The accuracy of the attenuation and scatter corrections is determined from this measurement as the residual errors (RE) in the lung region. IQ data were corrected for random coincidences, geometry, normalization, dead time losses, scatter and attenuation. Image reconstruction was performed using the VUE-point HD reconstruction algorithm. Further settings (iterations, subsets and FWHM post filter) were chosen in order to evaluate the influence of reconstruction parameters on image quality. Results: The transverse (axial) spatial resolution values were 4.90 (5.47) mm and 5.63 (6.07) mm at 1 cm and 10 cm off axis, respectively. Sensitivity (average between 0 and 10 cm) was 1.59 cps⁄kBq. CRCs were in the order of 77-81% (largest sphere) and 23-39% (smallest sphere) depending on the reconstruction parameters. Dependence of BV on the reconstruction parameters was more evident (in the order of 4.8-8.3% for the largest sphere). RE over the lung insert was in the order of 23-55%. Reconstruction with 3 it, 16 sub and 5 mm post filter (CRC=80.7%, BV=5.2 %, RE=37%) was subjectively identified as yielding the best image quality by two physicians. Conclusions 64Cu PET measurements provide high resolution and sensitivity and accurate quantitative information that can be of clinical use.

In phantom evaluation of a CT iterative reconstruction algorithm S. Guariglia1 , G. Meliadò1., E. Zivelonghi1, L. Pinali1 S. Montemezzi1 , C. Cavedon1 (1) Azienda Ospedaliera Universitaria Integrata – Verona
Purpose: The increasing number of CT examinations in clinical routine has induced a constantly growing interest in dose reduction [1,2]; the availability of larger computational capacities oriented all major vendors toward the development of iterative reconstruction algorithms. The aim of this work was to evaluate in terms of image quality an iterative reconstruction algorithm (iDOSE4), available on a 256-slice CT scanner, by using a CT-specific phantom.
Materials and methods: Measurements have been performed on a Billiance iCT 256 slice scanner (PHILIPS Healthcare), equipped with the iDOSE4 algorithm reconstruction. iDOSE4 is based on an iterative approach that attempts to reduce image noise without modifying the noise power spectrum (NPS) in order to maintain the same noise texture of a filtered back-projection method (FBP) and to avoid the plastic texture typical of iterative reconstructions. In a first step the algorithm starts removing noise in the raw data domain, then in a second step it removes noise in the image domain to iteratively eliminate the quantum image noise[3]. It is possible to choose 6 or 7 different levels of iteration of the iDOSE4 algorithm, depending on the parameters of the scan. A Catphan600 phantom (The Phantom Laboratory, NY) [4] was used with
• CTP404 to evaluate CT number linearity and CNR on a high contrast Teflon insert,• CTP515 module to evaluate CNR (evaluation on the 1% contrast detail),• CTP528 module to evaluate high contrast resolution (MTF)• CTP486 module to assess non uniformity and SNR [5].
All parameters have been evaluated using IQWorks v0.7 software [6]. We performed different acquisitions at 120 kV, 2 mm slice thickness, using three different filters (standard smooth B, medium C and hard YB) and changing mAs in order to obtain 60%, 50%, 40%, 30% and 25% dose reduction from the base line of 200 mAs. We reconstructed all the images using FBP and the iDOSE4 algorithm at levels 1 to 6.
Results: CT number is preserved with the use of iterative reconstruction and the standard deviation shows an improvement of about 45% passing from FBP to iDOSE4 level 6. SNR and CNR improved from FBP to iDOSE4 and the improvement was enhanced by increasing iDOSE4 level as reported in Fig. 1 The mean percent improvement from FBP to iDOSE4 level 6 is reported in Tab. 1 for 120 kV scan with different filters, (the mean is intended over all different mAs used in this study). Kernel SNR CNR 1% CNR teflon B 71.6% 69.2% 68.2% C 71.2% 76% 69.8% YB 69.9% 64.3% 78%
Tab. 1 Mean percent improvement for SNR and CNR for iDOSE4 level 6 respect FBP for different kernels.

Fig. 1 SNR and CNR at different level of iDOSE4
MTF and uniformity are not affected by the use of iterative reconstruction as reported in Tab. 2.
Non uniformity MTF (lp/mm) reconstruction algorithm B C YB
reconstruction algorithm B C YB
FBP -0.112 -0.121 -0.114 FBP 0.33 0.36 0.54 iDOSE1 -0.112 -0.121 -0.114 iDOSE1 0.33 0.35 0.54 iDOSE2 -0.114 -0.120 -0.107 iDOSE2 0.33 0.35 0.54 iDOSE3 -0.112 -0.124 -0.103 iDOSE3 0.33 0.35 0.54 iDOSE4 -0.114 -0.125 -0.104 iDOSE4 0.33 0.35 0.54 iDOSE5 -0.112 -0.125 -0.115 iDOSE5 0.33 0.35 0.54 iDOSE6 -0.113 -0.133 -0.114 iDOSE6 0.33 0.35 0.55
Tab. 2 Non uniformity and MTF values at 120 kV and 150 mAs scan for different filters.
The observed behaviour of CNR, MTF, non uniformity and SNR as a function of the reconstruction algorithm was unaffected by the use of standard, smooth or hard filters. We also found that the same image quality of FBP was achievable with a 30% reduction of mAs and using iDose4-level3 reconstruction: in fact we observed in these conditions equal values of SNR, CNR, uniformity and MTF. This means that a 30% dose saving is possible if all the quality indexes of the image shall be preserved. On the other hand, where the most critical factor is high-contrast resolution, higher dose reduction seems to be achievable (up to 50%).
Conclusion: The iterative reconstruction technique reduces the noise and this results in an overall improvement of image quality at any given dose. So it is possible in general to use these techniques for an overall improvement of quality image or to reduce the dose to the patients. Our in-phantom results are encouraging but we have to consider that transferring results in clinical practice is not obvious: radiologists have to be minded to use iDOSE4 images and be familiar with these; for example, with increasing iDOSE4 level, a plastic texture appears that might in principle introduce a confounding element. A realistic clinical approach might be found in using the iterative reconstruction at different levels as a function of the specific diagnostic need. This approach, however, would need further investigation in order to be adopted.
References: [1] Brenner DJ, Hall EJ, Computed tomography-an increasing source of radiation exposure, N Engl J Med 2007; 357:2274-2284. [2] Diana L. Miglioretti, PhD; Eric Johnson, MS; Andrew Williams et al., The Use of Computed Tomography in Paediatrics and the Associated Radiation Exposure and Estimated Cancer Risk. JAMA Pediatr. 2013;167(8):700-707. [3] Beister M., Kolditz D., Kalender W.A., Iterative reconstruction methods in X-ray CT, Physica Medica Volume 28, Issue 2, April 2012, 94–108. [4] Catphan 500/600 manual. [5] Measurement of the Performance Characteristics of Diagnostic X-Ray Systems, Part III: 2nd Edition Computed Tomography X-Ray Scanners, 2003.[6] http://wiki.iqworks.org/.

Implementazione di CR mammografici per ottimizzare la qualità dell’immagine in pazienti neonati. Implementation of mammographic CR to optimize image quality in newborns patients. A. Mari1, C. Cavalieri2, S. Maggi1 (1) A.O.U. Ospedali Riuniti, SOD Fisica Sanitaria, Ancona, (2) Università Politecnica delle Marche, Ancona Purpose: pediatric radiology is always a difficult balance of very low dose and the difficulty in patient management all factors that reduce image quality. The prematures and newborns thorax bed exams are the peak of that situation were patient are connected with life-‐machine and placed inside incubator not always predisposed for Xray exams. The easiest and cheapest solution are CR but specific solution are not so diffused. In this study we evaluated the performance of mammografic CR to perform exams of these kind of patients . Methods and materials: we caracterized at IEC’s RQA3 and RQA5 three different CR: used standard CR (ST-VI by Fujifilm), new plate of the same type and mammographic CR (HR-BD by Fujifilm). For the last one’s we evaluated performances with mammographic calibration and with conventional Xray calibration. We measured MTF, NNPS and DQE and we analyzed also contrast detail with CDRAD with two different plexiglass thickness (7 and 10 cm) and we performed also some exams on patients. Results: the results showed a considerable loss of efficiency of the plate in use, and a DQE incorrect response at low doses especially with RQA3. The BD plates showed a slightly narrower response range than the VI. The BD showed a decrease of DQE increasing beam energy, and MTF is obviously better than in ST plate. NNPS results indipendent from energy and dose and also from plate. Contrast detail analysis shows that new plates have a better curve respect used, and BD are better for thinner patients. On patients, images depend hardly on singular situations, images acquired with identical doses appears noisier but with more definition and the possibility to see better lung parenchyma. Analysis of for presentation images shows that at lower doses systems anomalous DQE (for shapes, values and dose dependence) and maybe spurious information could be represented on radiographic images. Conclusion: Althought the mammographic CR are not specific for pediatric radiology they permit to obtain with the same dose more informations. A lower kV analysis is suggested to improve low contrastperformances. At least plate and IP must be kept at best condition avaible, checked frequently and substituted when unadequate, expecially for use at low doses. References: [1] P. Monin, An image quality comparison of standard and dual-‐side read CR systems for pediatric radiology, Medical Physics (2006) 33, 411-‐20
Sviluppo di un modello emodinamico per lo studio del ritorno venoso cerebrale: analisi di sensitività e confronto con i risultati sperimentali. Development of a hemodynamic model for the study of cerebral venous outflow: sensitivity analysis and comparison with experimental results. G. Gadda1, M. Gambaccini1,2, F. Sisini1, A. Taibi1,2, M. Ursino3, P. Zamboni4 (1) Dipartimento di Fisica e Scienze della Terra, Università degli Studi di Ferrara, via Saragat 1, 44122 Ferrara (2) INFN Ferrara, via Saragat 1, 44122 Ferrara, Italy (3) Dipartimento di Ingegneria dell'Energia Elettrica e dell'Informazione, Università degli Studi di Bologna, viale Risorgimento 2, 40136 Bologna (4) Centro Malattie Vascolari, Università degli Studi di Ferrara, via Aldo Moro 8, 44124 Cona (Ferrara) Purpose: Blood redistribution due to posture changes in patients affected by vascular diseases is associated with the onset of venous obstructions. To evaluate this distribution, we developed a lumped model for the simulation of the intracranial and jugular/vertebral hemodynamics that allows us to study altered hemodynamics profiles and to correlate model parameters to these profiles. In this work we show a sensitivity analysis of the model together with the Echo-‐Colour Doppler (ECD) measurements performed to compare experimental blood flows with model outputs. Methods and materials: The mathematical model is a system of ordinary differential equations composed by two submodels. The first model simulates intracranial hemodynamics while the second one simulates the hemodynamics of jugular and vertebral ducts and includes the effect of the hydrostatic pressure gradient suffered by collapsible vessels in upright position. We used literature data to adjust parameters in order to reproduce proper blood flows and we chose the Berkeley Madonna software to solve the system of equations. A sensitivity analysis is performed by looking at the model results during simulations of posture change and lack of drainage of specific ducts. An experimental validation of the model is possible by the evaluation of jugular and vertebral blood flows in healthy subjects, obtained through the measurements of cross sectional area (CSA) of the vessels and time average blood velocities (TVA) using ECD technique. Results: Sensitivity analysis shows that postural change simulation affects flows and pressures in different ways depending on the conductance we chose to be null, without deviations from the expected physiological results. ECD data are in good agreement with the distribution of flows (normalized to the total inflow) predicted by the model, but absolute values are often distant from the physiological trend. Conclusion: The model in its present form is useful to simulate human hemodynamics affected by vessel obstructions in a simple way. We need to perform more ECD acquistions to increase sample statistics and obtain a significant database to extract reliable data.
Riproducibilità e stabilità del valore del SUV del fegato e del MBPS nel contesto della pratica clinica internazionale.
Reliability and stability of liver and MBPS SUV values in the context of international clinical practice.
Fabrizio Bergesio, Elisa Bertone, Alessandra Terulla, Stéphane Chauvie Medical Physics Unit, Santa Croce e Carle Hospital, Cuneo
Purpose: Liver and Mediastinal Blood Pool Structures (MBPS) uptake are an important reference background in assessment of response for PERCIST and the Deauville criteria. Methods and materials: 861 PET scans coming from 68 imaging centers worldwide distributed were analysed to retrieve SUV information in liver and MBPS. SUV of the liver were measured in a large areas of 5 cm in the posterior segment of the liver (segment VI) while SUV of the MBPS were measured in a small area of 1-1.5 cm in the aortic arch (areas of focal uptake were carefully excluded). Results: the CV for the liver SUV max and mean measurements carried out by the same readers three times in 20 patients acquired in the same scanner was 0.01 and 0.04. The coefficient of variation (CV) for 3 independent readers for SUV mean and max for 20 consecutive scans acquired on the same scanner was 0.03 and 0.07 respectively. SUV liver in the three different region of the liver(superior, middle and inferior) was respectively 1.84, 1.84 and 1.83 (SUV mean), 2.64, 2.68 and 2.51 (SUV max); CV showed p-values ranging from 0.27-0.98 for SUV mean and max. The intrinsic variability of the SUV, expressed as the standard deviation of the voxel SUV, in the 20 patients was 0.25 SUV units. The SUV mean and max for all patients was 1.88±0.48 and 2.62±0.67 respectively. No relationship was found between liver SUV and injected activity, patient weight or height. There was a significant difference in SUV mean and max for subjects with BMI >25 compared to < 25 (p<0.05). A strong correlation (p<0.01) was found between mean and max SUV in the liver and uptake time. SUV mean and max show a trend in decreasing in time, especially at very short and long time remaining more a less stable in a time frame between 60 and 90 minutes. Scans had SUV mean and max with time ≤ 75 minutes of 1.97±0.46 and 2.71±0.63 respectively and with time > 75 minutes of 1.81±0.48 and 2.55±0.70 respectively. There was a strong correlation between SUV mean (R2=0.43) and max (R2=0.36) in liver and mediastinal blood pool structures (MBPS). Conclusion: in conclusion, liver and MBPS are reliable reference organs for response assessment. Moreover SUV mean is less variable than SUV max. Finally SUV in liver and MBPS are strongly correlated.
Variazioni del protocollo di imaging PET nella pratica clinica internazionale per pazienti con linfoma.
PET imaging protocol variations in international clinical practice in lymphoma patients Fabrizio Bergesio, Elisa Bertone, Alessandra Terulla, Stéphane Chauvie Medical Physics Unit, Santa Croce e Carle Hospital, Cuneo
Purpose: the use of SUV as a surrogate biomarker inside clinical trials is potentially obstructed by the requirement for standardization of PET methods across various centers using several imaging. Methods and materials: a total of 68 centers contributed patients to different clinical trial in which a review of PET-CT scans was required. The 1402 scans were acquired following the routine local PET/CT protocol based on international guidelines. All DICOM headers were analysed to collect information on the scanning procedure. Results: DICOM header data were confirmed for patient weight (n=1133), height (n=564), uptake time (n=1315) and injected activity (n=1347). The study observed that the injected activity was ranging between 48 and 756 MBq due to the fact that some centers scaled it to body weight, while others used a fixed activity. The mean value and the standard deviation were calculated founding (321±91) MBq. The effective dose, calculated from ICRP, was (5.80±2.17) mSv. Uptake time mean value and standard deviation, obtained from a range value of 11-248 minutes, were (78±23) min. A normal distribution of uptake time over the 55-100 min range was found; the adherence to EANM guidelines for PET scanning (uptake time of 60±10 min) was confirmed only in 447 (34%) PET. The liver SUV mean and max for all patients were (1.88±0.48) g/ml and (2.62±0.67) g/ml respectively while the Mediastinal Blood Pool Structures (MBPS) SUV mean and max were (1.33±0.39) g/ml and (1.73±0.48) g/ml respectively. No relationship was found between liver SUV and injected activity, patient weight or height. There was a significant difference in SUV mean and max for subjects with BMI >25 compared to BMI< 25 patients (p<0.05). A strong correlation (p<0.01) was found between liver mean and max SUV and uptake time. Scans with time ≤ 75 minutes had SUV mean and max of 1.97±0.46 and 2.71±0.63 respectively; SUV mean and max in scans with time >75 minutes, instead were of 1.81±0.48 and 2.55±0.70 respectively. Conclusion: this study demonstrated that there is a wide variation in clinical practice regarding administrated activity for PET applications in lymphoma patients. The publication of EANM guidelines for tumor imaging recommending standardization of PET methods is timely (Boellard 2010).
Un nuovo marker di aggressività per il carcinoma prostatico basato sulle immagini T2-pesate in risonanza magnetica.
T2-weighted MR imaging: a new marker of prostate cancer aggressiveness. A. Vignati1, V. Giannini1, S. Mazzetti2, F. Russo1, C. Bracco2, M. Stasi2, D.Regge1. (1) Radiology Department, IRCCS Candiolo (TO) (2) Physics Department, IRCCS Candiolo (TO)
Purpose: Nowadays improving accuracy of risk assessment in prostate cancer (PCa) represents a compelling clinical need. Although it is well know that the signal intensity (SI) value on T2-weighted (T2-w) magnetic resonance imaging (MRI) is lower for PCa than for non-neoplastic prostatic tissue, its value in differentiating PCa aggressiveness is unknown. The purpose of this study is to investigate if T2-w SI correlates with the pathological Gleason Score (pGS), used as the reference standard for measuring the biological activity of PCa.Methods and materials: The study dataset comprises 31 men (mean age, 64 years) with biopsy proven PCa, including 9 men with pGS 3 + 3 tumours, 11 with pGS 3 + 4, 5 with pGS 4 + 3, and 6 with pGS 4 + 4. All patients underwent multiparametric MRI using a 1.5 T scanner and an endorectal coil. Imaging included a T2-w axial scan with the following technical parameters: TR/TE 2960/85 ms; FOV 16 cm; slice thickness 3 mm; acquisition matrix 384 x 288, reconstruction matrix 512 x 512. Data were processed with in-house software packages based on C++ algorithms and ITK libraries. Intensity inhomogeneity correction field was performed by the combination of a phantom intensity profile and a median smoothing of the original T2-w image. The obturator muscle (OBT) region was geometrically identified, based on the coil position obtained through the Hough transformation. The OBT was then automatically extracted using K-means algorithm and morphological operations, and the T2-w volume was normalized by the median value of the OBT. The Pearson coefficient (R) assessed the correlation between T2-w SI of the tumours and their pGS.Results: The T2-w mean SI values ± SD for the different pGS groups were: 2.63 ± 0.67 for pGS 3 + 3; 2.19 ± 0.57 for pGS 3 + 4; 1.74 ± 0.31 for pGS 4 + 3; 1.81 ± 0.13 for pGS 4 + 4. A R = - 0.63 showed a moderate correlation between T2-w SI measured on tumours and the corresponding pGS.Conclusion: These preliminary results, that needs to be confirmed on a larger dataset, support the potential use of T2-w SI as a reliable imaging marker to predict cancer aggressiveness, also as an additional feature considered by computer-aided diagnosis (CAD) schemes.

Algoritmo per l’identificazione automatica del fegato in immagini PET
An automatic algorithm for liver recognition in PET imagesStéphane Chauvie, Elisa Bertone, Fabrizio Bergesio, Alessandra Terulla, Giulia Boretto, Medical Physics Unit, Santa Croce e Carle Hospital, Cuneo
Purpose: The aim of this work was to introduce and validate a fully automated approach for uptake measurement of liver in whole-body 18FDG positron emission tomography/computed tomography (PET/CT) scans to enable the reproducible calculation of tracer uptake in it.Methods: PET scans are all coregistered in the geometrical centre of the mass of the images. 3D matrix are then projected in coronal direction and convoluted with Heaviside function. The largest area of higher homogeneity is then identified in the projected images. An additional cutoff at the maximum radius distance from the geometric center of mass of the patient to the liver is added. SUV in the liver was extracted by the algorithm and manually in a central portion of the liver far at least 4 cm from the liver dome and 2 cm from the liver’s edge.Results: In the 560 PET scan, coming from more than 40 PET center distributed in 21 nations, the algorithm identified the liver in the 100% of the cases. SUV in the liver measured by the algorithm and manually were 1.95±0.49 and 1.85±0.48 (p<0.01).Conclusions: SUV liver as extracted by the algorithm was in a good agreement with manual method. The algorithm created with this work has optimal characteristics to be used in different PET application, as an image quality assessment of automatic PET image segmentation.
Accuratezza della localizzazione per radiochirurgia stereotassica con TomoTherapy
Localization accuracy for stereotactic radiosurgery with TomoTherapy
S. Pallotta1,2, V. Reggioli1, M. Bucciolini1,2
(1) University of Florence, (2) Azienda Ospedaliero-Universitaria Careggi, Firenze.
Purpose: TomoTherapy could potentially provide an efficient advantage as a stereotactic radiosurgery
delivery system especially in the case of multiple intracranial targets. The non-isocentric approach, specific
of TomoTherapy treatments, can in fact lead to a significant time sparing compared to conventional
techniques with multiple isocentres. In order to perform stereotactic treatment high gometrical accuracy of
the image guidance system provided with TomoTherapy is needed. In this study the global accuracy of the
positioning procedure has been assessed considering the contribution of Mega Voltage CT (MVCT) slice
thickness and registration algorithms.
Materials and Methods: A plastic phantom with glass spheres ( GSs) inserted in known positions was
designed and realized in order to simulate 8 targets and estimate the accuracy of their localisation. The
contribution of slice thickness and registration algorithms were tested by acquiring MVCT scans of the
phantom to which known shifts had been applied with respect to the planning CT data set. Corse medium
and fine resolution were used to acquire MVCT images. For each applied shift and resolution used, manual
and automatic registration (Bone and tissue and Bone algorithms) were performed and the obtained
registration results were compared with known shifts. The global geometrical accuracy was tested preparing a
plan of the phantom in which 6 of the 8 GSs were used as targets. The phantom was positioned on the
Tomotherapy couch, with a gafchromic film inside, and the treatment was delivered. The gaf-chromic film
was digitalized and the dose distribution centroids relative to each GS were then evaluated and compared
with correspondent GS known positions.
Results: The accuracy in target localization depends on MVCT image resolution and results comparable to
voxel size. Better results were obtained when manual registration and fine resolution were used. In this case
the mean value of the absolute differences between applied shifts and known values were: 0.13+0.42 mm;
0.50+0.46mm; and -0.10+0.65 mm respectively along lateral, longitudinal and vertical directions.
The global localization accuracy tested with gaf-chromic films showed a mean difference between dose
distribution centroids and GS positions of 0.93+0.48mm.
Conclusions: Image guidance using the MVCT feature of the TomoTherapy Hi-Art System confirms that
the system is capable of phantom localization with voxel accuracy.
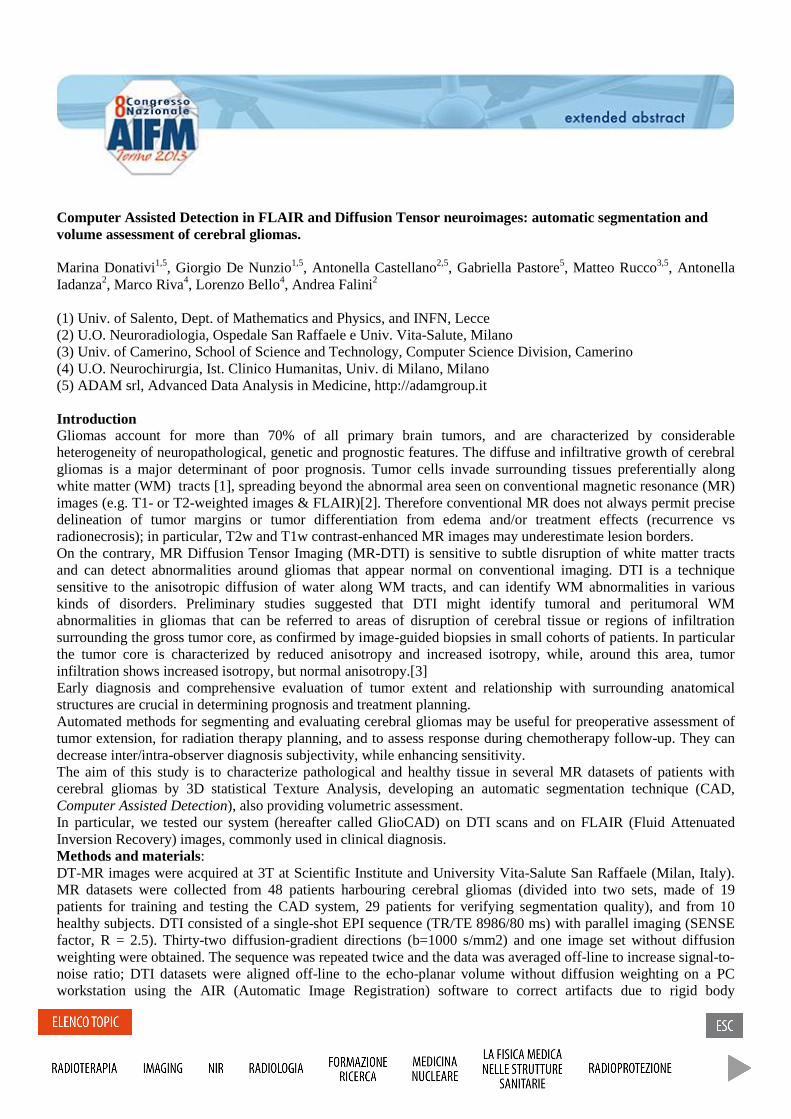
Computer Assisted Detection in FLAIR and Diffusion Tensor neuroimages: automatic segmentation andvolume assessment of cerebral gliomas.
Marina Donativi1,5, Giorgio De Nunzio1,5, Antonella Castellano2,5, Gabriella Pastore5, Matteo Rucco3,5, AntonellaIadanza2, Marco Riva4, Lorenzo Bello4, Andrea Falini2
(1) Univ. of Salento, Dept. of Mathematics and Physics, and INFN, Lecce(2) U.O. Neuroradiologia, Ospedale San Raffaele e Univ. Vita-Salute, Milano(3) Univ. of Camerino, School of Science and Technology, Computer Science Division, Camerino(4) U.O. Neurochirurgia, Ist. Clinico Humanitas, Univ. di Milano, Milano(5) ADAM srl, Advanced Data Analysis in Medicine, http://adamgroup.it
IntroductionGliomas account for more than 70% of all primary brain tumors, and are characterized by considerableheterogeneity of neuropathological, genetic and prognostic features. The diffuse and infiltrative growth of cerebralgliomas is a major determinant of poor prognosis. Tumor cells invade surrounding tissues preferentially alongwhite matter (WM) tracts [1], spreading beyond the abnormal area seen on conventional magnetic resonance (MR)images (e.g. T1- or T2-weighted images & FLAIR)[2]. Therefore conventional MR does not always permit precisedelineation of tumor margins or tumor differentiation from edema and/or treatment effects (recurrence vsradionecrosis); in particular, T2w and T1w contrast-enhanced MR images may underestimate lesion borders.On the contrary, MR Diffusion Tensor Imaging (MR-DTI) is sensitive to subtle disruption of white matter tractsand can detect abnormalities around gliomas that appear normal on conventional imaging. DTI is a techniquesensitive to the anisotropic diffusion of water along WM tracts, and can identify WM abnormalities in variouskinds of disorders. Preliminary studies suggested that DTI might identify tumoral and peritumoral WMabnormalities in gliomas that can be referred to areas of disruption of cerebral tissue or regions of infiltrationsurrounding the gross tumor core, as confirmed by image-guided biopsies in small cohorts of patients. In particularthe tumor core is characterized by reduced anisotropy and increased isotropy, while, around this area, tumorinfiltration shows increased isotropy, but normal anisotropy.[3]Early diagnosis and comprehensive evaluation of tumor extent and relationship with surrounding anatomicalstructures are crucial in determining prognosis and treatment planning.Automated methods for segmenting and evaluating cerebral gliomas may be useful for preoperative assessment oftumor extension, for radiation therapy planning, and to assess response during chemotherapy follow-up. They candecrease inter/intra-observer diagnosis subjectivity, while enhancing sensitivity.The aim of this study is to characterize pathological and healthy tissue in several MR datasets of patients withcerebral gliomas by 3D statistical Texture Analysis, developing an automatic segmentation technique (CAD,Computer Assisted Detection), also providing volumetric assessment.In particular, we tested our system (hereafter called GlioCAD) on DTI scans and on FLAIR (Fluid AttenuatedInversion Recovery) images, commonly used in clinical diagnosis.Methods and materials:DT-MR images were acquired at 3T at Scientific Institute and University Vita-Salute San Raffaele (Milan, Italy).MR datasets were collected from 48 patients harbouring cerebral gliomas (divided into two sets, made of 19patients for training and testing the CAD system, 29 patients for verifying segmentation quality), and from 10healthy subjects. DTI consisted of a single-shot EPI sequence (TR/TE 8986/80 ms) with parallel imaging (SENSEfactor, R = 2.5). Thirty-two diffusion-gradient directions (b=1000 s/mm2) and one image set without diffusionweighting were obtained. The sequence was repeated twice and the data was averaged off-line to increase signal-to-noise ratio; DTI datasets were aligned off-line to the echo-planar volume without diffusion weighting on a PCworkstation using the AIR (Automatic Image Registration) software to correct artifacts due to rigid body

movement during scan acquisition. T2-weighted Turbo-Spin-Echo (TSE) and T1-weighted Fast-Field-Echo (FFE)conventional imaging was performed for anatomic guidance and morphological characterization of the lesions.
Isotropic and anisotropic maps (MD, FA, MDp 3 , and 2MDqi
i ) were calculated. In order to
build a supervised procedure, manually-defined pathological regions of interests (ROIs) were drawn in consensuson each map by two experienced neuroradiologists using MRIcro software(http://www.mccauslandcenter.sc.edu/CRNL/tools). Scalp masks were generated using a combination ofthresholding and mathematical morphology in order to automatically exclude the background voxels and the boneof the skull. These masks were applied on each map.3D Texture analysis [4] was applied to the segmented ROIs. A total of 126 features from Grey-Level Histogram(GLH), Gray-Level Cooccurrence Matrices (GLCM), and Grey-Level Run-Length Matrices (GLRLM), werecalculated using a sliding-window approach: the (dilated) bounding boxes of the ROIs were regularly partitionedinto small overlapping sub-volumes of interest, called “svois”, in which the features were estimated. In this way,spatial distributions of features were assessed in each map (within the bounding boxes, where the tissue isessentially pathologic). In order to identify discriminating features, the same feature calculations were alsoperformed in the contralateral (usually healthy) ROIs (partitioned into “csvois”). Each svoi and each csvoi werelabeled as healthy or pathologic according to the class of its central voxel [5].In the supervised classification step, the image-feature dataset was split into a train and a test subset obtained byLeave One Patient Out (LOPO) cross-validation, a special case of k-fold cross-validation where k equals thenumber of patients.The feature-space dimensionality was reduced by Linear Discriminant Analysis (LDA), which allowed tissueclassification by simple thresholding.Classification quality for each diffusion map was assessed by ROC (Receiver Operating Characteristic) curvecalculation on the test set. A set of images that had not been used for training were automatically segmented bylocal tissue classification (again with a sliding-window approach, this time performed on the whole brain), andfinally a system for false-positive rejection (based on 1st-order features) was developed and applied. The automaticsegmentations were compared with the manual ones by the Jaccard similarity coefficient (JC), so giving a measureof the CAD-system quality. The JC measures similarity between sample sets (the CAD and manual ROIs, in ourcase), and is defined as the size of the intersection divided by the size of the union of the sample sets.All the software was written in the MATLAB environment (http://www.mathworks.it/products/matlab/), using theImage Processing toolbox and the MATLAB tools for NIFTI and Analyze image processing.With the purpose of allowing remote fruition of the CAD tool, a GUI (Graphical User Interface) was designed as aplugin for well-known visualization tools, such as Dycompiler and Osirix. The purpose of the interface is to offer asimple way of loading and displaying images, uploading them to a remote server, remotely running the CADsystem with the chosen options, receiving the output of the segmentation process and visualizing the automatically-created ROI on the initial image, together with volumetric measures of the identified tumor regions (Figure 1).
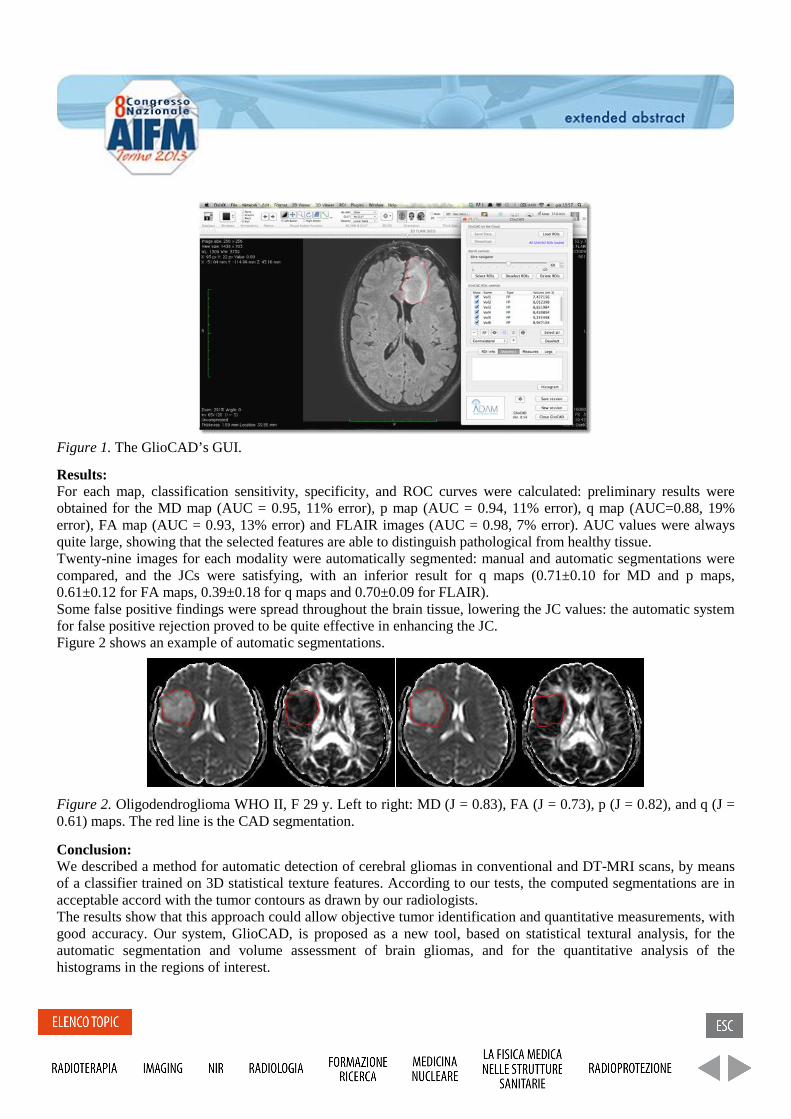
Figure 1. The GlioCAD’s GUI.
Results:For each map, classification sensitivity, specificity, and ROC curves were calculated: preliminary results wereobtained for the MD map (AUC = 0.95, 11% error), p map (AUC = 0.94, 11% error), q map (AUC=0.88, 19%error), FA map (AUC = 0.93, 13% error) and FLAIR images (AUC = 0.98, 7% error). AUC values were alwaysquite large, showing that the selected features are able to distinguish pathological from healthy tissue.Twenty-nine images for each modality were automatically segmented: manual and automatic segmentations werecompared, and the JCs were satisfying, with an inferior result for q maps (0.71±0.10 for MD and p maps,0.61±0.12 for FA maps, 0.39±0.18 for q maps and 0.70±0.09 for FLAIR).Some false positive findings were spread throughout the brain tissue, lowering the JC values: the automatic systemfor false positive rejection proved to be quite effective in enhancing the JC.Figure 2 shows an example of automatic segmentations.
Figure 2. Oligodendroglioma WHO II, F 29 y. Left to right: MD (J = 0.83), FA (J = 0.73), p (J = 0.82), and q (J =0.61) maps. The red line is the CAD segmentation.
Conclusion:We described a method for automatic detection of cerebral gliomas in conventional and DT-MRI scans, by meansof a classifier trained on 3D statistical texture features. According to our tests, the computed segmentations are inacceptable accord with the tumor contours as drawn by our radiologists.The results show that this approach could allow objective tumor identification and quantitative measurements, withgood accuracy. Our system, GlioCAD, is proposed as a new tool, based on statistical textural analysis, for theautomatic segmentation and volume assessment of brain gliomas, and for the quantitative analysis of thehistograms in the regions of interest.
References:[1] S.J.Price, R.Jena, N.G.Burnet, T.A.Carpenter, J.D.Pickard, J.H.Gillard, Predicting patterns of glioma recurrenceusing diffusion tensor imaging, Eur Radiol (2007); 17(7):1675-84[2]A.Pena, H.A.Green, T.A.Carpenter, S.J.Price, J.D.Pickard, J.H.Gillard, Enhanced visualization andquantification of magnetic resonance diffusion tensor imaging using the p:q tensor decomposition., Br J Radiol2006;79(938):101-9[3] S.J.Price, R.Jena, N.G.Burnet, P.J.Hutchinson, A.F.Dean, A.Pena, J.D.Pickard, T.A.Carpenter, J.H.Gillard,Improved delineation of glioma margins and regions of infiltration with the use of diffusion tensor imaging: Animage guided biopsy study, AJNR Am J Neuroradiol (2006); 27(9):1969-74.[4] R.Haralick, K.Shanmugam, I.Dinstien, Textural features for image classification. IEEE Trans Syst Man Cybern(1973). 6:610-21[5] G.De Nunzio, G.Pastore, M.Donativi, A.Castellano, A.Falini, A CAD system for cerebral glioma based ontexture features in DT-MR images. Nuclear Instruments & Methods in Physics Research Section A-AcceleratorsSpectrometers Detectors and Associated Equipment (2011) 648:S100-S102

Validazione in fantoccio di un algoritmo a soglia adattativa per il contornamento di lesioni alla PET
Phantom validation of an adaptive thresholding algorithm for 18F-FDG PET lesion segmentation L. Vigna1, R. Matheoud1, S. Valzano1, G. Loi1 , A.Bergantin2, D. Lizio1, M. Brambilla1. (1) Medical Physics Department, University Hospital “Maggiore della Carità”, Novara, Italy. (2) Imaging Department, Centro Diagnostico Italiano, Milano, Italy
Purpose: To validate an adaptive thresholding algorithm (ATA) on irregularly shaped 18FDG lesions in an anthropomorphic phantom. Methods and materials: The ATA was derived for the Biograph16 HI-REZ PET/CT scanner (Siemens Medical Solutions) from IEC phantom measures with spherical 18FDG target. The optimal threshold to yield the volume best matching the true value is only dependent on tissue-background ratio (TBr) and the amount of smoothing of the Gaussian filter (FWHM). This ATA proved to be robust and reliable on spherical object with absolute percent different with true spherical volumes of 8 ± 9 %. To simulate 18FDG oncological lesions we used two kind of materials: 1) a family of natural zeolites (small volume range: 4-7 cm3; TBr range: 5-44) and 2) flower foam that was carved to simulate several cancer lesions, such as head and neck, rectal and anal carcinomas (large volume range: 16-38 cm3; TBr range: 4-12). Both the materials used are irregularly shaped and able to uniformly absorb 18FDG solutions with different rate. The lesions were placed in different parts of the anthropomorphic phantom (lungs, liver, mediastinum) that were filled with clinical 18FDG concentrations. The phantom was acquired with the clinical PET/CT protocol and images were reconstructed with 3D-OSEM (2i x 24s, 8mm FWHM Gaussian filter) on a 256x256 frame (voxel volume 0.014 cm3). The lesions were delineated by means of ATA algorithm implemented on the workstation iTaRT (Tecnologie Avanzate, Torino). The accuracy and reproducibility in volume estimation for the ATA were evaluated: the former was defined as the difference between PET and CT volumes, the latter was defined as difference between PET volumes obtained by different users. Results: The ATA showed a mean difference and absolute percent difference between CT and PET volumes of -1 ± 1 cm3 and 14 ± 16 % for zeolites, of 1 ± 1 cm3 and 4 ± 2 % for foam. We showed that our algorithm implemented on workstation had a high reproducibility, about of 98% and there were limitations in the estimation of small volumes. Conclusion: our adaptive threshold algorithm is an accurate, robust and reproducible method. By the simple ATA presented in this study, a PET-based delineation of GTVs is clinically feasible.

CR Mammography: Image Quality and Dose Measurements for Needle vs. Powder Imaging Plate.
C. Ghetti(1), R.Rossi(1)
1Servizio di Fisica Sanitaria, Azienda Ospedaliero-Universitaria, Parma, Italy
Digital mammography has been progressively introduced in screening centres, since recent evolution of CR and DR detectors. Needle phosphor based computed radiography (CR) systems have been recently introduced and they promise improved image quality compared to powder phosphor based CR units for x-ray screening mammography. We have compared the imaging performance of needle CR cassettes, powder based CR cassettes and an a-Si (CsI-Tl) based flat panel based mammography system considered as the ‘gold standard’[1,2]. Several exposures have been performed with powder and needle phosphor CR and DR mammography units for comparing Average Glandular Dose (AGD) and Contrast-to-Noise Ratio (CNR) measured according to European guidelines for quality assurance in breast cancer screening and diagnosis. To detect contrast-detail curves we have used CDMAM 3.4 mammographic phantom with standard exposure conditions in order to obtain curve values for the standard breast. Results show that there are relevant differences among the mammography units. For the a-Si detector the AGD is always in the achievable range for every breast thickness, on the contrary for powder CR plates, for breast thickness inferior to 45 mm, AGD values are very near to the acceptable level. Looking at CNR parameter, a-Si detector has the highest values in the interval 15-34 and needle plates are slightly better than powder ones especially for thin breasts, with values that are respectively in the range of 7-12 and 5-9. The contrast-detail curves for needle plates and a-Si detector are very similar also for very small diameter of gold detail (less than 0.1 mm) on the contrary powder plates have a contrast-detail curve that is very close to acceptable values and for a 0.1 mm diameter, the percentage contrast is not acceptable. Imaging performance for the needle CR phosphor technology, characterized using CNR, AGD and contrast-details curves demonstrates an improvement compared to powder phosphor based CR systems, but the differences with DR systems are still relevant especially from the dosimetric point of view.
References:
[1]Marshall NW et al. Physical evaluation of a needle photostimulable phosphor based CR mammography system. Med Phys. 2012 Feb;39(2):811-24. [2] Chiarelli AM et al., Digital Compared with Screen-Film Mammography: Performance Measures in Concurrent Cohorts within an Organized Breast Screening Program. Radiology. 2013 Sep;268(3):684-93.
Quantificazione del contenuto di lipidi e macromolecule per differenziare glioblastomi e metastasi: uno studio con risonanza magnetica a 3T
Lipid and Macromolecules Quantitation in Differentiating GBM from Solitary MET: a short TE single-voxel MRS study at 3T
L. Orsingher1,2, G. Crisi1, S. Filice1 (1) Parma University Hospital Trust; Parma, Italy (2) University of Sacro Cuore - Rome
Purpose: The differentiation between solitary metastasis and glioblastoma is difficult by means of only MRI. MRS lipid signal indicates cellular necrosis both in GBMs and METs. The purpose of this prospective study is to determine whether a class of lipids and/or macromolecules, able to efficiently discriminate between these two types of lesions, exists. Methods and materials: Forty-one patients with solitary brain tumor (23 GBMs and 18 METs) underwent MR imaging and single-voxel MRS. Short echo time PRESS acquisition with CHESS water suppression technique was used. Spectra were analyzed using LCModel. Absolute quantification was performed with "water-scaling" procedure. The analysis was focused on sums of lipid and macromolecular (LM) components at 0.9 ppm and 1.3 ppm. Results: The LM13 concentration was statistically different (P< .0001) between GBMs and METs. With a cut-off of 81 mM in LM13 absolute concentration METs and GBMs can be distinguished with a 78% of specificity and a 81% of sensitivity. The presence of the MM12 peak, related to the Fucose II complex, in tumors harboring a K-ras gene mutation has been investigated. Conclusion: We exploited the performance of a clinically easily implementable method, such as short-TE single voxel MRS, for the differentiation between brain metastasis and primary brain tumors. The study showed that MRS absolute lipid and macromolecular signals could be helpful in differentiating glioblastoma from metastasis. LM13 class was found to be a discriminant parameter with an accuracy of 85%. Detection of the MM12-Fucose peak may also have a role in understanding molecular biology of brain metastasis and should be further investigated to address specific metabolic phenotypes.

A comparison of copper and tungsten edge for DQE assessment
Confronto tra l’impiego di edge in tungsteno e rame per misure di DQE S.Farnedi1, G.Lucconi2 , M.P.Mascia1, N.Scrittori1
(1) Medical Physics Department, S.Maria delle Croci Hospital, Ravenna, Italy (2) Post-graduate School in Medical Physics, University of Bologna, Italy Purpose: According to IEC requirements DQE measurements should be performed with a tungsten and stainless steel edge for general and mammography digital detector respectively. This study is a comparison of tungsten and copper edges more widely available. Materials and methods: DQE was measured for Trixell PIXIUM4600 digital detectors on Philips DDVM using RQA 5 radiation quality and GE Essential mammography flat panels using RQA-M2 and Rh/Rh qualities. In Trixell detectors each subpanel was tested separately. For comparison purposes we chose a reference air Kerma of 50 µGy [1] and 4 µGy at the surface of the GE and Trixell detectors respectively. MTF was measured using a TX5 tungsten edge test device and a 1mm thick copper edge [2]; NNPS was evaluated on uniform images. Linearized images were analyzed with ImageJ COQ plugin developed by the Medical Imaging group of the University of Bologna. Alternatively we calculated NNPS with DQE Panel v7 ImageJ plugin and MTF with a ImageJ plugin [3]; MTF curve was then fitted with a 5 order polynomial to calculate DQE. Results: MTF curves obtained with copper and tungsten edges are mostly overlapping for all systems. No significant differences were observed between horizontal and vertical MTF. The two analysis methods led to quite different MTF curves for Trixell detectors; minor deviations were observed also for mammography flat panels at frequencies > 2 lp/mm. We obtained similar NNPS with both methods: ~10-6 for mammography and ~10-5 for Trixell detectors. In Trixell detectors curves related to the 4 subpanels overlapped within each other. For mammography systems DQE measured with the two methods was consistent with technical specifications and data previously published in literature (max DQE ~68% for both radiation qualities). DQE related to a new Trixell detector met technical specifications with a maximum value of 57%, while a 4-year-old detector showed a 45% maximum DQE. Conclusion: The comparison of DQE curves obtained in this study shows how this parameter can be accurately calculated using a copper edge. References: [1] R. Garcia-Mollà et al, “Study of DQE dependence with beam quality on GE Essential mammography flat panel”, J. Appl. Clin. Med. Phys. 25, 12(1), 2010 [2] C. Ghetti et al, “Physical characteristics of GE Senographe Essential and DS digital mammography detectors” Med. Phys. 35, 2008 [3] O. Rampado et al, “Quantitative assesment of computed radioghraphy quality control parameters“, Phys. Med. Biol. 51, 2006

Assessing model uncertainty as a function of acquisition parameters in Diffusion Tensor Imaging
A. Duggento1, M. Guerrisi1, C. Tessa2, M. Giannelli3 , N. Toschi1. (1) Medical Physics Section, Department of Biomedicine and Prevention, University of Rome “Tor Vergata”,
Rome, Italy.(2) Division of Radiology, Versilia Hospital, AUSL 12 Viareggio, Lido di Camaiore (Lu), Italy(3) Unit of Medical Physics, Pisa University Hospital “Azienda Ospedaliero-Universitaria Pisana”, Pisa, Italy
Background: The accuracy and precision of diffusion tensor imaging (DTI)-derived parameters strongly depend on signal-to-noise ratio (SNR), number of gradient directions along which diffusion-weighted (DW) images ( ) are acquired, number of non-diffusion weighted ( ) images ( ), and estimation algorithm. When using magnitude-reconstructed images in tensor estimation, the statistical properties of noise are not commonly taken into account, leading to fundamentally biased estimates. Additionally, current approaches to modeling noise in DTI assume a single noise parameter across all and DW images.
Theory: We introduce a likelihood-minimization-based tensor fitting routine which allows voxel-wise, simultaneous inference of a) tensor model parameters, b) true signal, c) noise ( ), and d) DWI noise ( ), while correctly modeling statistical noise properties using either a Rice or a Chi distribution. The posterior distribution of tensor trace (TR), fractional anisotropy (FA), mode (K3), and are described as a function of SNR, and . In particular, we maximize the posterior probability of elements of the diffusion tensor (D) relative to the mono-exponential diffusion tensor model:
where is the “real” (unknown) diffusion-weighted signal, is the “real” (unknown) reference signal, and the likelihood function is
where hat-variables ( ) are the measured intensities and is the modified Bessel function of the first kind with order zero.
Methods: The dependence of accuracy and precision of TR, FA, K3, and estimates on SNR, , and tensor type (see Table 1) is fully characterized through massively parallel simulations. Additionally, large phantom (100 repetitions of a full DTI acquisition) and in vivo (44 repetitions of a full DTI acquisition) datasets are used to validate synthetic data results. All computations are performed in Mathematica ® 9.0.

Synthetic data: For each synthetic tensor type (see Table 1), we systematically varied , SNR and . For every combination of parameter values, we generated a) 1000 realizations where the two degrees of freedom that define eigenvector orientations were randomly sampled b) 1000 realizations where the orientations of the eigenvectors were fixed (to allow calculation of dyadic coherence). In total, we simulated 113.344.000 synthetic voxel data for which we performed subsequent tensor and noise estimation.
Tensor type FA K3
Big {0.840, 0.728, 0.616} 0.153 0.000
Flat {0.960, 0.960, 0.200} 0.553 -1.000
Small {0.840, 0.570, 0.190} 0.585 -0.259
Stick {1.650, 0.250, 0.250} 0.829 1.000
Table 1: Tensors employed in synthetic data simulation.
Water phantom acquisitions: DTI of a spherical water phantom was performed by using single-shot spin-echo echo-planar imaging. 100 complete DTI datasets were acquired sequentially (1 and 30 DW images along different directions). In each voxel, ground truth signal and noise values for both b0 ( respectively) and DW ( respectively), images were estimated by fitting a Rician distribution over the 100 acquisitions. Subsequently, we compared ground truth values noise estimates obtained by using our Rician-aware-algorithm to fit the tensor model to one DTI dataset. We also estimated the dependence of bias in inferred quantities on by selecting a subsequently larger subset of ground truth DW images, performing tensor estimation and comparing to ground truth values obtained using 30 DW images.
In-vivo acquisition: We analysed 44 repetitions of DTI scans from the same subject (publicly available data) using the strategy described above for phantom data. All inferred tensors were then grouped by tissue type (cerebrospinal fluid (CSF), white matter (WM) and grey matter (GM)) as well as by TR and FA values, aiming to match TR and FA values used in synthetic data validation.
Results: Normalized standard deviations of virtually all inferred quantities are seen to follow simple power laws both as function of SNR and of ; Figure 1 shows an example of such behavior for inferred normalized bias and standardized bias of FA with respect to SNR. The bias behavior of most tensor related quantities (TR, FA, K3) predicted by synthetic data simulation is confirmed by using our estimator on the phantom as well as on the in vivo dataset. As an example, Figure 2 shows the inferred noise as a function of ; the mean bias of the inferred quantity decreases as increases. Figure 3 shows another example of bias convergence to ground-truth estimation from in vivo data; the quantity shown in Figure 3 is the normalized bias of FA (with respect to the estimated ground-truth), and the results are shown for different tissue types and different groups of tensors types. Also, for the first time, we were able to compute voxel-wise in vivo maps of both and (data not shown).
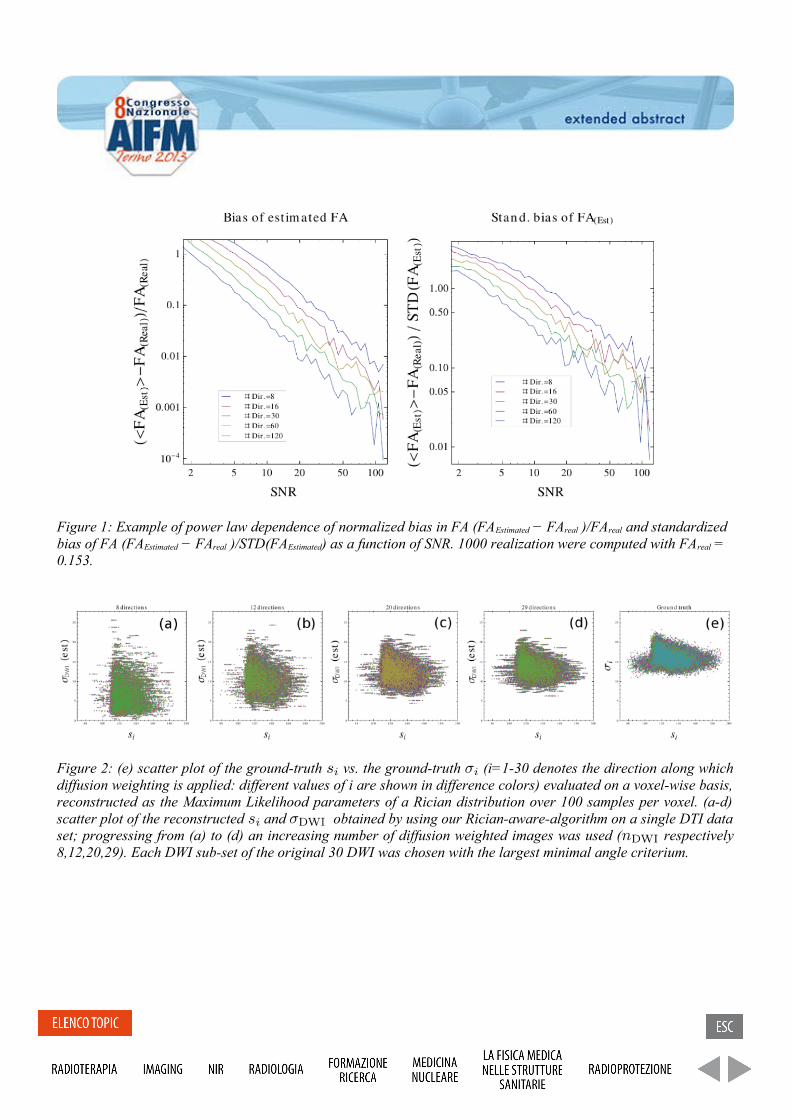
Figure 1: Example of power law dependence of normalized bias in FA (FAEstimated − FAreal )/FAreal and standardized bias of FA (FAEstimated − FAreal )/STD(FAEstimated) as a function of SNR. 1000 realization were computed with FAreal = 0.153.
Figure 2: (e) scatter plot of the ground-truth vs. the ground-truth (i=1-30 denotes the direction along which diffusion weighting is applied: different values of i are shown in difference colors) evaluated on a voxel-wise basis, reconstructed as the Maximum Likelihood parameters of a Rician distribution over 100 samples per voxel. (a-d) scatter plot of the reconstructed and obtained by using our Rician-aware-algorithm on a single DTI data set; progressing from (a) to (d) an increasing number of diffusion weighted images was used ( respectively 8,12,20,29). Each DWI sub-set of the original 30 DWI was chosen with the largest minimal angle criterium.
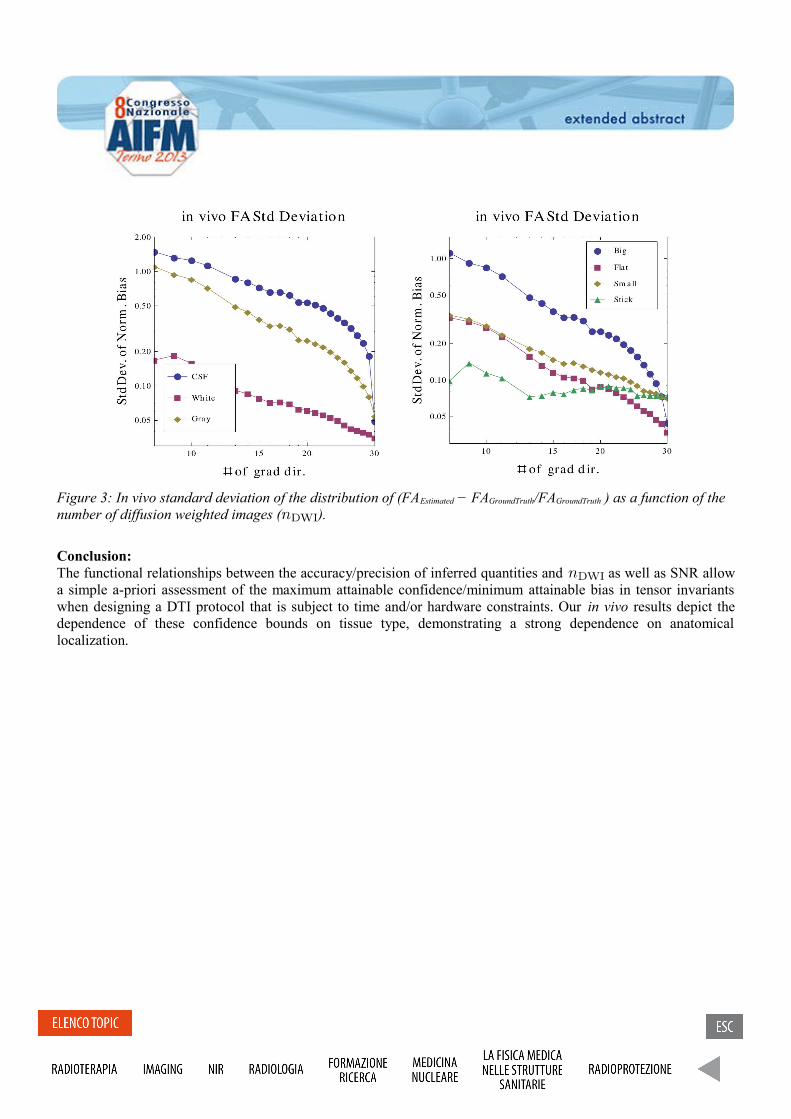
Figure 3: In vivo standard deviation of the distribution of (FAEstimated − FAGroundTruth/FAGroundTruth ) as a function of the number of diffusion weighted images ( ).
Conclusion: The functional relationships between the accuracy/precision of inferred quantities and as well as SNR allow a simple a-priori assessment of the maximum attainable confidence/minimum attainable bias in tensor invariants when designing a DTI protocol that is subject to time and/or hardware constraints. Our in vivo results depict the dependence of these confidence bounds on tissue type, demonstrating a strong dependence on anatomical localization.
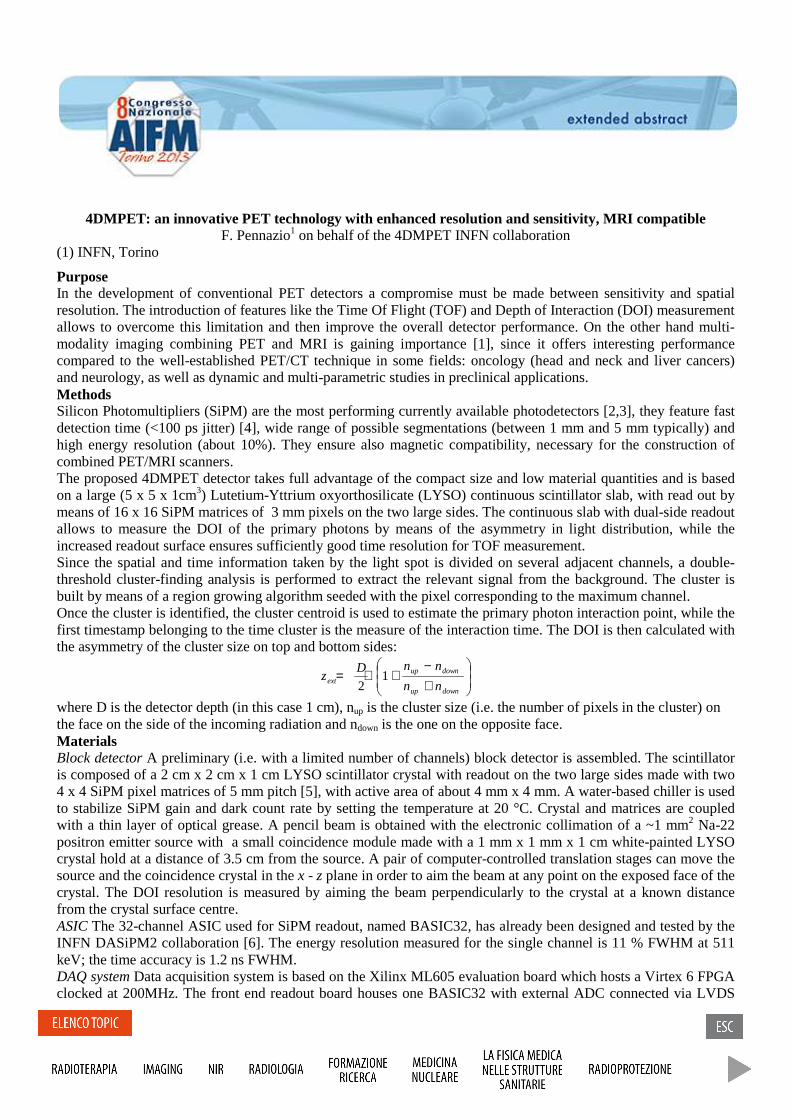
4DMPET: an innovative PET technology with enhanced resolution and sensitivity, MRI compatible F. Pennazio1 on behalf of the 4DMPET INFN collaboration
(1) INFN, Torino
Purpose In the development of conventional PET detectors a compromise must be made between sensitivity and spatial resolution. The introduction of features like the Time Of Flight (TOF) and Depth of Interaction (DOI) measurement allows to overcome this limitation and then improve the overall detector performance. On the other hand multi-modality imaging combining PET and MRI is gaining importance [1], since it offers interesting performance compared to the well-established PET/CT technique in some fields: oncology (head and neck and liver cancers) and neurology, as well as dynamic and multi-parametric studies in preclinical applications. Methods Silicon Photomultipliers (SiPM) are the most performing currently available photodetectors [2,3], they feature fast detection time (<100 ps jitter) [4], wide range of possible segmentations (between 1 mm and 5 mm typically) and high energy resolution (about 10%). They ensure also magnetic compatibility, necessary for the construction of combined PET/MRI scanners. The proposed 4DMPET detector takes full advantage of the compact size and low material quantities and is based on a large (5 x 5 x 1cm3) Lutetium-Yttrium oxyorthosilicate (LYSO) continuous scintillator slab, with read out by means of 16 x 16 SiPM matrices of 3 mm pixels on the two large sides. The continuous slab with dual-side readout allows to measure the DOI of the primary photons by means of the asymmetry in light distribution, while the increased readout surface ensures sufficiently good time resolution for TOF measurement. Since the spatial and time information taken by the light spot is divided on several adjacent channels, a double-threshold cluster-finding analysis is performed to extract the relevant signal from the background. The cluster is built by means of a region growing algorithm seeded with the pixel corresponding to the maximum channel. Once the cluster is identified, the cluster centroid is used to estimate the primary photon interaction point, while the first timestamp belonging to the time cluster is the measure of the interaction time. The DOI is then calculated with the asymmetry of the cluster size on top and bottom sides:
+−
+⋅=downup
downupext nn
nnDz 1
2
where D is the detector depth (in this case 1 cm), nup is the cluster size (i.e. the number of pixels in the cluster) on the face on the side of the incoming radiation and ndown is the one on the opposite face. Materials Block detector A preliminary (i.e. with a limited number of channels) block detector is assembled. The scintillator is composed of a 2 cm x 2 cm x 1 cm LYSO scintillator crystal with readout on the two large sides made with two 4 x 4 SiPM pixel matrices of 5 mm pitch [5], with active area of about 4 mm x 4 mm. A water-based chiller is used to stabilize SiPM gain and dark count rate by setting the temperature at 20 °C. Crystal and matrices are coupled with a thin layer of optical grease. A pencil beam is obtained with the electronic collimation of a ~1 mm2 Na-22 positron emitter source with a small coincidence module made with a 1 mm x 1 mm x 1 cm white-painted LYSO crystal hold at a distance of 3.5 cm from the source. A pair of computer-controlled translation stages can move the source and the coincidence crystal in the x - z plane in order to aim the beam at any point on the exposed face of the crystal. The DOI resolution is measured by aiming the beam perpendicularly to the crystal at a known distance from the crystal surface centre. ASIC The 32-channel ASIC used for SiPM readout, named BASIC32, has already been designed and tested by the INFN DASiPM2 collaboration [6]. The energy resolution measured for the single channel is 11 % FWHM at 511 keV; the time accuracy is 1.2 ns FWHM. DAQ system Data acquisition system is based on the Xilinx ML605 evaluation board which hosts a Virtex 6 FPGA clocked at 200MHz. The front end readout board houses one BASIC32 with external ADC connected via LVDS
signals to an FMC adapter board. Each board has two FMC connectors and so one it is used to acquire 64 readout channels. Control and acquisition is made via Gigabit Ethernet and multiple boards can be used by synchronizing them to a common external clock. The acquisition and online monitoring software is written in LabVIEW. Results: Experimental Measurement results with preliminary prototype indicate a DOI resolution of 1.6 mm RMS in the central part of the detector, though the prototype geometry is largely un-optimised (high dead area between pixels, low channel number, coarse segmentation) [7]. Spatial resolution measurement also suffers because of the same limitations, so in the detector central region is of 1.9 mm FWHM, while at the edges it is limited by the lack of channels, so an adjunctive uncertainty contribution of ~1 mm must be added [8]. Monte Carlo Simulations A Geant4/GAMOS [9,10] Monte Carlo simulation is performed to reproduce layout and results of the experimental setup. The simulation includes source, coincidence module, LYSO crystal with optical properties, optical photons tracking, SiPM matrices with dead area and PDE as a function of the wavelength. The simulation reproduces accurately the experimental data in both local and global behaviour [7]. This validated Monte Carlo simulation is used to evaluate the actual DOI measurement capability of the preliminary version of the block detector, since it allows to exclude beam size and spread from the uncertainty contributions, indicating a DOI resolution between 1.6 mm and 1.8 mm RMS if -3 mm < z < 3 mm, and about 2.3 mm otherwise. The validated simulation is then extended to reproduce the 4DMPET block detector with the proposed nominal design (16 x 16 SiPM pixel 3 mm pitch to read out on top and bottom side a large LYSO slab 1 cm thick), as well as a dedicated ASIC to read out the pixels. The expected figures of merit [11] indicate a 25 % FWHM energy resolution at 511 keV, a spatial (x - y ) resolution of 0.9 mm FWHM, a DOI resolution of 1.4 mm FWHM and a time resolution of 110 ps σ. Conclusions: Preliminary measurement results show the feasibility of an innovative PET block detector layout, with a continuous LYSO crystal slab and light readout from top and bottom side by means of Silicon Photomultipliers. Acknowledgements 4DMPET is a collaboration which involves INFN sections of Pisa, Bari, Perugia and Torino. 4DMPET experiment is a three-years (2011-2013) project funded by INFN - National Scientific Committee 5. References: [1] G. K. von Schulthess et al., Clinical positron emission tomography/magnetic resonance imaging applications. Sem. Nucl. Med. (2013) 43(1), pp. 3–10 [2] P. Vaska, T. Cao, The state of instrumentation for combined positron emission tomography and magnetic resonance imaging. Sem. Nucl. Med. (2013) 43(1), pp. 11–18 [3] C. Piemonte, M. Boscardin, G.-F. Dalla Betta, et al. Recent developments on Silicon Photomultipliers produced at FBK-irst. Nuclear Science Symposium Conference Record (2007). volume 3, pages 2089 –2092 [4] G. Collazuol, G. Ambrosi, M. Boscardin, et al. Single photon timing resolution and detection efficiency of the irst silicon photo-multipliers. Nuclear Instruments and Methods in Physics Research Section A, (2007) 581(1–2):461 – 464, 2007. VCI 2007 Proceedings of the 11th International Vienna Conference on Instrumentation [5] http://www.advansid.com/SiPM4x4T [6] F. Corsi, A. Argentieri, M. Foresta, C. Marzocca, G. Matarrese, and A. Del Guerra, “Front-end electronics for silicon photo-multipliers coupled to fast scintillators,” in Nuclear Science Symposium Conference Record (NSS/MIC), 2010 IEEE, 30 2010-nov. 6 2010, pp. 1332 –1339. [7] Pennazio, F. et al, Simulations of the 4DMPET SiPM-based PET module, Nuclear Science Symposium and Medical Imaging Conference (2011) IEEE, pp.2316 – 2320. [8] Morrocchi M. et al, Development of a PET detector module with Depth Of Interaction capability, 13th Vienna Conference on Instrumentation conf. proc.(2013) [9] S. Agostinelli, J. Allison, K. Amako, et al. Geant4 - a simulation toolkit. Nuclear Instruments and Methods in Physics Research Section A: Accelerators, Spectrometers, Detectors and Associated Equipment (2003), 506(3):250 – 303.
[10] Pedro Arce, Pedro Rato, Mario Canadas, and Juan Ignacio Lagares. Gamos: A GEANT4-based easy and flexible framework for nuclear medicine applications. Nuclear Science Symposium Conference Record, (2008). IEEE, pp. 3162 – 3168 [11] P. Cerello, F. Pennazio, M.G. Bisogni, et al. An innovative detector concept for hybrid 4D-PET/MRI imaging. Nuclear Instruments and Methods in Physics Research A (2012) pp.118-123
L’importanza di utilizzare un fantoccio appropriato per i controlli di qualita’ relativi alle immagini di mammella su magneti a 3T The importance of using the right phantom for breast MR imaging quality controls at 3T Marta Maieron(1), Renato Padovani(1) (1)SOC Fisica Sanitaria, AOUD, Udine, Italy
Purpose:The use of high field MRI technologies has rapidly increased in body applications in clinical field. However, the increased field strength is also associated with many technical challenges. It is know that non-‐uniformity of B1 across space affect the contrast of MRI breast imaging reducing its diagnostic value [1, 2]. It is important in order to assess the quality of breast images quantify the distribution of B1 transmission-field inhomogeneity. In this study we try to map the B1-field profiles across breast image using appropriate phantom. Methods and materials: Studies were performed on 10 healthy volunteers and 2 phantoms on a 3T Philips scanner without multitransmit. B1 field was measured using the AFI gradient echo sequence [3] (TR1/TR2 = 30/150 ms, TE = 2.4 ms, α = 60°, 20 axial slices, thickness = 6 mm, resolution = 3.13 X 3.13 mm). Amplitude of B1-‐field was estimated by measuring the value of flip-‐angles generated in every single voxel relative to the expected value expressed as a percentage. A SS-‐EPI-‐DWI sequence (TR=5000ms, TE=61ms, b-‐value=0/400/800/1200 s/mm2, r = 2) was also acquired to assess the influence of in homogeneity on it. Results: A measured plot of B1-‐field profile of breast images shows a decrement of α from left to right in the axial plane. The values of α vary from 50 to 120% of the declared angle. The profile of phantom with no water load doesn’t show an evident difference in B1 field across space, but the real flip-‐angle is always lower than value set on sequence (mean = 90 % of declared α). When we use the phantom with the water load the inhomogeneity of B1 field appear obvious and the value of α vary again ( right = 63%, left = 74%) as in the real breast image. Conclusion: The B1 field inhomogeneity can be detected in quality controls if an appropriate phantom is used. Inhomogeneous B1 field is caused by a variety of conductive and dielectric effects in tissue that are more pronounced at high field [4,5]. Only using a phantom of the same dimension of the patient body we are able to reproduce the real RF frequency deposition simulating the correct behaviour of dielectric shading and local signal enhancements/losses as a result of standing waves or interference RF waves that generated artefacts at 3T field. References [1] Kuhl CK. et al. Radiology 2006; 666-‐676 [2] Kuhl CK. et al. Radiology 2007;929-‐939 [3] Yarnykh VL. 2007;192-‐200 [4] Dietrich O. et al. Eur J radiol 2008;29-‐35 [5] Murtz P. et al. Eur J Radiol. 2011 Dec 15.
Un metodo automatico di segmentazione delle immagini FDG-PET basato su processi di Dirichlet. An automatic segmentation method of FDG-PET images based on Dirichlet process mixture model. M.G. Giri1, C. Cavedon1. (1) Azienda Ospedaliera Universitaria Integrata di Verona Purpose: the use of 18F-fluorodeoxyglucose positron emission tomography (FDG-PET) in radiotherapy planning is becoming widespread. Various approaches are available including both manual and automatic methods. The main automatic tools are based on the definition of a threshold value: this value can be expressed as an absolute SUV level or as a relative one or could be automatically chosen by an adaptive algorithm. Deterministic gradient edge or statistical methods have also been proposed. In this work we propose a new method of automatic tumor segmentation based on the Dirichlet process (DP) mixture model applied to the distribution of the voxel activity concentration of the PET images. We tested the method on a dataset of images of the IEC phantom acquired by a Philips Gemini scanner and on a digital phantom simulating both spherical and uniform lesions and tumours irregular in shape and activity. Methods and materials: the IEC body phantom consists of 6 spherical inserts with diameters in the range 10-37 mm. Each sphere was filled with 18F-FDG using 9 different target-to-background ratios from 2.5 to 70. The scan time per bed was set to 5 minutes. The digital phantom simulates 3 spheres with uniform activity (volumes of 5, 13 and 37 ml) and 3 irregular structures (volumes of 45, 62 and 133 ml). We applied to PET images an automatic, statistically-based segmentation method that uses Dirichlet process priors to classify the images. This was restricted to a ROI centred on the volume of enhanced activity. The DP mixture model is a Bayesian method based on Markov chain Monte Carlo simulations for exploring mixture models with an unknown number of components, not specified in advance. It depends from 4 parameters. In order to verify the influence of the DP parameters on the automatic segmentation, we repeated contour generation by setting parameters to different values and we performed an anova test to verify their dependence from the radius of the spheres. Results: the only parameter that influenced lesion segmentation was the minimum value admissible for a cluster variance: we observed an almost-linear dependence from the standard deviation of the image pixel values in the selected ROI. The optimization of this parameter produced an agreement between true and segmented volumes within less than 2 % in all cases. Conclusion: the described procedure allows an automatic and accurate segmentation of PET images, potentially useful to assist physicians in lesion delineation.
Tumore gastrico: il ruolo della Diffusion Weighted Imaging nella stadiazione preoperatoria
Gastric cancer: the role of Diffusion Weighted Imaging in the preoperative staging
R. Caivano1, P. Rabasco1, A. Lotumolo1, F. D' Antuono1, A. Zandolino1, A. Villonio1, L. Macarini2 , M. Salvatore1,3 and A. Cammarota1 (1) I.R.C.C.S.–C.R.O.B. Rionero in Vulture (Pz), (2)Università di Foggia, (3)I.R.C.C.S. SDN Foundation Napoli.
Purpose: The symptoms of gastric cancer are not specific and not always present. For these reasons, early diagnosis is difficult and an accurate preoperative staging is fundamental for the choice of treatment and for the prognosis of the disease. There are different techniques used for the diagnosis and staging of gastric carcinoma, magnetic resonance imaging (MRI) is one of the newly developed techniques. Conventionally the gastric cancer study consists of T1-weighted, T2-weighted, SPAIR, STIR sequences and contrast-enhanced T1-weighted images. Diffusion-weighted-imaging (DWI) application in the gastro-intestinal tract is relatively new, it has been used in combination with conventional MRI in the diagnosis and characterization of liver lesions and in the evaluation of rectum carcinoma. The present study evaluated the applicability of the 3T MRI in the diagnosis and staging of gastric cancer using DWI sequences in addition to the standard protocol.Materials and methods: 31 patients with histologically confirmed gastric cancer were selected. Patients were 18 males and 13 females aged between 29 and 84 year, mean age of 67 year. All patients were subjected to endoscopy and MRI for preoperative staging. Each patient was treated surgically 3-10 days after MRI. Two radiologists evaluated the tumor staging in DWI. All images were interpreted without knowledge neither the pathologic findings nor the histological staging. The presence of tumor tissue and any pathological lymph nodes was evaluated. The tumor was noted on the basis of signal intensity variation in the sequences before and after contrast injection and in DWI sequences with relative apparent diffusion coefficient (ADC). Results were compared to postsurgical pathologic findings.Results: The T factor accuracy of conventional MRI and DWI was 73% and 80% respectively. Tumor lesions showed increased signal intensity in DWI images with b0, b350, b750 values and a reduction of the signal in ADC maps. The average ADC value was 0.811 ± 0.300 mm2/s compared to normal gastric walls which showed an average ADC value of 1.503 ± 0.430 mm2/s (p<0.05).The N staging accuracy of conventional MRI and DWI was 80% and 93%, respectively. Lymph nodes identified in MRI had restriction pathological signal in DWI and lower ADC value (1.70 ± 0.40 mm2/s) compared to non-metastatic lymph nodes (2.10 ± 0.22 mm2/s) (p<0.05).Conclusion: DWI and ADC values showed to be useful in preoperative staging of gastric cancer.

Diffusion Weighted Imaging e Apparent Diffusion Coefficient nella risonanza magnetic 3T delle lesioni mammarie
Diffusion Weighted Imaging and Apparent Diffusion Coefficient in 3T magnetic resonance imaging of breast lesions
R. Caivano1, F. D' Antuono1, P. Rabasco1, A. Lotumolo1, M. Gioioso1, A. Zandolino1, A. Villonio1, L. Macarini2 , M. Salvatore1,3 and A. Cammarota1 (1) I.R.C.C.S.–C.R.O.B. Rionero in Vulture (Pz), (2)Università di Foggia, (3)I.R.C.C.S. SDN Foundation Napoli.
Purpose: to evaluate the ability of diffusion weighted imaging (DWI) and apparent diffusion coefficient (ADC) in a 3T magnetic resonance imaging (MRI) study of breast cancer. In particular the study aims to classify ADC values according to histology either for benign or malignant lesions.Materials and Methods: the cases of 110 women who underwent breast MRI with MRI-DWI sequences and quantitative evaluation of the ADC were retrospectively reviewed. Results obtained with MRI-DWI and with biopsy were analyzed in terms of accuracy, sensitivity, specificity, positive predictive value (PPV) and negative predictive value (NPV). Subsequently ADC values were compared to histological results.Results: The CE-MRI protocol showed 96.9% sensitivity and 75.0% specificity, with 85.3% PPV, 94.3% NPV and 88.2% accuracy. While CE-MRI+DWI showed a 95.5% sensitivity and a 83.7% specificity, with 90.1% PPV, 92.3% NPV and 90.9% accuracy. The mean ADC values of benign and malignant lesions were 1.96±0.17 and 1.03±0.07 mm2/s, respectively (p <0.05). The ADC values classified for benign and malignant lesions were: among benign lesions, cysts revealed a mean ADC value of 3.42±1.04, fibrosis 1.56±0.64, fibroadenomas 1.57±0.78 and mastitis 0.81±0.13, (p <0.05) for all the benign couples except between fibrosis vs fibroadenomas for which p>0.05 was found. Among malignant lesions, ductal carcinoma revealed a mean ADC value of 0.98±0.41, lobular carcinoma 1.30±0.60 and tubular carcinoma 0.58±0.23, (p <0.05).Conclusions: the addition of DWI in a standard 3T MRI protocol improves specificity and increases the diagnostic performance of MRI in breast cancer detection. ADC values could be well correlate with cellularity, furnishing an objective tool to distinguish malignant and benign masses.
Comparazione di Metodi di analisi “Model Free” e “Model Based” in epilessia. ICA and GLM based methods of simultaneous EEG/fMRI data in epilepsy. Marco Carnì
1,2, Luisa Altabella
3, Carlo Di Bonaventura
4, Jinane Fattuch
4, Sara Casciato
4, Anna Teresa
Giallonardo4, Valter Nucciarelli
4, Claudio Colonnese
4, Elisabetta Di Castro
1, Bruno Maraviglia
5
(1) UOC di Fisica Medica e Sanitaria, Policlinico Umberto I di Roma. (2) Scuola di Dottorato in scienze morfofunzionali e biofisica Universita’ di Roma “La Sapienza”, Italy. (3)Post Graduate School of Medical Physics University of Rome “La Sapienza”, Italy. (4) Dipartimento di Neurologia e Psichiatria, Universita’ di Roma “La Sapienza”, Italy. (5) Enrico Fermi Center (Roma); Dipartimento di Fisica, Universita’ di Roma “La Sapienza”, Italy. Purpose: A simultaneous recording of electroencephalogram (EEG) and functional magnetic resonance imaging (fMRI) is a powerful and promising tool in epilepsy [1]. Regions of brain activation and deactivation have been revealed by EEG/fMRI in relation to interictal and ictal epileptic discharge. The conventional analysis of EEG-fMRI data is usually performed using the model based general linear model (GLM) approach with regressor created by convolution of the EEG events with a standard hemodynamic response function (HRF). This approach has many limitations. Here we present a new approach to improve the epileptic events identification based on independent component analysis (ICA) and EEG spectral on simultaneous EEG/fMRI acquisitions on patients affected by ictal electro-clinical activity.
Methods and materials: EEG recording was performed using a 32-channels MR-compatible device (Micromed, Italy). FMRI images (two series of 200 temporal dynamics, each consisting of 20 axial slices) were acquired using a clinical 3T magnet (Siemens Verio). Seven epileptic subjects were considered for this study divided into two groups: partial seizure (n=4) and generalized (n=3) epilepsy. As regard data driven approach, spatial ICA was performed with Group ICA Toolbox (http://icatb.sourceforge.net/) while model based was performed by GLM as implemented in SPM8 (www.fil.ion.ucl.ac.uk/spm). After image pre-processing steps, fMRI analysis was carried out using a regressor obtained in the first case by convolving the spm-HRF with box-car function from EEG ictal events (identified by the neurophysiologist), and in the other by convolving the spm HRF with spectral profile of EEG data (processed with EEGLAB toolbox) and modelling the motion parameters as nuisance variables. Results: In general the detected activation areas resulting from canonical analysis (data driven and data model approach) are in agreement with presumed electroclinical hypothesis. However ICA and GLM-EEG spectrum analysis exhibited an increased sensitivity for the detection of brain regions associated with epileptic events.
Conclusion: The same BOLD patterns of activation alone or activation-deactivation in response to synchronized ictal activity were found by ICA and conventional GLM analysis.The novel method represents an improvements respect to existing method eliminating subjectivity in classification of the epileptic events.
References: [1] Laufs. NeuroImage (2012), Aug 15;62(2):1056-‐67.
Immagini MRI ad alta risoluzione della regione ippocampale per la diagnosi precoce
della malattia di Alzheimer.
High-resolution MRI images of the hippocampal region for Alzheimer’s disease early
diagnosis.
R. Quartulli1, F. Brun
1,2, A. Chincarini
3, L. Rei
3, M. Ukmar
4, R. Longo
1,6.
(1) University of Trieste (2) Elettra - Sincrotrone Trieste S.C.p.A. (3) INFN, Genoa (4)
Cattinara University Hospital, Trieste (6) INFN, Trieste.
Purpose: A challenging point in neuroimaging is the diagnosis of Alzheimer’s disease (AD)
all the more so during its asymptomatic phase. It is known that with aging brain undergoes
anatomical and functional changes, not very different from those observed in AD. In both
cases there is a loss of brain tissue with consequent brain reduction in terms of volume and
weight, however in the presence of the disease the degeneration is much more pronounced.
This is one of the reasons that make the diagnosis hard to obtain, especially in the initial
stages of the disease.
Mild Cognitive Impairment (MCI) condition affects a large part of elderly population, and it's
proved that in a limited portion this state can convert toward dementia.
A common praxis, in this sense, is to follow MCI patients with MRI exams repeated at fixed
intervals (usually 6-12-24 48 and 60 months).
In this framework (Longitudinal study) several Magnetic Resonance Imaging (MRI) markers
can be studied: whole brain atrophy, hippocampus volume, enthorinal cortex thickness, lateral
ventricle size and shape [1], being the medial temporal lobe (MTL) structures - in particular
both hippocampi - atrophy one of the most reliable.
Powerful computational techniques [2] have been conceived to treat MR images information
from hippocampal region [3][4] with promising results. However clinical prediction strength
depends on image characteristics and Signal to Noise ratio (SNR) , both critically linked to
acquisition protocol. The aim of our research is the development of a brand new clinical
protocol for MRI scans acquisition focused on left and right hippocampal regions suitable for
automatic analysis. We expect that such a protocol could capture more clinical information,
with respect to existent standard modalities, and favour the recognition of the MCI converter
and non-converter patients and the possible identification of individuals at high risk of AD in
a completely pre-clinical stage.
This is realized through the optimization of the high-resolution Magnetization Prepared Rapid
Acquisition Gradient Echo (MPRAGE) sequence.
A MRI volumetric sequence at 1.5 T has been developed in order to obtain very high spatial
resolution and high contrast images in the hippocampal area. Resulting images are
characterized by a sufficiently high quality to carry out proper morphometric evaluation.
This kind of analysis is strongly affected by errors due to B1 field inhomogeneities. Spatial
inhomogeneity of B1 field results in flip-angle deviations depending on the spatial position. It
limits the ability of the scanner to deliver the prescribed flip angle, introducing errors into the
T1 maps that limit the accuracy of quantitative analysis based on those maps. This artifact can
degrade the quality of acquired data and can affect computational analysis of the images due
to the variance in signal intensity. Consequently a study to correct this issue was dealt.
Materials and methods: To design our sequence, we started from Alzheimer’s Disease
Neuroimaging Initiative (ADNI) protocol [5] and we tried to tune some parameters in order to
increase spatial resolution, preserving contrast and without losing too much in SNR. We
therefore limited the volume investigated from full brain to the hippocampal area.
A Philips Achieva (Philips Medical System) 1.5 T imager and the SENSE Neurovascular coil with 16 channels were used. However no-SENSE protocol resulted the best choice in order to maximize SNR. We acquired scans with this sequence from a group of 10 young volunteers (8 females and 2 males) aged between 21 and 28 years. Written informed consent was obtained from each subject. None of the volunteers in this study reported any previous pathologies of
Central Nervous System. Between the sides of the head and the coil we have included
foam rubber supports in order to ensure the immobility of the investigated area. A home
made bearing containing a solution of copper sulphate was used as external
reference for absolute calibration of images during the B1 correction. To avoid
interferences between the brain volume and the bearing during image registration, a
separator was used between the head and the bearing. The separator was a plastic bubble foil.
For the B1 correction, images of bottles containing the same solution of the bearing
were acquired using the optimized sequence in order to study the magnitude of
signal inhomogeneity. Repeated measurements of a test object (Eurospin II MRI
assessment test object TO5, Diagnostic Sonar Ltd) varying the position of the T1 and T2
calibrated gel-filled test tubes, were made to validate the correction algorithm.
Results: Starting from ADNI MPRAGE sequence, we have enhanced hippocampal
region resolution without unreasonably increase scan time and noise components. A new
protocol with a voxel size of 0.6x0.6x0.59 mm3, a studied volume of 20x20x4 cm
3, a
scan time of about 14 min - reasonably compatible with standard duration - was defined.
The acquisition matrix is 336 (Nx) x 278 (Ny), 101 slices are acquired and repetition time
(TR) and echo time (TE) are respectively 12,5 ms and 5,9 ms. The flip angle is 8 deg, the
slice thickness is 0,6 mm, the pixel bandwidth (Bw) is 114 Hz, the number of signal averages
(NSA) is 3. The SNR is smaller but comparable with whole brain ADNI MPRAGE
sequence. The use of bearing is optimal with the presence of the separator in order to avoid
problems of automatic extraction of the brain. Different methods for the correction of
intensity inhomogeneity were explored. Prospective methods based on the additional
imaging of a suitably prepared phantom as well as retrospective methods, i.e. methods that
take into account only the information of the acquired images, were considered in this
study.
Conclusion: High resolution and intensity calibrated MR images of the hippocampi
were acquired both with original and our protocol from a small group of young subjects. The
study of the comparison between MPRAGE and this new acquisition setting in terms of test/
re-test noise, AD/controls discriminating ability is still in progress.
References:
[1] L. K. McEvoy et al., Mild Cognitive Impairment: Baseline and Longitudinal
Structural MR Imaging Measures Improve Predictive Prognosis. Radiology (2011) 259,
834-843.
[2] R. Cuingnet et al., Automatic classification of patients with Alzheimer’s disease
from structural MRI: A comparison of ten methods using the ADNI database, NeuroImage
(2010). [3] A. Chincarini et al., Local MRI analysis approach in the diagnosis of early and
prodromal Alzheimer’s disease, NeuroImage (2011) 58, 469-480.
[4] P. Calvini et al., Automatic analysis of medial temporal lobe atrophy from structural
MRIs for the early assessment of Alzheimer disease, Med. Phys. (2009) 36, 3737-3747.
[5] Jack et al., The Alzheimer’s Disease Neuroimaging Initiative (ADNI): MRI
Methods. JOURNAL OF MAGNETIC RESONANCE IMAGING (2008) 27, 685-691.

On Board Imager System Quality Assurance
D. Morelli1, L. Barone Tonghi2, R.M. La Rosa1, O. Marilli2, A. Grasso2, A. Rosso2.
(1) Università degli Studi di Catania Scuola di Specializzazione in Fisica Sanitaria –Indirizzo Fisica Medica,
Catania (2)Azienda Ospedaliera di Rilievo Nazionale e di Alta Specializzazione – Presidio Ospedaliero Garibaldi –
Nesima, Catania
Modern radiotherapy techniques, such as 3D conformal (3D-CRT) and Intensity Modulated Radiotherapy (IMRT),
manage to shape radiation dose to closely conform the tumor volume, reducing the dose to critical structures. The
clinical use of radiotherapy machines more and more precise and the implementation of accurate planning
algorithms require, however, an exact knowledge of the target position both during the dose planning and the
treatment phases. The need of accurate target positioning has led to the development of the so called Image Guided
Radiation Therapy (IGRT) [1,2,3]. Images are acquired not only before the planning and used only to plan the
treatment (contouring CT) but also during the treatment. Modern Linac are provided with imaging systems that
usually are implemented into the accelerator gantry. The systems usually consist of a kilovoltage (kV) x-ray source
mounted on-board a linear accelerator, e.g. an On-Board Imager (OBI); the use of a kV source instead of a
megavoltage one (MV) allow an increase in bony structure contrast enable more reliable setup corrections [4,5].
Planar x-ray images do not provide adequate soft-tissue contrast, needful for tumor localization, but the new
techniques of acquiring cone-beam CT (CBCT) images by rotating the x-ray source with the gantry have allowed
finely to make soft tissue visible and monitor the volume tumor during the radiotherapy treatment.
In this paper we describe the performed Quality Assurance (QA) tests to evaluate the On Board Imager system
mounted on a Varian Linac DHX RapidArcTM operating in the Radiotherapy department of the Azienda
Ospedaliera di Rilievo Nazionale e di Alta Specializzazione – Presidio Ospedaliero Garibaldi – Nesima Catania.
This OBI system is designed to correct for motion and setup errors of patients undergoing radiation therapy, it
provides three imaging modes: two-dimensional radiographic acquisition, fluoroscopic image acquisition, and
three-dimensional cone-beam computed tomography (CBCT) acquisition. The measurements consisted of
verifications of geometric accuracy; image quality and dosimetric valuations. Geometry QA verifies the geometric
accuracy and stability of the OBI hardware as well as some of the software function of the acquisition system.
Image quality monitors spatial resolution and contrast sensitivity of the radiographic images. Image quality for
CBCT includes tests for Hounsfield Unit (HU) linearity, HU uniformity and spatial linearity. The goal of image
QA was to establish baseline for image quality parameters and to monitor these parameters over time.
The measurements were carried out according to the indication of the AAPM-TG 142 and the AAPM TG179 [6,7].
For the analysis were used different phantoms: a cube phantom with a radiation opaque marker to study the
agreement with treatment isocenter; a test patient created for geometric QA tests with a test plan containing two kV
setup field. Each set up field had a DRR (Digitally Reconstructed Radiograph) associated with it so that the entire
patient reposition process could be performed. To verify the couch shift we used a marker block phantom
containing a central opaque marker of 1 mm diameter and helded by an assembly with several steps in it that allows
the marker phantom to be shifted by a very accurately 2 cm in each of the longitudinal, lateral and vertical
directions. The block was attached to the top step of the set assembly, attached to the couch using the exact bar and
positioned so that the center of the block was at the isocenter. The block was moved from the top step to the second
step [8]. We acquired anterior and right lateral kV images and then performed the 2D2D match to align the central
marker and check the correct couch shift.
The image quality was carried out for both planar and tomographic images. The QA measurements have been done
using tests from conventional QA programs for radiographic units and for CT scanners.
For the planar image QA was used the phantom TOR 18FG (Leeds test objects Ltd, North Yorkshire, UK), to
monitor both contrast and spatial resolution, tests were carried out for both radiographic and fluoroscopic
acquisitions.
CBCT images were evaluated using a Catphan® phantom which has different inserts for the different QA
parameters: HU stability and uniformity, HU linearity, in-slice geometry, slice thickness, spatial resolution and low
contrast resolution. The analysis was performed using the CBCT acquisition software and a software for image
management, the ImageJ® software. Tests were carried out for both full-fan and half-fan modes.
Dosimetric measurements were carried out using standard head and body Lucite CTDI cylindrical phantom (16 cm
and 32 cm in diameter respectively) and a 100 mm length ionization chamber to measure central and skin doses in
the phantoms.
The geometric measurements showed that the OBI system is mechanically stable and is reproducible in terms of
position. CBCT images acquired with full-fan mode showed good HU uniformity and resolution while that one
acquired with half-fan mode showed a lower HU uniformity and resolution. However, the second one gives less
dose to the patient. Comparison between the image analysis performed with the ImageJ® software and the CBCT
acquisition software gave good agreement, this allow to consider usable the first one and this allow to make QA
measurement faster being the analysis of-line.
According to the dosimetric measurements, if CBCTs are planned before each treatment, it is recommended to
consider also the dose coming from the imaging to the total dose to the patient.
References:
[1] T.R Mackie, et Al., Image guidance for precise conformal radiotherapy, Int. J. Radiat. Oncol. Biol. Phys.(2003)
59, 89-105, 2003.
[2] R .Mohan, et Al., Use of deformed intensity distributions for on-line modification image guided IMRT to
account for inter-fractional anatomic changes, Int. J. Radiat. Oncol. Biol. Phys., (2005)61, 1258-1266.
[3] C.A. McBain, et Al., X-ray volumetric imaging in image-guided radiotherapy: the new standard in on-treatment
imaging, Int. J. Radiat. Oncol. Biol. Phys., (2006) 64, 625-634.
[4] J.E. Schewe, et Al., A room-based diagnostic imaging system for measurement of patient setup, Med.
Phys. (1998) 25, 2385-2387. [5] D.A Jaffray, et Al., A radiographic and tomographic imaging system integrated into a medical linear accelerator
for localization of bone and soft tissue targets, Int. J. Radiat. Oncol. Biol. Phys. (1999) 45, 773-789.
[6] E.E. Klein, et Al., Task Group 142 report: Quality assurance of medical accelerators, Med. Phys. (2009) 36 (9).
[7] J.-P. Bissonnette, et Al., Quality assurance for image-guided radiation therapy utilizing CT-based technologies:
A report of the AAPM TG-179, Med. Phys.(2012) 39 (4), 1946-1963.
[8] S.Yoo, et Al., A quality assurance program for the on-board imager, Med. Phys. (2006) 33(11),4431-4447.
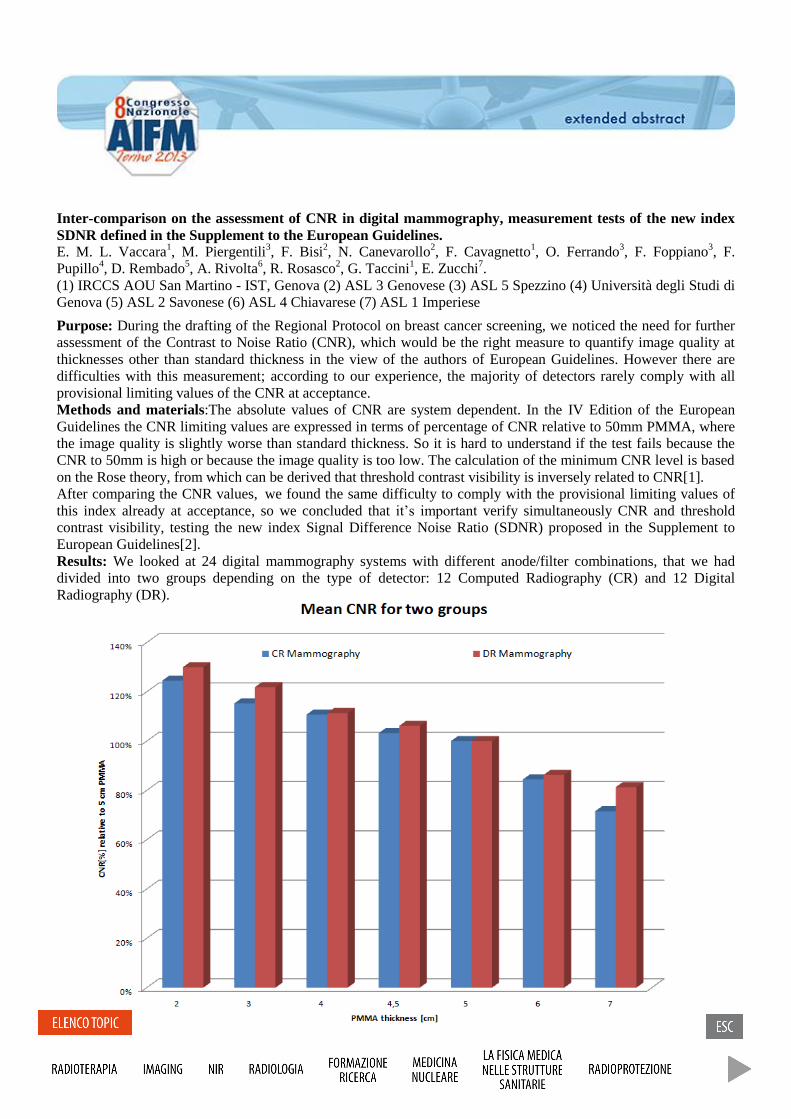
Inter-comparison on the assessment of CNR in digital mammography, measurement tests of the new index
SDNR defined in the Supplement to the European Guidelines.
E. M. L. Vaccara1, M. Piergentili
3, F. Bisi
2, N. Canevarollo
2, F. Cavagnetto
1, O. Ferrando
3, F. Foppiano
3, F.
Pupillo4, D. Rembado
5, A. Rivolta
6, R. Rosasco
2, G. Taccini
1, E. Zucchi
7.
(1) IRCCS AOU San Martino - IST, Genova (2) ASL 3 Genovese (3) ASL 5 Spezzino (4) Università degli Studi di
Genova (5) ASL 2 Savonese (6) ASL 4 Chiavarese (7) ASL 1 Imperiese
Purpose: During the drafting of the Regional Protocol on breast cancer screening, we noticed the need for further
assessment of the Contrast to Noise Ratio (CNR), which would be the right measure to quantify image quality at
thicknesses other than standard thickness in the view of the authors of European Guidelines. However there are
difficulties with this measurement; according to our experience, the majority of detectors rarely comply with all
provisional limiting values of the CNR at acceptance.
Methods and materials:The absolute values of CNR are system dependent. In the IV Edition of the European
Guidelines the CNR limiting values are expressed in terms of percentage of CNR relative to 50mm PMMA, where
the image quality is slightly worse than standard thickness. So it is hard to understand if the test fails because the
CNR to 50mm is high or because the image quality is too low. The calculation of the minimum CNR level is based
on the Rose theory, from which can be derived that threshold contrast visibility is inversely related to CNR[1].
After comparing the CNR values, we found the same difficulty to comply with the provisional limiting values of
this index already at acceptance, so we concluded that it’s important verify simultaneously CNR and threshold
contrast visibility, testing the new index Signal Difference Noise Ratio (SDNR) proposed in the Supplement to
European Guidelines[2].
Results: We looked at 24 digital mammography systems with different anode/filter combinations, that we had
divided into two groups depending on the type of detector: 12 Computed Radiography (CR) and 12 Digital
Radiography (DR).
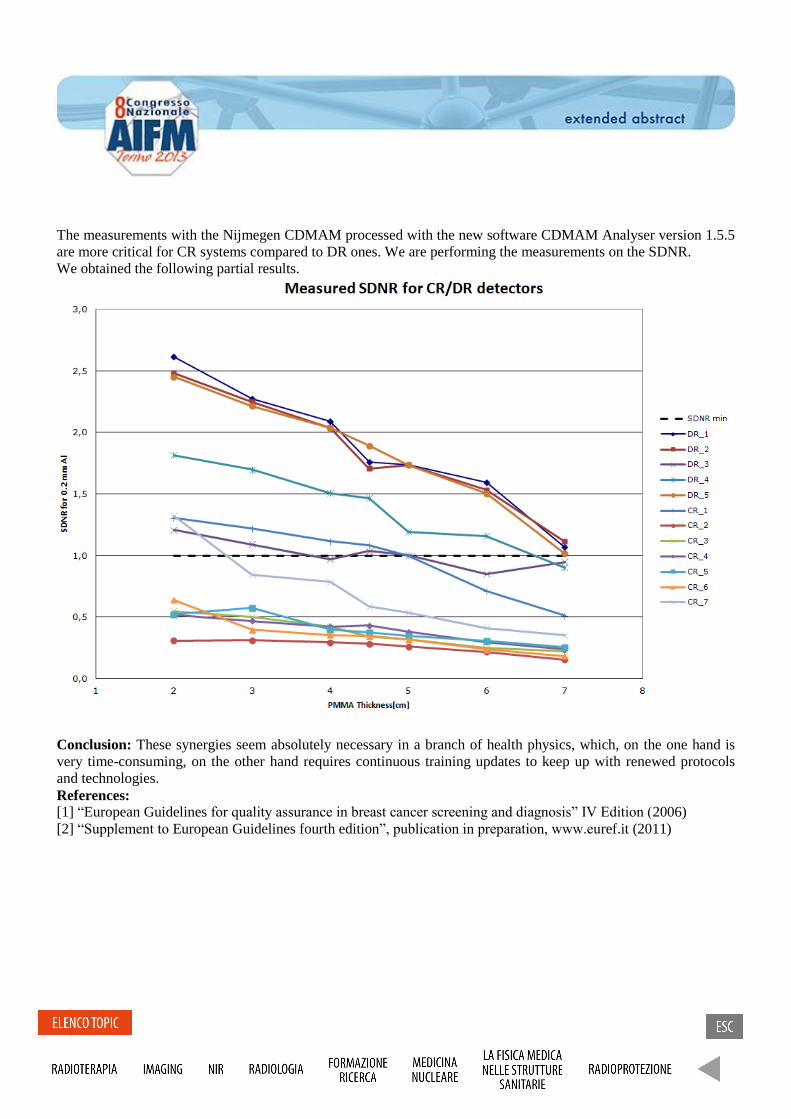
The measurements with the Nijmegen CDMAM processed with the new software CDMAM Analyser version 1.5.5
are more critical for CR systems compared to DR ones. We are performing the measurements on the SDNR.
We obtained the following partial results.
Conclusion: These synergies seem absolutely necessary in a branch of health physics, which, on the one hand is
very time-consuming, on the other hand requires continuous training updates to keep up with renewed protocols
and technologies.
References:
[1] “European Guidelines for quality assurance in breast cancer screening and diagnosis” IV Edition (2006)
[2] “Supplement to European Guidelines fourth edition”, publication in preparation, www.euref.it (2011)
Differences in DSC-MR perfusion maps generated by different commercial software
L. Orsingher1,2
, G. Crisi1, S. Piccinini
1
(1) Parma University Hospital Trust; Parma, Italy (2) University of Sacro Cuore - Rome
Dynamic susceptibility contrast perfusion magnetic resonance imaging (DSC-MRI) during bolus injection of
gadolinium contrast agent is commonly used to investigate patients with primary brain tumors [1-3]. Relative
cerebral blood volume (rCBV) measurement derived from DSC-MRI has been shown to correlate with tumor
grade and prognosis [4] and, recently, to provide a reliable estimation of the degree of neoangiogenesis which
could be useful for response assessment.[5-6].
We retrospectively evaluated DSC-MRI datasets of 24 consecutive patients with surgically resected
glioblastoma multiforme (GBM). All MR imaging and DSC-MRI scans were performed on a 3T whole-
body scanner (Discovery MR 750; GE Healthcare, Milwaukee, Wisconsin, USA) equipped with an 8
channel phased-array head coil. Two commercially available software applications, NordicICE
(NordicNeuroLab, Bergen, Norway, EU) and GE Brainstat (GE Healthcare, Milwaukee, Wisconsin,
USA) are used at our institution for obtaining maps of DSC-MRI brain vascular estimates.
All DSC-MRI images were corrected for motion. Both software applications can generate maps of the
perfusion parameters (MTT, CBV, CBF) on a voxel by voxel basis. Several approaches can be applied in
the post-processing procedure but the main issue relies on whether the gamma variate function (GVF) or
arterial input function (AIF) are used or not. Region of interest (ROI) were manually constructed by a
neuroradiologist using the contrast-enhanced T1 weighted image as reference. Two ROIs of the same area
were placed: one around tumor hot-spot and one in the contralateral normal white matter.
All statistical analysis were performed with SPSS (Version 18.0; Statistical Package for the Social
Sciences, Chicago, Illinois). One-way repeated-measures analysis ANOVA has been conducted to
determine whether there was a significant difference in the calculated MTT, CBV and CBF values.
Factorial analysis has been applied in order to investigate which independent variables have significant
effects. Significance was set at p < .05.
Several studies have reported perfusion parameters derived from DSC-MRI in brain tumors. Literature
reported rCBV values range from 4.72± 2.76 (n=21) [1] to 8.27 ±2.0 (n=6) [2]. Our rCBV estimates,
ranging from 5.77 to 7.31 in 24 patients, display a wide range of mean values and reflect the variability
found in the literature. We therefore aim to investigate the sources of this variability.
In both software applications, AIF has a statistical effect on data. Although the detection of the AIF and
its implementation in the analysis show similar effects in NordicICE and GE applications, influence of
post-processing steps on the final results is quantitative different for the two software applications.
Moreover, rCBV estimates are affected by the use of a different software application, even if the
algorithms seem to be the same.
Two important issues in the calculation of CBV are represented by the residue function and the gamma-
variate fitting. As a matter of fact, the residue function method is theoretically more correct, but relying
on deconvolution procedure it is also more sensitive to noise. Our results actually show that SD of rCBV
estimates for methods with normalization is lower than the SD of methods with the integration of the
residue function.
The statistical differences found in rCBF values impinges on the rMTT values calculated at CBV/CBF
ratio; on the other hand, when MTT is directly calculated all methods provides homogenous rMTT
values. This can be easily explained by the MTT measurement, which comes directly in seconds without
any data manipulation and it does not rely on the intensity of the curve. Moreover, it should be noted that
for absolute quantification of CBV and CBF, scaling factors are fundamental. CBV and CBF can
therefore be provided in relative units (“institutional” units) while, since the same scaling factors affects
both CBV and CBF, they cancels out in MTT. This observation should encourage the direct
determination of MTT in all cases to check the consistency between the other two perfusion parameters
and to correct them accordingly.
In summary, our work aimed to compare fast and fully automated quantitative perfusion analysis methods
implemented in two different software applications. The use of a different software leads to different
results, even if the algorithms seem to be the same. As a matter of fact, the introduction of AIF in the data
post-processing determines a higher estimates variability that can make inter- and intra- hospital exams
not completely comparable even if tumor to normal values ratio is considered.
References
1) Knopp EA, Cha S, Johnson G, Mazumdar A, Golfinos JG, Zagzag D, Miller DC, Kelly PJ, Kricheff II.
Glial neoplasms: dynamic contrast-enhanced T2*-weighted MR imaging. Radiology 1999; 211:791–98.
2) Lam WW, Chan KW, Wong WL, Poon WS, Metreweli C. Pre-operative grading of intracranial
glioma. Acta Radiol 2001; 42:548–54.
3) Kremer S, Grand S, Remy C, Esteve F, Lefournier V, Pasquier B, Hoffmann D, Benabid AL, Le Bas
JF. Cerebral blood volume mapping by MR imaging in the initial evaluation of brain tumors. J
Neuroradiol 2002; 29:105–13.
4) Aronen H, Gazit I, Louis D, Buchbinder B, Pardo F, Weisskoff R, Harsh GR, Cosgrove GR, Halpern
EF, Hochberg FH et al. Cerebral blood volume maps of gliomas: comparison with tumor grade and
histologic findings. Radiology 1994; 191:41–51.
5) Sugahara T, Korogi Y, Kochi M, Ikushima I, Hirai T, Okuda T, Shigematsu Y, Liang L, Ge Y, Ushio
Y, Takahashi M. Correlation of MR imaging determined cerebral blood volume maps with histologic and
angiographic determination of vascularity of gliomas. Am J Roentgenol 1998; 171:1479–86.
6) Aronen H,Pardo F, Kennedy DN, Belliveau JW, Packard SD, Hsu DW, Hochberg FH, Fishman AJ,
Rosen BR. High Microvascular Blood Volume Is Associated with High Glucose Uptake and Tumor
Angiogenesis in Human Gliomas. Clin Cancer Res 2000; 6: 2189-200.
Segmentazione di volumi FDG-PET, tramite utilizzo del software PETVCARTM, per la definizione del biological target volume nei trattamenti radioterapici dei tumori del distretto testa-collo. Segmentation of FDG-PET volume by PETVCARTM software in order to define biological target volume for head and neck radiotherapy treatments. D. Sardina1; A. Stefano2; E. Bonanno3; S. Cosentino4; M. Favetta1; F. Marletta5; I.V. Patti3; G. Russo2; F. Scopelliti4, M. Tamburo5; L. M. Valastro3; M.G. Sabini3; M. Ippolito4. (1) Scuola di Specializzazione in Fisica Medica, Università degli Studi di Catania (2) IBFM CNR - LATO, Cefalù (PA) (3) U.O.S. Fisica Sanitaria - A.O.E. Cannizzaro, Catania (4) U.O.C. Medicina Nucleare - A.O.E. Cannizzaro, Catania (5) U.O.C. Radioterapia - A.O.E. Cannizzaro, Catania Purpose: As techniques for radiotherapy delivery have developed, increasingly accurate localization of disease is demanded. Functional imaging, particularly, PET and its fusion with anatomical modalities, such as PET/CT, promises to improve detection and characterization of disease. In this context, consistent and accurate methods for PET tumor segmentation are needed in radiation therapy. The aim of our study is to evaluate two of the three segmentation algorithms that can be used in the GE-PETVCAR software implemented into GE workstation, “Max % threshold” and “Estimate threshold” (a clustering method based on the Spherical mean shift algorithm that use a “weight “ factor, that user can vary between 0 and 1), in order to define the FDG-PET/CT biological target volume (BTV) for head and neck treatments. Materials and Methods: Image Quality NEMA IEC/2001 body phantom was acquired on a PET/CT Discovery GE 690 filled with [18F]Fluorodeoxyglucose (FDG) activities for different source-to- background ratio (SBR). The SRB were estimated from PET images and ranged from 1.4 to 10. The two methods included in PETVCAR were tested in order to assess the segmentation accuracy comparing the resulting PET volumes with the known spheres inner volume. For each SBR combination, optimum thresholds and “weight” factor yielding the minimum volume difference between the known and measured sphere volumes were iteratively calculated. Results: For “Max % threshold” and “Estimate threshold” methods, the results show a non linear dependence on the volume of the spheres and the SBR. Regarding to the first method, for small volumes (< 4ml) and SBR (< 2.5) a fixed threshold cannot be estimated because for smaller volumes the SBR reduction increased the threshold levels, in other cases an optimum threshold can be founded including in the range [40-50]%. A similar result has been found for the second method: for small volumes (< 2ml) and SBR (< 2.5) it was not possible to estimate a fixed “weight” factor, in other cases it may be indicated an optimum factor in the range [0,5-0,6]. Conclusion: The threshold and weight factor obtained were applied for a head and neck cancer treatment in order to define FDG-PET/CT biological target volume (BTV). References [1] Habib Zaidi, Issam El Naqq. J Nucl Med Mol Imaging. 2010; 37:2165-2187. [2] TB. Sebastian, et al. Proceedings of the 9th international MICCAI'06 conference. Copenhagen, 2006.
Robust gray-level standardization in brain Magnetic Resonance images. Standardizzazione robusta dei livelli di grigio in immagini cerebrali di Risonanza Magnetica. G. De Nunzio1,2, R. Cataldo1, A. Carlà1. (1) University of Salento, Dept. of Mathematics and Physics, and INFN, Lecce (2) ADAM srl, Advanced Data Analysis in Medicine, http://adamgroup.it Purpose: it is known that intensities in MRI do not have a fixed tissue-specific numeric meaning, even within the same MRI protocol, for the same body region, or for images of the same patient obtained on the same scanner in different moments. Consequently many problems can arise in large multi-site clinical studies, making the interpretation of results difficult or confused, or affecting post processing phases such as segmentation and registration. In spite of the fact that the lack of a standard and quantifiable interpretation compromises the precision, accuracy, and efficiency of those applications, few papers have explicitly addressed the problems. In this context, we propose a tiSsue-Based Standardization Technique (SBST) of MR brain images. Methods and materials: the system was developed and tested on a large number of images, belonging to healthy people and to patients with different degrees of neurodegenerative pathology, obtained from public databases and the clinical practice. Both histogram and tissue-specific intensity information were used, performing piecewise linear intensity transformations between images, so sharing the simplicity and robustness of landmark techniques, while remaining fully automated and quite light from the computational point of view. Results: the efficacy in minimizing the risk of “mixing” brain tissues during intensity transformations was assessed, and particular attention was devoted to a thorough examination of the benefits comparing SBST with other approaches available in the literature. Conclusion: the technique proved robust in standardizing tissues, giving similar intensities to similar tissues, even across images coming from different sources.

Precisione nella quantificazione del 2-idrossiglutarato per mezzo della 1H-MRS a 3 Tesla: uno studio su fantocci
Accuracy of 2-hydroxyglutarate quantification by 1H-MRS at 3 Tesla: a phantom study Nicola Bertolino1, MSc; Chiara Marchionni2, PhD; Francesco Ghielmetti1, MSc; Brian Burns3 , MSc; Gaetano Finocchiaro4, PhD; Maria Grazia Bruzzone1, MD; Ludovico Minati5 , PhD CEng CPhys CSci (1) Neuroradiology Unit, Fondazione IRCCS Istituto Neurologico Carlo Besta, Milano, Italy; (2) Oncology, Nerviano Medical Sciences srl, Nerviano, Italy; (3) Department of Bioengineering, UCLA, Los Angeles CA, USA; (4) Molecular Neuro-oncology Unit, Fondazione IRCCS Istituto Neurologico Carlo Besta; (5) Scientific Department, Fondazione IRCCS Istituto Neurologico Carlo Besta, Milano, Italy.
Purpose: We set out to investigate the potential confounding effect of variable concentration of N-acetyl-L-aspartate (NAA) and Glutamate (Glu) on measurement of the brain oncometabolite 2-hydroxyglutarate (2HG). This issue may arise due to spectral overlap at clinical magnetic field strengths and thus complicate the usage of 2HG as a putative biomarker of low grade gliomas. Methods and materials: Spectra from 25 phantoms (50 mL falcon test tubes) containing a range of knownconcentrations of 2HG, NAA and Glu were acquired using a clinical 3 T scanner with a quadraturehead coil, single-voxel point-resolved spectroscopy sequence with TE=30 ms. Metabolite concentrations were estimated by linear combination analysis and a simulated basis set. Results: NAA and Glu concentrations have a significant confounding effect on 2HG measurements, whereby the negative changes in concentration of these metabolites typically observed in (peri)lesional areas can lead to under-estimation of 2HG concentration with respect to spectra acquired in presence of physiological levels of NAA and Glu. Conclusion: The confounding effect of NAA and Glu concentration changes need to be considered: in patients, it may mask the presence of 2HG at low concentrations, however it is not expected to lead to false positives. References: [1] Grier JT, Batchelor T. Low-grade gliomas in adults Oncologist 2006; 11(6):681-93 [2] Pope WB, Prins RM, Albert Thomas M, Nagarajan R, Yen KE, Bittinger MA, Salamon N, Chou AP, Yong WH, Soto H, et al. Non-invasive detection of 2-hydroxyglutarate and other metabolites in IDH1 mutant glioma patients using mag 189 netic resonance spectroscopy J Neurooncol 2012; 107(1):197-205
Registrazione automatica di immagini prostatiche MR con contrasto e in diffusione.
A fully automatic registration algorithm for multiparametric prostate MRI. V. Giannini1, A. Vignati1, S. Mazzetti2, F. Russo1, C. Bracco2, M. Stasi2, D. Regge1 (1) Radiology Department, IRCCS Candiolo (TO) (2) Physics Department, IRCCS Candiolo (TO)
Purpose: Multi-parametric (mp) magnetic resonance imaging (MRI) has been proposed as a potential alternative screening method for prostate cancer (PCa) diagnosis. One of the most challenging problems is to correctly align different types of images so that features coming from different sequences can be extracted from the same group of pixels. Aim of this study is to present a fully automatic registration system capable of correcting for movements generated during the dynamic contrast-enhanced (DCE) acquisitions and for diffusion-weighted (DW) image distortion. Methods and materials: The dataset includes 21 men with histologically proven PCa (age 65 ± 7, mean ± SD) that underwent endorectal MRI at 1.5 T with the following scanning protocol: axial T2-weigthed (T2-w), DW imaging (b-values 0, 600, 1000 and 1400 s/mm2) and a DCE sequence with a 13 s time resolution. All patients underwent radical prostatectomy within 3 months of MRI. A radiologist manually outlined regions of interest on the T2-w images in areas corresponding to the tumoural foci at histology and in non-tumoural regions located in the contralateral peripheral zone (PZ). First, a multi-resolution rigid registration algorithm, based on the mutual information similarity measurement, corrected misalignment between T2-w and DCE images. Afterward, a linear deformation field decaying along the vertical axis was applied on the DW images. To test for improvement, pharmacokinetics parameters and apparent diffusion coefficient coming from registered and non-registered images were fed into a Bayes classifier, and the area under the receiver operating characteristic curve (AUC) was computed before and after registration. The one-tailed paired t-test was used to evaluate differences between AUC, sensitivity and specificity obtained by the classifier before and after registration. Results: Applying the registration, AUC increased from 0.59 ± 0.15 (mean ± SD) to 0.88 ± 0.11 (p < 0.0001), and sensitivity improvement was from 0.72 ± 0.12 to 0.81 ± 0.12 (p < 0.0001). Conclusion: This study demonstrated the feasibility of a fully automatic registration framework on a MRI prostate computer aided detection (CAD) system. The proposed method seeks to have all the MRI dataset registered to the T2-w image, thus allowing a more reliable mp-MRI analysis.

Gated reconstruction in 18f-fdg pet-ct quantitative imaging: impact on suv estimation in lung tumors E Zivelonghi1, S Guariglia1, MG Giri1, D Grigolato1, M Zuffante1, M Ferdeghini1, C Cavedon1
(1)Azienda Ospedaliera Universitaria Integrata – Verona - Italy
Purpose: PET-CT data are potentially useful in delineating reference volumes in radiation therapy of lung tumors. However, methods based on SUV maps suffer from poor SUV and volume quantification due to respiratory motion. The aim of this study was to assess the impact of respiratory-gated PET-CT (4D-PET-CT) on SUV and SUV-based volume quantification in lung tumors. Methods and Materials: 20 patients who had 18-FDG PET-CT were studied with a 4D-PET-CT additional acquisition after a whole body scan. Only patients that showed respiratory-induced tumor motion greater than 5 mm were enrolled. 4D-PET-CT was performed by means of a Philips Gemini BigBore TOF scanner, using the Varian RPM gating system. Administration and acquisition parameters were 2,5 MBq/kg 18F-FDG, 2 min/bed, retrospective-mode for both PET and CT modalities. Patients were instructed to breath as regularly as possible. Data were reconstructed in 1 (no sorting), 4, 5, 6, 7, 8, 9 and 10 phases. SUVmax values within the lesion in max expiration (ph0) were studied as a function of the number of phases into which the breathing cycle was split. Lesion volumes were also obtained by three different methods: a) fixed SUV=2.2 threshold, b) 40% of SUVmax isocontour and c) gradient-based method. The volumes were also studied as a function of the number of phases in ph0. Results: SUVmax was on average 46.6% higher in the gated acquisition (10 phases) compared to the non-gated case (range 13.1%-228.3%). Volumes estimated by the fixed-threshold method increased with the number of phase-bins, SUVmax percentage-based volumes decreased and gradient-based volumes did not show a unique trend. Conclusion: Motion control significantly impacts quantitative analysis of metabolic imaging. 4D-PET-CT offers a clear advantage in 18F-FDG SUV estimation for tumors that move with respiration. A balance between acquisition time, SNR and SUV estimation accuracy seems to be achievable by using 4-6 phases, depending on lesion size and location. 4D-PET-CT might improve volume quantification as well; however, further research is needed in order to find the optimum segmentation method independently from tumor motion, as residual inconsistencies are observed after motion correction.
Cone Beam Computed Tomography e Multi Slice Computed Tomography: confronto tra la qualità di
imagine e la dose per un protocollo di studio dell’orecchio interno
Cone Beam Computed Tomography and Multi Slice Computed Tomography: Image Quality and dose
comparisons for a inner-ear protocol.
L. Berta2, L. Mascaro
1, C. Pinardi
2, C. Rodella
1 P. Feroldi
1
(1) A.O. Spedali Civili di Brescia, Brescia (2) University of Milan
Purpose: to compare dose and image quality of the inner ear clinical protocol performed at our center with
two different technologies.
Methods and materials: A cone beam CT (CBCT) scanner, Newtom 5G (QR, Verona, IT), and a multi
detector CT (MDCT), Somatom Definition Flash (Siemens, Forcheim GE), were considered in this study. A
cylindrical water phantom (diameter=16cm) that mimicked a human adult head was used for noise
measurements. The Catphan CTP591 module was used for modulation transfer function (MTF)
characterisation. CTDIw measurements were performed with a Piranha electrometer and the CT dose probe
(RTI Electronics AB-SE Mölndal) with a CTDI head phantom.
The CBCT protocol acquisitions were performed at 110 kVp voltage, with the use of an automatic exposure
control, a collimation of 8x8cm2 and a high resolution acquisition mode (voxel size=0.1 mm
3 isotropic) with
a reconstruction field of view (FOV) of 67.2 mm3. The MDCT protocol is a spiral acquisition performed at
120 kVp voltage, using 180 mAs-eff, 8x0.6 collimation, with a ultra-high resolution reconstruction filter
(U70u) and a 0.6mm slice thickness. A statistic of 10 patients for each system was analyzed and compared
in terms of CTDIvol and DLP.
Results: CBCT showed a better spatial resolution: the 50% and 10% MTF were, respectively, 1.2 and 2.4
line pairs/mm compared to the MDCT that resulted 1.1 and 1.4 line pairs/mm.
Image noise in CBCT was about 60% lower than MDCT. However, a relevant structured noise level was
found in some CBCT images, probably due to a non optimal detector calibration.
Dose measurements were used to objectively compare the two systems and to correct the displayed CTDIvol
and DLP reported in the patient protocols. Dose indexes were lower for the CBCT protocol. CTDIvol was
about 60% lower while DLP was only 40% lower because the acquisition volume was higher for CBCT
acquisitions.
Conclusion:. the two technique use two different tube senttings, geometries, detectors and reconstruction
algorithms that make the comparison difficult. However, the CBCT shows significant improvement of image
spatial resolution even if the presence of some structured noise could be a problem that has to be solved.
CBCT doses resulted significantly lower, even if this gap could be reduced considering that the MDCT
system offers some options for further protocol optimisation, as the use of iterative reconstructions and AEC
that is currently turned off.
VALIDATION OF CT-MRI IMAGE REGISTRATION FOR RADIOTHERAPY TREATMENT
PLANNING WITH A DEDICATED PHANTOM
VERIFICA DELLA REGISTRAZIONE DI IMMAGINI TC-IRM PER LA PIANIFICAZIONE DEL
TRATTAMENTO RADIOTERAPICO CON UN FANTOCCIO DEDICATO
S. Spampinato1,2
, A.M. Gueli1-3
, L. Raffaele1,3
, C. Stancampiano1,3
, V. Salamone1,3
(1) A.O.U. Policlinico Vittorio Emanuele, Catania, (2) Università di Catania (3) Scuola di Specializzazione
Fisica Medica, Facoltà di Medicina, Catania
Purpose: The paper is dedicated to the validation of CT-MRI image registration in terms of accuracy and
repeatability using Elekta Focal platform. The study was aimed to verify the automatic registration in clinical
application. For this purpose a dedicated home-made phantom with a lot of landmarks was realized (Stylized
Anatomy for Registration Objective, S.A.R.O.) reproducing PTV and OARs related to the treatment of the
prostate.
Methods and materials: The registration algorithm uses as metric the Mutual Information (MI) and a model
of rigid transformation with six parameters, three translation and three rotations. The registration can be 1)
fully automatic (global), the user can 2) select a restricted region where the algorithm calculates the MI (VOI
tool), or 3) executes manual transformations.
Once acquired phantom CT and MRI images, the study aims to verify accuracy and repeatability of the
transformations imposed by the software. For this purpose, automatic registration parameters (global and
with VOI tool) were compared with those of manual registration. Found the best parameters, some known
rigid transformations have been imposed to the correctly aligned study to test the ability of automatic
registration to bring the study in the correct position.
Results: The comparison between the parameters of automatic and manual registration shows that the first is
reliable when VOI tool is used. Differences between these parameters are less than 1° for rotations and 1 mm
for translations, values comparable with the spatial resolution of images.
Regarding the repeatability of transformations, the registration algorithm is reliable for rotations along Y axis
up to 40° only if VOI tool is used. The same result is obtained with translations along the three axes up to
several cm. On the other hand, automatic registration has not proved satisfactory with rotations along the X
and Z axis. In this case, even for small rotations (2°) the correct alignment is not found.
Conclusion: The results of this study shows that in radiotherapy clinical application automatic registration
would be reliable if VOI tool is used including landmarks visible in both modalities.
However, since the algorithm does not seem to be very sensitive to rotations along X and Z axes, the correct
positioning of the patient in CT and MRI scanning is crucial. Furthermore, the user should always check the
quality of registration and execute, if necessary, manual transformations.

Analisi delle immagini per il controllo di qualità in MSCT: software commerciale vs. homemade
MSCT Image QC analysis: commercial vs. homemade software
A. Sardo1, M.Porzio
1, E.Riciputo
1, E.Zucchi
1.
(1) ASL1 Imperiese, S.D. Fisica Sanitaria, Sanremo
Purpose: The aim of this work is to validate a commercial software developed for the MSCT image quality
control comparing the analysis of different parameters with a homemade software.
Methods and materials: The commercial software is the AutoQA Lite™ - IrisQA llc which is capable of
performing a fully automated analysis of CT images of a range of CT phantoms while the homemade
software is based on ImageJ - RSB public domain. The in-house phantom is the Catphan 600 series –
Phantom Labs with five submodules allowing the measurements of different image parameters: 1)
sensitometry, pixel size and positional accuracy; 2) slice thickness; 3) high contrast resolution; 4) subslice
and supra-slice low contrast and 5) noise and uniformity evaluation.
The evaluation is carried out using all the five modules except the fourth one since for the low contrast
analysis is used a qualitative approach. The Catphan phantom images were acquired on the MSCT- GE
LightSpeed VCT 32 slices.
Results: The software comparison is performed in terms of the mean differences (commercial vs.
homemade) between the image quality parameters taken into account. The sensitometry shows a percentage
difference of -0.3 %, the pixel size and positional accuracy presents differences of 0.1 mm and 0.65 mm
respectively; for slice thickness the mean difference is 0.34 mm. As regard the high contrast resolution, the
mean percentage difference of the MTF at 50 % is 9.0 % with higher deviations in images obtained with
reconstruction filters corresponding to LSF with negative lobes. The noise and the uniformity parameters
show a difference of 0.2 % and -0.26 HU respectively (the latter calculated as the difference in the mean
CT# of ROIs placed at the center and at four boundary positions).
Conclusion: The comparison between the AutoQA Lite™ and the homemade software shows comparable
image quality parameter values with the exception of the high contrast resolution which presents the highest
percentage difference values, due to different calculation approaches.
The results of this work validate the accuracy of AutoQA Lite™ software proving his employment in the
routinely quality assurance program , furthermore the time for the analysis is significantly reduced.

Elastography: comparison of techniques and equipment A. Radice(1),(2), G.Viganò(3) , E. Mariani (2), C. Pasquali(2), C. Ielasi(1),(2), A.Crespi(2)
(1) Università degli Studi di Milano, Scuola di Specializzazione in Fisica Medica, Milano (2) A. O. San Gerardo, S. C. Fisica Sanitaria, Monza (MB)(3) Università degli Studi Milano-Bicocca – Facoltà di Scienze Matematiche Fisiche e Naturali, corso di laurea in Fisica, Milano
Purpose: For centuries, physicians had used palpation as an important diagnostic tool. The strength of palpation is based on the fact that many diseases make changes in the elastic properties of affected tissues. Many cancers, for example, appear as highly hard nodules. Unfortunately, palpation is quite a subjective diagnostic method, and it depends on the size and location of lesions and on the skill of clinicians. Limits set by manual testing and elasticity changes, led in the '80s, to develop various methods estimating the tissue elasticity in different ways. This study was to widen our knowledge of the elastography world, which includes a set of non-invasive techniques using US to give either a quantitative measure of physical parameters characterizing the elasticity of tissues (e.g., Young's modulus), or images showing qualitative distributions of strain in media. Particularly, we aimed to evaluate the metrology response of two particular elastographic techniques: Acoustic Radiation Force Impulse (ARFI) Quantification and Real-Time Elastography (RTE). Furthermore, regarding the RTE, we compared the recorded performances among different platforms.
Methods & materials. The ARFI Quantification was implemented on the ACUSON S2000 system with the linear probe 9L4 (Siemens Healthcare), while the RTE technique was available on the MyLab70XVG (Esaote SpA), Logos Hi Vision (Hitachi Medical Corporation) and ACUSON S2000 (Siemens Healthcare) platforms equipped with the LA523, EUP - L74M and 18L6 – HD linear transducers, respectively.
The ARFI technology provides tissue deformations by means of acoustic radiation force impulses; these generate along their paths transversal shear waves propagating with a cs velocity. The extent of cs allows the assessment of Young's Modulus (E), index of tissue stiffness through the relation E = 3cs
2ρ , where ρ is the medium density. RTE returns strain images both in colormaps and in greyscale levels; tissues are pushed by compression movement effected by users through perpendicular motions of the US transducer to the patient skin. On RTE images measurements of strain ratios (SR) are made: these values give the lesion strain degree to the background one. Strain ratio SR is related to strain (σ), deformation( γ) and Young's Modulus (E) according to this formula:
RTE provides only a semi-quantitative assessment because it returns a ratio; in addition, the strain information is noteworthy and is used as surrogate for stiffness (E), a parameter is not available with this technique.
In the first place, US systems were subjected to quality assurance programmes. Indeed, by means of an appropriate phantom, Precision Multi-Purpose Grey Scale Test Instrument (Gammex, Inc.), and following protocols in use at the O.U. of Medical Physics of the A.O. San Gerardo Hospital (Monza, Italy), we tested their traditional greyscale images (B-Mode). This allowed us to certify that the US machines had maintained high imaging performances.

Among all the parameters investigated, particular importance was attributed to the spatial resolution, which is significant in relation to elasticity images as well. Then, we evaluated the metrology abilities of the elastographic techniques implemented on our machines: in particular, we tested how good our systems were to measure cs and SR, through the use of the Elastography QA Phantom, model 049 (CIRS), provided with some inserts characterized by four values of E (8; 14; 45; 80 kPa) different from the background one (25 kPa).
Data for RTE evaluations acquired comply with guidelines disposable in literature(1,2). In fact, in literature there are plenty of lacking guidelines suggesting how to evaluate SRs, so we summarized all the collected directions in a comprehensive list:
− focus position in correspondence of lesion profundity to have good B-mode image quality − elastographic box with the same dimension of B-mode image − ROIlesion and ROIBKG on the same profundity to have the same strain applied − ROIBKG positioned in a uniform area at the same depth of the lesion; − ROIlesion has to include as much portion of the lesion as possible
SR outcomes depend on the image quality, ROI positions within the prescribed areas and users: these introduce a variance that cannot be erased. Conscious of this, we tried to evaluate the magnitude of this variance by means of a specific set of measures. These measures were designed to introduce changes in the strain image acquisition (focus, frequency, choice of frame in which design ROI) and in the ROI selection procedure (dimension and positioning) and verify how these could affect SR values.
Results Analysing the ARFI measures, it can be seen that these values are repeatable for each different sample (same depth and dimension); instead, there is a dependence between errors and the Young’s Modulus of the lesions within the phantom: indeed, the harder the insert, the greater the standard deviation (σLes IV=1.04, 1.14) . This trend may be noted also among the results for the reproducibility evaluation. Using the formula E=3ρcs
2 , concordance between Ecalculated and Eexpected was evaluated.
Les. I - 8 kPa Les. II- 14 kPa BKG - 25 kPa Les. III- 45 kPa Les. IV- 80 kPa
Ecalc [kPa] 6 11 19 25 45
σEc[kPa] 1 1 2 6 33
Eexp [kPa] 8 14 25 45 80
σEa[kPa] 3 4 4 5 8
(exp-calc)/exp% 21% 24% 25% 44% 44%
There is a general tendency to underestimate the measured values compared to the expected ones and this trend becomes more important for harder inserts. In the end, the machine correctly recognizes and linearly responds (R=0.99) to increases of the Young's modulus in the phantom.
RTE evaluations were effected on the different US systems: MyLab70XVG (Esaote SpA), Logos Hi Vision (Hitachi Medical Corporation) and ACUSON S2000 (Siemens Healthcare). Following guidelines, these data were collected:
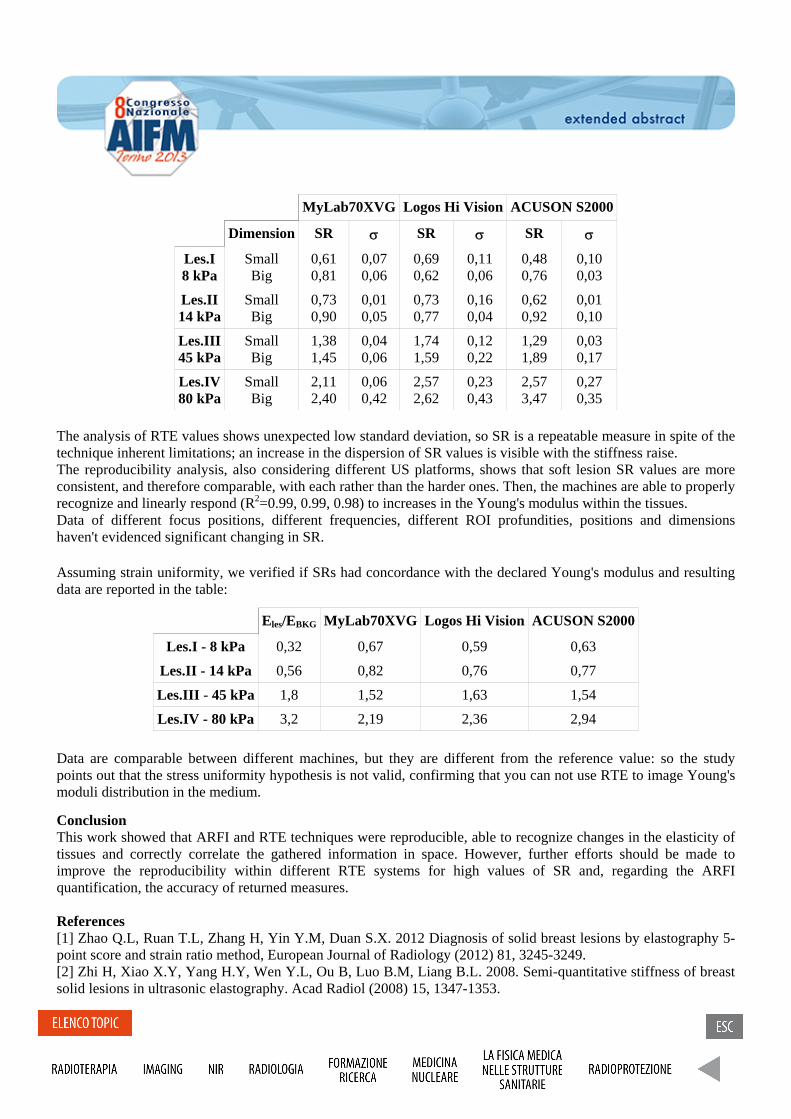
MyLab70XVG Logos Hi Vision ACUSON S2000
Dimension SR σ SR σ SR σ
Les.I 8 kPa
Small Big
0,61 0,81
0,07 0,06
0,69 0,62
0,11 0,06
0,48 0,76
0,10 0,03
Les.II 14 kPa
Small Big
0,73 0,90
0,01 0,05
0,73 0,77
0,16 0,04
0,62 0,92
0,01 0,10
Les.III 45 kPa
Small Big
1,38 1,45
0,04 0,06
1,74 1,59
0,12 0,22
1,29 1,89
0,03 0,17
Les.IV 80 kPa
Small Big
2,11 2,40
0,06 0,42
2,57 2,62
0,23 0,43
2,57 3,47
0,27 0,35
The analysis of RTE values shows unexpected low standard deviation, so SR is a repeatable measure in spite of the technique inherent limitations; an increase in the dispersion of SR values is visible with the stiffness raise. The reproducibility analysis, also considering different US platforms, shows that soft lesion SR values are more consistent, and therefore comparable, with each rather than the harder ones. Then, the machines are able to properly recognize and linearly respond (R2=0.99, 0.99, 0.98) to increases in the Young's modulus within the tissues. Data of different focus positions, different frequencies, different ROI profundities, positions and dimensions haven't evidenced significant changing in SR.
Assuming strain uniformity, we verified if SRs had concordance with the declared Young's modulus and resulting data are reported in the table:
Eles/EBKG MyLab70XVG Logos Hi Vision ACUSON S2000
Les.I - 8 kPa 0,32 0,67 0,59 0,63
Les.II - 14 kPa 0,56 0,82 0,76 0,77
Les.III - 45 kPa 1,8 1,52 1,63 1,54
Les.IV - 80 kPa 3,2 2,19 2,36 2,94
Data are comparable between different machines, but they are different from the reference value: so the study points out that the stress uniformity hypothesis is not valid, confirming that you can not use RTE to image Young's moduli distribution in the medium.
Conclusion This work showed that ARFI and RTE techniques were reproducible, able to recognize changes in the elasticity of tissues and correctly correlate the gathered information in space. However, further efforts should be made to improve the reproducibility within different RTE systems for high values of SR and, regarding the ARFI quantification, the accuracy of returned measures.
References [1] Zhao Q.L, Ruan T.L, Zhang H, Yin Y.M, Duan S.X. 2012 Diagnosis of solid breast lesions by elastography 5-point score and strain ratio method, European Journal of Radiology (2012) 81, 3245-3249. [2] Zhi H, Xiao X.Y, Yang H.Y, Wen Y.L, Ou B, Luo B.M, Liang B.L. 2008. Semi-quantitative stiffness of breast solid lesions in ultrasonic elastography. Acad Radiol (2008) 15, 1347-1353.
Characterization of LuYAP and LuAP scintillation crystals for gamma ray imaging Caratterizzazione di cristalli di scintillazione LuAP e LuYAP per imaging a raggi gamma. M.Bettiol1,2, P. Bennati2, R. Scafè2, D. Sacco3,4, A. Fabbri3,5, R.Pellegrini2,3, M.N. Cinti2,3, S. Lo Meo6, G. De Vincentis3,7, F. de Notaristefani3,4, R. Pani2,3. (1) Post Graduate School of Medical Physics, Sapienza University of Rome, Italy(2) Dept. of Molecular Medicine, Sapienza University of Rome, Italy (3) INFN, Roma I (4) INAIL, Italy (5) Department of Physics, Roma Tre University, Italy (6) ENEA, Bologna (7) Dept. of Radiology, Oncology and Anatomy-pathology Sciences, Sapienza University of Rome, Italy Purpose: LuYAP and LuAP crystals have been recently proposed as ideal candidates for the detection of high-energy gamma rays since their physical and scintillation characteristics. In this study we present the results of characterization of a detector based on array of LuYAP and LuAP crystals coupled to a last generation photomultiplier Hamamatsu H10966, with the aim of achieving a gamma camera for applications in positron emission tomography (PET) and for dosimetry systems in hadrontherapy. Methods and materials: two matrices, one made of 100 LuAP and one made of 100 LuYAP crystals, were realized and tested. Pixel crystals are 2mm×2mm×10 mm isolated by the deposition of dielectric layers with a total thickness of only 15 µm. A packing fraction of 98% was obtained, to the advantage of detection efficiency. The matrices have been coupled to a multi-anodes Hamamatsu H10966 PMT with superbialkali photocathode (38% QE). A 64 independent channels read-out electronics based on FPGA allowed to analyze event by event the distributions of light. The analysis of crystals response, in terms of spatial resolution (SR) and energy resolution (ER), was studied using radioactive isotopes (Co57, Ba133, Cs137) with emission energies in the range of 100 ÷ 662 KeV. Results: As expected from pixels size, the light distributions resulted subsampled even though it has been possible to discriminate the pixels without the use of any additional optical guide. An impressive value of 0.5 mm pixel identification was obtained at 662keV photon energy. Although an unsatisfactory overall ER respect to the literature data for both crystals the good pixels discrimination permitted to extract events from a single pixel so to carry out a best result of 17÷18% at 662 KeV. Then, from the analysis of ER and SR as function of photon energy we showed how the emission of light resulted close to the statistical behaviour for both crystals, which suggests a profitable application of these systems with higher gamma-ray energy. Conclusion: An imaging and spectrometric characterization was done of two LuAP and LuYAP crystal arrays. A good ER and SR values together with the gain in detection efficiency compared to standard assemblies (~ 19%), make this sophisticated system of great interest for γ imaging, both in PET and at higher γ energies (i.e. prompt γ imaging in hadrontherapy).
A Real Time, Large Area, High Spatial resolution Tracker based on scintillating fibers
C. Pugliattia,b, S. Aiellob, D. L. Bonannoa, G. A. P. Cirronec, E. Leonorab, F. Longhitanob, D. Lo Prestia,b, N. Randazzob, F. Romanoc, G.V. Russoa,b, M. Russoa,b, C. Stancampianoc, V. Sipalad,e (a) University of Catania, Catania (Italy) (b) INFN - Sezione di Catania, Catania (Italy) (c) LNS, Catania (Italy) (d) University of Sassari, Sassari (Italy) (e) INFN - Sezione di Cagliari, Cagliari (Italy)
Purpose: Cutting edge research in the treatment of tumours has oriented towards hadron therapy, one of the most effective external radiotherapy techniques, that uses charge particle beams (protons and carbon ions) with energy up to 400 AMeV. Such beams make it possible to accurately release the required dose to control a cancerous mass, while at the same time leaving the surrounding healthy tissue almost totally untouched. If the maximum advantage is to be gained from the potential of these beams, this property must be accompanied by information on the stopping power of the particles used for radiotherapy treatments. The direct use of this information, rather than that from X-ray tomography, leads to a more accurate evaluation of the distribution of the dose and can be used to verify the positioning of the patient. Therefore, the availability of very accurate imaging systems is of fundamental importance [1]. The prefixed tasks are to design and build an imaging system for charged particles based on the consolidated principle of residual range measurement [2], taking advantage of new detection techniques. The aim is to use this system to achieve large detection areas (up to 30x30 cm2), suitable for almost all medical physics applications, and high spatial resolution (up to approximately 150 micron, calculated as strip pitch over ) and time resolutions (up to approximately 2 ns, about 1 ns for Sci-Fi and about 1 ns for photomultipliers) mainly employing scintillating fibers (Sci-Fi) for the trackers and the residual range measurement. We have developed a prototype of the tracker, the OFFSET (Optical Fiber Folded Scintillating Extended Tracker) detector, which has been accurately tested with radioactive sources, cosmic rays and the 62 MeV proton beam available at CATANA proton therapy facility in Laboratori Nazionali del Sud (LNS). The OFFSET tracker uses a read-out channel reduction architecture, which is suitable for imaging conditions, that is it reads a particle at a time. This architecture optimizes and reduces the number of read-out channels for a linear segmentation detector and is an extremely modern version of previous applications [3], [4]. The detector: OFFSET is a large area detector, based on suitably folded Sci-Fi. It consists of two planes of Sci-Fi orthogonal to each other, called the X and Y planes. The prototype uses Saint-Gobain [5], 500 micron multi-cladding BCF-12 Sci-Fi with square section to build the sensitive area of the detector. In these fibers, with a core in suitably doped polystyrene, the energy released by a crossing particle produces isotropically emitted light. Only a part of this light will be channelled into the fiber, which at this point will act as a guide. This light will flow in both directions along the fiber. These fibers come directly from the factory as a pre-glued, aligned ribbon. The ribbons are arranged in two layers and kept in position by pressure of from two square aluminium frames, delimitating the sensitive area of the detector in the prototype that is 20 x 20 cm2. The application of a read-out channel reduction consists in suitably coupling the Sci-Fi to larger standard (clear) optical fibers. The clear fibers are then coupled to light sensors. A single multianode photomultiplier (PSPM) is used as a light sensor instead of having separate light sensors per clear fiber. The H9500 [6] PSPM Hamamatsu photomultiplier has 16x16 pixels, is very compact, needs only one High Voltage power supply and provides an additional signal, called the dynode, which is connected to all the last dynodes of each PSPM channel.

In the detector, 10 Sci-Fi are coupled to a single clear fiber. The coupling is made by routing and fixing the Sci-Fi and clear fibers, mechanically, with optical gel. Conclusion: The first prototype of the OFFSET Tracker has been designed and tested with beta sources, cosmic rays and proton beam. It demonstrates the great advantages of the read-out channel reduction system applied to a large detector with a high spatial resolution, employing submillimiter Sci-Fi and the functionality of the architecture. A complete characterization has been performed and the results are presented. A new version of the detector is now under construction in order to reduce the overall size and to improve the imaging performances also in view of an extension of the size of the sensitive area to 30x30 cm2. The main results regarding the system architecture have been used as a demonstration of the technique which as been patented by the italian Istituto Nazionale di Fisica Nucleare (INFN) [7]. References: [1] G.A.P. Cirrone et alter, The Italian project for a proton imaging device. – Nuclear Instruments & Methods in Physics Research - Section A, Accelerators, spectrometers, detectors and associate equipment, (2007) Vol. 576 pp. 194-197, ISSN 0168-9002, DOI 10.1016/j.nima.2007.01.151 [2] D.A. Watts, U. Amaldi et alter, A proton range telescope for quality assurance in hadrontherapy. – TERA Found., Chile - Nuclear Science Symposium Conference Record (NSS/MIC), 2009 IEEE Issue Date: Oct. 24 2009-Nov. 1 2009, 4163 - 4166, ISSN: 1082-3654 10.1109/NSSMIC.2009.5402303 [3] T. Bressani et alter, Performance of an economic Time-of-flight scintillator hodoscope. – Nuclear Instruments and Methods in Physics Research 221 (1984) 355-362 [4] M. Caria et alter, On the limits of the performances of time-of-flight scintillator hodoscopes saving the number of photomultipliers. –IEEE Transactions on Nuclear Science, Vol. NS-32, No. 1, February 1985 (609-611) [5] Saint Gobain Crystals – Scintillating optical fibers brochure: http://www.detectors.saint-gobain.com/ [6] Hamamatsu web page: www.hamamatsu.com [7] Lo Presti D. 2012. RM2012A000273, Istituto Nazionale di Fisica Nucleare.
Un approccio con reti neurali artificiali all’analisi del task fMRI di rivalità binoculare A neural network approach to fMRI binocular visual rivalry task analysis Nicola Bertolino1, Francesco Ghielmetti1, Stefania Ferraro2, Anna Nigri2 (1) Health Department, IRCCS Carlo Besta Neurological Institute, Milan; (2) Neuro-Radiology Department, IRCCS Carlo Besta Neurological Institute, Milan. Purpose: The aim of this study is to investigate whether artificial neural networks can decode the participants’ conscious experience perception from brain activity alone, using complex stimuli in a binocular visual rivalry fMRI task. Taking into account simultaneously brain activity information from more differently located clusters of voxels, multivariate pattern analysis make possible detection of phenomena that may remain hidden to conventional fMRI analysis with univariate statistical methods. Methods and materials: We applied a pattern recognition data analysis, based on neural networks, on fMRI data acquired during the execution of a binocular visual rivalry paradigm, a task that induces spontaneous and stochastic changes in conscious experience without any changing in visual stimulation. Twelve healthy participants were submitted to fMRI during the execution of a visual non-rivalry task and a visual binocular rivalry task in which two classes of stimuli (faces and houses) were presented. Behavioral responses relative to the switching between consciously perceived stimuli (faces or houses) were also collected. A processing protocol was employed to improve the signal quality. We used non-rivalry data set to identify areas involved in perception and discrimination between visual stimuli and then to train a feed-forward one-layer network. After the training process, we used the network as a ‘brain reading’ tool to determine which stimuli was consciously perceived by the participant. Results: We used behavioral responses, as control parameters, and, comparing it with network output, we obtained good agreement up to 80 % for the best subject (p-value < 0.05 for all subjects). Conclusion: Using the information held in BOLD signal changes, we decoded a pattern of activity identifying the conscious perception status without relying in explicit report. Problems of fMRI data interpretation, concerning patients unable to provide any feedback, could be faced using the described method. References: [1] John-Dylan Haynes, Geraint Rees. Predicting the Stream of Consciousness from Activity in Human Visual Cortex. Current Biology, Vol. 15, 1301–1307, July 26, 2005. [2] Tong F., Nakayama K., Vaughan J.T., Kanwisher N. Binocular Rivalry and Visual Awareness in Human Extrastriate Cortex. Neuron, Vol. 21, 753–759, October, 1998.
Cortical and Subcortical characterization of “diffusional kurtosis imaging” metrics in the human brain
Caratterizzazione corticale e sottocorticale di metriche "diffusional kurtosis imaging" nel cervello umano
S. Lanzafame1, M. Guerrisi1, M. Giannelli2 , N. Toschi1
(1) Medical Physics Section, Department of Biomedicine and Prevention, University of Rome “Tor Vergata”, Rome, Italy.
(2) Unit of Medical Physics, Azienda Ospedaliero-Universitaria Pisana, Pisa, Italy
Background
The diffusion tensor imaging (DTI) model is widely employed for analysis of diffusion-weighted images. However, the model of a Gaussian propagator, which is at the base of conventional DTI framework, may reach its limits in voxels containing mixed tissue types and/or crossing fiber bundles. Diffusional Kurtosis Imaging (DKI) is an extension of DTI that allows for a non-Gaussian water molecule displacement profile while maintaining clinically acceptable acquisition times. It requires multiple diffusion weighted images acquired along non-collinear directions and multiple shells (i.e. b-values), and provides a number of additional invariants which can supply a more comprehensive tissue characterization and an improved sensitivity of diffusion weighted MRI to subtle tissue microstructure alterations. Comparative research in this nascent field is often hampered by the lack of standards in terms of absolute values as well as variability of DKI metrics across anatomical locations. In this paper, we aim to provide reference values for a number of DKI-related metrics and their variability in both cortical and subcortical regions of interest (ROI).
Methods
Multi-shell DKI data were acquired in 10 healthy volunteers on a 3T MR scanner using an EPI sequence and an 8-channel phased array coil. Diffusion weighting was applied in 64 independent, non-collinear directions for each b-value (1000 and 2500 s/mm2), followed by 10 images with no diffusion weighting (b0). We also acquired T1-weighted 3D MPRAGE images. Grey Matter (GM) and White Matter (WM) were segmented on MPRAGE images using FSL FAST, while subcortical structures were isolated using FSL FIRST. Segmentations were transformed into native diffusion space by inverting an affine (12 DOF) transformation computed by registering the b0 image to the T1-weighted image using FSL FLIRT in order to compute ROI-specific averages of DKI-derived metrics, which were estimated using ExploreDTI.
Results
Values of Axial Kurtosis (AK), Axonal Water Fraction (AWF), Kurtosis Anisotropy (KA), Mean Kurtosis (MK), Radial Kurtosis (RK) and Tortuosity (TORT) were measured in the Thalamus, Caudate, Putamen, Pallidum, Hippocampus, Amygdala and Accumbens as well as in White Matter (WM) and Gray Matter (CM) (Table 1).
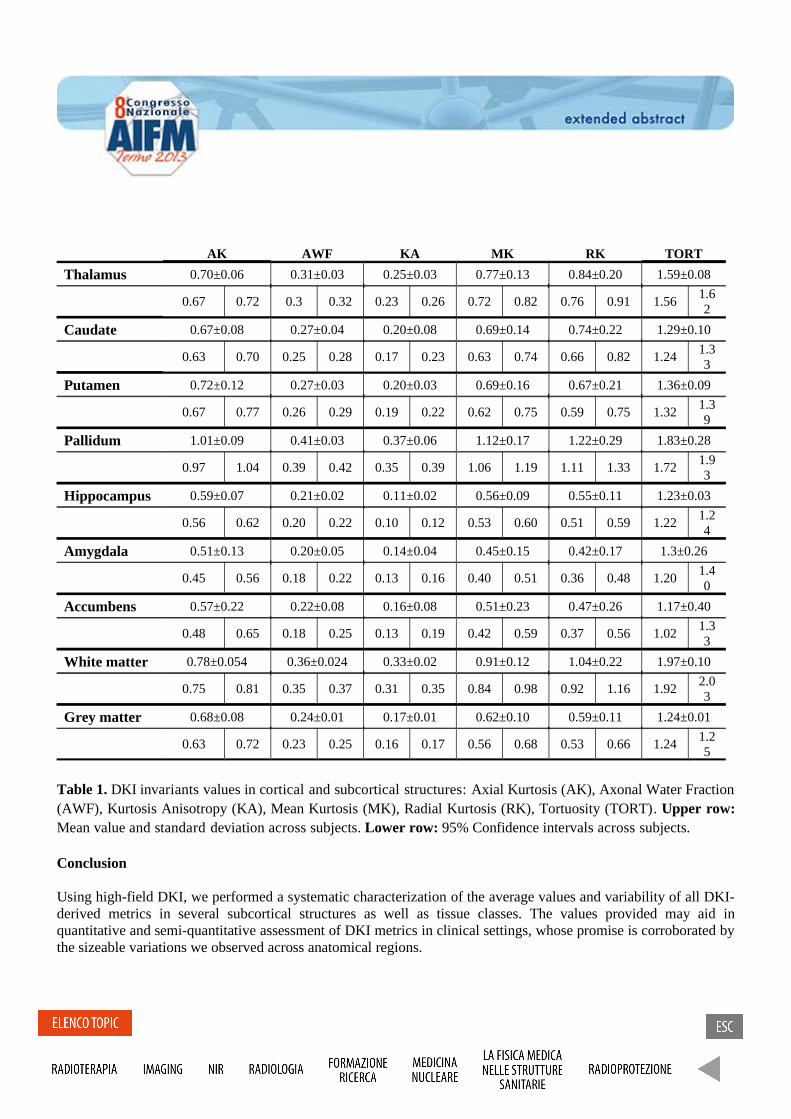
AK AWF KA MK RK TORT
Thalamus 0.70±0.06 0.31±0.03 0.25±0.03 0.77±0.13 0.84±0.20 1.59±0.08
0.67 0.72 0.3 0.32 0.23 0.26 0.72 0.82 0.76 0.91 1.561.62
Caudate 0.67±0.08 0.27±0.04 0.20±0.08 0.69±0.14 0.74±0.22 1.29±0.10
0.63 0.70 0.25 0.28 0.17 0.23 0.63 0.74 0.66 0.82 1.241.33
Putamen 0.72±0.12 0.27±0.03 0.20±0.03 0.69±0.16 0.67±0.21 1.36±0.09
0.67 0.77 0.26 0.29 0.19 0.22 0.62 0.75 0.59 0.75 1.321.39
Pallidum 1.01±0.09 0.41±0.03 0.37±0.06 1.12±0.17 1.22±0.29 1.83±0.28
0.97 1.04 0.39 0.42 0.35 0.39 1.06 1.19 1.11 1.33 1.721.93
Hippocampus 0.59±0.07 0.21±0.02 0.11±0.02 0.56±0.09 0.55±0.11 1.23±0.03
0.56 0.62 0.20 0.22 0.10 0.12 0.53 0.60 0.51 0.59 1.221.24
Amygdala 0.51±0.13 0.20±0.05 0.14±0.04 0.45±0.15 0.42±0.17 1.3±0.26
0.45 0.56 0.18 0.22 0.13 0.16 0.40 0.51 0.36 0.48 1.201.40
Accumbens 0.57±0.22 0.22±0.08 0.16±0.08 0.51±0.23 0.47±0.26 1.17±0.40
0.48 0.65 0.18 0.25 0.13 0.19 0.42 0.59 0.37 0.56 1.021.33
White matter 0.78±0.054 0.36±0.024 0.33±0.02 0.91±0.12 1.04±0.22 1.97±0.10
0.75 0.81 0.35 0.37 0.31 0.35 0.84 0.98 0.92 1.16 1.922.03
Grey matter 0.68±0.08 0.24±0.01 0.17±0.01 0.62±0.10 0.59±0.11 1.24±0.01
0.63 0.72 0.23 0.25 0.16 0.17 0.56 0.68 0.53 0.66 1.241.25
Table 1. DKI invariants values in cortical and subcortical structures: Axial Kurtosis (AK), Axonal Water Fraction (AWF), Kurtosis Anisotropy (KA), Mean Kurtosis (MK), Radial Kurtosis (RK), Tortuosity (TORT). Upper row: Mean value and standard deviation across subjects. Lower row: 95% Confidence intervals across subjects.
Conclusion
Using high-field DKI, we performed a systematic characterization of the average values and variability of all DKI-derived metrics in several subcortical structures as well as tissue classes. The values provided may aid in quantitative and semi-quantitative assessment of DKI metrics in clinical settings, whose promise is corroborated by the sizeable variations we observed across anatomical regions.
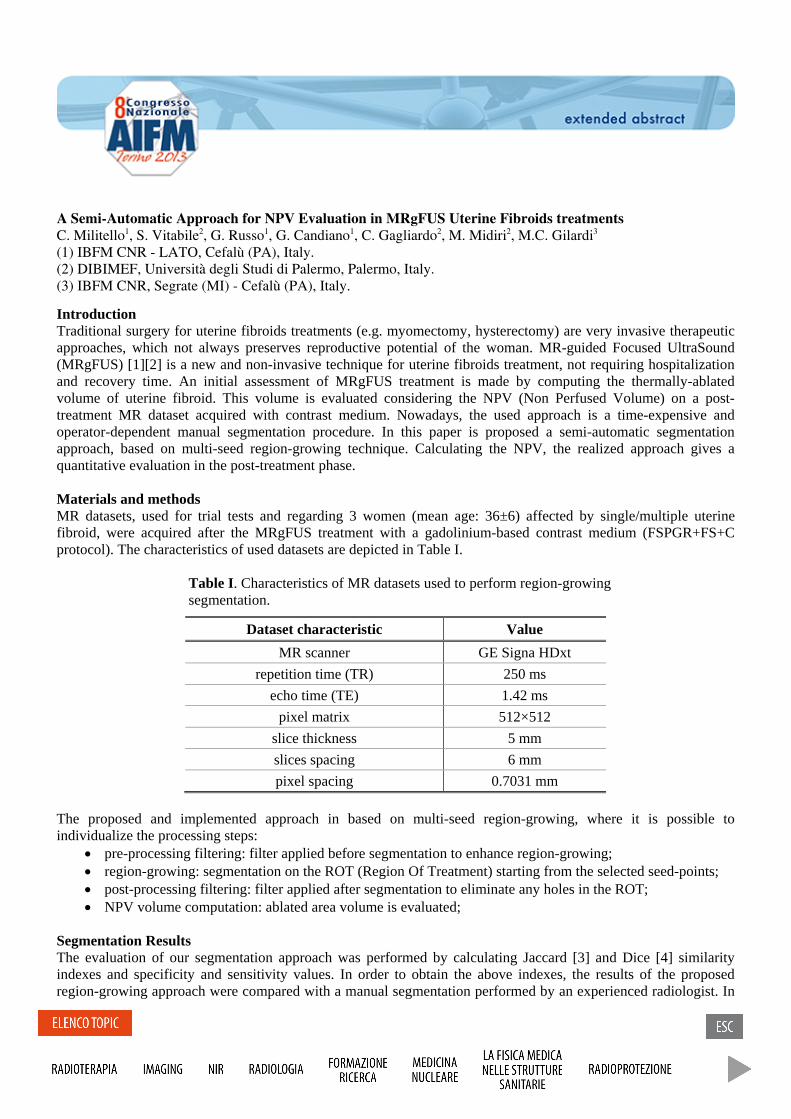
A Semi-Automatic Approach for NPV Evaluation in MRgFUS Uterine Fibroids treatments C. Militello1, S. Vitabile2, G. Russo1, G. Candiano1, C. Gagliardo2, M. Midiri2, M.C. Gilardi3 (1) IBFM CNR - LATO, Cefalù (PA), Italy. (2) DIBIMEF, Università degli Studi di Palermo, Palermo, Italy. (3) IBFM CNR, Segrate (MI) - Cefalù (PA), Italy.
Introduction Traditional surgery for uterine fibroids treatments (e.g. myomectomy, hysterectomy) are very invasive therapeutic approaches, which not always preserves reproductive potential of the woman. MR-guided Focused UltraSound (MRgFUS) [1][2] is a new and non-invasive technique for uterine fibroids treatment, not requiring hospitalization and recovery time. An initial assessment of MRgFUS treatment is made by computing the thermally-ablated volume of uterine fibroid. This volume is evaluated considering the NPV (Non Perfused Volume) on a post-treatment MR dataset acquired with contrast medium. Nowadays, the used approach is a time-expensive and operator-dependent manual segmentation procedure. In this paper is proposed a semi-automatic segmentation approach, based on multi-seed region-growing technique. Calculating the NPV, the realized approach gives a quantitative evaluation in the post-treatment phase.
Materials and methods MR datasets, used for trial tests and regarding 3 women (mean age: 36±6) affected by single/multiple uterine fibroid, were acquired after the MRgFUS treatment with a gadolinium-based contrast medium (FSPGR+FS+C protocol). The characteristics of used datasets are depicted in Table I.
Table I. Characteristics of MR datasets used to perform region-growing segmentation.
Dataset characteristic Value MR scanner GE Signa HDxt
repetition time (TR) 250 ms echo time (TE) 1.42 ms
pixel matrix 512×512 slice thickness 5 mm slices spacing 6 mm pixel spacing 0.7031 mm
The proposed and implemented approach in based on multi-seed region-growing, where it is possible to individualize the processing steps:
• pre-processing filtering: filter applied before segmentation to enhance region-growing;• region-growing: segmentation on the ROT (Region Of Treatment) starting from the selected seed-points;• post-processing filtering: filter applied after segmentation to eliminate any holes in the ROT;• NPV volume computation: ablated area volume is evaluated;
Segmentation Results The evaluation of our segmentation approach was performed by calculating Jaccard [3] and Dice [4] similarity indexes and specificity and sensitivity values. In order to obtain the above indexes, the results of the proposed region-growing approach were compared with a manual segmentation performed by an experienced radiologist. In

Figure 1 are shown three different moments in the segmentation process of MR images. Obtained segmentation results are depicted in Table II.
Figure 1 – a) MR sagittal slice of 3 uterine fibroids after MRgFUS treatment. Initial seed-points are selected by operators; b) Segmented ROIs on treated fibroid areas using the proposed Region-Growing approach; c) Masked ROIs obtained after segmentation. Individualized areas are used to calculate the NPV.
Table II. Obtained segmentation results in terms of Jaccard and Dice similarity indexes and specificity/sensitivity values.
Index Value
Jaccard Index 87.83% Dice Index 94.12% Sensitivity 91.59%Specificity 89.72%
Conclusions The proposed multi-seed region-growing segmentation approach allows to estimate the NPV in a semi-automatic and operator-independent way. Obtained evaluation indexes show the effectiveness of the implemented technique.
References [1] Machtinger R et al.; MR-guided focus ultrasound (MRgFUS) for symptomatic uterine fibroids:
predictors of treatment success; Hum Reprod. 2012 Dec;27(12):3425-31. doi: 10.1093/humrep/des333.
[2] Chapman A et al.; Thermal ablation of uterine fibroids using MR-guided focused ultrasound-a truly non-invasive treatment modality; Eur. Radiology (2007) 17.10: 2505-11.
[3] Jaccard P; “Distribution de la florine alpine dans la Bassin de Dranses et dans quelques regiones voisines”, Bulletin de la Societe Vaudoise des Sciences Naturelles, vol. 37, pp. 241–272.
[4] Dice LR; “Measures of the amount of ecologic association between species”, Ecology 26, 297–302.
a) b) c)
Confronto tra diversi flussimetri per la calibrazione di un sistema Echo-Doppler con Blood Mimicking Fluid (BMF) ; test delle capacita di simulazione della vena giugulare interna del fantoccio Blue Phantom Training Model BPIJ500. Comparison of several flowmeters using Blood Mimicking Fluid (BMF) for calibration of an Echo-Doppler system and the compliance measurement of the Blue Phantom Ultrasound Internal Jugular Training Model BPIJ500
K. Denanyoh1, G.Gadda1, E.Menegatti2, F. Sisini 1, A. Taibi1,3
, M. Tessari2, P. Zamboni2, R.Novario4 , M. Gambaccini1,3
(1) Department of Physics and Earth Sciences University of Ferrara, via Saragat1, I-44122 Ferrara, Italy (2) Department of Morphology, Surgery and Experimental Medicine University of Ferrara, via Luigi Borsari 46 Ferrara, Italy (3) INFN Ferrara, via Saragat1, I-44122 Ferrara, Italy (4) Health Physics University of Insubria, Viale Borri 57, Varese, Italy Purpose: A typical diagnostic application of Ultrasound (US) is known as Echo-Doppler (ED) for the quantification of the velocity of blood in vessels. For example in neck veins it allows to diagnose the syndrome CCSVI(Chronic Cerebrospinal Venous Insufficiency)[1],[2]. In this work we present a comparison between different flowmeters for blood mimicking mean velocity measurement and to compare it to the response of an ED system as well as the compliance measurement of the Blue Phantom US Internal Jugular Training Model BPIJ500. Methods and materials: With different types of flowmeter (UF Ultrasonic flowmeter, liquid turbine meters of the series KIT-200x, GEMS flowmeter) we measure the flow of the blood mimicking fluid (BMF) flowing through a hemodynamic circuit consisting of a plastic reservoir containing the BMF, a gear pump, a phantom simulating the neck veins, flowmeters above mentioned and finally external tubes.A 5MHz to 10MHz ultrasonic probe fixed in a position and connected to an ED machine was used allowing to display the velocities profil.The tube is completely imbedded inside the BMF.By varying the voltage applied to the pump, the flowmeters (GEMS and liquid turbine meters) connected to an oscilloscope display a signal whose Fourier transform allows to obtain the frequency and then the flow.The data analysis is done using Igor software. The compliance of the Blue Phantom US Internal Jugular Training Model BPIJ500 is measured by making the ratio between the change in area and in pressure of the tube simulating the neck veins due to the flowing fluid. Results: The trend of the velocity provided by the flowmeters is different from that of the ED system. It presents an offset and a slope difference compared to the one obtained from the flowmeters and the compliance of the Blue Phantom US Internal Jugular Training Model BPIJ500 is comparable to that in general of a human being Conclusion: The correct velocity measurement of the ED system can be obtained by making a rescale removing the offset and changing the slope from the value measured and the compliance measured can be used for clinical considerations. References: [1] P. Zamboni, E.Menegatti, L.Pomidori, S. Morovic,A.Taibi, AM. Malagoni, AL.Cogo, M.Gambaccini, Does thoracic pump influence the cerebral venous return?., J.Appl Physiol 112:904-910,2012

[2] P.Zamboni, S.Morovic, E. Menegatti,G.Viselner, AN. Nicolaides, Screening for CCSVI using US, Int. Angiol 2011,30:571-97
Mammografia a contrasto di fase: studi su fantocci.
Phase contrast mammography: a phantom study.
P. Russo1,2
, R. Castriconi1, G. Mettivier
1,2.
(1) Dipartimento di Fisica, Università di Napoli “Federico II”, (2) INFN, Sezione di Napoli.
The purpose of this study is to investigate the image quality for microcalcifications and masses detection in a breast
phantom, in absorption based and in-line (propagation based) phase contrast mammography, as a function of the
radiation dose.
Digital mammography has limitations, including the difficulty of diagnosis for patients with a dense breast,
in which a high percentage of fibroglandular tissue complicates the detection of tissue lesions. Recently, through
the analysis of phenomena related to the wave nature of X-ray electromagnetic radiation, it has been shown that for
the generation of the radiographic contrast it is possible to exploit also the information related to the wave phase
shift introduced in the propagation of X-rays in matter. Techniques allowing to recover the information on the
wave phase shift are called phase contrast imaging techniques. These techniques are based on the small angle
refraction phenomena which the incident wave undergoes in crossing local inhomogeneities in the refractive index
of the material, as well as on variations in the sample thickness (along the direction of propagation). The complex
refractive index is written as n 1 i, where is the refractive index decrement and is the absorption index
of the material at the energy of the X-rays. The deformation of the wave front generates a lateral phase gradient
which carries information on the position and the nature of the refractive inhomogeneities in the tissue. These
refractive phenomena are characterized by angular deviations of microradians in biological tissues. Hence, it is
necessary to interpose a sufficient propagation distance between object and detector, and to use X-ray waves with
sufficient degree of spatial coherence. The radiation field behind the object (Fresnel near field) results from the
coherent overlapping of diffracted wave fronts. It presents areas of constructive and destructive interference which
generate phenomena of contrast enhancement at the edges of the radiographed objects (edge enhancement effect).
The contrast in the final image will be generated by refraction and by interference between parts of the emerging
wave front with different phase shift.
In this work we studied the phase contrast phenomenon, through the in-line phase contrast imaging (also
called propagation based imaging), in order to test the effective improvement in image contrast in phase imaging
with respect to attenuation based imaging. The presence of phase effects might give the possibility of an increased
image contrast for glandular masses and for microcalcifications, at levels of Mean Glandular Dose (MGD) not
greater than the maximum allowed for one-view mammography. In addition, we investigated any improvement in
image contrast upon increasing the beam energy (40 and 80 kVp), at each given MGD value.
Our setup for in-line phase contrast mammography employs a microfocus X-ray tube (7 m focal spot size,
W anode, 1.58 mm Al additional filter, 40 kVp/250 or 80 kVp/125 ) and a CMOS CsI:Tl flat-panel detector
with 50 m pitch. 2D projection images were acquired at 40 and at 80 kVp of a mammographic phantom (CIRS
mod. 014AD, 3 slabs of BR50/50 breast tissue substitute material with 50% glandular fraction, 5 cm total
thickness, containing at midplane simulated masses and varying size CaCO3 specks). This phantom is intended for
quality control in mammography. Images were acquired a) with the phantom in contact with the detector
(absorption image with 625 mm source to phantom distance and magnification M = 1.1); b) in a geometry with an
image magnification M = 1.9 (phase contrast image with 625 mm source to phantom distance and 512 mm object
to image distance). We retrieved the phase map of the test object (at 40 and 80 kVp) taken under phase contrast
conditions, using the ANKAphase algorithm (“Weitkamp T et al.” ANKAphase: software for single-distance phase
retrieval from inline X-ray phase-contrast radiographs. J. Synchrotron Rad. 18, 617–629, 2011), assuming
homogeneity of the sample and uniformity of the ratio δ/β in the phantom volume. Values of δ and β was derived
from CSIRO CSS web site (https://www.ts-imaging.net/Services/Simple/Default.aspx) for 50/50 breast tissue at the
average energies 28 keV and 42 keV for the 40-kVp and 80-kVp beam energies, respectively. The equivalent MGD
calculated for a single exposure frame was 0.0092 mGy (40 kVp) or 0.022 mGy (80 kVp); by taking the running
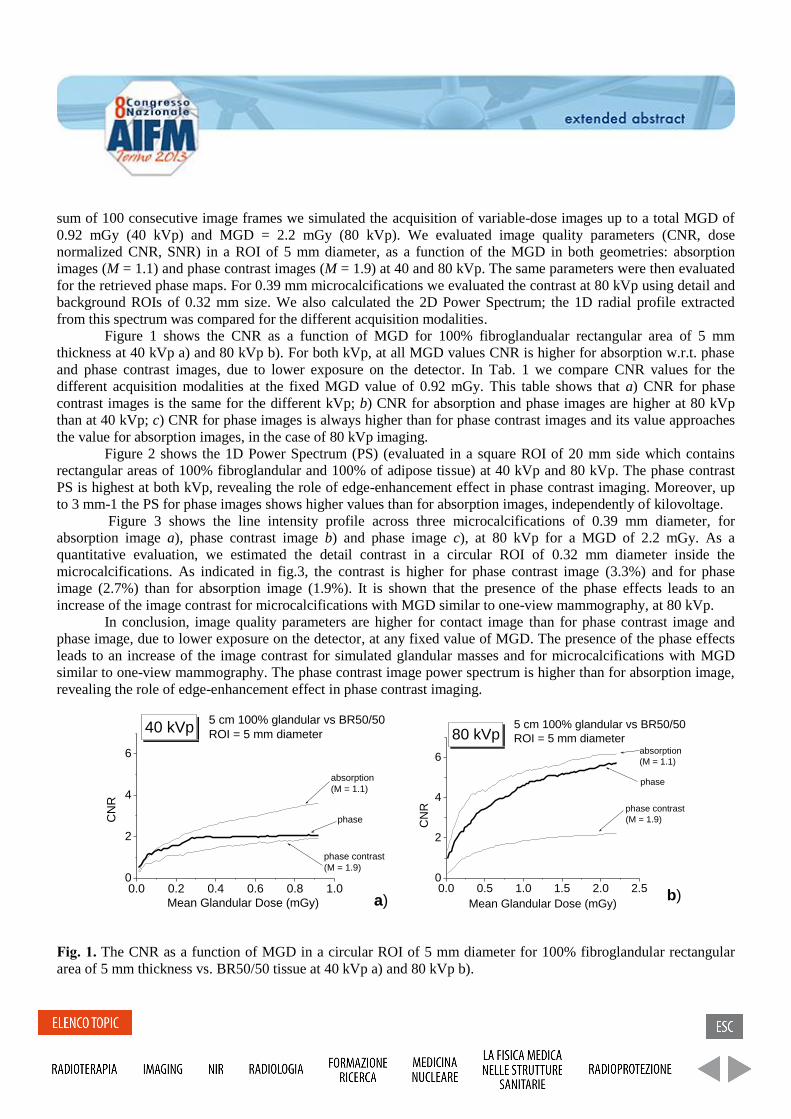
sum of 100 consecutive image frames we simulated the acquisition of variable-dose images up to a total MGD of
0.92 mGy (40 kVp) and MGD = 2.2 mGy (80 kVp). We evaluated image quality parameters (CNR, dose
normalized CNR, SNR) in a ROI of 5 mm diameter, as a function of the MGD in both geometries: absorption
images (M = 1.1) and phase contrast images (M = 1.9) at 40 and 80 kVp. The same parameters were then evaluated
for the retrieved phase maps. For 0.39 mm microcalcifications we evaluated the contrast at 80 kVp using detail and
background ROIs of 0.32 mm size. We also calculated the 2D Power Spectrum; the 1D radial profile extracted
from this spectrum was compared for the different acquisition modalities. Figure 1 shows the CNR as a function of MGD for 100% fibroglandualar rectangular area of 5 mm
thickness at 40 kVp a) and 80 kVp b). For both kVp, at all MGD values CNR is higher for absorption w.r.t. phase
and phase contrast images, due to lower exposure on the detector. In Tab. 1 we compare CNR values for the
different acquisition modalities at the fixed MGD value of 0.92 mGy. This table shows that a) CNR for phase
contrast images is the same for the different kVp; b) CNR for absorption and phase images are higher at 80 kVp
than at 40 kVp; c) CNR for phase images is always higher than for phase contrast images and its value approaches
the value for absorption images, in the case of 80 kVp imaging.
Figure 2 shows the 1D Power Spectrum (PS) (evaluated in a square ROI of 20 mm side which contains
rectangular areas of 100% fibroglandular and 100% of adipose tissue) at 40 kVp and 80 kVp. The phase contrast
PS is highest at both kVp, revealing the role of edge-enhancement effect in phase contrast imaging. Moreover, up
to 3 mm-1 the PS for phase images shows higher values than for absorption images, independently of kilovoltage.
Figure 3 shows the line intensity profile across three microcalcifications of 0.39 mm diameter, for
absorption image a), phase contrast image b) and phase image c), at 80 kVp for a MGD of 2.2 mGy. As a
quantitative evaluation, we estimated the detail contrast in a circular ROI of 0.32 mm diameter inside the
microcalcifications. As indicated in fig.3, the contrast is higher for phase contrast image (3.3%) and for phase
image (2.7%) than for absorption image (1.9%). It is shown that the presence of the phase effects leads to an
increase of the image contrast for microcalcifications with MGD similar to one-view mammography, at 80 kVp.
In conclusion, image quality parameters are higher for contact image than for phase contrast image and
phase image, due to lower exposure on the detector, at any fixed value of MGD. The presence of the phase effects
leads to an increase of the image contrast for simulated glandular masses and for microcalcifications with MGD
similar to one-view mammography. The phase contrast image power spectrum is higher than for absorption image,
revealing the role of edge-enhancement effect in phase contrast imaging.
0.0 0.2 0.4 0.6 0.8 1.00
2
4
6
a)
5 cm 100% glandular vs BR50/50
ROI = 5 mm diameter
absorption
(M = 1.1)
phase
phase contrast
(M = 1.9)
40 kVp
CN
R
Mean Glandular Dose (mGy)
0.0 0.5 1.0 1.5 2.0 2.50
2
4
6
b)
phase contrast
(M = 1.9)
phase
absorption
(M = 1.1)
5 cm 100% glandular vs BR50/50
ROI = 5 mm diameter80 kVp
CN
R
Mean Glandular Dose (mGy)
Fig. 1. The CNR as a function of MGD in a circular ROI of 5 mm diameter for 100% fibroglandular rectangular
area of 5 mm thickness vs. BR50/50 tissue at 40 kVp a) and 80 kVp b).
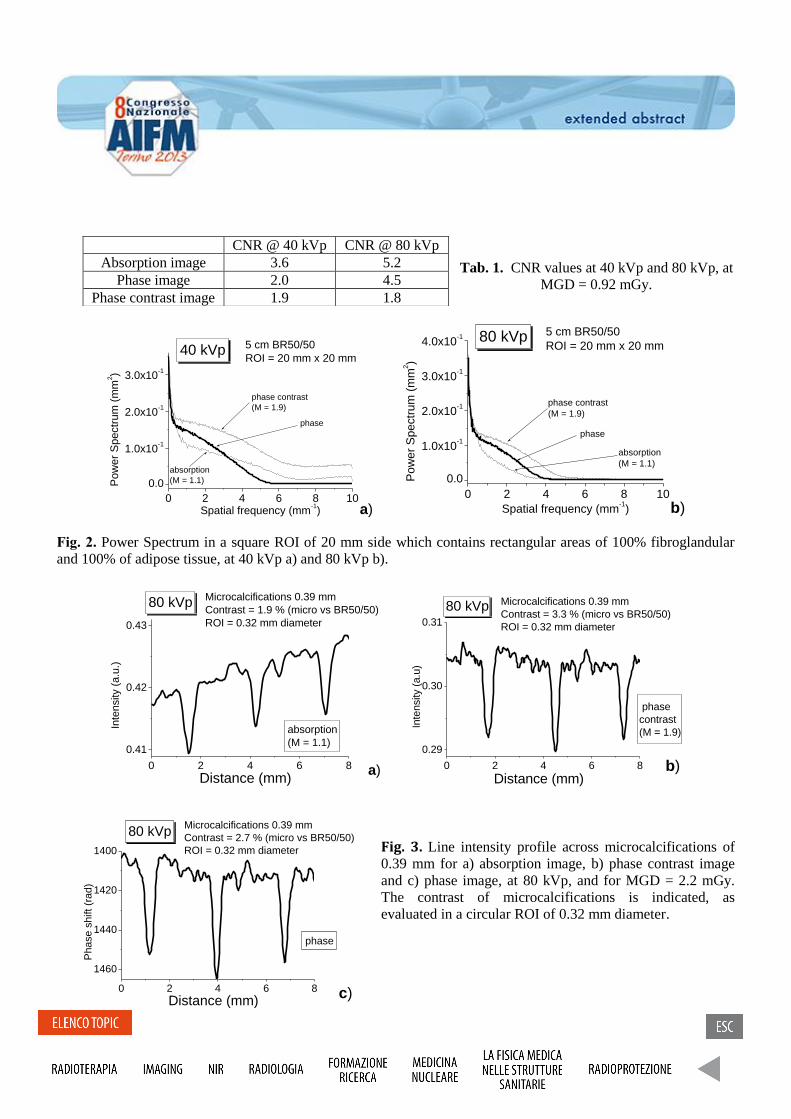
Tab. 1. CNR values at 40 kVp and 80 kVp, at
MGD = 0.92 mGy.
0 2 4 6 8 10
0.0
1.0x10⁻¹
2.0x10⁻¹
3.0x10⁻¹
a)
phase contrast
(M = 1.9)
phase
absorption
(M = 1.1)
5 cm BR50/50
ROI = 20 mm x 20 mm40 kVp
Pow
er
Spectr
um
(m
m2)
Spatial frequency (mm-1)
0 2 4 6 8 10
0.0
1.0x10⁻¹
2.0x10⁻¹
3.0x10⁻¹
4.0x10⁻¹
b)
5 cm BR50/50
ROI = 20 mm x 20 mm80 kVp
phase contrast
(M = 1.9)
phase
absorption
(M = 1.1)
Po
we
r S
pe
ctr
um
(m
m2)
Spatial frequency (mm-1)
Fig. 2. Power Spectrum in a square ROI of 20 mm side which contains rectangular areas of 100% fibroglandular
and 100% of adipose tissue, at 40 kVp a) and 80 kVp b).
0 2 4 6 8
0.41
0.42
0.43
a)
Microcalcifications 0.39 mm
Contrast = 1.9 % (micro vs BR50/50)
ROI = 0.32 mm diameter
80 kVp
absorption
(M = 1.1)
Inte
nsity (
a.u
.)
Distance (mm)0 2 4 6 8
0.29
0.30
0.31
b)
phase
contrast
(M = 1.9)
Microcalcifications 0.39 mm
Contrast = 3.3 % (micro vs BR50/50)
ROI = 0.32 mm diameter
80 kVp
Inte
nsity (
a.u
)
Distance (mm)
Fig. 3. Line intensity profile across microcalcifications of
0.39 mm for a) absorption image, b) phase contrast image
and c) phase image, at 80 kVp, and for MGD = 2.2 mGy.
The contrast of microcalcifications is indicated, as
evaluated in a circular ROI of 0.32 mm diameter.
CNR @ 40 kVp CNR @ 80 kVp
Absorption image 3.6 5.2
Phase image 2.0 4.5
Phase contrast image 1.9 1.8
0 2 4 6 8
1460
1440
1420
1400
c)
phase
Microcalcifications 0.39 mm
Contrast = 2.7 % (micro vs BR50/50)
ROI = 0.32 mm diameter
80 kVp
Ph
ase
sh
ift (r
ad
)
Distance (mm)
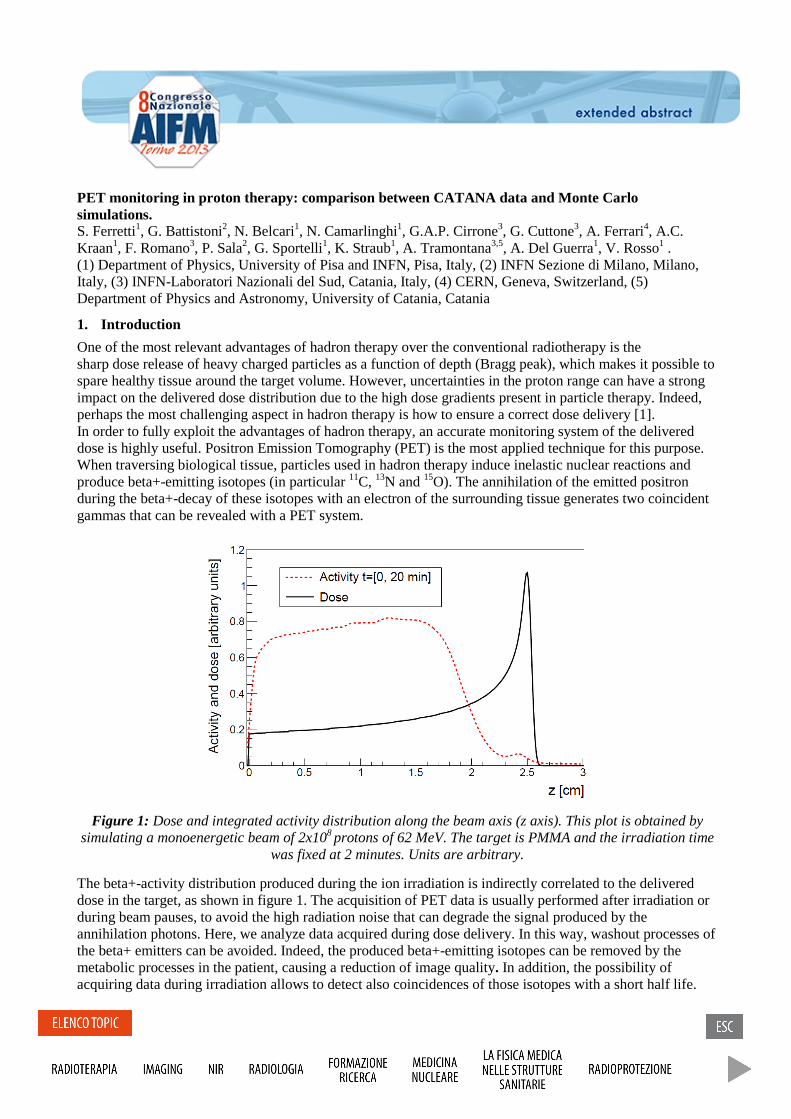
PET monitoring in proton therapy: comparison between CATANA data and Monte Carlo simulations. S. Ferretti1, G. Battistoni2, N. Belcari1, N. Camarlinghi1, G.A.P. Cirrone3, G. Cuttone3, A. Ferrari4, A.C. Kraan1, F. Romano3, P. Sala2, G. Sportelli1, K. Straub1, A. Tramontana3,5, A. Del Guerra1, V. Rosso1 . (1) Department of Physics, University of Pisa and INFN, Pisa, Italy, (2) INFN Sezione di Milano, Milano, Italy, (3) INFN-Laboratori Nazionali del Sud, Catania, Italy, (4) CERN, Geneva, Switzerland, (5) Department of Physics and Astronomy, University of Catania, Catania
1. Introduction
One of the most relevant advantages of hadron therapy over the conventional radiotherapy is the sharp dose release of heavy charged particles as a function of depth (Bragg peak), which makes it possible to spare healthy tissue around the target volume. However, uncertainties in the proton range can have a strong impact on the delivered dose distribution due to the high dose gradients present in particle therapy. Indeed, perhaps the most challenging aspect in hadron therapy is how to ensure a correct dose delivery [1]. In order to fully exploit the advantages of hadron therapy, an accurate monitoring system of the delivered dose is highly useful. Positron Emission Tomography (PET) is the most applied technique for this purpose. When traversing biological tissue, particles used in hadron therapy induce inelastic nuclear reactions and produce beta+-emitting isotopes (in particular 11C, 13N and 15O). The annihilation of the emitted positron during the beta+-decay of these isotopes with an electron of the surrounding tissue generates two coincident gammas that can be revealed with a PET system.
Figure 1: Dose and integrated activity distribution along the beam axis (z axis). This plot is obtained by simulating a monoenergetic beam of 2x10⁸ protons of 62 MeV. The target is PMMA and the irradiation time
was fixed at 2 minutes. Units are arbitrary.
The beta+-activity distribution produced during the ion irradiation is indirectly correlated to the delivered dose in the target, as shown in figure 1. The acquisition of PET data is usually performed after irradiation or during beam pauses, to avoid the high radiation noise that can degrade the signal produced by the annihilation photons. Here, we analyze data acquired during dose delivery. In this way, washout processes of the beta+ emitters can be avoided. Indeed, the produced beta+-emitting isotopes can be removed by the metabolic processes in the patient, causing a reduction of image quality . In addition, the possibility of acquiring data during irradiation allows to detect also coincidences of those isotopes with a short half life.
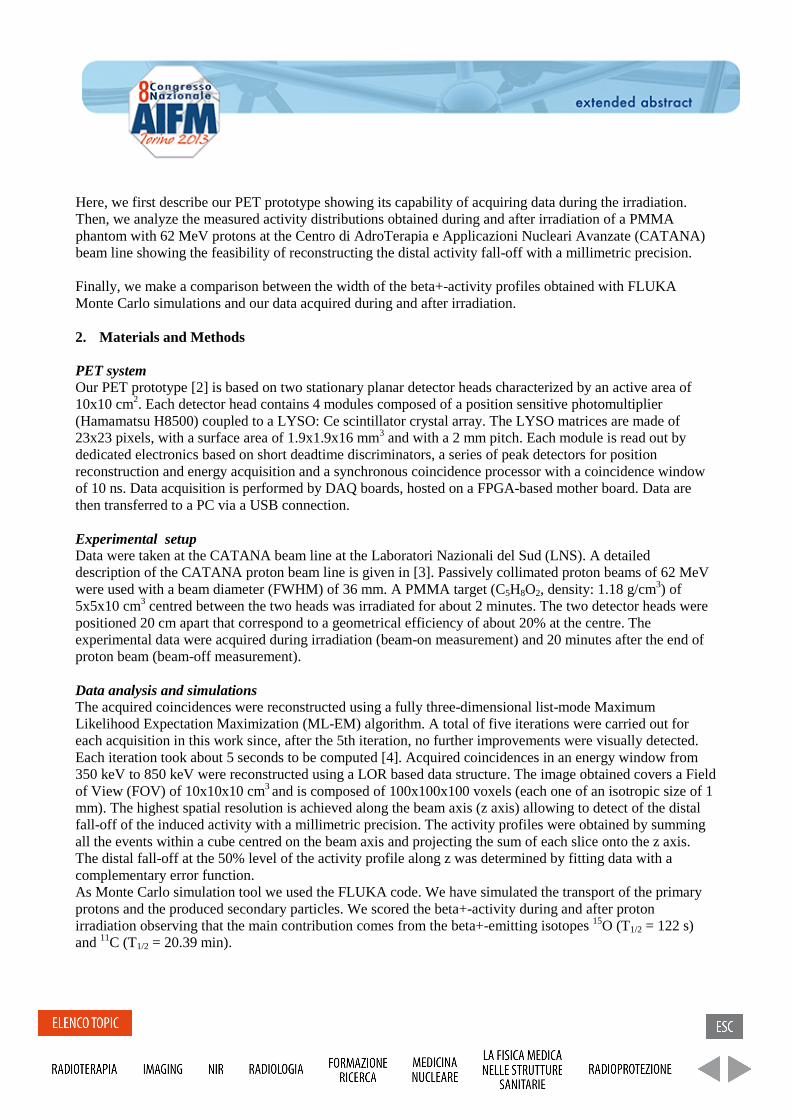
Finally, we make a comparison between the width of the beta+-activity profiles obtained with FLUKA Monte Carlo simulations and our data acquired during and after irradiation.
2. Materials and Methods
PET system Our PET prototype [2] is based on two stationary planar detector heads characterized by an active area of 10x10 cm2. Each detector head contains 4 modules composed of a position sensitive photomultiplier (Hamamatsu H8500) coupled to a LYSO: Ce scintillator crystal array. The LYSO matrices are made of 23x23 pixels, with a surface area of 1.9x1.9x16 mm3 and with a 2 mm pitch. Each module is read out by dedicated electronics based on short deadtime discriminators, a series of peak detectors for position reconstruction and energy acquisition and a synchronous coincidence processor with a coincidence window of 10 ns. Data acquisition is performed by DAQ boards, hosted on a FPGA-based mother board. Data are then transferred to a PC via a USB connection.
Experimental setup Data were taken at the CATANA beam line at the Laboratori Nazionali del Sud (LNS). A detailed description of the CATANA proton beam line is given in [3]. Passively collimated proton beams of 62 MeV were used with a beam diameter (FWHM) of 36 mm. A PMMA target (C5H8O2, density: 1.18 g/cm3) of 5x5x10 cm3 centred between the two heads was irradiated for about 2 minutes. The two detector heads were positioned 20 cm apart that correspond to a geometrical efficiency of about 20% at the centre. The experimental data were acquired during irradiation (beam-on measurement) and 20 minutes after the end of proton beam (beam-off measurement).
Data analysis and simulations The acquired coincidences were reconstructed using a fully three-dimensional list-mode Maximum Likelihood Expectation Maximization (ML-EM) algorithm. A total of five iterations were carried out for each acquisition in this work since, after the 5th iteration, no further improvements were visually detected. Each iteration took about 5 seconds to be computed [4]. Acquired coincidences in an energy window from 350 keV to 850 keV were reconstructed using a LOR based data structure. The image obtained covers a Field of View (FOV) of 10x10x10 cm3 and is composed of 100x100x100 voxels (each one of an isotropic size of 1 mm). The highest spatial resolution is achieved along the beam axis (z axis) allowing to detect of the distal fall-off of the induced activity with a millimetric precision. The activity profiles were obtained by summing all the events within a cube centred on the beam axis and projecting the sum of each slice onto the z axis. The distal fall-off at the 50% level of the activity profile along z was determined by fitting data with a complementary error function. As Monte Carlo simulation tool we used the FLUKA code. We have simulated the transport of the primary protons and the produced secondary particles. We scored the beta+-activity during and after proton irradiation observing that the main contribution comes from the beta+-emitting isotopes 15O (T1/2 = 122 s) and 11C (T1/2 = 20.39 min).
Here, we first describe our PET prototype showing its capability of acquiring data during the irradiation. Then, we analyze the measured activity distributions obtained during and after irradiation of a PMMA phantom with 62 MeV protons at the Centro di AdroTerapia e Applicazioni Nucleari Avanzate (CATANA) beam line showing the feasibility of reconstructing the distal activity fall-off with a millimetric precision.
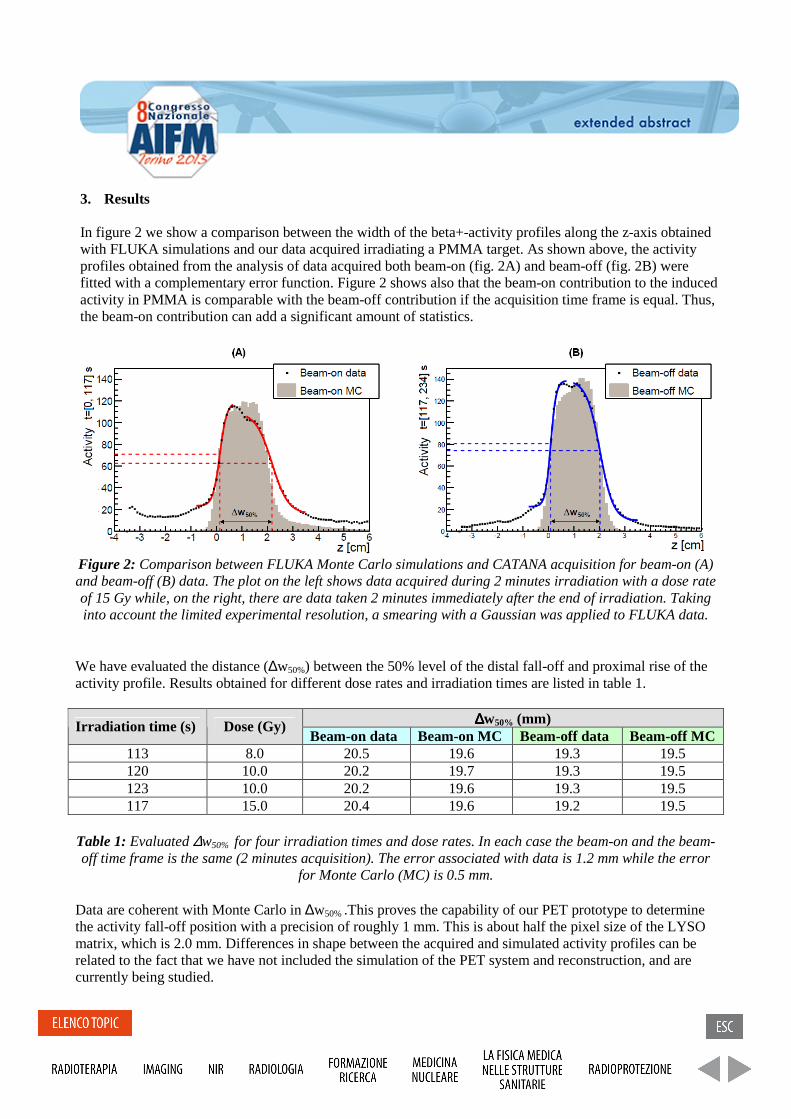
Figure 2: Comparison between FLUKA Monte Carlo simulations and CATANA acquisition for beam-on (A) and beam-off (B) data. The plot on the left shows data acquired during 2 minutes irradiation with a dose rate of 15 Gy while, on the right, there are data taken 2 minutes immediately after the end of irradiation. Taking into account the limited experimental resolution, a smearing with a Gaussian was applied to FLUKA data.
We have evaluated the distance (∆w50%) between the 50% level of the distal fall-off and proximal rise of the activity profile. Results obtained for different dose rates and irradiation times are listed in table 1.
∆∆∆∆w50% (mm) Irradiation time (s) Dose (Gy) Beam-on data Beam-on MC Beam-off data Beam-off MC
113 8.0 20.5 19.6 19.3 19.5 120 10.0 20.2 19.7 19.3 19.5 123 10.0 20.2 19.6 19.3 19.5 117 15.0 20.4 19.6 19.2 19.5
Table 1: Evaluated ∆w50% for four irradiation times and dose rates. In each case the beam-on and the beam-off time frame is the same (2 minutes acquisition). The error associated with data is 1.2 mm while the error
for Monte Carlo (MC) is 0.5 mm.
Data are coherent with Monte Carlo in ∆w50% .This proves the capability of our PET prototype to determine the activity fall-off position with a precision of roughly 1 mm. This is about half the pixel size of the LYSO matrix, which is 2.0 mm. Differences in shape between the acquired and simulated activity profiles can be related to the fact that we have not included the simulation of the PET system and reconstruction, and are currently being studied.
3. Results
In figure 2 we show a comparison between the width of the beta+-activity profiles along the z-axis obtained with FLUKA simulations and our data acquired irradiating a PMMA target. As shown above, the activity profiles obtained from the analysis of data acquired both beam-on (fig. 2A) and beam-off (fig. 2B) were fitted with a complementary error function. Figure 2 shows also that the beam-on contribution to the induced activity in PMMA is comparable with the beam-off contribution if the acquisition time frame is equal. Thus, the beam-on contribution can add a significant amount of statistics.
[3] G. A. P. Cirrone et al., “A 62-MeV Proton Beam for the Treatment of Ocular Melanoma at Laboratori Nazionali del Sud-INFN”, IEEE Transaction On Nuclear Science, VOL. 51, no. 3, June 2004
[4] V. Rosso et al., “A new PET prototype for proton therapy: comparison of data and Monte Carlo simulations”, Journal of Instrumentation 2013.
4. Conclusions
The PET prototype is able to acquire valuable data during and immediately after proton irradiation also sustaining the single photon count rates. Results obtained with the Monte Carlo simulations are in line with the experimental data. The activity profile fall-off position for monoenergetic protons impinging on a homogeneous PMMA target is in good agreement with the FLUKA predictions. The precision of our system to determine the proton fall-off position is about 1 mm. We currently plan other data acquisitions during irradiation of multimaterial and antropomorphic phantoms.
References
[1] Knopf A. and Lomax A., “In vivo proton range verification: a review”, Physics In Medicine And Biology 58, 2013.
[2] G. Sportelli et al., “Full in-beam PET measurements of 62MeV protons onto a PMMA target”, Nuclear Instruments and Methods in Physics Research, Section A, 2012.
Uno studio quantitativo sulle caratteristiche del rivelatore PICASSO per imaging in contrasto di fase con radiazione di sincrotrone. A quantitative study on the performance of PICASSO detector in phase contrast imaging with synchrotron radiation. M. Longo1, L. Rigon2,3, F. Arfelli2,3, F. C. M. Lopez2,3, R. Longo2,3
(1) Post Graduate School of Medical Physics, Sapienza University of Rome, Rome Italy (2) Department of Physics, University of Trieste, Trieste, Italy (3) INFN, Italian National Institute of Nuclear Physics, Section of Trieste, Trieste, Italy Purpose: The imaging capabilities of a single-photon counting detector designed for mammography with synchrotron radiation are investigated with the aim to utilize it in the Phase Contrast imaging (PhCi) modality. It is demonstrated that this technique can be applied to the mammographic examinations, ensuring low doses thanks to the high efficiency of the detector, high spatial resolution and low image noise with respect to the conventional mammographic images. Methods and materials: The INFN has developed a silicon detector prototype, called PICASSO (Phase Imaging for Clinical Application with Silicon detector and Synchrotron radiatiOn), operating in the edge-on configuration and in single-photon counting mode. The detector pixel size is defined by its 50 µm pitch and 300 µm height. The prototype meets the requirements for clinical mammography as far as spatial resolution, contrast resolution, efficiency and acquisition speed are concerned. Modulation Transfer Function (MTF), Noise Power Spectrum (NPS) and Detective Quantum Efficiency (DQE) were evaluated. The synchronization of the two detector couples, concurrent with the reconstruction of images of all layers, and the spatial resolution are evaluated in order to test the imaging capabilities of this system. All measurements were done at SYRMEP beamline of ELETTRA synchrotron radiation facility in Trieste. Results: The vertical MTF agrees with the physical pixel height. The horizontal MTF is influenced by the detector comparator threshold: it decreases with the increase of the threshold value. This is due to the charge sharing effect. The horizontal MTF value at 50% varies from 12 to 14 mm-1 in an energy range from 19 to 25 keV. NPS is determined using 2D Fourier analysis while, based on the measured MTF and NPS results, DQE was calculated. Conclusion: The PICASSO data acquisition system was tested at SYRMEP beamline of ELETTRA, demonstrating good imaging capabilities and spatial resolution. The measurements performed using PhCi technique and PICASSO detector are promising and will be optimised in terms of clinical feasibility in order to transfer the method into clinical practice. References: [1] F.C.M. Lopez, L. Rigon, R. Longo, F. Arfelli, A. Bergamaschi, R.C. Chen, D. Dreossi, B. Schmitt, E. Vallazza, E. Castelli, Development of a fast read-out system of a single photon counting detector for mammography with synchrotron radiation, Journal of Instrumentation (2011), Vol. 6 - 12, pp. C1203.
Valutazione di un metodo di registrazione di immagini per la deformazione delle mappe di dose in protonterapia. Evaluation of an image registration method for dose accumulation in proton therapy. E. Scalco1, D. Ravanelli2, F. Fellin2,3, M. Sutto2,4, G.M. Cattaneo5, M. Schwarz2,3, G. Rizzo1. (1) Istituto di Bioimmagini e Fisiologia Molecolare, CNR , Segrate (Milano) (2) Agenzia Provinciale per la Protonterapia (ATREP), Trento (3) Azienda Provinciale per i Servizi Sanitari (APSS), Trento (4) Università degli Studi di Trento (5) Dipartimento di fisica medica, Ospedale San Raffaele, Milano Purpose: In proton therapy (inter- and intra-) fraction patient motion can cause differences between planned and delivered dose distribution. To evaluate accumulated doses in 4DCT images of thorax district, the motion recovery and the correction of density variation due to breathing are needed. We propose and validate an image registration method to recover respiratory movements and show an application to dose accumulation for proton therapy. Methods and materials: 5 4DCT studies with 4 breathing phases each were used. Deformable image registration based on Free Form and B-Splines1 was performed between reference (R) and any other breathing phase (X). Accuracy and consistency of the method were evaluated by comparing lung and GTV contours automatically propagated using the estimated deformation field with contours manually delineated by an expert. Structure overlapping (Dice index), average and maximum distance between contours (Dmean, Dmax) were calculated. Inverse Consistency Error (ICE) was estimated as mean distance between contours, after image registration and contours propagation from R to X and from X to R. Then, proton treatment plans were optimized for 2 patients on 4 anatomies representations (Average, MIP, X+ITV filled with MIP density, Average + ITV filled with MIP density) and 3 GTV-PTV margins (0, 5, 10 mm). The doses were recalculated on X and deformed on R. Accumulated doses were compared on target coverage and OARs sparing to assess which method allows for robust dose distributions with respect to intra-fraction respiratory motion. Results: Accuracy of the registration method was: Dice=0.73±0.1, Dmean=1.34±0.33 mm and Dmax=3.55±3.07 mm for GTV; Dice=0.93±0.02, Dmean=1.31±0.5 mm and Dmax=29.7±11 mm for lungs. ICE was 0.66±0.46 mm in GTV and 0.61±0.33 mm in lungs. Average CT + ITV (5mm expanded) filled with MIP density was associated with the most robust plans. MIP with no margins accounted for an optimal target coverage but with significant hotspots in the target. The results obtained in the remaining anatomy representations were not nearly robust enough. Conclusion: The proposed image registration procedure has been demonstrated accurate and consistent, being the registration errors in the order of image voxel size and it can be used for robustness evaluation of proton treatment plans in thorax district. References: 1Faggiano et al, Phys. Med. Biol. (2011) 56(3), 775-791.
A new methodological approach to improve safety, quality and reproducibility during concurrent EEG/fMRI: a feasibility study Ferrari Paolo1, Assecondi Sara1,3, Jovicich Jorge1,2 (1) Center for Mind/Brain Sciences (CIMeC), University of Trento (2) Department of Psychology and Cognitive Sciences, University of Trento, (3) School of Psychology, University of Birmingham Introduction Data quality in concurrent EEG-fMRI is highly dependent on the placement of the EEG system and cables inside the MR-scanner, and it also affects subject’s safety during the whole procedure. The setups presented in literature are hardly reproducible across laboratories, given the diversity of stimulus projection systems, EEG cable lengths, possible interacting instrumentation, etc. In case of an emergency that requires the subject to be removed from the scanner, this should ideally happen safely, quickly and efficiently with minimum harm to the subject and/or the equipment. EEG-fMRI experimental setups that require subject’s detachment from the amplifiers by accessing connections inside the magnet bore from the back of the magnet might be suboptimal. In this work we describe the experience in our institution with a 4T MR scanner. The aim of this study was to investigate the feasibility of a novel experimental setup for concurrent EEG/fMRI recordings. The new setup, designed at the CIMeC, consisted of a form-fitting wooden extension of the MR patient bed and a customized 64-channels EEG cap with shorter cable. The novel compact setup was compared to a setup, which uses an unmodified EEG cap and no wooden extension, in terms of safety aspects, MRI data quality and reproducibility across sessions. This configuration allows to setup the whole system without the need to access connections from the back of the magnet, which may also involve handling the back-projection screen used for visual stimulation, when present. We compare such novel compact setup with a more common reference setup that uses longer EEG cables to the amplifiers placed inside the magnet, at the back of the magnet bore. We evaluate both experimental setups in terms of degradation in MRI data due to across-modality interferences, and we discuss the implications of its use on reproducibility and safety during EEG-fMRI experiments. Methods and materials Both setups consisted of two 32-channels MR-compatible amplifiers and a battery pack. While in the compact setup the amplifiers were placed on a form-fitting wooden extension, force-locked to the back of the MR patient bed, with the amplifiers one above the other and power pack behind, in the reference setup the amplifiers were placed in a fixed position inside the magnet bore at the back. In the reference setup, the cables, connecting the cap and the amplifiers, were thus forced to be misaligned with respect to the z-axis of the magnet, and had an approximate length of 111cm. A customized 64 channels EEG cap with shorter cables was used in the compact setup, and had an approximate length of 46cm. The scanner was a 4T MRI system. QA tests, including stability test [1], B0 and flip angle maps, were evaluated using a spherical silicon oil phantom (17 cm diameter). The temperature was measured with four MR-compatible probes in four EEG electrode locations where the risk of excessive heating is higher [2]. Stability test were obtained using a standard full-brain single shot gradient echo 2D Echo-Planar Imaging protocol (TE 33ms, TR 2200ms, flip angle 75°, 3mm isotropic voxels, 64x64 matrix, 37 slices, slice gap 0.45mm, 180 volumes) and MR data were analyzed with in-house developed Matlab code (MathWorks ®) and FSL. We derived maps of the static field (B0) from a double-echo gradient echo sequence (TE 6 and 10ms, TR 400ms, flip angle 39°, 2mm isotropic voxels, 128x128 matrix, 75 sagittally-oriented slices, slice gap 0.3mm, fat saturation). We obtained maps of the flip angle using a double-angle Turbo Spin Echo sequence (TE 18ms, TR 6000ms, flip angles 60° and 120°, 0.86x0.86x5.00mm voxels, 256x256 matrix, 30 sagittally-oriented slices, slice gap 0.75mm). Maps of the static field (B0-maps in Hz) were obtained as a scaled difference of the phase images obtained by each echo, as ΔB0 = (2πγΔTE)−1ΔΦ [3], after phase unwrapping [4], where γ is the gyromagnetic ratio, ΔTE is the difference between echo times and ΔΦ is the difference between phase images. Maps of the flip angle were calculated on a voxel basis as α = arccos (3√(M2/8M1)) [5], where α is the flip angle, M1 and M2 are the acquisition intensities at the voxel from the two different flip angles. The α-maps were normalized to the average flip angle within a central ROI of 30 voxels, and visually inspected, during both human and phantom acquisitions. The standard deviation of the flip angle α across the sample (no background) was
calculated for both setups. Results FBIRN stability parameters [1] derived from phantom fMRI recordings (compact vs reference) did change with respect to the baseline (i.e., measurements without any EEG equipment present). Some parameters increased (average signal intensity, standard deviation, drift) and others decreased (SNR and SFNR), when the EEG cap was on. In all cases except for the average signal intensity, the effects of the EEG cap remained within two standard deviation from the base-line condition of no EEG equipment. We did not find any structured noise in the summary stability images. Inhomogeneities of B0 are also noticeable, regardless the session (EEG or MRI) while flip angle maps do not show any unexpected pattern. The standard deviation across volume of interest of B0 and normalized flip angle maps, respectively, for phantom data might give an indication of the extent of the variability. The values are very similar across sessions (MRI acquisition with and without the EEG system) and setups (compact vs. reference). In summary, our results show that the presence of the EEG electrodes and gel equally affects the homogeneity of the static magnetic field, with respect to the MRI session, regardless the setup. Under the safety point of view, in case of emergency the compact setup allowed an easier patient removal from the MR-bore without compromising the subject or the system safety: the EEG amplifiers and the battery pack on wood extension slid together with the patient bed, whereas in the reference setup they remain in the bore. Temperature curves showed no abnormal trends. Conclusions Safety considerations for the two experimental setups were made based on temperature measures under EEG electrodes during concurrent EEG-fMRI, as well as based on the access to the EEG system allowed by the two setups, and on potential hazard related to the length of the EEG cables. An imperative concern in research involving living subjects is safety. This is especially important when modalities not yet standardized, such as EEG-fMRI, are used. By being fixated to the MR-bed, the compact setup allows the easy extraction of the subject from the MR-bore without risks neither for the subject nor for the system, both during a normal experiment or during an emergency. This is currently not possible with the reference setup. B0 and flip angle maps are informative about the interaction between external devices and conductive materials inside the magnet bore and the imaging process. The availability of both maps, allowed us to disentangle the causes of signal loss and image distortion due to inhomogeneity of the static magnetic field (most likely due to electrodes and gel) and those due to perturbations of the RF-fields used for excitation and detection of the MR signal (more likely caused by a suboptimal shielding of the amplifier). By inspecting the variability of the flip angle across the volume, we could not find noticeable differences between the MRI and EEG condition or between setups. Signal loss in the images is therefore primarily due to inhomogeneity of the flip angle (susceptibility effect), which in turn, in human recordings, is masked by the intrinsic susceptibility of human tissues. In conclusion, the proposed study showed the feasibility of a novel compact setup for the placement of the EEG system during concurrent EEG/fMRI. We discussed how the proposed setup improved safety, reproducibility of system placement and usability. EEG data quality was thoroughly investigated and results, reported in a companion abstract, showed that the compact setup does not affect the quality of EEG recordings. Acknowledgments This work has been realized also thanks to the support from the Provincia Autonoma di Trento and the Fondazione Cassa di Risparmio di Trento e Rovereto. References [1] L. Friedman, Report on a multicenter fMRI quality assurance protocol. J Magn Res Imaging(2006)23:827-39 [2] L. M. Angelone, On the effect of resistive EEG electrodes and leads during 7T MRI: simulation temperature measurement studies. Magn. Reson Imaging (2006) 24, 801-812. [3] P. Jezzard, R. S. Balaban, Correction for geometric distortion in echo planar images from B0 field variations. Magn Reson Med (1995) 34 (1), 65–73. [4] M. Jenkinson, Fast, automated, n-dimensional phase-unwrapping algorithm. Magn Res Med (2003)49(1)193-7. [5] G. R. Morrell, A phase-sensitive method of flip angle mapping. Magn Reson Med (2008) 60 (4), 889–894.

Ricostruzione di dati pCT con FBP: i risultati preliminari della collaborazione PRIMA.
FBP reconstruction of pCT data: the PRIMA collaboration preliminary results.
E. Vanzi1, M. Bruzzi
2,3, M. Bucciolini
1,2,3, G. A. P. Cirrone
4, C. Civinini
2, G. Cuttone
4, D. Lo Presti
5,6,
S. Pallotta1,2,3
, C. Pugliatti5,6
, N. Randazzo5, F. Romano
4,7, M. Scaringella
3, V. Sipala
8,9, C. Stancampiano
5,6,
C. Talamonti1,2,3
, M. Zani2,3
(1) Azienda Ospedaliero-Universitaria Careggi, Firenze, (2)INFN, Firenze, (3) University of Florence, (4)
INFN - LNS, Catania, (5) INFN, Catania, (6) University of Catania, (7) Centro Studi e Ricerche e Museo
Storico della Fisica, Rome, (8) University of Sassari, (9)INFN,Cagliari
Purpose: Nowadays there is a steadily increasing interest in proton radiation therapy (pRT), since proton
beams can achieve highly localized dose distributions. However, to fully harness the power of pRT, accurate
methods of dose calculation and verification of the patient positioning are mandatory. These issues require
tomographic imaging performed directly with protons.
A first prototype of Proton Computed Tomography (pCT) scanner, composed by a Silicon tracker followed
by a YAG:Ce calorimeter and having a 5x5x5 cm3 field of view (FOV), has been developed by the PRIMA
(PRoton IMAging) collaboration. Here, first results concerning tomographic image reconstruction are
discussed.
Methods and materials: Experimental data were acquired at Laboratori Nazionali del Sud (LNS), Catania
(Italy), on a specifically designed cylindrical phantom using a 62 MeV proton beam. Tomographic data
consisted of 36 10°-spaced angular views binned in a 256x256 projection matrix (200 µm pixel size),
containing a mean of 950000 events/view.
The 3D map of the stopping power was reconstructed with the Filtered Back-Projection (FBP) algorithm. In
order to fulfill the FBP requirement of rectilinear and parallel trajectories, different event selection strategies,
leading to different levels of noise on data, were considered. In each case, the trade-off between noise and
spatial resolution was pursued by adjusting the FBP Butterworth filter parameters (order and cut-off
frequency).
Results: Overall, a spatial resolution of 0.8 mm with 6.3% noise was reached; using a smoother filter, 1.4%
noise could be obtained, with resolution degrading to 1.0 mm. Reconstruction required only 22 seconds on a
standard personal computer.
Conclusion: Even if cumbersome iterative reconstruction methods are necessary to correctly take into
account the non-rectilinear path of protons due to multiple coulomb scatter (MCS) and produce images
sufficiently accurate for treatment planning, the good image quality obtained with FBP suggests that FBP
can be convenient when a pCT image has to be produced in short times, such as for patient positioning
verification and to produce an image that can be used as the starting point for iterative methods. The good
performances of the pCT prototype encourages working on the development of a similar equipment with an
enlarged FOV and on the implementation of iterative methods managing the MCS model which are expected
to further significantly increase image quality.

Imaging di Risonanza Magnetica Nucleare permette di valutare l’idratazione della pelle in modello ex vivo
An ex vivo MRI Method for Assessing Skin Hydration
A. Galante 1,2, A. Rosa 1, and M. Alecci 1,2
(1) Dipartimento Medicina Clinica, Sanita’ Pubblica, Scienze della Vita e dell'Ambiente, Universita’ degli Studi dell'Aquila, Via Vetoio 10, Coppito, L'Aquila 67100, Italy.(2) Istituto Nazionale di Fisica Nucleare, Laboratori Nazionali del Gran Sasso, S.S. 17 bis km 18910, Assergi, L'Aquila 67010, Italy.
PurposeHuman skin hydration of individuals depends on several factors: normal or pathological physiology, food consumption, physical activity, stress and climate. Moisturizing agents are widely used to regulate skin water content, and over the past decade a number of MRI methods were proposed to assess hydration effects [1-2].In this work we present an ex vivo porcine model recently developed for the quantitative assessment of skin water content by means of high resolution MRI.MethodsEx vivo porcine studies were conducted using a 2.35T MRI Biospec scanner. GEFI images of the whole sample, composed by fresh abdominal porcine skin/fat/muscle layers (12g), were acquired (TR=3000ms; TE=2.9ms;FOV=2.5cm2; 1024*64voxels; thickness=2.6mm; TAQ=13min). The model can be considered as 1D with 27μmresolution perpendicular to the skin surface. Given the acquisition parameters the MRI signal is weighted in proton density and it was used to quantify the water content (%) versus time/treatment. The signal of fat was taken as an internal reference, as confirmed by PRESS spectra. As a model of skin hydration we used a simple system that allows the contact of ex vivo skin samples with a 5% glycerol solution over a time. Glycerol is a small molecule highly hydrophilic, often used in cosmetic product that shows hydration effects at low concentrations (1-10%) and dehydration effects at higher concentrations (>20%) [1-2].ResultsThe fresh samples were positioned at about 10 mm from the RF surface coil (2.5 cm) by using a Pedri dish and plastic spacers. To study the kinetic of hydration, MRI images were acquired before (T=0 hours) and during thetreatment with 5% glycerol at T=0.5, 2, 13, 17 hours. The normalized MRI signal profiles showed a markedhydration effect (+40%) of the external layers due to the moisturizing agent and also an increase (+100 μm) of skin thickness.In a second experiment the fresh sample was maintained in contact for 2 hours only with the glycerol solution.MRI images were acquired at T=0, 3, 16 hours. A clear hydration effect (+30%) of the external layers and also an increase (200 μm) of the skin thickness at 3 hours was observed. The subsequent in-air dehydration phase showed a reduction of the MRI signal (20%) and skin thickness decrease (80μm) after 14 hours.ConclusionsThe combination of high resolution MRI and ultra short TE is capable to delineate excellent details of the skin anatomy in ex vivo porcine model, following the hydration time course due to moisturizing agents.References[1] Szayan M, et al. JEADV (1998)11:122-128.[2] Stefanowska J, et al. JEADV (2010)24:875–880.
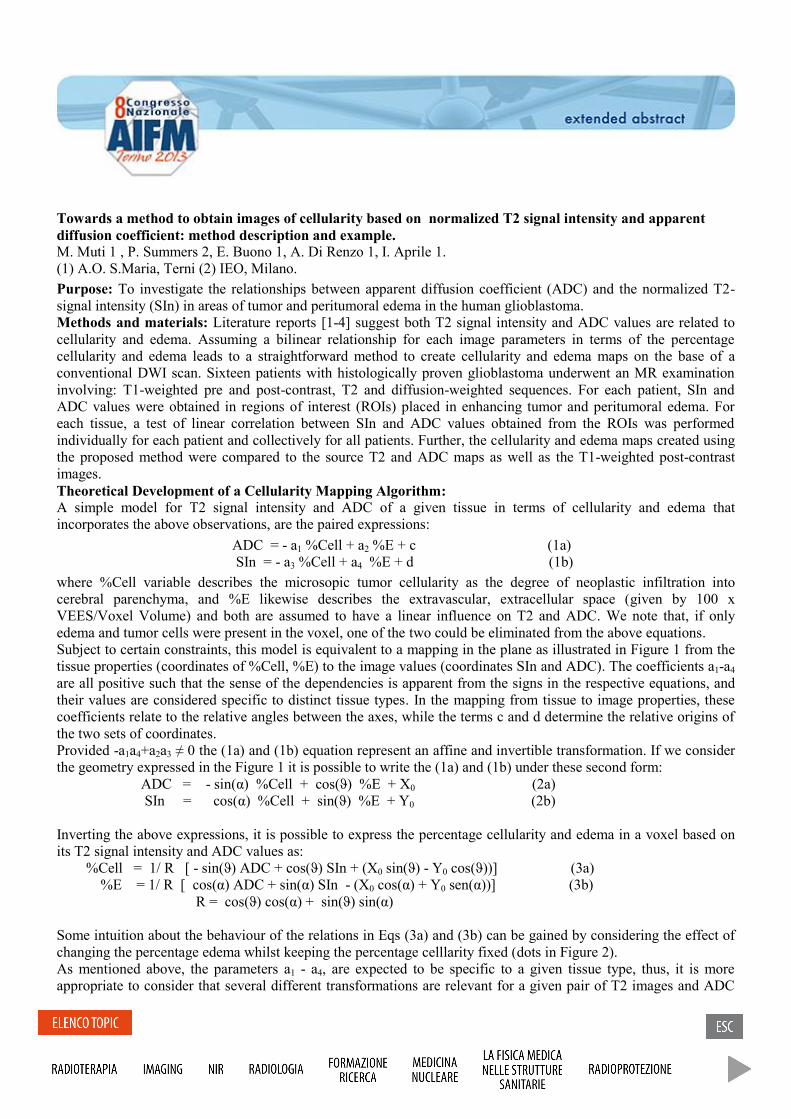
Towards a method to obtain images of cellularity based on normalized T2 signal intensity and apparent
diffusion coefficient: method description and example.
M. Muti 1 , P. Summers 2, E. Buono 1, A. Di Renzo 1, I. Aprile 1.
(1) A.O. S.Maria, Terni (2) IEO, Milano.
Purpose: To investigate the relationships between apparent diffusion coefficient (ADC) and the normalized T2-
signal intensity (SIn) in areas of tumor and peritumoral edema in the human glioblastoma.
Methods and materials: Literature reports [1-4] suggest both T2 signal intensity and ADC values are related to
cellularity and edema. Assuming a bilinear relationship for each image parameters in terms of the percentage
cellularity and edema leads to a straightforward method to create cellularity and edema maps on the base of a
conventional DWI scan. Sixteen patients with histologically proven glioblastoma underwent an MR examination
involving: T1-weighted pre and post-contrast, T2 and diffusion-weighted sequences. For each patient, SIn and
ADC values were obtained in regions of interest (ROIs) placed in enhancing tumor and peritumoral edema. For
each tissue, a test of linear correlation between SIn and ADC values obtained from the ROIs was performed
individually for each patient and collectively for all patients. Further, the cellularity and edema maps created using
the proposed method were compared to the source T2 and ADC maps as well as the T1-weighted post-contrast
images.
Theoretical Development of a Cellularity Mapping Algorithm:
A simple model for T2 signal intensity and ADC of a given tissue in terms of cellularity and edema that
incorporates the above observations, are the paired expressions:
ADC = - a1 %Cell + a2 %E + c (1a)
SIn = - a3 %Cell + a4 %E + d (1b)
where %Cell variable describes the microsopic tumor cellularity as the degree of neoplastic infiltration into
cerebral parenchyma, and %E likewise describes the extravascular, extracellular space (given by 100 x
VEES/Voxel Volume) and both are assumed to have a linear influence on T2 and ADC. We note that, if only
edema and tumor cells were present in the voxel, one of the two could be eliminated from the above equations.
Subject to certain constraints, this model is equivalent to a mapping in the plane as illustrated in Figure 1 from the
tissue properties (coordinates of %Cell, %E) to the image values (coordinates SIn and ADC). The coefficients a1-a4
are all positive such that the sense of the dependencies is apparent from the signs in the respective equations, and
their values are considered specific to distinct tissue types. In the mapping from tissue to image properties, these
coefficients relate to the relative angles between the axes, while the terms c and d determine the relative origins of
the two sets of coordinates.
Provided -a1a4+a2a3 ≠ 0 the (1a) and (1b) equation represent an affine and invertible transformation. If we consider
the geometry expressed in the Figure 1 it is possible to write the (1a) and (1b) under these second form:
ADC = - sin(α) %Cell + cos(ϑ) %E + X0 (2a)
SIn = cos(α) %Cell + sin(ϑ) %E + Y0 (2b)
Inverting the above expressions, it is possible to express the percentage cellularity and edema in a voxel based on
its T2 signal intensity and ADC values as:
%Cell = 1/ R [ - sin(ϑ) ADC + cos(ϑ) SIn + (X0 sin(ϑ) - Y0 cos(ϑ))] (3a)
%E = 1/ R [ cos(α) ADC + sin(α) SIn - (X0 cos(α) + Y0 sen(α))] (3b)
R = cos(ϑ) cos(α) + sin(ϑ) sin(α)
Some intuition about the behaviour of the relations in Eqs (3a) and (3b) can be gained by considering the effect of
changing the percentage edema whilst keeping the percentage celllarity fixed (dots in Figure 2).
As mentioned above, the parameters a1 - a4, are expected to be specific to a given tissue type, thus, it is more
appropriate to consider that several different transformations are relevant for a given pair of T2 images and ADC
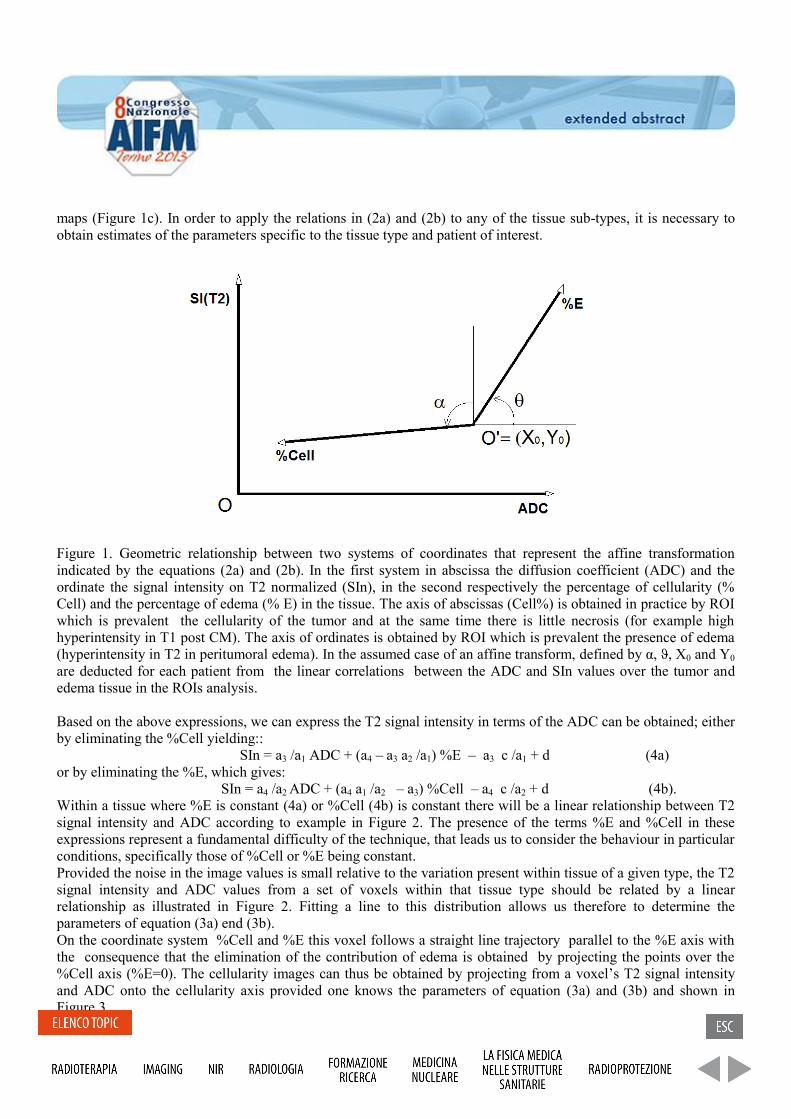
maps (Figure 1c). In order to apply the relations in (2a) and (2b) to any of the tissue sub-types, it is necessary to
obtain estimates of the parameters specific to the tissue type and patient of interest.
Figure 1. Geometric relationship between two systems of coordinates that represent the affine transformation
indicated by the equations (2a) and (2b). In the first system in abscissa the diffusion coefficient (ADC) and the
ordinate the signal intensity on T2 normalized (SIn), in the second respectively the percentage of cellularity (%
Cell) and the percentage of edema (% E) in the tissue. The axis of abscissas (Cell%) is obtained in practice by ROI
which is prevalent the cellularity of the tumor and at the same time there is little necrosis (for example high
hyperintensity in T1 post CM). The axis of ordinates is obtained by ROI which is prevalent the presence of edema
(hyperintensity in T2 in peritumoral edema). In the assumed case of an affine transform, defined by α, ϑ, X0 and Y0
are deducted for each patient from the linear correlations between the ADC and SIn values over the tumor and
edema tissue in the ROIs analysis.
Based on the above expressions, we can express the T2 signal intensity in terms of the ADC can be obtained; either
by eliminating the %Cell yielding::
SIn = a3 /a1 ADC + (a4 – a3 a2 /a1) %E – a3 c /a1 + d (4a)
or by eliminating the %E, which gives:
SIn = a4 /a2 ADC + (a4 a1 /a2 – a3) %Cell – a4 c /a2 + d (4b).
Within a tissue where %E is constant (4a) or %Cell (4b) is constant there will be a linear relationship between T2
signal intensity and ADC according to example in Figure 2. The presence of the terms %E and %Cell in these
expressions represent a fundamental difficulty of the technique, that leads us to consider the behaviour in particular
conditions, specifically those of %Cell or %E being constant.
Provided the noise in the image values is small relative to the variation present within tissue of a given type, the T2
signal intensity and ADC values from a set of voxels within that tissue type should be related by a linear
relationship as illustrated in Figure 2. Fitting a line to this distribution allows us therefore to determine the
parameters of equation (3a) end (3b).
On the coordinate system %Cell and %E this voxel follows a straight line trajectory parallel to the %E axis with
the consequence that the elimination of the contribution of edema is obtained by projecting the points over the
%Cell axis (%E=0). The cellularity images can thus be obtained by projecting from a voxel’s T2 signal intensity
and ADC onto the cellularity axis provided one knows the parameters of equation (3a) and (3b) and shown in
Figure 3.

Figure 2. The figure shows the trajectory in a straight line of a ROI with a given amount of cellularity but growing
amount of edema. The increase of edema translates the point in parallel to the abscissa axis (% E) in the system O
and in O’ being straight lines invariant in the systems linked by affine transformations. In this way it is possible to
correct the images for the presence of edema by projecting the points on the %Cell axis and get images weighted in
cellularity.
Results: Among the individual patients a significant linear correlation between SIn and ADC was present in tumor
in 75% of the cases, in edema 81% of cases. The slope of the correlation differed significantly between enhancing
tumor and edema in 40% of cases, being lower in tumor than edema but in 100% of cases the slope was linearly
dependent from the intercept. This last result, is the mathematical base for to determinate the method described for
to introduce images weigthed in cellularity.
Conclusion: In the human glioblastoma a significant linear dependence exists between SIn and ADC in Tumor and
Edema. A more deepened understanding of the relations between SIn and ADC with cellularity and edema allows
to introduce a hypothesis for a discrimination between the two tissues.
References:
[1] Muti M, et al., Study on the variation of the apparent diffusion coefficient in areas of solid tunor in high grade
gliomas, Magn Reson Imaging (2002) 20, 635-641.
[2] Goran P,et al., The differences of water diffusion between brain tissue infiltrated by tumor and peritumoral
vasogenic edema, Clinical Imaging (2009) 33, 96–101.
[3] Sugahara T, Korogi Y, Kochi M, et al. Usefulness of Diffusion-weighted MRI With Echo-Planar Tecnique in
the Evaluation of Cellularity in Gliomas. J Magn Reson Imaging (1999) 9, 53-60.
[4] Lu S, Ahn D, Johnson G, Law M, Zagzag D, Grossman R I. Diffusion-Tensor MR imaging of intracranial
neoplasia and associated peritumoral edema: introduction of the tumor infiltration index. Radiology (2004) 232,
221-228.
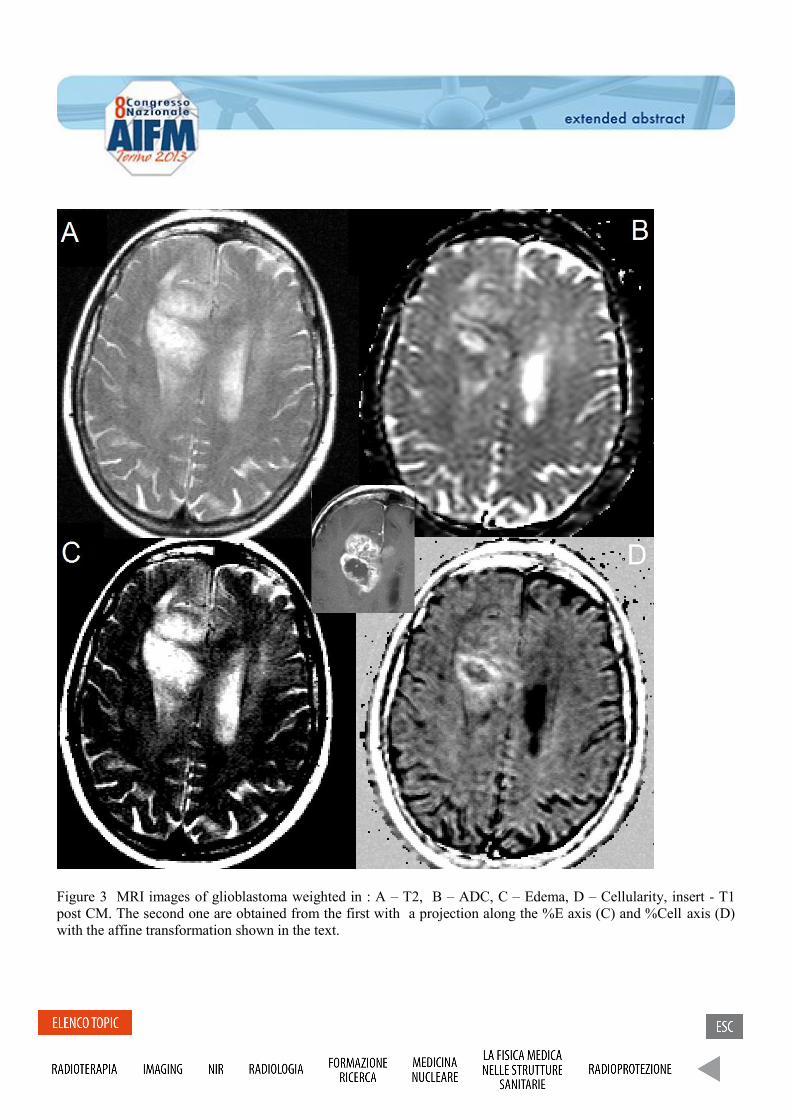
Figure 3 MRI images of glioblastoma weighted in : A – T2, B – ADC, C – Edema, D – Cellularity, insert - T1
post CM. The second one are obtained from the first with a projection along the %E axis (C) and %Cell axis (D)
with the affine transformation shown in the text.
A compact setup to improve the quality of EEG data recorded during fMRI
Un setup compatto per migliorare la qualitá di dati simultanei EEG-fMRI
Assecondi Sara1,3
, Ferrari Paolo1, Jovicich Jorge
1,2
(1) Center for Mind/Brain Sciences, University of Trento (2) Department of Psychology and Cognitive
Sciences, University of Trento, (3) School of Psychology, University of Birmingham
Purpose: We describe the EEG-fMRI experience in our institution with a 4 T MR scanner. In our laboratory
EEG quality during concurrent fMRI benefits from a compact setup in which the EEG cables are shortened
and the amplifiers placed closer to the MR (RX/TX) coil [1] and stabilised on a wooden form-fitting
extension moving with the MR bed.
Methods and materials: Our setup comprises a 4T MR-scanner (MedSpec, Bruker), an MR-compatible
EEG system (Brain Products GmbH, Gilching, Germany), a form-fitting wooden extension, moving with the
MR-bed and the use of an RX/TX MR-coil, open at the back (USA Instruments). This configuration allowed
us to reduce the length of the EEG cables connecting the cap to the amplifiers, which now fall straight along
the z-direction of the bore. This compact setup was compared with a reference unmodified setup, in which
the amplifiers were placed at the back of the magnet bore and stabilised with sand bags. EEG recordings
were performed with the compact and the reference setup on a phantom (5 minutes of recording) and on two
human subjects during a visual detection task (2 Hz checkerboard).
Results: We compared the setups in terms of sensitivity to MR-room environmental noise, interference from
the complementary measuring devices (EEG or fMRI), and sensitivity to functional responses to a visual
stimulation paradigm. We found that the compact setup heavily reduced the total power contribution of the
noise sources (84±19%), and the variability of the imaging artefact (60±21%) with respect to the reference
setup. MR image quality was thoroughly investigated and results, reported in a companion abstract, showed
that the compact setup does not affect the MR images.
Conclusion: A careful design of the workplace for EEG-fMRI recordings, tailored to the laboratory-specific
needs, not only improves the quality of EEG data achieved during simultaneous EEG-fMRI, but can also
impact on important aspects such as safety, ergonomics and reproducibility of the setup across sessions and
laboratories. These considerations are also relevant to higher or lower field strengths and to people setting up
their first EEG-fMRI experiment.
References:
[1] D.W. Carmichael et al. NeuroImage, 2012;
[2] K. Mullinger et al. Int.J.Psychophysiol, 2008.
Evaluation of the simulation software BreastSimulator for breast tomography. P. Russo
1,2, R. Tucciariello
1, G. Mettivier
1,2.
(1) Dipartimento di Fisica, Università di Napoli “Federico II” (2) INFN, Sezione di Napoli. Purpose: In order to test the software BreastSimulator [1], a breast X-ray imaging simulation software (developed
at the department of Medical Physics, School of Health Sciences, University of Patras, Greece), as a tool for the
creation of 3D uncompressed breast digital models and for the simulation and the optimization of computed
tomographic (CT) equipment, different breast models and CT projections were realized and reconstructed CT slices
were analyzed with a built-in-house algorithm to measure their anatomical noise properties.
Introduction: Digital Mammography (DM) is a fundamental technique in breast cancer diagnosis. DM returns a
two-dimensional representation (2D) of a compressed three-dimensional object. Therefore, tissues belonging to
different planes are all projected on the same X-ray image plane, making it difficult to detect possible abnormalities.
In order overcome this limitation, CT scanners dedicated to the breast have been developed using monochromatic
[2] or polychromatic [3, 4] X-ray beam, which return tomographic 3D images of the breast anatomy. However,
these techniques need to be optimized before applying them clinically; thus there is the need to develop X-ray
imaging models for the compressed as well as uncompressed breast. Clinical studies employ physical phantoms
with realistic anatomical characteristics, and medical centers invest heavily in diagnostic equipments that provide
direct examinations, non-invasive and time limited investigations. The difficulty of these investigations is their high
cost. The increasing use of powerful computers allows to design digital phantoms rather than physical phantoms
and, in general, to limit direct tests carried out on patients, which deliver an ionizing dose of radiation.
BreastSimulator is a support tool for research in breast imaging. It allows the creation of realistic 3D uncompressed
breast models composed of breast skin, duct system and terminal ductal lobular units, Cooper’s ligaments,
lymphatic and blood vessel systems, pectoral muscle, 3D mammographic background texture, and breast
abnormalities. With this software it is possible to simulate mammographic, tomosynthesis and tomographic
imaging geometries with monochromatic and polychromatic beams. It runs under both Microsoft Windows and
Linux operating systems. This software was already evaluated as a reliable tool for the simulation of DM systems
[5] with good results.
In this study we evaluated BreastSimulator, as an appropriate X-ray simulation software for CT dedicated to the
breast. The anatomical noise properties were evaluated by measuring the β exponent deduced from the power
spectral analysis of the CT simulated images.
Materials and methods: Different 3D digital breast phantoms (different sizes and composition) with realistic
features were created with BreastSimulator. The attenuation coefficients of the different breast components were
derived from the software X-ray Oriented programs (XOP) [6] and manually entered. Two different breast CT
setups were simulated:
- Monochromatic setup: 19 or 26 keV beam, cone-beam irradiation geometry, 555 mm source-object
distance and 650 mm source-detector distance, 1000×1000 pixels photon counting detector with a
resolution of 6.6 pixel/mm, 360 projections over 360 degrees. - Polychromatic setup: 80 kVp beam, cone-beam irradiation geometry, 600 mm source-object distance and
900 mm source-detector distance, 512×512 pixels photon counting detector with a resolution of 3 pixel/mm,
360 projections over 360 degrees. The tomographic projections were reconstructed with the commercial software Exxim COBRA implementing the
FDK algorithm, providing axial, coronal and sagittal views in a virtual CT image of 1024×1024×1024 voxel of
(0.150 mm)3. From these reconstructed CT slices, the power-law exponent β derived from the Noise Power
Spectrum (NPS) function has been evaluated [7], where f is the spatial frequency. To derive this
value, assuming that tissue characteristics are the same in the various regions of the breast volume, 100 ROIs have
been selected randomly inside the breast. For each ROI we applied a Hamming window ( , with for ) where R is half the width of the image. Then, the 2D NPS was
computed by the Fast Fourier Transform for each ROI and the mean 2D NPS (mNPS) was determined by averaging
the NPS from the 100 ROIs. In order to obtain 1D NPS, a radial profile was evaluated. Finally we calculated the β
coefficient, as the slope line returned by computing a linear fit of log(f) to log (1D NPS).
Results: Four realistic 3D uncompressed breast models were created with 64 bit Linux operating system on a Intel
Core 2 Quad Processor Q8200 2.33 GHz, with 8 GB RAM. Based on the breast model complexity, the CPU time
for the realization of the digital model ranged between 15 min and 30 min. Three different setups, two
monochromatic (19 and 26 keV) and one polychromatic beam (80 kVp), were simulated for imaging. The
simulation of the 360 X-ray projections took 24 h and 4 days, for the monochromatic (based on Siddon’s X-ray
tracing algorithm) and polychromatic (based on Monte Carlo code) setup, respectively. Finally, we have obtained
six CT reconstructions and have evaluated the β coefficient for the slices in each reconstruction. From this analysis,
we deduced that the simulated model complexity is not yet close to the real anatomical complexity of the breast.
Indeed, the measured β coefficients are lower than expected [7]. This implies the need to increase both the
simulation time and the computing power, e.g. using parallel processing, in order to increase the model complexity
by increasing the number of ducts, ductal lobular units, Cooper’s ligaments and lymphatic and blood vessels in the
simulation. Conclusion: In this work we evaluated BreastSimulator, as an appropriate X-ray simulation software for CT
dedicated to the breast, which involves the use of Monte Carlo simulations and the use of polychromatic beams.
Different breast models and irradiation modalities (monochromatic and polychromatic CT) were simulated and the
anatomical noise properties were evaluated measuring the β exponent deducted from the power spectral analysis of
simulated images. The software proved its potential in simulating the complex anatomy of the female breast. Acknowledgements
We thank Dr. K. Bliznakova (Dept. of Medical Physics, Univ. Patras, Greece) for providing the BreastSimulator
software.
References: [1] K. Bliznakova et al., “A three-dimensional breast software phantom for mammography simulation”, Phys. Med.
Biol. 48 (2003) 3699–3719. [2] S. Pani et al., “Breast tomography with synchrotron radiation: preliminary results”, Phys. Med. Biol. 49 (2004)
1739–1754. [3] K. K. Lindfors et al., “Dedicated Breast CT: Initial Clinical Experience”, Radiology 246 (2008), 3, 725–733. [4] G. Mettivier et al., “Dedicated scanner for laboratory investigations on cone-beam CT/SPECT imaging of the
breast”, Nucl. Instr. Meth. A 629 (2011), 350–356. [5] K. Bliznakova et al., “Evaluation of an improved algorithm for producing realistic 3D breast software
phantoms: Application for mammography”, Med. Phys. 37 (2010), 5604–5617. [6] M. S. Del Rio and R. J. Dejus, http://www.esrf.eu/computing/scientific/xop2.1/ [7] G. Kathrine et al., “Characterizing anatomical variability in breast CT images”, Med. Phys. 35 (2008) 11,
4685–4694.