Giovannetti, Giorgia; Ricchiuti, Giorgio; Velucchi ... · Giorgia Giovannetti Dipartimento Scienze...
28
Diese Version ist zitierbar unter / This version is citable under: http://nbn-resolving.de/urn:nbn:de:0168-ssoar-242958 www.ssoar.info Size, innovation and internationalization: a survival analysis of Italian firms Giovannetti, Giorgia; Ricchiuti, Giorgio; Velucchi, Margherita Postprint / Postprint Zeitschriftenartikel / journal article Zur Verfügung gestellt in Kooperation mit / provided in cooperation with: www.peerproject.eu Empfohlene Zitierung / Suggested Citation: Giovannetti, Giorgia ; Ricchiuti, Giorgio ; Velucchi, Margherita: Size, innovation and internationalization: a survival analysis of Italian firms. In: Applied Economics (2009). 25 pages. DOI: http://dx.doi.org/10.1080/00036840802600566 Nutzungsbedingungen: Dieser Text wird unter dem "PEER Licence Agreement zur Verfügung" gestellt. Nähere Auskünfte zum PEER-Projekt finden Sie hier: http://www.peerproject.eu Gewährt wird ein nicht exklusives, nicht übertragbares, persönliches und beschränktes Recht auf Nutzung dieses Dokuments. Dieses Dokument ist ausschließlich für den persönlichen, nicht-kommerziellen Gebrauch bestimmt. Auf sämtlichen Kopien dieses Dokuments müssen alle Urheberrechtshinweise und sonstigen Hinweise auf gesetzlichen Schutz beibehalten werden. Sie dürfen dieses Dokument nicht in irgendeiner Weise abändern, noch dürfen Sie dieses Dokument für öffentliche oder kommerzielle Zwecke vervielfältigen, öffentlich ausstellen, aufführen, vertreiben oder anderweitig nutzen. Mit der Verwendung dieses Dokuments erkennen Sie die Nutzungsbedingungen an. Terms of use: This document is made available under the "PEER Licence Agreement ". For more Information regarding the PEER-project see: http://www.peerproject.eu This document is solely intended for your personal, non-commercial use.All of the copies of this documents must retain all copyright information and other information regarding legal protection. You are not allowed to alter this document in any way, to copy it for public or commercial purposes, to exhibit the document in public, to perform, distribute or otherwise use the document in public. By using this particular document, you accept the above-stated conditions of use.
Transcript of Giovannetti, Giorgia; Ricchiuti, Giorgio; Velucchi ... · Giorgia Giovannetti Dipartimento Scienze...
Diese Version ist zitierbar unter / This version is citable under:http://nbn-resolving.de/urn:nbn:de:0168-ssoar-242958
www.ssoar.info
Size, innovation and internationalization: a survivalanalysis of Italian firmsGiovannetti, Giorgia; Ricchiuti, Giorgio; Velucchi, Margherita
Postprint / PostprintZeitschriftenartikel / journal article
Zur Verfügung gestellt in Kooperation mit / provided in cooperation with:www.peerproject.eu
Empfohlene Zitierung / Suggested Citation:Giovannetti, Giorgia ; Ricchiuti, Giorgio ; Velucchi, Margherita: Size, innovation and internationalization: a survivalanalysis of Italian firms. In: Applied Economics (2009). 25 pages. DOI: http://dx.doi.org/10.1080/00036840802600566
Nutzungsbedingungen:Dieser Text wird unter dem "PEER Licence Agreement zurVerfügung" gestellt. Nähere Auskünfte zum PEER-Projekt findenSie hier: http://www.peerproject.eu Gewährt wird ein nichtexklusives, nicht übertragbares, persönliches und beschränktesRecht auf Nutzung dieses Dokuments. Dieses Dokumentist ausschließlich für den persönlichen, nicht-kommerziellenGebrauch bestimmt. Auf sämtlichen Kopien dieses Dokumentsmüssen alle Urheberrechtshinweise und sonstigen Hinweiseauf gesetzlichen Schutz beibehalten werden. Sie dürfen diesesDokument nicht in irgendeiner Weise abändern, noch dürfenSie dieses Dokument für öffentliche oder kommerzielle Zweckevervielfältigen, öffentlich ausstellen, aufführen, vertreiben oderanderweitig nutzen.Mit der Verwendung dieses Dokuments erkennen Sie dieNutzungsbedingungen an.
Terms of use:This document is made available under the "PEER LicenceAgreement ". For more Information regarding the PEER-projectsee: http://www.peerproject.eu This document is solely intendedfor your personal, non-commercial use.All of the copies ofthis documents must retain all copyright information and otherinformation regarding legal protection. You are not allowed to alterthis document in any way, to copy it for public or commercialpurposes, to exhibit the document in public, to perform, distributeor otherwise use the document in public.By using this particular document, you accept the above-statedconditions of use.
For Peer Review
Size, Innovation and Internationalization: A Survival Analysis of Italian Firms
Journal: Applied Economics
Manuscript ID: APE-08-0028.R1
Journal Selection: Applied Economics
Date Submitted by the Author:
02-Jul-2008
Complete List of Authors: Giovannetti, Giorgia; Fondazione M. Masi; Univerisità degli Studi di Firenze, Dipartimento Scienze Economiche Ricchiuti, Giorgio; Università degli Studi di Firenze, Dipartimento Scienze Economiche Velucchi, Margherita; Università degli Studi di Firenze, Dipartimento di Statistica "G. Parenti"
JEL Code:
C41 - Duration Analysis < C4 - Econometric and Statistical Methods: Special Topics < C - Mathematical and Quantitative Methods, L11 - Production, Pricing, and Market Structure|Size Distribution of Firms < L1 - Market Structure, Firm Strategy, and Market Performance < L - Industrial Organization, L25 - Firm Size and Performance < L2 - Firm Objectives, Organization, and Behavior < L - Industrial Organization, F21 - International Investment|Long-Term Capital Movements < F2 - International Factor Movements and International Business < F - International Economics
Keywords:Business Demography , Competitiveness, Internationalization, Survival Analysis
Editorial Office, Dept of Economics, Warwick University, Coventry CV4 7AL, UK
Submitted Manuscript
For Peer Review
Page 1 of 25
Editorial Office, Dept of Economics, Warwick University, Coventry CV4 7AL, UK
Submitted Manuscript
123456789101112131415161718192021222324252627282930313233343536373839404142434445464748495051525354555657585960
For Peer Review
1
Size, Innovation and Internationalization:
A Survival Analysis of Italian Firms1
Giorgia Giovannetti
Dipartimento Scienze Economiche, Università degli Studi di Firenze and Fondazione Masi
via delle Pandette 9, 50127 Firenze
Giorgio Ricchiuti
Dipartimento Scienze Economiche, Università degli Studi di Firenze, via delle Pandette 9, 50127
Firenze
Margherita Velucchi
Dipartimento di Statistica “G. Parenti”, Università degli Studi di Firenze, viale G.B. Morgagni 59,
50134 Firenze
Abstract
Firms’ survival is often seen as crucial for economic growth and
competitiveness. This paper focuses on business demography of Italian firms,
using an original database, obtained by matching and merging to gain the
intersection three firm level datasets. This database allows us to
simultaneously consider the effect of size, technology, trade, foreign direct
investments, and innovation on firms’ survival probability. We show that size
and technological level positively affect the likelihood of survival.
Internationalized firms show higher failure risk: on average competition is
stronger in international markets, forcing firms to be more efficient. However,
large internationalized firms are more likely to ‘survive’. An Italian
internationalized firm to be successful and to survive, should be high-tech,
large and innovative.
Keywords: Business Demography, Survival, Competitiveness,
Internationalization
JEL: C41, L11, L25, F21
1 Corresponding author: Giorgio Ricchiuti, Dipartimento Scienze Economiche, Facoltà di Economia, Università degli Studi di Firenze, via delle Pandette 9, 50127, Firenze (Italy), [email protected].
Page 2 of 25
Editorial Office, Dept of Economics, Warwick University, Coventry CV4 7AL, UK
Submitted Manuscript
123456789101112131415161718192021222324252627282930313233343536373839404142434445464748495051525354555657585960
For Peer Review
2
1. Introduction
Several years ago, the Lisbon European Council (2000) set the ten-
year goal of making the European Union “the most dynamic,
competitive, sustainable knowledge-based economy in the world,
enjoying full employment and economic and social cohesion”. Priority
actions were designed to encourage an entrepreneurial culture, create
additional jobs, promote high technology and knowledge-intensive
sectors of the economy, and stimulate internationalization both
through exports and foreign direct investment (FDI). These goals are
still far from being achieved, especially in Italy, which seems to lag
behind other EU countries in terms of the Lisbon targets, therefore
representing an interesting case to focus on.
Data from ISTAT (2005) and Eurostat (2006) highlight that 22% of the
EU25 firms are Italian but their weight in terms of employment is only
11%. The size of Italian firms is half the European average and their
productivity is 10% lower. Italian firms specialize in traditional low tech
sectors characterized, in general, by lower productivity. Their
specialization is, therefore, far from being the knowledge-intensive
kind promoted by the European Council. Moreover, the international
demand for traditional goods such as those produced in Italy is low and
grows less than the average demand for manufacturing. These
characteristics help explain the incredibly high turnover of Italian firms:
4 years after birth, only 60% of Italian firms survive, and the figure is
even less for those that operate in international markets.
Page 3 of 25
Editorial Office, Dept of Economics, Warwick University, Coventry CV4 7AL, UK
Submitted Manuscript
123456789101112131415161718192021222324252627282930313233343536373839404142434445464748495051525354555657585960
For Peer Review
3
A recent and increasing literature has pointed out the importance of
firms’ survival, as well as turnover, entry of new firms, start up,
incubators etc. for growth and competitiveness of a country (see for
instance Bartelsman et al., 2003, Bartelsman et al. 2004). A different
strand of literature emphasizes that firms involved in international
activities through export or FDI are “different” from purely domestic
firms in several respect, productivity, wages, skill intensity (see for all
Mayer and Ottaviano, 2008). In this paper we draw on these two so far
unrelated strands of the literature and assess the relationships among
firms’ characteristics and their competitiveness by analyzing
demographic dynamics and survival of Italian firms. More specifically,
we show how the probability of survival is related to firms’ size,
innovation and technological level (in line with Agarwal e Audretsch,
2001) but also to firms’ presence in foreign markets, both as exporters
and foreign direct investors (in line with Mayer and Ottaviano, 2008).
We rely on an innovative dataset obtained by matching and merging
three different firm level databases for Italy which allows us to analyze
the effect of exports, FDI, innovation, size, technological level and R&D
expenditures on the firms’ probability of survival for the period 2001-
2005 in Italy. We find that size and technological level reduce the risk
of failure (exit). Furthermore, the positive impact of technology
increases with size: large firms that operate in high-tech sectors, on
average, have a higher probability of survival than small firms in
traditional sectors. Internationalized firms, on the other hand, show
higher failure risk since, in general, competition in international
Page 4 of 25
Editorial Office, Dept of Economics, Warwick University, Coventry CV4 7AL, UK
Submitted Manuscript
123456789101112131415161718192021222324252627282930313233343536373839404142434445464748495051525354555657585960
For Peer Review
4
markets is stronger. Our results also show that, for innovative firms,
the failure risk is reduced if they operate in high-tech sectors, while
non-innovative firms can survive longer if they are large enough to
exploit their market power. Hence, in Italy, a successful and long-lived
internationalized firm should be high-tech, large and innovative. After
a brief overview of two strand of the literature (Gibrat’s Law and
business demography on the one and internationalization on the other
hand), we sketch the econometric techniques used (Section 3) and
then we present, in Section 4, our results. Section 5 concludes.
2. From Gibrat’s Law to firms’ demography:
domestic versus “international” firms
Back in 1931, Robert Gibrat proposed an explanation for skew size
distributions in a number of different environments, ranging from
biology to astronomy. In particular, describing manufacturing
industries, he showed that the firms’ size distribution is well
approximated by a Log Normal: “the probability of a given
proportionate change in size during a specified period is the same for
all firms in a given industry – regardless of their size at the beginning
of the period” (Mansfield, 1962, p. 1031). This regularity is known as
the Law of Proportionate Effect or Gibrat’s Law.
Until the 1970s this Law was popular, not only because it was coherent
with dynamic patterns of manufacturing firms in different countries but
Page 5 of 25
Editorial Office, Dept of Economics, Warwick University, Coventry CV4 7AL, UK
Submitted Manuscript
123456789101112131415161718192021222324252627282930313233343536373839404142434445464748495051525354555657585960

For Peer Review
5
also because of its compatibility with different theoretical models.
However, empirical testing soon became controversial, while
theoretical models started developing different lines of research (cf.
Santarelli et al, 2006), the most promising of which emphasized the
existence of a strong relationship between the likelihood of survival and
firm size.2 “Because small firms have a lower likelihood of survival than
their larger counterparts, and the likelihood of small firms’ survival is
directly related to growth, firms’ size is found to be negatively related
to growth, thereby refuting Gibrat’s Law” (Agarwal and Audretsch,
2001, pp 22). Hence, the greater is the “entry size” in a given
industry, the higher the likelihood of survival of new entrants. On
average, therefore, smaller firms have a lower probability of survival;
however those who survive grow proportionately faster than larger
firms (Jovanovic, 1982; Evans, 1987; Hall, 1987, Agarwal and
Audretsch, 2001). Furthermore, “entry appears to be relatively easy,
but survival is not” (Geroski, 1995), so that turnover can be high,
especially in highly competitive markets.
A vast number of recent empirical studies, covering different time
periods and countries,3 finds that size increases the likelihood of
survival in the more technological advanced industries, but not in
traditional sectors. Most of these studies are consistent with theories of
industry evolution (Agarwal and Gort, 1996, Agarwal, 1998, Audretsch,
2 See the influential surveys by Geroski, 1995, Sutton, 1997 , Caves, 1998 and the paper by Holmes et al., 2008. 3 See, for instance, Dunne, Roberts and Samuelson, 1988, 1989 (US); Audretsch, 1991, 1995 (US); Agarwal, 1997 (US); Mata, Portugal, 1994 (Portugal); Agarwal and Audretsch, 2001 (US); Eurostat, 2006 (EU); Bartelsman et al., 2003 (OECD); Bartelsman et al., 2004 (EU and Americas). There are several applications to the service sector pointing to the positive effect of size and diversification (see Santarelli, 1998 and Leong et al., 2003).
Page 6 of 25
Editorial Office, Dept of Economics, Warwick University, Coventry CV4 7AL, UK
Submitted Manuscript
123456789101112131415161718192021222324252627282930313233343536373839404142434445464748495051525354555657585960
For Peer Review
6
1995) and with the theory of strategic niches (Caves and Porter, 1977;
Porter, 1979). According to the latter, firms remain small because they
occupy product niches that are not easily accessible or profitable for
their larger counterparts. A different strand of the literature has
emphasized firms’ heterogeneity and focused on the existence of
substantial differences between domestic and internationalized firms.
The underlying idea is that there are relatively few firms ‘fit’ to cope
with the more competitive international markets and these firms are
more productive, pay higher wages, employ more skilled workers,
invest more in R&D.4 In a seminal paper, Melitz (2003) maintains that
firms with different level of international involvement, which are
randomly allocated a productivity level, are clearly ranked: exporters
are more productive than domestic firms, foreign investors more
productive than exporters and so on. Our purpose is to link the
literature on survival with that on mode of internationalization. To the
best of our knowledge there are few studies, if any, that look
simultaneously at the role of size, technology and internationalization
on firms’ survival rates. As will be emphasized below, some of our
results are in line with the theoretical findings of the recent literature
on internationalization (see Mayer and Ottaviano, 2007).
4 More precisely, this literature can be split in two: on the one side the seminal paper by Melitz, 2003 and the papers surveyed in Meyer and Ottaviano, 2008, which focus on the ranking and on the different productivity levels of firms with different international involvement. On the other hand, a large literature on learning by exporting, pioneered by Clerides, Lach and Tybout, 1998. Only some of our results, as will be emphasized below, are in line with the theoretical findings.
Page 7 of 25
Editorial Office, Dept of Economics, Warwick University, Coventry CV4 7AL, UK
Submitted Manuscript
123456789101112131415161718192021222324252627282930313233343536373839404142434445464748495051525354555657585960
For Peer Review
7
3. The Econometric Techniques
To analyze whether the likelihood of survival is invariant to firm size,
international involvement and to technological intensity we use the
Analysis of Duration (Lancaster, 1990) that allows us to estimate the
length of the time until failure.5 The variable of interest in the analysis
of survival is the length of time that elapses from the beginning of
some events either until “their” end or until the end of the analysis.
Observations will typically consist of a cross section of durations
t1,t2,…,tn∈T, where T is a random variable (discrete or continuous),
and for this type of data the analysis of duration allows one to estimate
the probability that the event “failure” occurs next period. In this paper
the dependent variable is the span of survival and is calculated as the
difference between time t and the firm’s set up year while the “failure”
event includes winding-up, failure or end of activity (Agarwal and
Audretsch, 2001). The process observed may have started at different
points in time and, because its length is not constant over time, the
random variable T is unavoidably censored.
Let T be a random variable with a cumulative probability
∫ ≤==t
tTdssftF0
)Pr()()(
where f(t) is the continuous probability distribution. We are interested
in the probability that the period is of length at least t, which is given
by the survival function
)Pr()(1)( tTtFtS ≥=−=
5 Simple examples are the length of a strike, the durability of electric and electronic components, the length of survival after the diagnosis of a disease or after an operation and time until business failure.
Page 8 of 25
Editorial Office, Dept of Economics, Warwick University, Coventry CV4 7AL, UK
Submitted Manuscript
123456789101112131415161718192021222324252627282930313233343536373839404142434445464748495051525354555657585960
For Peer Review
8
and the probability that the phenomenon will end the next short
interval of time, ∆ , is
)|Pr(),( tTtTttl ≥∆+≤≤=∆ .
The Hazard Rate, i.e. the rate at which spells are completed after
duration t, given that they last at least until t, is:
)(
)(
)(
)()(lim
)|Pr(lim)(
00 tS
tf
tS
tFtFtTtTtt =
∆−∆+
=∆
≥∆+≤≤=
→∆→∆λ
To measure the effect of different regressors (in our case entry size
and technological level) on the survival probability of the phenomenon,
we estimate the parameter λ using Maximum Likelihood by the Cox
Proportional Hazard Regressions.
The hazard function hi(t) of a firm i is expressed as:
)exp()(),()( '0 βiii xthxthth ==
)(0 th being an arbitrary and unspecified baseline hazard function
representing the probability of failure conditional on the fact that the
firm has survived until time t, xi is a vector of measured explanatory
variables for the i-th firm and β is the vector of unknown parameters
to be estimated. Negative coefficients or risk ratios less than one imply
that the hazard rate decreases and the corresponding probability of
survival increases.
Life-table analysis, estimating the survival rate at time s, where s is
defined as the fraction of the total number of firms that survived at
least t years, can also be used to show firms survival and failure rates.
Life tables give the number of firms that die conditional on their age,
i.e. they represent the probability of failure given that the firm has
survived t years. To check for significance of differences between
Page 9 of 25
Editorial Office, Dept of Economics, Warwick University, Coventry CV4 7AL, UK
Submitted Manuscript
123456789101112131415161718192021222324252627282930313233343536373839404142434445464748495051525354555657585960
For Peer Review
9
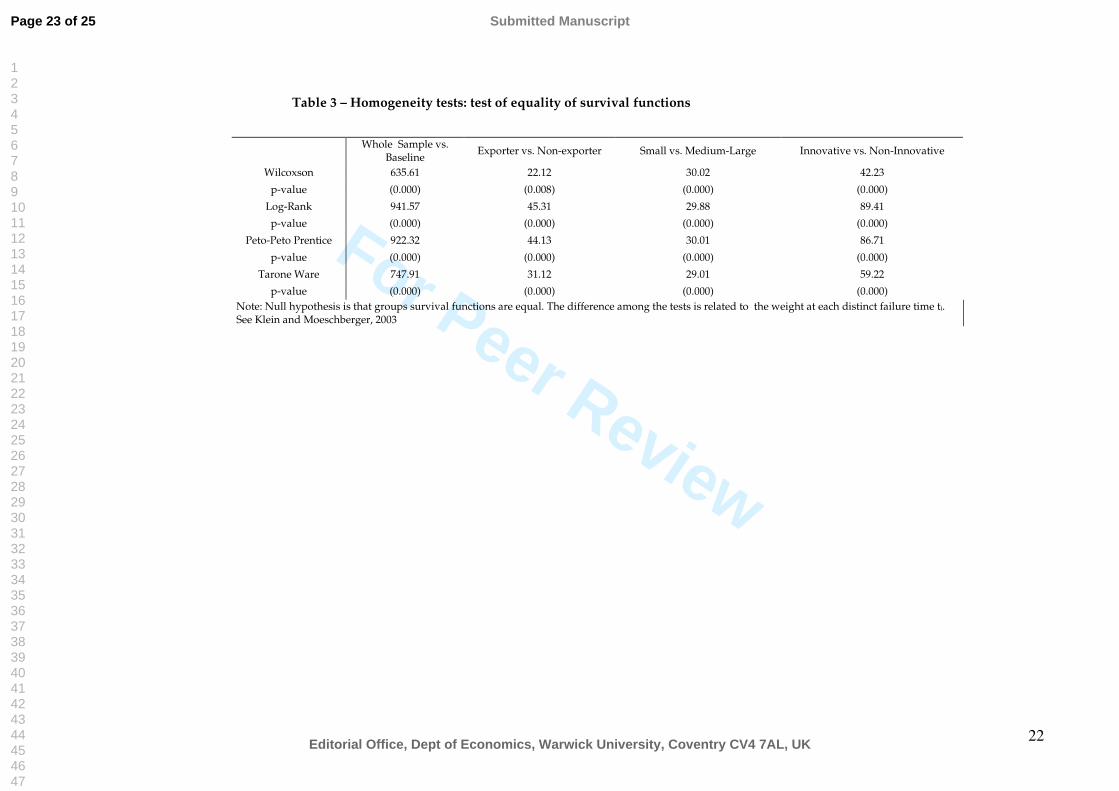
groups, tests of homogeneity are usually run (in the following we use
the nonparametric Log-Rank, Wilcoxon, Tarone-West and Peto-Peto-
Prentice tests). At each failure time t, the test statistics is obtained as
a weighted standardized sum of the difference between the observed
and expected number of exit in each of the k-groups. The null
hypothesis is no difference between the survival functions of the k-
groups. The weights functions used determine the test statistics (see
Klein and Moeschenberger, 2003).
4. Data and Results
We match and merge to gain the intersection of three different
datasets: Capitalia, ICE-Reprint and AIDA.6 AIDA provides standard data
on budgets of Italian companies, Capitalia’s Observatory on Small and
Medium Size Firms is a survey on a representative sample of over 4000
Italian firms, providing information on R&D, innovation, destination
markets for exports etc. The sample includes all firms with more than
500 employees and firms with less than 500 employees selected using a
stratified design on location, industrial activity and size. Finally, the ICE-
Reprint database is the census of foreign affiliates of Italian firms and
provides information on number of employees and sales (for details, see
Mariotti and Mutinelli, 2005). In this paper, we use ICE-Reprint for
information on foreign direct investment. Hence, our consolidated
6 Capitalia (9th survey, 2005) has data for the period 2001-2003, ICE-Reprint provides information for the period 2001-2003. See De Benedictis and Giovannetti (2008) for further information on the dataset and for the main characteristics of ICE-Reprint database. AIDA provides the budget and entrepreneurs’ data for the period 2001-2005. See below for the exact source of each variable.
Page 10 of 25
Editorial Office, Dept of Economics, Warwick University, Coventry CV4 7AL, UK
Submitted Manuscript
123456789101112131415161718192021222324252627282930313233343536373839404142434445464748495051525354555657585960

For Peer Review
10
dataset provides information on firms’ processes of internationalization,
economic performance, innovative capacity and growth for 4289
manufacturing firms.
The independent variable (span of survival) is calculated as:
10 +−= AAS tt
where tA is the year corresponding to the balance sheet at year t and
0A is the firms’ birth year. tS is a censored variable because the exit
from the market can happen during or before 2005 due to winding-up,
failure or end of activity. In the survival analysis, tS represents the
“failure” variable on which the exit probability is worked out. Hence, we
can avoid biased estimates by distinguishing firms that failed during
2005 from those still alive in 2005 that are no longer included in the
dataset as a result of falling outside the sample frame.
The technological dummy is built on the Pavitt taxonomy. It is equal
zero when the firm works in traditional or in scale sectors and one
otherwise.7
Size is generated from firm’s total sales. Because of the high skewness
of the Italian firms’ distribution, we use 5 equally represented classes,
following the procedure introduced by Geweke, Marshall and Zarkin
(1986), to avoid inconsistency problems in the axioms at the basis of
the discrete Markov Chains theory (Fractile Markov Chains). Hence, we
do not use equally sized classes but we define a number of classes n
7 The Pavitt taxonomy distinguishes between traditional, scale, specialized and high-tech sectors. Since in the scale sectors there are some firms that cannot be classified as “low tech”, we also run the models using (1) a dummy equal to 0 only for traditional sectors and 1 otherwise and (2) the 4 Pavitt classes separately. Results are robust and available upon request.
Page 11 of 25
Editorial Office, Dept of Economics, Warwick University, Coventry CV4 7AL, UK
Submitted Manuscript
123456789101112131415161718192021222324252627282930313233343536373839404142434445464748495051525354555657585960
For Peer Review
11
such that the proportion of the population8 (asset size of the firms) in
each class j, for each t, is constant and equal to n-1. This allows us to
avoid classifying most firms as “small”.
We use a specific question of the Capitalia survey to define the dummy
variable capturing innovative capacity. The dummy is equal one if in the
period 2001-2003 the firm has introduced into the market an innovative
product or it has set up either a new production process or an
innovation in labor organization. Finally, dichotomous variables are also
defined on whether firms export, invest abroad and/or invest in R&D
activities. Innovation, exports, R&D, technology and FDI variables are
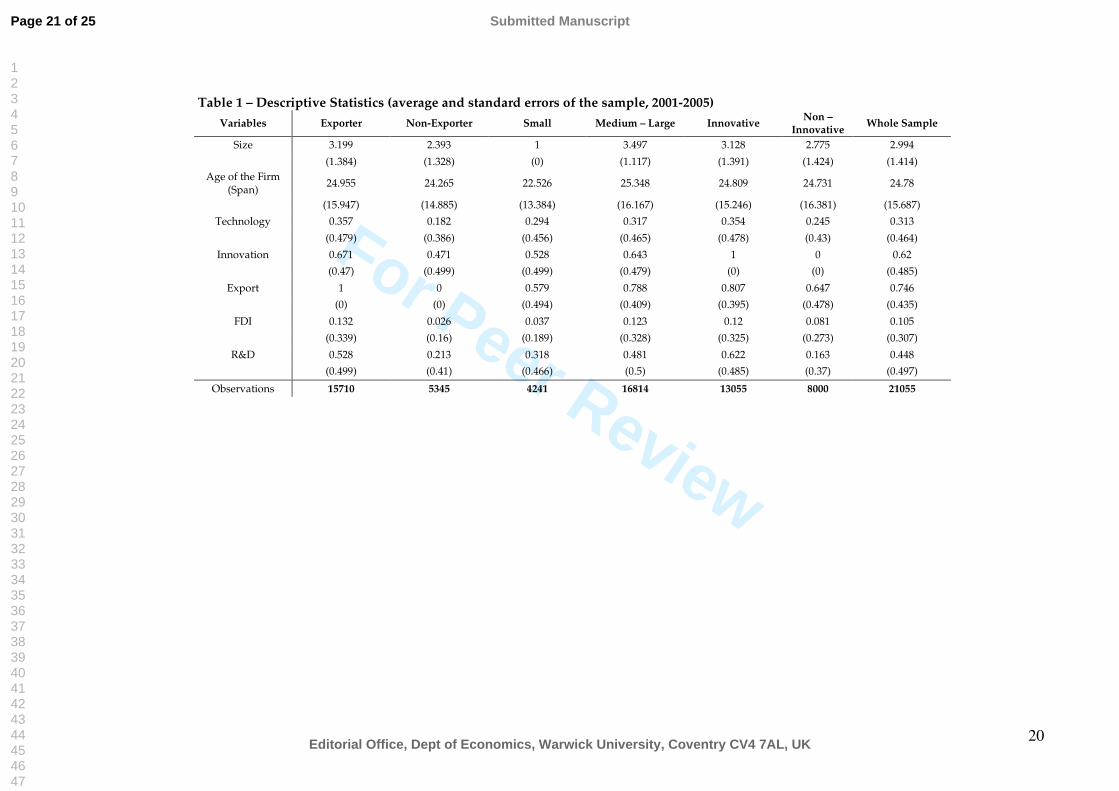
drawn from the Capitalia and ICE-Reprint databases. Table 1 reports
summary statistics on the whole sample. We show that 74.6% of our
sample firms export, while only 10.5% invest abroad. Moreover, in the
period 2001-2003, 62% of firms reported at least one innovation,9 while
only 44% of them spent on R&D10. The sample average firms’ age is
24.78 years, which is quite high if compared to the average age of the
Italian firms. However, the sample standard deviation is very high11.
Table 1 around here
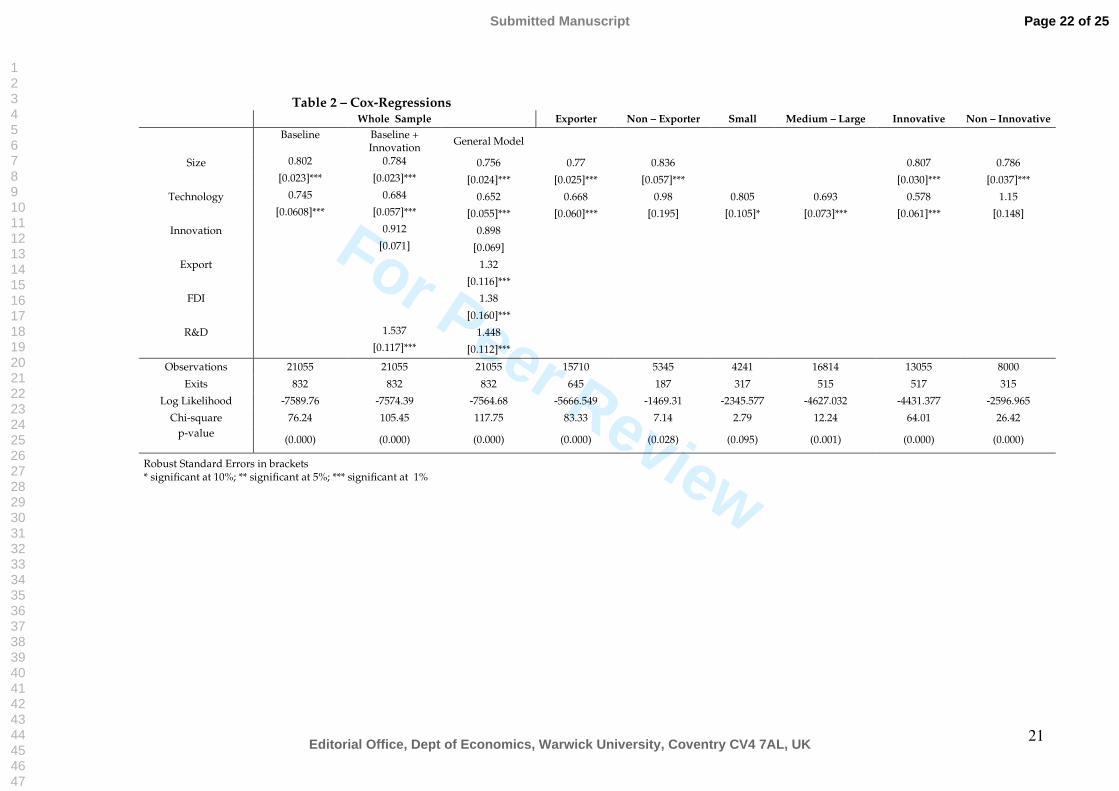
Table 2 presents the estimation results for the entire sample12 and some
sub-samples selected by splitting the sample to single out small (class
1) and medium-large (classes 2-5), exporters and non-exporters, and
innovative and non-innovative firms. Table 3 reports the homogeneity
8 ∀t and ∀j: 1, 2,…, n, πj,t = n-1, t is time, j are the n classes and πj,t in class j at time t. 9 Because of lack of data, we cannot distinguish between product, process and organizational innovations. 10 Life Tables analysis confirm our results; it is not reported for reasons of space but is available on request. 11 Further analysis shows that eliminating the outliers does not alter the sample average firms’ age. For instance, sample including firms less than 50 years old, have an average age of 22. 12 We also run the regressions including only size (not reported), size and technology (cf. Table 2) and size, technology R&D and innovation. The coefficients of those variables are stable but the explanatory power in our preferred regression, which includes even internationalization variables, is higher.
Page 12 of 25
Editorial Office, Dept of Economics, Warwick University, Coventry CV4 7AL, UK
Submitted Manuscript
123456789101112131415161718192021222324252627282930313233343536373839404142434445464748495051525354555657585960
For Peer Review
12
tests (Log-Rank, Wilcoxon, Peto-Peto Prentice and Tarone Ware) for sub
groups.
Table 2 around here
Table 3 around here
Size is always statistically significant and has a positive effect in
increasing survival probability. It means that, independently of the main
characteristics of the economic system, larger firms have a higher
probability to survive. However, its magnitude is different among the
various specifications.
Considering the whole sample, all variables except innovation are
significant. Larger size and higher tech increase the survival probability,
while internationalizing (either by exporting or FDI) has the opposite
effect: competition in international markets is harder and increases the
risk of failure (more specifically, to export increases the risk of failure by
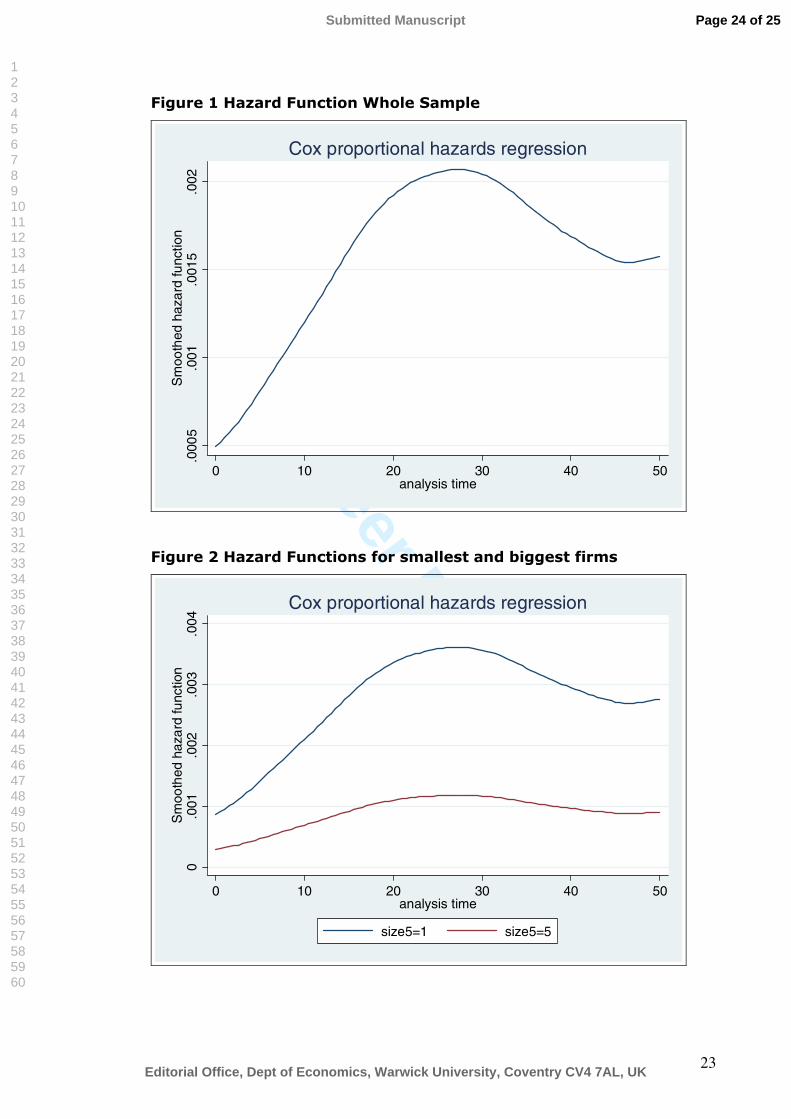
32% and to invest abroad by 38%)13. In Figure 1 we report the smooth
hazard function for the whole sample; as can be seen, the risk of failure
is relatively low (on average around 0.2%) but keeps increasing until
almost 30 years after birth and, after a short period of reduction
(around ten years), starts increasing again.
Figure 1 around here
It is worth noting that size plays a more important role for exporting
that for non-exporting firms. Moreover, size reduces by 20% the failure
13 This result is in line with the theoretical model of Melitz and Ottaviano, 2008.
Page 13 of 25
Editorial Office, Dept of Economics, Warwick University, Coventry CV4 7AL, UK
Submitted Manuscript
123456789101112131415161718192021222324252627282930313233343536373839404142434445464748495051525354555657585960
For Peer Review
13
risk for innovative firms but by 22% for non-innovative firms. Producing
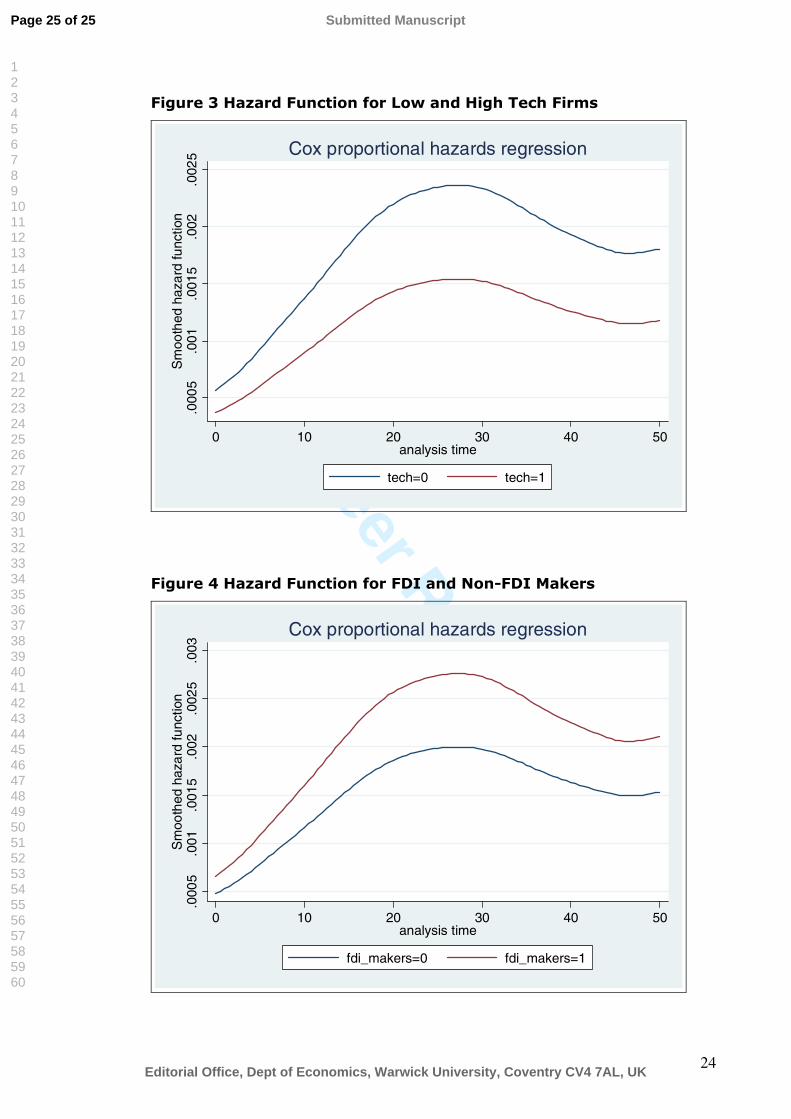
in high-tech sectors reduces the risk of failure. Particularly, firms that
export high-tech goods are less vulnerable and their probability of
survival increases by roughly 33%. It seems that the best strategy for
exporters is to operate in high-tech sectors and, secondly, to become
larger.
If we split small from medium and large firms, we notice that for the
former technology has a weakly (significant) effect, while for the latter a
huge (-30%) impact on failure risk. This result seems to support,
somehow, the theory of strategic niches: some firms remain small
because they have a comparative advantage due to the peculiar nature
of the goods they produce (mainly low tech), advantage that can
disappear if/when the size increases. Finally, in the sample considered,
the innovative firms have higher survival probability (+42.2%). On the
contrary, for non-innovative firms operating in traditional sectors, the
technological level of the goods produced does not have any effect on
the failure risk. Figures 2 to 6 report sub-sample smoothed hazard
functions.
Figures 2 to 6 around here
In summary, we can say that exporting and innovative activity are (on
average) more risky if the firm is small and produces traditional goods.
On the other hand, size plays a crucial role for those firms operating
only in Italy and for non-innovative firms; in these cases, technology
does not have significant effects on survival probability.
Page 14 of 25
Editorial Office, Dept of Economics, Warwick University, Coventry CV4 7AL, UK
Submitted Manuscript
123456789101112131415161718192021222324252627282930313233343536373839404142434445464748495051525354555657585960

For Peer Review
14
5. Conclusions
Our empirical analysis suggests that, for Italian firms: 1) size and
technological level reduce failure risk: the larger the firm, the greater
the positive effect of technology on survival probability; 2) being an
exporter or investing abroad reduces the survival probability of a firm:
on average, the exposure to the strong competition in international
markets increases the firms’ risk of failure. Moreover, competitive firms
in international markets tend to be bigger and in high-tech sectors. 3)
Comparing exporting and non-exporting firms, size and technology have
a stronger impact on the former than on the latter. Similarly, for
innovative firms it is crucial to operate in high-tech sectors, while non-
innovative firms can survive longer exploiting the market power
(proxied by size).
Hence, we can claim that, in Italy in the last few years a long-lived
successful firm is big and innovative, operates in high-tech sectors, and
is a key player on international markets. This has a clear implication for
economic policy and makes it essential to fulfil the Lisbon goals.
Acknowledgement
We would like to thank Sergio De Nardis, Fabrizio Onida, Christine Oughton
and Alessandro Viviani for their comments on a previous version, as well as
the anonymous referee. We would also like to thank Alberto Petrucci and the
participants to the conference of the CNR group Economia Internazionale,
held in Villa Mondragone (Roma, 17-18 September 2007). Giorgia
Giovannetti and Giorgio Ricchiuti gratefully acknowledge financial
Page 15 of 25
Editorial Office, Dept of Economics, Warwick University, Coventry CV4 7AL, UK
Submitted Manuscript
123456789101112131415161718192021222324252627282930313233343536373839404142434445464748495051525354555657585960

For Peer Review
15
contributions from the FIRB project “International fragmentation of Italian
firms. New organizational models and the role of information technologies”.
Margherita Velucchi gratefully acknowledges financial contributions from the
research project no. 2005139545_003 funded by the MIUR.
Page 16 of 25
Editorial Office, Dept of Economics, Warwick University, Coventry CV4 7AL, UK
Submitted Manuscript
123456789101112131415161718192021222324252627282930313233343536373839404142434445464748495051525354555657585960
For Peer Review
16
References
Agarwal R. (1997), “Survival of Firms over the Product Life Cycle”, Southern
Economic Journal, 3, pp.571-584
Agarwal R. (1998), “Evolutionary Trends of Industry Variables”,
International Journal of Industrial Organization, 16, pp. 511-526
Agarwal R, Gort M. (1996), “The Evolution of Markets and Entry, Exit and
Survival of Firms”, Review of Economics and Statistics, 78, pp.489-498
Agarwal R., Audretsch D. B. (2001), “Does entry size matter? The impact of
the life cycle and technology on firm survival”, The Journal of Industrial
Economics, 1, pp. 21-43
Audretsch D.B. (1991),”New Firm Survival and the Technological Regime”,
Review of Economics and Statistics, 73, pp.441-450
Audretsch D.B. (1995), Innovation and Industry Evolution, Cambridge, MIT
Press
Bartelsman E., Scarpetta S., Schivardi F. (2003),”Comparative Analysis of
Firm Demographics and Survival: Micro-Level Evidence for the OECD
Countries”, OECD Economics Department Working Papers, No. 348, OECD
Bartelsman E., Haltiwanger J., Scarpetta S. (2004), “Microeconomic
Evidence of Creative Destruction in Industrial and Developing countries”,
Tinbergen Institute Discussion Papers, TI 2004-114/3
Capitalia (2003), VIII Indagine sulle Imprese italiane, Osservatorio sulle
piccole e medie imprese
Capitalia (2005), IX Indagine sulle Imprese italiane, Osservatorio sulle
piccole e medie imprese
Page 17 of 25
Editorial Office, Dept of Economics, Warwick University, Coventry CV4 7AL, UK
Submitted Manuscript
123456789101112131415161718192021222324252627282930313233343536373839404142434445464748495051525354555657585960
For Peer Review
17
Caves R., Porter M.E. (1977), “From Entry Barriers to Mobility Barriers”,
Quarterly Journal of Economics, 91, pp.241-261
Caves R. E. (1998), Industrial Organization and New Findings on the
Turnover and Mobility of Firms, Journal of Economic Literature, Vol. 36, No.
4, pp. 1947-1982
Clerides, S., Lach,S, Tybout, J. (1998), Is learning by exporting important?
Micro-dynamic evidence from Columbia, Mexico and Morocco, Quarterly
Journal of Economics, Vol. 113, pp.903-948
De Benedictis L., Giovannetti G. (2008) “Caratteristiche
dell’Internazionalizzazione delle imprese in Italia. Esportazioni,
Delocalizzazione ed Investimenti Diretti all’estero” Rapporto CER-ICE,
Rubettino Editore, forthcoming
Dunne T., Roberts, M.J., Samuelson L. (1988), “Patterns of Firm Entry and
Exit in the U.S. Manufacturing Industries”, Rand Journal of Economics, 19,
pp.495-515
Dunne T., Roberts, M.J., Samuelson L. (1989), “The Growth and the Failure
of U.S. Manufacturing Plants”, Quarterly Journal of Economics, 104, pp.671-
698
Eurostat (2006), European business – Facts and Figures
Evans D. (1987), “The Relationship between Firms Growth, Size and Age:
Estimates from 100 Manufacturing Industries”, Journal of Industrial
Economics, 35, pp.567-581
Geweke, J, Marshall, R.C., Zarkin, G.A. (1986), “Mobility Indices in
Continuous Time Markov Chains”, Econometrica, 54(6), pp.1407-1423
Page 18 of 25
Editorial Office, Dept of Economics, Warwick University, Coventry CV4 7AL, UK
Submitted Manuscript
123456789101112131415161718192021222324252627282930313233343536373839404142434445464748495051525354555657585960
For Peer Review
18
Geroski P.A. (1995), “What do we know about entry?” International Journal
of Industrial Organization, 13, pp. 450-456
Gibrat R. (1931), Les Inégalités Économiques. Applications : Aux Inégalités
des Richesses, à la Concentration des Entreprises, Aux Population des Villes,
Aux Statistiques des Familles, etc., d’une Loi Nouvelle : La Loi de l’Effet
Proportionnel, Paris, Librairie du Recueil Sirey
Hall B.(1987), “The Relationship Between Firm Size and Firm Growth in the
U.S. Manufacturing Sector”, Journal of Industrial Economics, 35, pp.583-606
Holmes, P., Hunt, A. and Stone, I. (2008) “An analysis of new firm survival
using a hazard function”, Applied Economics, 99999:1
ISTAT (2005), Rapporto Annuale, Roma
Lisbon European Council (2000),
http://www.europa.eu.int/comm/lisbon_strategy/index_en.html.
Klein J.P. and Moeschberger M.L., (2003), Survival Analysis: Techniques for
censored and truncated data, 2nd ed., New York, Springer
Jovanovic, B. (1982), “Selection and the Evolution of Industry”,
Econometrica, Econometric Society, vol. 50(3), pp. 649-670
Lancaster, T. (1990), The Analysis of Transition Data, New York: Cambridge
University Press
Leung, M. K., Rigby, D. and Young, T. (2003) “Entry of foreign banks in the
People's Republic of China: a survival analysis”; Applied Economics,35:1,21-
31
Mansfield, E. (1962), “Entry, Gibrat’s Law, Innovation, and the Growth of
Firms”, American Economic Review, 52, pp. 1023-1051
Page 19 of 25
Editorial Office, Dept of Economics, Warwick University, Coventry CV4 7AL, UK
Submitted Manuscript
123456789101112131415161718192021222324252627282930313233343536373839404142434445464748495051525354555657585960

For Peer Review
19
Mariotti S., Mutinelli M. (2005), Italia Multinazionale 2004. Le partecipazioni
Italiane all’estero e estere in Italia, Soveria Mannelli, Rubbettino Editore.
Mata J., Portugal P. (1994), “Life Duration of New Firms”, Journal of
Industrial Economics, 27, pp.227-246
Mayer, T., Ottaviano, G.M. (2007), The Happy Few the internationalization of
European Firms, Bruegel blueprint series, n. 3
Melitz, M. (2003), “The Impact of Trade on Intra-Industry Reallocations and
Aggregate Industry Productivity” Econometrica, Econometric Society, vol.
71(6), pp. 1695-1725
Melitz, M, Ottaviano G. M. (2008), “Market Size, Trade, and Productivity”,
Review of Economic Studies, Vol. 75, Issue 1, pp. 295 - 316
Porter M.E. (1979), “The structure within industries and companies
performance”, Review of Economics and Statistics, 61, pp. 214-227
Santarelli, E. (1998), “Start-up size and post-entry performance: the case of
tourism services in Italy”, Applied Economics, 30:2, 157-163
Santarelli E., Klomp L., Turik R. (2006), “Gibrat Law: an Overview of the
Empirical Literature”, in Santarelli (eds.), Entrepreneurship, Growth, and
Innovation: the Dynamics of Firms and Industries, Springer, New York
Steindl J. (1965), Random Processes and the Growth of the Firms: A Study
of the Pareto Law, London: Griffith
Sutton J. (1997), “Gibrat’s Legacy”, Journal of Economic Literature, 35, pp.
40-59.
Sutton J. (1998), Technology and market structure: Theory and History,
Cambridge, Mass, the MIT Press.
Page 20 of 25
Editorial Office, Dept of Economics, Warwick University, Coventry CV4 7AL, UK
Submitted Manuscript
123456789101112131415161718192021222324252627282930313233343536373839404142434445464748495051525354555657585960
For Peer Review
20
Table 1 – Descriptive Statistics (average and standard errors of the sample, 2001-2005)
Variables Exporter Non-Exporter Small Medium – Large InnovativeNon –
InnovativeWhole Sample
Size 3.199 2.393 1 3.497 3.128 2.775 2.994
(1.384) (1.328) (0) (1.117) (1.391) (1.424) (1.414)Age of the Firm
(Span)24.955 24.265 22.526 25.348 24.809 24.731 24.78
(15.947) (14.885) (13.384) (16.167) (15.246) (16.381) (15.687)
Technology 0.357 0.182 0.294 0.317 0.354 0.245 0.313
(0.479) (0.386) (0.456) (0.465) (0.478) (0.43) (0.464)
Innovation 0.671 0.471 0.528 0.643 1 0 0.62
(0.47) (0.499) (0.499) (0.479) (0) (0) (0.485)
Export 1 0 0.579 0.788 0.807 0.647 0.746
(0) (0) (0.494) (0.409) (0.395) (0.478) (0.435)
FDI 0.132 0.026 0.037 0.123 0.12 0.081 0.105
(0.339) (0.16) (0.189) (0.328) (0.325) (0.273) (0.307)
R&D 0.528 0.213 0.318 0.481 0.622 0.163 0.448
(0.499) (0.41) (0.466) (0.5) (0.485) (0.37) (0.497)
Observations 15710 5345 4241 16814 13055 8000 21055
Page 21 of 25
Editorial Office, Dept of Economics, Warwick University, Coventry CV4 7AL, UK
Submitted Manuscript
123456789101112131415161718192021222324252627282930313233343536373839404142434445464748495051525354555657585960
For Peer Review
21
Table 2 – Cox-Regressions Whole Sample Exporter Non – Exporter Small Medium – Large Innovative Non – Innovative
Baseline Baseline + Innovation
General Model
Size 0.802 0.784 0.756 0.77 0.836 0.807 0.786[0.023]*** [0.023]*** [0.024]*** [0.025]*** [0.057]*** [0.030]*** [0.037]***
Technology 0.745 0.684 0.652 0.668 0.98 0.805 0.693 0.578 1.15[0.0608]*** [0.057]*** [0.055]*** [0.060]*** [0.195] [0.105]* [0.073]*** [0.061]*** [0.148]
Innovation 0.912 0.898[0.071] [0.069]
Export 1.32
[0.116]***
FDI 1.38
[0.160]***
R&D 1.537 1.448[0.117]*** [0.112]***
Observations 21055 21055 21055 15710 5345 4241 16814 13055 8000
Exits 832 832 832 645 187 317 515 517 315
Log Likelihood -7589.76 -7574.39 -7564.68 -5666.549 -1469.31 -2345.577 -4627.032 -4431.377 -2596.965
Chi-square 76.24 105.45 117.75 83.33 7.14 2.79 12.24 64.01 26.42p-value
(0.000) (0.000) (0.000) (0.000) (0.028) (0.095) (0.001) (0.000) (0.000)
Robust Standard Errors in brackets* significant at 10%; ** significant at 5%; *** significant at 1%
Page 22 of 25
Editorial Office, Dept of Economics, Warwick University, Coventry CV4 7AL, UK
Submitted Manuscript
123456789101112131415161718192021222324252627282930313233343536373839404142434445464748495051525354555657585960
For Peer Review
22
Table 3 – Homogeneity tests: test of equality of survival functions
Whole Sample vs. Baseline
Exporter vs. Non-exporter Small vs. Medium-Large Innovative vs. Non-Innovative
Wilcoxson 635.61 22.12 30.02 42.23
p-value (0.000) (0.008) (0.000) (0.000)
Log-Rank 941.57 45.31 29.88 89.41
p-value (0.000) (0.000) (0.000) (0.000)
Peto-Peto Prentice 922.32 44.13 30.01 86.71
p-value (0.000) (0.000) (0.000) (0.000)
Tarone Ware 747.91 31.12 29.01 59.22
p-value (0.000) (0.000) (0.000) (0.000)Note: Null hypothesis is that groups survival functions are equal. The difference among the tests is related to the weight at each distinct failure time ti. See Klein and Moeschberger, 2003
Page 23 of 25
Editorial Office, Dept of Economics, Warwick University, Coventry CV4 7AL, UK
Submitted Manuscript
123456789101112131415161718192021222324252627282930313233343536373839404142434445464748495051525354555657585960
For Peer Review
23
Figure 1 Hazard Function Whole Sample
.000
5.0
01.0
015
.002
Sm
ooth
ed h
azar
d fu
nctio
n
0 10 20 30 40 50analysis time
Cox proportional hazards regression
Figure 2 Hazard Functions for smallest and biggest firms
0.0
01.0
02.0
03.0
04S
moo
thed
haz
ard
func
tion
0 10 20 30 40 50analysis time
size5=1 size5=5
Cox proportional hazards regression
Page 24 of 25
Editorial Office, Dept of Economics, Warwick University, Coventry CV4 7AL, UK
Submitted Manuscript
123456789101112131415161718192021222324252627282930313233343536373839404142434445464748495051525354555657585960
For Peer Review
24
Figure 3 Hazard Function for Low and High Tech Firms
.000
5.0
01.0
015
.002
.002
5S
moo
thed
haz
ard
func
tion
0 10 20 30 40 50analysis time
tech=0 tech=1
Cox proportional hazards regression
Figure 4 Hazard Function for FDI and Non-FDI Makers
.000
5.0
01.0
015
.002
.002
5.0
03S
moo
thed
haz
ard
func
tion
0 10 20 30 40 50analysis time
fdi_makers=0 fdi_makers=1
Cox proportional hazards regression
Page 25 of 25
Editorial Office, Dept of Economics, Warwick University, Coventry CV4 7AL, UK
Submitted Manuscript
123456789101112131415161718192021222324252627282930313233343536373839404142434445464748495051525354555657585960

For Peer Review
25
Figure 5 Hazard Function for Exporting and Non-Exporting Firms
.000
5.0
01.0
015
.002
.002
5S
moo
thed
haz
ard
func
tion
0 10 20 30 40 50analysis time
export=0 export=1
Cox proportional hazards regression
Figure 6 Hazard Function for Innovative and Non-Innovative Firms
.0005
.001
.0015
.002
.0025
Sm
ooth
ed h
azar
d fu
nctio
n
0 10 20 30 40 50analysis time
innovation=0 innovation=1
Cox proportional hazards regression
Page 26 of 25
Editorial Office, Dept of Economics, Warwick University, Coventry CV4 7AL, UK
Submitted Manuscript
123456789101112131415161718192021222324252627282930313233343536373839404142434445464748495051525354555657585960