G. Ferrara , A. Mazzeo , A.M.S. Matarrese , C. Pacucci … Colture/Vite da Tavola/7th... · •PGRs...
32
G. Ferrara 1 , A. Mazzeo 1 , A.M.S. Matarrese 1 , C. Pacucci 1 , V. Gallo 2,3 1 Dipartimento di Scienze del Suolo, della Pianta e degli Alimenti - University of Bari ‘Aldo Moro’ , via Amendola 165/A - 70126 Bari (Italy) 2 DICATECh, Politecnico di Bari, via Orabona 4 – 70125 Bari (Italy) 3 Innovative Solutions S.r.l. – Spin Off company of Politecnico di Bari, zona H 150/B Noci (Bari, Italy)
Transcript of G. Ferrara , A. Mazzeo , A.M.S. Matarrese , C. Pacucci … Colture/Vite da Tavola/7th... · •PGRs...
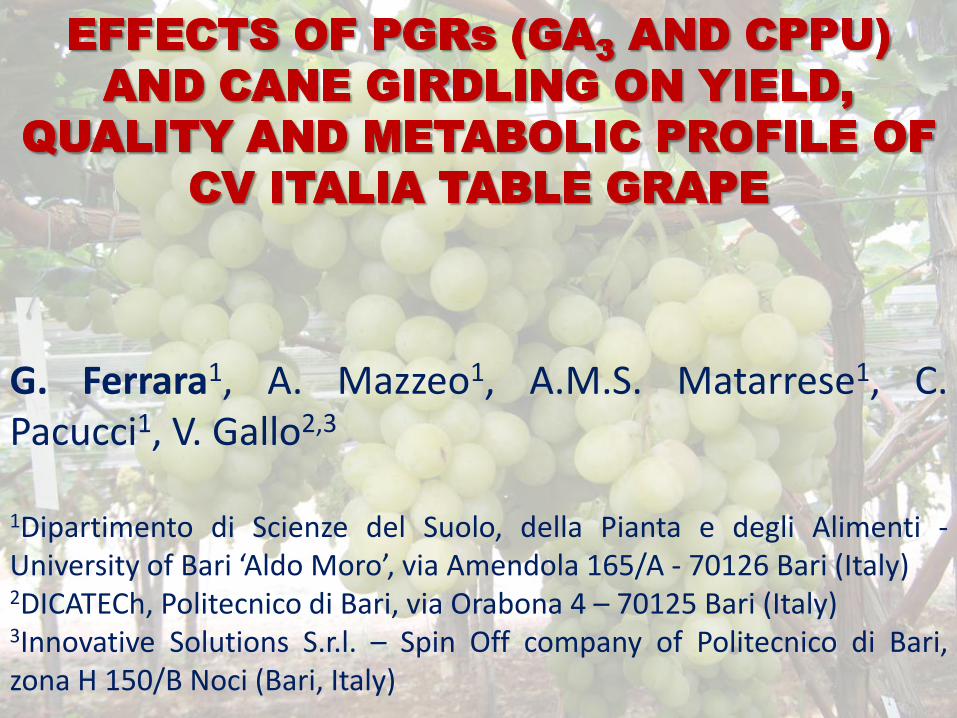
G. Ferrara1, A. Mazzeo1, A.M.S. Matarrese1, C. Pacucci1, V. Gallo2,3 1Dipartimento di Scienze del Suolo, della Pianta e degli Alimenti - University of Bari ‘Aldo Moro’, via Amendola 165/A - 70126 Bari (Italy) 2DICATECh, Politecnico di Bari, via Orabona 4 – 70125 Bari (Italy) 3Innovative Solutions S.r.l. – Spin Off company of Politecnico di Bari, zona H 150/B Noci (Bari, Italy)
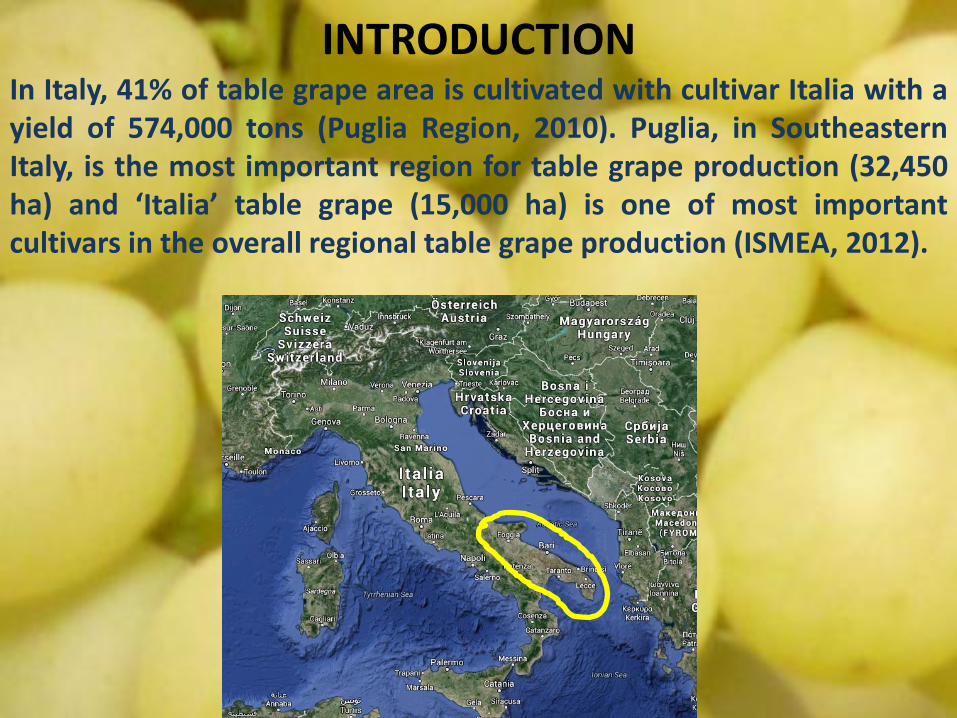
INTRODUCTION In Italy, 41% of table grape area is cultivated with cultivar Italia with a yield of 574,000 tons (Puglia Region, 2010). Puglia, in Southeastern Italy, is the most important region for table grape production (32,450 ha) and ‘Italia’ table grape (15,000 ha) is one of most important cultivars in the overall regional table grape production (ISMEA, 2012).
INTRODUCTION
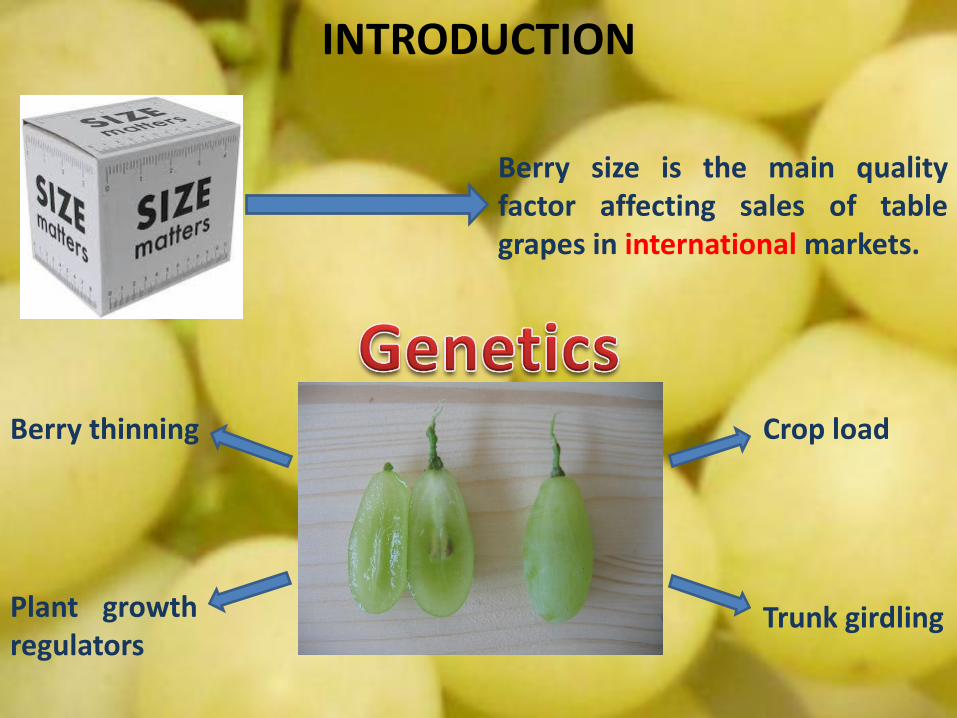
Berry size is the main quality factor affecting sales of table grapes in international markets.
Crop load Berry thinning
Trunk girdling Plant growth regulators
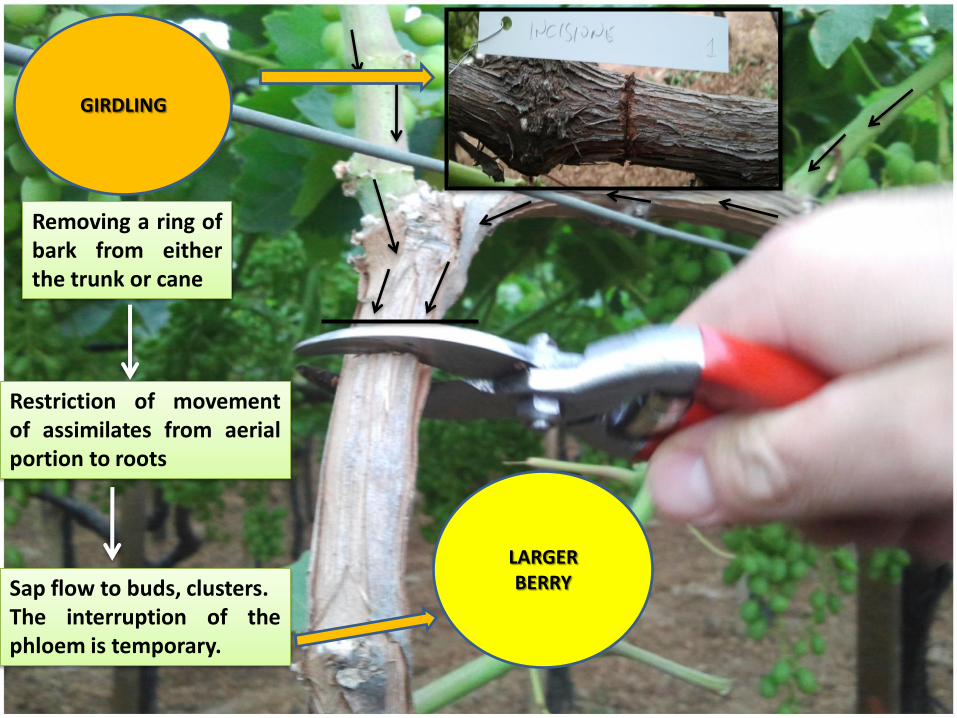
Removing a ring of bark from either the trunk or cane
Restriction of movement of assimilates from aerial portion to roots
Sap flow to buds, clusters. The interruption of the phloem is temporary.
GIRDLING
LARGER BERRY
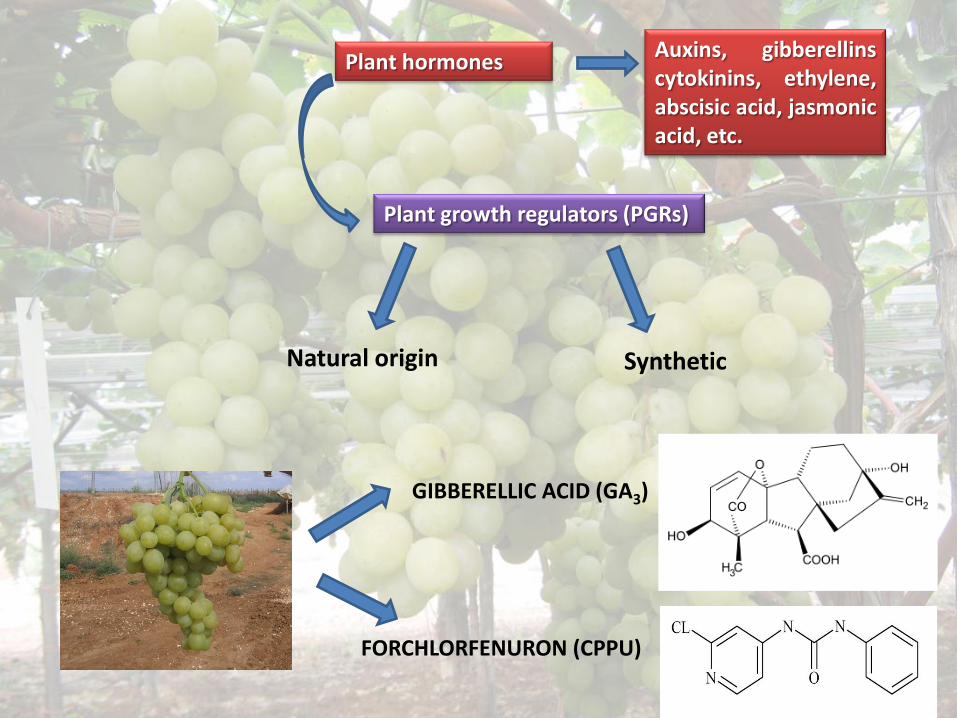
Plant hormones
Plant growth regulators (PGRs)
GIBBERELLIC ACID (GA3)
FORCHLORFENURON (CPPU)
Auxins, gibberellins cytokinins, ethylene, abscisic acid, jasmonic acid, etc.
Natural origin Synthetic

INCREASE OF RNA SYNTHESIS
INCREASE OF PROETINS SYNTHESIS
STIMULATION OF CELL ELONGATION AND DIVISION
HIGHER SUGAR AND WATER INTAKE INTO THE CELLS
GA3 & table grape
Increase of weight and size of the
berry
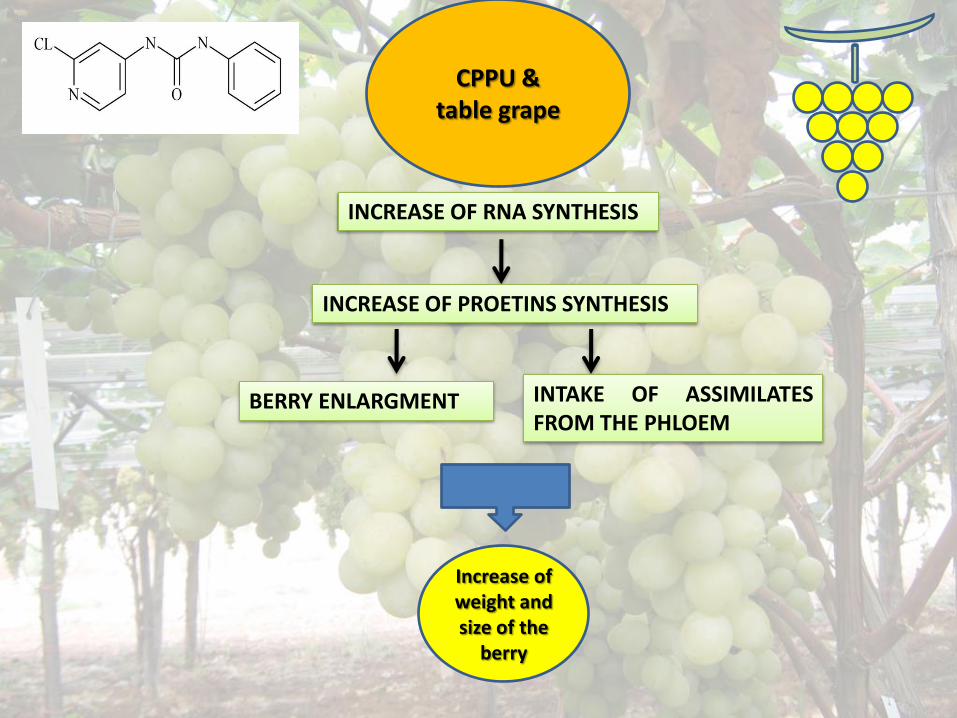
INCREASE OF RNA SYNTHESIS
INCREASE OF PROETINS SYNTHESIS
BERRY ENLARGMENT INTAKE OF ASSIMILATES FROM THE PHLOEM
CPPU & table grape
Increase of weight and size of the
berry

Qualitative parameters
GA3
Morphological analyses
Chemical analyses
GIRDLING
Yield
Metabolomic approach
CPPU
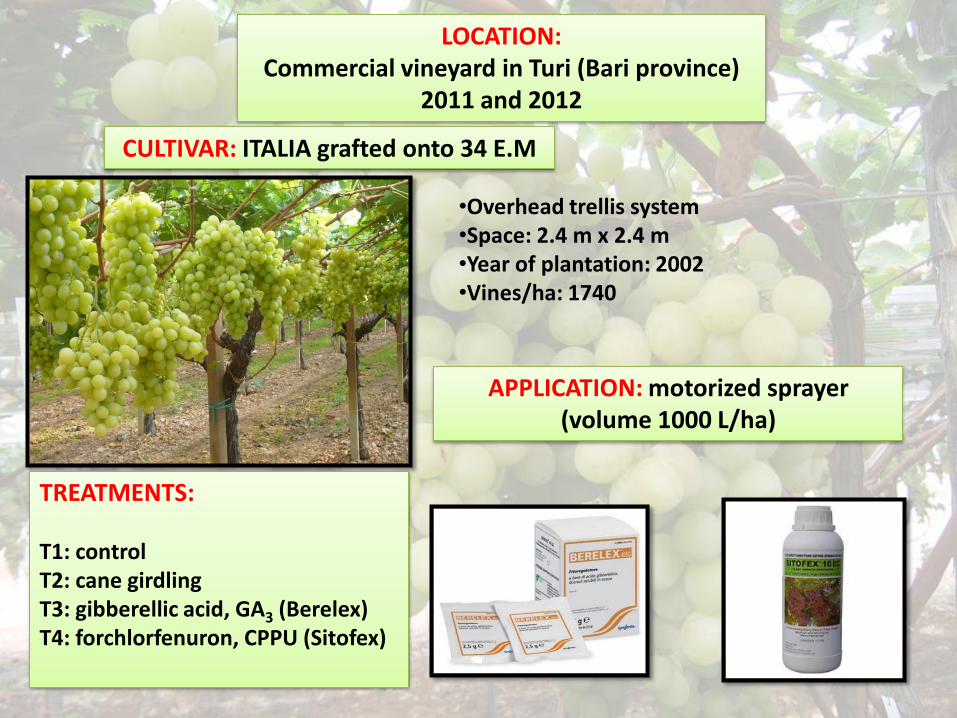
LOCATION: Commercial vineyard in Turi (Bari province)
2011 and 2012
CULTIVAR: ITALIA grafted onto 34 E.M
•Overhead trellis system •Space: 2.4 m x 2.4 m •Year of plantation: 2002 •Vines/ha: 1740
TREATMENTS: T1: control T2: cane girdling T3: gibberellic acid, GA3 (Berelex) T4: forchlorfenuron, CPPU (Sitofex)
APPLICATION: motorized sprayer (volume 1000 L/ha)
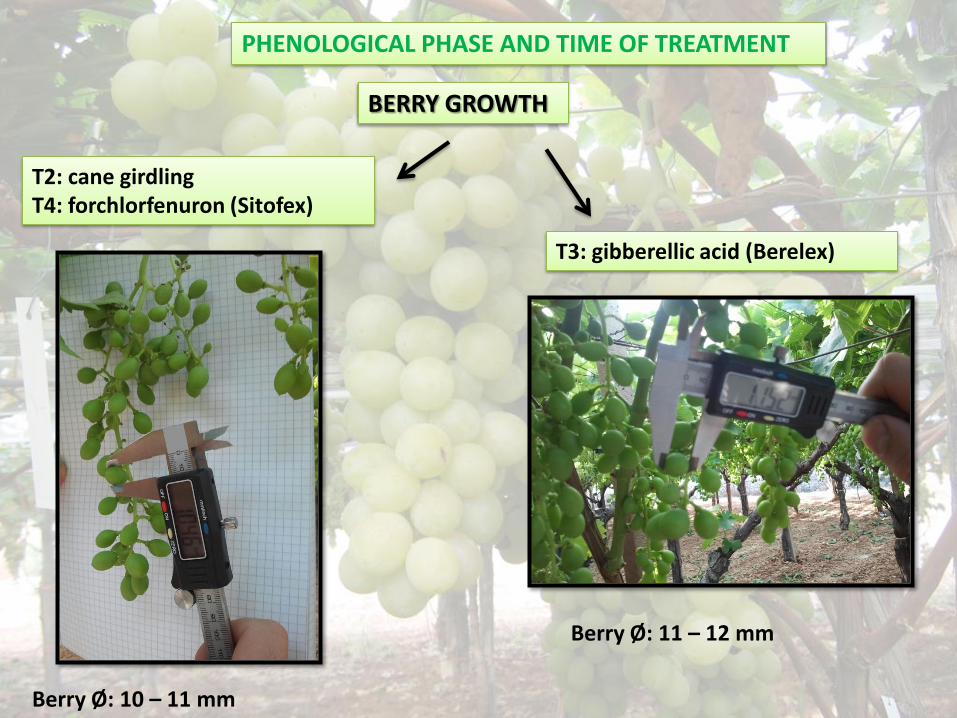
PHENOLOGICAL PHASE AND TIME OF TREATMENT
BERRY GROWTH
Berry Ø: 10 – 11 mm
T2: cane girdling T4: forchlorfenuron (Sitofex)
Berry Ø: 11 – 12 mm
T3: gibberellic acid (Berelex)
T3 T1 T2
T3 T1 T2
T3 T1 T2
T4 T2 T1
T4 T2 T1
T4 T2 T1
T1 T4 T3
T1 T4 T3
T1 T4 T3
T2 T3 T4
T2 T3 T4
T2 T3 T4
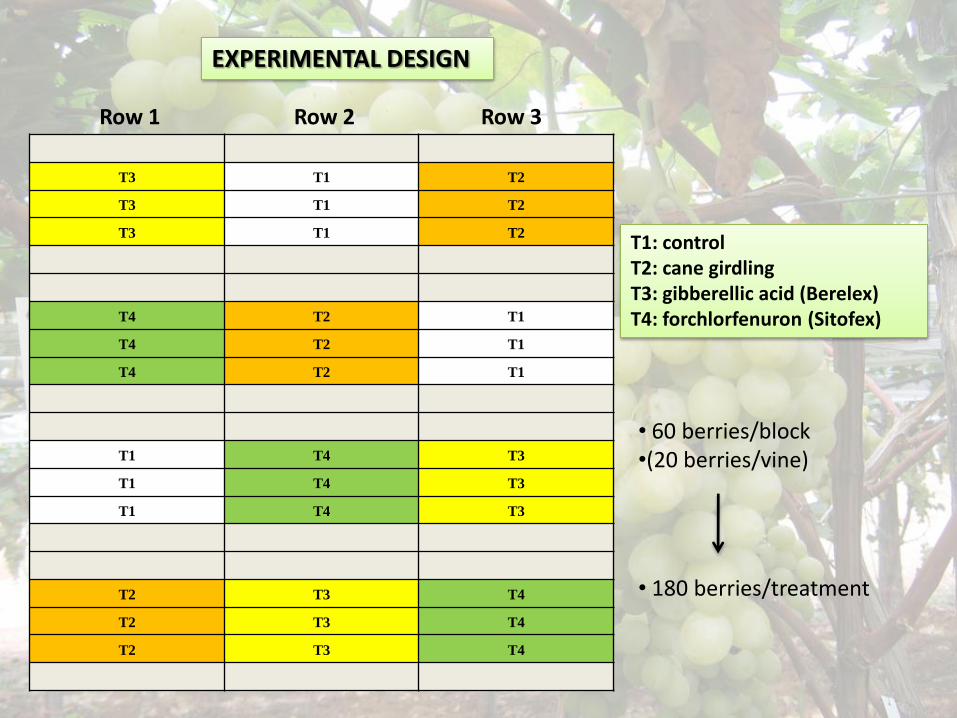
EXPERIMENTAL DESIGN
Row 1 Row 2 Row 3
T1: control T2: cane girdling T3: gibberellic acid (Berelex) T4: forchlorfenuron (Sitofex)
• 60 berries/block •(20 berries/vine)
• 180 berries/treatment
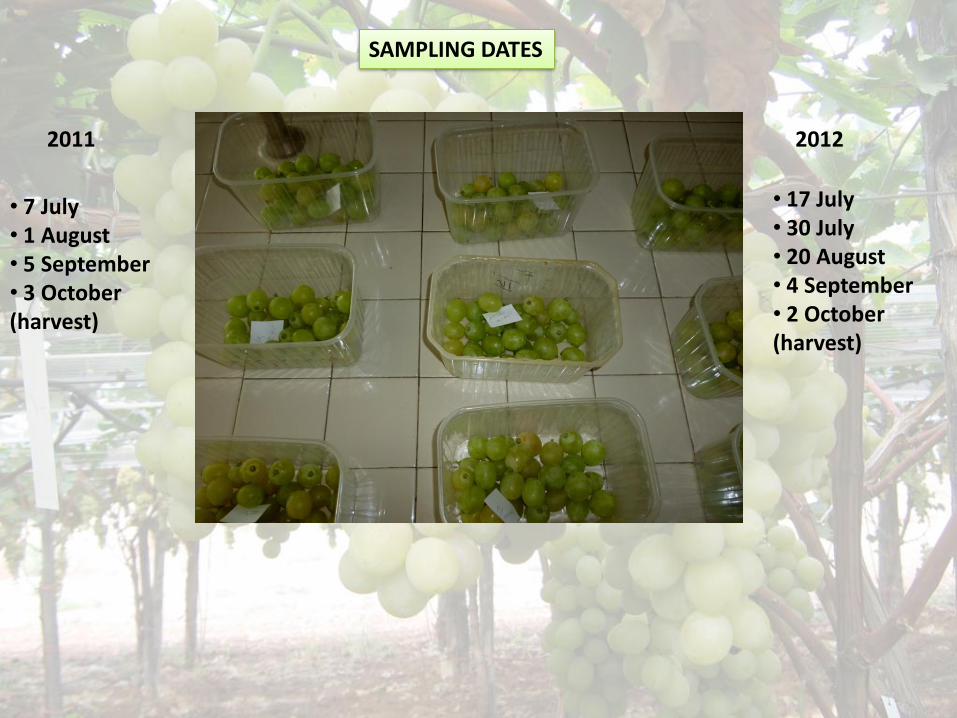
SAMPLING DATES
2011
• 7 July • 1 August • 5 September • 3 October (harvest)
2012
• 17 July • 30 July • 20 August • 4 September • 2 October (harvest)

BERRIES ANALYSES
morphological chemical qualitative
• diameter (mm) • length (mm) • weight (g)
• TSS (° Brix) • pH • TA (g/L tartaric acid)
• firmness (N) • detachment force (N) • colour
metabolomic
•primary metabolites: sugars, organic acids, aminoacids
RESULTS 2011

Size parameters
23.8 b 25.7 a 25.6 a 24.8 ab
28.1 29.5 28.9 29.1
0
5
10
15
20
25
30
35
Control Girdling GA3 CPPU
Size
(m
m)
Diameter Length
10.8 b
12.6 a
12.0 ab
11.1 ab
10
11
12
13
Control Girdling GA3 CPPU
We
igh
t (g
)

Chemical parameters
17.1 a 17.2 a
15.7 b
16.9 ab
14
15
16
17
18
Control Girdling GA3 CPPU
TSS
(°B
rix)
3.87 3.74 3.61 3.75
0
1
2
3
4
5
Control Girdling GA3 CPPU
pH
6.8 a
5.8 b
6.1 b 6.2 b
4
5
6
7
8
Control Girdling GA3 CPPU
TA (
g/L
tart
aric
aci
d)
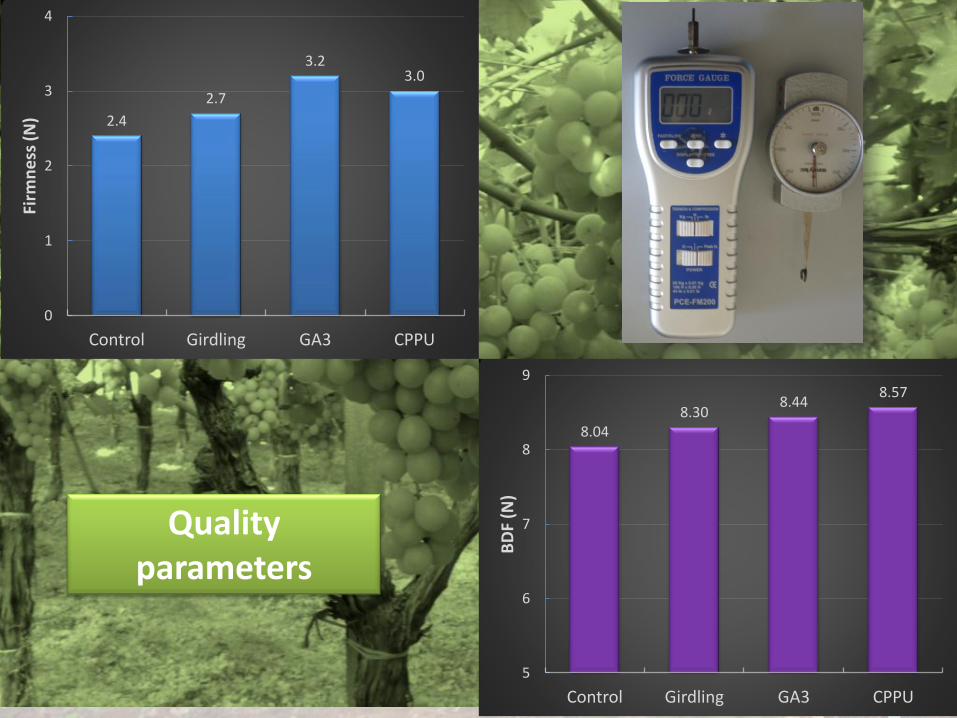
Quality parameters
2.4
2.7
3.2 3.0
0
1
2
3
4
Control Girdling GA3 CPPU
Firm
ne
ss (N
)
8.04 8.30
8.44 8.57
5
6
7
8
9
Control Girdling GA3 CPPU
BD
F (N
)
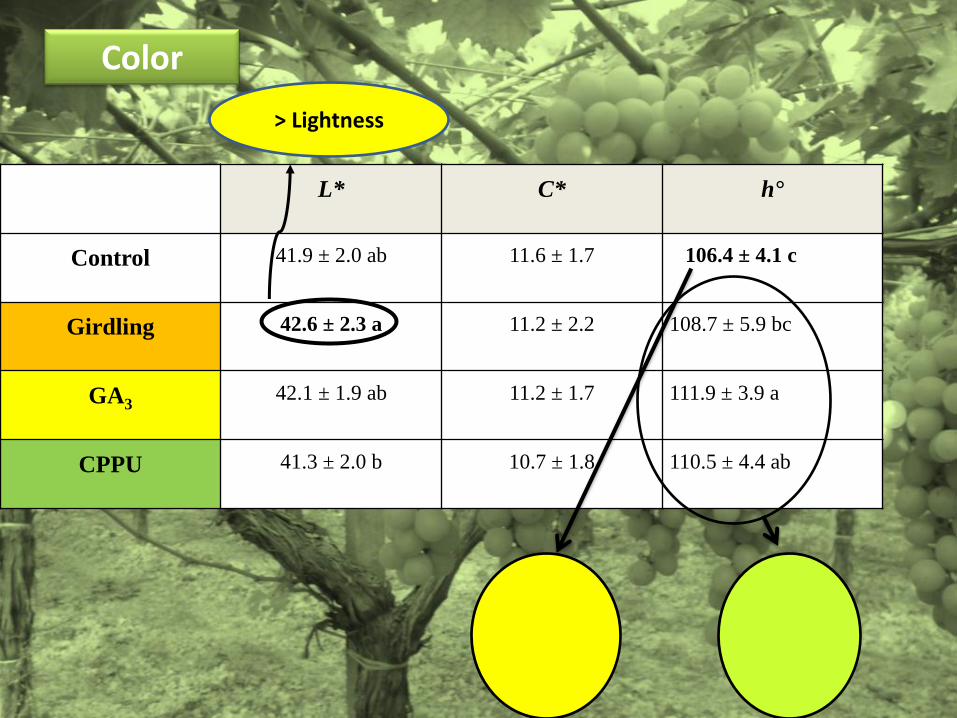
L* C* h°
Control 41.9 ± 2.0 ab 11.6 ± 1.7 106.4 ± 4.1 c
Girdling 42.6 ± 2.3 a 11.2 ± 2.2 108.7 ± 5.9 bc
GA3 42.1 ± 1.9 ab 11.2 ± 1.7 111.9 ± 3.9 a
CPPU 41.3 ± 2.0 b 10.7 ± 1.8 110.5 ± 4.4 ab
Color
> Lightness
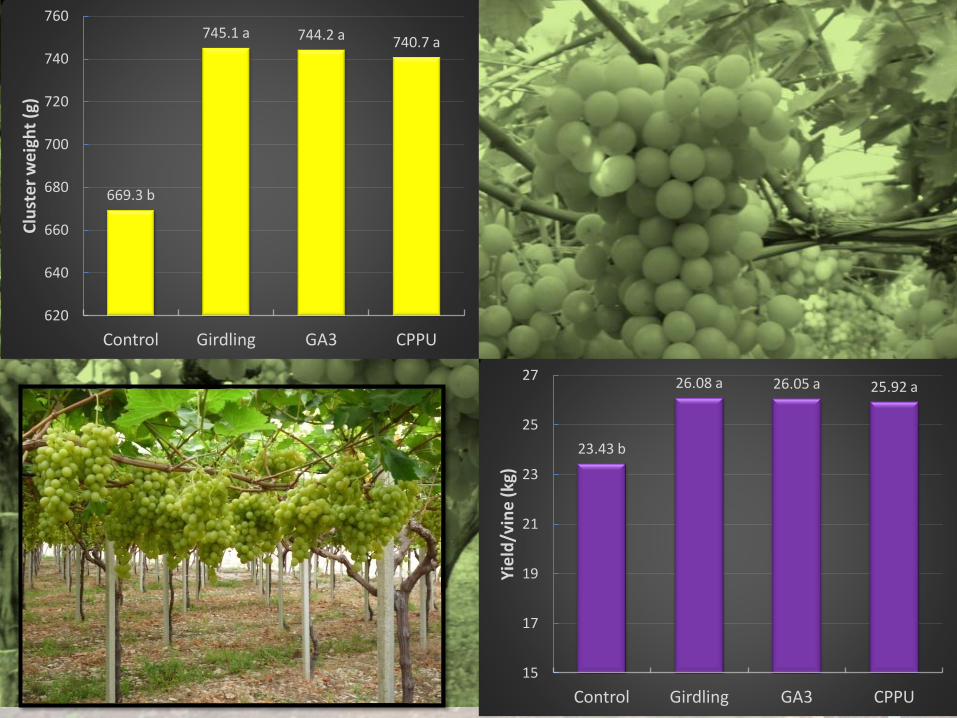
669.3 b
745.1 a 744.2 a 740.7 a
620
640
660
680
700
720
740
760
Control Girdling GA3 CPPU
Clu
ste
r w
eig
ht
(g)
23.43 b
26.08 a 26.05 a 25.92 a
15
17
19
21
23
25
27
Control Girdling GA3 CPPU
Yie
ld/v
ine
(kg
)
Zabadal e Budovc, 2006 Fidan et al., 1994
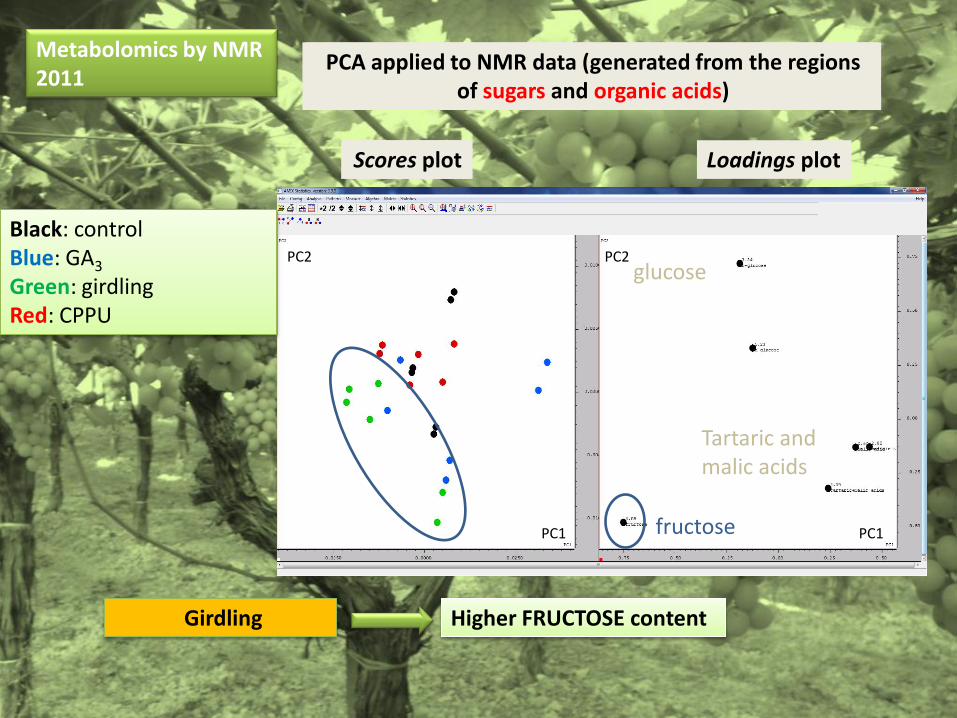
Metabolomics by NMR 2011
PCA applied to NMR data (generated from the regions of sugars and organic acids)
Girdling Higher FRUCTOSE content
Black: control Blue: GA3
Green: girdling Red: CPPU
glucose
Tartaric and malic acids
fructose PC1
PC2
PC1
PC2
Scores plot Loadings plot
PCA applied to NMR data (generated from the regions of sugars and organic acids)
Scores plot
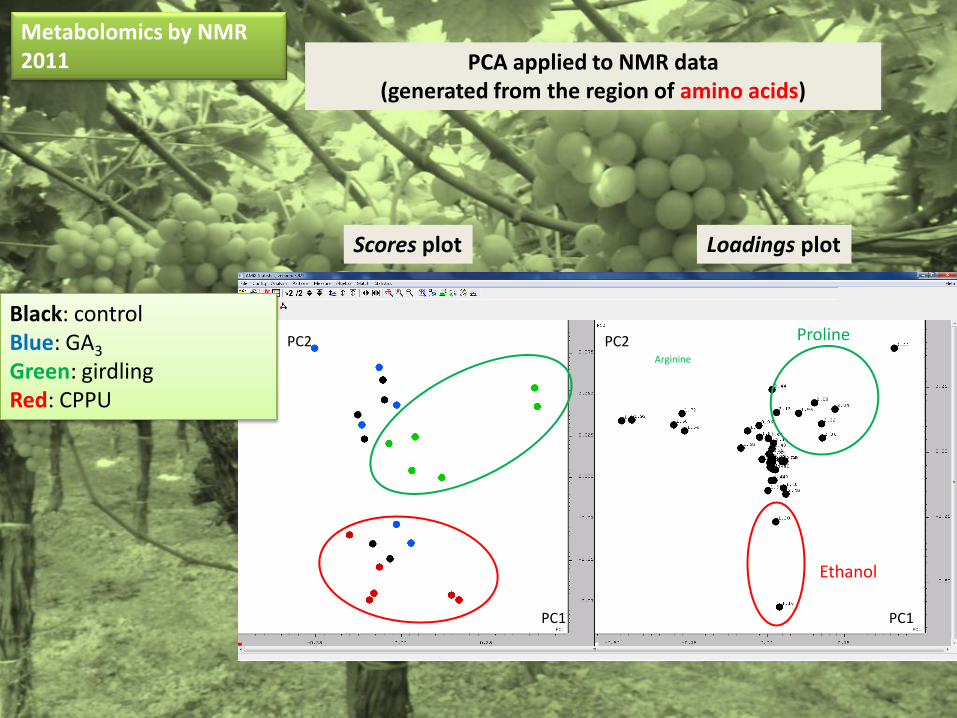
Arginine
Proline
Loadings plot
PCA applied to NMR data (generated from the region of amino acids)
Scores plot
Black: control Blue: GA3
Green: girdling Red: CPPU
PC1
PC2
PC1
PC2
Ethanol
Metabolomics by NMR 2011
RESULTS 2012
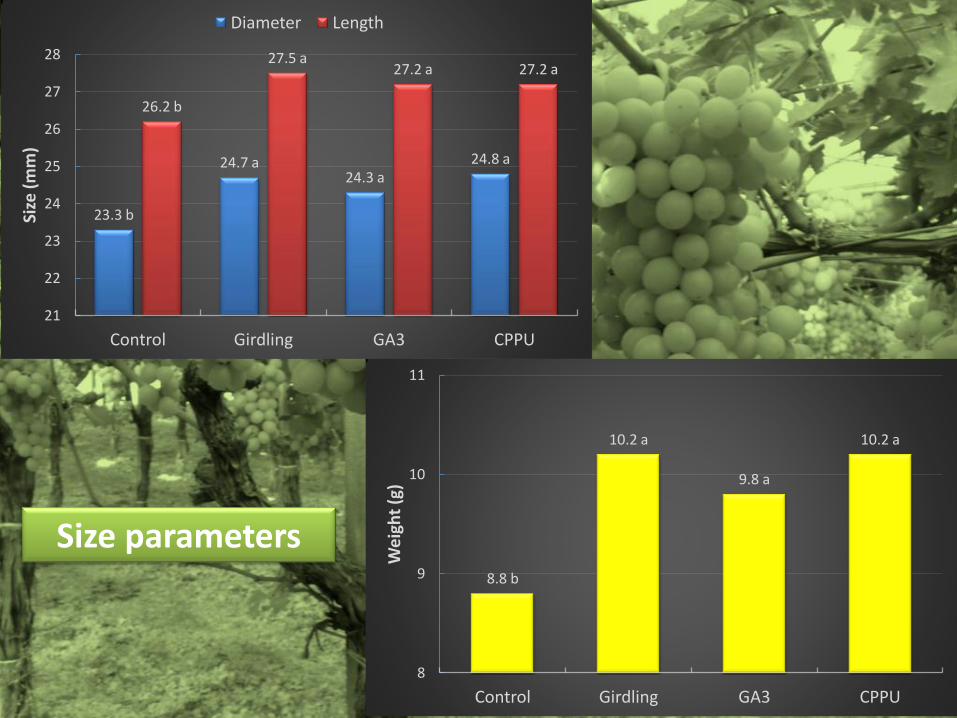
Size parameters
23.3 b
24.7 a 24.3 a
24.8 a
26.2 b
27.5 a 27.2 a 27.2 a
21
22
23
24
25
26
27
28
Control Girdling GA3 CPPU
Size
(m
m)
Diameter Length
8.8 b
10.2 a
9.8 a
10.2 a
8
9
10
11
Control Girdling GA3 CPPU
We
igh
t (g
)
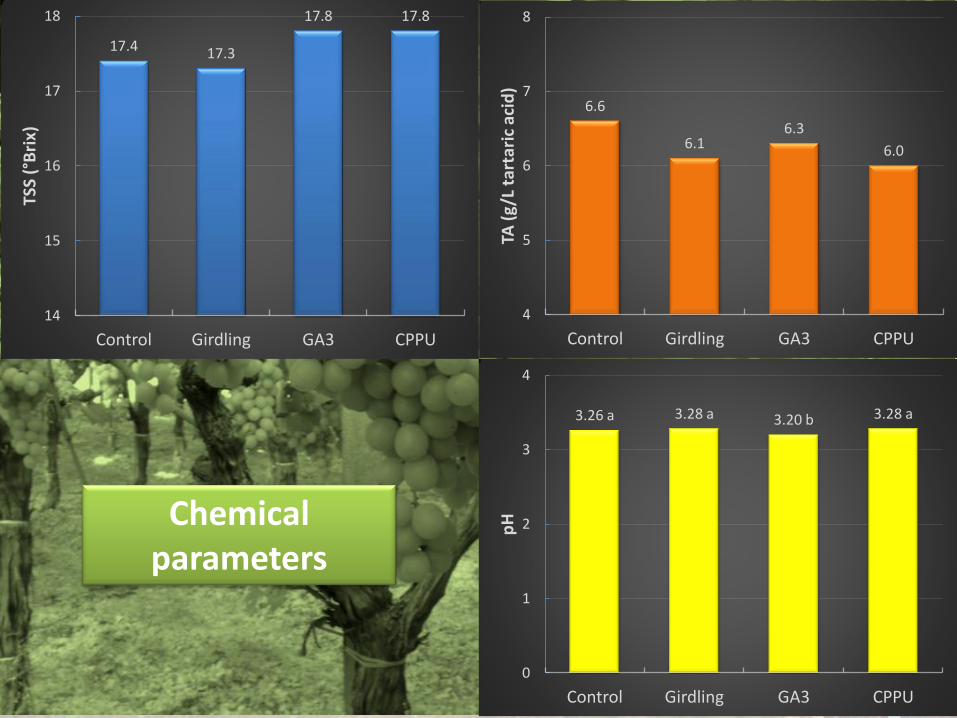
Chemical parameters
17.4 17.3
17.8 17.8
14
15
16
17
18
Control Girdling GA3 CPPU
TSS
(°B
rix)
3.26 a 3.28 a 3.20 b 3.28 a
0
1
2
3
4
Control Girdling GA3 CPPU
pH
6.6
6.1 6.3
6.0
4
5
6
7
8
Control Girdling GA3 CPPU
TA (
g/L
tart
aric
aci
d)
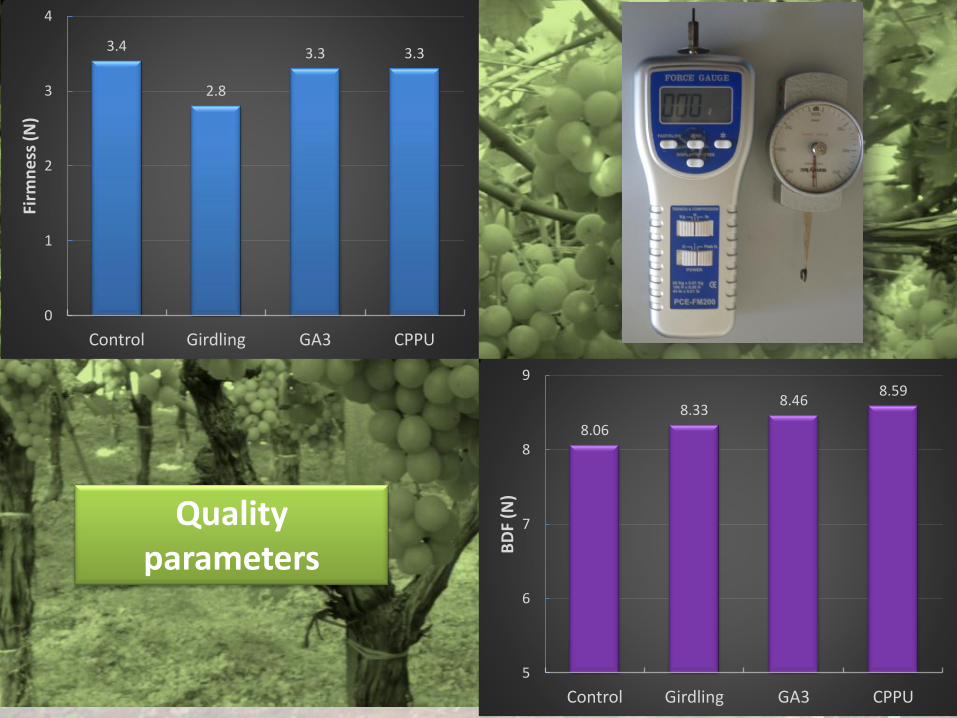
Quality parameters
3.4
2.8
3.3 3.3
0
1
2
3
4
Control Girdling GA3 CPPU
Firm
ne
ss (N
)
8.06
8.33 8.46
8.59
5
6
7
8
9
Control Girdling GA3 CPPU
BD
F (N
)
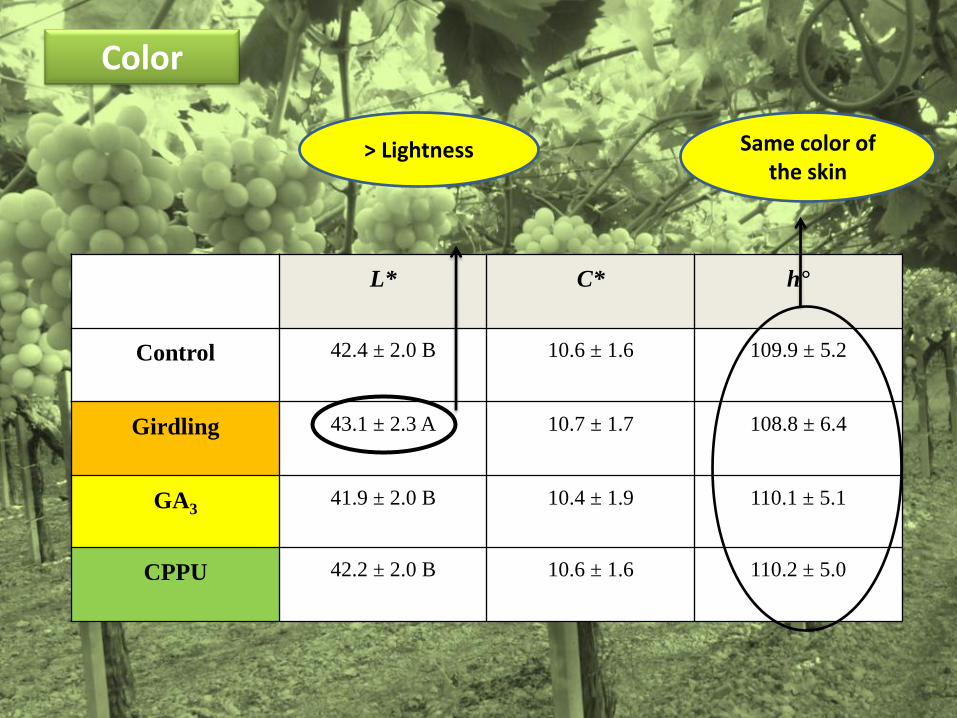
L* C* h°
Control 42.4 ± 2.0 B 10.6 ± 1.6 109.9 ± 5.2
Girdling 43.1 ± 2.3 A 10.7 ± 1.7 108.8 ± 6.4
GA3 41.9 ± 2.0 B 10.4 ± 1.9 110.1 ± 5.1
CPPU 42.2 ± 2.0 B 10.6 ± 1.6 110.2 ± 5.0
> Lightness Same color of the skin
Color
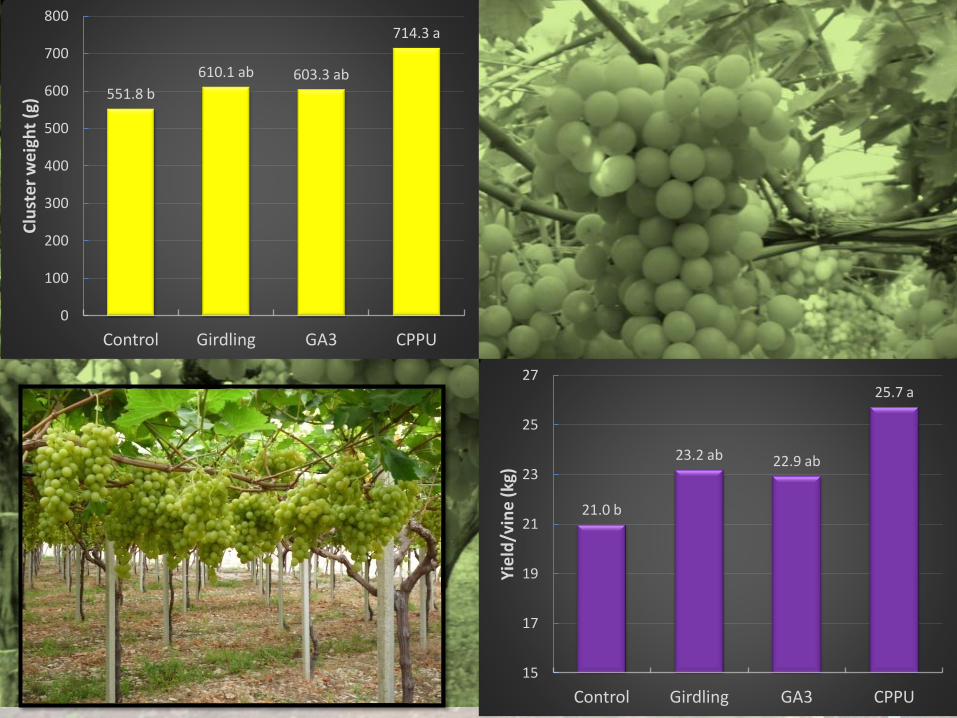
551.8 b
610.1 ab 603.3 ab
714.3 a
0
100
200
300
400
500
600
700
800
Control Girdling GA3 CPPU
Clu
ste
r w
eig
ht
(g)
21.0 b
23.2 ab 22.9 ab
25.7 a
15
17
19
21
23
25
27
Control Girdling GA3 CPPU
Yie
ld/v
ine
(kg
)
Zabadal e Budovc, 2006 Fidan et al., 1994
Girdling
GA3
CPPU
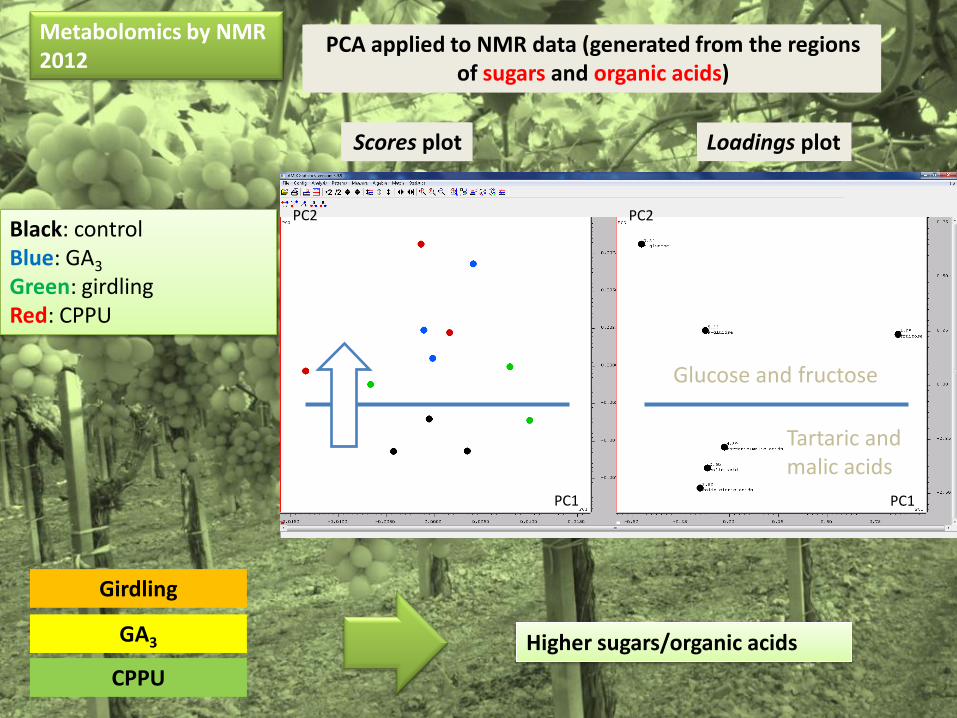
Higher sugars/organic acids
Glucose and fructose
Tartaric and malic acids
Metabolomics by NMR 2012
PCA applied to NMR data (generated from the regions of sugars and organic acids)
Scores plot Loadings plot
PCA applied to NMR data (generated from the regions of sugars and organic acids)
Scores plot
Black: control Blue: GA3
Green: girdling Red: CPPU
PC1
PC2
PC1
PC2
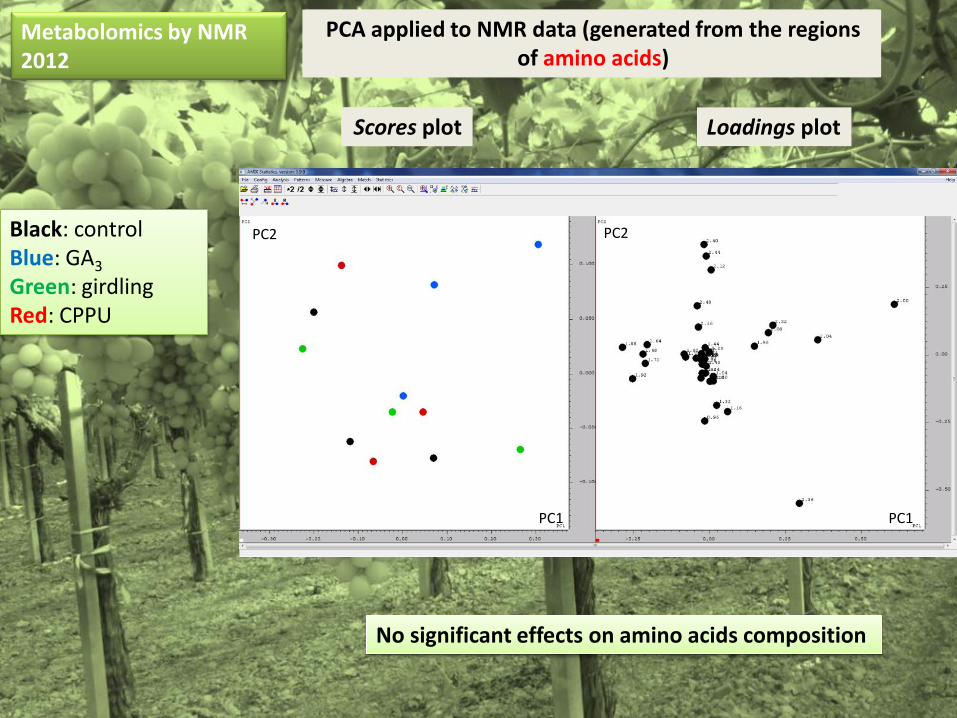
No significant effects on amino acids composition
Metabolomics by NMR 2012
PCA applied to NMR data (generated from the regions of sugars and organic acids)
Scores plot Loadings plot
PCA applied to NMR data (generated from the regions of amino acids)
Scores plot
Black: control Blue: GA3
Green: girdling Red: CPPU
PC1
PC2
PC1
PC2
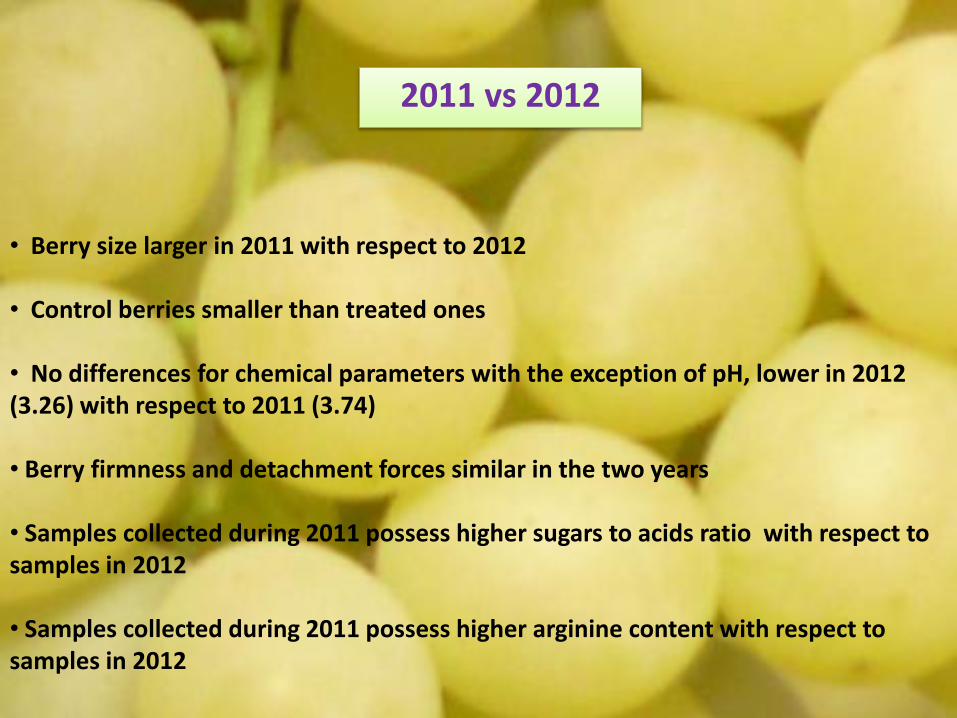
2011 vs 2012
• Berry size larger in 2011 with respect to 2012 • Control berries smaller than treated ones • No differences for chemical parameters with the exception of pH, lower in 2012 (3.26) with respect to 2011 (3.74) • Berry firmness and detachment forces similar in the two years • Samples collected during 2011 possess higher sugars to acids ratio with respect to samples in 2012 • Samples collected during 2011 possess higher arginine content with respect to samples in 2012
CONCLUSIONS
•Girdling and PGRs significantly affected size of the berry and yield/vine •Limited influence on chemical parameters •PGRs affected the color of the berry skin •On the basis of our results and literature, an unappropriated use of PGRs may lead to negative qualitative characteristics •Season is a key factor


![8QLYHUVLWjGHJOL6WXGLGL1DSROL³)HGHULFR,,´ The bosons that arise from the extension of the electroweak interaction are called W0and Z0[27] in analogy to the ones of the SM. The principal](https://static.fdocumenti.com/doc/165x107/60e92b507910cf4ccd72c1c9/8qlyhuvlwjghjol6wxglgl1dsrolhghulfr-the-bosons-that-arise-from-the-extension.jpg)