Fluorine- and Niobium-Doped TiO 2 : Chemical and Spectroscopic...
12
Fluorine- and Niobium-Doped TiO 2 : Chemical and Spectroscopic Properties of Polycrystalline n‑Type-Doped Anatase Jakub Biedrzycki, † Stefano Livraghi, † Elio Giamello,* ,† Stefano Agnoli, ‡ and Gaetano Granozzi ‡ † Dipartimento di Chimica and NIS, Universita ̀ di Torino, Via P. Giuria 7, 10125 Torino, Italy ‡ Dipartimento di Scienze Chimiche, Universita ̀ di Padova, Via Marzolo 1, 35131 Padova, Italy * S Supporting Information ABSTRACT: Doping titanium dioxide (anatase) with elements carrying an extra electron, such as Nb and F, or with their mixtures leads to n-type materials showing peculiar properties with respect to the pristine oxide. Niobium and fluorine are present in the lattice in the form of Nb 5+ and F − ions (detected by XPS), and the extra electrons carried by the dopants are stabilized on titanium ions, which become EPR-visible as Ti 3+ ions homogeneously dispersed in the bulk of the crystals. Under such conditions, the optical band gap transition is slightly red-shifted (by a few tenths of an electronvolt) for all samples containing fluorine, and the Fermi level lies, depending on the material, at the boundary or even in the lower region of the conduction band. The typical Ti 3+ (I) centers generated by valence induction are responsible for the already reported conductivity properties of the system. The presence of these centers also influences the process of electron injection in the solid, favoring the dilution of additional reduced centers in the bulk, thereby leading to a homogeneously reduced material with optoelectronic properties differing from those of reduced anatase. 1. INTRODUCTION Titanium dioxide is one of the most investigated metal oxides. The importance of this abundant, inexpensive, and nontoxic material is certainly due to its large-scale applications as a white pigment. However, a great deal of the scientific investigations concerning this oxide are essentially due to the exciting applications related to its photochemical and photophysical properties. This explains the exponential growth in studies on both bare and modified TiO 2 appearing in the literature in the past 20 years. 1,2 Titanium dioxide (or titania) is the most important photocatalyst, active in several reactions for pollutant abatement, 3 and since the discovery of water photosplitting in 1972, 4 it can also be considered as a system of interest for photochemical and photoelectrochemical applications in energetics (artificial photosynthesis). Furthermore, titanium dioxide is employed as a biocide, 5 in odor control, 6 and in the preparation of self-cleaning surfaces and superhydrophilic antifogging layers. 7 The use of titanium dioxide in photovoltaics is also extremely important. In dye-sensitized solar cells (DSSCs), 8 in fact, TiO 2 plays the roles of acceptor of electrons from the dye excited state and carrier of electrons toward the electric contact. The main polymorphs of titanium dioxide are rutile and anatase. The former phase is more stable than the latter, whereas the latter is more effective in terms of photochemical applications. In parallel with the growth of titanium dioxide applications, intense activity began to focus on the preparation of modified forms of the solid in an effort to tune some of its specific physical properties. This is the case for the inclusion of either transition-metal or nonmetal impurities in the lattice to modify the optical absorption of the system. One of the goals of this activity, although not the only one, is to reduce the optical absorption threshold of the oxide, whose band gap is around 3.2 eV for the anatase polymorph (corresponding to a UV photon), and to make it photosensitive to visible light. 1,9−11 Among the various types of nonmetal doping of TiO 2 , that with fluoride ions assumes a particular role. About 10 years ago, it was reported that the inclusion of fluoride ions in the oxide matrix improves the photocatalytic performance of the bare oxide in the mineralization of various organic pollutants using either UV 12 or visible 13 light. To obtain fluorine-doped titania, fluoride ions are usually introduced in the liquid medium for the preparation of the oxide through hydrolysis (for instance, by the frequently used sol−gel technique). A fraction of the F − ions is included in the lattice such that they substitute O 2− anions. An investigation by some of us, based on electron paramagnetic resonance (EPR) spectroscopy 14 of F-doped anatase TiO 2 (hereafter F−TiO 2 ) prepared by the sol−gel method, clarified that paramagnetic Ti 3+ ions are present in the solid. This occurs because at least a fraction of the excess electrons introduced by fluorine are localized by lattice Ti 4+ cations. The presence of reduced Ti 3+ centers in the as- prepared, fully oxidized solid indicates that the F−TiO 2 system can be described in terms of an n-type semiconductor. It is worth noting that pristine titanium dioxide (belonging to the class of reducible oxides because it easily loses oxygen) also Received: February 3, 2014 Revised: April 1, 2014 Published: April 1, 2014 Article pubs.acs.org/JPCC © 2014 American Chemical Society 8462 dx.doi.org/10.1021/jp501203h | J. Phys. Chem. C 2014, 118, 8462−8473
Transcript of Fluorine- and Niobium-Doped TiO 2 : Chemical and Spectroscopic...

Fluorine- and Niobium-Doped TiO2: Chemical and SpectroscopicProperties of Polycrystalline n‑Type-Doped AnataseJakub Biedrzycki,† Stefano Livraghi,† Elio Giamello,*,† Stefano Agnoli,‡ and Gaetano Granozzi‡
†Dipartimento di Chimica and NIS, Universita di Torino, Via P. Giuria 7, 10125 Torino, Italy‡Dipartimento di Scienze Chimiche, Universita di Padova, Via Marzolo 1, 35131 Padova, Italy
*S Supporting Information
ABSTRACT: Doping titanium dioxide (anatase) with elements carrying an extra electron,such as Nb and F, or with their mixtures leads to n-type materials showing peculiarproperties with respect to the pristine oxide. Niobium and fluorine are present in the latticein the form of Nb5+ and F− ions (detected by XPS), and the extra electrons carried by thedopants are stabilized on titanium ions, which become EPR-visible as Ti3+ ionshomogeneously dispersed in the bulk of the crystals. Under such conditions, the opticalband gap transition is slightly red-shifted (by a few tenths of an electronvolt) for all samplescontaining fluorine, and the Fermi level lies, depending on the material, at the boundary oreven in the lower region of the conduction band. The typical Ti3+(I) centers generated byvalence induction are responsible for the already reported conductivity properties of thesystem. The presence of these centers also influences the process of electron injection in thesolid, favoring the dilution of additional reduced centers in the bulk, thereby leading to ahomogeneously reduced material with optoelectronic properties differing from those ofreduced anatase.
1. INTRODUCTION
Titanium dioxide is one of the most investigated metal oxides.The importance of this abundant, inexpensive, and nontoxicmaterial is certainly due to its large-scale applications as a whitepigment. However, a great deal of the scientific investigationsconcerning this oxide are essentially due to the excitingapplications related to its photochemical and photophysicalproperties. This explains the exponential growth in studies onboth bare and modified TiO2 appearing in the literature in thepast 20 years.1,2 Titanium dioxide (or titania) is the mostimportant photocatalyst, active in several reactions for pollutantabatement,3 and since the discovery of water photosplitting in1972,4 it can also be considered as a system of interest forphotochemical and photoelectrochemical applications inenergetics (artificial photosynthesis). Furthermore, titaniumdioxide is employed as a biocide,5 in odor control,6 and in thepreparation of self-cleaning surfaces and superhydrophilicantifogging layers.7 The use of titanium dioxide in photovoltaicsis also extremely important. In dye-sensitized solar cells(DSSCs),8 in fact, TiO2 plays the roles of acceptor of electronsfrom the dye excited state and carrier of electrons toward theelectric contact.The main polymorphs of titanium dioxide are rutile and
anatase. The former phase is more stable than the latter,whereas the latter is more effective in terms of photochemicalapplications. In parallel with the growth of titanium dioxideapplications, intense activity began to focus on the preparationof modified forms of the solid in an effort to tune some of itsspecific physical properties. This is the case for the inclusion ofeither transition-metal or nonmetal impurities in the lattice to
modify the optical absorption of the system. One of the goals ofthis activity, although not the only one, is to reduce the opticalabsorption threshold of the oxide, whose band gap is around3.2 eV for the anatase polymorph (corresponding to a UVphoton), and to make it photosensitive to visible light.1,9−11
Among the various types of nonmetal doping of TiO2, thatwith fluoride ions assumes a particular role. About 10 years ago,it was reported that the inclusion of fluoride ions in the oxidematrix improves the photocatalytic performance of the bareoxide in the mineralization of various organic pollutants usingeither UV12 or visible13 light. To obtain fluorine-doped titania,fluoride ions are usually introduced in the liquid medium forthe preparation of the oxide through hydrolysis (for instance,by the frequently used sol−gel technique). A fraction of the F−
ions is included in the lattice such that they substitute O2−
anions. An investigation by some of us, based on electronparamagnetic resonance (EPR) spectroscopy14 of F-dopedanatase TiO2 (hereafter F−TiO2) prepared by the sol−gelmethod, clarified that paramagnetic Ti3+ ions are present in thesolid. This occurs because at least a fraction of the excesselectrons introduced by fluorine are localized by latticeTi4+cations. The presence of reduced Ti3+ centers in the as-prepared, fully oxidized solid indicates that the F−TiO2 systemcan be described in terms of an n-type semiconductor. It isworth noting that pristine titanium dioxide (belonging to theclass of reducible oxides because it easily loses oxygen) also
Received: February 3, 2014Revised: April 1, 2014Published: April 1, 2014
Article
pubs.acs.org/JPCC
© 2014 American Chemical Society 8462 dx.doi.org/10.1021/jp501203h | J. Phys. Chem. C 2014, 118, 8462−8473

becomes an n-type system when annealed under a vacuum, as aresult of oxygen depletion, formation of anion vacancies, andexcess electron stabilization (Ti3+). Fully oxidized, undefectiveTiO2 and F−TiO2 thus differ because the latter is, intrinsically,an n-type semiconducting system, as indicated by earlyinvestigations pointing to the electronic and photoelectricproperties of F-doped rutile TiO2.
15,16
The same electronic effect described for F−TiO2 is observedwhen the tetravalent Ti of anatase is substituted by apentavalent element such as Nb or Sb. Also in this case, theextra electron introduced by the dopant is expected17 to localizeon the titanium ions, producing Ti3+. The formation of latticetrivalent titanium ions has been monitored directly by EPRspectroscopy for Nb−TiO2 (anatase),
18−20 The interest in Nb-doped titania has recently increased because of the search fornew transparent conducting oxides (TCOs) for use inoptoelectronic devices21−23 and, in particular, in DSSCs topromote charge transport within the transparent oxide layerusually constituted by bare TiO2.
24−26 It is worth mentioningthat, in the case of Nb−TiO2, the described valence inductioneffect (i.e., formation of Nb5+ and Ti3+) holds for the anatasepolymorph, whereas in rutile doped with niobium, the extraelectron remains on the dopant atom, as indicated by thepresence of Nb4+ ions, which were detected both by EPRspectroscopy at low temperature for Nb−TiO2 rutile singlecrystals27,28 and by X-ray photoelectron spectroscopy (XPS)measurements.29
In the present article, we report a detailed study of thechemical and spectroscopic properties of n-type dopedpolycrystalline anatase performed with the joint use of opticalspectroscopy (DR UV−vis−NIR), photoelectron spectros-copies, and electron paramagnetic resonance (EPR) spectros-copy. The materials under investigation included both singlydoped (F−TiO2 and Nb−TiO2) and codoped (F,Nb) systems.Our investigation started with two main goals. The first one wasto explore band gap modifications of TiO2 depending on thetype of dopant. The second goal was that of examining thebehavior of the doped materials upon addition of further excesselectrons (by direct injection or reduction) in comparison withthe behavior of pristine TiO2. The presence and mobility ofexcess electrons are essential in photochemical applications ofsolids such as photocatalysis and dye-sensitized solar cells. Asimilar approach induced Wold and co-workers,15 more than 30years ago, to investigate the photoconduction of fluorinatedrutile crystals, which showed significantly higher conductivitythan reduced rutile. More recently, studies on Nb-dopedanatase have shown similar conductivity increments.24,25
2. EXPERIMENTAL SECTION
2.1. Sample Preparation. The TiO2 sample was preparedby the sol−gel process using titanium isopropoxide as the Tiprecursor, as reported in a previous work.20 Doped sampleswere prepared as described in the following subsections.
2.1.1. F−TiO2. This set of samples was prepared by the sol−gel method using hydrofluoric acid solution as the hydrolyzingagent. In a typical preparation, 7.5 mL of titanium isopropoxidewas diluted in 7.5 mL of 2-propanol, and the obtained mixturewas hydrolyzed with 4 mL of HF solution of differentconcentrations to obtain nominal F/Ti ratios of 0.01, 0.90,1.80, 3.50, 5.50, and 7.00. The formed solid was dried at 340 Kand finally calcined at 770 K (heating rate of 10 K/min) for 1 hto obtain a fully oxidized material and to eliminate allcontaminants left from the synthesis. Higher temperatureswere not used to limit fluorine loss.30 This set of samples islabeled F1−F6 in order of increasing F/Ti ratio. For the sake ofbrevity, only data related to F2 are reported here. The datarelated to the remaining samples are provided in theSupporting Information.
2.1.2. Nb−TiO2. This sample was prepared by the sol−gelprocess. An appropriate amount of NbCl5, to obtain a nominaldoping of 5% (Nb/Ti = 0.05), was added to 7.5 mL of 2-propanol, and the mixture was stirred at room temperatureuntil the NbCl5 was completely dissolved. Then, 7.5 mL oftitanium isopropoxide was added. The final solution washydrolyzed with 4 mL of H2O. The obtained solid was dried at340 K and finally calcined at 770 K (heating rate of 10 K/min)for 1 h to obtain a fully oxidized material and to eliminate allcontaminants left from the synthesis. Higher temperature werenot used to avoid anatase-to-rutile phase conversion. Thissample is denoted as Nb1.
2.1.3. F−Nb−TiO2 (Codoped Samples). This set of sampleswas prepared as follows: A solution containing the cations (Nb,Ti) was prepared as in the previous case and then hydrolyzedwith solutions of hydrofluoric acid having different concen-trations to obtain nominal F/Ti ratios of 0.05, 0.15, 0.25, 0.35,and 0.45. The obtained solids were dried at 340 K and finallycalcined at 970 K (heating rate of 10 K/min) for 1 h. In thiscase, a higher calcination temperature was employed becausefluorine (although partially expelled from the solid under theseconditions) stabilizes the anatase phase, reducing theconversion to rutile and allowing materials with highcrystallinity to be obtained.These samples are labeled NbF05, NbF15, NbF25, NbF35,
and NbF45 according to their F/Ti ratios (Table 1). Anadditional sample labeled NbF25a was prepared using H2O as ahydrolyzing agent and NbF5 as a source of both Nb and F. For
Table 1. Abbreviations Used for the Samples in the Present Work and Corresponding Compositional, Structural, and OpticalProperties
phasea,b (w/w %)
sample abbreviation Nb/Ti nominal Nb/Ti XRF F/Ti nominal calcination temp (K) A R B crystal sizec (nm) band gap, Eg (eV)
TiO2 0 0 0 770 100 0 0 30 3.20F2 0 − 0.90 770 100 0 0 30 3.20Nb1 0.05 0.05 0 770 55 10 35 12 2.91NbF25 0.05 0.05 0.25 970 98 2 0 21 3.03NbF35 0.05 0.05 0.35 970 100 0 0 24 3.08NbF45 0.05 0.06 0.45 970 100 0 0 32 3.11NbF25a 0.05 0.05 0.25 970 100 0 0 23 3.18
aA = anatase, R = rutile, B = brookite. bData obtained by Rietveld refinement using the MAUD program. cData apply to the anatase polymorph only.
The Journal of Physical Chemistry C Article
dx.doi.org/10.1021/jp501203h | J. Phys. Chem. C 2014, 118, 8462−84738463

the sake of brevity, only data related to samples NbF25, NbF35,NbF45, and NbF25a are reported herein. The data related tothe remaining samples are provided in the SupportingInformation.Table 1 summarizes the main features and abbreviations for
the samples reported in this work. Because of the loss offluorine that occurs progressively during the various reductivetreatments, the evaluation by chemical analysis of the initial F/Ti ratio is substantially insignificant and was therefore notperformed.2.2. Structural and Spectroscopic Characterization of
the Materials. X-ray diffraction (XRD) patterns werecollected on a Phillips PW1830 diffractometer using Co Kαradiation. Diffraction peaks were indexed according to theInorganic Crystal Structure Database (ICSD). The crystallitesizes of the various investigated materials were obtained byemploying the Debye−Scherrer equation. Phase compositionwas determined by refining the obtained data by the Rietveldmethod using the MAUD program.31
Photoemission data were acquired in a custom-designedultrahigh-vacuum (UHV) system equipped with a VG MK IIEscalab electron analyzer, working at a base pressure of 10−10
mbar. Core-level photoemission spectra were recorded at roomtemperature in normal emission using a nonmonochromatizedAl/Mg twin-anode X-ray source, whereas for valence-band data,we used a He discharge lamp (Omicron HIS 15). Powdersamples were suspended in bidistilled water and drop casted onhigh-purity copper foils. After being allowed to dry in air, theobtained films were introduced into the ultrahigh-vacuumsystem, outgassed overnight, and finally annealed in UHV for20 min at 650 K. The charging observed during measurementsof some samples was corrected using the adventitious carbon asan internal reference. The energy was calibrated using a goldsample (Au 4f at 84 eV)Elemental analysis was performed by means of X-ray
fluorescence (XRF) spectroscopy. The samples were analyzedusing an EDAX Eagle III energy-dispersive micro-XRF (μXRF)spectrometer equipped with a Rh X-ray tube and a polycapillarywith a circular area of nominally 30-μm diameter. Datacollection occurred at each point for a 250-s detector livetime, with X-ray tube settings adjusted for 30% dead time.
Diffuse-reflectance ultraviolet−visible−near-infrared (DRUV−vis−NIR) spectroscopy was employed to characterizethe absorption features over a range of wavelengths (250−2500nm). These measurements were performed on fine powders ofthe samples in a cell with optical quartz walls. The spectra werecollected in reflectance mode with a Perkin-Elmer Cary 5000instrument equipped with an integrating sphere and thenreported as an absorbance-like pattern by means of theKubelka−Munk function. Optical band gap absorption wasobtained by means of a Tauc plot of the Kubelka−Munkabsorption as a function of the photon energy.Electron paramagnetic resonance (EPR) spectra were
obtained using an X-band continuous-wave- (CW-) EPRBruker EMX spectrometer equipped with a cylindrical cavityoperating at 100 kHz field modulation. The measurementswere carried out at 77 K in cells that can be connected to aconventional high-vacuum apparatus (residual pressure < 10−4
mbar).
3. RESULTS AND DISCUSSION
3.1. Composition and Structural Features of Fluorine-and Niobium-Doped Titanium Dioxide. In the presentarticle, we report results concerning two singly doped (with Fand Nb) titania samples and four codoped materials. A sampleof bare anatase (TiO2) prepared by the same procedure(section 2) was used for comparison. Results on a widercollection of doped and codoped samples are available in theSupporting Information. Table 1 presents some basic featuresof the samples examined here. The atomic ratios between theanionic dopant (F−) and titanium are relative to thecomposition of the liquid phase prior to gelification and donot represent the actual composition of the solid,14,30 because itis known that a fraction of fluorine is eliminated from the solidduring the final calcination of the materials. The four codopedsolids were prepared using a constant Nb concentration (Nb/Ti = 0.05) and a varying concentration of fluorine. For thecationic dopant, the μXRF analysis showed a goodcorrespondence between the nominal and final Nb/Ti contentsfor all Nb-containing samples (see Table 1).Figure 1 shows the XRD plot of all of the samples described
in Table 1. Anatase is the unique phase in all samples except forNb1 (Nb−TiO2, Figure 1c), which shows the presence of rutile
Figure 1. XRD patterns of TiO2-based materials: (a) TiO2, (b) F2, (c) Nb1, (d) NbF25, (e) NbF35, (f) NbF45, (g) NbF25a. The barscorresponding to TiO2-A, TiO2-R, and TiO2-B indicate the diffraction peaks of the anatase, rutile, and brookite polymorphs, respectively.
The Journal of Physical Chemistry C Article
dx.doi.org/10.1021/jp501203h | J. Phys. Chem. C 2014, 118, 8462−84738464

and brookite, and the low-fluorine-content NbF25, whichexhibits traces of rutile (Figure 1d). It is known, in fact, that thepresence of fluorine allows the formation of a highly crystallineanatase phase. This state is achieved because F, inhibiting theanatase-to-rutile transition, allows relatively high temperaturesof calcination to be reached. At these temperatures, a betterquality of anatase crystals is obtained. This latter factor hasbeen invoked as the reason for the good photocatalyticperformances of fluorine-doped anatase powders.30 Thesolubility of fluorine in TiO2 is limited by two factors, however.The first is the mentioned elimination of this element duringcalcination, and the second is the formation of an extra phaseamenable to TiOF2 occurring for high fluorine concentrations
13
(see Supporting Information, Figure SI-1).The behavior of niobium is different from that of fluorine
because Nb ions can be incorporated into TiO2 at a wider rangeof concentrations.32 The presence of niobium, however, doesnot completely suppress the formation of rutile even atrelatively low calcination temperatures. The Nb−TiO2 sample(Nb1, Table 1 and Figure 1c) in fact contains about 10% w/wof rutile after calcination at 773 K.To obtain single-phase (anatase) materials, the drawbacks of
the two single-doping procedures can be overcome usingcodoping with the two elements. Niobium is not removed athigh temperature, ensuring a certain degree of n-doping, andthe presence of fluorine stabilizes the anatase polymorph.3.2. Optical Properties of (Oxidized) n-Type Doped
TiO2. The optical properties of the various doped and codopedTiO2 samples are illustrated in Figure 2 by DR UV−vis spectra.
All of the spectra are dominated by a strong absorption in theUV region due to the transition from the valence band to theconduction band, although the absorption threshold changes inthe case of the doped systems.Except for NbF25a, which was prepared by a different
procedure and showed an absorption edge that was basicallycoincident with that observed for pure TiO2, all samplesshowed a red shift of a few tenths of an electronvolt withrespect to the absorption threshold of bare TiO2. The Nb−TiO2 (Nb1) sample exhibited a larger red shift, and the materialshowed a yellowish color (Figure 2, black line). This sample,however, was the only one containing appreciable amounts ofthe other two TiO2 polymorphs (Table 1), namely, brookite(with a band gap similar to that of anatase33) and rutile, whichhas a smaller band gap than anatase. In the majority of cases of
Nb-doped titania reported in the literature, however, a blueshift of the band gap edge was observed, which was explained interms of the Burstein−Moss effect.18,24,25,34−36 This effect isbased on the filling of the conduction band by extra electronsthat suppresses absorption at the band edge. Nevertheless, insome other cases, a red shift, as in the present work, has beenreported for Nb−TiO2.
37−41 There are also examples in whichno change in the optical spectra was observed.42,43 Anunambiguous interpretation of the red shift is not present inthe literature. Some authors have explained this experimentalevidence by invoking the presence of Nb2O5 microaggregates inthe TiO2 matrix.
38 Even though there is no trace of niobiumoxides in XRD patterns of our samples (Figure 1) (which couldbe due to quantitative limits of the technique or to the presenceof amorphous fractions), the fact remains that the Burstein−Moss effect does not occur in Nb-doped and Nb−F-codopedmaterials prepared by the sol−gel method, for which a red shiftof the absorption edge was systematically observed.In the spectroscopic range between 450 and 650 nm, the
spectral lines are flat for all samples, and there is no evidence ofabsorption in the visible range. The same occurs in the IRregion until 2500 nm (vide infra). This result differs from whathas been reported in some case for Nb-doped titania, such as inthe recent article by De Trizio et al.,26 who obtained blue-colored materials. This considerable difference is very probablydue to the partially reduced state of their colloidal samples (seesection 3.6 on the optical properties of reduced materials). Asimilar situation was described by Hopper et al.,25 whoprepared Nb−TiO2 suspensions by a hydrothermal reactionand also obtained blue materials that, however, definitelybecame white after treatment at 770 K or long air exposure. Inthe case of the materials described in the present article (havinga relatively low Nb loading), despite the presence of Ti3+
reduced centers revealed by EPR spectroscopy, no opticalabsorption in the visible range occurred, and the samples,except for the pale yellow Nb1 (whose color is due to the bandgap transition tail), were white.
3.3. EPR Spectroscopy of Doped and CodopedMaterials. As recalled in the Introduction, aliovalentsubstitution (F or Nb) implies the presence of excess electronsin the system, which leads to the formation of Ti3+ centers by amechanism of valence induction. These ions are paramagnetic,and the corresponding EPR spectra recorded at 77 K (Figure 3)were conclusively assigned in our previous work to reducedTi3+ centers in regular lattice sites in the bulk of the anataseFigure 2. DR UV−vis spectra: (a) TiO2, (b) Nb1, (c) NbF25, (d)
NbF35, (e) NbF45, (f) NbF25a.
Figure 3. Normalized EPR spectra recorded at 77 K of n-type TiO2:(a) F2, (b) Nb1, and (c) NbF45.
The Journal of Physical Chemistry C Article
dx.doi.org/10.1021/jp501203h | J. Phys. Chem. C 2014, 118, 8462−84738465

matrix.44 For both dopants, the signal is axial and characterizedby g⊥ = 1.992, g∥ = 1.962. The same signal [hereafter Ti3+(I)]was observed in the case of the codoped materials (Figure 3). Itis worth recalling that the samples whose spectra are reportedin Figure 3 were fully oxidized materials (see ExperimentalSection) and that the presence of Ti3+ ions is uniquely due tothe valence induction effect and not to a partial reduction of thesolid (vide infra). These reduced titanium ions were well-dispersed in the solid matrix (relatively narrow line width), andthere was no evidence of appreciable amounts of surfacereduced ions, which have different EPR parameters.20
Summarizing, both F−TiO2 and Nb−TiO2 can be describedas n-type doped oxides (electrically neutral systems containing,with respect to the bare oxide, extra electrons conveyed by thepresence of diluted aliovalent elements). Their formulas, whichcan be written, as a first approximation and on the basis of thevalence induction effect, as Ti4+(1−x)Ti
3+x F−x O2−
(2−x) andTi4+(1−2x)Nb
5+xTi
3+xO
2−2, respectively, point to the stabilization
of the extra electrons on lattice titanium ions as indicated by theEPR spectra, which are the same in the two cases. The codopedsystems can be described by a combination of the two previousformulas. Another compensation mechanism based on theformation of Ti4+ vacancies, which has been proposed based onconductivity measurements,24 cannot in principle be excludedand will be discussed in section 4. The features of the EPRspectra, however, unambiguously indicate that at least a fractionof the dopant (F or Nb) releases excess electrons into the solidproducing donor Ti3+ centers that modify therefore theelectronic structure of the solid itself.3.4. XPS Characterization. To investigate the composi-
tional features and the electronic structure of the doped solids adetailed investigation based on photoelectron spectroscopy wascarried out. In Figure 4 we report the core-level spectra of Ti 2pand Nb 3d: in all samples the Ti 2p3/2 peak maximum iscentered at 459 eV, it is highly symmetric and, despite the EPRevidence reported above, does not show any significantpresence of the shoulder connected to Ti3+ reduced speciesat 457.5 eV. Similarly, the Nb 3d photoemission line shows ahighly symmetric doublet with the maximum centered at 207.5eV, which nicely corresponds to Nb5+ species.26,45 This dopantis therefore present in the systems in its maximum oxidationstate. A small shift at slightly lower binding energy wasobserved for sample Nb1 only. Fluoride dopants were observedin relatively small concentrations, and no impurities other thanC (<0.5%) were detected. A quantitative analysis of the surfaceand subsurface region accessible to X-rays was performed usingtwo sources (Mg and Al) having different penetration depths(Table 2). The intensity of the photoemission spectra wasnormalized using the differential cross sections and asymmetryparameters provided by Yeh and Lindau46 and the inelasticmean free path calculated using the TPP2 algorithm.47 Table 2indicates that the Nb concentrations found in the varioussamples were quite similar, the Nb/Ti ratio being around 0.2,with the only exception being Nb1, for which this value wasaround 0.11. These values, however, are definitely higher thanboth the nominal compositions and the XRF values (Table 1).This difference is due to the fact that XPS, a surface
technique, monitors a limited subsurface region, so that one candetermine that the niobium distribution is not homogeneousand that a gradient of concentration exists from the surface tothe center of the nanocrystals. This fact is confirmed bycomparing the compositional data obtained with the twosources. Nb concentrations, in fact, are systematically higher
with the Mg source (l253.6 eV) than with the Al source(1486.6 eV), which probes deeper layers because of its higherphotoelectron energy. The gradient in the niobium concen-tration seems to be an unavoidable feature of our preparationmethod but should not influence the general behavior of thesolids. For this reason, it will not be discussed further. The XPSdata also indicate an excess of oxygen probably due to thepresence of surface hydroxyl groups and/or chemisorbed waterthat alters the solid stoichiometry at the surface. Residualconcentrations of fluoride ions, ranging from 1% to 9%, weredetected in all samples. Even though the true concentration ofF throughout the whole sample was unknown, these XPSresults corroborate the idea that a fraction of fluorine leaves thesolid during the final thermal treatment. Nonetheless, thepresence of both Nb and residual fluoride ions indicates thatthe prepared materials can be considered as n-type codoped
Figure 4. XPS core-level spectra of (A) Nb 3d and (B) Ti 2p. Samplesfrom top to bottom are Nb1, NbF25, NbE35, NbF45, NbF25a.
Table 2. Compositions of the Various Materials DerivedUsing Mg and Al Sources, Valence-Band Maxima (VBM),and Fermi Energy Levels (EF) Estimated from VBM andOptical Band Gap (Eg) Values
sample Mg Kα (1253.6 eV) Al Kα (1486.6 eV)VBM(eV)
EF = Eg− VBM(eV)
NbF25a Ti1O2.72Nb0.18F0.09 Ti1O2.82Nb0.15F0.03 3.20 −0.02NbF45 Ti1O2.79Nb0.21F0.055 Ti1O2.83Nb0.17F0.05 3.15 −0.04NbF35 Ti1O2.89Nb0.2F0.05 Ti1O2.94Nb0.15F0.012 3.25 −0.17NbF25 Ti1O2.81Nb0.19F0.01 Ti1O2.85Nb0.13F0.03 3.20 −0.17Nb1 Ti1O2.44Nb0.11F0.0 Ti1O2.5Nb0.11F0.0 2.80 0.11
The Journal of Physical Chemistry C Article
dx.doi.org/10.1021/jp501203h | J. Phys. Chem. C 2014, 118, 8462−84738466

anatase systems with the only exception of Nb1, which is dopedwith Nb only and contains fractions of other polymorphs.A further insight into the electronic properties of the
materials was obtained by ultraviolet photoemission spectros-copy (UPS). In Figure 5, we report the valence-band spectra
acquired using the He II emission line (hν = 40.8 eV). Thespectra indicate the presence of a semiconductive gap withminimal differences from that of pure TiO2. The typical defectband at a binding energy of 1 eV due to Ti3+ species, which isgenerally found in the case of reduced TiO2, was not detected.By applying a widely used procedure for titania-based materials,we interpolated by a line the low-energy slope of the valenceband and used its intercept with the energy axis for a qualitativedetermination of the position of the valence-band maximum(VBM).48−50 The results were found to be quite similar for allsamples and very close to the value for bare anatase (EVB,max ≈3.2 eV),48 with the notable exception of sample Nb1, whosevalence-band edge was found at 2.8 eV, a value in goodagreement with that obtained in a previous investigation of Nb-doped titania by DR UV−vis spectroscopy. By combining theVBM values with the estimated optical band gap (Table 1), it ispossible to deduce the energy of the Fermi level (EF) for thewhole set of samples49 (see Table 2). It is worth noting that theenergy gap was obtained by a method that requires a certaindegree of approximation.51 The absolute EF values determinedby this method are obviously quite dependent on the range ofbinding energies used for the linear interpolation of the slope ofthe valence band;52 however, this approach is quite reliable ifused, as in the present case, to compare the values in a series ofhomologous materials. The whole set of data thus indicate that,in our materials, as expected for n-type systems, the Fermi levellies in a higher position than in the undoped material, veryclose to the conduction-band minimum (CBM) as expected forNb-doped systems53 and, in some case, even inside theconduction band, in agreement with findings predictedtheoretically.54,55
Regarding the red shift observed for Nb-containing materialsleading to some absorbance in the visible region (Figure 2), bycombining UPS and DR UV−vis data, we can infer that thisphenomenon is not ascribable to the presence of localizedstates as in the case of reduced blue titania, for example. Rather,it is due to a general broadening of the valence band that ismoving toward lower binding energies and thus narrowing theband gap.
3.5. Excess Electron Injection in n-Type Doped TiO2.The formation, stabilization, and migration of charge carriers inTiO2 are phenomena that are of paramount importancebecause of the photochemical (photoinduced charge separa-tion) and optoelectronic (transparent conducting materials)applications of this oxide. Charge dynamics in particular hasbeen investigated in terms of the alternative mechanisms ofohmic and polaronic electronic conduction,56,57 and the natureof localized electron centers has been addressed in an effort tounderstand the space distribution of the trapped electron wavefunction. The latter question is still debated, and oppositeconclusions (electron localized on a single titanium ion ordelocalized on several ions in a relatively large volume) havebeen proposed on the basis of different approaches.58,59 Recentactivity in our group has challenged the problem of localizationversus delocalization of excess electrons in both anatase andrutile,20,60 exploring the EPR spectra of the correspondingcenters generated either by irradiation or by chemical reactions(electron injection, reduction by annealing, and consequentoxygen depletion). In the following subsections, we illustrate aseries of experiments performed with the same approach on n-type doped anatase.
3.5.1. Electron Injection. A simple method to introduceexcess electrons in TiO2 is based on the reactivity of the solidwith atomic hydrogen. This can be done by either generatingthe reactant by microwave discharge in H2 atmosphere orirradiating the system, always in the presence of H2, with UVlight. In the first case, the H atom ionizes, injecting an electroninto the solid61,62 (O2−
surf + H → OH−surf + e−). In the second
case, UV radiation induces the formation of an electron−holepair. The hole, once it has migrated to the surface, reacts withmolecular hydrogen to give a hydroxyl group and a H atomthat, as in the previous case, ionizes, injecting an electron intothe solid (2O2−
surf + h+ + H2 → OH−surf + O2−
surf + H• →2OH−
surf + e−). Excess electrons are successively stabilized onTi4+ cations, forming Ti3+ centers (Ti4+ + e− → Ti3+).The results of this latter experiment in the case of bare TiO2
anatase are reported in Figure 6A. The baseline (line a) in thiscase is flat because no paramagnetic species are present in thepristine oxide. Irradiation in the presence of H2 generates anintense EPR spectrum due to the overlap of two independentsignals both amenable to Ti3+ species [Ti3+(I) and Ti3+(II)].Whereas the former species is due to electrons stabilized onregular Ti4+ sites of the anatase bulk [Ti3+(I) is the same signalas shown in Figure 3 for doped materials], the second species(much more abundant than the first because of its large linewidth) is related to trapping sites present at the surface of thesystem. The large line width of this signal is due to the relativelydisordered environment typical of anatase nanocrystals. Thesurface nature of the Ti3+(II) species was conclusivelydemonstrated on the basis of pulse-EPR experiments using17O.20
The same irradiation experiment was then performed usingtwo distinct samples of n-type doped TiO2 (Nb1and NbF45,Figure 6, panels B and C, respectively). In these two cases, the
Figure 5. Valence-band spectra: (a) Nb1, (b) NbF25, (c) NbF35, (d)NbF45, (e) NbF25a, (f) TiO2.
The Journal of Physical Chemistry C Article
dx.doi.org/10.1021/jp501203h | J. Phys. Chem. C 2014, 118, 8462−84738467

spectral background (line a) is not, of course, a flat line, in thatthe n-type doped starting material contains a certain initialconcentration of Ti3+(I) species (see Figure 3). The effect ofirradiation in H2 is surprising (line b in Figure 6B,C) becausean increase in the amount of Ti3+ species is, as expected,observed, but it is due uniquely to Ti3+(I) species, whoseintensity increases several times (but by less than 1 order ofmagnitude) depending on the type of sample. No trace ofTi3+(II) species was observed in the specific magnetic fieldregion. In other words, the presence of Ti3+ in the starting n-type doped materials seems to selectively condition the fate ofextra electrons injected into the solid, which all reach latticeTi4+ sites, preventing the formation of surface reduced centers.The intensities of the spectra after electron injection (hence,the amounts of reduced Ti3+ centers) are similar for the twodoped samples (Figure 6B,C) and slightly higher than that forthe nondoped one (Figure 6A).3.5.2. Reduction of the Solids by Thermal Annealing.
Titanium dioxide is a reducible oxide whose compositiondepends on the pressure of oxygen in the atmosphere. Inparticular, molecular oxygen is released upon annealing thesolid under a vacuum, leaving excess electrons in the (reduced)solid.63 This phenomenon, which has been deeply investigatedby various techniques including EPR spectroscopy,20,64 can berepresented as O2− + 2Ti4+ → 1/2O2 + VO
•• + 2Ti4+ + 2e− →1/2O2 + VO
•• + 2Ti3+, where VO•• indicates an empty oxygen
vacancy according to the Kroger−Vink notation. Figure 7compares the effects of a progressive reduction by annealingfrom rather mild conditions (373 K under a vacuum) to 773 Kon the EPR spectra of bare (panel A) and n-type doped (panelsB and C) anatase. The figure clearly shows that, in the earlystages of the reduction (line b in the three panels), Ti3+(I) isthe unique species formed in all materials, indicating that thefirst fraction of excess electrons is stabilized on regular sites ofthe lattice. In the following stages of the treatment, the signalintensity of Ti3+ increases, but the behaviors of the two classesof materials diverge. In the case of bare anatase (as documentedin a previous work20), the broad and featureless signal ofTi3+(II) species (see Figure 7A) soon becomes dominant,reflecting the complex situation based on reduced titaniumcenters in various coordination states, at the surface and insubsurface regions. This complexity is increased, with respect tothe case of simple electron injection (Figure 6), by the oxygenvacancies formed during annealing. In the case of the n-type
systems (F−TiO2 and Nb−TiO2, Figure 7B,C), exactly as inthe case of Figure 6, it is indeed the signal of Ti3+(I) thatincreases its intensity with increasing the solid reduction. At thesame time, the signal becomes broader and broader, althoughmaintaining the axial structure (panels B and C, lines b−e)because of dipolar interactions between similar centers in closevicinity because of their high concentration. In this case (Figure7), the intensity increment, much higher than in the case ofelectron injection (Figure 6), is between 1 and 2 orders ofmagnitude depending on the sample. At the highest annealingtemperature, the signal of F−TiO2 (panel B, line f) becomesfeatureless, probably because the solid loses its n-type characteras a result of fluorine depletion (see section 3.1). Under thesame conditions, the niobium-doped sample (panel C)maintains its axial structure.The described experiment confirms what was observed in the
case of electron injection, namely, the capability of the n-typedoped materials to dilute extra electrons on the titanium sites ofthe oxide bulk, producing high amounts of a single family ofbulk reduced centers [Ti3+(I)]. This behavior is different fromthat of bare TiO2, for which, in addition to a small amount ofTi3+(I), the much more abundant Ti3+(II) centers are observed.In quantitative terms, the amounts of reduced centers in the
two doped samples at the end of the reduction (Figure 7Bf,Cf)are similar and 1 order of magnitude higher than that observedfor the same samples after electron injection (Figure 6). Also, inthis case, the bare TiO2 material (Figure 7A) is less reduciblethan the doped materials (Figure 7B,C).
3.5.3. Ti3+ Centers Obtained by Thermal Annealing inVariously Doped TiO2 Systems. The results described in theprevious sections indicate that the n-type TiO2 systemsobtained by aliovalent excess electron doping show a differentbehavior in electron trapping than bare anatase. To understandwhether this phenomenon is related to the presence of ageneric heteroatom in the TiO2 matrix, Ti3+ generationexperiments by thermal annealing were also carried out onother doped systems with no n-type character. The othersystems were zirconium-doped TiO2 (Zr−TiO2), in which Zr4+
substitutes Ti4+ cations (isovalent substitution65), and alumi-num-doped TiO2 (Al−TiO2). In the second case, an aliovalent
Figure 6. EPR spectra of bare anatase and n-type TiO2 samplesobtained after UV irradiation at 77 K in the presence of H2: (A) TiO2,(B) NbF45, (C) Nb1.
Figure 7. X-band CW-EPR spectra of (A) TiO2, (B) F2, and (C) Nb1samples subjected to annealing under a vacuum at increasingtemperature, recorded at 77 K: (a) fully oxidized starting materialsand (b−f) samples annealed for 45 min at (b) 370, (c) 470, (d) 570,(e) 670, and (f) 770 K. Notice the different magnetic field scale inpanel A compared to panels B and C. The asterisk (*) indicates asignal (g = 2.003) ubiquitously present in reduced TiO2.
The Journal of Physical Chemistry C Article
dx.doi.org/10.1021/jp501203h | J. Phys. Chem. C 2014, 118, 8462−84738468

substitution occurs, with formation of a defective system(oxygen vacancies compensate the lack of positive charge66,67).The two materials were prepared using the same procedure asdescribed in section 2.In Figure 8, the EPR spectra of n-type systems, including a
sample not shown before (Sb-doped TiO2) are compared with
the spectra of the other samples of doped TiO2 after annealingin vacuo at 773 K. Whereas all of the n-type doped materials(Figure 8A) confirm the exclusive presence of Ti3+(I) electron-trapping centers (anatase bulk sites) after reduction, the twodifferently doped samples show the same behavior as pristineanatase, with the trapped electrons centers mainly confined tothe disordered surface region [Ti3+(II)].The effect discussed here is therefore specific to n-type
doped TiO2 anatase (irrespective of the cationic or anionicnature of the aliovalent dopant) and is not related to thepresence of a generic heteroatom in the crystal lattice.3.6. Optical Properties of the Reduced Materials. In
Figure 9 the DR UV−vis−NIR spectra of TiO2 and NbF25asamples reduced by annealing under a vacuum at 770 K arereported. The annealing deeply modifies the optical propertiesof both pristine TiO2 and n-type TiO2. For these two types of
materials in their fully oxidized state, in fact, no absorption fromthe band gap transition to 2500 nm is observed (Figure 9b forNbF25a). Upon annealing, an onset of visible and NIRabsorption occurs in parallel with the appearance of a bluecolor. In all of the curves reported in Figure 9, apart from minorabsorption peaks at about 1400 and 2250 nm due to hydroxylgroups, the main spectral feature is represented by broadabsorptions spread over the visible and infrared regions. Thespectra in Figure 9 are confidently comparable to each other, asthe scattering properties should be similar for all samples thatexhibit similar crystallite sizes (Table 1). Some trends in theKubelka−Munk Function might, in fact, be due to Rayleighscattering rather than optical absorption.Broad optical spectra for reduced TiO2 have been reported in
the literature, particularly in the case of rutile,64 and areattributed to the presence of Ti3+ centers responsible for thetypical blue color of these reduced systems. Once again,however, the n-type systems analyzed in this work show aremarkable difference with respect to the pure material.Reduced pure TiO2 (Figure 9a) exhibits a curve that is likely
due to the superimposition of two broad absorptions, onehaving a maximum around 1000 nm (1.2 eV) and the secondhaving a maximum at a lower energy roughly corresponding tothe instrumental threshold of 2500 nm (≤0.5 eV). Thepresence of the first absorption feature centered at ca. 1000 nmis in agreement with data reported in the literature68,69 andbecomes much more evident after the sample is exposed tooxygen at room temperature (Figure 9a′). Under theseconditions, in fact, the fraction of reduced centers absorbingat low energy preferentially reacts, and the absorption curvecentered at 1000 nm dominates the absorption spectrum afteroxidation. The curves of the reduced n-type TiO2 systems,unlike that of bare TiO2, show a continuously increasingabsorption with a maximum at very low energy (E ≤ 0.5 eV),again located near the instrumental threshold or even beyond2500 nm (Figure 9b′). The curve, in fact, is similar to thoserecently reported26 for similar Nb-doped anatase systems with amaximum at about 2500 nm. Upon exposure of the reduced n-type system to oxygen at room temperature (Figure 9b″), as inthe case of pure TiO2, some of the initial Ti
3+ centers react, butin this case, only the overall intensity of the spectrum isaffected, and the absorption curve maintains its shape,suggesting the presence of only one absorption band in thistype of system.Furthermore, to characterize the Ti3+ centers in the n-type
TiO2 sample prepared in this work, valence-band spectra wererecorded after sample reduction by thermal annealing. In allcases, it was impossible to observe Ti3+ centers even though thecolor of the powders changed from white to blue, the typicalcolor of reduced TiO2.
56,70 This experimental evidence suggeststhat excess electrons rapidly migrate into the bulk of thematerial to form Ti3+ centers, in agreement with the conclusiondrawn from EPR experiments.
4. DISCUSSION AND CONCLUSIONSThe systems studied in this work, both singly doped and Nb−F-codoped materials, are n-type TiO2. In fact, they contain Nband/or F, both carriers of an extra electron with respect to theelements of the stoichiometric oxide, and consequently, they allshow the presence of Nb5+ and/or F− ions (XPS) and Ti3+ ions(EPR spectroscopy). This latter fact, in particular, indicates thatat least a fraction of the excess electrons introduced by thedopant are stabilized by valence induction, as taken into
Figure 8. X-band CW-EPR spectra recorded at 77 K of variouslydoped titania samples annealed under a vacuum at 770 K for 60 min.
Figure 9. DR UV−vis−NIR spectra of samples reduced upon thermalannealing under a vacuum: (a) pristine TiO2 annealed at 770 K for 2h; (a′) annealed TiO2 (as in sample a) after contact with O2 at roomtemperature; (b) fully oxidized, as-prepared NbF25a; (b′) NbF25aannealed under a vacuum at 770 K for 2 h; and (b″) annealed NbF25a(as in sample b′) after contact with O2 at room temperature.
The Journal of Physical Chemistry C Article
dx.doi.org/10.1021/jp501203h | J. Phys. Chem. C 2014, 118, 8462−84738469
account by the general formulas reported in section 3.3. Analternative possibility for the extra charge stabilization, whichhas been proposed in some cases for Nb-doped titania,24 isbased on the formation of cationic vacancies (four Nb ionscorrespond to one Ti vacancy). It is not possible, on the basisof our data, to confirm or exclude the presence of suchvacancies (which, by the way, are not easily detectable byexperimental techniques). It must be kept in mind, however,that, in general, aliovalently doped systems selectively choosethe solution of higher stability, and therefore, the presence ofTi3+ ions seems to indicate the preference for the mechanism ofvalence induction rather than that of vacancy formation.The value of the energy band gap in n-type doped materials
is a very complex problem. In all cases of codoped samples, weobserved a small red shift of the edge of the band, in analogy toother published results,37−41 whereas in several other cases ofNb doping, a blue shift was observed that was attributed to theBurstein−Moss effect. Our data (red shift for all F-containingsamples, lack of a shift for the Nb−TiO2 sample), together withthe variability of the results available in the literature, suggestthat the band gap is dictated by a delicate interplay between theBurstein−Moss effect, the modifications occurring at the edgeof the conduction band due to the presence of the energy levelsof Ti3+ (vide infra), and the modifications in the valence bandcausing the shift of the band itself (see section 3.4).The Ti3+(I) centers observed by EPR spectroscopy at 77 K
determine the behavior of the doped oxide. Previous work byour group has shown unambiguously that the reduced ionsresponsible of the EPR signal with g⊥ = 1.992 and g∥ = 1.962are placed in the regular lattice positions of the oxide bulk, thatis, they are neither surface nor interstitial ions.20,44 The energylevels corresponding to these excess electron centers areextremely shallow, however, or even lie at the edge the CB.This is indicated by the lack of absorption of the fully oxidizedsamples in the visible region and by the position of the Fermilevel (Table 2), which is very high in the band gap or even liesin the conduction band. The correspondence between thestructured and relatively narrow EPR signal (Figure 4) of
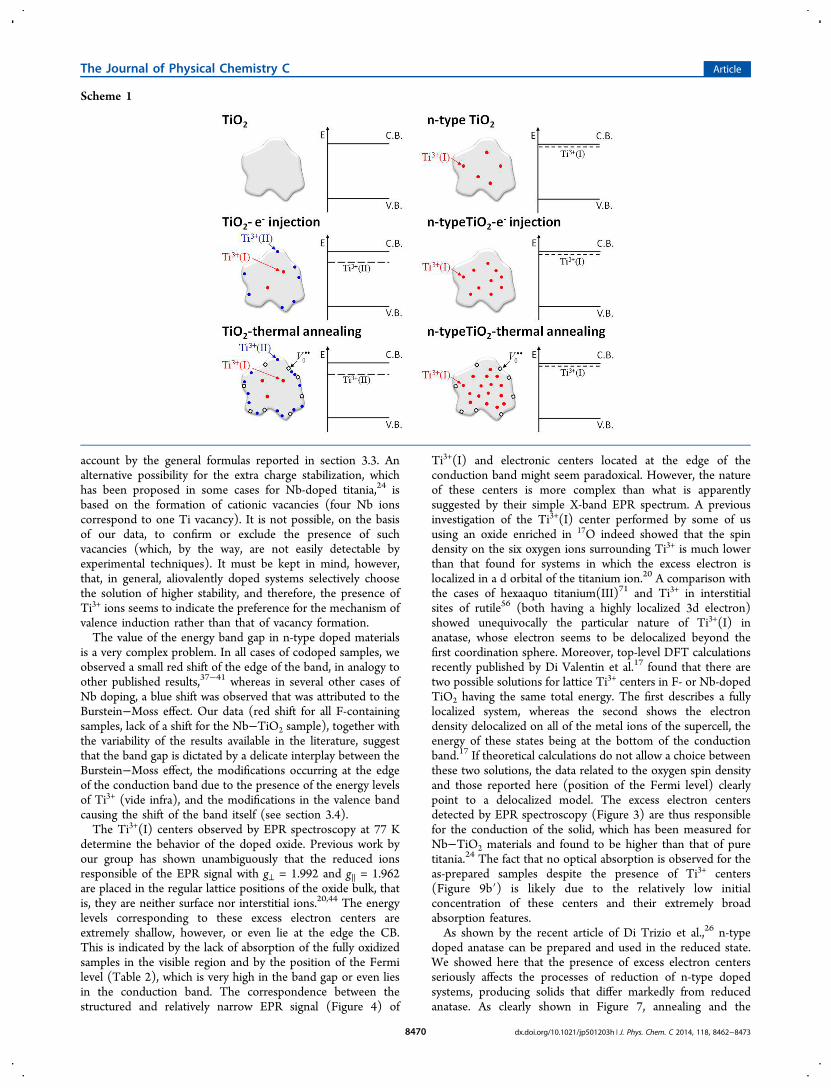
Ti3+(I) and electronic centers located at the edge of theconduction band might seem paradoxical. However, the natureof these centers is more complex than what is apparentlysuggested by their simple X-band EPR spectrum. A previousinvestigation of the Ti3+(I) center performed by some of ususing an oxide enriched in 17O indeed showed that the spindensity on the six oxygen ions surrounding Ti3+ is much lowerthan that found for systems in which the excess electron islocalized in a d orbital of the titanium ion.20 A comparison withthe cases of hexaaquo titanium(III)71 and Ti3+ in interstitialsites of rutile56 (both having a highly localized 3d electron)showed unequivocally the particular nature of Ti3+(I) inanatase, whose electron seems to be delocalized beyond thefirst coordination sphere. Moreover, top-level DFT calculationsrecently published by Di Valentin et al.17 found that there aretwo possible solutions for lattice Ti3+ centers in F- or Nb-dopedTiO2 having the same total energy. The first describes a fullylocalized system, whereas the second shows the electrondensity delocalized on all of the metal ions of the supercell, theenergy of these states being at the bottom of the conductionband.17 If theoretical calculations do not allow a choice betweenthese two solutions, the data related to the oxygen spin densityand those reported here (position of the Fermi level) clearlypoint to a delocalized model. The excess electron centersdetected by EPR spectroscopy (Figure 3) are thus responsiblefor the conduction of the solid, which has been measured forNb−TiO2 materials and found to be higher than that of puretitania.24 The fact that no optical absorption is observed for theas-prepared samples despite the presence of Ti3+ centers(Figure 9b′) is likely due to the relatively low initialconcentration of these centers and their extremely broadabsorption features.As shown by the recent article of Di Trizio et al.,26 n-type
doped anatase can be prepared and used in the reduced state.We showed here that the presence of excess electron centersseriously affects the processes of reduction of n-type dopedsystems, producing solids that differ markedly from reducedanatase. As clearly shown in Figure 7, annealing and the
Scheme 1
The Journal of Physical Chemistry C Article
dx.doi.org/10.1021/jp501203h | J. Phys. Chem. C 2014, 118, 8462−84738470

simultaneous depletion of oxygen imply the formation of thesame type of bulk reduced centers as are already present in thestarting material [Ti3+(I)], which assume a homogeneousdistribution in the bulk. The conduction properties of thestarting n-type material24,25 are likely responsible for conveyngthe excess electrons formed upon reduction to form thishomogeneous distribution of reduced centers. This is not thecase for pristine anatase, for which the great majority of reducedcenters correspond to the EPR signal of Ti3+(II), that is, tocenters present at the surface or subsurface of the nanoparticlesin a highly heterogeneous environment because of both thesurface morphology and the presence of the oxygen vacanciesformed upon annealing. This description is supported by bothphotoelectron and optical spectroscopies (Figure 9). XPS is asurface-sensitive technique and does not detect Ti3+ species inthe starting doped materials (Figure 4) or even after reduction.The optical spectra basically indicate two facts: (a) The dopedsystems absorb visible and NIR light when reduced. (b)Similarly to the case of EPR spectra, the optical absorptionsobtained by reducing pristine and n-type doped anatase aredifferent. In particular, in the early stages of reduction, pureanatase mainly absorbs in two regions of the spectrum (maximaat 1000 and 2500 nm), whereas in the case of n-type dopedmaterials, only the second type of absorption is present (Figure9). This agrees with the EPR results indicating that reduced n-type materials are simpler (only one EPR signal) and morehomogeneous than reduced TiO2. Furthermore, the opticalspectra firmly indicate that the reduced states of n-type TiO2
are shallower than the majority of those present in reducedpure anatase. This is in agreement with the position of theFermi level (Table 2) derived by combining the UPS andoptical spectra. The simplified physical states of the two typesof materials in their stoichiometric and reduced states areschematically compared in Scheme 1 on the basis of thefindings reported in this article.In conclusion, concerning the description of n-type doped
anatase, this work has served to put some important pieces ofthe puzzle into place, such that one can now look at this systemas a solid that is markedly different from pure anatase. In fact,n-type doped anatase contains very shallow donor levels whoseamount increases upon reduction because the solid is able tohomogeneously scatter the excess electrons by associating themwith regular titanium ions of the lattice [Ti3+(I)]. The samedoes not occur for pure anatase, which, when reduced,preferentially forms deeper [Ti3+(II)] centers localized atsurface and subsurface sites. The particular position of Ti3+(I)at the lower limit of the conduction band also explainsconductivity measurements placing Nb−F-doped materials atthe boundary between a true n-doped semiconductor and ametallic conductor52−54 and accounts for recent resultsindicating the delocalized nature of the wave function of theTi3+(I) unpaired electron.All of these features are of fundamental importance in the
field of transparent conducting oxides (TCOs) and have afurther appealing consequence related to the solid reduction ina homogeneous way, with creation of absorption in the visibleand NIR regions (Figure 8) without producing an accumulationof electrons at the surface. This could be of much interest inview of the preparation of reduced titania-based photocatalyticsystems capable of absorbing visible and NIR radiation asrecently proposed by several authors.72−74
■ ASSOCIATED CONTENT*S Supporting InformationAdditional information as noted in text. This material isavailable free of charge via the Internet at http://pubs.acs.org.
■ AUTHOR INFORMATIONCorresponding Author*E-mail: [email protected] authors declare no competing financial interest.
■ ACKNOWLEDGMENTSThis work was supported by the Italian Ministry of Universityand Research, MIUR, through the “Programs of NationalRelevance” (PRIN-2009) and the “National Funding for BasicResearch” (FIRB) with a project entitled “Oxides at theNanoscale: Functionalities and Applications” (FIRB RBA-P11AYN). Thanks are also due to the COST ActionCM1104 (Reducible Oxides: Chemistry, Structure andFunctions). The μ-XRF results were obtained with equipmentacquired by the “G. Scansetti” Interdepartmental Centre forStudies on Asbestos and Other Toxic Particulates, thanks to agrant by the Compagnia di San Paolo, Torino, Italy.
■ REFERENCES(1) Thompson, T. L.; Yates, J. T., Jr. Surface Science Studies of thePhotoactivation of TiO2New Photochemical Processes. Chem. Rev.2006, 106, 4428−4453.(2) Henderson, M. A. A Surface Science Perspective on TiO2Photocatalysis. Surf. Sci. Rep. 2011, 66, 185−297.(3) Serpone, N.; Pelizzetti, E. Photocatalysis: Fundamentals andApplications; Wiley & Sons: New York, 1989.(4) Fujishima, A.; Honda, K. Electrochemical Photolysis of Water at aSemiconductor Electrode. Nature 1972, 238, 37−38.(5) Cho, M.; Chung, H.; Choi, W.; Yoon, J. Linear Correlationbetween Inactivation of E. coli and OH Radical Concentration in TiO2Photocatalytic Disinfection. Water Res. 2004, 38, 1069−1077.(6) Nozawa, M.; Tanigawa, K.; Hosomi, M.; Chikusa, T.; Kawada, E.Removal and Decomposition of Malodorants by Using TitaniumDioxide Photocatalyst Supported on Fiber Activated Carbon. WaterSci. Technol. 2001, 44, 127−133.(7) Watanabe, T.; Nakajima, A.; Wang, R.; Minabe, M.; Koizumi, S.;Fujishima, A.; Hashimoto, K. Photocatalytic Activity and Photo-induced Hydrophilicity of Titanium Dioxide Coated Glass. Thin SolidFilms 1999, 351, 260−263.(8) Hagfeld, A.; Gratzel, M. Light-Induced Redox Reactions inNanocrysyalline Systems. Chem. Rev. 1995, 95, 49−68.(9) Asahi, R.; Morikawa, T.; Ohwaki, T.; Aoki, K.; Taga, Y. VisibleLight Photocatalysis in Nitrogen-Doped Titanium Oxides. Science2001, 293, 269−271.(10) Fujishima, A.; Zhang, X.; Tryk, D. A. TiO2 and Related SurfacePhenomena. Surf. Sci. Rep. 2008, 63, 515−582.(11) Di Valentin, C.; Finazzi, E.; Pacchioni, G.; Selloni, A.; Livraghi,S.; Paganini, M. C.; Giamello, E. N-Doped TiO2: Theory andExperiment. Chem. Phys. 2007, 339, 44−56.(12) Yu, J. C.; Yu, J.; Ho, W.; Jiang, Z.; Zhang, L. Effects of F−
Doping on the Photocatalytic Activity and Microstructure ofNanocrystalline TiO2 Powders. Chem. Mater. 2002, 14, 3808−3816.(13) Li, D.; Haneda, H.; Labhsetwar, N.; Hishita, S.; Ohashi, N.Visible-Light-Driven Photocatalysis of Fluorine-Doped TiO2 Powdersby Creation of Surface Oxygen Vacancies. Chem. Phys. Lett. 2005, 401,579−584.(14) Czoska, A.; Livraghi, S.; Chiesa, M.; Giamello, E.; Agnoli, S.;Granozzi, G.; Finazzi, E.; Di Valentin, C.; Pacchioni, G. The Nature ofDefects in Fluorine-Doped TiO2. J. Phys. Chem. C 2008, 112, 8951−8956.
The Journal of Physical Chemistry C Article
dx.doi.org/10.1021/jp501203h | J. Phys. Chem. C 2014, 118, 8462−84738471
(15) Subbarao, S. N.; Yun, Y. H.; Kershaw, R.; Dwight, K.; Wold, A.Electrical and Optical Properties of the System TiO2−xFx. Inorg. Chem.1979, 18, 488−492.(16) Wang, C. M.; Mallouk, T. E. Photoelectrochemistry andInterfacial Energetics of Titanium Dioxide Photoelectrodes inFluoride-Containing Solution. J. Phys. Chem. 1990, 94, 423−428.(17) Di Valentin, C.; Pacchioni, G.; Selloni, A. Reduced and n-TypeDoped TiO2: Nature of Ti3+ Species. J. Phys. Chem. C 2009, 113,20543−20552.(18) Valigi, M.; Cordischi, D.; Minelli, G.; Natale, P.; Porta, P.;Keijzers, C. P. A Structural, Thermogravimetric, Magnetic, ElectronSpin Resonance, and Optical Reflectance Study of the NbOxTiO2
System. J. Solid State Chem. 1988, 77, 255−263.(19) Kiwi, J.; Suss, J. T.; Szapiro, S. EPR Spectra of Niobium-DopedTiO2 and Implications for Water Photocleavage Processes. Chem. Phys.Lett. 1984, 106, 135−138.(20) Livraghi, S.; Chiesa, M.; Paganini, M. C.; Giamello, E. On theNature of Reduced States in Titanium Dioxide As Monitored byElectron Paramagnetic Resonance. I: The Anatase Case. J. Phys. Chem.C 2011, 115, 25413−25421.(21) Furubayashi, Y.; Hitosugi, T.; Yamamoto, Y.; Inaba, K.; Kinoda,G.; Hirose, Y.; Shimada, T.; Hasegawa, T. A Transparent Metal Nb-Doped TiO2. Appl. Phys. Lett. 2005, 86, 252101.(22) Zhang, S. X.; Dhar, S.; Yu, W.; Xu, H.; Ogale, S. B.; Venkatesan,T. Growth Parameter-Property Phase Diagram for Pulsed LaserDeposited Transparent Oxide Conductor Anatase Nb:TiO2. Appl.Phys. Lett. 2007, 91, 112113.(23) Su, W.; Song, K.; Huo, D.; Li, B. Analysis of Correlationbetween Electrical and Infrared Optical Properties of Anatase NbDoped TiO2 Films. Curr. Appl. Phys. 2013, 13, 556−561.(24) Chandiran, A.; K. Sauvage, F.; Casas-Cabanas, M.; Comte, P.;Zakeeruddin, S. M.; Gratzel, M. Doping a TiO2 Phoanode with Nb5+
to Enhance Transparency and Charge Collection Efficiency in Dye-Sensitized Solar Cells. J. Phys. Chem. C 2010, 114, 15849−15856.(25) Hopper, E. M.; Sauvage, F.; Chandiran, A. K.; Gratzel, M.;Poeppelmeier, K. R.; Mason, T. O. Electrical Properties of Nb-, Ga-,and Y-Substituted Nanocrystalline Anatase TiO2 Prepared byHydrothermal Synthesis. J. Am. Chem. Soc. 2012, 95, 3192−3196.(26) De Trizio, L.; Buonsanti, R.; Schimpf, A. M.; Llordes, A.;Gamelin, D. R.; Simonutti, R.; Milliron, D. J. Nb-Doped ColloidalTiO2 Nanocrystals with Tunable Infrared Absorption. Chem. Mater.2013, 25, 3383−3390.(27) P Chester, P. Cross-Doping Agent for Rutile Masers. J. Appl.Phys. 1961, 32, 866−868.(28) Zimmermann, P. H. Temperature Dependence of the EPRSpectra of Niobium-Doped TiO2. Phys. Rev. B 1973, 8, 3917−3927.(29) Gao, Y.; Chambers, S. A. MBE Growth and Characterization ofEpitaxial TiO2(110) Surface by Molecular Beam Epitaxy. Mater. Lett.1996, 26, 217−221.(30) Dozzi, M. V.; Livraghi, S.; Giamello, E.; Selli, E. PhotocatalyticActivity of S- and F-Doped TiO2 in Formic Acid Mineralization.Photochem. Photobiol. Sci. 2011, 10, 343−349.(31) Materials Analysis Using Diffraction, available at http://www.ing.unitn.it/∼maud.(32) Morris, D.; Dou, Y.; Rebane, J.; Mitchell, C. E. J.; Egdell, R. G.;Law, D. S. L.; Vittadini, A.; Casarin, M. Photoemission and STM Studyof the Electronic Structure of Nb-Doped TiO2. Phys. Rev. B 2000, 61,13445−13457.(33) Di Paola, A.; Cufalo, G.; Addamo, M.; Bellardita, M.;Campostrini, R.; Ischia, M.; Ceccato, R.; Palmisano, L. PhotocatalyticActivity of Nanocrystalline TiO2 (Brookite, Rutile and Brookite-Based) Powders Prepared by Thermohydrolysis of TiCl4 in AqueousChloride Solutions. Colloids Surf., A 2008, 317, 366−376.(34) Kurita, D.; Ohta, S.; Sugiura, K.; Ohta, H.; Koumoto, K. CarrierGeneration and Transport Properties of Heavily Nb-Doped AnataseTiO2 Epitaxial Films at High Temperatures. J. Appl. Phys. 2006, 100,096105.(35) Zhang, S. X.; Kundaliya, D. C.; Yu, W.; Dhar, S.; Yung, S. Y.;Salamnca-Riba, L. G.; Ogale, S. B.; Vispute, R. D.; Venkatesan, T.
Niobium Doped TiO2: Intrinsic Transparent Metallic Anatase VersusHighly Resistive Rutile Phase. J. Appl. Phys. 2007, 102, 013701.(36) Breault, T. M.; Bartlett, B. M. Composition Dependence ofTiO2:(Nb,N)-x Compounds on the Rate of Photocatalytic MethyleneBlue Dye Degradation. J. Phys. Chem. C 2013, 117, 8611−8618.(37) Zakrzewska, K.; Radecka, M.; Rekas, M. Effect of Nb, Cr, Sn,Additions on Gas Sensing Properties of TiO2 Thin Films. Thin SolidFilms 1997, 310, 161−166.(38) Mattsson, A.; Leideborg, M.; Larsson, K.; Westin, G.;Orsterlund, L. Absorption and Solar Light Decomposition of Acetoneon Anatase TiO2 and Niobium Doped TiO2 Films. J. Phys. Chem. B2006, 110, 1210−1220.(39) Hirano, M.; Ichihashi, Y. Phase Transformation andPrecipitation Behavior of Niobium Component out of Niobium-Doped Anatase-Type TiO2 Nanoparticles Synthesized via Hydro-thermal Crystallization. J. Mater. Sci. 2009, 44, 6135−6143.(40) Kubacka, A.; Colon, G.; Fernandez-Garcıa, M. Cationic (V, Mo,Nb, W) Doping of TiO2−Anatase: A Real Alternative for VisibleLight-Driven Photocatalysis. Catal. Today 2009, 143, 286−292.(41) Znad, H.; Ang, M. H.; Tade, M. O. Ta/TiO2- and Nb/TiO2-Mixed Oxide as Efficient Solar Photocatalytic: Preparation, Character-ization, and Photocatalytic Activity. Int. J. Photoenergy 2012,No. 548158.(42) Tsvetkov, N. A.; Larina, L. L.; Shevaleevskiy, O. E.; Al-Ammar,A. B.; Ahn, T. Design of Conduction Band Structure of TiO2 ElectrodeUsing Nb Doping for Highly Efficient Dye-Sensitized Solar Cells. Prog.Photovoltaics 2012, 20, 904−911.(43) Mardare, D.; Tasca, M.; Delibas, M.; Rusu, G. I. On theStructural Properties and Optical Transmittance of TiO2 r.f. SputteredThin Films. Appl. Surf. Sci. 2000, 156, 200−206.(44) Chiesa, M.; Paganini, M. C.; Livraghi, S.; Giamello, E. ChargeTrapping in TiO2 Polymorphs As Seen by Electron ParamagneticResonance Spectroscopy. Phys. Chem. Chem. Phys. 2013, 15, 9435−9447.(45) Sasahara, A.; Tomitori, M. XPS and STM Study of Nb-DopedTiO2(110)-(1 × 1) Surface. J. Phys. Chem. C 2013, 117, 17680−17686.(46) Yeh, J. J.; Lindau, I. Atomic Subshell Photonization CrossSections and Asymmetry Parameters: 1 ≤ Z ≤ 103. At. Data Nucl.Data Tables 1985, 32, 1−155.(47) Tanuma, S.; Powell, C. J.; Penn, D. R. Calculations of ElectronInelastic Mean Free Paths. Surf. Interface Anal. 1994, 21, 165−176.(48) Sandell, A.; Sanyal, B.; Walle, L. E.; Uvdal, P.; Borg, A. Probingthe Conduction Band Edge of Transition Metal Oxides by X-rayAbsorption Spectroscopy. J. Electron Spectrosc. Relat. Phenom. 2011,183, 107−113.(49) Walle, L. E.; Agnoli, S.; Svenum, I.-H.; Borg, A.; Artiglia, L.;Krger, P.; Sandell, A.; Granozzi, G. High Resolution Photoemissionand X-ray Absorption Spectroscopy of a Lepidocrocite-like TiO2
Nanosheet on Pt(110) (1 × 2). J. Chem. Phys. 2011, 135, 054706.(50) Nikolay, T.; Larina, L.; Shevaleevskiy, O.; Ahn, B. T. ElectronicStructure Study of Lightly Nb-Doped TiO2 Electrode for Dye-Sensitized Solar Cells. Energy Environ. Sci. 2011, 4, 1480−1486.(51) Martra, G.; Gianotti, E.; Coluccia, S. The Application of UV−Visible−NIR Spectroscopy to Oxides. In Metal Oxide Catalysis;Hargraves, J. S. J., Jackson, D., Eds.; Wiley-VCH: Weinheim, Germany,2008; Chapter 2, pp 51−94.(52) Chambers, S. A.; Liang, Y.; Yu, Z.; Droopad, R.; Ramandi, J.;Eisenbeiser, K. Band Discontinuities at Epitaxial SrTiO3/Si(001)Heterojunctions. Appl. Phys. Lett. 2000, 77, 1662−1664.(53) Archana, P. S.; Jose, R.; Yosoff, M. M.; Ramakrishna, S. NearBand-Edge Electron in Electrospun Nb-Doped Anatase NanofibersProbed by Electrochemical Impedence Spectroscopy. Appl. Phys. Lett.2011, 98, 152106.(54) Hitosugi, T.; Kamisaka, H.; Yamashita, K.; Nogawa, H.;Furubayashi, Y.; Nakao, S.; Chikamatsu, A.; Kumigashira, H.;Oshima, M.; Hirose, Y.; Shimada, T.; Hasegawa, T. Electronic BandStructure of Transparent Conductor: Nb-Doped Anatase TiO2. Appl.Phys. Express 2008, 1, 111203.
The Journal of Physical Chemistry C Article
dx.doi.org/10.1021/jp501203h | J. Phys. Chem. C 2014, 118, 8462−84738472

(55) Liu, X. D.; Jiang, E. Y.; Li, Z. Q.; Song, Q. G. ElectronicStructure and Optical Properties of Nb-Doped Anatase TiO2. Appl.Phys. Lett. 2008, 92, 252104.(56) Deskins, N. A.; Dupuis, M. Intrinsic Hole Migration Rates inTiO2 from Density Functional Theory. J. Phys. Chem. C 2009, 113,346−358.(57) Deskins, N. A.; Rousseau, R.; Dupuis, M. Defining the Role ofExcess Electrons in the Chemistry of TiO2. J. Phys. Chem. C 2010, 114,5891−5897.(58) Kruger, P.; Bourgeois, S.; Domenichini, B.; Magnan, H.;Chandesris, D.; Le Fevre, P.; Flank, A. M.; Jupille, J.; Floreano, L.;Cossaro, A.; Verdini, A.; Morgante, A. Defect States in the TiO2(110)Surface Probed by Resonant Photoelectron Diffraction. Phys. Rev. Lett.2008, 100, 055501.(59) Wendt, S.; Sprunger, P. T.; Lira, E.; Madsen, G. K. H. M.; Li, Z.;Hansen, J.; Matthiensen, J.; Blekinge-Rasmussen, A.; Lægsgaard, E.;Hammer, B.; Besenbacher, F. The Role of Interstitial Sites in the Ti3dDefects State in the Band Gap of Titania. Science 2008, 320, 1755−1759.(60) Livraghi, S.; Maurelli, S.; Paganini, M. C.; Chiesa, M.; Giamello,E. Probing the Local Environment of Ti3+ Ions in TiO2 (Rutile) by17O HYSCORE. Angew. Chem. Int. Ed. 2011, 50, 8038−8040.(61) Chiesa, M.; Paganini, M. C.; Giamello, E.; Murphy, D. M.; DiValentin, C.; Pacchioni, G. Excess Electrons Stabilization on IonicOxide Surfaces. Acc. Chem. Res. 2006, 39, 861−867.(62) Berger, T.; Diwald, O.; Knoezinger, E.; Napoli, F.; Chiesa, M.;Giamello, E. Hydrogen Activation at TiO2 Anatase Nanoparticles.Chem. Phys. 2007, 339, 138−145.(63) Diebold, U. The Surface Science of Titanium Dioxide. Surf. Sci.Rep. 2003, 48, 53−229.(64) Carter, E.; Carley, A. F.; Murphy, D. M. Evidence for O2
−
Radical Stabilization at Surface Oxygen Vacancies on PolycrystallineTiO2. J. Phys. Chem. C 2007, 111, 10630−10638.(65) Livraghi, S.; Olivero, F.; Paganini, M. C.; Giamello, E. TitaniumIons Dispersed into the ZrO2 Matrix: Spectroscopic Properties andPhotoinduced Electron Transfer. J. Phys. Chem. C 2010, 114, 18553−18558.(66) Shirley, R.; Kraft, M.; Inderwildi, O. R. Electronic and OpticalProperties of Aluminium-Doped Anatase and Rutile TiO2 from abInitio Calculation. Phys. Rev. B 2010, 81, 075111.(67) M Steveson, M.; Bredow, T. A.; Gerson, R. MSINDO QuantumChemical Modelling Study of the Structure of Aluminium-DopedTiO2. Phys. Chem. Chem. Phys. 2002, 4, 358−365.(68) Khomenko, V. M.; Langer, K.; Rager, H.; Fett, A. ElectronicAbsorption by Ti3+ Ions and Electron Delocalization in Synthetic BlueRutile. Phys. Chem. Miner. 1998, 25, 338−346.(69) Komaguchi, K.; Maruoka, T.; Nakano, H.; Imae, I.; Ooyama, Y.;Harima, Y. Electron-Transfer Reaction of Oxygen Species on TiO2Nanoparticles Induced by Sub-Band-Gap Illumination. J. Phys. Chem.C 2010, 114, 1240−1245.(70) Diebold, U.; Li, M.; Dulub, O.; Hebenstreit, E. L. D.;Hebenstreit, W. The Relationship between Bulk and SurfaceProperties of Rutile TiO2(110). Surf. Rev. Lett. 2000, 5−6, 613−617.(71) Maurelli, S.; Livraghi, S.; Chiesa, M.; Giamello, E.; VanDoorslaer, S.; Di Valentin, C.; Pacchioni, G. Hydration Structure ofthe Ti(III) Cation as Revealed by Pulse EPR and DFT Studies: NewInsights into a Textbook Case. Inorg. Chem. 2011, 50, 2385−2394.(72) Zuo, F.; Wang, L.; Wu, T.; Zhang, Z.; Borchardt, D.; Feng, P.Self-Doped Ti3+ Enhanced Photocatalyst for Hydrogen Productionunder Visible Light. J. Am. Chem. Soc. 2010, 132, 11856−11857.(73) Gordon, T. R.; Cargnello, M.; Paik, T.; Mangolini, F.; Weber, R.T.; Fornasiero, P.; Murray, C. B. Nonaqueous Synthesis of TiO2Nanocrystals Using TiF4 to Engineer Morphology, Oxygen VacancyConcentration, and Photocatalytic Activity. J. Am. Chem. Soc. 2012,134, 6751−6761.(74) Grabstanowicz, L. R.; Gao, S.; Li, T.; Rickard, R. M.; Rajh, T.;Liu, D.-J.; Xu, T. Facile Oxidative Conversion of TiH2 to High-Concentration Ti3+-Self-Doped-TiO2 with Visible Light Photoactivity.Inorg. Chem. 2013, 52, 3884−3890.
The Journal of Physical Chemistry C Article
dx.doi.org/10.1021/jp501203h | J. Phys. Chem. C 2014, 118, 8462−84738473


![POLITECNICO DI TORINO Repository ISTITUZIONALE...MsSC45Cu [A m2/kg]: saturation magnetization value of copper doped glass ceramics. Figure 7.22: Amount of magnetite in the silver-doped](https://static.fdocumenti.com/doc/165x107/60b9196e9f6fa410c850d97e/politecnico-di-torino-repository-istituzionale-mssc45cu-a-m2kg-saturation.jpg)