Fabio Malberti Divisione di Nefrologia e Dialisi Cremona · ALTERAZIONI DEL METABOLISMO...
43
ALTERAZIONI DEL METABOLISMO CALCIO-FOSFORO E DIETA IPOPROTEICA Fabio Malberti Divisione di Nefrologia e Dialisi Cremona
Transcript of Fabio Malberti Divisione di Nefrologia e Dialisi Cremona · ALTERAZIONI DEL METABOLISMO...

ALTERAZIONI DEL METABOLISMOCALCIO-FOSFORO E DIETA IPOPROTEICA
Fabio Malberti
Divisione di Nefrologia e Dialisi Cremona
•Fosforemia e mortalità•Fosforemia e progressione IR•Target di fosforemia nei vari stadi di CKD•Quali dati nella realtà clinica•Effetti clinici della restrizione dietetica•Raccomandazioni
AGENDA
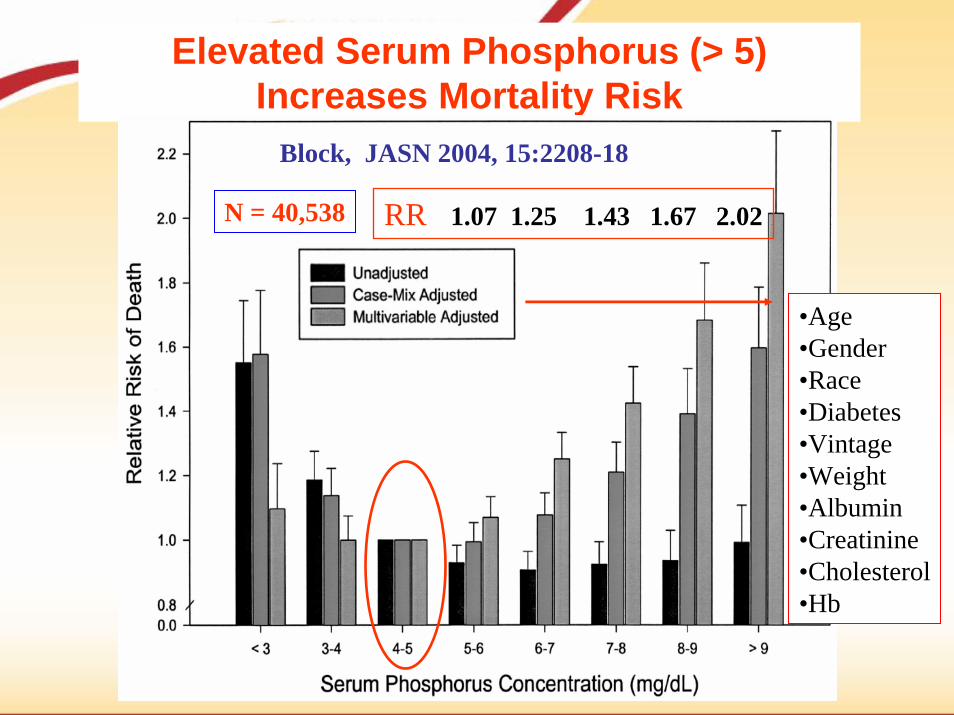
Elevated Serum Phosphorus (> 5)Increases Mortality Risk
Block, JASN 2004, 15:2208-18
RR 1.07 1.25 1.43 1.67 2.02
•Age•Gender•Race•Diabetes•Vintage•Weight•Albumin•Creatinine•Cholesterol•Hb
N = 40,538
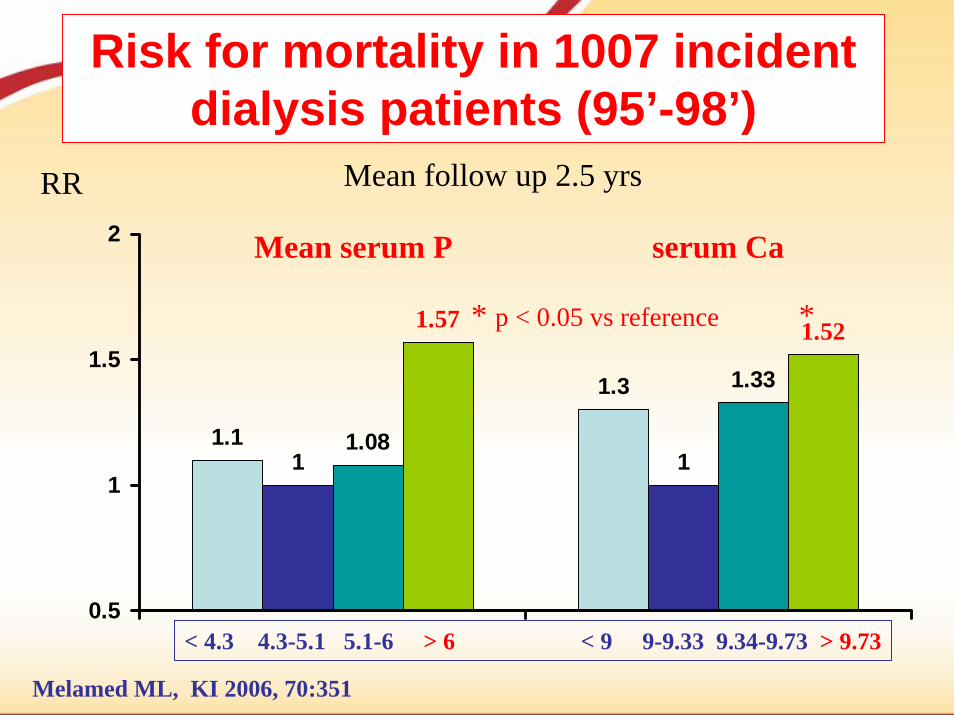
Risk for mortality in 1007 incident dialysis patients (95’-98’)
1.1
1.3
1 11.08
1.33
1.521.57
0.5
1
1.5
2
RR
Melamed ML, KI 2006, 70:351
< 4.3 4.3-5.1 5.1-6 > 6 < 9 9-9.33 9.34-9.73 > 9.73
Mean follow up 2.5 yrs
Mean serum P serum Ca
* p < 0.05 vs reference *

Risk for mortality in 1007 incident dialysis patients (95’-98’)
1.3
0.861 1.01
1.5
1
1.87 1.87
0.5
1
1.5
2
RR
Melamed ML, KI 2006, 70:351
< 40 40-48 48-56 > 56 < 76 76-160 161-308 > 308
Mean Ca x P serum PTH* p < 0.05 vs reference *

Schwarz, S. et al. Clin J Am Soc Nephrol 2006;1:825-831
Composite outcome of ESRD and doubling of serum creatinine associated with serum P
unadjusted and after adjustment for age, race, systolic (SBP) and diastolic BP (DBP), diabetes, smoking status, estimated GFR (eGFR), serum albumin, calcium, bicarbonate, blood urea nitrogen (BUN), hemoglobin,
24-h urine protein, and use of calcium-containing phosphate binders and angiotensin-converting enzyme inhibitors (ACEI)/angiotensin II receptor blockers (ARB)
985 CKD stage 1- 5 from Salem Veterans AMC, median follow up: 2.1 yrs
RR vs P<3.3 = 1.6(1.06-2.4)

Voormolen, N. et al. NDT 2007 22:2909-
Plasma phosphate at the start of pre-dialysis care and subsequent decline in renal function during follow-up
448 pts followed from 1999 to 2004
Adjusted RR of decline = 0.178 ml/min/mos for 1 mg% of P
Mortality risk for each mg/dl of P = 1.62(adjusted for age, sex, GFR, comorbids)
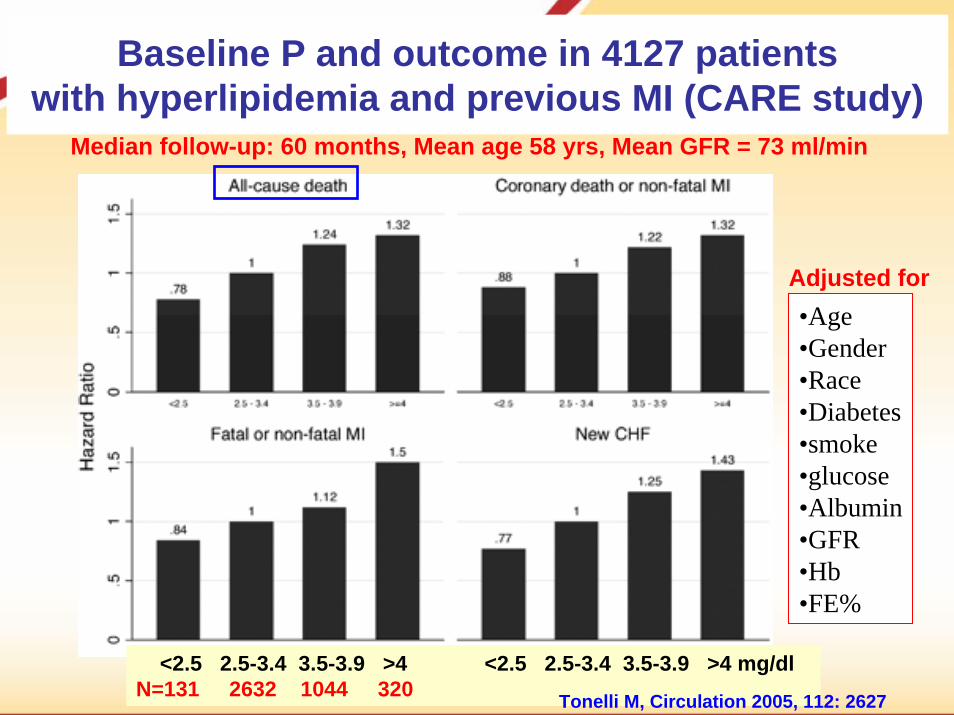
Baseline P and outcome in 4127 patientswith hyperlipidemia and previous MI (CARE study)
<2.5 2.5-3.4 3.5-3.9 >4 <2.5 2.5-3.4 3.5-3.9 >4 mg/dlN=131 2632 1044 320
Median follow-up: 60 months, Mean age 58 yrs, Mean GFR = 73 ml/min
•Age•Gender•Race•Diabetes•smoke•glucose•Albumin•GFR•Hb •FE%
Adjusted for
Tonelli M, Circulation 2005, 112: 2627

Iperfosforemia
PTH
Ca
Resistenza al PTH
Resistenza al CT
Calcitriolo
MortalitàCalcificazioni vascolari
Prolifer cell. Parat

Eknoyan G et al. Am J Kidney Dis 2003;42(Suppl 3):1–201
CKD stage
GFR range PTH target*
3 30-59
15-29
< 15
35–70 pg/mL[4–8 pmol/L]
4 70–110 pg/mL[8–12 pmol/L]
5 150–300 pg/mL[16.5–33.0]
* Reference = Allegro iPTH Nichols
P target2.7–4.6 mg/dl[0.9–1.5 mmol/L]2.7–4.6 mg/dl[0.9–1.5 mmol/L]3.5–5.5 mg/dl[1.1–1.8 mmol/L]

Serum P and creatinine clearance
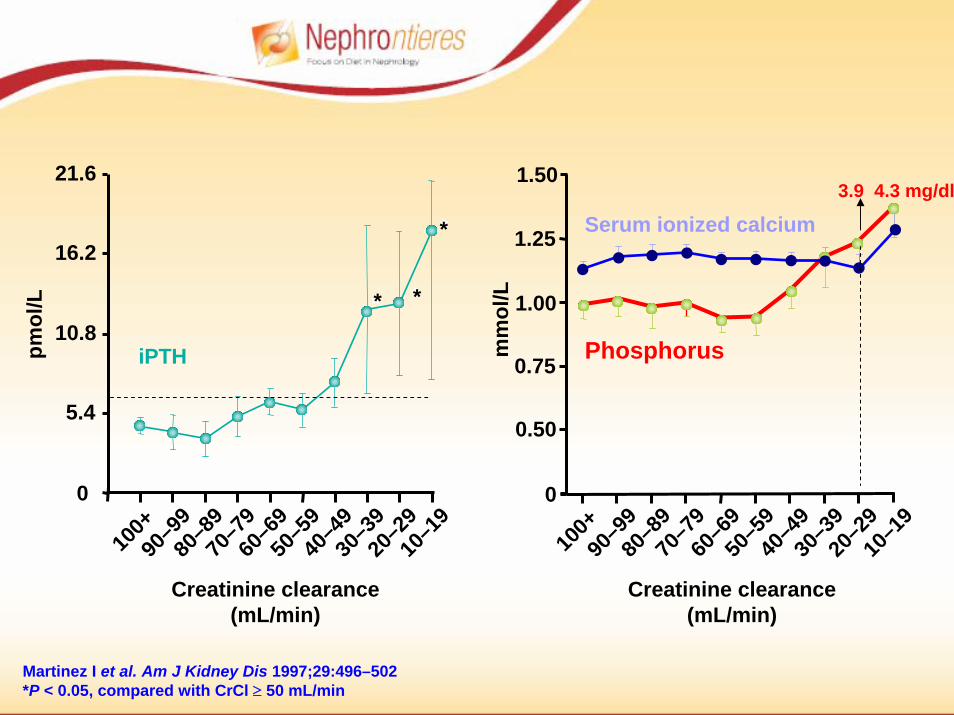
Martinez I et al. Am J Kidney Dis 1997;29:496–502*P < 0.05, compared with CrCl ≥ 50 mL/min
0
100+
90–9
980
–89
70–7
960
–69
50–5
940
–49
30–3
920
–29
10–1
9
mm
ol/L
0
5.4
10.8
16.2
21.6
100+
90–9
980
–89
70–7
960
–69
50–5
940
–49
30–3
920
–29
10–1
9
pmol
/L
iPTH
Creatinine clearance (mL/min)
*
*** *
*
Creatinine clearance (mL/min)
0.75
1.00
1.25
1.50
Serum ionized calcium
Phosphorus
0.50
3.9 4.3 mg/dl

Laboratory data during follow up:105 CKD (stage 4) patients
20
1513
11
17
21
0
10
20
30
Hb < 100 g/L Ca < 8.4 mg/dl Phosphate > 4.8
Initial visit follow up (0.5-4 yrs)
Thanamayooran S et al, NDT 2005, 20: 2385
% of patients
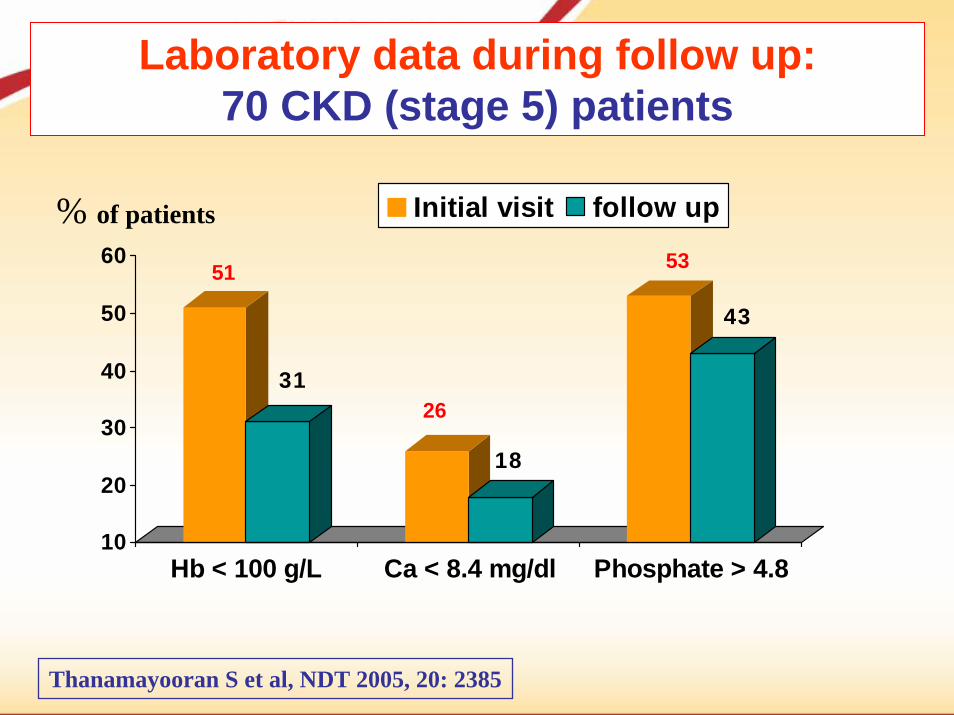
Laboratory data during follow up:70 CKD (stage 5) patients
51
3126
18
53
43
10
20
30
40
50
60
Hb < 100 g/L Ca < 8.4 mg/dl Phosphate > 4.8
Initial visit follow up
Thanamayooran S et al, NDT 2005, 20: 2385
% of patients

Ca and Phosphate levels during follow up:367 CKD pts followed for at least 3 months
35.4 6.8
17.4
0
10
20
30
Ca < 8.4 mg/dl P > 4.8 mg/dl
Initial visit follow up (mean 21, median 18 months)Cremona Hospital (initial visit between 1/01 and 4/05)
%
Initial lastGFR (MDRD-6) 28±19 25±19 ml/min/1.73m2 (p < 0.001 vs initial)Stage V,% of pts 19 33
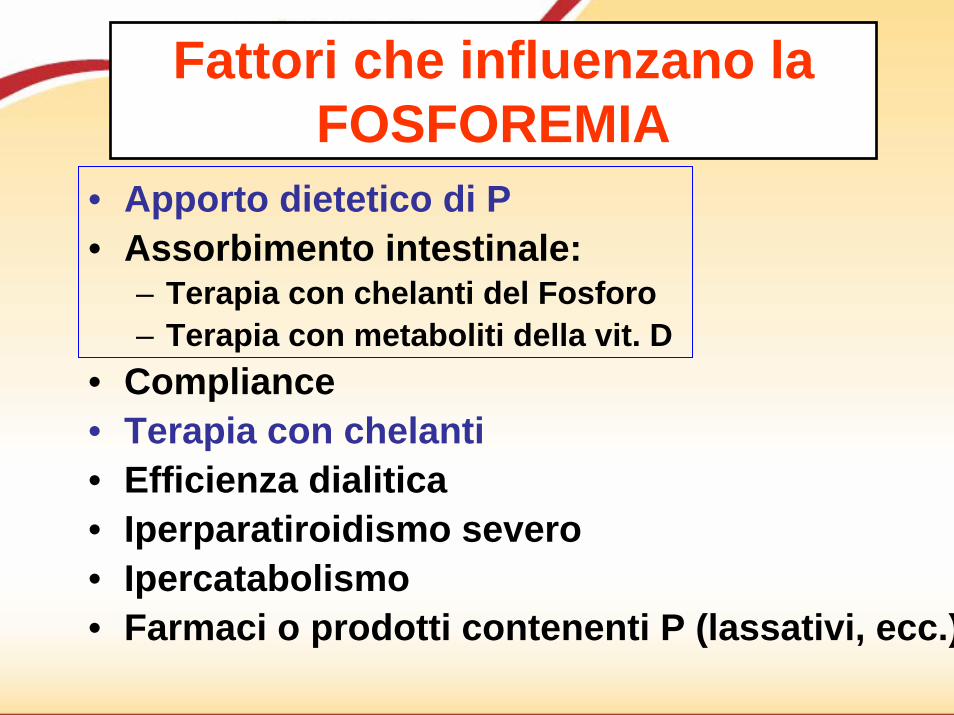
Fattori che influenzano la FOSFOREMIA
• Apporto dietetico di P• Assorbimento intestinale:
– Terapia con chelanti del Fosforo– Terapia con metaboliti della vit. D
• Compliance• Terapia con chelanti• Efficienza dialitica• Iperparatiroidismo severo• Ipercatabolismo • Farmaci o prodotti contenenti P (lassativi, ecc.)

80
60
87
50
60
70
80
90
100
C HD - HD+ VitD
Assorbimento intestinale di P
Ramirez KI 1986; 30: 753
%Pasto con 310 mg di P
(2 μg/die)
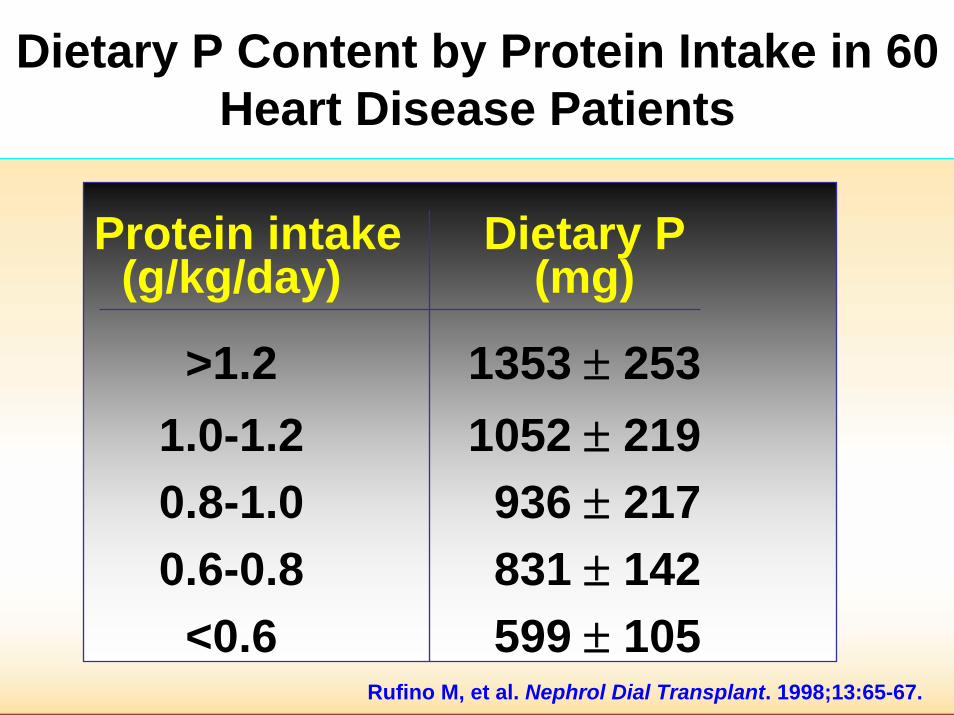
Dietary P Content by Protein Intake in 60 Heart Disease Patients
Protein intake Dietary P(g/kg/day) (mg)
>1.2 1353 ± 2531.0-1.2 1052 ± 2190.8-1.0 936 ± 2170.6-0.8 831 ± 142
<0.6 599 ± 105Rufino M, et al. Nephrol Dial Transplant. 1998;13:65-67.

65.6
5.14.5
9.69.99.89.7
4
5
6
7
8
9
10
< 50 50-59 60-69 > 69
P Ca
pizza8,6
71
5952
74
40
50
60
70
80
< 50 50-59 60-69 > 69
Prot
eine
g
/day
mg/dl
Lorenzo V et al AJKD 2001, 37: 1260-6
years
PTH pg/ml 361 357 215 150
1.29g/kg
1.10g/kg
0.88g/kg
0.84g/kg
N° = 207 dialysis pts

Controllo intake di Calcio
(ev. supplementazione)CKD stadio III-V
Controllointake di Fosforo
Somministrazione Vitamina D e Chelanti
del Fosforo
Low Protein Diet
Strategie terapeutiche nel paziente con CKD
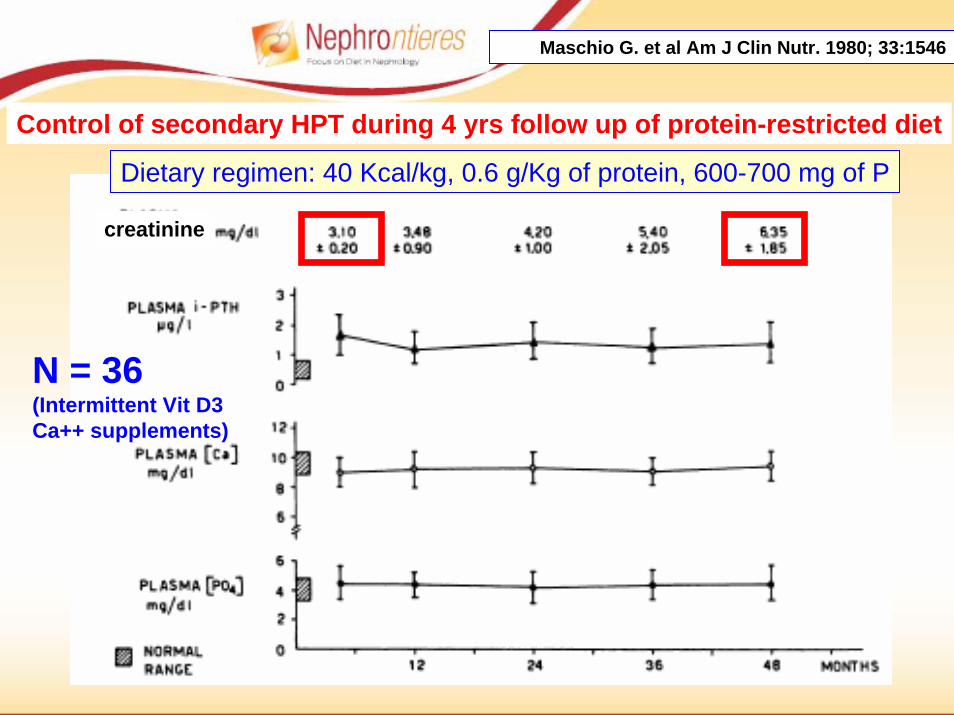
Maschio G. et al Am J Clin Nutr. 1980; 33:1546
Control of secondary HPT during 4 yrs follow up of protein-restricted diet
Dietary regimen: 40 Kcal/kg, 0.6 g/Kg of protein, 600-700 mg of P
N = 36(Intermittent Vit D3Ca++ supplements)
creatinine

Dopo 18 mesi di trattamento LPD nei pazienti con IRC (cr. 1,6-2,8 mg/dl), si osservava un miglioramento delle patologie a ridotto ed elevato turn-over.
Dieta Ipoproteica ed IperPTH
Maschio G. et al Am J Clin Nutr. 1980;33:1546-1554
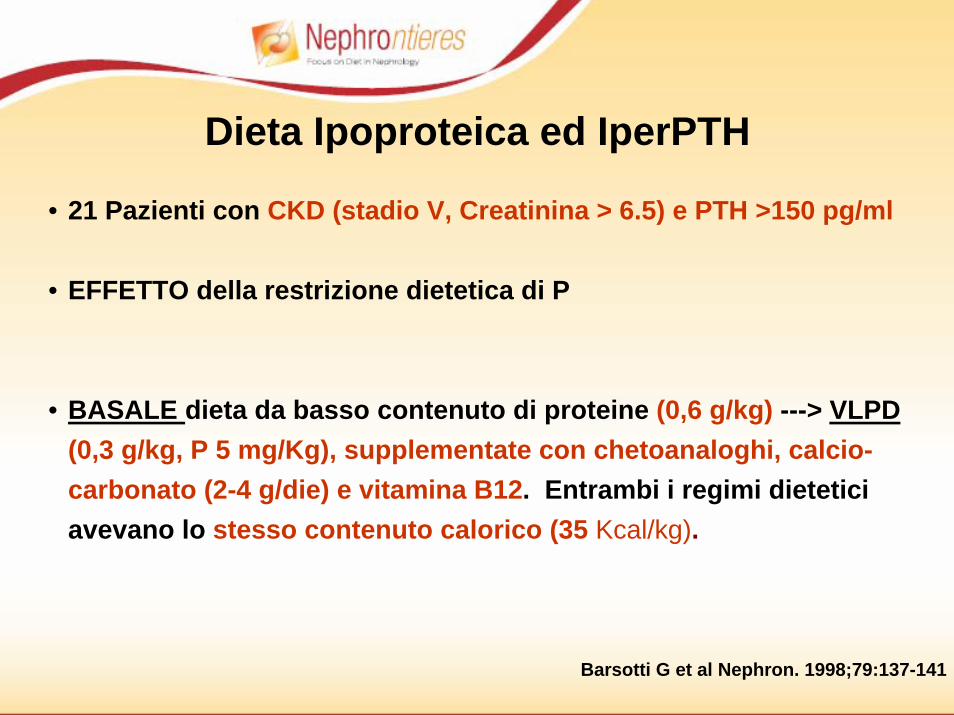
• 21 Pazienti con CKD (stadio V, Creatinina > 6.5) e PTH >150 pg/ml
• EFFETTO della restrizione dietetica di P
• BASALE dieta da basso contenuto di proteine (0,6 g/kg) ---> VLPD(0,3 g/kg, P 5 mg/Kg), supplementate con chetoanaloghi, calcio-carbonato (2-4 g/die) e vitamina B12. Entrambi i regimi dietetici avevano lo stesso contenuto calorico (35 Kcal/kg).
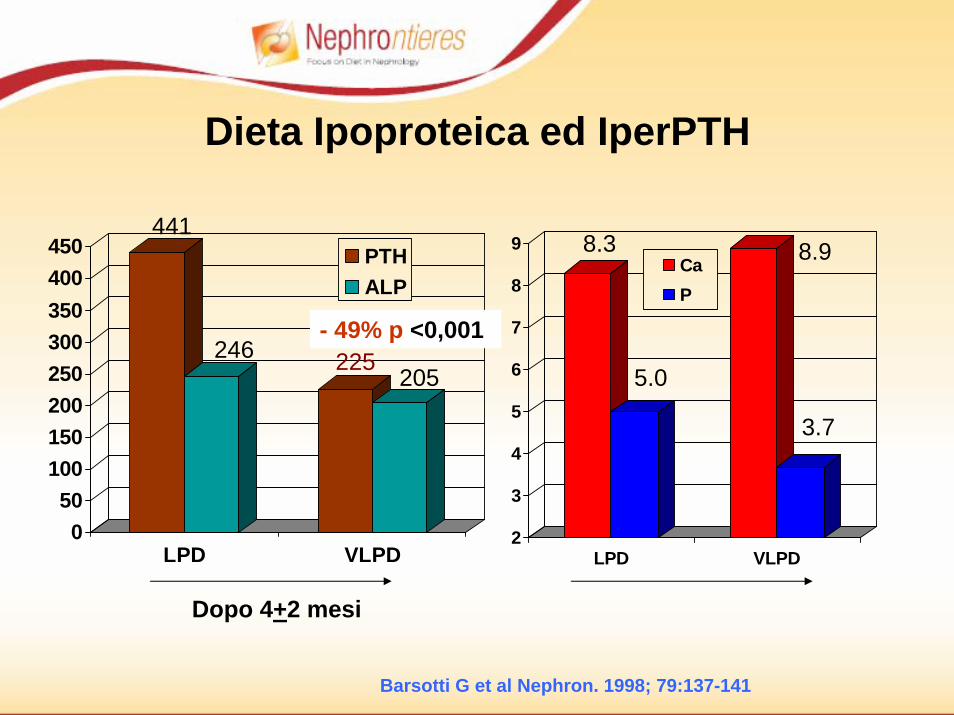
Dieta Ipoproteica ed IperPTH
Barsotti G et al Nephron. 1998;79:137-141
050
100150200250300350400450
LPD VLPD
PTHALP
Dopo 4+2 mesi
Dieta Ipoproteica ed IperPTH
Barsotti G et al Nephron. 1998; 79:137-141
- 49% p <0,001
2
3
4
5
6
7
8
9
LPD VLPD
CaP
246205 5.0
3.7
8.3 8.9441
225

Pedrini, M. T. et. al. Ann Intern Med 1996;124:627-632
Effect of dietary protein restriction on progression ofnondiabetic renal diseases

Pedrini, M. T. et. al. Ann Intern Med 1996;124:627-632
Effect of dietary protein restriction on progression of diabeticrenal disease

Hansen HP et al, KI 2002; 62: 220–228
Estimated dietary protein intake in type 1 diabetic patientswith progressive nephropathy (mean GFR decrease: 7.1 ml/min/yr).
Usual protein diet: 1.02 g/Kg/dLow protein diet: 0.89 g/Kg/d
p < 0.005
Comparable BP and glycemic control, 85% on ACE-I
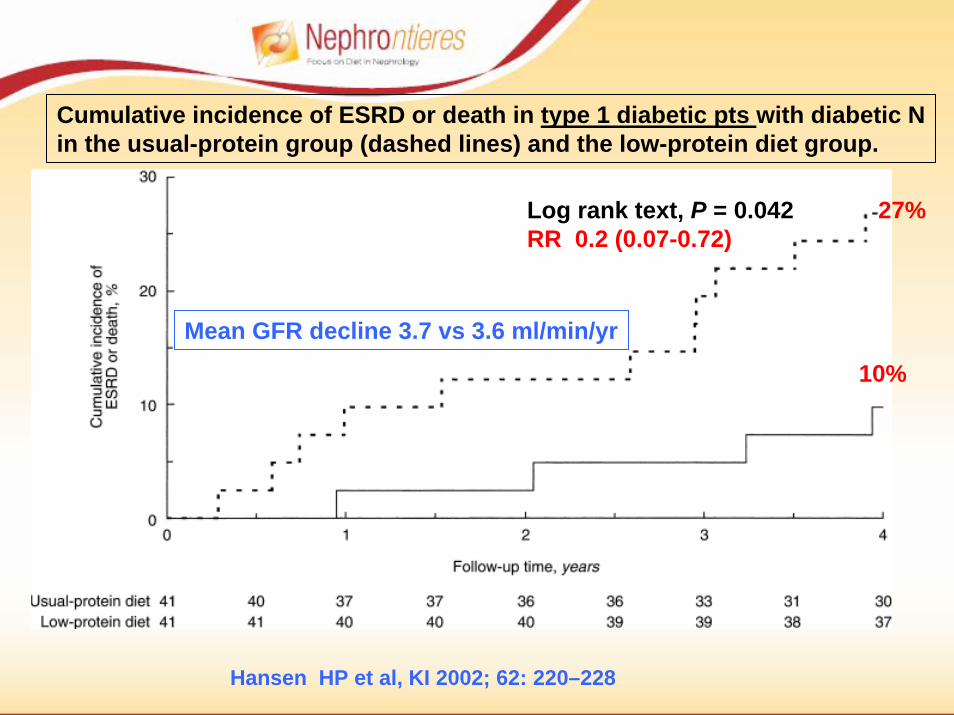
Cumulative incidence of ESRD or death in type 1 diabetic pts with diabetic Nin the usual-protein group (dashed lines) and the low-protein diet group.
Log rank text, P = 0.042RR 0.2 (0.07-0.72)
10%
27%
Hansen HP et al, KI 2002; 62: 220–228
Mean GFR decline 3.7 vs 3.6 ml/min/yr
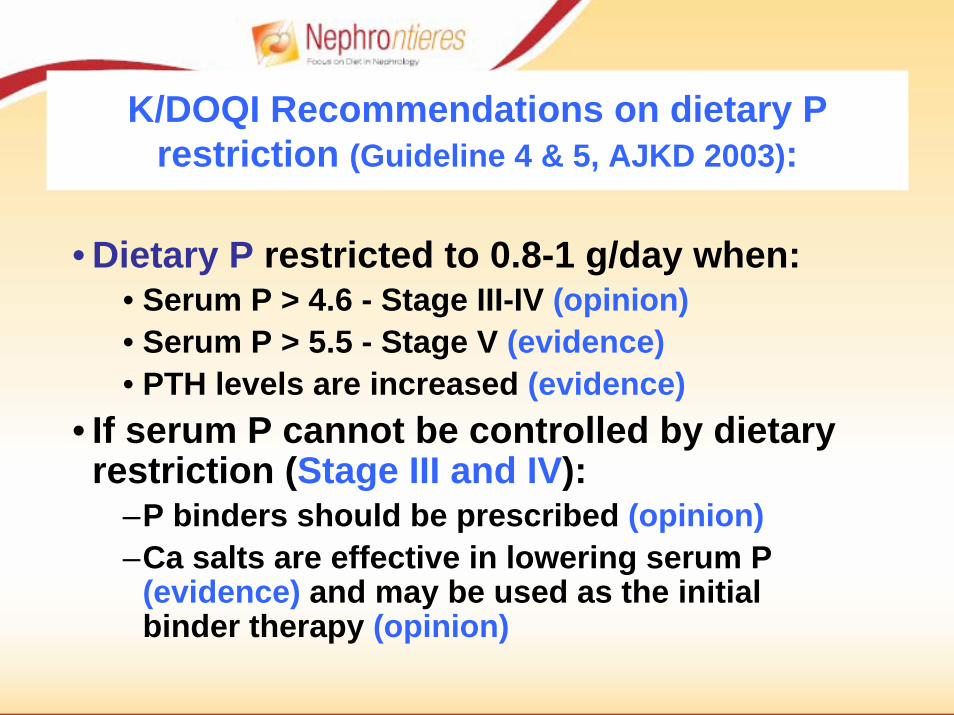
K/DOQI Recommendations on dietary Prestriction (Guideline 4 & 5, AJKD 2003):
• Dietary P restricted to 0.8-1 g/day when:• Serum P > 4.6 - Stage III-IV (opinion)• Serum P > 5.5 - Stage V (evidence)• PTH levels are increased (evidence)
• If serum P cannot be controlled by dietary restriction (Stage III and IV):
–P binders should be prescribed (opinion)–Ca salts are effective in lowering serum P
(evidence) and may be used as the initial binder therapy (opinion)
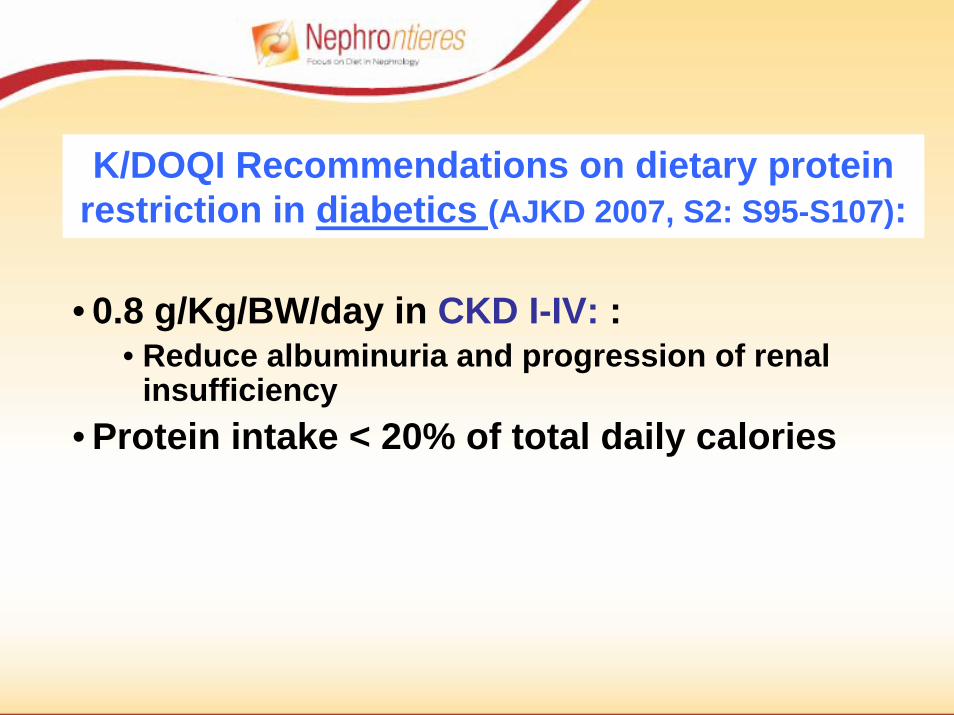
K/DOQI Recommendations on dietary protein restriction in diabetics (AJKD 2007, S2: S95-S107):
• 0.8 g/Kg/BW/day in CKD I-IV: :• Reduce albuminuria and progression of renal
insufficiency• Protein intake < 20% of total daily calories


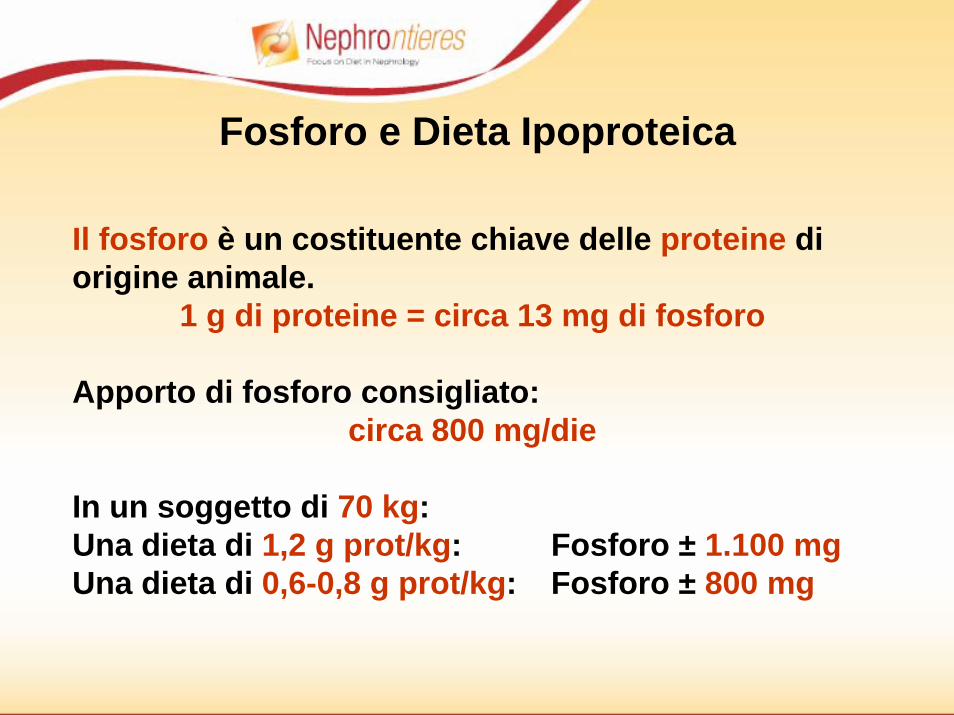
Il fosforo è un costituente chiave delle proteine di origine animale.
1 g di proteine = circa 13 mg di fosforo
Apporto di fosforo consigliato: circa 800 mg/die
In un soggetto di 70 kg:Una dieta di 1,2 g prot/kg: Fosforo ± 1.100 mgUna dieta di 0,6-0,8 g prot/kg: Fosforo ± 800 mg
Fosforo e Dieta Ipoproteica

Un metodo per ridurre ulteriormente il contenuto dei fosfati con la dieta è quello della bollitura.
Il 21-27% di fosforo può essere eliminato dai cibi vegetali come anche da
quelli animali.
Fosforo = consigli dietetici
Barsotti e Cupisti: J Ren Nutr 2005;1:189-192
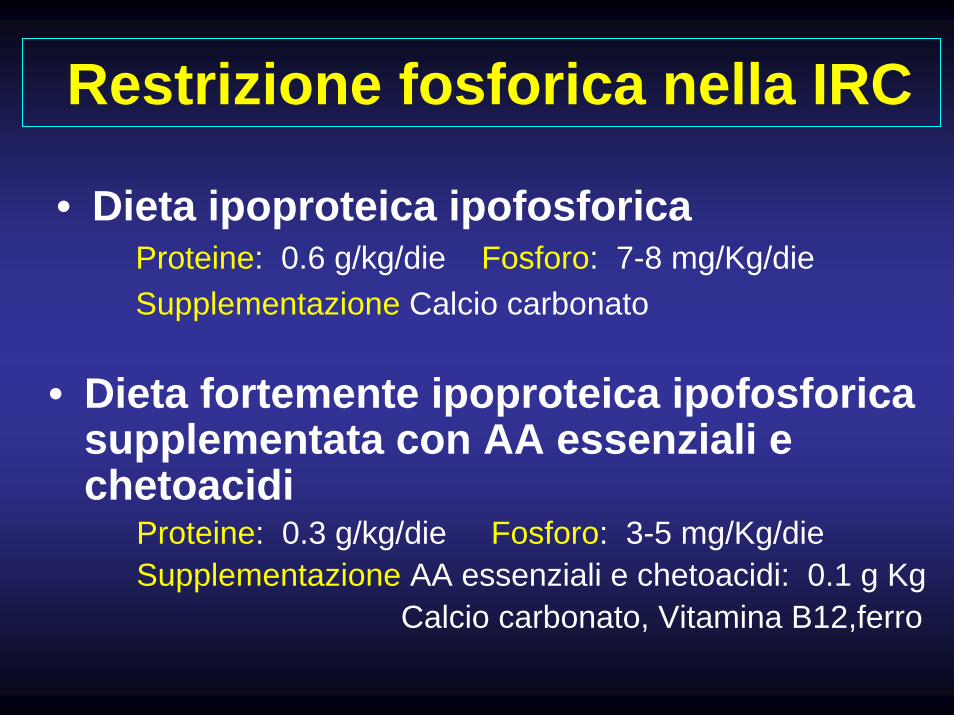
Restrizione fosforica nella IRC
• Dieta fortemente ipoproteica ipofosforica supplementata con AA essenziali e chetoacidi
Proteine: 0.3 g/kg/die Fosforo: 3-5 mg/Kg/dieSupplementazione AA essenziali e chetoacidi: 0.1 g Kg
Calcio carbonato, Vitamina B12,ferro
• Dieta ipoproteica ipofosforicaProteine: 0.6 g/kg/die Fosforo: 7-8 mg/Kg/dieSupplementazione Calcio carbonato
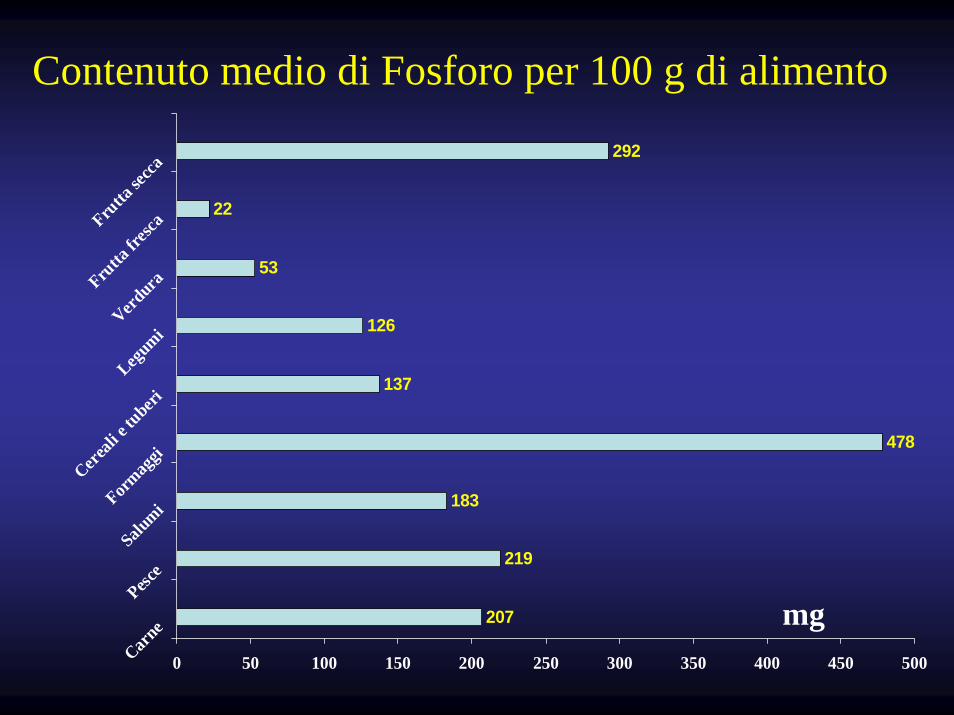
207
219
183
478
137
126
53
22
292
0 50 100 150 200 250 300 350 400 450 500Carne
Pesce
SalumiForm
aggi
Cereali
e tuberi
Legumi
VerduraFru
tta fr
escaFru
tta se
cca
mg
Contenuto medio di Fosforo per 100 g di alimento
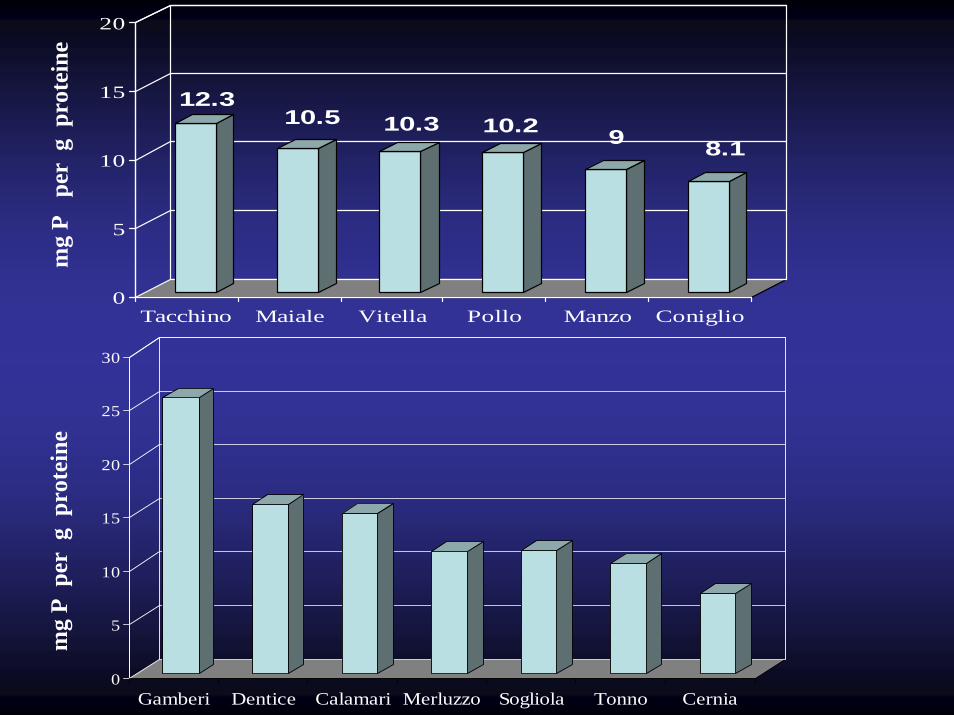
12.310.5 10.3 10.2 9 8.1
0
5
10
15
20
Tacchino Maiale Vitella Pollo Manzo Coniglio
0
5
10
15
20
25
30
Gamberi Dentice Calamari Merluzzo Sogliola Tonno Cernia
mg
P p
er g
pro
tein
em
g P
per
g p
rote
ine

12.2 12.1
7.66.6 6.1
0.0
5.0
10.0
15.0
20.0
mortad. salsiccia p. cotto p. crudo salamepizza
8,6
0
5
10
15
20
25
30
patate paneintegrale
biscotti riso pasta pane tipo0
cornflakes
mg
P p
er g
pro
tein
em
g P
per
g
pro
tein
e
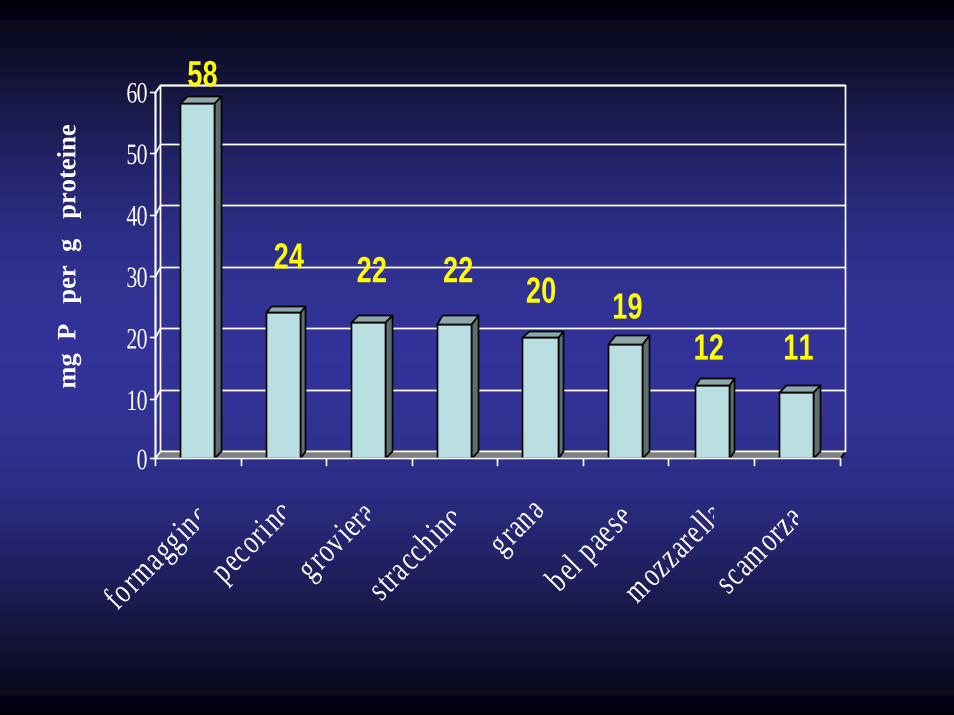
58
24 22 22 20 1912 11
0
10
20
30
40
50
60
formaggino
pecorin
ogrov
ierastra
cchino gran
abel p
aese
mozzarell
asca
morza
mg
P
per
g
prot
eine
020406080
100120140160
Vino
Birra
Coca cola
" Light "
mg
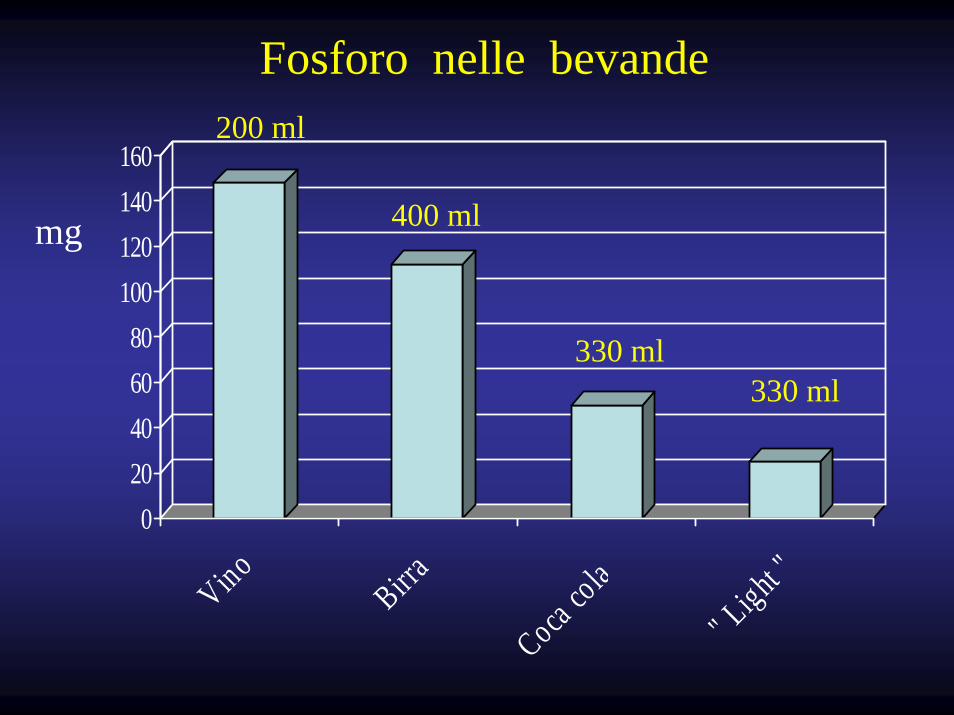
330 ml330 ml
200 ml
400 ml
Fosforo nelle bevande
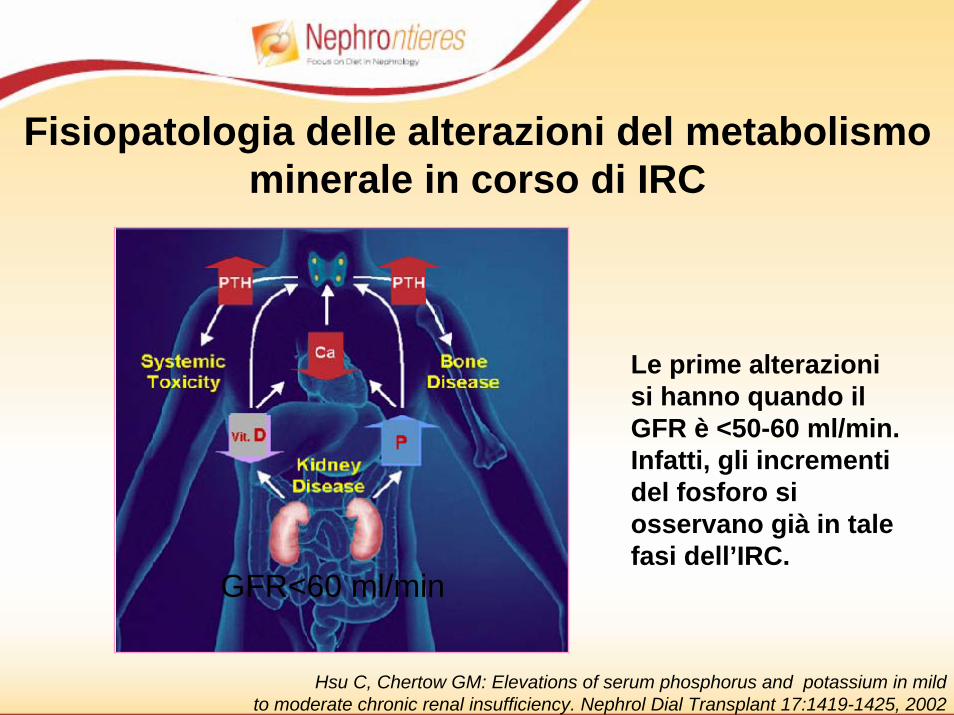
GFR<60 ml/min
Le prime alterazioni si hanno quando il GFR è <50-60 ml/min. Infatti, gli incrementi del fosforo si osservano già in tale fasi dell’IRC.
Fisiopatologia delle alterazioni del metabolismominerale in corso di IRC
Hsu C, Chertow GM: Elevations of serum phosphorus and potassium in mildto moderate chronic renal insufficiency. Nephrol Dial Transplant 17:1419-1425, 2002
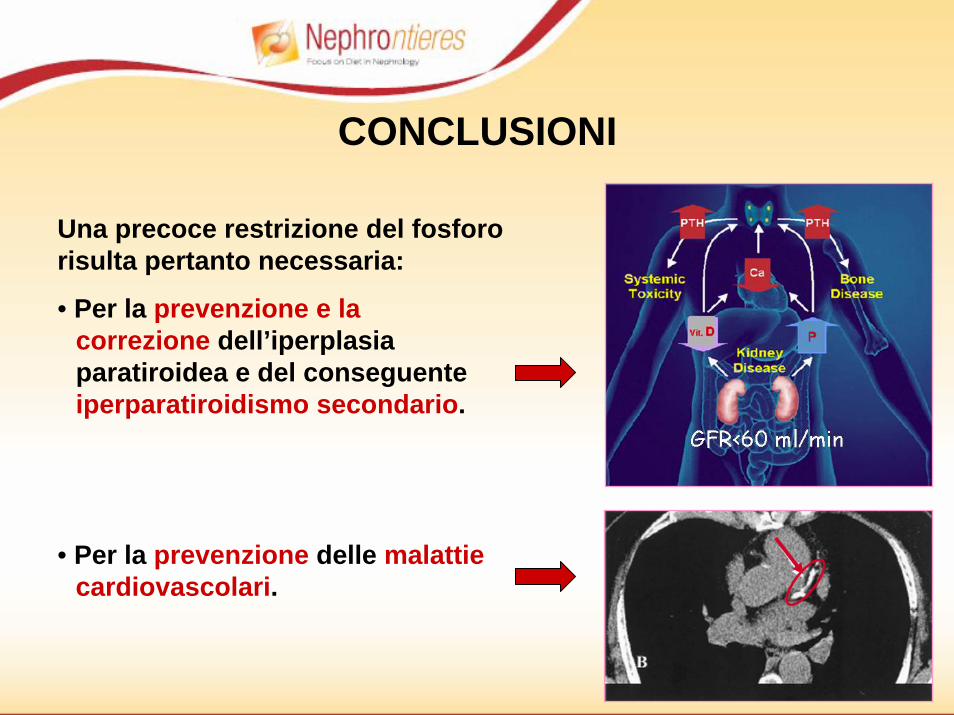
Una precoce restrizione del fosforo risulta pertanto necessaria:
• Per la prevenzione e la correzione dell’iperplasia paratiroidea e del conseguenteiperparatiroidismo secondario.
CONCLUSIONI
• Per la prevenzione delle malattie cardiovascolari.
Conclusioni• Una corretta dieta ipoproteica-ipofosforica è
efficace nel controllo della fosforemia e nella prevenzione dell’iperparatiroidismo secondario nei pazienti in terapia conservativa
• La manipolazione dietetica da sola non è in grado di controllare l’iperfosforemia nel paziente in dialisi convenzionale, se non con il rischio di malnutrizione proteica