Doha Round Outcomes: hype or danger?
26
Doha Round Outcomes: hype or danger? Luca Salvatici (Università degli studi del Molise) •Programma di ricerca co-finanziato PRIN: Il nuovo negoziato multilaterale dell'Organizzazione Mondiale del Commercio (Doha Round): gli scenari di liberalizzazione e le implicazioni per l'economia italiana. •European Union Specific Targeted Research or Innovation Project (VI Framework Programme): Agricultural Trade Agreements SPERA International Seminar – Pavia, 22 October 2007
Transcript of Doha Round Outcomes: hype or danger?

Doha Round Outcomes: hype
or danger?Luca Salvatici (Università degli studi del Molise)
•Programma di ricerca co-finanziato PRIN: Il nuovo negoziato multilaterale dell'Organizzazione Mondiale del
Commercio (Doha Round): gli scenari di liberalizzazione e le implicazioni per l'economia italiana.
•European Union Specific Targeted Research or Innovation Project (VI Framework Programme): Agricultural Trade
Agreements
SPERA International Seminar – Pavia, 22 October 2007

2
Outline1. GTAP model and data:
• CGE model and baseline
2. Simulation scenarios: the impact of a (possible?) agreement at the end of the Doha Development Agenda
3. Results:
• Welfare
• Adjustment costs (structural change)
• Trade flows and comparison of trade policy restrictiveness across countries / liberalization scenarios
4. Concluding remarks
SPERA International Seminar – Pavia, 22 October 2007

Model & Data
Multi-sector and multi-region, static computable general equilibrium model (Global Trade Analysis Project – GTAP)
• Demand = CDE for private consumption, with price and income elasticities from the literature and derived compensated price elasticities, Cobb-Douglas at the upper nest
• Supply = CES for primary factors and intermediates, Leontief for the upper nest
• Trade = Armington specification assumes quality differential between the same good produced in different countries/regions: substitution elasticities homogenous across countries, and different across product
• Factor mobility (within regions) = Imperfect (only agriculture) for land and natural resource; full for capital and labor (CET)
• Policies = are introduced as wedges between countries (different from transportation margins cif/fob), and between production and consumption
• Data = GTAP v.6 (2001) and MacMaps v.2 (2004)
3SPERA International Seminar – Pavia, 22 October 2007

SPERA International Seminar – Pavia, 22 October 2007 4
AggregationsREGIONS (22) SECTORS (28) Endowments (5)
Rest of Europe Rice Land
Rest of America Cereals Skilled labour
Rest of Sub-Saharan Africa Oilseeds Unskilled labour
Australia&New Zealand Vegetables&fruit Capital
Middle East&North Africa Sugar Natural resources
China Vegetable oils&fats
Rest of Asia Meats
EU 14 Other foods
CEECs Dairy products
Bulgaria&Romania Processed rice
Italy Natural resources
Japan Water
India Construction
Canada Trade
United States Communication
Mexico Financial services
Argentina Transport
Brazil Other services
NOWTO Textiles
Turkey Leather
ASEAN Wearing apparel
LDCs Petroleum&coal
Chemical&plastic
Other manufactures
Metal products
Motor vehicles
Electronic equipment
Wood products
Baseline
Imperfect competition closure (non agricultural products): •economies of scale (estimates from the literature: Francois, 1998)•monopolistic competition (i.e., zero profits)Exogenous variables (2004):•GDP (IMF)•population (UN projections)•labor force (Faostat)•total factors’ productivity (Hertel and Martin, 2000)Policy changes:•database integrated with of AVEs for services drawn from the literature (CEPII)•China WTO membership •EU (27) enlargement•Everything But Arms•Agricultural Policy reforms
– EU Common Agricultural Policy: Agenda 2000 and its Midterm Review– USA: Farm Security and Rural Investment Act– Mexico: PROCAMPO– China: domestic subsidies
5SPERA International Seminar – Pavia, 22 October 2007
6
Outline
1. GTAP model and data:
• CGE model and baseline
2. Simulation scenarios: the impact of a
(possible?) agreement at the end of the
Doha Development Agenda
SPERA International Seminar – Pavia, 22 October 2007

DDA final agreement (if any…)Issues already agreed upon
� Lesser commitments by developing countries (special and differential treatment)
� Preferential market access to least developed countries
� Sensitive/Special products clauses
� Swiss formula in industry
� Elimination of export subsidies
� Progressivity (tiers) in agriculture tariff cuts
� Disciplines encouraging decoupling of domestic support
Main issues still to be
agreed upon
• Level of reduction rates
(tariffs, domestic
support)
• Number and treatment
of Sensitive/Special
products
• Extent of the S&D
treatment for
developing countries
7SPERA International Seminar – Pavia, 22 October 2007

Why is it important to work at
the most detailed level?
8
• WTO negotiations: the cuts are applied to bound duties
• Applied (bilateral) tariffs are not necessarily cut down if there is water (difference between MFN bound and applied tariffs) or a preference margin (difference between MFN and bilateral applied tariffs => Preferences are proportionately more eroded than tariffs are cut
• Tariff changes calculated at the HS6 product level then aggregation of this product-by-product cuts using trade-weighted averages
SPERA International Seminar – Pavia, 22 October 2007

Example: 50% cut in the bound rate
0 10 20 30 40
P re f - LDC
MFN - LDC
MFN - P re f
P re f. marg ins:
LDC
P re fe rred
MFN
Bound
In itia l
Afte r lib °
SPERA International Seminar – Pavia, 22 October 2007

Tariff lines without actual cuts (%)
10
0%
10%
20%
30%
40%
50%
60%
70%
80%
90%
% Agr_min % Man_min % Agr_max % Man_max
SPERA International Seminar – Pavia, 22 October 2007

11
Outline
1. GTAP model and data:
• CGE model and baseline
2. Simulation scenarios: the impact of a
(possible?) agreement at the end of the
Doha Development Agenda
3. Results:
• Welfare
SPERA International Seminar – Pavia, 22 October 2007

Welfare: minimum
• Japan and EU present the largest net gains: efficiency (agriculture Japan) and TOT (imports EU)
• China and US present the largest losses: scale effects in manufactures (textile US, electronics and chemical China) and TOT
12
-10000
-5000
0
5000
10000
15000
20000
25000
M
i
o
U
S
$
efficiency scale terms of trade
SPERA International Seminar – Pavia, 22 October 2007

Welfare: maximum
GAINS: still Japan and EU but also ASEAN, India and LDCs
LOSSES: still China and USA due to scale effects deriving from changes in the textile sector (decrease US, increase China)
SPERA International Seminar – Pavia, 22 October 2007 13
-20000
-10000
0
10000
20000
30000
40000Mio US$
efficiency terms of trade scale

Welfare effects: too high or too
low?Welfare gains range between 0.1 and 0.3% of global GDP. Is this an higher or lower bound?
• General vs. partial equilibrium: – PE: no “dampening” feedback effects
– GE: more comprehensive approach
• “Neoclassical” (savings determine investment) vs. “Keynesian” macro-closure: no generalisation nor clear evidence
• Endogenous vs. fixed trade balance: larger gains
• Comparative static vs. dynamic: lower gains
• Imperfect competition and increasing returns to scale: larger gains
• Fixed capital stock: lower gains
• Larger Armington elasticities: larger gains
• High level of aggregation: lower gains (the sum of the welfare losses caused by an high and low tariff is greater than the loss associated to the average tariff applied in both markets)
• Future baseline: lower gains (other liberalization processes) but possibly larger in absolute terms
SPERA International Seminar – Pavia, 22 October 2007 14

SPERA International Seminar – Pavia, 22 October 2007 15
Outline
1. GTAP model and data:
• CGE model and baseline
2. Simulation scenarios: the impact of a (possible?) agreement at the end of the Doha Development Agenda
3. Results:
• Welfare
• Adjustment costs (structural change)

Benefits and costsGiven the admittedly limited welfare impact, is it really worth the effort?
• In order to assess the adjustment costs a commonly used method of measuring structural change in output (and employment) is the rate or coefficient of (compositional) structural change, often referred to as a SCI.
• The SCI for output may be defined as half the sum of the absolute value of the differences in value-added shares over time. The calculation is given by the formula:
where xi,t and xi,t-1 represent each industry’s share of total value-added at time (t) and (t-1).
• The use of absolute values ensures that positive and negative changes in industry shares do not cancel each other out when the values are summed across industries. The SCI is bounded between zero and 100, with zero representing no structural change while 100 indicates a complete reversal of structure.
SPERA International Seminar – Pavia, 22 October 2007 16
∑ −
−= 1,,2
1titi xxSCI

Structural Change Index
• At most, less than 5% of factors will have to move across our (admittedly rather large) sectors.
• Larger adjustment for ASEAN, China and India.
• Lower values for Mexico, USA and Italy (similar impact in both scenarios always lower than other EU members)
SPERA International Seminar – Pavia, 22 October 2007 17
0
0.5
1
1.5
2
2.5
3
3.5
4
4.5
5
15 mex 19 ita 14 usa 10 rame 16 arg 21
nowto
18 eu14 11 jpn 1 reur 4 acp 13 can 6 mena 2 cand 20 eu10 22 tur 5 oce 3 ldc 17 bra 12 ind 7 china 9 rsa 8 asean
MIN MAX

SPERA International Seminar – Pavia, 22 October 2007 18
Outline
1. GTAP model and data:
• CGE model and baseline
2. Simulation scenarios: the impact of a (possible?) agreement at the end of the Doha Development Agenda
3. Results:
• Welfare
• Adjustment costs (structural change)
• Trade flows and comparison of trade policy restrictiveness across countries / liberalization scenarios

Trade flows (maximum)
Overall volume growth: +3.3%
• Export > Import growth: Argentina, India, Messico and LDCs or USA (trade deficit reduction)
• Import > Export growth: Japan and EU, Brazil and China (trade surplus increasing nonetheless)
SPERA International Seminar – Pavia, 22 October 2007 19
0.0
5.0
10.0
15.0
20.0
25.0
30.0
rsa usa mena ldc arg ind mex rame acp asean ita can EU26 reur china tur bra oce
Import Export

How to compare the restrictiveness
of different trade policies?
• Focus on tariff data hoping that all other instruments are (perfectly) correlated.
• Which aggregation procedure across sectors? We follow Anderson and Neary (IER, 2003) using a theoretically-sound indicator: Mercantilistic Trade Restrictiveness Index (MTRI – import-volume equivalent index): what is the equivalent uniform tariff that would keep aggregate imports at their observed levels?
• Bilateral MTRI uniform tariffs with endogenous world prices (Antimiani, Conforti and Salvatici, RWE, 2008)
SPERA International Seminar – Pavia, 22 October 2007 20

Comparison across countries:
developed vs. developing (baseline)
• Developing countries (e.g., India) more protectionist than developed countries, but China protection is relatively lower (late accession)
• Regional patterns (though developing countries are not generally better off in terms of market access): – USA – America
– Japan – Asia & Oceania
– Italy (EU) – MENA, LDCs and ACP
SPERA International Seminar – Pavia, 22 October 2007 21
0
5
10
15
20
25
30
35
ldc tur reur acp mena rame nowto oce mex arg asean can rsa
Brazil China India Italy Japan USA

Comparison across sectors in the
baseline: the case of Italy (EU)
22
-5
0
5
10
15
20ldc
tur
reur
acp
mena
rame
nowto
jpn
ocechina
mex
arg
asean
usa
can
rsa
ind
bra
AGRICOLTURE MANUFACTURING SERVICES
SPERA International Seminar – Pavia, 22 October 2007
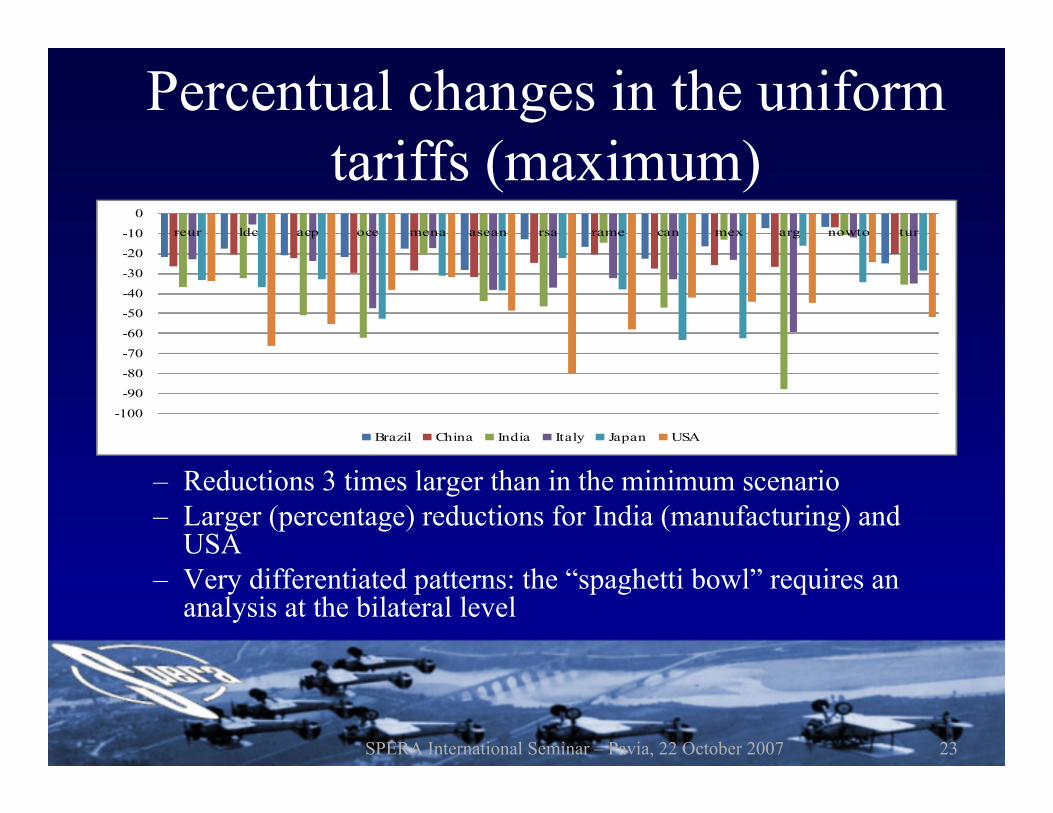
Percentual changes in the uniform
tariffs (maximum)
– Reductions 3 times larger than in the minimum scenario
– Larger (percentage) reductions for India (manufacturing) and USA
– Very differentiated patterns: the “spaghetti bowl” requires an analysis at the bilateral level
SPERA International Seminar – Pavia, 22 October 2007 23
-100
-90
-80
-70
-60
-50
-40
-30
-20
-10
0
reur ldc acp oce mena asean rsa rame can mex arg nowto tur
Brazil China India Italy Japan USA

24
Outline
1. GTAP model and data:
• CGE model and baseline
2. Simulation scenarios: the impact of a (possible?) agreement at the end of the Doha Development Agenda
3. Results:
• Welfare
• Adjustment costs (structural change)
• Trade flows and comparison of trade policy restrictiveness across countries / liberalization scenarios
4. Concluding remarks
SPERA International Seminar – Pavia, 22 October 2007
Conclusion: policy
• Overall, results suggest relatively small welfare gains and adjustment costs. Reasons: • binding overhang well taken into account considering applied tariffs on a
bilateral basis (HS6 level)
• gap between support being negotiated on (ceilings) and actual one (AMS)
• Results are consistent with expectations that a reduction in border protection is positively related to welfare improvements, especially through an increased role of comparative advantages in shaping market prices and returns to primary factors
• At the same time, there are difficulties for poorer and less diversified economies to capture the opportunities arising from a more liberal trade environment. Welfare losses arise in these countries from more limited possibilities to switch toward more competitive activities, while facing worsening terms of trade and preference erosion.
25SPERA International Seminar – Pavia, 22 October 2007

Conclusion: methodology
• There is not such a thing as the “right model”
• Recent results from other simulations and models (e.g., the World Bank – LINKAGE, the CEPII – MIRAGE) quite convergent: the benefits of liberalization are significantly lower (especially for developing countries) than the forecasts just a few years old. Reasons:
• early studies based themselves on various conjectures as to what the liberalization package would look like, and were generally too optimistic
• in the latest, updated models, the basic data is less out of date, and the world has less protectionism left to lose – so there are smaller benefits available from going the rest of the distance toward liberalization.
• Rich research agenda both in terms of theory (model structure and policy representation) and inputs (data and parameters: “models are like sausages” )
26SPERA International Seminar – Pavia, 22 October 2007