
DEVELOPMENT OF ADVANCED INTERFEROMETRIC … · TUTOR: PROF. PAOLO A. NETTI (DICMaPI) i Preface ......
103
UNIVERSITÀ DEGLI STUDI DI NAPOLI “FEDERICO II” FACOLTÀ DI INGEGNERIA DIPARTIMENTO DI INGEGNERIA DEI MATERIALI E DELLA PRODUZIONE DOTTORATO DI RICERCA IN INGEGNERIA DEI MATERIALI E DELLE STRUTTURE BIOMATERIALI XXVIII CICLO PhD Thesis DEVELOPMENT OF ADVANCED INTERFEROMETRIC TECHNIQUES FOR THE STUDY OF CELL-MATERIAL INTERACTION CANDIDATO: ALEJANDRO CALABUIG-BARROSO COORDINATORE: DOTT. SIMONETTA GRILLI (CNR-ISASI) TUTOR: PROF. PAOLO A. NETTI (DICMaPI)
Transcript of DEVELOPMENT OF ADVANCED INTERFEROMETRIC … · TUTOR: PROF. PAOLO A. NETTI (DICMaPI) i Preface ......

UNIVERSITÀ DEGLI STUDI DI NAPOLI “FEDERICO II”
FACOLTÀ DI INGEGNERIA
DIPARTIMENTO DI INGEGNERIA DEI MATERIALI E DELLA
PRODUZIONE
DOTTORATO DI RICERCA IN INGEGNERIA DEI MATERIALI E DELLE
STRUTTURE BIOMATERIALI
XXVIII CICLO
PhD Thesis
DEVELOPMENT OF ADVANCED INTERFEROMETRIC
TECHNIQUES FOR THE STUDY OF CELL-MATERIAL
INTERACTION
CANDIDATO: ALEJANDRO CALABUIG-BARROSO
COORDINATORE: DOTT. SIMONETTA GRILLI (CNR-ISASI)
TUTOR: PROF. PAOLO A. NETTI (DICMaPI)


i
Preface
The work presented in this thesis is the result of the doctoral studies started about
four years ago in the Department of Engineering of Materials and Production, at
the University of Naples “Federico II” (UNINA). The experimental work has
been performed partly in UNINA and partly at the Institute of Applied Sciences
and Intelligent Systems (ISASI) of the National Council of Research (CNR) in
Naples, Italy, where I am holder of a Research Grant.
The research work performed at the ISASI laboratories have been funded by the
Italian Ministero dell’Istruzione dell’Università e della Ricerca (MIUR) within
the Project: PANDION - Studio di sottosistemi funzionali inovativi per impieghi
spaziali (PON01_00375).
This thesis consists of an introductory part providing a background to the work
performed and the reprints of the publications.

ii
Acknowledgments
This thesis is the result of three years of work in some research institutes around
Naples and I wish to express here my gratitude to the people that helped and
supported me during this experience.
First of all I would like to thank the director of ISASI, Pietro Ferraro, for giving
me the opportunity to join his research group. My supervisors, Paolo Netti and
Simonetta Grilli, for their useful suggestions and the constant guide during the
whole doctorate course.
Of course I have to thank all my lab colleagues, without their help and
contribution a great part of the results presented here would have never been
obtained.
Last but not least, I’m very grateful to the PhD coordinator Prof. Giuseppe
Mensitieri. His management of the doctorate course has been friendly and
stimulating for our work as PhD students.

iii
Congress Assistance and List of Publications
Congress Assistance
During the last triennium:
1. “TOTAL INTERNAL REFLECTION HOLOGRAPHIC
MICROSCOPY IN A BIRREFRINGENT MEDIUM”. A. Calabuig, M. Paturzo,
and P. Ferraro. EOS topical meeting, Capri 2013 [OµS’13]
2. “COMMON-PATH CONFIGURATION IN TOTAL INTERNAL
REFLECTION DIGITAL HOLOGRAPHIY MICROSCOPY”. A. Calabuig, M.
Matrecano, M. Paturzo, and P. Ferraro. 2014 SPIE. PHOTONICS EUROPE -
Brussels, Belgium
3. “MONITORING CELL MORPHOLOGY DURING NECROSIS AND
APOPTOSIS BY QUANTITATIVE PHASE IMAGING”. Alejandro Calabuig,
Martina Mugnano, Simonetta Grilli, Lisa Miccio, and Pietro Ferraro. 2015 SPIE.
WORLD OF PHOTONICS CONGRESS – Munich, Germany
4. “IMAGING AND CHARACTERIZATION OF SURFACE RELIEF
GRATINGS ON AZOPOLYMER BY DIGITAL HOLOGRAPHIC
MICROSCOPY”. Carmela Rianna, Alejandro Calabuig, Maurizio Ventre, Silvia
Cavalli, Vito Pagliarulo, Simonetta Grilli, Pietro Ferraro, and Paolo Antonio
Netti. 2015 SPIE. WORLD OF PHOTONICS CONGRESS – Munich, Germany
5. “DIGITAL HOLOGRAPHY AND TOTAL INTERNAL REFLECTION
FLUORESCENCE TO IMAGE CELL/SUBSTRATE CONTACT”. Biagio
Mandracchia, Alejandro Calabuig, Oriella Gennari, Melania Paturzo and Pietro
Ferraro. EOS topical meeting, Capri 2015 [OµS’15].
6. “HOLOGRAPHIC IMAGING OF CELL NECROSIS INDUCED BY
LASER STIMULATION”. Martina Mugnano, Alejandro Calabuig, Lisa Miccio,
Simonetta Grilli and Pietro Ferraro. EOS topical meeting, Capri 2015 [OµS’15]
Before the last triennium:
7. “SUPERESOLUTION IN DIGITAL HOLOGRAPHIC MICROSCOPY”. A.
Calabuig, V. Mico, Z. Zalevsky, C. Ferreira, and J. Garcia. (IEEE, 2011), pp. 1–
3. Optics (WIO), Castellón, Spain (June 2011). Invited paper

iv
8. "TOWARDS FEMTOSECOND DIGITAL LENSLESS DIGITAL
HOLOGRAPHIC MICROSCOPY”. A. Calabuig, O. Mendoza-Yero, E.
Tajahuerce, J. Lancis, P. Andrés, and J. Garcia-Sucerquia.
focusonmicroscopy.org 850, 2006 (2012).
List of Publications
Publications during the last triennium:
I. A. Calabuig, M. Matrecano, M. Paturzo, and P. Ferraro, “Common-path
configuration in total internal reflection digital holography microscopy.” Opt.
Lett., vol. 39, no. 8, pp. 2471–4, 2014.
II. Vittorio Bianco, Melania Paturzo, Andrea Finizio, Alejandro Calabuig,
Bahram Javidi, Fellow, IEEE, and Pietro Ferraro, Senior Member, IEEE, “Clear
Microfluidics Imaging through Flowing Blood by Digital Holography.”, IEEE
JOURNAL OF SELECTED TOPICS IN QUANTUM ELECTRONICS, VOL.
20, NO. 3, MAY/JUNE 2014.
III. C. Rianna, A. Calabuig, M. Ventre, S. Cavalli, V. Pagliarulo, S. Grilli, P.
Ferraro, and P. A. Netti, “Reversible Holographic Patterns on Azopolymers for
Guiding Cell Adhesion and Orientation,” Appl. Mater. Interfaces, 2015, 7 (31),
pp 16984–16991.
IV. Alejandro Calabuig, Martina Mugnano, Simonetta Grilli, Lisa Miccio,
and Pietro Ferraro, “Investigating Fibroblast Cells under "Safe" and "Injurious"
Blue-Light Exposure by Holographic Microscopy,” (In press su Journal of
Biophotonics).
Publications before the last triennium:
V. A. Calabuig, V. Micó, J. Garcia, Z. Zalevsky, and C. Ferreira, "Single-
exposure super-resolved interferometric microscopy by red-green-blue
multiplexing." Optics Letters 36, 885–887 (2011). Selected paper in Virtual
Journal for Biomedical Optics (VJBO) Vol. 6, Iss. 4 — May. 4, 2011.
VI. A. Calabuig, J. Garcia, C. Ferreira, Z. Zalevsky, and V. Micó, "Resolution
improvement by single-exposure superresolved interferometric microscopy with
a monochrome sensor." Journal of the Optical Society of America A 28, 2346–
58 (2011).

v
VII. A. Calabuig, S. Sánchez-Ruiz, L. Martínez-León, E. Tajahuerce, M.
Fernández-Alonso, W. D. Furlan, J. a Monsoriu, and A. Pons-Martí, "Generation
of programmable 3D optical vortex structures through devil’s vortex-lens
arrays.," Applied optics 52, 5822–9 (2013).
VIII. O. Mendoza-Yero, A. Calabuig, E. Tajahuerce, J. Lancis, P. Andrés, and
J. Garcia-Sucerquia, "Femtosecond digital lensless holographic microscopy to
image biological samples.," Optics letters 38, 3205–7 (2013). Selected paper in
Virtual Journal for Biomedical Optics (VJBO) Vol. 8, Iss. 10 — Nov. 8, 2013
vi
Table of Contents
Preface i
Acknowledgments ii
Congress Assistance and List of Publications iii
Table of Contents vi
Chapter 1. Introduction 1
Abstract 1
1.1. Material Science and Engineering 2
1.2. Tissue Engineering 3
1.3. Cell-Material Interaction 3
1.4. Cell-Topography Crosstalk 5
1.5. Dynamic Topographic Signals 6
1.6. Azopolymer as biomaterial 7
1.7. Aims and outcomes 12
References 13
Chapter 2. Digital Holographic Microscopy 17
Abstract 17
2.1. Historical developments and general introduction 18
2.2. Holographic Recording and Optical Reconstruction 19
2.3. Digital Holographic Recording and Numerical Reconstruction 22
References 28
Chapter 3. Reversible holographic patterns on Azopolymer for guiding cell
adhesion and orientation 31
Abstract 31
3.1. Introduction 32
3.2. Materials and Methods 33
3.3. Results and Discussion 36

vii
3.4. Conclusions and Future Trends 45
References 46
Chapter 4. Imaging and characterization of Surface relief gratings on
azopolymer by digital holographic microscopy 51
Abstract 51
4.1. Introduction 52
4.2. Tools and Approaches 53
4.3. Results and Discussion 56
4.4. Conclusion and Future Trends 57
References 58
Chapter 5. Monitoring cell behavior under blue light exposure by DHM 62
Abstract 62
5.1. Introduction 63
5.2. Experimental Setup 65
5.3. Results and Discussion 68
5.4. Conclusion and Future Trends 72
References 73
Chapter 6. Common-path configuration in Total Internal Reflection Digital
Holography Microscopy 79
Abstract 79
6.1. Introduction 80
6.2. Common path interferometer in Total Internal Reflexion 81
6.3. Technique Validation 85
6.4. Conclusion and Future Trends 87
References 88
Summary 91

viii
Chapter 1. Introduction
Abstract
Recently, the development of innovative materials able to control and guide the
cellular responses for specific applications has been produced a great interest.
The study of cell-material interaction is important because it provides a better
understanding of how they affect the physical and chemical properties of
materials on the cellular dynamics. In fact, it is known that some types of signals
regulate important processes such as adhesion, differentiation, and other cellular
events. Currently, it has extended the use of highly advanced analytical devices
for the study of these phenomena. For morphological analysis using the
fluorescence microscope that allows you to report different types of subcellular
structures such as the actin cytoskeleton and the cell nucleus. In addition, the
atomic force microscope, allows the analysis of the topography of biomaterials
before being used as platforms for cell adhesion. The disadvantage in using these
techniques is the one hand, that the fluorescent microscope uses of the dyes to
analyze the morphology of the cell and, on the other hand, the atomic force
microscope does not allow the real-time analysis of topographical formation of
although the material has a high spatial resolution.
The thesis is targeted to develop three types of instruments based optical
interferometry, to provide new types of methods in cell-material interaction
study, for both the manipulation and characterization of biomaterials, both for the
quantitative study of cell behaviour under dynamic changes of the physical
properties of adhesion substrates. The experimental apparatus for the
characterization of the optical lithographic processes provides the capability of
real-time monitor the formation in azopolimeri of so-called "Surface Relief
Gratings" (SRG). In addition, via a special digital holographic microscope, the
dynamics of fibroblasts has been studied on a petri glass platform. Experiments
show that this device allow to open a new way of research on the quantitative
analysis of cellular damage caused by the effect of phototoxicity induced by
electromagnetic waves. Moreover, morphological processes of necrotic death can
be monitored with quantitative-temporal phase analysis. Finally, a microscopic
device based on the analysis surface in "Total Internal Reflection" has been
improved through advanced interferometric techniques to obtain quantitative
information about the cell adhesion processes. Validation and application of the
technique have been demonstrated.
2
1.1. Material Science and Engineering
Since the dawn of humanity, the humankind have used materials or a combination
of materials as tools. Stone and wood had been using for millennia, but as time
progressed, tools became far more complex. At some point, humans began using
fire for heat and cooking, developed language and created adornments. Tools are
made from materials and they were first transformed and manipulated thanks to
fire. Materials and its progress are narrowly linked to the advance of the
humanity.
Materials science and engineering involves the discovery and design of new
materials. The traditional examples are metals, semiconductors, ceramics and
polymers. However, new and advanced materials that are being developed
include nanomaterials and biomaterials.
The basis of materials science involves studying the structure of materials, and
relating them to their properties. They exhibit myriad properties, which
determine its usability and hence its engineering application and include
mechanical, chemical, electrical, thermal, optical and magnetic properties. Once
a materials scientist knows about this structure-property correlation, they can go
on to study the relative performance of a material in a certain application.
Characterization is the way materials scientists examine the structure of a
material. This involves techniques such as diffraction with x-rays, electrons, or
neutrons, and various forms of spectroscopy and chemical analysis such as
Raman spectroscopy, energy-dispersive spectroscopy (EDS), chromatography,
thermal analysis, electron microscope analysis, etc.
In recent times, biomaterials science has received much attention from
researchers. A biomaterial is any matter, surface, or construct that interacts with
biological systems. A biological system is a complex network of biologically
relevant entities. As biological organization spans several scales, examples of
biological systems are populations of organisms, or on the organ- and tissue scale
in mammals and other animals, the circulatory system, the respiratory system,
the nervous system, etc. On the micro to the nanoscopic scale, examples of
biological systems are cells, organelles, macromolecular complexes and
regulatory pathways. Biomaterials science encompasses elements of medicine,
biology, chemistry, tissue engineering and materials science. The field is
inherently interdisciplinary, and the materials engineers must be aware and make
use of the methods of the physicist, chemist and engineer. The field thus,

3
maintains close relationships with these fields. In addition, many physicists,
chemists and engineers also find themselves working in materials science.
Breakthroughs in materials science are likely to have a significant impact on the
future of technology.
1.2. Tissue Engineering
Tissue engineering refers to the practice of combining scaffolds, cells and
biologically active molecules into functional tissues. The goal of tissue
engineering is to assemble functional constructs that restore, maintain, or
improve damaged tissues or whole organs [1]. The ability of an engineered
biomaterial to approximate the structural and mechanical aspects of the cellular
microenvironment is an important factor in determining the success or failure of
engineered devices for tissue repair or replacement. Biological tissues basically
consist of cells, signaling systems and extracellular matrix (ECM) [2]. The cells
are the core of the tissue, however, in the absence of signaling systems and/or of
the ECM cannot explicate their functions. In fact, cells are the building blocks of
tissue, and tissues are the basic unit of function in the body. Generally, groups of
cells make and secrete their own supporting structures, that is the extracellular
matrix [3]. This matrix, or scaffold, does more than just support the cells; it also
acts as a relay station for various signaling molecules. Thus, cells receive
messages from many sources that become available from the local environment.
Each signal can elicit a cascade of responses that determine what happens to the
cell. By understanding how cells respond to signals, interact with their
environment and organize into tissues and organisms, many researchers were
able to manipulate these process to mend damaged tissues or even create new
ones. When engineering and designing a new biomaterial, one of the most
important aspects that have to be largely considered is the interaction between
cells and material surface, namely cell-material interaction.
1.3. Cell-Material Interaction
Cell-material interaction occurs through a combination of biochemical and
biophysical signal, including interfacial presentation of molecular, topographic
and mechanical cues. Indeed, both biochemical and biophysical features of the
biomaterial have been reported to affect and influence cell functions by triggering
specific molecular events at the cell-material interface. Cellular activities that are
4
mostly influenced by material properties are adhesion, spreading, migration,
proliferation and differentiation [4]. Cell adhesion and migration are highly
complex and multistep processes, which share many common features. They both
involve several compartments of the cell, including surface receptors, signaling
elements and the cytoskeleton, which is a cellular structure mainly responsible
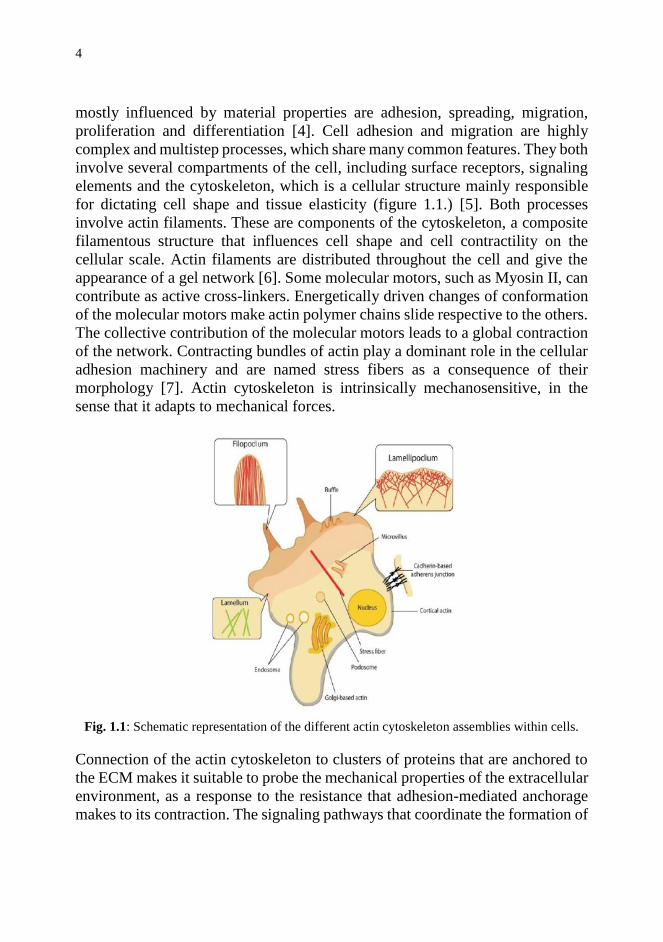
for dictating cell shape and tissue elasticity (figure 1.1.) [5]. Both processes
involve actin filaments. These are components of the cytoskeleton, a composite
filamentous structure that influences cell shape and cell contractility on the
cellular scale. Actin filaments are distributed throughout the cell and give the
appearance of a gel network [6]. Some molecular motors, such as Myosin II, can
contribute as active cross-linkers. Energetically driven changes of conformation
of the molecular motors make actin polymer chains slide respective to the others.
The collective contribution of the molecular motors leads to a global contraction
of the network. Contracting bundles of actin play a dominant role in the cellular
adhesion machinery and are named stress fibers as a consequence of their
morphology [7]. Actin cytoskeleton is intrinsically mechanosensitive, in the
sense that it adapts to mechanical forces.
Fig. 1.1: Schematic representation of the different actin cytoskeleton assemblies within cells.
Connection of the actin cytoskeleton to clusters of proteins that are anchored to
the ECM makes it suitable to probe the mechanical properties of the extracellular
environment, as a response to the resistance that adhesion-mediated anchorage
makes to its contraction. The signaling pathways that coordinate the formation of
5
new adhesions as well as their maturation, are intimately linked to the dynamical
reorganization of the actin cytoskeleton [8].
Focal Adhesions (FAs) are sites of tight adhesion to underlying ECM developed
by cells in culture during their adhesion. As such, they constitute a structural link
between the actin cytoskeleton and the ECM and are regions of signal
transduction between the outside environment and the inside cellular cytoplasm.
A mature FA contains hundreds of proteins that are grouped based on their
contribution to four basic processes: receptor/matrix binding, linkage to actin
cytoskeleton, intracellular signal transduction and actin polymerization. Both
actin polymerization and acto-myosin contractile machinery generate forces that
affect mechanosensitive proteins in the actin linking module, the receptor module
(e.g. integrins), the signaling module and the actin polymerization module. The
combined activity of the mechanosensitive components forms the
mechanoresponsive network.
1.4. Cell-Topography Crosstalk
In in-vivo contexts, extracellular environment represent a set of topographic
signals, perceived by cells at different scale. Fibrils and fiber bundles (collagen
and fibrin), rough surfaces (crystal deposit in bone) and porous membranes
(basement membranes) represent examples of natural topographies. These
topographical signals play a relevant role in cell-material interaction through
direct alteration in several cellular processes [9]. Recent advancements in micro-
and nano-fabrication technologies made it possible to imprint on substrate
surfaces topographic features favoring the study of the role of topography in cell-
material interaction. Soft lithography [10], [11], electron beam lithography [12]
and nanoimprint lithography [13] can emboss topographic patterns with a tightly
controlled spatial resolution (of a few nanometers). Cells interact with native
topographical structures in many ways, often through a phenomenon known as
contact guidance. Contact guidance is a leading example of a naturally occurring
phenomenon that is characterized by the response of cells to structures on the
micron and submicron scale [14]. Cell-nanotopography interactions can induce
different effects within a single cell type due to the coupled effect of
nanotopography in combination with physicochemical properties of the
substrate. These interaction also vary across cell type, feature size, and feature
geometry as well. Nevertheless, there are some general trends that can be
6
extricated from the rapidly growing body of literature [15]. Cells respond to two-
dimensional synthetic topographic substrates in a wide array of responses, which
depend upon many factors including cell type, feature size and geometry or the
physical properties of the bulk substrate material including substrate stiffness
[16]. For example, Bettinger et al. [15] reported epithelial cell response to
nanotopography.
Furthermore, Walboomers et al. [14] reported the behavior of fibroblast cultured
on a grooved polystyrene substratum and hypothesized that micro-grooves
created a pattern of mechanical stress, which influences cell spreading and caused
the cell to be aligned with surface microgrooves. Also smooth muscle cells
showed to be influenced by nano-topography imprinted on polydimethylsiloxane
(PDMS) and polymethylmethacrylate (PDMA) [17]. Therefore, in all these
examples cell behavior on nanotopography was similar even if cell type was
different.
1.5. Dynamic Topographic Signals
Several techniques have been proposed to encode micro- and nano-topographies
on material surfaces, in order to investigate many processes involved in cell-
material interaction. Despite possessing a very high spatial resolution, these
techniques require expensive equipments and are time consuming. Additionally,
once produced, the geometric features of the master or substrate cannot be readily
modified a posteriori since they are intrinsically static in nature. In order to
overcome the limits of a physically static system and to develop more versatile
platforms, large interest has recently arisen in using stimuli-responsive materials
as dynamic supports to investigate cell response. For example, Davis et al. [18]
have proposed a thermoresponsive cell culture system, used to control cell
behavior via surface shape memory polymers.
In details, by taking advantage of a polymer with a glass transition temperature
of 37ºC, the temporary patterned shape could be switched in the flat stable form
during cell culture. Among all the stimuli-responsive materials, this thesis
focuses on photoswitchable polymers, aiming to control the topographic surface
with light as external stimulus in a precise way. Azopolymers were selected as
the best candidate, aiming to realize dynamic supports for studying cell adhesion
and mechanics.

7
1.6. Azopolymer as biomaterial
Azobenzene is an achromatic molecule formed by an azo linkage (-N=N-)
connecting two phenyl rings. Originally, azobenzenes were used as dyes and
colorants, due to their powerful colors [19]. At later stage, their amazing
properties were discovered and exploited in many field. The most fascinating
characteristics of the azobenzene is their reversible photoisomerization.
Azobenzenes have two stable isomeric states: a thermally stable trans
configuration and a metastable cis form (Figure 1.2). Remarkably, the
azobenzene chromophore can interconvert between these isomers upon
absorption of a photon. For most azobenzenes, the molecule can be optically
isomerized from trans to cis with light and the molecule will subsequently
thermally relax back to the trans state on a timescale dictated by the substitution
pattern. This photochemistry is central to azobenzene potential use as tool for
nanopatterning.
Fig. 1.2: Azobenzene photoisomerization. The trans form (left) can be converted to the cis form
(right) using an appropriate wavelength of light. A different wavelength will induce the
molecule back conversion to the trans form. Alternately, the molecule will thermally relax to
the stable trans form.
Azobenzenes can be separated into three spectroscopic classes: azobenzene-type,
aminoazobenzene-type, and pseudo-stilbenes molecules [20].
The azobenzene-type molecules have a strong absorption in the UV, and low-
intensity band in the visible. The aminoazobenzenes and pseudo-stilbenes
typically have strong overlapped absorptions in the visible region. The
photoisomerization between trans (E) and cis (Z) isomers is completely
reversible and free from side reactions, such that it is characterized as one of the
8
cleanest photoreactions known [20]. In the dark, most azobenzene molecules will
be found in the trans form.
Upon absorption of a photon (with a wavelength in the trans absorption band),
the azobenzene will convert, with high efficiency, into the cis isomer. A second
wavelength of light (corresponding to the cis absorption band) can cause the
back-conversion. These photoisomerizations usually have picosecond
timescales. Alternatively, azobenzenes will thermally reconvert from the cis to
trans state, with a timescale ranging from milliseconds to hours, depending on
the substituents can inhibit the cis-trans relaxation process, thereby allowing the
cis state persist for days [21].
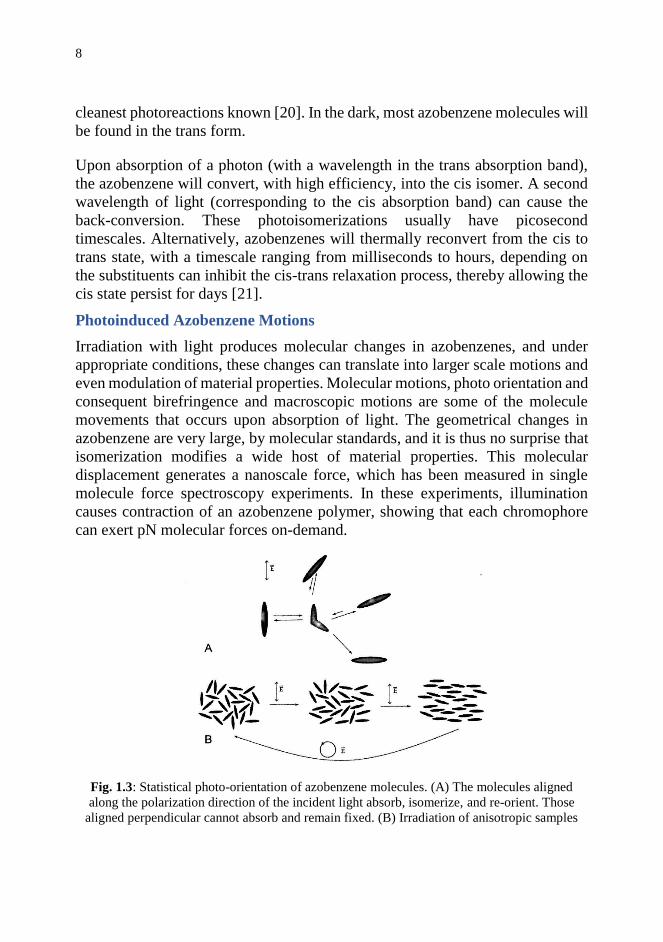
Photoinduced Azobenzene Motions
Irradiation with light produces molecular changes in azobenzenes, and under
appropriate conditions, these changes can translate into larger scale motions and
even modulation of material properties. Molecular motions, photo orientation and
consequent birefringence and macroscopic motions are some of the molecule
movements that occurs upon absorption of light. The geometrical changes in
azobenzene are very large, by molecular standards, and it is thus no surprise that
isomerization modifies a wide host of material properties. This molecular
displacement generates a nanoscale force, which has been measured in single
molecule force spectroscopy experiments. In these experiments, illumination
causes contraction of an azobenzene polymer, showing that each chromophore
can exert pN molecular forces on-demand.
Fig. 1.3: Statistical photo-orientation of azobenzene molecules. (A) The molecules aligned
along the polarization direction of the incident light absorb, isomerize, and re-orient. Those
aligned perpendicular cannot absorb and remain fixed. (B) Irradiation of anisotropic samples
9
leads to accumulation of chromophores in the perpendicular direction. Circularly polarized light
restores isotropy.
Additionally, orientation of azobenzene chromophores can be manipulated using
polarized light (Figure 1.3). Azobenzenes preferentially absorb light polarized
along their transition dipole axis (long axis of the azobenzene). The probability
of absorption varies as cos2phi where pi is the angle between the light
polarization and the azobenzene dipole axis. Thus, azomolecules oriented along
the polarization of the light will absorb, whereas those oriented against the light
polarization will not. For a given initial angular distribution of chromophores,
many will absorb, convert into the cis form, and then revert to the trans form with
a new random direction. Those chromophores that fall perpendicular to the light
polarization will no longer isomerize and reorient; hence, there is a net depletion
of chromophores aligned with the light polarization, with a concomitant increase
in the population of chromophores aligned perpendicular (i.e., orientation hole
burning).
This statistical reorientation is fast, and gives rise to strong birefringence
(anisotropy in refractive index) and dichroism (anisotropy in absorption
spectrum) due to the large anisotropy of the azo electronic system. Because
unpolarized light can photo-orient (along the axis of illumination), even sunlight
is suitable [22].
Surface Relief Gratings
Along the line of active cell culture substrates, holographic imprinting of surface
relief gratings (SRGs) on azopolymer films is a promising approach for a
straightforward fabrication of dynamic substrates. Large-scale surface mass
displacement was observed by Natansohn and Kumar groups who irradiated
azopolymer films with an interference pattern of light [23], [24]. Once the
sinusoidal pattern of light is in contact with the polymer, it is able to induce the
formation of SRGs, in the form of topographic arrays that trace out the light
intensity profile. This phenomenon has been used to realize micro-and nano-
grooved polymer films, suitable in many applications, such as optics and
photonics [25], [26].
In a typical experiment, two coherent laser beams, with a wavelength in the
azobenzene absorption band, are intersected at the ample surface (Figure 1.11.).
The sample usually consist of a thin spin-cast film (10-1000 nm) of an amorphous
azo-polymer on a transparent substrate.

10
Fig. 1.4: Experimental setup for the inscription of a surface relief grating: S refers to the
sample, M are mirrors, D is a detector for the diffraction of the probe beam, WP is a waveplate
(or generally a combination of polarizing elements), and BS is a 50% beam splitter. (A) A
simple one-beam inscription involves reflecting half of the incident beam off of a mirror
adjacent to the sample. (B) A two-beam interference setup enables independent manipulation of
the polarization state of the two incident beams.
The sinusoidal light interference pattern at the sample surface leads to a
sinusoidal surface patterning, i.e. SRG. The process occurs readily at room
temperature (well below the Tg of the amorphous polymers used) with moderate
irradiation (1-100 mW/cm2) over seconds to minutes. The phenomenon is a
reversible mass transport, not irreversible material ablation, since a flat film with
the original thickness is recovered upon heating above Tg. Upon irradiation with
linearly polarized light of appropriate wavelength, the azobenzene molecules
statistically reorient and accumulate the direction perpendicular to the
polarization plane (Figure x). The resulting molecular alignment gives rise to
optical anisotropy that can be erased by irradiating the sample with circularly
polarized or unpolarized light [27], [28].
When a thin amorphous azopolymer film was irradiated with an optical
interference pattern, the material starts to migrate and move away from high-
intensity areas to form a replica of the incident irradiation in the form of a SRG.
Many models have been proposed to explain this mechanism, such as thermal
model, pressure gradient force model [29], mean-field model [30], optical-field

11
gradient force model [30], [31]. However a controversy regarding the mechanism
still remains.
Fig. 1.5: (A) Schematic illustration of the photoalignment of azobenzenes with polarized light.
(B) Representation of the SRG inscription process. An atomic force micrograph and a surface
profile of an inscribed grating are shown on the right.
Azopolymers for Biological Applications
The phenomenon SRG inscription on azopolymers has been used to realize
micro- and nano-grooved polymers films, suitable in many applications, such as
optics and photonics [25], [26]. Despite their extraordinary chemical/physical
characteristics the number of studies on the use of azobenzene-based substrates
for cell cultures is very limited. However some examples are reported here. For
instance, Baac at al. [32] used SRGs as cell supports for controlling cell growth,
adhesion and orientation. They found that human astrocytes were highly oriented
along the groove direction.
Moreover, Rocha et al. [33] studied the biocompatibility of azopolymers based
polysiloxane coatings and investigated the stability of the substrates in aqueous
environment.
Barille et al. [34] examined the imprinting capabilities of the azo-based
photoswitchable materials both in dry and wet conditions and analyzed neuron
response to the topographic signal.

12
However, the possibility to exploit writing/erasing reversibility of azobenzene
polymers in biological applications has not been addressed yet. This aspect has
been investigated in this thesis.
1.7. Aims and outcomes
The progress of humanity and new discoveries has been highly related to the
design of new methodologies and apparatus, which have allowed us to extend our
biological limits to understand how universe works. With this thesis, we try to
introduce the basics of using quantitative phase microscopy to study the cell-
material phenomenology. The thesis is organized as follows. Chapter 2 intends
to provide a general knowledge of holography and particularly digital
holographic microscopy (DHM) which is largely applied in this thesis for
different characterizations. Chapter 3 presents for the first time that azopolymer
platforms can be used as a photoreversible platforms for controlling some cell
behaviors. A confocal microscope was employed to study several cellular aspects
like cytoskeleton and focal adhesion. These nanostructures comes modulated
depending on the topography of the substrates. On the other hand, azopolymer
recording was carried on by a Lloyd interferographic lithography. Moreover, the
characterization of the surfaces were realized by an Atomic Force Microscope.
Both apparatus have good advantages, but also have some disadvantages related
to time scanning and dangerous invasive problems. To overcome these
limitations, we propose optical interferometric methods for writing and analyzing
biomaterials and their interactions. Chapter 4 focuses on the development of a
DHM apparatus to characterize “surface relief gratings” on azopolymer. In
chapter 5, a DH time-lapse microscope was built to study in-vitro fibroblast cells.
The limits of “safe exposure” (SE) and “injurious exposure” (IE) were stabilized
to limit phototoxic effects. The quantitative data recovered by our setup allows
cell-death characterization fitting the data by means of a logistical regression
curve. Chapter 6 describes a new device to study quantitative information from
the cell adhesion. This apparatus is a kind of “Total Internal Reflexion
Microscope” which allows retrieving quantitative data near to the interface
thanks to the evanescent waves. The technique has been verified and biological
samples has been analyzed. The last chapter encloses conclusions and future
trends.

13
References
[1] S. Cohen, M. C. Ba??o, L. G. Cima, H. R. Allcock, J. P. Vacanti, C. A.
Vacanti, and R. Langer, “Design of synthetic polymeric structures for cell
transplantation and tissue engineering,” Clin. Mater., vol. 13, no. 1–4, pp.
3–10, 1993.
[2] L. J. Bonassar and C. a Vacanti, “Tissue engineering: the first decade and
beyond.,” J. Cell. Biochem. Suppl., vol. 30–31, no. September, pp. 297–
303, 1998.
[3] M. J. Lysaght and J. Reyes, “The growth of tissue engineering.,” Tissue
Eng., vol. 7, no. 5, pp. 485–493, 2001.
[4] M. Ventre, F. Causa, and P. A. Netti, “Determinants of cell-material
crosstalk at the interface: towards engineering of cell instructive
materials,” J. R. Soc. Interface, vol. 9, no. 74, pp. 2017–2032, 2012.
[5] B. Ladoux and A. Nicolas, “Physically based principles of cell adhesion
mechanosensitivity in tissues,” Reports Prog. Phys., vol. 75, no. 11, p.
116601, 2012.
[6] D. A. Fletcher and R. D. Mullins, “Cell mechanics and the cytoskeleton,”
Nature, vol. 463, no. 7280, pp. 485–492, 2010.
[7] C. D. Nobes and a Hall, “Rho, rac, and cdc42 GTPases regulate the
assembly of multimolecular focal complexes associated with actin stress
fibers, lamellipodia, and filopodia.,” Cell, vol. 81, no. 1, pp. 53–62, 1995.
[8] A. D. Bershadsky, N. Q. Balaban, and B. Geiger, “Adhesion-dependent
cell mechanosensitivity.,” Annu. Rev. Cell Dev. Biol., vol. 19, pp. 677–
695, 2003.
[9] R. Singhvi, G. Stephanopoulos, and D. I. C. Wang, “Effects of substratum
morphology on cell physiology.,” Biotechnol. Bioeng., vol. 43, no. 8, pp.
764–771, 1994.
[10] G. M. Whitesides, E. Ostuni, X. Jiang, and D. E. Ingber, “Soft Lithography
in Biology and Biochemistry,” 2001.
[11] Y. N. Xia and G. M. Whitesides, “Soft lithography,” Annu. Rev. Mater.
14
Sci., vol. 28, no. 1, pp. 153–184, 1998.
[12] R. F. W. Pease, “Electron beam lithography,” Contemp. Phys., vol. 22, no.
3, pp. 265–290, May 1981.
[13] Y. Hirai, S. Yoshida, N. Takagi, Y. Tanaka, H. Yabe, K. Sasaki, H.
Sumitani, and K. Yamamoto, “High aspect pattern fabrication by nano
imprint lithography using fine diamond mold,” Japanese J. Appl. Physics,
Part 1 Regul. Pap. Short Notes Rev. Pap., vol. 42, no. 6 B, pp. 3863–3866,
2003.
[14] X. F. Walboomers, H. J. E. Croes, L. A. Ginsel, and J. A. Jansen, “Growth
behavior of fibroblasts on microgrooved polystyrene,” Biomaterials, vol.
19, no. 20, pp. 1861–1868, 1998.
[15] C. J. Bettinger, R. Langer, and J. T. Borenstein, “Engineering substrate
topography at the Micro- and nanoscale to control cell function,” Angew.
Chemie - Int. Ed., vol. 48, no. 30, pp. 5406–5415, 2009.
[16] D. E. Discher, P. Janmey, and Y.-L. Wang, “Tissue cells feel and respond
to the stiffness of their substrate.,” Science, vol. 310, no. 5751, pp. 1139–
43, 2005.
[17] E. K. F. Yim, R. M. Reano, S. W. Pang, A. F. Yee, C. S. Chen, and K. W.
Leong, “Nanopattern-induced changes in morphology and motility of
smooth muscle cells,” Biomaterials, vol. 26, no. 26, pp. 5405–5413, 2005.
[18] K. a. Davis, K. a. Burke, P. T. Mather, and J. H. Henderson, “Dynamic
cell behavior on shape memory polymer substrates,” Biomaterials, vol. 32,
no. 9, pp. 2285–2293, 2011.
[19] H. Zollinger, “Azo and Diazo Chemistry,” 1961.
[20] H. Rau, “Photochemistry and photophysics,” CRC Press, pp. 119–141,
1990.
[21] K. Yager and C. Barrett, “Light-Induced Nanostructure Formation using
Azobenzene Polymers,” Polym. Nanostructures Their Appl., vol. 0, pp. 1–
38, 2006.
[22] M. Han and K. Ichimura, “Tilt orientation of p-methoxyazobenzene side
15
chains in liquid crystalline polymer films by irradiation with nonpolarized
light,” Macromolecules, vol. 34, no. 1, pp. 82–89, 2001.
[23] P. Rochon, E. Batalla, and a. Natansohn, “Optically induced surface
gratings on azoaromatic polymer films,” Appl. Phys. Lett., vol. 66, no. 2,
pp. 136–138, 1995.
[24] D. Y. Kim, S. K. Tripathy, L. Li, and J. Kumar, “Laser-induced
holographic surface relief gratings on nonlinear optical polymer films,”
Appl. Phys. Lett., vol. 66, no. 10, pp. 1166–1168, 1995.
[25] S. R. Marder, B. Kippelen, A. K. Jen, and N. Peyghambarian, “Design and
synthesis of chromophores and polymers for electro-optic and
photorefractive applications,” 1997.
[26] A. Priimagi and A. Shevchenko, “Azopolymer-based micro- and
nanopatterning for photonic applications,” J. Polym. Sci. Part B Polym.
Phys., vol. 52, no. 3, pp. 163–182, Feb. 2014.
[27] A. Natansohn and P. Rochon, “Photoinduced Motions in Azo-Containing
Polymers,” 2002.
[28] A. Priimagi, M. Kaivola, M. Virkki, F. J. Rodríguez, and M. Kauranen,
“Suppression of Chromophore Aggregation in Amorphous Polymeric
Materials: Towards More Efficient Photoresponsive Behavior,” J.
Nonlinear Opt. Phys. Mater., vol. 19, no. 01, p. 57, 2010.
[29] T. Pedersen, P. Johansen, N. Holme, P. Ramanujam, and S. Hvilsted,
“Mean-Field Theory of Photoinduced Formation of Surface Reliefs in
Side-Chain Azobenzene Polymers,” Phys. Rev. Lett., vol. 80, pp. 89–92,
1998.
[30] J. Kumar, L. Li, X. L. Jiang, D.-Y. Kim, T. S. Lee, and S. Tripathy,
“Gradient force: The mechanism for surface relief grating formation in
azobenzene functionalized polymers,” Appl. Phys. Lett., vol. 72, no. 17, p.
2096, 1998.
[31] S. Bian, W. Liu, J. Williams, L. Samuelson, J. Kumar, and S. Tripathy,
“Photoinduced surface relief grating on amorphous poly(4-
phenylazophenol) films,” Chem. Mater., vol. 12, no. 6, pp. 1585–1590,
2000.

16
[32] H. Baac, J.-H. Lee, J.-M. Seo, T. H. Park, H. Chung, S.-D. Lee, and S. J.
Kim, “Submicron-scale topographical control of cell growth using
holographic surface relief grating,” Mater. Sci. Eng. C, vol. 24, no. 1–2,
pp. 209–212, 2004.
[33] L. Rocha, C. M. Paius, A. Luca-Raicu, E. Resmerita, A. Rusu, I. A.
Moleavin, M. Hamel, N. Branza-Nichita, and N. Hurduc, “Azobenzene
based polymers as photoactive supports and micellar structures for
applications in biology,” J. Photochem. Photobiol. A Chem., vol. 291, pp.
16–25, 2014.
[34] R. Barillé, R. Janik, S. Kucharski, J. Eyer, and F. Letournel, “Photo-
responsive polymer with erasable and reconfigurable micro- and nano-
patterns: An in vitro study for neuron guidance,” Colloids Surfaces B
Biointerfaces, vol. 88, no. 1, pp. 63–71, 2011.
Chapter 2. Digital Holographic Microscopy
Abstract
Holography is a relatively recent interferometric technique. Dannis Gabor paper
[1] from 1948 is historically accounted as its beginning. From then a large
number of improvements have been investigated and still now holography is an
up-and-coming technique.
Holographic basic principle is the recording of an interference pattern on a
photographic plate (classical holography) or by a charge coupled device (digital
holography) and then, from the reconstructed wavefront, it’s possible to manage
the amplitude as well as the phase of the optical wavefield. The capability to
perform amplitude image and phase contrast image makes holography a suitable
tool in many application fields from metrology to 3D display.

18
2.1. Historical developments and general introduction
Holography got its name from the Greek words holos, meaning whole, and
graphein, meaning to write. It is a means for recording and reconstructing the
whole information contained in an optical wavefront, namely amplitude and
phase, and not just intensity as in photography.
Dennis Gabor invented holography in 1948 as a lensless process for image
formation by reconstructed wavefront with the aim of improving electron
microscope images [1]. Gabor’s ideas was unsuccessful in the field of electron
microscopy because of practical problems but its validity in the optical field was
confirmed by other researcher as G. L. Rogers [2] and El Sum and Kirkpatrick
[3]. Because of the superimposition and the poor quality of the reconstructed
images the interest around holography declined up to the 1960s when the
development of lasers made available a powerful source of coherent light.
Holography is made of two separated processes: the recording of an image, and
the retrieval. The first stage is accomplished by means of a photographic film
recording the interference pattern produced by the light waves scattered by an
object and a reference beam derived from the same coherent light source, as
shown in Fig. 2.1. (a).
(a) (b)
Fig. 2.1.: (a) Hologram recording: the interference pattern produced by the reference wave and
the object wave is recorded; (b) Image reconstruction: light diffracted by the hologram
reconstructs the object wave.
Since the intensity at any point in this interference pattern also depends on the
phase of the object wave, the resulting recording (the hologram) contains
information on the phase as well as the amplitude of the object wave. The second
stage is the image formation of the object. If the hologram is illuminated once
19
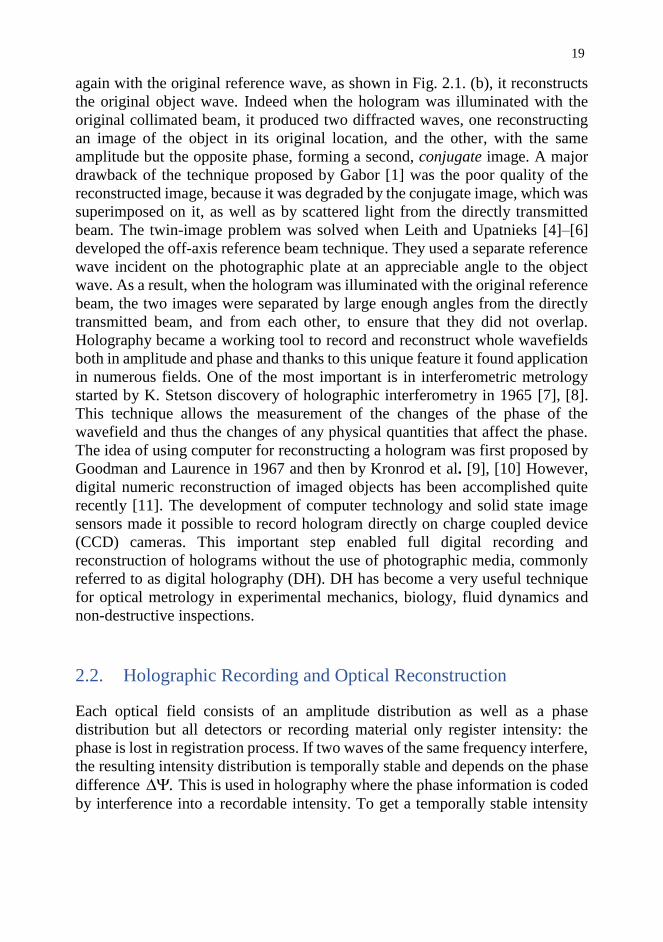
again with the original reference wave, as shown in Fig. 2.1. (b), it reconstructs
the original object wave. Indeed when the hologram was illuminated with the
original collimated beam, it produced two diffracted waves, one reconstructing
an image of the object in its original location, and the other, with the same
amplitude but the opposite phase, forming a second, conjugate image. A major
drawback of the technique proposed by Gabor [1] was the poor quality of the
reconstructed image, because it was degraded by the conjugate image, which was
superimposed on it, as well as by scattered light from the directly transmitted
beam. The twin-image problem was solved when Leith and Upatnieks [4]–[6]
developed the off-axis reference beam technique. They used a separate reference
wave incident on the photographic plate at an appreciable angle to the object
wave. As a result, when the hologram was illuminated with the original reference
beam, the two images were separated by large enough angles from the directly
transmitted beam, and from each other, to ensure that they did not overlap.
Holography became a working tool to record and reconstruct whole wavefields
both in amplitude and phase and thanks to this unique feature it found application
in numerous fields. One of the most important is in interferometric metrology
started by K. Stetson discovery of holographic interferometry in 1965 [7], [8].
This technique allows the measurement of the changes of the phase of the
wavefield and thus the changes of any physical quantities that affect the phase.
The idea of using computer for reconstructing a hologram was first proposed by
Goodman and Laurence in 1967 and then by Kronrod et al. [9], [10] However,
digital numeric reconstruction of imaged objects has been accomplished quite
recently [11]. The development of computer technology and solid state image
sensors made it possible to record hologram directly on charge coupled device
(CCD) cameras. This important step enabled full digital recording and
reconstruction of holograms without the use of photographic media, commonly
referred to as digital holography (DH). DH has become a very useful technique
for optical metrology in experimental mechanics, biology, fluid dynamics and
non-destructive inspections.
2.2. Holographic Recording and Optical Reconstruction
Each optical field consists of an amplitude distribution as well as a phase
distribution but all detectors or recording material only register intensity: the
phase is lost in registration process. If two waves of the same frequency interfere,
the resulting intensity distribution is temporally stable and depends on the phase
difference . This is used in holography where the phase information is coded
by interference into a recordable intensity. To get a temporally stable intensity

20
distribution at least as long as the recording process must be stationary, which
means the wave fields must be mutually coherent.
The off axis geometry
The experiments which will be presented in this thesis basically use the “off-
axis” arrangement with the object beam separated from the reference one by an
angle as shown in Fig. 2.2.(a). The reference beam is a collimated beam of
uniform intensity, derived from the same source as that used to illuminate the
object.
(a) (b)
Fig. 2.2.: Schematic view of the off-axis configuration for hologram recording (a); and image
reconstruction (b).
The complex amplitude at any point ),( yx on the photographic plate due to the
reference beam can then be written as:
)2exp(),( xfiryxr r (2.2.1-1)
where /)(sinrf , since only the phase of the reference beam varies across
the photographic plate, while that due to the object beam, for which both the
amplitude and phase vary, can be written as:
)),(exp(|),(|),( yxiyxoyxo (2.2.1-2)
The resultant intensity is, therefore,
2|),(),(|),( yxoyxryxI
)2exp()),(exp(|),(||),(||),(| 22 xfiyxiyxoryxoyxr r

21
)2exp()),(exp(|),(| xfiyxiyxor r =
)).,(2cos(|),(|2|),(| 22 yxxfyxoryxor r (2.2.1-3)
The amplitude and phase of the object wave are encoded as amplitude and phase
modulation, respectively, of a set of interference fringes equivalent to a carrier
with a spatial frequency of rf . If we assume that the amplitude transmittance of
the processed photographic plate is a linear function of the intensity, the resultant
amplitude transmittance of the hologram is
2'
0 |),(|),( yxoTtyxt
)2exp()),(exp(|),(| xfiyxiyxoTr r
)2exp()),(exp(|),(| xfiyxiyxoTr r . (2.2.1-4)
where 2
0
'
0 Trtt is a constant background transmittance. When the hologram
is illuminated once again with the original reference beam, as shown in Fig. 2.2
(b), the complex amplitude of the transmitted wave can be written as
),(),(),( yxtyxryxu
)2exp(|),(|)2exp( 2'
0 xfiyxoTrxfirt rr
)4exp(),(*),( 22 xfiyxoTryxoTr r . (2.2.1-5)
The first term on the right-hand side of Eq. 2.2.1-5 corresponds to the directly
transmitted beam, while the second term yields a halo surrounding it, with
approximately twice the angular spread of the object. These two terms constitute
the zeroth order of diffraction. The third term is identical to the original object
wave, except for a constant factor 2Tr , and produces a virtual image of the
object in its original position. The fourth term corresponds to the conjugate image
which, in this case, is a real image. If the offset angle of the reference beam is
made large enough, the virtual image can be separated from the directly
transmitted beam and the conjugate image. In this arrangement, corresponding

22
points on the real and virtual images are located at equal distances from the
hologram, but on opposite sides of it. Since the depth of the real image is inverted,
it is called a pseudoscopic image, as opposed to the normal, or orthoscopic,
virtual image.
2.3. Digital Holographic Recording and Numerical Reconstruction
The principle of DH is identical to the classical one. The idea is always to record
the interference between an object wave and a reference wave in an in-line or off-
axis geometry. The major difference consists in replacing the photographic plate
by a digital device like a CCD. Therefore the wavefront is digitized and stored as
an array of zeros and ones in a computer and the reconstruction process is
achieved numerically through a numerical simulation of wave propagation. This
idea was proposed for the first time in 1967 by J.W. Goodman and R.W. Laurence
[9] and numerical hologram reconstruction was initiated by M.A. Kronrod and
L.P. Yaroslavsky [10] in the early 1970s. They still recorded in-line and Fourier
holograms on a photographic plate, but they enlarged and sampled part of them
to reconstruct them numerically. A complete digital holographic setup in a sense
of digital recording and reconstruction was achieved by U. Schnars and W.
Jüptner when they introduce the CCD camera to record Fresnel holograms [11].
This method suppresses the long intermediate step of photographic plate
development between the recording and the numerical reconstruction process and
allows high acquisition and reconstruction rates. However, no electronic devices
have been able to compete with the high resolution of the traditional holographic
materials.
Sampling
The recording process is a sampling of an interference pattern consisting of
spatial frequencies, the highest of which is given by the largest angle between
object and reference wave. The limited resolution of the CCD chip and similar
digital devices decides the maximum frequency allowed for sampling and
severely restricts the experimental set-up configuration. According to the
Whittaker-Shannon sampling theorem each period must be recorded by at least
two detector elements. If is the fringe spacing and pd the detector pitch
(centre-to-centre spacing between neighbouring detector elements) in one
transversal direction, then
pd2 (2.3.1-1)

23
A geometrical evaluation in which is the angle between the object and the
reference wave gives
2sin2
(2.3.1-2)
Combining Eqs. 2.3.1-1 and 2.3.1-2 gives
)2
arcsin(pd
(2.3.1-3)
where )2/(1 pd is the sampling frequency. This means that the angular extent of
the object, max , in Fig. 2.3., must not exceed this limit. In order to use the entire
available bandwidth of the recording device, the equal sign in Eq. 2.3.1-3 should
be used. Another geometrical evaluation shows that if the distance d between the
CCD and the object is
Dd
dp
2 (2.3.1-4)
then the maximum bandwidth is obtained without violating the sampling
theorem. D is the transversal size (height or width) of the object, and small
angular values are assumed according to Eq. 2.3.1-3.
Fig. 2.3.: Schematic view of the angular extent of the object: θ is the angular extent of the
object and the maximum angle between object and reference wave; d is the distance along the
optical axis between the CCD chip and the object; D is the transversal size of the object, normal
to the optical axis.[12]
The distance d is in general quite large compared to the object size. For example,
when the detector pitch is m7.6 and the illuminating light comes from a He-Ne
laser ( nm8.632 ), the object must be less than cm5 wide and placed 1m in
front of the CCD. Applications that have been demonstrated over the last years

24
include microscopy [12], [13], deformation studies, particle analysis [14],
vibration analysis [15], characterization of micro-optics, shape measurements by
multi-wavelength contouring [16] and light-in-flight observation [17]. Even
larger objects have been used with the aid of lenses that demagnify the object
wave [18], magnify the interference pattern or image the object onto the CCD. In
many cases the detector pitch pd is equal to the size of each detector element,
also called “unit cell size” or “pixel size”. and denote the one-
dimensional pixel sizes along and directions, respectively.
Numerical reconstruction
While the recording step is basically an interference process, the reconstruction
can be explained by diffraction theory. Fig. 2.4. schematically shows the relative
positions of the object, hologram and image planes, the z axis is the optical axis.
Fig. 2.4.: Geometry for digital recording and numerical reconstruction.
The hologram is positioned in the ),( plane where 0z , while ),( yx is the
object plane at )0( ddz and )','( yx is an arbitrary plane of observation at
'dz . All these planes are normal to the optical axis. During reconstruction, the
hologram is an amplitude transmittance or aperture that diffracts the reference
wave and the propagation of the wavefield ),(),(),( rhu from the
hologram plane to a plane of observation is numerically simulated. With Section
2.2 in mind, a focused image of the original object should be situated at dz
and dz provided the reference as a plane wave. A detailed derivation of the

25
mathematical formulae of diffraction theory is given by Goodman. If )','(' yxb
is the reconstructed wavefront in the plane of observation, then Rayleigh-
Sommerfeld’s diffraction integral can be written as:
dde
rhi
yxbik
cos),(),(1
)','(' (2.3.2-1)
where the integration is carried out over the hologram surface and
222 )'()'(' yxd (2.3.2-2)
is the distance from a given point in the hologram plane to a point of observation.
The quantity cos is an obliquity factor normally set to one because of small
angles. If the reference is a collimated and normally impinging wavefront, as in
this case, one can set 1||),( rr , thus simplifying the numerical
implementation. A disadvantage is that the plane reference does not exploit the
maximum bandwidth of the CCD chip as is the case with a spherical one. For the
sake of generality, the notation “ ),( r ” is kept throughout this chapter.
Equation 2.3.2-1 represents a complex wavefield with intensity and phase
distributions I and given by
);',''*()','(')','( yxbyxbyxI )','('
)','('arctan
yxbR
yxbI (2.3.2-3)
}'{bI and }'{bR denote the imaginary and real part of 'b , respectively. There are
two ways [30] of implementing Eq. 2.2.2-1 in a computer: the Fresnel and
convolution methods. Both approaches convert Rayleigh-Sommerfeld’s
diffraction integral into one or more Fourier transforms which make the
numerical implementation easy. Several Fast Fourier Transform (FFT)
algorithms are available for efficient computations.
Reconstruction by Fresnel Transform
The Fresnel method is based on approximations of the expression in Eq. 2.3.2-2
by applying the binomial expansion of the square root. When terms of higher
order than the first two are excluded, becomes:
2
2
2
2'
'
)'(
2
1
'
)'(
2
11
d
y
d
xd
(2.3.3-1)
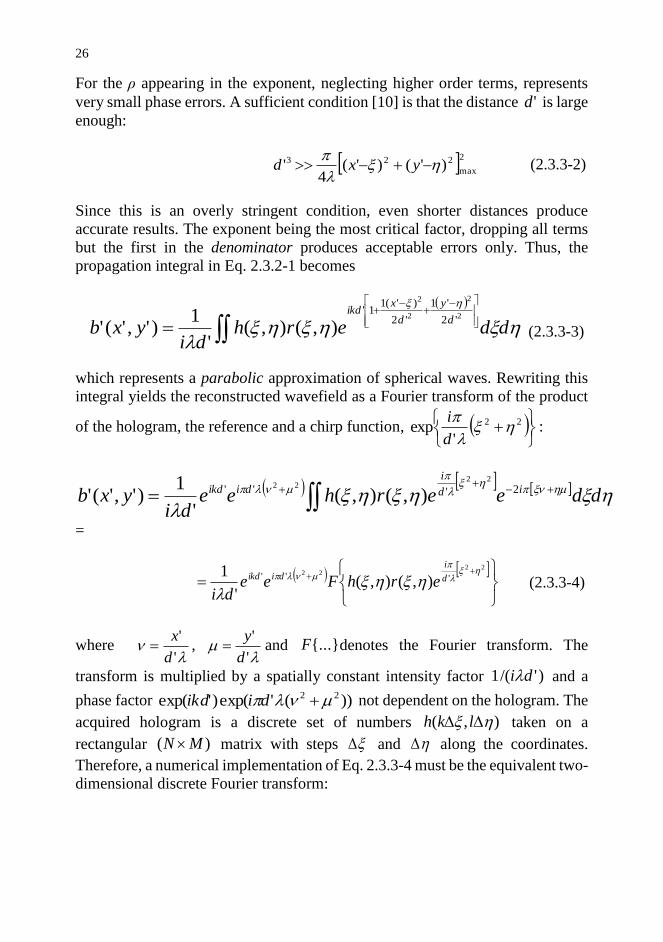
26
For the ρ appearing in the exponent, neglecting higher order terms, represents
very small phase errors. A sufficient condition [10] is that the distance 'd is large
enough:
2max
223 )'()'(4
'
yxd (2.3.3-2)
Since this is an overly stringent condition, even shorter distances produce
accurate results. The exponent being the most critical factor, dropping all terms
but the first in the denominator produces acceptable errors only. Thus, the
propagation integral in Eq. 2.3.2-1 becomes
dderhdi
yxbd
y
d
xikd
2
2
2
2
'2
'1
'2
)'(11'
),(),('
1)','(' (2.3.3-3)
which represents a parabolic approximation of spherical waves. Rewriting this
integral yields the reconstructed wavefield as a Fourier transform of the product
of the hologram, the reference and a chirp function,
22
'exp
d
i:
ddeerhee
diyxb id
i
diikd
2'''
2222
),(),('
1)','('
=
22
22''' ),(),(
'
1
d
i
diikd erhFeedi
(2.3.3-4)
where
'
'
d
x ,
'
'
d
y and {...}F denotes the Fourier transform. The
transform is multiplied by a spatially constant intensity factor )'/(1 di and a
phase factor ))('exp()'exp( 22 diikd not dependent on the hologram. The
acquired hologram is a discrete set of numbers ),( lkh taken on a
rectangular )( MN matrix with steps and along the coordinates.
Therefore, a numerical implementation of Eq. 2.3.3-4 must be the equivalent two-
dimensional discrete Fourier transform:
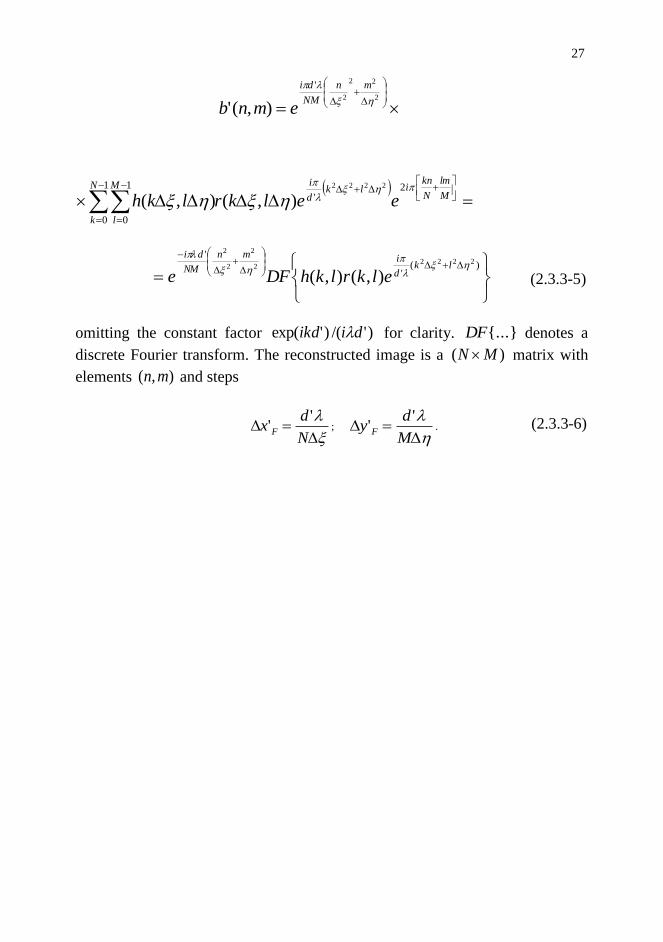
27
2
22
2
'
),('
mn
NM
di
emnb
M
lm
N
knilk
d
iN
k
M
l
eelkrlkh
2
'
1
0
1
0
2222
),(),(
)(
'
'2222
2
2
2
2
),(),(
lk
d
imn
NM
di
elkrlkhDFe (2.3.3-5)
omitting the constant factor )'/()'exp( diikd for clarity. {...}DF denotes a
discrete Fourier transform. The reconstructed image is a )( MN matrix with
elements ),( mn and steps
N
dx F
'' ;
M
dy F
'' . (2.3.3-6)
28
References
[1] D. Gabor, “A New Microscopic Principle,” Nature, vol. 161, no. 4098, pp.
777–778, May 1948.
[2] G. L. Rogers, “Experiments in diffraction microscopy,” Proc. Roy. Soc.
Edinburgh, vol. 63A, pp. 193–221, 1952.
[3] H. M. A. El Sum and P. Kirkpatrick, “Microscopy by reconstructed
wavefronts,” Phys. Rev., vol. 85, p. 763, 1952.
[4] E. N. Leith and J. Upatnieks, “Reconstructed Wavefronts and
Communication Theory,” J. Opt. Soc. Am., vol. 52, no. 10, p. 1123, 1962.
[5] E. N. Leith and J. Upatnieks, “Wavefront Reconstruction with
Continuous-Tone Objects,” J. Opt. Soc. Am., vol. 53, no. 12, pp. 1377–
1381, 1963.
[6] E. N. Leith and J. Upatnieks, “Wavefront Reconstruction with Diffused
Illumination and Three-Dimensional Objects,” J. Opt. Soc. Am., vol. 54,
no. 11, pp. 1295–1301, 1964.
[7] R. L. Powell and K. A. Stetson, “Interferometric Vibration Analysis by
Wavefront Reconstruction,” J. Opt. Soc. Am., vol. 55, no. 12, pp. 1593–
1597, 1965.
[8] K. A. Stetson and R. L. Powell, “Interferometric Hologram Evaluation and
Real-Time Vibration Analysis of Diffuse Objects,” J. Opt. Soc. Am., vol.
55, no. 12, p. 1694, 1965.
[9] J. W. Goodman, “Digital Image Formation From Electronically Detected
Holograms,” Appl. Phys. Lett., vol. 11, no. 3, p. 77, 1967.
[10] M. A. Kronrod, N. S. Merzlyakov, and L. P. Yaroslavski, “Reconstruction
of holograms with a computer,” Sov. physics. Tech. physics., vol. 17, pp.
333–334, 1972.
[11] U. Schnars and W. Jüptner, “Direct recording of holograms by a CCD
target and numerical reconstruction.,” Appl. Opt., vol. 33, no. 2, pp. 179–
181, 1994.
[12] T. Zhang and I. Yamaguchi, “Three-dimensional microscopy with phase-
shifting digital holography.,” Opt. Lett., vol. 23, no. 15, pp. 1221–1223,
1998.
[13] E. Cuche, P. Marquet, and C. Depeursinge, “Simultaneous amplitude-

29
contrast and quantitative phase-contrast microscopy by numerical
reconstruction of Fresnel off-axis holograms,” 1999.
[14] R. B. Owen and A. a. Zozulya, “In-line digital holographic sensor for
monitoring and characterizing marine particulates,” Opt. Eng., vol. 39, no.
8, p. 2187, 2000.
[15] G. Pedrini, P. Fro, H. Fessler, and H. J. Tiziani, “In-line digital holographic
interferometry,” Appl. Opt., 2000.
[16] C. Wagner, W. Osten, and S. Seebacher, “Direct shape measurement by
digital wavefront reconstruction and multiwavelength contouring
Christophe,” Opt. Eng., vol. 39, no. 1, pp. 79–85, 2000.
[17] B. Nilsson and T. E. Carlsson, “Simultaneous measurement of shape and
deformation using digital light-in-flight recording by holography,” Opt.
Eng., vol. 39, no. 1, p. 244, 2000.
[18] H. Huh and J. K. Pan, “Optical/digital invariant recognition of two-
dimensional patterns with straight lines,” pp. 997–1002, 1996.

30
Chapter 3. Reversible Holographic Patterns on
Azopolymer for Guiding Cell Adhesion and Orientation
Abstract
Topography of material surfaces is known to influence cell behavior at different
levels: from adhesion up to differentiation. Different micro- and nanopatterning
techniques have been employed to create patterned surfaces to investigate various
aspects of cell behavior, most notably cellular mechanotransduction.
Nevertheless, conventional techniques, once implemented on a specific substrate,
fail in allowing dynamic changes of the topographic features. Here we
investigated the response of NIH-3T3 cells to reversible topographic signals
encoded on light-responsive azopolymer films. Switchable patterns were
fabricated by means of a well-established holographic setup. Surface relief
gratings were realized with Lloyd’s mirror system and erased with circularly
polarized or incoherent light. Cell cytoskeleton organization and focal adhesion
assembly proved to be very sensitive to the underlying topographic signal.
Thereafter, pattern reversibility was tested in air and wet environment by using
temperature or light as a trigger. Additionally, pattern modification was
dynamically performed on substrates with living cells. This study paves the way
toward an in situ and real-time investigation of the material−cytoskeleton
crosstalk caused by the intrinsic properties of azopolymers.

32
3.1. Introduction
Understanding cellular reaction and response to the external environment is a
central aspect in diverse biomedical, bioengineering, and clinical applications. A
growing number of works emphasize the high sensitivity that cells display toward
the chemical and physical features of the substrate to which they are connected.
In particular, such features proved to affect different aspects of cell behavior like
attachment, spreading, differentiation, and ultimately cell fate [1]–[5]. Different
types of signals displayed by the material substrate, such as biochemical,
mechanical, and topographical signals, can influence cell behaviour [6]–[8].
Topographic cues are known to exert a potent influence on cell fate and functions,
and many techniques were developed to fabricate micro- and nanogrooved
materials to study contact guidance and mechanotransduction phenomena. The
realization of substrates with topographic patterns usually relies on micro- and
nanofabrication techniques, chiefly soft lithography, electron beam lithography,
or focused ion beam lithography. These techniques, despite possessing a very
high spatial resolution, require expensive equipment and are timeconsuming,
especially when large surfaces need to be processed. Additionally, once
produced, the geometric features of the master or substrate cannot be readily
modified a posteriori because the displayed topography is intrinsically static in
nature. To overcome the limits of a physically static system and to develop more
versatile platforms, great interest has recently arisen in using stimulus-responsive
materials as dynamic supports to investigate cell response [9], [10]. These works
made use of temperature-responsive cell culture systems, developed through the
so-called shape memory polymers. A different approach uses azopolymer-based
substrates in which topographic patterns are transferred on the material surface
optically. More specifically, holographic imprinting of surface relief gratings
(SRGs) on azopolymer films is a promising approach for a straightforward
fabrication of dynamic substrates. In fact, holographic patterns of linearly
polarized light allow the realization of precise and spatially controlled gratings,
while circularly polarized or incoherent light allows pattern erasure [11]. Large-
scale surface mass displacement was observed by Rochon et al. [12] and Kim et
al [12], [13] who irradiated azopolymer films with an interference pattern of light.
Once the sinusoidal pattern of light is in contact with the polymer, it is able to
induce the formation of SRGs, in the form of topographic arrays that trace out
the light intensity profile. This phenomenon has been used to realize micro- and
nanogrooved polymer films, suitable in many applications, such as optics and
photonics [14], [15]. Because of their versatility and intrinsic properties, azo-
based materials may have a great impact in unraveling the dynamics of cell
adhesion events or in inducing specific adhesion-related signaling. Indeed, few
examples of SRG applications to cell cultures have been reported [16]–[18].
33
However, studies related to dynamic pattern writing and/or erasing with living
cells are lacking. On the basis of our previous experience on cell response to
static micro- and nanoscale patterns [19]–[21], we explored the possibility of
using light sensitive substrates to move toward the development of surfaces on
which patterned signals can be manipulated dynamically. Therefore, we
investigated the behavior of NIH-3T3 cells on a light sensitive azobenzene-based
polymer. Surface production proved to be easy and fast, and micron-scale
patterns were produced with conventional optical equipment. Polymer stability,
reversibility, and dynamic writing and erasing were investigated. Elongation,
orientation, and focal adhesion morphology of NIH-3T3 fibroblasts were studied
on different light-induced micron-scale topographic patterns. Our data
demonstrate that the process we propose is adequate for the production of
material platforms to perform in vitro studies on reversible and adjustable
topographic patterns. This can in principle allow investigation of
cell−topography interactions and mechanotransduction in a dynamic
environment.
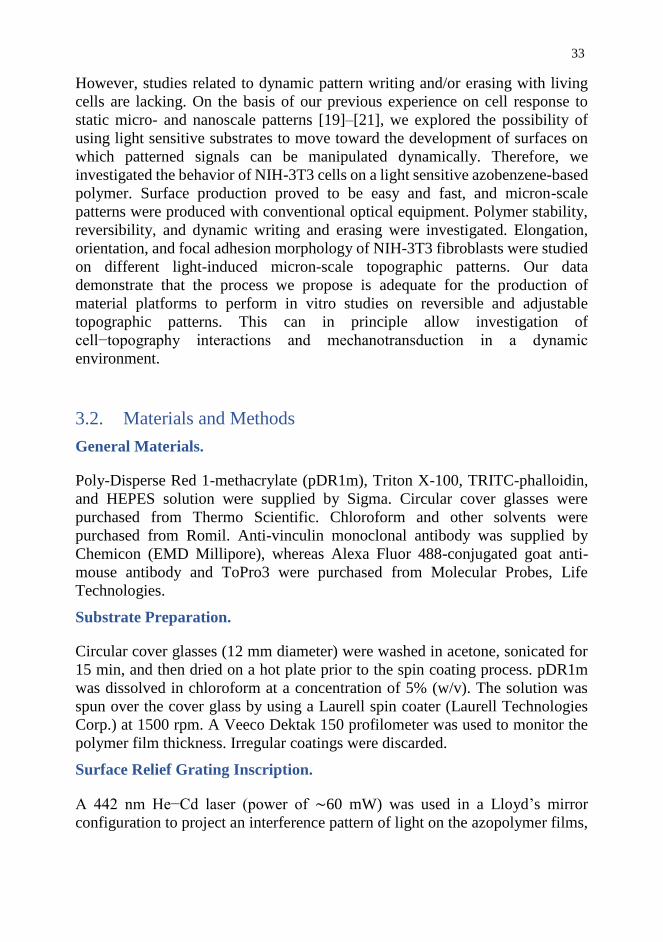
3.2. Materials and Methods
General Materials.
Poly-Disperse Red 1-methacrylate (pDR1m), Triton X-100, TRITC-phalloidin,
and HEPES solution were supplied by Sigma. Circular cover glasses were
purchased from Thermo Scientific. Chloroform and other solvents were
purchased from Romil. Anti-vinculin monoclonal antibody was supplied by
Chemicon (EMD Millipore), whereas Alexa Fluor 488-conjugated goat anti-
mouse antibody and ToPro3 were purchased from Molecular Probes, Life
Technologies.
Substrate Preparation.
Circular cover glasses (12 mm diameter) were washed in acetone, sonicated for
15 min, and then dried on a hot plate prior to the spin coating process. pDR1m
was dissolved in chloroform at a concentration of 5% (w/v). The solution was
spun over the cover glass by using a Laurell spin coater (Laurell Technologies
Corp.) at 1500 rpm. A Veeco Dektak 150 profilometer was used to monitor the
polymer film thickness. Irregular coatings were discarded.
Surface Relief Grating Inscription.
A 442 nm He−Cd laser (power of ∼60 mW) was used in a Lloyd’s mirror
configuration to project an interference pattern of light on the azopolymer films,

34
thus inducing mass migration and SRG formation. In more detail, the azopolymer
sample was glued to one of the mirror’s edge and the horizontally polarized laser
beam was reflected on it, thus realizing an interference pattern of light. The
pattern pitch was given by 2d = λ sin(ϑ), where λ is the laser wavelength and ϑ is
the angle between the incident beam and the mirror. With angle ϑ varying,
patterns with different pitch could be easily prepared. Additionally, a beam from
a He−Ne laser emitting at 632 nm was used for a real-time control of the
inscription process by monitoring the diffraction efficiency of the inscribed
grating.
Surface Relief Grating Erasure.
SRG structures can be erased by subjecting them to either high temperatures or
light [22]. Temperature-induced erasure was performed by means of a hot plate
that was used to heat patterned pDR1m films up to 130 °C, a temperature that is
well above the glass transition temperature of the polymer (Tg ∼ 85 °C). In the
case of light-induced erasure, two different strategies were pursued. First, a wave
plate retarder (WPR) was placed between the linear polarized beam (442 nm
He−Cd laser) and the sample and acted as polarization filter, thus converting the
linear polarized laser beam in a circularly polarized one. The time exposure was
10 min. When pattern erasure was performed in a wet environment, the circularly
polarized laser beam was reflected with a mirror on top of a fluid-filled 35 mm
diameter Petri dish. Three different fluid types were tested, namely, water, 10×
phosphatebuffered saline (PBS), and Dulbecco’s modified Eagle’s medium
(DMEM). The total fluid volume was 1.5 mL, and the time exposure was 10 min.
Second, incoherent light was employed to randomize the azomolecules and erase
the SRG inscription. In details, patterned samples were positioned in a Petri dish
filled with aqueous solutions and irradiated from the bottom part by using a
mercury lamp (15 mW intensity) with a 488 nm filter of a TCS SP5 confocal
microscope (Leica Microsystems). The time exposure was 2 min.
Atomic Force Microscopy (AFM).
A JPK NanoWizard II (JPK Instruments), mounted on the stage of an Axio
Observer Z1 microscope (Zeiss), was used to characterize the azopolymer films
in terms of surface topography and pattern features (depth and pitch). Silicon
nitride tips (MSCT, Bruker) with a spring constant of 0.01 N/m were used in
contact mode, in air at room temperature. The open source software Fiji was used
to measure both pattern height and pattern pitch with the 2D Fast Fourier
Transform function. Five samples for each pattern type were analyzed to obtain
the geometrical parameters.

35
Cell Culture and Immunofluorescence. NIH-3T3
fibroblasts were cultured in low-glucose DMEM and incubated at 37 °C in a
humidified atmosphere of 95% air and 5% CO2. Prior to cell seeding, pDR1m
substrates were sterilized under UV light for 30 min. In principle, UV irradiation
does not interfere with pDR1m conformation, because the maximum absorption
band of the azobenzene polymer is 483 nm (Figure S1 of the Supporting
Information). After 24 h, cells were fixed with 4% paraformaldehyde for 20 min
and then permeabilized with 0.1% Triton X-100 in PBS for 3 min. Actin
filaments were stained with TRITC-phalloidin. Samples were incubated for 30
min at room temperature in the phalloidin solution (1:200 dilution). Focal
adhesions (FAs) were stained with vinculin. Briefly, cells were incubated in an
anti-vinculin monoclonal antibody solution (1:200 dilution) for 2 h and then
marked with Alexa Fluor 488-conjugated goat anti-mouse antibody (1:1000
dilution) for 30 min at 20 °C. Finally, cells were incubated for 15 min at 37 °C
in ToPro3 solution (5:1000 dilution) to stain cell nuclei. A TCS SP5 confocal
microscope (Leica Microsystems) was used to collect fluorescent images of cells
on flat and patterned pDR1m films. Laser lines at 488 nm (vinculin), 543 nm
(actin), and 633 nm (nuclei) were used. Emissions were collected in the ranges
of 500−530, 560−610, and 650−750 nm, respectively. Cell and FA morphometry
measurements were performed by using Fiji software. The procedure has been
previously described by Ventre et al. [21] Briefly, cell elongation was assessed
from phalloidin-stained cells that were analyzed with the MomentMacroJ version
1.3 script (hopkinsmedicine.org/fae/mmacro. htm). We evaluated the principal
moments of inertia (i.e., maximum and minimum) and defined a cell elongation
index as the ratio of the principal moments (Imax/Imin). In more detail, the
moment of inertia of a digital image reflects how its points are distributed with
regard to an arbitrary axis and extreme values of the moments are evaluated along
the principal axes. High values of Imax/Imin identify elongated cells. Cell
orientation was defined as the angle that the principal axis of inertia formed with
a reference axis, i.e., the pattern direction in the case of 2.5 and 5.5 μm linear
patterns and the horizontal axis (x-axis) for a flat surface and a 2.5 μm × 2.5 μm
grid. Morphometric analysis of FAs was performed as follows. Digital images of
FAs were first processed using a 15 pixel wide Gaussian blur filter. Then, blurred
images were subtracted from the original images using the image calculator
command. The images were further processed with the threshold command to
obtain binarized images. Pixel noise was erased using the erode command, and
then particle analysis was performed to extract the morphometric descriptors.
Only FAs whose length was >1 μm were included in the subsequent analysis.
Significant differences between FA length or cell orientation groups were

36
determined with the Kruskal−Wallis test run in Matlab (The Mathworks, Natick,
MA).
3.3. Results and Discussion
Fig. 3.1: Three-dimensional AFM images of (A) flat spin-coated pDR1m, (B) 2.5 μm pitch
pattern realized with an interference pattern of light, and (C) a 2D grating obtained by two-step
illumination. The second grating was inscribed after rotating the sample by 90°.Schematic
representation of the different actin cytoskeleton assemblies within cells.
Azobenzene-based polymers undergo conformational changes when they are
irradiated by light. More specifically, under irradiation with a proper wavelength,
the continuous trans−cis−trans photoisomerization of azobenzene molecules,
together with their change in geometrical disposition and polarity, results in a
locally preferred orientation of the azobenzene groups, which direct
perpendicular to the incident electrical field. As a result, polymer mass migration
occurs, thus inducing a pattern inscription on the material surface. Many models
have been proposed so far, aiming to elucidate the mechanism of light-induced
mass transport and consequent pattern formation. Among these, a thermal model
[23], a pressure gradient force model [24], a mean-field model [25], an optical-
field gradient force model [26], [27], and athermal photofluidization [28] have
been developed and presented in the past few decades. However, a general
consensus about the physics that governs SRG formation has not yet been
achieved. In this work, we used SRGs as cell culture substrates. Topographic
patterns were inscribed and erased on pDR1m films by using an interference
pattern of light and circularly polarized or incoherent beam, respectively.
Because of the photoreversibility of the azopolymer surface structures, a study of
the response of NIH-3T3 cells to the dynamic topographic changes of SRGs was
performed. Lloyd’s mirror is a well-consolidated setup that we employed to
realize gratings on 700 nm thick pDR1m layers (Figure 3.3A). In detail, a linear
polarized light reflecting on a mirror resulted in a holographic pattern of light,
which was able to inscribe a parallel grating on the interfering azopolymer film

37
surface (Figure 3B). By performing a second inscription after rotating the sample
by 90°, we realized a two-dimensional (2D) SRG (Figure 3.3C).
Table 1: Dimensions of the Geometrical Features of the SRGs.
Patterns with different pitches were prepared by varying the angle between the
laser beam and the mirror. Our study was based on linear patterns with nominal
pitches of 2.5 and 5.5 μm and a two-dimensional grid with a 2.5 μm × 2.5 μm
pitch. Table 1 shows the measured geometrical features of the patterns, in terms
of depth and pitch. The pattern pitch is in good agreement with the theoretical
predefined values. The pitch mismatch observed on the microgrid is probably due
to the imperfect overlap between the two linear patterns. In the following,
substrates will be termed 2.5 and 5.5 μm linear patterns and 2.5 μm × 2.5 μm grid
pattern. To use these materials as cell culture substrates, we performed a
preliminary test to assess pattern stability under conditions comparable to those
experienced during cell culture. Toward this aim, a 2.5 μm linear pattern was
scanned via AFM, thus obtaining the time-zero height profile. Then the sample
was immersed in DMEM at 37 °C for 24 h. Afterward, the sample was washed,
air-dried, and scanned via AFM. The gross morphology of the pattern remained
unchanged, as well as the height profile, thus demonstrating the structural
stability of the substrate under biological conditions. The NIH-3T3 fibroblast
response to the patterned substrates was studied in terms of cell adhesion (length
and orientation of FAs) and cell shape. Flat polymer films were used as control
surfaces. Different topographic patterns on azopolymer films proved to exert a
strong influence on cell behavior. In fact, NIH-3T3 cells were mostly round or
elliptical in shape when cultivated on a flat or 2.5 μm × 2.5 μm grid pattern
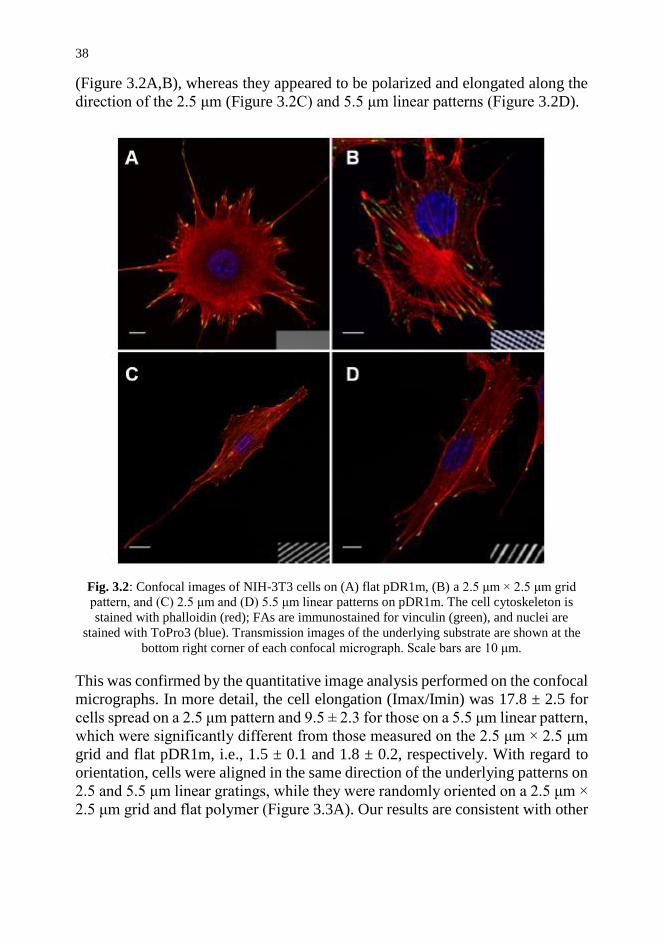
38
(Figure 3.2A,B), whereas they appeared to be polarized and elongated along the
direction of the 2.5 μm (Figure 3.2C) and 5.5 μm linear patterns (Figure 3.2D).
Fig. 3.2: Confocal images of NIH-3T3 cells on (A) flat pDR1m, (B) a 2.5 μm × 2.5 μm grid
pattern, and (C) 2.5 μm and (D) 5.5 μm linear patterns on pDR1m. The cell cytoskeleton is
stained with phalloidin (red); FAs are immunostained for vinculin (green), and nuclei are
stained with ToPro3 (blue). Transmission images of the underlying substrate are shown at the
bottom right corner of each confocal micrograph. Scale bars are 10 μm.
This was confirmed by the quantitative image analysis performed on the confocal
micrographs. In more detail, the cell elongation (Imax/Imin) was 17.8 ± 2.5 for
cells spread on a 2.5 μm pattern and 9.5 ± 2.3 for those on a 5.5 μm linear pattern,
which were significantly different from those measured on the 2.5 μm × 2.5 μm
grid and flat pDR1m, i.e., 1.5 ± 0.1 and 1.8 ± 0.2, respectively. With regard to
orientation, cells were aligned in the same direction of the underlying patterns on
2.5 and 5.5 μm linear gratings, while they were randomly oriented on a 2.5 μm ×
2.5 μm grid and flat polymer (Figure 3.3A). Our results are consistent with other
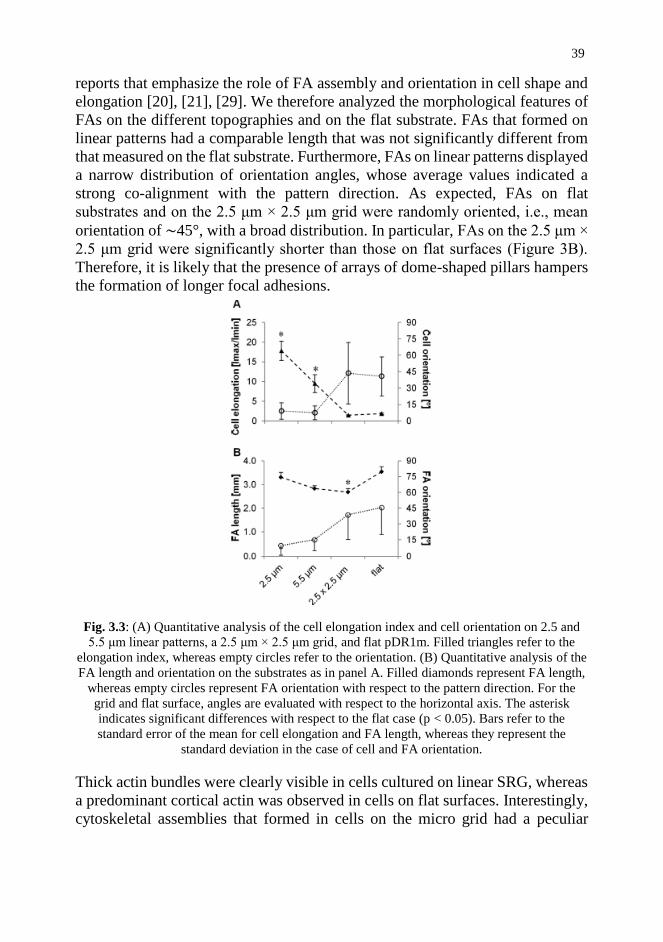
39
reports that emphasize the role of FA assembly and orientation in cell shape and
elongation [20], [21], [29]. We therefore analyzed the morphological features of
FAs on the different topographies and on the flat substrate. FAs that formed on
linear patterns had a comparable length that was not significantly different from
that measured on the flat substrate. Furthermore, FAs on linear patterns displayed
a narrow distribution of orientation angles, whose average values indicated a
strong co-alignment with the pattern direction. As expected, FAs on flat
substrates and on the 2.5 μm × 2.5 μm grid were randomly oriented, i.e., mean
orientation of ∼45°, with a broad distribution. In particular, FAs on the 2.5 μm ×
2.5 μm grid were significantly shorter than those on flat surfaces (Figure 3B).
Therefore, it is likely that the presence of arrays of dome-shaped pillars hampers
the formation of longer focal adhesions.
Fig. 3.3: (A) Quantitative analysis of the cell elongation index and cell orientation on 2.5 and
5.5 μm linear patterns, a 2.5 μm × 2.5 μm grid, and flat pDR1m. Filled triangles refer to the
elongation index, whereas empty circles refer to the orientation. (B) Quantitative analysis of the
FA length and orientation on the substrates as in panel A. Filled diamonds represent FA length,
whereas empty circles represent FA orientation with respect to the pattern direction. For the
grid and flat surface, angles are evaluated with respect to the horizontal axis. The asterisk
indicates significant differences with respect to the flat case (p < 0.05). Bars refer to the
standard error of the mean for cell elongation and FA length, whereas they represent the
standard deviation in the case of cell and FA orientation.
Thick actin bundles were clearly visible in cells cultured on linear SRG, whereas
a predominant cortical actin was observed in cells on flat surfaces. Interestingly,
cytoskeletal assemblies that formed in cells on the micro grid had a peculiar
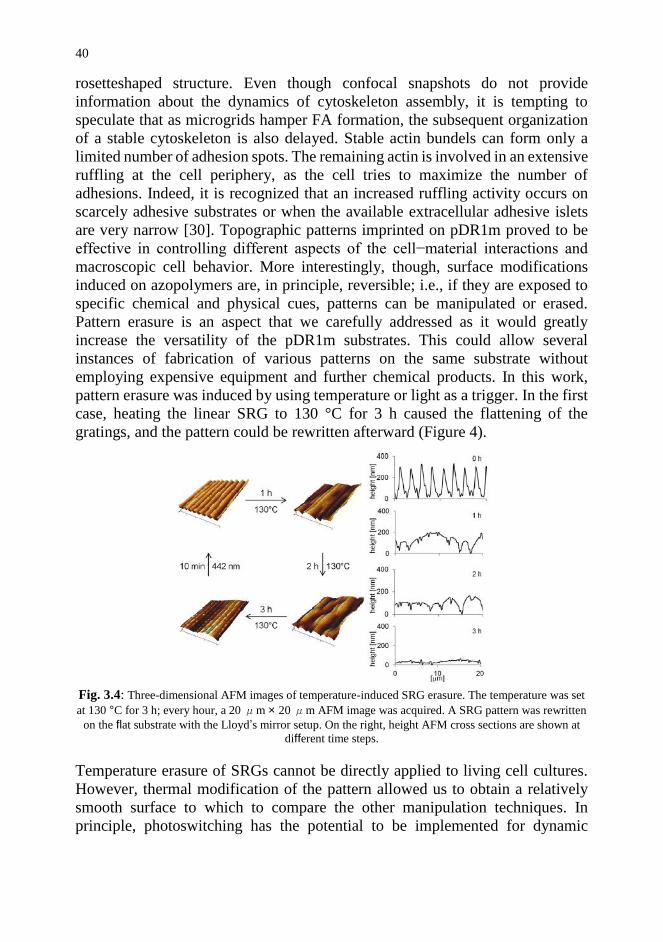
40
rosetteshaped structure. Even though confocal snapshots do not provide
information about the dynamics of cytoskeleton assembly, it is tempting to
speculate that as microgrids hamper FA formation, the subsequent organization
of a stable cytoskeleton is also delayed. Stable actin bundels can form only a
limited number of adhesion spots. The remaining actin is involved in an extensive
ruffling at the cell periphery, as the cell tries to maximize the number of
adhesions. Indeed, it is recognized that an increased ruffling activity occurs on
scarcely adhesive substrates or when the available extracellular adhesive islets
are very narrow [30]. Topographic patterns imprinted on pDR1m proved to be
effective in controlling different aspects of the cell−material interactions and
macroscopic cell behavior. More interestingly, though, surface modifications
induced on azopolymers are, in principle, reversible; i.e., if they are exposed to
specific chemical and physical cues, patterns can be manipulated or erased.
Pattern erasure is an aspect that we carefully addressed as it would greatly
increase the versatility of the pDR1m substrates. This could allow several
instances of fabrication of various patterns on the same substrate without
employing expensive equipment and further chemical products. In this work,
pattern erasure was induced by using temperature or light as a trigger. In the first
case, heating the linear SRG to 130 °C for 3 h caused the flattening of the
gratings, and the pattern could be rewritten afterward (Figure 4).
Fig. 3.4: Three-dimensional AFM images of temperature-induced SRG erasure. The temperature was set
at 130 °C for 3 h; every hour, a 20 μm × 20 μm AFM image was acquired. A SRG pattern was rewritten
on the flat substrate with the Lloyd’s mirror setup. On the right, height AFM cross sections are shown at
different time steps.
Temperature erasure of SRGs cannot be directly applied to living cell cultures.
However, thermal modification of the pattern allowed us to obtain a relatively
smooth surface to which to compare the other manipulation techniques. In
principle, photoswitching has the potential to be implemented for dynamic

41
changes of the pattern features. As a preliminary experiment, circularly polarized
light was used to reduce SRG depth. After irradiation for 10 min in air at room
temperature, the grating depth decreased from 90 to 10 nm, similar in shape to
that obtained through thermal processing. To assess the effectiveness of pattern
modification on a cell culture experiment, we first cultivated NIH-3T3 cells on
flat surfaces for 24 h. Cells were then trypsinized, and the substrates were washed
in PBS and air-dried. Second, a 2.5 μm pattern was inscribed using the setup
previously described on which cells were seeded on the patterned substrate and
cultivated for 24 h. Finally, cells were trypsinized, the substrate was washed and
dried, and the pattern was erased by exposing it to a circularly polarized light for
10 min at room temperature. To draw out quantitative data on cell morphology
and adhesion, we prepared a second set of samples in which cells were fixed and
stained rather than detached from each substrate with trypsin. Therefore, confocal
images of cells stained for vinculin, actin, and nuclei were acquired (Figure 3.5).
Cells were randomly distributed on a flat polymer, while they acquired an
elongated morphology when they were seeded on the linear pattern. Circularly
polarized light dramatically reduced pattern height, and cells recovered a round
morphology accordingly. The quantification of cell elongation and orientation is
reported in Figure 5D, in which the highest values of elongation are measured on
the 2.5 μm pattern, whereas the elongation of cells on the erased pattern is not
significantly different from that of the flat case. Accordingly, cell orientation was
nearly parallel to the pattern direction with a narrow distribution when cells were
seeded on the pattern, while a random orientation with a broad distribution was
measured for cells on both flat and erased pattern. FA length did not display
changes in the writing/erasing cycles, whereas FA orientation was very sensitive
to the topography as parallel FAs were observed on the SRG only (Figure 3.5E).
Therefore, pDR1m-coated substrates can in principle be rewritten with different
patterns, and cells respond to the modified signal accordingly. Cells are
necessarily cultivated in aqueous media. To implement light-induced pattern
modification or erasure while living cells are cultivated on the substrate, the
circularly polarized laser beam must pass through the culturing medium before
colliding onto the patterned surface. We then investigated whether the process of
pattern erasure was affected by the presence of an aqueous environment.
Therefore, the laser beam was directed into the Petri dish containing the SRG
sample immersed in either water, PBS, or DMEM (1.5 mL in volume). After
exposure for 10 min, we observed the formation of bubblelike structures on the
polymer surface, which were arranged in a sort of aligned pattern.
Simultaneously, the original topographic pattern intensity was drastically
reduced. This particular effect occurred in a manner independent of the fluid type.
Cells seeded on the erased SRG were not able to perceive the original topographic

42
signals (red arrow) but rather co-aligned along the bubblelike structures (yellow
arrow).
Fig. 3.5: Confocal images of NIH-3T3 cells cultivated on (A) flat pDR1m substrate, (B) SRG
grating, and (C) pattern erased with circularly polarized light. Transmission images of the
substrate are reported in the bottom right corner of each confocal micrograph, and AFM scans
are shown below them. (D) Plots of cell elongation (▲) and cell orientation (○). (E) Plot of FA
length (▲) and orientation (○). The asterisk denotes a significant difference with respect to the
flat case. Bars indicate the standard error of the mean in the case of cell elongation and FA
length, whereas they represent the standard deviation in the case of cell and FA orientation.
The use of circularly polarized light to erase or reduce the pattern depth entailed
a great disadvantage; in fact, the optical setup was hardly adaptable to cell
environment conditions, and the laser intensity was not suitable for dynamic real-
time experiments with cells. For this reason, we introduced a new approach to
erase SRG structures on pDR1m films, based on the use of a microscope. This
new strategy was more adaptable to biological conditions; in fact, because of the
microscope equipment it was possible to identify precisely the polymer surface,
and because of the coupled isolated thermochamber, the biological environment
was easily reproduced, allowing the observation of cells over several hours after
light exposure. In this case, an incoherent and unpolarized light beam of a
43
mercury lamp, implemented in a Leica confocal microscope (15 mW intensity,
488 nm filter), was used to erase the patterns. In fact, incoherent and unpolarized
light is highly effective in randomizing azobenzene molecule orientation, as well
as circularly polarized light. Starting from these observations, we irradiated a
cellpopulated 2.5 μm pattern for 2 min with the mercury lamp. Also in this case,
bubblelike structures appeared. However, NIH-3T3 cells were still vital and
migrated over the substrate. Despite the fact that both circularly polarized and
incoherent light sources proved to be very effective in erasing the pattern under
dry conditions, the presence of an aqueous environment generates the bubblelike
structures due to either scattering of the light or promotion of uncontrolled
interactions between water and the azopolymer. It is most likely that upon
irradiation water molecules deform the polymer, while pDR1m is stable in
aqueous media under the normal cell culturing conditions. Therefore, we
hypothesize that a photofluidization process (athermal anisotropic
photosoftening) occurs, meaning that light-induced molecule mobility allows
small forces to generate material flow [31]. In an aqueous environment, this
phenomenon triggers a sort of interfacial phase separation between the
hydrophobic polymer and the aqueous environment, with the formation of
globular polymeric domains on the substrates. However, this needs to be
confirmed with specific experiments. Azobenzene compounds, along with their
response to light irradiation, have been widely investigated and are mainly used
in the optics and photonics fields. Despite their extraordinary chemical and
physical characteristics, the number of studies on the use of azobenzene-based
substrates for cell cultures is limited. Specifically functionalized azopolymers
were used to alter the surface chemistry of cell culture substrates, for example,
wettability or ligand presentation, thus altering the cell response [32].
Azopolymers are particularly suitable for the fabrication of topographic patterns
because of the orderly mass migration induced by interference patterns of linearly
polarized light [11]. This makes these polymers an ideal platform for studying
cell−topography interactions. The topographic signal and in particular micron-
and submicron-scale signals proved to strongly affect and control a specific
aspect of the cell behavior. They finely regulate the processes of cell adhesion
and migration [20], [21], [29], and topographies can exert a profound impact on
cell differentiation [1], [4] and tissuegenesis [19], [33]. In the case of topographic
patterns encoded on azopolymers for in vitro cell cultures, Rocha et al.[17]
studied the biocompatibility of azopolymer-based polysiloxane coatings and
investigated the stability of the substrates in an aqueous environment. Barille et
al.[16] examined the imprinting capabilities of the azo-based photoswitchable
materials under both dry and wet conditions and analyzed neuron response to the
topographic signal. Interestingly, they also reported that irregularities were
observed when the pattern was embossed in the presence of PBS. To the best of

44
our knowledge, however, the possibility of exploiting the writing/erasing
reversibility of azobenzene polymers in biological applications has not yet been
addressed. We demonstrated that pDR1m-coated glass can be patterned in a
reversible manner using either temperature or light triggers. Additionally, the
microscopy setup we propose allows pattern feature alteration in the presence of
cells without affecting their viability. However, even though the system has the
potential to be employed for real-time experiments with living cells, the
irradiation technique needs to be optimized to gain better control of azopolymer
mass transport and hence improve pattern modification.

45
3.4. Conclusions and Future Trends
In this work, we presented an effective and inexpensive technique for imprinting
and modifying large-scale biocompatible topographic patterns on pDR1m-coated
glass, using conventional equipment. Patterned substrates proved to be effective
in confining FA growth and cytoskeletal assembly. The pattern could be easily
erased and rewritten under dry conditions, whereas in a wet environment,
circularly polarized or incoherent light was able to alter pattern shape. In
particular, incoherent and unpolarized light-mediated erasure proved to be a
promising strategy for real-time experiments with living cells as microscopy
setup and illumination exposure time did not affect cell viability. Therefore, the
system we proposed has the potential to be employed for understanding cell
behavior and possibly mechanotransduction events in a dynamic environment.

46
References
[1] L. E. McNamara, R. J. McMurray, M. J. Biggs, and F. Kantawong,
“Nanotopographical control of stem cell differentiation,” J. Tissue Eng.,
vol. Article ID, pp. 1–13, 2010.
[2] B. Ladoux and A. Nicolas, “Physically based principles of cell adhesion
mechanosensitivity in tissues,” Reports Prog. Phys., vol. 75, no. 11, p.
116601, 2012.
[3] M. J. P. Biggs, R. G. Richards, and M. J. Dalby, “Nanotopographical
modification: A regulator of cellular function through focal adhesions,”
Nanomedicine Nanotechnology, Biol. Med., vol. 6, no. 5, pp. 619–633,
2010.
[4] E. K. F. Yim, E. M. Darling, K. Kulangara, F. Guilak, and K. W. Leong,
“Nanotopography-induced changes in focal adhesions, cytoskeletal
organization, and mechanical properties of human mesenchymal stem
cells,” Biomaterials, vol. 31, no. 6, pp. 1299–1306, 2010.
[5] M. Ventre, F. Valle, M. Bianchi, F. Biscarini, and P. A. Netti, “Cell
fluidics: Producing cellular streams on micropatterned synthetic surfaces,”
Langmuir, vol. 28, no. 1, pp. 714–721, 2012.
[6] N. J. Hallab, K. J. Bundy, K. O’Connor, R. Clark, and R. L. Moses, “Cell
adhesion to biomaterials: correlations between surface charge, surface
roughness, adsorbed protein, and cell morphology.,” J. Long. Term. Eff.
Med. Implants, vol. 5, no. 3, pp. 209–231, 1995.
[7] R. Flemming, C. Murphy, G. Abrams, S. Goodman, and P. Nealey,
“Effects of synthetic micro-and nano-structured surfaces on cell
behavior,” Biomaterials, vol. 20, no. 1999, pp. 573–588, 1999.
[8] M. Ventre, F. Causa, and P. A. Netti, “Determinants of cell-material
crosstalk at the interface: towards engineering of cell instructive
materials,” J. R. Soc. Interface, vol. 9, no. 74, pp. 2017–2032, 2012.
[9] K. a. Davis, K. a. Burke, P. T. Mather, and J. H. Henderson, “Dynamic
cell behavior on shape memory polymer substrates,” Biomaterials, vol. 32,
no. 9, pp. 2285–2293, 2011.
[10] D. M. Le, K. Kulangara, A. F. Adler, K. W. Leong, and V. S. Ashby,
47
“Dynamic topographical control of mesenchymal stem cells by culture on
responsive poly(ε-caprolactone) surfaces,” Adv. Mater., vol. 23, no. 29,
pp. 3278–3283, 2011.
[11] A. Natansohn and P. Rochon, “Photoinduced Motions in Azo-Containing
Polymers,” 2002.
[12] P. Rochon, E. Batalla, and a. Natansohn, “Optically induced surface
gratings on azoaromatic polymer films,” Appl. Phys. Lett., vol. 66, no. 2,
pp. 136–138, 1995.
[13] D. Y. Kim, S. K. Tripathy, L. Li, and J. Kumar, “Laser-induced
holographic surface relief gratings on nonlinear optical polymer films,”
Appl. Phys. Lett., vol. 66, no. 10, pp. 1166–1168, 1995.
[14] S. R. Marder, B. Kippelen, A. K. Jen, and N. Peyghambarian, “Design and
synthesis of chromophores and polymers for electro-optic and
photorefractive applications,” 1997.
[15] A. Priimagi and A. Shevchenko, “Azopolymer-based micro- and
nanopatterning for photonic applications,” J. Polym. Sci. Part B Polym.
Phys., vol. 52, no. 3, pp. 163–182, Feb. 2014.
[16] R. Barillé, R. Janik, S. Kucharski, J. Eyer, and F. Letournel, “Photo-
responsive polymer with erasable and reconfigurable micro- and nano-
patterns: An in vitro study for neuron guidance,” Colloids Surfaces B
Biointerfaces, vol. 88, no. 1, pp. 63–71, 2011.
[17] L. Rocha, C. M. Paius, A. Luca-Raicu, E. Resmerita, A. Rusu, I. A.
Moleavin, M. Hamel, N. Branza-Nichita, and N. Hurduc, “Azobenzene
based polymers as photoactive supports and micellar structures for
applications in biology,” J. Photochem. Photobiol. A Chem., vol. 291, pp.
16–25, 2014.
[18] H. Baac, J.-H. Lee, J.-M. Seo, T. H. Park, H. Chung, S.-D. Lee, and S. J.
Kim, “Submicron-scale topographical control of cell growth using
holographic surface relief grating,” Mater. Sci. Eng. C, vol. 24, no. 1–2,
pp. 209–212, 2004.
[19] M. Iannone, M. Ventre, L. Formisano, L. Casalino, E. J. Patriarca, and P.
A. Netti, “Nanoengineered surfaces for focal adhesion guidance trigger
mesenchymal stem cell self-organization and tenogenesis,” Nano Lett.,
48
vol. 15, no. 3, pp. 1517–1525, 2015.
[20] C. F. Natale, M. Ventre, and P. A. Netti, “Tuning the material-cytoskeleton
crosstalk via nanoconfinement of focal adhesions,” Biomaterials, vol. 35,
no. 9, pp. 2743–2751, 2014.
[21] M. Ventre, C. F. Natale, C. Rianna, and P. A. Netti, “Topographic cell
instructive patterns to control cell adhesion, polarization and migration,”
J. R. Soc. Interface, vol. 11, p. 20140687, 2014.
[22] X. L. Jiang, L. Li, J. Kumar, D. Y. Kim, and S. K. Tripathy, “Unusual
polarization dependent optical erasure of surface relief gratings on
azobenzene polymer films,” Appl. Phys. Lett., vol. 72, no. 20, pp. 2502–
2504, 1998.
[23] K. G. Yager and C. J. Barrett, “Temperature modeling of laser-irradiated
azo-polymer thin films,” J. Chem. Phys., vol. 120, no. 2, pp. 1089–1096,
2004.
[24] C. J. Barrett, A. L. Natansohn, and P. L. Rochon, “Mechanism of Optically
Inscribed High-Efficiency Diffraction Gratings in Azo Polymer Films,” J.
Phys. Chem., vol. 100, no. 21, pp. 8836–8842, 1996.
[25] T. Pedersen, P. Johansen, N. Holme, P. Ramanujam, and S. Hvilsted,
“Mean-Field Theory of Photoinduced Formation of Surface Reliefs in
Side-Chain Azobenzene Polymers,” Phys. Rev. Lett., vol. 80, pp. 89–92,
1998.
[26] J. Kumar, L. Li, X. L. Jiang, D.-Y. Kim, T. S. Lee, and S. Tripathy,
“Gradient force: The mechanism for surface relief grating formation in
azobenzene functionalized polymers,” Appl. Phys. Lett., vol. 72, no. 17, p.
2096, 1998.
[27] S. Bian, W. Liu, J. Williams, L. Samuelson, J. Kumar, and S. Tripathy,
“Photoinduced surface relief grating on amorphous poly(4-
phenylazophenol) films,” Chem. Mater., vol. 12, no. 6, pp. 1585–1590,
2000.
[28] N. Hurduc, B. C. Donose, A. Macovei, C. Paius, C. Ibanescu, D. Scutaru,
M. Hamel, N. Branza-Nichita, and L. Rocha, “Direct observation of
athermal photofluidisation in azo-polymer films,” Soft Matter, vol. 10, no.
26, p. 4640, 2014.
49
[29] S. A. Biela, Y. Su, J. P. Spatz, and R. Kemkemer, “Different sensitivity of
human endothelial cells, smooth muscle cells and fibroblasts to
topography in the nano-micro range,” Acta Biomater., vol. 5, pp. 2460–
2466, 2009.
[30] R. Lutz, K. Pataky, N. Gadhari, M. Marelli, J. Brugger, and M. Chiquet,
“Nano-stenciled RGD-gold patterns that inhibit focal contact maturation
induce lamellipodia formation in fibroblasts,” PLoS One, vol. 6, no. 9,
2011.
[31] P. Karageorgiev, D. Neher, B. Schulz, B. Stiller, U. Pietsch, M. Giersig,
and L. Brehmer, “From anisotropic photo-fluidity towards
nanomanipulation in the optical near-field.,” Nat. Mater., vol. 4, no. 9, pp.
699–703, 2005.
[32] G. Wang and J. Zhang, “Photoresponsive molecular switches for
biotechnology,” J. Photochem. Photobiol. C Photochem. Rev., vol. 13, no.
4, pp. 299–309, 2012.
[33] D.-H. Kim, E. A. Lipke, P. Kim, R. Cheong, S. Thompson, M. Delannoy,
K.-Y. Suh, L. Tung, and A. Levchenko, “Nanoscale cues regulate the
structure and function of macroscopic cardiac tissue constructs.,” Proc.
Natl. Acad. Sci. U. S. A., vol. 107, no. 2, pp. 565–70, 2010.

50

Chapter 4. Imaging and Characterization of Surface
Relief Gratings on Azopolymer by Digital Holographic
Microscopy
Abstract
Azopolymers are unique materials with interesting optical properties due to the
photoisomerization reaction, which induce large material motions at molecular,
nanometrical and even macroscopical scales making suitable for many
applications. Several methods such as direct efficiency diffraction and AFM are
used to characterize and study the morphological properties of SRG’s. However,
those methods are time-consuming, invasive or non-so much revealing. In this
paper we shown that the use of DHM can overcome these limitations. We use a
DHM set-up after using a Lloyd mirror to retrieve 3-D information from the
whole sample in a fast and non-invasive way. AFM and DHM data are matched
to validate our approach. Due to his high axial resolution, DHM shows
nanometrical axial deepness information.
52
4.1. Introduction
The request of the synthesis of functional polymers has experimented a great
growth due to the need to produce optoelectronic materials for different
applications such as light emitting diodes, thin-film transistors, sensors, light-
harvesting. Nowadays, functional polymers if biocompatible can be used as
supportive scaffolds in the field of tissue engineering. Recently, we were
focused our attention to study and make a biocompatible gratings by
interferometric techniques in order to investigate the cell motion using azo-
polymer (poly Disperse Red 1 acrylate (pDR1a)) as surface relief grating (SRG)
[1]. SRG’s were first observed in 1995 by Rochon [2] and Kumar [3]. Even more,
it was the first time that a large-scale surface mass transport generated by
polarized laser light was reported in polymer science. Such experimental work
caught sight of new amazing light-induced phenomena never explained before.
There is a last good reviewed work available covering Azopolymer micro- and
nanostructures for photonic applications belongs to Priimagi and Shevchenko [4]
spiegare cosa dice questa review. Following the division initially explained by
Natansohn and Rochon, the photoisomerization reaction can induce substantial
material motions at different scales, i.e., molecular, mesoscopic and macroscopic
level. The effect of SRG’s formations depends on light properties (intensity,
polarization and wavelength…) and material characteristics (compound and
material thick…). Many works have studied theoretical models to understand
how light can cause such macroscopic movements of glassy materials at even
more than 100ºC below the glass-transition temperature of the polymer. The
common element of all currently proposed models is that the light-induced mass-
transport action is related to the optical field via its intensity gradients [5]; even
so, the mechanism responsible for the formation of SRG is still unresolved [6]–
[8].
Besides, the diffractive properties of azopolymer diffraction gratings were in
1984 (Todorov et. al.) [9] assumed to be only due to the birefringence
phenomena. The Rochon team used an atomic force microscope (AFM) to
examine the surface of the polymer [2], which allowed them to perceive the
nanometrical sinusoidal variation of the depth. Therefore, it is easy to understand
how important is to apply specialized advanced devices and methodologies to
glimpse new phenomena that escape to human ingenuity. Then, characterize
accurately such substrates is not a simple task. On one side, diffraction method
was the original procedure that Todorov used to characterize the diffraction
efficiency but did not provide surface information making it, at the present time,
an homemade traditional technique to characterize the SRG’s. On the other hand,
AFM has helped to researchers to characterize with incredible accuracy much

53
kind of surfaces, from the polymer films to the cells. For example, a research
group recently coupled an AFM to an optical lithographic interferometer to
characterize SRG’s [10]. However, this appreciative technic suffers from several
disadvantages. From our point of view, the great disadvantage is the relative slow
rate of scanning during AFM image, which avoid really the on-line image
acquisition. Then, two key points arise and suggest the need for continue
searching new analysis options which allow to the researcher make more flexible
and simple the characterization of SRG’s. SRG’s on azopolymer are difficult to
observe in optical bright-field microscopy and they are almost invisible when the
groves thickness has nanometrical deepness. Those groves produce a sinusoidal
phase shift to the incoming light where the thickness information is encoded. A
qualitative visualization of this phase contrast may be obtained by contrast
interference microscopy, that is, phase contrast or Normaski/Zernicke
interferential contrast microscopy. However, by these techniques, it is not
possible to retrieve the quantitative phase shift value. In order to overcome these
intrinsic limitations, a Digital Holographic Microscope (DHM) approach is
employed in this work [11]. DHM is noncontact, label-free, non-invasive and
high axial resolution method that allows the recording and reconstruction of the
wave front information from biomaterials (amplitude and phase information).
Consequently, 3-D quantitative sample imaging can be automatically produced
by numerical refocusing of a 2-D image at different object planes without
mechanical realigning the optical imaging system. This method allows the
characterization of dynamical samples. DHM has been [12] successfully applied
for real-time 3-D metrology for studying microelectromechanical systems
(MEMS), vibrational analysis, recognition and study of cells behavior [13]–[15],
for imaging in turbid media [16], TIR [17], [18] and plasmonic phase image,
resolution improvement (super-resolution) [19], [20] and nano sized particle
detection. In this work, we use DHM for the first time in order to study and
characterize statically the SRG’s formation based on azopolymers.
4.2. Tools and Approaches
Substrate preparation
Circular cover glasses (12 mm diameter) were washed in acetone, sonicated for
15 min and then dried on a hot plate prior to the spin coating process. Poly-
Disperse Red 1-methacrylate (pDR1m from Sigma-Aldrich) was dissolved in
chloroform at a 5% w/v concentration. The solution was spun over the cover glass
by using a Laurell spin coater (Laurell Technologies Corporation, USA) at 1500
rpm. A Dektak 150 profilometer was used to monitor the polymer film thickness.
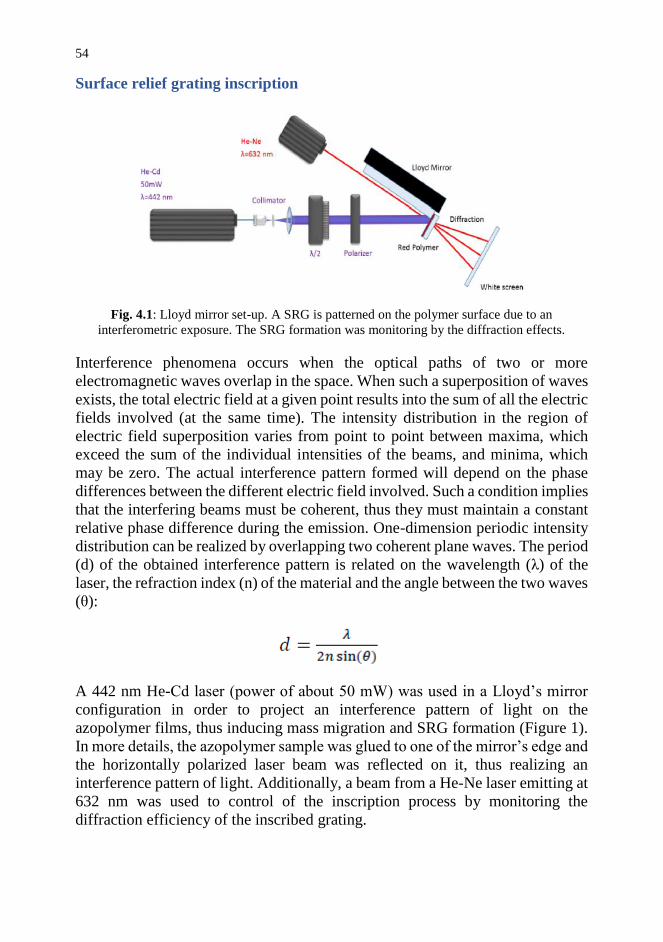
54
Surface relief grating inscription
Fig. 4.1: Lloyd mirror set-up. A SRG is patterned on the polymer surface due to an
interferometric exposure. The SRG formation was monitoring by the diffraction effects.
Interference phenomena occurs when the optical paths of two or more
electromagnetic waves overlap in the space. When such a superposition of waves
exists, the total electric field at a given point results into the sum of all the electric
fields involved (at the same time). The intensity distribution in the region of
electric field superposition varies from point to point between maxima, which
exceed the sum of the individual intensities of the beams, and minima, which
may be zero. The actual interference pattern formed will depend on the phase
differences between the different electric field involved. Such a condition implies
that the interfering beams must be coherent, thus they must maintain a constant
relative phase difference during the emission. One-dimension periodic intensity
distribution can be realized by overlapping two coherent plane waves. The period
(d) of the obtained interference pattern is related on the wavelength (λ) of the
laser, the refraction index (n) of the material and the angle between the two waves
(θ):
A 442 nm He-Cd laser (power of about 50 mW) was used in a Lloyd’s mirror
configuration in order to project an interference pattern of light on the
azopolymer films, thus inducing mass migration and SRG formation (Figure 1).
In more details, the azopolymer sample was glued to one of the mirror’s edge and
the horizontally polarized laser beam was reflected on it, thus realizing an
interference pattern of light. Additionally, a beam from a He-Ne laser emitting at
632 nm was used to control of the inscription process by monitoring the
diffraction efficiency of the inscribed grating.
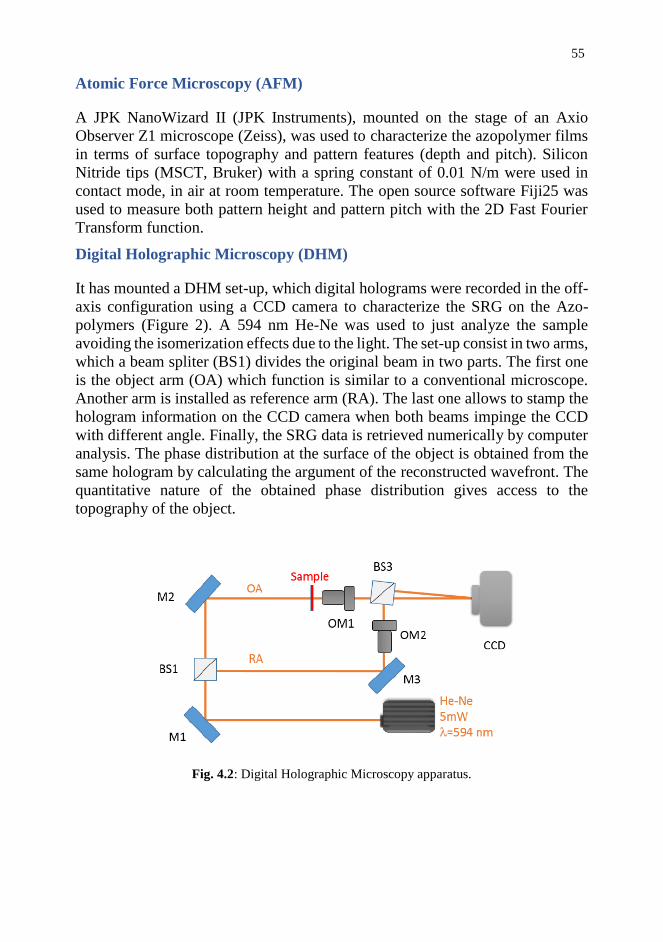
55
Atomic Force Microscopy (AFM)
A JPK NanoWizard II (JPK Instruments), mounted on the stage of an Axio
Observer Z1 microscope (Zeiss), was used to characterize the azopolymer films
in terms of surface topography and pattern features (depth and pitch). Silicon
Nitride tips (MSCT, Bruker) with a spring constant of 0.01 N/m were used in
contact mode, in air at room temperature. The open source software Fiji25 was
used to measure both pattern height and pattern pitch with the 2D Fast Fourier
Transform function.
Digital Holographic Microscopy (DHM)
It has mounted a DHM set-up, which digital holograms were recorded in the off-
axis configuration using a CCD camera to characterize the SRG on the Azo-
polymers (Figure 2). A 594 nm He-Ne was used to just analyze the sample
avoiding the isomerization effects due to the light. The set-up consist in two arms,
which a beam spliter (BS1) divides the original beam in two parts. The first one
is the object arm (OA) which function is similar to a conventional microscope.
Another arm is installed as reference arm (RA). The last one allows to stamp the
hologram information on the CCD camera when both beams impinge the CCD
with different angle. Finally, the SRG data is retrieved numerically by computer
analysis. The phase distribution at the surface of the object is obtained from the
same hologram by calculating the argument of the reconstructed wavefront. The
quantitative nature of the obtained phase distribution gives access to the
topography of the object.
Fig. 4.2: Digital Holographic Microscopy apparatus.
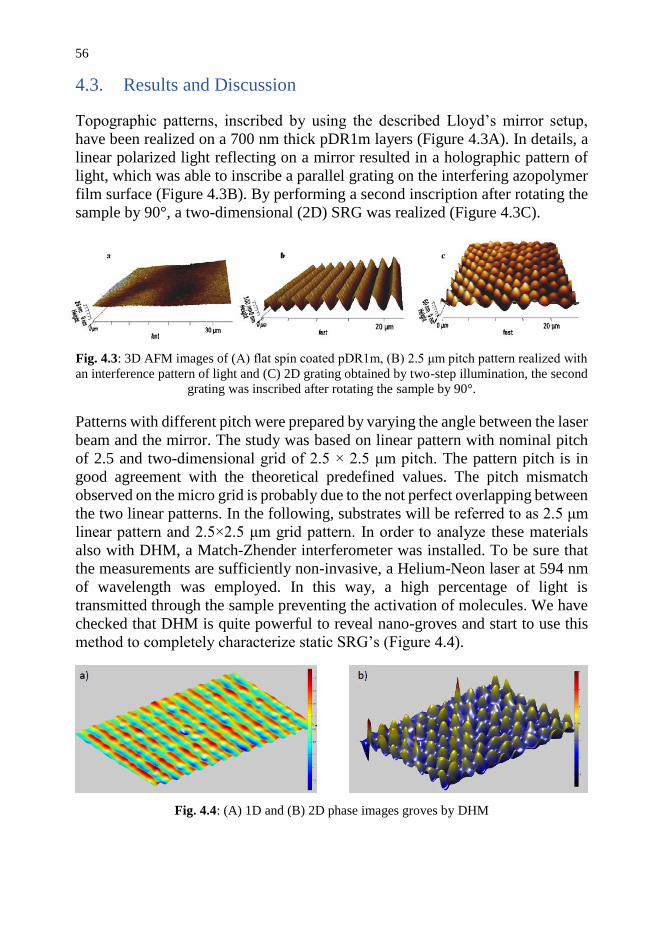
56
4.3. Results and Discussion
Topographic patterns, inscribed by using the described Lloyd’s mirror setup,
have been realized on a 700 nm thick pDR1m layers (Figure 4.3A). In details, a
linear polarized light reflecting on a mirror resulted in a holographic pattern of
light, which was able to inscribe a parallel grating on the interfering azopolymer
film surface (Figure 4.3B). By performing a second inscription after rotating the
sample by 90°, a two-dimensional (2D) SRG was realized (Figure 4.3C).
Fig. 4.3: 3D AFM images of (A) flat spin coated pDR1m, (B) 2.5 μm pitch pattern realized with
an interference pattern of light and (C) 2D grating obtained by two-step illumination, the second
grating was inscribed after rotating the sample by 90°.
Patterns with different pitch were prepared by varying the angle between the laser
beam and the mirror. The study was based on linear pattern with nominal pitch
of 2.5 and two-dimensional grid of 2.5 × 2.5 μm pitch. The pattern pitch is in
good agreement with the theoretical predefined values. The pitch mismatch
observed on the micro grid is probably due to the not perfect overlapping between
the two linear patterns. In the following, substrates will be referred to as 2.5 μm
linear pattern and 2.5×2.5 μm grid pattern. In order to analyze these materials
also with DHM, a Match-Zhender interferometer was installed. To be sure that
the measurements are sufficiently non-invasive, a Helium-Neon laser at 594 nm
of wavelength was employed. In this way, a high percentage of light is
transmitted through the sample preventing the activation of molecules. We have
checked that DHM is quite powerful to reveal nano-groves and start to use this
method to completely characterize static SRG’s (Figure 4.4).
Fig. 4.4: (A) 1D and (B) 2D phase images groves by DHM

57
Such substrates were originally sized to use on the Tissue Engineer field.
Preliminary experiments have been performed to study the biocompatibility of
the realized SRG. Owing to the photo-reversibility of the azopolymer surface
structures, a study of NIH-3T3 cell response to the dynamic topographic changes
of SRGs also can be performed.
4.4. Conclusion and Future Trends
In this chapter we presented a DHM study to characterize the azo-polymers
instead AFM. Two patterned substrates of 1D and 2D were realized with a
lithographic interferometric method using the Lloyd mirror configuration.
Subsequently, we have characterized and compared the samples with both
techniques mentioned above. Therefore, the approach we proposed has the
potential to be employed for understanding the dynamics of SRG formation and
we believe it will has also future impact in the analysis of interaction between
biomaterials and cell behavior study.
58
References
[1] C. Rianna, A. Calabuig, M. Ventre, S. Cavalli, V. Pagliarulo, S. Grilli, P.
Ferraro, and P. A. Netti, “Reversible holographic patterns on azopolymers
for guiding cell adhesion and orientation.,” ACS Appl. Mater. Interfaces,
Apr. 2015.
[2] P. Rochon, E. Batalla, and a. Natansohn, “Optically induced surface
gratings on azoaromatic polymer films,” Appl. Phys. Lett., vol. 66, no. 2,
pp. 136–138, 1995.
[3] N. K. Viswanathan, D. Y. Kim, S. Bian, J. Williams, W. Liu, L. Li, L.
Samuelson, J. Kumar, and S. K. Tripathy, “Surface relief structures on azo
polymer films,” J. Mater. Chem., vol. 9, no. 9, pp. 1941–1955, 1999.
[4] A. Priimagi and A. Shevchenko, “Azopolymer-based micro- and
nanopatterning for photonic applications,” J. Polym. Sci. Part B Polym.
Phys., vol. 52, no. 3, pp. 163–182, Feb. 2014.
[5] J. Kumar, L. Li, X. L. Jiang, D.-Y. Kim, T. S. Lee, and S. Tripathy,
“Gradient force: The mechanism for surface relief grating formation in
azobenzene functionalized polymers,” Appl. Phys. Lett., vol. 72, no. 17, p.
2096, 1998.
[6] P. Lefin and C. Fiorini, “Anisotropy of the photoinduced translation
diffusion of azo-dyes,” vol. 9, no. January, pp. 323–328, 1998.
[7] K. G. Yager and C. J. Barrett, “All-optical patterning of azo polymer
films,” Curr. Opin. Solid State Mater. Sci., vol. 5, no. 6, pp. 487–494,
2001.
[8] O. Henneberg, T. Geue, M. Saphiannikova, U. Pietsch, P. Rochon, and a.
Natansohn, “Formation and dynamics of polymer surface relief gratings,”
Appl. Surf. Sci., vol. 182, no. 3–4, pp. 272–279, Oct. 2001.
[9] T. Todorov, L. Nikolova, and N. Tomova, “Polarization holography. 2:
Polarization holographic gratings in photoanisotropic materials with and
without intrinsic birefringence.,” Appl. Opt., vol. 23, no. 24, p. 4588, 1984.
[10] N. S. Yadavalli and S. Santer, “In-situ atomic force microscopy study of
the mechanism of surface relief grating formation in photosensitive
polymer films,” J. Appl. Phys., vol. 113, no. 22, p. 224304, 2013.

59
[11] E. Cuche, F. Bevilacqua, and C. Depeursinge, “Digital holography for
quantitative phase-contrast imaging,” Opt. Lett., vol. 24, no. 5, pp. 291–
293, 1999.
[12] Y.-D. Su, K.-C. Chiu, N.-S. Chang, H.-L. Wu, and S.-J. Chen, “Study of
cell-biosubstrate contacts via surface plasmon polariton phase
microscopy.,” Opt. Express, vol. 18, no. 19, pp. 20125–35, 2010.
[13] K. Alm, Z. El-schich, M. F. Miniotis, A. G. Wingren, and B. Janicke,
“Cells and Holograms – Holograms and Digital Holographic Microscopy
as a Tool to Study the Morphology of Living Cells.”
[14] K. Alm, H. Cirenajwis, L. Gisselsson, A. G. Wingren, B. Janicke, A.
Molder, S. Oredsson, and J. Persson, “Digital Holography and Cell
Studies,” no. 11, pp. 237–252, 2011.
[15] M. Bielaszewska, A. Bauwens, L. Greune, B. Kemper, U. Dobrindt, J. M.
Geelen, K. S. Kim, M. A. Schmidt, and H. Karch, “Vacuolisation of
human microvascular endothelial cells by enterohaemorrhagic Escherichia
coli.,” Thromb. Haemost., vol. 102, no. 6, pp. 1080–92, Dec. 2009.
[16] V. Bianco, M. Paturzo, A. Finizio, A. Calabuig, B. Javidi, and P. Ferraro,
“Clear Microfluidics Imaging through flowing blood by Digital
Holography,” IEEE J. Sel. Top. Quantum Electron., no. c, pp. 1–1, 2013.
[17] W. M. Ash and M. K. Kim, “Digital holography of total internal
reflection.,” Opt. Express, vol. 16, no. 13, pp. 9811–20, Jun. 2008.
[18] A. Calabuig, M. Matrecano, M. Paturzo, and P. Ferraro, “Common-path
configuration in total internal reflection digital holography microscopy.,”
Opt. Lett., vol. 39, no. 8, pp. 2471–4, 2014.
[19] A. Calabuig, V. Micó, J. Garcia, Z. Zalevsky, and C. Ferreira, “Single-
exposure super-resolved interferometric microscopy by red-green-blue
multiplexing.,” Opt. Lett., vol. 36, no. 6, pp. 885–887, 2011.
[20] A. Calabuig, J. Garcia, C. Ferreira, Z. Zalevsky, and V. Micó, “Resolution
improvement by single-exposure superresolved interferometric
microscopy with a monochrome sensor.,” J. Opt. Soc. Am. A, vol. 28, no.
11, pp. 2346–58, 2011.

60

Chapter 5. Monitoring Cell Behavior under Blue Light
Exposure by DHM
Abstract
The exposure to visible light has been shown to exert various biological effects,
such as erythema and retinal degeneration. However, the phototoxicity
mechanisms in living cells are still not well understood. Here we report a study
on the temporal evolution of cell morphology and volume during blue light
exposure. Blue laser irradiation is switched during the operation of a digital
holography (DH) microscope between what we call here “safe” and “injurious”
exposure (SE & IE). The results reveal a behaviour that is typical of necrotic
cells, with early swelling and successive leakage of the intracellular liquids when
the laser is set in the “injurious” operation. In the phototoxicity investigation
reported here the light dose modulation is performed through the very
same laser light source adopted for monitoring the cell’s behaviour by digital
holographic microscope. We believe the approach may open the route to a deep
investigation of light-cell interactions, with information about death pathways
and threshold conditions between healthy and damaged cells when subjected to
light-exposure.

62
5.1. Introduction
It is well known that visible wavelengths, ranging from 400 nm to 700 nm, exert
various biological effects, including erythema [1], pigmentation [2], [3] and
generation of oxygen species [4]. However, nowadays, the interaction of visible
light with living cells is still of great interest for a wide variety of purposes [5]–
[8]. Among a plethora of cell features used for investigating cell damages, the
morphology and volume are gaining great significance. In fact, the mechanisms
of cell volume regulation (CVR) are of fundamental importance in live and
healthy cells. They compensate for those minor volume variations that occur
physiologically, by maintaining an appropriate balance of ions across the cell
membrane. Any alteration of this CVR is associated to disease states and cell
death pathways, as well described in a wide variety of reviews and papers
available in literature [9], [10]. A common feature to dead cells is the loss of cell
membrane integrity, with the subsequent release of the intracellular content. In
fact, the most used assays, able to differentiate between viable and non-viable
cells, are based on the assessment of the membrane integrity through time
consuming process steps that make use of inclusion and/or exclusion dyes such
as trypan blue or propidium iodide [11], [12]. However, such cell viability assays
assess only the late stage of the cell death process, without any information about
the cell death pathway and about the stimulus that induced the cell death. In fact,
it is noteworthy that the early stage of the cell death is accompanied by non-
negligible and peculiar changes in volume and morphology that define the
different cell death pathways [13]. In particular, the volume increase associated
to initial cell swelling occurring during necrosis is a key morphological
characteristic that discriminates this physiological cell death process from
apoptosis that, conversely, in characterized by initial loss of cell volume
associated to cell shrinkage [14], [15]. Indeed, when cells undergo necrosis,
typically the cytoplasmatic granularity increases, the plasma membrane loses
integrity and exhibits balloon-like structures, and the cell swells while the nuclei
remain intact. In contrast, apoptotic cells exhibit typically blebbing of plasma
membrane, formation of apoptotic body, chromatin condensation with
margination of chromatin to the nuclear membrane, and nuclear fragmentation.
Necrosis is considered as a form of cell injury that results in the premature death
of cells in living tissue, whereas apoptosis is an orchestrated process of
programmed cell death, encoded genetically in vertebrates, that plays a central
role in development and homeostasis. Nowadays a great interest exists in finding
methods and procedures able to measure accurately the cell volume changes over
time in the early stage of cell death, in order to discriminate, as much precisely
as possible, between diverse cell death processes and associated causes. In fact,
for example, it is important to distinguish necrosis from other forms of cell death,

63
particularly because it is often associated with non-physiological loss of cells in
human pathologies [16], [17]. Various techniques have been presented in
literature for studying cell volume changes. The conventional optical
microscopy, under bright field or differential interferometry contrast, provides a
quite facile and rapid view of the early stage death in cell culture dishes but only
qualitatively, without any quantitative information about volume changes. The
electron microscopy [18], [19] provides high spatial resolution and is usually
considered the ‘gold standard’ in cell death research. However, it is very
expensive, time consuming and requires cell fixing, thus suspending any
biological process. The electronic cell sizing is useful for precise measurements
but is a population-based technique [20]. Scanning-based techniques allow for
live-cell imaging on tissue culture plates with relatively high spatial resolutions,
but these measurements are time-consuming, thus making it difficult to observe
changes in morphology with a time resolution better than minutes [21]. Probably
the most widely used methods are those based on flow cytometry [22]–[26]. They
are quite convenient and give information about cell size through relatively easy
to accomplish measurements based on light scattering phenomena. However,
these techniques require suspended cells and therefore they assume a spherical
shape for each cell, thus giving an output signal that is related only to the cell
size, without providing a direct measurement of the volume. Additionally,
individual cells cannot be monitored over time.
In recent years, the digital holography (DH) in microscopy configuration has
been proved to be suitable for bio physics experiments to evaluate quantitatively
forces, positions and biovolumes [27]–[33]. Basically, DH measures directly the
phase changes undergone by a light wave passing through or reflecting from
objects [34]–[37]. Such measured phases can be converted to a volume’s change
of the cell through a variety of phase unwrapping methods. Therefore DH allows
one to measure the temporal evolution of the volumes of both individual and
many cells, without scanning procedures. The time resolutions are limited,
basically, only by the frame rate of the camera used for recording the holograms
[38], [39]. Compared to the above-mentioned techniques, DH allows one to
detect accurately the volume changes occurring in the early stage of cell death,
thanks to its excellent time resolution.
Different works have been published in the last few years where DH is used for
investigating the variations of cell morphology under in-vitro invasive
stimulations. Pavillon et al. used DH for monitoring the transient swelling
phenomena occurring in neuronal cells when stimulated by glutamate
applications, but without leading to death [40]. A couple of works used DH for
measuring the temporal evolution of cell volume changes during cell death

64
induced by chemical treatments: neuronal cells stressed by glutamate overdoses
[41] and human epithelial cells stimulated by staurosporine [42]. More recently
Wingren’s group proposed DH for monitoring morphologically cell cycle arrest
and death under specific chemical treatments, but without real time information
about the cell volume changes during death [43], [44]. Balvan et al. presented a
combination of DH and fluorescence microscopy for distinguishing apoptotic and
necrotic cancer cells through plumbagin treatments, but, again, without
presenting temporal evolution of cell volumes [45]. In this framework, to the best
of our knowledge, cell volume changes have been investigated only in case of
chemical treatments. However, it is important to note that even light exposure at
wavelengths towards the blue range is injurious for live cells, leading to cell death
[46].
Here we propose an innovative DH configuration able to monitor the cell volume
variations induced by blue light exposure at different cell adhesion stages, thus
giving quantitative information about the cell death pathways occurring under
this kind of injurious stimulation. Compared to the above mentioned DH
techniques, here for the first time we develop a DH set-up that uses a blue laser
source that simultaneously serves as reading and erasing tool, by switching the
DH operation between what we call here “safe” and “injurious” exposure (SE &
IE). In other words, the same laser source is used for recording the holograms,
by using exposure parameters that preserve the cell viability, and for
overexposing the cells. Compared to the above-mentioned DH methods, we can
improve the longitudinal resolution thanks to the shorter wavelength of the blue
source. The resulting highly resolved volume data reveal the morphology
evolution typical of necrotic cells, with swelling and subsequent membrane
rupture. Moreover, the versatile nature of the laser exposure, temporally as well
as spatially, allows one to localize the death stimulation, contrary to all of the
above-mentioned techniques where the entire cell population is induced to death
through chemical treatments. This method allows one to extract very important
information on the interaction between laser light and live adherent cells,
establishing the threshold conditions between healthy and damaged cells. This
study opens the route for further investigations on light induced mechanisms in
living specimen and, thanks to the possibility of structuring the light pattern, even
at the interface between live and dead samples.
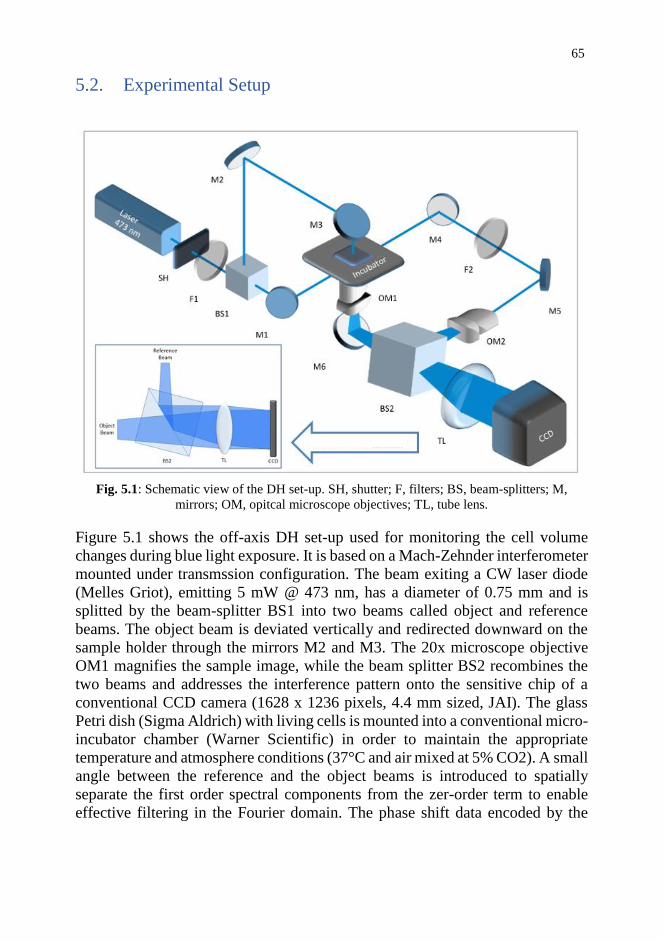
65
5.2. Experimental Setup
Fig. 5.1: Schematic view of the DH set-up. SH, shutter; F, filters; BS, beam-splitters; M,
mirrors; OM, opitcal microscope objectives; TL, tube lens.
Figure 5.1 shows the off-axis DH set-up used for monitoring the cell volume
changes during blue light exposure. It is based on a Mach-Zehnder interferometer
mounted under transmssion configuration. The beam exiting a CW laser diode
(Melles Griot), emitting 5 mW @ 473 nm, has a diameter of 0.75 mm and is
splitted by the beam-splitter BS1 into two beams called object and reference
beams. The object beam is deviated vertically and redirected downward on the
sample holder through the mirrors M2 and M3. The 20x microscope objective
OM1 magnifies the sample image, while the beam splitter BS2 recombines the
two beams and addresses the interference pattern onto the sensitive chip of a
conventional CCD camera (1628 x 1236 pixels, 4.4 mm sized, JAI). The glass
Petri dish (Sigma Aldrich) with living cells is mounted into a conventional micro-
incubator chamber (Warner Scientific) in order to maintain the appropriate
temperature and atmosphere conditions (37°C and air mixed at 5% CO2). A small
angle between the reference and the object beams is introduced to spatially
separate the first order spectral components from the zer-order term to enable
effective filtering in the Fourier domain. The phase shift data encoded by the
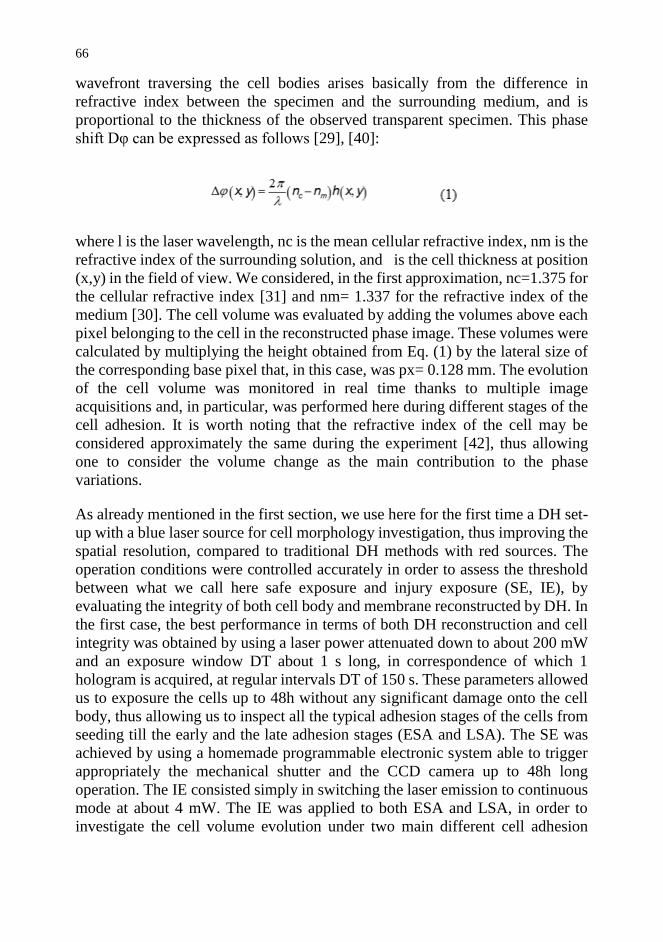
66
wavefront traversing the cell bodies arises basically from the difference in
refractive index between the specimen and the surrounding medium, and is
proportional to the thickness of the observed transparent specimen. This phase
shift Dφ can be expressed as follows [29], [40]:
where l is the laser wavelength, nc is the mean cellular refractive index, nm is the
refractive index of the surrounding solution, and is the cell thickness at position
(x,y) in the field of view. We considered, in the first approximation, nc=1.375 for
the cellular refractive index [31] and nm= 1.337 for the refractive index of the
medium [30]. The cell volume was evaluated by adding the volumes above each
pixel belonging to the cell in the reconstructed phase image. These volumes were
calculated by multiplying the height obtained from Eq. (1) by the lateral size of
the corresponding base pixel that, in this case, was px= 0.128 mm. The evolution
of the cell volume was monitored in real time thanks to multiple image
acquisitions and, in particular, was performed here during different stages of the
cell adhesion. It is worth noting that the refractive index of the cell may be
considered approximately the same during the experiment [42], thus allowing
one to consider the volume change as the main contribution to the phase
variations.
As already mentioned in the first section, we use here for the first time a DH set-
up with a blue laser source for cell morphology investigation, thus improving the
spatial resolution, compared to traditional DH methods with red sources. The
operation conditions were controlled accurately in order to assess the threshold
between what we call here safe exposure and injury exposure (SE, IE), by
evaluating the integrity of both cell body and membrane reconstructed by DH. In
the first case, the best performance in terms of both DH reconstruction and cell
integrity was obtained by using a laser power attenuated down to about 200 mW
and an exposure window DT about 1 s long, in correspondence of which 1
hologram is acquired, at regular intervals DT of 150 s. These parameters allowed
us to exposure the cells up to 48h without any significant damage onto the cell
body, thus allowing us to inspect all the typical adhesion stages of the cells from
seeding till the early and the late adhesion stages (ESA and LSA). The SE was
achieved by using a homemade programmable electronic system able to trigger
appropriately the mechanical shutter and the CCD camera up to 48h long
operation. The IE consisted simply in switching the laser emission to continuous
mode at about 4 mW. The IE was applied to both ESA and LSA, in order to
investigate the cell volume evolution under two main different cell adhesion

67
conditions. For these experiments NIH-3T3 fibroblast cells were grown in
Dulbecco’s Modified Eagle Medium supplemented with 10% Fetal Bovine
Serum (both Life Technologies, Carlsbad, CA, USA), 2 mM L-glutamine
(Sigma, St. Louis, MO), and 100 U/ml penicillin 100 μg/ml streptomycin at 37°C
in 5% CO2. The cells were trypsinized and seeded in a 35 mm glass Petri dishes
(World Precision Instruments) at a density of 10104 cells per plate and monitored
by the DH setup over 24h in a complete growth medium and under temperature
and humidity controlled environment. A conventional CO2/pH controller
(Harvard Apparatus) insured the right conditions for the cell culture medium.
Fig. 5.2: Typical phase map images of live cells under SE at different time intervals. The scale bar is 20 m. The colour bar corresponds to m units.
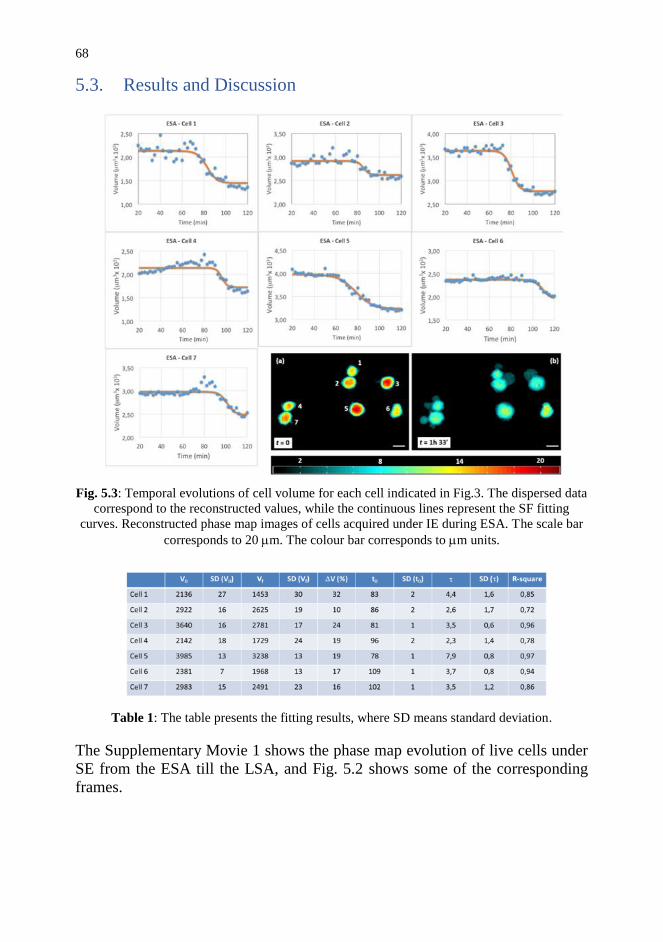
68
5.3. Results and Discussion
Fig. 5.3: Temporal evolutions of cell volume for each cell indicated in Fig.3. The dispersed data
correspond to the reconstructed values, while the continuous lines represent the SF fitting
curves. Reconstructed phase map images of cells acquired under IE during ESA. The scale bar
corresponds to 20 m. The colour bar corresponds to m units.
Table 1: The table presents the fitting results, where SD means standard deviation.
The Supplementary Movie 1 shows the phase map evolution of live cells under
SE from the ESA till the LSA, and Fig. 5.2 shows some of the corresponding
frames.

69
The cells appear clearly to spread completely onto the glass surface of a
conventional Petri dish in a couple of hours, without any significant anomaly,
thus demonstrating the non-invasive nature of the SE modality. Successively,
another experiment was performed for monitoring the cell volume changes
during IE in correspondence of the ESA. The laser source was switched on CW
just a few minutes after seeding the cells into the Petri dish. The image acquisition
started around 10 minutes after seeding and continued for about 9 hours with an
acquisition rate of 0.4 frames/min, namely one frame every 150 s. The
Supplementary Movie 2 shows the typical phase map evolution of cells during
IE, and Fig.5.3 shows two typical frames.
The phase images show clearly how the cells try to adhere to the substrate and,
before spreading, exhibit a swelling effect with the formation of “balloon-like”
and blebs structures, typical of necrotic cells. Successively the cell membrane
rupture occurs and the intracellular fluid flows out the cell body, with a
consequent volume decrease. The volume was evaluated for each cell in Fig.5.3
and the corresponding temporal evolutions.
Fig. 5.4: (a,b,c,d) Temporal evolution of the reconstructed phase map under 3D representation
in case of a single cell during ESA when subjected to IE. The scale bar is 6 m. The colour bar
corresponds to m units. (Plot) Temporal evolution of cell volume and area during ESA when
subjected to IE.
The experimental data of the cell volumes are represented by the dispersed dots
and were fitted with the following Sigmoid function (SF):
where V0 and Vf are the initial and final volume of the cell reconstructed through
the corresponding phase maps, t0 is the mean temporal point of the SF, namely
the centre of the SF where the volume reaches the maximum value, and t is the
time constant. The volume data show clearly the volume increase of the cell
before membrane rupture, typically occurring in necrosis. The variability of cell
volume variation was due to the slight different adhesion stage in each cell. The
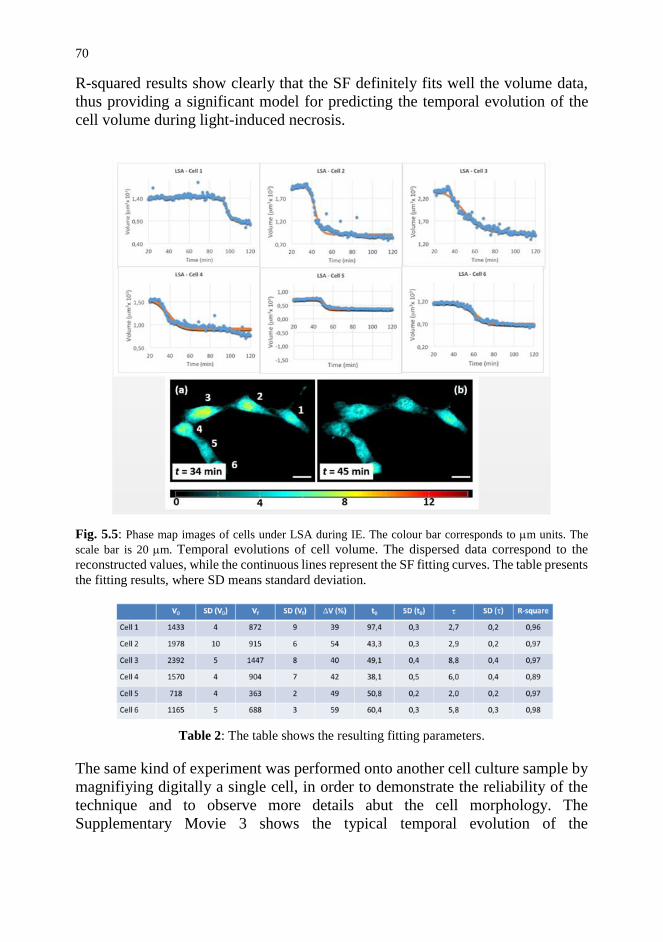
70
R-squared results show clearly that the SF definitely fits well the volume data,
thus providing a significant model for predicting the temporal evolution of the
cell volume during light-induced necrosis.
Fig. 5.5: Phase map images of cells under LSA during IE. The colour bar corresponds to m units. The
scale bar is 20 m. Temporal evolutions of cell volume. The dispersed data correspond to the
reconstructed values, while the continuous lines represent the SF fitting curves. The table presents
the fitting results, where SD means standard deviation.
Table 2: The table shows the resulting fitting parameters.
The same kind of experiment was performed onto another cell culture sample by
magnifiying digitally a single cell, in order to demonstrate the reliability of the
technique and to observe more details abut the cell morphology. The
Supplementary Movie 3 shows the typical temporal evolution of the

71
reconstructed phase maps under 3D representation of a single cell during blue
laser exposure on ESA. Figure 5.4 shows four frames corresponding to different
time intervals. The morphological changes experienced by the cell are clearly
visible with high spatial resolution during the entire cell death process.
The first frames of the movie correspond to the state in which the cell is alive just
after seeding and observed under SE. The cell morphology appears stable and un-
perturbated. Conversely, the cell motion and vibrations appear to rise
significantly when switching to IE, corresponding to the early stages of the
necrosis, when the cell tries to regulate its volume desperately till death. In this
case we evaluated the temporal evolution of both the cell volume and the cell
area, and Fig.5.5 shows the corresponding results.
The cell volume initially oscillates according to the regulatory mechanisms that
compansate the physiogocial volume variations in order to maintain an
appropriate balance of ions across their cell membrane. Then, the volume data
exhibit the upward slope corresponding to the swelling just before the membrane
rupture, while the area data arise correspondingly. The intracellular liquid flowed
out of the cell, the volume dropped down rapidly by about 32%, following the SF
behaviour.
Fig. 5.6: Large microscopic view of the cell culture dish investigated. The rounded area
corresponds to the continuous blue light exposure during necrosis.
The blue light exposure was investigated also during the LSA by switching the
DH modality from SE to IE after cell spreading onto the Petri dish. The
Supplementary Movies 4,5 show the temporal evolution of the reconstructed
phase maps under 2D and 3D representation and Fig.5.5 presents a couple of the
corresponding frames.

72
The phase images clearly show how the spread cells release intracellular liquids
with a consequent decrease of the volume. Figure 5.5 shows the temporal
evolution of the resulting volume data fitted again to a SF.
The R-square values are always above 0.9, thus demonstrating the reliability of
the SF model. Figure 5.6 shows the microscope large view image of the cell
culture sample investigated in Fig.5.5, just after light-induced necrosis.
The highlighted round region corresponded to the surface exposed to the blue
laser during IE. The most of the inner cells exhibited the round shape typical of
dead cells, while the outer ones appeared clearly adhered to the substrate, thus
confirming the toxicity of the continuous exposure to the blue laser light.
5.4. Conclusion and Future Trends
We performed a novel quantitative study for investigating real time the cell
volume changes during blue-light exposure under both early and late adhesion of
fibroblast cells. We adopted a holographic microscopy technique for obtaining
quantitative data. Furthermore, we added an innovative approach if compared to
the standard DH techniques as here for the first time we develop a DH set-up that
uses a blue laser source that simultaneously serves as reading and tool for
inducing phototoxicity, by switching the DH operation between what we call here
“safe” and “injurious” exposure (SE & IE). The results show that the cell
morphology and volume evolve with characteristics that are typical of necrotic
cells, with swelling, balloon-like structures and successive membrane rupture and
leakage of intracellular liquids. This technique allows one to extract information
about the interaction of blue light with live adherent cells, establishing the
threshold conditions between healthy and damaged cells. This study could open
the route to further investigations on light induced mechanisms in living
specimen and, thanks to the possibility of structuring the light pattern, even at the
interface between live and dead samples.

73
References
[1] P. B. Rottier and J. C. Van Der Leun, “Hyperaemia of the deeper cutaneous
vessels after irradiation of human skin with large doses of ultra-violet and
visible light.,” Br. J. Dermatol., vol. 72, pp. 256–60, 1960.
[2] N. Kollias and A. Baqer, “An experimental study of the changes in
pigmentation in human skin in vivo with visible and near infrared light,”
Photochem. Photobiol., vol. 39, pp. 651–659, 1984.
[3] S. B. Porges, K. H. Kaidbey, and G. L. Grove, “Quantification of visible
light-induced melanogenesis in human skin,” Photodermatology, vol. 5,
pp. 197–200, 1988.
[4] M. Mittelbrunn, R. Tejedor, H. de la Fuente, M. A. García-López, A. Ursa,
P. F. Peñas, A. García-Díez, J. L. Alonso-Lebrero, J. P. Pivel, S. González,
R. Gonzalez-Amaro, and F. Sánchez-Madrid, “Solar-simulated ultraviolet
radiation induces abnormal maturation and defective chemotaxis of
dendritic cells.,” J. Invest. Dermatol., vol. 125, no. 2, pp. 334–42, 2005.
[5] G. Monfrecola, S. Lembo, M. Cantelli, E. Ciaglia, L. Scarpato, G.
Fabbrocini, and A. Balato, “The effect of visible blue light on the
differentiation of dendritic cells in vitro.,” Biochimie, vol. 101, pp. 252–5,
Jun. 2014.
[6] S. Gottschalk, H. Estrada, O. Degtyaruk, J. Rebling, O. Klymenko, M.
Rosemann, and D. Razansky, “Short and long-term phototoxicity in cells
expressing genetic reporters under nanosecond laser exposure.,”
Biomaterials, vol. 69, pp. 38–44, Nov. 2015.
[7] N. N. Osborne, C. Núñez-Álvarez, and S. Del Olmo-Aguado, “The effect
of visual blue light on mitochondrial function associated with retinal
ganglions cells.,” Exp. Eye Res., vol. 128, pp. 8–14, Nov. 2014.
[8] I. Jaadane, P. Boulenguez, S. Chahory, S. Carré, M. Savoldelli, L. Jonet,
F. Behar-Cohen, C. Martinsons, and A. Torriglia, “Retinal damage
induced by commercial light emitting diodes (LEDs).,” Free Radic. Biol.
Med., vol. 84, pp. 373–84, Jul. 2015.
[9] P. Weerasinghe and L. M. Buja, “Oncosis: an important non-apoptotic
mode of cell death.,” Exp. Mol. Pathol., vol. 93, no. 3, pp. 302–308, Dec.
2012.

74
[10] L. F. Barros, T. Kanaseki, R. Sabirov, S. Morishima, J. Castro, C. X.
Bittner, E. Maeno, Y. Ando-Akatsuka, and Y. Okada, “Apoptotic and
necrotic blebs in epithelial cells display similar neck diameters but
different kinase dependency.,” Cell Death Differ., vol. 10, no. 6, pp. 687–
697, 2003.
[11] H. Lecoeur, “Nuclear apoptosis detection by flow cytometry: influence of
endogenous endonucleases.,” Exp. Cell Res., vol. 277, no. 1, pp. 1–14,
2002.
[12] L. Zamai, E. Falcieri, G. Marhefka, and M. Vitale, “Supravital exposure
to propidium iodide identifies apoptotic cells in the absence of
nucleosomal DNA fragmentation.,” Cytometry, vol. 23, no. 4, pp. 303–11,
1996.
[13] T. Vanden Berghe, S. Grootjans, V. Goossens, Y. Dondelinger, D. V.
Krysko, N. Takahashi, and P. Vandenabeele, “Determination of apoptotic
and necrotic cell death in vitro and in vivo,” Methods, vol. 61, no. 2, pp.
117–129, Jun. 2013.
[14] L. F. Barros, T. Hermosilla, and J. Castro, “Necrotic volume increase and
the early physiology of necrosis,” Comp. Biochem. Physiol. - A Mol.
Integr. Physiol., vol. 130, no. 3, pp. 401–409, Oct. 2001.
[15] G. Majno and I. Joris, “Apoptosis, oncosis, and necrosis. An overview of
cell death.,” Am. J. Pathol., vol. 146, no. 1, pp. 3–15, 1995.
[16] W. Zong and C. B. Thompson, “Necrotic death as a cell fate,” Genes Dev.,
vol. 20, pp. 1–15, 2006.
[17] N. Festjens, T. Vanden Berghe, and P. Vandenabeele, “Necrosis, a well-
orchestrated form of cell demise: signalling cascades, important mediators
and concomitant immune response.,” Biochim. Biophys. Acta, vol. 1757,
no. 9–10, pp. 1371–87, 2006.
[18] P. N. Unwin and P. D. Ennis, “Two configurations of a channel-forming
membrane protein,” Nature, vol. 307, no. 16, pp. 609–613, 1984.
[19] P. N. Unwin and G. Zampighi, “Structure of the junction between
communicating cells.,” Nature, vol. 283, no. 5747, pp. 545–9, 1980.
[20] E. Maeno, Y. Ishizaki, T. Kanaseki, A. Hazama, and Y. Okada,
75
“Normotonic cell shrinkage because of disordered volume regulation is an
early prerequisite to apoptosis.,” Proc. Natl. Acad. Sci. U. S. A., vol. 97,
no. 17, pp. 9487–9492, 2000.
[21] A. Tanaka, R. Tanaka, N. Kasai, S. Tsukada, T. Okajima, and K.
Sumitomo, “Time-lapse imaging of morphological changes in a single
neuron during the early stages of apoptosis using scanning ion
conductance microscopy,” J. Struct. Biol., vol. 191, no. 1, pp. 32–38, Jul.
2015.
[22] K. J. Chalut, J. H. Ostrander, M. G. Giacomelli, and A. Wax, “Light
Scattering Measurements of Subcellular Structure Provide Noninvasive
Early Detection of Chemotherapy-Induced Apoptosis,” Cancer Res., vol.
69, no. 3, pp. 1199–1204, Feb. 2009.
[23] M. M. Comptont, J. S. Haskill, and J. A. Cidlowski, “Analysis of
Glucocorticoid Actions on Rat Thymocyte Deoxyribonucleic Acid by
Fluorescence-Activated Flow,” Endocrinology, vol. 122, no. 5, pp. 2158–
2164, 1988.
[24] a M. Petrunkina, E. Jebe, and E. Töpfer-Petersen, “Regulatory and
necrotic volume increase in boar spermatozoa.,” J. Cell. Physiol., vol. 204,
no. 2, pp. 508–21, 2005.
[25] T. Nabekura, S. Morishima, T. L. Cover, S. I. Mori, H. Kannan, S.
Komune, and Y. Okada, “Recovery from lactacidosis-induced glial cell
swelling with the aid of exogenous anion channels,” Glia, vol. 41, no.
August 2002, pp. 247–259, Feb. 2003.
[26] X. Yang, Y. Feng, Y. Liu, N. Zhang, W. Lin, Y. Sa, and X.-H. Hu, “A
quantitative method for measurement of HL-60 cell apoptosis based on
diffraction imaging flow cytometry technique,” Biomed. Opt. Express,
vol. 5, no. 7, p. 2172, Jun. 2014.
[27] B. Javidi, I. Moon, S. Yeom, and E. Carapezza, “Three-dimensional
imaging and recognition of microorganism using single-exposure on-line
(SEOL) digital holography.,” Opt. Express, vol. 13, no. 12, pp. 4492–
4506, 2005.
[28] A. El Mallahi, C. Minetti, and F. Dubois, “Automated three-dimensional
detection and classification of living organisms using digital holographic
microscopy with partial spatial coherent source: application to the

76
monitoring of drinking water resources.,” Appl. Opt., vol. 52, no. 1, pp.
A68–80, 2013.
[29] B. Rappaz, P. Marquet, E. Cuche, Y. Emery, C. Depeursinge, and P. J.
Magistretti, “Measurement of the integral refractive index and dynamic
cell morphometry of living cells with digital holographic microscopy,”
Opt. Express, vol. 13, no. 23, pp. 9361–9373, 2005.
[30] B. Kemper, S. Kosmeier, P. Langehanenberg, G. von Bally, I. Bredebusch,
W. Domschke, and J. Schnekenburger, “Integral refractive index
determination of living suspension cells by multifocus digital holographic
phase contrast microscopy.,” J. Biomed. Opt., vol. 12, no. 5, p. 054009,
2014.
[31] M. Kemmler, M. Fratz, D. Giel, N. Saum, A. Brandenburg, and C.
Hoffmann, “Noninvasive time-dependent cytometry monitoring by digital
holography.,” J. Biomed. Opt., vol. 12, no. 6, p. 064002, 2014.
[32] P. Marquet, B. Rappaz, P. J. Magistretti, E. Cuche, Y. Emery, T. Colomb,
and C. Depeursinge, “Digital holographic microscopy: a noninvasive
contrast imaging technique allowing quantitative visualization of living
cells with subwavelength axial accuracy,” Opt. Lett., vol. 30, no. 5, pp.
468–470, 2005.
[33] G. Di Caprio, M. A. Ferrara, L. Miccio, F. Merola, P. Memmolo, P.
Ferraro, and G. Coppola, “Holographic imaging of unlabelled sperm cells
for semen analysis: a review,” J. Biophotonics, vol. 789, no. 10, pp. 779–
789, 2015.
[34] S. Grilli, P. Ferraro, S. De Nicola, a Finizio, G. Pierattini, and R. Meucci,
“Whole optical wavefields reconstruction by digital holography.,” Opt.
Express, vol. 9, no. 6, pp. 294–302, 2001.
[35] A. Calabuig, V. Micó, J. Garcia, Z. Zalevsky, and C. Ferreira, “Single-
exposure super-resolved interferometric microscopy by red-green-blue
multiplexing.,” Opt. Lett., vol. 36, no. 6, pp. 885–887, 2011.
[36] A. Calabuig, M. Matrecano, M. Paturzo, and P. Ferraro, “Common-path
configuration in total internal reflection digital holography microscopy.,”
Opt. Lett., vol. 39, no. 8, pp. 2471–4, 2014.
[37] P. Ferraro, A. Wax, and Z. Zalevsky, Coherent Light Microscopy. 2010.

77
[38] C. Mann, L. Yu, C.-M. Lo, and M. Kim, “High-resolution quantitative
phase-contrast microscopy by digital holography.,” Opt. Express, vol. 13,
no. 22, pp. 8693–8698, Oct. 2005.
[39] F. Verpillat, F. Joud, P. Desbiolles, and M. Gross, “Dark-field digital
holographic microscopy for 3D-tracking of gold nanoparticles,” Opt.
Express, vol. 19, no. 27, p. 26044, 2011.
[40] N. Pavillon, J. Kühn, C. Moratal, P. Jourdain, C. Depeursinge, P. J.
Magistretti, and P. Marquet, “Early cell death detection with digital
holographic microscopy.,” PLoS One, vol. 7, no. 1, p. e30912, Jan. 2012.
[41] C. Moratal, P. Jourdain, C. Depeursinge, J. Pierre, N. Pavillon, and J. Ku,
“Early Cell Death Detection with Digital Holographic Microscopy,” vol.
v, no. 1, pp. 1–9, 2012.
[42] A. Khmaladze, R. L. Matz, T. Epstein, J. Jasensky, M. M. Banaszak Holl,
and Z. Chen, “Cell volume changes during apoptosis monitored in real
time using digital holographic microscopy.,” J. Struct. Biol., vol. 178, no.
3, pp. 270–8, Jun. 2012.
[43] Z. El-Schich, A. Mölder, H. Tassidis, P. Härkönen, M. Falck Miniotis, and
A. Gjörloff Wingren, “Induction of morphological changes in death-
induced cancer cells monitored by holographic microscopy,” J. Struct.
Biol., vol. 189, no. 3, pp. 207–212, 2015.
[44] M. Falck Miniotis, A. Mukwaya, and A. Gjörloff Wingren, “Digital
Holographic Microscopy for Non-Invasive Monitoring of Cell Cycle
Arrest in L929 Cells,” PLoS One, vol. 9, no. 9, p. e106546, Jan. 2014.
[45] J. Balvan, A. Krizova, J. Gumulec, M. Raudenska, Z. Sladek, M.
Sedlackova, P. Babula, M. Sztalmachova, R. Kizek, R. Chmelik, and M.
Masarik, “Multimodal Holographic Microscopy: Distinction between
Apoptosis and Oncosis,” PLoS One, vol. 10, no. 3, p. e0121674, Jan. 2015.
[46] Y. Kuse, K. Ogawa, K. Tsuruma, M. Shimazawa, and H. Hara, “Damage
of photoreceptor-derived cells in culture induced by light emitting diode-
derived blue light.,” Sci. Rep., vol. 4, p. 5223, 2014.

78
Chapter 6. Common-path configuration in Total Internal
Reflection Digital Holography Microscopy
Abstract
Total Internal Reflection Digital Holographic Microscopy (TIRDHM) has
recognized to be a powerful tool in retrieving quantitative phase images of cell-
substrate interfaces, adhesions, and tissue structures close to the prism surface.
In this work, we develop an improved TIRDHM system taking advantage of a
refractive indexes mismatch between the prism and the substrate where is placed
the sample, in order to allow phase-shifting DH with just a single beam
interferometric configuration. Phase shift method is used to retrieve amplitude
and phase images in coherent light and TIR modality, instead of the traditional
off-axis method. Essentially, the substrate-prism interface acts like a beam-
splitter generating a reference beam where the phase-shift dependence on the
incident angle is exploited in this common-path configuration. With the aim to
demonstrate the technique validity, some experiments are performed thus
establishing the advantage of this compact and simple configuration where the
reference arm in the set-up is avoided.

80
6.1. Introduction
Many microscopic biological samples, such as cells, molecules and their
intracellular constituents, are transparent objects, characterized by low contrast,
and therefore represent a challenging task for optical measuring techniques. For
imaging and studying these transparent phase objects, some techniques have been
developed [1]–[6] and they have played very important roles in the advance of
modern biology and medicine. In this context, digital holography (DH)
approaches in microscopy is especially significant, because it presents several
advantages [7], [8]. First, it has shown to be a good technique to retrieve the
quantitative phase information and the sample optical thickness using a reference
wave [9], [10] (off-axis configuration) or even in an on-axis arrangement,
through the phase-shifting digital holography method [11]. Furthermore, DH is a
non-invasive, label-free and non-destructive technique and numerical refocusing
of holographic images can be carried out from an only single hologram (multi-
focus). Over the years, several useful and particular methods have been
developed to improve the capabilities and in this way, to cover a greater number
of applications, e.g. for shape and strain measurements [12], [13], optical-image
encryption [14], quantitative analysis of biological samples [15]–[17], 3D
imaging and display [18]. In addition, in microfluidic environment, quantitative
phase-contrast imaging methods, based on interferometric technique, have been
recently developed [19], [20]. Moreover, especially compact on-chip imaging
methods have been proposed. For instance, lens-free light-weight holographic
digital microscopy installed on a cellphone has been developed by Tseng et al.
[21]. It offers a cost-effective tool for telemedicine applications to address
various global health challenges. On the other hand, Bishara et al. [22], [23]
integrated the LED-based digital in-line holography platform with a microfluidic
channel for sample transporting, referred to as holographic optofluidic
microscopy (HOM). Anyway, due to the underlying principles of DH
microscopy, it returns integral information, which leads into account the
contribution of the entire object volume and eventually of adjacent samples.
Furthermore, in cellular biology, there are many interesting questions involving
the regions of contact between a cell and a solid substrate. Then, to improve data
selectivity, and exclude interference from the out-of-focus background, since
1981, Alxelrod et al. [24] have used a different optical technique to analyze
cellular organelles and biological molecules structure, near biological surface.
The method is called Total Internal Reflection Fluorescence (TIRFM) and it uses
an evanescent wave to selectively visualize fluorescent surface regions until
approximately 200 nm into the sample medium. In fact, for this kind of system,
when light is incident from inside of a higher refractive index medium n1 into a
lower-index one n2, the entire incident light is reflected back to the first medium
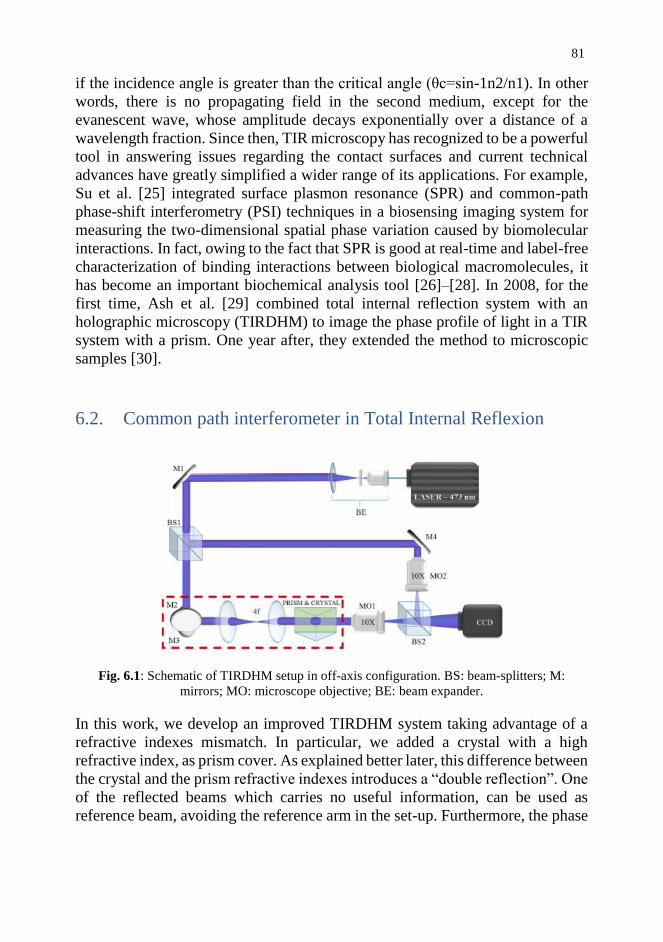
81
if the incidence angle is greater than the critical angle (θc=sin-1n2/n1). In other
words, there is no propagating field in the second medium, except for the
evanescent wave, whose amplitude decays exponentially over a distance of a
wavelength fraction. Since then, TIR microscopy has recognized to be a powerful
tool in answering issues regarding the contact surfaces and current technical
advances have greatly simplified a wider range of its applications. For example,
Su et al. [25] integrated surface plasmon resonance (SPR) and common-path
phase-shift interferometry (PSI) techniques in a biosensing imaging system for
measuring the two-dimensional spatial phase variation caused by biomolecular
interactions. In fact, owing to the fact that SPR is good at real-time and label-free
characterization of binding interactions between biological macromolecules, it
has become an important biochemical analysis tool [26]–[28]. In 2008, for the
first time, Ash et al. [29] combined total internal reflection system with an
holographic microscopy (TIRDHM) to image the phase profile of light in a TIR
system with a prism. One year after, they extended the method to microscopic
samples [30].
6.2. Common path interferometer in Total Internal Reflexion
Fig. 6.1: Schematic of TIRDHM setup in off-axis configuration. BS: beam-splitters; M:
mirrors; MO: microscope objective; BE: beam expander.
In this work, we develop an improved TIRDHM system taking advantage of a
refractive indexes mismatch. In particular, we added a crystal with a high
refractive index, as prism cover. As explained better later, this difference between
the crystal and the prism refractive indexes introduces a “double reflection”. One
of the reflected beams which carries no useful information, can be used as
reference beam, avoiding the reference arm in the set-up. Furthermore, the phase
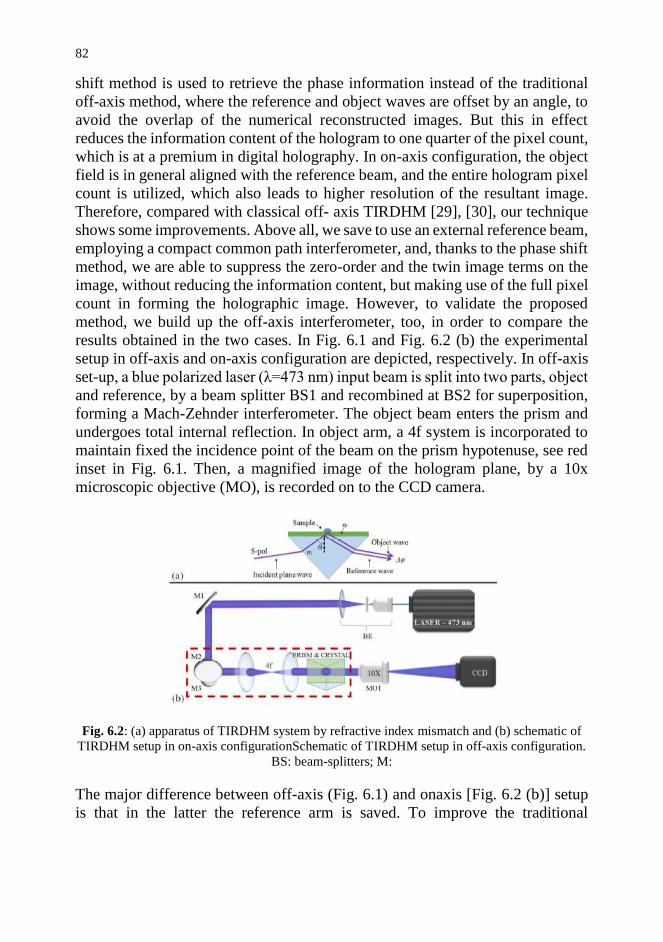
82
shift method is used to retrieve the phase information instead of the traditional
off-axis method, where the reference and object waves are offset by an angle, to
avoid the overlap of the numerical reconstructed images. But this in effect
reduces the information content of the hologram to one quarter of the pixel count,
which is at a premium in digital holography. In on-axis configuration, the object
field is in general aligned with the reference beam, and the entire hologram pixel
count is utilized, which also leads to higher resolution of the resultant image.
Therefore, compared with classical off- axis TIRDHM [29], [30], our technique
shows some improvements. Above all, we save to use an external reference beam,
employing a compact common path interferometer, and, thanks to the phase shift
method, we are able to suppress the zero-order and the twin image terms on the
image, without reducing the information content, but making use of the full pixel
count in forming the holographic image. However, to validate the proposed
method, we build up the off-axis interferometer, too, in order to compare the
results obtained in the two cases. In Fig. 6.1 and Fig. 6.2 (b) the experimental
setup in off-axis and on-axis configuration are depicted, respectively. In off-axis
set-up, a blue polarized laser (λ=473 nm) input beam is split into two parts, object
and reference, by a beam splitter BS1 and recombined at BS2 for superposition,
forming a Mach-Zehnder interferometer. The object beam enters the prism and
undergoes total internal reflection. In object arm, a 4f system is incorporated to
maintain fixed the incidence point of the beam on the prism hypotenuse, see red
inset in Fig. 6.1. Then, a magnified image of the hologram plane, by a 10x
microscopic objective (MO), is recorded on to the CCD camera.
Fig. 6.2: (a) apparatus of TIRDHM system by refractive index mismatch and (b) schematic of
TIRDHM setup in on-axis configurationSchematic of TIRDHM setup in off-axis configuration.
BS: beam-splitters; M:
The major difference between off-axis (Fig. 6.1) and onaxis [Fig. 6.2 (b)] setup
is that in the latter the reference arm is saved. To improve the traditional
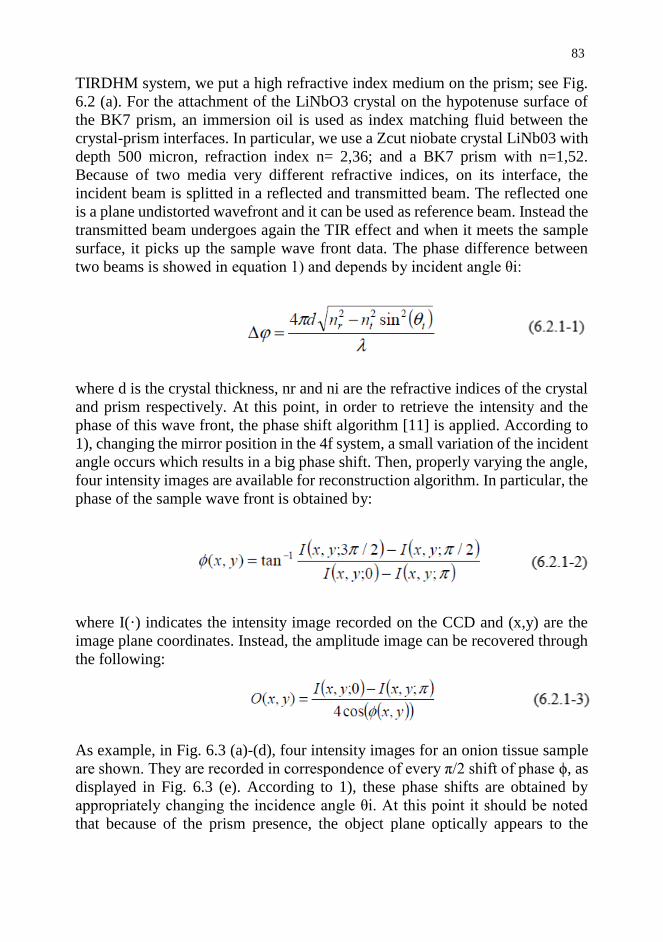
83
TIRDHM system, we put a high refractive index medium on the prism; see Fig.
6.2 (a). For the attachment of the LiNbO3 crystal on the hypotenuse surface of
the BK7 prism, an immersion oil is used as index matching fluid between the
crystal-prism interfaces. In particular, we use a Zcut niobate crystal LiNb03 with
depth 500 micron, refraction index n= 2,36; and a BK7 prism with n=1,52.
Because of two media very different refractive indices, on its interface, the
incident beam is splitted in a reflected and transmitted beam. The reflected one
is a plane undistorted wavefront and it can be used as reference beam. Instead the
transmitted beam undergoes again the TIR effect and when it meets the sample
surface, it picks up the sample wave front data. The phase difference between
two beams is showed in equation 1) and depends by incident angle θi:
where d is the crystal thickness, nr and ni are the refractive indices of the crystal
and prism respectively. At this point, in order to retrieve the intensity and the
phase of this wave front, the phase shift algorithm [11] is applied. According to
1), changing the mirror position in the 4f system, a small variation of the incident
angle occurs which results in a big phase shift. Then, properly varying the angle,
four intensity images are available for reconstruction algorithm. In particular, the
phase of the sample wave front is obtained by:
where I(·) indicates the intensity image recorded on the CCD and (x,y) are the
image plane coordinates. Instead, the amplitude image can be recovered through
the following:
As example, in Fig. 6.3 (a)-(d), four intensity images for an onion tissue sample
are shown. They are recorded in correspondence of every π/2 shift of phase ϕ, as
displayed in Fig. 6.3 (e). According to 1), these phase shifts are obtained by
appropriately changing the incidence angle θi. At this point it should be noted
that because of the prism presence, the object plane optically appears to the

84
camera at a certain angle of inclination, so the prism introduces a tilted plane
anamorphism. In the following, to correct this tilt aberration, a special cubic
phase plate (CPP) algorithm [31] is applied in order to correct the defocus on
some part of the reconstructed images. Furthermore, the angular spectrum
method (AS) is employed to propagate the sample wave front until the focused
plane.
To show how the improved TIRDHM system impacts the imaging in microscopy,
we performed different experiments and the results are reported in Fig.6.4,
Fig.6.5 and Fig.6.6, respectively. In a first trial, a very small amount of onion
tissue is deposited over the crystal covering the prism, corresponding to the four
images acquired and shown in Fig. 6.3. In Fig.6.4 (a) and (b), the intensity and
phase images reconstruction are shown, respectively. They are obtained
according to 2) and 3) that is the method described in [11]. Thanks to the obtained
phase maps, we can see what happens on the contact surfaces between the cells
and the substrate, detecting refractive index changes on the interface and
morphological changes with nano-metric precision. As further confirmation, in
Fig.6.4 (c), we display a pseudo-3D phase reconstruction where the phase
difference between the onion tissue and the background of the sample can be
better appreciated.
In Fig.6.5, we report the results of another experiment showing the Quantitative
Phase Maps (QPM), also in pseudo 3D, Fig.6.5 (b), of onion tissue cells obtained
through the common-path system described previously.
According to (2), the phase images are reconstructed and the results show that
through our method it is possible to easily obtain the phase objects reconstruction
without reference beam.
Fig. 6.3: (a) four π/2 phase shift points chosen for on-axis reconstruction; (b), (c) (d) and (e)
intensity images corresponding to π/2 phase shift.

85
Fig. 6.4: (a) amplitude, (b) phase and (c) pseudo-3D phase image reconstruction by proposed
on-axis TIRDHM.
6.3. Technique validation
Fig. 6.5: (a) reconstructed Quantitative-Phase-Map of onion tissue cells, (b) also in pseudo 3D.
As additional demonstration of the proposed method validity, we perform a
comparison between the two techniques: the traditional TIRDHM, using off-axis
method and the improved TIRDHM system, using on-axis method, proposed in
this paper. In this case, as sample, a 10 ml drop of water is deposited on the
niobate crystal that covers the prism. In Fig. 6.6 (a) and (b) the amplitude and
phase image reconstruction for off-axis method are shown, respectively. Instead,
in Fig.6.6 (c) and (d) the amplitude and phase results for on-axis method are
displayed. Comparing both amplitude images, Fig. 6.6 (a) and (c), no particular
changes are detectable, except for small differences in the offset. A similar result
is obtained for the phase images reconstructions obtained both by traditional
method, in off-axis, Fig. 6.6 (b), and by phase shifting in on-axis configuration,
Fig. 6.6 (d). Comparing these two images, one can note that both techniques
return the same phase image. This confirms that for the purpose of the final result,
the two techniques are entirely comparable. Moreover, as further proof of the
proposed technique validity, we compare the phase profile along the same line,
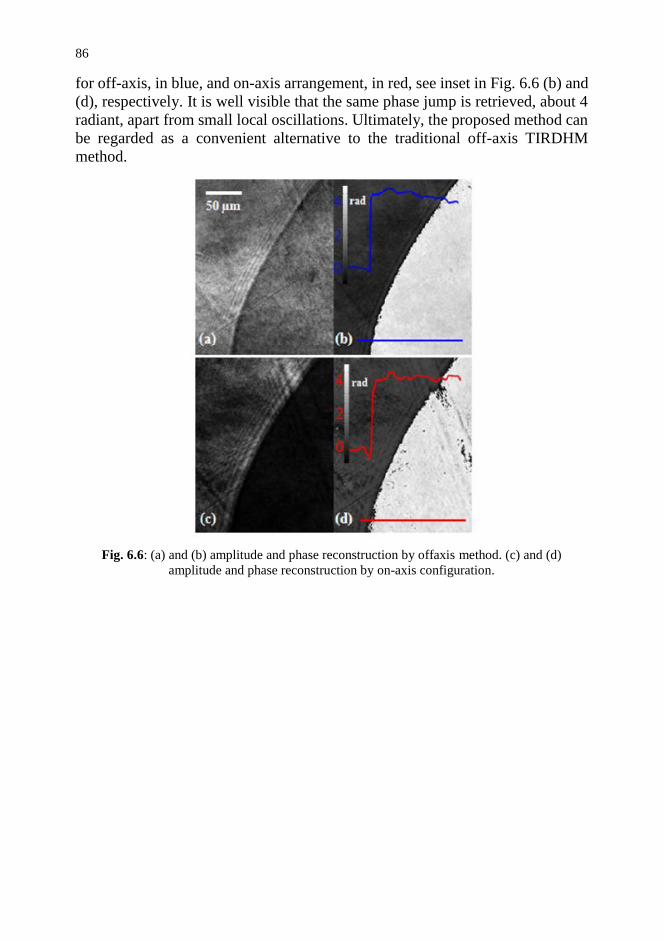
86
for off-axis, in blue, and on-axis arrangement, in red, see inset in Fig. 6.6 (b) and
(d), respectively. It is well visible that the same phase jump is retrieved, about 4
radiant, apart from small local oscillations. Ultimately, the proposed method can
be regarded as a convenient alternative to the traditional off-axis TIRDHM
method.
Fig. 6.6: (a) and (b) amplitude and phase reconstruction by offaxis method. (c) and (d)
amplitude and phase reconstruction by on-axis configuration.

87
6.4. Conclusion and Future Trends
In conclusion, in this work an improved TIRDHM system, incorporating a high
refractive index crystal cover, is described. The aim is to retrieve the complex
wave front in a different and more convenient way, with respect to the traditional
one. In particular, taking advantage of a refractive indexes mismatch between the
prism and crystal, a reflected beam which carries no useful information, can be
used as reference beam, avoiding the reference arm in the set-up. Furthermore,
the phase shift method is used to retrieve the phase information instead of the
traditional off-axis method. To the authors knowledge, this is the first time which
this method in used in a TIRDHM system. The results demonstrate that amplitude
and phase images of the purely phase objects are correctly reconstructed through
the proposed method. Moreover, the results obtained are fully comparable with
those from the traditional method. This establishes the validity ofthe proposed
technique.

88
References
[1] L. G. Alexopoulos, G. R. Erickson, and F. Guilak, “A method for
quantifying cell size from differential interference contrast images:
Validation and application to osmotically stressed chondrocytes,” J.
Microsc., vol. 205, no. 2, pp. 125–135, 2002.
[2] A. Barty, K. A. Nugent, and D. Paganin, “Quantitative optical phase
microscopy,” Opt. Lett., vol. 23, no. 11, pp. 817–819, 1998.
[3] E. Cuche, P. Marquet, and C. Depeursinge, “Simultaneous amplitude-
contrast and quantitative phase-contrast microscopy by numerical
reconstruction of Fresnel off-axis holograms,” 1999.
[4] C. Hu, J. Zhong, and J. Weng, “Digital holographic microscopy by use of
surface plasmon resonance for imaging of cell membranes.,” J. Biomed.
Opt., vol. 15, no. 5, p. 056015, 2011.
[5] C. Mann, L. Yu, C.-M. Lo, and M. Kim, “High-resolution quantitative
phase-contrast microscopy by digital holography.,” Opt. Express, vol. 13,
no. 22, pp. 8693–8698, Oct. 2005.
[6] B. Rothenhäusler and W. Knoll, “Surface plasmon microscopy,” Nature,
vol. 332, no. 6165, pp. 615–617, Apr. 1988.
[7] M. K. Kim, “Principles and techniques of digital holographic
microscopy,” Spie, p. 018005, 2010.
[8] U. Schnars and W. P. O. Juptner, “Digital recording and numerical
reconstruction of holograms,” Meas. Sci. Technol., vol. 13, no. 9, pp. R85–
R101, 2002.
[9] K. J. Chalut, W. J. Brown, and A. Wax, “Quantitative phase microscopy
with asynchronous digital holography,” Opt. Express, vol. 15, no. 6, pp.
3047–3052, 2007.
[10] W. Xu, M. H. Jericho, I. a. Meinertzhagen, and H. J. Kreuzer, “Digital in-
line holography for biological applications.,” Proc. Natl. Acad. Sci. U. S.
A., vol. 98, no. 20, pp. 11301–5, 2001.
[11] T. Zhang and I. Yamaguchi, “Three-dimensional microscopy with phase-
shifting,” vol. 23, no. 15, pp. 1221–1223, 1998.
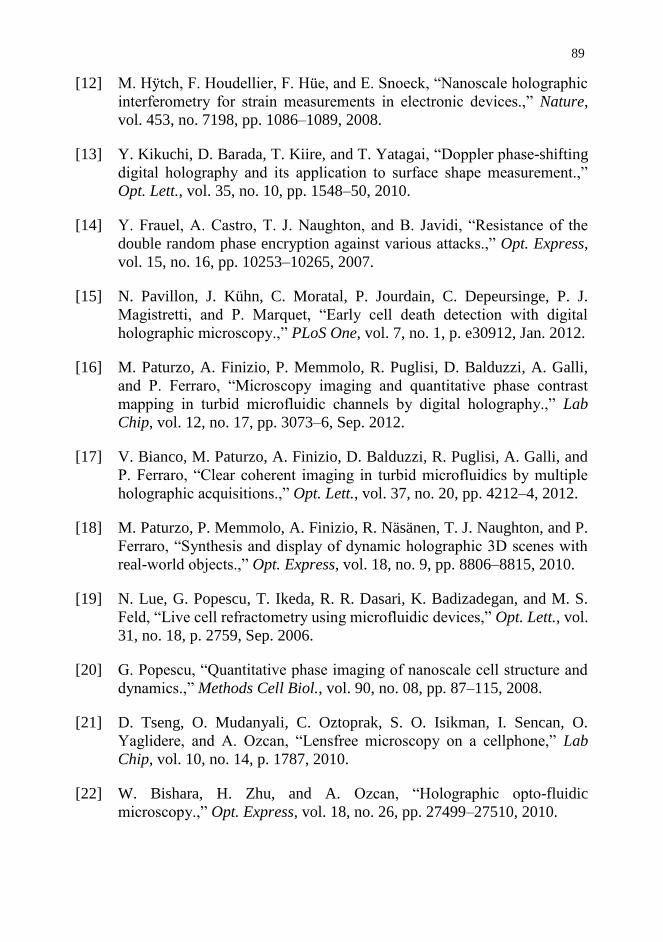
89
[12] M. Hÿtch, F. Houdellier, F. Hüe, and E. Snoeck, “Nanoscale holographic
interferometry for strain measurements in electronic devices.,” Nature,
vol. 453, no. 7198, pp. 1086–1089, 2008.
[13] Y. Kikuchi, D. Barada, T. Kiire, and T. Yatagai, “Doppler phase-shifting
digital holography and its application to surface shape measurement.,”
Opt. Lett., vol. 35, no. 10, pp. 1548–50, 2010.
[14] Y. Frauel, A. Castro, T. J. Naughton, and B. Javidi, “Resistance of the
double random phase encryption against various attacks.,” Opt. Express,
vol. 15, no. 16, pp. 10253–10265, 2007.
[15] N. Pavillon, J. Kühn, C. Moratal, P. Jourdain, C. Depeursinge, P. J.
Magistretti, and P. Marquet, “Early cell death detection with digital
holographic microscopy.,” PLoS One, vol. 7, no. 1, p. e30912, Jan. 2012.
[16] M. Paturzo, A. Finizio, P. Memmolo, R. Puglisi, D. Balduzzi, A. Galli,
and P. Ferraro, “Microscopy imaging and quantitative phase contrast
mapping in turbid microfluidic channels by digital holography.,” Lab
Chip, vol. 12, no. 17, pp. 3073–6, Sep. 2012.
[17] V. Bianco, M. Paturzo, A. Finizio, D. Balduzzi, R. Puglisi, A. Galli, and
P. Ferraro, “Clear coherent imaging in turbid microfluidics by multiple
holographic acquisitions.,” Opt. Lett., vol. 37, no. 20, pp. 4212–4, 2012.
[18] M. Paturzo, P. Memmolo, A. Finizio, R. Näsänen, T. J. Naughton, and P.
Ferraro, “Synthesis and display of dynamic holographic 3D scenes with
real-world objects.,” Opt. Express, vol. 18, no. 9, pp. 8806–8815, 2010.
[19] N. Lue, G. Popescu, T. Ikeda, R. R. Dasari, K. Badizadegan, and M. S.
Feld, “Live cell refractometry using microfluidic devices,” Opt. Lett., vol.
31, no. 18, p. 2759, Sep. 2006.
[20] G. Popescu, “Quantitative phase imaging of nanoscale cell structure and
dynamics.,” Methods Cell Biol., vol. 90, no. 08, pp. 87–115, 2008.
[21] D. Tseng, O. Mudanyali, C. Oztoprak, S. O. Isikman, I. Sencan, O.
Yaglidere, and A. Ozcan, “Lensfree microscopy on a cellphone,” Lab
Chip, vol. 10, no. 14, p. 1787, 2010.
[22] W. Bishara, H. Zhu, and A. Ozcan, “Holographic opto-fluidic
microscopy.,” Opt. Express, vol. 18, no. 26, pp. 27499–27510, 2010.

90
[23] W. Bishara, U. Sikora, O. Mudanyali, T.-W. Su, O. Yaglidere, S.
Luckhart, and A. Ozcan, “Holographic pixel super-resolution in portable
lensless on-chip microscopy using a fiber-optic array.,” Lab Chip, vol. 11,
no. 7, pp. 1276–9, 2011.
[24] D. Axelrod, “Cell-substrate contacts illuminated by total internal
reflection fluorescence.,” J. Cell Biol., vol. 89, no. 1, pp. 141–5, Apr. 1981.
[25] Y. D. Su, S. J. Chen, and T. L. Yeh, “Common-path phase-shift
interferometry surface plasmon resonance imaging system.,” Opt. Lett.,
vol. 30, no. 12, pp. 1488–90, Jun. 2005.
[26] J.-Y. Lee, H.-C. Shih, C.-T. Hong, and T. K. Chou, “Measurement of
refractive index change by surface plasmon resonance and phase
quadrature interferometry,” Opt. Commun., vol. 276, no. 2, pp. 283–287,
2007.
[27] J. Y. Lee, T. K. Chou, and H. C. Shih, “Polarization-interferometric
surface-plasmon-resonance imaging system,” Opt. Lett., vol. 33, no. 5, pp.
434–436, 2008.
[28] R.-Y. He, C.-Y. Lin, Y.-D. Su, K.-C. Chiu, N.-S. Chang, H.-L. Wu, and
S.-J. Chen, “Imaging live cell membranes via surface plasmon-enhanced
fluorescence and phase microscopy.,” Opt. Express, vol. 18, no. 4, pp.
3649–59, Feb. 2010.
[29] W. M. Ash and M. K. Kim, “Digital holography of total internal
reflection.,” Opt. Express, vol. 16, no. 13, pp. 9811–20, Jun. 2008.
[30] W. M. Ash, L. Krzewina, and M. K. Kim, “Quantitative imaging of
cellular adhesion by total internal reflection holographic microscopy.,”
Appl. Opt., vol. 48, no. 34, pp. H144–52, Dec. 2009.
[31] M. Matrecano, M. Paturzo, A. Finizio, and P. Ferraro, “Enhancing depth
of focus in tilted microfluidics channels by digital holography.,” Opt. Lett.,
vol. 38, no. 6, pp. 896–8, Mar. 2013.
Summary and Future Trends
The thesis was focused on the development of interferometric microscopic
techniques to high resolution study cell-material interaction by means of
quantitative phase imaging analysis. Three devices were built.
First, we presented a technique for stamping and modifying large-scale
biocompatible topographic patterns on pDR1m-coated glass, using conventional
equipment. Patterned substrates proved to be effective in confining FA growth
and cytoskeletal assembly. The pattern could be easily erased and rewritten under
dry conditions. Therefore, the system we proposed has the potential to be
employed for understanding cell behavior and possibly mechanotransduction
events in a dynamic environment.
Confocal microscope and AFM have some disadvantages which can be overcome
with DHM. Characterization experimentsby DHM have included the full-field
real-time accurate measures of the SRG on azopolymer plataform, and fibroblast
dynamics and adhesion. On the other hand, a TIRHM was designed to recover
the quantitative phase map from the adhering surface.
We characterize the azo-polymers by DHM instead AFM. Two patterned
substrates of 1D and 2D were realized with a lithographic interferometric method
using the Lloyd mirror configuration. After, we have analysed the samples with
both techniques mentioned above. Therefore, we believe the approach will has
future impact in the analysis of interaction between biomaterials and cell
behaviour study.
Next, we performed a novel quantitative study for investigating real time the cell
volume changes during blue-light exposure under both early and late adhesion of
fibroblast cells. A holographic microscopy technique was adopted for obtaining
quantitative data. Additionally, we added an innovative approach if compared to
the standard DH techniques as here for the first time we develop a DH set-up that
uses a blue laser source that simultaneously serves as reading and tool for
inducing phototoxicity, by switching the DH operation between what we call here
“safe” and “injurious” exposure (SE & IE). The results confirm that the cell
morphology and volume evolve with characteristics that are typical of necrotic
cells, with swelling, balloon-like structures and successive membrane rupture and
leakage of intracellular liquids. This technique allows extracting information
about the interaction of blue light with live adherent cells, establishing the
threshold conditions between healthy and damaged cells.
92
An improved TIRDHM system, incorporating a high refractive index crystal
cover, was built. The goal was to retrieve the complex wave front in a different
and more convenient way, with respect to the traditional one. In particular, taking
advantage of a refractive indexes mismatch between the prism and crystal, a
reflected beam which carries no useful information, can be used as reference
beam, avoiding the reference arm in the set-up. Furthermore, the phase shift
method is used to retrieve the phase information instead of the traditional off-axis
method. The results verify that phase images are correctly reconstructed through
the projected method. In addition, the results obtained are fully comparable with
those from the traditional method.
This work opens a new ways to study cell-material interaction. In the first place,
other surfaces can be manipulated and characterized by the first device. Nexts
experiments will use LiNbO3 as a photomodulable platform. We believe that
surface charges have interesting effects on cell adhesion and orientation. Then,
the latest devices can characterize such effects on the cell like no other kind of
setup. We want to study the cell death behaviours deeply by DHM quantitative
study. Differentiate between apoptosis and necrosis will be the next scopes. In
addition, the phototoxicity effects can be measured for other wavelengths.
Different kind of microscope apparatus and new methodologies are already
developing in our laboratories.

93