APPROVAZIONE DELLA RELAZIONE FINANZIARIA...
18
COMUNICATO STAMPA APPROVAZIONE DELLA RELAZIONE FINANZIARIA SEMESTRALE CONSOLIDATA AL 31 OTTOBRE 2018 Il CdA di Sesa S.p.A. riunitosi in data odierna ha approvato la Relazione finanziaria semestrale consolidata al 31 ottobre 2018 Ricavi e Altri Proventi in crescita del 14,7% e redditività in aumento di oltre il 10% rispetto al primo semestre del precedente esercizio, grazie al successo della strategia di sviluppo nelle aree di business a valore aggiunto dell’IT, a supporto della domanda di trasformazione digitale della clientela Ricavi e Altri Proventi consolidati: Euro 648,2 milioni (+14,7% vs Euro 564,9 milioni al 31 ottobre 2017) Ebitda consolidato: Euro 30,1 milioni (+16,6% vs Euro 25,8 milioni al 31 ottobre 2017) Ebit consolidato: Euro 21,5 milioni (+10,7% vs Euro 19,4 milioni al 31 ottobre 2017). Ebit Adjusted 1 : Euro 22,7 milioni (+11,7% YoY) Utile netto consolidato: Euro 13,7 milioni (+10,1% vs 31 ottobre 2017). Utile netto consolidato Adjusted 1 : Euro 14,6 milioni (+11,2% YoY) Utile netto consolidato di pertinenza del Gruppo: Euro 12,0 milioni (+10,5% vs 31 ottobre 2017). Utile netto consolidato Adjusted 1 di pertinenza del Gruppo: Euro 12,9 milioni (+11,8% YoY) Posizione Finanziaria Netta consolidata attiva (liquidità netta) per Euro 1,8 milioni, in miglioramento vs debito finanziario netto pari ad Euro 2,1 milioni al 31 ottobre 2017 Patrimonio Netto consolidato pari ad Euro 213,6 milioni vs Euro 201,7 milioni al 31 ottobre 2017 Empoli (FI), 19 dicembre 2018 Il Consiglio di Amministrazione di Sesa S.p.A., operatore di riferimento in Italia nel settore delle soluzioni e servizi di Information Technology (“IT”) per la clientela business, in data odierna ha esaminato ed approvato la Relazione finanziaria semestrale consolidata al 31 ottobre 2018, redatta secondo i principi contabili UE- IFRS. Nei primi sei mesi dell’esercizio in corso il Gruppo ha proseguito la strategia di sviluppo nelle aree di business a valore aggiunto dell’IT, supportando il fabbisogno di trasformazione digitale delle imprese ed integrando con successo le recenti operazioni di acquisizione societaria. Il Gruppo Sesa nel primo semestre dell’esercizio al 30 aprile 2019 ha conseguito crescite di ricavi e redditività di oltre il 10% rispetto al primo semestre del precedente esercizio, superiori al trend di sviluppo di lungo termine del Gruppo (CAGR ricavi 2011-2018 +9%, CAGR Ebitda +9,1%). 1 L’Ebit Adjusted e l’Utile prima delle imposte Adjusted sono definiti al lordo degli ammortamenti delle immobilizzazioni immateriali (Liste clienti e Know how) iscritte a seguito del processo di Purchase Price Allocation (PPA). L’Utile netto Adjusted e l’Utile netto Adjusted di pertinenza del Gruppo sono definiti al lordo degli ammortamenti delle immobilizzazioni immateriali (Liste clienti e Know how) iscritte a seguito del processo di PPA, al netto del relativo effetto fiscale
Transcript of APPROVAZIONE DELLA RELAZIONE FINANZIARIA...
COMUNICATO STAMPA
APPROVAZIONE DELLA RELAZIONE FINANZIARIA SEMESTRALE CONSOLIDATA AL 31
OTTOBRE 2018
Il CdA di Sesa S.p.A. riunitosi in data odierna ha approvato la Relazione finanziaria semestrale
consolidata al 31 ottobre 2018
Ricavi e Altri Proventi in crescita del 14,7% e redditività in aumento di oltre il 10% rispetto al primo
semestre del precedente esercizio, grazie al successo della strategia di sviluppo nelle aree di business a
valore aggiunto dell’IT, a supporto della domanda di trasformazione digitale della clientela
Ricavi e Altri Proventi consolidati: Euro 648,2 milioni (+14,7% vs Euro 564,9 milioni al 31 ottobre
2017)
Ebitda consolidato: Euro 30,1 milioni (+16,6% vs Euro 25,8 milioni al 31 ottobre 2017)
Ebit consolidato: Euro 21,5 milioni (+10,7% vs Euro 19,4 milioni al 31 ottobre 2017). Ebit
Adjusted1: Euro 22,7 milioni (+11,7% YoY)
Utile netto consolidato: Euro 13,7 milioni (+10,1% vs 31 ottobre 2017). Utile netto consolidato
Adjusted1: Euro 14,6 milioni (+11,2% YoY)
Utile netto consolidato di pertinenza del Gruppo: Euro 12,0 milioni (+10,5% vs 31 ottobre 2017).
Utile netto consolidato Adjusted1 di pertinenza del Gruppo: Euro 12,9 milioni (+11,8% YoY)
Posizione Finanziaria Netta consolidata attiva (liquidità netta) per Euro 1,8 milioni, in
miglioramento vs debito finanziario netto pari ad Euro 2,1 milioni al 31 ottobre 2017
Patrimonio Netto consolidato pari ad Euro 213,6 milioni vs Euro 201,7 milioni al 31 ottobre 2017
Empoli (FI), 19 dicembre 2018 Il Consiglio di Amministrazione di Sesa S.p.A., operatore di riferimento in Italia nel settore delle soluzioni e
servizi di Information Technology (“IT”) per la clientela business, in data odierna ha esaminato ed approvato
la Relazione finanziaria semestrale consolidata al 31 ottobre 2018, redatta secondo i principi contabili UE-
IFRS.
Nei primi sei mesi dell’esercizio in corso il Gruppo ha proseguito la strategia di sviluppo nelle aree di business
a valore aggiunto dell’IT, supportando il fabbisogno di trasformazione digitale delle imprese ed integrando
con successo le recenti operazioni di acquisizione societaria. Il Gruppo Sesa nel primo semestre dell’esercizio
al 30 aprile 2019 ha conseguito crescite di ricavi e redditività di oltre il 10% rispetto al primo semestre del
precedente esercizio, superiori al trend di sviluppo di lungo termine del Gruppo (CAGR ricavi 2011-2018
+9%, CAGR Ebitda +9,1%).
1L’Ebit Adjusted e l’Utile prima delle imposte Adjusted sono definiti al lordo degli ammortamenti delle immobilizzazioni immateriali (Liste clienti e Know how) iscritte a seguito del processo di Purchase Price Allocation (PPA). L’Utile netto Adjusted e l’Utile netto Adjusted di pertinenza del Gruppo
sono definiti al lordo degli ammortamenti delle immobilizzazioni immateriali (Liste clienti e Know how) iscritte a seguito del processo di PPA, al netto
del relativo effetto fiscale
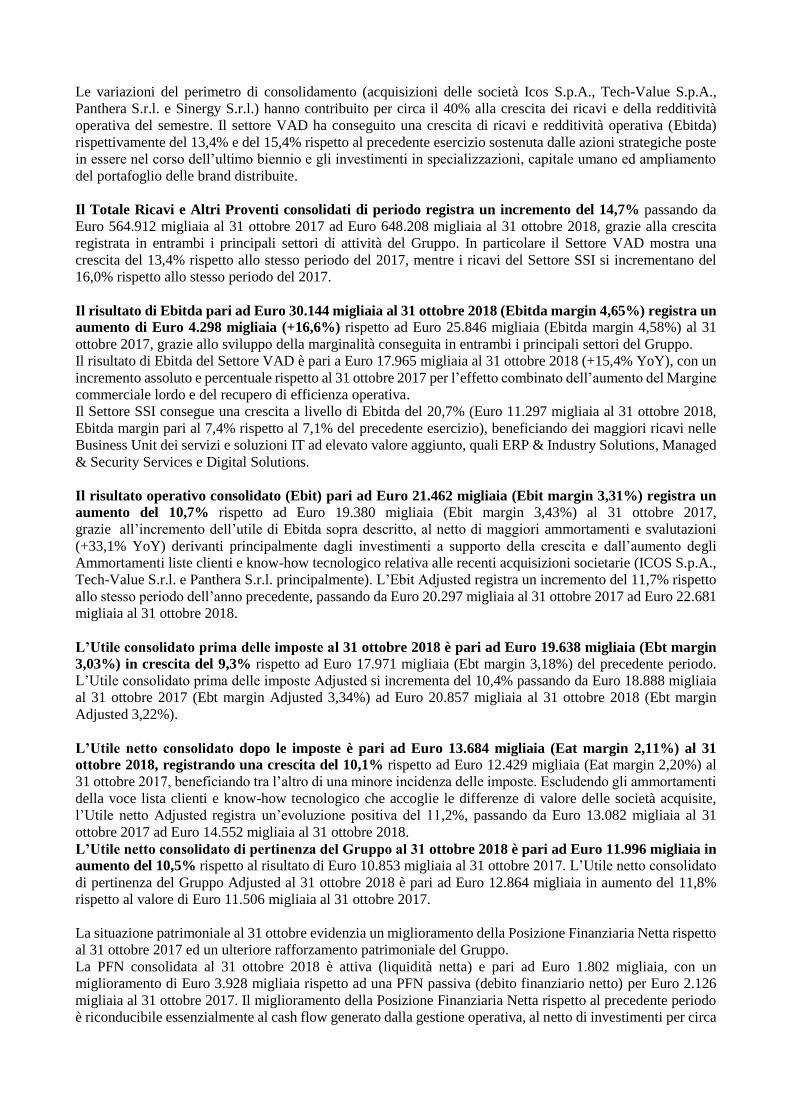
Le variazioni del perimetro di consolidamento (acquisizioni delle società Icos S.p.A., Tech-Value S.p.A.,
Panthera S.r.l. e Sinergy S.r.l.) hanno contribuito per circa il 40% alla crescita dei ricavi e della redditività
operativa del semestre. Il settore VAD ha conseguito una crescita di ricavi e redditività operativa (Ebitda)
rispettivamente del 13,4% e del 15,4% rispetto al precedente esercizio sostenuta dalle azioni strategiche poste
in essere nel corso dell’ultimo biennio e gli investimenti in specializzazioni, capitale umano ed ampliamento
del portafoglio delle brand distribuite.
Il Totale Ricavi e Altri Proventi consolidati di periodo registra un incremento del 14,7% passando da
Euro 564.912 migliaia al 31 ottobre 2017 ad Euro 648.208 migliaia al 31 ottobre 2018, grazie alla crescita
registrata in entrambi i principali settori di attività del Gruppo. In particolare il Settore VAD mostra una
crescita del 13,4% rispetto allo stesso periodo del 2017, mentre i ricavi del Settore SSI si incrementano del
16,0% rispetto allo stesso periodo del 2017.
Il risultato di Ebitda pari ad Euro 30.144 migliaia al 31 ottobre 2018 (Ebitda margin 4,65%) registra un
aumento di Euro 4.298 migliaia (+16,6%) rispetto ad Euro 25.846 migliaia (Ebitda margin 4,58%) al 31
ottobre 2017, grazie allo sviluppo della marginalità conseguita in entrambi i principali settori del Gruppo.
Il risultato di Ebitda del Settore VAD è pari a Euro 17.965 migliaia al 31 ottobre 2018 (+15,4% YoY), con un
incremento assoluto e percentuale rispetto al 31 ottobre 2017 per l’effetto combinato dell’aumento del Margine
commerciale lordo e del recupero di efficienza operativa.
Il Settore SSI consegue una crescita a livello di Ebitda del 20,7% (Euro 11.297 migliaia al 31 ottobre 2018,
Ebitda margin pari al 7,4% rispetto al 7,1% del precedente esercizio), beneficiando dei maggiori ricavi nelle
Business Unit dei servizi e soluzioni IT ad elevato valore aggiunto, quali ERP & Industry Solutions, Managed
& Security Services e Digital Solutions.
Il risultato operativo consolidato (Ebit) pari ad Euro 21.462 migliaia (Ebit margin 3,31%) registra un
aumento del 10,7% rispetto ad Euro 19.380 migliaia (Ebit margin 3,43%) al 31 ottobre 2017,
grazie all’incremento dell’utile di Ebitda sopra descritto, al netto di maggiori ammortamenti e svalutazioni
(+33,1% YoY) derivanti principalmente dagli investimenti a supporto della crescita e dall’aumento degli
Ammortamenti liste clienti e know-how tecnologico relativa alle recenti acquisizioni societarie (ICOS S.p.A.,
Tech-Value S.r.l. e Panthera S.r.l. principalmente). L’Ebit Adjusted registra un incremento del 11,7% rispetto
allo stesso periodo dell’anno precedente, passando da Euro 20.297 migliaia al 31 ottobre 2017 ad Euro 22.681
migliaia al 31 ottobre 2018.
L’Utile consolidato prima delle imposte al 31 ottobre 2018 è pari ad Euro 19.638 migliaia (Ebt margin
3,03%) in crescita del 9,3% rispetto ad Euro 17.971 migliaia (Ebt margin 3,18%) del precedente periodo.
L’Utile consolidato prima delle imposte Adjusted si incrementa del 10,4% passando da Euro 18.888 migliaia
al 31 ottobre 2017 (Ebt margin Adjusted 3,34%) ad Euro 20.857 migliaia al 31 ottobre 2018 (Ebt margin
Adjusted 3,22%).
L’Utile netto consolidato dopo le imposte è pari ad Euro 13.684 migliaia (Eat margin 2,11%) al 31
ottobre 2018, registrando una crescita del 10,1% rispetto ad Euro 12.429 migliaia (Eat margin 2,20%) al
31 ottobre 2017, beneficiando tra l’altro di una minore incidenza delle imposte. Escludendo gli ammortamenti
della voce lista clienti e know-how tecnologico che accoglie le differenze di valore delle società acquisite,
l’Utile netto Adjusted registra un’evoluzione positiva del 11,2%, passando da Euro 13.082 migliaia al 31
ottobre 2017 ad Euro 14.552 migliaia al 31 ottobre 2018.
L’Utile netto consolidato di pertinenza del Gruppo al 31 ottobre 2018 è pari ad Euro 11.996 migliaia in
aumento del 10,5% rispetto al risultato di Euro 10.853 migliaia al 31 ottobre 2017. L’Utile netto consolidato
di pertinenza del Gruppo Adjusted al 31 ottobre 2018 è pari ad Euro 12.864 migliaia in aumento del 11,8%
rispetto al valore di Euro 11.506 migliaia al 31 ottobre 2017.
La situazione patrimoniale al 31 ottobre evidenzia un miglioramento della Posizione Finanziaria Netta rispetto
al 31 ottobre 2017 ed un ulteriore rafforzamento patrimoniale del Gruppo.
La PFN consolidata al 31 ottobre 2018 è attiva (liquidità netta) e pari ad Euro 1.802 migliaia, con un
miglioramento di Euro 3.928 migliaia rispetto ad una PFN passiva (debito finanziario netto) per Euro 2.126
migliaia al 31 ottobre 2017. Il miglioramento della Posizione Finanziaria Netta rispetto al precedente periodo
è riconducibile essenzialmente al cash flow generato dalla gestione operativa, al netto di investimenti per circa
Euro 30 milioni in acquisizioni di nuove società ed infrastrutture tecnologiche realizzati negli ultimi dodici
mesi e dei dividendi erogati nel periodo per circa Euro 9,3 milioni.
Si registra un ulteriore miglioramento dell’efficienza nella gestione del capitale circolante: il capitale di
esercizio netto ammonta ad Euro 116.607 migliaia al 31 ottobre 2018 con una riduzione del 11,3% (pari ad
Euro 14.884 migliaia) rispetto al 31 ottobre 2017, ed un miglioramento del rapporto tra Net Working Capital
e Totale Ricavi ed Altri Proventi su base annuale che al 31 ottobre 2018 scende all’8,1% rispetto al 10,3% al
31 ottobre 2017.
La variazione della PFN al 31 ottobre 2018 rispetto al 30 aprile 2018, che evidenziava una liquidità netta pari
ad Euro 54.662 migliaia, riflette principalmente la stagionalità del business, caratterizzato da un maggiore
assorbimento di capitale circolante netto nel secondo semestre dell’anno solare e quindi al 31 ottobre di ciascun
anno rispetto al 30 aprile.
Nel periodo in esame si rafforza ulteriormente il Patrimonio Netto consolidato che al 31 ottobre 2018 ammonta
ad Euro 213.612 migliaia rispetto ad Euro 201.650 migliaia al 31 ottobre 2017 e ad Euro 216.001 migliaia al
30 aprile 2018.
Il Presidente Paolo Castellacci e l’Amministratore Delegato Alessandro Fabbroni hanno così commentato i
risultati di periodo al 31 ottobre 2018.
“In una fase di trasformazione del mercato, in cui si evolve la modalità di fruizione della tecnologia ed
accelera la domanda di trasformazione digitale delle imprese il Gruppo prosegue la gestione evolvendo la
propria offerta ed ampliando le competenze tecniche a supporto della clientela, affiancandola nel percorso di
innovazione tecnologica. In mercati che necessitano di crescente specializzazione continuiamo a sviluppare
servizi ed innovazioni a valore sostenuti dagli investimenti in capitale umano”, ha affermato Paolo Castellacci,
Presidente e fondatore di Sesa.
“La gestione del primo semestre dell’esercizio si chiude con crescite superiori a quelle del mercato di
riferimento e del track record di lungo termine del Gruppo, beneficiando del successo dei recenti investimenti
in capitale umano ed innovazione tecnologica. Alla crescita hanno contribuito le acquisizioni societarie
realizzate nell’ultimo biennio, in aree di sviluppo strategico, che il Gruppo ha avuto la capacità di integrare
con successo. Alla luce del positivo andamento del primo semestre dell’esercizio il Gruppo conferma un
outlook favorevole per l’intero esercizio al 30 aprile 2019 con livelli di crescita di ricavi e redditività in linea
con il proprio track record di lungo termine (pari a circa il 10% medio annuale nel periodo 2011-2018).
Continueremo ad operare perseguendo politiche di investimento e crescita sostenibile nel lungo termine, a
beneficio di tutti gli stakeholder”, ha affermato Alessandro Fabbroni, Amministratore Delegato di Sesa.
*****
Si allegano al presente comunicato stampa i seguenti prospetti (valori espressi in migliaia di Euro):
Allegato n. 1 – Conto economico consolidato riclassificato al 31 ottobre 2018
Allegato n. 2 – Situazione patrimoniale consolidata riclassificata al 31 ottobre 2018
Allegato n. 3 – Prospetto di conto economico consolidato al 31 ottobre 2018
Allegato n. 4 – Prospetto della situazione patrimoniale e finanziaria consolidata al 31 ottobre 2018
Allegato n. 5 – Segment Information al 31 ottobre 2018
*****
Il comunicato stampa è disponibile sul sito internet della società www.sesa.it, nonché presso il meccanismo di
stoccaggio autorizzato eMarket Storage consultabile all’indirizzo www.emarketstorage.com.
Conference Call: mercoledi 19 dicembre 2018 alle ore 17.00 (CET), Sesa terrà una conferenza telefonica con
la comunità finanziaria, durante la quale saranno discussi i risultati economici e finanziari del Gruppo. E’
possibile collegarsi ai seguenti numeri telefonici: dall’Italia +39028058811, dal Regno Unito +44121 2818003,
dagli USA +17187058794 (numero locale internazionale), 18552656959 (numero verde). Prima della
conferenza telefonica sarà possibile scaricare la presentazione presso il sito www.sesa.it, sezione IR.
*****
Il dott. Alessandro Fabbroni, in qualità di dirigente preposto alla redazione dei documenti Contabili Societari,
dichiara ai sensi del comma 2 articolo 154 bis del Testo Unico della Finanza che l’informativa contabile
contenuta nel presente comunicato corrisponde alle risultanze documentali, ai libri ed alle scritture contabili.
Sesa S.p.A., con sede ad Empoli (FI) ed attività sull’intero territorio nazionale, è a capo di un Gruppo che costituisce
l’operatore di riferimento in Italia nel settore delle soluzioni IT a valore aggiunto per il segmento business e
professionale, con ricavi consolidati per oltre Euro 1,350 miliardi e circa 1.650 dipendenti (fonte: Bilancio consolidato
al 30 aprile 2018). Il Gruppo ha la missione di portare le soluzioni tecnologiche avanzate dei maggiori Vendor
Internazionali di IT nei distretti dell’economia italiana, guidando le imprese nel percorso di innovazione tecnologica
con particolare riferimento ai segmenti SME ed Enterprise. Grazie alla partnership con i global leading player del
settore (cosiddetti “IT Titans”), alle competenze delle proprie risorse umane ed agli investimenti in innovazione il
Gruppo offre servizi e soluzioni ICT (progettazione, education, assistenza pre e post vendita, Managed and Security
Services, Digital Services, Cloud Computing solutions) a supporto della competitività delle imprese e partner clienti.
Sesa è quotata sul segmento STAR (MTA) di Borsa Italiana con un flottante di circa il 47% del capitale.
Per Informazioni Finanziarie
Sesa S.p.A.
Conxi Palmero, Investor Relations Manager
+39 0571 997326 - [email protected]
Per Informazioni Media
Idea Point S.r.l.
Alessandro Pasquinucci
+39 0571 99744 - [email protected]
Sesa S.p.A.
Sede legale Empoli, via Piovola n.138, 50053 Tel. (+39) 0571.997444 – fax (+39) 0571.997984
www.sesa.it
Capitale sociale Euro 37.126.927,50 - i.v. Partita IVA, Codice Fiscale e numero di iscrizione al Registro delle
Imprese di Firenze 07116910964
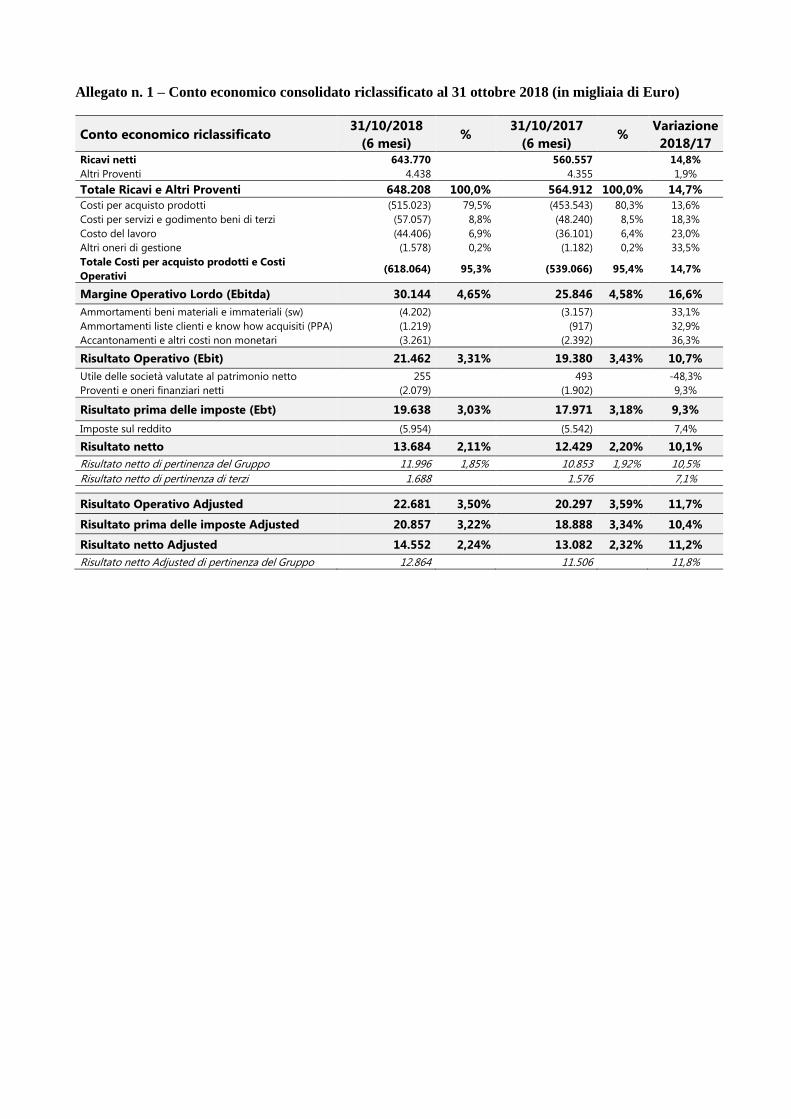
Allegato n. 1 – Conto economico consolidato riclassificato al 31 ottobre 2018 (in migliaia di Euro)
Conto economico riclassificato 31/10/2018
(6 mesi) %
31/10/2017
(6 mesi) %
Variazione
2018/17 Ricavi netti 643.770 560.557 14,8%
Altri Proventi 4.438 4.355 1,9%
Totale Ricavi e Altri Proventi 648.208 100,0% 564.912 100,0% 14,7%
Costi per acquisto prodotti (515.023) 79,5% (453.543) 80,3% 13,6%
Costi per servizi e godimento beni di terzi (57.057) 8,8% (48.240) 8,5% 18,3%
Costo del lavoro (44.406) 6,9% (36.101) 6,4% 23,0%
Altri oneri di gestione (1.578) 0,2% (1.182) 0,2% 33,5%
Totale Costi per acquisto prodotti e Costi
Operativi (618.064) 95,3% (539.066) 95,4% 14,7%
Margine Operativo Lordo (Ebitda) 30.144 4,65% 25.846 4,58% 16,6%
Ammortamenti beni materiali e immateriali (sw) (4.202) (3.157) 33,1%
Ammortamenti liste clienti e know how acquisiti (PPA) (1.219) (917) 32,9%
Accantonamenti e altri costi non monetari (3.261) (2.392) 36,3%
Risultato Operativo (Ebit) 21.462 3,31% 19.380 3,43% 10,7%
Utile delle società valutate al patrimonio netto 255 493 -48,3%
Proventi e oneri finanziari netti (2.079) (1.902) 9,3%
Risultato prima delle imposte (Ebt) 19.638 3,03% 17.971 3,18% 9,3%
Imposte sul reddito (5.954) (5.542) 7,4%
Risultato netto 13.684 2,11% 12.429 2,20% 10,1%
Risultato netto di pertinenza del Gruppo 11.996 1,85% 10.853 1,92% 10,5%
Risultato netto di pertinenza di terzi 1.688 1.576 7,1%
Risultato Operativo Adjusted 22.681 3,50% 20.297 3,59% 11,7%
Risultato prima delle imposte Adjusted 20.857 3,22% 18.888 3,34% 10,4%
Risultato netto Adjusted 14.552 2,24% 13.082 2,32% 11,2%
Risultato netto Adjusted di pertinenza del Gruppo 12.864 11.506 11,8%
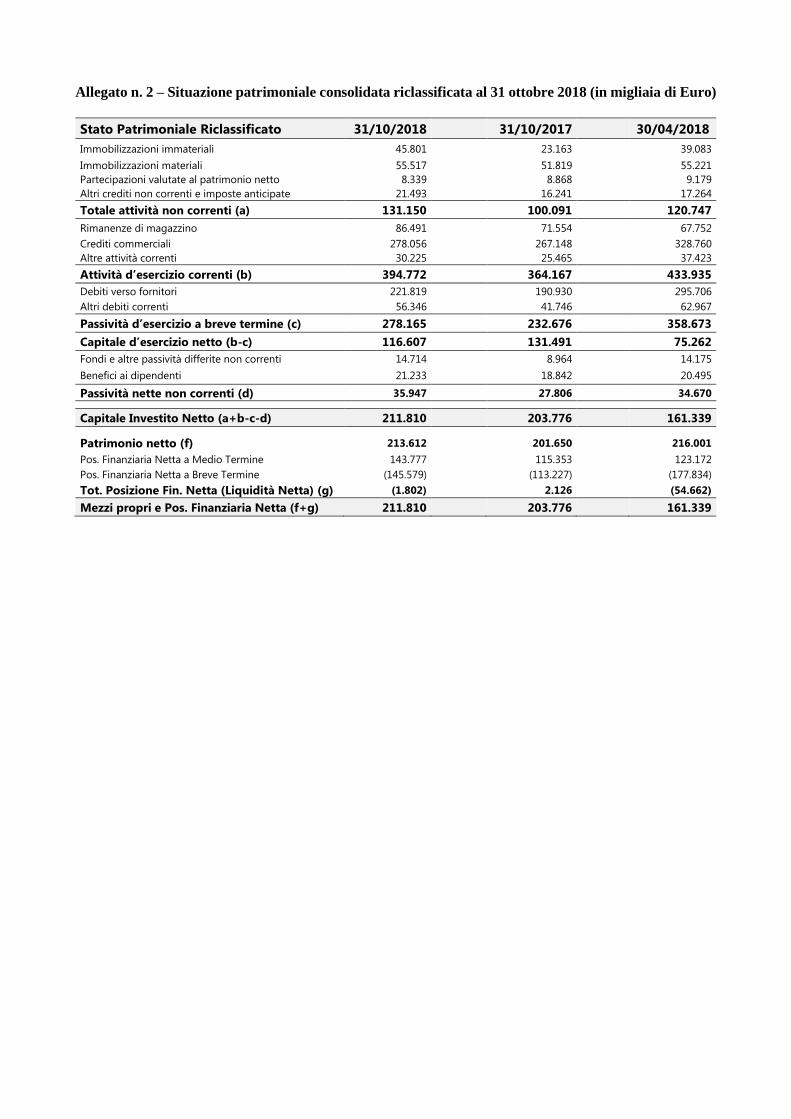
Allegato n. 2 – Situazione patrimoniale consolidata riclassificata al 31 ottobre 2018 (in migliaia di Euro)
Stato Patrimoniale Riclassificato 31/10/2018 31/10/2017 30/04/2018
Immobilizzazioni immateriali 45.801 23.163 39.083
Immobilizzazioni materiali 55.517 51.819 55.221
Partecipazioni valutate al patrimonio netto 8.339 8.868 9.179
Altri crediti non correnti e imposte anticipate 21.493 16.241 17.264
Totale attività non correnti (a) 131.150 100.091 120.747
Rimanenze di magazzino 86.491 71.554 67.752
Crediti commerciali 278.056 267.148 328.760
Altre attività correnti 30.225 25.465 37.423
Attività d’esercizio correnti (b) 394.772 364.167 433.935
Debiti verso fornitori 221.819 190.930 295.706
Altri debiti correnti 56.346 41.746 62.967
Passività d’esercizio a breve termine (c) 278.165 232.676 358.673
Capitale d’esercizio netto (b-c) 116.607 131.491 75.262
Fondi e altre passività differite non correnti 14.714 8.964 14.175
Benefici ai dipendenti 21.233 18.842 20.495
Passività nette non correnti (d) 35.947 27.806 34.670
Capitale Investito Netto (a+b-c-d) 211.810 203.776 161.339
Patrimonio netto (f) 213.612 201.650 216.001
Pos. Finanziaria Netta a Medio Termine 143.777 115.353 123.172
Pos. Finanziaria Netta a Breve Termine (145.579) (113.227) (177.834)
Tot. Posizione Fin. Netta (Liquidità Netta) (g) (1.802) 2.126 (54.662)
Mezzi propri e Pos. Finanziaria Netta (f+g) 211.810 203.776 161.339
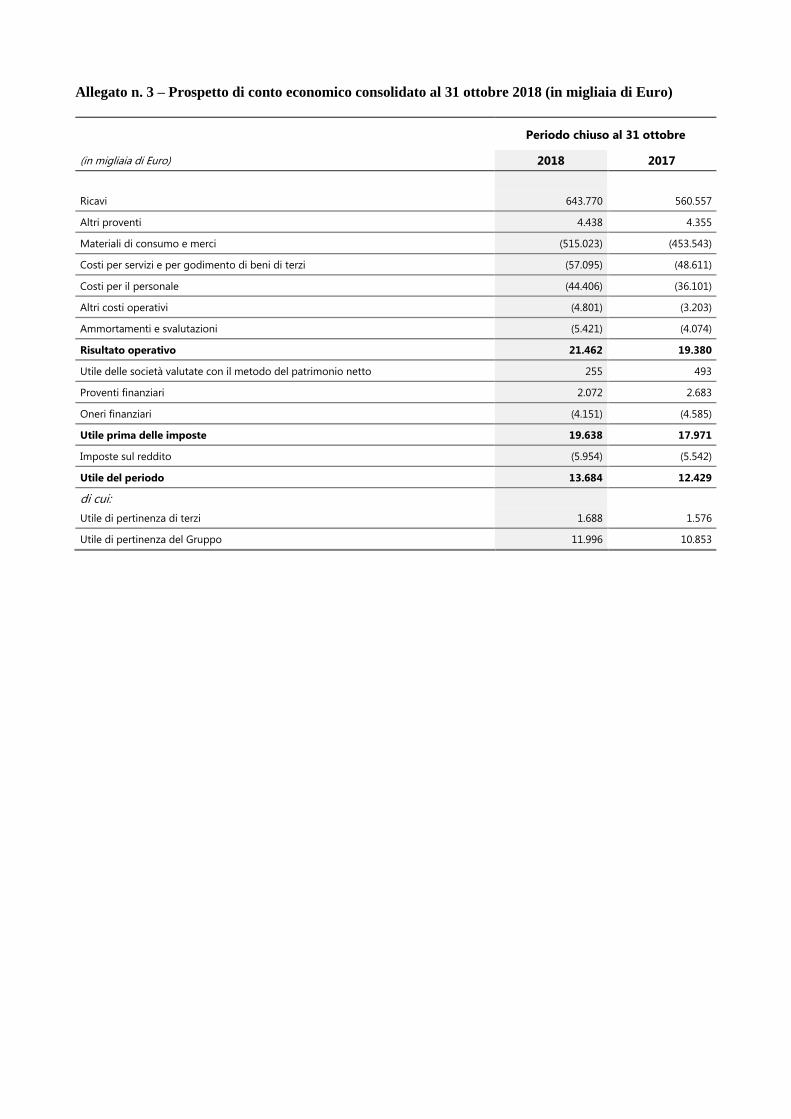
Allegato n. 3 – Prospetto di conto economico consolidato al 31 ottobre 2018 (in migliaia di Euro)
Periodo chiuso al 31 ottobre
(in migliaia di Euro) 2018 2017
Ricavi 643.770 560.557
Altri proventi 4.438 4.355
Materiali di consumo e merci (515.023) (453.543)
Costi per servizi e per godimento di beni di terzi (57.095) (48.611)
Costi per il personale (44.406) (36.101)
Altri costi operativi (4.801) (3.203)
Ammortamenti e svalutazioni (5.421) (4.074)
Risultato operativo 21.462 19.380
Utile delle società valutate con il metodo del patrimonio netto 255 493
Proventi finanziari 2.072 2.683
Oneri finanziari (4.151) (4.585)
Utile prima delle imposte 19.638 17.971
Imposte sul reddito (5.954) (5.542)
Utile del periodo 13.684 12.429
di cui:
Utile di pertinenza di terzi 1.688 1.576
Utile di pertinenza del Gruppo 11.996 10.853
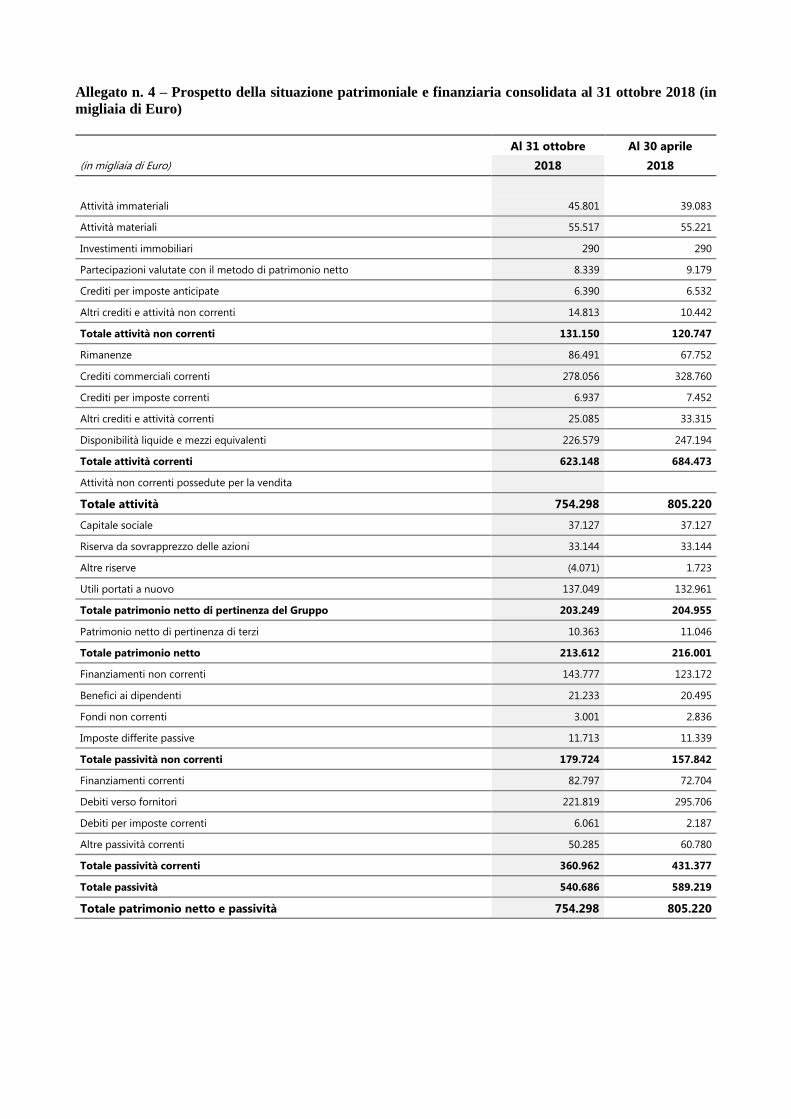
Allegato n. 4 – Prospetto della situazione patrimoniale e finanziaria consolidata al 31 ottobre 2018 (in
migliaia di Euro)
Al 31 ottobre Al 30 aprile
(in migliaia di Euro) 2018 2018
Attività immateriali 45.801 39.083
Attività materiali 55.517 55.221
Investimenti immobiliari 290 290
Partecipazioni valutate con il metodo di patrimonio netto 8.339 9.179
Crediti per imposte anticipate 6.390 6.532
Altri crediti e attività non correnti 14.813 10.442
Totale attività non correnti 131.150 120.747
Rimanenze 86.491 67.752
Crediti commerciali correnti 278.056 328.760
Crediti per imposte correnti 6.937 7.452
Altri crediti e attività correnti 25.085 33.315
Disponibilità liquide e mezzi equivalenti 226.579 247.194
Totale attività correnti 623.148 684.473
Attività non correnti possedute per la vendita
Totale attività 754.298 805.220
Capitale sociale 37.127 37.127
Riserva da sovrapprezzo delle azioni 33.144 33.144
Altre riserve (4.071) 1.723
Utili portati a nuovo 137.049 132.961
Totale patrimonio netto di pertinenza del Gruppo 203.249 204.955
Patrimonio netto di pertinenza di terzi 10.363 11.046
Totale patrimonio netto 213.612 216.001
Finanziamenti non correnti 143.777 123.172
Benefici ai dipendenti 21.233 20.495
Fondi non correnti 3.001 2.836
Imposte differite passive 11.713 11.339
Totale passività non correnti 179.724 157.842
Finanziamenti correnti 82.797 72.704
Debiti verso fornitori 221.819 295.706
Debiti per imposte correnti 6.061 2.187
Altre passività correnti 50.285 60.780
Totale passività correnti 360.962 431.377
Totale passività 540.686 589.219
Totale patrimonio netto e passività 754.298 805.220
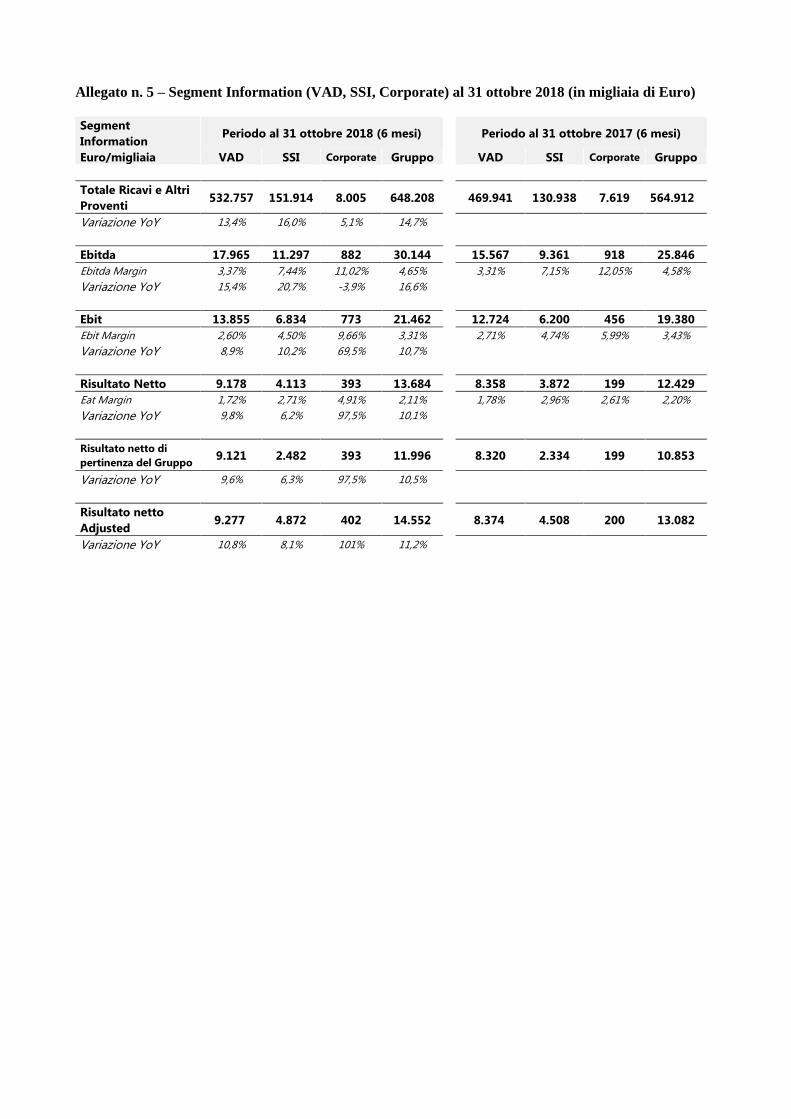
Allegato n. 5 – Segment Information (VAD, SSI, Corporate) al 31 ottobre 2018 (in migliaia di Euro)
Segment
Information Periodo al 31 ottobre 2018 (6 mesi) Periodo al 31 ottobre 2017 (6 mesi)
Euro/migliaia VAD SSI Corporate Gruppo VAD SSI Corporate Gruppo
Totale Ricavi e Altri
Proventi 532.757 151.914 8.005 648.208 469.941 130.938 7.619 564.912
Variazione YoY 13,4% 16,0% 5,1% 14,7%
Ebitda 17.965 11.297 882 30.144 15.567 9.361 918 25.846
Ebitda Margin 3,37% 7,44% 11,02% 4,65% 3,31% 7,15% 12,05% 4,58%
Variazione YoY 15,4% 20,7% -3,9% 16,6%
Ebit 13.855 6.834 773 21.462 12.724 6.200 456 19.380
Ebit Margin 2,60% 4,50% 9,66% 3,31% 2,71% 4,74% 5,99% 3,43%
Variazione YoY 8,9% 10,2% 69,5% 10,7%
Risultato Netto 9.178 4.113 393 13.684 8.358 3.872 199 12.429
Eat Margin 1,72% 2,71% 4,91% 2,11% 1,78% 2,96% 2,61% 2,20%
Variazione YoY 9,8% 6,2% 97,5% 10,1%
Risultato netto di
pertinenza del Gruppo 9.121 2.482 393 11.996 8.320 2.334 199 10.853
Variazione YoY 9,6% 6,3% 97,5% 10,5%
Risultato netto
Adjusted 9.277 4.872 402 14.552 8.374 4.508 200 13.082
Variazione YoY 10,8% 8,1% 101% 11,2%
PRESS RELEASE
APPROVAL OF THE HALF-YEAR FINANCIAL REPORT AT 31 OCTOBER 2018
The Board of Directors of Sesa S.p.A. today examined and approved the Half-Year Financial Report
as of 31 October 2018
Total Revenues and Other Income up by 14.7% and growth of profitability over 10% compared to the
first half of the previous year, thanks to the success of the Group's development strategy in higher
value-added IT business areas, supporting the customers’ demand for digital transformation
Total Revenues and Other Income: Euro 648.2 million (+14.7% vs Euro 564.9 million at 31
October 2017)
Consolidated Ebitda: Euro 30.1 million (+16.6% vs Euro 25.8 million at 31 October 2017)
Consolidated Ebit: Euro 21.5 million (+10.7% vs Euro 19.4 million at 31 October 2017). Adjusted1
consolidated Ebit: Euro 22.7 million (+11.7% YoY)
Consolidated Net profit: Euro 13.7 million (+10.1% vs 31 October 2017). Adjusted1 consolidated
Net profit: Euro 14.6 million (+11.2% YoY)
Consolidated Net profit attributable to the Group: Euro 12.0 million (+10.5% vs 31 October 2017).
Adjusted1 consolidated Net profit attributable to the Group: Euro 12.9 million (+11.8% YoY)
Net Financial Position (net liquidity) positive by Euro 1.8 million, with an improvement vs a net
debt equal to Euro 2.1 million at 31 October 2017
Total Equity equal to Euro 213.6 million vs Euro 201.7 million at 31 October 2017
Empoli, 19 December 2018 The Board of Directors of Sesa S.p.A., reference operator in Italy in the sector of value-added IT services and
solutions for the business segment, examined and approved the consolidated Half-Year Financial Report as of
31 October 2018, prepared in compliance with EU-IFRS accounting standards.
In the first six months of the current year, the Group carried on its development strategy in in higher value-
added IT business areas, supporting the companies’ digital transformation requirements and successfully
integrating the recent corporate acquisitions. In the first half of the year ending on 30 April 2019, Sesa Group
achieved a growth in revenues and profitability of over 10% compared to the first half of the previous year,
higher than the Group's long-term growth trend (2011-2018 revenues CAGR +9%, 2011-2018 Ebitda CAGR
+9.1%).
1Adjusted Ebit and Adjusted Ebt are gross of the amortization of intangible assets (client lists and technological know-how) recorded as a result of the Purchase Price Allocation (PPA) process. Adjusted Net profit and Adjusted Net profit attributable to the Group are gross of the amortization of
intangible assets (client lists and technological know-how) recorded as a result of the Purchase Price Allocation (PPA) process, both net of the related
tax effects
The changes in the scope of consolidation (acquisitions of the companies Icos S.p.A., Tech-Value S.p.A.,
Panthera S.r.l. and Sinergy S.r.l.) contributed to the growth for about 40% in revenues and profitability at 31
October 2018. The VAD sector achieved an increase in revenues and Ebitda of 13.4% and 15.4% respectively
compared to the previous year, supported by the strategic actions implemented over the last two years and
investments in specializations, human capital and expansion of the portfolio of distributed brands.
Total Revenues and Other Income up by 14.7% in the period, from Euro 564,912 thousand at 31 October
2017 to Euro 648,208 thousand at 31 October 2018, thanks to the growth recorded in both Group's main
business segments. In particular, the VAD sector showed a growth of 13.4% compared to the same period of
2017, while SSI sector’s revenues increased by 16.0% compared to the same period of 2017.
The consolidated Ebitda equal to Euro 30,144 thousand at 31 October 2018 (Ebitda margin 4.65%)
showed an increase of Euro 4,298 thousand (+16.6%) compared to Euro 25,846 thousand (Ebitda margin
4.58%) at 31 October 2017, thanks to the growth achieved in both Group’s main business segments.
The VAD sector’s Ebitda amounted to Euro 17,965 thousand at 31 October 2018 (+15.4% YoY), with an
absolute and percentage growth compared to 31 October 2017 thanks to the combined effect of Gross Margin
increase and the recovery in the operating efficiency.
The SSI sector recorded a 20.7% growth in Ebitda (Euro 11,297 thousand at 31 October 2018, Ebitda margin
equal to 7.4% compared to 7.1% of the previous year), benefiting from higher revenues in the Business Units
of high value-added IT services and solutions, such as ERP & Industry Solutions, Managed & Security
Services and Digital Solutions.
The consolidated Ebit equal to Euro 21,462 thousand (Ebit margin 3.31%) increased by 10.7% compared
to Euro 19,380 thousand (Ebit margin 3.43%) at 31 October 2017, thanks to the above-mentioned growth in
Ebitda, net of higher amortisation and depreciation (+33.1% YoY) following the Group’s investments
supporting the growth and the increase in the item amortisation client lists and technological know-how related
to the recent acquisitions (mainly ICOS S.p.A., Tech-Value S.r.l. and Panthera S.r.l.). The Adjusted Ebit
increased by 11.7% compared to the same period of the previous year, from Euro 20,297 thousand at 31
October 2017 to Euro 22,681 thousand at 31 October 2018.
The consolidated Ebt at 31 October 2018 is equal to Euro 19,638 thousand (Ebt margin 3.03%), up by
9.3% compared to Euro 17,971 thousand (Ebt margin 3.18%) of the previous period. The consolidated
Adjusted Ebt increased by 10.4% from Euro 18,888 thousand at 31 October 2017 (Adjusted Ebt margin 3.34%)
to Euro 20,857 thousand at 31 October 2018 (Adjusted Ebt margin 3.22%).
The consolidated Net profit after taxes is equal to Euro 13,684 thousand (Eat margin 2.11%) at 31
October 2018, showing an increase of 10.1% compared to Euro 12,429 thousand (Eat margin 2.20%) at 31
October 2017, benefiting, among other things, from a lower tax incidence. Excluding the item amortisation
client lists and technological know-how that includes the differences in value of the acquired companies, the
Adjusted Net profit recorded a 11.2% growth, from Euro 13,082 thousand at 31 October 2017 to Euro 14,552
thousand at 31 October 2018.
The consolidated Net profit attributable to the Group at 31 October 2018 is equal to Euro 11,996
thousand, up by 10.5% compared to Euro 10,853 thousand at 31 October 2017. The consolidated Adjusted
Net profit attributable to the Group at 31 October 2018 amounted to Euro 12,864 thousand, with a 11.8%
growth compared to Euro 11,506 thousand at 31 October 2017.
The Balance Sheet at 31 October showed an improvement in the Net Financial Position compared to 31
October 2017 and a further strengthening of the Group's Equity.
The consolidated NFP at 31 October 2018 is positive (net liquidity) by Euro 1,802 thousand, with an
improvement of Euro 3,928 thousand compared to a negative NFP (net debt) equal to Euro 2,126 thousand at
31 October 2017. The improvement compared to the same period of the previous year was mainly due to the
operating cash flow, net of investments for corporate acquisitions and technological infrastructures (about Euro
30 million) carried out in the last 12 months and dividends paid in the period equal to about Euro 9.3 million.
It should be noted a further improvement in the efficiency of working capital management: the Net Working
Capital amounted to Euro 116,607 thousand at 31 October 2018 with a decrease of 11.3% (equal to Euro
14,884 thousand) compared to 31 October 2017, and an improvement in the ratio between Net Working Capital
and Total Revenues and Other Income on an annual basis which fell to 8.1% at 31 October 2018 from 10.3%
at 31 October 2017.
The change in the NFP at 31 October 2018 compared to 30 April 2018, which showed a net liquidity equal to
Euro 54,662 thousand, mainly reflects the seasonality of the business, characterized by a greater absorption of
net working capital in the second half of the year and therefore at 31 October compared to 30 April of each
year.
During the period, the consolidated Equity further strengthened and amounted to Euro 213,612 thousand at 31
October 2018 compared to Euro 201,650 thousand at 31 October 2017 and Euro 216,001 thousand at 30 April
2018.
The Chairman Paolo Castellacci and the Chief Executive Officer Alessandro Fabbroni commented the results
for the six-month period at 31 October 2018.
“During a phase of market transformation, in which the way of technological fruition is evolving and grow
the the companies’ digital transformation requirements, the Group carries on the business developing its
offering and increasing technical skills supporting the customers in their technological innvoation path. In
markets that need a growing specialization we continue to develop value-added services and innovations
favored by investments in human capital”, stated Paolo Castellacci, Chairman and founder of Sesa.
“In the first half of the fiscal year the Group overperformed the reference market and the Group's long-term
trend, benefiting from the succes of the recent investments in human capital and technological innovation. To
the growth contributed the corporate acquisitions carried out in strategic areas during the last two years,
succesfully integrated by the Group. Considering the positive performance of the first half of the year, the
Group confirms a favorable outlook for the full year ending on 30 April 2019 with a growth in revenues and
profitability in line with its long-term track record (equal to an average of about 10% annually in the period
2011-2018). We will continue to operate by pursuing long-term investments and sustainable growth policies,
towards all stakeholders”, stated Alessandro Fabbroni, CEO of Sesa.
*****
Here attached you can find the following exhibits (in thousands of Euros):
Exhibit n. 1 – Reclassified Consolidated Income Statement of Sesa Group as of 31 October 2018
Exhibit n. 2 – Reclassified Consolidated Balance Sheet of Sesa Group as of 31 October 2018
Exhibit n. 3 – Consolidated Income Statement of Sesa Group as of 31 October 2018
Exhibit n. 4 – Consolidated Statement of Financial Position of Sesa Group as of 31 October 2018
Exhibit n. 5 – Segment Information (VAD, SSI, Corporate) as of 31 October 2018
*****
This press release is also available on the company's website www.sesa.it, as well as on the authorized storage
mechanism eMarket Storage consultable at the website www.emarketstorage.com.
Conference Call: Wednesday 19 December 2018 at 5.00 p.m. (CET), Sesa S.p.A. will hold a conference call
with the financial community, in order to discuss the Group’s economic and financial results. You can connect
through the following phone numbers: from Italy +39 02 8058811, from the UK +44 121 2818003, from USA
+1 718 7058794 (international local number), 1 855 2656959 (toll-free number). Before the conference call,
the financial presentation will be available on the company’s website, http://www.sesa.it/en/investor-
relations/presentations.html.
***** The manager responsible for drawing up the company’s accounts – Alessandro Fabbroni - declares, pursuant
to Paragraph 2 of Article 154 bis of the Consolidated Finance Act, that the accounting information contained
in this press release matches the information included in the accounting books and records.
Sesa S.p.A., based in Empoli (Florence) and activities throughout the Italian territory, is the head of a Group leader in
Italy in the sector of value-added IT services and solutions for the business segment, with consolidated revenues over
Euro 1.350 billion and about 1,650 employees (source: Consolidated Financial Statements at 30 April 2018). The
Group has the mission of bring the most advanced technological solutions of international Vendors of IT in the districts
of the Italian economy, leading companies and entrepreneurs in the path of technological innovation, with particular
reference to the SME and Enterprise segments. By partnering with the global leading brand in the industry (“IT
Titans”), the skills of its human resources and investment in innovation, the Group offers ICT services and solutions
(design, education, pre and post sales, Managed and Security Services, Digital Solutions, Cloud Computing Solutions)
to support the competitiveness of enterprises customers.
Sesa is listed on the STAR (MTA) of the Italian Stock Exchange with a free float of about 47%.
For Financial Information
Sesa S.p.A.
Conxi Palmero, Investor Relations Manager
+39 0571 997326 - [email protected]
For Media Information
Idea Point S.r.l.
Alessandro Pasquinucci
+39 0571 99744 - [email protected]
Sesa S.p.A.
Headquarter Empoli, via Piovola n.138, 50053
Ph. (+39) 0571.997444 – fax (+39) 0571.997984
www.sesa.it
Share Capital Euro 37,126,927.50 - i.v.
VAT number, Fiscal and number on the Florence Company
Register 07116910964
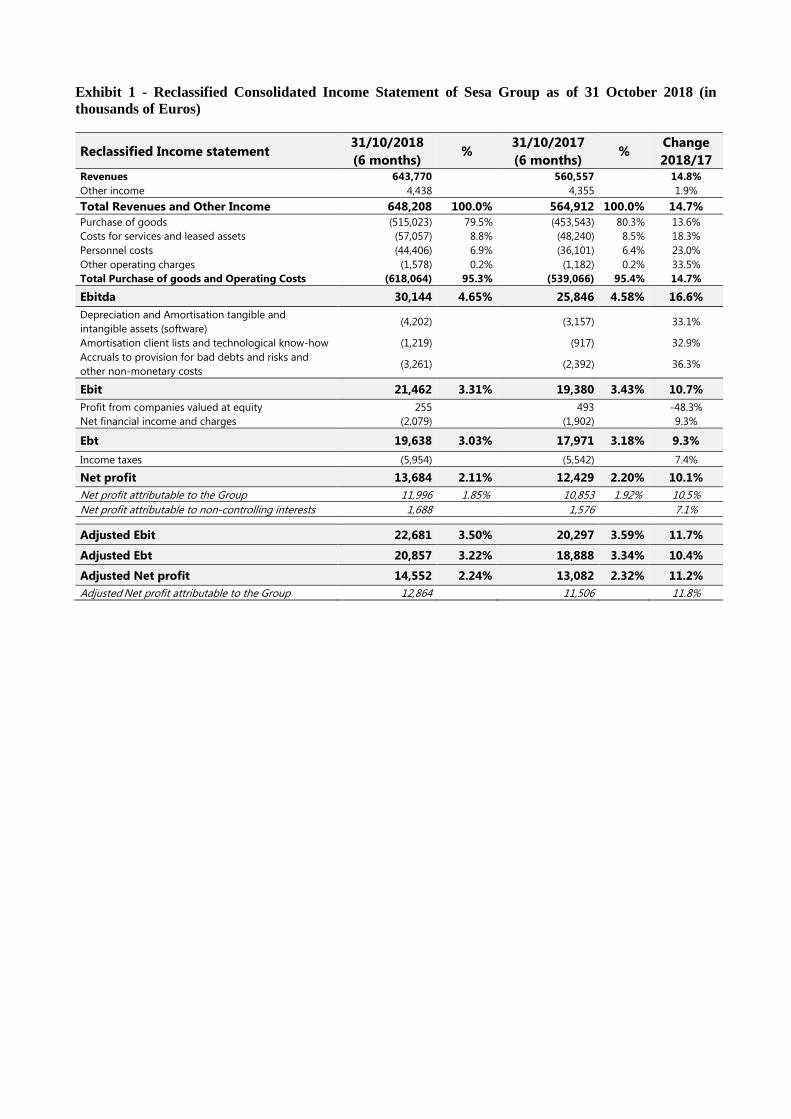
Exhibit 1 - Reclassified Consolidated Income Statement of Sesa Group as of 31 October 2018 (in
thousands of Euros)
Reclassified Income statement 31/10/2018
(6 months) %
31/10/2017
(6 months) %
Change
2018/17 Revenues 643,770 560,557 14.8%
Other income 4,438 4,355 1.9%
Total Revenues and Other Income 648,208 100.0% 564,912 100.0% 14.7%
Purchase of goods (515,023) 79.5% (453,543) 80.3% 13.6%
Costs for services and leased assets (57,057) 8.8% (48,240) 8.5% 18.3%
Personnel costs (44,406) 6.9% (36,101) 6.4% 23.0%
Other operating charges (1,578) 0.2% (1,182) 0.2% 33.5%
Total Purchase of goods and Operating Costs (618,064) 95.3% (539,066) 95.4% 14.7%
Ebitda 30,144 4.65% 25,846 4.58% 16.6%
Depreciation and Amortisation tangible and
intangible assets (software) (4,202) (3,157) 33.1%
Amortisation client lists and technological know-how (1,219) (917) 32.9%
Accruals to provision for bad debts and risks and
other non-monetary costs (3,261) (2,392) 36.3%
Ebit 21,462 3.31% 19,380 3.43% 10.7%
Profit from companies valued at equity 255 493 -48.3%
Net financial income and charges (2,079) (1,902) 9.3%
Ebt 19,638 3.03% 17,971 3.18% 9.3%
Income taxes (5,954) (5,542) 7.4%
Net profit 13,684 2.11% 12,429 2.20% 10.1%
Net profit attributable to the Group 11,996 1.85% 10,853 1.92% 10.5%
Net profit attributable to non-controlling interests 1,688 1,576 7.1%
Adjusted Ebit 22,681 3.50% 20,297 3.59% 11.7%
Adjusted Ebt 20,857 3.22% 18,888 3.34% 10.4%
Adjusted Net profit 14,552 2.24% 13,082 2.32% 11.2%
Adjusted Net profit attributable to the Group 12,864 11,506 11.8%
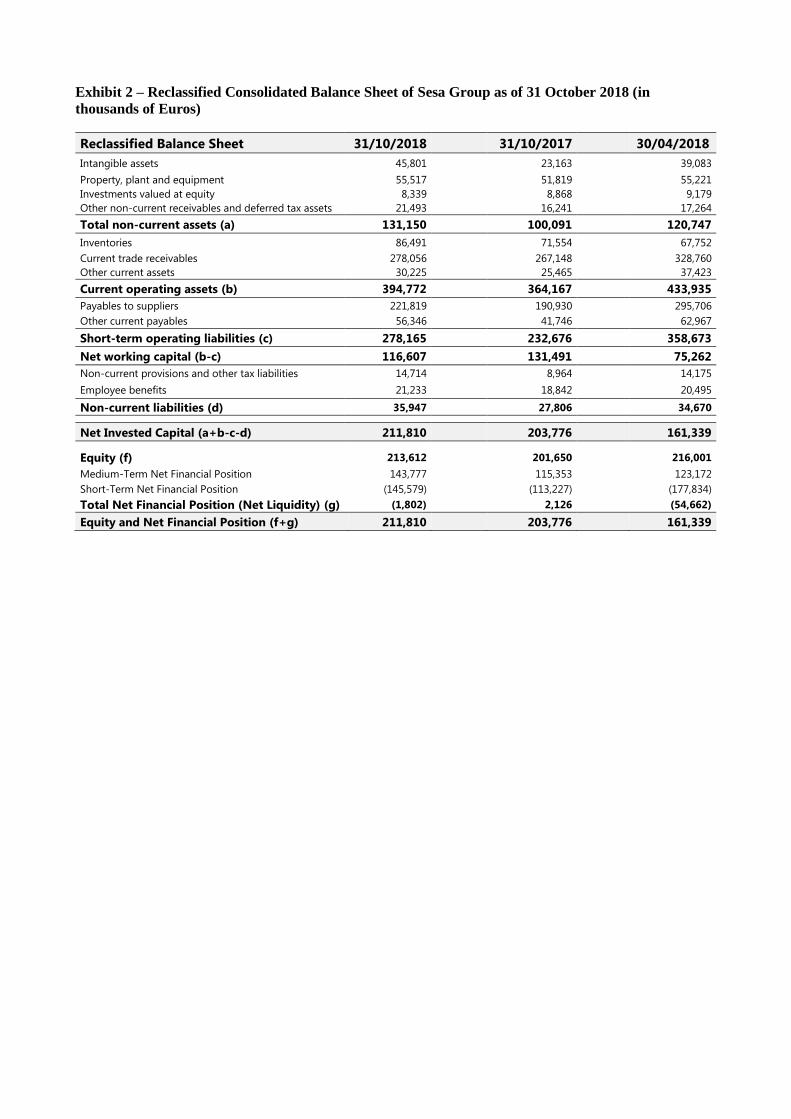
Exhibit 2 – Reclassified Consolidated Balance Sheet of Sesa Group as of 31 October 2018 (in
thousands of Euros)
Reclassified Balance Sheet 31/10/2018 31/10/2017 30/04/2018
Intangible assets 45,801 23,163 39,083
Property, plant and equipment 55,517 51,819 55,221
Investments valued at equity 8,339 8,868 9,179
Other non-current receivables and deferred tax assets 21,493 16,241 17,264
Total non-current assets (a) 131,150 100,091 120,747
Inventories 86,491 71,554 67,752
Current trade receivables 278,056 267,148 328,760
Other current assets 30,225 25,465 37,423
Current operating assets (b) 394,772 364,167 433,935
Payables to suppliers 221,819 190,930 295,706
Other current payables 56,346 41,746 62,967
Short-term operating liabilities (c) 278,165 232,676 358,673
Net working capital (b-c) 116,607 131,491 75,262
Non-current provisions and other tax liabilities 14,714 8,964 14,175
Employee benefits 21,233 18,842 20,495
Non-current liabilities (d) 35,947 27,806 34,670
Net Invested Capital (a+b-c-d) 211,810 203,776 161,339
Equity (f) 213,612 201,650 216,001
Medium-Term Net Financial Position 143,777 115,353 123,172
Short-Term Net Financial Position (145,579) (113,227) (177,834)
Total Net Financial Position (Net Liquidity) (g) (1,802) 2,126 (54,662)
Equity and Net Financial Position (f+g) 211,810 203,776 161,339
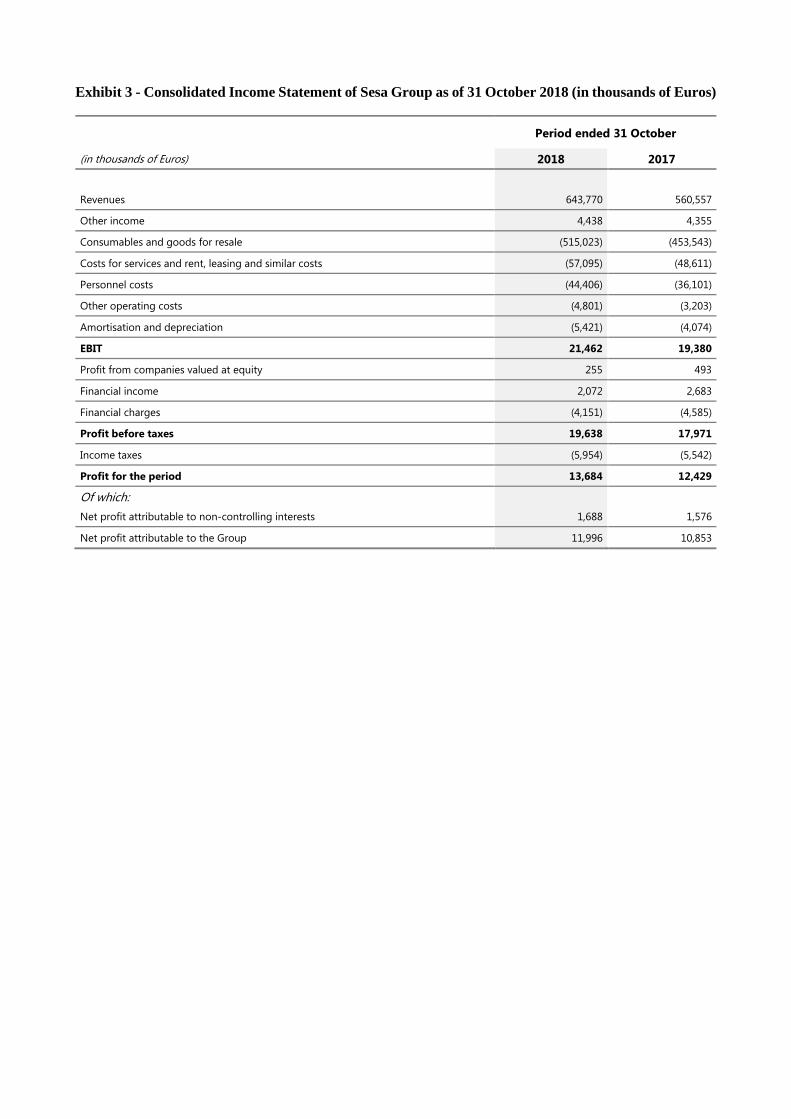
Exhibit 3 - Consolidated Income Statement of Sesa Group as of 31 October 2018 (in thousands of Euros)
Period ended 31 October
(in thousands of Euros) 2018 2017
Revenues 643,770 560,557
Other income 4,438 4,355
Consumables and goods for resale (515,023) (453,543)
Costs for services and rent, leasing and similar costs (57,095) (48,611)
Personnel costs (44,406) (36,101)
Other operating costs (4,801) (3,203)
Amortisation and depreciation (5,421) (4,074)
EBIT 21,462 19,380
Profit from companies valued at equity 255 493
Financial income 2,072 2,683
Financial charges (4,151) (4,585)
Profit before taxes 19,638 17,971
Income taxes (5,954) (5,542)
Profit for the period 13,684 12,429
Of which:
Net profit attributable to non-controlling interests 1,688 1,576
Net profit attributable to the Group 11,996 10,853
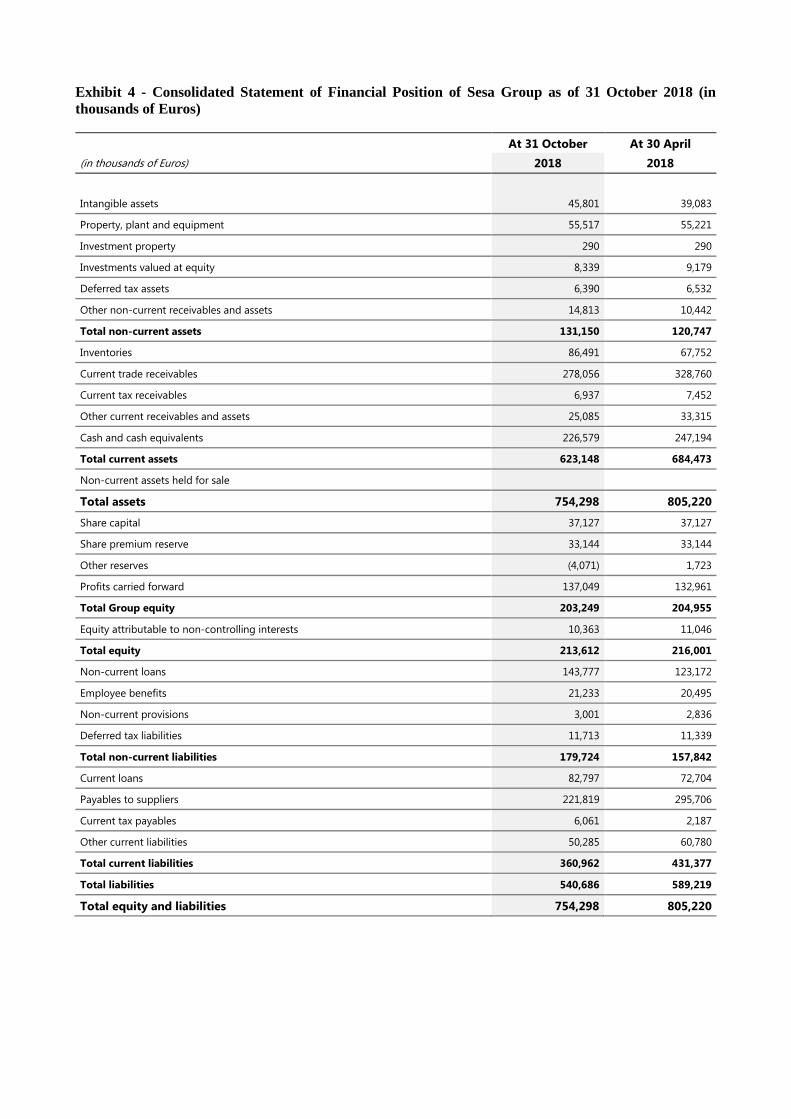
Exhibit 4 - Consolidated Statement of Financial Position of Sesa Group as of 31 October 2018 (in
thousands of Euros)
At 31 October At 30 April
(in thousands of Euros) 2018 2018
Intangible assets 45,801 39,083
Property, plant and equipment 55,517 55,221
Investment property 290 290
Investments valued at equity 8,339 9,179
Deferred tax assets 6,390 6,532
Other non-current receivables and assets 14,813 10,442
Total non-current assets 131,150 120,747
Inventories 86,491 67,752
Current trade receivables 278,056 328,760
Current tax receivables 6,937 7,452
Other current receivables and assets 25,085 33,315
Cash and cash equivalents 226,579 247,194
Total current assets 623,148 684,473
Non-current assets held for sale
Total assets 754,298 805,220
Share capital 37,127 37,127
Share premium reserve 33,144 33,144
Other reserves (4,071) 1,723
Profits carried forward 137,049 132,961
Total Group equity 203,249 204,955
Equity attributable to non-controlling interests 10,363 11,046
Total equity 213,612 216,001
Non-current loans 143,777 123,172
Employee benefits 21,233 20,495
Non-current provisions 3,001 2,836
Deferred tax liabilities 11,713 11,339
Total non-current liabilities 179,724 157,842
Current loans 82,797 72,704
Payables to suppliers 221,819 295,706
Current tax payables 6,061 2,187
Other current liabilities 50,285 60,780
Total current liabilities 360,962 431,377
Total liabilities 540,686 589,219
Total equity and liabilities 754,298 805,220
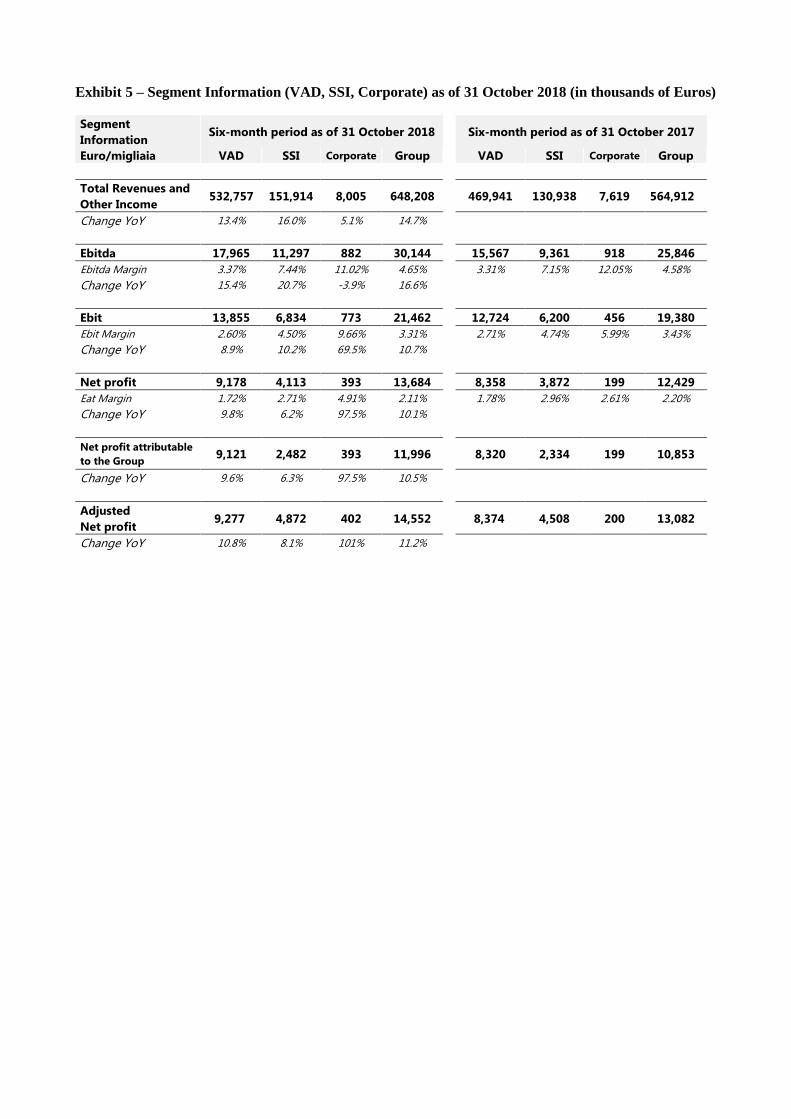
Exhibit 5 – Segment Information (VAD, SSI, Corporate) as of 31 October 2018 (in thousands of Euros)
Segment
Information Six-month period as of 31 October 2018 Six-month period as of 31 October 2017
Euro/migliaia VAD SSI Corporate Group VAD SSI Corporate Group
Total Revenues and
Other Income 532,757 151,914 8,005 648,208 469,941 130,938 7,619 564,912
Change YoY 13.4% 16.0% 5.1% 14.7%
Ebitda 17,965 11,297 882 30,144 15,567 9,361 918 25,846
Ebitda Margin 3.37% 7.44% 11.02% 4.65% 3.31% 7.15% 12.05% 4.58%
Change YoY 15.4% 20.7% -3.9% 16.6%
Ebit 13,855 6,834 773 21,462 12,724 6,200 456 19,380
Ebit Margin 2.60% 4.50% 9.66% 3.31% 2.71% 4.74% 5.99% 3.43%
Change YoY 8.9% 10.2% 69.5% 10.7%
Net profit 9,178 4,113 393 13,684 8,358 3,872 199 12,429
Eat Margin 1.72% 2.71% 4.91% 2.11% 1.78% 2.96% 2.61% 2.20%
Change YoY 9.8% 6.2% 97.5% 10.1%
Net profit attributable
to the Group 9,121 2,482 393 11,996 8,320 2,334 199 10,853
Change YoY 9.6% 6.3% 97.5% 10.5%
Adjusted
Net profit 9,277 4,872 402 14,552 8,374 4,508 200 13,082
Change YoY 10.8% 8.1% 101% 11.2%