Applicazioni di spettrometria di massa in proteomica...Applicazioni di spettrometria di massa in...
42
Applicazioni di spettrometria di massa in proteomica Angela Bachi Dibit-San Raffaele Scientific Institute
Transcript of Applicazioni di spettrometria di massa in proteomica...Applicazioni di spettrometria di massa in...
Applicazioni di spettrometriadi massa in proteomica
Angela BachiDibit-San Raffaele Scientific Institute
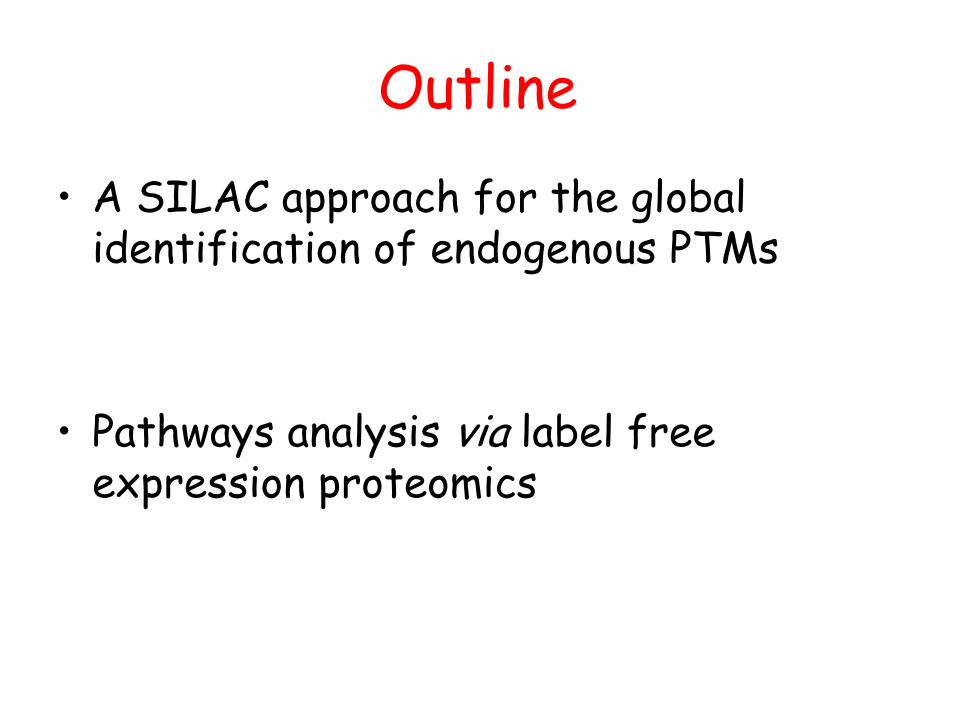
Outline
• A SILAC approach for the global identification of endogenous PTMs
• Pathways analysis via label free expression proteomics
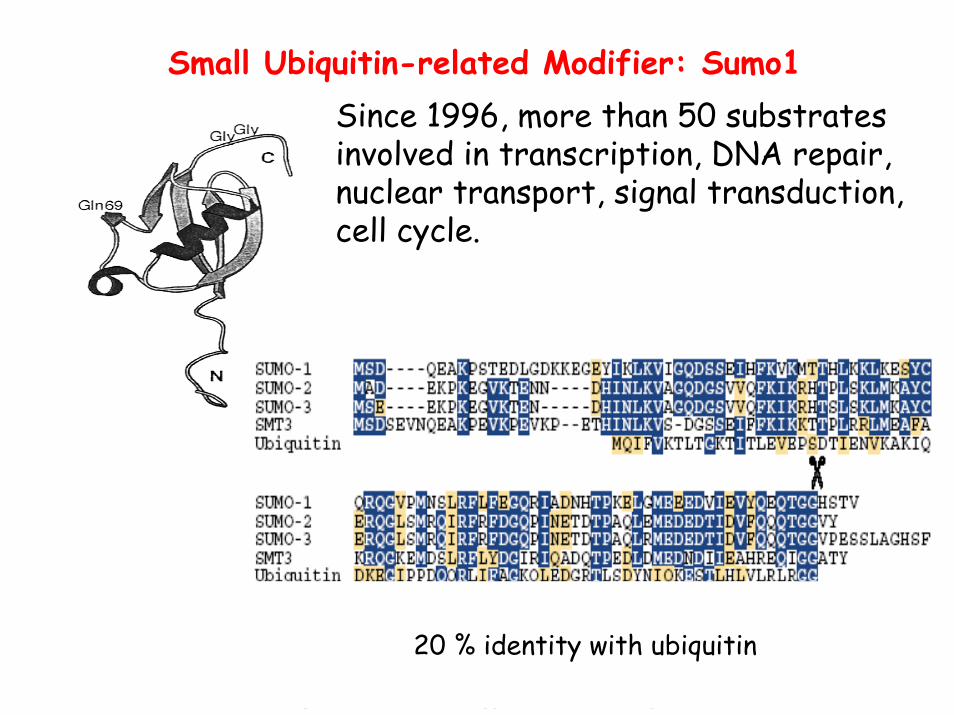
Small Ubiquitin-related Modifier: Sumo1
20 % identity with ubiquitin
Since 1996, more than 50 substrates involved in transcription, DNA repair, nuclear transport, signal transduction, cell cycle.
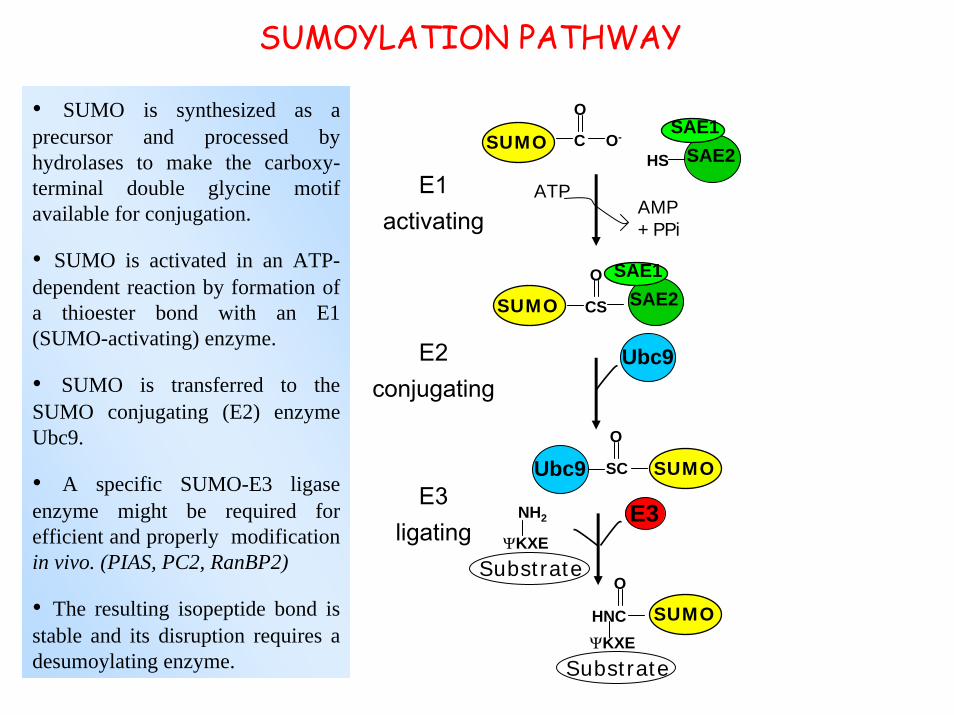
SUMOYLATION PATHWAY
• SUMO is synthesized as aprecursor and processed by hydrolases to make the carboxy-terminal double glycine motif available for conjugation.
• SUMO is activated in an ATP-dependent reaction by formation of a thioester bond with an E1 (SUMO-activating) enzyme.
• SUMO is transferred to the SUMO conjugating (E2) enzymeUbc9.
• A specific SUMO-E3 ligase enzyme might be required for efficient and properly modificationin vivo. (PIAS, PC2, RanBP2)
• The resulting isopeptide bond is stable and its disruption requires adesumoylating enzyme.
SC
O
Ubc9 SUMO
ΨKXESubstrate
HNC
O
SUMO
Ubc9
ATPAMP+PPi
SUMO SAE2SAE1
CS
O
E3ΨKXE
Substrate
NH2
SUMO
O
C O-
SAE2SAE1
HSE1
activating
E2conjugating
E3ligating

Biological functions of SUMO
chromatin structure
Antagonismof ubiquitination
protein/proteininteraction
SUMO
Substrate
Subnuclearlocalization
Nucleus-cytosolshuttling
Transcriptionfactor activity
Cell cycleRegulation
of DNA binding

MS characterization of the endogenously sumoylated proteins by aquantitative approach (SILAC)
SILAC (Stable Isotope Labeling by Amino acids in Cell culture)
[12C614N4-Arg] [13C6
15N4 -Arg]
Non stimulated cells MG132 treatmentStimulate cells6 plates of 8 doubling
1:1 Mix
Lysate in presence of 50mM NEM
Immunoprecipitation of SUMO-1 proteins using anti-SUMO antibody
beads
ProteinG
Anti SUMOIP
+
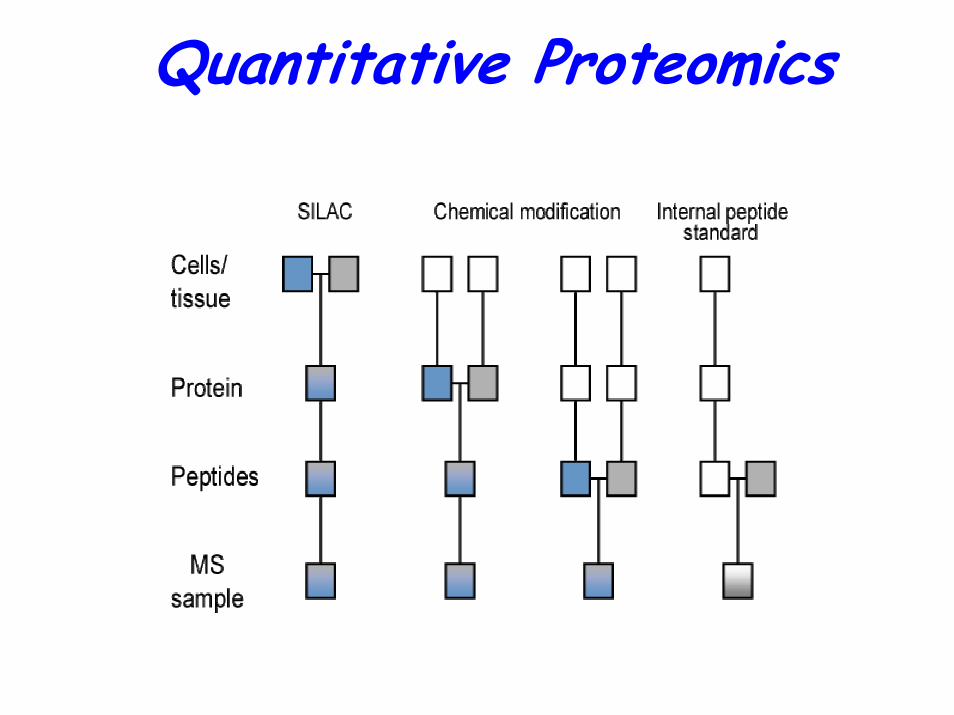
Quantitative Proteomics

SUMO-1 accumulates into nucleoli upon MG132 treatment
DMSO MG1321h
MG132 6h
MG13212h
a b c d
e f g h
i l m n
SUM
O-1
DN
AM
erge
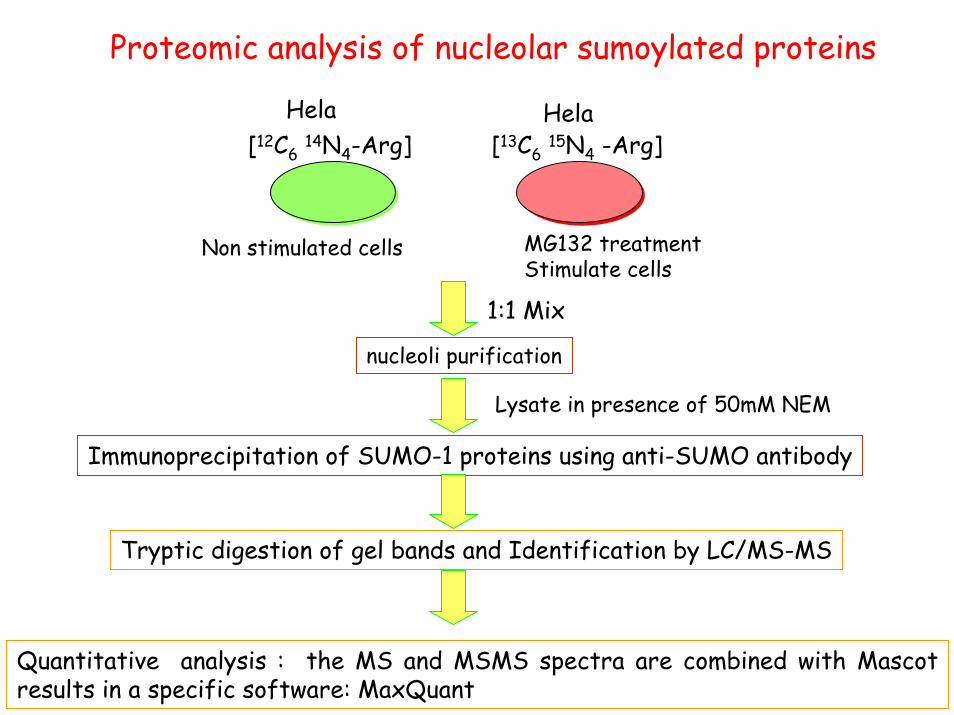
Proteomic analysis of nucleolar sumoylated proteins
Hela Hela[12C6
14N4-Arg] [13C615N4 -Arg]
MG132 treatmentStimulate cells
Non stimulated cells
1:1 Mix
nucleoli purification
Lysate in presence of 50mM NEM
Immunoprecipitation of SUMO-1 proteins using anti-SUMO antibody
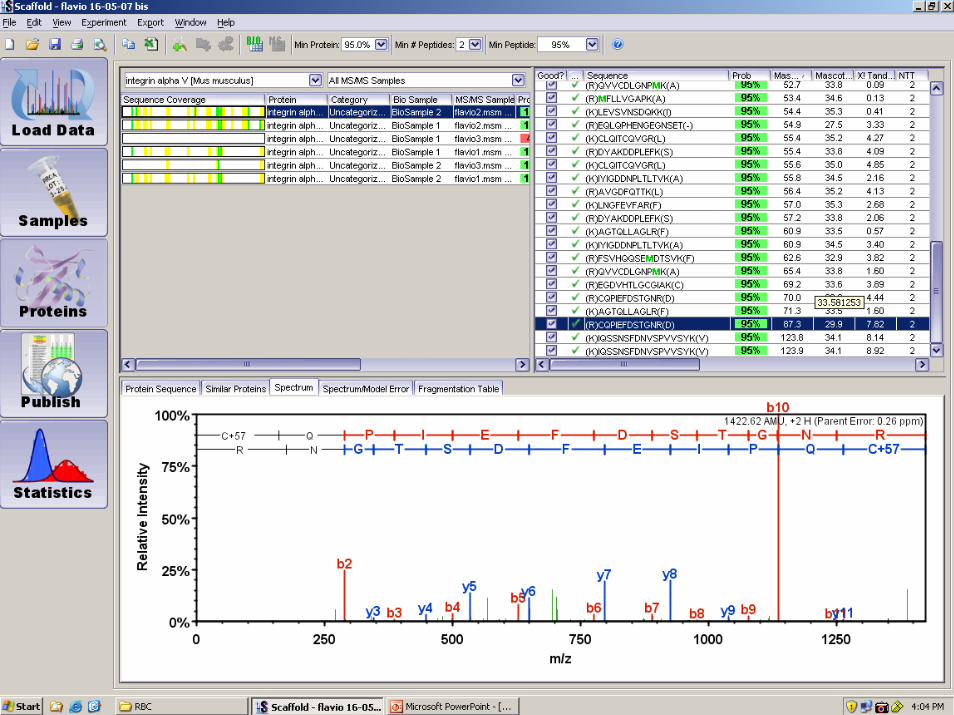
Tryptic digestion of gel bands and Identification by LC/MS-MS
Quantitative analysis : the MS and MSMS spectra are combined with Mascot results in a specific software: MaxQuant

SDS PAGE 10%Colloidal Coomassie
97
66
45
30
A1
B1
C1
D1
E1
F1
G1
H1
I1
L1
28-0
1-09
MW (kDa
)
M1
N1
O1
In gel digestion(Trypsin)
1C:\Xcalibur\data\09Sep\27Sep\AA1_7LM 9/28/2007 1:44:06 PM
RT: 8.95 - 77.50 SM: 7G
10 15 20 25 30 35 40 45 50 55 60 65 70 75Time (min)
0
10
20
30
40
50
60
70
80
90
100
Rel
ativ
e A
bund
ance
17.32
23.4929.43
38.9029.15 34.5626.55 33.50 35.4122.68
24.29 33.3631.64
20.71
16.52
37.6140.5616.27 41.53
15.5844.9310.53 47.19 62.61 70.8349.99 53.35
NL:8.43E4Base Peak F: ITMS + c NSI E d Full ms2 MS AA1_7LM
AA1_7LM #746 RT: 25.55 AV: 1 NL: 1.79E4T: ITMS + c NSI E d Full ms2 [email protected] [175.00-1375.00]
200 300 400 500 600 700 800 900 1000 1100 1200 1300m/z
0
10
20
30
40
50
60
70
80
90
100
Rel
ativ
e Ab
unda
nce
963.2988
805.2812
672.2371
557.1674 876.2897
1116.1715399.0985718.2689486.1531 644.1760 1187.2200
539.1782371.1805300.0984 1003.1432246.2188 1062.3458589.1819440.1023 759.1253945.2876
858.3187215.0024 1227.2920 1300.2496
2
3 Protein identity
nLC-MS/MS

AutomationAutomationMass Scans Acquire:
• 1 high resolution scan for accurate mass on precursor ion and • 5 low resolution scans for MS/MS sequence information.
Add Mass to Exclusion List
Perform MS/MS with
Check Exclusion List
Select nth Most Abundant Ion
Full Scan MSMono isotopic accurate mass information of
peptides
Sequence informationof peptides
DataBase
Search
Parallel detection allows total cycle time of 1.0 sec.
1 sec
5 x 0.1 secin parallel
5 times
dta file

Requirements for large sets of protein ID data
• How often was the experiment repeated• Technical info on how data was created • Search parameters are adequately representing MS platform
• orbitrap-FT: 5 ppm precursor, 0.5 Da fragments• qTOF: 100 ppm precursor, 200 ppm fragments• Trap: 0.8 Da precursor, 0.8 Da fragments• Few variable modifications (ox M)
• Results based on MS/MS of tryptic peptides– Semi-tryptic peptides only allowed for most prominent fragmentation
pathway– Two or more independent tryptic peptides support ID– Alternatively multiple ID of the same peptide– ID must not rely on a single modified peptide
• Result representation should include– A score that relates to probability– Mass accuracy data– Peptide sequence including flanking amino acids– Count of how often a peptide is represented– Is the peptide match unique ?

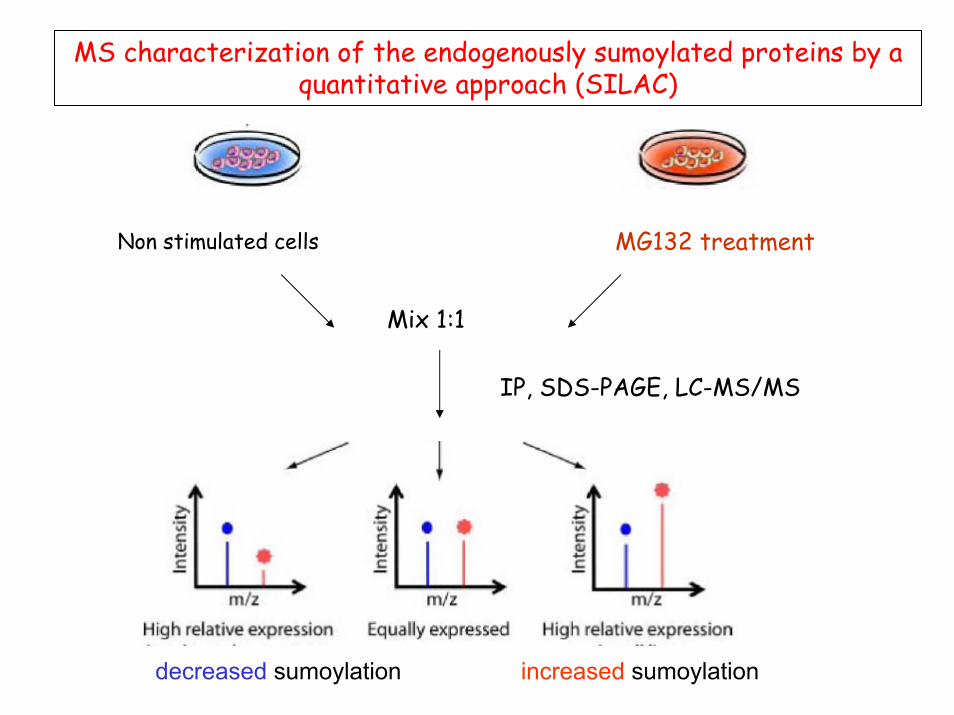
MS characterization of the endogenously sumoylated proteins by aquantitative approach (SILAC)
Non stimulated cells MG132 treatment
Mix 1:1
IP, SDS-PAGE, LC-MS/MS
decreased sumoylation increased sumoylation

Plectin 1 isoform 10 (IPI00398778)
0.98 +- 0.07
R.LTVDEAVR.A K.GLVEDTLR.Q + 13C6-15N4 (R)
ATP-dependent RNA helicase (IPI00215638)
K.LAQFEPSQR.Q + 13C6-15N4 (R)
K.LAQFEPSQR.Q
0.70 +- 0.08

Putative sumoylated proteinsEntry Name ID MW (Da) Score Matched
peptides12C/13C+- S.D.
SUMO prediction sites
Subcellular localization
IPI00007928 Pre-mrna-processing-splicing Factor 8
273600 117 6 (2) 0.76+- 0.05
IKVE 0.94IKTE 0.94
Nucleolus
Cytosol
Cytosol
Nucleolus
Cytosol
Nucleolus
Nucleolus
Nucleus
Nucleolus
Nucleus
Nucleus
IPI00015953 Nucleolar RNA helicase 2 80121 454 15 (3) 0.62+-0.03
IKQD 0.94MKKE 0.80
Nucleolus
IPI00302592 Filamin A, Alpha. 280018 1850 50 (14) 0.82+- 0.07
VKAE 0.93VKVE 0.93
IPI00019502 Myosin-9. 227799 1798 53 (18) 0.82+- 0.13
VKND 0.93LKTD 0.91
IPI00420014 U5 Small Nuclear Ribonucleoprotein 200 Kda Helicase.
246032 337 12 (4) 0.75+- 0.09
VKLD 0.93VKYD 0.93
IPI00333015 Beta-spectrin 2 Isoform 2. 251948 365 13 (6) 0.87 +- 0.11
IKAE 0.94IKNE 0.94
IPI00005024 Myb-binding protein 1A 149731 1230 41 (12) 0.74+- 0.11
VKKD 0.93LKAD 0.91
IPI00215638 ATP-dependent RNA helicase A
142103 1250 39 (17) 0.79+- 0.08
IKSE 0.94LKNE 0.91
IPI00140420 EBNA-2 co-activator variant(Fragment)
108222 141 5 (2) 0.83+-0.01
IKCP 0.84IKNG 0.77
IPI00017451 Splicing factor 3 subunit 1 88888 70 4 (1) 1.03 LKKE 0.91LKTE 0.91
IPI00017297 Matrin-3 94921 137 5 (2) 0.81+-0.01
IKNE 0.94VKVD 0.93
IPI00449049 Poly-ADP ribose polymerase1
113680 393 11 (3) 0.87+- 0.02
IKDE 0.94VKAE 0.93
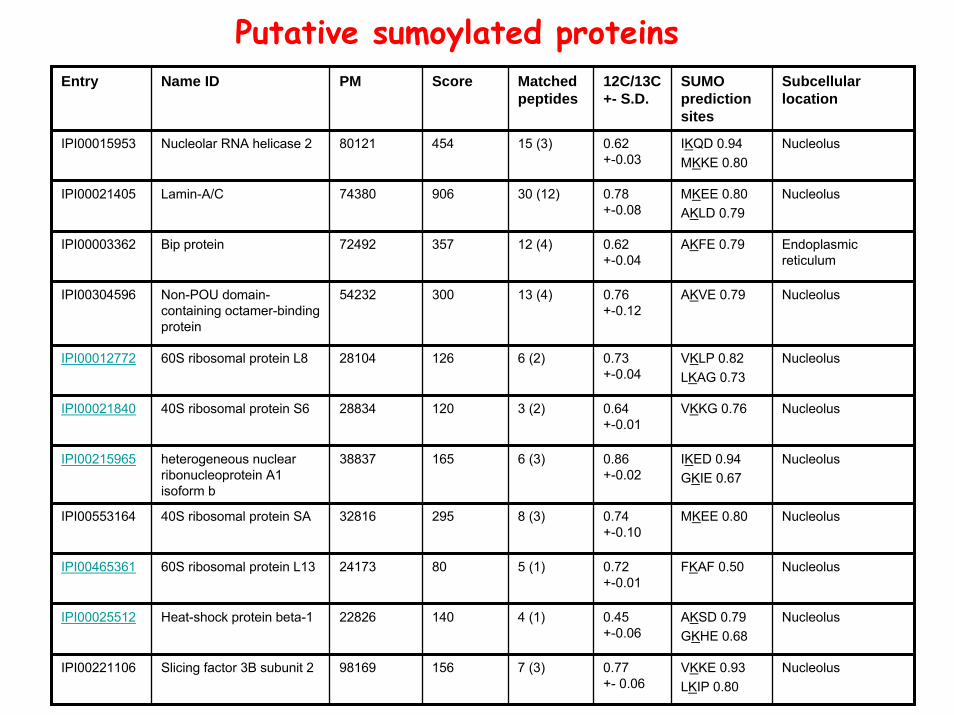
Putative sumoylated proteinsEntry Name ID PM Score Matched
peptides12C/13C+- S.D.
SUMO prediction sites
Subcellular location
IPI00015953 Nucleolar RNA helicase 2 80121 454 15 (3) 0.62+-0.03
IKQD 0.94MKKE 0.80
MKEE 0.80AKLD 0.79
AKFE 0.79
AKVE 0.79
VKLP 0.82LKAG 0.73
VKKG 0.76
IKED 0.94GKIE 0.67
MKEE 0.80
FKAF 0.50
AKSD 0.79GKHE 0.68
IPI00221106 Slicing factor 3B subunit 2 98169 156 7 (3) 0.77+- 0.06
VKKE 0.93LKIP 0.80
Nucleolus
IPI00021405 Lamin-A/C 74380 906 30 (12) 0.78+-0.08
Nucleolus
Nucleolus
Endoplasmic reticulum
Nucleolus
Nucleolus
Nucleolus
Nucleolus
Nucleolus
Nucleolus
IPI00003362 Bip protein 72492 357 12 (4) 0.62+-0.04
IPI00012772 60S ribosomal protein L8 28104 126 6 (2) 0.73+-0.04
IPI00021840 40S ribosomal protein S6 28834 120 3 (2) 0.64+-0.01
IPI00215965 heterogeneous nuclear ribonucleoprotein A1isoform b
38837 165 6 (3) 0.86+-0.02
IPI00553164 40S ribosomal protein SA 32816 295 8 (3) 0.74+-0.10
IPI00465361 60S ribosomal protein L13 24173 80 5 (1) 0.72+-0.01
IPI00025512 Heat-shock protein beta-1 22826 140 4 (1) 0.45+-0.06
Nucleolus
IPI00304596 Non-POU domain-containing octamer-binding protein
54232 300 13 (4) 0.76+-0.12
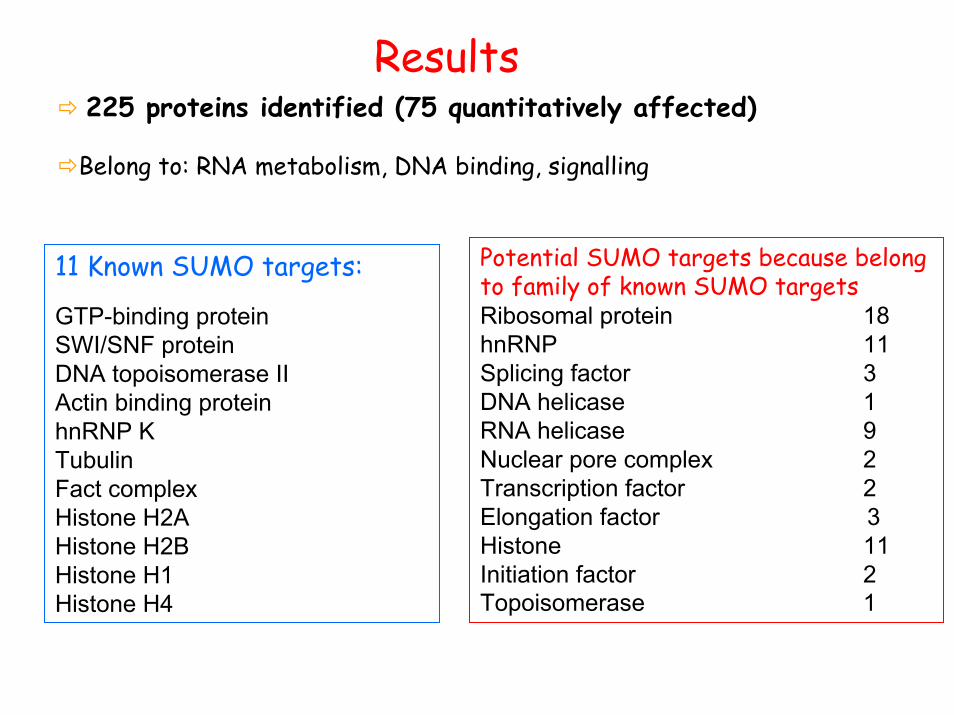
Results225 proteins identified (75 quantitatively affected)
Belong to: RNA metabolism, DNA binding, signalling
Potential SUMO targets because belong to family of known SUMO targetsRibosomal protein 18hnRNP 11Splicing factor 3DNA helicase 1RNA helicase 9Nuclear pore complex 2Transcription factor 2Elongation factor 3Histone 11Initiation factor 2Topoisomerase 1
11 Known SUMO targets:
GTP-binding proteinSWI/SNF proteinDNA topoisomerase IIActin binding proteinhnRNP KTubulinFact complexHistone H2AHistone H2BHistone H1Histone H4
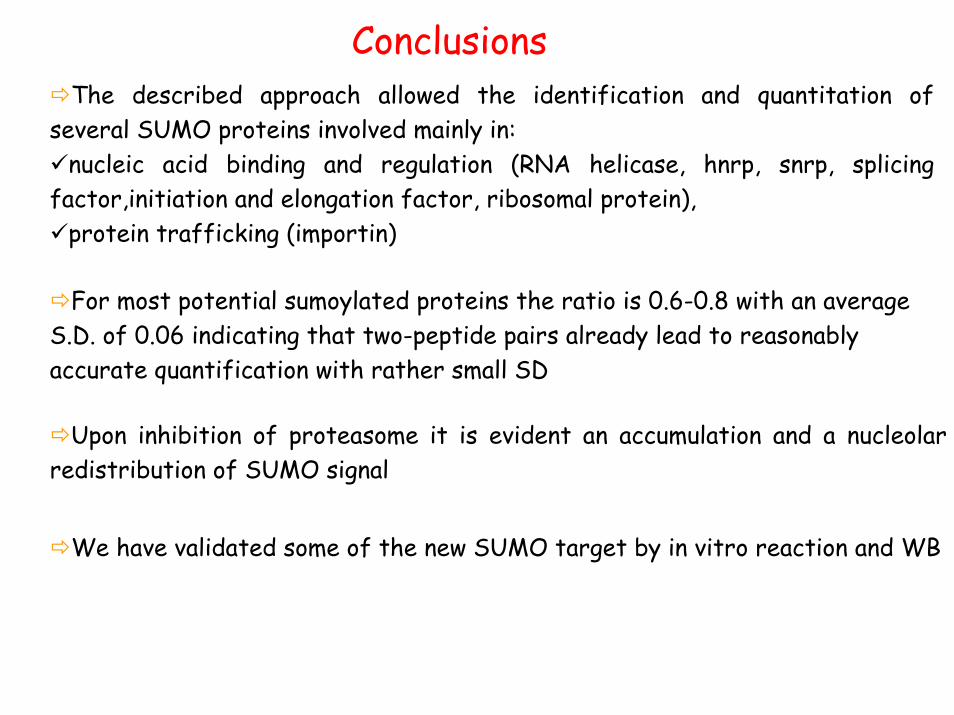
ConclusionsThe described approach allowed the identification and quantitation of
several SUMO proteins involved mainly in:nucleic acid binding and regulation (RNA helicase, hnrp, snrp, splicing
factor,initiation and elongation factor, ribosomal protein), protein trafficking (importin)
For most potential sumoylated proteins the ratio is 0.6-0.8 with an average S.D. of 0.06 indicating that two-peptide pairs already lead to reasonably accurate quantification with rather small SD
Upon inhibition of proteasome it is evident an accumulation and a nucleolar redistribution of SUMO signal
We have validated some of the new SUMO target by in vitro reaction and WB
Pathways analysis in proteomics
the input is the expression proteomics data and the
output is the list of activated or dominant pathways in a given sample

Aim- To generate non-trivial functional hypotheses on
biological systems
- To define disease biomarker among pathways or pathway patterns instead of single molecules
- To rationalize how molecules interact in ‘molecular pathways’, i.e. chains of chemical reactions or physical interactions in which the product of one reaction becomes the reactant of the other.
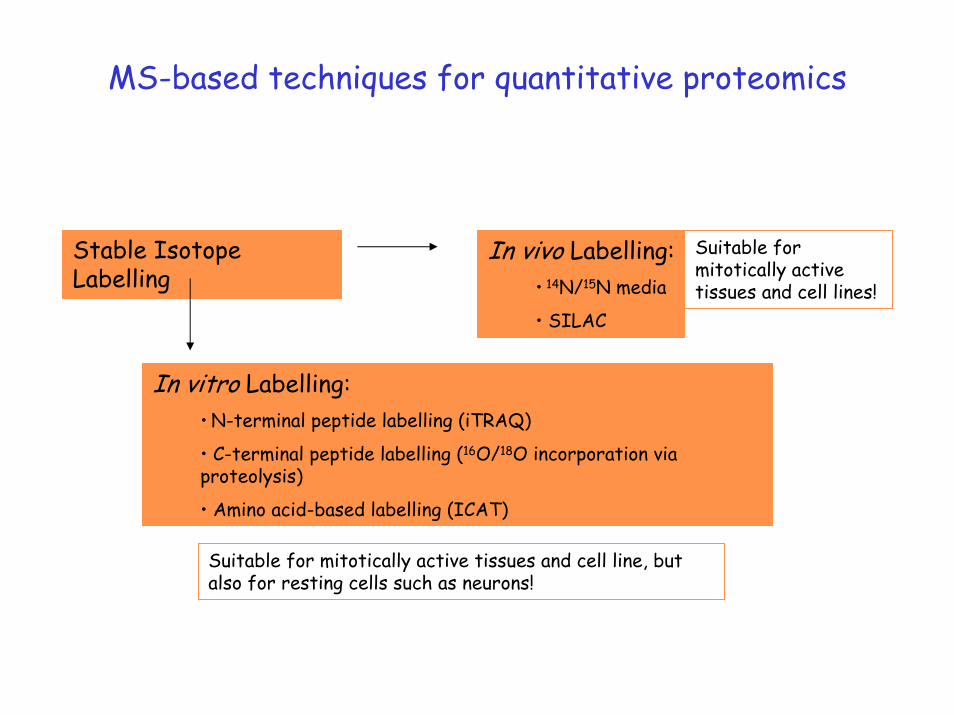
MS-based techniques for quantitative proteomics
Stable Isotope Labelling
In vivo Labelling:• 14N/15N media
• SILAC
Suitable for mitotically active tissues and cell lines!
In vitro Labelling:• N-terminal peptide labelling (iTRAQ)
• C-terminal peptide labelling (16O/18O incorporation via proteolysis)
• Amino acid-based labelling (ICAT)
Suitable for mitotically active tissues and cell line, but also for resting cells such as neurons!

label-free quantitation
• mass spectrometry based approach
• less time consuming
• less sample consuming, if coupled to gel-free proteomic experiments
Advantages:
• no need for labelled amino acids
• can be applied to non-proliferating cells
Limitations:
• relatively new technique
• might not be as accurate as SILAC
Quantitation taking into account protein relative abundances:
• peptide score summation
• number of peptides identifying a protein
• use of a pseudo-internal standard
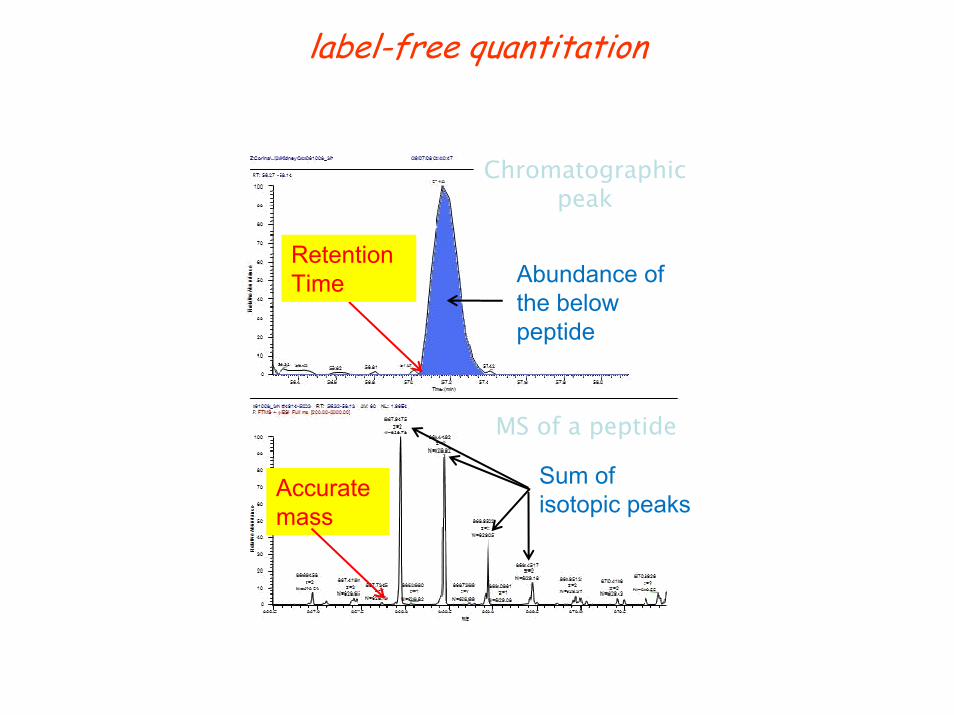
label-free quantitation
Abundance of the below peptide
MS of a peptide
Sum of isotopic peaks
RetentionTime
Accurate mass
Chromatographic peak

Differential Analysis of Promonocytic U937 “Plus”And “Minus” Cell Clones
Promonocytic U937 cell line is used as in vitro model of HIVinfection.
Two different clones of U937 have been described and defined as “Plus” and “Minus” in respect of their efficiency or inefficiency to support productive HIV-1 infection.
Aim of this study was to investigate the whole proteome of Plus (10) and Minus(34) clones in order to detect potential quali/quantitative differences at the protein expression level to unravel protein correlates of efficient/inefficient HIV replication.

Known differences at morphological, proliferative and molecular levels
Expression of common and differential myelomonocytic Ag in U937 Plus and
Minus cell clones
Cellular factors differentially expressed by Plus and Minus
U937 cell clones
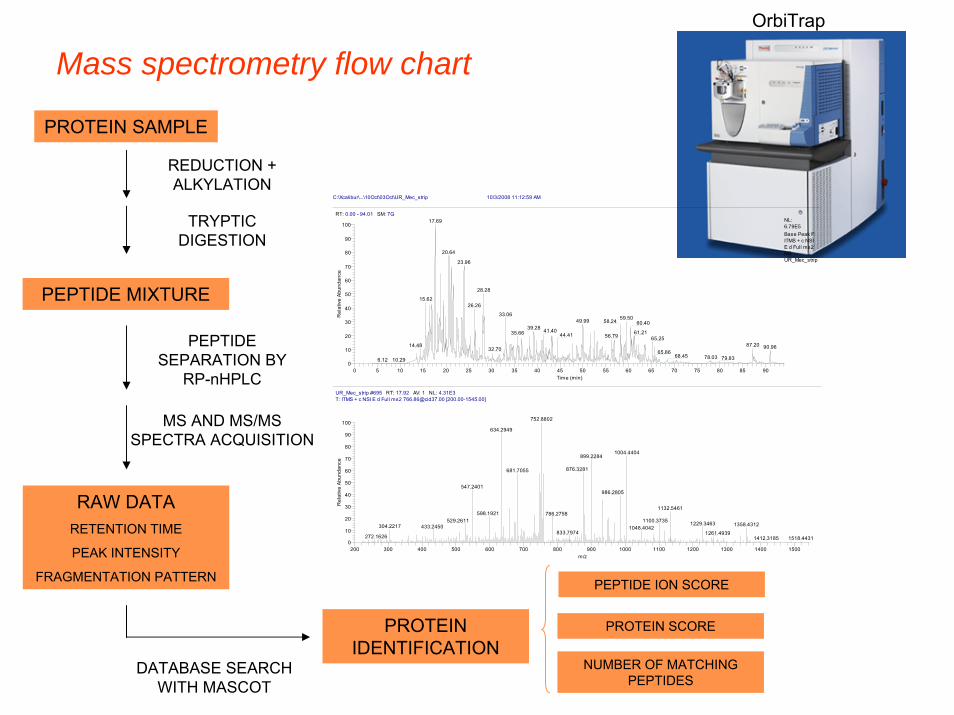
Mass spectrometry flow chart
PROTEIN SAMPLE
REDUCTION + ALKYLATION
TRYPTIC DIGESTION
PEPTIDE MIXTURE
PEPTIDE SEPARATION BY
RP-nHPLC
MS AND MS/MS SPECTRA ACQUISITION
RAW DATA RETENTION TIME
PEAK INTENSITY
FRAGMENTATION PATTERN
DATABASE SEARCH WITH MASCOT
PROTEIN IDENTIFICATION
PEPTIDE ION SCORE
PROTEIN SCORE
NUMBER OF MATCHING PEPTIDES
C:\Xcalibur\...\10Oct\03Oct\UR_Mec_strip 10/3/2008 11:12:59 AM
RT: 0.00 - 94.01 SM: 7G
0 5 10 15 20 25 30 35 40 45 50 55 60 65 70 75 80 85 90Time (min)
0
10
20
30
40
50
60
70
80
90
100
Rel
ativ
e A
bund
ance
17.69
20.64
23.96
28.28
15.6226.26
33.0659.5049.99 58.24 60.40
39.28 41.40 61.2135.66 44.41 56.79 65.2587.2014.48 90.9632.70 65.86
68.45 78.03 79.8310.296.12
NL:6.79E5Base Peak F: ITMS + c NSI E d Full ms2 MS UR_Mec_strip
UR_Mec_strip #695 RT: 17.92 AV: 1 NL: 4.31E3T: ITMS + c NSI E d Full ms2 [email protected] [200.00-1545.00]
200 300 400 500 600 700 800 900 1000 1100 1200 1300 1400 1500m/z
0
10
20
30
40
50
60
70
80
90
100
Rel
ativ
e A
bund
ance
752.8802
634.2949
1004.4404899.2284
876.3281681.7055
547.2401986.2805
1132.5461598.1921 786.2758
1100.3735529.2611 1229.3463 1358.4312304.2217 433.2450 1048.4042833.7974 1261.4939
272.1626 1518.44311412.3185
OrbiTrap
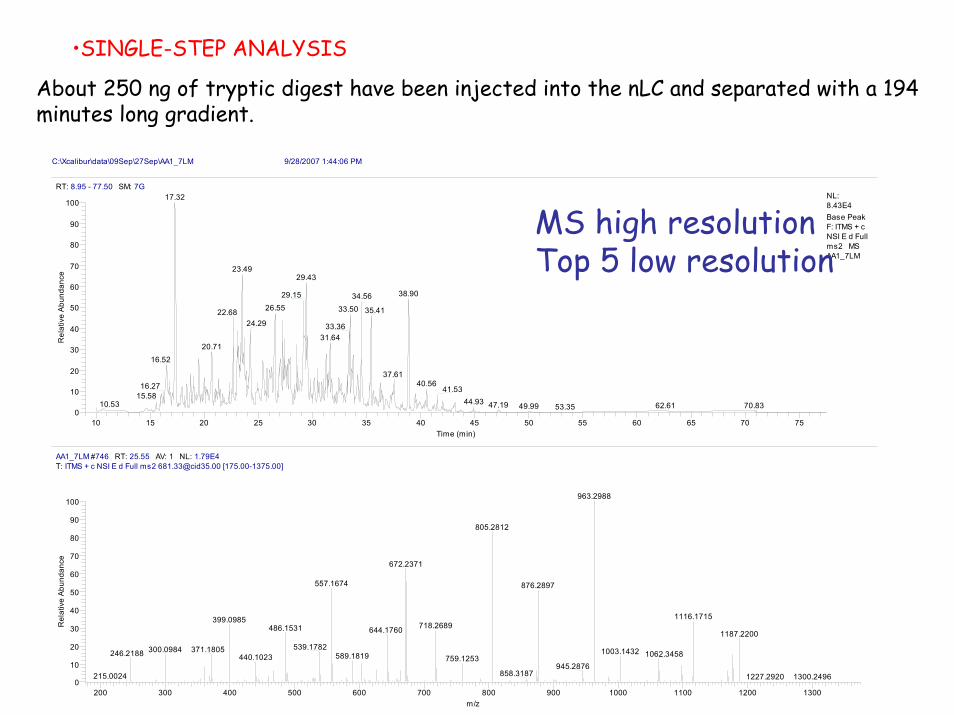
•SINGLE-STEP ANALYSIS
About 250 ng of tryptic digest have been injected into the nLC and separated with a 194 minutes long gradient.
C:\Xcalibur\data\09Sep\27Sep\AA1_7LM 9/28/2007 1:44:06 PM
RT: 8.95 - 77.50 SM: 7G
10 15 20 25 30 35 40 45 50 55 60 65 70 75Time (min)
0
10
20
30
40
50
60
70
80
90
100
Rel
ativ
e Ab
unda
nce
17.32
23.4929.43
38.9029.15 34.5626.55 33.50 35.4122.68
24.29 33.3631.64
20.71
16.52
37.6140.5616.27 41.53
15.5844.9310.53 47.19 62.61 70.8349.99 53.35
NL:8.43E4Base Peak F: ITMS + c NSI E d Full ms2 MS AA1_7LM
AA1_7LM #746 RT: 25.55 AV: 1 NL: 1.79E4T: ITMS + c NSI E d Full ms2 [email protected] [175.00-1375.00]
200 300 400 500 600 700 800 900 1000 1100 1200 1300m/z
0
10
20
30
40
50
60
70
80
90
100
Rel
ativ
e A
bund
ance
963.2988
805.2812
672.2371
557.1674 876.2897
1116.1715399.0985718.2689486.1531 644.1760 1187.2200
539.1782371.1805300.0984 1003.1432246.2188 1062.3458589.1819440.1023 759.1253945.2876
858.3187215.0024 1227.2920 1300.2496
MS high resolutionTop 5 low resolution

•SINGLE-STEP ANALYSIS
About 250 ng of tryptic digest have been injected into the nLC and separated with a 180 minutes long gradient.
Mass spectra have been acquired twice with two partially overlapping mass ranges:
•300-900 low mass
•750-1600 high mass
U937_10 U937_10bis U937_34 U937_34bis
12415 10689
Number of proteins (bold red and ion score more than 20)
664 733 752 680
1370810510Number of queries
Mass ranges combined. Mascot and X! tandem searches. 5ppm precursor, 0.5 Da for fragments. At least 2 peptides at 95%, protein probability >99%.
more than 700 proteins identified
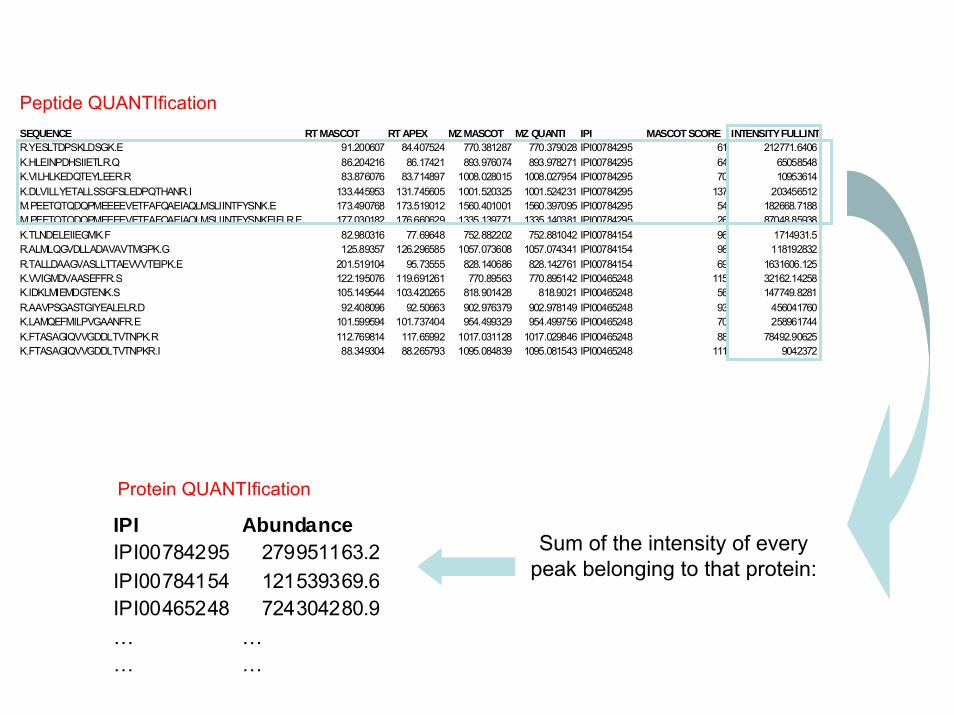
Peptide QUANTIficationSEQUENCE RT MASCOT RT APEX MZ MASCOT MZ QUANTI IPI MASCOT SCORE INTENSITY FULLINTR.YESLTDPSKLDSGK.E 91.200607 84.407524 770.381287 770.379028 IPI00784295 61 212771.6406K.HLEINPDHSIIETLR.Q 86.204216 86.17421 893.976074 893.978271 IPI00784295 64 65058548K.VILHLKEDQTEYLEER.R 83.876076 83.714897 1008.028015 1008.027954 IPI00784295 70 10953614K.DLVILLYETALLSSGFSLEDPQTHANR.I 133.445953 131.745605 1001.520325 1001.524231 IPI00784295 137 203456512M.PEETQTQDQPMEEEEVETFAFQAEIAQLMSLIINTFYSNK.E 173.490768 173.519012 1560.401001 1560.397095 IPI00784295 54 182668.7188M.PEETQTQDQPMEEEEVETFAFQAEIAQLMSLIINTFYSNKEIFLR.E 177.030182 176.660629 1335.139771 1335.140381 IPI00784295 26 87048.85938K.TLNDELEIIEGMK.F 82.980316 77.69648 752.882202 752.881042 IPI00784154 96 1714931.5R.ALMLQGVDLLADAVAVTMGPK.G 125.89357 126.296585 1057.073608 1057.074341 IPI00784154 98 118192832R.TALLDAAGVASLLTTAEVVVTEIPK.E 201.519104 95.73555 828.140686 828.142761 IPI00784154 69 1631606.125K.VVIGMDVAASEFFR.S 122.195076 119.691261 770.89563 770.895142 IPI00465248 115 32162.14258K.IDKLMIEMDGTENK.S 105.149544 103.420265 818.901428 818.9021 IPI00465248 56 147749.8281R.AAVPSGASTGIYEALELR.D 92.408096 92.50663 902.976379 902.978149 IPI00465248 93 456041760K.LAMQEFMILPVGAANFR.E 101.599594 101.737404 954.499329 954.499756 IPI00465248 70 258961744K.FTASAGIQVVGDDLTVTNPK.R 112.769814 117.65992 1017.031128 1017.029846 IPI00465248 88 78492.90625K.FTASAGIQVVGDDLTVTNPKR.I 88.349304 88.265793 1095.084839 1095.081543 IPI00465248 111 9042372
Protein QUANTIfication
IPI AbundanceIPI00784295 279951163.2IPI00784154 121539369.6IPI00465248 724304280.9… …… …
Sum of the intensity of everypeak belonging to that protein:

SINGLE-STEP ANALYSIS
Total lysates in-solution digested: 250 ng of digested proteins separated by LC through very long gradient. Analysis in duplicates.
MS acquired two times, with two different and partially overlapping mass ranges (300-900 and 750-1600).
Mass spectra summed up and submitted to database searching as a whole; MASCOT and X! tandem algorithms for database search.
More than 700 proteins identified and quantitated :
19 unique of clone 10+
47 unique of clone 34-
64 up regulated and 27 down-regulated in 34
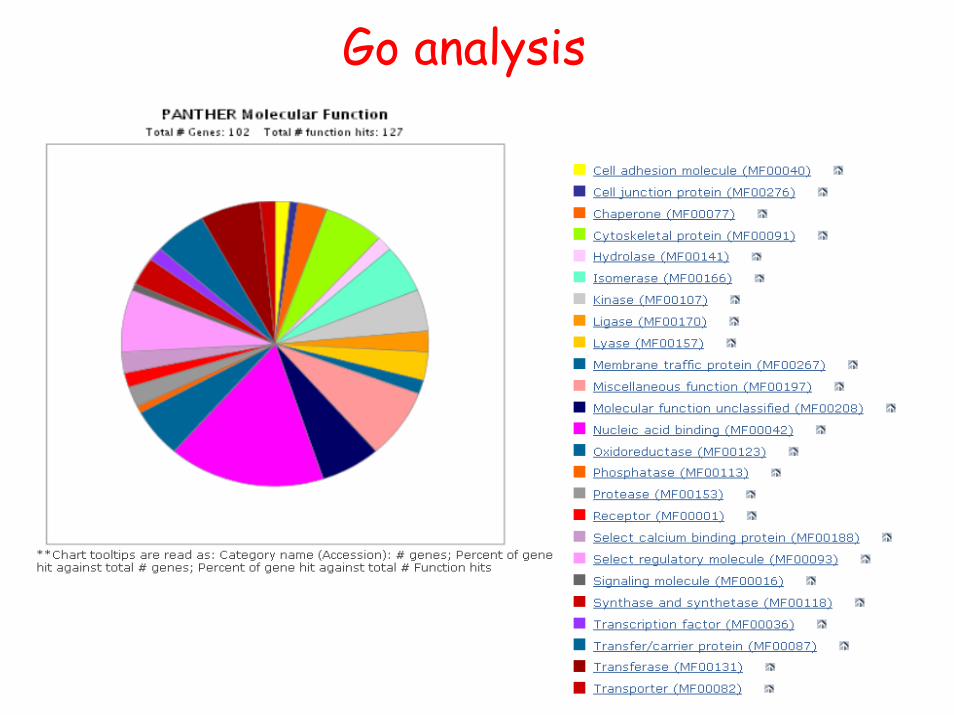
Go analysis

Use of known signalling mechanismsto identify and quantify activated pathways
What do we want:
Detecting events in unbiased way to: Hypothesisgeneration
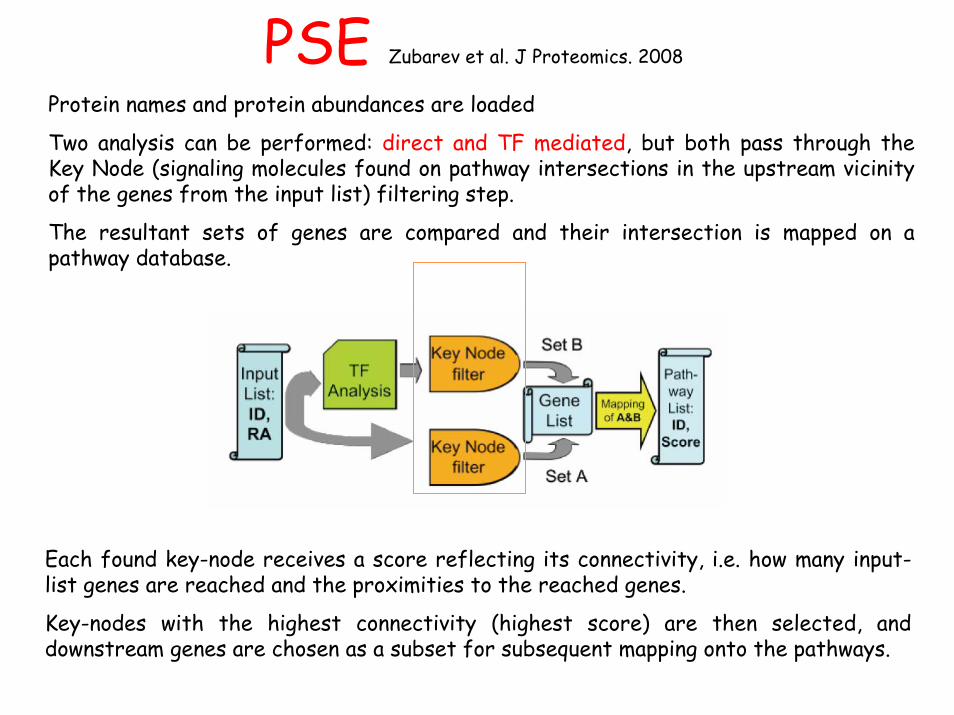
PSE Zubarev et al. J Proteomics. 2008
Protein names and protein abundances are loaded
Two analysis can be performed: direct and TF mediated, but both pass through the Key Node (signaling molecules found on pathway intersections in the upstream vicinity of the genes from the input list) filtering step.
The resultant sets of genes are compared and their intersection is mapped on a pathway database.
Each found key-node receives a score reflecting its connectivity, i.e. how many input-list genes are reached and the proximities to the reached genes.
Key-nodes with the highest connectivity (highest score) are then selected, and downstream genes are chosen as a subset for subsequent mapping onto the pathways.
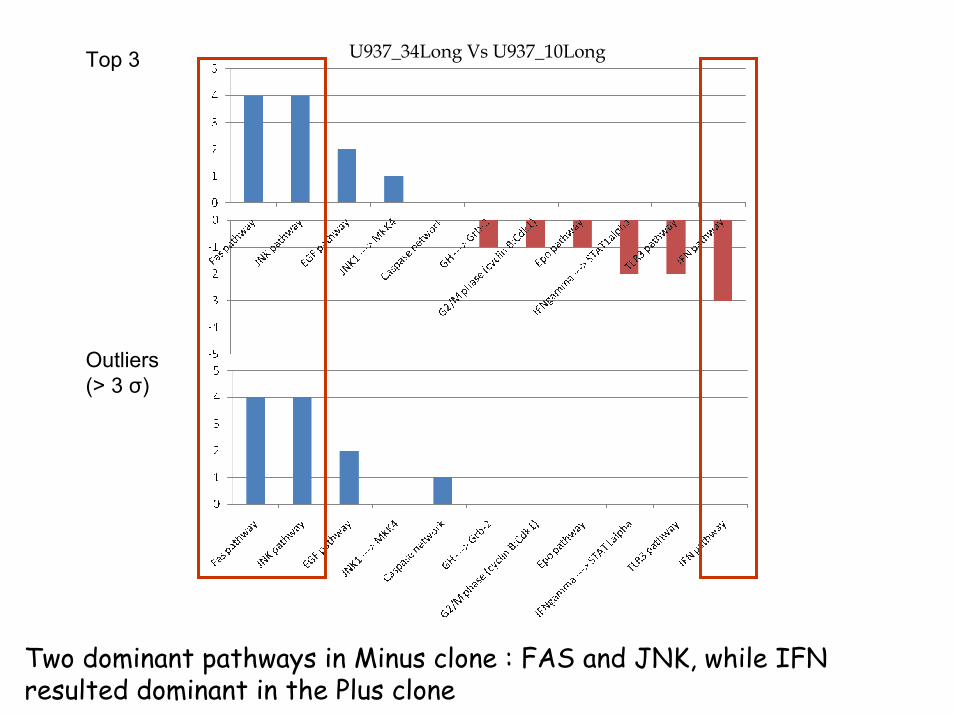
U937_34Long Vs U937_10LongTop 3
Outliers(> 3 σ)
Two dominant pathways in Minus clone : FAS and JNK, while IFN resulted dominant in the Plus clone
RESULTSUp to now, the analysis on the two clones showed differences at a morphological, proliferative and molecular level (such as the expression of surface antigens, proteases, and membrane receptors).
A new dimension has been added by pathways analysis.
..but needs to be validated
Involved pathways:Fas and JNK activated in U937 clone 34IFN upregulated in U937 clone 10
To confirm this hypothesis, different antibodies against elements of these pathways have been used in western blot analysis. In particular: anti-casp3 (cleaved form) (FAS pathway)anti-pJNK (active form) (JNK pathway)anti-CASP8 (FAS pathway)

Testing the hypothesis
#34 #34#10 #10
Fas pathway is activated in clone 34
Anti Caspase-8
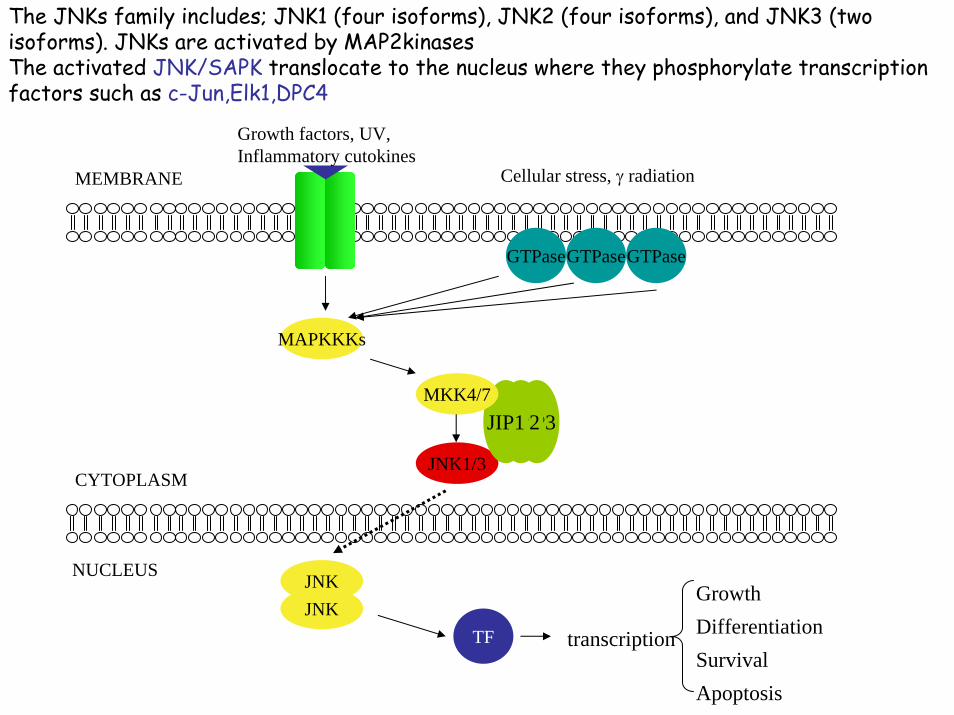
The JNKs family includes; JNK1 (four isoforms), JNK2 (four isoforms), and JNK3 (two isoforms). JNKs are activated by MAP2kinases The activated JNK/SAPK translocate to the nucleus where they phosphorylate transcription factors such as c-Jun,Elk1,DPC4
JIP3JIP2
NUCLEUS
CYTOPLASM
MEMBRANE
MAPKKKs
JNK1/3
JIP1MKK4/7
JNKJNK
GTPaseGTPaseGTPase
Growth factors, UV, Inflammatory cutokines
Cellular stress, γ radiation
TF transcription
GrowthDifferentiationSurvivalApoptosis
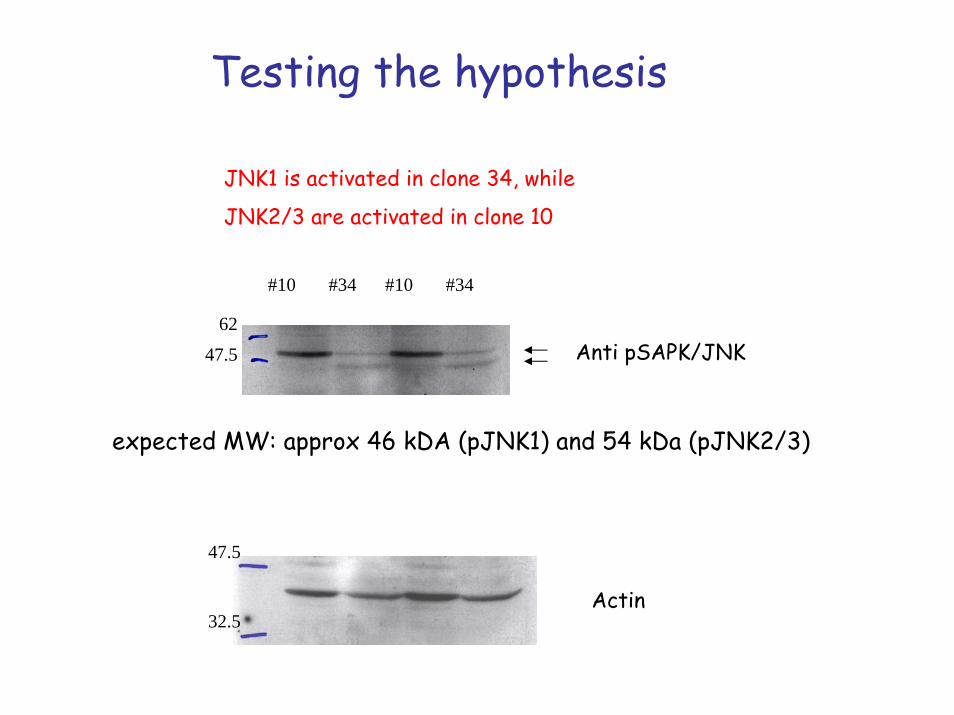
Testing the hypothesis
JNK1 is activated in clone 34, while
JNK2/3 are activated in clone 10
47.5
32.5Actin
62
47.5 Anti pSAPK/JNK
#10#34 #34#10
expected MW: approx 46 kDA (pJNK1) and 54 kDa (pJNK2/3)

Where are we?
We can , in 1 exp. from 1x10⁶ cells, identify and relatively quantitate (1 status vs the other) about 500-1000 proteins.
Pathway Search Engine
Dominant pathwayidentification

Eduardo Salce
Umberto Restuccia
Alfonsina D’Amato
Angela CattaneoVittoria Matafora
Vera Usuelli
Federico Torta