Ambiente, Energia, Sviluppo sostenibile i cambiamenti climatici Galeotti.pdf · Ambiente, Energia,...
54
0 Marzio Galeotti (Università di Milano, FEEM, CMCC, LaVoce.info) Libertà e Giustizia Pavia, 16 Febbraio 2008 Ambiente, Energia, Sviluppo sostenibile i i cambiamenti cambiamenti climatici climatici
Transcript of Ambiente, Energia, Sviluppo sostenibile i cambiamenti climatici Galeotti.pdf · Ambiente, Energia,...

0
Marzio Galeotti(Università di Milano, FEEM, CMCC, LaVoce.info)
Libertà e Giustizia
Pavia, 16 Febbraio 2008
Ambiente, Energia, Sviluppo sostenibile
i i cambiamenticambiamenti climaticiclimatici
1
1.1.
SVILUPPO SOSTENIBILE E SVILUPPO SOSTENIBILE E
CAMBIAMENTI CLIMATICICAMBIAMENTI CLIMATICI

2
Sustainability Guaranteeing “well being” to present generations, equitably distributed among them
and non declining over time
Important: well being on per-capita basis
It is difficult to define well being e.g.:
Many social-cultural components involved in addition to “money”
Upshot: It could be difficult to define sustainable development
Sustainable DevelopmentSustainable Development: A Short Primer
3
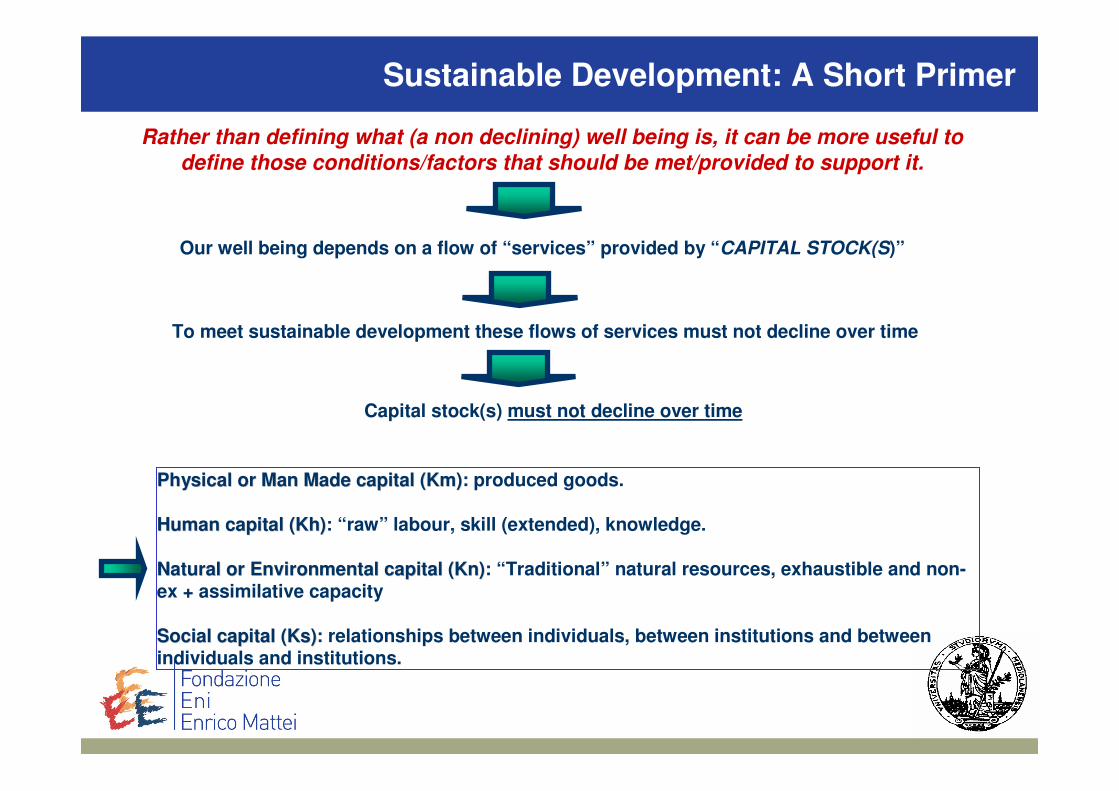
Rather than defining what (a non declining) well being is, it can be more useful to define those conditions/factors that should be met/provided to support it.
Our well being depends on a flow of “services” provided by “CAPITAL STOCK(S)”
To meet sustainable development these flows of services must not decline over time
Capital stock(s) must not decline over time
Sustainable Development: A Short Primer
Physical or Man Made capital (Km)Physical or Man Made capital (Km): produced goods.
Human capital (Human capital (KhKh)): “raw” labour, skill (extended), knowledge.
Natural or Environmental capital (Natural or Environmental capital (KnKn)): “Traditional” natural resources, exhaustible and non-ex + assimilative capacity
Social capital (Ks)Social capital (Ks): relationships between individuals, between institutions and between individuals and institutions.

4
Km
Kh
Kn
Ks
Totalcapitalassets
TK
∆(TK/POP)/∆T ≥ 0
Sustainable Development
TechnologicalTechnological
ChangeChange PopulationPopulation GrowthGrowth
(+) (-)
Sustainable Development
5
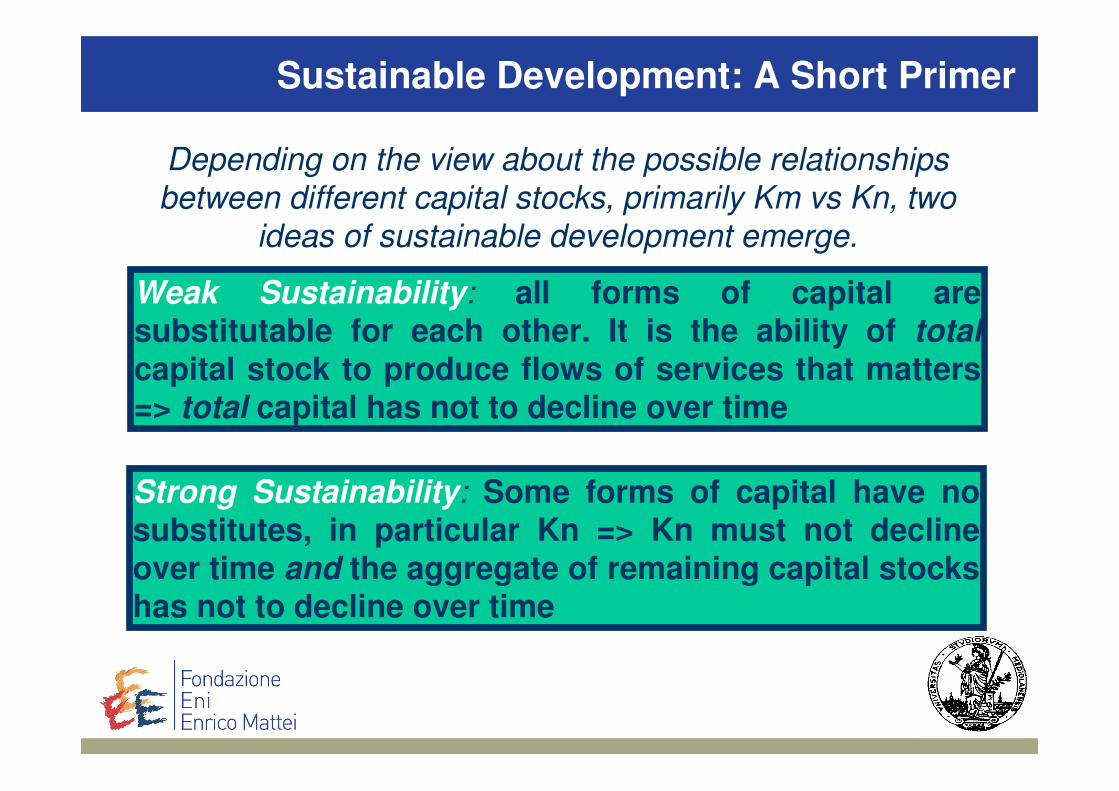
Weak Sustainability: all forms of capital are substitutable for each other. It is the ability of totalcapital stock to produce flows of services that matters => total capital has not to decline over time
Strong Sustainability: Some forms of capital have no substitutes, in particular Kn => Kn must not decline over time and the aggregate of remaining capital stocks has not to decline over time
Depending on the view about the possible relationships
between different capital stocks, primarily Km vs Kn, two
ideas of sustainable development emerge.
Sustainable Development: A Short PrimerSustainable Development: A Short Primer

6
2.2.
CARATTERISTICHE CARATTERISTICHE
DEIDEI
CAMBIAMENTI CLIMATICICAMBIAMENTI CLIMATICI
7
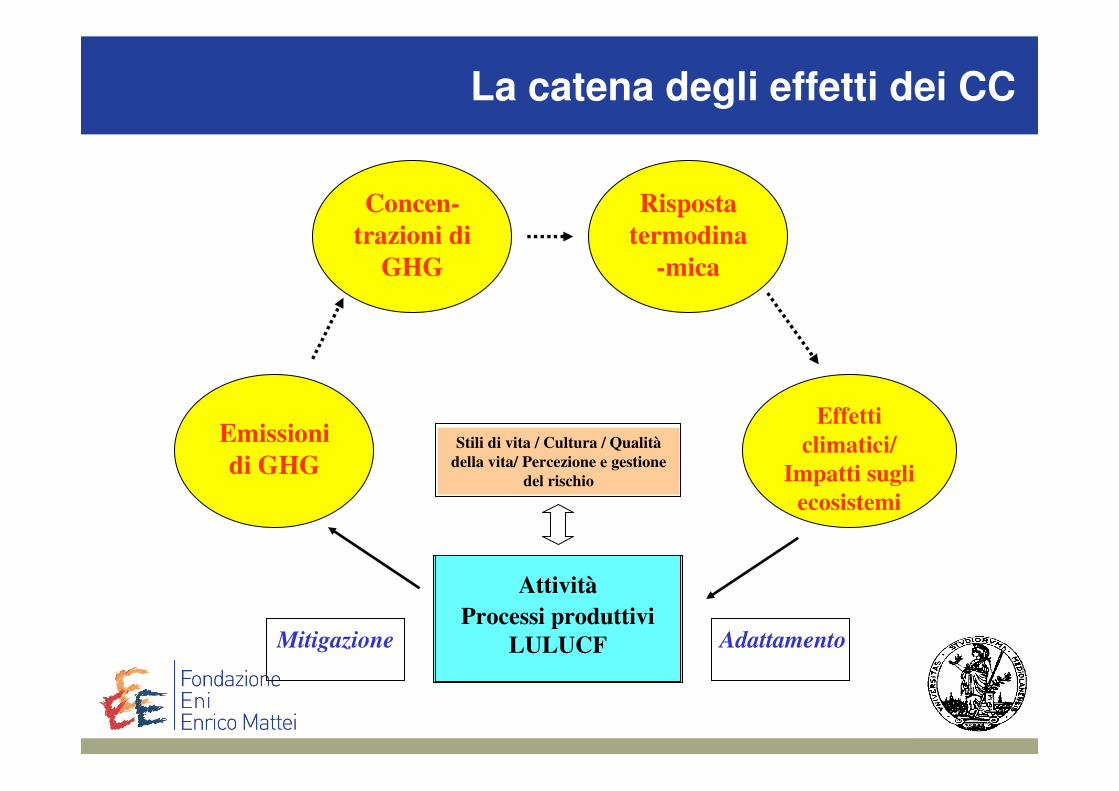
La catena degli effetti dei CC
Concen-
trazioni di
GHG
Risposta
termodina
-mica
Emissioni
di GHG
Effetti
climatici/
Impatti sugli
ecosistemi
Attività
Processi produttivi
LULUCFMitigazione Adattamento
Stili di vita / Cultura / Qualità
della vita/ Percezione e gestione
del rischio
8
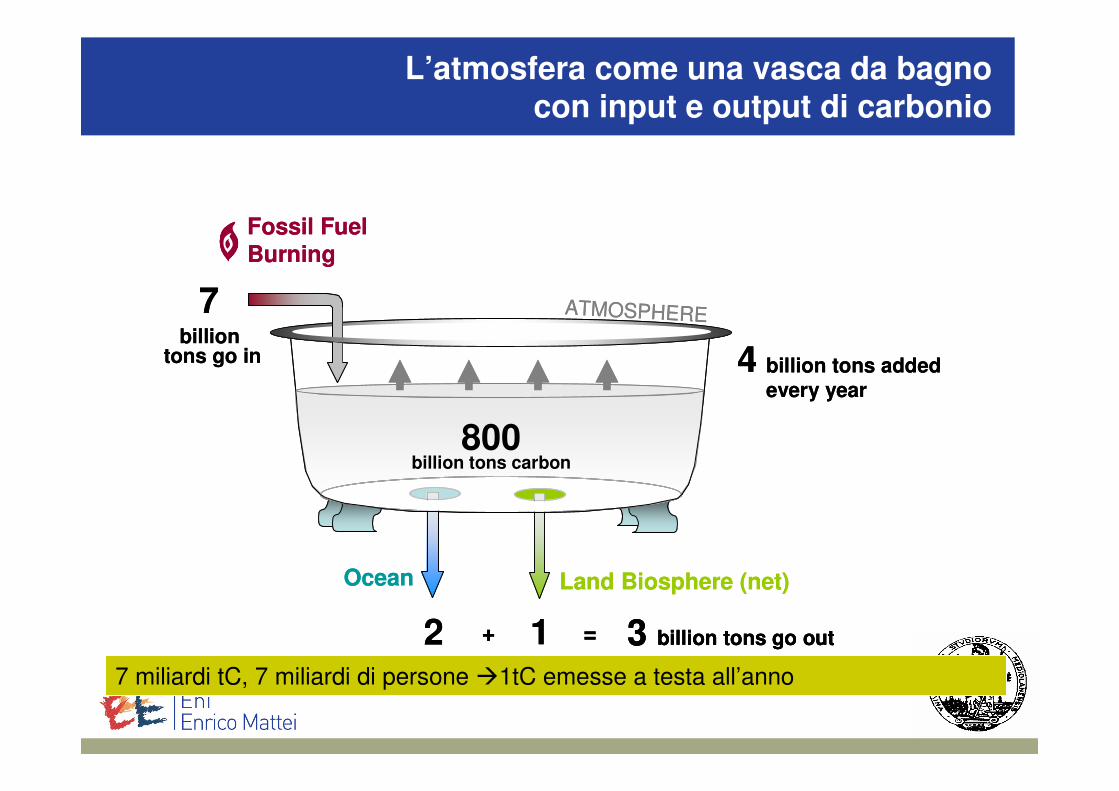
L’atmosfera come una vasca da bagnocon input e output di carbonio
2 1 = 3 billion tons go out
Ocean Land Biosphere (net)
Fossil FuelBurning
+
7
800billion tons carbon
4billion
tons go in
ATMOSPHERE
billion tons added every year
2 1 = 3 billion tons go out3 billion tons go out
Ocean Land Biosphere (net)
Fossil FuelBurning
+
7
800billion tons carbon
4billion
tons go in
ATMOSPHERE
billion tons added every year
7 miliardi tC, 7 miliardi di persone �1tC emesse a testa all’anno

9
CO2Natural + man-madeUse of Fossil fuels +
deforestation5-200 1
CH4Natural + man-made
Livestock +Wetland cultivation (rice)
12 23
N2ONatural + man-made
Coal burning +Fertilisers
114 296
Fluor.ed
CFC
HFC
Man-madeRefrigerants + foam
plastic, elect. comp.
Man-made
Man-made3200 -50000
0.3 -260
45
5700 -22200
12 -12000
GAS OriginAtm.
lifetime GWP
1320 -9300
GCC: Greenhouse Gases
10
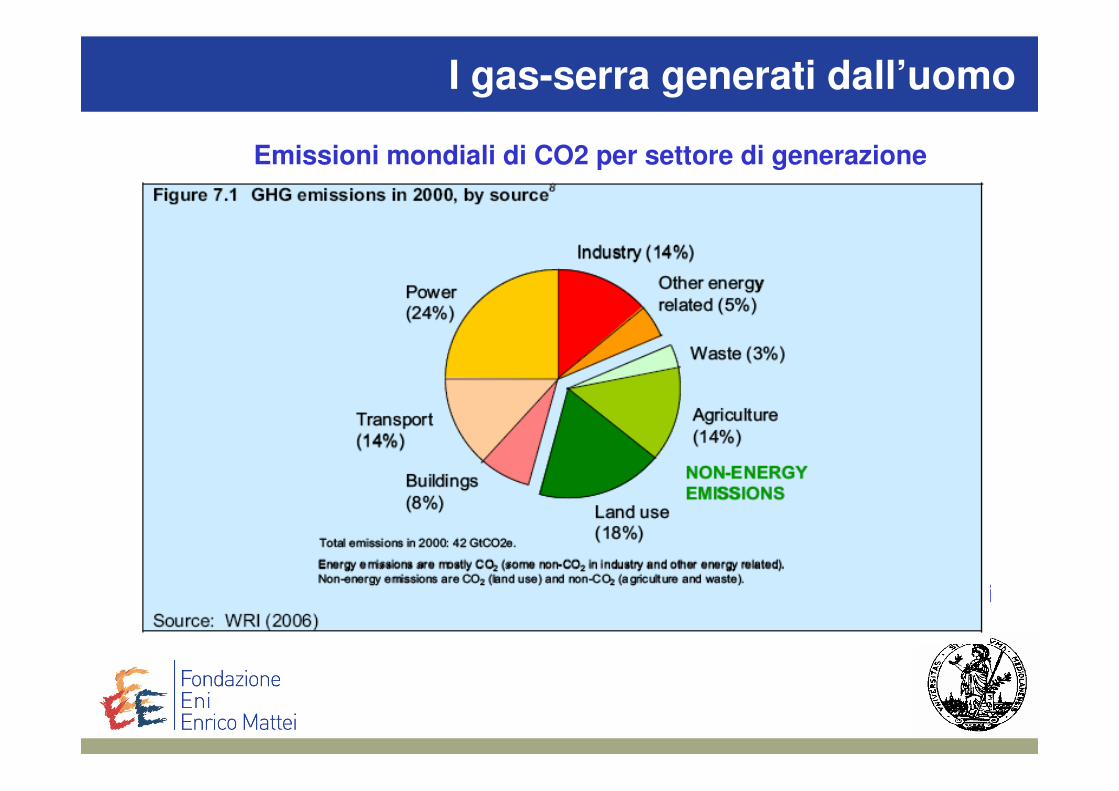
I gas-serra generati dall’uomo
CFCHFC
Fluorinati
Emissioni mondiali di CO2 per settore di generazione

11
Emissioni mondiali di CO2 per fonti fossile di energia
Fonte: OECD/IEA World Energy Outlook 2006
I gas-serra generati dall’uomo
Fonte: IEA World Energy Outlook 2006
12
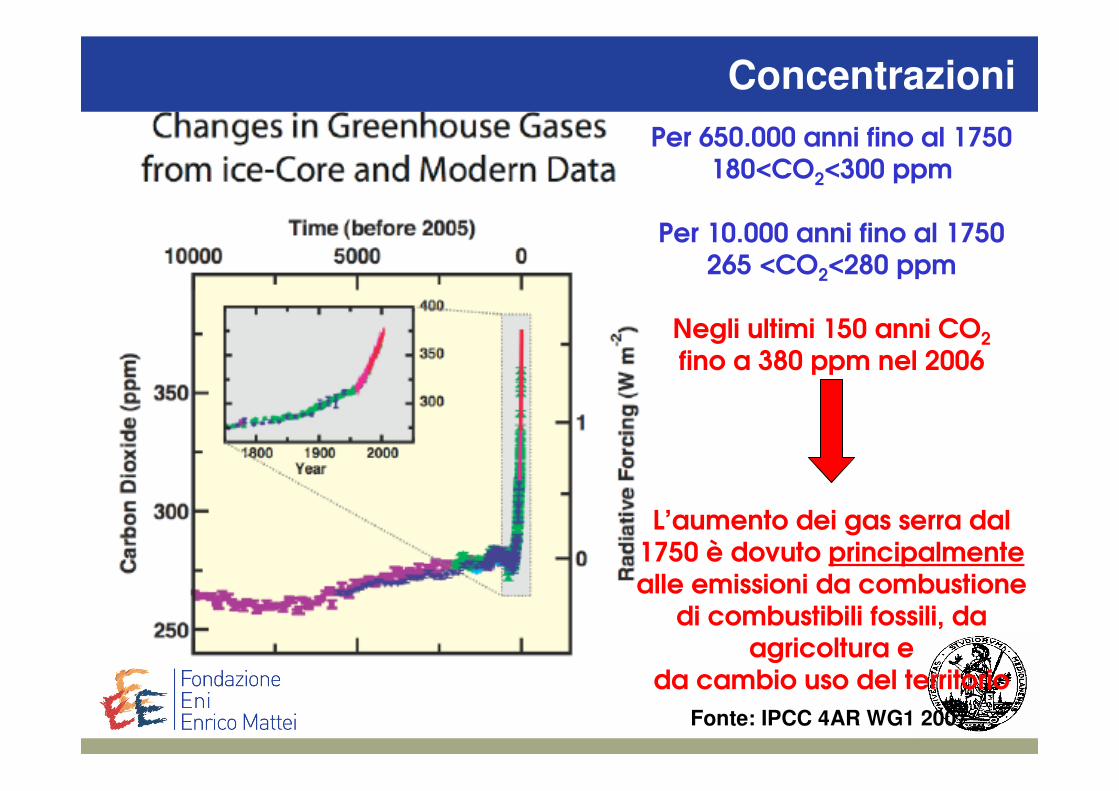
Per 650.000 anni fino al 1750180<CO2<300 ppm
Per 10.000 anni fino al 1750265 <CO2<280 ppm
Negli ultimi 150 anni CO2
fino a 380 ppm nel 2006
L’aumento dei gas serra dal 1750 è dovuto principalmentealle emissioni da combustione
di combustibili fossili, da agricoltura e
da cambio uso del territorio
Fonte: IPCC 4AR WG1 2007
Concentrazioni
13
Fo
nte
: IP
CC
4A
R W
G1
20
07
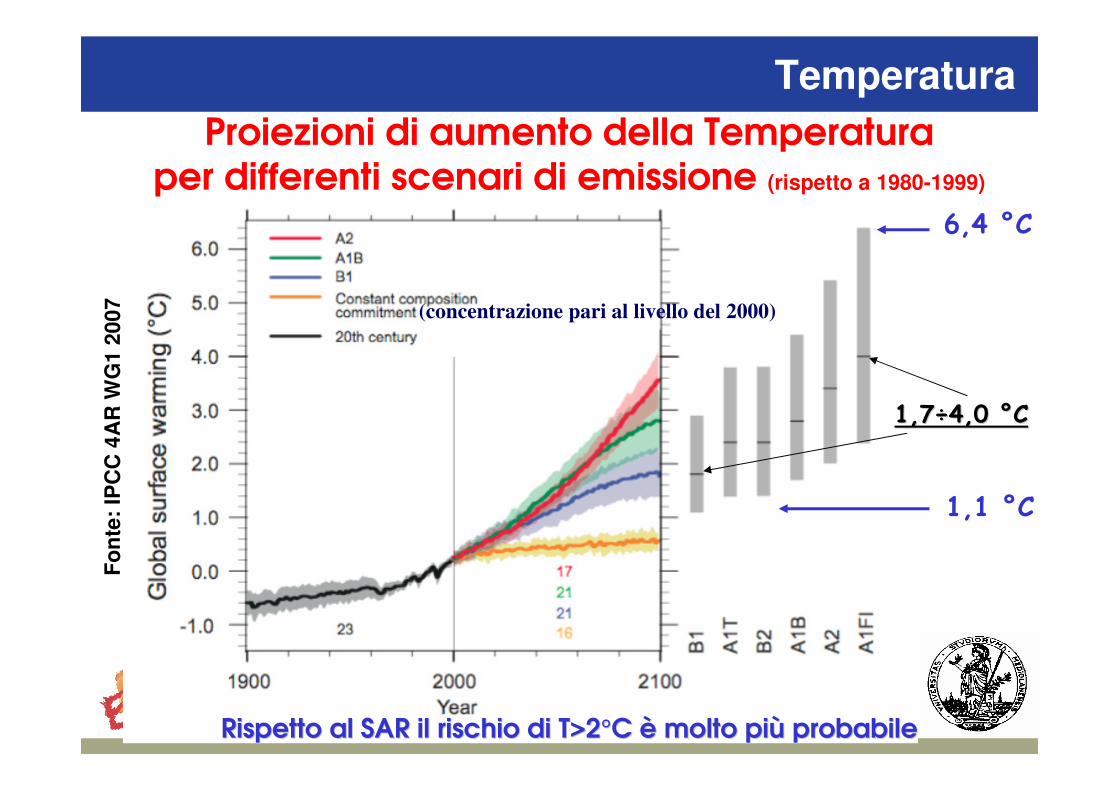
Proiezioni di aumento della Temperaturaper differenti scenari di emissione (rispetto a 1980-1999)
1,1 °C
6,4 °C
(concentrazione pari al livello del 2000)
1,71,7÷÷4,0 4,0 °C°C
Rispetto al SAR il rischio di T>2°C è molto più probabile Rispetto al SAR il rischio di T>2°C è molto più probabile
Temperatura

14
Effetti dei CC: alterazioni del clima
Una selezione di conseguenze sul clima:
� Crescita della temperatura del pianeta (dal 1860 di 0.6°C)
� Crescita di eventi di precipitazione
� Crescita nella frequenza ed intensità di eventiclimatici estremi
� Crescita del rischio di desertificazione
� Riduzione dei ghiacciai
� Innalzamento del livello del mare(ultimi 100 anni: ca. 10-25 cm)

15
Variazioni nella temperatura, precipitazioni e livello dei mari
Agricoltura:
Cambiamenti nella quantità di raccolto, nella domanda di
Irrigazione e nella produttività
Foreste:
Cambiamenti nelle ecologie,
variabilità geografica dellespecie, salute e produttività
Zone costiere:
Erosioni, allagamenti
Inondazioni, mutamentinelle zone paludose
Salute umana:
Mortalità dovuta allecond. meteorologiche
malattie infettive
Qualità dell’aria –malattie respiratorie
Industria ed Energia:
Cambiamenti nelladomanda di energiae nella domanda e offerta di beni
Una classificazione degli impatti
Risorse idriche:
Cambiamenti nell’offerta e nella qualità dell’acqua
Problemi di concorrenza e transfrontalieri
16
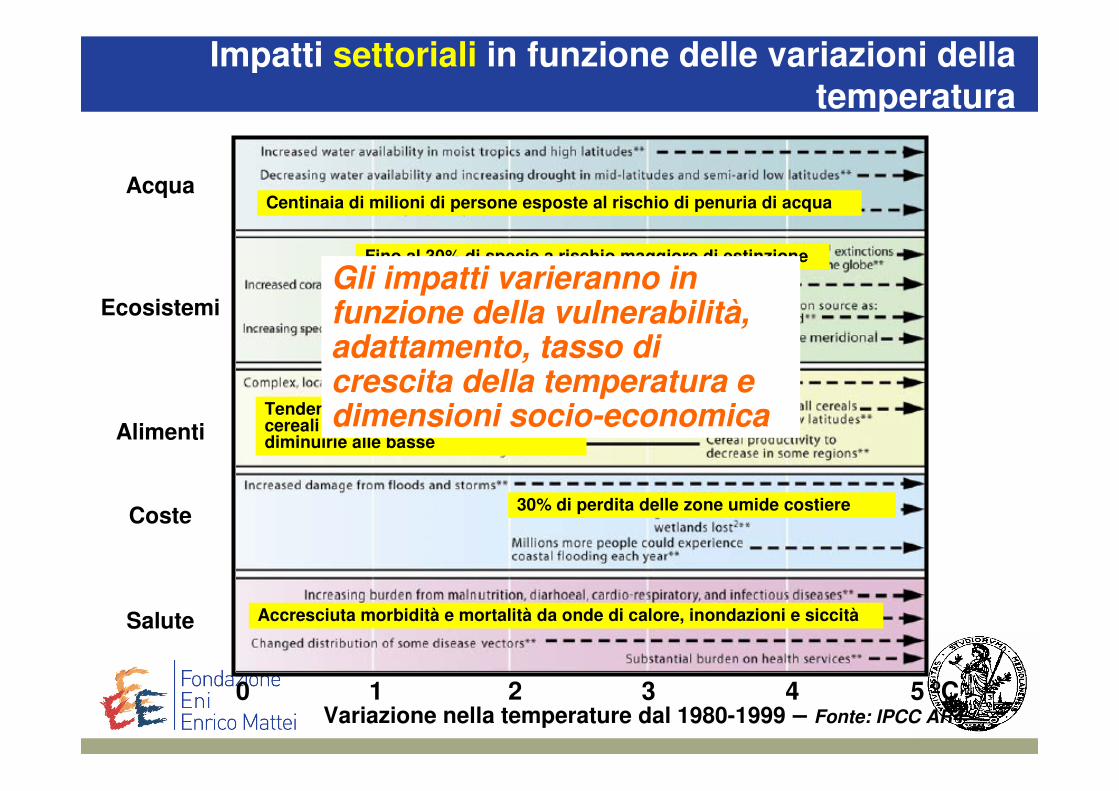
Acqua
Ecosistemi
Alimenti
Coste
Salute
0 1 2 3 4 5 ºCVariazione nella temperature dal 1980-1999 – Fonte: IPCC AR4
30% di perdita delle zone umide costiere
Fino al 30% di specie a rischio maggiore di estinzione
Accresciuta morbidità e mortalità da onde di calore, inondazioni e siccità
Tendenza della produttività deicereali a crescere alle alte latitudini e diminuirie alle basse
Centinaia di milioni di persone esposte al rischio di penuria di acqua
Impatti settoriali in funzione delle variazioni dellatemperatura
Gli impatti varieranno in funzione della vulnerabilità, adattamento, tasso di crescita della temperatura e dimensioni socio-economica
17
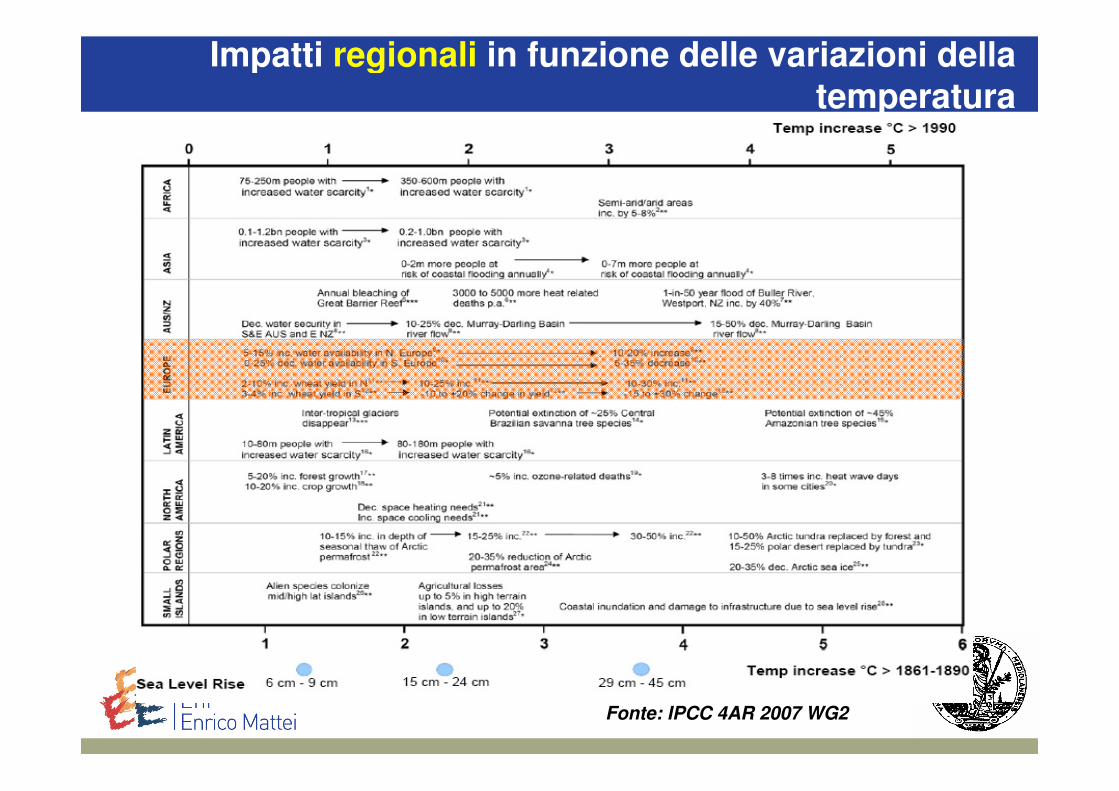
Impatti regionali in funzione delle variazioni dellatemperatura
Fonte: IPCC 4AR 2007 WG2
18
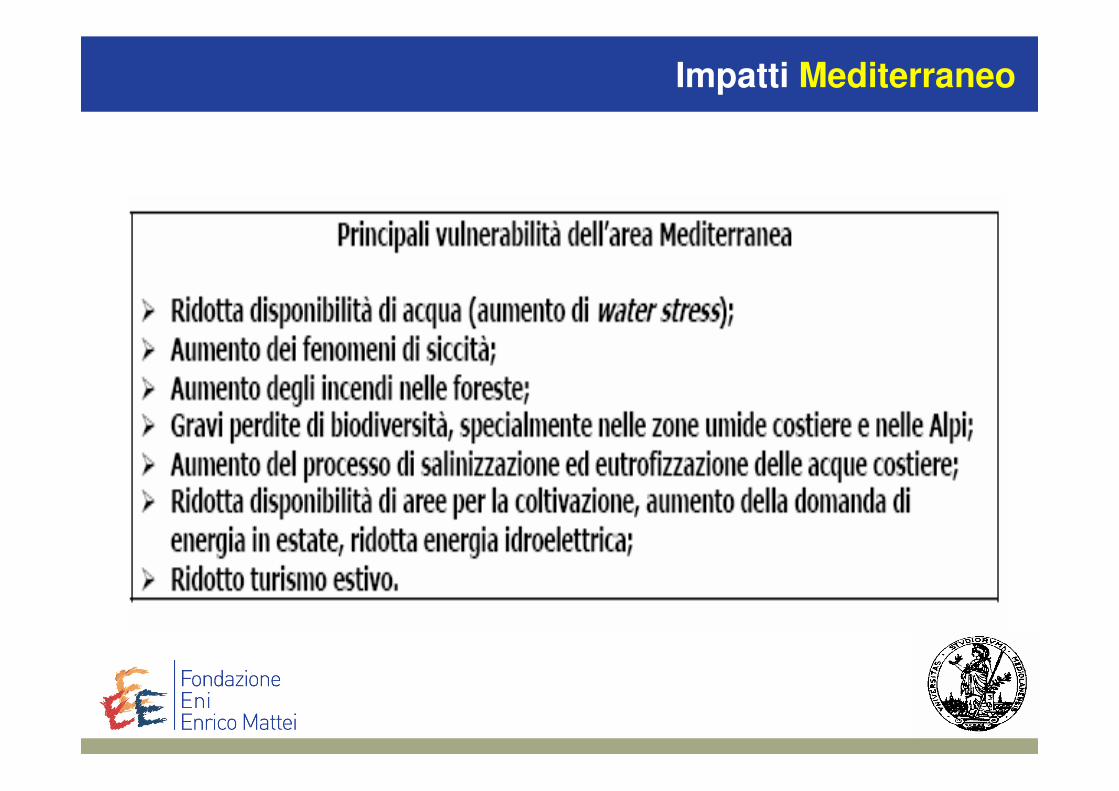
Impatti Mediterraneo
19
3.3.
PECULIARITA’ PECULIARITA’
DEIDEI
CAMBIAMENTI CLIMATICICAMBIAMENTI CLIMATICI
20
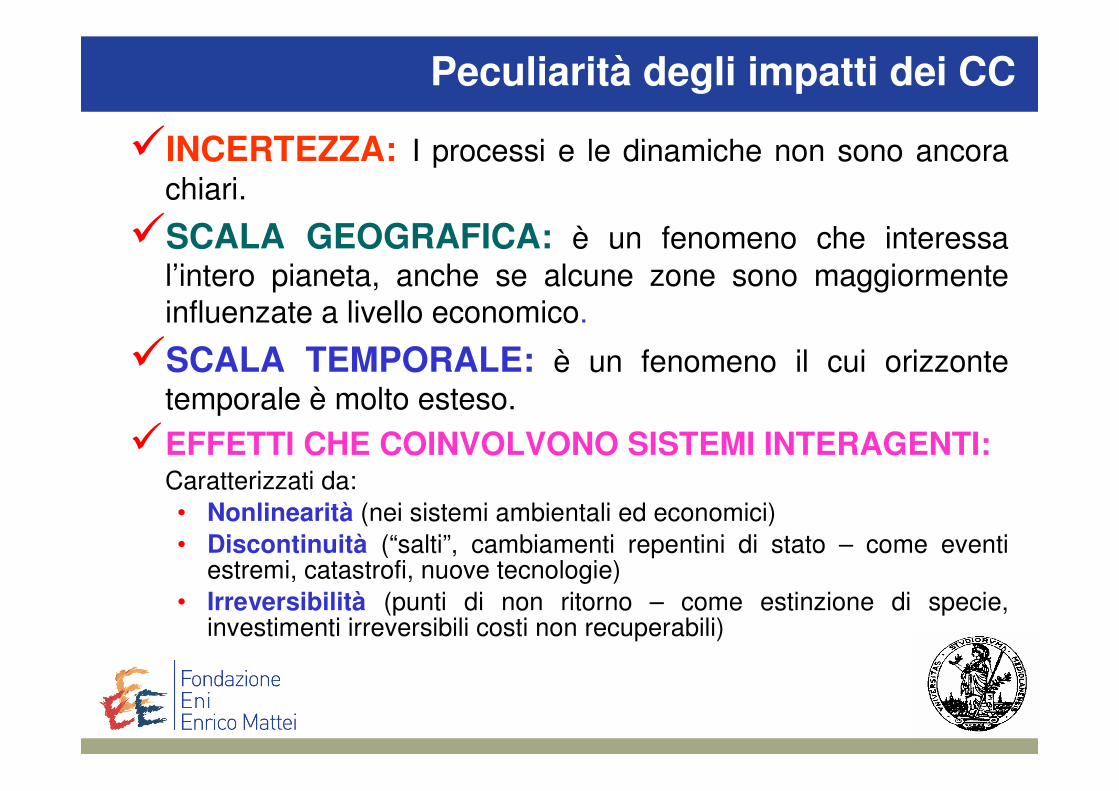
Peculiarità degli impatti dei CC
�INCERTEZZA: I processi e le dinamiche non sono ancora
chiari.
�SCALA GEOGRAFICA: è un fenomeno che interessa
l’intero pianeta, anche se alcune zone sono maggiormenteinfluenzate a livello economico.
�SCALA TEMPORALE: è un fenomeno il cui orizzonte
temporale è molto esteso.
�EFFETTI CHE COINVOLVONO SISTEMI INTERAGENTI:Caratterizzati da:
• Nonlinearità (nei sistemi ambientali ed economici)
• Discontinuità (“salti”, cambiamenti repentini di stato – come eventiestremi, catastrofi, nuove tecnologie)
• Irreversibilità (punti di non ritorno – come estinzione di specie, investimenti irreversibili costi non recuperabili)
21
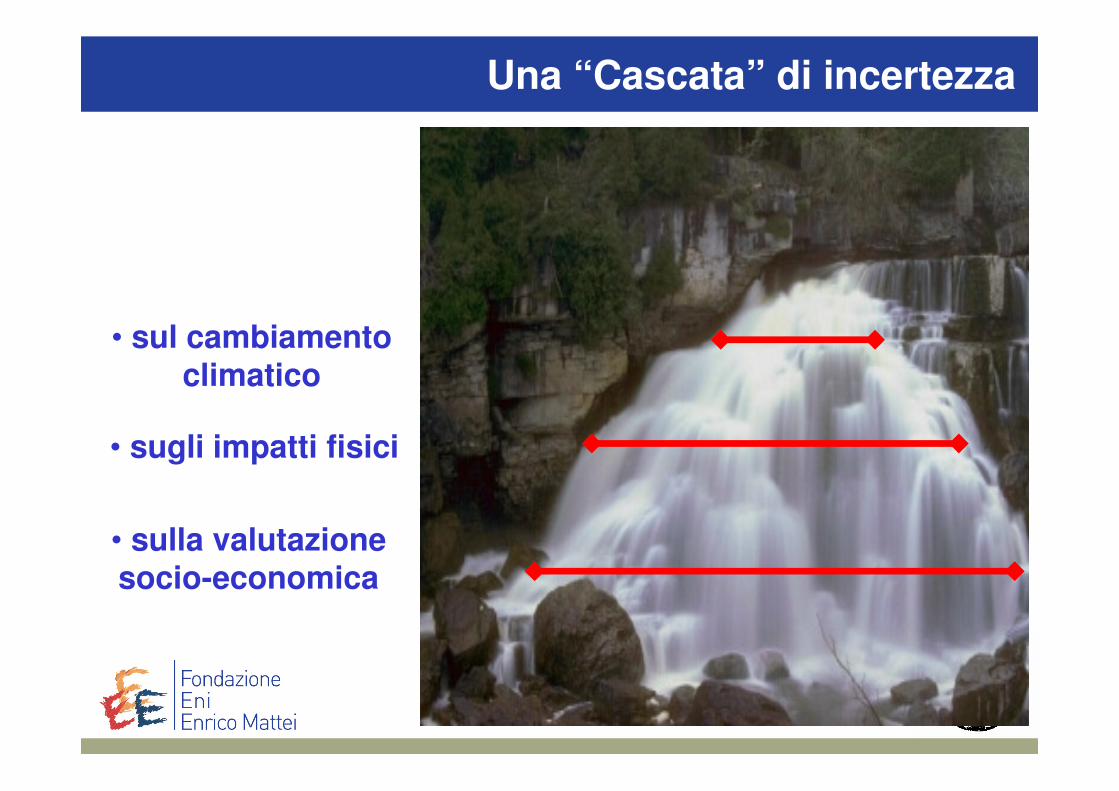
Una “Cascata” di incertezza
• sul cambiamentoclimatico
• sugli impatti fisici
• sulla valutazionesocio-economica
22
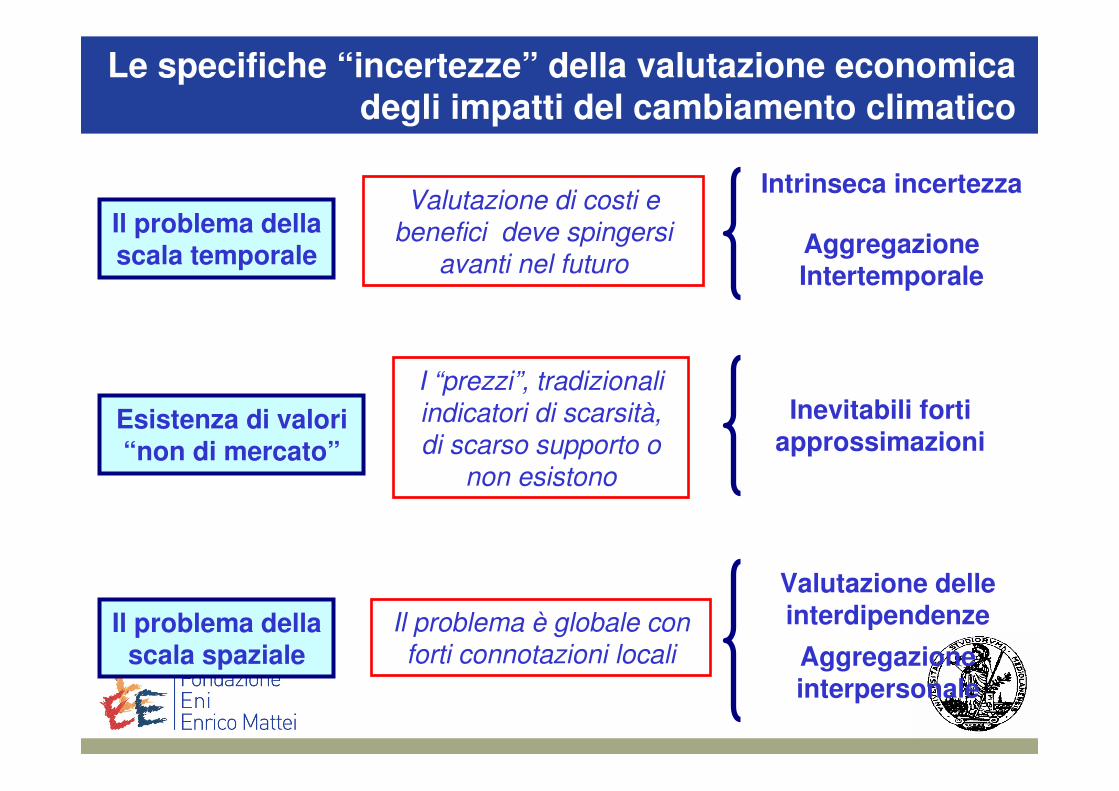
Le specifiche “incertezze” della valutazione economicadegli impatti del cambiamento climatico
Valutazione di costi e benefici deve spingersi
avanti nel futuro
Esistenza di valori“non di mercato”
Il problema dellascala temporale
Il problema dellascala spaziale
Intrinseca incertezza
AggregazioneIntertemporale
I “prezzi”, tradizionaliindicatori di scarsità, di scarso supporto o
non esistono
Inevitabili fortiapprossimazioni
Il problema è globale con forti connotazioni locali
Valutazione delleinterdipendenze
Aggregazioneinterpersonale
23
IPCC AR4 WGIII
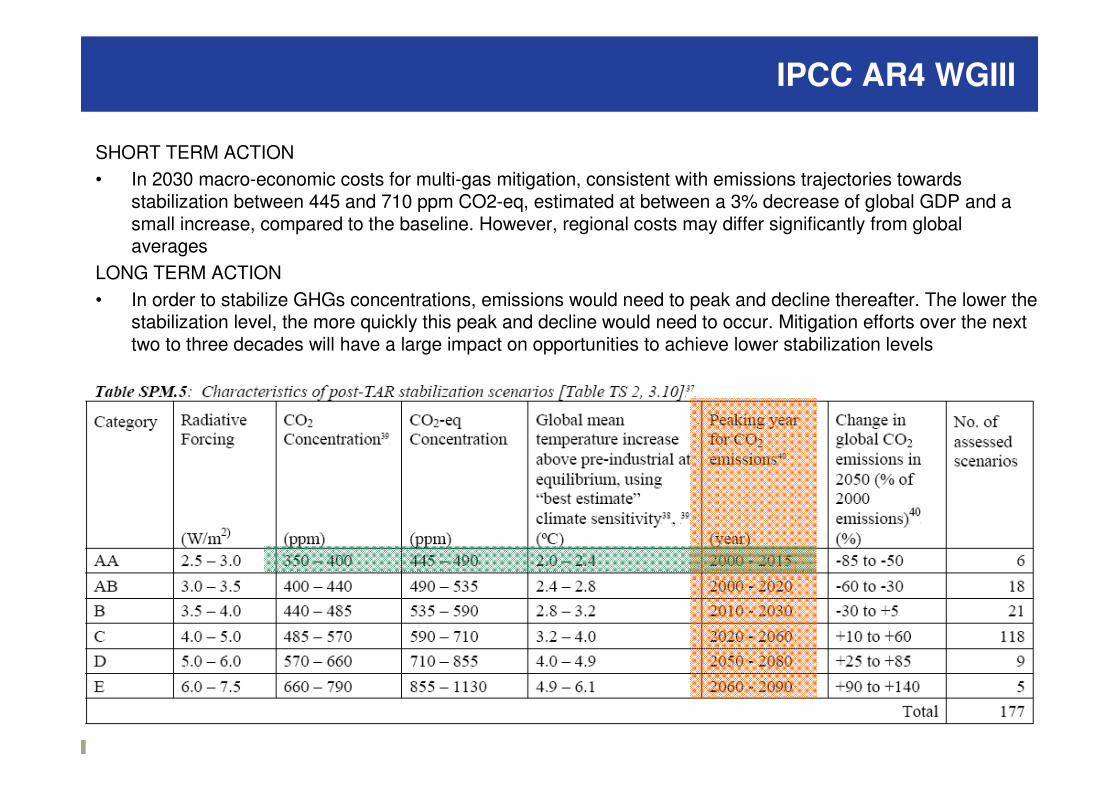
SHORT TERM ACTION
• In 2030 macro-economic costs for multi-gas mitigation, consistent with emissions trajectories towards stabilization between 445 and 710 ppm CO2-eq, estimated at between a 3% decrease of global GDP and a small increase, compared to the baseline. However, regional costs may differ significantly from global averages
LONG TERM ACTION
• In order to stabilize GHGs concentrations, emissions would need to peak and decline thereafter. The lower the stabilization level, the more quickly this peak and decline would need to occur. Mitigation efforts over the next two to three decades will have a large impact on opportunities to achieve lower stabilization levels
24
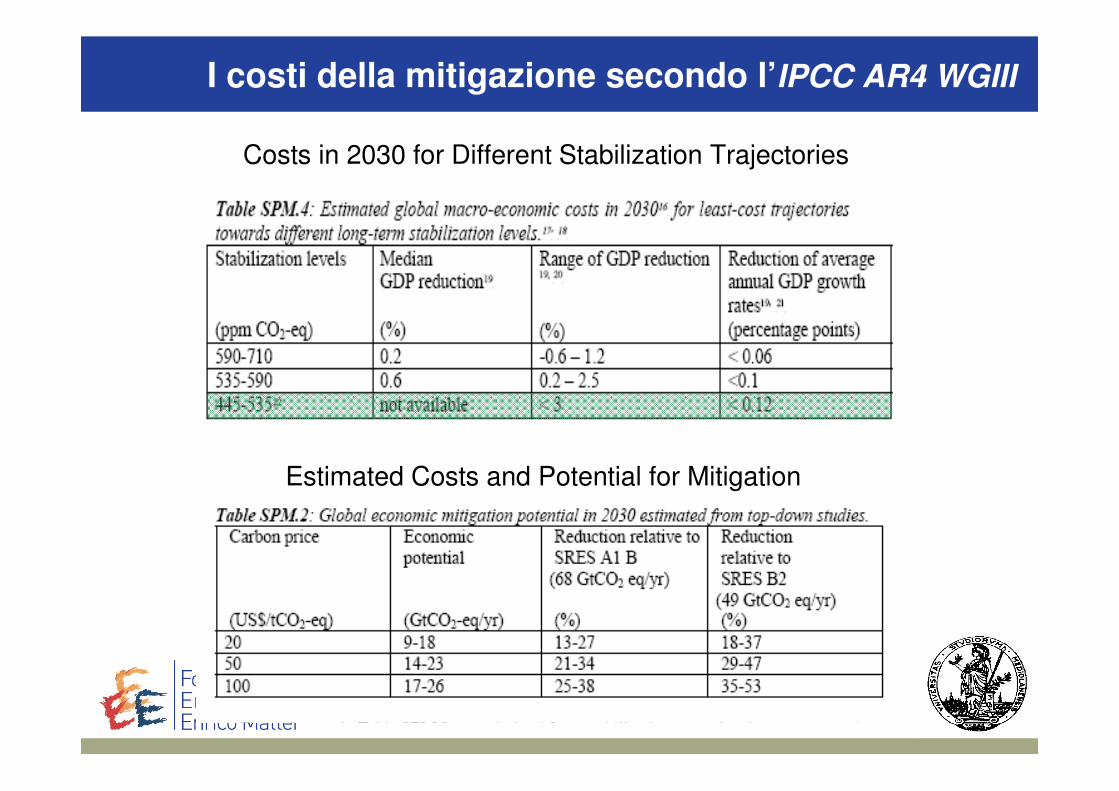
I costi della mitigazione secondo l’IPCC AR4 WGIII
Costs in 2030 for Different Stabilization Trajectories
Estimated Costs and Potential for Mitigation
25
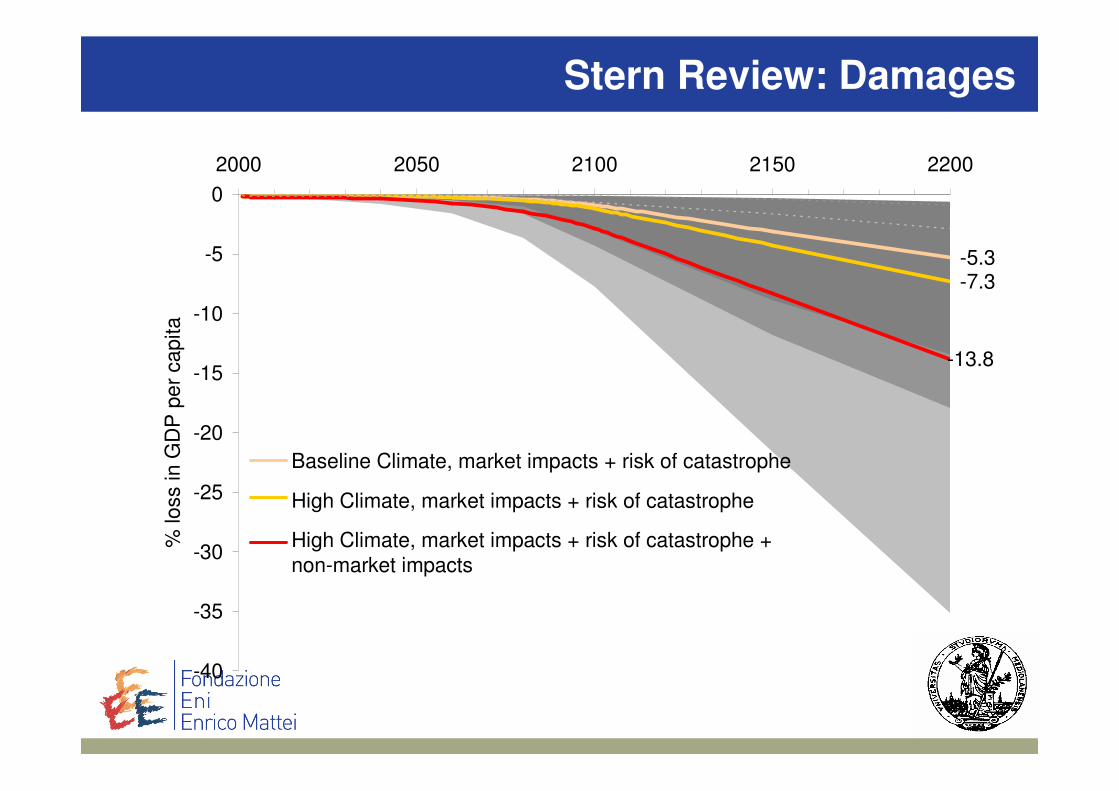
-5.3-7.3
-13.8
-40
-35
-30
-25
-20
-15
-10
-5
0
2000 2050 2100 2150 2200%
loss in G
DP
pe
r capita
High Climate, market impacts + risk of catastrophe +
non-market impacts
Baseline Climate, market impacts + risk of catastrophe
High Climate, market impacts + risk of catastrophe
Stern Review: Damages
26
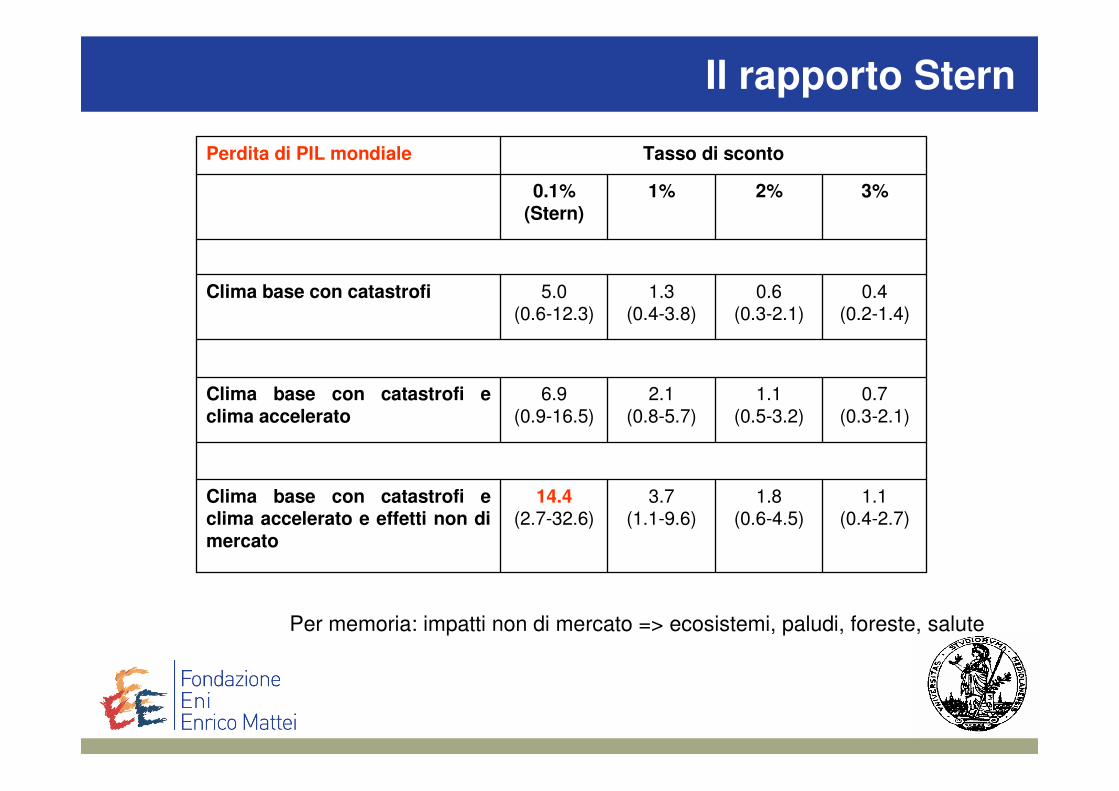
Il rapporto Stern
1.1(0.4-2.7)
1.8(0.6-4.5)
3.7(1.1-9.6)
14.4(2.7-32.6)
Clima base con catastrofi e clima accelerato e effetti non dimercato
0.7(0.3-2.1)
1.1(0.5-3.2)
2.1(0.8-5.7)
6.9(0.9-16.5)
Clima base con catastrofi e clima accelerato
0.4(0.2-1.4)
0.6(0.3-2.1)
1.3(0.4-3.8)
5.0(0.6-12.3)
Clima base con catastrofi
3%2%1%0.1% (Stern)
Tasso di scontoPerdita di PIL mondiale
Per memoria: impatti non di mercato => ecosistemi, paludi, foreste, salute
27
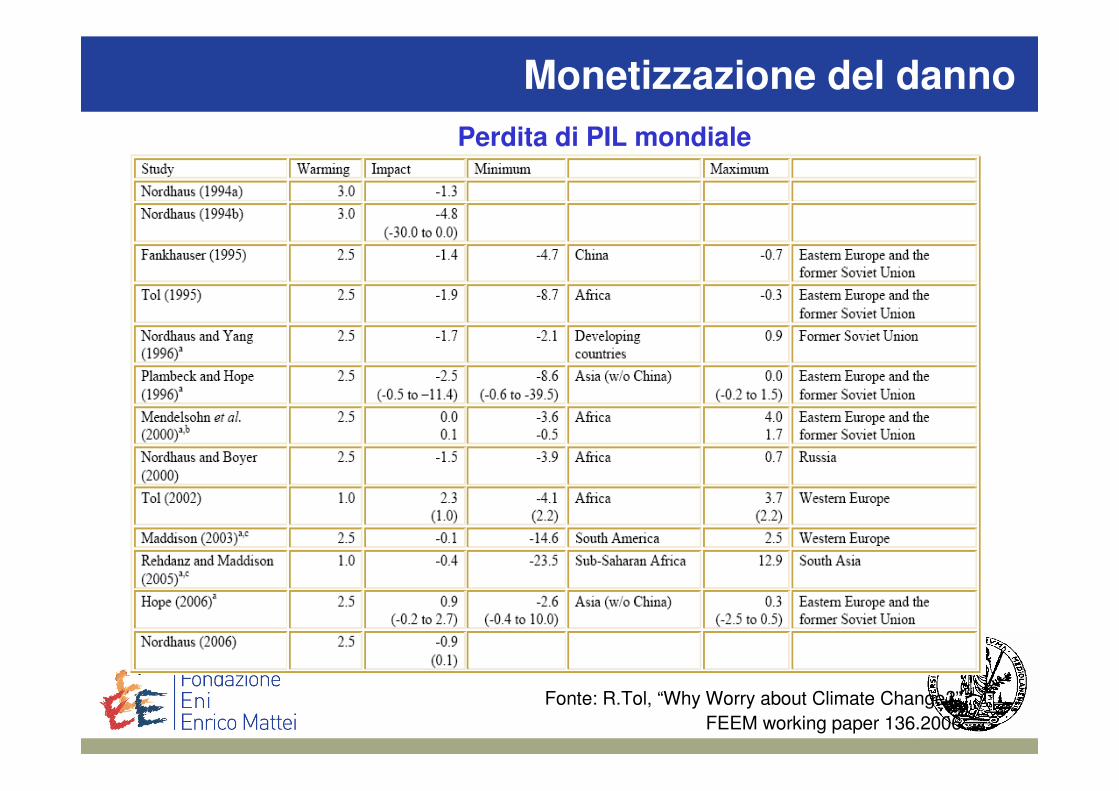
Monetizzazione del danno
Perdita di PIL mondiale
Fonte: R.Tol, “Why Worry about Climate Change?”
FEEM working paper 136.2006
28
4.4.
DRIVERS DRIVERS
DEIDEI
CAMBIAMENTI CLIMATICICAMBIAMENTI CLIMATICI

29
Gli esseri umani (la Gli esseri umani (la Gli esseri umani (la Gli esseri umani (la PopolazionePopolazionePopolazionePopolazione))))
attraverso attraverso attraverso attraverso l’Energial’Energial’Energial’Energia, generano , generano , generano , generano RedditoRedditoRedditoReddito
L’Energia, la Popolazione ed il Reddito
generano l’Inquinamento
La Kaya identity descrive tale relazione:
Inquinamento = Inquinamento *
Energia
Energia *
Reddito
Reddito *
Popolazione
Popolazione
Ovvero:
∆ Inquinamento =
Inquinamento∆ Inten. Inqui. + Inten. Inqui.
∆ Inten. Ener. + Inten. Ener.
∆ Reddito pc. + Reddito pc.
∆ PopPop
“tecno-forze” “socio-forze”
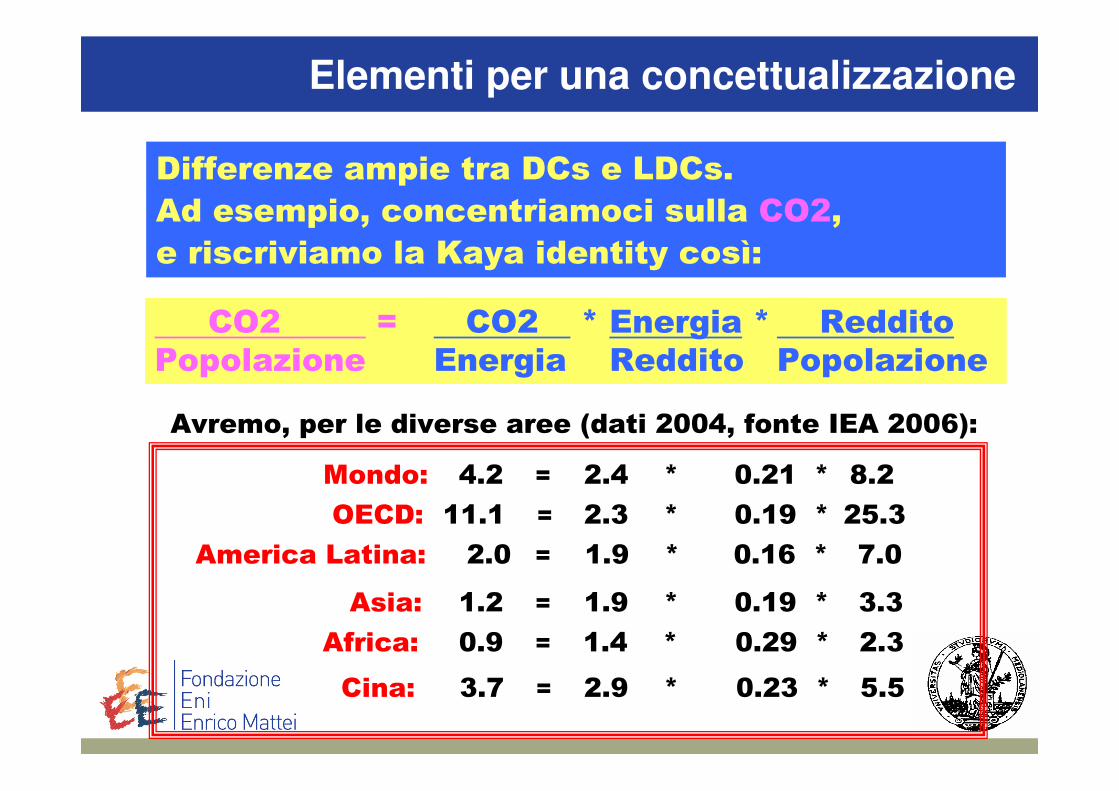
Elementi per una concettualizzazione
30
Differenze ampie tra DCs e LDCs.
Ad esempio, concentriamoci sulla CO2,
e riscriviamo la Kaya identity così:
CO2 =
Popolazione
CO2 *
Energia
Energia *
Reddito
Reddito
Popolazione
Avremo, per le diverse aree (dati 2004, fonte IEA 2006):
Mondo: 4.2 = 2.4 * 0.21 * 8.2
OECD: 11.1 = 2.3 * 0.19 * 25.3
Asia: 1.2 = 1.9 * 0.19 * 3.3
America Latina: 2.0 = 1.9 * 0.16 * 7.0
Africa: 0.9 = 1.4 * 0.29 * 2.3
Cina: 3.7 = 2.9 * 0.23 * 5.5
Elementi per una concettualizzazione
31
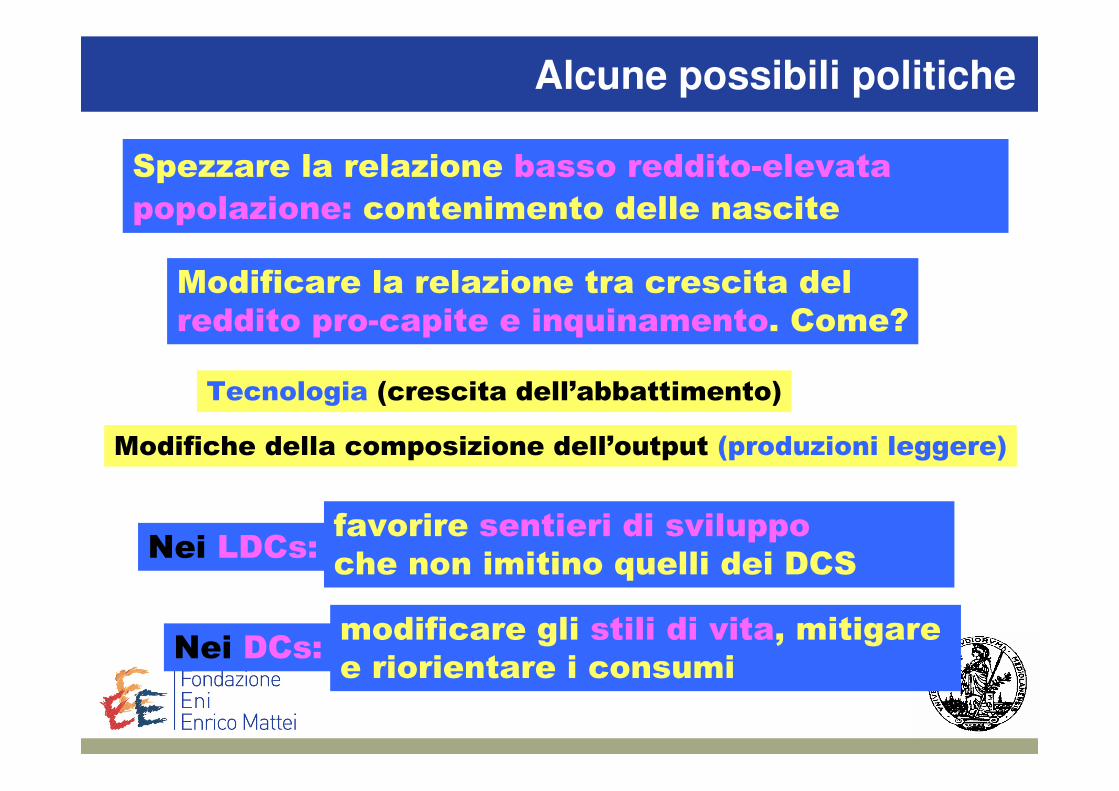
Spezzare la relazione basso reddito-elevata
popolazione: contenimento delle nascite
Modificare la relazione tra crescita del
reddito pro-capite e inquinamento. Come?
Tecnologia (crescita dell’abbattimento)
Modifiche della composizione dell’output (produzioni leggere)
Nei LDCs:favorire sentieri di sviluppo
che non imitino quelli dei DCS
Nei DCs:modificare gli stili di vita, mitigare
e riorientare i consumi
Alcune possibili politiche

32
La Kaya Identity suggerisce delle risposte di policy:
� aumentare l’efficienza energetica
� modificare le struttura del sistema economico
� cambiare stili di vita
� modificare il mix energetico
� aumentare l’abbattimento
� diminuire/contenere l’aumento nei diminuire/contenere l’aumento nei redditi pro capiteredditi pro capite
� ridurre ridurre la crescita delle popolazionela crescita delle popolazione
Alcune possibili politiche
33
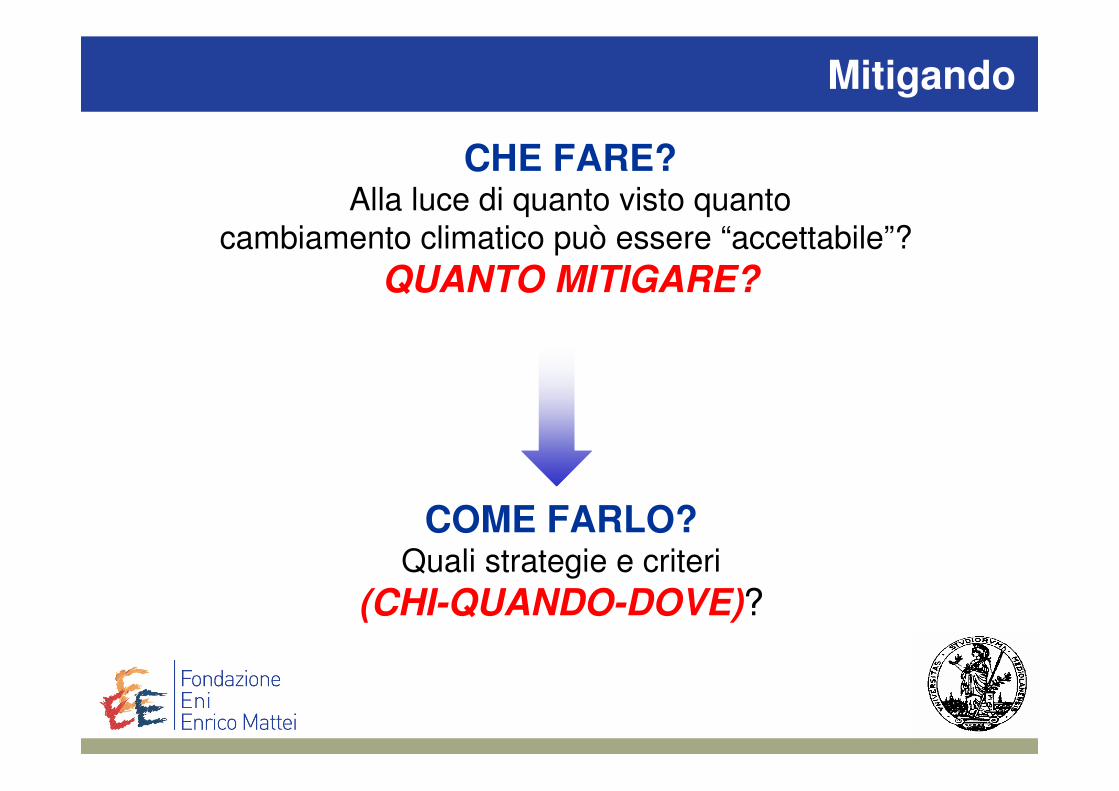
Mitigando
CHE FARE?Alla luce di quanto visto quanto
cambiamento climatico può essere “accettabile”?
QUANTO MITIGARE?
COME FARLO?Quali strategie e criteri
(CHI-QUANDO-DOVE)?
34
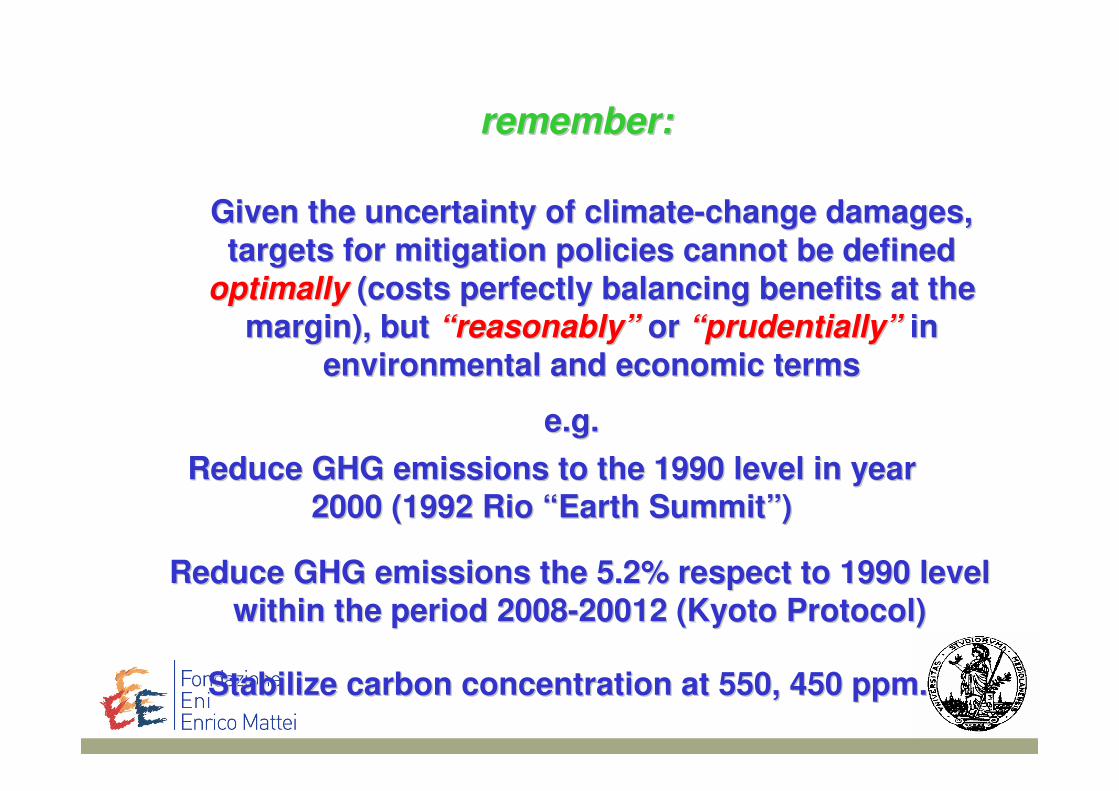
Given the uncertainty of climateGiven the uncertainty of climate--change damages, change damages,
targets for mitigation policies cannot be definedtargets for mitigation policies cannot be defined
optimallyoptimally (costs perfectly balancing benefits at the (costs perfectly balancing benefits at the
margin), butmargin), but “reasonably”“reasonably” or or “prudentially”“prudentially” in in
environmental and economic termsenvironmental and economic terms
e.g.e.g.
Reduce GHG emissions to the 1990 level in year Reduce GHG emissions to the 1990 level in year
2000 (1992 Rio “Earth Summit”)2000 (1992 Rio “Earth Summit”)
Reduce GHG emissions the 5.2% respect to 1990 level Reduce GHG emissions the 5.2% respect to 1990 level
within the period 2008within the period 2008--20012 (Kyoto Protocol)20012 (Kyoto Protocol)
Stabilize carbon concentration at 550, 450 Stabilize carbon concentration at 550, 450 ppmppm. .
remember:remember:

35
5.5.
LA POLITICA DEL CLIMALA POLITICA DEL CLIMA
36
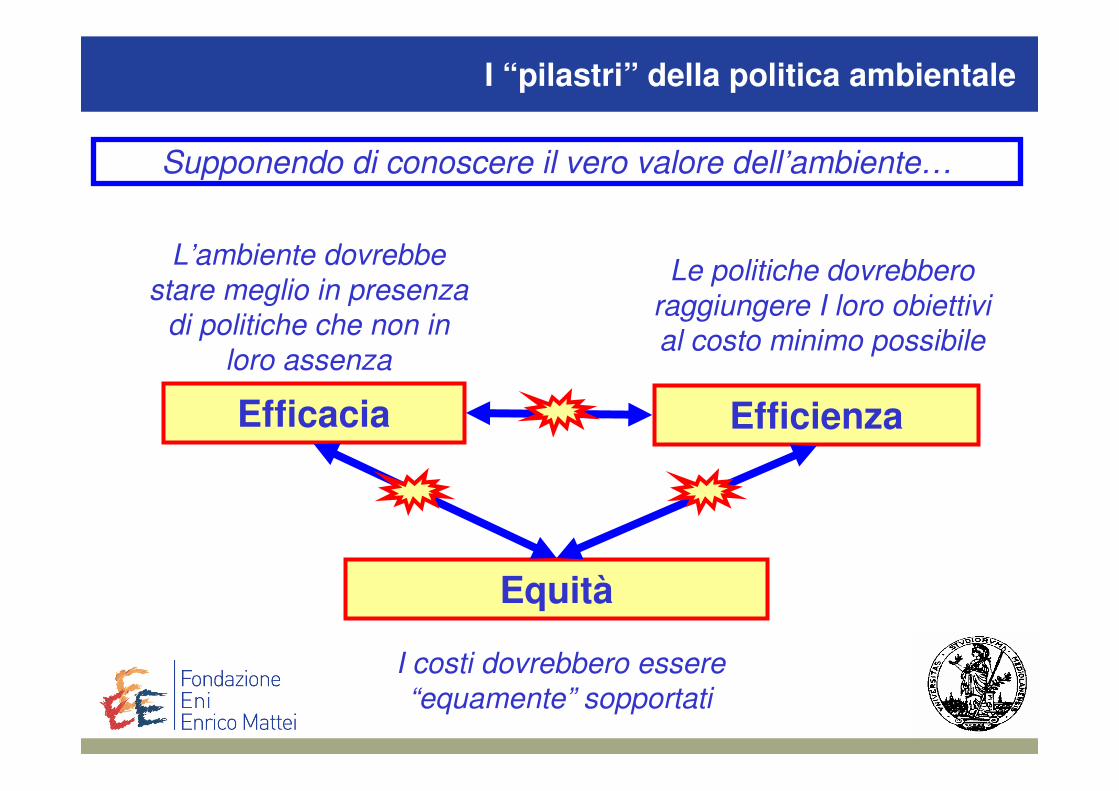
I “pilastri” della politica ambientale
Efficacia
L’ambiente dovrebbe
stare meglio in presenzadi politiche che non in
loro assenza
Efficienza
Le politiche dovrebbero
raggiungere I loro obiettivial costo minimo possibile
Equità
I costi dovrebbero essere
“equamente” sopportati
Supponendo di conoscere il vero valore dell’ambiente…
37
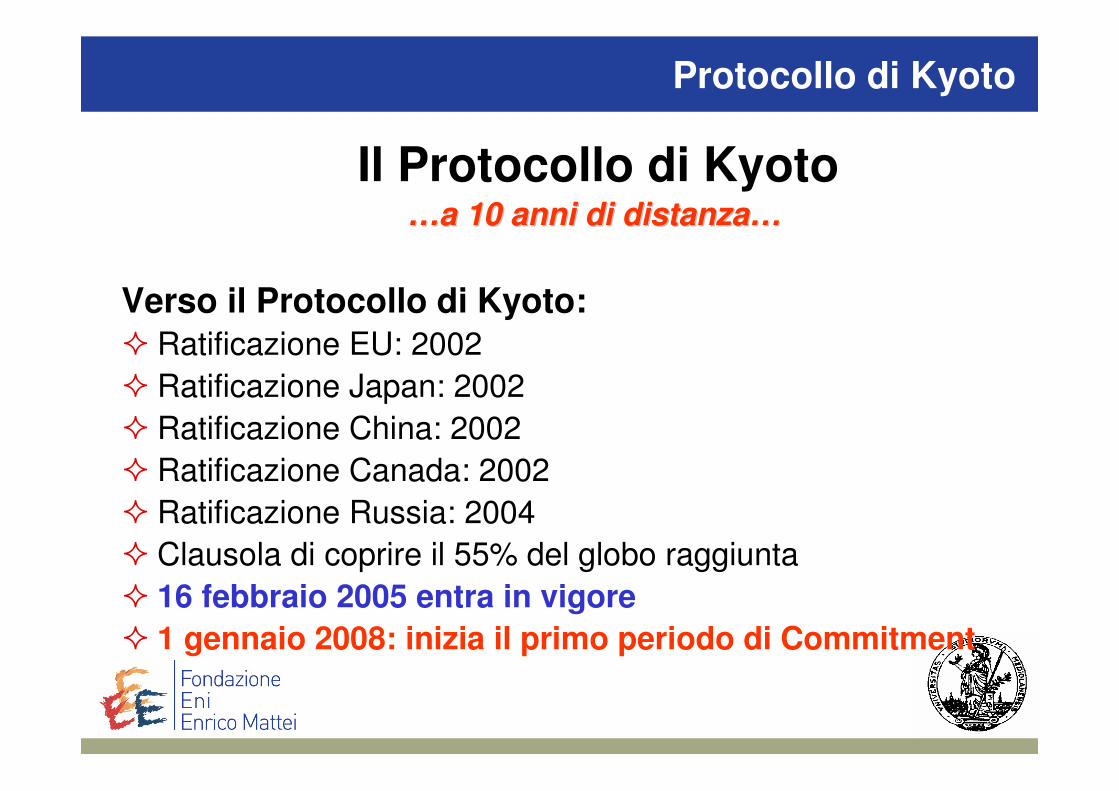
Protocollo di Kyoto
Il Protocollo di Kyoto……aa 10 anni di 10 anni di distanza…distanza…
Verso il Protocollo di Kyoto:
� Ratificazione EU: 2002
� Ratificazione Japan: 2002
� Ratificazione China: 2002
� Ratificazione Canada: 2002
� Ratificazione Russia: 2004
� Clausola di coprire il 55% del globo raggiunta
� 16 febbraio 2005 entra in vigore
� 1 gennaio 2008: inizia il primo periodo di Commitment

38
Kyoto e le politiche ambientali
Obiettivi vincolanti di riduzionedelle emissioni per i paesiindustrializzati (Annex 1):riduzione complessiva del 5.2% di emissioni di GHGs rispetto ai proprilivelli del 1990 tra il 2008 e il 2012.
Efficacia
Flessibilità/Costo Efficienza
Equità/Responsabilità
Clausola del 55%Almeno 55 “Parties” dellaConvenzione, che rappresentinoalmeno il 55% delle emissioni di anidride carbonica dei paesiAnnex 1 Parties, devono avereratificato il trattato.
Nessun obbligo di riduzione delle emissioni per I PVS
Dove: ET, JI, CDM Quando: 2008-2012

39
Caratteristiche delle politiche del clima
Emissioni di GHGs: esternalità+ “male pubblico”
Non esisteun’autorità sovra-
nazionale di enforcement
Le nazioni sonodifferenti tra loro
Efficacia ambientale => “ampia” partecipazione
Incentivi al “free-riding”
Accordo basato sullapartecipazione “volontaria” =>
Benefici > Costi per i partecipanti
Distribuzione ineguale dei costie dei guadagni tra i potenziali
partecipanti

40
Caratteristiche delle politiche del clima
Difficile raggiungere una partecipazione da tutti:
- E’ un bene pubblico, tutti vogliono il bene, tutti dovrebbero pagare, ma ognuno ha incentivi per lasciare che paghino gli altri
�Prisoner’s Dilemma ���� Tragedy of the Commons
�instabilità intrinseca nelle negoziazioni:
- Asimmetrie economiche e degli impatti tra regioni
- Non esiste una autorità sopra nazionale
Alcuni aspetti economiciAlcuni aspetti economici

41
All this condensates in two key All this condensates in two key
conceptsconcepts
An IEA can be An IEA can be
signedsigned if and only if and only
if it is if it is profitableprofitable to to
all partiesall parties
An IEA can be An IEA can be
sustained over sustained over
timetime if and only if if and only if
it is it is stablestable to all to all
partiesparties
Each participant is Each participant is
better off with than better off with than
without the without the
agreement agreement
-- No incentive to freeNo incentive to free--
ride: ride: each participant is better each participant is better
off inside the agreement than off inside the agreement than
outside the agreement with outside the agreement with
other parties committed to the other parties committed to the
agreement agreement
-- Outsiders no incentive Outsiders no incentive
to join into join in
In In
principle principle
both both
issues issues
can be can be
accommoaccommo
dated dated
with with
transfers transfers
from from
winners winners
to losers to losers
or to or to
potential potential
freefree--
ridersriders

42
According to the theory According to the theory this can be very this can be very
difficultdifficult
The higher the benefits the higher the incentive to free The higher the benefits the higher the incentive to free
ride that cannot be possibly offset by any transfer ride that cannot be possibly offset by any transfer
scheme scheme (Carraro (Carraro SiniscalcoSiniscalco, 1992; Heal 1994; Barrett, 1997), 1992; Heal 1994; Barrett, 1997)
EXIT 1EXIT 1
indeedindeed
An IEA with binding An IEA with binding
content can be signed content can be signed
only by a small only by a small
number of countries number of countries
(max 3)(max 3)
An IEA is signed by a An IEA is signed by a
large number of large number of
participants => it is participants => it is
empty of environmental empty of environmental
commitmentcommitment
EXIT 2EXIT 2

43
An example: an interpretation of the Kyoto An example: an interpretation of the Kyoto
Protocol negotiation processProtocol negotiation process
USA + Australia USA + Australia
nonnon--ratificationratification
Russia Russia
ratificationratification
EU ratificationEU ratification
The agreement is perceived as The agreement is perceived as
excessively costly = excessively costly = non profitablenon profitable. .
Requiring “meaningful participation” of Requiring “meaningful participation” of
LDCsLDCs = requiring a = requiring a transfertransfer from from LDCsLDCs
Required reduction low and possibility Required reduction low and possibility
to sell hotto sell hot--air => agreement very air => agreement very
profitable + no incentive to free rideprofitable + no incentive to free ride
Indirect relaxation of the commitment Indirect relaxation of the commitment
see carbon sinks => approaching status see carbon sinks => approaching status
quo antequo ante
Possibility to buy hot air lowers costs + Possibility to buy hot air lowers costs +
wrong estimates of costs?wrong estimates of costs?
In general, In general,
attempts to attempts to
widening the widening the
agreement agreement

44
In addition, regarding negotiations: In addition, regarding negotiations:
the effectiveness/efficiency/equity the effectiveness/efficiency/equity puzzlepuzzle

45
EU and Kyoto
… emissions must go to level 80 for Kyoto….
� EU emissions: historical trend (source: EEA)

46
Sharing the Burden: the European Recipe
� The main recipe of the European C-E policy: “20-20-20” by 2020 (magic numbers)
� As for CO2 emissions:
− 20% unilateral reduction for the whole of EU27 by 2020 relative to
1990 levels
– 30% reduction for the whole of EU27 by 2020 relative to 1990
levels provided that the other DCs do the same and fast growing
LDCs participate according to their capacity
− 60% to 80% reduction for the whole of DCs by 2050 relative to
1990 levels
� As for the rest:
− 20% minimum share of renewable energy by 2020 (of which: 10%
biofuels)
− 20% increase in energy efficiency by 2020
47
Sharing the Burden/1
Climate Action and Renewable Energy Packagethe EC's legislative proposal to achieve agreed EU objectives
in the fight against climate change
Package presented by EC President Barroso on January 23, 2008 to give content to the Council decisions of March 2007
The "Climate action and renewable energy package" sets out the contribution expected from each Member State to meeting these targetsand proposes a series of measures to help achieve them.
While the measures would cost consumers 3 euros a week on average, Barroso said: "The cost of inaction is up to 10 times more than what we
are proposing."
48
Sharing the Burden/2
Climate Action and Renewable Energy Packagethe EC's legislative proposal to achieve agreed EU objectives
in the fight against climate change
The package includes a series of interrelated policy proposals:
� Proposal for strengthening and expanding the EU Emission Trading Scheme after 2012
� "Effort Sharing“ proposal about how to distribute the burden by MS of reducing emissions in those sectors not covered by EU-ETS (transportation, building, services, small industrial plants, agriculture, waste)
� Proposal concerning setting different national compulsory targets for renewable energy in 2020 and criteria of sustainability of biofuels
� Proposal concerning the legal framework for a safe and eco-compatible use of Carbon Capture and Storage - CCS
� Revision of code concerning State Aid in area of environmental protection
� Energy efficiency
49
Il negoziato sul clima –Gli scenari Post-2012

50
La prospettiva dei G77 e Cina
Em
issio
ni per
capita (
ton C
O2e)
Dimensione relativa della popolazione
51
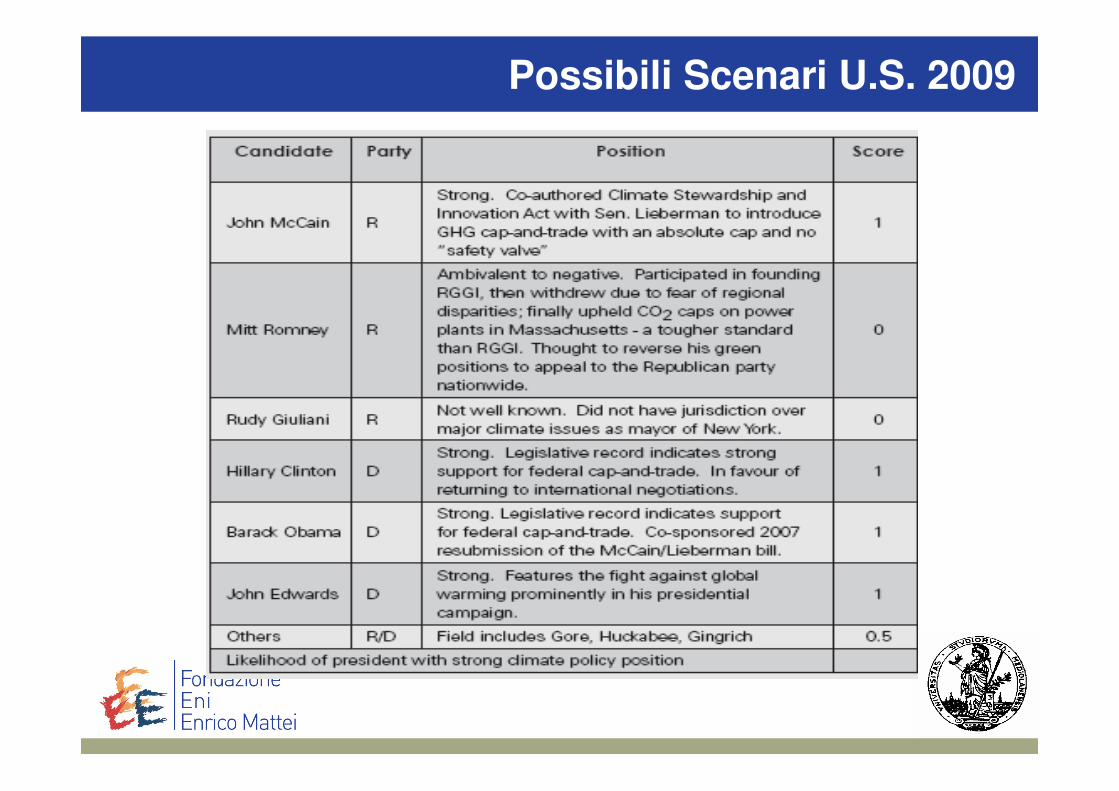
Possibili Scenari U.S. 2009
52
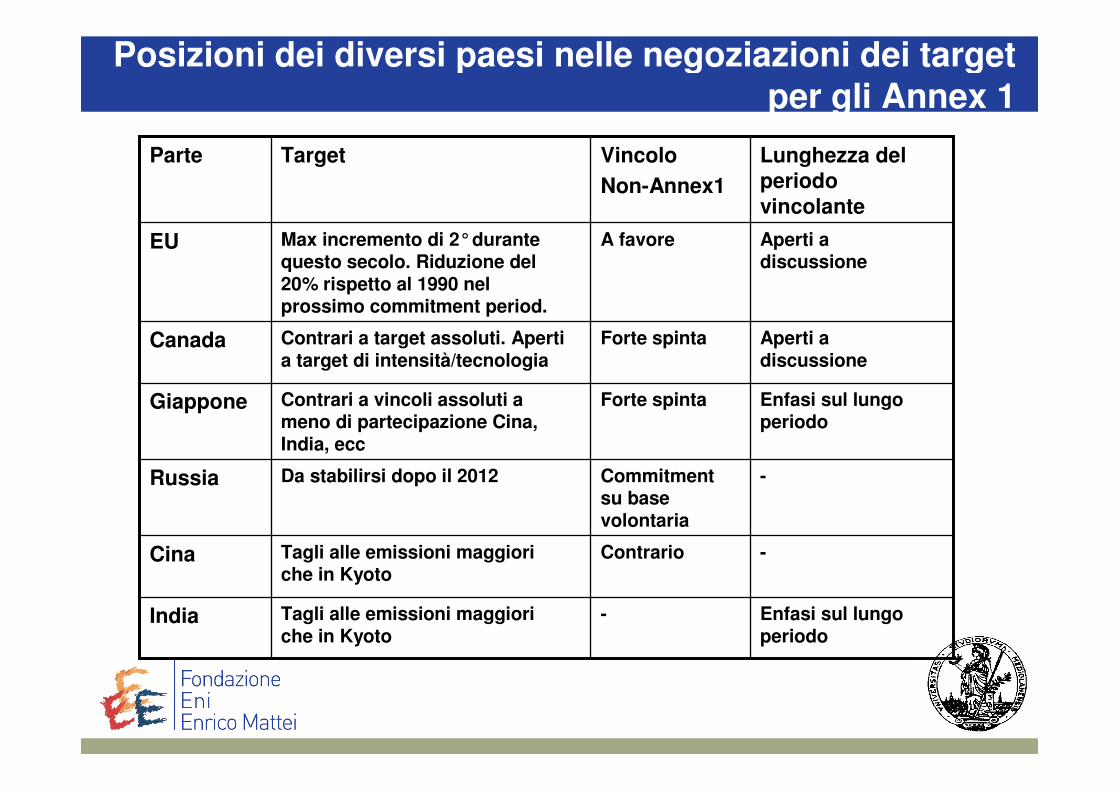
Posizioni dei diversi paesi nelle negoziazioni dei target per gli Annex 1
Enfasi sul lungo periodo
-Tagli alle emissioni maggiori che in Kyoto
India
-ContrarioTagli alle emissioni maggiori che in Kyoto
Cina
-Commitmentsu base volontaria
Da stabilirsi dopo il 2012Russia
Enfasi sul lungo periodo
Forte spintaContrari a vincoli assoluti a meno di partecipazione Cina, India, ecc
Giappone
Aperti a discussione
Forte spintaContrari a target assoluti. Aperti a target di intensità/tecnologia
Canada
Aperti a discussione
A favoreMax incremento di 2° durante questo secolo. Riduzione del 20% rispetto al 1990 nel prossimo commitment period.
EU
Lunghezza del periodo vincolante
Vincolo
Non-Annex1
TargetParte

53
Principali Scenari Politici 2008-2032
Prezzi del carbonio gradualmente crescenti
Il più dei paesi e
Offerta CER ridotta
Aumentato tradein AAU-backedcredits
Grande domanda US di CDM/JI
Divergenza tra CERs e mercati nazionali dei crediti
EU-ETS e Giappone si legano a CDM e JI per cui si vede crescita della domanda
Mercato AAU
Market
Tranne Africa quasi tutti i paesi sottoscrivono i target
Vincoli più stringenti, convergenza con altri ANNEX 1
Vincoli stringenti in linea obiettivi 2050
2023-32
Cina sottoscrive i target
Partecipazione piena al regime internazionale
Vincoli meno stringenti di altri ANNEX 1
Regime onnicomprensivo
2018-22
Membri OECD seguono i target internazionali
Fuoco su gestione foreste
Link EU-ETS e US-ETS, trade globale
Nuovo protocollo
Incluse marina e aviazione
2013-17
Rifiuto di cap
Riduzione di più di 2 miliardi di tonnellate CO2 e da CDM
Nuovo presidente 2009, rientra nelle negoziazioni ma non in tempo per ratificare 2013-17
US-ETS 2015-15
RGGI trading da 2009
Accordi volontari
Negoziazioni post 2012
Riduzioni dovute a EU-ETS e industrie giapponesi
2008-12
NON –Annex 1USAnnex 1Periodo