


Le lingue
Pagine
Legale

Andamento infortunistico e costi della non sicurezza
Ilaria BarraINAIL Direzione Generale Contarp
La sicurezza sul lavoro nei parchi eolici
Roma 13 giugno 2012
1
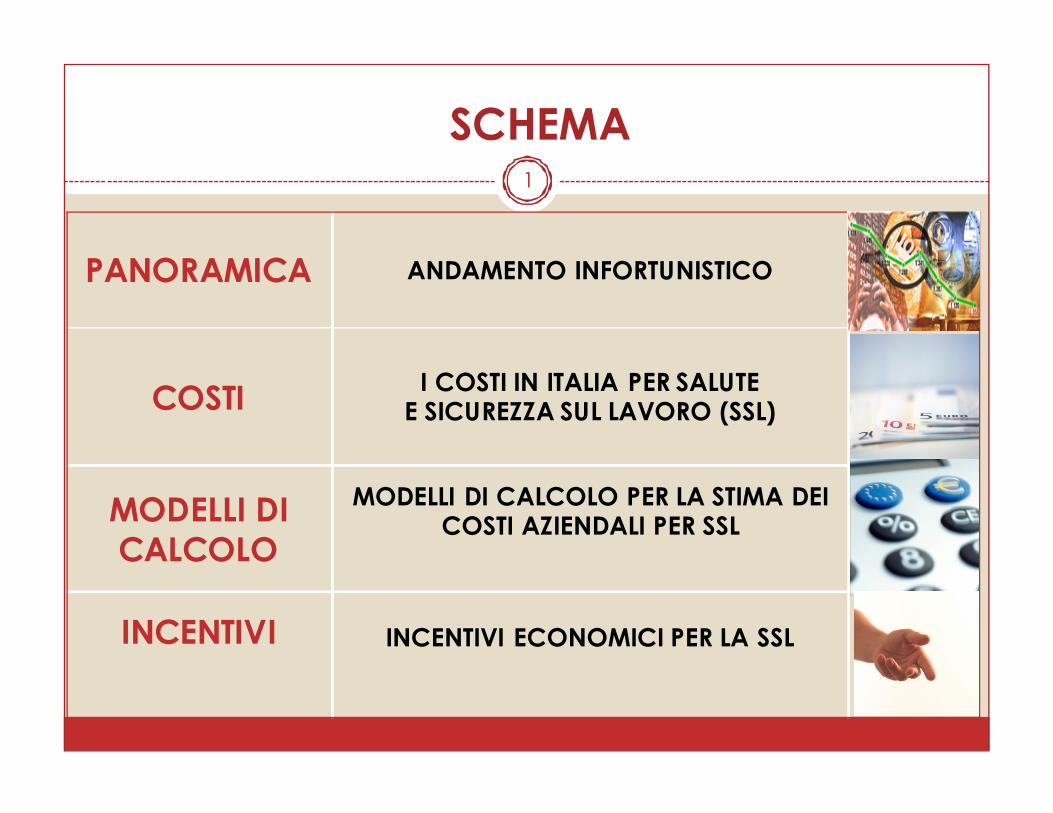
SCHEMA
PANORAMICA ANDAMENTO INFORTUNISTICO
COSTII COSTI IN ITALIA PER SALUTE
E SICUREZZA SUL LAVORO (SSL)
MODELLI DI CALCOLO
MODELLI DI CALCOLO PER LA STIMA DEI COSTI AZIENDALI PER SSL
INCENTIVI INCENTIVI ECONOMICI PER LA SSL
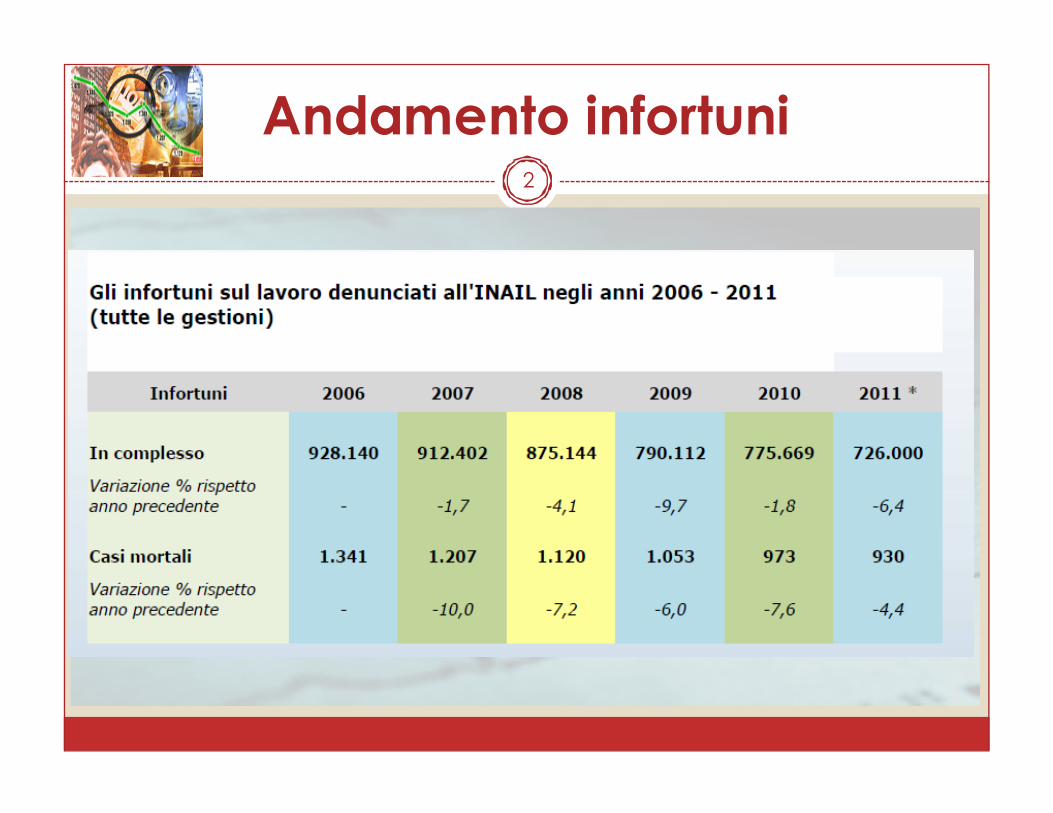
Andamento infortuni2
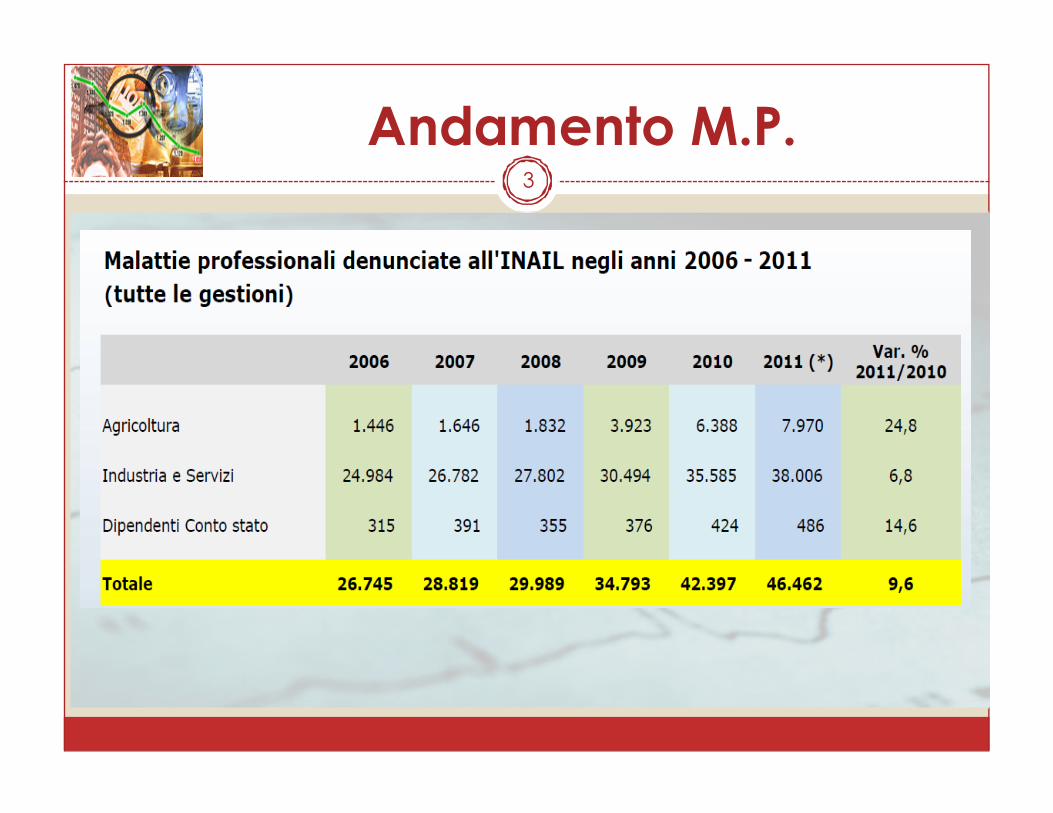
Andamento M.P.3
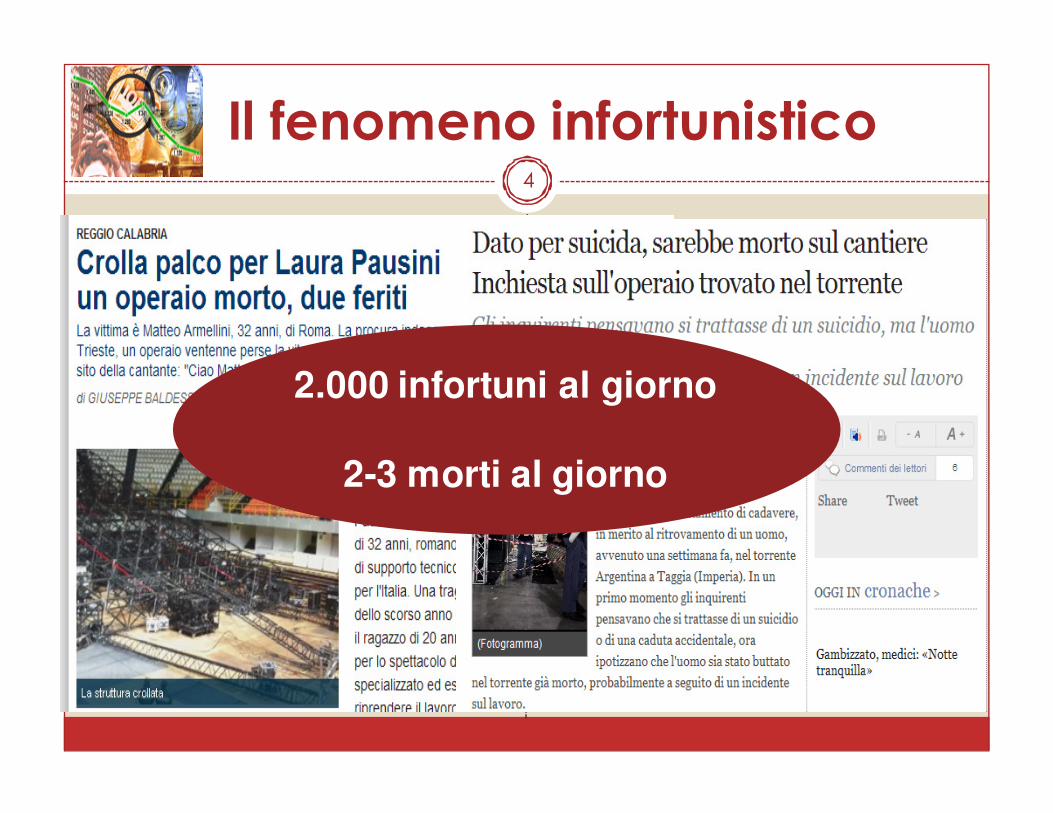
Il fenomeno infortunistico
2.000 infortuni al giorno
2-3 morti al giorno
4
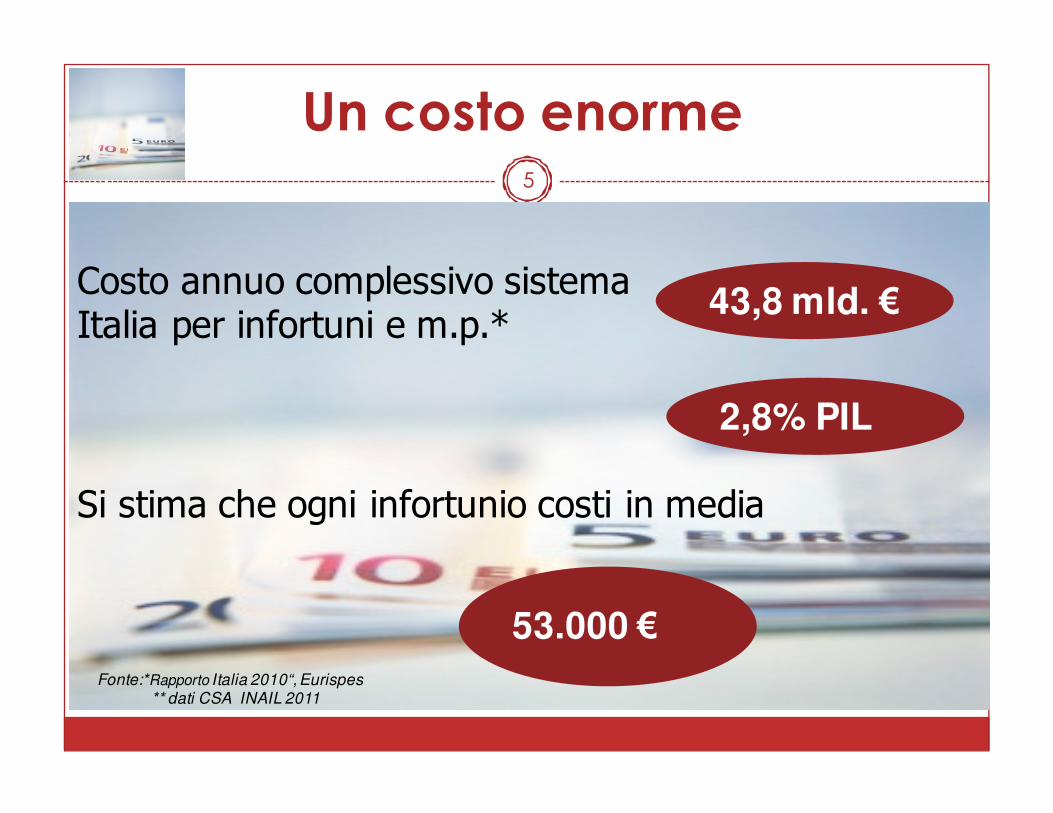
Un costo enorme
Fonte:*Rapporto Italia 2010“, Eurispes** dati CSA INAIL 2011
Costo annuo complessivo sistema Italia per infortuni e m.p.*
43,8 mld. €
5
2,8% PIL
Si stima che ogni infortunio costi in media
53.000 €

Chi paga
Lavoratore
6
Azienda Società
Perdita della salute
Riduzione produzione
Qualità della vitaContenziosi amministrativi
Perdita di risorse
SSN
Danni attrezzature
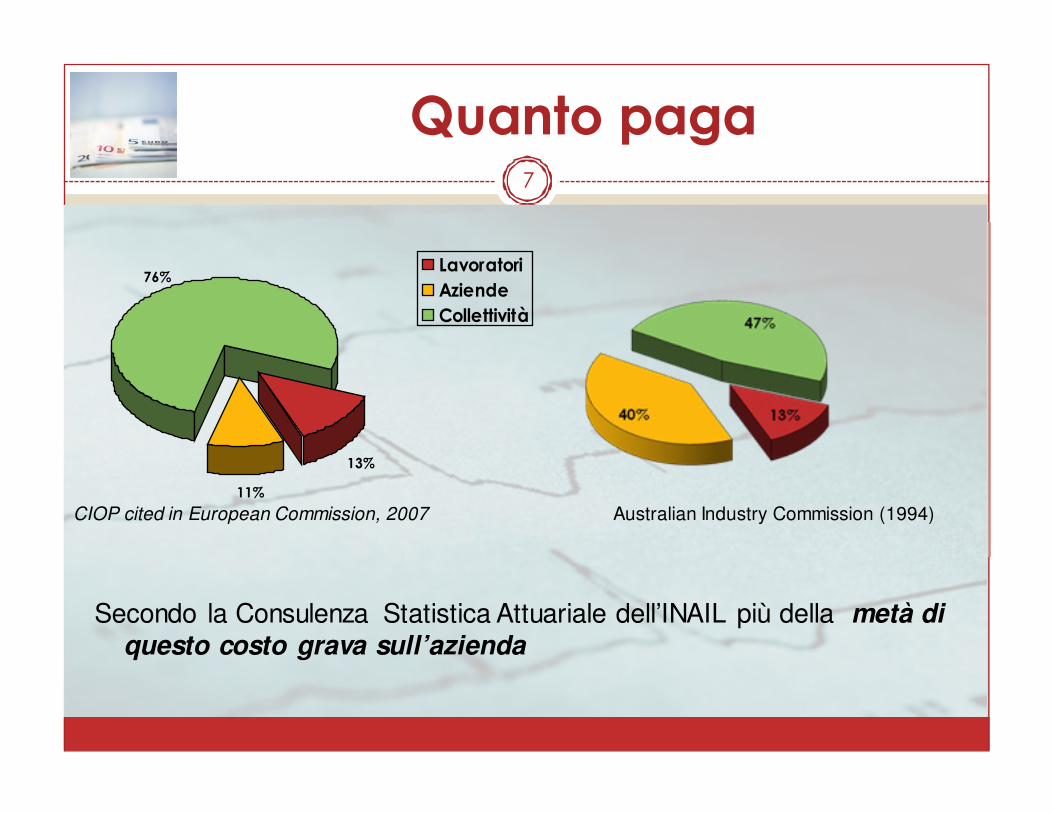
Quanto paga7
13%
11%
76%Lavoratori
Aziende
Collettività
CIOP cited in European Commission, 2007 Australian Industry Commission (1994)
Secondo la Consulenza Statistica Attuariale dell’INAIL più della metà di questo costo grava sull’azienda
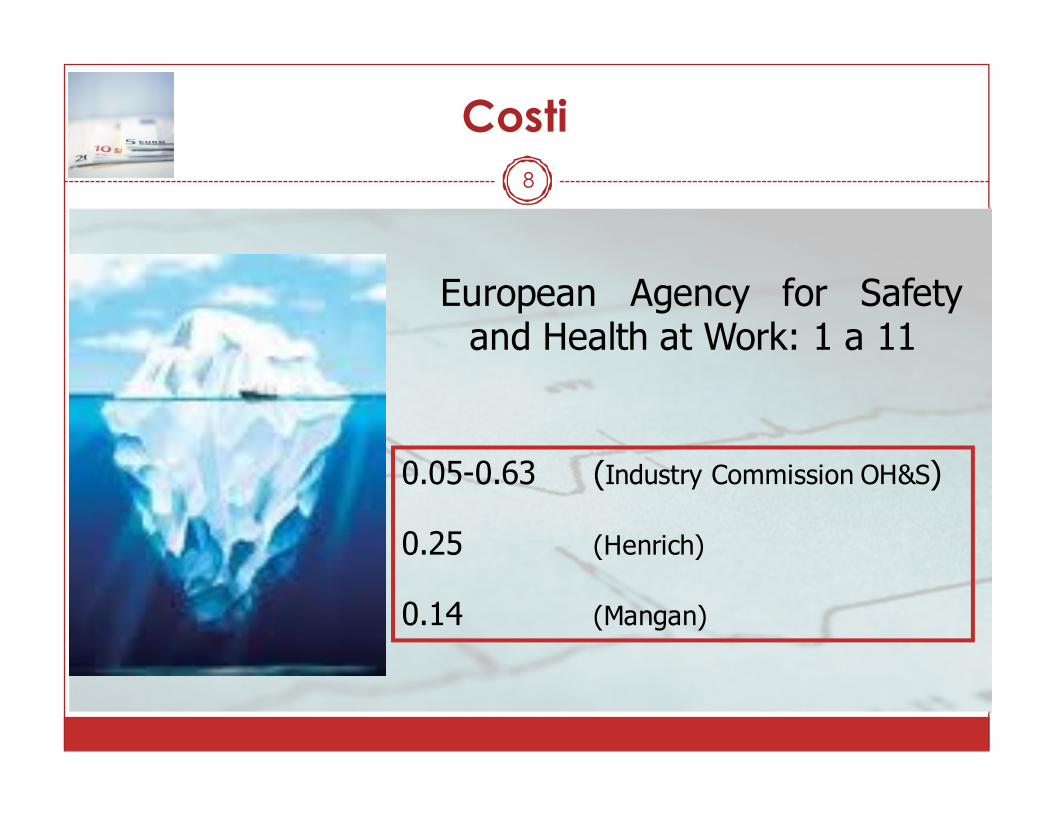
European Agency for Safetyand Health at Work: 1 a 11
Costi
0.05-0.63 (Industry Commission OH&S)
0.25 (Henrich)
0.14 (Mangan)
8
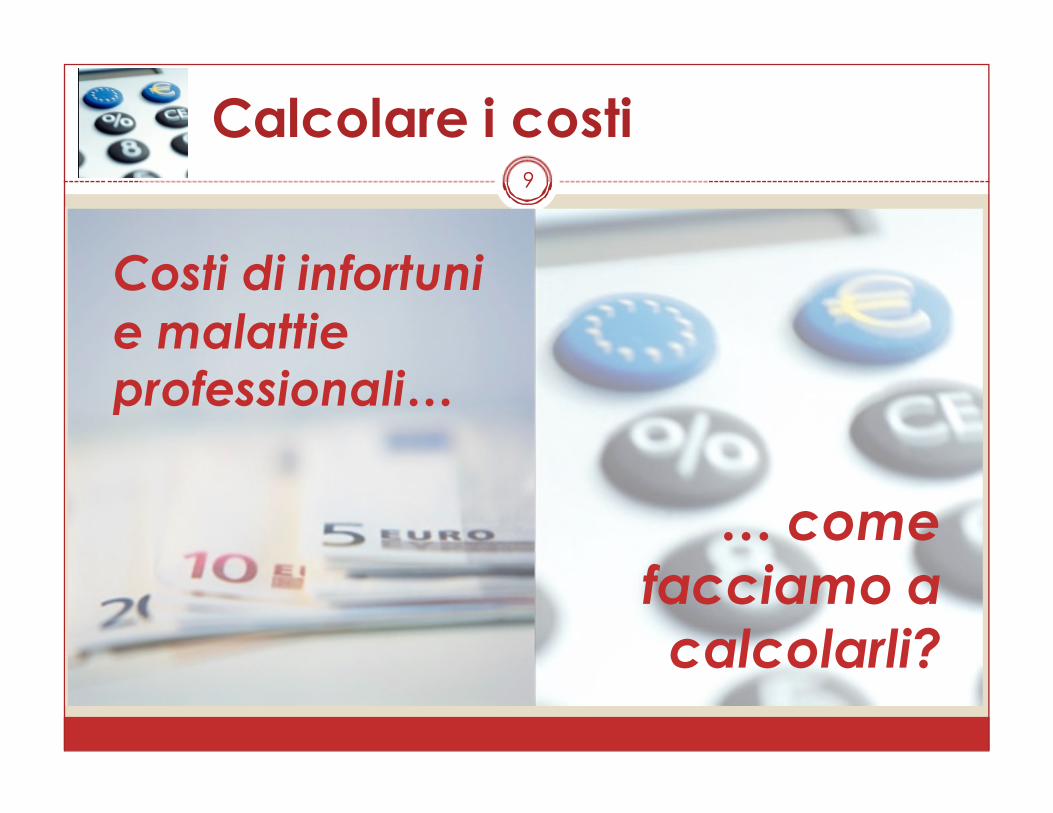
Costi di infortuni
e malattie professionali…
Calcolare i costi
… come
facciamo a
calcolarli?
9
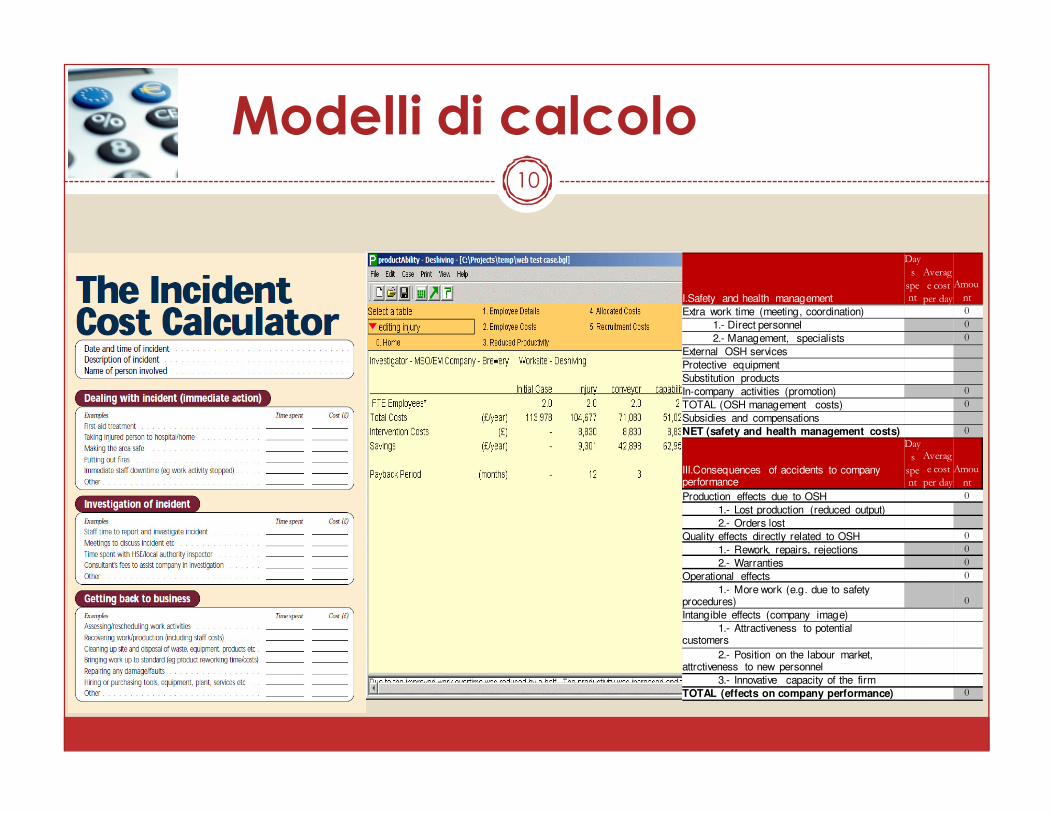
Modelli di calcolo
I.Safety and health management
Day
s
spent
Averag
e cost
per day
Amou
nt
Extra work time (meeting, coordination) 0
1.- Direct personnel 0
2.- Management, specialists 0
External OSH services
Protective equipment
Substitution products
In-company activities (promotion) 0
TOTAL (OSH management costs) 0
Subsidies and compensations
NET (safety and health management costs) 0
III.Consequences of accidents to company performance
Day
s
spent
Averag
e cost
per day
Amou
nt
Production effects due to OSH 0
1.- Lost production (reduced output)
2.- Orders lost
Quality effects directly related to OSH 0
1.- Rework, repairs, rejections 0
2.- Warranties 0
Operational effects 0
1.- More work (e.g. due to safety procedures) 0
Intangible effects (company image)
1.- Attractiveness to potential customers
2.- Position on the labour market, attrctiveness to new personnel
3.- Innovative capacity of the firm
TOTAL (effects on company performance) 0
10
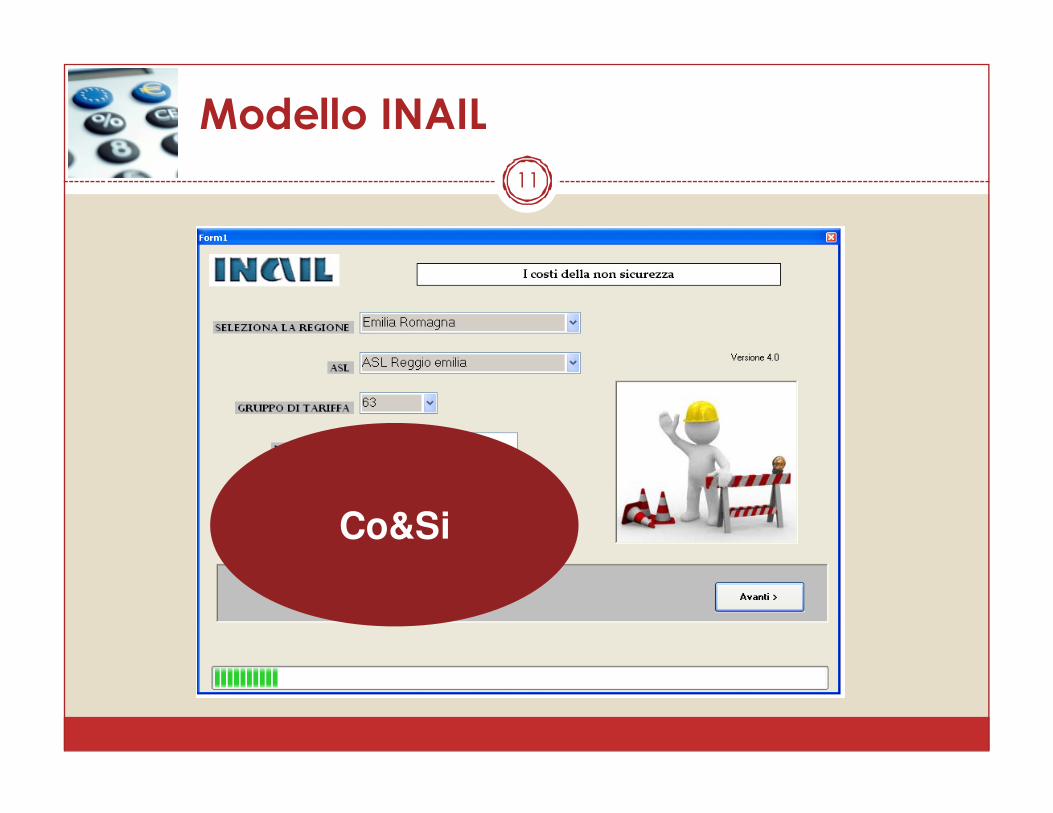
Modello INAIL
11
Co&Si
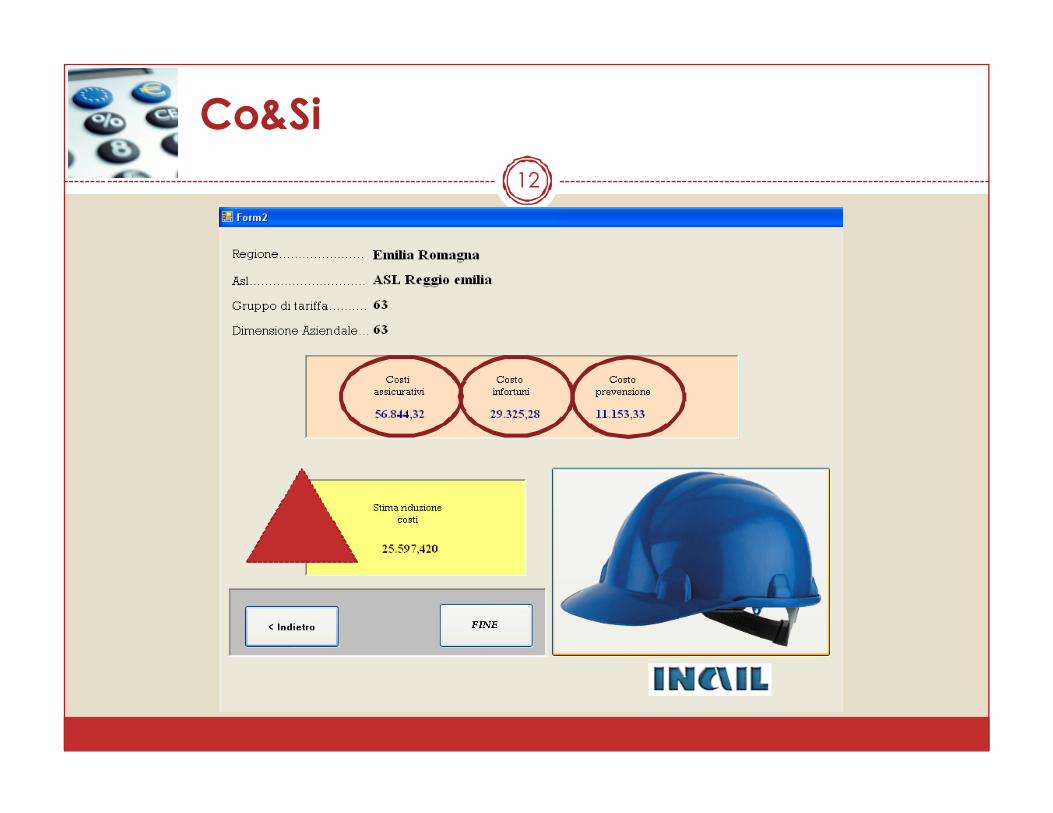
Co&Si
12
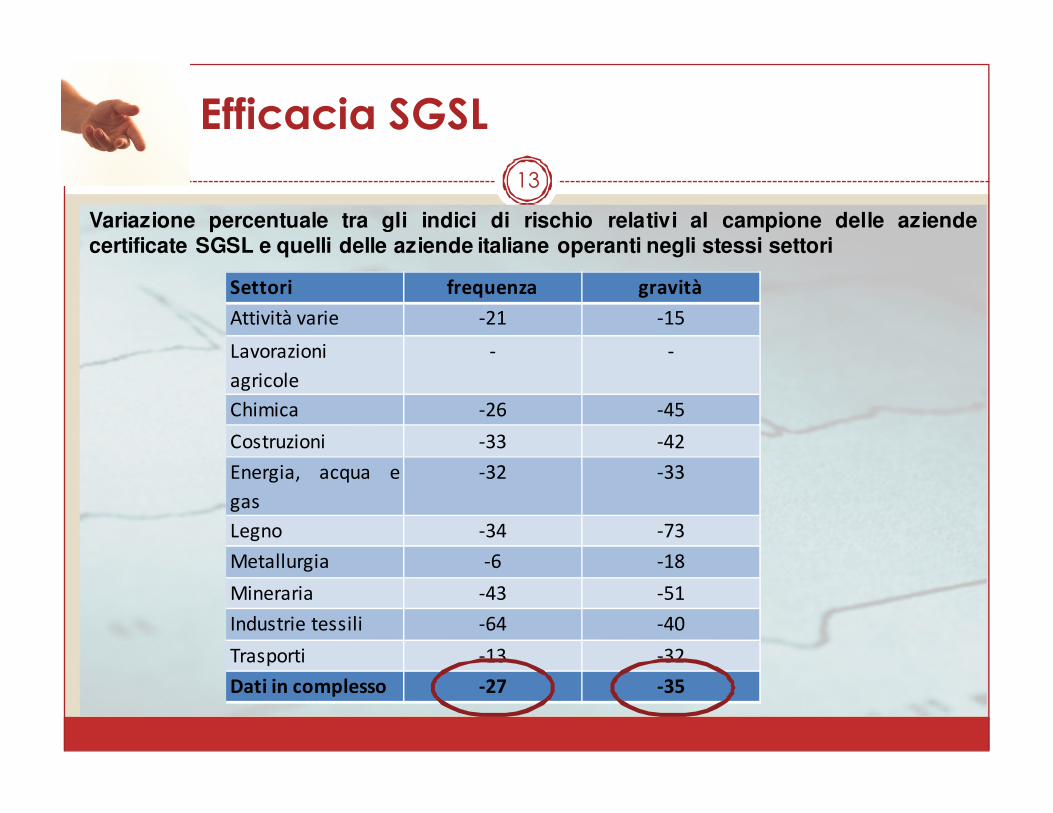
Efficacia SGSL
13
Settori frequenza gravità
Attività varie -21 -15
Lavorazioni
agricole
- -
Chimica -26 -45
Costruzioni -33 -42
Energia, acqua e
gas
-32 -33
Legno -34 -73
Metallurgia -6 -18
Mineraria -43 -51
Industrie tessili -64 -40
Trasporti -13 -32
Dati in complesso -27 -35
Variazione percentuale tra gli indici di rischio relativi al campione delle aziendecertificate SGSL e quelli delle aziende italiane operanti negli stessi settori
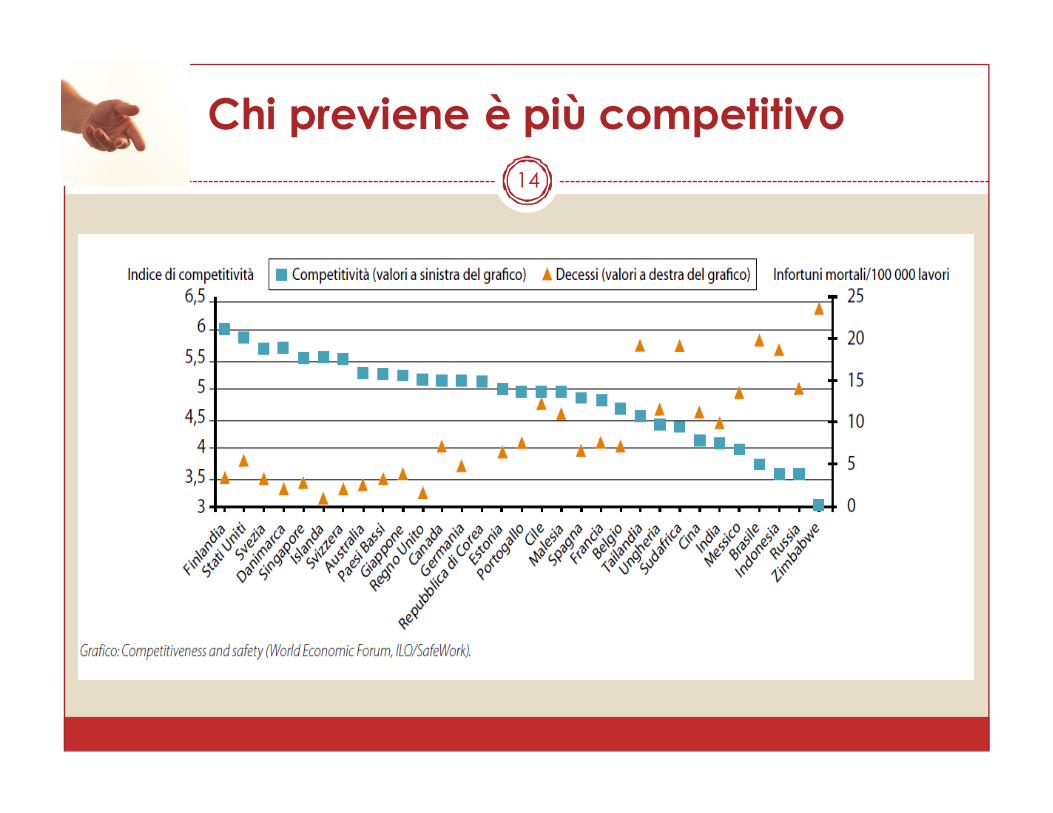
Chi previene è più competitivo
14
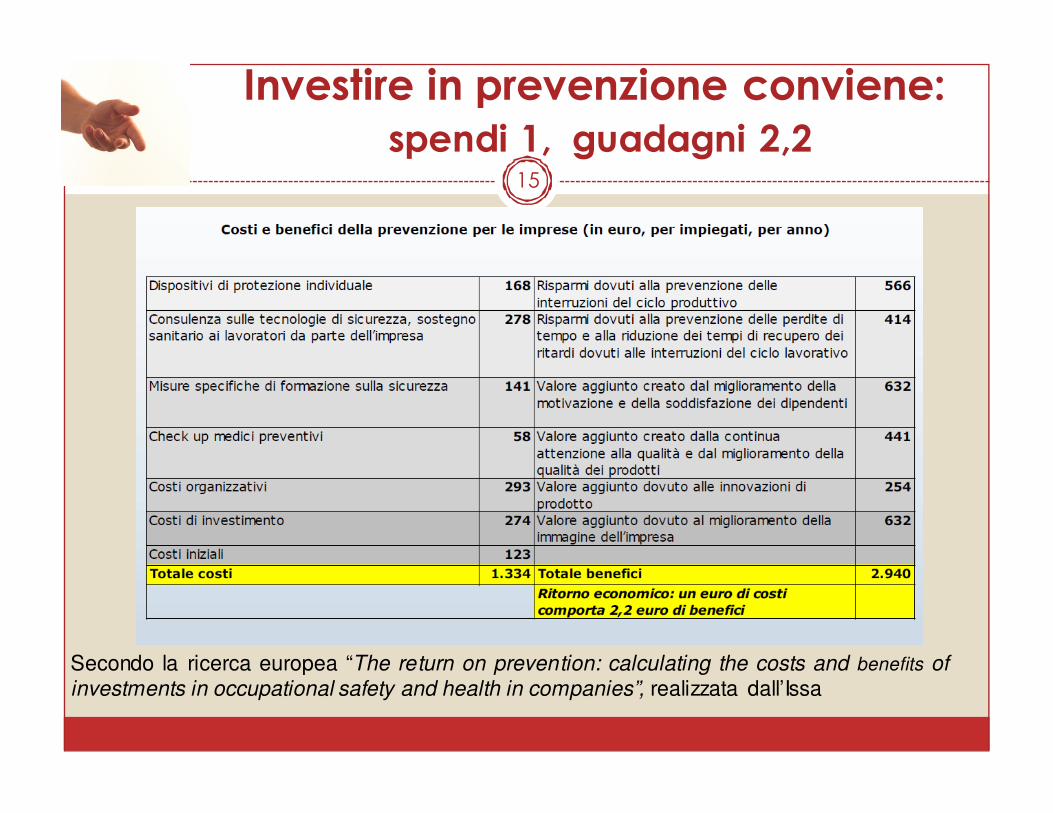
Investire in prevenzione conviene:spendi 1, guadagni 2,2
15
Secondo la ricerca europea “The return on prevention: calculating the costs and benefits ofinvestments in occupational safety and health in companies”, realizzata dall’Issa
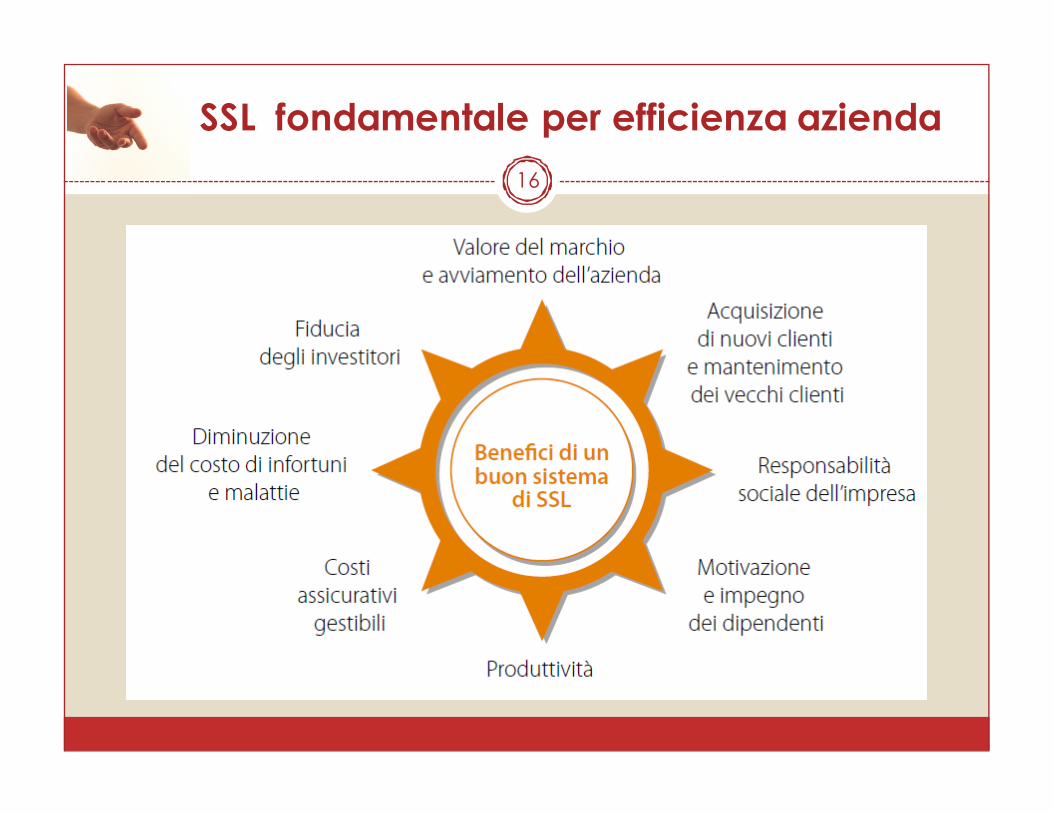
SSL fondamentale per efficienza azienda
16
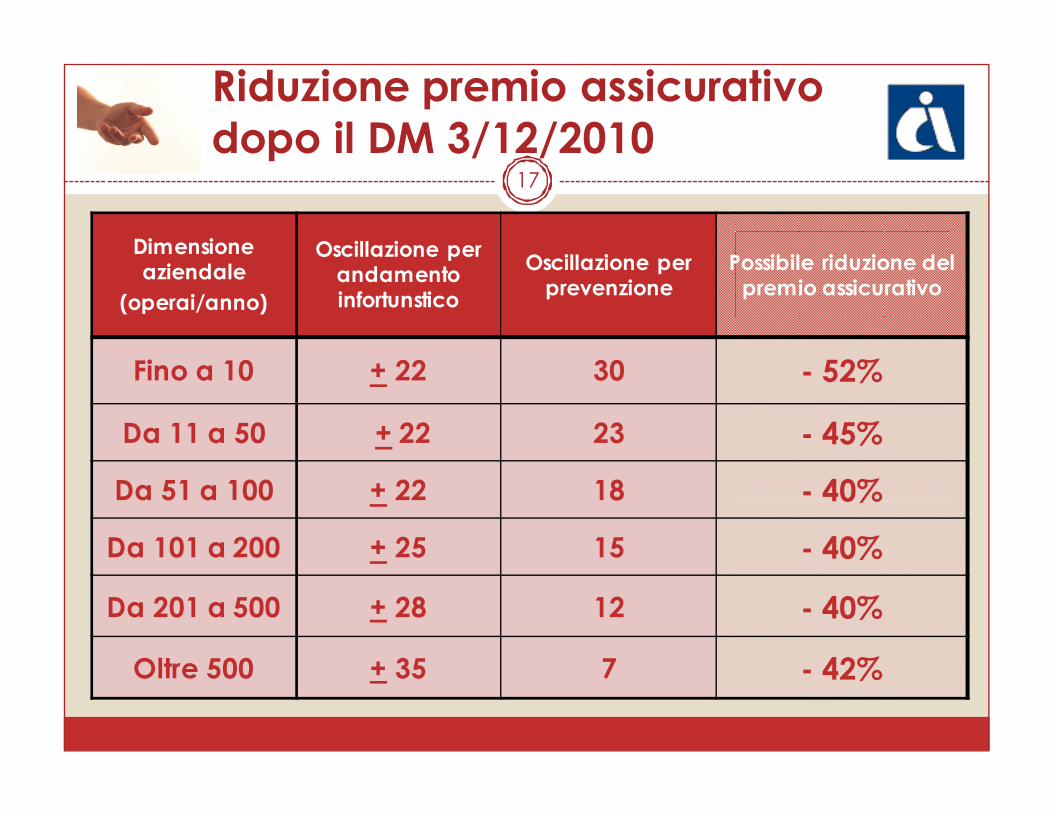
Riduzione premio assicurativo dopo il DM 3/12/2010
Dimensione aziendale
(operai/anno)
Oscillazione per andamento infortunstico
Oscillazione per prevenzione
Possibile riduzione del premio assicurativo
Fino a 10 + 22 30 - 52%
Da 11 a 50 + 22 23 - 45%
Da 51 a 100 + 22 18 - 40%
Da 101 a 200 + 25 15 - 40%
Da 201 a 500 + 28 12 - 40%
Oltre 500 + 35 7 - 42%
17
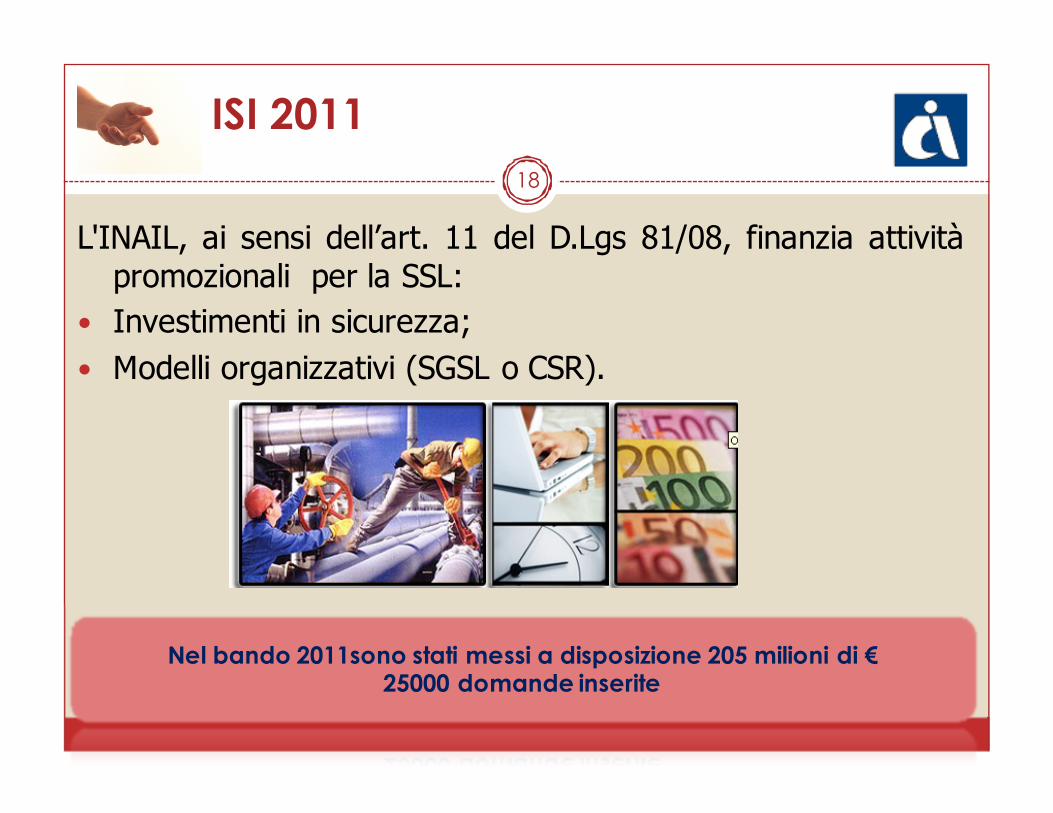
ISI 2011
L'INAIL, ai sensi dell’art. 11 del D.Lgs 81/08, finanzia attivitàpromozionali per la SSL:
� Investimenti in sicurezza;
� Modelli organizzativi (SGSL o CSR).
Nel bando 2011sono stati messi a disposizione 205 milioni di €25000 domande inserite
18
GRAZIE DELL’ATTENZIONE
Dott.ssa Maria Ilaria Barra
Safety is, without doubt , the most crucial investment we can make, and the question is
not what it costs us, but what it saves” Robert MacKee Chairman Conoco (UK)Ltd.
Top Related