UNIVERSITÀ DEGLI STUDI DI PADOVA - [email protected]/4842/1/TESI.pdf ·...
85
UNIVERSITÀ DEGLI STUDI DI PADOVA DIPARTIMENTO DI PEDIATRIA SCUOLA DI DOTTORATO DI RICERCA IN MEDICINA DELLO SVILUPPO E SCIENZE DELLA PROGRAMMAZIONE INDIRIZZO: MALATTIE RARE; GENETICA, BIOLOGIA E BIOCHIMICA CICLO XXIV EXTRACELLULAR MATRIX-DEGRADING ENZYMES AND CONTROL OF FIBROBLAST GROWTH FACTOR-2 (FGF-2) SIGNALING IN PEDIATRIC GLIOMA CELL LINES Direttore della Scuola: Ch.mo Prof. Giuseppe Basso Coordinatore d’indirizzo: Ch.mo Prof. Giorgio Perilongo Supervisore: Dott. Maurizio Onisto Co-supervisore: Ch.mo Prof. Paolo Mignatti Dottoranda: Evelyne Tassone
Transcript of UNIVERSITÀ DEGLI STUDI DI PADOVA - [email protected]/4842/1/TESI.pdf ·...

UNIVERSITÀ DEGLI STUDI DI PADOVA
DIPARTIMENTO DI PEDIATRIA
SCUOLA DI DOTTORATO DI RICERCA
IN MEDICINA DELLO SVILUPPO E SCIENZE DELLA PROGRAMMAZIONE
INDIRIZZO: MALATTIE RARE; GENETICA, BIOLOGIA E BIOCHIMICA
CICLO XXIV
EXTRACELLULAR MATRIX-DEGRADING ENZYMES
AND CONTROL OF FIBROBLAST GROWTH FACTOR-2 (FGF-2) SIGNALING
IN PEDIATRIC GLIOMA CELL LINES
Direttore della Scuola: Ch.mo Prof. Giuseppe Basso
Coordinatore d’indirizzo: Ch.mo Prof. Giorgio Perilongo
Supervisore: Dott. Maurizio Onisto
Co-supervisore: Ch.mo Prof. Paolo Mignatti
Dottoranda: Evelyne Tassone


Table of contents
Summary 1
Riassunto 3
Chapter 1: Introduction 5
1.1 Primary central nervous system tumors 5
1.2 Pediatric gliomas 5
1.2.1 Definition and characteristics of gliomas 5
1.2.2 Classification by cell type and localization 7
1.2.3 Classification by grade 8
1.2.4 Astrocytomas 9
1.2.5 Clinical presentation 10
1.2.6 Tumor biology 11
1.2.7 Treatment and outcomes 12
1.3 The extracellular matrix in the central nervous system 13
1.4 Molecular biology of glioma cell invasion 14
1.5 Matrix metalloproteinases (MMPs) 15
1.6 MT1-MMP 17
1.6.1 Protein structure 17
1.6.2 Functions and regulation 18
1.7 Heparan sulfate proteoglycans 20
1.8 Heparanase 21
1.8.1 Structure, functions and regulation 21
1.8.2 Pro-metastatic and pro-angiogenic properties 22
1.9 Fibroblast growth factor-2 (FGF-2) 23
1.9.1 FGF-2 and FGF receptors (FGFRs) 23
1.9.2 Role in angiogenesis and tumor growth 25
Chapter 2: Project aims 27
Chapter 3: Materials and Methods 29
3.1 Reagents 29
3.2 Cell lines and culture media 30

3.3 Cell treatments 31
3.3.1 FGF-2 treatment 31
3.3.2 TIMP-2 treatment 31
3.4 RNA extraction and cDNA synthesis 31
3.5 Semi-quantitative PCR and Real-Time quantitative PCR 31
3.6 Transient and stable transfections 32
3.7 Protein extraction and Western blotting 33
3.8 Biotinylation of soluble and cell surface associated FGF-2 34
3.9 Gelatin zymography 35
3.10 Cell proliferation assay 35
3.11 Statistical analysis 35
Chapter 4: Results 37
4.1 Pediatric glioma cell lines 37
4.2 HPSE expression in pediatric glioma cells and HPSE silencing
in SF188 cells 38
4.3 Effects of HPSE silencing on MMP-2, MT1-MMP and VEGF
expression in SF188 cells 39
4.4 Effects of HPSE silencing on SF188 cell proliferation 40
4.5 MT1-MMP, FGF-2 and FGFRs expression in MCF-7 cells 41
4.6 ERK1/2 activation by FGF-2 in MCF-7 cells expressing MT1-MMP 43
4.7 Effects of MT1-MMP on cell-associated FGF-2 46
4.8 Characterization of cell-associated FGF-2 48
4.9 Effects of decreased FGF-2 binding on MCF-7 cell proliferation 50
4.10 MT1-MMP, FGF-2 and FGFRs expression in pediatric glioma cells 51
4.11 ERK1/2 activation by FGF-2 in pediatric glioma cells 53
4.12 Effects of FGF-2 on pediatric glioma cell proliferation 58
4.13 ERK1/2 activation by TIMP-2 in pediatric glioma cells 60
Chapter 5: Discussion 63
Bibliography 73
Publications 81

1
Summary
The main purpose of my research project was to investigate the role of two extracellular
matrix-degrading enzymes, heparanase (HPSE) and membrane-type 1 matrix
metalloproteinase (MT1-MMP), in pediatric gliomas. I spent the first two years of my
PhD program in Dott. Maurizio Onisto’s laboratory (University of Padua). Then I
continued my work at New York University School of Medicine, under the supervision of
Prof. Paolo Mignatti, whose experimental work focuses on the molecular mechanisms of
proteolysis-independent signaling by MT1-MMP and its physiological inhibitor, tissue
inhibitor of metalloproteinase-2 (TIMP-2).
Gliomas, the most common primary brain tumors, comprise a heterogeneous group of
neoplasms that originate from glial cells. Despite recent advances in the management of
these tumors, children affected by gliomas, particularly the more aggressive forms, have a
poor prognosis. Gliomas can diffusely penetrate throughout the brain, even though they
remain localized in this organ. One of the most important events during glioma cell
invasion is extracellular matrix (ECM) degradation, a complex mechanism that involves
both glycosidic and proteolytic enzymes. HPSE is an endo-β-D-glucuronidase secreted in
the ECM, where it cleaves the heparan sulfate side chains of both soluble and membrane-
bound proteoglycans. MT1-MMP, a cell membrane-bound proteinase with an
extracellular catalytic domain and a short cytoplasmic tail, has been implicated in the
proteolytic degradation of extracellular and transmembrane proteins. High levels of HPSE
and MT1-MMP are present in a variety of aggressive malignancies, a finding that
highlights their important role in cancer invasion and metastasis.
In this study we characterized pediatric glioma cell lines derived from different types of
gliomas: two glioblastoma multiforme, one anaplastic astrocytoma, one diffuse
astrocytoma and one pilocytic astrocytoma. In addition, we used human MCF-7 breast
adenocarcinoma cells to examine the role of MT1-MMP, because these cells do not
express this proteinase and thus represent an ideal model for the regulation of its
expression.
The data reported show that MT1-MMP inhibits activation of intracellular signaling
(ERK1/2) by fibroblast growth factor-2 (FGF-2) in MCF-7 cells. MT1-MMP does not
degrade FGF-2 but reduces FGF-2 binding to the surface of MCF-7 cells. Since the
biological effects of FGF-2 are mediated by its low- (heparan sulfate proteoglycans,
HSPGs) and high-affinity receptors (FGFRs), we hypothesize that MT1-MMP controls
FGF-2 interaction with these receptors.
In contrast, we found no clear correlation between HPSE, MT1-MMP or FGF-2
expression and the aggressiveness of the pediatric astrocytoma cells. The results show

2
that gene silencing of HPSE in a pediatric glioblastoma cell line does not affect vascular
endothelial growth factor (VEGF) expression or cell proliferation, but upregulates matrix
metalloproteinase-2 (MMP-2) and MT1-MMP expression. Moreover, ERK1/2 activation
by FGF-2 inversely correlates with MT1-MMP expression in these pediatric glioma cells,
although they express MT1-MMP in its inactive, proenzyme form. Unlike in MCF-7
cells, ERK1/2 activation by FGF-2 was decreased in the glioma cells by an MMP
inhibitor, suggesting the involvement of MMPs other than MT1-MMP in pediatric
astrocytoma activation of ERK1/2. No differences in ERK1/2 activation by FGF-2 were
detected in glioma cells transfected with wt MT1-MMP, even though MT1-MMP was
expressed in its active form. Finally, TIMP-2 induced ERK1/2 activation in all glioma
cells irrespective of MT1-MMP expression. Because in the MCF-7 cells ERK1/2
activation by TIMP-2 is mediated by MT1-MMP, this finding indicates that in pediatric
glioma cells TIMP-2 may have signaling functions independent of MT1-MMP.
Taken together, the results show that in MCF-7 cells MT1-MMP controls ERK1/2
activation by FGF-2 and FGF-2 interaction with its receptors. However, MT1-MMP does
not have these effects in pediatric glioma cells, indicating a more complex control
mechanism of intracellular signaling. This initial characterization of these unique
pediatric astrocytoma cell lines provides new insights into the knowledge of this poorly
studied group of tumors.

3
Riassunto
L’obiettivo principale del mio progetto di ricerca è stato analizzare il ruolo di due enzimi
che degradano la matrice extracellulare, l’“heparanase” (HPSE) e la “membrane-type 1
matrix metalloproteinase” (MT1-MMP), nei gliomi pediatrici. Ho trascorso i primi due
anni di Dottorato nel laboratorio del Dott. Maurizio Onisto (Università di Padova). Ho poi
continuato il mio lavoro presso la New York University School of Medicine, sotto la
supervisione del Prof. Paolo Mignatti, il cui lavoro sperimentale è focalizzato
sull’approfondimento dei meccanismi molecolari alla base dell’attivazione del segnale
intracellulare da parte di MT1-MMP e del suo inibitore fisiologico, il “tissue inhibitor of
metalloproteinases-2” (TIMP-2).
I gliomi, i più comuni tumori cerebrali primari, comprendono un gruppo eterogeneo di
neoplasie che originano dalle cellule gliali. Nonostante i recenti progressi raggiunti nel
trattamento e nel controllo di tali tumori, la prognosi dei bambini affetti da glioma, ed in
particolare dalle sue forme più aggressive, rimane tuttora infausta. Pur essendo confinati
nell’organo nel quale originano, i gliomi posso invadere tutte le aree del cervello. Uno
degli eventi più importanti che caratterizzano l’invasività dei gliomi è costituito dalla
degradazione della matrice extracellulare, un complesso meccanismo che coinvolge
enzimi sia glicosidici sia proteolitici. HPSE è una endo-β-D-glucuronidasi secreta nella
matrice extracellulare, nella quale taglia le catene di eparan solfato dei proteoglicani
solubili e legati alla membrana. MT1-MMP, una proteasi legata alla membrana e
composta da un dominio catalitico extracellulare e da una piccola coda citoplasmatica, è
coinvolta nella degradazione proteolitica di proteine extracellulari e di membrana. Elevati
livelli di HPSE e MT1-MMP sono stati riscontrati in numerosi tipi di tumore e tale
evidenza sottolinea il ruolo chiave che essi svolgono nell’invasività tumorale e nella
formazione di metastasi.
In questo studio sono state caratterizzate cinque linee cellulari di glioma pediatrico
derivanti da diversi tipi di glioma: due glioblastomi multiformi, un astrocitoma
anaplastico, un astrocitoma diffuso ed un astrocitoma pilocitico. Con lo scopo iniziale di
esaminare il ruolo di MT1-MMP nell’attivazione del segnale indotto dall’FGF-2, sono
state inoltre utilizzate cellule di carcinoma mammario MCF-7, le quali non esprimono
MT1-MMP e perciò rappresantano un modello ideale per studiare la regolazione della sua
espressione.
I dati riportati mostrano che nelle cellule MCF-7 MT1-MMP inibisce l’attivazione del
segnale intracellulare (ERK1/2) da parte del “fibroblast growth factor-2” (FGF-2). MT1-
MMP non degrada l’FGF-2, ma riduce il legame di questo fattore di crescita alla
superficie delle cellule. Poichè gli effetti biologici dell’FGF-2 sono mediati dai suoi

4
recettori a bassa e ad alta affinità (rispettivamente proteoglicani eparan solfato e recettori
tirosin chinasici), ipotizziamo che MT1-MMP controlli l’interazione tra l’FGF-2 ed i suoi
recettori.
Nelle cellule di astrocitoma pediatrico non è stata identificata alcuna chiara correlazione
tra espressione di HPSE, MT1-MMP o FGF-2 ed aggressività tumorale. I risultati inoltre
dimostrano che il silenziamento genico di HPSE in una linea cellulare di glioblastoma
pediatrico non influenza l’espressione del “vascular endothelial growth factor” (VEGF) o
la proliferazione cellulare, ma determina la sovraespressione della “matrix
metalloproteinase-2” (MMP-2) e di MT1-MMP. Inoltre, nelle cellule di glioma,
l’attivazione di ERK1/2 da parte di FGF-2 è inversamente correlata all’espressione di
MT1-MMP, nonostante in queste cellule MT1-MMP sia espressa in forma di proenzima
inattivo. Al contrario di quanto accade nelle cellule MCF-7, nelle cellule di glioma
l’attivazione di ERK1/2 da parte dell’FGF-2 è inibita dal trattamento con un inibitore di
MMP, suggerendo che in queste cellule MMP diverse da MT1-MMP possano essere
coinvolte nell’attivazione di ERK1/2. Questa ipotesi è sostenuta anche dall’osservazione
che nelle cellule di glioma trasfettate con MT1-MMP wt non si ottiene alcuna
diminuzione dell’attivazione di ERK1/2 dall’FGF-2, anche se MT1-MMP è espressa in
forma attiva. Infine, al contrario delle cellule MCF-7, in tutte le cellule di glioma, TIMP-2
induce l’attivazione di ERK1/2 indipendentemente dall’espressione di MT1-MMP.
Poichè nelle cellule MCF-7 l’attivazione di ERK1/2 da parte di TIMP-2 è mediata da
MT1-MMP, questa osservazione indica che nelle cellule di glioma pediatrico il TIMP-2
può attivare segnali intracellulari con un meccanismo indipendente da MT1-MMP.
In conclusione, i risultati ottenuti mostrano che nelle cellule MCF-7 MT1-MMP controlla
l’attivazione di ERK1/2 da parte dell’FGF-2 e l’interazione di questo fattore di crescita
con i suoi recettori. Al contrario, MT1-MMP non ha questi effetti nelle cellule di glioma
pediatrico, indicando l’esistenza di un più complesso meccanismo di controllo del segnale
intracellulare. La caratterizzazione delle linee cellulari di astrocitoma pediatrico
presentata in questa tesi offre una più completa conoscenza di questo gruppo di tumori
ancora poco studiati.

5
Chapter 1: Introduction
1.1 Primary central nervous system tumors
Primary central nervous system (CNS) tumors account for approximately 2-3% of all
cancer types; in Western Europe, North America and Australia, the mortality rates for
these tumors are 3 - 7 per 100,000 people per year [1]. CNS tumors, together with
leukemia, are the leading cause of childhood cancer-related mortality [2]. These tumors
comprise a heterogeneous group of benign and malignant neoplasms that originate from
brain cells, the membranes around the brain (meninges), nerves, or glands. They can
directly affect normal brain cells, but also produce inflammation and increase pressure in
the brain. The causes of primary brain tumors are still unknown. Genetic predisposition to
brain tumors appears relatively uncommon, although they may be inherited as a part of
several familial diseases, such as neurofibromatosis; moreover, environmental factors
associated with primary brain tumors are difficult to identify. Tumors may occur at any
age, but most brain tumors are rare in the first year of life [3]. Over the past three
decades, the management of brain tumors in children has positively evolved reflecting
refinements in tumor classification, delineation of risk groups within histological subsets
of tumors, and incorporation of recently developed molecular and imaging techniques.
These advances have improved the outcome of some childhood brain tumors, even
though the prognosis of other cancer types remains still very poor. Pediatric brain tumors
are usually treated by different approaches involving surgery, radiation and
chemotherapy. The specific modalities depend on tumor histology, location, patient’s age,
and risk factors of the individual tumor subgroups [4].
1.2 Pediatric gliomas
1.2.1 Definition and characteristics of gliomas
Histologically, human tumors are diagnosed and graded according to the World Health
Organization (WHO) system, most recently published in 2007 [5], which firstly classifies
brain tumors into glial and nonglial (neuronal) tumors.
As reported in the population-based study by Kaatsch and colleagues [6], glial tumors (or
gliomas) comprise approximately 60% of pediatric brain tumors, whereas the remaining
40% are heterogeneous and consist of medulloblastomas and other embryonal tumors,
craniopharyngiomas, pineal tumors, meningiomas, and others (Table 1.1) [7].

6
A glial tumor is a primary brain tumor arising from the supportive cells of the brain,
named glial or neuroglial cells, the most common cellular component of the brain. Glial
cells surround and provide mechanical support and electrical insulation for the neurons in
the CNS; together with neurons, they compose the tissue of the CNS. As shown in Fig.
1.1, different types of glial cells exist: astrocytes, microglial cells, ependymal cells, and
oligodendrocytes.
Table 1.1. Main histological subtypes, WHO grade, and
frequency of CNS tumors in children (data from Kaatsch et
al., 2001) [7].
Figure 1.1. Neuroglial cells: (a) astrocyte; (b) microglial cell; (c)
ependymal cell; (d) oligodendrocyte. Copyright © 2004 Pearson
Education, Inc.

7
Astrocytes have a characteristic star-like morphology with long cytoplasmic processes
that connect neurons and capillary endothelial cells. They provide both mechanical and
metabolic support for neurons, regulating the environment where they function; they
contribute to the blood-brain barrier structure, control the transport of different molecules
from blood to neural tissue and coordinate nerve pathway development.
Microglial cells, easily recognized for their small size, provide a protective function to the
nervous tissue.
Ependymal cells form the linings of the ventricles of the brain and the central canal of the
spinal cord, and contribute to the production of cerebrospinal fluid (CSF).
The name of the fourth type of glial cells, the oligodendrocytes, derives from their limited
number of dendritic processes, which provide electrical insulation for the adjacent
neurons by forming a part of the myelin sheath, and thereby increasing the speed of
transmission of action potentials along that axon (Fig. 1.1).
Gliomas diffusely penetrate throughout the brain, but they do not metastasize and remain
localized in their organ compartment. In contrast to most other malignant tumors, gliomas
grow in a terminally differentiated organ, the brain, with no regular and cyclical cell
turnover, unlike epithelia or bone marrow. Although pools of cycling cells may be found
in the brain, they are highly discrete, and their mitotic activity is expressed only under
specific circumstances, such as following injury. Importantly, the CNS is protected by the
blood-brain barrier, which prevents the entry of numerous drugs, including many
systemically effective chemotherapeutic agents [8].
1.2.2 Classification by cell type and localization
The WHO system classifies gliomas mainly by their morphological resemblance to the
respective normal glial cells from which they derive, cytoarchitecture and
immunohistological marker profile. Gliomas arise from astrocytes (astrocytomas),
oligodendrocytes (oligodendrogliomas) and ependymal cells (ependymomas). In some
cases, gliomas can have mixed features and are therefore named mixed gliomas (for
example, oligoastrocytoma) (Table 1.2).
Because the localization of brain tumors plays an important role in the overall prognosis,
gliomas are further categorized by their anatomical site into the following groups:
supratentorial (in the cerebrum), brain stem, and cerebellar gliomas [7].

8
1.2.3 Classification by grade
In addition to the classifications described above, there is also a WHO grading system
that assigns a grade from I to IV to each type of tumor, with I being the least aggressive
and IV the most malignant. The WHO grading scheme is determined by the pathologic
evaluation of the tumor and the presence of specific factors, including atypia, mitosis,
endothelial proliferation, and necrosis. Grade I and II tumors are also defined as low-
grade gliomas, whereas grade III and IV are called high-grade gliomas. The system
distinguishes four grades for astrocytomas (I, II, III and IV) and two grades (II and III) for
oligodendrogliomas and oligoastrocytomas [5].
Although the WHO system is based only upon adult tumors, which share many
morphological features with their pediatric counterparts, it is important to remember that
this classification may not be strictly representative of the histopathological differences
characteristic of childhood. Furthermore, recent molecular findings have shown that the
Table 1.2. Gliomas, tumor grades, and frequency according to
the WHO classification of CNS tumors [7].

9
identified histological groups comprise several entities with morphological similarities
but distinct pathways of tumorigenesis, and these molecular differences may play a key
role in determining the appropriate therapeutic approach.
1.2.4 Astrocytomas
For the purposes of this thesis, only astrocytomas will be considered in the next
paragraphs, and in particular a specific subtype for each grade of astrocytoma will be
extensively examined, as reported in Table 1.3.
Tumor Grade
Pilocytic astrocytoma I
Diffuse astrocytoma II
Anaplastic astrocytoma III
Glioblastoma IV
Table 1.3. Astrocytomas and tumor grade.
Pilocytic astrocytoma
This particular type of astrocytoma has been referred to as pilocytic - meaning “hair-
like”- because its cells often show a biphasic, ‘‘piloid’’ pattern, with long and bipolar
processes. Pilocytic astrocytoma is the most frequent pediatric glioma, with an incidence
equal to 20% of all tumors in children up to 14 years of age, and 15% in teenagers aged
15 to 18 years. Pilocytic astrocytoma is a grade I glioma, usually well-circumscribed,
slow-growing, with a morphologically benign appearance. It is usually associated with a
favorable prognosis, as indicated by a 10-year survival rate of 96% [9]. It can be localized
in the cerebellum, the hypothalamic/optic pathways, thalamic region, cerebral
hemispheres, brain stem, and spinal cord. Microcystic regions and other regions with
oligodendroglioma-like cells can be found in the tumor besides the typical compact
‘‘piloid’’ areas.
Diffuse astrocytoma
Diffuse astrocytoma is about 6 to 7 times less common in children than pilocytic
astrocytoma. It is classified as a grade II glioma because of its tendency to be well
differentiated and infiltrative, with increased cell density and some cellular anomalies or
atypias. Tumor cells can generate a loosely structured, often microcystic tumor matrix.
Diffuse astrocytoma can be located in any region of the CNS, with the most frequent
location being the frontal and temporal lobes. Although this low-grade tumor presents
specific genetic alterations (paragraph 1.2.6), and their accumulation may correlate with

10
tumor progression and malignancy, the evolution of the disease into anaplastic
astrocytoma or secondary glioblastoma is only observed in about 10% of children with
this tumor [7,10,11].
Anaplastic astrocytoma
Anaplastic astrocytoma principally arises in the cerebral hemispheres, with the same
frequency in children as diffuse astrocytoma. As a grade III tumor, anaplastic astrocytoma
is characterized by rapid and infiltrative growth, and shows signs of increased vessel
density, cellular atypias, anaplasia, elevated mitotic activity and high cell density.
Glioblastoma
Glioblastoma, a grade IV astrocytoma typically located in the fronto-temporal region,
occurs about 1.5 times more often than anaplastic astrocytoma in children, but is
approximately 100 times less common in children than in adults, where it usually
manifests. Glioblastoma, the most aggressive and diffusely infiltrating glioma, shows
vascular endothelial proliferation, necrosis, very high cell density, nuclear atypias and
mitotic activity. It mostly occurs de novo (primary glioblastoma), but can also evolve
from a preceding low-grade astrocytoma (secondary glioblastoma) [7,8].
1.2.5 Clinical presentation
Because pediatric low-grade gliomas encompass a heterogeneous group of tumors with
different histology and behavior, clinical presentation can vary accordingly. Almost 50%
of children have symptoms for 6 months or longer prior to diagnosis. Patients usually
show nonspecific symptoms due to increased intracranial pressure from obstruction of the
ventricles, including headache (particularly in the morning), nausea, vomiting and
lethargy. Physical examination findings include decreased upward gaze, sixth cranial
nerve palsies, and papilledema. These are most often caused by tumors located in the
cerebellum, optic chiasm/hypothalamus, dorsally exophytic brain stem, and tectum. Other
symptoms are specific for tumor localization and include focal neurological findings,
seizures and endocrinopathies [12].
Children with high-grade gliomas can also present with a variety of signs and symptoms
that vary according to tumor localization and child’s age. In this case, the history is
typically short, with an evolution of symptoms measured in a few months to weeks,
sometimes even days. Patients with cortical tumors often show seizures as their first
manifestation, but they also can experience hemiparesis, visual field deficits, and
headache. A mass that obstructs cerebrospinal fluid’s flow and causes hydrocephalus
often produces morning headache, vomiting, and papilledema. Very young children may

11
have nonspecific symptoms, such as irritability, lethargy, vomiting, failure to thrive, or
macrocephaly [13].
1.2.6 Tumor biology
The tumorigenesis of pediatric gliomas is not well-understood. Typical cytogenetic and
molecular abnormalities of adult gliomas occur less frequently and with different patterns
in children, and to date only few of them have been identified as specific of children.
Studying tumors in children affected by genetic susceptibility syndromes improves the
knowledge about the signal transduction pathways involved in the development of low-
grade gliomas. In particular, in children with type 1 neurofibromatosis the inactivation of
the tumor suppressor neurofibromin results in increased Ras activity and astrocyte
proliferation. This aberrant activation is responsible for the formation of low-grade
astrocytomas in 15% to 20% of type 1 neurofibromatosis patients [14]. Moreover, some
type 1 neurofibromatosis children with pilocytic astrocytomas show frequent activation of
the mammalian target of rapamycin (mTOR) pathway [15].
Activating mutations of KRAS, which also result in the activation of MAPK signaling,
have been reported in a minor fraction of sporadic pilocytic astrocytomas [16].
Adult low-grade gliomas show frequent p53 mutations, which in children account for
only 5% to 10% of low-grade gliomas [17].
Many studies have also revealed a balanced karyotype in a majority of pilocytic
astrocytomas, although duplication of chromosomes 5 and 7 are the most frequently
found chromosomal aberrations. A small nonrandom duplication in the 7q34 region can
be present in pilocytic astrocytomas. This duplication involves the oncogene BRAF and
causes the up-regulation of the RAS/RAF/MEK pathway [12,18]. Loss of heterozygosity
of chromosomal regions 1p36 and 19q13 is a favorable prognostic factor in adults with
oligodendrogliomas, but not in pediatric tumors [19].
The gain of chromosomal material at chromosome arm 1q is associated with a
significantly shorter survival in pediatric anaplastic astrocytomas [20]. Other specific
genomic aberrations of these tumors are gains of 5q and losses of 6q, 9q, 12q, and 22q.
Mutations in the PTEN tumor suppressor gene at 10q23 are rarely observed in pediatric
anaplastic astrocytoma (6%), and are associated with poor prognosis [21].
Although pediatric and adult glioblastomas are histologically very similar, the genetic and
molecular analysis of these tumors suggests that most childhood lesions arise through
molecular pathways distinct from those characteristic of adults.
TP53 mutations, always associated with secondary glioblastoma in adults, frequently
occur in de novo (primary) pediatric glioblastomas [22].

12
Genomic amplification or rearrangement of the epidermal growth factor receptor (EGFR)
gene are the most common genetic aberrations in adult primary glioblastoma, but they are
rarely (less than 10%) observed in pediatric tumors [23].
Similarly, mutations of the PTEN tumor suppressor gene at 10q23 occur less frequently in
pediatric glioblastomas than in adult tumors, and are associated with poor prognosis [21].
Some genetic aberrations, such as gains of 1q, 3q, and 16p, and losses of 8q, and 17p, are
more frequent in the pediatric age group [20].
According to the activation status of the MAPK and AKT pathways, two subsets of
pediatric glioblastomas with different prognosis can be defined. In particular, the
activation of these intracellular signaling cascades correlates with poor prognosis [24].
Amplification of the platelet-derived growth factor receptor α (PDGFRA) gene has been
detected in 15% of pediatric malignant gliomas, suggesting that the encoded protein may
be a relevant target for some tumors [4].
1.2.7 Treatment and outcomes
The success of treatment of patients affected by gliomas is highly dependent on tumor
localization.
Surgery alone can provide prolonged, disease-free survival for those pediatric low-grade
lesions that can be completely removed. Total resection is associated with 10-year overall
survival rates of 90% or greater and rare tumor relapses. Children can also undergo
subtotal resection or biopsy, and in some cases surgery is not feasible because of the
tumor proximity or invasion of vital structures. When progression occurs, adjuvant
therapies are initiated [25]. Radiation therapy typically results in an appreciable tumor
reduction in patients with low-grade gliomas, and may improve the time of disease-free
survival in children with partially resected lesions. Despite these potential benefits,
radiotherapy can have deleterious side effects on the developing nervous, endocrine, and
vascular systems, particularly in young children. For these reasons, chemotherapy is often
used as adjuvant therapy for children with progressive low-grade gliomas. The
combination of carboplatin and vincristine results in tumor reduction or stable disease,
but up to 40% of children experience hypersensitivity reactions. Alternative treatments
with other chemotherapeutic agents can also be effective [26].
Despite improvements in neurosurgery, radiotherapy, and chemotherapy, children with
pediatric high-grade gliomas are still difficult to treat, have a poor clinical outcome, and
most of them die within a few years of diagnosis. These tumors are invasive, aggressive,
and relatively rare in children, making large randomized clinical trials challenging. Since
many standard adult therapies have displayed only few benefits in children, the genetic
and molecular differences between pediatric and adult high-grade glial tumors could be
potentially important for the choice of the correct therapy.

13
Pediatric patients who undergo a complete surgical resection have a better chance at long-
term survival than those subjected only to biopsy and partial tumor resection. High-grade
gliomas almost always show response to radiation therapy, but this effect is usually
transient, and most patients experience recurrence or disease progression within 6-18
months of diagnosis. The addition of high-dose chemotherapy only provides a short
interval of disease control, with good initial responses to some chemotherapeutic agents,
but does not improve survival.
A better survival for pediatric high-grade gliomas has been recently achieved by using
combined treatment, based on radiation therapy and/or chemotherapy together with
agents that have shown promise in preclinical studies, such as radiosensitizers, anti-
angiogenic molecules, growth factor receptor inhibitors, and others. Although, for
example, survival does not appear to be improved when children are treated with
chemoradiotherapy and adjuvant temozolomide, hypermethylation of the O6-
methylguanine-DNA-methyltransferase (MGMT) promoter is predictive of greater
sensitivity to alkylating agents. Because of these still controversial results, biomedical
research efforts should be focused on the use of new multitherapeutic treatments that are
well-tolerated and offer the greatest anti-tumor activity for pediatric high-grade gliomas
[27].
1.3 The extracellular matrix in the central nervous system
Extracellular space accounts for approximately 20% of total volume in the mature brain,
and is filled with a highly structured and organized extracellular matrix (ECM). The ECM
components are synthesized by both neurons and glial cells, which can easily interact
with each other. The polysaccharide hyaluronic acid, a basic constituent of the brain
ECM, non-covalently binds to proteoglycans, such as chondroitin sulfate and heparan
sulfate proteoglycans, and glycoproteins, like for example tenascins and laminins. These
and other proteins contribute to the structural composition of the brain ECM [28].
ECM molecules are expressed in the developing embryo, and the ECM undergoes
significant changes during CNS development. The ECM of the embryonic and young
brain supports neurogenesis, gliogenesis, cell migration, axonal outgrowth, genesis and
rearrangements of synapses. ECM molecules also have a key role in the adult CNS, where
they are present in almost every structure of the brain and spinal cord; the adult ECM is
non-permissive for axonal outgrowth and inhibits regeneration and major reorganization
processes [29].
Despite its typical heterogeneity, the ECM functions as an extracellular presynaptic and
synaptic scaffold that directs the clustering of neurotransmitter receptors in the
postsynaptic compartment and as a barrier for reducing the diffusion of soluble and
membrane-associated molecules away from synapses. The ECM also supports the

14
migration and differentiation of stem cells present in the nervous system, and helps the
correct localization of ion channels and transporters between astrocytic processes and
blood vessels. Furthermore, the growth factors present in the ECM can bind to their
cognate receptors at the cell surface in both neurons and glial cells, thus contributing to
the regulation of different intracellular signaling pathways [30].
1.4 Molecular biology of glioma cell invasion
The biological mechanisms that underlie glioma cell invasion are not completely
understood. Single tumor cells can invade normal brain tissue, thus creating numerous
neoplastic lesions distinct from the primary tumor. This phenomenon involves cell
interactions with the ECM and adjacent cells, and active cell movement is supported by
specific biochemical processes. As shown in Fig. 1.2, tumor cell invasion requires four
different and sequential stages:
a) detachment of invading cells from the primary tumor mass,
b) adhesion to the ECM,
c) degradation of the ECM, and
d) cell movement and contraction.
The detachment of invading glioma cells from the primary tumor mass firstly involves the
destabilization and disorganization of cadherin-mediated junctions that hold the primary
mass together. After this event, decreased expression of connexin 43, an adhesion
molecule primarily expressed in astrocytes, leads to a reduction in gap junction formation,
which in turn facilitates uncontrolled cell division and de-differentiation. Finally, the
hyaluronan receptor CD44, which normally anchors the primary mass to the ECM, is
proteolytically cleaved.
Glioma cells adhere to the ECM by integrins, transmembrane glycoproteins that interact
with numerous ECM proteins, such as fibronectin, vitronectin, fibrinogen, and cell
surface molecules.
Figure 1.2. Schematic representation of the mechanism of glioma
invasion [31].

15
The degradation of different components of the ECM in order to allow the free movement
of invading glioma cells is a complex mechanism that involves both proteolytic and
glycosidic enzymes, such as the soluble and/or membrane-bound matrix
metalloproteinases (MMPs and/or MT-MMPs) and the heparan sulfate-degrading enzyme
heparanase, respectively. The expression and activity of these ECM-degrading enzymes
will be discussed in the following paragraphs.
The migration of glioma cells, the last event of the invasion process, is characterized by
the extension of a prominent leading cytoplasmic process followed by a forward
movement of the cell body. Glioma cell motility and contractility requires many signaling
molecules and cytoskeletal components, such as myosin II [31,32].
1.5 Matrix metalloproteinases (MMPs)
The ECM does not only provide a structural barrier to tissues or cells, but also actively
participates in cell proliferation, motility, survival and apoptosis. Many extracellular and
membrane-bound proteinases, such as the matrix metalloproteinases (MMPs), can
regulate these physiological processes, and also mediate several changes in the
microenvironment during tumor invasion and metastasis.
The MMPs belong to a family of zinc-dependent endopeptidases responsible for the
degradation of numerous protein targets in the ECM. To date, 23 MMP members have
been identified; they are divided in two groups based on their cellular localization
(secreted and membrane-bound), or in five main groups according to their structure and
substrate specificity: collagenases, gelatinases, membrane-type, stromelysins and
matrilysins [33].
As shown in Fig. 1.3, the minimal common structural domains of all MMPs are:
1. an amino-terminal signal sequence (Pre), cleaved by the signal peptidase and
necessary to direct the protein to the endoplasmic reticulum prior to its secretion,
2. a pro-domain (Pro) containing a thiol-group (-SH) and a furin cleavage site,
3. a catalytic domain with a zinc-binding site (Zn2+
).
Figure 1.3. Structural domains of MMPs [33].

16
MMPs are synthesized as inactive proenzymes (proMMPs), in which the -SH group of the
N-terminal cysteine residue of the prodomain interacts with the zinc ion of the catalytic
site. Only after disruption of this interaction by a mechanism called cysteine switch,
which is usually mediated by proteolytic removal of the prodomain or chemical
modification of the cysteine residue, the enzyme becomes proteolytically active. The
prodomain contains a consensus sequence for the activation of the protein; the proteolytic
cleavage of the prodomain can occur intracellularly by furin or in the extracellular space
by other MMPs or serine proteinases.
In addition to these minimal domains, most MMPs have a hemopexin-like region, o PEX
domain, consisting of four repeats with sequence similarity to the heme-binding protein
hemopexin. The PEX domain contains a disulfide bond (S-S) between the first and the
last subdomains, and is linked to the catalytic domain via a flexible “hinge” region. The
functions of the PEX domain are to provide substrate specificity and interaction with the
physiological tissue inhibitors of metalloproteinases (TIMP). Within the PEX domain the
gelatinases MMP-2 and -9 possess gelatin-binding repeats that resemble the collagen-
binding type II motif of fibronectin (FN).
The membrane-bound MMPs (membrane-type MMP, or MT-MMP) also possess at the
C-terminus either a transmembrane (TM) and a cytoplasmic domain (Cy), or a
glycosylphosphatidylinositol (GPI) anchor. MMP-23 is unique in its structure as it is
bound to the cell membrane through an N-terminal signal anchor (SA) and contains a
unique cysteine array (CA) and an immunoglobulin (Ig)-like domain.
Because of their high proteolytic activity and potentially disastrous effects on the cell
microenvironment, MMPs are tightly controlled at both transcriptional and post-
transcriptional levels.
The net activity of MMPs in the tissue microenvironment depends on the local balance
between active proteolytic enzymes and their physiological inhibitors. MMPs are firstly
regulated by TIMPs, which are normally expressed in most normal and tumor tissues.
TIMP-1, -2, -3, and 4 form reversible 1:1 stoichiometric complexes with active MMPs
leading to inhibition of the proteolytic activity. Although both MMPs and TIMPs are
expressed by cancer cells, they can also be synthesized and secreted by stromal cells
infiltrating the tumor, such as inflammatory cells (neutrophils, macrophages, dendritic
cells, lymphocytes, and mast cells), endothelial cells, fibroblasts, and hemopoietic
progenitor cells.
MMPs can promote carcinogenesis and play a direct role in cell adhesion, migration,
tumor angiogenesis, and proteolytic processing of cytokines, chemokines, growth factors
or their receptors, underlying the complex nature of tumorigenesis [34].

17
1.6 MT1-MMP
1.6.1 Protein structure
Membrane-type 1 matrix metalloproteinase (MT1-MMP or MMP-14), the prototypical
member of the MT-MMPs, is characterized by an overall protein structure similar to
secreted MMPs with a catalytic domain, a flexible linker peptide and a hemopexin-like
domain but, unlike its soluble counterparts, the enzyme is bound to the cell surface by a
C-terminal transmembrane region that terminates in a short, 20-aminoacid cytoplasmic
domain (Fig. 1.4).
In the human genome, MT1-MMP is encoded by a single gene located on chromosome
14. The first amino-terminal domain of the protein (Pre) is the signal peptide required to
correctly direct MT1-MMP to the endoplasmic reticulum. The prodomain (Pro, M1-R
111),
which maintains the enzyme in an inactive form and is removed by proteolytic cleavage,
contains a thiol-group (-SH) and a consensus sequence (Fu) for cleavage by the pro-
hormone convertase furin. The Zn2+
-binding catalytic domain (Y112
-G285
) is responsible
for substrate degradation and auto-catalysis. The hinge region (H, E286
-I318
), located
between the catalytic and the hemopexin-like (PEX) domains, is a highly mobile peptide,
which confers flexibility to the catalytic domain during its interactions with the different
substrates. The PEX domain (C319
-C508
) is involved in substrate recognition and enzyme
homo-dimerization; moreover, it participates in proMMP-2 activation and tumor
invasion. MT1-MMP is also characterized by a hydrophobic transmembrane domain
(TM, A539
-F562
). The short cytoplasmic tail (R563
-V582
) is essential for endocytosis,
recycling and membrane localization of MT1-MMP, and is involved in the activation of
intracellular signaling (see next paragraph).
This specific structure composed of an extracellular and an intracellular domain confers
MT1-MMP with the unique ability to focalize the proteolytic activity to the pericellular
microenvironment and closely interact with the intracellular transduction machinery
involved in the cell response to extracellular signals [35,36].
Figure 1.4. Protein structure of MT1-MMP [36].

18
1.6.2 Functions and regulation
MT1-MMP is widely expressed in a variety of cell types, where it plays an essential role
in both physiological and pathological processes. The active enzyme can degrade
numerous components of the ECM, such as collagen types I, II and III, fibrin, laminins-1
and -5, fibronectin, vitronectin, aggrecan, cell adhesion and signaling receptors [37]. In
mice, MT1-MMP deficiency results in craniofacial dysmorphism, arthritis, osteopenia,
dwarfism, fibrosis of soft tissues and premature death, thus highlighting the importance of
MT1-MMP during postnatal development and in the correct turnover of the connective
tissue [38].
MT1-MMP is spatially and temporally regulated at both transcriptional and post-
transcriptional levels by tightly and well-coordinated mechanisms that control its
expression, activity and subcellular localization. These mechanisms comprise activation
of the MT1-MMP proenzyme, inhibition of MT1-MMP by TIMPs and autocatalytic
inactivation, efficiency of trafficking to, and recycling from the plasma membrane. This
multiple regulation mechanism is necessary for the preservation of normal cell functions,
and its importance is well-illustrated by several studies that have described the effects of
MT1-MMP overexpression in various human tumors, and shown the central role of MT1-
MMP in ECM invasion by cancer cells [39].
MT1-MMP is synthesized as a latent proenzyme (60 kDa) that requires proteolytic
cleavage of the propeptide for activation. Firstly, the prodomain sequence of MT1-MMP
is proteolytically processed, resulting in the generation of an intermediate activation
product. Subsequently, a proprotein convertase (such as furin) cleaves the inhibitory
prodomain at the R108
RKR111
↓Y112
site in the trans-Golgi network. This two-step
mechanism ends with the degradation of the inhibitory prodomain and release of the
mature MT1-MMP enzyme (57 kDa), which traffics to the cell surface where the catalytic
site is exposed to the extracellular space. The activation may also be mediated by other
enzymes on the cell surface [40].
Current evidence suggests that the activity of MT1-MMP is short-lived and the half-life
of active, mature MT1-MMP bound to the plasma membrane is approximately one hour
[41]. During this time period, active MT1-MMP is either inactivated by TIMPs or
autolytically degraded, or internalized with, partial recycling. TIMP-2, TIMP-3 and
TIMP-4 are highly potent inhibitors of MT1-MMP, whereas TIMP-1 is a very poor
inhibitor [35].
The expression of MT1-MMP at the cell surface and its activity in the pericellular space
result in the modification of many tumor cell functions, including proliferation, migration,
invasion and survival. The efficient penetration of the ECM is a complex phenomenon
which involves not only the MT1-MMP-mediated proteolysis, but also the correct
localization of the enzyme at the surface of migrating cells. Cell surface localization of

19
MT1-MMP is usually very weak in most cell types because of rapid endocytosis of the
enzyme from the plasma membrane and its trafficking to early and late endosomes. The
cytoplasmic domain plays an important role in the regulation of all these events, thus
contributing to the pro-invasive properties of the enzyme. In addition, it activates
intracellular signaling, such as the ERK pathway [42].
Furthermore, it has been shown that MT1-MMP – TIMP-2 interaction controls cell
functions through a non-proteolytic mechanism. Although TIMP-2 is a powerful inhibitor
of MT1-MMP activity, binding of physiological concentrations (10-100 ng/ml) of TIMP-
2 to MT1-MMP causes rapid activation of the intracellular Ras-Raf-ERK signaling
cascade, which leads to cancer cell proliferation and migration. This function is
dependent on the presence of the cytoplasmic sequence of MT1-MMP [43].
Tumor cell migration is also enhanced by the cleavage of CD44, a membrane-associated
glycoprotein and one of the targets of MT1-MMP proteolysis. MT1-MMP physically
interacts with CD44 through its hemopexin domain, cleaving the protein and releasing the
CD44 ectodomain. The association between MT1-MMP and CD44 results in downstream
activation of the MAPK and PI3K signaling pathways involved in cell migration [44].
The hinge region is the main target for MT1-MMP auto-catalytic degradation, which
results in the release of the catalytic domain into the extracellular space and the
generation of an inactive membrane-tethered 44-kDa degradation product. The
accumulation of the 44-kDa form regulates the endocytosis of the active protease to
preserve a viable level of MT1-MMP on the cell surface, and it is associated with
increased enzymatic activity [45].
MT1-MMP is the physiological membrane activator of the soluble MMP-2 and MMP-13.
ProMMP-2, a secreted MMP that belongs to the gelatinase subfamily of MMPs, cleaves a
variety of substrates, such as collagens IV and I and denatured collagen I. The
extracellular activation of proMMP-2 by MT1-MMP requires the presence of TIMP-2.
The C-terminal region of TIMP-2 binds to the PEX domain of proMMP-2, whereas the
N-terminal interacts with the active site of MT1-MMP. MT1-MMP, TIMP-2 and
proMMP-2 thus form a trimolecular complex at the cell surface that allows the activation
of proMMP-2 by an adjacent TIMP-2-free MT1-MMP. ProMMP-2 (72 kDa) bound to the
complex is cleaved by MT1-MMP, thus producing an intermediate form of 66 kDa,
which is auto-catalytically processed to the fully active 62 kDa MMP-2 (Fig. 1.5).
The amount of proMMP-2 activation depends on several factors including the relative
levels of TIMP-2 and active MT1-MMP. Low levels of TIMP-2 relative to MT1-MMP
promote activation by generating the ternary complex leaving a sufficient amount of
TIMP-2-free, active MT1-MMP able to cleave the prodomain of proMMP-2. On the
contrary, high concentrations of TIMP-2, that inhibit all MT1-MMP molecules on the cell
surface, block MT1-MMP activation. Therefore, optimum concentrations of MT1-MMP

20
and TIMP-2 are required for proMMP-2 activation, efficient tissue degradation and
subsequent invasive growth [46].
The complete understanding of the molecular and cellular mechanisms involved in the
up-regulation of MT1-MMP expression and activity by cancer cells can thus provide
important new insights for the development of novel anticancer therapeutics to control
tumor progression. In particular, this is a critical point in order to improve the outcome of
childhood brain tumors, which still have a very poor prognosis. Recently published
results by Xie and colleagues indicate that MT1-MMP expression and ERK1/2
phosphorylation levels positively correlate with the increasing pathological grades in
adult brain glioma tissues [47]. With regard to the pediatric tumor counterparts, only few
studies have been conducted so far. One of these has shown that tumor microinvasion into
adjacent brain and expression of MMP-2 and MT1-MMP predict both overall and
progression-free survival in pediatric ependymomas (WHO grade II and III gliomas), and
that these are useful prognostic markers that may help stratify patients for adjuvant
therapies [48].
1.7 Heparan sulfate proteoglycans
Heparan sulfate proteoglycans (HSPGs) are macromolecules abundantly associated with
the cell surface and the ECM of a wide range of cells. The basic HSPG structure consists
of a protein core to which several linear heparan sulfate (HS) chains are covalently O-
linked. These polysaccharide chains can be modified by sulfation, epimerization, and N-
acetylation. HSPGs are essential for normal cell growth and development, because they
contribute to the self-assembly and integrity of the ECM and play an important role in
cell-cell and cell-ECM interactions. HSPGs exert their multimodal functions by
sequestering growth factors, chemokines and cytokines, providing a low-affinity reservoir
Figure 1.5. ProMMP-2 activation by MT1-MMP
(Modified from Barbolina and Stack, 2008) [37].

21
of these molecules and protecting them from proteolytic degradation. HSPGs also
enhance cell adhesion through their interaction with the HS-binding domain of ECM
proteins such as fibronectin, and act as co-receptors for many heparin-binding growth
factors, such as fibroblast growth factor-2 (FGF-2 or basic FGF, bFGF), thus modulating
their activity. For this reason, the cleavage of HS side chains not only alters ECM
integrity but also releases HS-bound biological mediators [49].
Emerging evidence indicates that in tumor HS structure is altered, and some HSPGs
possess a tumor-promoting effect. In particular, gliomas express significantly increased
levels of HS compared with normal glial cells. This different expression of HSPGs in
astrocyte-derived primary brain tumors can also be related to the malignant
transformation or growth potential of glia-derived tumor cells [50,51].
1.8 Heparanase
1.8.1 Structure, functions and regulation
Heparanase, an endo-β-D-glucuronidase capable of cleaving HS side chains at a limited
number of sites, is a protein encoded by a single gene located on chromosome 4 and
named HPSE or HPR-1 [52,53].
High levels of heparanase in many primary human tumors correlate with lymph node and
distant metastasis, elevated microvessel density and reduced post-operative survival of
cancer patients, a clinical observation that indicates pro-metastatic and pro-angiogenic
roles of the enzyme. Heparanase is also involved in several other physiological and
pathological processes, such as tissue morphogenesis, wound healing, hair growth,
amyloidosis, bone remodeling, embryo implantation, and glomerular diseases [54,55].
Given the multitude of polypeptides associated with HS on the cell surface and ECM and
their ability to strongly affect cell and tissue functions, heparanase activity and
bioavailability is tightly regulated at transcriptional and post-translational levels. In
particular, heparanase regulation is provided by its processing, cellular localization, and
secretion.
Heparanase is synthesized as a pre-pro precursor, processed into an inactive form of 65
kDa after the cleavage of the signal peptide (M1-A
35) necessary to direct the protein to the
endoplasmic reticulum. Subsequently, the 6 kDa linker segment (S110
-Q157
) is excised by
proteolysis, yielding the active enzyme. Active heparanase is a heterodimer consisting of
a 50 kDa subunit (L158
-I543
) non-covalently linked to an 8 kDa peptide (Q36
-E109
) [56].
Pre-pro-heparanase is first targeted to the endoplasmic reticulum lumen via its own signal
peptide, after which pro-heparanase is shuttled to the Golgi apparatus and secreted via
vesicles that bud from the Golgi. Once secreted, heparanase interacts with cell membrane
HSPGs, such as syndecan-family members, and the heparanase-HSPG complex is rapidly

22
endocytosed and accumulated in endosomes. The intracellular conversion of endosomes
to lysosomes results in processing and activation of heparanase, which in turn participates
in the turnover of HS side chains in the lysosome. This trafficking route may be bypassed
by numerous potential ways, such as the direct conversion of secretory vesicles to
endosomes. Lysosomal heparanase may translocate to the nucleus, where it affects gene
transcription, or can be secreted in response to local or systemic signals. The latent
secreted heparanase can also interact with heparanase-binding proteins and activate
intracellular signaling pathways, leading to enhanced cell adhesion, migration, and
angiogenesis [57].
1.8.2 Pro-metastatic and pro-angiogenic properties
Heparanase can enhance cell dissemination, and promote the formation of a vascular
network that accelerates primary tumor growth and provides an access for the invading
metastatic cells.
The systematic analysis of heparanase expression in primary human tumors has shown
the clinical significance of this enzyme in tumor progression. Heparanase is up-regulated
in many tumors, including the carcinomas of the colon, thyroid, liver, pancreas, bladder,
cervix, breast, stomach, prostate, head and neck, salivary gland, nasopharynx, as well as
leukemia, lymphoma, and multiple myeloma [58]. In all cases, the normal tissue
surrounding the malignant lesion expresses little or no detectable levels of heparanase. In
several carcinomas a more elevated heparanase expression is localized in the invasive
front of the tumor, supporting its role in cell invasion. Furthermore, patients diagnosed as
heparanase-positive exhibit a significantly higher rate of local and distant metastasis,
along with reduced post-operative survival, compared with patients diagnosed as
heparanase-negative. Patient survival is also associated with heparanase localization in
tumor cells: nuclear localization correlates with maintained cellular differentiation and
favorable outcome, suggesting that heparanase may affect gene regulation. In addition,
heparanase up-regulation in primary human tumors correlates in some cases with
increased tumor size and enhanced microvessel density, providing a clinical support for
the pro-angiogenic function of the enzyme. The relationship between heparanase levels
and patients’ clinical status suggests that heparanase may be used as a diagnostic marker
for the effectiveness of anti-tumor treatments [59].
HSPGs and HSPG-degrading enzymes are implicated in numerous and complex
angiogenesis-related events, including cell invasion, migration, adhesion, differentiation,
and proliferation. Because HSPGs are important components of blood vessels, heparanase
activity on the sub-endothelial basement membrane can directly facilitate endothelial cells
invasion. In addition, heparanase can also stimulate an indirect angiogenic response by
releasing many HS-bound angiogenic growth factors from the ECM, such as FGF-2 and

23
vascular endothelial growth factor (VEGF), and by generating HS fragments that promote
binding of receptors to FGF, dimerization, and signaling [60].
The involvement of heparanase in cancer metastasis and angiogenesis is not exclusively
restricted to its HS-degrading activity in the ECM. Recent studies indicate that inactive
heparanase can also exert non-enzymatic effects: it can bind to its putative cell-surface
receptors and activate many intracellular signal transduction cascades, promoting cell
adhesion and survival, up-regulation of VEGF [61] and tissue factor [62], and
accelerating tumor growth.
In contrast to its widely reported overexpression in a variety of tumors, heparanase was
found to be decreased in gliomas in one published study [63]. On the contrary, more
recently, Hong and colleagues have described heparanase up-regulation in human gliomas
[64]. Since the results of these few studies are still controversial, further experimental
evidence is necessary to verify the correct level of expression and the potential role of
heparanase in facilitating glioma tumor growth, particularly in the pediatric forms.
However in spite of these uncertainties, these findings highlight heparanase as a potential
therapeutic target in the treatment of malignant brain tumors.
1.9 Fibroblast growth factor-2 (FGF-2)
1.9.1 FGF-2 and FGF receptors (FGFRs)
Fibroblast growth factor-2 (FGF-2), formerly known as basic FGF (bFGF), is a member
of a large family of 23 structurally related heparin-binding proteins (FGFs). FGF-2 is a
ubiquitous growth factor implicated in a variety of physiological and pathological
processes, such as cell survival, proliferation, migration, growth and differentiation [65].
The human FGF-2 gene is located on chromosome 4. Alternative translation initiation of
FGF-2 mRNA results in five biologically active proteins with different molecular weight,
cellular localization and functions. Four high molecular weight (HMW) FGF-2 (34, 24,
22.5 and 22 kDa) forms are initiated by CUG start codons located upstream of the low
molecular weight (LMW) FGF-2 (18 kDa) sequence, which starts at an AUG codon. Only
34 kDa HMW FGF-2 is translated by the conventional cap-dependent mechanism,
whereas translation of all the other forms requires an internal ribosomal entry site (IRES)
located between nucleotides 154 and 319 (Fig. 1.6).

24
All forms of FGF-2 contain a C-terminal bipartite nuclear localization sequence (NLS).
The HMW isoforms also contain an N-terminal ER (glutamic acid - arginine) repeat that
acts as an NLS. The 34 kDa isoform contains an additional NLS similar in structure to
that of the human immunodeficiency virus (HIV) Rev protein (not shown in Fig. 1.6).
FGF-2 is a monomeric protein that lacks a conventional N-terminal signal sequence for
secretion. LMW FGF-2 is secreted from cells through a non-classical secretory pathway
independent of the endoplasmic reticulum/Golgi apparatus, but involving exocytosis, and
requiring ATP [66,67]; in the extracellular space it can act as a paracrine or autocrine
growth factor [68] by activating its cognate membrane receptors. Although HMW FGF-2
can also be released by cells - usually following cell lysis or damage - these forms are
typically intracellular and accumulate in the nucleus and nucleolus after translation. The
differences in the intracellular sorting of the various FGF-2 forms determine their
functional diversity, with LMW FGF-2 being an extracellular signaling molecule that acts
via activation of transmembrane receptors, and HMW FGF-2 having a nuclear, FGFR-
independent intracrine function [69].
The biological effects of FGF-2 are mediated by high-affinity tyrosine kinase FGF
receptors (FGFRs) and low-affinity receptors.
The four members of the FGFR family (FGFR-1, FGFR-2, FGFR-3 and FGFR-4) are
encoded by different genes, and their structural heterogeneity is increased by alternative
splicing.
The FGFRs have an overall structure similar to most receptor tyrosine kinases (RTKs).
They are single-pass transmembrane proteins comprised of an extracellular region that
binds FGF-2, a transmembrane domain and an intracellular tyrosine kinase domain. The
extracellular part of the receptor is composed of three Ig-like domains (I-III) with an
acidic, serine-rich region between domains I and II (acid box). The first Ig-like domain,
together with the acid box, is important for receptor auto-inhibition. Domains II and III
comprise the FGF-binding site. In FGFR-1, -2, and -3, alternative splicing in the Ig-like
domain III generates isoforms with different ligand-binding specificities. The intracellular
Figure 1.6. Schematic representation of human FGF-2 forms expression by
alternative translation initiation [69].

25
tyrosine kinase domain, which relays the signal inside the cell, has an insert and is
therefore referred to as a split kinase domain (Fig. 1.7).
FGF-2 can also bind to low-affinity receptors, HSPGs present in the ECM or bound to the
cell membrane. A highly basic (i.e. positively charged) protein, FGF-2 interacts with the
negatively charged polysaccharides, which protect it from degradation and participate in
complex formation between FGF-2 and FGFRs. Binding of FGF-2 to the FGFRs
determines the dimerization of a ternary complex consisting of two molecules of FGF-2,
two FGFRs and two heparan sulfate chains. Formation of this complex results in
activation of downstream signaling cascades, in particular the MAPK and the PI3K/Akt
pathways. After activation, the complex is internalized by endocytosis and transported to
lysosomes for degradation (Fig. 1.7) [70].
1.9.2 Role in angiogenesis and tumor growth
The intracellular signaling pathways activated by FGF-2 binding to FGFRs control a
variety of biological processes.
Despite complex involvement of FGF-2 in embryonic development (brain, limbs, lung,
heart, muscle, bone, blood, eye and skin), FGF-2 knockout mice are viable and have an
apparently normal phenotype [71]. However, in the adult FGF-2 is implicated in
controlling vascular tone, mediating cardiac hypertrophy, promoting the mobilization and
differentiation of myocardial precursor cells, and facilitating wound healing. Importantly,
FGF-2 is one of the most potent inducers of angiogenesis. Inhibition of angiogenesis
through FGF-2 blockade is a critical step for limiting tumor metastases, as tumor growth
Figure 1.7. Schematic diagram of FGFR structure and FGF-2-FGFR-HSPG interactions [70].

26
also depends on formation of a new capillary network from pre-existing blood vessels and
circulating endothelial progenitor cells [72].
Because of its pleiotropic activity that affects both tumor vasculature and parenchyma,
the FGF-2/FGFR system contributes to cancer progression not only by inducing neo-
angiogenesis but also by directly acting on tumor cells. In particular, FGF-2 upregulation
and release from tumor and/or stromal cells contributes to tumor proliferation, survival
and migration. Several cancer types, including pancreatic, breast, non-small cell lung, and
head and neck squamous carcinomas, are characterized by FGF-2 overexpression.
Moreover, FGF-2 bound to the HS-chains in the ECM can be released very efficiently by
both proteolytic and glycosidic enzymes, contributing to angiogenesis and tumor growth
[73]. In addition to FGF-2, numerous alterations of FGFRs, such as inappropriate
expression, activating point mutations, splice variations and genomic alterations, can also
dysregulate FGF-2 signaling and promote tumorigenesis [74].
The clinical significance of FGF-2 is demonstrated by the findings that elevated levels in
the serum of patients with breast, colorectal and renal cell carcinomas and other tumors
inversely correlate with patients’ survival [75,76].
FGF-2 also plays a critical role in nervous system development, and dysregulated
expression has been implicated in the pathogenesis of glial tumors. FGF-2 is
overexpressed in more than 90% of malignant gliomas and its level of expression
correlates with tumor grade, extent of anaplasia, and clinical outcome [77,78].
Down-regulation of FGF-2 by antisense cDNA or oligonucleotides, neutralizing anti-
FGF-2 antibody, or a peptide corresponding to the heparin-binding domain of FGF-2, and
reduced expression of FGFR by antisense cDNA or oligonucleotides block angiogenesis
and tumor growth in vivo, and therefore represent potential antineoplastic strategies [79].

27
Chapter 2: Project aims
Gliomas, the most frequent primary brain tumors, comprise a heterogeneous group of
neoplasms that originate from glial cells. The biological mechanisms underlying glioma
cell invasion in the normal brain tissue are numerous and complex. The degradation of
different components of the extracellular matrix involves both proteolytic and glycosidic
enzymes that modify the microenvironment during tumor invasion and metastasis. The
majority of the studies conducted so far are focused on adult gliomas, which show
different genetic, molecular and clinical features from their pediatric counterparts.
This study aimed to investigate the roles of heparanase (HPSE) and membrane-type 1
matrix metalloproteinase (MT1-MMP) by using cell lines derived from different types of
pediatric gliomas: two glioblastoma multiforme (SF188 and KNS42), one anaplastic
astrocytoma (UW479), one diffuse astrocytoma (Res259) and one pilocytic astrocytoma
(Res186) cell line.
The following aims have been achieved in this experimental study:
1. Characterization of HPSE expression in pediatric glioma cells and analysis of the
effects of HPSE gene silencing on the expression of matrix metalloproteinase-2
(MMP-2), MT1-MMP and vascular endothelial growth factor (VEGF), and on SF188
cell proliferation.
2. Analysis of activation of the ERK1/2 intracellular signaling pathway by fibroblast
growth factor-2 (FGF-2) in human MCF-7 breast adenocarcinoma cells expressing
MT1-MMP.
3. Analysis of the effects of MT1-MMP on FGF-2 interaction with the tumor cell
surface.
4. Characterization of MT1-MMP, FGF-2, FGF receptors and tissue inhibitor of
metalloproteinase-2 (TIMP-2) expression in pediatric glioma cells, and study of
ERK1/2 activation by FGF-2 and by TIMP-2.

28

29
Chapter 3: Materials and Methods
3.1 Reagents
Rabbit anti-human MT1-MMP antibody (hinge region), rabbit anti-human TIMP-2 (C-
terminus) antibody, Ilomastat (GM6001), and PVDF membranes were purchased from
Millipore (Billerica, MA); mouse anti-human phospho-p44/42 MAPK (ERK1/2)
(Thr202
/Tyr204
) was from Cell Signaling Technology (Danver, MA); doxycycline, 1,10-
phenantroline, bovine serum albumin (BSA), puromycin, and mouse anti-human tubulin
antibody were from Sigma-Aldrich (St. Louis, MO); donkey anti-mouse IgG antibody,
donkey IgG anti-rabbit antibody, and streptavidin (all conjugated with horseradish
peroxidase) from Jackson ImmunoResearch Laboratories (West Grove, PA);
sulfosuccinimidyl-6-[biotin-amido]hexanoate (sulfo-NHS-LC-biotin), bicinchoninic acid
(BCA) protein assay kit, and SuperSignal West Pico chemiluminescent substrate from
Thermo Scientific (Rockford, IL); heparin-Sepharose beads from Reprokine Research
Immunity (Valley Cottage, NY); protein A/G PLUS-agarose immunoprecipitation reagent
was from Santa Cruz Biotechnology (Santa Cruz, CA); recombinant human basic FGF
(155) from Akron Biotech (Boca Raton, FL); human recombinant TIMP-2 from
PeproTech (Rocky Hill, NJ); CellTiter96 Aqueous One Solution Cell Proliferation (MTS)
and GoTaq DNA Polymerase were from Promega (Madison, WI); MEM alpha medium,
Lipofectamine 2000 Reagent, TRIzol Reagent, and SuperScript II Reverse Transcriptase
from Invitrogen (Grand Island, NY); TransIT-LT1 transfection reagent was from Mirus
(Madison, WI); HPSE gene-specific shRNA expression cassettes, and pRS plasmid
(TR20003) from OriGene (Rockville, MD); complete mini protease inhibitor cocktail,
PhosSTOP phosphatase inhibitor cocktail, and DNAse I from Roche (Indianapolis, IN);
Dulbecco’s modified Eagle’s medium (DMEM), DMEM/F-12 Ham’s medium, fetal
bovine serum (FBS), L-glutamine, penicillin, and streptomycin from CellGro (Manassas,
MA); Power SYBR Green master mix was from Applied Biosystem (Milan, Italy).
Wild-type and mutant MT1-MMP cDNAs cloned in pcDNA3 vectors, and mouse anti-
human FGF-2 antibody were previously generated in Dr. P. Mignatti’s laboratory (New
York University School of Medicine).

30
3.2 Cell lines and culture media
The following human tumor cell lines were used:
Cell line Tumor
MCF-7 Breast adenocarcinoma
SF188 Glioblastoma multiforme
KNS42 Glioblastoma multiforme
UW479 Anaplastic astrocytoma
Res259 Diffuse astrocytoma
Res186 Pilocityc astrocytoma
Table 3.1. Tumor cell lines.
MCF-7 cells, which do not express MT1-MMP, were obtained from ATCC. In addition,
we used MCF-7 cells stably transfected with MT1-MMP cDNA under control by the
tetracycline resistance transactivator in the Tet-Off conformation (MCF-7 clone 8) which
had previously been generated in Dr. P. Mignatti’s laboratory (New York University
School of Medicine). In these cells addition to the culture medium of doxycycline (DOX),
a stable analogue of tetracycline, prevents the expression of MT1-MMP.
The pediatric glioma cell lines were kindly provided by Dr. C. Jones (The Institute of
Cancer Research, Sutton, UK) (Table 3.1).
Primary bovine capillary endothelial (BCE) cells, used as control in some experiments,
were previously obtained from calf adrenal glands in Dr. P. Mignatti’s laboratory.
MCF-7 and MCF-7 clone 8 cells were grown in DMEM supplemented with 10% (v/v)
FBS, 2 mM L-glutamine, 100 U/ml penicillin, and 100 µg/ml streptomycin. SF188,
KNS42, UW479, Res259 and Res186 cell lines were grown in DMEM/F12 Ham’s
medium supplemented with FBS, L-glutamine and antibiotics as above. BCE cells were
grown in 0.1% gelatin-coated tissue culture plates in alpha MEM supplemented with 5%
donor calf serum, L-glutamine and antibiotics. All the cells grew as monolayers, and were
maintained at 37 ºC in a 5% CO2 atmosphere saturated with H2O.

31
3.3 Cell treatments
All the treatments described below were performed with medium containing 0.5% FBS.
3.3.1 FGF-2 treatment
Sub-confluent MCF-7 cells were serum-starved (0.5% FBS) and incubated for 24 h with
or without 1 µg/ml DOX. Where indicated, cells were incubated for 15 min with medium
containing either 50 µM Ilomastat or 500 µM 1,10-phenantroline before treatment with
FGF-2 as indicated in Results. In some experiments serum-starved cells were treated with
30 ng/ml of FGF-2 for 15 min and subsequently washed 3 times with PBS followed by
one washing with either 2 M NaCl in 20 mM HEPES, pH 7.5 or 2 M NaCl in 20 mM
sodium acetate, pH 4.0. After treatment, cells and conditioned media were immediately
collected for subsequent analysis (paragraphs 3.7 and 3.9). Alternatively, 8×10³ MCF-7
clone 8 cells grown in 96-well culture plates and serum-starved were incubated overnight
with or without DOX, and subsequently with or without 10 ng/ml FGF-2 for 1 to 3 days,
and further analyzed for proliferation by the MTS assay (paragraph 3.10).
3.3.2 TIMP-2 treatment
Sub-confluent cells serum-starved (0.5% FBS) for 24 h were treated for 15 min with or
without 50 µM Ilomastat, and subsequently with or without 100 ng/ml TIMP-2. Both
Ilomastat and TIMP-2 were added directly to the medium in a volume of 1 ml of medium.
Cells were immediately collected for subsequent analysis (paragraph 3.7).
3.4 RNA extraction and cDNA synthesis
Total RNA was extracted with the TRIzol Reagent including DNase I treatment. Yield
and purity were checked by Nanodrop (EuroClone). One microgram of total RNA was
reverse-transcribed using 500 ng of random primers and 200 U of SuperScript Reverse
Transcriptase. All the protocols were performed following the manufacturer’s
instructions.
3.5 Semi-quantitative PCR and Real-Time quantitative PCR
Expression of FGFR-1, -2, -3, and -4 was analyzed by semi-quantitative PCR. The
reaction was performed with GoTaq polymerase using 5 µmoles of forward and reverse
primers, denaturation at 95 ºC for 10 min, followed by 28 cycles of denaturation at 95 ºC
for 30 sec, annealing at 58 ºC for 30 sec, and elongation at 72 ºC for 30 sec. GAPDH,

32
measured with 25 cycles of amplification under the same conditions, was used as loading
control. PCR products were resolved in 2% agarose gels in 1X TAE buffer (50 mM Tris-
HCl pH 8.0, 20 mM sodium acetate, 2 mM Na2EDTA), and visualized under UV light.
Expression of HPSE, MMP-2, MT1-MMP and VEGF was analyzed by Real-Time
quantitative PCR. The reaction was performed with the Power SYBR Green Master Mix
using 5 µmoles of forward and reverse primers, denaturation at 95 ºC for 10 min,
followed by 40 cycles of denaturation at 95 ºC for 30 sec, annealing and elongation at 60
ºC for 30 sec. GAPDH was used as loading control. Gene expression was quantified by
the comparative Ct method (ΔΔCt), and the relative quantification was calculated as 2-
ΔΔCt. Melting curve analysis was used to rule out the presence of non-specific
amplification products.
The following primers were used:
Primer PCR Product
length Sequence (5’ – 3’)
FGFR-1_FOR SQ 200 bp
ACCACCGACAAAGAGATGGA
FGFR-1_REV SQ GCCCCTGTGCAATAGATGAT
FGFR-2_FOR SQ 247 bp
TCTAAAGGCAACCTCCGAGA
FGFR-2_REV SQ CTCTGGCGAGTCCAAAGTCT
FGFR-3_FOR SQ 282 bp
CCACTGTCTGGGTCAAGGAT
FGFR-3_REV SQ CCAGCAGCTTCTTGTCCATC
FGFR-4_FOR SQ 220 bp
TCATCAACCTGCTTGGTGTC
FGFR-4_REV SQ CGGGACTCCAGATACTGCAT
GAPDH_FOR SQ 458 bp
AACATCATCCCTGCCTCTAC
GAPDH_REV SQ CCCTGTTGCTGTAGCCAAAT
HPSE_FOR Q 136 bp
ATTTGAATGGACGGACTGC
HPSE_REV Q GTTTCTCCTAACCAGACCTTC
MMP-2_FOR Q 71 bp
GCGGCGGTCACAGCTACTT
MMP-2_REV Q CACGCTCTTCAGACTTTGGTTCT
MT1-MMP_FOR Q 131 bp
TGCCATGCAGAAGTTTTACGG
MT1-MMP_REV Q TCCTTCGAACATTGGCCTTG
VEGF_FOR Q 81 bp
ATGACGAGGGCCTGGAGTGTG
VEGF_REV Q CCTATGTGCTGGCCTTGGTGAG
GAPDH_FOR Q 112 bp
ACACCCACTCCTCCACCTTT
GAPDH_REV Q TCCACCACCCTGTTGCTGTA
Table 3.2. Type of PCR performed (SQ = semi-quantitative, Q = quantitative),
product length, and primer sequences.
Primers were designed with Primer3 (v. 0.4.0) using default settings. Because different
FGFR isoforms are generated by alternative splicing, Fast DB software was first used to
identify the exons shared by all FGFR variants, and primers were subsequently designed
with Primer3.

33
3.6 Transient and stable transfections
Wild-type and mutant MT1-MMP cDNAs in pcDNA3 were transiently transfected into
sub-confluent cells in 6-well plates using 3 µg of plasmid and 7.5 µl of Lipofectamine,
according to the manufacturer’s instructions. In particular, the mutant MT1-MMP
constructs contained MT1-MMP sequences either lacking the hemopexin domain (Δpex)
or the cytoplasmic tail (Δcyt), or an alanine substitution of glutamic acid 240 in the
catalytic domain (E240A). Twenty-four hours after transfection, cells were incubated
with medium containing 0.5% FBS for additional 24 h, and immediately used for the
experiments.
To obtain a stably HPSE silenced SF188 cell line, the following 29mer shRNAs targeting
human heparanase were used:
shRNA Sequence
pHPSE-1 TTATGTGGCTGGATAAATTGGGCCTGTCA
pHPSE-2 GTTCAAGAACAGCACCTACTCAAGAAGCT
pHPSE-3 GTGGTGATGAGGCAAGTATTCTTTGGAGC
pHPSE-4 TCGTTCCTGTCCGTCACCATTGACGCCAA
Table 3.3. ShRNA sequences of human HPSE.
Sub-confluent tumor cells in 6-well plates were transfected with 2 µg of each shRNA
plasmid in serum-free medium using TransIT-LT1 according to the manufacture's
instruction. Forty-eight hours after transfection, stable SF188 cell transfectants were
grown for several weeks in medium containing 0.5 µg/ml puromycin. Six puromycin-
resistant clones were selected for subsequent analysis.
3.7 Protein extraction and Western blotting
At the indicated times after FGF-2 or TIMP-2 treatment, cells were washed with ice-cold
PBS and scraped in RIPA buffer (150 mM NaCl, 1% Igepal, 0.5% sodium deoxycholate,
0.1% SDS in 50 mM Tris-HCl, pH 8.0) containing protease (Complete) and phosphatase
(PhosSTOP) inhibitors. Following centrifugation (14,000 rpm for 15 min at 4 º C) and
sonication, the lysates were assayed for protein concentration by the BCA method, using
BSA as standard.
Cell extract protein (20-40 µg) was diluted in reducing sample buffer (10% glycerol, 2%
SDS, 80 mM Tris-HCl pH 6.8, 0.005% bromophenol blue, 10% β-mercaptoethanol)
denatured for 10 min at 100 ºC, and electrophoresed in SDS/10-12% polyacrylamide gels.
Proteins were transferred onto PVDF membranes; non-specific binding was blocked for 2
h at RT with 5% non-fat milk in Tris buffered saline (TBS) buffer. Membranes were

34
exposed to primary and secondary peroxidase-conjugated antibodies in TBS buffer
containing 5% (w/v) non-fat milk. The working dilutions of the primary antibodies used
in the experiments are listed in Table 3.4. The secondary antibodies were usually diluted
1:5,000 (2 h, RT), with the exception of the secondary antibody used to detect tubulin,
which was diluted 1:20,000 (1 h, RT). The signal was detected with the SuperSignal West
Pico Chemiluminescent substrate solution, according to the manufacturer's instructions.
In some experiments, the membranes were stripped by incubation in a mild stripping
buffer (20 mM Glycine, 0.1% SDS, 1% Tween 20, pH 2.2) for 30 min at RT with gentle
agitation, re-blocked and re-probed with other antibodies.
Since heparin shows high affinity for FGF-2, heparin-Sepharose beads were used to
detect FGF-2 in cell conditioned medium or in the washing buffers used to remove FGF-2
from the cell surface. Heparin-Sepharose beads (20 µl) equilibrated with serum-free
medium were incubated with 200 µl of the sample for 2 h at 4 ºC. Following
centrifugation, the pelleted beads were resuspended in reducing sample buffer, denatured
and loaded onto a SDS-polyacrylamide gel for Western blotting analysis as described
above.
Primary
antibody Dilution and incubation time Host
MT1-MMP 1:1,000; o/n, 4 ºC Rabbit
P-ERK 1:1,000 in MCF-7 cells; 2 h, RT
1:5,000 in glioma cells; 1 h 30 min, RT Mouse
FGF-2 1:3,000 in MCF-7 cells; 2 h, RT
1:5,000 in glioma cells; 1 h 30 min, RT Mouse
TIMP-2 1:5,000; 2 h, RT Rabbit
TUBULIN 1:25,000; 1 h, RT Mouse
Table 3.4. Primary antibodies, dilutions, and incubation.
3.8 Biotinylation of soluble and cell surface associated FGF-2
Biotin, a small vitamin (244 Da) that binds the protein streptavidin with high affinity, can
be conjugated to virtually all proteins without altering their biological activity. To label
human recombinant FGF-2 we used sulfo-NHS-LC-biotin, which reacts with primary
amino groups (-NH2) in pH 7-9 buffers to form stable amide bonds.
Ten mM biotin reagent solution was added to 100 µg/ml FGF-2 in PBS, and incubated on
ice for 2 h. The biotinylated FGF-2 was used for cell treatments, as described above,
without purification, and detected by Western blotting with peroxidase-conjugated
streptavidin.
Because Sulfo-NHS-LC-biotin is water soluble and charged by the sodium sulfoxide
group on the succinimidyl ring, it cannot permeate cell membranes. Therefore, biotin can

35
also be used to label proteins localized on cell surface because as long as the cells remain
intact, only primary amines exposed on the surface will be biotinylated. To biotinylate
cell surface associated FGF-2 cell monolayers incubated with 30 ng/ml FGF-2 for 15 min
were washed 3 times with ice-cold PBS, and incubated on ice for 30 min with 1 mM
biotin (ice can reduce the active internalization of biotin). Following 3 washings with 100
mM glycine in PBS to quench and remove the excess of biotin reagent, the cells were
lysed in RIPA buffer (50 mM Tris-HCl pH 8.0, 125 mM NaCl, 0.5% Igepal, 0.5% sodium
deoxycholate, 0.1% SDS, 1 mM DTT) containing protease and phosphatase inhibitors.
The cell lysate was centrifuged (14,000 rpm for 15 min at 4 ºC), sonicated, and assayed
for protein concentration. Anti-FGF-2 antibody (1 µg) or mouse non-immune IgG (1 µg)
was added to cell extract protein (1 mg), and incubated with protein A/G PLUS-agarose
beads (30 µl) overnight at 4 ºC. Following centrifugation at 2000 rpm for 4 min at 4 ºC,
the pelleted beads were resuspended in reducing sample buffer, loaded onto a SDS-
polyacrylamide gel for Western blotting analysis, and the immunocomplexes were
detected with peroxidase-conjugated streptavidin.
3.9 Gelatin zymography
MMP activities were studied by using zymography, which allows detection of both the
proenzyme and active forms of MMP-2 and -9 [80]. Media (20 µl) conditioned by an
equal number (5×10⁵) of cells were electrophoresed in a SDS/8% polyacrylamide gel co-
polymerized with 0.1% gelatin. Following electrophoresis, the gel was washed for 1 h at
RT in 2.5% Triton X-100 and incubated overnight at 37 ºC in 100 mM Tris-HCl, 10 mM
CaCl2, pH 7.4. Finally, the gel was stained with 0.1% Coomassie Brilliant Blue R- 250,
and destained with 30% methanol - 10% acetic acid. Gelatinolytic activities were detected
as clear bands against the background of blue-stained gelatin.
3.10 Cell proliferation assay
Cell proliferation was measured by the MTS assay. FGF-2-treated or untreated cells were
incubated with 3-(4,5-dimethylthiazol-2-yl)-5-(3-carboxy-methoxyphenyl)-2-(4-
sulfophenyl)-2H-tetrazolium (MTS) for 1 h at 37 ºC, and the number of proliferating cells
was evaluated by measuring optical density at 490 nm.
3.11 Statistical analysis
Differences between FGF-2-treated and untreated cells, and between wild-type and HPSE
silenced cells were analyzed using the Students' t test. A p value ≤ 0.05 was considered as
significant.

36

37
Chapter 4: Results
4.1 Pediatric glioma cell lines
All the pediatric glioma cell lines used in this study were derived from astrocytomas of
differing grades arisen in patients aged 3-16 years. Established in vitro by other groups,
these cell lines grow as monolayer cultures, with doubling times ranging between 24 and
48 h, and are characterized by a mixture of stellate and bipolar morphologies, with some
cells being polygonal, cuboidal or flattened (Table 4.1; Fig. 4.1).
SF188 KNS42 UW479
Res259 Res186
Figure 4.1. Representative images of pediatric glioma cells. All the cells grow as monolayer cultures,
and are characterized by a mixture of stellate and bipolar morphologies, with some cells being polygonal,
cuboidal or flattened. Original magnification × 200.
Table 4.1. Characteristics of pediatric glioma cells (Modified from Bax et al., 2009) [81].

38
4.2 HPSE expression in pediatric glioma cells and HPSE silencing in SF188 cells
Preliminary experiments were performed to investigate the role of the heparan sulfate-
degrading enzyme heparanase in glioma cell lines. Results from a quantitative Real-Time
PCR assay showed different levels of HPSE expression in the different glioma cell lines,
KNS42 cells having the highest levels and Res259 cells very low, almost undetectable
levels (Fig. 4.2).
Figure 4.2. HPSE expression in pediatric glioma cells. HPSE mRNA levels in pediatric glioma cells were
determined by quantitative Real-Time PCR. The results were normalized using GAPDH mRNA as an
internal control and represent mean ± standard deviation of two different experiments performed with
triplicate samples.
Since both SF188 and KNS42 cells showed high HPSE mRNA levels, these cell lines
were subsequently used for HPSE downregulation. For this purpose cells were transfected
with 29mer shRNAs to HPSE or with the corresponding empty vector as a negative
control. Several clones of stable SF188 cell transfectants were obtained by selection with
puromycin; however, KNS42 transfected cells died during the antibiotic selection.
HPSE mRNA expression was then measured in SF188 clones by quantitative Real-Time
PCR. HPSE levels in non-transfected cells were comparable to those of cells transfected
with the negative control plasmid. Among the 5 silenced clones, the one with the best
silencing effect (73%) was chosen for subsequent experiments, and named pHPSE-3. In
addition, a mixture of clones of SF188 cells transfected with all four 29mer shRNA
plasmids together showed HPSE mRNA expression similar to that of the other clones
(pHPSE-1, -2, -4) (Fig. 4.3).
0
50
100
150
200
SF188 KNS42 UW479 Res259 Res186
HP
SE
rela
tive e
xp
ressio
n (
%)

39
Figure 4.3. Stable silencing of HPSE in SF188 cells. SF188 cells were transfected with 29mer shRNAs to
HPSE or with the empty vector as a negative control. Several clones of stable SF188 cell transfectants were
obtained by selection with puromycin. HPSE mRNA levels in SF188 clones were determined by
quantitative Real-Time PCR. The results were normalized using GAPDH mRNA as an internal control and
represent mean ± standard deviation of two different experiments performed with triplicate samples. Clone
3 cells, which showed the strongest silencing effect (73%), were chosen for subsequent experiments, and
named pHPSE-3 (wt, non-transfected cells, black bar; 1, 2, 4, cells transfected with the shRNA plasmid-1,
2, 4, respectively, gray bar; 3, cells transfected with shRNA plasmid-3, white bar; mix, cells transfected
with all four shRNA plasmids, gray bar; empty, cells transfected with the empty vector, gray bar; * p <
0.05, SF188 wt vs. pHPSE-3 cells).
4.3 Effects of HPSE silencing on MMP-2, MT1-MMP and VEGF expression in
SF188 cells
Given the close association existing between glycosidases and proteases in the ECM,
MMP-2 and MT1-MMP mRNA expression was then studied by quantitative Real-Time
PCR in SF188 wt cells and pHPSE-3 cells. SF188 cells showed high MMP-2 mRNA
levels; these cells also synthesized the corresponding protein, which is released in the
extracellular environment in its proenzymatic form (proMMP-2). Conversely, MT1-MMP
mRNA levels were about 10 times lower relative to MMP-2 expression (Fig. 4.4A).
Figure 4.4. MMP-2 and MT1-MMP expression in SF188 wt and silenced cells. MMP-2 (A, B) and MT1-
MMP (A, C) mRNA levels in SF188 wt (black bar) and silenced (gray bar) cells were determined by
quantitative Real-Time PCR. The results were normalized to GAPDH mRNA as an internal control and
represent mean ± standard deviation of two different experiments performed with triplicate samples.
0
25
50
75
100
125
wt 1 2 3 4 mix empty
HP
SE
rela
tive e
xp
ressio
n (
%)
*
0
25
50
75
100
125
150
MMP-2 MT1-MMP
ge
ne
re
lati
ve
e
xp
res
sio
n (
%)
0
25
50
75
100
125
150
wt pHPSE-3
MM
P-2
re
lati
ve
exp
ressio
n (
%)
0
25
50
75
100
125
150
wt pHPSE-3
MT
1-M
MP
rela
tive
exp
ressio
n (
%)
A B C

40
MMP-2 and MT1-MMP mRNA levels were 35 and 50% higher, respectively, in pHPSE-3
cells than in SF188 wt cells (Fig. 4.4, B and C).
Since HPSE can also participate in the regulation of VEGF signaling [61], the mRNA
expression of this growth factor was also analyzed by quantitative Real-Time PCR
analysis in SF188 wt cells and pHPSE-3 cells. The results showed that VEGF mRNA
levels were comparable in both cell lines. Interestingly, treatment of SF188 cells with
FGF-2 (10 ng/ml) for 24 h increased VEGF expression about 2.5-fold relative to untreated
cells (Fig. 4.5).
Figure 4.5. VEGF expression in SF188 wt and silenced cells. VEGF mRNA levels in SF188 wt (black
bar) and silenced (gray bar) cells were determined by quantitative Real-Time PCR. SF188 wt and silenced
cells were also treated with FGF-2 (10 ng/ml) for 24 h and VEGF mRNA levels measured. The results were
normalized using GAPDH mRNA as an internal control and represent mean ± standard deviation of two
different experiments performed with triplicate samples.
4.4 Effects of HPSE silencing on SF188 cell proliferation
In order to understand whether HPSE silencing altered FGF-2 effect on glioma cell
proliferation SF188 wt cells and pHPSE-3 cells were treated with FGF-2 (10 ng/ml), and
the cell number was measured by the MTS assay after 1 and 2 days.
At each time-point, no statistically significant difference in cell proliferation was
observed between untreated wt cells and silenced cells. After 2 days FGF-2 induced a
25% and 20% increase in cell number in wt and silenced cells, respectively (p < 0.05, Fig.
4.6,A).
In these experiments we used bovine capillary endothelial (BCE) cells as a positive
control for the activity of FGF-2 as an inducer of cell proliferation. Since BCE are normal
primary cells, they grow more slowly than tumor cells, and under low serum conditions
their growth is almost arrested. After 6 days of FGF-2 treatment, the number of BCE cells
was more than 3 times higher than that of untreated cells (p < 0.05), showing that the
FGF-2 we used was indeed active (Fig. 4.6,B).
0
50
100
150
200
250
300
wt pHPSE-3 wt +FGF-2
pHPSE-3 +FGF-2
VE
GF
rela
tive
exp
ressio
n (
%)

41
Figure 4.6. Effects of HPSE silencing on SF188 cell proliferation. SF188 wt and silenced cells grown in
medium containing 0.5% FBS were treated with FGF-2 (10 ng/ml) for 1 and 2 days and cell number was
measured by the MTS assay. BCE cells treated with FGF-2 (10 ng/ml) for 1, 3 and 6 days were used as
positive control for FGF-2 activity. Each point represents mean ± standard deviation of a representative
experiment performed with triplicate samples.
4.5 MT1-MMP, FGF-2 and FGFRs expression in MCF-7 cells
The following experiments were performed in the Prof. Mignatti’s laboratory at New
York University School of Medicine, where I spent the third year of my PhD program.
Before studying the involvement of MT1-MMP in the pediatric glioma cell lines, the role
of MT1-MMP was first examined in the human MCF-7 breast adenocarcinoma cell line.
MCF-7 cells, which do not express MT1-MMP, offer a useful model for studying this
proteinase by transient transfection of plasmids encoding wild-type (wt) or mutant MT1-
MMP cDNA.
Wild-type MT1-MMP is a 582-amino acid protein consisting of numerous domains:
- pre/propeptide M1 – R
111
- catalytic domain Y112
– G285
- hinge region E286
– I318
- hemopexin domain C319
– C508
- transmembrane domain A539
– F562
- cytoplasmic tail R563
– V582
.
In our study, we used three MT1-MMP mutants:
1. MT1-MMP devoid of the hemopexin domain (Δpex);
2. MT1-MMP devoid of the cytoplasmic tail (Δcyt);
3. MT1-MMP mutated in the catalytic site, with an alanine substitution of the glutamic
acid in position 240 (E240A); this mutant is devoid of proteolytic activity.
A B
0.0
0.2
0.4
0.6
0.8
1.0
0 1 2
A 4
90
Time (d)
wt - FGF-2
wt + FGF-2
pHPSE-3 - FGF-2
pHPSE-3 + FGF-2
0.0
0.1
0.2
0.3
0.4
0 1 3 6
A 4
90
Time (d)
- FGF-2
+ FGF-2

42
The aminoacidic sequence of MT1-MMP is shown in Fig. 4.7.
1 MSPAPRPPRCLLLPLLTLGTALASLGSAQSSSFSPEAWLQQYGYLPPGDLRTHTQRSPQS 60
61 LSAAIAAMQKFYGLQVTGKADADTMKAMRRPRCGVPDKFGAEIKANVRRKRYAIQGLKWQ 120
121 HNEITFCIQNYTPKVGEYATYEAIRKAFRVWESATPLRFREVPYAYIREGHEKQADIMIF 180
181 FAEGFHGDSTPFDGEGGFLAHAYFPGPNIGGDTHFDSAEPWTVRNEDLNGNDIFLVAVHE 240
241 LGHALGLEHSSDPSAIMAPFYQWMDTENFVLPDDDRRGIQQLYGGESGFPTKMPPQPRTT 300
301 SRPSVPDKPKNPTYGPNICDGNFDTVAMLRGEMFVFKERWFWRVRNNQVMDGYPMPIGQF 360
361 WRGLPASINTAYERKDGKFVFFKGDKHWVFDEASLEPGYPKHIKELGRGLPTDKIDAALF 420
421 WMPNGKTYFFRGNKYYRFNEELRAVDSEYPKNIKVWEGIPESPRGSFMGSDEVFTYFYKG 480
481 NKYWKFNNQKLKVEPGYPKSALRDWMGCPSGGRPDEGTEEETEVIIIEVDEEGGGAVSAA 540
541 AVVLPVLLLLLVLAVGLAVFFFRRHGTPRRLLYCQRSLLDKV 583
Figure 4.7. Amino acidic sequence of wt MT1-MMP protein, as reported in Ensembl Genome
Browser. MT1-MMP hemopexin and cytoplasmic domains are highlighted in yellow and green,
respectively; the glutamic acid (E) in position 240 of the E240A mutant is written in red and bold.
In addition, we used stable MCF-7 cells Tet-Off transfectants (clone 8 cells) in which
expression of wt MT1-MMP is controlled by the tetracycline resistance transactivator,
and can therefore be suppressed by addition of doxycycline (a tetracycline analog) to the
culture medium.
MCF-7 cells do not express FGF-2; however, by semi-quantitative RT-PCR analysis they
show high expression of FGF-2 receptors (FGFR) 1, 2 and 4, and low expression of FGF
receptor-3 (Fig. 4.8). For each FGFR, the forward and reverse primers used were
designed to detect all the splicing variants.
Figure 4.8. FGFRs expression in MCF-7 cells. FGFRs mRNA levels in MCF-7 cells were determined by
semi-quantitative PCR. GAPDH mRNA was used as loading control (H2O, negative control for PCR).
FGFR-1
FGFR-2
FGFR-3
FGFR-4
GAPDH

43
4.6 ERK1/2 activation by FGF-2 in MCF-7 cells expressing MT1-MMP
Since MCF-7 cells do not express FGF-2 but express 3 FGFRs, clone 8 cells grown in the
presence or absence of DOX (i.e. without or with expression of MT1-MMP) were treated
with human recombinant FGF-2 (0.75 ng/ml) for 15 min and ERK1/2 activation was
analyzed by Western blotting.
As shown in Fig. 4.9, ERK1/2 activation by FGF-2 was lower in MT1-MMP expressing
cells than in cells with no MT1-MMP expression.
Figure 4.9. ERK1/2 activation by FGF-2 in MCF-7 cells. MT1-MMP Tet-Off MCF-7 cells (MCF-7
clone 8) grown for 24 h in the presence (no MT1-MMP expression) or absence (MT1-MMP expression) of
1 µg/ml DOX in medium containing 0.5% FBS were treated with 0.75 ng/ml FGF-2 for 15 min. Active
ERK1/2 (p-ERK1/2) and MT1-MMP were detected by Western blotting. Tubulin was used as a loading
control.
We next performed experiments to identify the optimal FGF-2 concentration and time of
treatment to detect the different activation of ERK1/2. Addition of increasing
concentrations of FGF-2 (from 0.25 ng/ml to 0.75 ng/ml for 15 min) and time-course
experiments (from 15 min to 60 min with 0.75 ng/ml FGF-2) showed that the difference
in ERK1/2 activation between MT1-MMP expressing and non-expressing cells was most
evident after FGF-2 treatment with 0.75 ng/ml for 15 min (Fig. 4.10, A and B). Therefore,
all subsequent experiments were performed with 0.75 ng/ml FGF-2 and 15 min
incubation, except where indicated otherwise.
To confirm this result and understand which domain of MT1-MMP is responsible for the
different ERK1/2 activation, MCF-7 cells transiently transfected with wt or mutant MT1-
MMP cDNAs were treated with FGF-2 (0.75 ng/ml for 15 min).
FGF-2 (0.75 ng/ml)
DOX
TUB
p-ERK1/2
MT1-MMP
- +- +
+ +- -

44
Figure 4.10. ERK1/2 activation by FGF-2 in MCF-7 cells. MCF-7 cells grown for 24 h in the presence or
absence of DOX in medium containing 0.5% FBS were treated with increasing concentrations of FGF-2 (A)
(0.25 ng/ml to 0.75 ng/ml) for 15 min or with 0.75 ng/ml FGF-2 for increasing times (B) (15 min to 60
min). ERK1/2 phosphorylation was detected by Western blotting. Tubulin was used as a loading control.
Figure 4.11. ERK1/2 activation by FGF-2 in MCF-7 cells transiently transfected with MT1-MMP. MCF-7 cells transiently transfected with wt or mutant MT1-MMP cDNAs were grown for 24 h in medium
containing 0.5% FBS and treated with FGF-2 (0.75 ng/ml for 15 min). ERK1/2 phosphorylation and MT1-
MMP expression were detected by Western blotting. Tubulin was used as a loading control (-, empty
vector; Δpex, Δcyt, MT1-MMP devoid of the hemopexin domain or the cytoplasmic tail, respectively;
E240A, MT1-MMP mutated in the catalytic site, with an alanine substitution of the glutamic acid in
position 240).
MT1-MMP
FGF-2 (0.75 ng/ml)
p-ERK1/2
MT1-MMP
TUB
- wt Δpex Δcyt E240A
- + - + - +- + - +
MT1-MMP
0 0.25 0.5 0.75 0 0.25 0.5 0.75
+ -
FGF-2 (ng/ml) 15 min
p-ERK1/2
TUB
0 15 30 60 0 15 30 60FGF-2 (min) 0.75 ng/ml
p-ERK1/2
TUB
A
B

45
As shown in Fig. 4.11, cells transfected with the control empty vector revealed no MT1-
MMP expression. Conversely, in cells transfected with wt MT1-MMP, Western blotting
analysis showed one 57 kDa band corresponding to active MT1-MMP, in addition to low
molecular weight bands that represent MT1-MMP degradation products generated by
auto-catalysis. Since the hemopexin domain accounts for 189 of 472 amino acids of
active MT1-MMP, cells transfected with mutant MT1-MMP devoid of this domain
(Δpex) showed a band of approximately 40 kDa. In contrast, mutant MT1-MMP lacking
the short (20 amino acids) cytoplasmic tail (Δcyt) migrated in the gel as a band with a
molecular weight similar to that of wt MT1-MMP. MCF-7 cells transfected with MT1-
MMP mutated in the catalytic site (E240A) expressed a full-length protein, but no
degradation products were detectable.
The level of ERK1/2 activation by FGF-2 in cells transfected with the empty vector was
comparable to that obtained with the E240A mutant, and more elevated than the one
observed in cells transfected with wt MT1-MMP. MCF-7 cells expressing either Δpex or
Δcyt MT1-MMP, which are both proteolytically active, showed levels of ERK1/2
activation similar to that of cells expressing wt MT1-MMP (Fig. 4.11). These results
therefore indicate that MT1-MMP decreases activation of ERK1/2 by a mechanism
mediated by its catalytic domain.
To confirm this indication clone 8 cells were pre-treated with Ilomastat, a potent inhibitor
of the catalytic activity of MMPs, and incubated with FGF-2. Consistent with the
previous results, ERK1/2 activation by FGF-2 was lower in clone 8 cells expressing
catalytically active MT1-MMP than in cells where the enzymatic activity was inhibited
by Ilomastat (Fig. 4.12,A).
Figure 4.12. ERK1/2 activation by FGF-2 in MCF-7 cells. (A) MCF-7 cells grown for 24 h in medium
containing 0.5% FBS were treated with Ilomastat (50 µM), a potent inhibitor of the catalytic activity of
MMPs, and FGF-2 (0.75 ng/ml for 15 min). (B) MCF-7 cells grown for 24 h in the presence or absence of
DOX in medium containing 0.5% FBS were treated with FGF-2 (30 ng/ml for 15 min). ERK1/2
phosphorylation, MT1-MMP expression and cell-associated FGF-2 were detected by Western blotting.
Tubulin was used as a loading control.
Ilomastat (50 μM)
FGF-2 (0.75 ng/ml)
p-ERK1/2
TUB
- +- +
+ +- -
TUB
FGF-2
p-ERK1/2
MT1-MMP
FGF-2 (30 ng/ml)
DOX - +- +
+ +- -
A B

46
The same effect was observed in other experiments in which MCF-7 cells expressing
MT1-MMP were treated with 30 ng/ml FGF-2, a saturating concentration. In these
experiments we also observed that the level of cell-associated FGF-2 was lower in cells
that expressed than in cells that did not express MT1-MMP (Fig. 4.12,B).
These findings indicated that the proteolytic activity of MT1-MMP controls FGF-2
signaling by regulating the amount of FGF-2 that binds to the cells.
4.7 Effects of MT1-MMP on cell-associated FGF-2
To test the hypothesis of the possible regulation of FGF-2 signaling by active MT1-MMP
we performed a series of experiments. In the first set of experiments, clone 8 cells grown
in the presence of DOX (i.e. not expressing MT1-MMP) were treated with FGF-2 (30
ng/ml) for increasing lengths of time (5 min to 30 min), and ERK1/2 activation and cell-
associated FGF-2 were analyzed by Western blotting analysis.
Figure 4.13. ERK1/2 activation by FGF-2 in MCF-7 cells. MCF-7 cells grown for 24 h in the presence or
absence of DOX in medium containing 0.5% FBS were treated with FGF-2 (30 ng/ml) for increasing times
(from 5 min to 30 min). ERK1/2 phosphorylation, MT1-MMP expression and cell-associated or soluble
FGF-2 in the conditioned medium were detected by Western blotting. Tubulin was used as a loading
control.
As shown in Fig. 4.13, maximum ERK1/2 activation occurred after 5 min of FGF-2
treatment and rapidly decreased, whereas the amount of cell-associated FGF-2 increased
in a time-dependent manner, and only one band with a molecular weight equal to 17 kDa
- corresponding to the recombinant exogenous FGF-2 - was detected in the cell extracts.
At each time-point, both ERK1/2 phosphorylation and cell-associated FGF-2 were lower
in MT1-MMP expressing cells than in cells devoid of this proteinase. In contrast, no
TUB
FGF-2
p-ERK1/2
MT1-MMP
FGF-2 (30 ng/ml)
DOX
FGF-2Conditioned
medium
Cell extracts
5 10 15 30 5 10 15 30 min
- -- - + ++ +

47
differences were detected in FGF-2 levels in the conditioned medium of cells that
expressed vs. cells that did not express MT1-MMP (Fig. 4.13).
Since the quantity of FGF-2 observed in the conditioned medium was too high to
appreciate potential differences, the experiment was repeated with 3 ng/ml FGF-2.
However, with the exception of the 5 min time-point, also this experiment did not show
any MT1-MMP-dependent differences in the levels of FGF-2 (Fig. 4.14).
Figure 4.14. FGF-2 amount in MCF-7 cell conditioned medium. MCF-7 cells grown for 24 h in the
presence or absence of DOX in medium containing 0.5% FBS were treated with FGF-2 (3 ng/ml) for
increasing times (5 min to 30 min). FGF-2 was detected in the conditioned medium by Western blotting.
To investigate whether MT1-MMP affects FGF-2 binding to its low- (heparan sulfate
proteoglycans, HSPGs) and/or high-affinity receptors (FGFRs), clone 8 cells were treated
with 30 ng/ml of FGF-2 for 15 min, and subsequently washed 3 times with PBS alone or
with PBS followed by a buffer containing either 2 M NaCl at pH 7.5 (2 M NaCl in 20
mM HEPES, pH 7.5) or 2 M NaCl at pH 4.0 (2 M NaCl in 20 mM sodium acetate, pH
4.0). Because of their different ionic strength (pH), these two buffers remove FGF-2 from
the HSPGs or the FGFRs, respectively [82]. The amount of FGF-2 was finally detected in
both cell extracts and washing buffers by Western blotting.
As shown in Fig. 4.15, consistent with previous results, in the control cells washed with
PBS alone a lower amount of FGF-2 was present in extracts of MT1-MMP expressing
cells than in cells without MT1-MMP. The detachment of FGF-2 from the cell surface
was demonstrated by the presence of very faint bands corresponding to FGF-2 in extracts
of the cells after the 2 M NaCl washings. Only in MT1-MMP non-expressing cells
washed with 2.0 M NaCl at pH 7.5, FGF-2 was detected in the washing buffers,
indicating that the amount of FGF-2 bound to the HSPGs in these cells was higher than in
MT1-MMP expressing cells. In cells washed with 2 M NaCl at pH 4.0, no FGF-2 was
identified (Fig. 4.15).
5 15 30 5 15 30 minFGF-2 (3 ng/ml)
MT1-MMP
FGF-2Conditioned
medium
-+

48
Figure 4.15. FGF-2 binding to low- and high-affinity receptors. MCF-7 cells grown for 24 h in the
presence or absence of DOX in medium containing 0.5% FBS were treated with FGF-2 (30 ng/ml for 15
min) and then washed with PBS alone or with a buffer containing either 2 M NaCl at pH 7.5 or 2 M NaCl at
pH 4.0. FGF-2 was detected in both cell extracts and washing buffers by Western blotting. One nanogram
of the recombinant FGF-2 was also loaded to verify the molecular weight of cell-associated and detached
FGF-2. Tubulin was used as a loading control.
4.8 Characterization of cell-associated FGF-2
To confirm that MT1-MMP does not degrade FGF-2 we used recombinant human FGF-2
labeled with biotin. This approach is preferable to Western blotting analysis to detect
FGF-2 degradation. Indeed, monoclonal anti-FGF-2 antibody interacts with a specific
region of FGF-2; if this region is cleaved from the protein the cleavage product may be
impossible to detect.
Recombinant FGF-2 is a small protein with a molecular weight of 17 kDa, and composed
of 155 amino acids. Biotin reacts chemically with the primary amino groups (-NH2) of
lysine (K), arginine (R), and the N-terminus of proteins, and these amino acid residues are
numerous and well-distributed in FGF-2 (Fig. 4.16).
1 MAAGSITTLPALPEDGGSGAFPPGHFKDPKRLYCKNGGFFLRIHPDGRVDGVREKSDPHI 60
61 KLQLQAEERGVVSIKGVCANRYLAMKEDGRLLASKCVTDECFFFERLESNNYNTYRSRKY 120
121 TSWYVALKRTGQYKLGSKTGPGQKAILFLPMSAKS 155
Figure 4.16. Amino acidic sequence of recombinant FGF-2 protein, as reported in Ensembl Genome
Browser. Lysine (K) and arginine (R) residues are highlighted in yellow and light blue respectively.
MT1-MMP
PBS2M NaCl
pH 7.5
2M NaCl
pH 4.0
FGF-2 (30 ng/ml)
FGF-2
FGF-2
Cell extracts
Washing
buffer
TUB
+ +- -
+ ++ +
+ -
++

49
Since the specific biotin used in this study was conjugated to a sulfated group, the
biotinylated-FGF-2 could not permeate cell membranes, and only ECM- and/or
membrane-bound FGF-2 could be detected.
After biotinylation, FGF-2 could be detected by both anti-FGF-2 antibody and
streptavidin (Fig. 4.17,A). We then treated clone 8 cells with both unlabeled and
biotinylated FGF-2, and analyzed ERK1/2 activation. The results showed that
biotinylated FGF-2 was less effective in activating ERK1/2 than unlabeled FGF-2.
Importantly, ERK1/2 phosphorylation levels induced by biotin alone were comparable to
those obtained by biotinylated FGF-2, a limitation that prevented us from using
biotinylated FGF-2 for the planned experiments (Fig. 4.17,B).
Figure 4.17. Biotinylation of soluble FGF-2. (A) Recombinant human FGF-2 labeled with biotin (5
ng/ml) was detected by Western blotting with streptavidin or with anti-FGF-2 antibody. (B) MCF-7 cells
were treated with unlabeled FGF-2 (5 ng/ml), biotinylated FGF-2 (5 ng/ml) or biotin alone for 15 min.
ERK1/2 activation was detected by Western blotting. Tubulin was used as a loading control.
Therefore, we adopted an alternative strategy. We first treated clone 8 cells with
unlabeled FGF-2 (30 ng/ml for 15 min), and then biotinylated the proteins associated with
the cell surface. These proteins included the exogenous FGF-2 bound to the FGFRs and
to the HSPGs. The biotinylated FGF-2 was then immunoprecipitated with anti-FGF-2
antibody, and the immunocomplex detected by Western blotting using streptavidin.
As shown in Fig. 4.18, consistent with the previous results the amount of biotinylated
FGF-2 was lower in MT1-MMP-expressing cells than in cells with no MT1-MMP.
Indeed this difference was more evident than the one detected with anti-FGF-2 antibody,
as this also detects intracellular, i.e. unlabeled, FGF-2 (Fig. 4.18).
Taken together, these experiments showed that catalytically active MT1-MMP reduces
FGF-2 binding to the cell surface, but does not degrade it.
Streptavidin
Anti-FGF-2
Biot-FGF-2(5 ng/ml)
p-ERK1/2
TUB
FGF-2 (5 ng/ml)
Biot-FGF-2 (5 ng/ml)
Biotin
+ - - -
+- - -
- - - +
A B

50
Figure 4.18. Biotinylation of cell surface-associated FGF-2. MCF-7 cells grown for 24 h in the presence
or absence of DOX in medium containing 0.5% FBS were treated with unlabeled FGF-2 (30 ng/ml for 15
min) and cell surface-associated proteins, including FGF-2, were biotinylated. The biotinylated FGF-2 was
immunoprecipitated with anti-FGF-2 antibody, and the immunocomplex detected by Western blotting using
streptavidin. Five nanograms of the biotinylated FGF-2 were also loaded as a control for streptavidin
binding to biotin.
4.9 Effects of decreased FGF-2 binding on MCF-7 cell proliferation
Since in MCF-7 cells expressing a catalytically active MT1-MMP both ERK1/2
activation by FGF-2 and the total amount of cell-associated FGF-2 were reduced, we
investigated whether these effects affected cell proliferation. To test this hypothesis, clone
8 cells grown in the presence of DOX (i.e. without MT1-MMP expression) were treated
with FGF-2 (10 ng/ml) and proliferation was analyzed by the MTS assay after 1, 2 and 3
days. Although these experiments were done in the presence of low serum concentration
(0.5% FBS), the cells showed a very rapid growth rate. Cells treated with FGF-2 for 3
days showed a 50% increase in proliferation relative to untreated cells (p < 0.05). No
statistically significant differences in cell proliferation were observed between MT1-
MMP-expressing and non-expressing cells (Fig. 4.19).
Figure 4.19. Effects of decreased FGF-2 binding on MCF-7 cell proliferation. MCF-7 cells grown for
24 h in the presence or absence of DOX in medium containing 0.5% FBS were treated with FGF-2 (10
ng/ml) for 1, 2 and 3 days and cell number was measured by the MTS assay. Each point represents mean ±
standard deviation of a representative experiment performed with triplicate samples (MT, MT1-MMP).
0.0
0.2
0.4
0.6
0.8
1.0
1.2
0 1 2 3
A 4
90
Time (d)
+ MT - FGF-2
+ MT + FGF-2
- MT - FGF-2
- MT + FGF-2
FGF-2 (30 ng/ml)
MT1-MMP
Biot-FGF-2 (5 ng)
Streptavidin
Anti-FGF-2
IgG IP
+ - - -
+ ++
+ -+

51
4.10 MT1-MMP, FGF-2 and FGFRs expression in pediatric glioma cells
We further investigated whether the novel mechanism of FGF-2 control by MT1-MMP
observed in MCF-7 cells was also effective in the pediatric glioma cell lines.
In order to evaluate MT1-MMP and FGF-2 expression in these cells, a preliminary
Western blot analysis was performed. The results showed that two of the five cell lines
(UW479 and Res186) express high levels of MT1-MMP, two (SF188 and Res259) have
moderate expression levels, and one (KNS42) expressed no MT1-MMP. In all MT1-
MMP-expressing cells, MT1-MMP appeared in the gel as a single band and no
degradation products were detected.
Res186 cells exhibited high expression of both low- (17 kDa) and high-molecular weight
(22 kDa) FGF-2. KNS42 cells expressed low levels of FGF-2, whereas the other cell lines
showed no FGF-2 expression (Fig. 4.20,A).
Figure 4.20. MT1-MMP and FGF-2 expression and MMP-2 activity in pediatric glioma cells. (A)
MT1-MMP and FGF-2 expression was analyzed by Western blotting of pediatric glioma cell extracts.
Tubulin was used as a loading control. (B) Glioma cell-conditioned medium was analyzed by gelatin
zymography. As a positive control, BCE cell-conditioned medium containing proMMP-2 was incubated for
24 h with MCF-7 cells transfected with wt MT1-MMP. Both proMMP-2 and MMP-2 are visible.
Since proMMP-2 activation is a simple and indirect method to understand whether MT1-
MMP is expressed in its activated form, we analyzed glioma cell-conditioned medium by
gelatin zymography. As a positive control, BCE cell-conditioned medium, which contains
proMMP-2, was incubated for 24 h with MCF-7 cells transfected with wt MT1-MMP.
MT1-MMP
TUB
FGF-2
- +
++
MCF-7
Cond. medium
from BCE
proMMP-2
MMP-2
MT1-MMP
A
B

52
MCF-7 cells do not express proMMP-2 or MMP-2 (not shown), but the transfected cells
produce active MT1-MMP, which activates the proMMP-2 secreted from the BCE cells.
Both proMMP-2 and MMP-2 were indeed detected in this control sample by
zymography. Among the pediatric glioma cell lines, SF188, Res259 and Res186 cells
showed only one band corresponding to the proMMP-2, whereas no MMP was detected
in the other cell lines (Fig. 4.20,B).
UW479 and Res186 cells, which express MT1-MMP, were then incubated with BCE cell-
conditioned medium, and, as shown in Fig. 4.21, in both cell lines only proMMP-2 was
detected (Fig. 4.21). This finding indicated that the MT1-MMP expressed by these cells is
not active.
Figure 4.21. MMP-2 activity in UW479 and Res186 cells. BCE cell-conditioned medium incubated for
24 h with UW479 and Res186 cells and with MCF-7 cells transfected with wt MT1-MMP, as a positive
control, was analyzed by gelatin zymography.
Semi-quantitative PCR analysis
was then carried out to
characterize the expression of the
FGFRs in the pediatric glioma
cell lines. Each cell line
expressed at least one of the four
FGFRs mRNA; FGFR-1 being
expressed in all cell lines (Fig.
4.22).
Figure 4.22. FGFRs expression in pediatric glioma cells. FGFRs mRNA levels in pediatric glioma cells
were determined by semi-quantitative PCR. GAPDH mRNA was used as loading control (H2O, negative
control for PCR).
UW479 Res186
- + - +
- +
++
MCF-7
Cond. medium
from BCE
proMMP-2
MMP-2
MT1-MMP
FGFR-1
FGFR-2
FGFR-3
FGFR-4
GAPDH

53
4.11 ERK1/2 activation by FGF-2 in pediatric glioma cells
Given the heterogeneity in the expression of MT1-MMP, FGF-2 and FGFRs, all the
pediatric glioma cell lines were treated with recombinant FGF-2 (10 ng/ml for 15 min) to
analyze ERK1/2 activation and understand whether a correlation between ERK1/2
activation and MT1-MMP expression also exists in these tumor cells.
In SF188, KNS42 and Res259 cells FGF-2 induced stronger ERK1/2 phosphorylation
than in the other cell lines. In particular, under these experimental conditions, no ERK1/2
activation was induced by FGF-2 in UW479 cells, whereas Res186 cells showed
constitutive ERK1/2 activation, even without FGF-2 treatment. In agreement with the
results previously obtained with MCF-7 cells, ERK1/2 activation seemed to inversely
correlate with MT1-MMP expression (Fig. 4.23).
Figure 4.23. ERK1/2 activation by FGF-2 in pediatric glioma cells. Pediatric glioma cells grown for 24
h in medium containing 0.5% FBS were treated with FGF-2 (10 ng/ml for 15 min). ERK1/2 activation,
FGF-2 and MT1-MMP were detected by Western blotting. Tubulin was used as a loading control.
Since SF188 cells were one of the most responsive to FGF-2 treatment, subsequent dose-
response and time-course analyses of ERK1/2 activation were performed with these cells.
Addition of increasing concentrations of FGF-2 (from 0.1 to 10 ng/ml for 15 min) showed
that maximum ERK1/2 phosphorylation occurred with 1.0 ng/ml of FGF-2 and was very
rapid (5-15 min) (Fig. 4.24).
MT1-MMP
p-ERK1/2
TUB
FGF-2
FGF-2 (10 ng/ml)
SF188 KNS42 UW479 Res259 Res186
+- +- +- +- +-

54
Figure 4.24. ERK1/2 activation by FGF-2 in SF188 cells. SF188 cells grown for 24 h in medium
containing 0.5% FBS were treated with increasing concentrations of FGF-2 (A) (0.1 ng/ml to 10 ng/ml) for
15 min, or with 1 ng/ml FGF-2 for increasing times (B) (1 min to 30 min). ERK1/2 activation was detected
by Western blotting. Tubulin was used as a loading control.
In order to investigate the existence of a potential common mechanism through which
MT1-MMP could regulate intracellular signaling by FGF-2 in different tumor cells,
glioma cells were pre-treated with the MMP inhibitor Ilomastat, and then incubated with
FGF-2 (10 ng/ml for 15 min) (Fig. 4.25).
Figure 4.25. ERK1/2 activation by FGF-2 in pediatric glioma cells treated with Ilomastat. Pediatric
glioma cells grown for 24 h in medium containing 0.5% FBS were treated with Ilomastat (50 µM) and
FGF-2 (10 ng/ml) for 15 min. ERK1/2 activation was detected by Western blotting. Tubulin was used as a
loading control.
Ilomastat (50 μM)
FGF-2 (10 ng/ml)
p-ERK1/2
TUB
p-ERK1/2
TUB
SF188 KNS42 UW479
Res259 Res186
- +- +
+ +- -
- +- +
+ +- -
- +- +
+ +- -
0 0.1 1.0 10 ng/ml 1 2 5 15 30 min
p-ERK1/2
TUB
FGF-2
A B
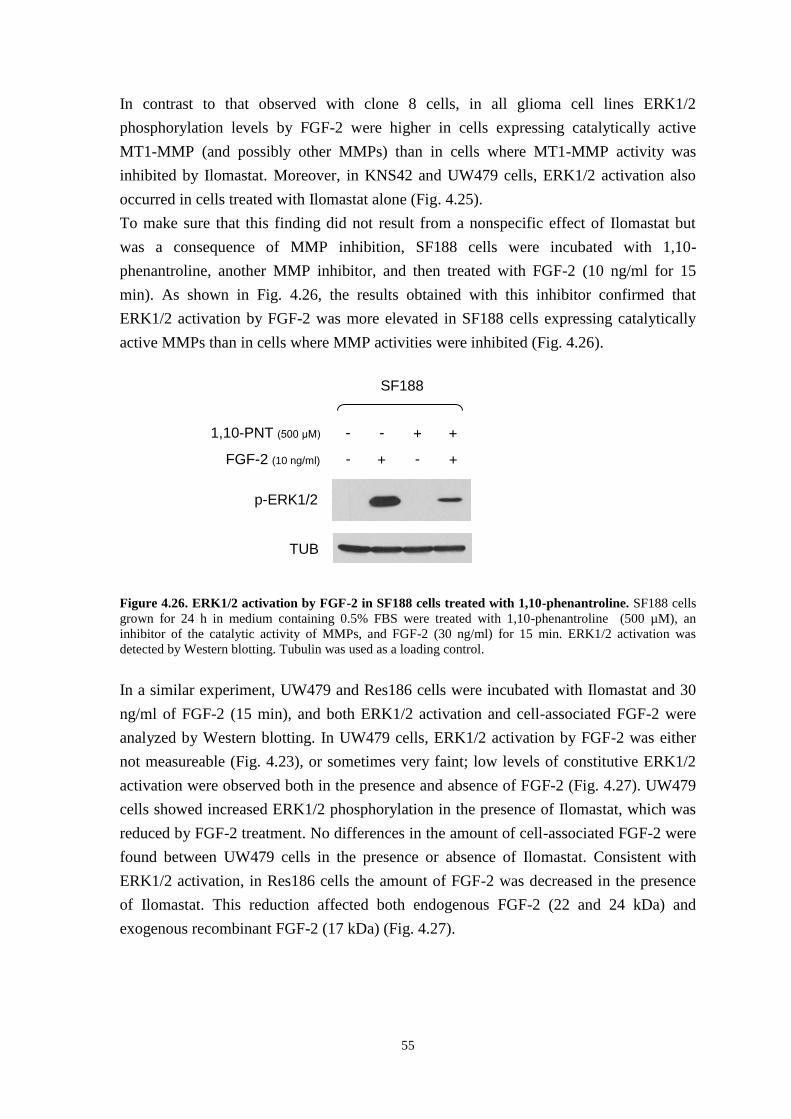
55
In contrast to that observed with clone 8 cells, in all glioma cell lines ERK1/2
phosphorylation levels by FGF-2 were higher in cells expressing catalytically active
MT1-MMP (and possibly other MMPs) than in cells where MT1-MMP activity was
inhibited by Ilomastat. Moreover, in KNS42 and UW479 cells, ERK1/2 activation also
occurred in cells treated with Ilomastat alone (Fig. 4.25).
To make sure that this finding did not result from a nonspecific effect of Ilomastat but
was a consequence of MMP inhibition, SF188 cells were incubated with 1,10-
phenantroline, another MMP inhibitor, and then treated with FGF-2 (10 ng/ml for 15
min). As shown in Fig. 4.26, the results obtained with this inhibitor confirmed that
ERK1/2 activation by FGF-2 was more elevated in SF188 cells expressing catalytically
active MMPs than in cells where MMP activities were inhibited (Fig. 4.26).
Figure 4.26. ERK1/2 activation by FGF-2 in SF188 cells treated with 1,10-phenantroline. SF188 cells
grown for 24 h in medium containing 0.5% FBS were treated with 1,10-phenantroline (500 µM), an
inhibitor of the catalytic activity of MMPs, and FGF-2 (30 ng/ml) for 15 min. ERK1/2 activation was
detected by Western blotting. Tubulin was used as a loading control.
In a similar experiment, UW479 and Res186 cells were incubated with Ilomastat and 30
ng/ml of FGF-2 (15 min), and both ERK1/2 activation and cell-associated FGF-2 were
analyzed by Western blotting. In UW479 cells, ERK1/2 activation by FGF-2 was either
not measureable (Fig. 4.23), or sometimes very faint; low levels of constitutive ERK1/2
activation were observed both in the presence and absence of FGF-2 (Fig. 4.27). UW479
cells showed increased ERK1/2 phosphorylation in the presence of Ilomastat, which was
reduced by FGF-2 treatment. No differences in the amount of cell-associated FGF-2 were
found between UW479 cells in the presence or absence of Ilomastat. Consistent with
ERK1/2 activation, in Res186 cells the amount of FGF-2 was decreased in the presence
of Ilomastat. This reduction affected both endogenous FGF-2 (22 and 24 kDa) and
exogenous recombinant FGF-2 (17 kDa) (Fig. 4.27).
1,10-PNT (500 μM)
FGF-2 (10 ng/ml)
p-ERK1/2
TUB
SF188
- +- +
+ +- -

56
Figure 4.27. ERK1/2 activation by FGF-2 in UW479 and Res186 cells treated with Ilomastat. UW479
and Res186 cells grown for 24 h in medium containing 0.5% FBS were treated with Ilomastat (50 µM) and
FGF-2 (30 ng/ml) for 15 min. ERK1/2 activation and FGF-2 were detected by Western blotting. Tubulin
was used as a loading control.
As shown before, both UW479 and Res186 cells express MT1-MMP but do not activate
proMMP-2 form, indicating that MT1-MMP is not activated (proMT1-MMP).
To understand what mechanism(s) could explain the differences in ERK1/2 activation and
FGF-2 amount in these cells, KNS42 and Res259 cells, which do not express MT1-MMP,
were transiently transfected with plasmids encoding wt or catalytically inactive MT1-
MMP (E240A MT1-MMP), or with the control empty vector. KNS42 cells were then
incubated for 24 h with SF188 cell-conditioned medium, which contains proMMP-2.
Conversely, Res259 cells, which express proMMP-2, were incubated with plain medium.
MT1-MMP expression and proMMP-2 activation were then analyzed by Western blotting
and gelatin zymography, respectively.
As shown in Fig. 4.28, in KNS42 and Res259 cells transfected with wt MT1-MMP, MT1-
MMP was expressed both as a full-length protein and as degradation products generated
by auto-catalysis. However, MT1-MMP degradation products were not observed in
KNS42 cells transfected with the catalytically inactive MT1-MMP E240A mutant; in
contrast, they were present in Res259 E240A cells, probably resulting from proteolytic
cleavage by other MMPs or other proteinases. In addition, transfection efficiency was
higher in KNS42 than in Res259 cells (Fig. 4.28,A). In the conditioned medium collected
from cells transfected with wt MT1-MMP we observed partial activation of proMMP-2
with generation of 62 kDa MMP-2 (Fig. 4.28,B).
Ilomastat (50 μM)
FGF-2 (30 ng/ml)
UW479
p-ERK1/2
TUB
FGF-2
Res186
- +- +
+ +- -
- +- +
+ +- -
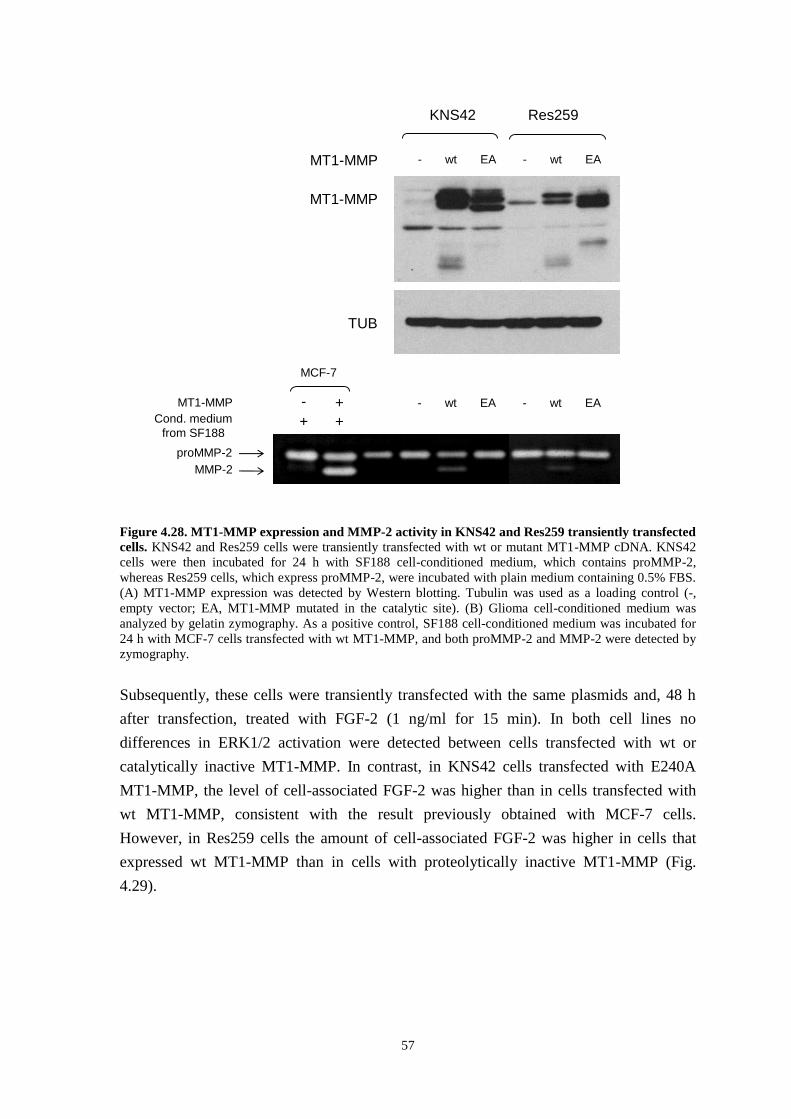
57
Figure 4.28. MT1-MMP expression and MMP-2 activity in KNS42 and Res259 transiently transfected
cells. KNS42 and Res259 cells were transiently transfected with wt or mutant MT1-MMP cDNA. KNS42
cells were then incubated for 24 h with SF188 cell-conditioned medium, which contains proMMP-2,
whereas Res259 cells, which express proMMP-2, were incubated with plain medium containing 0.5% FBS.
(A) MT1-MMP expression was detected by Western blotting. Tubulin was used as a loading control (-,
empty vector; EA, MT1-MMP mutated in the catalytic site). (B) Glioma cell-conditioned medium was
analyzed by gelatin zymography. As a positive control, SF188 cell-conditioned medium was incubated for
24 h with MCF-7 cells transfected with wt MT1-MMP, and both proMMP-2 and MMP-2 were detected by
zymography.
Subsequently, these cells were transiently transfected with the same plasmids and, 48 h
after transfection, treated with FGF-2 (1 ng/ml for 15 min). In both cell lines no
differences in ERK1/2 activation were detected between cells transfected with wt or
catalytically inactive MT1-MMP. In contrast, in KNS42 cells transfected with E240A
MT1-MMP, the level of cell-associated FGF-2 was higher than in cells transfected with
wt MT1-MMP, consistent with the result previously obtained with MCF-7 cells.
However, in Res259 cells the amount of cell-associated FGF-2 was higher in cells that
expressed wt MT1-MMP than in cells with proteolytically inactive MT1-MMP (Fig.
4.29).
- wt EA - wt EA
KNS42 Res259
MT1-MMP
TUB
- +
++
MCF-7
Cond. medium
from SF188
proMMP-2
MMP-2
MT1-MMP - wt EA - wt EA
MT1-MMP

58
Figure 4.29. ERK1/2 activation by FGF-2 in KNS42 and Res259 cells transiently transfected with
MT1-MMP. KNS42 and Res259 cells transiently transfected with wt or mutant MT1-MMP cDNA were
grown for 24 h in medium containing 0.5% FBS and treated with FGF-2 (30 ng/ml for 15 min). ERK1/2
activation, and MT1-MMP and FGF-2 were detected by Western blotting. Tubulin was used as a loading
control (-, empty vector; E240A, MT1-MMP mutated in the catalytic site).
4.12 Effects of FGF-2 on pediatric glioma cell proliferation
To understand whether the effects of FGF-2 on glioma cell proliferation correlated with
MT1-MMP expression, all glioma cell lines were treated with FGF-2 (10 ng/ml), and
proliferation was measured by the MTS assay after 1, 2 and 3 days.
All glioma cell lines showed a very rapid growth rate, both in the presence and absence of
FGF-2. SF188 and KNS42 cells were the most responsive to FGF-2, showing a 35% and
70% increase in cell number, respectively, relative to untreated cells after 3 days (p <
0.05). At the same time-point, the effect of FGF-2 on UW479 and Res259 cell
proliferation was moderate (10 and 15%, respectively). In contrast, Res186 cell
proliferation was not affected by FGF-2 (Fig. 4.30).
p-ERK1/2
MT1-MMP
FGF-2 (30 ng/ml)
TUB
FGF-2
MT1-MMP - wt E240A
KNS42
++ --+-
- wt E240A
Res259
++ --+-

59
Figure 4.30. Effects of FGF-2 treatment on pediatric glioma cell proliferation. Pediatric glioma cells
grown in medium containing 0.5% FBS were treated with FGF-2 (10 ng/ml) for 1, 2 and 3 days and cell
number measured by the MTS assay. Each point represents mean ± standard deviation of a representative
experiment performed with triplicate samples.
0.0
0.2
0.4
0.6
0.8
1.0
1.2
1.4
0 1 2 3
A 4
90
Time (d)
Res186
- FGF-2
+ FGF-2
0.0
0.2
0.4
0.6
0.8
1.0
1.2
1.4
0 1 2 3
A 4
90
Time (d)
SF188
- FGF-2
+ FGF-2
0.0
0.2
0.4
0.6
0.8
1.0
0 1 2 3
A 4
90
Time (d)
KNS42
- FGF-2
+ FGF-2
0.0
0.2
0.4
0.6
0 1 2 3
A 4
90
Time (d)
UW479
- FGF-2
+ FGF-2
0.0
0.2
0.4
0.6
0.8
1.0
1.2
1.4
1.6
0 1 2 3
A 4
90
Time (d)
Res259
- FGF-2
+ FGF-2

60
4.13 ERK1/2 activation by TIMP-2 in pediatric glioma cells
In MCF-7 cells and other human tumor cell lines MT1-MMP binding to its physiological
protein inhibitor, TIMP-2, results in ERK1/2 activation by a proteolysis independent
mechanism mediated by the cytoplasmic tail of MT1-MMP [43]. We therefore
investigated whether this effect also occurs in pediatric glioma cells. For this purpose we
first characterized our glioma cell lines for TIMP-2 expression by Western blotting. All
the glioma cells expressed low TIMP-2 levels comparable to that of MCF-7 cells, with
SF188 and UW479 cells showing lower levels than the other cell lines (Fig. 4.31).
Figure 4.31. TIMP-2 expression in pediatric glioma cells. TIMP-2 was detected in pediatric glioma cell
extracts by Western blotting. TIMP-2 expression in MCF-7 cells was used as positive control. Tubulin was
used as a loading control.
Addition of exogenous, recombinant TIMP-2 (100 ng/ml for 15 min) to the culture
medium induced ERK1/2 phosphorylation in all cell lines, and in particular the activation
was stronger in SF188, Res259 and Res186 cells than in the other cell lines. However, no
correlation between ERK1/2 activation and MT1-MMP expression was apparent. In fact,
TIMP-2 induced ERK1/2 activation in cells that expressed MT1-MMP as efficiently as in
cells without MT1-MMP (Fig. 4.32).
In MCF-7 cells the synthetic MMP inhibitor Ilomastat causes detachment of TIMP-2
from MT1-MMP and thus blocks TIMP-2 induction of ERK1/2 activation [43]. To
investigate whether this effect also occurred in the glioma cell lines, UW479 and Res186
cells, which expressed MT1-MMP, were treated with TIMP-2 in the presence or absence
of Ilomastat. In Res186 cells Ilomastat had the same effect as in MCF-7 cells. However,
in UW479 cells Ilomastat alone induced strong ERK1/2 activation, which was partially
reduced in the presence of TIMP-2. Conversely, no differences in ERK1/2 activation by
TIMP-2 were detected in UW479 cells in the presence or absence of Ilomastat (Fig. 4.33).
TIMP-2
TUB

61
Figure 4.32. ERK1/2 activation by TIMP-2 in pediatric glioma cells. Pediatric glioma cells grown for 24
h in medium containing 0.5% FBS were treated with recombinant TIMP-2 (100 ng/ml for 15 min). ERK1/2
activation was detected by Western blotting. Tubulin was used as a loading control.
Figure 4.33. ERK1/2 activation by TIMP-2 in UW479 and Res186 cells treated with Ilomastat. UW479 and Res186 cells grown for 24 h in medium containing 0.5% FBS were treated with Ilomastat (50
µM) and TIMP-2 (100 ng/ml) for 15 min. ERK1/2 activation was detected by Western blotting. Tubulin
was used as a loading control.
p-ERK1/2
TUB
TIMP-2 (100 ng/ml)
SF188 KNS42 UW479 Res259 Res186
+- +- +- +- +-
p-ERK1/2
TUB
- +- +
+ +- -
- +- +
+ +- -
Ilomastat (50 μM)
TIMP-2 (100 ng/ml)
UW479 Res186

62

63
Chapter 5: Discussion
Primary human brain tumors represent the principal cause of solid cancer-related
mortality in childhood [2]. Gliomas, the most frequent primary brain tumors, comprise a
heterogeneous group of neoplasms that originate from glial cells, the supportive and most
abundant cellular component of the brain. Children affected by gliomas, especially the
more aggressive forms, have a poor clinical outcome and, although tumors do not
metastasize, they can diffusely penetrate throughout the brain [27]. Furthermore, brain is
a terminally differentiated organ protected by the blood-brain barrier, which prevents the
entry of numerous drugs; therefore, tumors arising in this area are clearly different from
any other malignant lesion [4]. The particular cellular composition of gliomas, together
with their diffuse invasiveness and ability to escape therapies has challenged researchers
for decades. Over the past 20 years the cytogenetic and molecular characterization of
gliomas has been intensely investigated in association with tumor formation and
progression [13,83]. Since the majority of the studies conducted so far are focused on
adult gliomas, which show different genetic, molecular and clinical features from their
pediatric counterparts, it is important to seek new advances for the complete
understanding of childhood tumors, in order to improve their diagnosis and prognosis, as
well as the development of new specific therapies for pediatric patients.
The biological mechanisms underlying glioma cell invasion in the normal brain tissue are
numerous and complex. Glioma cell invasion is mainly characterized by the detachment
of single tumor cells from the primary tumor mass, adhesion of cells to the ECM,
degradation of the ECM and subsequent migration of cells, with the generation of
neoplastic lesions distinct from the primary tumor mass [31]. Tumor cell dissemination
may occur along definite structures, for example the basement membranes of blood
vessels or the glial limitans externa, which contain ECM proteins. Frequently, invasive
glioma cells can also migrate along myelinated fiber tracts of white matter. The
extracellular space in anatomic structures, such as blood vessel basement membranes or
between myelinated axons, is profoundly different, suggesting that glioma cells can use a
variety of matrix ligands and activate distinct mechanisms for invasion. The enzymatic
modification of the extracellular space or deposition of ECM by tumor cells may also
create a more permissive environment for tumor spread into the adjacent brain [28]. The
degradation of different components of the ECM involves both proteolytic and glycosidic
enzymes whose activity can regulate many physiological processes, but most importantly
mediate several changes in the microenvironment during tumor invasion and metastasis
[84-86].

64
The expression of ECM-degrading enzymes and their potential role in glial tumors were
investigated in this experimental study by using in vitro models of pediatric glioma. In
particular, among the ECM-degrading enzymes, the heparan sulfate-degrading enzyme
heparanase (HPSE) and membrane-type 1 matrix metalloproteinase (MT1-MMP) were
the focus of our investigation.
All the pediatric glioma cell lines used in our study were derived from astrocytomas of
differing grades (I, II, III and IV) arisen in patients aged 3-16 years. In particular, the cells
included two glioblastoma multiforme (SF188 and KNS42), one anaplastic astrocytoma
(UW479), one diffuse astrocytoma (Res259) and one pilocytic astrocytoma (Res186) cell
line. These tumors originate from astrocytes, glial cells characterized by a star-like
morphology that are responsible for the structural and metabolic support of neurons, and
regulate the environment where they function.
The principal, detailed molecular and phenotypic characterization of these pediatric cell
lines was recently carried out by Bax and colleagues [81].
Unlike the large number of MMPs, a single functional heparanase is used by cells to
degrade the HS side chains of HSPGs [53]. In contrast to its widely reported
overexpression in a variety of tumors, the heparan sulfate-degrading enzyme heparanase
was found to be decreased in gliomas in one published study [63]. On the contrary, more
recently Hong and colleagues have described heparanase upregulation in human gliomas
[64]. Since the results of these few studies are still controversial, heparanase expression
was investigated in all our pediatric glioma cell lines in order to understand its possible
role in modulating glioma tumor growth.
Quantitative Real-Time PCR analysis showed different levels of HPSE expression. In
order to determine the role of HPSE in pediatric gliomas, we silenced HPSE expression in
SF188 cells, which produce high levels of this enzyme. Among the five stably silenced
clones obtained, the one with the best silencing rate (73%) was characterized for mRNA
expression of MMP-2, MT1-MMP and VEGF.
Zcharia and colleagues have recently shown that HPSE knock-out mice have increased
expression of MMPs [74]. Consistent with this observation, we found that the SF188
HPSE silenced cells had MMP-2 and MT1-MMP mRNA levels 35 and 50% higher,
respectively, than non-silenced SF188 cells. This finding suggests that the upregulation of
MMPs expression may compensate for the reduced HPSE expression.
HPSE exhibits also non-enzymatic activities independent of its involvement in ECM
remodeling, and in particular it contributes to the regulation of VEGF signaling [56].
Therefore, we characterized VEGF mRNA expression in SF188 non-silenced and
silenced cells; however, we found no differences in VEGF expression between the two
cell lines. These results also contrast with a report by Zetser and colleagues, who
provided evidence that HPSE overexpression and silencing in different tumor cell lines
resulted in increased and reduced VEGF expression levels, respectively, suggesting that

65
VEGF expression can be regulated by HPSE [61]. Conversely, consistent with the
knowledge that several growth factors, including FGF-2, upregulate VEGF expression
[88], SF188 cells treated with FGF-2 showed 2.5-fold higher VEGF mRNA levels than
untreated cells.
We found no statistically significant differences in cell proliferation between SF188 non-
silenced and silenced cells, indicating that cell proliferation is not affected by HPSE
silencing in these cells. Moreover, FGF-2 treatment induced a 25 and 20% increase in cell
proliferation in non-silenced and silenced cells, respectively, an effect that can be
mediated by FGF-2 directly and indirectly also by the upregulation of VEGF expression.
Before studying the involvement of MT1-MMP in the determination of the malignant
phenotype of pediatric gliomas, the role of MT1-MMP was first examined in an in vitro
model with a completely different origin, the human MCF-7 breast adenocarcinoma cell
line. Since these cells do not express MT1-MMP, they represent an ideal model for the
regulation of its expression as they offer the possibility to generate - by transient or stable
transfection - cells that express wt or mutant MT1-MMP, and to use the parental cells
with no MT1-MMP expression as control. In this study we also used a stably transfected
MCF-7 cell line (MCF-7 clone 8), in which MT1-MMP expression is controlled by an
inducible promoter.
The specific multi-domain structure of MT1-MMP consisting of the extracellular catalytic
and hemopexin domains, a transmembrane sequence and a short cytoplasmic tail enables
MT1-MMP proteolytic activity in the ECM and facilitates intracellular interactions with
the transduction machinery involved in the cell response to extracellular signals [35].
In addition, MCF-7 cells do not express FGF-2 but do express three of the four FGF
receptor tyrosine kinases (FGFRs); for this reason, they also offer a convenient model to
study potential links between MT1-MMP and activation of intracellular signaling by
FGF-2.
It is known that FGF-2 binding to FGFRs as well as MT1-MMP overexpression can
activate several intracellular signaling pathways that control a variety of biological
processes, including tumor cell proliferation and migration [65, 89], but no correlation
between MT1-MMP and FGF-2 - FGFRs has been identified so far.
The results reported in this thesis show for the first time that the proteolytic activity of
MT1-MMP reduces FGF-2 binding to the surface of MCF-7 cells and decreases ERK1/2
activation by FGF-2. These conclusions are based on numerous experimental evidences.
We initially observed that ERK1/2 activation by FGF-2 was lower in MT1-MMP-
expressing MCF-7 cells than in cells with no MT1-MMP expression. Subsequent
experiments performed with MCF-7 cells transiently transfected with plasmids encoding
wt or mutant MT1-MMP cDNAs confirmed this initial observation and showed which
domain of MT1-MMP was involved in the control of the cell response to FGF-2. In

66
particular, ERK1/2 activation by FGF-2 in MCF-7 cells transfected with the empty vector
or with a plasmid encoding proteolytically inactive MT1-MMP mutated in the catalytic
domain (E240A) was more elevated than in cells transfected with wt MT1-MMP. MCF-7
cells expressing MT1-MMP mutants lacking either the hemopexin (Δpex) or the
cytoplasmic (Δcyt) domain but proteolytically active showed levels of ERK1/2 activation
comparable to that of cells that expressed wt MT1-MMP. Therefore, this experiment
showed that the proteolytic activity of MT1-MMP is responsible for the inhibition of
ERK1/2 activation by FGF-2. The involvement of MT1-MMP catalytic domain was
further supported by the finding that in MCF-7 cells treated with Ilomastat, a broad
spectrum and potent inhibitor of the catalytic activity of MMPs, ERK1/2 activation by
FGF-2 was higher than in cells that expressed proteolytically active MT1-MMP.
A recent report has shown that MT1-MMP can potentiate corneal neovascularization
induced by FGF-2, by modulating FGF-2 signal transduction pathways. In particular,
fibroblast cell lines expressing or not expressing MT1-MMP were treated with FGF-2,
and the phosphorylation levels of the MAP kinases p38, JNK and ERK1/2 were analyzed.
The Authors observed that both p38 and JNK activation by FGF-2 was higher in MT1-
MMP-expressing cells than in cells with no MT1-MMP, whereas no differences were
detected in ERK1/2 phosphorylation levels [90]. Although the cells used were not tumor
cells and the observations contrast with the results we obtained with MCF-7 breast
adenocarcinoma cells, it remains unclear how MT1-MMP can affect FGF-2 signaling.
We not only observed a difference in ERK1/2 phosphorylation levels between cells that
expressed or lacked MT1-MMP but also found that the amount of cell-associated FGF-2
was reduced in MCF-7 cells expressing MT1-MMP relative to cells devoid of MT1-
MMP.
Since the proteolytic activity of MT1-MMP targets numerous components of the ECM,
cell adhesion molecules, and other pericellular non-matrix proteins, resulting in the
regulation of cell behavior, tissue development and remodeling [91], we hypothesized
that MT1-MMP could directly degrade FGF-2 or, alternatively, its low and/or high
affinity cell membrane receptors (HSPGs and/or FGFRs). FGF-2 signaling is activated by
the interaction of FGF-2 with both FGFRs and HSPGs; therefore, the degradation of one
or more of these molecules can interfere with the intracellular response.
Although MT1-MMP-mediated degradation of FGF-2 has not been demonstrated, it
would be not surprising. This hypothesis was first supported by the finding that the C-
terminal region of FGF-2 can be cleaved in vitro by trypsin and chymotrypsin [92].
Moreover, Goodman and colleagues have reported that the cell surface peptidase
neprilysin can cleave FGF-2, with its subsequent inactivation, loss of any detectable
receptor binding activity, and inhibition of angiogenesis both in vitro and in vivo [93].
In addition, a study published in 1996 showed that FGFR-1 is a specific target for MMP-2
on the cell surface. MMP-2 can specifically hydrolyze the Val368
-Met369
peptide bond in

67
the FGFR-1 ectodomain, eight amino acids upstream of the transmembrane domain, and
thus release the entire extracellular domain in the form of a soluble FGF receptor [94].
Finally, since soluble and membrane-bound HSPGs also act as co-receptors for FGF-2,
their degradation by proteolytic or glycosidic degrading enzymes can modify FGF-2
signaling, affecting cell proliferation and migration [60,95].
The findings reported in this thesis show that MT1-MMP does not degrade FGF-2, but
downregulates FGF-2 binding to the cell surface.
To test the hypothesis that MT1-MMP degrades FGF-2 by MT1-MMP we first performed
a time-course experiment with MCF-7 cells. We found that whereas maximum ERK1/2
activation occurred after 5 min of FGF-2 treatment and rapidly decreased, the amount of
cell-associated FGF-2 increased in a time-dependent manner. The discrepancy between
level of ERK1/2 activation and amount of cell-associated FGF-2 can be explained by the
typical FGF-2 - FGFR interaction and by the concentration of FGF-2 used in the
experiment. As expected, the binding of a growth factor to its receptor rapidly activates
intracellular signal transduction pathways, which are subsequently downregulated by
cytoplasmic phosphatases. This effect explains why the levels of phosphorylation of
intracellular signaling proteins normally decrease in a time-dependent manner. In
addition, although 30 ng/ml is the best working concentration to detect FGF-2 binding to
cells by Western blotting, it is about 3 times as high as the concentration required to
saturate all cell surface receptors.
Our experiments showed that ERK1/2 phosphorylation levels and the amount of cell-
associated FGF-2 were lower in MT1-MMP-expressing cells than in cells devoid of MT1-
MMP. However, we did not find any MT1-MMP-dependent difference in the level of
FGF-2 present in the conditioned medium of the treated cells. Notably, if the hypothesis
that MT1-MMP degrades FGF-2 were correct, one or more degradation products and/or
bands with lower molecular weight than native FGF-2 should have been detected by
Western blotting. We found no evidence of such degradation products.
Taken together, these initial observations showed that MT1-MMP-expressing cells bound
less FGF-2 on their surface than cells devoid of MT1-MMP, but did not show any FGF-2
degradation by MT1-MMP. Since the monoclonal anti-FGF-2 antibody we used for our
Western blotting analysis interacts with a specific region of FGF-2, if this region is
cleaved the binding between antibody and FGF-2 could be prevented, and no FGF-2
could be identified by Western blotting. Moreover, the antibody detects both intracellular
and cell surface associated FGF-2. To obviate these limitations, we labeled recombinant
FGF-2 with biotin. This approach offered at least two advantages: first, biotin could react
with the numerous lysine and arginine residues of FGF-2; in addition, the sulfated-biotin
we used did not permeate cell membranes, therefore only extracellular, membrane-bound
FGF-2 was labeled. However, the finding that in our experiments biotin alone activated
ERK1/2 as well as biotinylated FGF-2 complicated our approach. This experimental

68
problem could be explained by the fact that the amount of FGF-2 biotinylated (10 µg)
was approximately 100-fold smaller than the quantity (1 mg) usually suggested for the
labeling reaction with biotin; the small amount of FGF-2 available for labeling prevented
the purification of the biotinylated FGF-2 (which would be lost during the purification
procedures) and therefore the labeled protein contained an excess of biotin. Moreover, the
biotinylated FGF-2 activated ERK1/2 less efficiently than the unlabeled molecule. These
limitations prevented the use of biotinylated FGF-2 for our subsequent experiments.
We therefore adopted an alternative strategy. MCF-7 clone 8 cells were treated with FGF-
2, after which all cell surface proteins including FGF-2 bound to HSPGs and FGFRs were
biotinylated. Subsequently the biotinylated FGF-2 was immunoprecipitated and detected
by Western blotting using streptavidin, which binds biotin with high affinity. The amount
of biotinylated FGF-2 detected by this method was lower in MT1-MMP-expressing cells
than in cells with no MT1-MMP. This result was consistent with our previous
observations using anti-FGF-2 antibody; however, the difference between cells with or
without MT1-MMP was much more evident because the cell biotinylation approach
allowed us to detect only cell surface-associated FGF-2, whereas Western blotting of cell
extracts with anti-FGF-2 antibody detects both cell surface-associated and intracellular
FGF-2. These experiments therefore showed that catalytically active MT1-MMP inhibits
FGF-2 binding to the surface of MCF-7 cells.
To investigate whether MT1-MMP controls FGF-2 binding to its low- or high-affinity
receptors, we sought to detach FGF-2 from the cell surface by washing FGF-2 treated
cells with either 2 M NaCl, pH 7.5 or 2 M NaCl, pH 4.0. Because of their different ionic
strength, these solutions remove FGF-2 from HSPGs or FGFRs, respectively [82]. The
effective detachment of FGF-2 from the cell surface was demonstrated by the presence of
very faint bands corresponding to FGF-2 in extracts of the cells after the 2 M NaCl
washings. Interestingly, when the cells were washed with 2 M NaCl at pH 7.5, FGF-2
was detected in the washings only if the cells did not express MT1-MMP, indicating that
the amount of FGF-2 bound to the HSPGs in these cells was higher than in cells
expressing MT1-MMP and that MT1-MMP activity controls FGF-2 binding to HSPGs.
Conversely, when the cells were washed with 2 M NaCl at pH 4.0, no FGF-2 was
detected in the washings, probably because the number of FGFRs was much lower than
that of HSPGs molecules, and - under these experimental conditions - the amount of the
FGF-2 detached from the FGFRs was possibly below the sensitivity limit of the Western
blotting.
Further work is warranted to identify the FGF-2 binding sites degraded by MT1-MMP
and understand the effect of decreased FGF-2 binding on tumor cell functions such as
proliferation, migration and apoptosis.
However, we performed a preliminary experiment to investigate whether decreased FGF-
2 binding affects cell proliferation. MCF-7 cells treated for 3 days with FGF-2 showed a

69
50% increase in proliferation relative to the untreated cells; however, no differences in
cell proliferation were observed between MT1-MMP expressing and non-expressing
cells.
It is important to consider here that HSPGs are not only necessary to facilitate the
formation of the FGF-2 - FGFRs complex, but can positively or negatively regulate FGF-
2 signaling. The HS-binding regions of FGF-2 and FGFRs require different structural
motifs within the HS chains for binding. These differences explain why HS can modulate
signaling in multiple ways. A particular HS that binds both FGF-2 and FGFR(s) acts as a
stimulator, whereas a HS that only binds FGF-2 inhibits the signaling by sequestering the
growth factor. Tight regulation is achieved by a balance of HSPGs that either stimulate or
inhibit FGF-2 binding to its FGFRs [96]. HSPGs can have important functions in tumor
biology, by regulating mediators of tumor cell survival, proliferation, migration and
invasion. The specific effects of both cell surface and soluble HSPGs also depend on
tumor cell type, so that they can stimulate cell growth, survival and migration in some
cells but elicit apoptosis or additional cell functions in others [97].
In breast carcinoma syndecan-1 and -4, the most abundant cell surface HSPGs in this
tumor, have an increased ability to promote the assembly of the FGF-2 - FGFR-1
complex compared with normal mammary epithelial cells [98].
Syndecans can also function as soluble HSPGs as their extracellular domain, consisting of
the HS chains, can be released from the cell surface by a process known as ectodomain
shedding [99]. Syndecan shedding can be induced by both MMPs [100,101] and the HS-
degrading enzyme HPSE [102].
Among the MMPs, MT1-MMP expressed by stromal fibroblasts can directly cleave
syndecan-1 on the cell surface and release the ectodomain, which in turn stimulates breast
carcinoma cell proliferation [103]. The shedding of syndecan-1 mediated by MT1-MMP
can also stimulate cell migration in a fibrosarcoma tumor model [95].
In conclusion, the data reported here show that, in an in vitro model of breast
adenocarcinoma, MT1-MMP can affect FGF-2 activation of ERK1/2 signaling, an effect
resulting from decreased FGF-2 binding to its low- and perhaps also high-affinity
receptors.
Subsequently, the link between MT1-MMP and FGF-2 signaling was investigated in the
pediatric glioma cell lines. The purpose of this investigation was to study whether the
novel mechanism of control of FGF-2 by MT1-MMP observed in the MCF-7 breast
carcinoma cell line was also effective in these cells.
Although it is known that both MT1-MMP [47,104] and FGF-2 [105] are expressed in
adult gliomas, no information regarding the pediatric counterparts was available. For this
reason, we first characterized the expression of these proteins in all the pediatric cell
lines.

70
UW479 and Res186 cells expressed high levels of MT1-MMP, whereas in SF188 and
Res259 cells the expression levels were moderate, and in KNS42 cells no protein was
detected. In all MT1-MMP positive cells MT1-MMP migrated in SDS PAGE as a single
band of approximately 57 kDa, and no degradation products with lower molecular weight
were detected. This observation indicated that in these cells MT1-MMP was expressed in
its inactive, proenzyme form.
The analysis of FGF-2 expression showed that Res186 cells produce high levels of both
the low- and high-molecular weight forms (17 kDa and 22 kDa, respectively) of this
growth factor. Conversely, KNS42 cells expressed low levels of FGF-2, and the other cell
lines showed no detectable FGF-2 expression.
No correlation was apparent between MT1-MMP and/or FGF-2 expression and the
aggressiveness of the original tumors. Interestingly, Res186 cells, which derive from a
benign, grade I pilocytic astrocytoma, expressed high levels of HPSE, MT1-MMP and
FGF-2. This finding contrasts with previous reports [39,59,106] demonstrating that the
expression of HPSE, MT1-MMP and FGF-2 generally correlates with a more aggressive
tumor phenotype and poor prognosis.
Since MT1-MMP is the physiological membrane activator of proMMP-2 [107], MMP-2
activation can be used as an indirect method to understand whether MT1-MMP is
expressed by cells in its activated form. Gelatin zymography analysis of glioma cell
culture supernatants showed that SF188, Res259 and Res186 cells express proMMP-2,
whereas no MMP-2 was detected in the other cell lines. To understand whether MT1-
MMP is produced by UW479 and Res186 cells in its active form, these cells were
incubated with medium conditioned by BCE cells, which contains proMMP-2, and the
culture supernatant was analyzed for MMP-2 activation by gelatin zymography. The
results showed that neither cell line activates MMP-2.
The Western blotting finding of only one band corresponding to MT1-MMP and the
absence of MMP-2 activation demonstrate unequivocally that UW479 and Res186 cells
express inactive MT1-MMP.
The subsequent aim of the study was to analyze ERK1/2 activation and understand
whether it correlates with MT1-MMP expression similarly to what was observed in MCF-
7 cells. For this purpose we first characterized the mRNA expression levels of the four
FGFRs. In adult gliomas at least three FGFRs are expressed [77]. We found that each
pediatric cell line expressed the mRNA of at least one FGFR; FGFR-1 being the only
FGF receptor expressed in all the cell lines.
In SF188, KNS42 and Res259 cells, the levels of ERK1/2 activation by FGF-2 were very
high and more elevated than in the other cell lines, which do not express MT1-MMP. In
agreement with the results obtained with MCF-7 cells, ERK1/2 activation inversely
correlated with MT1-MMP expression, although MT1-MMP was in its inactive form.
However, unlike in MCF-7 cells, in all glioma cell lines the levels of ERK1/2 activation

71
by FGF-2 were decreased in cells in which MMPs, including MT1-MMP, were inhibited
by Ilomastat or 1,10-phenantroline. Moreover, the amount of cell-associated FGF-2 was
similarly decreased in Res186 cells treated with an MMP inhibitor. These results contrast
with those obtained with MCF-7 cells. Since both Ilomastat and 1,10-phenantroline are
selective inhibitors of the catalytic activity of MMPs, our findings suggest that MMP
activity can enhance ERK1/2 activation by FGF-2 in pediatric gliomas. In addition, in
these cells MT1-MMP is either not expressed or is expressed in its inactive, proenzyme
form, indicating that other MMPs could be involved in this process. Among the MMPs,
MMP-3 and -10 were shown to be implicated in the pathogenesis of astrocytomas
[108,109]. To investigate whether MT1-MMP contributes to ERK1/2 activation, MT1-
MMP expression should be inhibited, for example by silencing, in the glioma cell lines
that express this proteinase.
Interestingly, in KNS42 and Res259 cells transiently transfected with wt MT1-MMP,
MT1-MMP degradation products generated by auto-catalysis were detected by Western
blotting. In addition, medium conditioned by these cells showed partial activation of
MMP-2, indicating that the transfected MT1-MMP was expressed in its active form.
However, both cell lines showed no differences in ERK1/2 activation by FGF-2 after
transfection with wt or a proteolytically inactive MT1-MMP mutant (E240A).
Furthermore, in KNS42 cells transfected with the E240A MT1-MMP mutant, the amount
of cell-associated FGF-2 was higher than in cells transfected with wt MT1-MMP, as
occurs in MCF-7 cells. The opposite result was obtained with Res259 cells.
All the glioma cell lines showed a very high growth rate both in the presence and in the
absence of FGF-2. SF188 and KNS42 cells were the most responsive to this growth
factor, whereas the effect of FGF-2 on the UW479 and Res259 cell proliferation was
moderate, and absent on Res186 cells, probably because these cells expressed high levels
of FGF-2. With the exception of Res259 cells, the increase in cell proliferation induced
by FGF-2 was more pronounced in cells that do not express MT1-MMP.
The expression of TIMP-2 - the physiological inhibitor of MT1-MMP [110] - in the
glioma cell lines was comparable to that of MCF-7 cells, in which it is not sufficiently
high to inhibit MT1-MMP activity. Since in MCF-7 cells it is known that MT1-MMP -
TIMP-2 interaction induces ERK1/2 activation [43], all the glioma cell lines were treated
with recombinant TIMP-2. This treatment induced ERK1/2 activation in all the cell lines,
but no correlation was apparent between ERK1/2 activation and MT1-MMP expression.
To further characterize the MT1-MMP – TIMP-2 interaction in glioma cell lines, the
MT1-MMP expressing UW479 and Res186 cells were treated with TIMP-2 in the
presence of Ilomastat. With UW479 cells no differences in ERK1/2 activation by TIMP-2
were observed in the presence or in the absence of Ilomastat. In contrast Ilomastat
reduced ERK1/2 activation by TIMP-2 in Res186 cells, with an effect similar to that
obtained in MCF-7 cells [43]. These results indicate that TIMP-2 can also have MMP-

72
independent functions, including binding to cell surface proteins other than MT1-MMP
and thereby activating intracellular signaling [111].
In conclusion, the data reported in this thesis show that the proteolytic activity of MT1-
MMP inhibits ERK1/2 activation by FGF-2 and reduces FGF-2 binding to the cell surface
of human MCF-7 breast adenocarcinoma cells. Although preliminary experiments
highlight the possible involvement of HSPGs, more experimental evidences is warranted
in order to identify the FGF-2 binding sites degraded by MT1-MMP and understand the
effect of decreased FGF-2 binding on tumor cell functions.
The characterization of five pediatric astrocytoma cell lines has also provided new
insights into the knowledge of this poorly studied group of tumors. We could find no
clear correlation between HPSE, MT1-MMP or FGF-2 expression and the aggressiveness
of these tumor cells. Our results showed that HPSE silencing in a pediatric glioblastoma
cell line does not affect cell proliferation, but upregulates MMP-2 and MT1-MMP
expression, probably to compensate for the reduced HPSE activity. In these pediatric
glioma cells ERK1/2 activation appears to inversely correlate with MT1-MMP
expression, although endogenous MT1-MMP was expressed in its inactive, proenzyme
form. In all the glioma cell lines, ERK1/2 activation by FGF-2 was higher in cells in
which MMP activities were not inhibited, suggesting a possible involvement of MMPs
other than MT1-MMP. Although cells transfected with wt MT1-MMP expressed this
proteinase in its active form, we detected no differences in ERK1/2 activation by FGF-2.
In addition, our results indicated that in these cells TIMP-2 may have signaling functions
independent of MT1-MMP.
The significant differences between the pediatric glioma cell lines and the breast
adenocarcinoma cell line used in this study are likely to reflect the different origin of glial
and epithelial tumors, as well as the profoundly different composition of the extracellular
environment within the brain, and the expression of proteases, heparanase, growth
factors, receptors, HSPGs, and other molecules. Therefore, a detailed understanding of
the specific mechanisms that control glioma cells proliferation and invasion can have
important implications for the development of novel therapeutic strategies for the
management of pediatric gliomas.
73
Bibliography
1. Ohgaki H, Kleihues P. Epidemiology and etiology of gliomas. Acta Neuropathol.
(2005) 109:93-108.
2. Pollack IF. Brain tumors in children. N Engl J Med. (1994) 331:1500-1507.
3. Buckner JC, Brown PD, O’Neill BP, Meyer FB, Wetmore CJ, Uhm JH. Central
nervous system tumors. Mayo Clin. Proc. (2007) 82(10):1271-1286.
4. Pollack IF, Jakacki RI. Childhood brain tumors: epidemiology, current management
and future directions. Nat Rev Neurol. (2011) 7:495-506.
5. Louis DN, Ohgaki H, Wiestler OD, Cavenee WK, Burger PC, Jouvet A et al. The
2007 WHO classification of tumours of the central nervous system. Acta
Neuropathol. (2007) 114:97-109.
6. Kaatsch P, Rickert C, Kühl J, Schüz J, Michaelis J. Population based epidemiologic
data on brain tumors in German children. Cancer. (2001) 92(12):3155-3164.
7. Pfister S, Hartmann C, Korshunov A. Histology and molecular pathology of
pediatric brain tumors. J Child Neurol. (2009) 24:1375-1386.
8. Westphal M, Lamszus K. The neurobiology of gliomas: from cell biology to the
development of therapeutic approaches. Nat Rev Neurosci. (2011) 12(9):495-508.
9. Burkhard C, Di Patre PL, Schüler D, Schüler G, Yaşargil MG, Yonekawa Y et al. A
population-based study of the incidence and survival rates in patients with pilocytic
astrocytoma. J Neurosurg. (2003) 98(6):1170-4.
10. Riemenschneider MJ, Reifenberger G. Molecular neuropathology of gliomas. Int J
Mol Sci. (2009) 10:184-212.
11. Reddy AT. Advances in biology and treatment of childhood brain tumors. Curr
Neurol Neurosci Rep. (2001) 1(2):137-143.
12. Sievert AJ, Fisher MJ. Pediatric low-grade gliomas. J Child Neurol. (2009) 24(11):
1397-1408.
13. Reddy AT, Wellons JC. Pediatric high-grade gliomas. Cancer J. (2003) 9(2):107-
112.
14. Gutmann DH. Using neurofibromatosis-1 to better understand and treat pediatric
low-grade glioma. J Child Neurol. (2008) 23(10):1186-1194.
15. Dasgupta B, Yi Y, Chen DY, Weber JD, Gutmann DH. Proteomic analysis reveals
hyperactivation of the mammalian target of rapamycin pathway in
neurofibromatosis 1-associated human and mouse brain tumors. Cancer Res. (2005)
65(7):2755-2760.
16. Janzarik WG, Kratz CP, Loges NT, Olbrich H, Klein C, Schäfer T et al. Further
evidence for a somatic KRAS mutation in a pilocytic astrocytoma. Neuropediatrics.
(2007) 38(2):61-63.
17. Felix CA, Slavc I, Dunn M, Strauss EA, Phillips PC, Rorke LB et al. p53 gene
mutations in pediatric brain tumors. Med Pediatr Oncol. (1995) 25(6):431-436.
18. Pfister S, Janzarik WG, Remke M, Ernst A, Werft W, Becker N et al. BRAF gene
duplication constitutes a mechanism of MAPK pathway activation in low-grade
astrocytomas. J Clin Invest. (2008) 118(5):1739-1749.

74
19. Mariani L, Deiana G, Vassella E, Fathi AR, Murtin C, Arnold M et al. Loss of
heterozygosity 1p36 and 19q13 is a prognostic factor for overall survival in patients
with diffuse WHO grade 2 gliomas treated without chemotherapy. J Clin Oncol.
(2006) 24(29):4758-4763.
20. Rickert CH, Strater R, Kaatsch P, Wassmann H, Jürgens H, Dockhorn-Dworniczak
B et al. Pediatric High-Grade Astrocytomas Show Chromosomal Imbalances
Distinct from Adult Cases. Am J Pathol. (2001) 158(4):1525-1532.
21. Raffel C, Frederick L, O’Fallon JR, Atherton-Skaff P, Perry A, Jenkins RB et al.
Analysis of oncogene and tumor suppressor gene alterations in pediatric malignant
astrocytomas reveals reduced survival for patients with PTEN mutations. Clin
Cancer Res. (1999) 5(12):4085-4090.
22. Wang Y, Yang J, Zheng H, Tomasek GJ, Zhang P, McKeever PE et al. Expression
of mutant p53 proteins implicates a lineage relationship between neural stem cells
and malignant astrocytic glioma in a murine model. Cancer Cell. (2009) 15(6):514-
526.
23. Sung T, Miller D, Hayes R, Alonso M, Yee H, Newcomb EW. Preferential
inactivation of the p53 tumor suppressor pathway and lack of EGFR amplification
distinguish de novo high grade pediatric astrocytomas from de novo adult
astrocytomas. Brain Pathol. (2000) 10(2):249-259.
24. Faury D, Nantel A, Dunn SE, Guiot MC, Haque T, Hauser P et al. Molecular
profiling identifies prognostic subgroups of pediatric glioblastoma and shows
increased YB-1 expression in tumors. J Clin Oncol. (2007) 25(10):1196-1208.
25. Fisher PG, Tihan T, Goldthwaite PT, Wharam MD, Carson BS, Weingart JD et al.
Outcome analysis of childhood low-grade astrocytomas. Pediatr Blood Cancer.
(2008) 51(2):245-250.
26. Karajannis M, Allen JC, Newcomb EW. Treatment of pediatric brain tumors. J Cell
Physiol. (2008) 217(3):584-589.
27. MacDonald TJ, Aguilera D,Kramm CM. Treatment of high-grade glioma in
children and adolescents. Neuro-Oncol. (2011) 13(10):1049-1058.
28. Giese A, Westphal M. Glioma invasion in the central nervous system.
Neurosurgery. (1996) 39(2):235-250; discussion 250-252.
29. Gundelfinger ED, Frischknecht R, Choquet D, Heine M. Converting juvenile into
adult plasticity: a role for the brain’s extracellular matrix. Eur J Neurosci. (2010)
31:2156-2165.
30. Dityatev A, Seidenbecher CI, Schachner M. Compartmentalization from the
outside: the extracellular matrix and functional microdomains in the brain. Trends
Neurosci. (2010) 33(11):503-512.
31. Onishi M, Ichikawa T, Kurozumi K, Date I. Angiogenesis and invasion in glioma
brain tumor. Pathol (2011) 28:13-24.
32. Tate MC, Aghi MK. Biology of Angiogenesis and Invasion in Glioma
Neurotherapeutics. (2009) 6(3):447-457.
33. Kessenbrock K, Plaks v, Werb Z. Matrix Metalloproteinases: Regulators of the
tumor microenvironment. Cell. (2010) 141(1):52-67.
34. Bourboulia D, Stetler-Stevenson WG. Semin Cancer Biol. Matrix
metalloproteinases (MMPs) and tissue inhibitors of metalloproteinases (TIMPs):

75
positive and negative regulators in tumor cell adhesion. Semin Cancer Biol. (2010)
20(3):161-168.
35. Nagase H, Visse R, Murphy G. Structure and function of matrix metalloproteinases
and TIMPs. Cardiovasc Res. (2006) 69(3):562-573.
36. Egeblad M, Werb Z. New functions for the matrix metalloproteinases in cancer
progression. Nat Rev Cancer. (2002) 2(3):161-174.
37. Barbolina MV, Stack MS. Membrane type 1-matrix metalloproteinase: substrate
diversity in pericellular proteolysis. Semin Cell Dev Biol. (2008) 19(1):24-33.
38. Holmbeck K, Bianco P, Yamada S, Birkedal-Hansen H. A Tethered Collagenase. J
Cell Physiol. (2004) 200(1):11-19.
39. Itoh Y, Seiki M. MT1-MMP: a potent modifier of pericellular microenvironment. J
Cell Physiol. (2006) 206(1):1-8.
40. Strongin AY. Proteolytic and non-proteolytic roles of membrane type-1 matrix
metalloproteinase in malignancy. Biochim Biophys Acta. (2010) 1803(1):133-141
41. Remacle A, Murphy G, Roghi C. Membrane type I-matrix metalloproteinase (MT1-
MMP) is internalised by two different pathways and is recycled to the cell surface. J
Cell Sci (2003) 116:3905-3916.
42. Gingras D, Béliveau R. Emerging concepts in the regulation of membrane-type 1
matrix metalloproteinase activity. Biochim Biophys Acta. (2010) 1803(1):142-150.
43. D'Alessio S, Ferrari G, Cinnante K, Scheerer W, Galloway AC, Roses DF et al.
Tissue inhibitor of metalloproteinases-2 binding to membrane-type 1 matrix
metalloproteinase induces MAPK activation and cell growth by a non-proteolytic
mechanism. J Biol Chem. (2008) 283(1):87-99.
44. Zarrabi K, Dufour A, Li J, Kuscu C, Pulkoski-Gross A, Zhi J et al. Inhibition of
matrix metalloproteinase 14 (MMP-14)-mediated cancer cell migration. J Biol
Chem. (2011) 286(38):33167-33177.
45. Cho JA, Osenkowski P, Zhao H, Kim S, Toth M, Cole K et al. The inactive 44-kDa
processed form of membrane type 1 matrix metalloproteinase (MT1-MMP)
enhances proteolytic activity via regulation of endocytosis of active MT1-MMP. J
Biol Chem. (2008) 283(25):17391-17405.
46. Sato H, Takino T. Coordinate action of membrane-type matrix metalloproteinase-1
(MT1-MMP) and MMP-2 enhances pericellular proteolysis and invasion. Cancer
Sci. (2010) 101(4):843-847.
47. Xie H, Xue YX, Liu LB, Wang P, Liu YH, Ying HQ. Expressions of matrix
metalloproteinase-7 and matrix metalloproteinase-14 associated with the activation
of extracellular signal-regulated kinase1/2 in human brain gliomas of different
pathological grades. Med Oncol. (2011) 1:433-438.
48. Snuderl M, Chi SN, De Santis SM, Stemmer-Rachamimov AO, Betensky RA, De
Girolami U et al. Prognostic value of tumor microinvasion and metalloproteinases
expression in intracranial pediatric ependymomas. J Neuropathol Exp Neurol.
(2008) 67(9):911-920.
49. Bernfield M, Götte M, Park PW, Reizes O, Fitzgerald ML, Lincecum J et al.
Functions of cell surface heparan sulfate proteoglycans. Annu Rev Biochem. (1999)
68:729-777.
50. Watanabe A, Mabuchi T, Satoh E, Furuya K, Zhang L, Maeda S et al. Expression of
syndecans, a heparan sulfate proteoglycan, in malignant gliomas: participation of

76
nuclear factor-kappaB in upregulation of syndecan-1 expression. J Neurooncol.
(2006) 77(1):25-32.
51. Steck PA, Moser RP, Bruner JM, Liang L, Freidman AN, Hwang TL et al. Altered
expression and distribution of heparan sulfate proteoglycans in human gliomas.
Cancer Res. (1989) 49(8):2096-2103.
52. Toyoshima M, Nakajima M. Human heparanase. Purification, characterization,
cloning, and expression. J Biol Chem. (1999) 274(34):24153-24160.
53. Vlodavsky I, Friedmann Y, Elkin M, Aingorn H, Atzmon R, Ishai-Michaeli R et al.
Mammalian heparanase: gene cloning, expression and function in tumor progression
and metastasis. Nat Med. (1999) 5(7):793-802.
54. McKenzie EA. Heparanase: a target for drug discovery in cancer and inflammation.
Br J Pharmacol. (2007) 151(1):1-14.
55. Parish CR, Freeman C, Hulett MD. Heparanase: a key enzyme involved in cell
invasion. Biochim Biophys Acta. (2001) 1471(3):M99-108.
56. Ilan N, Elkin M, Vlodavsky I. Regulation, function and clinical significance of
heparanase in cancer metastasis and angiogenesis. Int J Biochem Cell Biol. (2006)
38(12):2018-2039.
57. Vlodavsky I, Ilan N, Nadir Y, Brenner B, Katz BZ, Naggi A et al. Heparanase,
heparin and the coagulation system in cancer progression. Thromb Res. (2007)
120(2):S112-120.
58. Xu X, Quiros RM, Maxhimer JB, Jiang P, Marcinek R et al. Inverse correlation
between heparan sulfate composition and heparanase-1 gene expression in thyroid
papillary carcinomas: a potential role in tumor metastasis. Clin Cancer Res. (2003)
9:5968-5979.
59. Vlodavsky I, Elkin M, Abboud-Jarrous G, Levi-Adam F, Fuks L, Shafat I et al.
Heparanase: one molecule with multiple functions in cancer progression. Connect
Tissue Res. (2008) 49(3):207-210.
60. Xu X, Rao G, Quiros RM, Kim AW, Miao HQ, Brunn GJ et al. In vivo and in vitro
degradation of heparan sulfate (HS) proteoglycans by HPR1 in pancreatic
adenocarcinomas. Loss of cell surface HS suppresses fibroblast growth factor 2-
mediated cell signaling and proliferation. J Biol Chem. (2007) 282(4):2363-2373.
61. Zetser A, Bashenko Y, Edovitsky E, Levy-Adam F, Vlodavsky I, Ilan N.
Heparanase induces vascular endothelial growth factor expression: correlation with
p38 phosphorylation levels and Src activation. Cancer Res. (2006) 66(3):1455-1463.
62. Nadir Y, Brenner B, Gingis-Velitski S, Levy-Adam F, Ilan N, Zcharia E.
Heparanase induces tissue factor pathway inhibitor expression and extracellular
accumulation in endothelial and tumor cells. Thromb Haemost. (2008) 99(1):133-
141.
63. Ueno Y, Yamamoto M, Vlodavsky I, Pecker I, Ohshima K, Fukushima T.
Decreased expression of heparanase in glioblastoma multiforme. J Neurosurg.
(2005) 102(3):513-521.
64. Hong X, Nelson KK, de Carvalho AC, Kalkanis SN. Heparanase expression of
glioma in human and animal models. J Neurosurg. (2010) 113(2):261-269.
65. Beenken A, Mohammadi M. The FGF family: biology, pathophysiology and
therapy. Nat Rev Drug Discov. (2009) 8(3):235-253.

77
66. Mignatti P, Morimoto T, Rifkin DB. Basic fibroblast growth factor, a protein devoid
of secretory signal sequence, is released by cells via a pathway independent of the
endoplasmic reticulum-Golgi complex. J Cell Physiol. (1992) 151(1):81-93.
67. Mignatti P, Rifkin DB. Release of basic fibroblast growth factor, an angiogenic
factor devoid of secretory signal sequence: a trivial phenomenon or a novel
secretion mechanism? J Cell Biochem. (1991) 47(3):201-207.
68. Mignatti P, Morimoto T, Rifkin DB. Basic fibroblast growth factor released by
single, isolated cells stimulates their migration in an autocrine manner. Proc Natl
Acad Sci USA. (1991) 88(24):11007-11011.
69. Chlebova K, Bryja V, Dvorak P, Kozubik A, Wilcox WR, Krejci P. High molecular
weight FGF2: the biology of a nuclear growth factor. Cell Mol Life Sci. (2009)
66(2):225-235.
70. Wesche J, Haglund K, Haugsten EM. Fibroblast growth factors and their receptors
in cancer. Biochem J. (2011) 437(2):199-213.
71. Zhou M, Sutliff RL, Paul RJ, Lorenz JN, Hoying JB, Haudenschild CC, et al.
Fibroblast growth factor 2 control of vascular tone. Nat Med (1998) 4:201-207.
72. Presta M, Dell'Era P, Mitola S, Moroni E, Ronca R, Rusnati M. Fibroblast growth
factor/fibroblast growth factor receptor system in angiogenesis. Cytokine Growth
Factor Rev. (2005) 16(2):159-178.
73. Jiang X, Couchman JR. Perlecan and tumor angiogenesis. J Histochem Cytochem.
(2003) 51(11):1393-1410.
74. Ribatti D, Vacca A, Rusnati M, Presta M. The discovery of basic fibroblast growth
factor/fibroblast growth factor-2 and its role in haematological malignancies.
Cytokine Growth Factor Rev. (2007) 18(3-4):327-334.
75. Bremnes RM, Camps C, Sirera R. Angiogenesis in non-small cell lung cancer: the
prognostic impact of neoangiogenesis and the cytokines VEGF and bFGF in
tumours and blood. Lung Cancer. (2006) 51(2):143-158.
76. Yetgin S, Yenicesu I, Cetin M, Tuncer M. Clinical importance of serum vascular
endothelial and basic fibroblast growth factors in children with acute lymphoblastic
leukemia. Leuk Lymphoma. (2001) 42(1-2):83-88.
77. Loilome W, Joshi AD, ap Rhys CM, Piccirillo S, Vescovi AL, Gallia GL et al.
Glioblastoma cell growth is suppressed by disruption of fibroblast growth factor
pathway signaling. J Neurooncol. (2009) 94(3):359-366.
78. Bredel M, Pollack IF, Campbell JW, Hamilton RL. Basic fibroblast growth factor
expression as a predictor of prognosis in pediatric high-grade gliomas. Clin Cancer
Res. (1997) 3(11):2157-2164.
79. Tao J, Xiang JJ, Li D, Deng N, Wang H, Gong YP. Selection and characterization
of a human neutralizing antibody to human fibroblast growth factor-2. Biochem
Biophys Res Commun. (2010) 394(3):767-773.
80. Brown PD, Bloxidge RE, Anderson E, Howell A. Expression of activated gelatinase
in human invasive breast carcinoma. Clin Exp Metastasis. (1993) 11(2):183-189.
81. Bax DA, Little SE, Gaspar N, Perryman L, Marshall L, Viana-Pereira M et al.
Molecular and phenotypic characterisation of paediatric glioma cell lines as models
for preclinical drug development. PLoS One. (2009) 4(4):e5209.
82. Moscatelli D. High and low affinity binding sites for basic fibroblast growth factor
on cultured cells: absence of a role for low affinity binding in the stimulation of

78
plasminogen activator production by bovine capillary endothelial cells. J Cell
Physiol. (1987) 131(1):123-130.
83. Tatevossian RG, Lawson AR, Forshew T, Hindley GF, Ellison DW, Sheer D.
MAPK pathway activation and the origins of pediatric low-grade astrocytomas. J
Cell Physiol. (2010) 222(3):509-514.
84. Gialeli C, Theocharis AD, Karamanos NK. Roles of matrix metalloproteinases in
cancer progression and their pharmacological targeting. FEBS J. (2011) 278(1):16-
27.
85. Arvatz G, Shafat I, Levy-Adam F, Ilan N, Vlodavsky I. The heparanase system and
tumor metastasis: is heparanase the seed and soil? Cancer Metastasis Rev. (2011)
30(2):253-268.
86. Rowe RG, Weiss SJ. Navigating ECM barriers at the invasive front: the cancer cell-
stroma interface. Annu Rev Cell Dev Biol. (2009) 25:567-595.
87. Zcharia E, Jia J, Zhang X, Baraz L, Lindahl U, Peretz T et al. Newly generated
heparanase knock-out mice unravel co-regulation of heparanase and matrix
metalloproteinases. PLoS One. (2009) 4(4):e5181.
88. Ferrara N, Gerber HP, LeCouter J. The biology of VEGF and its receptors. Nat
Med. (2003) 9(6):669-676.
89. Gingras D, Bousquet-Gagnon N, Langlois S, Lachambre MP, Annabi B, Béliveau
R. Activation of the extracellular signal-regulated protein kinase (ERK) cascade by
membrane-type-1 matrix metalloproteinase (MT1-MMP). FEBS Lett. (2001)
507(2):231-236.
90. Onguchi T, Han KY, Chang JH, Azar DT. Membrane type-1 matrix
metalloproteinase potentiates basic fibroblast growth factor-induced corneal
neovascularization. Am J Pathol. (2009) 174(4):1564-1571.
91. Strongin AY. Mislocalization and unconventional functions of cellular MMPs in
cancer. Cancer Metastasis Rev. (2006) 25(1):87-98.
92. Sommer A, Rifkin DB. Interaction of heparin with human basic fibroblast growth
factor: protection of the angiogenic protein from proteolytic degradation by a
glycosaminoglycan. J Cell Physiol. (1989) 138(1):215-220.
93. Goodman OB Jr, Febbraio M, Simantov R, Zheng R, Shen R, Silverstein RL et al.
Neprilysin inhibits angiogenesis via proteolysis of fibroblast growth factor-2. J Biol
Chem. (2006) 281(44):33597-33605.
94. Levi E, Fridman R, Miao HQ, Ma YS, Yayon A, Vlodavsky I. Matrix
metalloproteinase 2 releases active soluble ectodomain of fibroblast growth factor
receptor 1. Proc Natl Acad Sci USA. (1996) 93(14):7069-7074.
95. Endo K, Takino T, Miyamori H, Kinsen H, Yoshizaki T, Furukawa M et al.
Cleavage of syndecan-1 by membrane type matrix metalloproteinase-1 stimulates
cell migration. J Biol Chem. (2003) 278(42):40764-40770.
96. Guimond S, Maccarana M, Olwin BB, Lindahl U, Rapraeger AC. Activating and
inhibitory heparin sequences for FGF-2 (basic FGF). Distinct requirements for FGF-
1, FGF-2, and FGF-4. J Biol Chem. (1993) 268(32):23906-23914.
97. Teng YH, Aquino RS, Park PW. Molecular functions of syndecan-1 in disease.
Matrix Biol. (2012) 31(1):3-16.

79
98. Mundhenke C, Meyer K, Drew S, Friedl A. Heparan sulfate proteoglycans as
regulators of fibroblast growth factor-2 receptor binding in breast carcinomas. Am J
Pathol. (2002) 160(1):185-194.
99. Hayashida K, Bartlett AH, Chen Y, Park PW. Molecular and cellular mechanisms
of ectodomain shedding. Anat Rec. (2010) 293(6):925-937.
100. Brule S, Charnaux N, Sutton A, Ledoux D, Chaigneau T, Saffar L et al. The
shedding of syndecan-4 and syndecan-1 from HeLa cells and human primary
macrophages is accelerated by 101. SDF-1/CXCL12 and mediated by the matrix
metalloproteinase-9. Glycobiology. (2006) 16(6):488-501.
101. Fears CY, Woods A. The role of syndecans in disease and wound healing. Matrix
Biol. (2006) 25(7):443-456.
102. Purushothaman A, Chen L, Yang Y, Sanderson RD. Heparanase stimulation of
protease expression implicates it as a master regulator of the aggressive tumor
phenotype in myeloma. J Biol Chem. (2008) 283(47):32628-32636.
103. Su G, Blaine SA, Qiao D, Friedl A. Membrane type 1 matrix metalloproteinase-
mediated stromal syndecan-1 shedding stimulates breast carcinoma cell
proliferation. Cancer Res. (2008) 68(22):9558-9565.
104. Fillmore HL, VanMeter TE, Broaddus WC. Membrane-type matrix
metalloproteinases (MT-MMPs): expression and function during glioma invasion. J
Neurooncol. (2001) 53(2):187-202.
105. Maxwell M, Naber SP, Wolfe HJ, Hedley-Whyte ET, Galanopoulos T, Neville-
Golden J et al. Expression of angiogenic growth factor genes in primary human
astrocytomas may contribute to their growth and progression. Cancer Res. (1991)
51(4):1345-1351.
106. Korc M, Friesel RE. The role of fibroblast growth factors in tumor growth. Curr
Cancer Drug Targets. (2009) 9(5):639-651.
107. Nagase H. Cell surface activation of progelatinase A (proMMP-2) and cell
migration. Cell Res. (1998) 8(3):179-186.
108. Mercapide J, Lopez De Cicco R, Castresana JS, Klein-Szanto AJ. Stromelysin-
1/matrix metalloproteinase-3 (MMP-3) expression accounts for invasive properties
of human astrocytoma cell lines. Int J Cancer. (2003) 106(5):676-682.
109. Bodey B, Bodey B Jr, Siegel SE, Kaiser HE. Matrix metalloproteinase expression in
childhood astrocytomas. Anticancer Res. (2000) 20(5A):3287-3292.
110. Visse R, Nagase H. Matrix metalloproteinases and tissue inhibitors of
metalloproteinases: structure, function, and biochemistry. Circ Res. (2003)
92(8):827-839.
111. Walsh LA, Cepeda MA, Damjanovski S. Analysis of the MMP-dependent and
independent functions of tissue inhibitor of metalloproteinase-2 on the invasiveness
of breast cancer cells. J Cell Commun Signal. (2012) [Epub ahead of print].

80

81
Publications
1. Tassone E, Maran C, Masola V, Bradaschia A, Garbisa S, Onisto M.
Antidepressant hyperforin up-regulates VEGF in CNS tumour cells. Pharmacol Res.
(2011) 63(1):37-43.
2. Fassan M, Tassone E, Onisto M, Perilongo G, D'Avella D, Gardiman MP. MGMT
promoter methylation in pediatric high-grade gliomas. Childs Nerv Syst. (2011)
27:7-8.
3. Masola V, Maran C, Tassone E, Zin A, Rosolen A, Onisto M. Heparanase activity
in alveolar and embryonal rhabdomyosarcoma: implications for tumor invasion.
BMC Cancer. (2009) 9:304.
4. Maran C, Tassone E, Masola V, Onisto M. The story of SPATA2
(Spermatogenesis-associated protein 2): from sertoli cells to pancreatic beta-cells.
Curr Genomics. (2009) 10(5):361-363.