
UNIVERSITA' DEGLI STUDI DI CATANIA -...
158
1 UNIVERSITA' DEGLI STUDI DI CATANIA FACOLTÀ DI SCIENZE MATEMATICHE FISICHE E NATURALI DIPARTIMENTO DI SCIENZE CHIMICHE DOTTORATO DI RICERCA INTERNAZIONALE IN SCIENZE CHIMICHE XXIV CICLO Dott. La Paglia Fragola Valentina SYNTHESIS OF CHROMO FLUOROGENIC SENSORS FOR MOLECULAR RECOGNITION Final report Tutor: Chiar. mo Prof. Francesco P. Ballistreri
Transcript of UNIVERSITA' DEGLI STUDI DI CATANIA -...
1
UNIVERSITA' DEGLI STUDI DI CATANIA FACOLTÀ DI SCIENZE MATEMATICHE FISICHE E NATURALI
DIPARTIMENTO DI SCIENZE CHIMICHE
DOTTORATO DI RICERCA INTERNAZIONALE
IN SCIENZE CHIMICHE
XXIV CICLO
Dott. La Paglia Fragola Valentina
SYNTHESIS OF CHROMO FLUOROGENIC
SENSORS FOR MOLECULAR RECOGNITION
Final report
Tutor:
Chiar. mo Prof. Francesco P. Ballistreri
Summary
2
I. INTRODUCTION ......................................................................................................................................... 4 I.2 SUPRAMOLECULAR CHEMISTRY ..................................................................................................... 6 I.3 SCHEME OF A CHEMOSENSOR.......................................................................................................... 7 I.4 HOW TO DESIGN A CHEMOSENSOR ................................................................................................10 I.5 COVALENTLY ASSEMBLED MONOLAYER ....................................................................................12
II. STATE OF THE ART.................................................................................................................................13 II.1 ORGANOPHOSPHATE DETECTION .................................................................................................13 II.2 METAL SENSING ...............................................................................................................................17 II.3 METALS IN NEUROBIOLOGY ..........................................................................................................18 II. 4 COPPER SENSING .............................................................................................................................19 II.5 COPPER IN NEUROBIOLOGY ...........................................................................................................21 II.6 PATHOLOGICAL FUNCTIONS OF BRAIN COPPER ........................................................................24 II.7 COPPER DETECTION METHODS .....................................................................................................26 II.9 CHIRAL SALEN COMPLEXES...........................................................................................................30 II.10 METHODOLOGIES TO TRANSFORM HOMOGENEOUS SALEN-METAL COMPLEXES INTO
REUSABLE CATALYSTS. ........................................................................................................................32 II.11 STABILITY OF METAL SALEN COMPLEXES ...............................................................................34 II. 12 REUSABLE CHIRAL SALEN COMPLEXES SUPPORTED ON INORGANIC SOLIDS AS
HETEROGENEOUS CATALYSTS ............................................................................................................36 III. AIM OF THE WORK ................................................................................................................................37 IV. RESULTS AND DISCUSSION .................................................................................................................39
IV.1 Synthesis of 4-hydroxy benzaldoxime ..................................................................................................39 IV.2 Synthesis of 4-amino-3-nitro benzaldoxime ..........................................................................................40 IV.3 Synthesis of 4-hydroxy-2‟-nitro-4‟-oxime-azo-benzene .......................................................................42 IV.4 Synthesis of 4-bromoacenaphtene ........................................................................................................44 IV.5 Synthesis of 4-bromo-5-nitro acenaphtene ............................................................................................45 IV.6 Synthesis of 4-bromo-5-nitro 1,8 naphtalic anhydride ...........................................................................46 IV.7 Synthesis of 4-bromo-5-nitro naphtalimide ...........................................................................................47 IV.8 Synthesis of N-tyramine-di[2(dipicolyl)amino]1,8 naphtalimide ...........................................................48 IV.9 Synthesis of N-tyramine-tri[2-(dipicolyl)amino]1,8 naphtalimide..........................................................49 IV. 10 UV-VIS measurements .....................................................................................................................52 IV. 11 Covalent assembly monolayer ...........................................................................................................57 IV. 12 UV-VIS Measurements II..................................................................................................................63 IV. 13 UV-VIS Measurements III ................................................................................................................68 IV. 14 Synthesis of 8-chloromethyl-2,6-diethyl-4,4-difluoro 1,3,5,7-tetramethyl-4-bora-3α,4α-diaza-s-
indacene ......................................................................................................................................................75 IV.15 Synthesis of 3-thiapentan-1-thiol ........................................................................................................76 IV.16 Synthesis of 3,6,12,15,Tetrathia-9-monoazaheptadecane .....................................................................77 IV.17 Synthesis of 8-[N,N-bis(3‟,6‟-dithiaoctyl)-aminomethyl]-2,6-diethyl-4,4-difluoro-1,3,5,7-tetramethyl-4-
bora-3α,4α-diaza-s-indacene CS1(Copper sensor-1) .....................................................................................78 IV.18 Synthesis of 4-Br-5-NO2-1,8-naphtalic anhydride ...............................................................................79 IV.19 Synthesis of 6-bromo-6-deoxy-α,α‟-trehalose (TH-Br) ........................................................................81 IV.20 Synthesis of 6-azido-6-deoxy-α,α‟-trehalose (TH-N3) .........................................................................82 IV.21 Synthesis of 6-amino-6-deoxy-α,α‟-trehalose (TH-NH2) .....................................................................83 IV.22 Synthesis of 4-bromoacenaphtene.......................................................................................................84 IV.23 Synthesis of 4-bromo-5-nitro acenaphtene ..........................................................................................84 IV. 25 Synthesis of N-trehalose-4-bromo-5-nitro-1,8 naphthalimide .............................................................84 IV.26 Synthesis of N-trehalose-4,5-di[(2 picolyl amino]-1,8 naphthalimide (CSTH) .....................................85 IV.27 ENANTIOSELECTIVE OXYGEN TRANSFER ................................................................................86 IV.28 Synthesis of N-(12-bromododecyl)pthalimide .....................................................................................87 IV.29 Synthesis of 2-hydroxy-3-oxy-dodecylpthalimido benzaldehyde .........................................................88 IV.30 Synthesis and deprotection of the ligand salen-PHT ............................................................................89 IV.31 Synthesis of the Mn(III)-salen complex (CAT_1) ..............................................................................91 IV.32 Synthesis of 3-tert-butyl-2-hydroxybenzaldehyde ...............................................................................92 IV. 33 Synthesis of 3-tert-butyl-5-chloromethyl-salicilic aldehyde. ...............................................................93 IV.34 Synthesis of hexanol-phtalimide ........................................................................................................94 IV.35 Synthesis of 3-tert-butyl-5-methoxy-exhyl-pthalimido-salicyl aldehyde ..............................................95 IV. 36 Synthesis of 1R,2R diphenylethylendiamine chloridrate .....................................................................96 IV.37 Synthesis of the asymmetric salen ligand ............................................................................................97 IV.38 Synthesis Salen-Mn(III) complex (CAT_3) .......................................................................................98 IV.39 Synthesis of salen ligand precursor of CAT_2 ....................................................................................99
Summary
3
IV.40 Synthesis of Mn(III) salen complex CAT_2 ...................................................................................... 100 V. CONCLUSIONS ...................................................................................................................................... 101 VI. EXPERIMENTAL .................................................................................................................................. 102
VI.1 General .............................................................................................................................................. 102 VI.2 Synthesis of 4-hydroxy benzaldoxime ............................................................................................... 103 VI.3 Synthesis of 4-acetamido-3-nitro benzaldehyde ................................................................................. 105 VI.4 Synthesis of 4-amino-3-nitro benzaldehyde ........................................................................................ 106 VI.5 Synthesis of 4-amino-3-nitro benzaldoxime ........................................................................................ 107 VI.6 Synthesis of 4-hydroxy-2‟-nitro-4‟-phormyl -azo-benzene ................................................................. 108 VI.7 Synthesis of 4-hydroxy-2‟-nitro-4‟-oxime -azo-benzene .................................................................... 110 VI.8 Synthesis of 4-bromoacenaphtene ...................................................................................................... 111 VI.9 Synthesis of 4-bromo-5-nitro acenaphtene .......................................................................................... 113 VI.9 Synthesis of 4-bromo-5-nitro 1,8 naphtalic anhydride ......................................................................... 114 VI.10 Synthesis of 4-bromo-5-nitro naphtalimide ....................................................................................... 115 VI.11 Synthesis of N-tiramine-di[2-(dipicolyl)amino]1,8 naphtalimide ....................................................... 116 VI.12 Synthesis of N-tyramine-tri[2-(dipicolyl)amino]1,8 naphtalimide ...................................................... 118 VI. 13 UV-VIS and NMR Measurements I ................................................................................................ 122 VI. 14 UV-VIS and NMR measurements II ................................................................................................ 124 VI. 15 UV-VIS and NMR measurements III ............................................................................................... 125 VI.16 Synthesis of 8-chloromethyl-2,6-diethyl-4,4-difluoro1,3,5,7-tetramethyl-4-bora-3α,4α-diaza-s-indacene
.................................................................................................................................................................. 127 VI. 17 Synthesis of 3-pentan-1-thiol ........................................................................................................... 128 VI. 18 Synthesis of 3,6,12,15,Tetrathia-9-monoazaheptadecane .................................................................. 129 VI.19 Synthesis of 8-[N,N-bis(3‟,6‟-dithiaoctyl)-aminomethyl]-2,6-diethyl-4,4-difluoro-1,3,5,7-tetramethyl-4-
bora-3α,4α-diaza-s-indacene CS1(Copper sensor-1) ................................................................................... 130 VI. 20 Synthesis of 6-bromo-6-deoxy-α,α‟-trehalose (TH-Br) ..................................................................... 132 VI. 21 Synthesis of 6-azido-6-deoxy-α,α‟-trehalose (TH-N3) ...................................................................... 133 Fig, 66. 1H-NMR 6-azido-6-deoxy-α,α‟-trehalose ....................................................................................... 133 VI. 22 Synthesis of 6-amino-6-deoxy-α,α‟-trehalose (TH-NH2) .................................................................. 134 VI. 23 Synthesis of N-trehalose-4-bromo-5-nitro-1,8 naphthalimide ........................................................... 135 VI. 24 Synthesis of N-trehalose-4,5-di[(2-picolylamino)]-1,8-naphthalimide .............................................. 136 VI.25 Synthesis of N-(12-bromododecyl)pthalimide ................................................................................... 137 VI. 26 Synthesis of 2-hydroxy-3-oxy-dodecyl-pthalimido-benzaldehyde .................................................... 139 VI. 27 Synthesis of the ligand .................................................................................................................... 141 VI.28 Ligand deprotection ......................................................................................................................... 143 VI. 29 Synthesis of the Mn(III) salen complexes ........................................................................................ 144 VI. 32 Synthesis of exhanol-pthalimide ...................................................................................................... 147 VI. 33 Synthesis of 3-tert-butyl-methoxy-exhyl-pthalimido-salicyl-aldehyde .............................................. 148 VI. 35 Synthesis of 1R,2R-diphenyl-ethylen-diamine-chloridrate................................................................ 150 VI. 36 Synthesis of 1R,2R-diphenyl-ethylen-3,5-di-tert-butyl-salicyl aldehyde-mono-imine-chloridrate ...... 151 VI. 37 Synthesis of the asymmetric ligand .................................................................................................. 152 VI.38 Synthesis of the complex salen-Mn(III) ............................................................................................ 154
VII. REFERENCES: ..................................................................................................................................... 155
Introduction
4
I. INTRODUCTION
According to the IUPAC definition a chemical sensor is a device that
transforms a chemical information, ranging from the concentration of a specific
sample component to total composition analysis, into an analytically useful
signal. The chemical information, mentioned above, may originate from a
chemical reaction of the analyte or from a physical property of the system
investigated.1
Chemical sensors contain two basic functional units, a receptor part and a
transducer part. In the receptor part of the sensor the chemical information is
transformed into a form of energy which may be measured by a transducer. In
the transducer part there is a device capable of transforming the energy carrying
the chemical information about the sample into a useful analytical signal.
The receptor part of a chemical sensor can be based on various principles:
1) Physical, where no chemical reaction take place. Typical examples are those
based upon measurement of absorbance or conductivity.
2) Chemical, in which a chemical reaction between the sensor and the analyte to
detect gives an analytical signal (chemosensors).
3) Biochemical, in which a biochemical process is the source of the analytical
signal (biosensors).
In some cases it is not possible to define unequivocally how a sensor operates,
as in the case of a signal due to an absorption process.
Optical devices, based on optical phenomena, represent a family of sensors
characterized by an absorption event which involves an interaction of the
analyte with the receptor part. Based on the type of optical properties we can
classified:
Absorbance measured in a transparent medium, caused by absorpitivity of
the analyte itself .
Reflectance that is measured in a non-transparent media, usually using an
immobilized indicator.
Luminescence, based on the measurement of the intensity of light emitted
by a chemical reaction
Fluorescence, measured as the positive emission effect caused by
irradiation; also could be detected by quenching of fluorescence.
Refractive index, measured as the result of a change in solution
composition.
Introduction
5
Opto-thermal effect, based on the measurement of the thermal effect
caused by light absorption.
Light scattering, based on effects caused by particles of definite size
present in the sample.
The development of chemosensors is already revolutionizing the protocol of
chemical analysis. The classical methods require collection, transportation and
treatment of the sample and, often, complex instrumentations.
Modern chemical sensors are designed considering a generic sensor as a species
that responds to external stimuli (Stimuli Responsive Materials). Therefore,
following a chemical or a physical perturbance (due to an interaction with the
analyte) the sensor must respond with a variation of any of its measurable
properties.2-3
Moreover, chemosensors are of particular interest not only because they are
cheap and easy to use but also because, if properly designed, can allow the
monitoring of concentrations of an analyte in time and sometimes in real space.
Currently, sensor devices are present everywhere with the intention of
improving the quality of life in every application. They are now widely applied
in various fields such as environmental monitoring, food analysis, medicine,
industrial automation, telecommunications, agriculture and, more recently, also
in the detection of toxic gases and explosive materials.4-5

Introduction
6
I.2 SUPRAMOLECULAR CHEMISTRY
A general requisite of all chemical sensors is that the interaction with the target
molecule must be selective, reversible and must occur in a very short time. An
approach used by chemists to design new chemosensors is based on the
principles of supramolecular chemistry.6-7-8
A supramolecular system is an organized architecture of molecular units,
where each unit retains most of the intrinsic properties and the various
components are linked together by weak forces like hydrogen bonds, Van Der
Waals forces, electrostatic interactions and so on. The interesting feature of
supramolecular systems is that the interactions that exist between different
subunits may lead to the disappearance of the properties of individual
components and the appearance of new relevant properties of the
supramolecular aggregate.
These new systems have stimulated chemists to undertake the construction of
new devices and machines at molecular level.9-10
In the last years a large number of systems with properties related to
phenomena of molecular recognition, signalling, transport and transformation of
chemical species has been designed.11
The general properties of these entities are
correlated both with the type of components and to the level of organization, for
example dendrimers, amphiphilic aggregates such as surfactants or mono and
multi layers etc. This kind of architectures is giving a strong contribution to the
development of nanotechnologies, especially the opportunity to control and to
intervene on the composition and on the structure of these molecular assemblies
has opened the way for the construction of molecular devices, systems capable
to transfer energy, electrons and so on; properties that can be used to obtain
useful functions, as the storage of information or signal transduction.
Introduction
7
I.3 SCHEME OF A CHEMOSENSOR
The field of optical chemical sensors has been a growing research area over the
last three decades. A wide range of review articles has been published by experts
in the field who have highlighted the advantages of optical sensing over other
transduction methods. An appropriate definition of a chemical sensor is the so-
called “Cambridge definition”: Chemical sensors are miniaturised devices that
can deliver real time and on-line information on the presence of specific
compounds or ions in even complex samples.12
Optical chemosensors employ optical transduction techniques to yield analyte
information. The most widely used techniques employed in optical chemical
sensors are optical absorption and luminescence, but sensors based on other
spectroscopies as well as on optical parameters, such as refractive index and
reflectivity, have also been developed.
Recent developments in the field have been driven by such factors as the
availability of low-cost, miniature optoelectronic light sources and detectors, the
need for multianalyte array-based sensors particularly in the area of biosensing
and imaging technology.
While the optical principles used in chemical sensing have not changed
substantially over the years, in many cases the transduction platforms have
changed considerably, yielding sensors with vastly improved performance, the
most relevant performance parameters being sensitivity, stability, selectivity,
and robustness.
In general, optical chemical sensors may be categorized under the headings of
direct sensors and reagent-mediated sensors. In a direct optical sensor, the
analyte is detected directly via some intrinsic optical property such as, for
example, absorption or luminescence. In reagent-mediated sensing systems, a
change in the optical response of an intermediate agent, usually an analyte-
sensitive dye molecule, is used to monitor analyte concentration. This latter
technique is useful particularly in the case where the analyte has no convenient
intrinsic optical property, which is the case for many analytes.
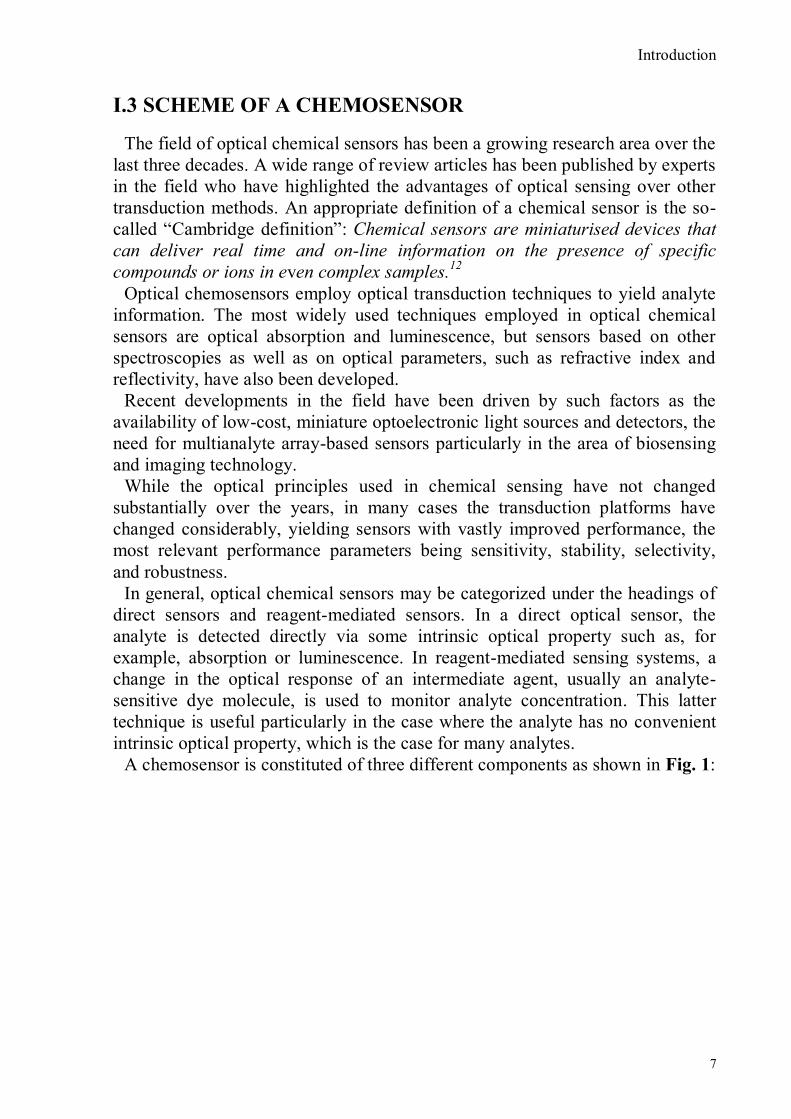
A chemosensor is constituted of three different components as shown in Fig. 1:
Introduction
8
Fig. 1 Scheme of a chemosensor
A receptor portion (responsible for selective interaction with the analyte) and a
signalling portion (whose properties vary as a result of the state of the receptor)
linked together by a spacer that regulates geometry and electronic interaction.
Signalling subunit must possess a certain property detectable and quantifiable,
optical or potential for example, that changes with the state of the system,
depending on whether the receptor is free or involved in the interaction with the
analyte.13
Moreover, the following requisites must be present:
1. receptor must have a selectivity for the target molecule much higher than
that of potentially interfering substances;
2. the recognition process must be fast and reversible;
3. the system must have a good global chemical stability.
Optical chemical sensors employ optical transduction techniques to yield
analyte information. The most widely used techniques employed in optical
chemical sensors are optical absorption and luminescence, but sensors based on
other spectroscopies as well as on optical parameters, such as refractive index
and reflectivity, have also been developed.
Recent developments in the field have been driven by such factors as the
availability of low-cost, miniature optoelectronic light sources and detectors, the
need for multianalyte array-based sensors particularly in the area of biosensing
and imaging technology.
In recent years, While the optical principles used in chemical sensing have not
changed substantially over the years, in many cases the transduction platforms
have changed considerably, yielding sensors with vastly improved performance,
the most relevant performance parameters being sensitivity, stability, selectivity,
and robustness.

Introduction
9
In general, optical chemical sensors may be categorized under the headings of
direct sensors and reagent-mediated sensors. In a direct optical sensor, the
analyte is detected directly via some intrinsic optical property such as, for
example, absorption or luminescence. In reagent-mediated sensing systems, a
change in the optical response of an intermediate agent, usually an analyte-
sensitive dye molecule, is used to monitor analyte concentration. This latter
technique is useful particularly in the case where the analyte has no convenient
intrinsic optical property, which is the case for many analytes.
Introduction
10
I.4 HOW TO DESIGN A CHEMOSENSOR
A fluorescent or colorimetric chemosensor is defined as a compound of abiotic
origin that complexes an analyte with a concomitant fluorescent or colorimetric
signal transduction. Generally there are three different approaches to designing a
chemosensor:
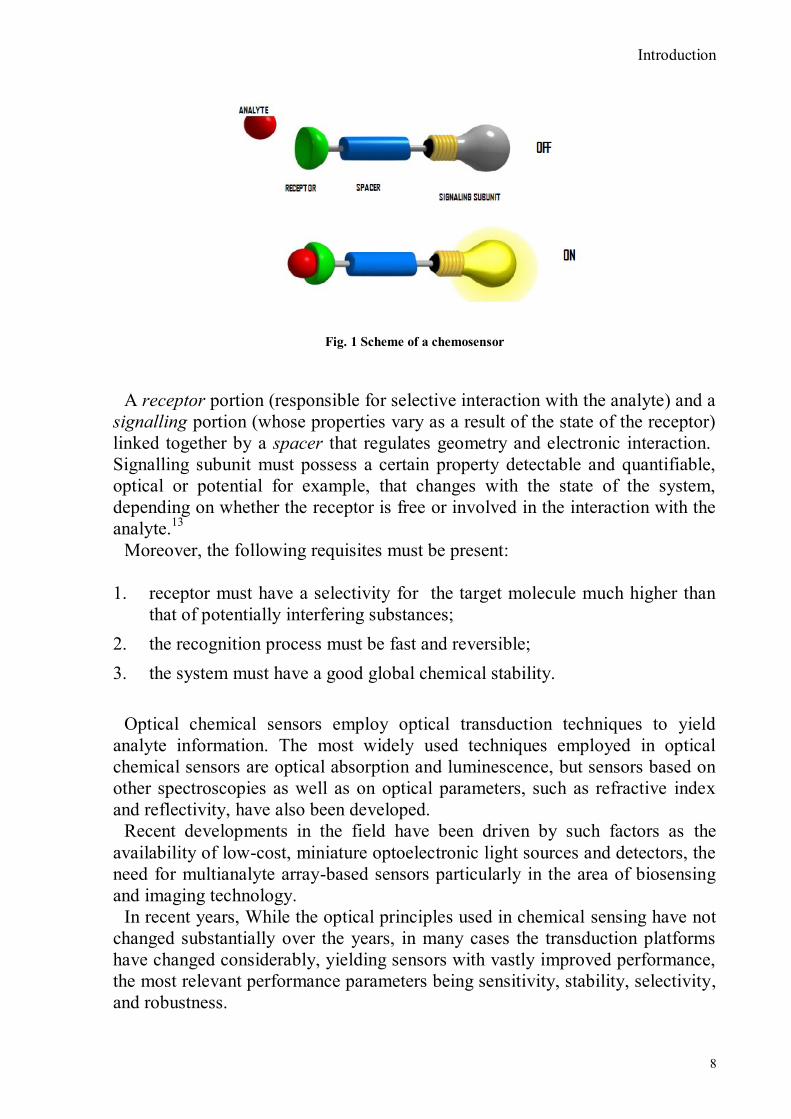
a. Binding Site- Signalling Subunit Approach
This approach, that is the most popular, involves covalently introducing
binding site and signalling subunits to the chemosensor. As can be seen in the
Fig. 2, the coordination site binds the analyte in such a way that the properties of
the signalling subunit are changed giving rise to variation either in the colour
(chromogenic chemosensor) or in its fluorescence behaviour (fluorogenic
chemosensor)
Fig. 2. Signalling subunit approach
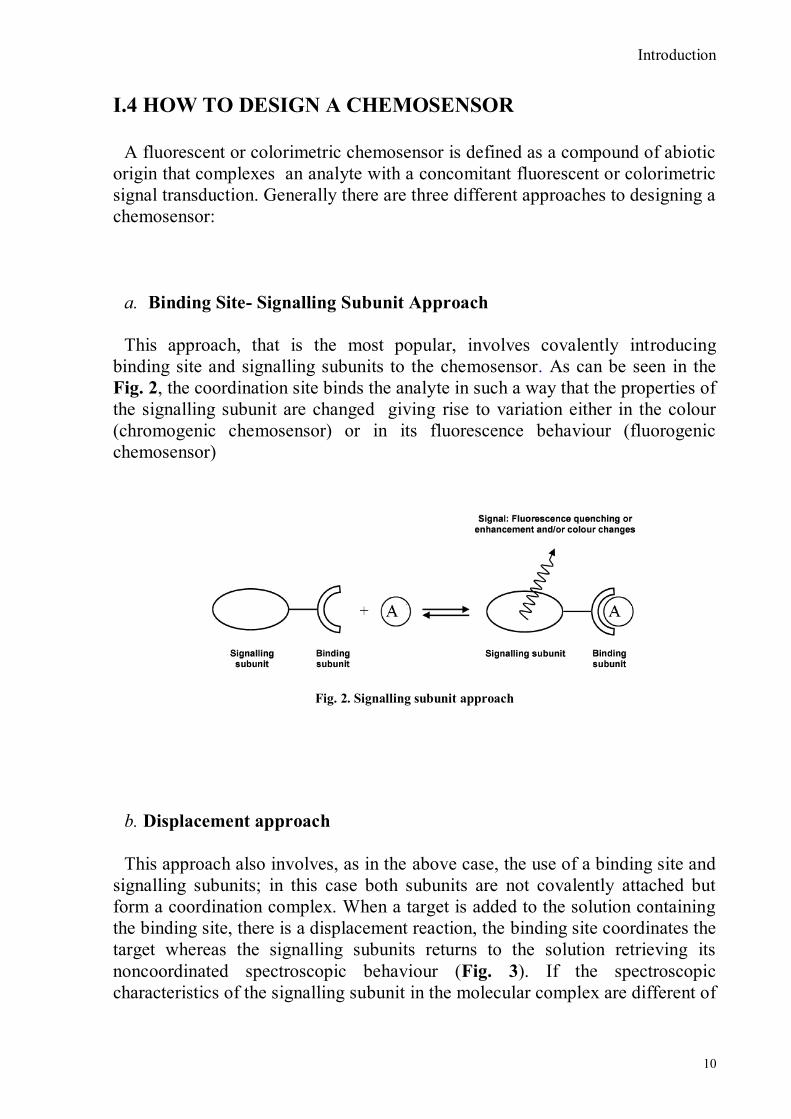
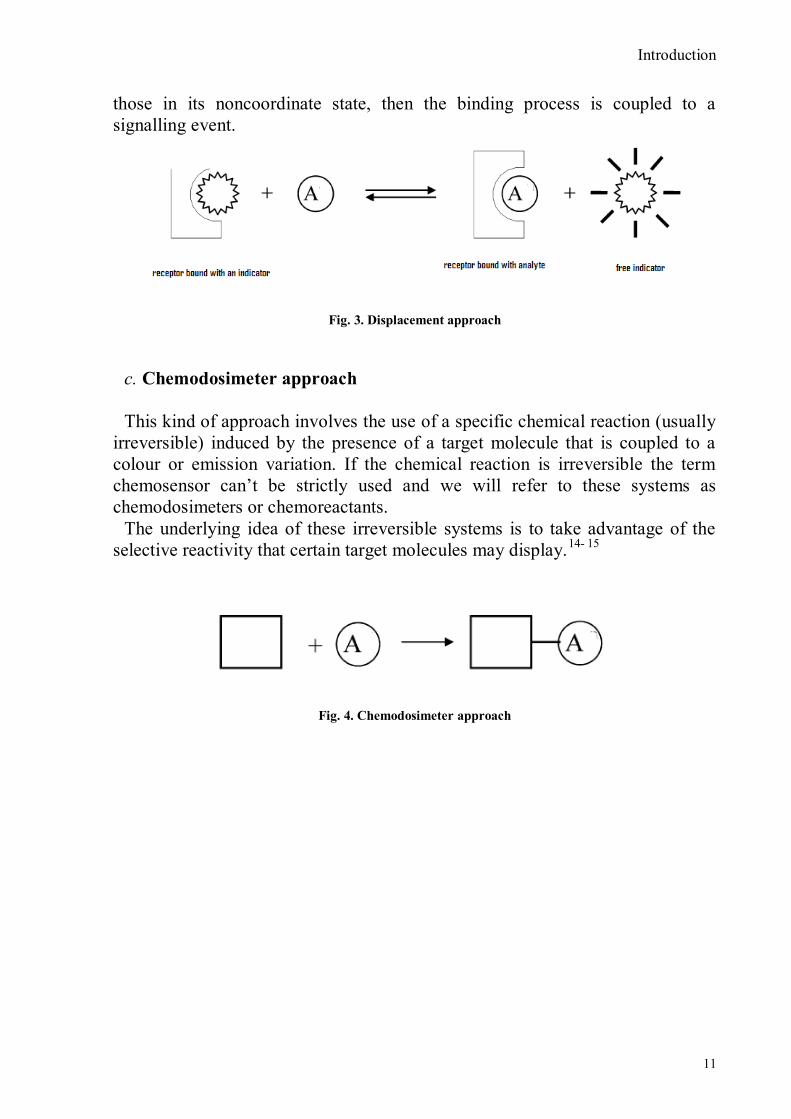
b. Displacement approach
This approach also involves, as in the above case, the use of a binding site and
signalling subunits; in this case both subunits are not covalently attached but
form a coordination complex. When a target is added to the solution containing
the binding site, there is a displacement reaction, the binding site coordinates the
target whereas the signalling subunits returns to the solution retrieving its
noncoordinated spectroscopic behaviour (Fig. 3). If the spectroscopic
characteristics of the signalling subunit in the molecular complex are different of
Introduction
11
those in its noncoordinate state, then the binding process is coupled to a
signalling event.
Fig. 3. Displacement approach
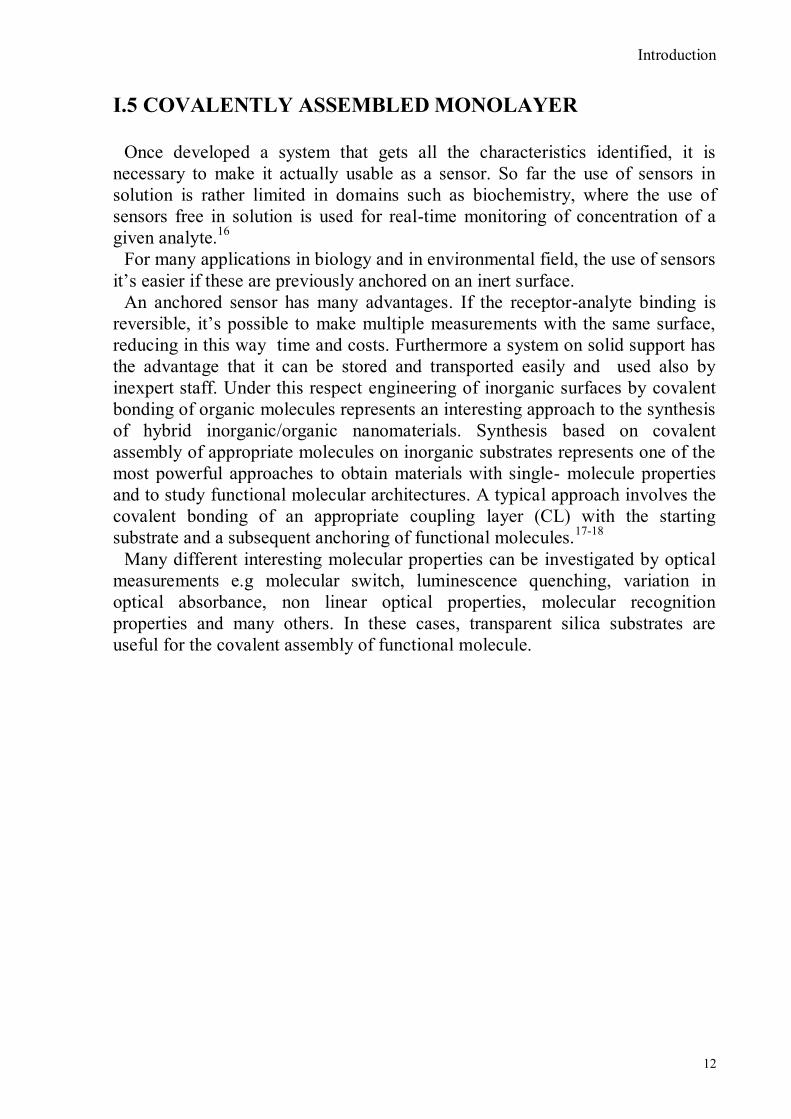
c. Chemodosimeter approach
This kind of approach involves the use of a specific chemical reaction (usually
irreversible) induced by the presence of a target molecule that is coupled to a
colour or emission variation. If the chemical reaction is irreversible the term
chemosensor can‟t be strictly used and we will refer to these systems as
chemodosimeters or chemoreactants.
The underlying idea of these irreversible systems is to take advantage of the
selective reactivity that certain target molecules may display.14- 15
Fig. 4. Chemodosimeter approach
Introduction
12
I.5 COVALENTLY ASSEMBLED MONOLAYER
Once developed a system that gets all the characteristics identified, it is
necessary to make it actually usable as a sensor. So far the use of sensors in
solution is rather limited in domains such as biochemistry, where the use of
sensors free in solution is used for real-time monitoring of concentration of a
given analyte.16
For many applications in biology and in environmental field, the use of sensors
it‟s easier if these are previously anchored on an inert surface.
An anchored sensor has many advantages. If the receptor-analyte binding is
reversible, it‟s possible to make multiple measurements with the same surface,
reducing in this way time and costs. Furthermore a system on solid support has
the advantage that it can be stored and transported easily and used also by
inexpert staff. Under this respect engineering of inorganic surfaces by covalent
bonding of organic molecules represents an interesting approach to the synthesis
of hybrid inorganic/organic nanomaterials. Synthesis based on covalent
assembly of appropriate molecules on inorganic substrates represents one of the
most powerful approaches to obtain materials with single- molecule properties
and to study functional molecular architectures. A typical approach involves the
covalent bonding of an appropriate coupling layer (CL) with the starting
substrate and a subsequent anchoring of functional molecules.17-18
Many different interesting molecular properties can be investigated by optical
measurements e.g molecular switch, luminescence quenching, variation in
optical absorbance, non linear optical properties, molecular recognition
properties and many others. In these cases, transparent silica substrates are
useful for the covalent assembly of functional molecule.
state of art
13
II. STATE OF THE ART
II.1 ORGANOPHOSPHATE DETECTION
The current rise in international concern over criminal terrorist attacks via chemical
warfare agents (CWAs) as brought about the need for reliable detection of these toxic
agents. According to the organization for the prohibition of Chemical Weapons and
the Chemical Weapons Conventions, some substances are considered chemical
weapons if they, through a “chemical effect on living processes, may cause death,
temporary loss of performance or permanent injury to people or animals”.
CWAs are classified into several groups according to their lethality, e.g. nerve
agents, asphyxiant agents, vesicant agents, pulmonary agents, lachrymatory agents
and incapacitating agents; among all the most dangerous are certainly nerve agents.18
Nerve agents are a family of highly toxic phosphoric acid esters, structurally related
to the larger family of organophosphate compounds; in fact development of nerve
agents was a by-product of insecticide research and development of the early 1930s
when German chemists observed that organo-phosphorous compounds could be
poisonous. Deadly nerve agents have rapid and severe effects on human and animals
health, either as a gas, aerosol or liquid form.
OP pesticides are synthetic esters, amides, or thiol derivatives of phosphoric,
phosphonic, phosphorothioic, or phosphonothioic acids. There are over 100 OP
compounds currently in the market, representing a variety of chemical, physical, and
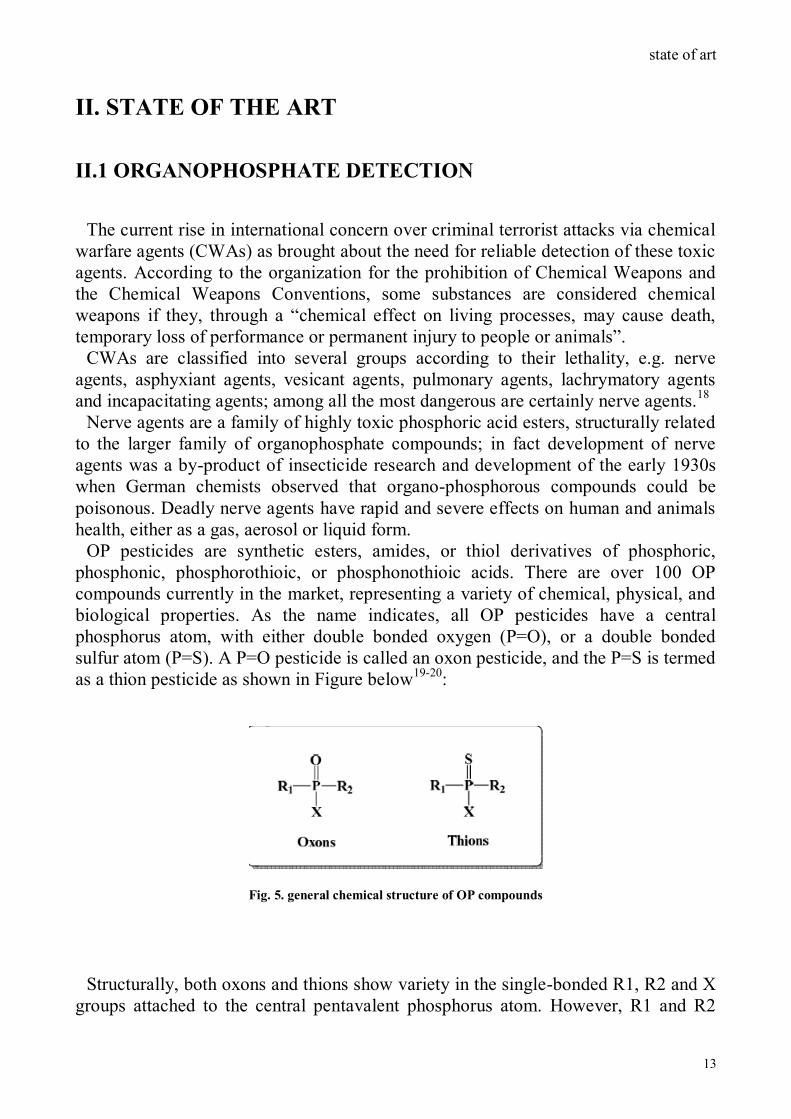
biological properties. As the name indicates, all OP pesticides have a central
phosphorus atom, with either double bonded oxygen (P=O), or a double bonded
sulfur atom (P=S). A P=O pesticide is called an oxon pesticide, and the P=S is termed
as a thion pesticide as shown in Figure below19-20
:
Fig. 5. general chemical structure of OP compounds
Structurally, both oxons and thions show variety in the single-bonded R1, R2 and X
groups attached to the central pentavalent phosphorus atom. However, R1 and R2
state of art
14
generally tend to be alkoxy, aryloxy and thioalkoxy groups, while X is a labile
leaving group.
Their effect are mainly due to their ability to inhibit the action of acetylcholine
esterase, a critical central nervous system enzyme. The sequence of symptoms varies
with the route of the exposure.
While respiratory symptoms are generally the first to appear after inhalation of the
nerve vapour, gastrointestinal symptoms are usually the first after ingestion.
Inhibition of acethylcholinesterase is a progressive process and depends not only on
the concentration but also on the time of exposure.
The ease of production and extreme toxicity of organophosphorous nerve agents
underscores the need to detect these odourless and colourless chemicals. As a
consequence intense research efforts have been directed to develop sensitive and
selective systems for the detection of these compounds. A variety of detection
methods for CWAs has been developed include enzymatic assays21
, GC-MS
spectrometry22-23-24-25
, electrochemical26
and so on. However, all the method presented
at least one of the following limitations: low sensitivity, limited selectivity, non
portability , difficulties in real time monitoring and false positive readings.
An alternative to those classical methods is the design of colorimetric27-28
or
fluorimetric chemosensors29-30-31
. In fact one of the most convenient and simplest
means of chemical detection is the generation of an optical event, e.g. change in
absorption or emission bands in the presence of a target analyte. Especially, optical
detection often require a low- cost and widely used instrumentation and offers the
possibility of so-called “naked eye detection”.
The first example of colorimetric probe for detection of nerve agents were described
in 1944 by Schonemann, and was based in the oxidation of certain amines, such as o-
toluidine, benzidine and so on, to give coloured products in the presence of several
organophosphorous compounds. The mechanism was based in the formation of a
peracid derived from the organophosphorous compound that induced the oxidation of
the amine.
Moreover, these are rare studies and the development of chromo-fluorogenic
sensors for nerve agents detection have been very scarce. The development of
chromo-fluorogenic sensors has been abandoned for many years and only recently
these studies were taken into account, giving rise to the development of chemosensor
more sophisticated than the earliest published works, we can cite sensors based on
Photoinduced-electron-transfer (PET) process used in the development of highly
sensitive fluorescent chemosensor just used for the recognition of cations and anions,
and by the same principle, recently applied to the detection of organophosphorous
agents. The ease which one can modulate the emission intensity due to the possibility
of functionalization with an appropriate fluorophore, which have certain binding sites
has created a myriad of receptors in recent years.
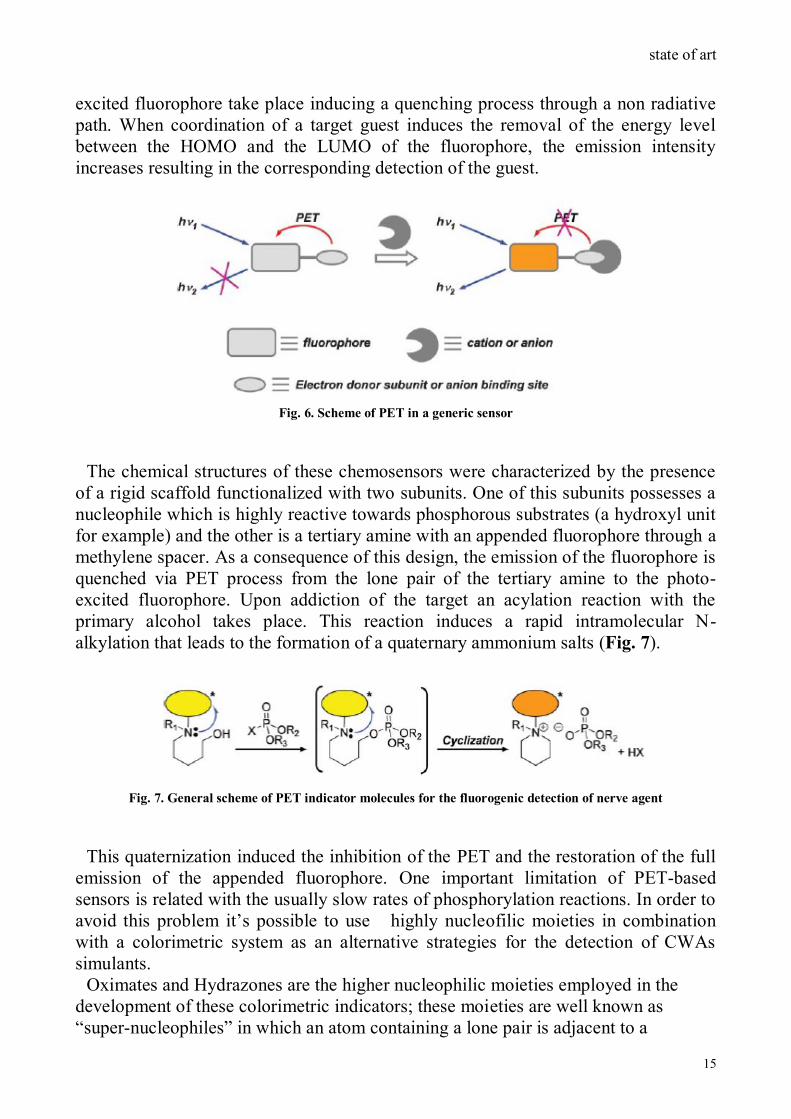
Fluorescence in a molecule is observed when an excited electron placed in the
LUMO orbital goes to the HOMO releasing the excess of energy in form of light. If
the energy of another “external” orbital lies between the energy gap of the HOMO
and LUMO of the fluorophore a PET process from the external orbital to the photo-
state of art
15
excited fluorophore take place inducing a quenching process through a non radiative
path. When coordination of a target guest induces the removal of the energy level
between the HOMO and the LUMO of the fluorophore, the emission intensity
increases resulting in the corresponding detection of the guest.
Fig. 6. Scheme of PET in a generic sensor
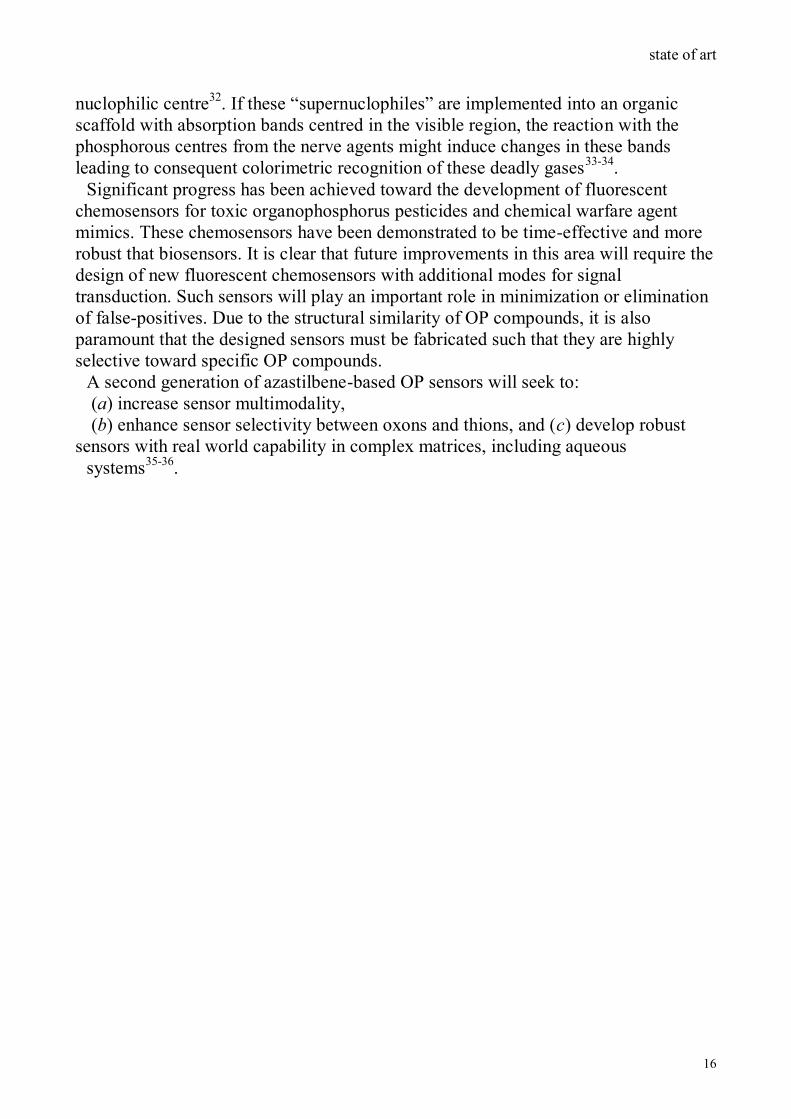
The chemical structures of these chemosensors were characterized by the presence
of a rigid scaffold functionalized with two subunits. One of this subunits possesses a
nucleophile which is highly reactive towards phosphorous substrates (a hydroxyl unit
for example) and the other is a tertiary amine with an appended fluorophore through a
methylene spacer. As a consequence of this design, the emission of the fluorophore is
quenched via PET process from the lone pair of the tertiary amine to the photo-
excited fluorophore. Upon addiction of the target an acylation reaction with the
primary alcohol takes place. This reaction induces a rapid intramolecular N-
alkylation that leads to the formation of a quaternary ammonium salts (Fig. 7).
Fig. 7. General scheme of PET indicator molecules for the fluorogenic detection of nerve agent
This quaternization induced the inhibition of the PET and the restoration of the full
emission of the appended fluorophore. One important limitation of PET-based
sensors is related with the usually slow rates of phosphorylation reactions. In order to
avoid this problem it‟s possible to use highly nucleofilic moieties in combination
with a colorimetric system as an alternative strategies for the detection of CWAs
simulants.
Oximates and Hydrazones are the higher nucleophilic moieties employed in the
development of these colorimetric indicators; these moieties are well known as
“super-nucleophiles” in which an atom containing a lone pair is adjacent to a
state of art
16
nuclophilic centre32
. If these “supernuclophiles” are implemented into an organic
scaffold with absorption bands centred in the visible region, the reaction with the
phosphorous centres from the nerve agents might induce changes in these bands
leading to consequent colorimetric recognition of these deadly gases33-34
.
Significant progress has been achieved toward the development of fluorescent
chemosensors for toxic organophosphorus pesticides and chemical warfare agent
mimics. These chemosensors have been demonstrated to be time-effective and more
robust that biosensors. It is clear that future improvements in this area will require the
design of new fluorescent chemosensors with additional modes for signal
transduction. Such sensors will play an important role in minimization or elimination
of false-positives. Due to the structural similarity of OP compounds, it is also
paramount that the designed sensors must be fabricated such that they are highly
selective toward specific OP compounds.
A second generation of azastilbene-based OP sensors will seek to:
(a) increase sensor multimodality,
(b) enhance sensor selectivity between oxons and thions, and (c) develop robust
sensors with real world capability in complex matrices, including aqueous
systems35-36
.

state of art
17
II.2 METAL SENSING
The development of chemosensors that are capable of sensing different target
species is currently a topic of major interest in supramolecular chemistry.
Then, considerable efforts have been made to design new molecular probes able to
recognize and sense environmentally and biologically important ionic species for
example highly noxious, heavy and transition metal ions are currently a task of prime
importance for medical, environmental, and biological applications. Consequently,
the construction of chemosensor molecules with high selectivity and sensitivity for
the detection of transition- and heavy-metal cations has received substantial attention,
as these ions play important roles in living systems and have an extremely toxic
impact on the environment.
Presently, one of the most attractive approaches focuses on the research of novel
colorimetric and fluorescent metal ion sensors, which allow naked-eye detection of
color and fluorescent emission change upon metal ion binding without the use of a
spectroscopic instrument.
Fluorescent sensors for the detection and measurement of transition-metal ions are
widely investigated because of their simplicity and high sensitivity of response. In
particular, the development of a fluorescent probe for copper ions in the presence of a
variety of other metal ions has received great attention.
In chemosensors, a selective binding motif is attached to a fluorophore for signal
transduction. However, one disadvantage is that the recognition event is sometimes
difficult to detect because the fluorophore does not directly contact the bound metal
ion. In this aspect, an ideal fluorescent probe would be one whose fluorescent unit is
directly involved in the interaction with the metal ions.
Cation-specific fluorescence sensors are powerful tools for the measurement of
metal ion concentrations in environmental and biological samples. They typically
combine high optical sensitivity with excellent cation selectivity, and are therefore
particularly well suited for the non-invasive visualization of labile metal pools in a
biological environment. Perhaps the largest class of fluorescence sensors function as
simple cation-responsive switches. The linear relationship between intensity and
cation concentration allows for quantitative measurements; however, the emission
intensity depends also on the sensor concentration, which is often not known with
sufficient accuracy in biological samples. Fluorescence sensors which undergo a
spectral shift upon binding of the cation inherently provide concentration information
of the metal-free sensor and are principally suitable for accurate quantitative
measurements via ratiometric fluorescence imaging. Despite their usefulness, only a
handful of ratiometric sensors have been developed, indicating the considerable
challenges in the probe design37
.

state of art
18
II.3 METALS IN NEUROBIOLOGY
The brain is a singular organ of unique biological complexity that serves as the
command center for cognitive and motor function. As such, this specialized system
also possesses a unique chemical composition and reactivity at the molecular level. In
this regard, two vital distinguishing features of the brain are its requirements for the
highest concentrations of metal ions in the body38-39
and the highest per-weight
consumption of body oxygen. In humans, the brain accounts for only 2% of total
body mass but consumes 20% of the oxygen that is taken in through respiration40
. As
a consequence of high oxygen demand and cell complexity, distinctly high metal
levels pervade all regions of the brain and central nervous system.
Structural roles for metal ions in the brain and the body include the stabilization of
biomolecules in static (e.g., Mg2+
for nucleic acid folds, Zn2+
in zinc-finger
transcription factors) or dynamic (e.g., Na+
and K+ in ion channels, Ca
2+ in neuronal
cell signaling) modes, and catalytic roles for brain metal ions are also numerous and
often of special demand. Because of the intimate connection between its unique
composition and function, the inorganic chemistry of the brain is inherently rich and
remains an open frontier for study. Traditional studies of metals in neurobiology have
focused on the chemistry and structural biology of redoxactive s-block metal ions,
including Na+, K
+, Mg
2+, and Ca
2+.
Na+ and K
+ are present in high concentrations in the body (~0.1 M) and possess
distinct compartmentalizations, with resting Na+ levels higher in the extracellular
space and K+
levels higher inside cells. The dynamic partitioning of these metal ions
is controlled by ion-specific channels that selectively allow passage of either Na+
or
K+ in and out of cells
41.
Less thoroughly studied are the roles of d-block metals in the brain. Zinc, iron,
copper, and related d-block metals are emerging as significant players in both
neurophysiology and neuropathology, particularly with regard to aging and
neurodegenerative diseases. Because the concentrations of these d-block metals in
brain tissue are up to 10000-fold higher than common neurotransmitters and
neuropeptides, referring to these essential brain nutrients as trace elements is a clear
misnomer, in fact not only do these metals serve as components of various proteins
and enzymes essential for normal brain function, but their labile forms, particularly
those of Zn2+
and Cu+/2+
, are also connected to specialized brain activities.
In this context, labile metal ion pools can possess protein or small molecule ligands
or both that can be readily exchanged between different ligand sets. The far-reaching
connections of inorganic chemistry to unexplored aspects of brain function, aging,
and disease have prompted demand for new methods to study metal ion function,
misregulation, or both within intact, living samples.
In this regard, molecular imaging with metal-responsive small-molecule probes
coupled to optical fluorescence imaging (OI) and magnetic resonance imaging (MRI)
modalities is emerging as a powerful approach to interrogating metal ion chemistry
from the subcellular to the organism level42
.
state of art
19
II. 4 COPPER SENSING
Copper plays an important role in various biological processes. It is a vital trace
element, the third most abundant in humans, and is present at low level in a variety of
cells and tissues, with the highest concentration in the liver. The average
concentration of blood copper in the normal group is 100-150 mg/dL (15.7 and 23.6
mM). As is well-known, Cu2+
plays an important role in living systems such as those
occurring in the human nervous system, gene expression, and the functional and
structural enhancement of proteins.2 However, under overloading conditions, copper
can be toxic and can cause oxidative stress and disorders associated with
neurodegenerative diseases, including Menkes and Wilson diseases, familial
amyotropic lateral sclerosis, Alzheimer‟s disease, and prion diseases.
The U.S. Environmental Protection Agency (EPA) has set the limit of copper in
drinking water to be 1.3 ppm (20 mM). As a pollutant due to its extensive industrial
use and an essential trace element in biological systems, chemosensors for copper(II)
based on chromogenic or fluorogenic probes that are expected to quickly, non -
destructively, and sensitively detect copper ions have drawn a lot of attention.
However, only few of them exhibit good performance in aqueous media, which is a
very important factor for potential biological applications.
For these reasons the design and the development of fluorescent and colorimetric
sensors for Cu2+
has received considerable attention in particular because they
combine the sensitivity of fluorescence with the convenience and
aesthetic appeal of a colorimetric assay43
.
In particular, ratiometric fluorescent sensors are preferred because the ratio between
the two emission intensities can be used to evaluate the analyte concentration and
provide a built-in correction for environmental effects, such as photobleaching,
sensor molecule concentration, the environment around the sensor molecule (pH,
polarity, temperature, and so forth), and stability under illumination. Nevertheless,
only a few ratiometric fluorescent sensors for Cu2+
have been reported due to the
fluorescence quenching nature of paramagnetic Cu2+ 44-45-46-47
. However, these
reported sensors were mostly only utilized in pure organic solvents or organic-
aqueous solutions, and often showed poor selectivity with other metal ions such as
Co2+
, Ni2+
, Ag+, Hg
2+ and Pb
2+. To date, there have been no reports of ratiometric
fluorescent and colorimetric sensors that are completely selective for Cu2+
that can be
used in 100% aqueous solution.
Even though some examples of selective recognition sensors for Cu2+
have been
reported,4 most of these sensors show “turn-off” manner in emission spectra upon
Cu2+
binding due to the fluorescence-quenching nature of paramagnetic Cu2+
.5
Furthermore, only a few examples can display “turn-on” or ratiometric fluorescent
changes in emission spectra, which are desirable for analytical purposes by the
enhancement of fluorescence or changes in the ratio of the intensities of the emission
at two wavelengths.
There are two basic requirements to construct a ratiometric fluorescent sensor for
Cu2+
:

state of art
20
1. a signaling mechanism is required, which can turn the Cu2+
recognition event
into a ratiometric fluorescence signal, for instance the internal charge transfer
(ICT) mechanism has been widely exploited for cation sensing. The interaction
between receptor and cation would blue shift the fluorescence spectra.
2. there is the requirement to protect fluorescence from being quenched by Cu2+
.
Another issue is related to the recognition is that of serious interference by other
metal ions such as Ni(II),5 Ag(I),6 and Hg(II).6,7 To achieve Cu(II)-only sensing,
fluorescent chemosensors require deliberate design.

state of art
21
II.5 COPPER IN NEUROBIOLOGY
Basic Aspects of Copper in the Brain. As just said copper is the third-most
abundant transition metal in the body and in the brain, with average neural copper
concentrations on the order of 0.1 mM48
.
This redox-active nutrient is distributed unevenly within brain tissue, as copper
levels in the gray matter are 2- to 3-fold higher than those in the white matter49
.
Copper is particularly abundant in the locus ceruleus (1.3 mM), the neural region
responsible for physiological responses to stress and panic, as well as the substantia
nigra (0.4 mM), the center for dopamine production in the brain. The major oxidation
states for copper ions in biological systems are cuprous Cu+ and cupric Cu
2+; Cu
+ is
more common in the reducing intracellular environment, and Cu2+
is dominant in the
more oxidizing extracellular environment. Levels of extracellular Cu2+
vary, with
Cu2+
concentrations of 10-25 μM in blood serum, 0.5-2.5 μM in cerebrospinal fluid
(CSF),331 and 30 μM in the synaptic cleft.1 Intracellular copper levels within
neurons can reach 2 to 3 orders of magnitude higher concentrations.
Like zinc and iron, brain copper is partitioned into tightly bound and labile pools.
Owing to its redox activity, copper is an essential cofactor in numerous enzymes,
including cytochrome c oxidase (CcO), Cu/Zn superoxide dismutase (SOD1),
ceruloplasmin (Cp), and dopamine _ monooxygenase (D_M), that handle the
chemistry of oxygen or its metabolites.
Labile brain copper stores have been identified in the soma of cortical pyramidal
and cerebellar granular neurons, as well as in neuropil within the cerebral cortex,
hippocampus, red nucleus, cerebellum, and spinal cord50
.
The widespread distribution and mobility of copper required for normal brain
function, along with the numerous connections between copper misregulation and a
variety of neurodegenerative diseases, have prompted interest in studying its roles in
neurophysiology and neuropathology.

state of art
22
Brain Copper Homeostasis. Because of its central importance to neurological
health and its propensity to trigger aberrant redox chemistry and oxidative stress
when unregulated, the brain maintains strict control over its copper levels and
distributions51-52
. An overview of homeostatic copper pathways in the brain is
summarized in the Figure below.
Fig. 8. A schematic model of neuronal copper homeostasis
Many of the fundamental concepts for neuronal copper homeostasis are derived
from rigorous studies of simple model bacterial or yeast microbes, but the brain
provides a more complex system with its own unique and largely unexplored
inorganic physiology. For example, work by O‟Halloran and co-workers indicates
that there is little “free” copper in the cytoplasm of bacteria and yeast, which is due to
the tight regulation of metallochaperones. However, many open questions remain
concerning the homeostasis of organelle copper stores, particularly in higher
organisms with specialized tissues. In this context, Winge and co-workers have
presented data that suggests that even yeast possess stores of labile copper in their
mitochondria53
.
Uptake of copper by the blood-brain barrier (BBB) is not well understood but is
proposed to occur through the P-type ATPase ATP7A, which can pump copper into
the brain. Mutations in this specific gene lead to Menkes disease, an inherited
neurodegenerative disorder that is characterized by global brain copper deficiency.
This phenotype is mirrored by Wilson disease, which involves mutations in the
related ATP7B gene responsible for excretion of excess copper from the liver into the
bile54
. Loss of ATP7B function leads to abnormal build up of copper in the liver. The
extracellular trafficking of brain copper is also different from that in the rest of the
body. Cerebrospinal fluid (CSF), the extracellular medium of the brain and central
nervous system, possesses a distinct copper homeostasis from blood plasma, which
carries copper to organs throughout the rest of the body.
The primary protein or small-molecule ligands for copper in CSF remain
unidentified. Uptake of copper into brain cells requires reduction of Cu2+
to Cu+.
Following reduction, Cu+ ions can be transported into cells through a variety of
protein-based pathways. For example, a major class of proteins involved in cellular

state of art
23
copper uptake is the copper transport protein (Ctr) family. Human copper transporter-
1(hCtr1) is a representative member that is expressed ubiquitously in all tissues.
state of art
24
II.6 PATHOLOGICAL FUNCTIONS OF BRAIN COPPER
Copper Neuropathology. Disruption of copper homeostasis is implicated in a
number of neuro degenerative diseases, including Alzheimer’s disease (AD), Prion
diseases, Parkinson’s disease (PD), familial amyotrophic lateral sclerosis (fALS),
Menkes disease, and Wilson disease.55-56-57
In all these disorders, the deleterious effects of copper stem from its dual abilities to
bind ligands and trigger uncontrolled oxidation reduction chemistry.
The connection between copper and AD pathology is due mainly to its molecular
reactions with APP and it‟s A_amyloid cleavage product (A_) that result in
imbalance of extracellular and intracellular brain copper pools. The function of APP
in the brain has not been fully elucidated but is plausibly linked to copper
homeostasis58-59-60
. However, aberrant binding of Cu2+
to APP triggers its reduction to
Cu+ with concomitant disulfide bond formation; this misregulated metalloprotein
intermediate can then participate in harmful Fenton-type chemistry. For example, the
reaction between the APP-Cu+ complex and H2O2 causes oxidation to Cu
2+ and APP
fragmentation, leading to a cycle of oxidative stress and aggregation of A_ peptides
that results in the ultimate formation of amyloid plaques in the extracellular
cerebrospinal fluid. Extracellular amyloid deposits from the brains of AD patients are
rich in Cu in addition to Zn and Fe, and Raman studies of senile plaques reveal Cu2+
centers bound by histidine donors that can result from direct cascade reactions
between Cu2+
and A_peptides.
Moreover, administration of Zn/Cu chelators such as clioquinol can redistribute
brain metal pools and reverse amyloid aggregation61
. Finally, addition of Cu2+
to cell
cultures alters APP processing, resulting in increased levels of intracellular and
secreted forms of APP and decreased levels of A_.
Prion diseases also have links to brain copper misregulation62
, where opposing Cu2+
and Mn2+
levels and availabilities may influence the conversion of the protease
sensitive PrPC into the toxic, protease-resistant form, PrPSc.
PrPC can bind between four and seven Cu2+
ions at various binding sites, including
the octapeptide repeat regions that have micromolar affinity for Cu2+
.
In one proposal for prion toxicity, PrPC is involved in copper homeostasis and
binding of Mn2+
to the protein facilitates its conversion to toxic PrPSc; the resulting
excess free copper further exacerbates the disease by promoting oxidative stress.
Onset of Parkinson‟s disease is accompanied by death of dopaminergic neurons and
intracellular accumulation of Lewy bodies, which are protein aggregates of the brain
protein R-synuclein. In its unmodified form, R-synuclein exists as an unfolded
protein, but factors including oxidative stress and presence of various metal cations
promote its fibrillation63
.
In particular, Cu2+
effectively promotes the self-oligomerization of R-synuclein
through the acidic C-terminal region of the protein and its oxidation and aggregation
in the presence of H2O264
.
Structural details of the Cu2+
-R-synuclein interaction have been reported recently
and identify two main copper binding sites in the protein.
state of art
25
One site is comprised of the carboxylate-rich C-terminus of the protein and has a
micromolar affinity for copper. The other site binds copper with nanomolar affinity;
initial reports suggested that both the N-terminus and His50 were necessary in Cu2+
binding, but more recent work refutes the involvement of His50 as a ligand.
Familial amyotrophic lateral sclerosis (fALS) is an inherited neurodegenerative
disorder stemming from mutations in the copper-dependent metalloprotein Cu/Zn
SOD1.65
Three main hypotheses exist regarding the molecular mechanism(s) of deterioration
in this disease: (i) the loss-of function mechanism, which results in toxic
accumulation of superoxide by lack of SOD1 protection, (ii) the gain-of function
mechanism, in which SOD1 exhibits enhanced peroxidase activity by aberrant redox
chemistry, and (iii) the aggregation mechanism, where SOD1 aggregates are formed
by increased or decreased availability of copper for binding.
The roles of copper homeostasis in this disease remain ambiguous because
modifications of the metal-binding domains in the enzyme active site can lead to
activity associated with the loss- or gain-of-function mechanisms and mice
expressing SOD1 mutants unable to bind copper ions still exhibit symptoms of
ALS66
.
state of art
26
II.7 COPPER DETECTION METHODS
The broad participation of copper in both neurophysiological and neuropathological
events has prompted demand for ways to trace this metal in biological systems. In
this regard, both major oxidation states of copper, the 4s23d
10 cuprous oxidation state
(Cu+) and the 4s
23d
9 cupric oxidation state (Cu
2+), are important for rigorous
considerations of its chemistry in natural settings. Radioactive copper isotopes such
as 67
Cu336
and atomic absorption spectroscopy have proven to be useful for studying
many aspects of copper biology but lack spatial resolution and cannot differentiate
between Cu+ and Cu
2+ .
The existence of two high abundance naturally occurring isotopes of copper, 63
Cu
(69.17%) and 65
Cu (30.83%), has also been exploited to study copper in specific
organs by analyzing the 63
Cu/65
Cu ratio using inductively coupled plasma mass
spectrometry (ICP/MS) or thermal-ionization mass spectrometry (TIMS).444–447
These methods are quite useful for studying complex organisms but again lack
subcellular resolution and cannot distinguish between different oxidation states of
copper. Finally, a myriad of histochemical indicators have been developed to stain for
copper, including hemotoxylin, rubeanic acid (dithiooxamide), rhodanine and
diphenylcarbazide, diethyldithiocarbamate, dithizone, Timm‟s staining, orcein, and
bathocuproine disulfonate (BCS). A modified Timm‟s method using trichloroacetic
acid can isolate Cu2+
pools with some fidelity,460 whereas BCS is a dual colorimetric
and fluorescence quenching indicator for Cu+ and Cu
2+. The main disadvantages of
these histochemical stains are that they cannot image copper in living samples and are
limited in terms of metal and redox specificity.
Many different solutions have been proposed but, among them, sensing systems
based on nanoparticles are certainly one of the most interesting and promising. In
particular, the use of dye-doped silica nanoparticles67-
can offer intriguing advantages
in this field, such as a great sensitivity enhancement through the occurrence of
amplification processes, the possibility to have an internal reference signal, thus
avoiding further calibrations, and good water solubility. An additional interesting
feature is the possibility to monitor chemical species in vivo, since silica is a
biocompatible material. This feature could be of crucial importance: metallostasis
alteration, namely, zinc and copper homeostatic levels, has already been observed
both in the biological fluids and tissues of patients affected by breast, prostate, lung
and gastrointestinal tumours and in some neurodegenerative disorders like
Parkinson‟s (PD) and Alzheimer‟s diseases (AD).
In particular, copper has been implicated in Amyloid β peptide (Aβ) aggregation
and neurotoxicity and it is generally accepted that in AD brains there is an excess of
Cu in the extracellular space and in amyloid plaques. On the other hand, a decrease of
the intracellular copper in AD as compared to healthy control brain is also reported.
All these findings explain the need for new efficient chemosensors for copper ions.68

state of art
27
II.8 ENANTIOSELECTIVE OXYGEN TRANSFER
Enantioselective catalytic reactions in which the chirality of an asymmetric catalyst
induces the preferred formation of a given product enantiomer have been one of the
most important achievements in chemistry during the 20th century. Initially the
successful enantioselective reactions using homogeneous chiral catalysts were limited
to stereospecific alkene hydrogenations using chiral binaphthylphosphine ligands69
and to the Sharpless epoxidation of allylic alcohols using tartaric acid derivatives as
ligands70-71
.
After proof of the principle of enantioselective catalysis, there was an evident
interest in expanding these results to virtually any substrate as well as for any
reaction type.
In this context, a limitation of the Sharpless enantioselective epoxidation was the
failure to induce enantioselectivity in simple alkenes lacking allylic hydroxy groups.
For this reason, the report by Jacobsen and Katsuki that chiral (salen)-Mn(III)
complexes act as highly enantioselective catalysts for the asymmetric epoxidation of
simple alkenes constituted a breakthrough in the field of asymmetric catalysis72a-e
.
Following the lead of alkene epoxidation, Jacobsen, Katsuki, and other groups
expanded the scope of enantioselective catalysis to other reactions73a-f
. The outcome
of this body of research is that metal complexes derived from chiral salen ligands are
among the most powerful enantioselective catalysts. The importance of chiral salen
ligands in enantioselective catalysis is due to the high enantiomeric excesses that can
be achieved and their general applicability to many different reaction types.
Apparently, chiral salen ligands with bulky substituents create a strongly stereogenic
environment at the active metal center, producing a remarkable discrimination
between the two transitions states leading to each enantiomer. The result is a very
effective transmission of chirality to the reaction product for a broad range of
substrates and reaction types.
One general trend in catalysis is to develop systems that allow the recovery and
reuse of the catalyst74
.
Environmental concerns together with economic considerations make necessary
and convenient this recovery. The high catalyst cost, usually considerably much
higher than that of the products, can be affordable in commercial applications only
when the productivity of the catalyst, measured as total kilograms of product
produced per kilogram of catalyst, is sufficiently high to make the process
economically viable.
On the other hand, the principles of green chemistry require industry to make all
necessary efforts to minimize wastes, particularly those of substances that contain
noxious transition metals such as those typically present in metallic catalysts.
There have been published numerous reviews and account describing the use of
salen-metal complexes as catalysts, including enantioselective reactions, focusing
mainly on the outcome of the reaction75-76
.
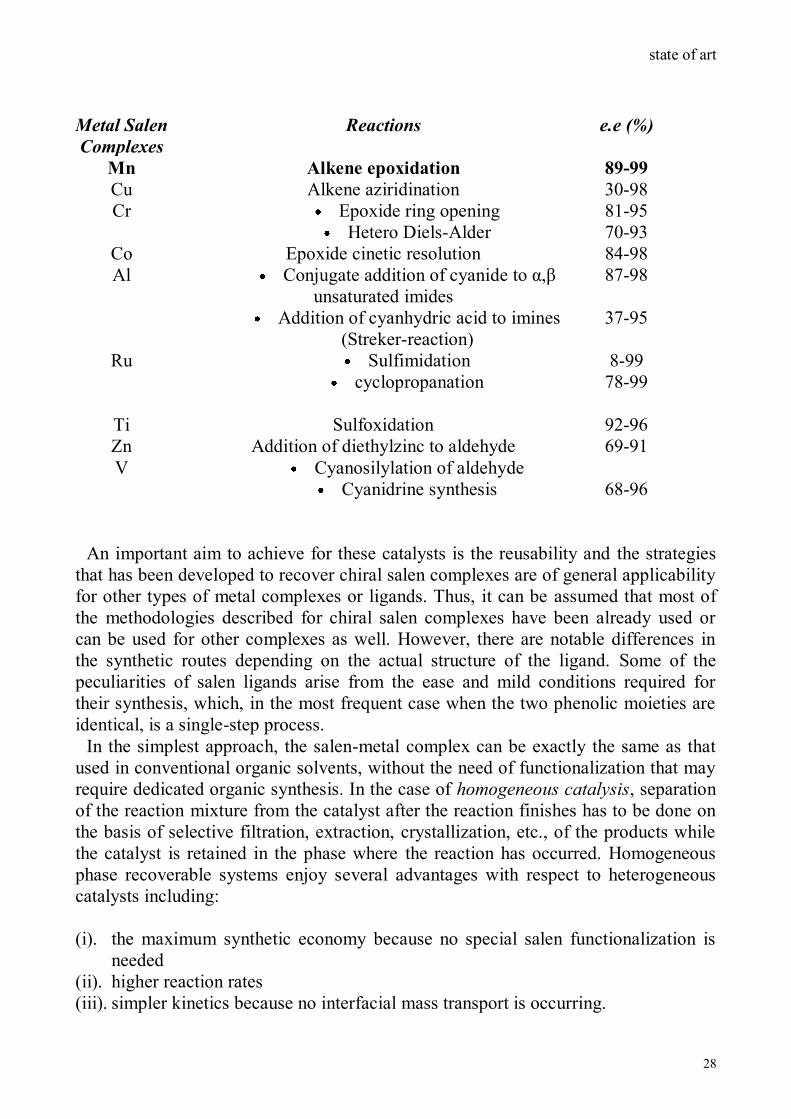
The various kind of metal complexes, the reaction‟s type and the enantiomeric
excesses (e.e) obtained catalyzed can be summarized on the table below :
state of art
28
Metal Salen
Complexes
Reactions e.e (%)
Mn Alkene epoxidation 89-99
Cu Alkene aziridination 30-98
Cr Epoxide ring opening
Hetero Diels-Alder
81-95
70-93
Co Epoxide cinetic resolution 84-98
Al Conjugate addition of cyanide to α,β
unsaturated imides
Addition of cyanhydric acid to imines
(Streker-reaction)
87-98
37-95
Ru Sulfimidation
cyclopropanation
8-99
78-99
Ti Sulfoxidation 92-96
Zn Addition of diethylzinc to aldehyde 69-91
V Cyanosilylation of aldehyde
Cyanidrine synthesis
68-96
An important aim to achieve for these catalysts is the reusability and the strategies
that has been developed to recover chiral salen complexes are of general applicability
for other types of metal complexes or ligands. Thus, it can be assumed that most of
the methodologies described for chiral salen complexes have been already used or
can be used for other complexes as well. However, there are notable differences in
the synthetic routes depending on the actual structure of the ligand. Some of the
peculiarities of salen ligands arise from the ease and mild conditions required for
their synthesis, which, in the most frequent case when the two phenolic moieties are
identical, is a single-step process.
In the simplest approach, the salen-metal complex can be exactly the same as that
used in conventional organic solvents, without the need of functionalization that may
require dedicated organic synthesis. In the case of homogeneous catalysis, separation
of the reaction mixture from the catalyst after the reaction finishes has to be done on
the basis of selective filtration, extraction, crystallization, etc., of the products while
the catalyst is retained in the phase where the reaction has occurred. Homogeneous
phase recoverable systems enjoy several advantages with respect to heterogeneous
catalysts including:
(i). the maximum synthetic economy because no special salen functionalization is
needed
(ii). higher reaction rates
(iii). simpler kinetics because no interfacial mass transport is occurring.
state of art
29
Most of the disadvantages of the homogeneous phase arise from the difficulty in
designing continuous flow processes for this type of catalysis and catalyst recovery.
Furthermore when the salen metal complex is in a solid phase, being inorganic,
carbonaceous, and polymeric or hybrid organic-inorganic.
Catalysis is heterogeneous media, and the solid can be immobilized in a fixed bed
reactor or can be suspended in the reaction medium using stirred tank reactors and
recovered by filtration. Prototypical industrial catalysts are solids, because this allows
the design of continuous flow processes. However, preparation of supported salen
complexes requires indefinitely stable complexes, and a suitable funtionalization to
bind the complex to a solid; otherwise, long-term leaching of the metal from the solid
to the fluid phase and/or complex decomposition can occur. Also, kinetics in
heterogeneous catalysis can be controlled by diffusion and mass transport through the
interfacial surface. These aspects determine that, normally, heterogenization used to
be considered as the last step in the evolution toward a reusable and recoverable
catalyst77
.
However, recent developments in homogeneous catalysis based on the use of novel
“green” liquid media may lead to changes in the preference for heterogeneous versus
homogeneous catalysis.
state of art
30
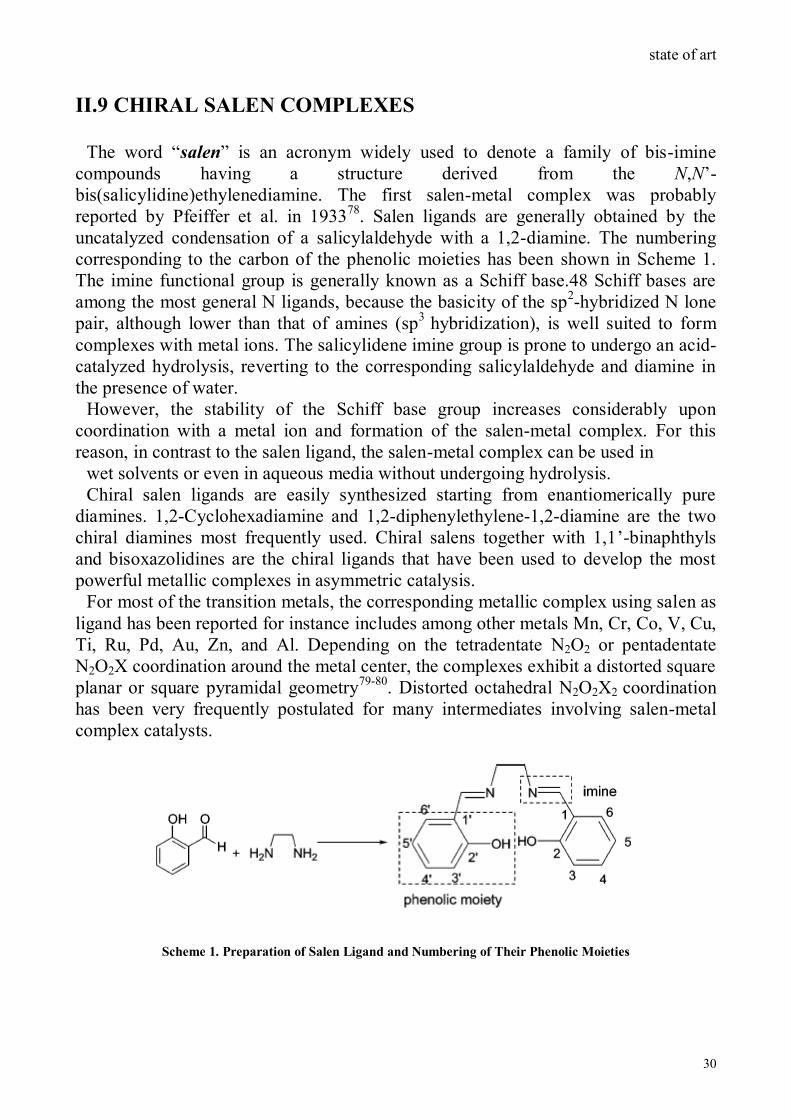
II.9 CHIRAL SALEN COMPLEXES
The word “salen” is an acronym widely used to denote a family of bis-imine
compounds having a structure derived from the N,N‟-
bis(salicylidine)ethylenediamine. The first salen-metal complex was probably
reported by Pfeiffer et al. in 193378
. Salen ligands are generally obtained by the
uncatalyzed condensation of a salicylaldehyde with a 1,2-diamine. The numbering
corresponding to the carbon of the phenolic moieties has been shown in Scheme 1.
The imine functional group is generally known as a Schiff base.48 Schiff bases are
among the most general N ligands, because the basicity of the sp2-hybridized N lone
pair, although lower than that of amines (sp3
hybridization), is well suited to form
complexes with metal ions. The salicylidene imine group is prone to undergo an acid-
catalyzed hydrolysis, reverting to the corresponding salicylaldehyde and diamine in
the presence of water.
However, the stability of the Schiff base group increases considerably upon
coordination with a metal ion and formation of the salen-metal complex. For this
reason, in contrast to the salen ligand, the salen-metal complex can be used in
wet solvents or even in aqueous media without undergoing hydrolysis.
Chiral salen ligands are easily synthesized starting from enantiomerically pure
diamines. 1,2-Cyclohexadiamine and 1,2-diphenylethylene-1,2-diamine are the two
chiral diamines most frequently used. Chiral salens together with 1,1‟-binaphthyls
and bisoxazolidines are the chiral ligands that have been used to develop the most
powerful metallic complexes in asymmetric catalysis.
For most of the transition metals, the corresponding metallic complex using salen as
ligand has been reported for instance includes among other metals Mn, Cr, Co, V, Cu,
Ti, Ru, Pd, Au, Zn, and Al. Depending on the tetradentate N2O2 or pentadentate
N2O2X coordination around the metal center, the complexes exhibit a distorted square
planar or square pyramidal geometry79-80
. Distorted octahedral N2O2X2 coordination
has been very frequently postulated for many intermediates involving salen-metal
complex catalysts.
Scheme 1. Preparation of Salen Ligand and Numbering of Their Phenolic Moieties

state of art
31
Chiral salen complexes have been found to act as catalysts of many different
reaction types including alkene epoxidation, epoxide ring opening,
cyclopropanations, aziridination, selective hydrogenations, carbonyl cyanosilylation,
imine additions, and others. The table mentioned above provides a list of the reaction
types reported using non recoverable chiral salen complexes, together with the
enantiomeric excess (e.e) achieved in each reaction and leading references.

state of art
32
II.10 METHODOLOGIES TO TRANSFORM HOMOGENEOUS
SALEN-METAL COMPLEXES INTO REUSABLE CATALYSTS.
The trend toward the commercial production of optically pure compounds in the
pharmaceutical and fine chemical industries has undoubtedly increased in recent
years81
.
Among the various methods to selectively produce a single enantiomer, asymmetric
catalysis is the most attractive method due to its synthetic economy and amplification
of chirality. However, the contribution of asymmetric catalysis to the overall
production of chiral chemicals is growing at a much slower rate than originally
expected. The main reason for this slow industrial implementation is the need to have
reusable chiral catalysts.
One of the major drawbacks of homogeneous enantioselective catalysis is the need
for separation of the extremely expensive catalysts from the reaction mixture at the
end of the process. Given the high value of the chiral catalysts, their recovery is a
necessary condition to the development of a viable industrial process. Recoverable
enantioselective catalysts with a high productivity are, therefore, necessary from
the industrial point of view.
For these reasons, a general evolution in catalysis is the transformation of successful
homogeneous catalysts into recoverable catalytic systems that can be easily separated
from the reaction mixture and reused multiple times without the loss of the high
activity and selectivity characteristic of the original catalyst. In addition, to minimize
the impact of the high cost of ligands and metals on the products, process design and
waste minimization often require catalyst immobilization and catalyst recovery. On
the one hand, the conversion from a batchwise operation to a continuous flow process
is facilitated by having the catalyst in a separate phase. On the other hand, complexes
may have some noxious metal that have to be completely removed (even in trace
quantities) from the reaction products and the disposal of which may be harmful for
the environment and would require special handling.
Among the different strategies that have been used for the purpose of converting
highly efficient homogeneous catalysts into recoverable and reusable catalytic
systems, the simplest one consists of using the same complex, but changing the
medium from conventional volatile organic solvents to novel “green” liquids. The
necessary condition is that the catalyst has to remain in the novel liquid, whereas the
products have to be separated by extraction, distillation, precipitation, membrane
filtration, or other physical means. Given the relatively large molecular weight and
structure of most catalysts, and specifically here those metal complexes based on
salen ligands, the selective solubility requirement is often easily met when the liquid-
liquid extraction is performed with an immiscible solvent with low solubility power
such as an alkane or an ether. Organic products are commonly more soluble in such
solvents than salen-metal complexes.

state of art
33
In this regard, the usual trend has been to combine the recovery of the catalyst with
the use of an environmentally friendly novel medium. On the basis of the principles
of green chemistry aimed at avoiding or reducing the use of volatile organic solvents,
for liquid substrates one option is to perform catalytic reactions under solvent-free
conditions.
However, in many cases solvents are still needed. Solventless conditions have as a
general limitation the fact that the reaction products may act as quenchers or
inhibitors of the catalyst. An important role of solvents in catalytic reactions
is to assist desorbing products from the catalytic sites. Also, even though solventless
conditions may be considered as ideal from the environmental point of view, this is
true only when substrate conversion reaches very high percentages.
Otherwise, product separation and catalyst recovery from unreacted starting
material may be even more difficult, hazardous, or environmentally unfriendly than
using conventional organic solvents.
Among the novel solvents that have been considered “green” as opposed to
conventional volatile organic liquids, the most frequently used are water,
perfluorinated liquids, supercritical fluids, and ionic liquids. Given the importance
of salen-metal complexes, examples of the use of salen metal complexes as catalysts
in any of these green solvents have been reported and reusability accomplished with a
variable degree of catalyst activity decay.
In addition to the previous approach based on homogeneous catalysis in special
liquid media, the next evolution for developing a recoverable and reusable catalytic
system is transforming a homogeneous into a heterogeneous catalyst.
Heterogeneous catalysts are easily separated from the reaction mixture and can be
recovered and reused provided that they do not become deactivated during recycling.
Also, if deactivation occurs, a suitable reactivation protocol can be devised to regain
most of the initial activity, as, for instance, replenishing the depleted metal ions.
The simplest methodology to accomplish is to support the active salen-metal
complex onto or into an insoluble solid. The interaction between the complex and the
support can range from physisorption to Coulombic forces and covalent anchoring. It
is generally assumed that the latter approach, even though synthetically more
demanding, gives the strongest complex-support binding, but, as we will show, this
assumption should not be taken for granted and must be critically evaluated in each
case. Concerning the support, it can be either organic polymers or inorganic oxides,
each of them having advantages and limitations with respect to the other. The
complex supported on a solid can be simply separated from the reaction mixture by
filtration or placed in a continuous flow reactor82
.

state of art
34
II.11 STABILITY OF METAL SALEN COMPLEXES
Ideally for reusability, the complex has to be perfectly stable under the reaction
conditions, a prerequisite that is difficult to meet. Although most of the salen-metal
complexes have very high binding constants in the range of log K >20,70-72
demetalation of the complex can occur due to competitive complexation with
reagents and products that can be favoured by changes in the metal oxidation state
during the catalytic cycle. Metal oxide formation is also common depending on the
pH at which the reaction is performed and the presence of bases.
Besides demetalation, ligand degradation is also an important cause of complex
instability, particularly when the catalytic reaction requires the presence of strong
acids or oxidizing or reducing reagents. Acids can cause demetalation by protonation
of the phenolate groups. This demetalation leads to the metal-free salen ligand that, as
was stated earlier, is very prone to undergoing hydrolysis to salicylaldehyde and
diamine.
Oxidation reactions require the presence of an oxidant in addition to certain acidic
or basic conditions. Oxidizing reagents can attack the salen ligand at various sites
including the imine and the phenolic ring. In general, Schiff bases can be easily
oxidized. Reduction can also lead to complex degradation that is usually initiated by
a reduction in the metal coordination number from penta- to tetracoordinate.
In addition to advantages in terms of reaction mixture and engineering of the
process, heterogenization can be also advantageous from the point of view of catalyst
stability, as immobilization frequently improves catalyst stability compared to the
homogeneous analogues. This stabilization can be attributed to steric constraints and
site isolation that minimize complex degradation.
In general, it can be said that there is a paucity of studies dealing with salen-metal
complex degradation even though these studies are necessary to assess the maximum
theoretical productivity of the catalytic system. These stability studies should be
performed prior to the determination of the most suitable immobilization procedure,
because it may be useless to anchor a complex that will become degraded in a few
catalytic cycles. Nevertheless, from the literature reports about reusability, it can be
deduced that salen complex stability is significantly reduced in the presence of
oxidizing reagents, as for instance in alkene epoxidation, and less problematic for
epoxide ring opening and other nucleophilic additions.
Kim and co-workers have recently developed a novel concept of heterometallic
chiral salen catalysts formed by the addition to chiral salen Co(II) of an alkali earth
halide (BF3, AlX3, or GaX3) in a molar ratio of 2:183a-c
. Apparently the Lewis acid
acts as bridge of two salen complexes forming a dimer that is more active and
selective than the monomer for the asymmetric ring opening of terminal epoxides or
hydrolytic kinetic resolution of terminal epoxides. Although the idea of obtaining
dimeric and oligomeric salen units with enhanced catalytic activity by simple
interaction with Lewis acid halides is certainly interesting and represents high
synthetic economy, the stability of these entities is low and they are not sufficiently

state of art
35
stable to be reused, due probably to hydrolysis of these entities under reaction
conditions.
On the negative side of supporting a chiral catalyst is the fact that the
enantioselectivity of the heterogenized catalyst is commonly lower than that of the
analogous salen-metal complex in solution. Although the origin of this lower
asymmetric induction must be determined and addressed in each specific case, a
general cause of negative influence on the asymmetric induction ability of supported
chiral catalysts is the disturbance that the support imposes on the approach of the
substrates to the metal centre. For this reason, although not frequently the subject of
detailed study, the tether or linker connecting the complex and the support has to be
of sufficient length to allow the complex to move into the liquid phase far from the
solid surface. In this way, there is a continuous effort to develop more efficient and
practical immobilization methods for homogeneous chiral catalysts.
state of art
36
II. 12 REUSABLE CHIRAL SALEN COMPLEXES SUPPORTED
ON INORGANIC SOLIDS AS HETEROGENEOUS CATALYSTS
Inorganic solids have been widely used as supports of chiral salen complexes. In the
past decades there has been an enormous evolution in the strategies to immobilize
salen complexes in inorganic supports, going from the encapsulation within the
cavities of tridirectional large-pore zeolites of homogeneous salen complexes without
any specific functionalization for this purpose to synthetically more demanding
methodologies whereby specific salen complexes with appropriate structures have
been synthesized to effect covalent immobilization on the support.
The use of inorganic solids has some advantages over other types of supports. The
chemical and thermal stability of the inorganic supports makes them compatible with
the widest range of reagents and experimental conditions. Also, mechanical
resistance of the solids makes these inorganic particles less prone to attrition due to
stirring and solvent attack during their use in a chemical reactor under continuous
operation. One of the major problems in the design of an Industrial process is the
possible decrease of catalyst particle size due to mechanical abrasion, this issue being
particularly important when polymer beads are used as supports.
It‟s possible to divide the immobilized salen-metal complexes into/onto inorganic
supports in three main groups on the basis of the support-catalyst interaction:
a. encapsulation within the cages of tri-directional large-pore zeolites using a
methodology generally known as “ship in a bottle” (SIB) synthesis, the
resulting salen complex becoming mechanically immobilized
b. immobilization by weak dipolar or strong Coulombic interactions, where in the
latter case the salen complex is adsorbed onto the support by ion-pairing with
an anionic or cationic solid
c. connection by covalent bond of the salen ligand and the support, which
requires the necessary functionalization of the complex to allow the
immobilization.84
Aim of the work
37
III. AIM OF THE WORK
This work aims to explore the possibility of design, synthesize and test
capabilities, firstly in solution and then into the solid state later on in the form of
monolayer new molecules, that present the ability to recognize a substrate and to
transform this recognition event into a detectable signal or into a real reaction.
What we expect is a change of the optical properties of these compounds, for
instance expressed by a colour switching or a fluorescence alteration both in
solution and on the solid state.
During the first two year we synthesized a series of molecule in order to
recognize nerve agent simulant like DMMP (dimethylmethyphosphonate) by
using firstly simple molecules as oximes (4-hydroxy benzaldoxime, 4-amino-3-
nitro benzaldoxime) that is well known are used in the detoxification therapy
after nerve agents exposure. Unfortunately the change of the behaviour of these
molecule was not as we expected into the solid state because the detectable
signal (that was expected to be a weak interaction) was too low in order to think
to transform this monolayer into a device, so we decided to move our research
into another class of compounds at last to achieve a higher detectable signal by
using aza-compounds (4-hydroxy-2‟-nitro-4‟-oxime-azo-benzene and 4-
hydroxy- 4‟-oxime-azo-benzene) with the same oxime moiety, but in this case
we used as recognition event a reaction by using another nerve agent simulant
DCP (diethylchlorophosphate). The solution measurements are promising and
we are going to perform the same test on solid state.29-36
Another aim of our research was to selectively recognize biological important
metal transition ions as Cu+ and Cu
2+ both in solution and into solid state by
colorimetric or fluorescent essay; for this purpose we employed organic
scaffolds that show a change of one of the properties mentioned above, for
instance aromatic rings that bear chromophoric groups or napthyl amide
derivates, covalently bonded with functional groups, such as di-picolyl amine,
that as it is well known have not only a great change in their photochemical
behaviour but also they present great selectivity.32-42
We synthesized a novel N-tyramine-di[2(dipicolyl)amino]1,8 naphtalimide that
showed the ability to selectively recognise Cu2+
as we expected85
, and then we
try to synthesized another derivate of this compound that bear in order three and
four picolyl groups but we stopped our synthesis at the three armed derivate
(that showed a good sensibility but not a great sensitivity); the four armed was
too difficult to obtain (very low yields and difficulties in purification).
During the third year we focused our attention into the recognition of transition
metal ions, specifically Cu+ and Cu
2+, in biological environment that is very
important for in vivo and in vitro studies for many associated diseases related to
the change of their homeostasis.43-68

Aim of the work
38
Firstly we focused our attention on a bodipy derivate presented in literature, we
embody this molecule into silica-doped-nanoparticles in collaboration with other
research groups obtaining very promising results in the recognition of Cu+.86
Secondly we synthesized a derivate of di[2(dipicolyl)amino]1,8 naphtalimide
linked with a disaccharide (threalose, that shown to be very effective in
inhibiting aggregation of the Alzheimer‟s related β-amyloid peptide Aβ and in
reducing its cytotoxicity ) in order to obtain a water soluble chemosensor; also
this work is in partnership with another research group and the first results are
promising.
We also studied the possibilities of selectively transfer oxygen onto a specific
substrate for instance unfunctionalized alkenes69-84
by using salen-Mn(III)
complexes as catalysts, both in solution and on solid support, in order to obtain a
reusable device.
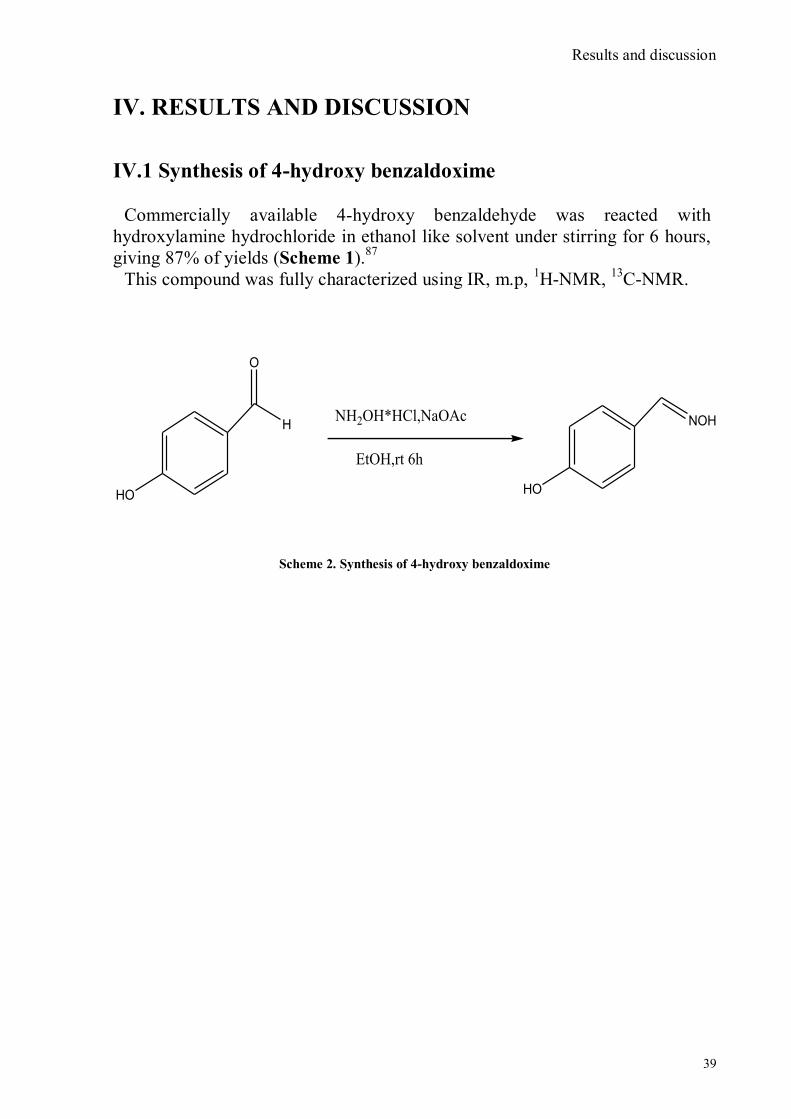
Results and discussion
39
IV. RESULTS AND DISCUSSION
IV.1 Synthesis of 4-hydroxy benzaldoxime
Commercially available 4-hydroxy benzaldehyde was reacted with
hydroxylamine hydrochloride in ethanol like solvent under stirring for 6 hours,
giving 87% of yields (Scheme 1).87
This compound was fully characterized using IR, m.p, 1H-NMR,
13C-NMR.
O
HNH2OH*HCl,NaOAc
EtOH,rt 6h
NOH
HO HO
Scheme 2. Synthesis of 4-hydroxy benzaldoxime
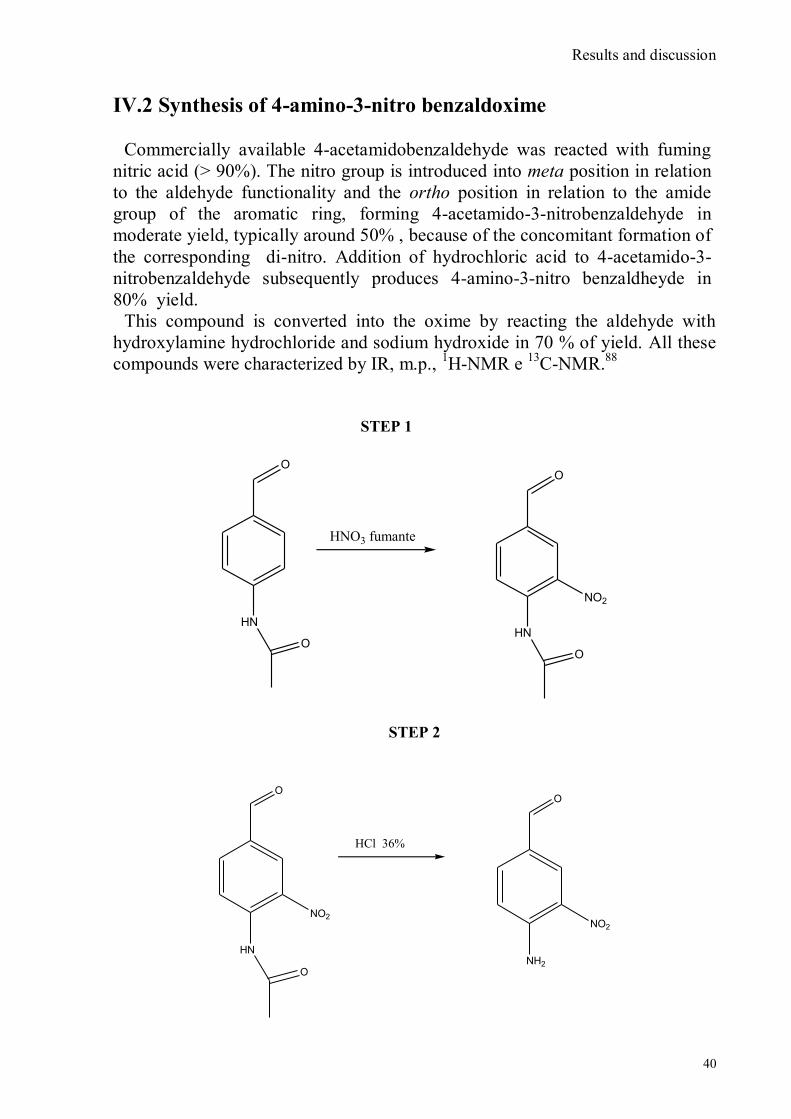
Results and discussion
40
IV.2 Synthesis of 4-amino-3-nitro benzaldoxime
Commercially available 4-acetamidobenzaldehyde was reacted with fuming
nitric acid (> 90%). The nitro group is introduced into meta position in relation
to the aldehyde functionality and the ortho position in relation to the amide
group of the aromatic ring, forming 4-acetamido-3-nitrobenzaldehyde in
moderate yield, typically around 50% , because of the concomitant formation of
the corresponding di-nitro. Addition of hydrochloric acid to 4-acetamido-3-
nitrobenzaldehyde subsequently produces 4-amino-3-nitro benzaldheyde in
80% yield.
This compound is converted into the oxime by reacting the aldehyde with
hydroxylamine hydrochloride and sodium hydroxide in 70 % of yield. All these
compounds were characterized by IR, m.p., 1H-NMR e
13C-NMR.
88
STEP 1
O
HN
O
HNO3 fumante
O
HN
O
NO2
STEP 2
HN
O
NO2
HCl 36%
NH2
NO2
OO
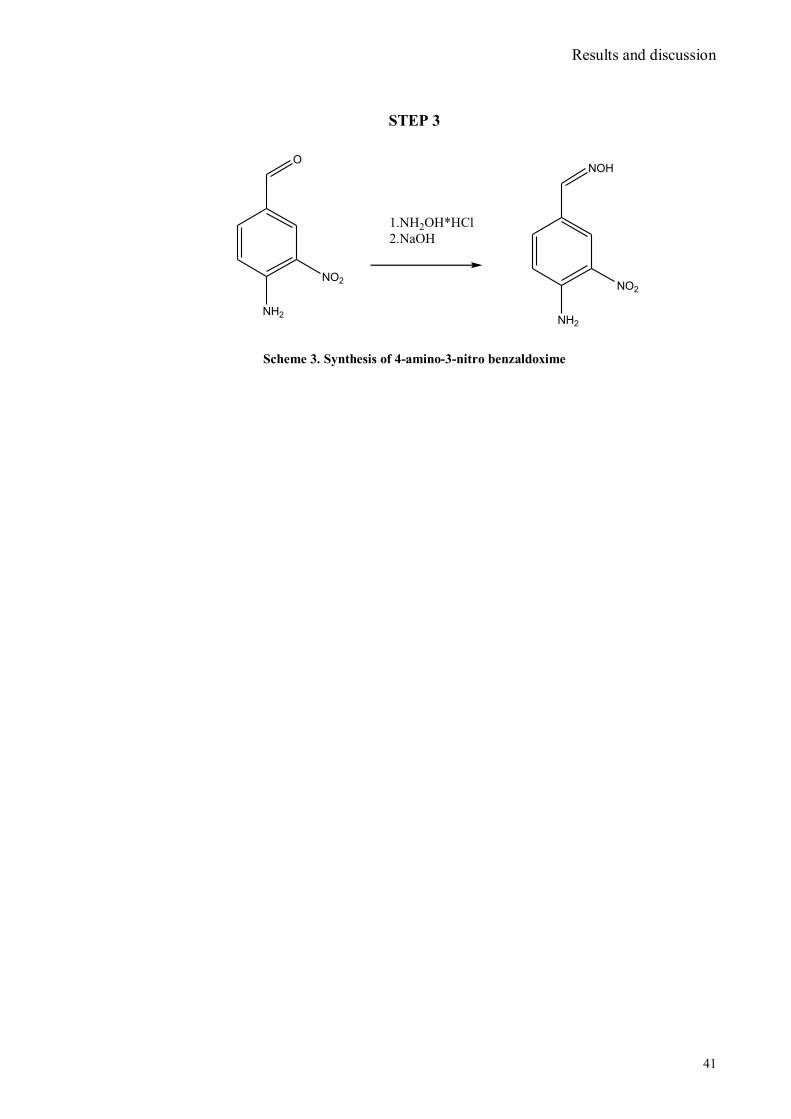
Results and discussion
41
STEP 3
O
NH2
NO2
1.NH2OH*HCl
2.NaOH
NOH
NH2
NO2
Scheme 3. Synthesis of 4-amino-3-nitro benzaldoxime

Results and discussion
42
IV.3 Synthesis of 4-hydroxy-2’-nitro-4’-oxime-azo-benzene
This reaction consist of two steps; in the first one we have the formation of the
diazo-compound that goes by adding to a suspension of 4-amino-3-nitro
benzaldehyde an acid solution (hydrochloridric acid 24%) of sodium nitrite at 0°
C for 40 minutes; when the diazotation reaction is completed we adjusted the pH
of the solution to neutrality by adding a 6% solution of sodium hydroxide.89
Still stirring and cooling we added a basic solution of phenol (in order to
obtain the fenolate intermediate). When the diazo copulation is completed the
reaction product was precipitated by addiction of sodium chloride and filtered
off.90
The crude product was recrystallized from acetic acid to give a bright orange
product 80% yield.
The second step of this reaction consist of the formation of the oxime moiety
by the reaction of the aldehyde sinthesized with hydroxylamine hydrochloride
and sodium hydroxide to give a magenta powder with 60 % of yield. These
compounds were characterized by IR , m.p.,1H-NMR e
13C-NMR and ESI-MS.
STEP 1
NO2
NH2
O
+
OH
NN
CHO
NO2
OH
1.1H2O, HCl
1.2 NaNO2, HCl
0° C
2.1 H2O, NaOH2.2 NaCl
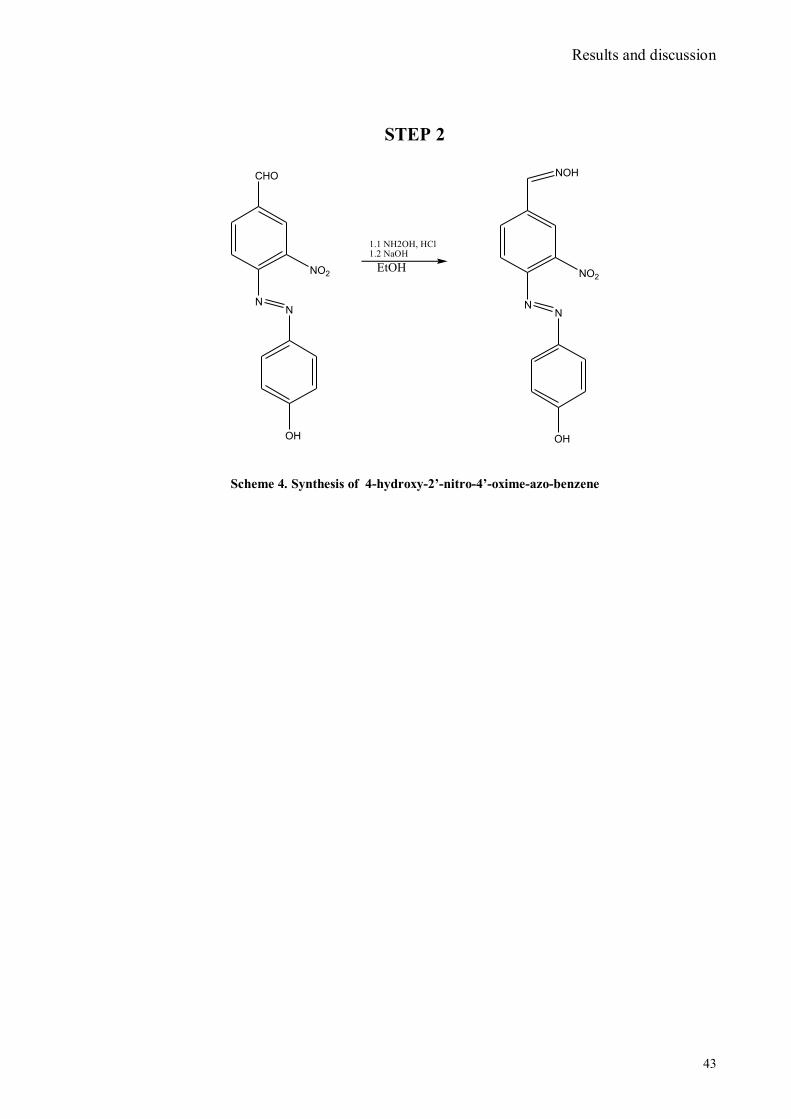
Results and discussion
43
STEP 2
NN
CHO
NO2
OH
1.1 NH2OH, HCl1.2 NaOH
NN
NO2
OH
NOH
EtOH
Scheme 4. Synthesis of 4-hydroxy-2’-nitro-4’-oxime-azo-benzene
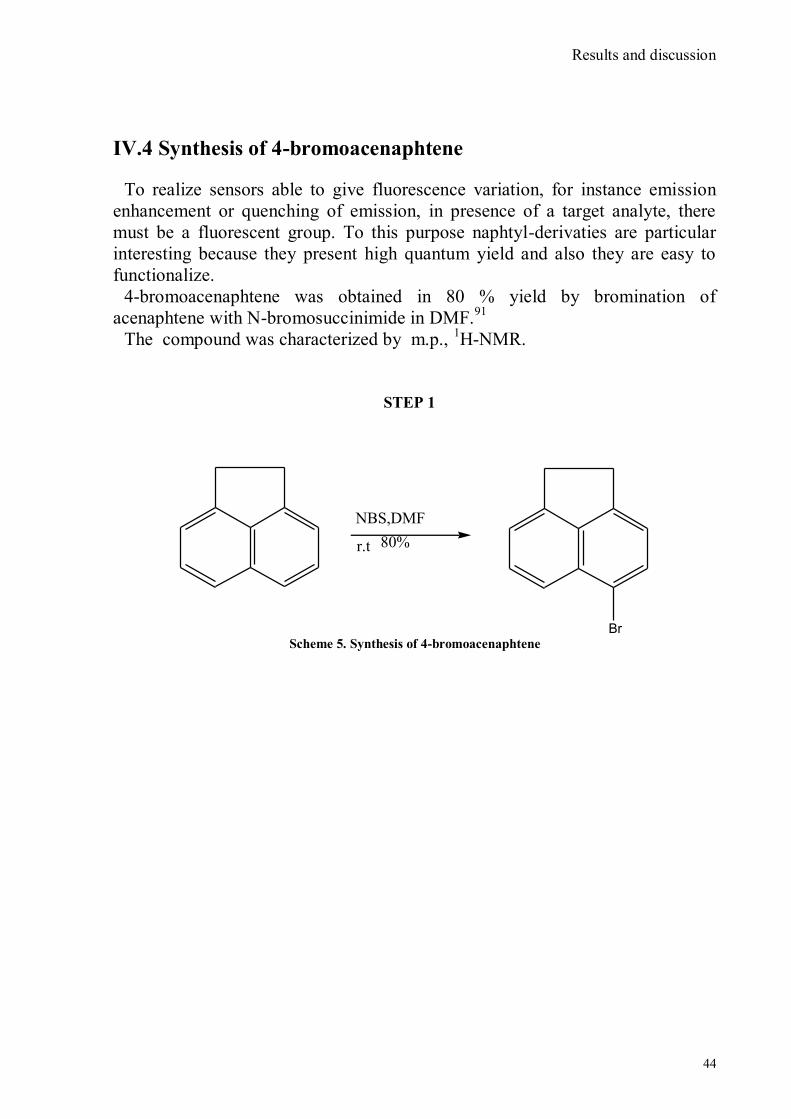
Results and discussion
44
IV.4 Synthesis of 4-bromoacenaphtene
To realize sensors able to give fluorescence variation, for instance emission
enhancement or quenching of emission, in presence of a target analyte, there
must be a fluorescent group. To this purpose naphtyl-derivaties are particular
interesting because they present high quantum yield and also they are easy to
functionalize.
4-bromoacenaphtene was obtained in 80 % yield by bromination of
acenaphtene with N-bromosuccinimide in DMF.91
The compound was characterized by m.p., 1H-NMR.
STEP 1
NBS,DMF
r.t 80%
Br Scheme 5. Synthesis of 4-bromoacenaphtene
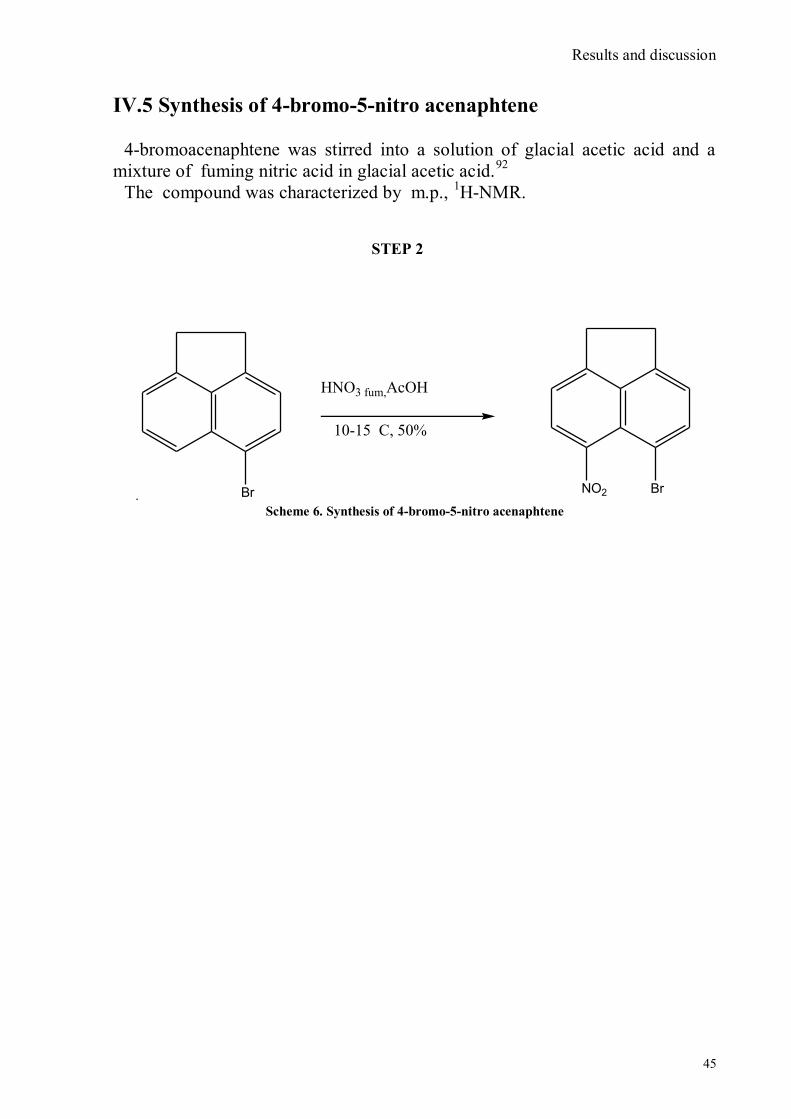
Results and discussion
45
IV.5 Synthesis of 4-bromo-5-nitro acenaphtene
4-bromoacenaphtene was stirred into a solution of glacial acetic acid and a
mixture of fuming nitric acid in glacial acetic acid.92
The compound was characterized by m.p., 1H-NMR.
.
STEP 2
Br
HNO3 fum,AcOH
10-15 C, 50%
BrNO2
Scheme 6. Synthesis of 4-bromo-5-nitro acenaphtene
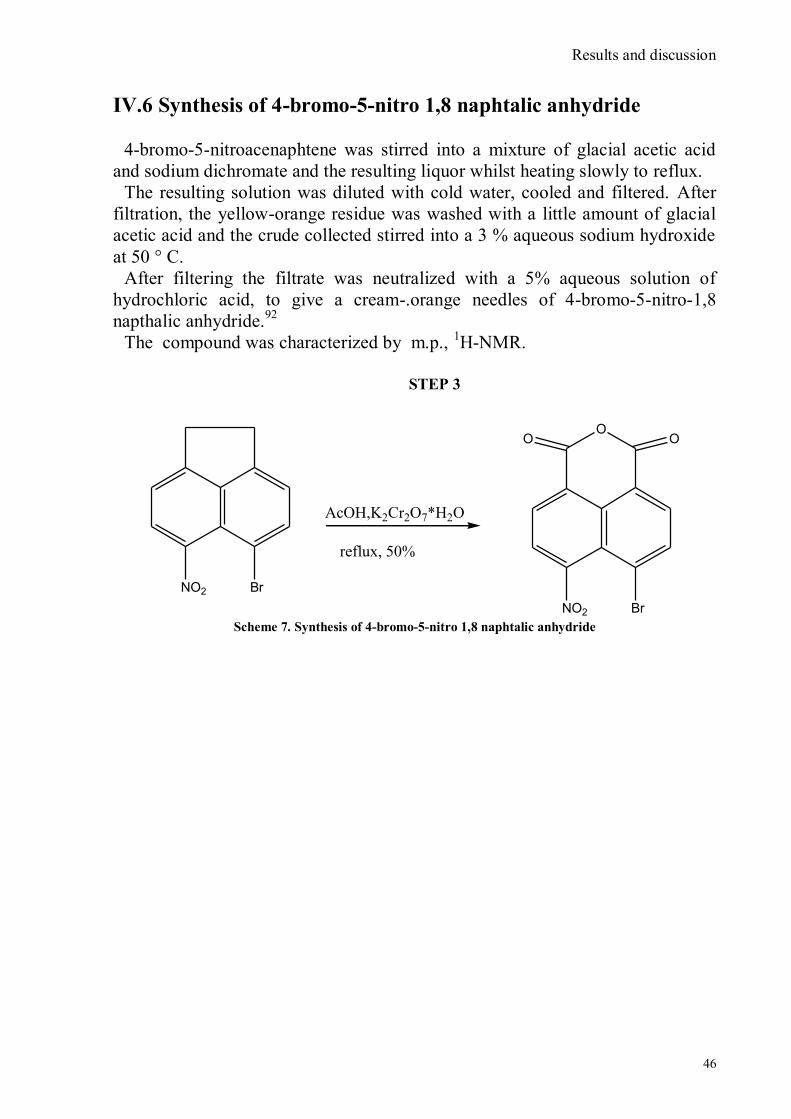
Results and discussion
46
IV.6 Synthesis of 4-bromo-5-nitro 1,8 naphtalic anhydride
4-bromo-5-nitroacenaphtene was stirred into a mixture of glacial acetic acid
and sodium dichromate and the resulting liquor whilst heating slowly to reflux.
The resulting solution was diluted with cold water, cooled and filtered. After
filtration, the yellow-orange residue was washed with a little amount of glacial
acetic acid and the crude collected stirred into a 3 % aqueous sodium hydroxide
at 50 ° C.
After filtering the filtrate was neutralized with a 5% aqueous solution of
hydrochloric acid, to give a cream-.orange needles of 4-bromo-5-nitro-1,8
napthalic anhydride.92
The compound was characterized by m.p., 1H-NMR.
BrNO2
STEP 3
AcOH,K2Cr2O7*H2O
reflux, 50%
BrNO2
OOO
Scheme 7. Synthesis of 4-bromo-5-nitro 1,8 naphtalic anhydride
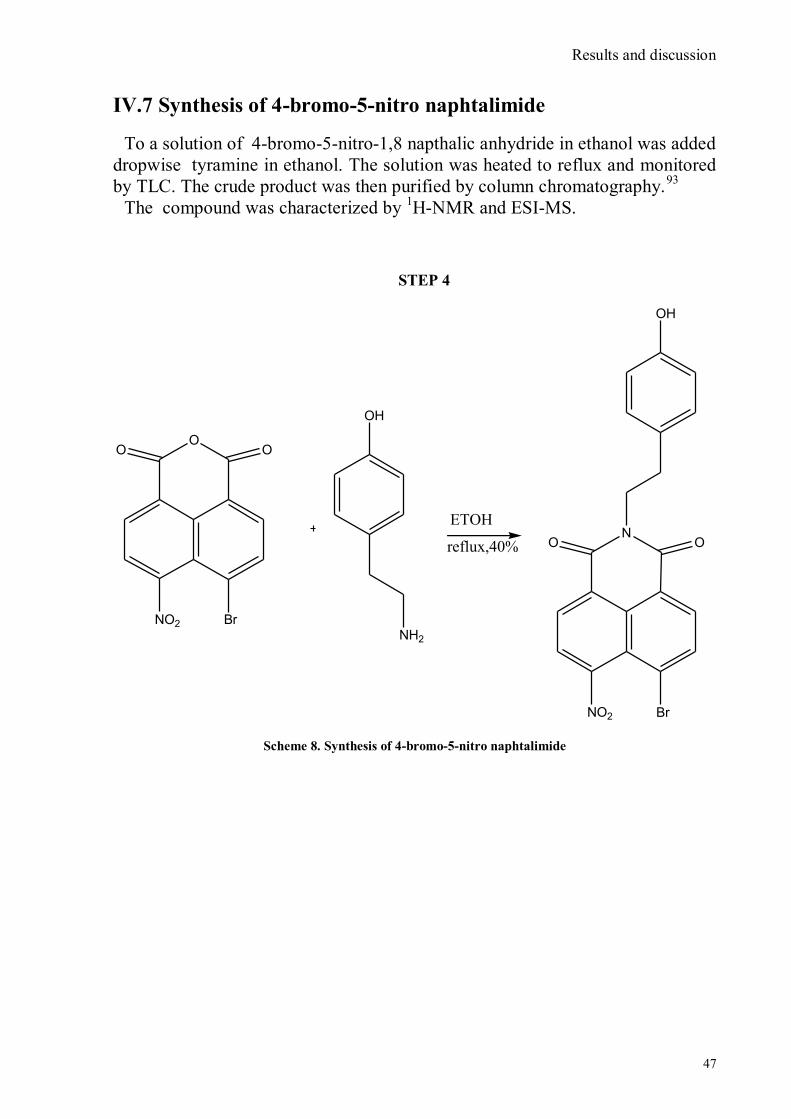
Results and discussion
47
IV.7 Synthesis of 4-bromo-5-nitro naphtalimide
To a solution of 4-bromo-5-nitro-1,8 napthalic anhydride in ethanol was added
dropwise tyramine in ethanol. The solution was heated to reflux and monitored
by TLC. The crude product was then purified by column chromatography.93
The compound was characterized by 1H-NMR and ESI-MS.
STEP 4
BrNO2
OOO
OH
ETOH
reflux,40%
BrNO2
NOO
OH
NH2
Scheme 8. Synthesis of 4-bromo-5-nitro naphtalimide
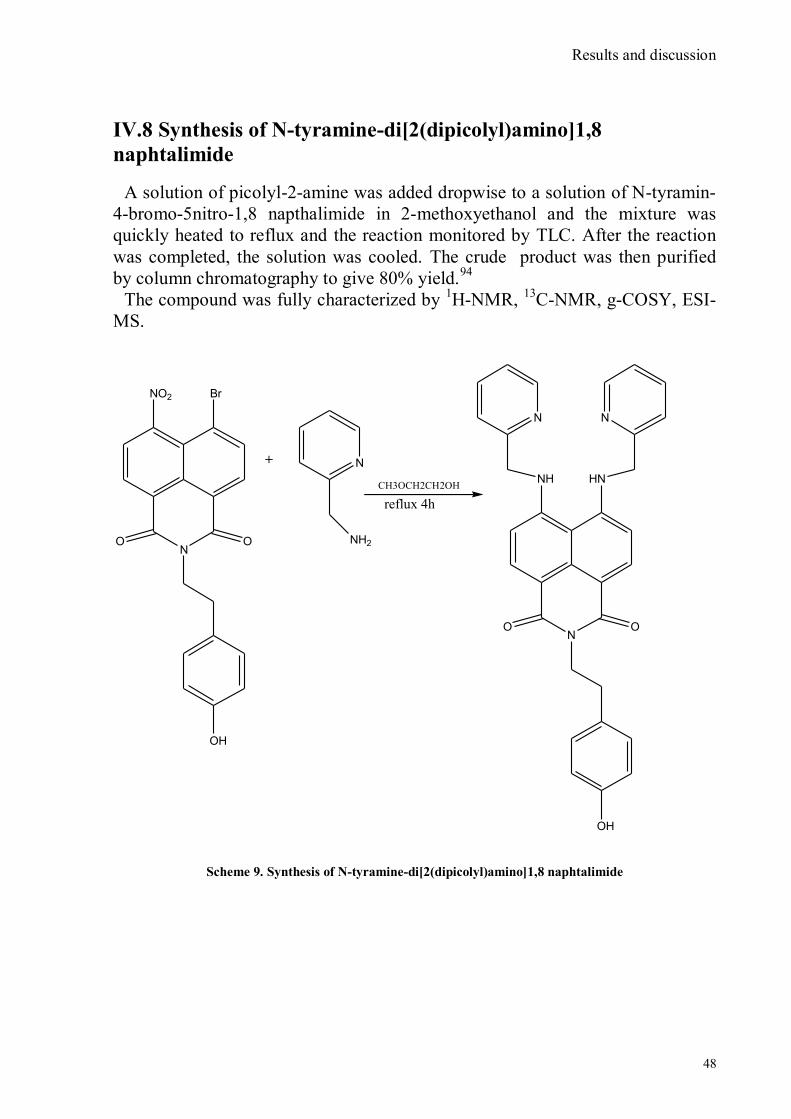
Results and discussion
48
IV.8 Synthesis of N-tyramine-di[2(dipicolyl)amino]1,8
naphtalimide
A solution of picolyl-2-amine was added dropwise to a solution of N-tyramin-
4-bromo-5nitro-1,8 napthalimide in 2-methoxyethanol and the mixture was
quickly heated to reflux and the reaction monitored by TLC. After the reaction
was completed, the solution was cooled. The crude product was then purified
by column chromatography to give 80% yield.94
The compound was fully characterized by 1H-NMR,
13C-NMR, g-COSY, ESI-
MS.
N
OH
OO
BrNO2
+ N
NH2
CH3OCH2CH2OH
reflux 4h
N
OH
OO
HNNH
NN
Scheme 9. Synthesis of N-tyramine-di[2(dipicolyl)amino]1,8 naphtalimide
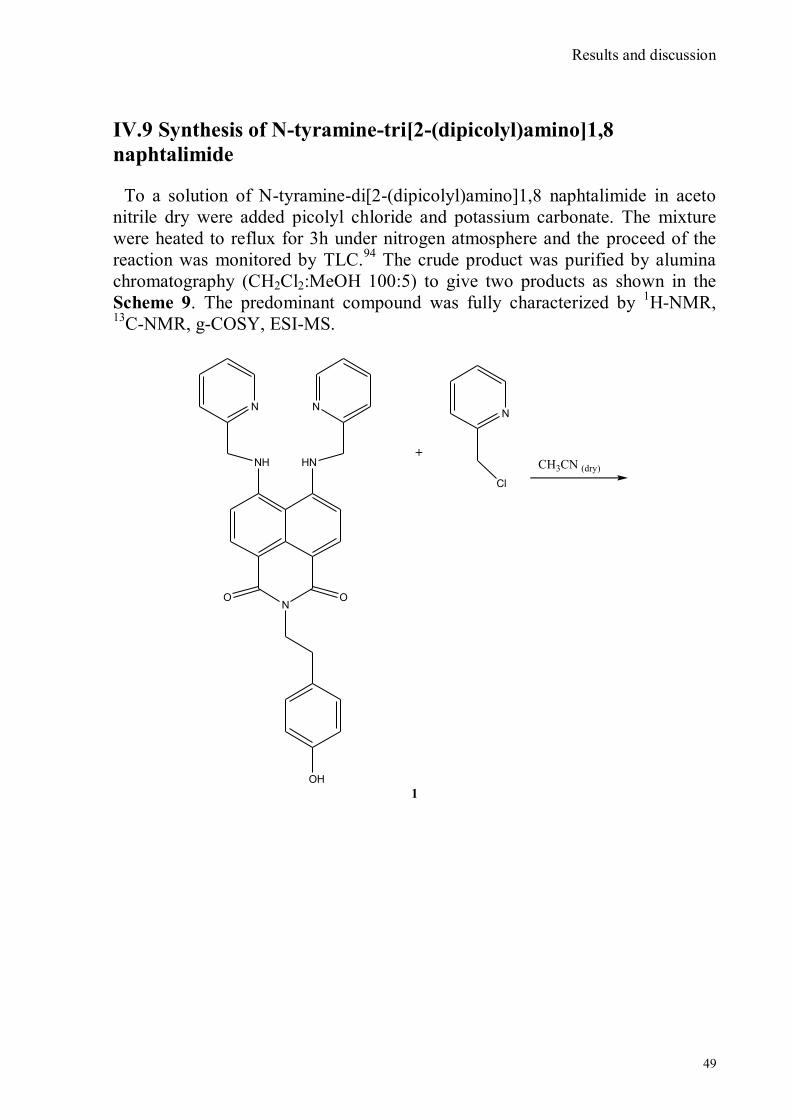
Results and discussion
49
IV.9 Synthesis of N-tyramine-tri[2-(dipicolyl)amino]1,8
naphtalimide
To a solution of N-tyramine-di[2-(dipicolyl)amino]1,8 naphtalimide in aceto
nitrile dry were added picolyl chloride and potassium carbonate. The mixture
were heated to reflux for 3h under nitrogen atmosphere and the proceed of the
reaction was monitored by TLC.94
The crude product was purified by alumina
chromatography (CH2Cl2:MeOH 100:5) to give two products as shown in the
Scheme 9. The predominant compound was fully characterized by 1H-NMR,
13C-NMR, g-COSY, ESI-MS.
N
OH
OO
HNNH
NNN
Cl
+CH3CN (dry)
1
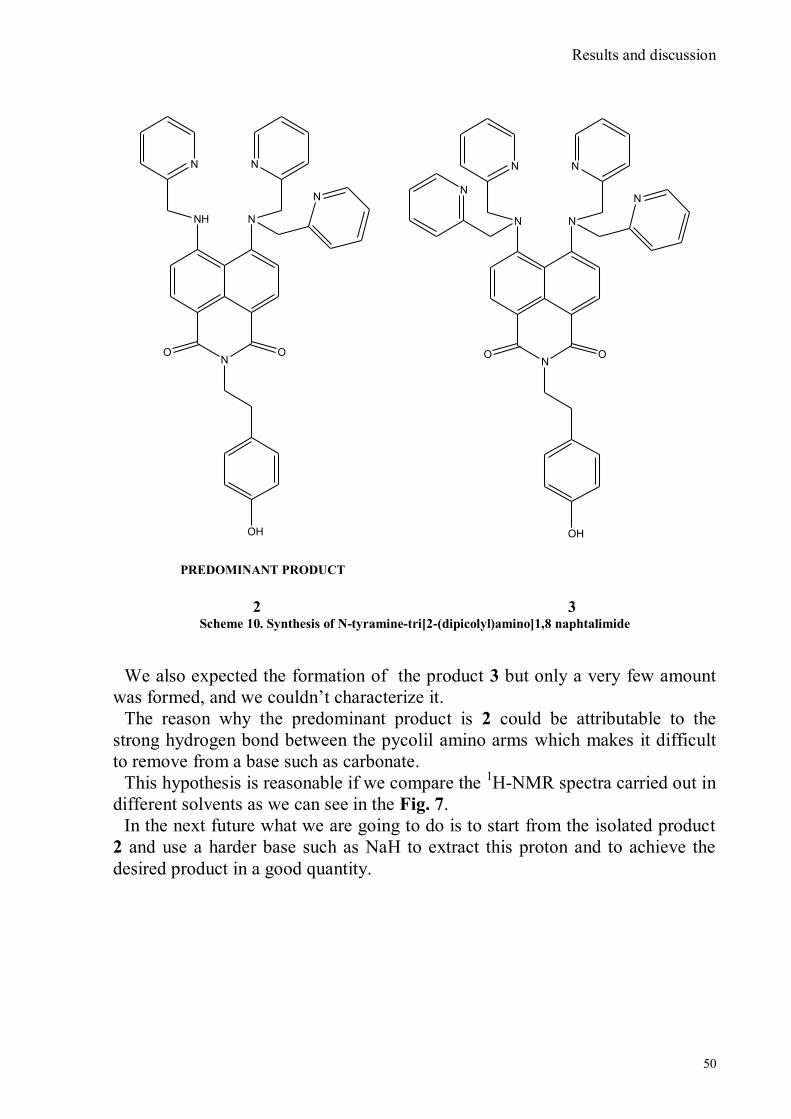
Results and discussion
50
N
OH
OO
NNH
NN
N
PREDOMINANT PRODUCT
N
OH
OO
NN
NN
NN
2 3 Scheme 10. Synthesis of N-tyramine-tri[2-(dipicolyl)amino]1,8 naphtalimide
We also expected the formation of the product 3 but only a very few amount
was formed, and we couldn‟t characterize it.
The reason why the predominant product is 2 could be attributable to the
strong hydrogen bond between the pycolil amino arms which makes it difficult
to remove from a base such as carbonate.
This hypothesis is reasonable if we compare the 1H-NMR spectra carried out in
different solvents as we can see in the Fig. 7.
In the next future what we are going to do is to start from the isolated product
2 and use a harder base such as NaH to extract this proton and to achieve the
desired product in a good quantity.
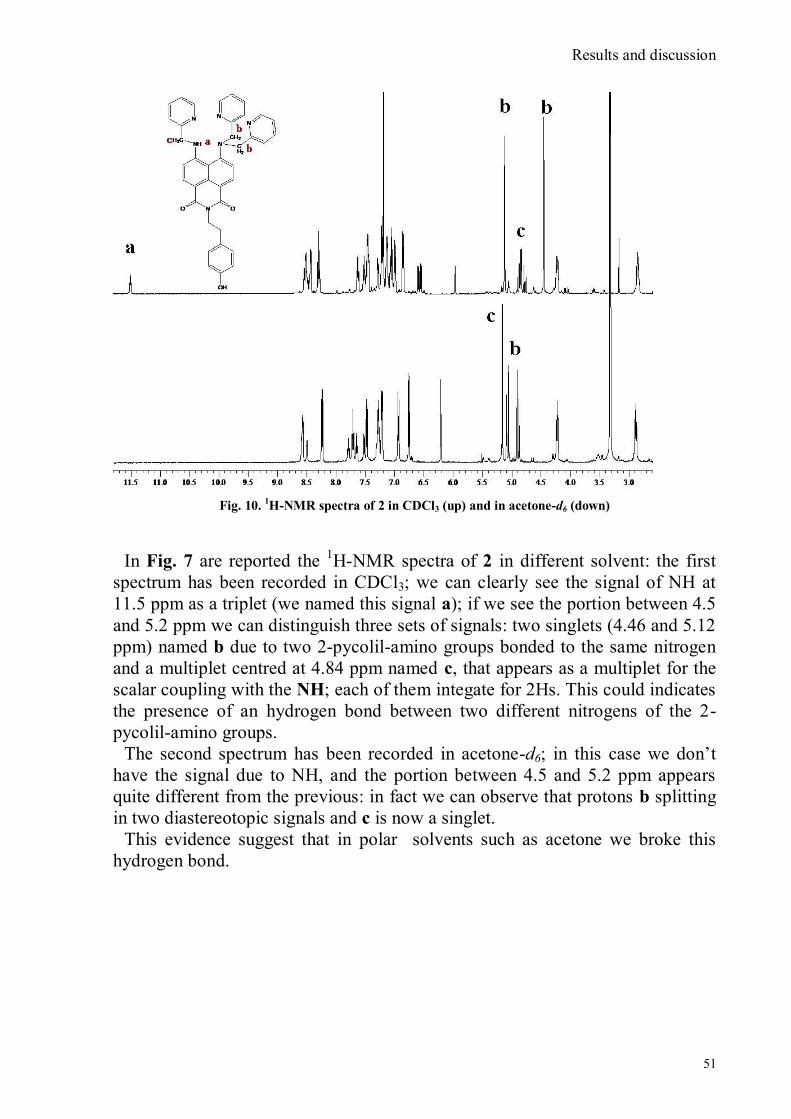
Results and discussion
51
Fig. 10.
1H-NMR spectra of 2 in CDCl3 (up) and in acetone-d6 (down)
In Fig. 7 are reported the 1H-NMR spectra of 2 in different solvent: the first
spectrum has been recorded in CDCl3; we can clearly see the signal of NH at
11.5 ppm as a triplet (we named this signal a); if we see the portion between 4.5
and 5.2 ppm we can distinguish three sets of signals: two singlets (4.46 and 5.12
ppm) named b due to two 2-pycolil-amino groups bonded to the same nitrogen
and a multiplet centred at 4.84 ppm named c, that appears as a multiplet for the
scalar coupling with the NH; each of them integate for 2Hs. This could indicates
the presence of an hydrogen bond between two different nitrogens of the 2-
pycolil-amino groups.
The second spectrum has been recorded in acetone-d6; in this case we don‟t
have the signal due to NH, and the portion between 4.5 and 5.2 ppm appears
quite different from the previous: in fact we can observe that protons b splitting
in two diastereotopic signals and c is now a singlet.
This evidence suggest that in polar solvents such as acetone we broke this
hydrogen bond.
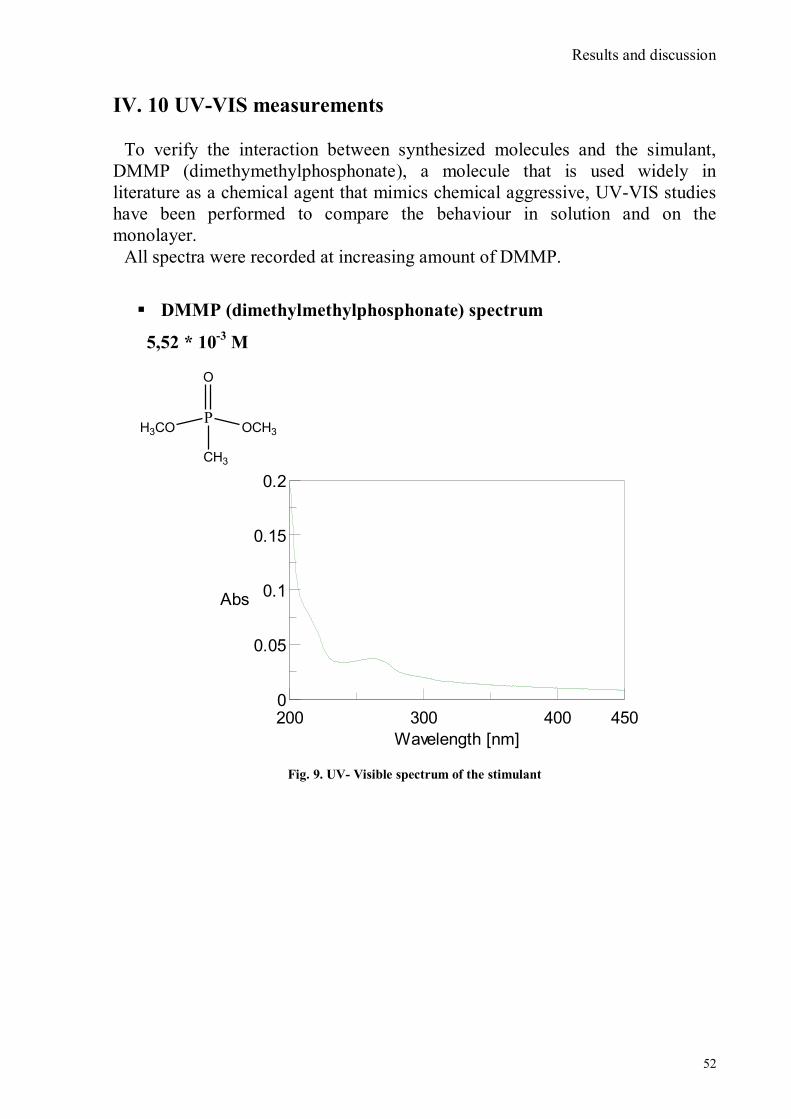
Results and discussion
52
IV. 10 UV-VIS measurements
To verify the interaction between synthesized molecules and the simulant,
DMMP (dimethymethylphosphonate), a molecule that is used widely in
literature as a chemical agent that mimics chemical aggressive, UV-VIS studies
have been performed to compare the behaviour in solution and on the
monolayer.
All spectra were recorded at increasing amount of DMMP.
DMMP (dimethylmethylphosphonate) spectrum
5,52 * 10-3
M
0
0.2
0.05
0.1
0.15
200 450300 400
Abs
Wavelength [nm]
Fig. 9. UV- Visible spectrum of the stimulant
P
O
OCH3H3CO
CH3
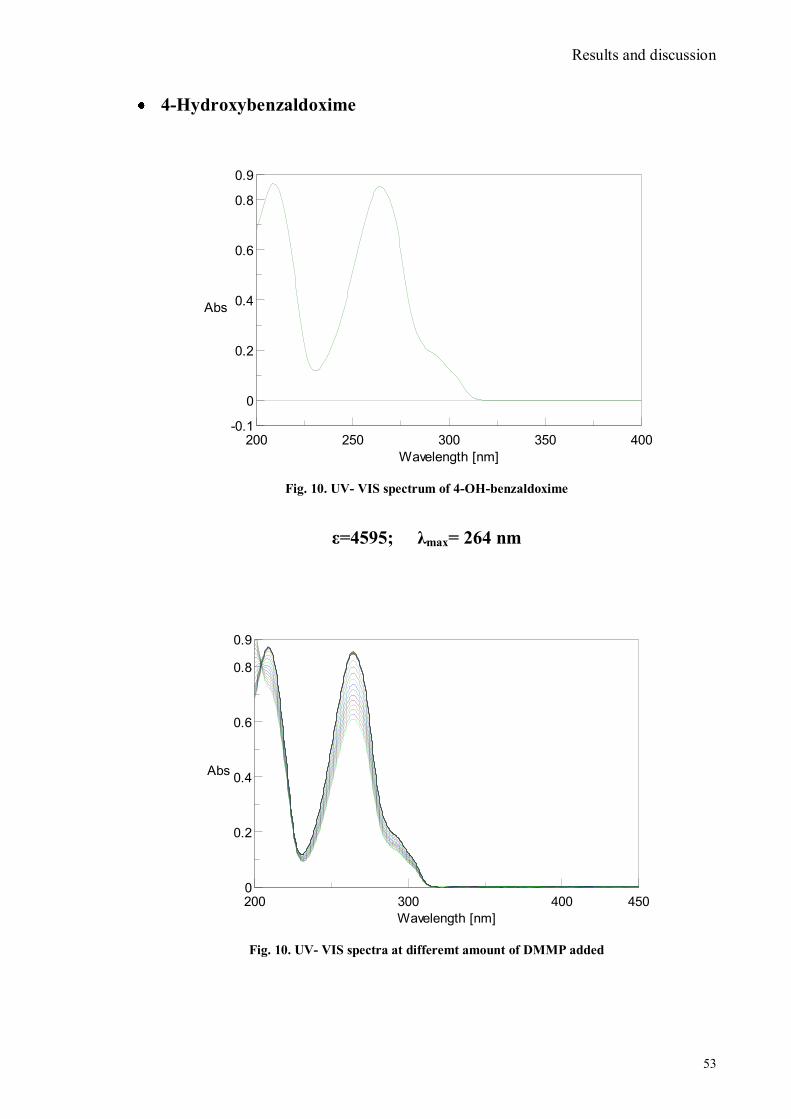
Results and discussion
53
4-Hydroxybenzaldoxime
-0.1
0.9
0
0.2
0.4
0.6
0.8
200 400250 300 350
Abs
Wavelength [nm]
Fig. 10. UV- VIS spectrum of 4-OH-benzaldoxime
ε=4595; λmax= 264 nm
0
0.9
0.2
0.4
0.6
0.8
200 450300 400
Abs
Wavelength [nm]
Fig. 10. UV- VIS spectra at differemt amount of DMMP added
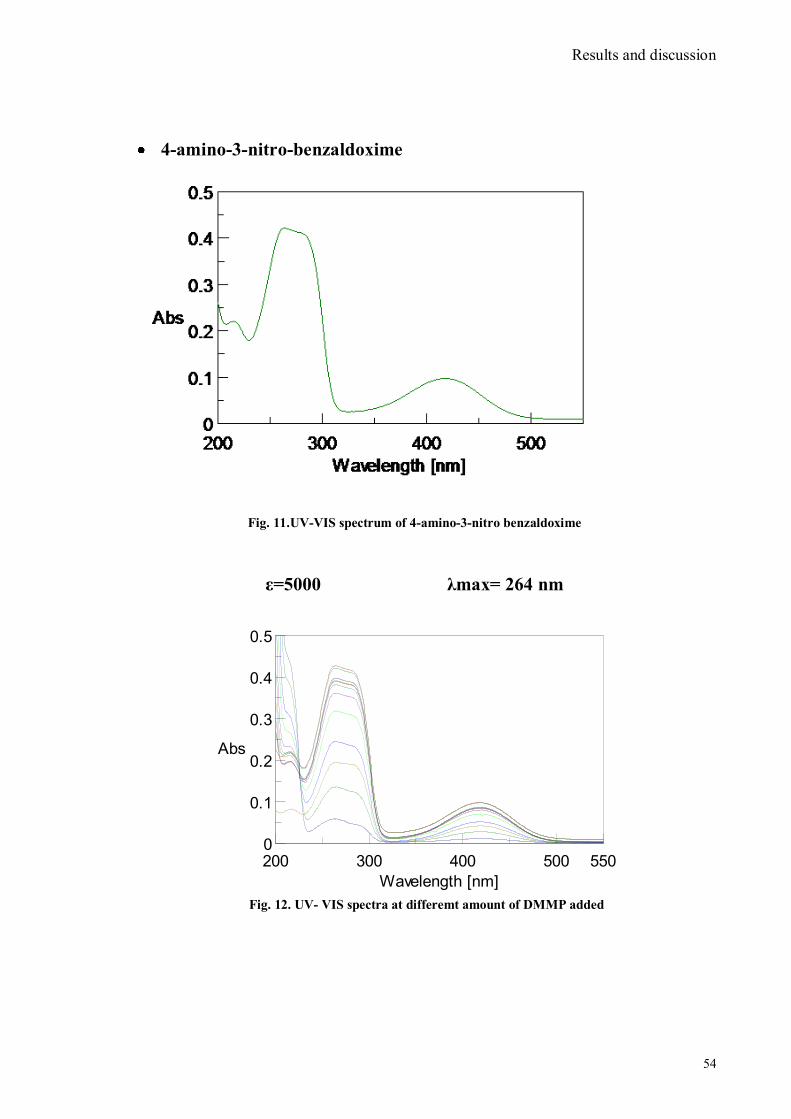
Results and discussion
54
4-amino-3-nitro-benzaldoxime
Fig. 11.UV-VIS spectrum of 4-amino-3-nitro benzaldoxime
ε=5000 λmax= 264 nm
0
0.5
0.1
0.2
0.3
0.4
200 550300 400 500
Abs
Wavelength [nm]
Fig. 12. UV- VIS spectra at differemt amount of DMMP added
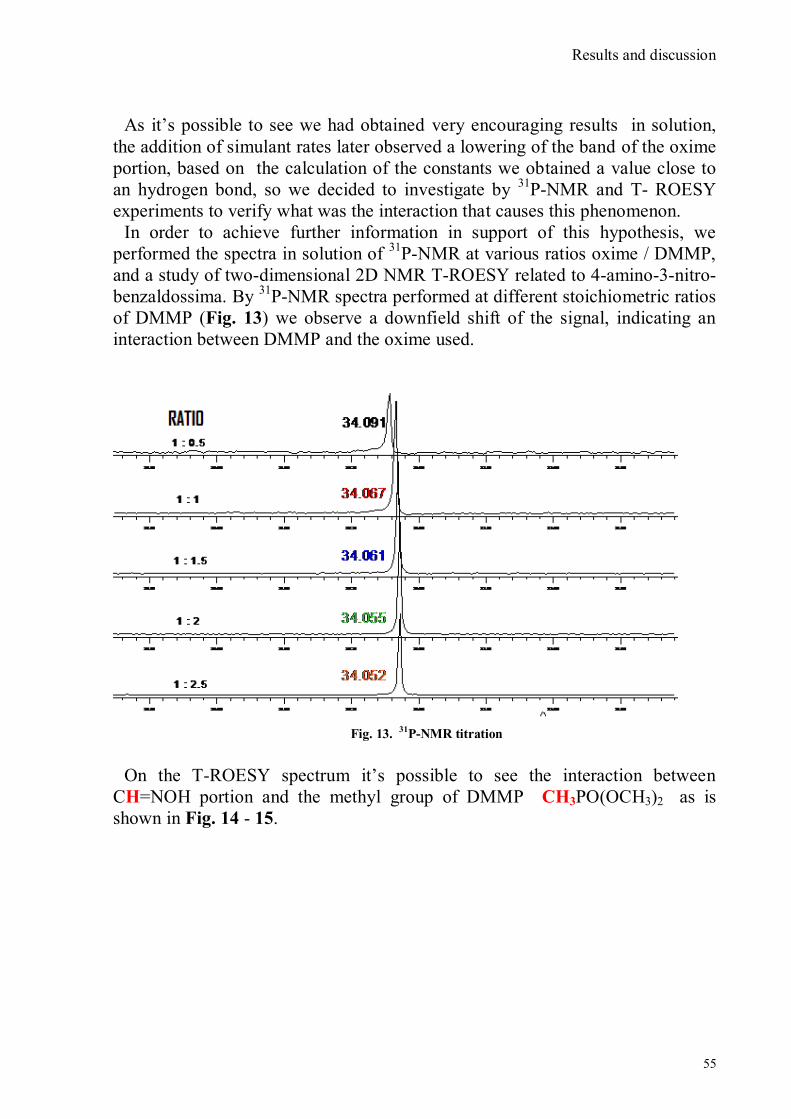
Results and discussion
55
As it‟s possible to see we had obtained very encouraging results in solution,
the addition of simulant rates later observed a lowering of the band of the oxime
portion, based on the calculation of the constants we obtained a value close to
an hydrogen bond, so we decided to investigate by 31
P-NMR and T- ROESY
experiments to verify what was the interaction that causes this phenomenon.
In order to achieve further information in support of this hypothesis, we
performed the spectra in solution of 31
P-NMR at various ratios oxime / DMMP,
and a study of two-dimensional 2D NMR T-ROESY related to 4-amino-3-nitro-
benzaldossima. By 31
P-NMR spectra performed at different stoichiometric ratios
of DMMP (Fig. 13) we observe a downfield shift of the signal, indicating an
interaction between DMMP and the oxime used.
Fig. 13.
31P-NMR titration
On the T-ROESY spectrum it‟s possible to see the interaction between
CH=NOH portion and the methyl group of DMMP CH3PO(OCH3)2 as is
shown in Fig. 14 - 15.
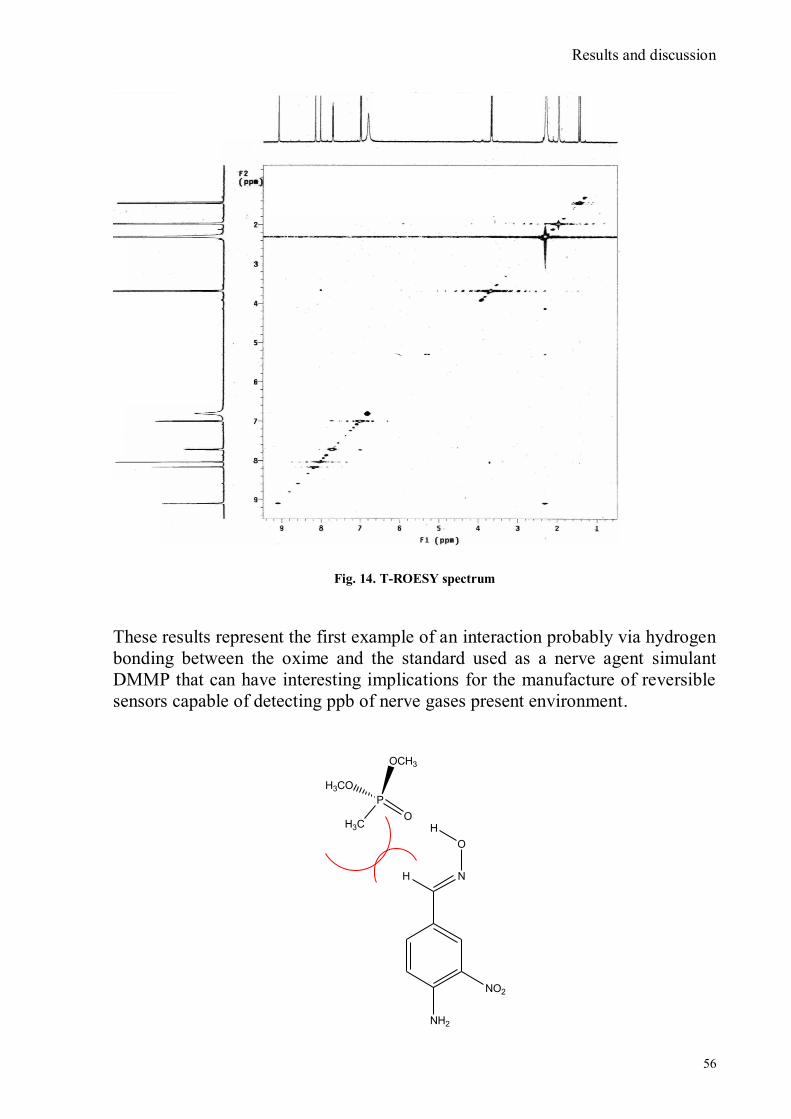
Results and discussion
56
Fig. 14. T-ROESY spectrum
These results represent the first example of an interaction probably via hydrogen
bonding between the oxime and the standard used as a nerve agent simulant
DMMP that can have interesting implications for the manufacture of reversible
sensors capable of detecting ppb of nerve gases present environment.
NH2
NO2
NH
O
H
P
OH3C
OCH3
H3CO
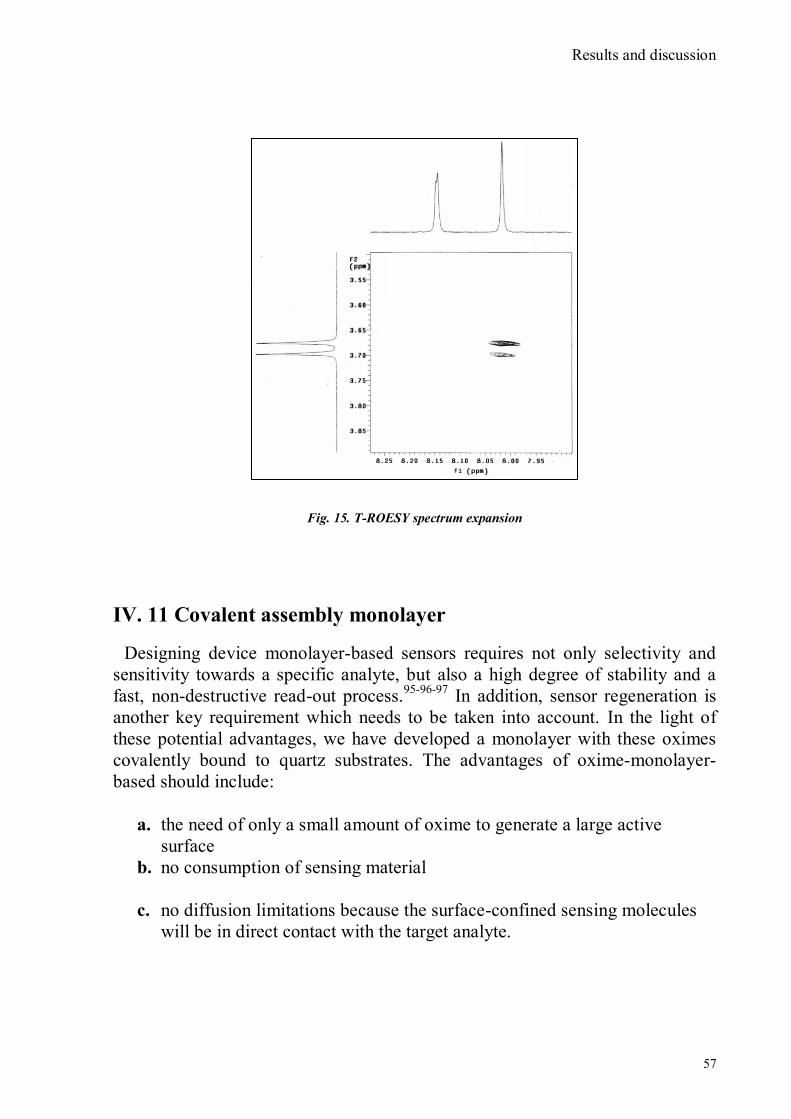
Results and discussion
57
Fig. 15. T-ROESY spectrum expansion
IV. 11 Covalent assembly monolayer
Designing device monolayer-based sensors requires not only selectivity and
sensitivity towards a specific analyte, but also a high degree of stability and a
fast, non-destructive read-out process.95-96-97
In addition, sensor regeneration is
another key requirement which needs to be taken into account. In the light of
these potential advantages, we have developed a monolayer with these oximes
covalently bound to quartz substrates. The advantages of oxime-monolayer-
based should include:
a. the need of only a small amount of oxime to generate a large active
surface
b. no consumption of sensing material
c. no diffusion limitations because the surface-confined sensing molecules
will be in direct contact with the target analyte.
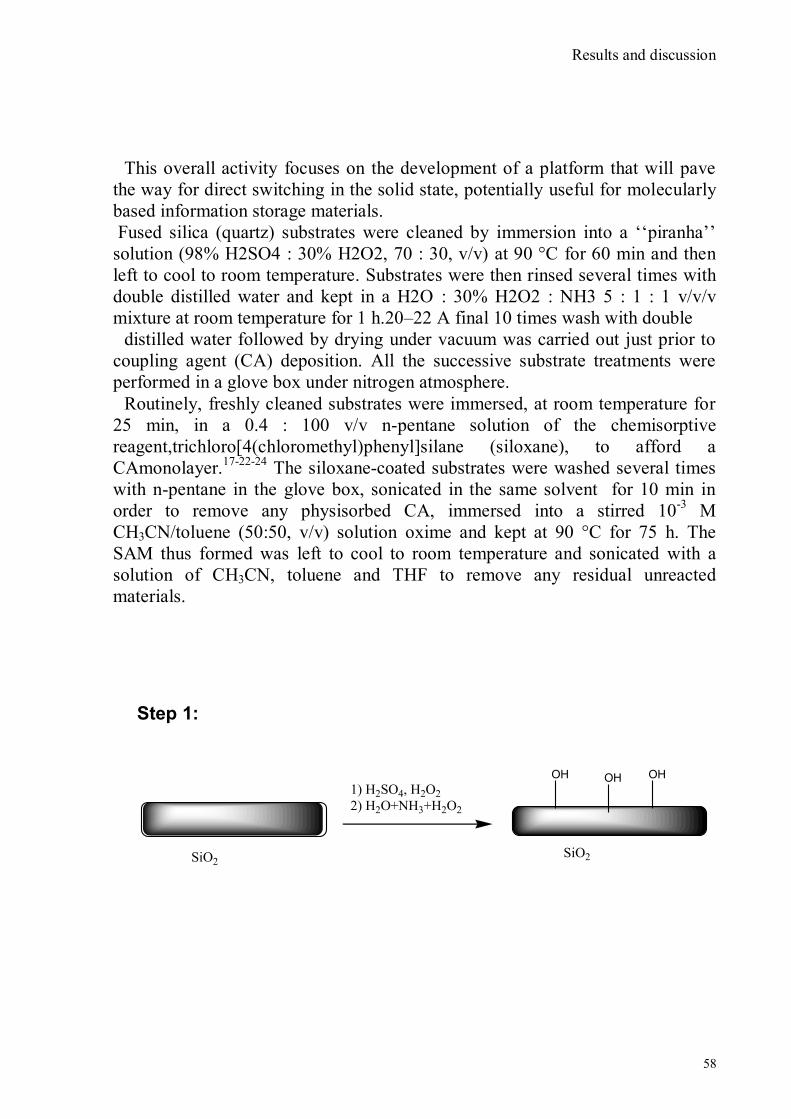
Results and discussion
58
This overall activity focuses on the development of a platform that will pave
the way for direct switching in the solid state, potentially useful for molecularly
based information storage materials.
Fused silica (quartz) substrates were cleaned by immersion into a „„piranha‟‟
solution (98% H2SO4 : 30% H2O2, 70 : 30, v/v) at 90 °C for 60 min and then
left to cool to room temperature. Substrates were then rinsed several times with
double distilled water and kept in a H2O : 30% H2O2 : NH3 5 : 1 : 1 v/v/v
mixture at room temperature for 1 h.20–22 A final 10 times wash with double
distilled water followed by drying under vacuum was carried out just prior to
coupling agent (CA) deposition. All the successive substrate treatments were
performed in a glove box under nitrogen atmosphere.
Routinely, freshly cleaned substrates were immersed, at room temperature for
25 min, in a 0.4 : 100 v/v n-pentane solution of the chemisorptive
reagent,trichloro[4(chloromethyl)phenyl]silane (siloxane), to afford a
CAmonolayer.17-22-24
The siloxane-coated substrates were washed several times
with n-pentane in the glove box, sonicated in the same solvent for 10 min in
order to remove any physisorbed CA, immersed into a stirred 10-3
M
CH3CN/toluene (50:50, v/v) solution oxime and kept at 90 °C for 75 h. The
SAM thus formed was left to cool to room temperature and sonicated with a
solution of CH3CN, toluene and THF to remove any residual unreacted
materials.
Step 1:
SiO2
1) H2SO4, H2O2
2) H2O+NH3+H2O2
SiO2
OH OH OH
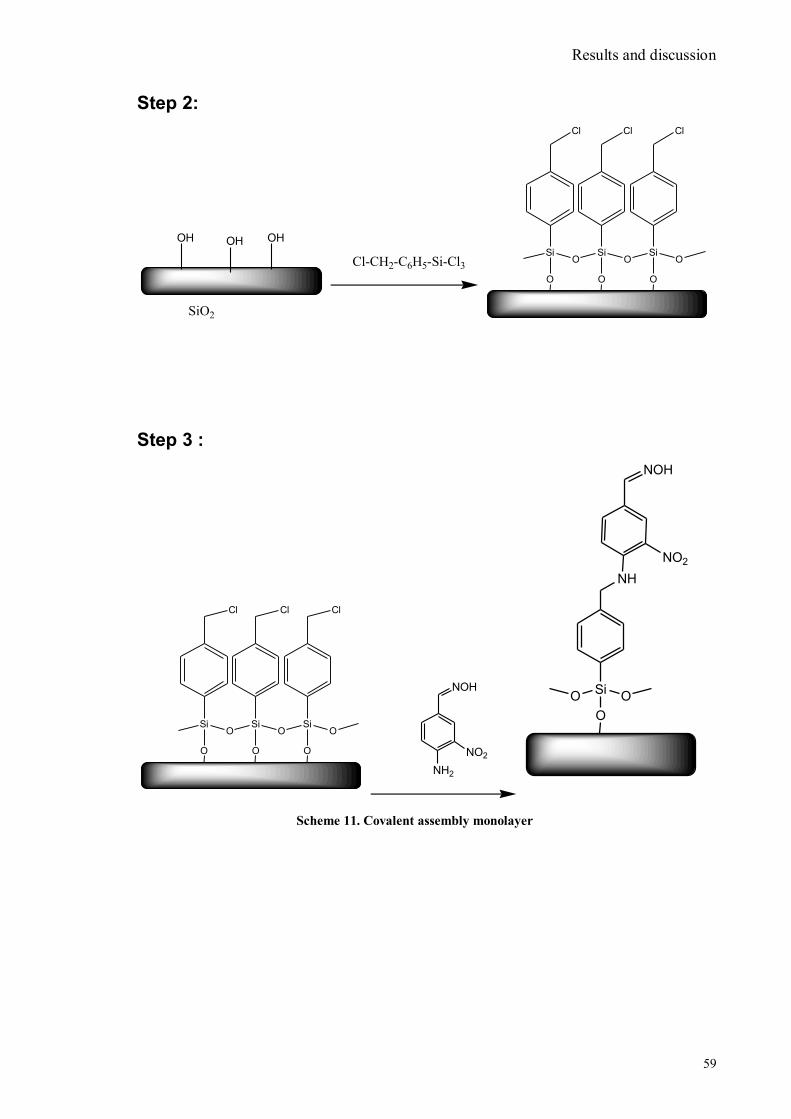
Results and discussion
59
Step 2:
Cl-CH2-C6H5-Si-Cl3
SiO2
OH OH OH
O
SiO
Si
O
OSi
O
O
Cl Cl Cl
Step 3 :
O
SiO
Si
O
OSi
O
O
Cl Cl Cl
NOH
NO2
NH2
O
SiO O
NOH
NO2
NH
Scheme 11. Covalent assembly monolayer
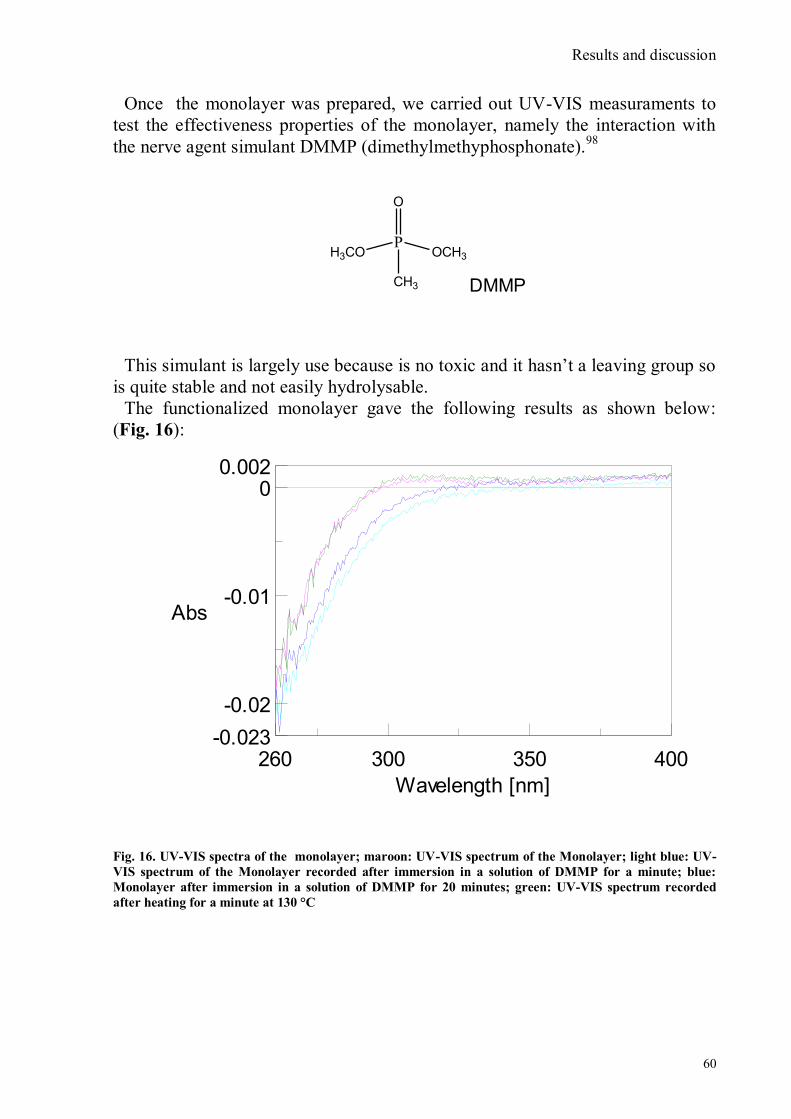
Results and discussion
60
Once the monolayer was prepared, we carried out UV-VIS measuraments to
test the effectiveness properties of the monolayer, namely the interaction with
the nerve agent simulant DMMP (dimethylmethyphosphonate).98
P
O
OCH3H3CO
CH3 DMMP
This simulant is largely use because is no toxic and it hasn‟t a leaving group so
is quite stable and not easily hydrolysable.
The functionalized monolayer gave the following results as shown below:
(Fig. 16):
-0.023
0.002
-0.02
-0.01
0
260 400300 350
Abs
Wavelength [nm]
Fig. 16. UV-VIS spectra of the monolayer; maroon: UV-VIS spectrum of the Monolayer; light blue: UV-
VIS spectrum of the Monolayer recorded after immersion in a solution of DMMP for a minute; blue:
Monolayer after immersion in a solution of DMMP for 20 minutes; green: UV-VIS spectrum recorded
after heating for a minute at 130 °C
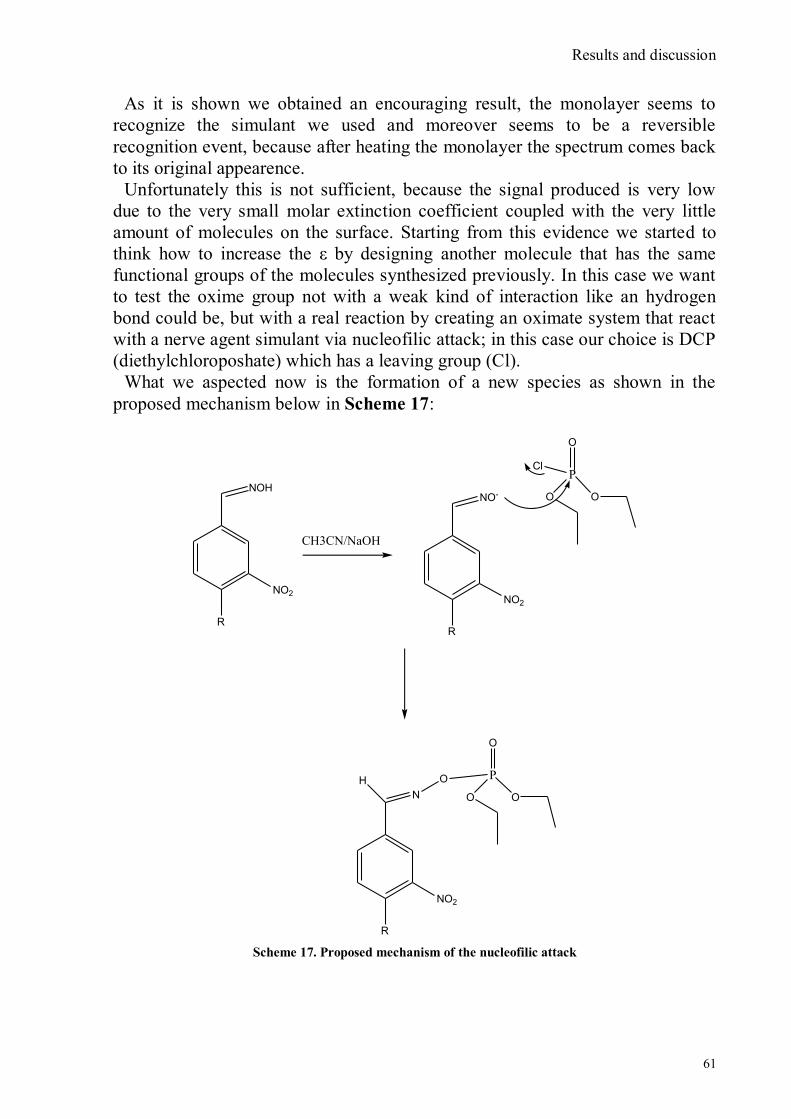
Results and discussion
61
As it is shown we obtained an encouraging result, the monolayer seems to
recognize the simulant we used and moreover seems to be a reversible
recognition event, because after heating the monolayer the spectrum comes back
to its original appearence.
Unfortunately this is not sufficient, because the signal produced is very low
due to the very small molar extinction coefficient coupled with the very little
amount of molecules on the surface. Starting from this evidence we started to
think how to increase the ε by designing another molecule that has the same
functional groups of the molecules synthesized previously. In this case we want
to test the oxime group not with a weak kind of interaction like an hydrogen
bond could be, but with a real reaction by creating an oximate system that react
with a nerve agent simulant via nucleofilic attack; in this case our choice is DCP
(diethylchloroposhate) which has a leaving group (Cl).
What we aspected now is the formation of a new species as shown in the
proposed mechanism below in Scheme 17:
R
NO2
NOH
CH3CN/NaOH
R
NO2
NO-
P
O
O O
Cl
R
NO2
N
P
O
O O
OH
Scheme 17. Proposed mechanism of the nucleofilic attack

Results and discussion
62
We chose a diazo-derivate that is well known that they are dyes with high ε
and show different colours depending on the level of conjugation; in fact
increasing attention has been devoted to materials containing photochromic
azobenzene moiety because of interest in their application fields such as optical
switching,99
optoelectronics100-101
and also to chromogenic recognition of
organophosphate.

Results and discussion
63
IV. 12 UV-VIS Measurements II
In order to obtain a molecule with a higher ε we synthesized this azo
compound, 4-hydroxy-2‟-nitro-4‟-oxime-azo-benzene and the UV-VIS spectrum
show that this compound is in a trans [E] configuration λmax 370 nm.
ε= 25000
-0.1
0.6
0
0.2
0.4
280 600400 500
Abs
Wavelength [nm]
Fig. 17. UV-VIS spectrum of 4-hydroxy-2’-nitro-4’-oxime-azo-benzene
The spectrum below exhibit a large red shift of the azo-compound when the
molecule is dissolved in a 1 : 1 solution CH3CN/ NaOH (aq)
λ 524 nm ε = 32550
-0.1
1
0
0.5
260 700300 400 500 600
Abs
Wavelength [nm]
Fig. 18. UV-VIS spectrum of 4-hydroxy-2’-nitro-4’-oxime-azo-benzene in a solution CH3CN/NaOH 1:1
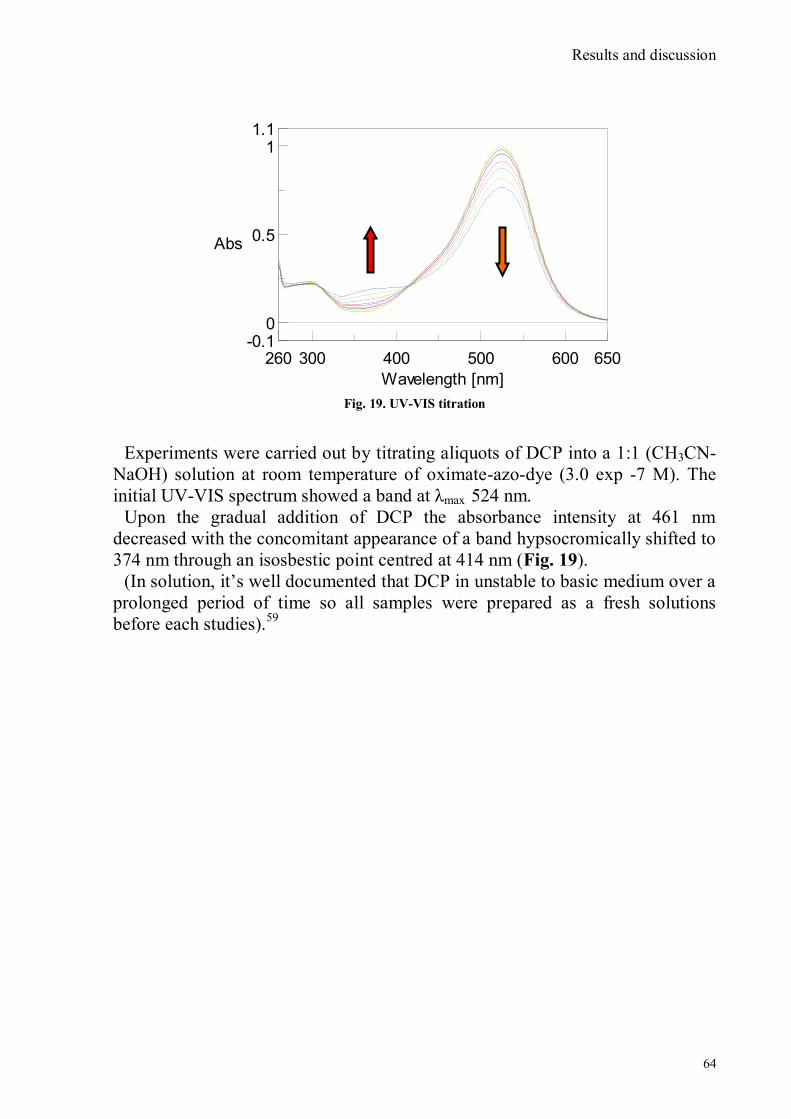
Results and discussion
64
Fig. 19. UV-VIS titration
Experiments were carried out by titrating aliquots of DCP into a 1:1 (CH3CN-
NaOH) solution at room temperature of oximate-azo-dye (3.0 exp -7 M). The
initial UV-VIS spectrum showed a band at λmax 524 nm.
Upon the gradual addition of DCP the absorbance intensity at 461 nm
decreased with the concomitant appearance of a band hypsocromically shifted to
374 nm through an isosbestic point centred at 414 nm (Fig. 19).
(In solution, it‟s well documented that DCP in unstable to basic medium over a
prolonged period of time so all samples were prepared as a fresh solutions
before each studies).59
-0.1
1.1
0
0.5
1
260 650300 400 500 600
Abs
Wavelength [nm]
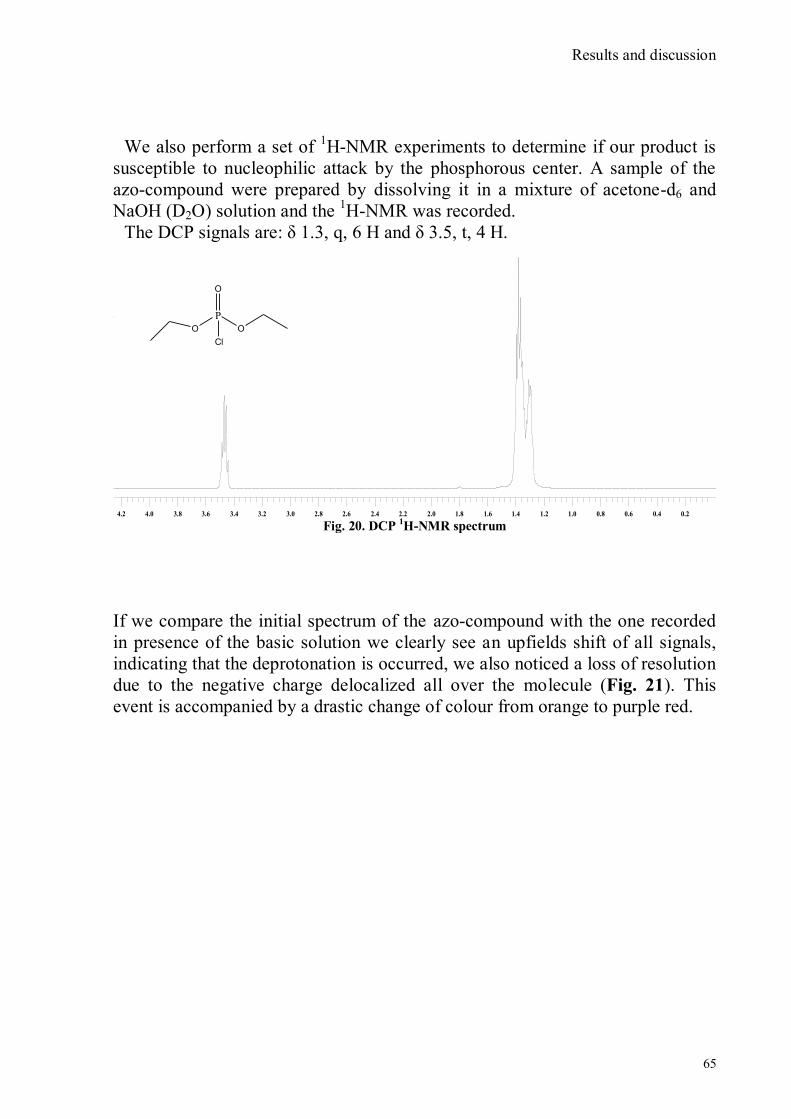
Results and discussion
65
We also perform a set of 1H-NMR experiments to determine if our product is
susceptible to nucleophilic attack by the phosphorous center. A sample of the
azo-compound were prepared by dissolving it in a mixture of acetone-d6 and
NaOH (D2O) solution and the 1H-NMR was recorded.
The DCP signals are: δ 1.3, q, 6 H and δ 3.5, t, 4 H.
Fig. 20. DCP
1H-NMR spectrum
If we compare the initial spectrum of the azo-compound with the one recorded
in presence of the basic solution we clearly see an upfields shift of all signals,
indicating that the deprotonation is occurred, we also noticed a loss of resolution
due to the negative charge delocalized all over the molecule (Fig. 21). This
event is accompanied by a drastic change of colour from orange to purple red.
0.20.20.40.40.60.60.80.81.01.01.21.21.41.41.61.61.81.82.02.02.22.22.42.42.62.62.82.83.03.03.23.23.43.43.63.63.83.84.04.04.24.2
P
O
OO
Cl
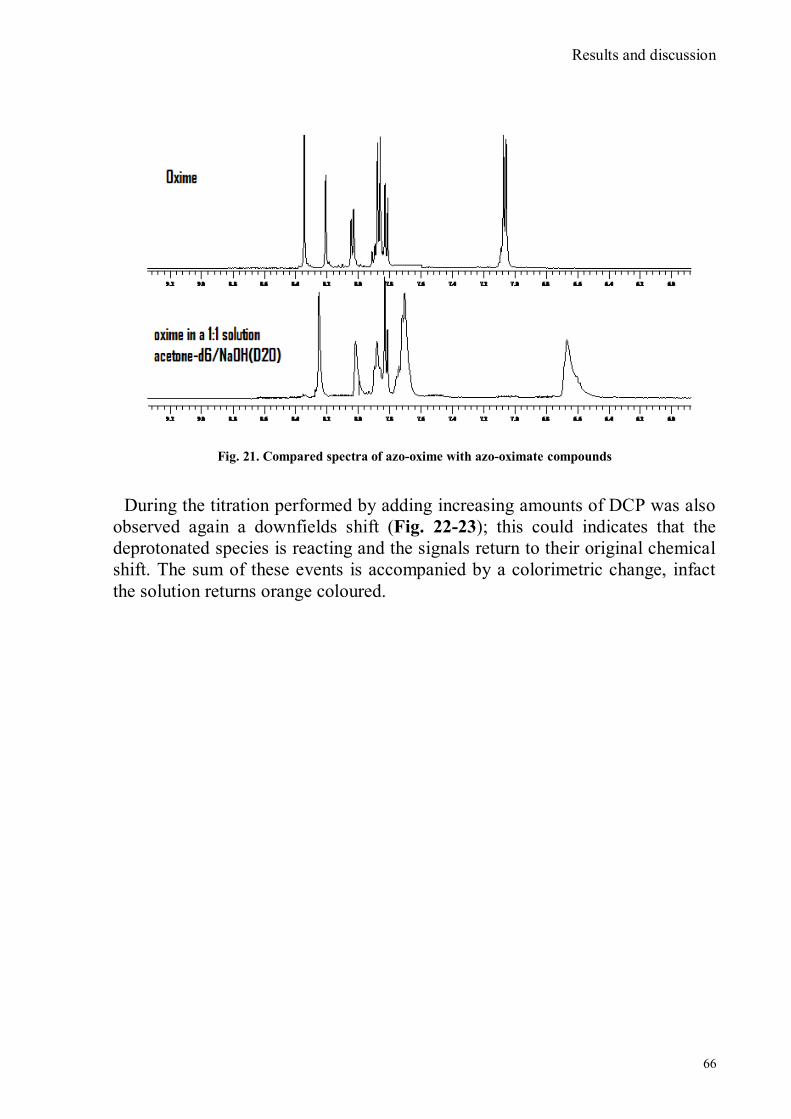
Results and discussion
66
Fig. 21. Compared spectra of azo-oxime with azo-oximate compounds
During the titration performed by adding increasing amounts of DCP was also
observed again a downfields shift (Fig. 22-23); this could indicates that the
deprotonated species is reacting and the signals return to their original chemical
shift. The sum of these events is accompanied by a colorimetric change, infact
the solution returns orange coloured.
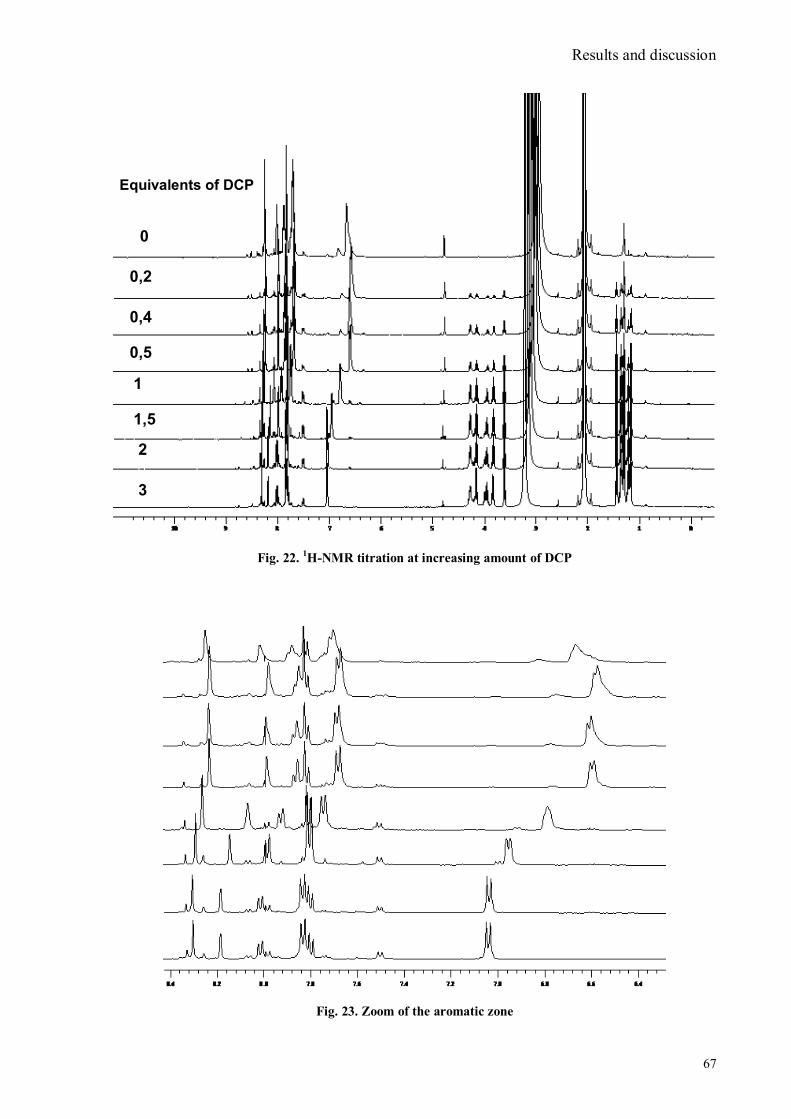
Results and discussion
67
Fig. 22. 1H-NMR titration at increasing amount of DCP
Fig. 23. Zoom of the aromatic zone
Equivalents of DCP
0
0,2
0,4
0,5
1
1,5
2
3
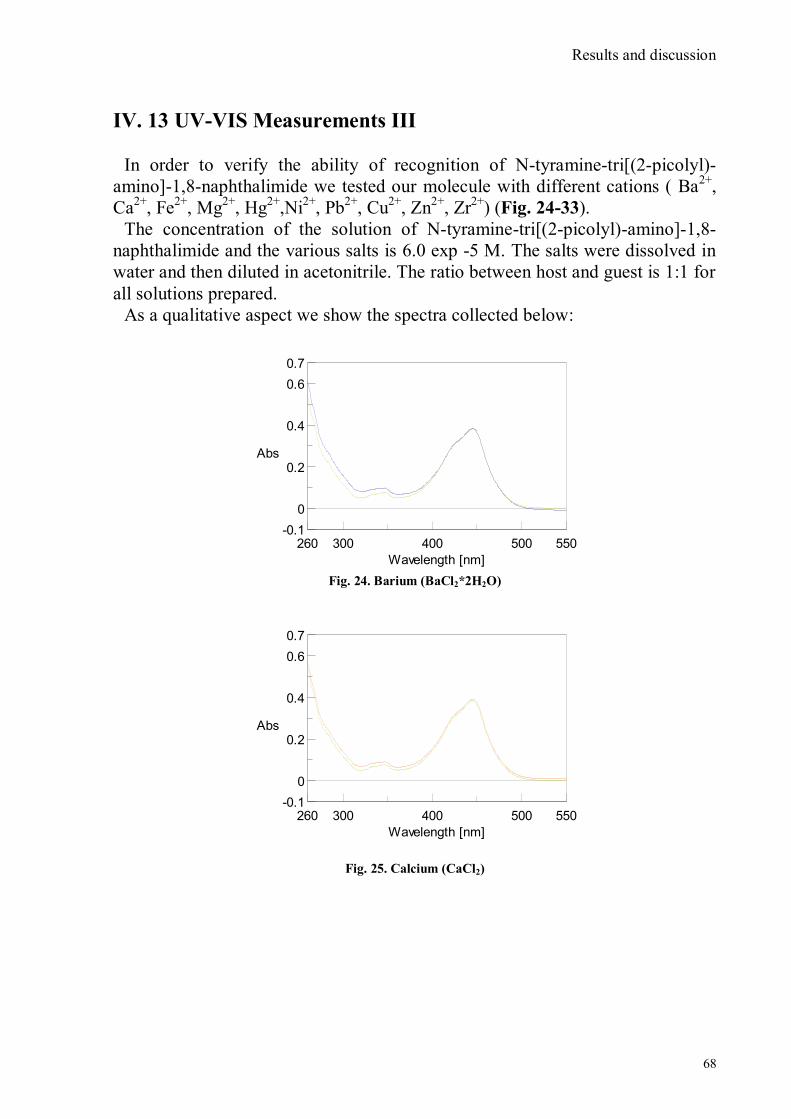
Results and discussion
68
IV. 13 UV-VIS Measurements III
In order to verify the ability of recognition of N-tyramine-tri[(2-picolyl)-
amino]-1,8-naphthalimide we tested our molecule with different cations ( Ba2+
,
Ca2+
, Fe2+
, Mg2+
, Hg2+
,Ni2+
, Pb2+
, Cu2+
, Zn2+
, Zr2+
) (Fig. 24-33).
The concentration of the solution of N-tyramine-tri[(2-picolyl)-amino]-1,8-
naphthalimide and the various salts is 6.0 exp -5 M. The salts were dissolved in
water and then diluted in acetonitrile. The ratio between host and guest is 1:1 for
all solutions prepared.
As a qualitative aspect we show the spectra collected below:
-0.1
0.7
0
0.2
0.4
0.6
260 550300 400 500
Abs
Wavelength [nm]
Fig. 24. Barium (BaCl2*2H2O)
-0.1
0.7
0
0.2
0.4
0.6
260 550300 400 500
Abs
Wavelength [nm]
Fig. 25. Calcium (CaCl2)

Results and discussion
69
-0.1
0.7
0
0.2
0.4
0.6
260 550300 400 500
Abs
Wavelength [nm]
Fig. 26. Mercury (HgCl2)
-0.1
0.7
0
0.2
0.4
0.6
260 550300 400 500
Abs
Wavelength [nm]
Fig. 27. Magnesium (MgClO4)
-0.1
0.4
0
0.1
0.2
0.3
280 600400 500
Abs
Wavelength [nm]
Fig. 28. Lead (Pb(NO3)2)
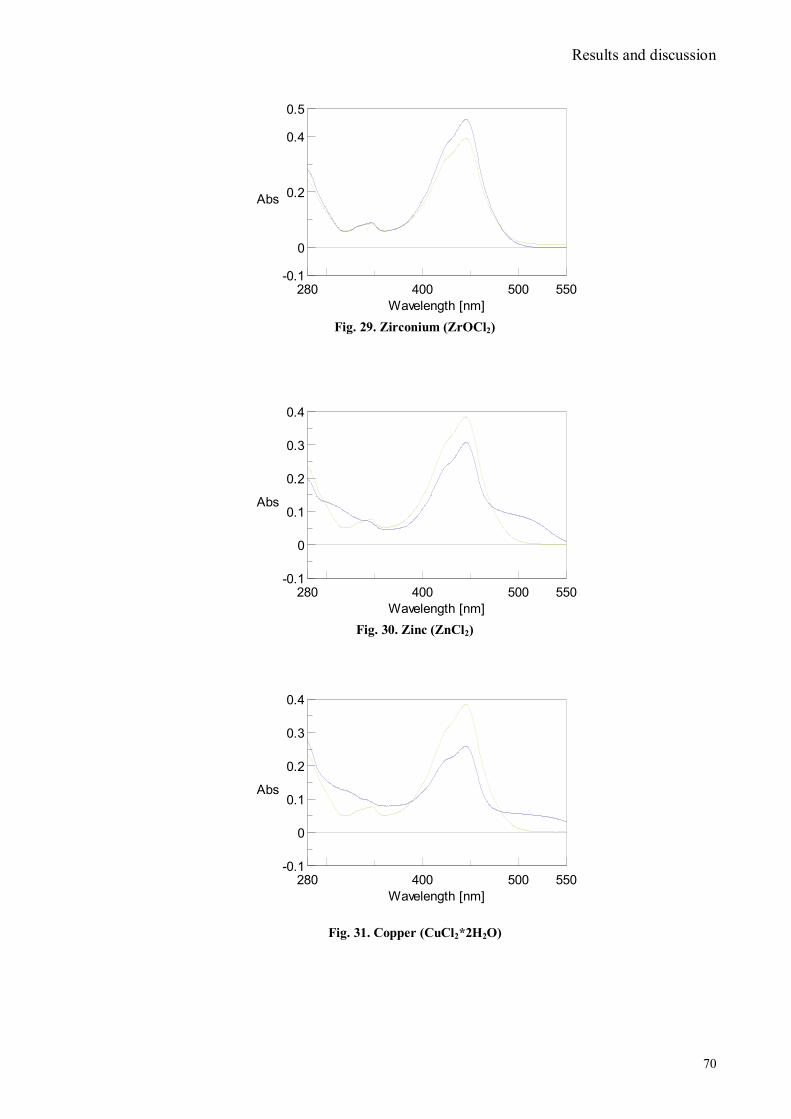
Results and discussion
70
-0.1
0.5
0
0.2
0.4
280 550400 500
Abs
Wavelength [nm]
Fig. 29. Zirconium (ZrOCl2)
-0.1
0.4
0
0.1
0.2
0.3
280 550400 500
Abs
Wavelength [nm]
Fig. 30. Zinc (ZnCl2)
-0.1
0.4
0
0.1
0.2
0.3
280 550400 500
Abs
Wavelength [nm]
Fig. 31. Copper (CuCl2*2H2O)
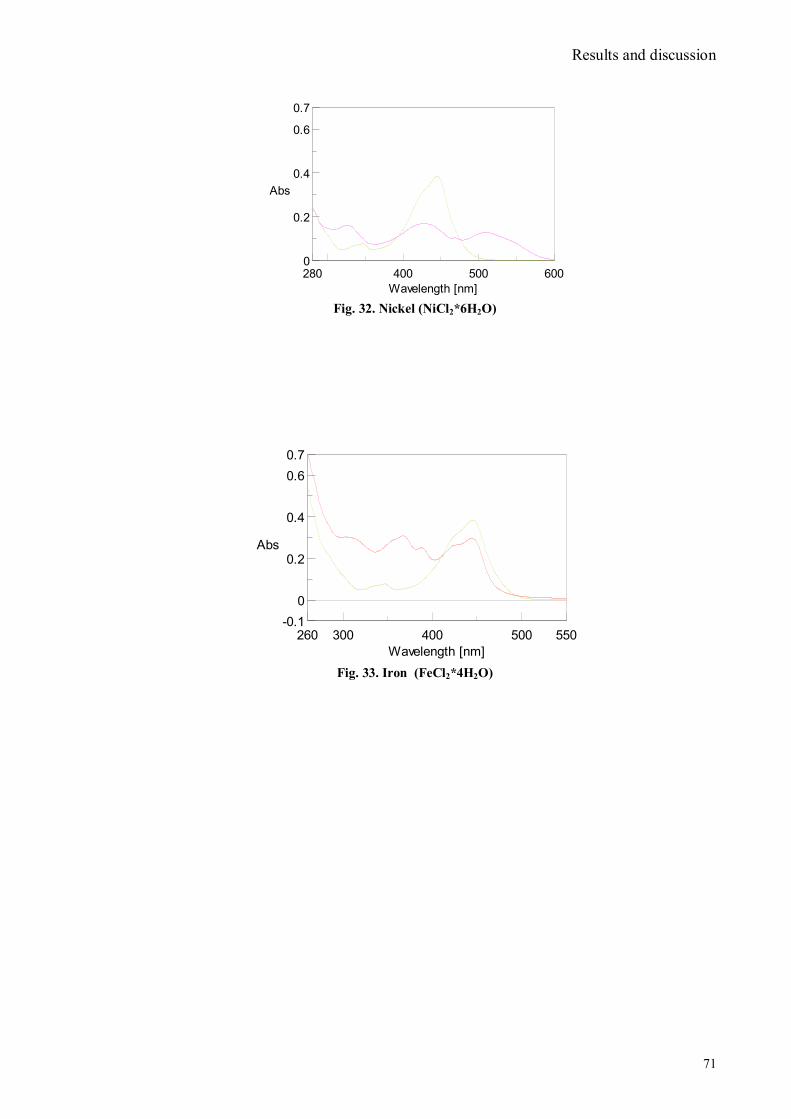
Results and discussion
71
0
0.7
0.2
0.4
0.6
280 600400 500
Abs
Wavelength [nm]
Fig. 32. Nickel (NiCl2*6H2O)
-0.1
0.7
0
0.2
0.4
0.6
260 550300 400 500
Abs
Wavelength [nm]
Fig. 33. Iron (FeCl2*4H2O)
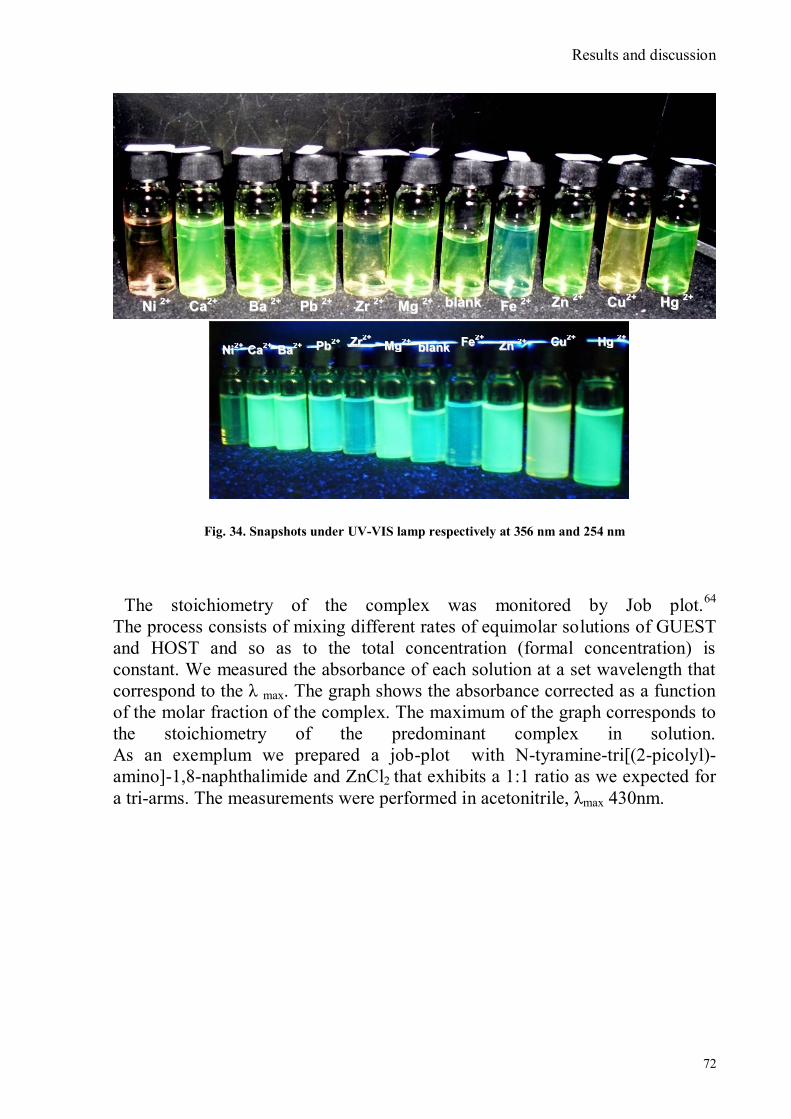
Results and discussion
72
Fig. 34. Snapshots under UV-VIS lamp respectively at 356 nm and 254 nm
The stoichiometry of the complex was monitored by Job plot.64
The process consists of mixing different rates of equimolar solutions of GUEST
and HOST and so as to the total concentration (formal concentration) is
constant. We measured the absorbance of each solution at a set wavelength that
correspond to the λ max. The graph shows the absorbance corrected as a function
of the molar fraction of the complex. The maximum of the graph corresponds to
the stoichiometry of the predominant complex in solution.
As an exemplum we prepared a job-plot with N-tyramine-tri[(2-picolyl)-
amino]-1,8-naphthalimide and ZnCl2 that exhibits a 1:1 ratio as we expected for
a tri-arms. The measurements were performed in acetonitrile, λmax 430nm.
CCuu22++
BBllaannkk CCuu22++
bbllaannkk
NNii 22++
NNii22++
FFee 22++
FFee22++
ZZnn 22++
ZZnn 22++
MMgg 22++
MMgg22++
HHgg 22++
HHgg 22++
BBaa 22++
BBaa22++
bbllaannkk ZZrr 22++
ZZrr22++
PPbb 22++
PPbb22++
CCaa22++
CCaa22++
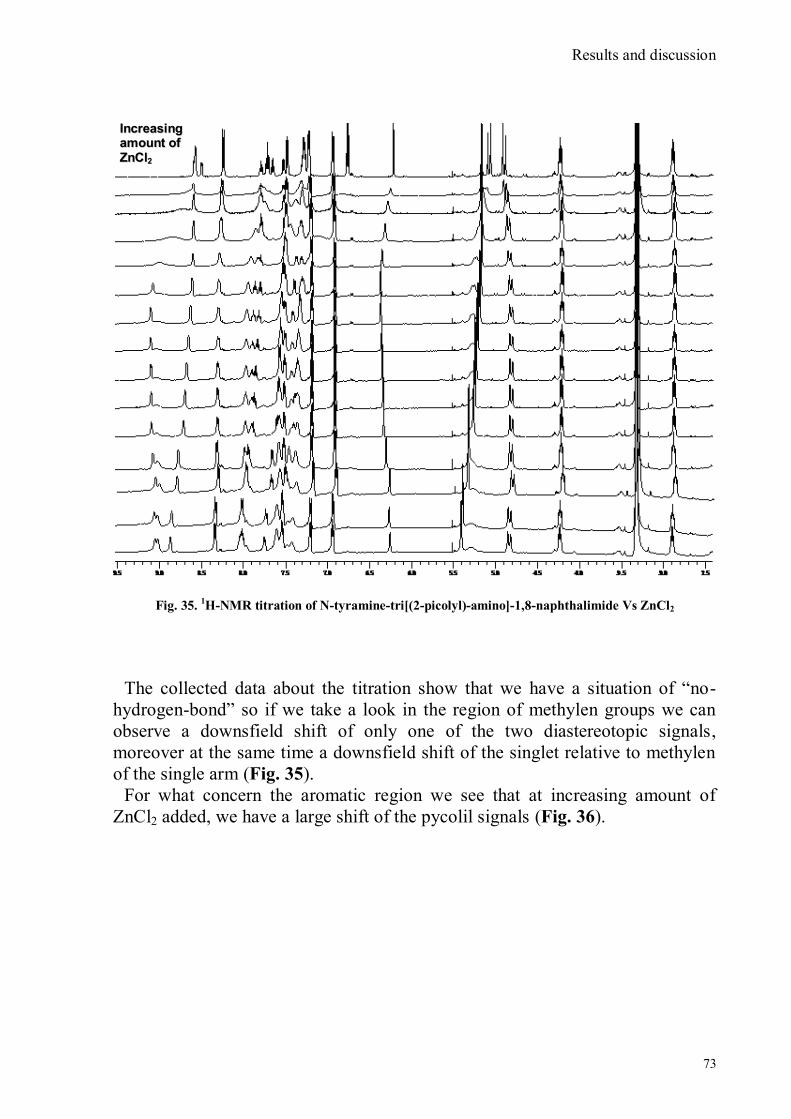
Results and discussion
73
Fig. 35. 1H-NMR titration of N-tyramine-tri[(2-picolyl)-amino]-1,8-naphthalimide Vs ZnCl2
The collected data about the titration show that we have a situation of “no-
hydrogen-bond” so if we take a look in the region of methylen groups we can
observe a downsfield shift of only one of the two diastereotopic signals,
moreover at the same time a downsfield shift of the singlet relative to methylen
of the single arm (Fig. 35).
For what concern the aromatic region we see that at increasing amount of
ZnCl2 added, we have a large shift of the pycolil signals (Fig. 36).
IInnccrreeaassiinngg
aammoouunntt ooff
ZZnnCCll22
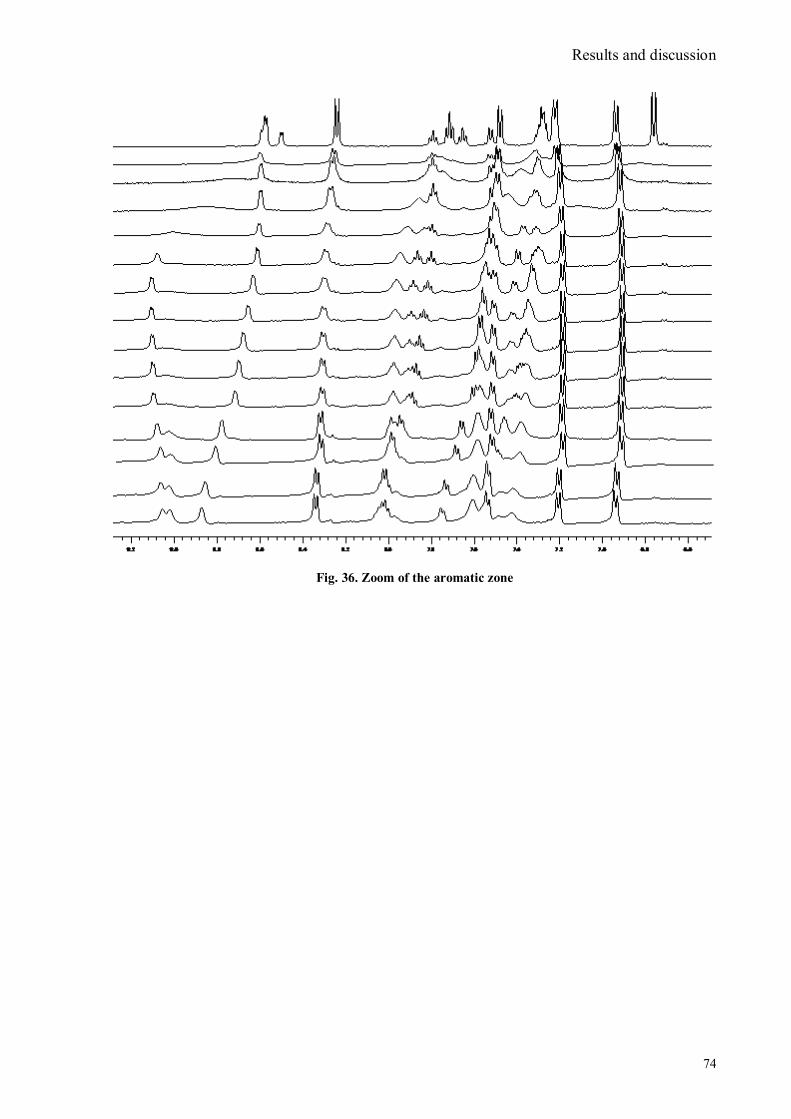
Results and discussion
74
Fig. 36. Zoom of the aromatic zone
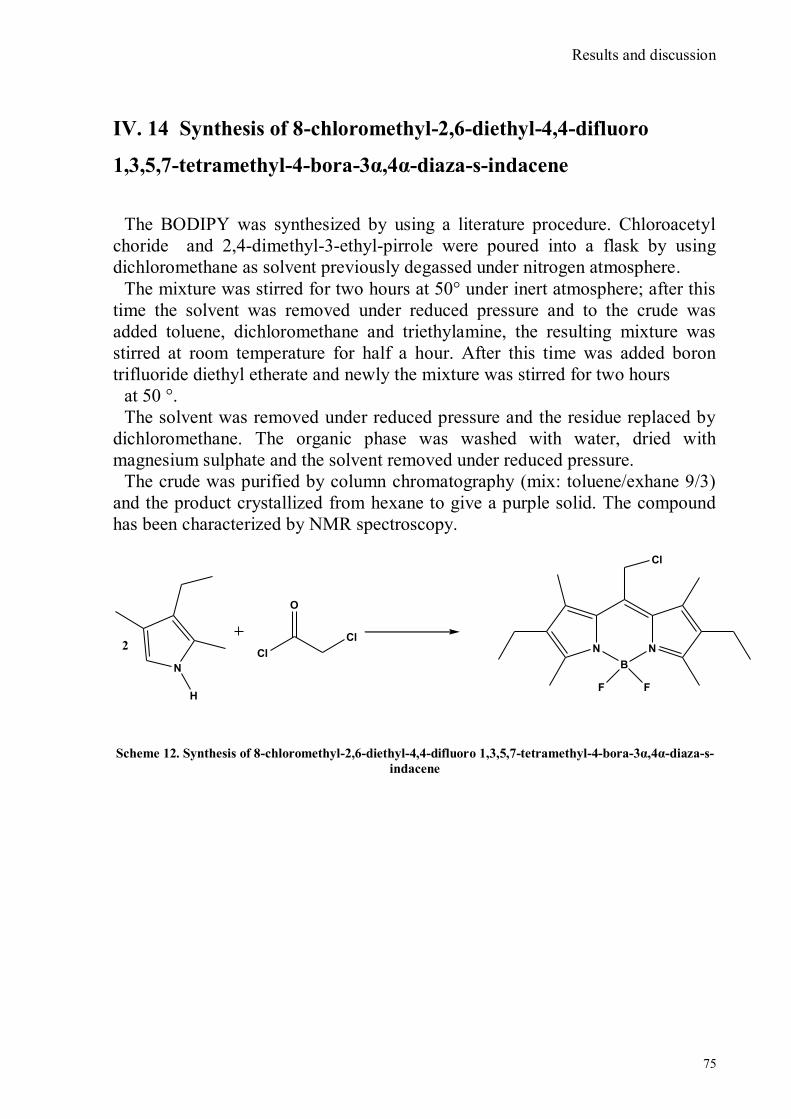
Results and discussion
75
IV. 14 Synthesis of 8-chloromethyl-2,6-diethyl-4,4-difluoro
1,3,5,7-tetramethyl-4-bora-3α,4α-diaza-s-indacene
The BODIPY was synthesized by using a literature procedure. Chloroacetyl
choride and 2,4-dimethyl-3-ethyl-pirrole were poured into a flask by using
dichloromethane as solvent previously degassed under nitrogen atmosphere.
The mixture was stirred for two hours at 50° under inert atmosphere; after this
time the solvent was removed under reduced pressure and to the crude was
added toluene, dichloromethane and triethylamine, the resulting mixture was
stirred at room temperature for half a hour. After this time was added boron
trifluoride diethyl etherate and newly the mixture was stirred for two hours
at 50 °.
The solvent was removed under reduced pressure and the residue replaced by
dichloromethane. The organic phase was washed with water, dried with
magnesium sulphate and the solvent removed under reduced pressure.
The crude was purified by column chromatography (mix: toluene/exhane 9/3)
and the product crystallized from hexane to give a purple solid. The compound
has been characterized by NMR spectroscopy.
N
H
2Cl
O
ClN
B
N
F F
Cl
Scheme 12. Synthesis of 8-chloromethyl-2,6-diethyl-4,4-difluoro 1,3,5,7-tetramethyl-4-bora-3α,4α-diaza-s-
indacene
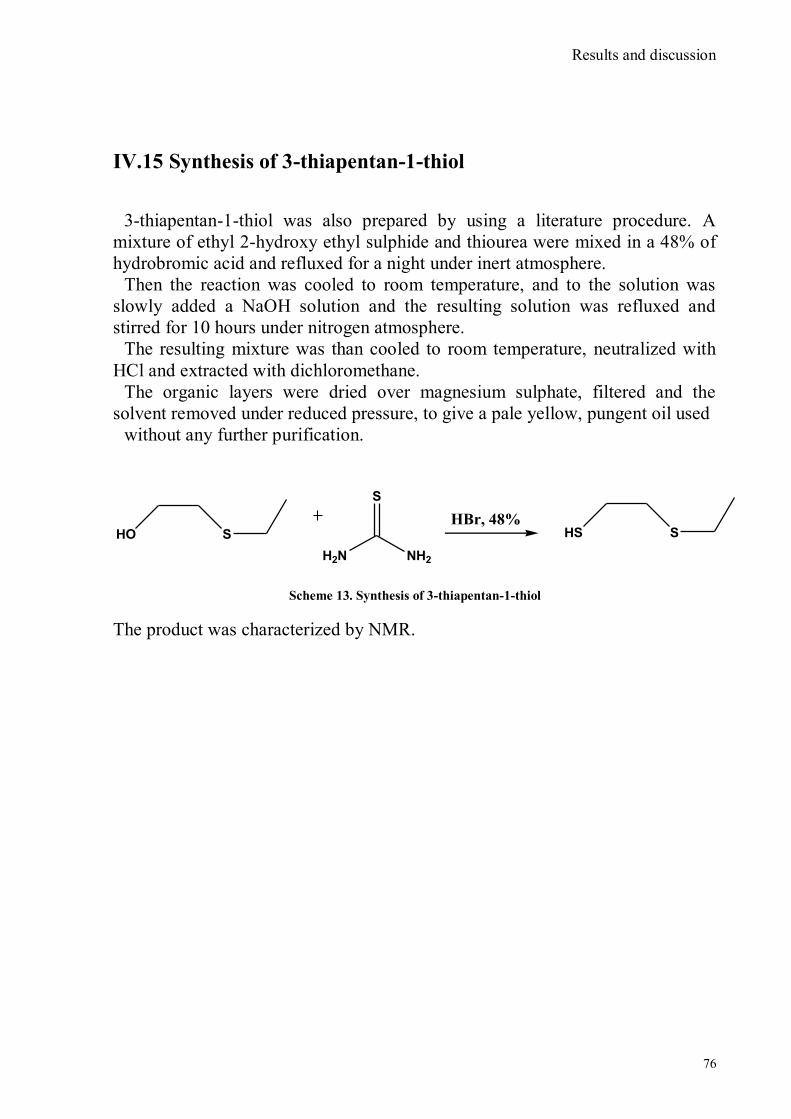
Results and discussion
76
IV.15 Synthesis of 3-thiapentan-1-thiol
3-thiapentan-1-thiol was also prepared by using a literature procedure. A
mixture of ethyl 2-hydroxy ethyl sulphide and thiourea were mixed in a 48% of
hydrobromic acid and refluxed for a night under inert atmosphere.
Then the reaction was cooled to room temperature, and to the solution was
slowly added a NaOH solution and the resulting solution was refluxed and
stirred for 10 hours under nitrogen atmosphere.
The resulting mixture was than cooled to room temperature, neutralized with
HCl and extracted with dichloromethane.
The organic layers were dried over magnesium sulphate, filtered and the
solvent removed under reduced pressure, to give a pale yellow, pungent oil used
without any further purification.
SHO
H2N NH2
S
SHSHBr, 48%
Scheme 13. Synthesis of 3-thiapentan-1-thiol
The product was characterized by NMR.
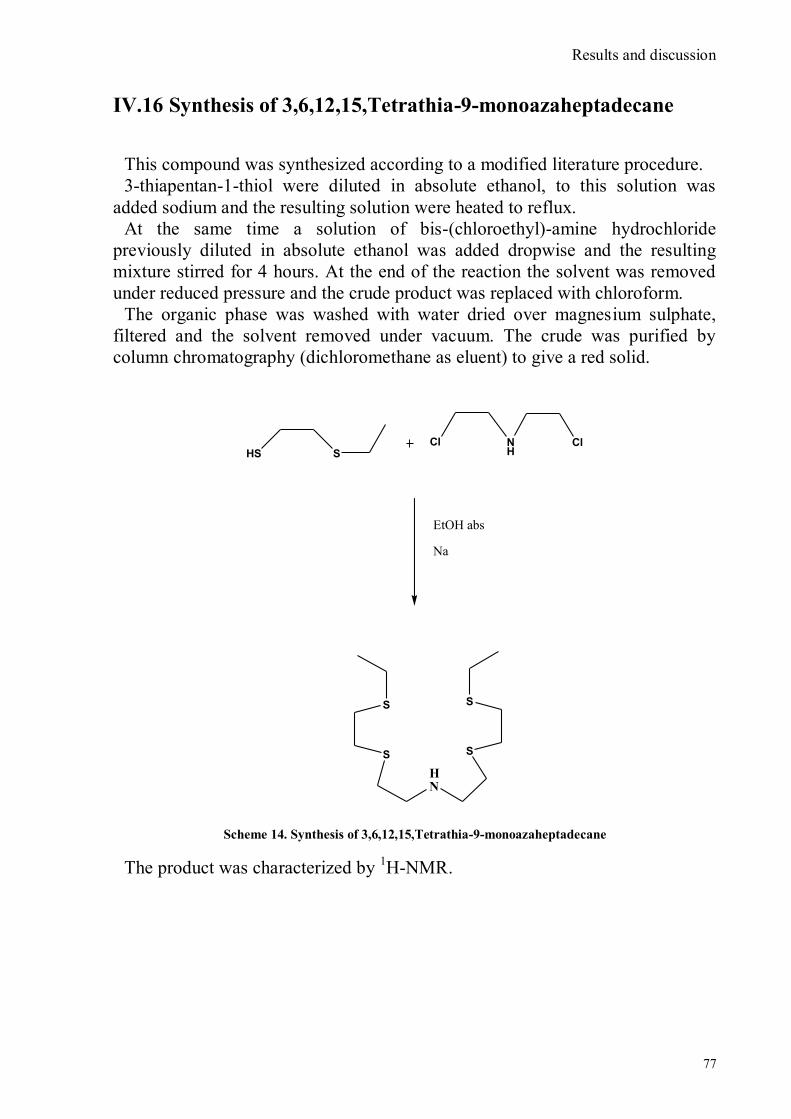
Results and discussion
77
IV.16 Synthesis of 3,6,12,15,Tetrathia-9-monoazaheptadecane
This compound was synthesized according to a modified literature procedure.
3-thiapentan-1-thiol were diluted in absolute ethanol, to this solution was
added sodium and the resulting solution were heated to reflux.
At the same time a solution of bis-(chloroethyl)-amine hydrochloride
previously diluted in absolute ethanol was added dropwise and the resulting
mixture stirred for 4 hours. At the end of the reaction the solvent was removed
under reduced pressure and the crude product was replaced with chloroform.
The organic phase was washed with water dried over magnesium sulphate,
filtered and the solvent removed under vacuum. The crude was purified by
column chromatography (dichloromethane as eluent) to give a red solid.
SHSNH
ClCl
EtOH abs
Na
HN
SS
S S
Scheme 14. Synthesis of 3,6,12,15,Tetrathia-9-monoazaheptadecane
The product was characterized by 1H-NMR.
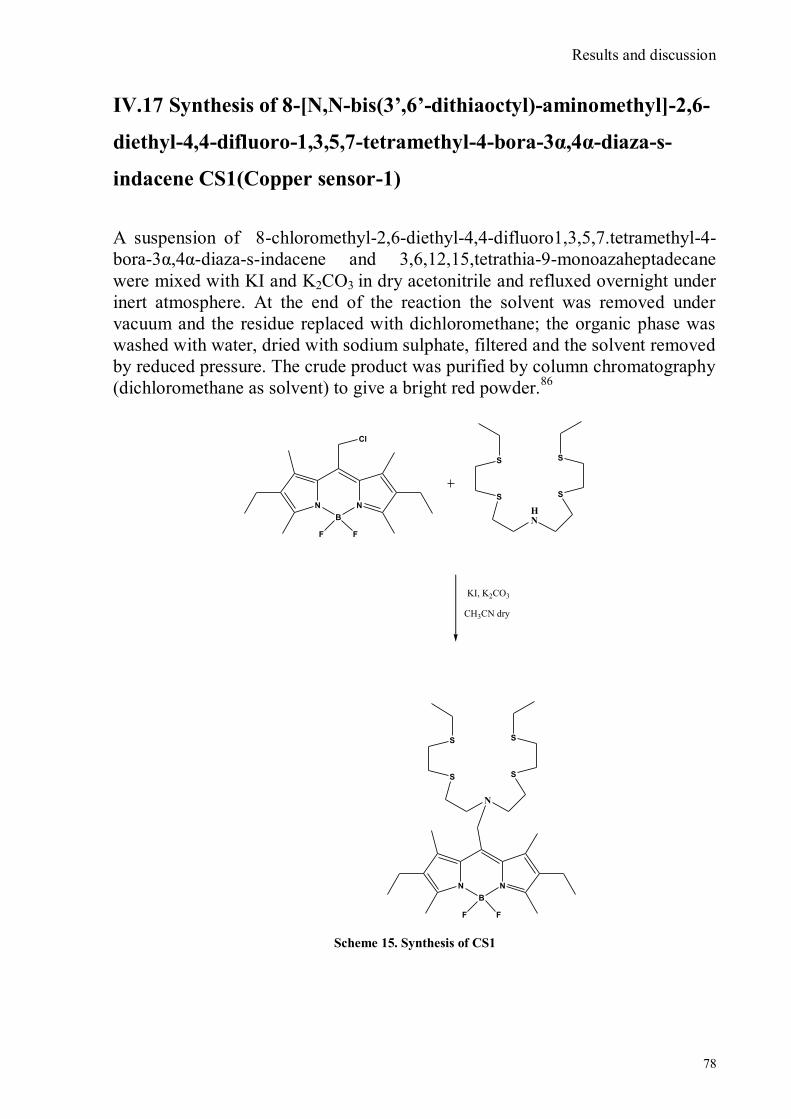
Results and discussion
78
IV.17 Synthesis of 8-[N,N-bis(3’,6’-dithiaoctyl)-aminomethyl]-2,6-
diethyl-4,4-difluoro-1,3,5,7-tetramethyl-4-bora-3α,4α-diaza-s-
indacene CS1(Copper sensor-1)
A suspension of 8-chloromethyl-2,6-diethyl-4,4-difluoro1,3,5,7.tetramethyl-4-
bora-3α,4α-diaza-s-indacene and 3,6,12,15,tetrathia-9-monoazaheptadecane
were mixed with KI and K2CO3 in dry acetonitrile and refluxed overnight under
inert atmosphere. At the end of the reaction the solvent was removed under
vacuum and the residue replaced with dichloromethane; the organic phase was
washed with water, dried with sodium sulphate, filtered and the solvent removed
by reduced pressure. The crude product was purified by column chromatography
(dichloromethane as solvent) to give a bright red powder.86
N
B
N
F F
Cl
HN
SS
S S
KI, K2CO3
CH3CN dry
N
B
N
F F
N
SS
S S
Scheme 15. Synthesis of CS1
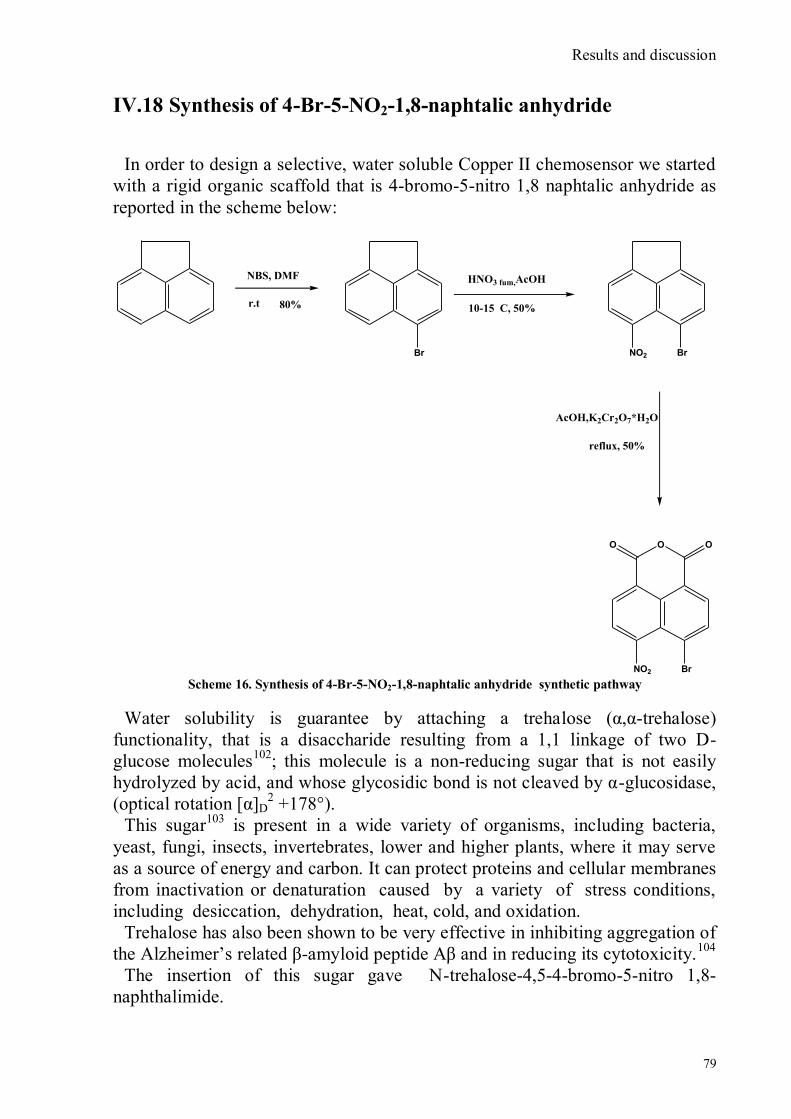
Results and discussion
79
IV.18 Synthesis of 4-Br-5-NO2-1,8-naphtalic anhydride
In order to design a selective, water soluble Copper II chemosensor we started
with a rigid organic scaffold that is 4-bromo-5-nitro 1,8 naphtalic anhydride as
reported in the scheme below:
NBS, DMF
r.t 80%
Br
HNO3 fum,AcOH
10-15 C, 50%
BrNO2
AcOH,K2Cr2O7*H2O
reflux, 50%
BrNO2
O OO
Scheme 16. Synthesis of 4-Br-5-NO2-1,8-naphtalic anhydride synthetic pathway
Water solubility is guarantee by attaching a trehalose (α,α-trehalose)
functionality, that is a disaccharide resulting from a 1,1 linkage of two D-
glucose molecules102
; this molecule is a non-reducing sugar that is not easily
hydrolyzed by acid, and whose glycosidic bond is not cleaved by α-glucosidase,
(optical rotation [α]D2 +178°).
This sugar103
is present in a wide variety of organisms, including bacteria,
yeast, fungi, insects, invertebrates, lower and higher plants, where it may serve
as a source of energy and carbon. It can protect proteins and cellular membranes
from inactivation or denaturation caused by a variety of stress conditions,
including desiccation, dehydration, heat, cold, and oxidation.
Trehalose has also been shown to be very effective in inhibiting aggregation of
the Alzheimer‟s related β-amyloid peptide Aβ and in reducing its cytotoxicity.104
The insertion of this sugar gave N-trehalose-4,5-4-bromo-5-nitro 1,8-
naphthalimide.

Results and discussion
80
O
HO
HO
OH
OH
O
OH
OH
O
HO
BrNO2
N OO
Then the insertion of two units of picolyl amine in 4,5 position permit the
formation of the new chemosensor N-trehalose-4,5-di[2(picolyl)amino]1,8
naphtalimide.
O
HO
HO
OH
OH
O
OH
OH
O
HO
NHNH
N OO
NN
Scheme 17. N-trehalose-4,5-di[2(picolyl)amino]1,8 naphtalimide
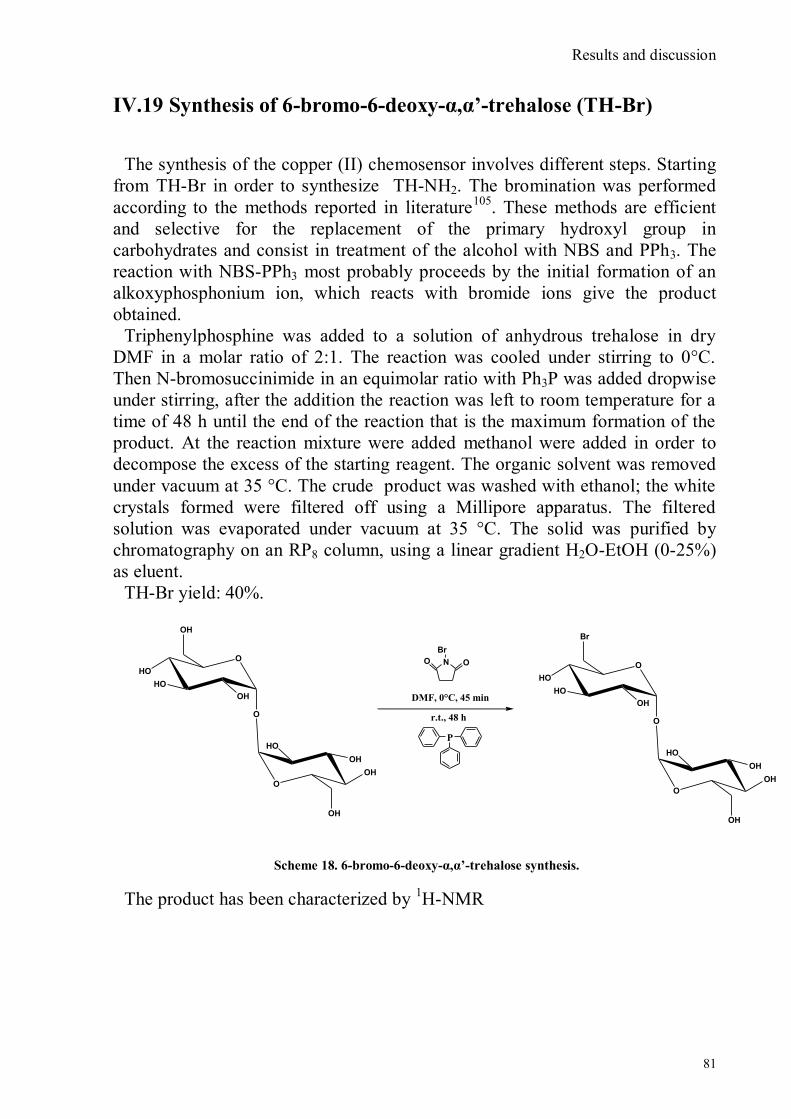
Results and discussion
81
IV.19 Synthesis of 6-bromo-6-deoxy-α,α’-trehalose (TH-Br)
The synthesis of the copper (II) chemosensor involves different steps. Starting
from TH-Br in order to synthesize TH-NH2. The bromination was performed
according to the methods reported in literature105
. These methods are efficient
and selective for the replacement of the primary hydroxyl group in
carbohydrates and consist in treatment of the alcohol with NBS and PPh3. The
reaction with NBS-PPh3 most probably proceeds by the initial formation of an
alkoxyphosphonium ion, which reacts with bromide ions give the product
obtained.
Triphenylphosphine was added to a solution of anhydrous trehalose in dry
DMF in a molar ratio of 2:1. The reaction was cooled under stirring to 0°C.
Then N-bromosuccinimide in an equimolar ratio with Ph3P was added dropwise
under stirring, after the addition the reaction was left to room temperature for a
time of 48 h until the end of the reaction that is the maximum formation of the
product. At the reaction mixture were added methanol were added in order to
decompose the excess of the starting reagent. The organic solvent was removed
under vacuum at 35 °C. The crude product was washed with ethanol; the white
crystals formed were filtered off using a Millipore apparatus. The filtered
solution was evaporated under vacuum at 35 °C. The solid was purified by
chromatography on an RP8 column, using a linear gradient H2O-EtOH (0-25%)
as eluent.
TH-Br yield: 40%.
O
HO
HO
O
OH
OH
O
OH
OH
HO
OH
P
N
Br
OO
DMF, 0°C, 45 min
r.t., 48 h
O
HO
HO
O
OH
Br
O
OH
OH
HO
OH
Scheme 18. 6-bromo-6-deoxy-α,α’-trehalose synthesis.
The product has been characterized by 1H-NMR
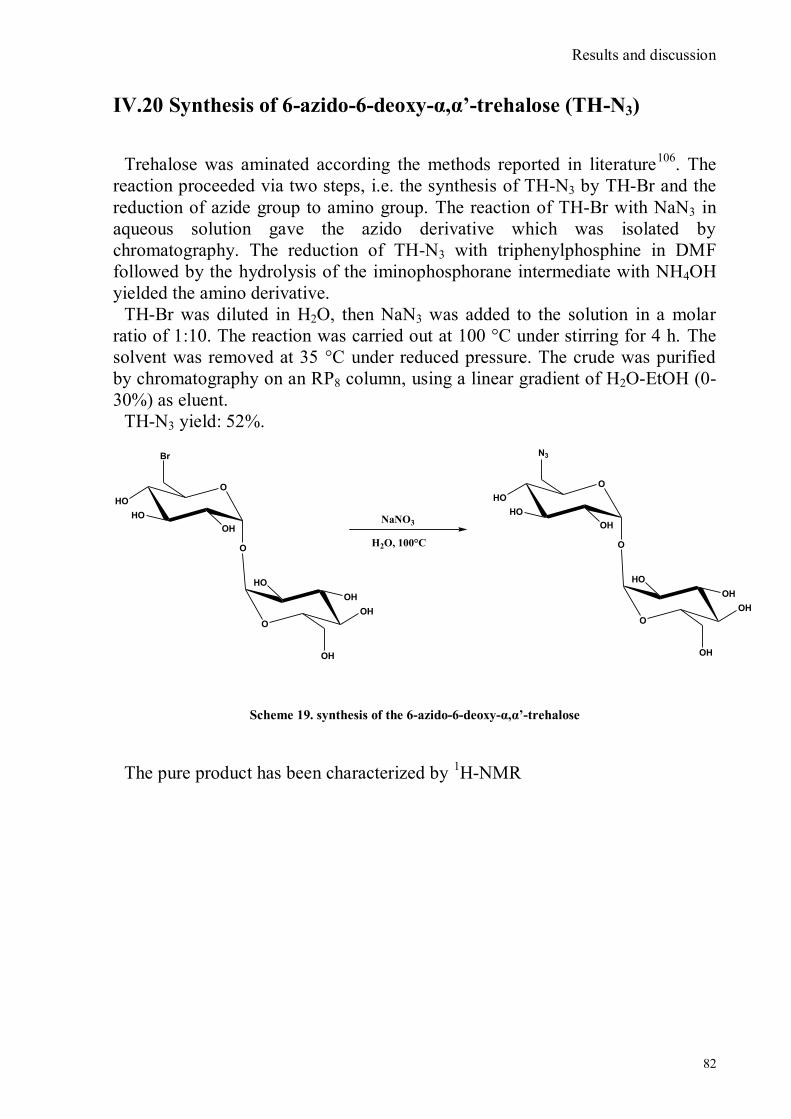
Results and discussion
82
IV.20 Synthesis of 6-azido-6-deoxy-α,α’-trehalose (TH-N3)
Trehalose was aminated according the methods reported in literature106
. The
reaction proceeded via two steps, i.e. the synthesis of TH-N3 by TH-Br and the
reduction of azide group to amino group. The reaction of TH-Br with NaN3 in
aqueous solution gave the azido derivative which was isolated by
chromatography. The reduction of TH-N3 with triphenylphosphine in DMF
followed by the hydrolysis of the iminophosphorane intermediate with NH4OH
yielded the amino derivative.
TH-Br was diluted in H2O, then NaN3 was added to the solution in a molar
ratio of 1:10. The reaction was carried out at 100 °C under stirring for 4 h. The
solvent was removed at 35 °C under reduced pressure. The crude was purified
by chromatography on an RP8 column, using a linear gradient of H2O-EtOH (0-
30%) as eluent.
TH-N3 yield: 52%.
O
HO
HO
O
OH
Br
O
OH
OH
HO
OH
O
HO
HO
O
OH
N3
O
OH
OH
HO
OH
NaNO3
H2O, 100°C
Scheme 19. synthesis of the 6-azido-6-deoxy-α,α’-trehalose
The pure product has been characterized by 1H-NMR
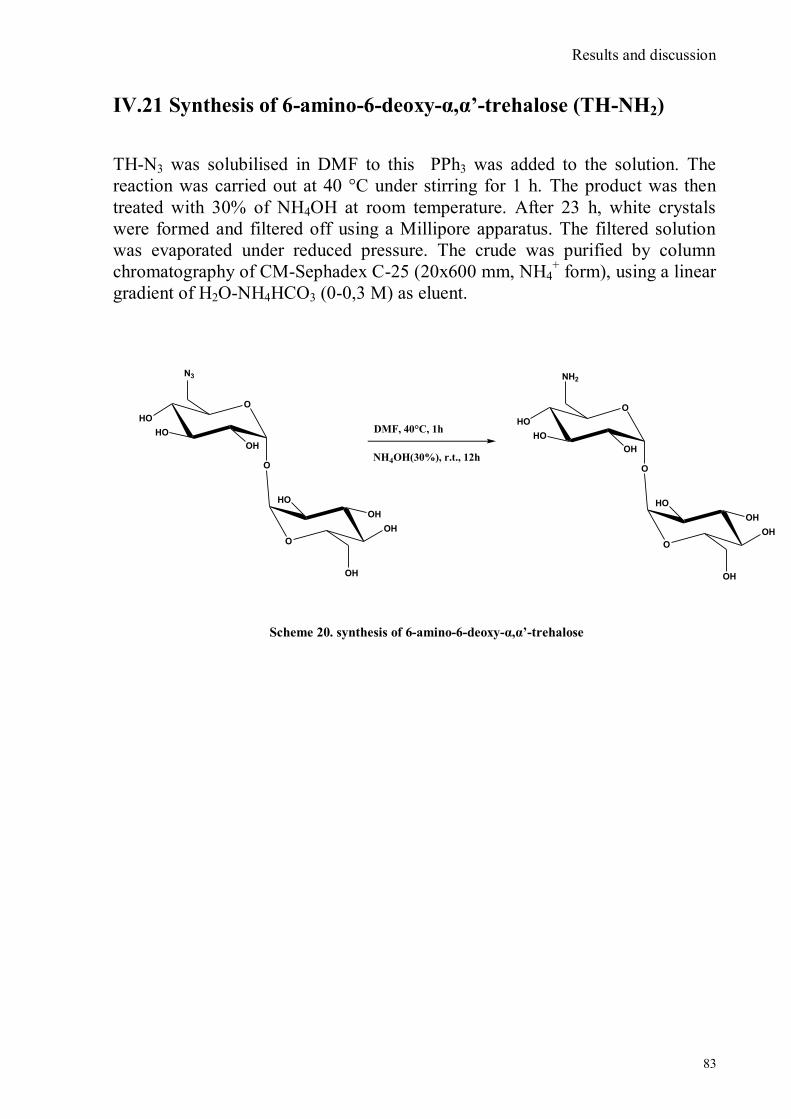
Results and discussion
83
IV.21 Synthesis of 6-amino-6-deoxy-α,α’-trehalose (TH-NH2)
TH-N3 was solubilised in DMF to this PPh3 was added to the solution. The
reaction was carried out at 40 °C under stirring for 1 h. The product was then
treated with 30% of NH4OH at room temperature. After 23 h, white crystals
were formed and filtered off using a Millipore apparatus. The filtered solution
was evaporated under reduced pressure. The crude was purified by column
chromatography of CM-Sephadex C-25 (20x600 mm, NH4+ form), using a linear
gradient of H2O-NH4HCO3 (0-0,3 M) as eluent.
O
HO
HO
O
OH
N3
O
OH
OH
HO
OH
DMF, 40°C, 1h
NH4OH(30%), r.t., 12h
O
HO
HO
O
OH
NH2
O
OH
OH
HO
OH
Scheme 20. synthesis of 6-amino-6-deoxy-α,α’-trehalose

Results and discussion
84
IV.22 Synthesis of 4-bromoacenaphtene
IV.23 Synthesis of 4-bromo-5-nitro acenaphtene
IV. 24 Synthesis of 4-bromo-5-nitro 1,8 naphtalic anhydride
See scheme 16.
IV. 25 Synthesis of N-trehalose-4-bromo-5-nitro-1,8
naphthalimide
TH-NH2 was diluted in DMF, to this solution was added a equimolar solution of
4-bromo-5-nitro-1,8-naphthalic anhydride. The reaction was carried out at 60 °C
under stirring for 5 hrs94
, at end of the reaction the solvent was removed under
reduced pressure. The crude of reaction was purified by column chromatography
on an RP8 resyn, using a linear gradient of H2O-EtOH (0-30% and 30-60%) as
eluent.
N-trehalose-4-bromo-5-nitro-1,8 naphthalimide yield: 69%.
O
HO
HO
O
OH
NH2
O
OH
OH
HO
OH
DMF, 60°C, 5h
O OO
NO2BrO
HO
HO
O
OH
O
OH
OH
HO
OH
NO O
NO2 Br
Scheme 21. Synthesis of N-trehalose-4-bromo-5-nitro-1,8 naphthalimide
The product was characterized by 1H-NMR.
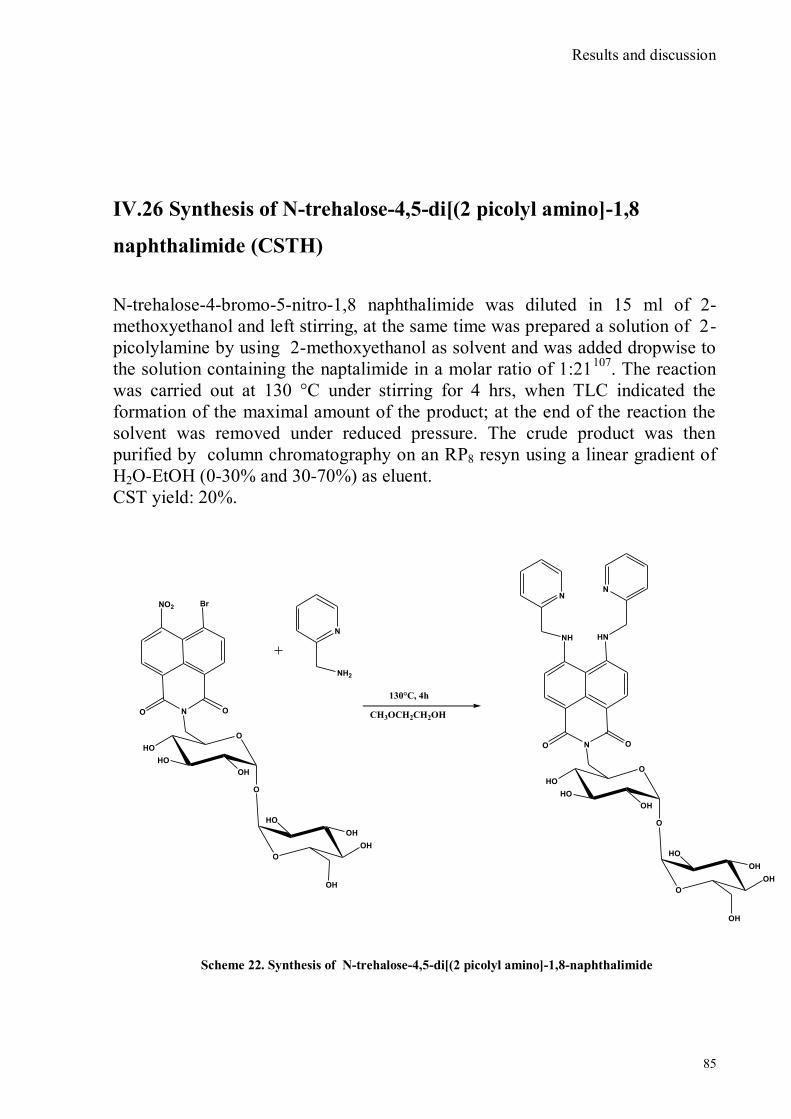
Results and discussion
85
IV.26 Synthesis of N-trehalose-4,5-di[(2 picolyl amino]-1,8
naphthalimide (CSTH)
N-trehalose-4-bromo-5-nitro-1,8 naphthalimide was diluted in 15 ml of 2-
methoxyethanol and left stirring, at the same time was prepared a solution of 2-
picolylamine by using 2-methoxyethanol as solvent and was added dropwise to
the solution containing the naptalimide in a molar ratio of 1:21107
. The reaction
was carried out at 130 °C under stirring for 4 hrs, when TLC indicated the
formation of the maximal amount of the product; at the end of the reaction the
solvent was removed under reduced pressure. The crude product was then
purified by column chromatography on an RP8 resyn using a linear gradient of
H2O-EtOH (0-30% and 30-70%) as eluent.
CST yield: 20%.
O
HO
HO
O
OH
O
OH
OH
HO
OH
NO O
NO2 Br
N
NH2
CH3OCH2CH2OH
130°C, 4h
O
HO
HO
O
OH
O
OH
OH
HO
OH
NO O
NH HN
NN
Scheme 22. Synthesis of N-trehalose-4,5-di[(2 picolyl amino]-1,8-naphthalimide
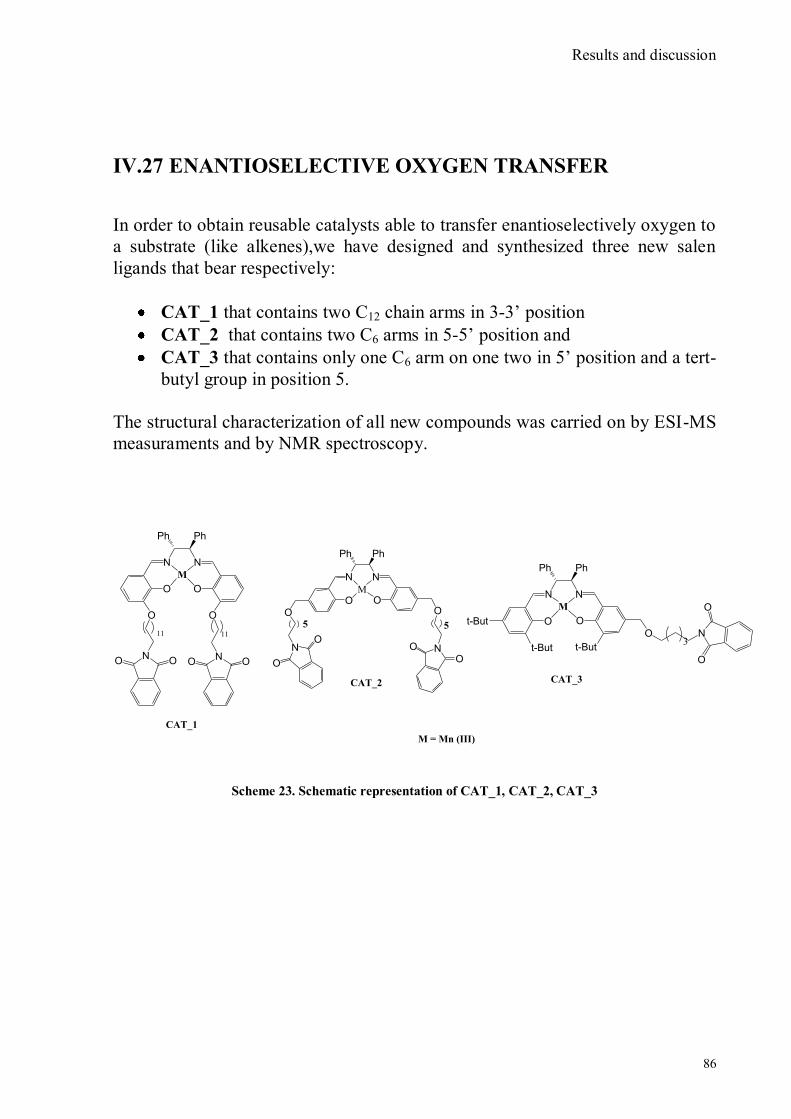
Results and discussion
86
IV.27 ENANTIOSELECTIVE OXYGEN TRANSFER
In order to obtain reusable catalysts able to transfer enantioselectively oxygen to
a substrate (like alkenes),we have designed and synthesized three new salen
ligands that bear respectively:
CAT_1 that contains two C12 chain arms in 3-3‟ position
CAT_2 that contains two C6 arms in 5-5‟ position and
CAT_3 that contains only one C6 arm on one two in 5‟ position and a tert-
butyl group in position 5.
The structural characterization of all new compounds was carried on by ESI-MS
measuraments and by NMR spectroscopy.
N N
Ph Ph
O
t-But
t-But O
t-But
O N
O
O
3
M
M = Mn (III)
CAT_3
PhPh
N N
O O
O O
NNO
O
O
O
5 5
M
CAT_2
Ph Ph
NN
O O
O O
NOO
11
NO O
11
M
CAT_1
Scheme 23. Schematic representation of CAT_1, CAT_2, CAT_3
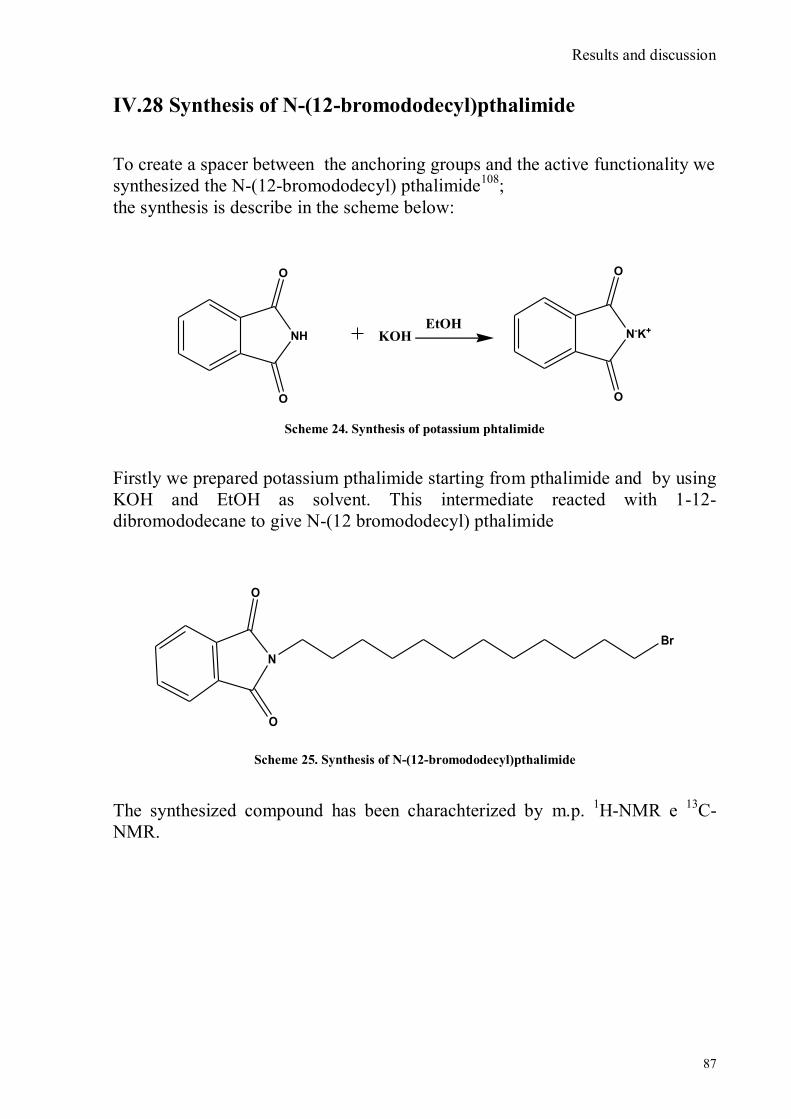
Results and discussion
87
IV.28 Synthesis of N-(12-bromododecyl)pthalimide
To create a spacer between the anchoring groups and the active functionality we
synthesized the N-(12-bromododecyl) pthalimide108
;
the synthesis is describe in the scheme below:
NH
O
O
N-K+
O
O
KOHEtOH
Scheme 24. Synthesis of potassium phtalimide
Firstly we prepared potassium pthalimide starting from pthalimide and by using
KOH and EtOH as solvent. This intermediate reacted with 1-12-
dibromododecane to give N-(12 bromododecyl) pthalimide
N
O
O
Br
Scheme 25. Synthesis of N-(12-bromododecyl)pthalimide
The synthesized compound has been charachterized by m.p. 1H-NMR e
13C-
NMR.
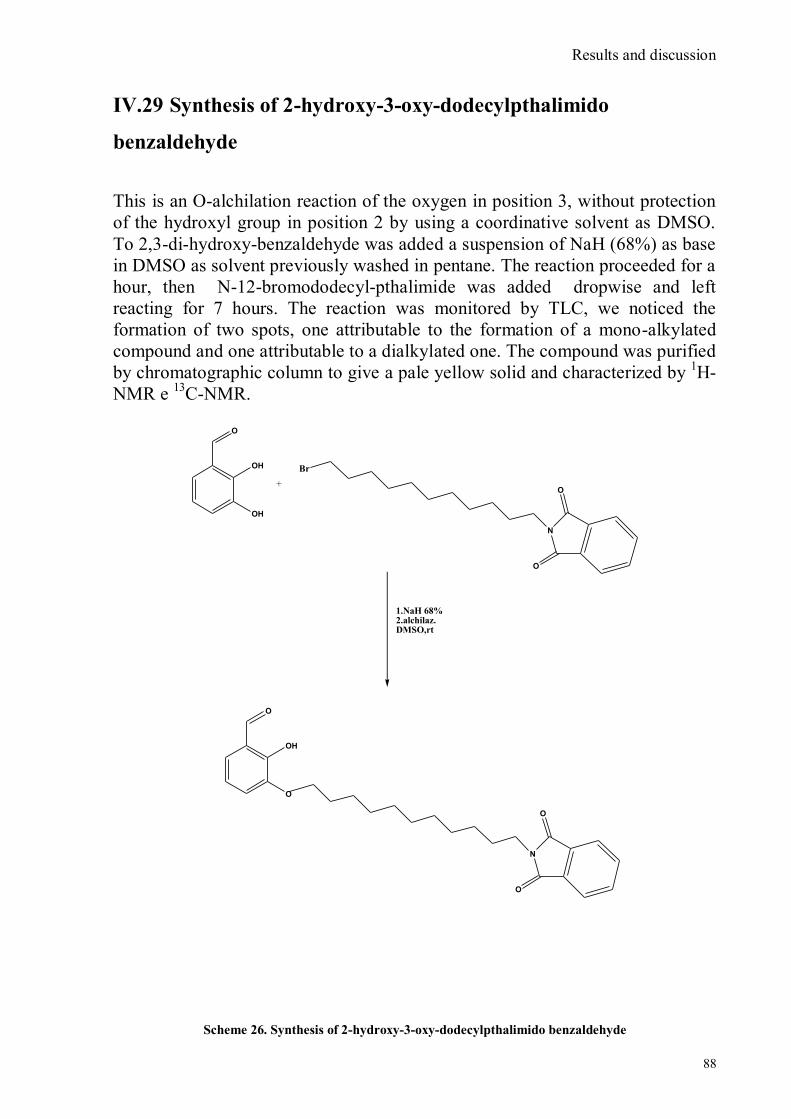
Results and discussion
88
IV.29 Synthesis of 2-hydroxy-3-oxy-dodecylpthalimido
benzaldehyde
This is an O-alchilation reaction of the oxygen in position 3, without protection
of the hydroxyl group in position 2 by using a coordinative solvent as DMSO.
To 2,3-di-hydroxy-benzaldehyde was added a suspension of NaH (68%) as base
in DMSO as solvent previously washed in pentane. The reaction proceeded for a
hour, then N-12-bromododecyl-pthalimide was added dropwise and left
reacting for 7 hours. The reaction was monitored by TLC, we noticed the
formation of two spots, one attributable to the formation of a mono-alkylated
compound and one attributable to a dialkylated one. The compound was purified
by chromatographic column to give a pale yellow solid and characterized by 1H-
NMR e 13
C-NMR.
OH
OH
O
+
Br
N
O
O
1.NaH 68%2.alchilaz.DMSO,rt
OH
O
O
N
O
O
Scheme 26. Synthesis of 2-hydroxy-3-oxy-dodecylpthalimido benzaldehyde
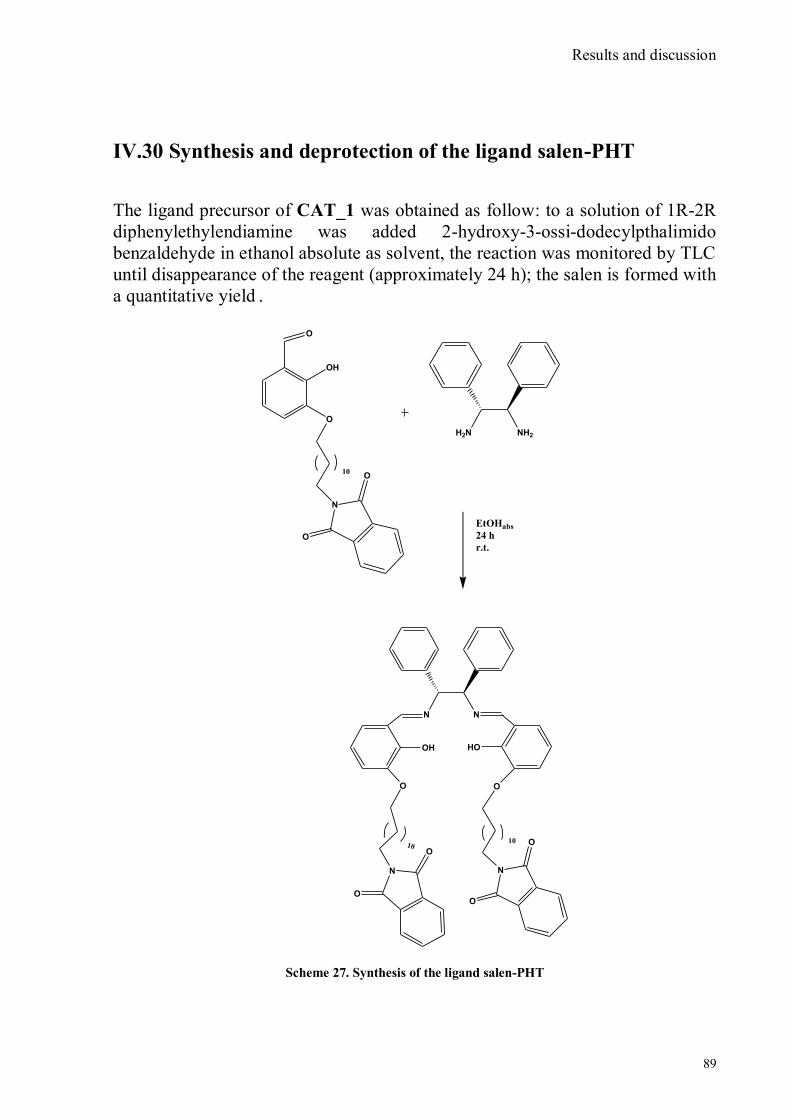
Results and discussion
89
IV.30 Synthesis and deprotection of the ligand salen-PHT
The ligand precursor of CAT_1 was obtained as follow: to a solution of 1R-2R
diphenylethylendiamine was added 2-hydroxy-3-ossi-dodecylpthalimido
benzaldehyde in ethanol absolute as solvent, the reaction was monitored by TLC
until disappearance of the reagent (approximately 24 h); the salen is formed with
a quantitative yield .
H2N NH2
O
OH
O
N
10O
O
EtOHabs
24 h
r.t.
N N
O
N
10O
O
N
10 O
O
OH HO
O
Scheme 27. Synthesis of the ligand salen-PHT
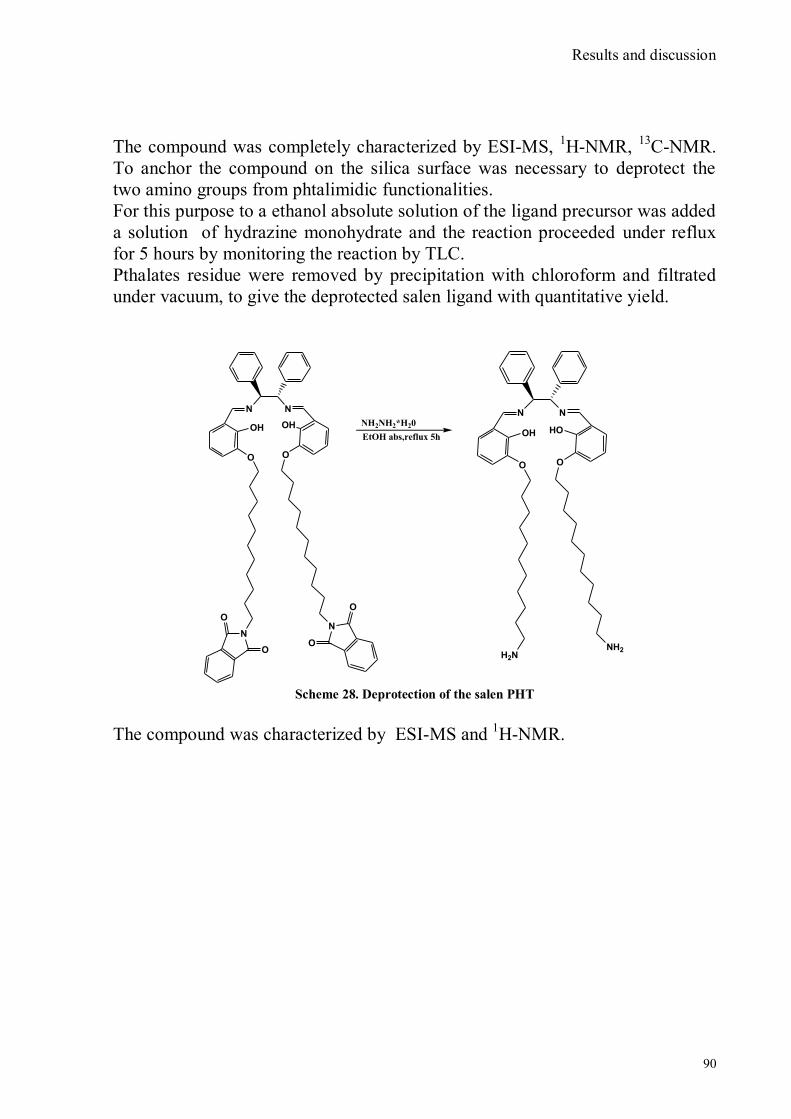
Results and discussion
90
The compound was completely characterized by ESI-MS, 1H-NMR,
13C-NMR.
To anchor the compound on the silica surface was necessary to deprotect the
two amino groups from phtalimidic functionalities.
For this purpose to a ethanol absolute solution of the ligand precursor was added
a solution of hydrazine monohydrate and the reaction proceeded under reflux
for 5 hours by monitoring the reaction by TLC.
Pthalates residue were removed by precipitation with chloroform and filtrated
under vacuum, to give the deprotected salen ligand with quantitative yield.
N N
OH HO
O O
H2NNH2
N N
OH OH
O O
N
ON
O
OO
NH2NH2*H20
EtOH abs,reflux 5h
Scheme 28. Deprotection of the salen PHT
The compound was characterized by ESI-MS and 1H-NMR.
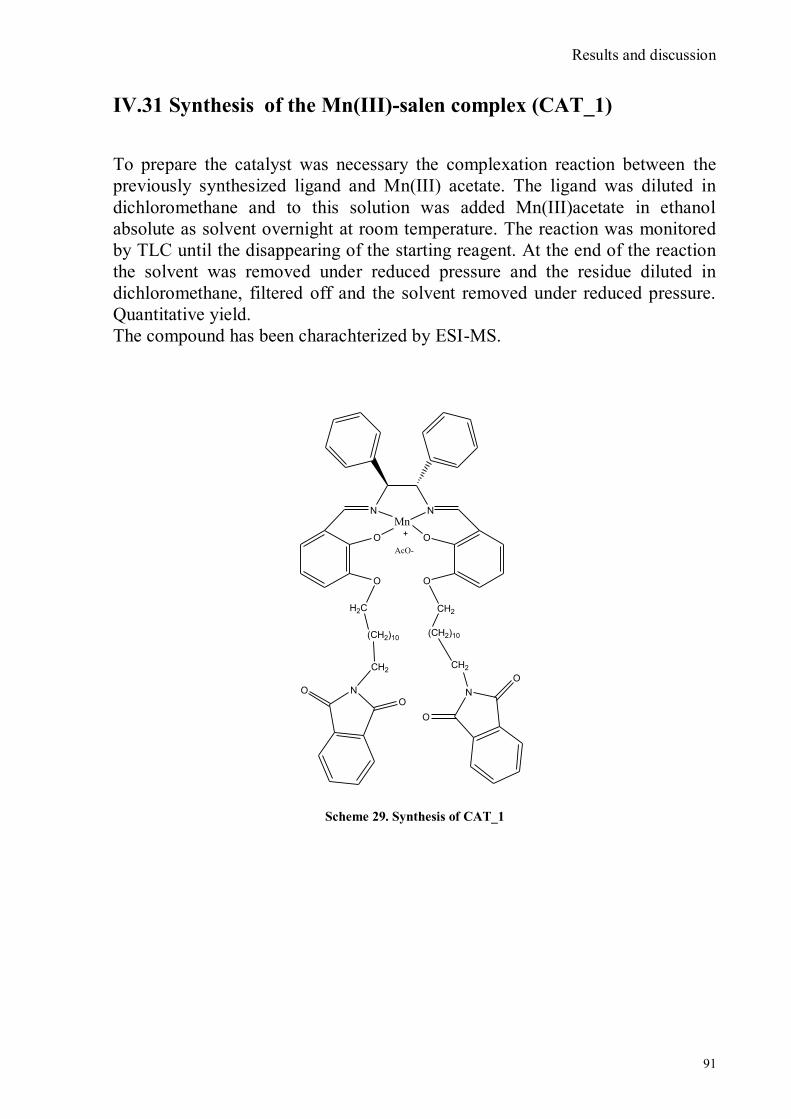
Results and discussion
91
IV.31 Synthesis of the Mn(III)-salen complex (CAT_1)
To prepare the catalyst was necessary the complexation reaction between the
previously synthesized ligand and Mn(III) acetate. The ligand was diluted in
dichloromethane and to this solution was added Mn(III)acetate in ethanol
absolute as solvent overnight at room temperature. The reaction was monitored
by TLC until the disappearing of the starting reagent. At the end of the reaction
the solvent was removed under reduced pressure and the residue diluted in
dichloromethane, filtered off and the solvent removed under reduced pressure.
Quantitative yield.
The compound has been charachterized by ESI-MS.
N N
O O
O O
H2C CH2
(CH2)10(CH2)10
CH2CH2
NN
Mn
O
O
O
O
AcO-
Scheme 29. Synthesis of CAT_1

Results and discussion
92
IV.32 Synthesis of 3-tert-butyl-2-hydroxybenzaldehyde
To synthesized 3-tert-butyl-2-hydroxybenzaldehyde was used as precursor 2-
tert-butylphenol through a Gross phormylation. These reaction proceeded in an
ice bath for 1 hour with di- chloro-methyl methyl ether as coordinating agent
and tin tetrachloride as catalyst and chloroform as solvent to give the product of
our interest.109
OH
1.Cl2CHOCH32.CHCl33.SnCl4
OH
O
Scheme 30. Synthesis of 3-tert-butyl-2-hydroxybenzaldehyde
The aldehyde obtained was purified by column chromatography ( exane / ethyl
acetate as eluent), and characterized by 1H-NMR spectroscopy.
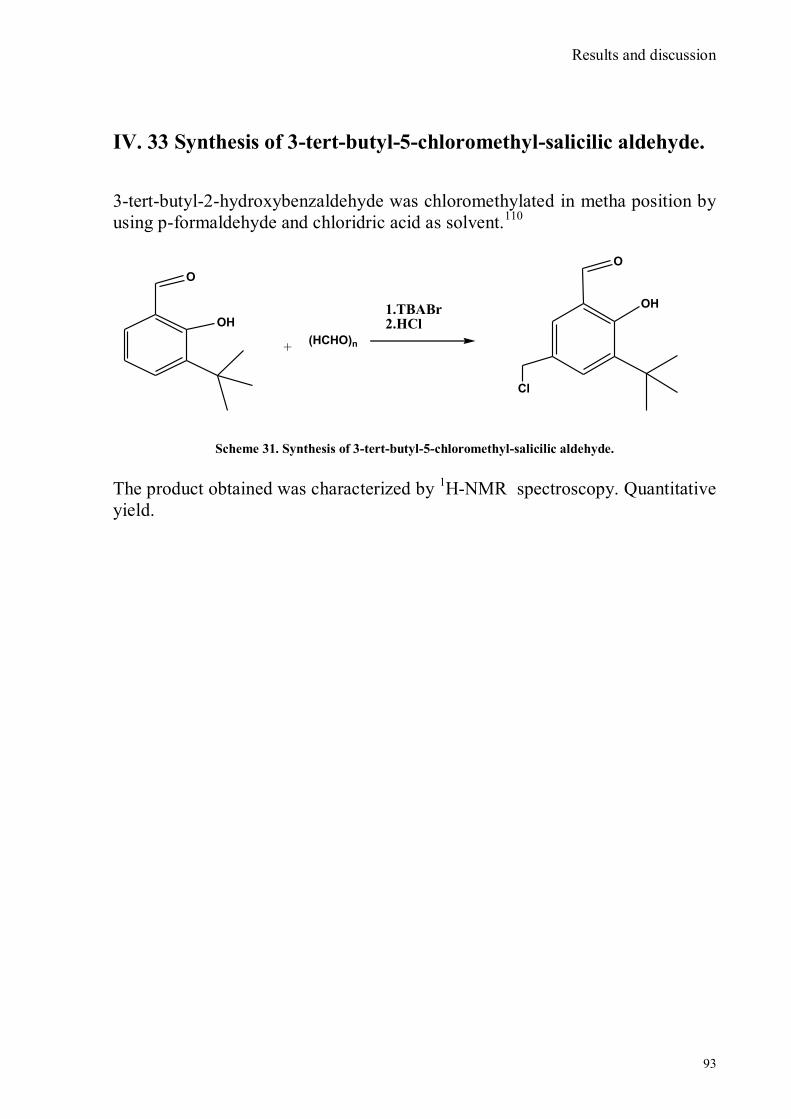
Results and discussion
93
IV. 33 Synthesis of 3-tert-butyl-5-chloromethyl-salicilic aldehyde.
3-tert-butyl-2-hydroxybenzaldehyde was chloromethylated in metha position by
using p-formaldehyde and chloridric acid as solvent.110
Scheme 31. Synthesis of 3-tert-butyl-5-chloromethyl-salicilic aldehyde.
The product obtained was characterized by 1H-NMR spectroscopy. Quantitative
yield.
OH
+
O
1.TBABr2.HCl
OH
O
(HCHO)n
Cl

Results and discussion
94
IV.34 Synthesis of hexanol-phtalimide
Hexanol-pthalimide was synthesized starting from 6-amino-1-hexanol and
phtalic anhydride under microwave condition by optimizing a literature
procedure111
.
No solvent was needed for this reaction, the mw parameters chosen were the
following:
Temperature: 160°C
Time: 5 minutes
Power: 300W
O
O
O
H2N-(CH2)6-OH N
O
O
OH
Scheme 32. Synthesis of hexanol-phtalimide
The product was fully characterized by 1H-NMR spectroscopy.
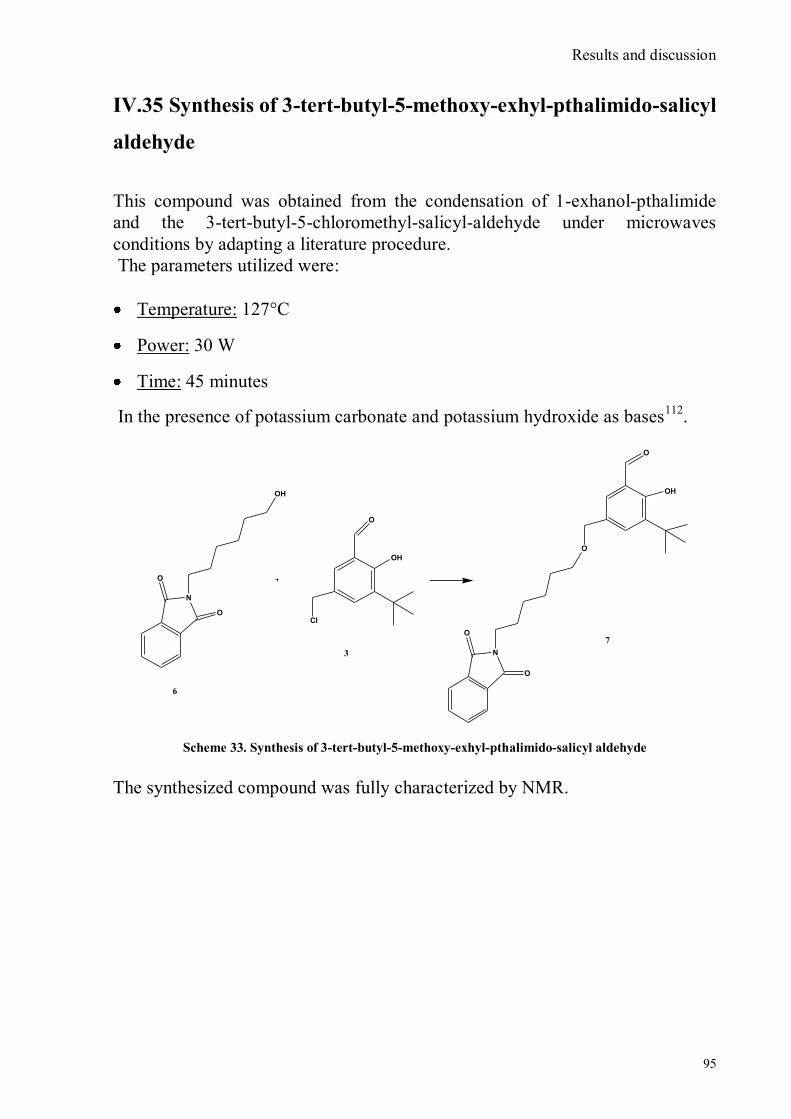
Results and discussion
95
IV.35 Synthesis of 3-tert-butyl-5-methoxy-exhyl-pthalimido-salicyl
aldehyde
This compound was obtained from the condensation of 1-exhanol-pthalimide
and the 3-tert-butyl-5-chloromethyl-salicyl-aldehyde under microwaves
conditions by adapting a literature procedure.
The parameters utilized were:
Temperature: 127°C
Power: 30 W
Time: 45 minutes
In the presence of potassium carbonate and potassium hydroxide as bases112
.
N
OH
O
O
O
OH
Cl
N
O
O
O
O
OH
6
3
7
Scheme 33. Synthesis of 3-tert-butyl-5-methoxy-exhyl-pthalimido-salicyl aldehyde
The synthesized compound was fully characterized by NMR.
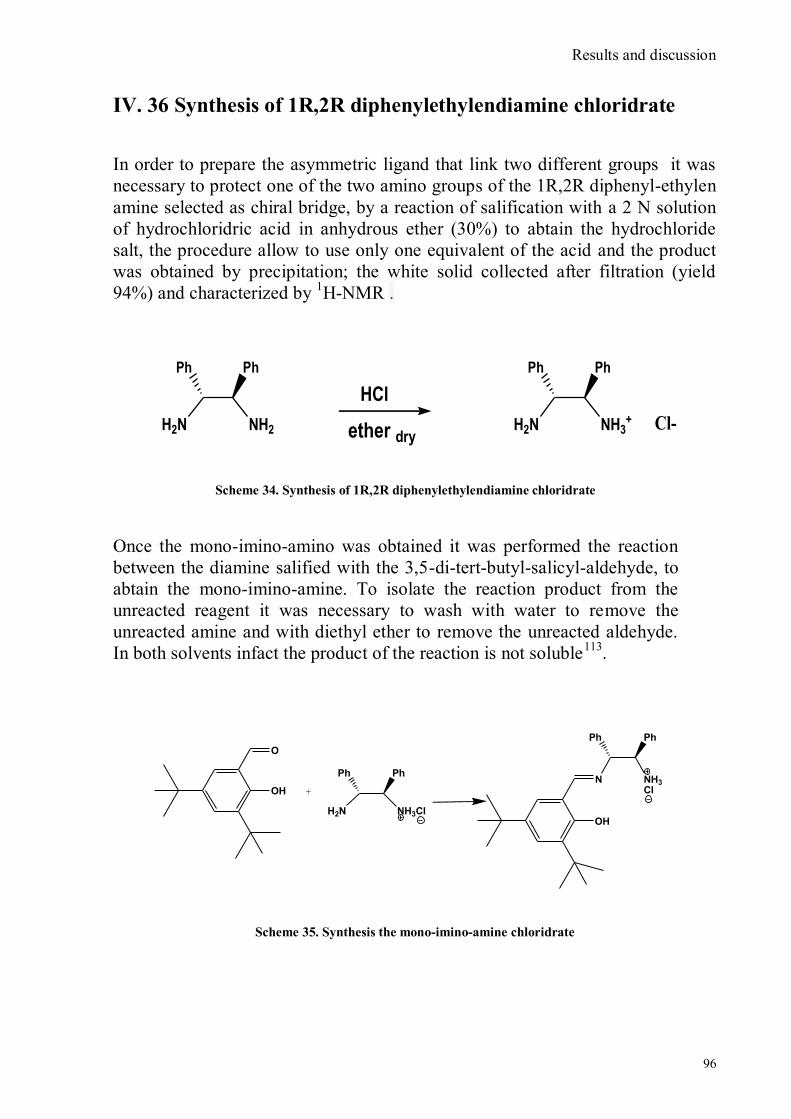
Results and discussion
96
IV. 36 Synthesis of 1R,2R diphenylethylendiamine chloridrate
In order to prepare the asymmetric ligand that link two different groups it was
necessary to protect one of the two amino groups of the 1R,2R diphenyl-ethylen
amine selected as chiral bridge, by a reaction of salification with a 2 N solution
of hydrochloridric acid in anhydrous ether (30%) to abtain the hydrochloride
salt, the procedure allow to use only one equivalent of the acid and the product
was obtained by precipitation; the white solid collected after filtration (yield
94%) and characterized by 1H-NMR .
H2N NH3+
Ph Ph
ether dryH2N NH2
Ph Ph
HCl
Cl-
Scheme 34. Synthesis of 1R,2R diphenylethylendiamine chloridrate
Once the mono-imino-amino was obtained it was performed the reaction
between the diamine salified with the 3,5-di-tert-butyl-salicyl-aldehyde, to
abtain the mono-imino-amine. To isolate the reaction product from the
unreacted reagent it was necessary to wash with water to remove the
unreacted amine and with diethyl ether to remove the unreacted aldehyde.
In both solvents infact the product of the reaction is not soluble113
.
H2N NH3Cl
Ph Ph
O
OH +
N
OH
NH3Cl
Ph Ph
Scheme 35. Synthesis the mono-imino-amine chloridrate
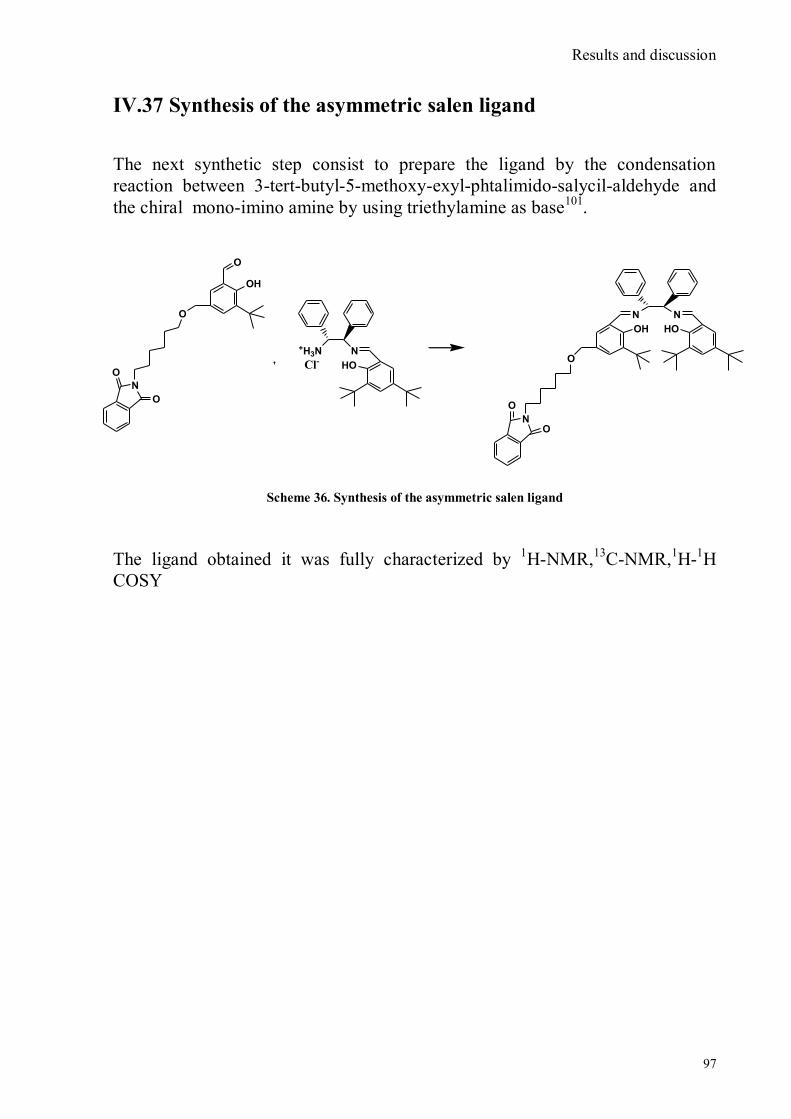
Results and discussion
97
N
O
O
O
O
OH
+H3N N
HOCl-
N
O
O
O
N
OH
N
HO
IV.37 Synthesis of the asymmetric salen ligand
The next synthetic step consist to prepare the ligand by the condensation
reaction between 3-tert-butyl-5-methoxy-exyl-phtalimido-salycil-aldehyde and
the chiral mono-imino amine by using triethylamine as base101
.
Scheme 36. Synthesis of the asymmetric salen ligand
The ligand obtained it was fully characterized by 1H-NMR,
13C-NMR,
1H-
1H
COSY
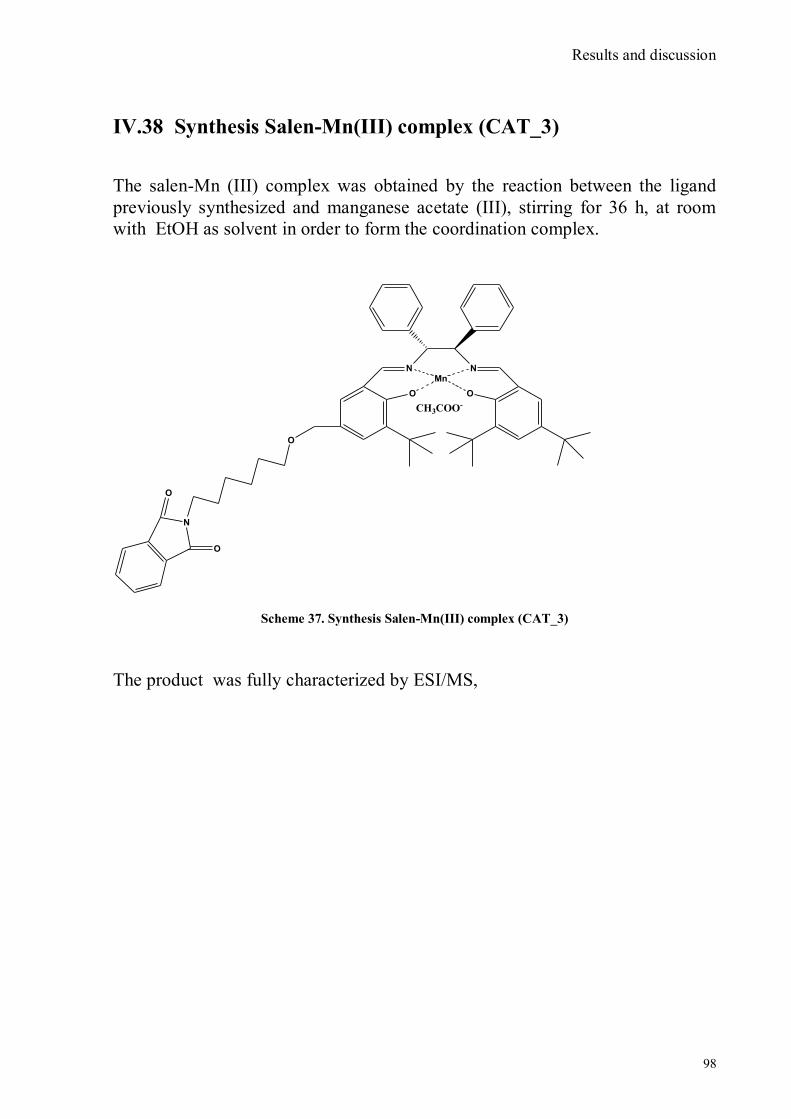
Results and discussion
98
IV.38 Synthesis Salen-Mn(III) complex (CAT_3)
The salen-Mn (III) complex was obtained by the reaction between the ligand
previously synthesized and manganese acetate (III), stirring for 36 h, at room
with EtOH as solvent in order to form the coordination complex.
N
O
O
O
O
N N
O
Mn
CH3COO-
Scheme 37. Synthesis Salen-Mn(III) complex (CAT_3)
The product was fully characterized by ESI/MS,
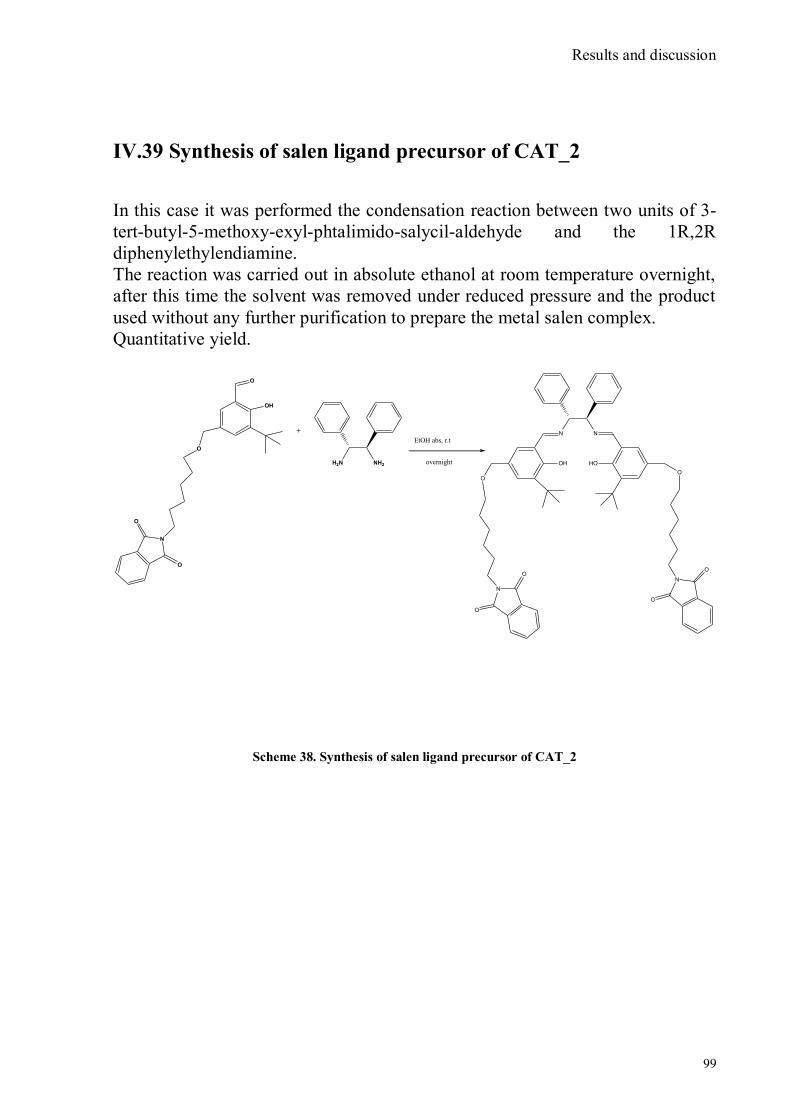
Results and discussion
99
IV.39 Synthesis of salen ligand precursor of CAT_2
In this case it was performed the condensation reaction between two units of 3-
tert-butyl-5-methoxy-exyl-phtalimido-salycil-aldehyde and the 1R,2R
diphenylethylendiamine.
The reaction was carried out in absolute ethanol at room temperature overnight,
after this time the solvent was removed under reduced pressure and the product
used without any further purification to prepare the metal salen complex.
Quantitative yield.
O
OH
O
N
O
O
NH2H2N
EtOH abs, r.t
overnight
NN
OH HO
OO
N
NO
O
O
O
Scheme 38. Synthesis of salen ligand precursor of CAT_2
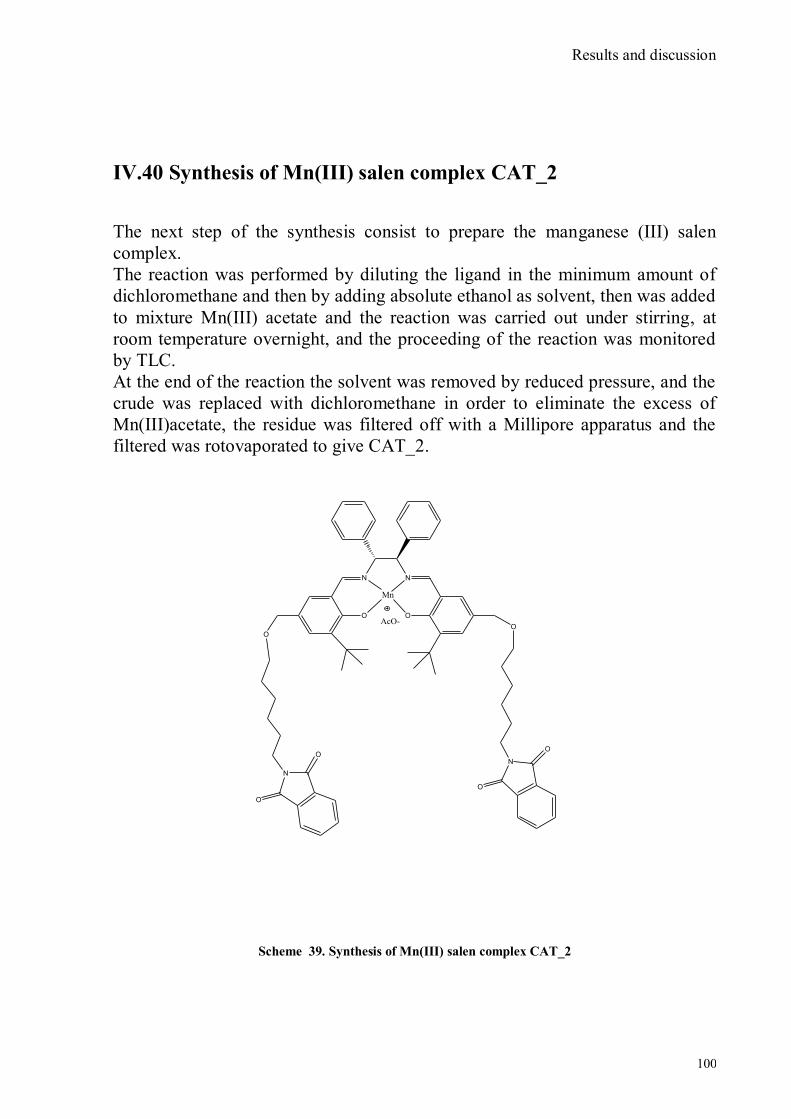
Results and discussion
100
IV.40 Synthesis of Mn(III) salen complex CAT_2
The next step of the synthesis consist to prepare the manganese (III) salen
complex.
The reaction was performed by diluting the ligand in the minimum amount of
dichloromethane and then by adding absolute ethanol as solvent, then was added
to mixture Mn(III) acetate and the reaction was carried out under stirring, at
room temperature overnight, and the proceeding of the reaction was monitored
by TLC.
At the end of the reaction the solvent was removed by reduced pressure, and the
crude was replaced with dichloromethane in order to eliminate the excess of
Mn(III)acetate, the residue was filtered off with a Millipore apparatus and the
filtered was rotovaporated to give CAT_2.
NN
O O
OO
N
NO
O
O
O
Mn
AcO-
Scheme 39. Synthesis of Mn(III) salen complex CAT_2
Conclusions
101
V. CONCLUSIONS
In this PhD work were synthesized and characterized a series of new organic
molecules with different aims, in order:
1. To detect CWAs simulant by synthesizing a series of oximes with an
active functional group in order anchor these molecules on silica surface.
A preliminary study in solution shows that the molecules synthesized
interact with the nerve agent simulant used (DMMP, dimethyl-methyl
phosphonate), but they do not give a high detectable signal. With the
second generation of oxymes synthesized we tried to perfom a reaction
with the simulant used (in this case the DCP, diethylchlorophosphate),
and we obtain a very promising device to detect CWAs because of the
dramatic change of colour after the interaction, followed by a significant
change in the UV-Vis and 1H NMR titrations.
2. To recognize metal transition ions by synthesizing a series of
naphtilamide derivates that has been tested both in solution and anchored
on silica surphace; firstly we synthesized the N-tyramine-
di[2(dipicolyl)amino]1,8 naphtalimide that selectively recognize copper
both in solution and also anchored on silica surface, then we synthesized
napthilamide derivate linked with a trealose derivate to recognize copper
in biological environment, studies are underway to determine the
selectivity of the sensor.
3. To selectively transfer oxygen by synthesizing three different catalysts
that bear salen units; these catalysts has been designed with three different
anchoring groups to obtain a reusable and environmental friendly devices.
The results are very promising in the regard of the reusability, and the
enantiomeric excess obtained are similar with whose presented in
literature.

Conclusions
102
VI. EXPERIMENTAL
VI.1 General
All starting materials and solvents were purchased from Sigma-Aldrich and used
as received. Melting points were determined on a Kofler hot stage apparatus and
are uncorrected. The NMR experiments were carried out at 27 °C on a Varian
UNITY Inova 500 MHz spectrometer (1H-NMR at 499.88 MHz,
13C NMR at
125.7 MHz in CDCl3) equipped with pulse field gradient module (Z axis) and a
tunable 5 mm Varian inverse detection probe (ID-PFG). The chemical shifts
(ppm) were referenced to TMS. Mass spectral data were obtained by employing
an ES-MS Thermo-Finnigan LCQ-DECA spectrometer equipped with an ion
trap analyzer. UV-VIS measurements: UV-Vis spectra were recorded with a
Jasco V-650 spectrophotometer. Epoxidation reaction: Gas chromatographic
analysis of the reaction mixture were carried out on a PERKIN- ELMER 8420
gas chromatograph equipped with a flame ionization detector and program
capability. The ee were determined employing the chiral column
DMePeBETACDX (25m x 0.25 mm ID x 0.25 μm film) to detect 1,2
dihydronaphtalene; DMeTButiSililBETA PS086 (25m x 0.25 mm ID x 0.25 μm
film) to detect cis β methylstirene and DIMEPEBETA-086 (25m x 0.25 mm ID
x 0.25 μm film) to detect 6-ciano-2,2-dimethyl chromene. XPS measurements:
PHI ESCA/SAM 5600 Multy technique spectrometer equipped with a
monochromatized Al Ka X-ray source. The analyses were carried out either at
45° or at 20° photoelectron take off angle relative to the sample surface with an
acceptance angle of ±7°. Binding Energy (BE) scale was calibrated by centering
the adventitious/hydrocarbon carbon C1s at 285.0 eV.
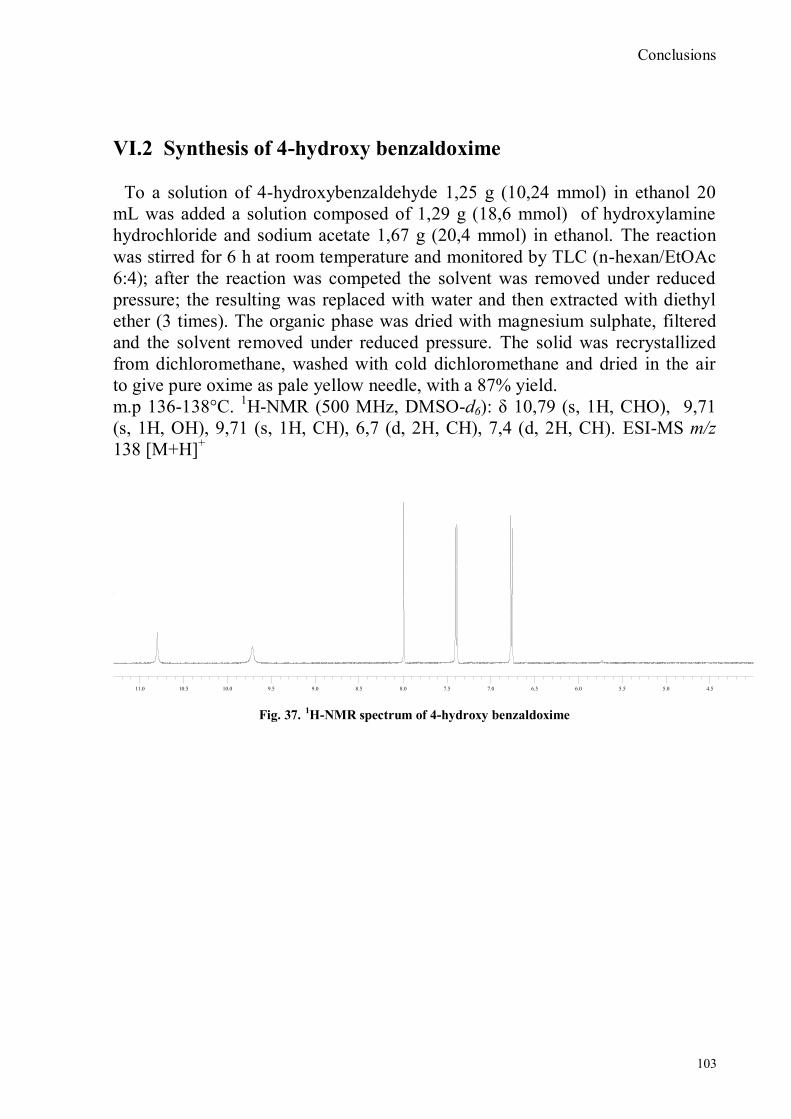
Conclusions
103
VI.2 Synthesis of 4-hydroxy benzaldoxime
To a solution of 4-hydroxybenzaldehyde 1,25 g (10,24 mmol) in ethanol 20
mL was added a solution composed of 1,29 g (18,6 mmol) of hydroxylamine
hydrochloride and sodium acetate 1,67 g (20,4 mmol) in ethanol. The reaction
was stirred for 6 h at room temperature and monitored by TLC (n-hexan/EtOAc
6:4); after the reaction was competed the solvent was removed under reduced
pressure; the resulting was replaced with water and then extracted with diethyl
ether (3 times). The organic phase was dried with magnesium sulphate, filtered
and the solvent removed under reduced pressure. The solid was recrystallized
from dichloromethane, washed with cold dichloromethane and dried in the air
to give pure oxime as pale yellow needle, with a 87% yield.
m.p 136-138°C. 1H-NMR (500 MHz, DMSO-d6): δ 10,79 (s, 1H, CHO), 9,71
(s, 1H, OH), 9,71 (s, 1H, CH), 6,7 (d, 2H, CH), 7,4 (d, 2H, CH). ESI-MS m/z
138 [M+H]+
4.54.55.05.05.55.56.06.06.56.57.07.07.57.58.08.08.58.59.09.09.59.510.010.010.510.511.011.0
Fig. 37. 1
H-NMR spectrum of 4-hydroxy benzaldoxime
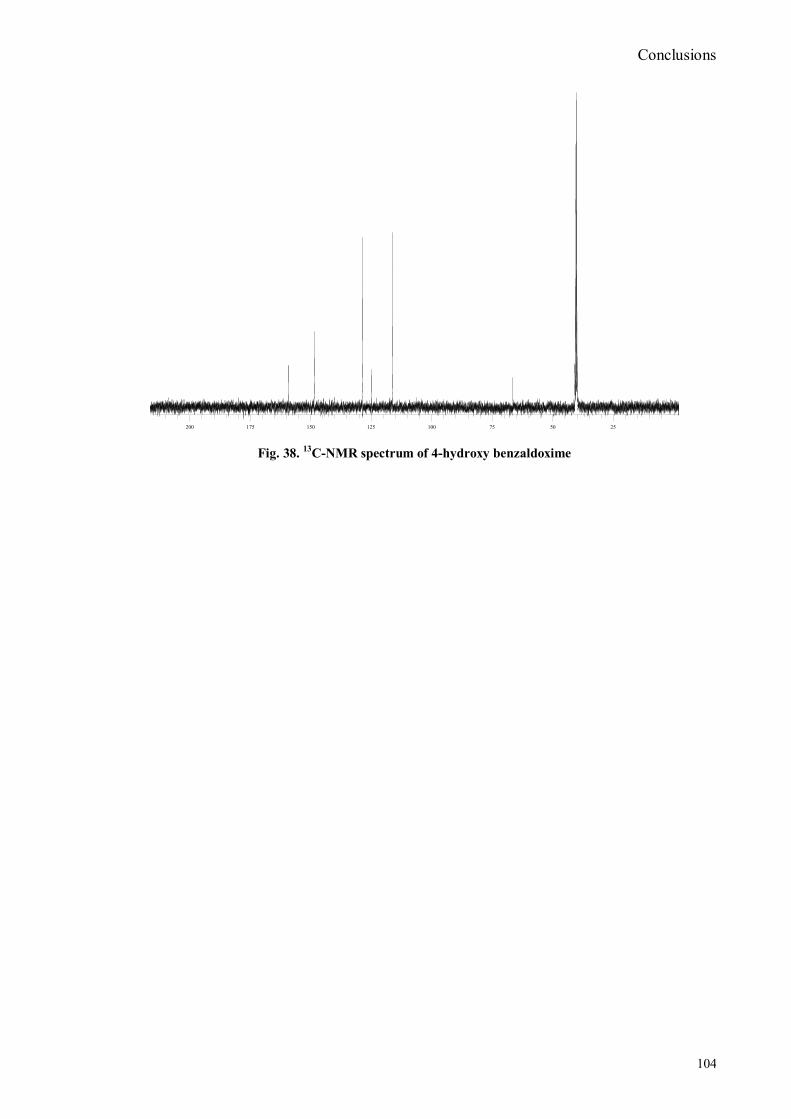
Conclusions
104
252550507575100100125125150150175175200200
Fig. 38. 13
C-NMR spectrum of 4-hydroxy benzaldoxime
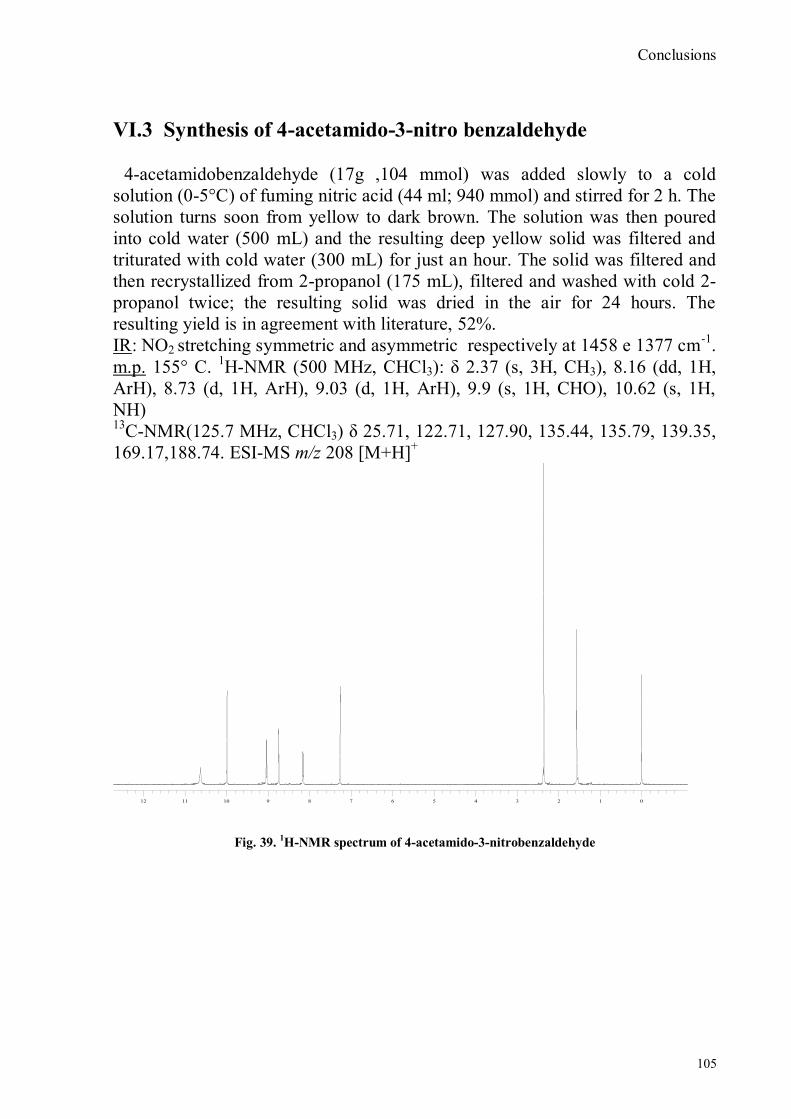
Conclusions
105
VI.3 Synthesis of 4-acetamido-3-nitro benzaldehyde
4-acetamidobenzaldehyde (17g ,104 mmol) was added slowly to a cold
solution (0-5°C) of fuming nitric acid (44 ml; 940 mmol) and stirred for 2 h. The
solution turns soon from yellow to dark brown. The solution was then poured
into cold water (500 mL) and the resulting deep yellow solid was filtered and
triturated with cold water (300 mL) for just an hour. The solid was filtered and
then recrystallized from 2-propanol (175 mL), filtered and washed with cold 2-
propanol twice; the resulting solid was dried in the air for 24 hours. The
resulting yield is in agreement with literature, 52%.
IR: NO2 stretching symmetric and asymmetric respectively at 1458 e 1377 cm-1
.
m.p. 155° C. 1H-NMR (500 MHz, CHCl3): δ 2.37 (s, 3H, CH3), 8.16 (dd, 1H,
ArH), 8.73 (d, 1H, ArH), 9.03 (d, 1H, ArH), 9.9 (s, 1H, CHO), 10.62 (s, 1H,
NH) 13
C-NMR(125.7 MHz, CHCl3) δ 25.71, 122.71, 127.90, 135.44, 135.79, 139.35,
169.17,188.74. ESI-MS m/z 208 [M+H]+
00112233445566778899101011111212
Fig. 39. 1H-NMR spectrum of 4-acetamido-3-nitrobenzaldehyde

Conclusions
106
VI.4 Synthesis of 4-amino-3-nitro benzaldehyde
4-acetamido-3-nitrobenzaldehyde (5g, 24 mmol) were added to concentrated
HCl 36% (25 mL). The suspension was stirred for 2 hours at 75°C. At the end of
the reaction cold water (150 mL) was added to the suspension and stirred for
further 1 hour. The resulting solid was filtered and triturated with cold water
(150 mL) containing NaHCO3 (2,75 g, 33,5 mmol) for 1 hour. The solid was
filtered, washed two times with cold water (50 mL) and crystallized from 2-
propanol (200 mL), then filtered and washed with cold 2-propanol to give 75%
yield.
m.p 191-192 °C 1H-NMR (500 MHz, DMSO-d6) δ 7.12 (d, 1H, ArH), 7.81 (dd,
1H, ArH), 8.18 (s, 2H, NH), 8.56 (d, 1H, ArH), 9.76 (s, 1H, CHO). 13
C-NMR (125.7 MHz, DMSO-d6) δ 119.89, 124.56, 129.70, 132.45, 132.74,
149.81, 189.73. ESI-MS m/z 166 [M+H]+.
112233445566778899101011111212
Fig.40. 1H-NMR spectrum of 4-amino-3-nitrobenzaldehyde
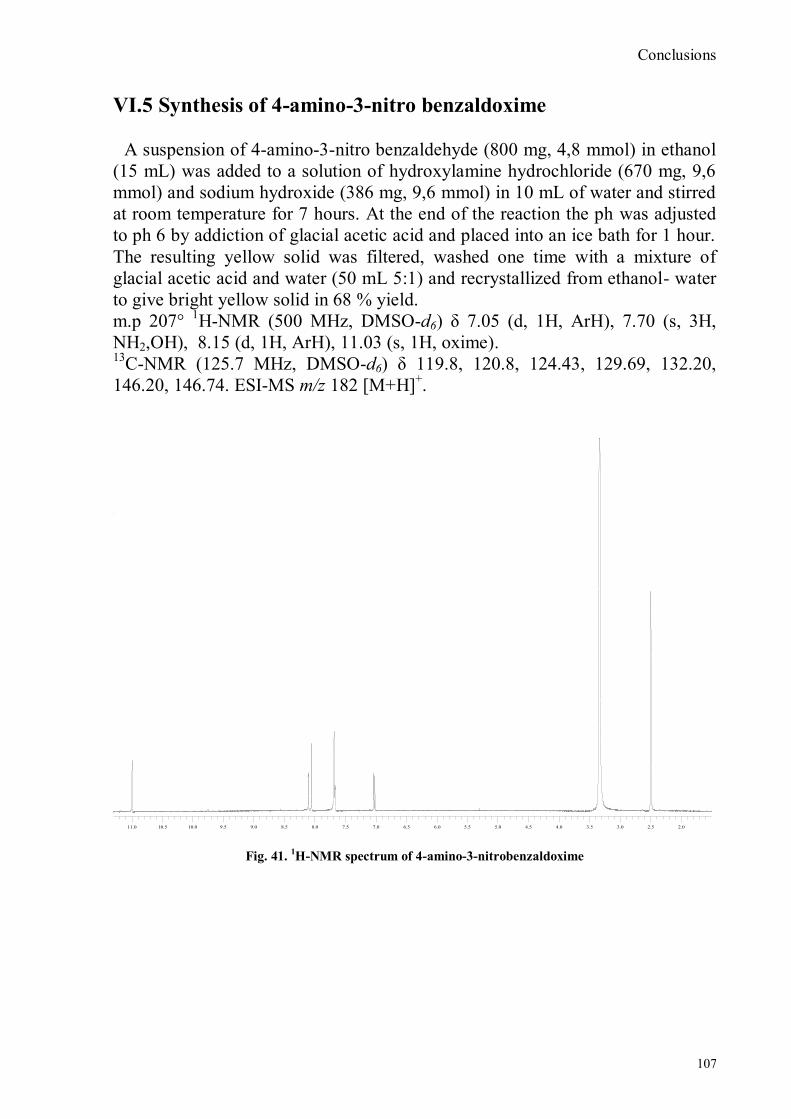
Conclusions
107
VI.5 Synthesis of 4-amino-3-nitro benzaldoxime
A suspension of 4-amino-3-nitro benzaldehyde (800 mg, 4,8 mmol) in ethanol
(15 mL) was added to a solution of hydroxylamine hydrochloride (670 mg, 9,6
mmol) and sodium hydroxide (386 mg, 9,6 mmol) in 10 mL of water and stirred
at room temperature for 7 hours. At the end of the reaction the ph was adjusted
to ph 6 by addiction of glacial acetic acid and placed into an ice bath for 1 hour.
The resulting yellow solid was filtered, washed one time with a mixture of
glacial acetic acid and water (50 mL 5:1) and recrystallized from ethanol- water
to give bright yellow solid in 68 % yield.
m.p 207° 1H-NMR (500 MHz, DMSO-d6) δ 7.05 (d, 1H, ArH), 7.70 (s, 3H,
NH2,OH), 8.15 (d, 1H, ArH), 11.03 (s, 1H, oxime). 13
C-NMR (125.7 MHz, DMSO-d6) δ 119.8, 120.8, 124.43, 129.69, 132.20,
146.20, 146.74. ESI-MS m/z 182 [M+H]+.
2.02.02.52.53.03.03.53.54.04.04.54.55.05.05.55.56.06.06.56.57.07.07.57.58.08.08.58.59.09.09.59.510.010.010.510.511.011.0
Fig. 41. 1H-NMR spectrum of 4-amino-3-nitrobenzaldoxime

Conclusions
108
VI.6 Synthesis of 4-hydroxy-2’-nitro-4’-phormyl -azo-benzene
A suspension 0,460 mg (3,85 mmol) of 4-amino-3-nitro benzaldehyde was
prepared at 0° C in 15 ml of water. At the same temperature was separately
dissolved 247 mg (3,6 mmol) of sodium nitrite in 10 ml of water. The
suspension of the 4-amino-3-nitro benzaldehyde was simultaneously added at
vigorous stirring the solution of sodium nitrite and 5 ml (33 mmol) of 24%
hydrochloridric acid solution. The completion of diazotation reaction was
monitored with a starch-iodide paper strip test. The solution of diazo compound
was then adjusted to pH 7 by adding a 6% solution of sodium hydroxide. To the
neutral solution of diazo compound at cooling and stirring was added a cool
solution of 0,300 g (3,2 mmol) of phenol dissolved in 5 ml of water at pH 6 by
sodium hydroxide. The of the reaction was monitored by TLC (esane: ethyl
acetate 8:2). The reaction product was precipitated by adding to the reaction
mixture 1g of sodium chloride, the precipitate was filtered off and the precipitate
recrystallized from acetic acid. Yield of the orange product 80% (530 mg). 1H-NMR (500 MHz, acetone-d6): δ 7 (d, 2H, ArH), 7.9 (d, 2H, ArH), 8.3 (d, 1H,
ArH), 8.5 (d, 1H, ArH), 7.9 (s, 1H, ArH), 10.2 (s, 1H, CHO). 13
C-NMR (125.7 MHz, acetone-d6) δ 116.3, 119.5, 125.1, 126.6, 133.4, 137.4,
146.4,162.6,190.2 ESI-MS m/z 272 [M+H]+
4.54.55.05.05.55.56.06.06.56.57.07.07.57.58.08.08.58.59.09.09.59.510.010.010.510.5
Fig. 42. 1H-NMR spectrum 4-hydroxy-2’-nitro-4’-phormyl -azo-benzene
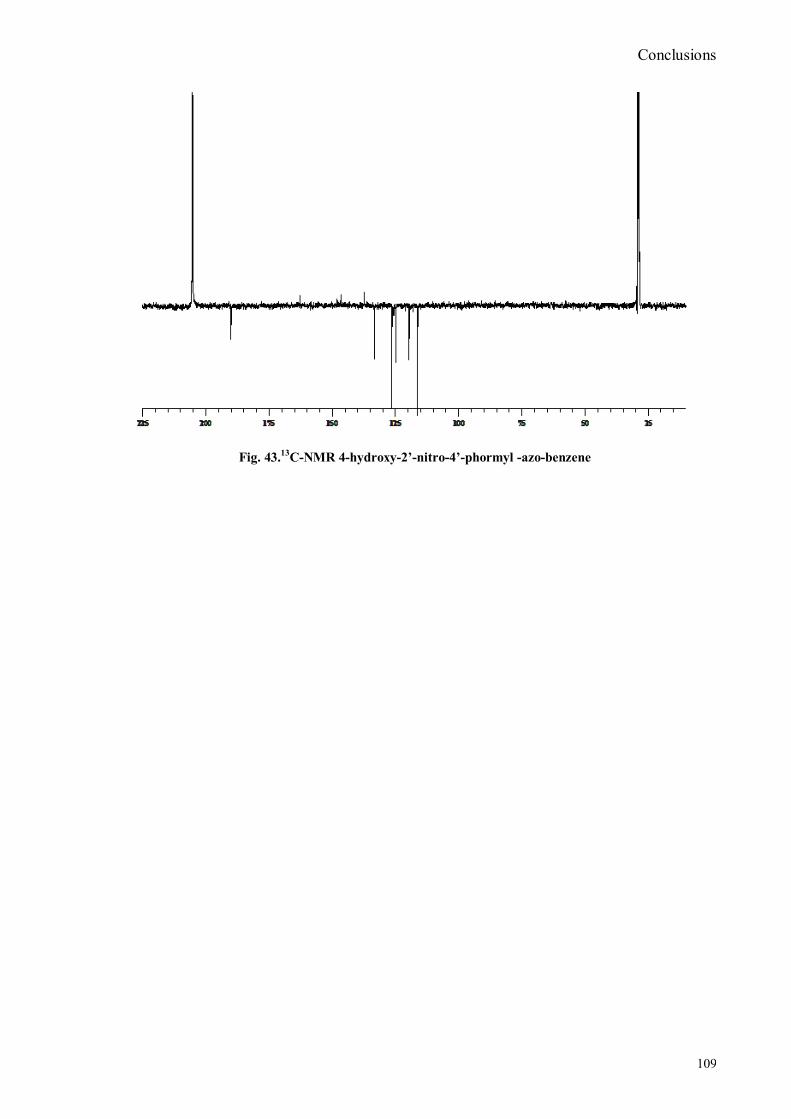
Conclusions
109
Fig. 43.
13C-NMR 4-hydroxy-2’-nitro-4’-phormyl -azo-benzene
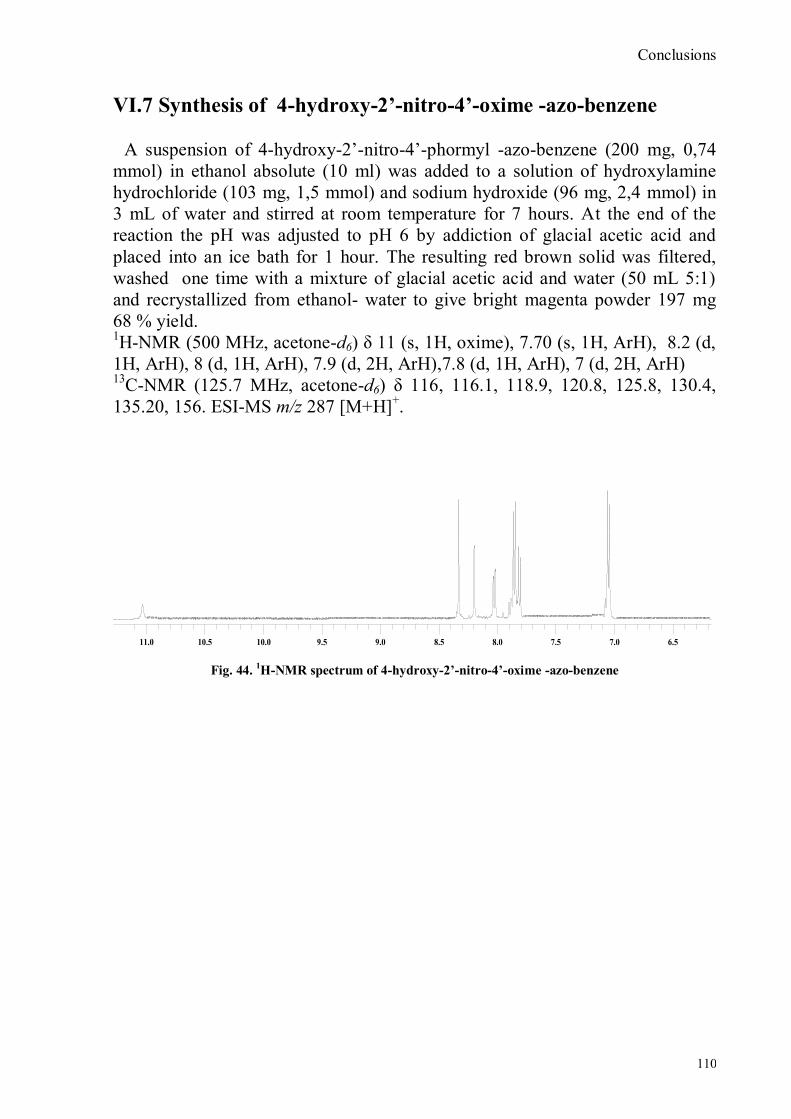
Conclusions
110
VI.7 Synthesis of 4-hydroxy-2’-nitro-4’-oxime -azo-benzene
A suspension of 4-hydroxy-2‟-nitro-4‟-phormyl -azo-benzene (200 mg, 0,74
mmol) in ethanol absolute (10 ml) was added to a solution of hydroxylamine
hydrochloride (103 mg, 1,5 mmol) and sodium hydroxide (96 mg, 2,4 mmol) in
3 mL of water and stirred at room temperature for 7 hours. At the end of the
reaction the pH was adjusted to pH 6 by addiction of glacial acetic acid and
placed into an ice bath for 1 hour. The resulting red brown solid was filtered,
washed one time with a mixture of glacial acetic acid and water (50 mL 5:1)
and recrystallized from ethanol- water to give bright magenta powder 197 mg
68 % yield. 1H-NMR (500 MHz, acetone-d6) δ 11 (s, 1H, oxime), 7.70 (s, 1H, ArH), 8.2 (d,
1H, ArH), 8 (d, 1H, ArH), 7.9 (d, 2H, ArH),7.8 (d, 1H, ArH), 7 (d, 2H, ArH) 13
C-NMR (125.7 MHz, acetone-d6) δ 116, 116.1, 118.9, 120.8, 125.8, 130.4,
135.20, 156. ESI-MS m/z 287 [M+H]+.
6.56.57.07.07.57.58.08.08.58.59.09.09.59.510.010.010.510.511.011.0
Fig. 44. 1H-NMR spectrum of 4-hydroxy-2’-nitro-4’-oxime -azo-benzene

Conclusions
111
Fig. 45. ESI-MS spectrum of 4-hydroxy-2’-nitro-4’-oxime -azo-benzene
VI.8 Synthesis of 4-bromoacenaphtene
A solution of N-bromosuccinimide, (18 g, 0,1 mol) in 50 mL of DMF was
added to a suspension of acenaphtene (15,4 g, 0,1 mol) in 50 mL of DMF at
room temperature. Heated was evolved and after 2 hours, the solution was

Conclusions
112
poured into a litre of cold water. Filtration gave 23 g of crude product. After
crystallization from ethanol gave 18,5 g (79%) of 4-Bromoacenapthene.48
1H-NMR (500 MHz, CDCl3) δ 7,7 (d, J = 8 Hz, 1H, ArH), 7.65 (d, J = 7 Hz, 1H,
ArH), 7,54 (t, J = 6,5 Hz, 1H, ArH), 7,32 (d, J = 6,5 Hz, 1H, ArH), 7,13 (d, J =
7 Hz, 1H, ArH), 3,37 (m, 4H, CH2). ESI-MS m/z 231,9 [M+H]+.
0011223344556677889910101111
Fig. 46. 1H-NMR spectrum of 4-bromoacenaphtene
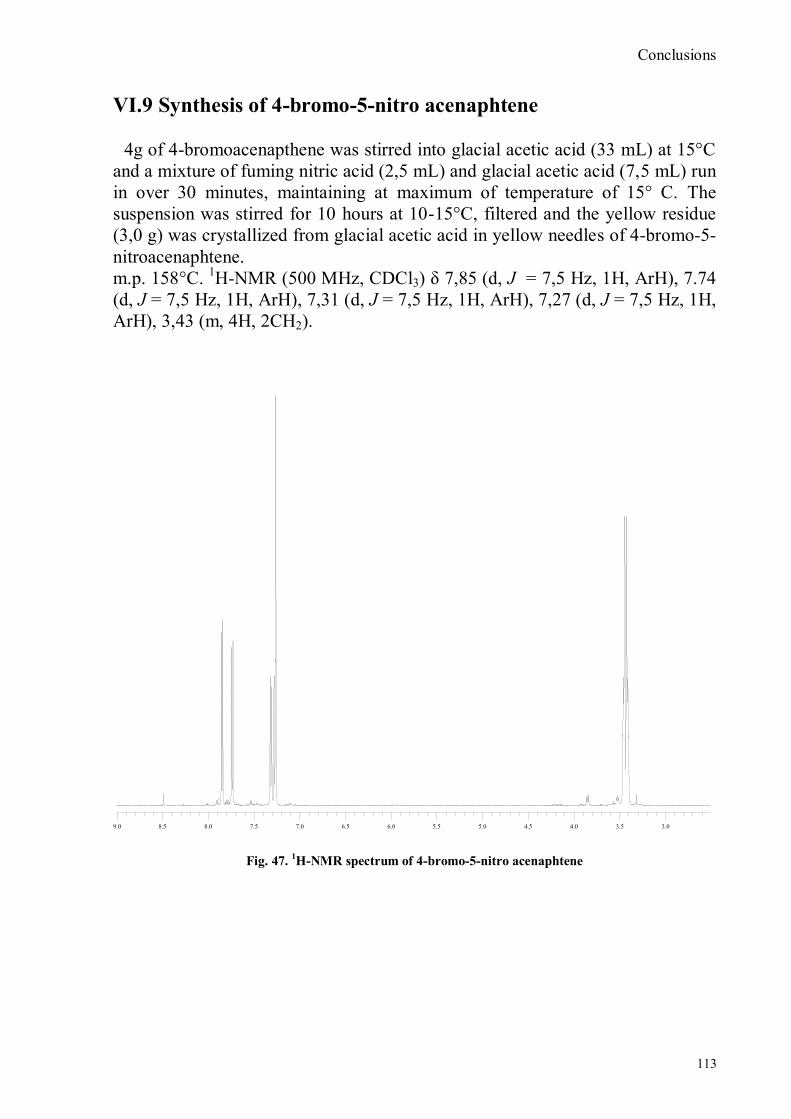
Conclusions
113
VI.9 Synthesis of 4-bromo-5-nitro acenaphtene
4g of 4-bromoacenapthene was stirred into glacial acetic acid (33 mL) at 15°C
and a mixture of fuming nitric acid (2,5 mL) and glacial acetic acid (7,5 mL) run
in over 30 minutes, maintaining at maximum of temperature of 15° C. The
suspension was stirred for 10 hours at 10-15°C, filtered and the yellow residue
(3,0 g) was crystallized from glacial acetic acid in yellow needles of 4-bromo-5-
nitroacenaphtene.
m.p. 158°C. 1H-NMR (500 MHz, CDCl3) δ 7,85 (d, J = 7,5 Hz, 1H, ArH), 7.74
(d, J = 7,5 Hz, 1H, ArH), 7,31 (d, J = 7,5 Hz, 1H, ArH), 7,27 (d, J = 7,5 Hz, 1H,
ArH), 3,43 (m, 4H, 2CH2).
3.03.03.53.54.04.04.54.55.05.05.55.56.06.06.56.57.07.07.57.58.08.08.58.59.09.0
Fig. 47. 1H-NMR spectrum of 4-bromo-5-nitro acenaphtene

Conclusions
114
VI.9 Synthesis of 4-bromo-5-nitro 1,8 naphtalic anhydride
4-bromo-6-nitro acenapthene (2,3 g 9,35 mmol) was stirred into a mixture of
glacial acetic acid (25 mL) and sodium dichromate * 2 H20 (6 g ) and the
solution slowly heated to reflux. The solution change color from bright orange
to dark green (because of this reaction Cr2O
7--→ Cr
3+ ); after refluxing for 3
hours the dark green liquor was diluted with 10 mL of cold water, cooled,
filtered and the yellow-orange residue washed with a little amount of glacial
acetic acid and then stirred into a 4% aqueous solution of sodium hydroxide.
After filtering, the filtrate were neutralized with 5% solution aqueous solution of
hydrochloric acid to give cream-orange precipitate of 4-bromo-5-nitro-
1,8naphtalic anhydride. 42% yield. 1H-NMR (500 MHz, CDCl3) δ 7,84 (d, J = 7 Hz, 1H, ArH), 7.72 (d, J = 8 Hz,
1H, ArH), 7,31 (d, J = 7 Hz, 1H, ArH), 7,25 (d, J = 8 Hz, 1H, ArH). ESI-MS
m/z 322,93 [M+H]+.
6.26.26.46.46.66.66.86.87.07.07.27.27.47.47.67.67.87.88.08.08.28.28.48.48.68.68.88.89.09.09.29.29.49.4
Fig. 48. 1H-NMR spectrum of 4-bromo-5-nitro naphtalic anhydride

Conclusions
115
VI.10 Synthesis of 4-bromo-5-nitro naphtalimide
To a solution of 1,3 g (4,0 mmol) of 4-bromo-5-nitro-1,8 naphtalic anhydride
in 30 mL of ethanol was added dropwise 0,4 g of tiramine in 15 mL of ethanol.
The mixture was then heated to reflux and monitored by TLC (CH2Cl2-EtOAc
8:2). After the reaction was completed, the solvent was removed under reduced
pressure and the crude product was purified by column chromatography (SiO2,
CH2Cl2-EtOAc 9:1) to give N-tiramine-di[2-(dipicolyl)amino]1,8 naphtalimide
as a deep yellow solid in 40,5% yield (670 mg). 1H-NMR (500 MHz, CDCl3) δ 8,70 (d, J = 8 Hz, 1H,ArH), 8.50 (d, J = 8 Hz,
1H, ArH), 8,21 (d, J = 8 Hz, 1H, ArH), 7,93 (d, J = 8 Hz, 1H, ArH) 7,19 (d, J =
8 Hz, 2H, ArH), 6,77 (d, J = 8 Hz, 2H,ArH), 4,62 (s, 1H, OH), 4,4 (t, J = 8 Hz,
2H, CH2), 2,9 ( t, J = 8 Hz, 2H, CH2 ). ESI-MS m/z 440 [M+H]+.
4.04.04.54.55.05.05.55.56.06.06.56.57.07.07.57.58.08.08.58.59.09.09.59.5
Fig.49. 1H-NMR spectrum of4-bromo-5-nitro naphtalimide
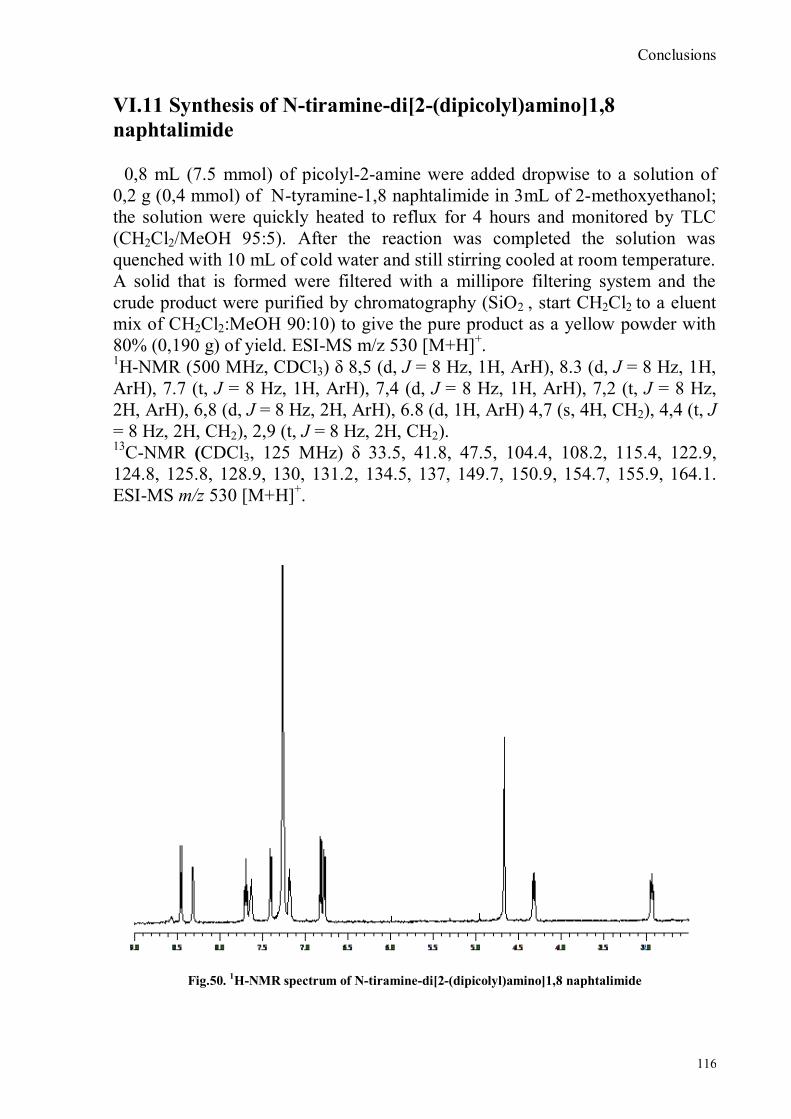
Conclusions
116
VI.11 Synthesis of N-tiramine-di[2-(dipicolyl)amino]1,8
naphtalimide
0,8 mL (7.5 mmol) of picolyl-2-amine were added dropwise to a solution of
0,2 g (0,4 mmol) of N-tyramine-1,8 naphtalimide in 3mL of 2-methoxyethanol;
the solution were quickly heated to reflux for 4 hours and monitored by TLC
(CH2Cl2/MeOH 95:5). After the reaction was completed the solution was
quenched with 10 mL of cold water and still stirring cooled at room temperature.
A solid that is formed were filtered with a millipore filtering system and the
crude product were purified by chromatography (SiO2 , start CH2Cl2 to a eluent
mix of CH2Cl2:MeOH 90:10) to give the pure product as a yellow powder with
80% (0,190 g) of yield. ESI-MS m/z 530 [M+H]+.
1H-NMR (500 MHz, CDCl3) δ 8,5 (d, J = 8 Hz, 1H, ArH), 8.3 (d, J = 8 Hz, 1H,
ArH), 7.7 (t, J = 8 Hz, 1H, ArH), 7,4 (d, J = 8 Hz, 1H, ArH), 7,2 (t, J = 8 Hz,
2H, ArH), 6,8 (d, J = 8 Hz, 2H, ArH), 6.8 (d, 1H, ArH) 4,7 (s, 4H, CH2), 4,4 (t, J
= 8 Hz, 2H, CH2), 2,9 (t, J = 8 Hz, 2H, CH2). 13
C-NMR (CDCl3, 125 MHz) δ 33.5, 41.8, 47.5, 104.4, 108.2, 115.4, 122.9,
124.8, 125.8, 128.9, 130, 131.2, 134.5, 137, 149.7, 150.9, 154.7, 155.9, 164.1.
ESI-MS m/z 530 [M+H]+.
Fig.50.
1H-NMR spectrum of N-tiramine-di[2-(dipicolyl)amino]1,8 naphtalimide
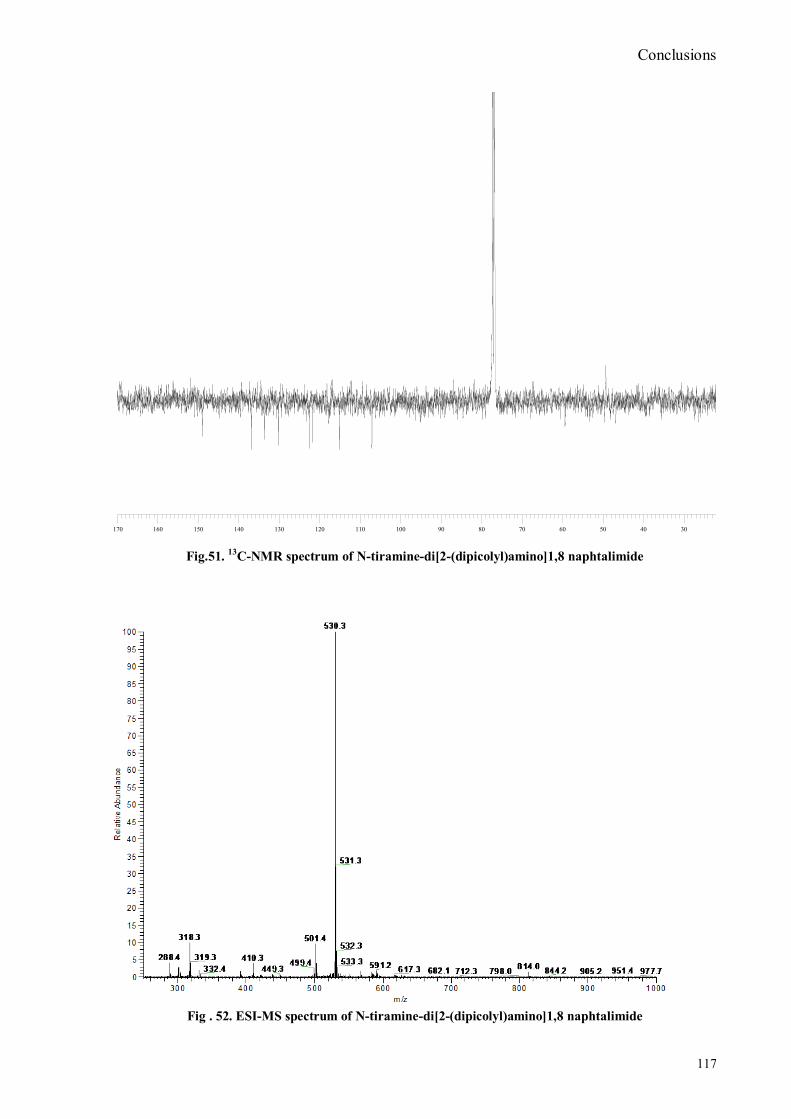
Conclusions
117
3030404050506060707080809090100100110110120120130130140140150150160160170170
Fig.51. 13
C-NMR spectrum of N-tiramine-di[2-(dipicolyl)amino]1,8 naphtalimide
Fig . 52. ESI-MS spectrum of N-tiramine-di[2-(dipicolyl)amino]1,8 naphtalimide
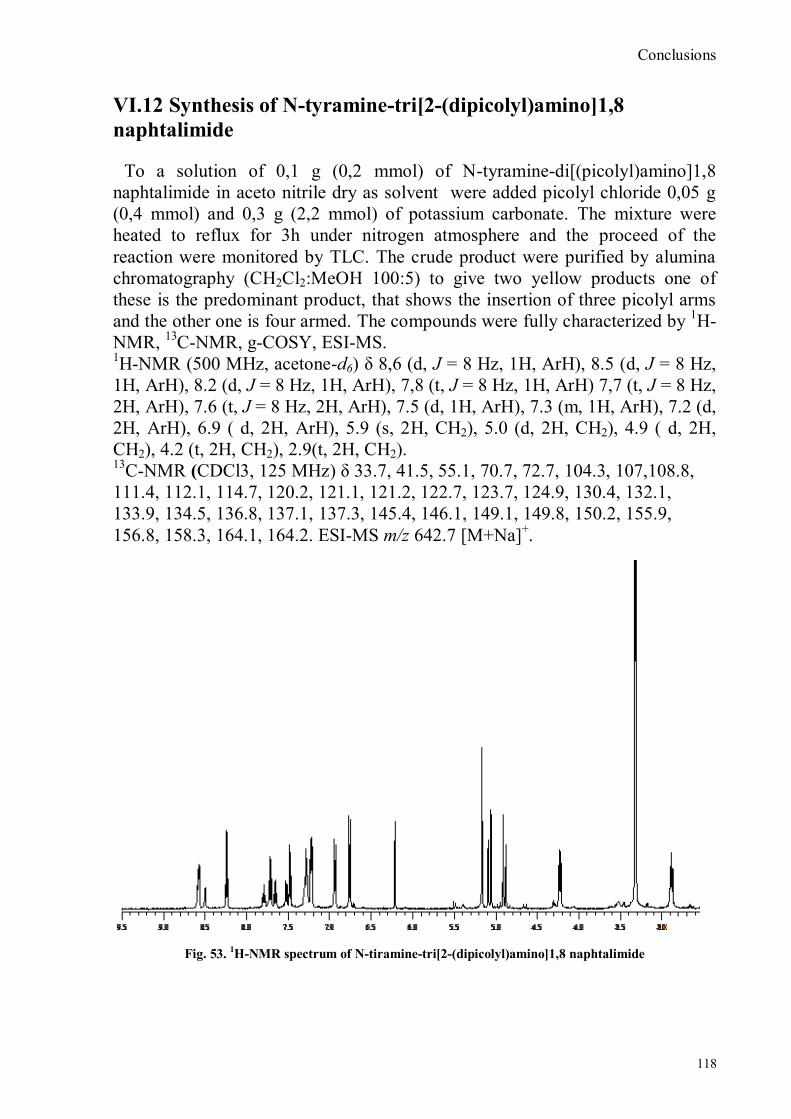
Conclusions
118
VI.12 Synthesis of N-tyramine-tri[2-(dipicolyl)amino]1,8
naphtalimide
To a solution of 0,1 g (0,2 mmol) of N-tyramine-di[(picolyl)amino]1,8
naphtalimide in aceto nitrile dry as solvent were added picolyl chloride 0,05 g
(0,4 mmol) and 0,3 g (2,2 mmol) of potassium carbonate. The mixture were
heated to reflux for 3h under nitrogen atmosphere and the proceed of the
reaction were monitored by TLC. The crude product were purified by alumina
chromatography (CH2Cl2:MeOH 100:5) to give two yellow products one of
these is the predominant product, that shows the insertion of three picolyl arms
and the other one is four armed. The compounds were fully characterized by 1H-
NMR, 13
C-NMR, g-COSY, ESI-MS. 1H-NMR (500 MHz, acetone-d6) δ 8,6 (d, J = 8 Hz, 1H, ArH), 8.5 (d, J = 8 Hz,
1H, ArH), 8.2 (d, J = 8 Hz, 1H, ArH), 7,8 (t, J = 8 Hz, 1H, ArH) 7,7 (t, J = 8 Hz,
2H, ArH), 7.6 (t, J = 8 Hz, 2H, ArH), 7.5 (d, 1H, ArH), 7.3 (m, 1H, ArH), 7.2 (d,
2H, ArH), 6.9 ( d, 2H, ArH), 5.9 (s, 2H, CH2), 5.0 (d, 2H, CH2), 4.9 ( d, 2H,
CH2), 4.2 (t, 2H, CH2), 2.9(t, 2H, CH2). 13
C-NMR (CDCl3, 125 MHz) δ 33.7, 41.5, 55.1, 70.7, 72.7, 104.3, 107,108.8,
111.4, 112.1, 114.7, 120.2, 121.1, 121.2, 122.7, 123.7, 124.9, 130.4, 132.1,
133.9, 134.5, 136.8, 137.1, 137.3, 145.4, 146.1, 149.1, 149.8, 150.2, 155.9,
156.8, 158.3, 164.1, 164.2. ESI-MS m/z 642.7 [M+Na]+.
Fig. 53.
1H-NMR spectrum of N-tiramine-tri[2-(dipicolyl)amino]1,8 naphtalimide
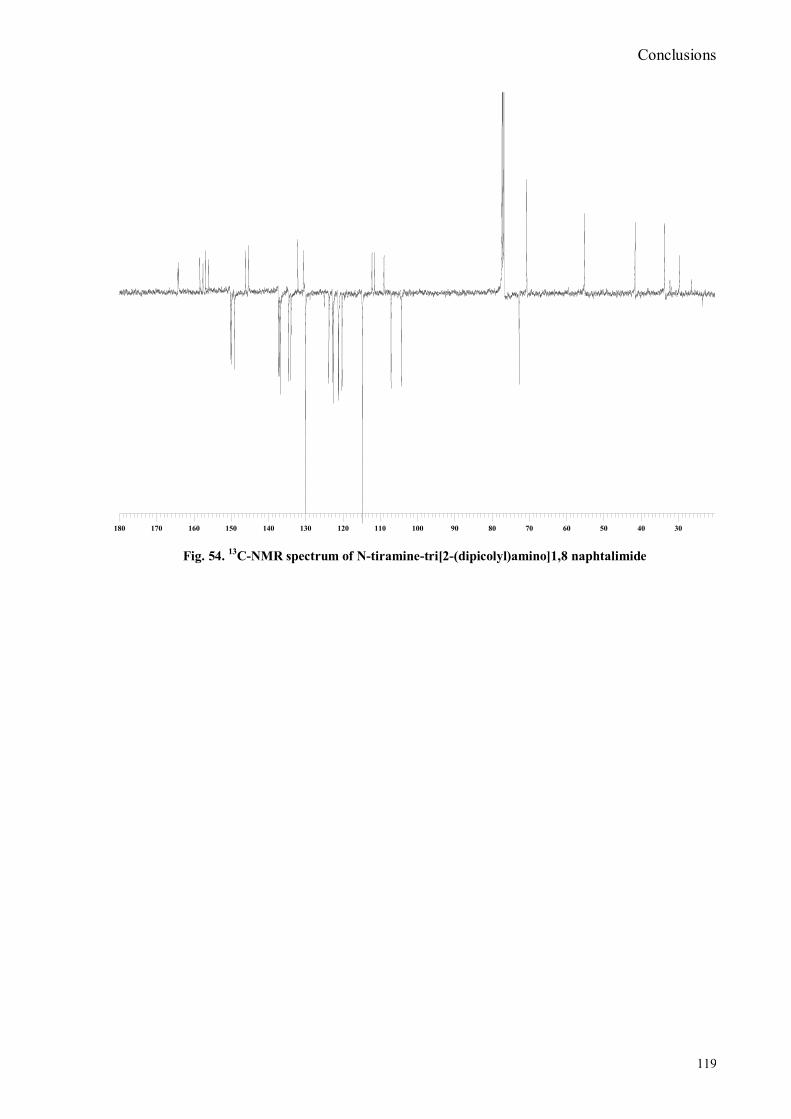
Conclusions
119
3030404050506060707080809090100100110110120120130130140140150150160160170170180180
Fig. 54. 13
C-NMR spectrum of N-tiramine-tri[2-(dipicolyl)amino]1,8 naphtalimide
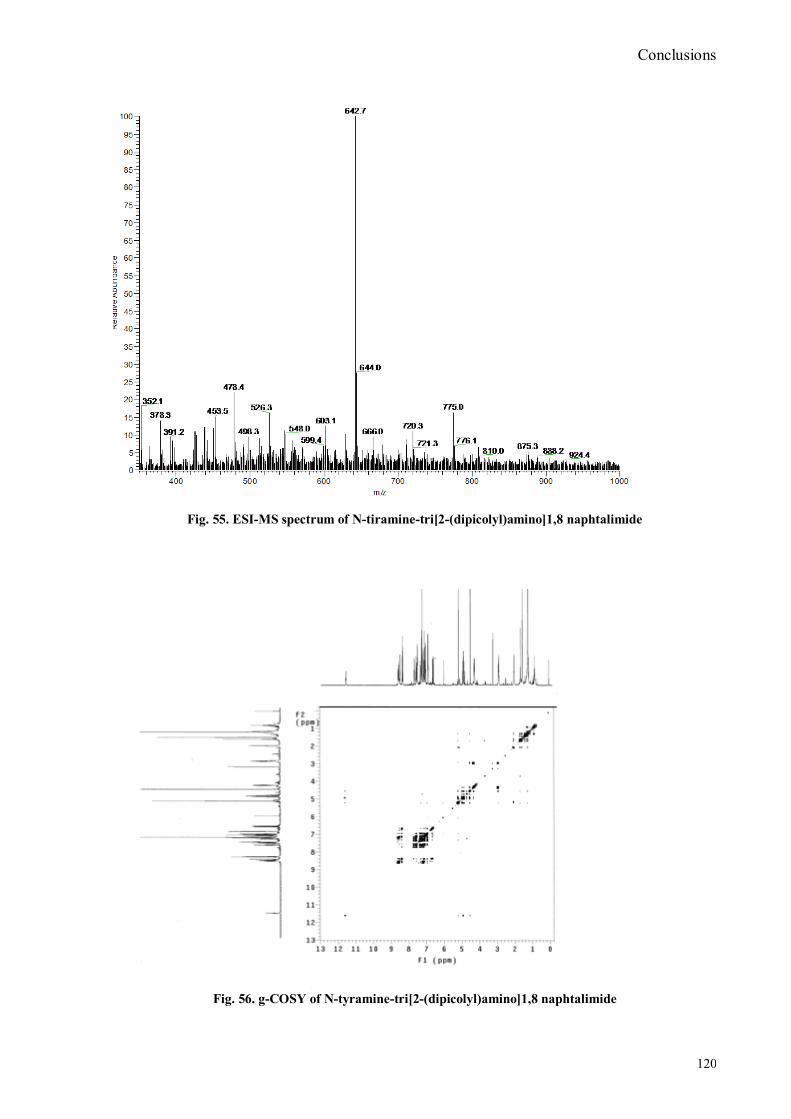
Conclusions
120
Fig. 55. ESI-MS spectrum of N-tiramine-tri[2-(dipicolyl)amino]1,8 naphtalimide
Fig. 56. g-COSY of N-tyramine-tri[2-(dipicolyl)amino]1,8 naphtalimide
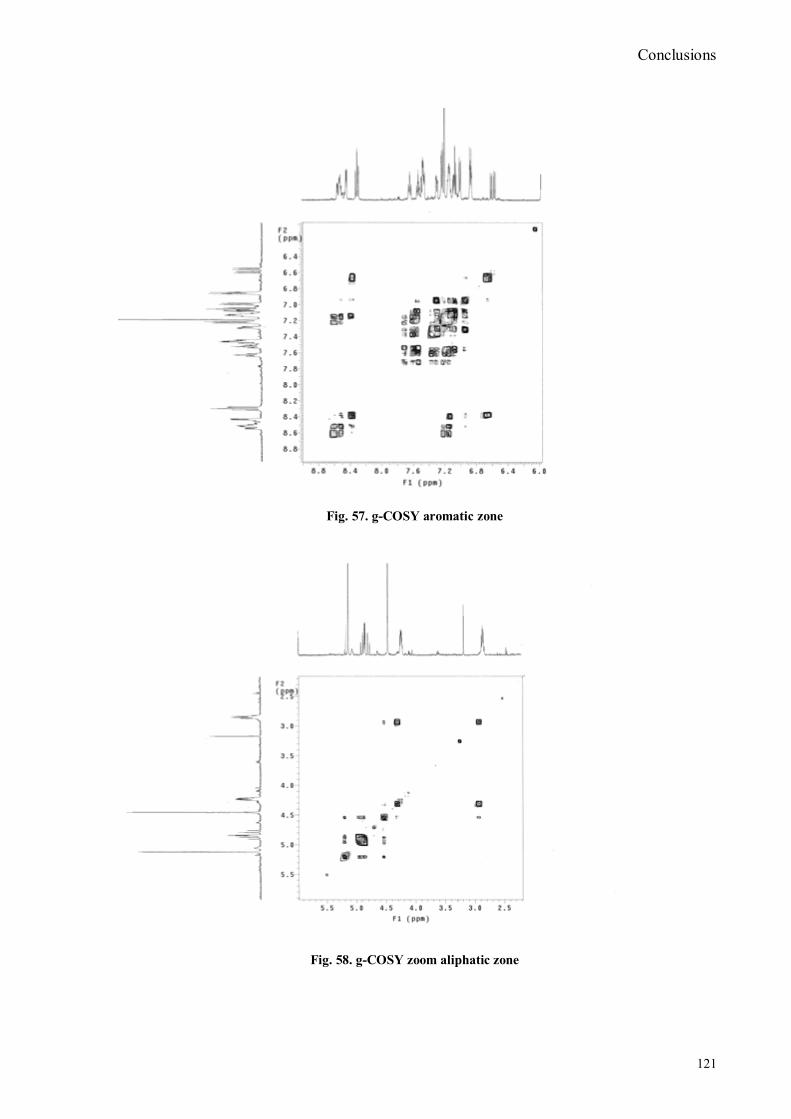
Conclusions
121
Fig. 57. g-COSY aromatic zone
Fig. 58. g-COSY zoom aliphatic zone
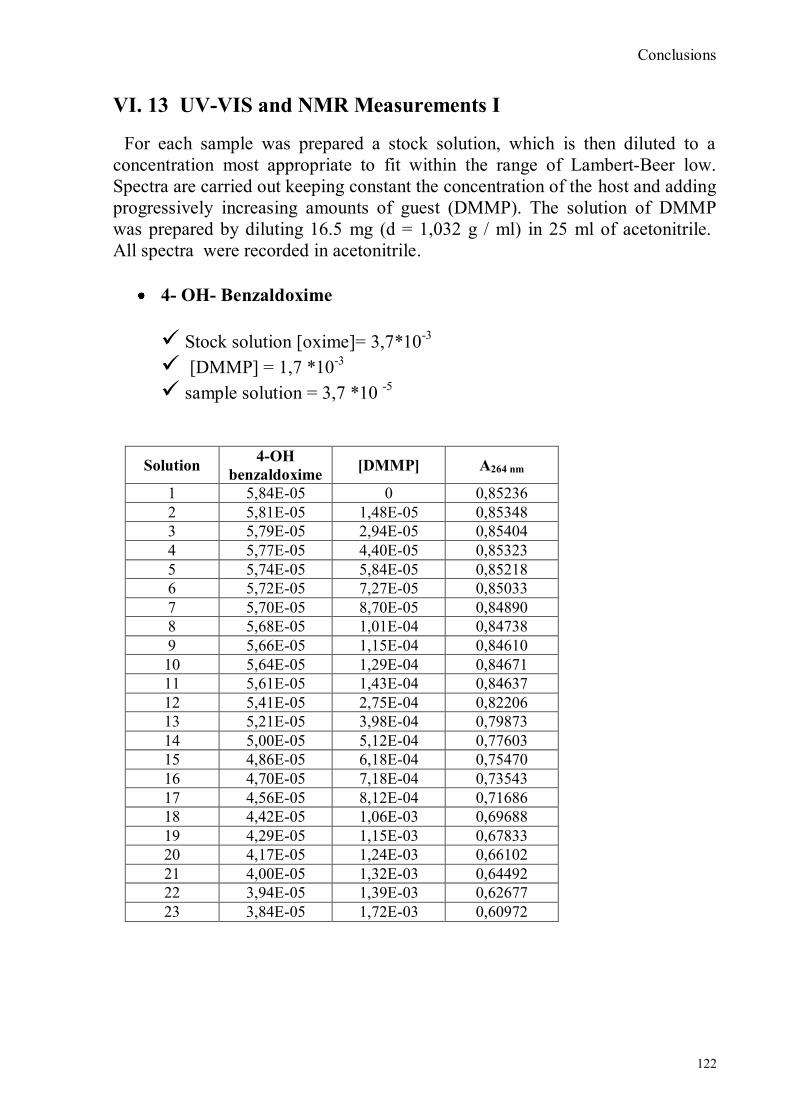
Conclusions
122
VI. 13 UV-VIS and NMR Measurements I
For each sample was prepared a stock solution, which is then diluted to a
concentration most appropriate to fit within the range of Lambert-Beer low.
Spectra are carried out keeping constant the concentration of the host and adding
progressively increasing amounts of guest (DMMP). The solution of DMMP
was prepared by diluting 16.5 mg (d = 1,032 g / ml) in 25 ml of acetonitrile.
All spectra were recorded in acetonitrile.
4- OH- Benzaldoxime
Stock solution [oxime]= 3,7*10-3
[DMMP] = 1,7 *10-3
sample solution = 3,7 *10 -5
Solution 4-OH
benzaldoxime [DMMP] A264 nm
1 5,84E-05 0 0,85236
2 5,81E-05 1,48E-05 0,85348
3 5,79E-05 2,94E-05 0,85404
4 5,77E-05 4,40E-05 0,85323
5 5,74E-05 5,84E-05 0,85218
6 5,72E-05 7,27E-05 0,85033
7 5,70E-05 8,70E-05 0,84890
8 5,68E-05 1,01E-04 0,84738
9 5,66E-05 1,15E-04 0,84610
10 5,64E-05 1,29E-04 0,84671
11 5,61E-05 1,43E-04 0,84637
12 5,41E-05 2,75E-04 0,82206
13 5,21E-05 3,98E-04 0,79873
14 5,00E-05 5,12E-04 0,77603
15 4,86E-05 6,18E-04 0,75470
16 4,70E-05 7,18E-04 0,73543
17 4,56E-05 8,12E-04 0,71686
18 4,42E-05 1,06E-03 0,69688
19 4,29E-05 1,15E-03 0,67833
20 4,17E-05 1,24E-03 0,66102
21 4,00E-05 1,32E-03 0,64492
22 3,94E-05 1,39E-03 0,62677
23 3,84E-05 1,72E-03 0,60972
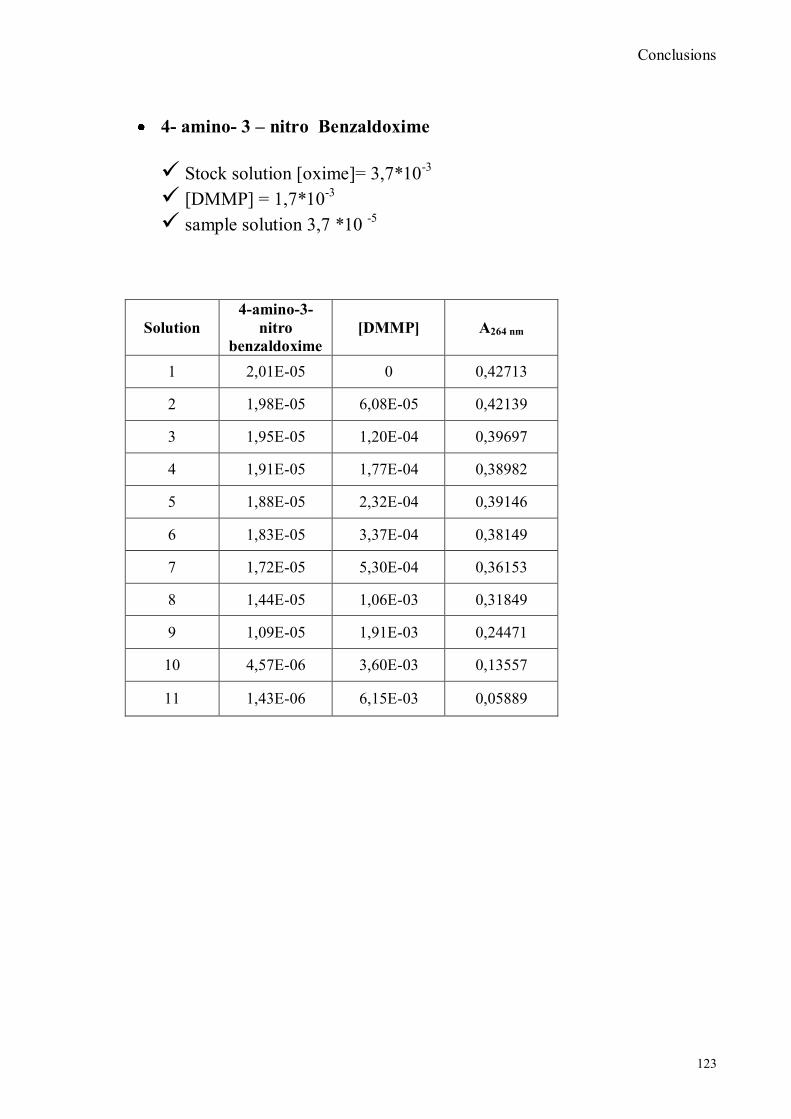
Conclusions
123
4- amino- 3 – nitro Benzaldoxime
Stock solution [oxime]= 3,7*10-3
[DMMP] = 1,7*10-3
sample solution 3,7 *10 -5
Solution
4-amino-3-
nitro
benzaldoxime
[DMMP] A264 nm
1 2,01E-05 0 0,42713
2 1,98E-05 6,08E-05 0,42139
3 1,95E-05 1,20E-04 0,39697
4 1,91E-05 1,77E-04 0,38982
5 1,88E-05 2,32E-04 0,39146
6 1,83E-05 3,37E-04 0,38149
7 1,72E-05 5,30E-04 0,36153
8 1,44E-05 1,06E-03 0,31849
9 1,09E-05 1,91E-03 0,24471
10 4,57E-06 3,60E-03 0,13557
11 1,43E-06 6,15E-03 0,05889
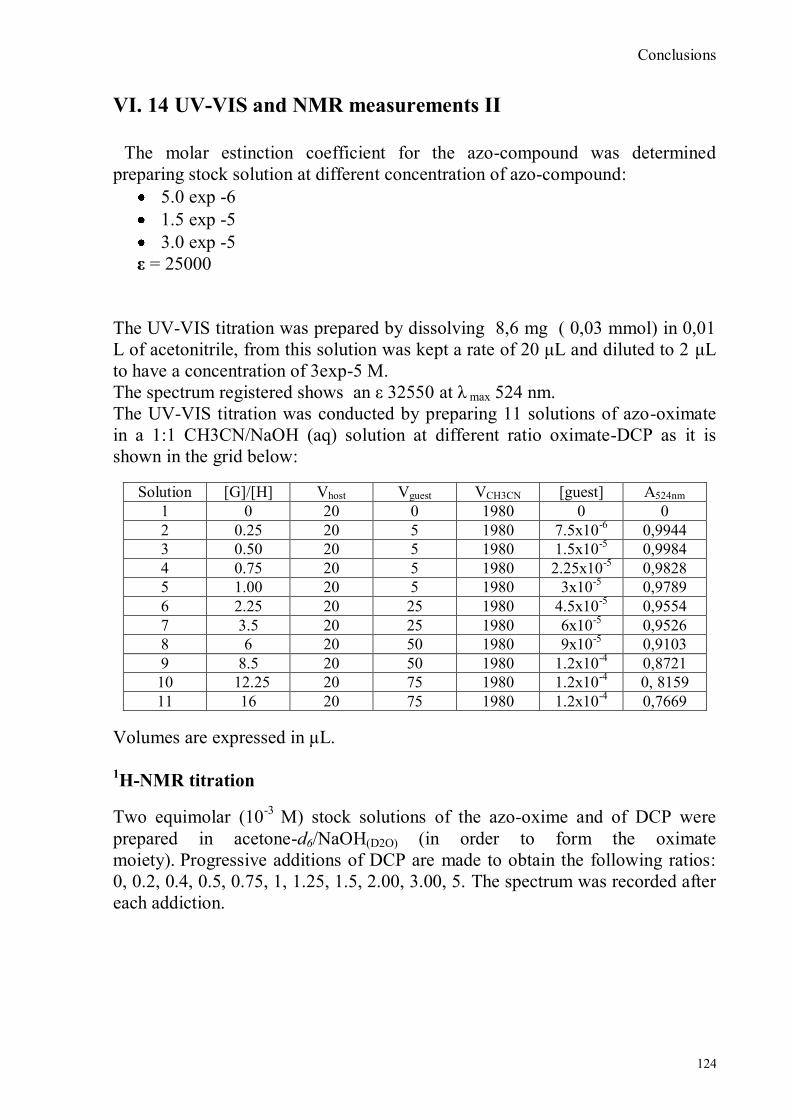
Conclusions
124
VI. 14 UV-VIS and NMR measurements II
The molar estinction coefficient for the azo-compound was determined
preparing stock solution at different concentration of azo-compound:
5.0 exp -6
1.5 exp -5
3.0 exp -5
ε = 25000
The UV-VIS titration was prepared by dissolving 8,6 mg ( 0,03 mmol) in 0,01
L of acetonitrile, from this solution was kept a rate of 20 μL and diluted to 2 μL
to have a concentration of 3exp-5 M.
The spectrum registered shows an ε 32550 at λ max 524 nm.
The UV-VIS titration was conducted by preparing 11 solutions of azo-oximate
in a 1:1 CH3CN/NaOH (aq) solution at different ratio oximate-DCP as it is
shown in the grid below:
Solution [G]/[H] Vhost Vguest VCH3CN [guest] A524nm
1 0 20 0 1980 0 0
2 0.25 20 5 1980 7.5x10⁻⁶
0,9944
3 0.50 20 5 1980 1.5x10⁻⁵
0,9984
4 0.75 20 5 1980 2.25x10⁻⁵
0,9828
5 1.00 20 5 1980 3x10⁻⁵
0,9789
6 2.25 20 25 1980 4.5x10⁻⁵
0,9554
7 3.5 20 25 1980 6x10⁻⁵
0,9526
8 6 20 50 1980 9x10⁻⁵
0,9103
9 8.5 20 50 1980 1.2x10⁻⁴
0,8721
10 12.25 20 75 1980 1.2x10⁻⁴
0, 8159
11 16 20 75 1980 1.2x10⁻⁴
0,7669
Volumes are expressed in μL.
1H-NMR titration
Two equimolar (10-3
M) stock solutions of the azo-oxime and of DCP were
prepared in acetone-d6/NaOH(D2O) (in order to form the oximate
moiety). Progressive additions of DCP are made to obtain the following ratios:
0, 0.2, 0.4, 0.5, 0.75, 1, 1.25, 1.5, 2.00, 3.00, 5. The spectrum was recorded after
each addiction.
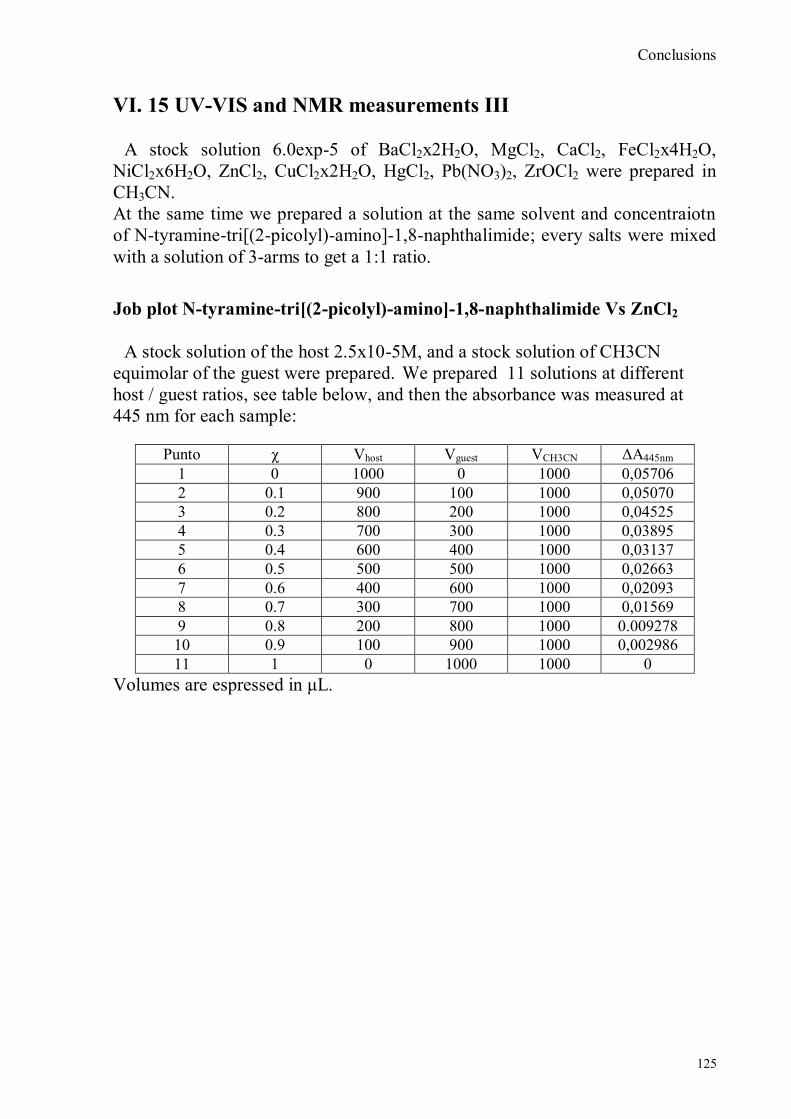
Conclusions
125
VI. 15 UV-VIS and NMR measurements III
A stock solution 6.0exp-5 of BaCl2x2H2O, MgCl2, CaCl2, FeCl2x4H2O,
NiCl2x6H2O, ZnCl2, CuCl2x2H2O, HgCl2, Pb(NO3)2, ZrOCl2 were prepared in
CH3CN.
At the same time we prepared a solution at the same solvent and concentraiotn
of N-tyramine-tri[(2-picolyl)-amino]-1,8-naphthalimide; every salts were mixed
with a solution of 3-arms to get a 1:1 ratio.
Job plot N-tyramine-tri[(2-picolyl)-amino]-1,8-naphthalimide Vs ZnCl2
A stock solution of the host 2.5x10⁻⁵M, and a stock solution of CH3CN
equimolar of the guest were prepared. We prepared 11 solutions at different
host / guest ratios, see table below, and then the absorbance was measured at
445 nm for each sample:
Punto χ Vhost Vguest VCH3CN
ΔA445nm
1 0 1000 0 1000 0,05706
2 0.1 900 100 1000 0,05070
3 0.2 800 200 1000 0,04525
4 0.3 700 300 1000 0,03895
5 0.4 600 400 1000 0,03137
6 0.5 500 500 1000 0,02663
7 0.6 400 600 1000 0,02093
8 0.7 300 700 1000 0,01569
9 0.8 200 800 1000 0.009278
10 0.9 100 900 1000 0,002986
11 1 0 1000 1000 0
Volumes are espressed in μL.

Conclusions
126
The graph report ΔA/χ Vs χ:
JOB PLOT
-0,002
0
0,002
0,004
0,006
0,008
0,01
0,012
0,014
0,016
0,018
0 0,2 0,4 0,6 0,8 1
x
DA
Fig. 59. Job plot N-tyramine-tri[(2-picolyl)-amino]-1,8-naphthalimide Vs ZnCl2
1H-NMR titration
Two equimolar (M = 2.9exp-3) stock solutions were prepared in acetone-d6 of
N-tyramine-tri[(2-picolyl)-amino]-1,8-naphthalimide and ZnCl2. Progressive
additions of ZnCl2 are made to obtain the following ratios: 0, 0.2, 0.4, 0.6, 0.8,
1, 1.2, 1.4, 1.6, 1.8, 2, 2.2, 3, 4, 5. Each spectrum was recorded after every
addiction.
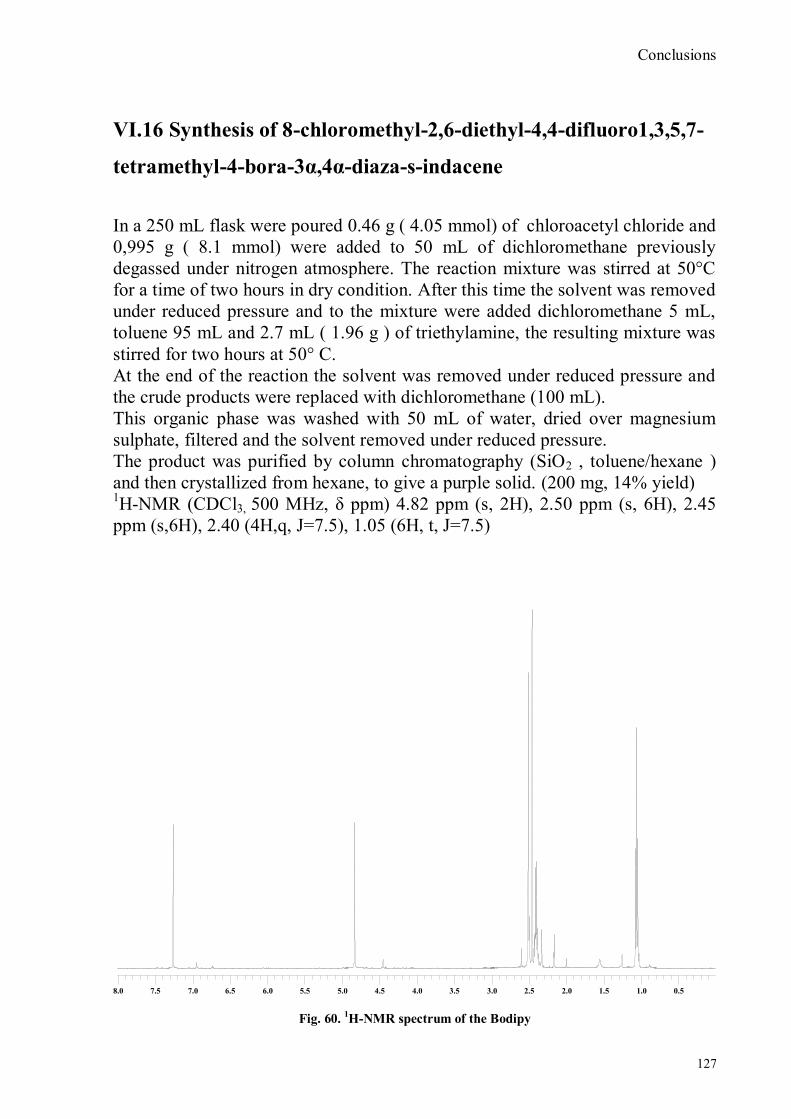
Conclusions
127
VI.16 Synthesis of 8-chloromethyl-2,6-diethyl-4,4-difluoro1,3,5,7-
tetramethyl-4-bora-3α,4α-diaza-s-indacene
In a 250 mL flask were poured 0.46 g ( 4.05 mmol) of chloroacetyl chloride and
0,995 g ( 8.1 mmol) were added to 50 mL of dichloromethane previously
degassed under nitrogen atmosphere. The reaction mixture was stirred at 50°C
for a time of two hours in dry condition. After this time the solvent was removed
under reduced pressure and to the mixture were added dichloromethane 5 mL,
toluene 95 mL and 2.7 mL ( 1.96 g ) of triethylamine, the resulting mixture was
stirred for two hours at 50° C.
At the end of the reaction the solvent was removed under reduced pressure and
the crude products were replaced with dichloromethane (100 mL).
This organic phase was washed with 50 mL of water, dried over magnesium
sulphate, filtered and the solvent removed under reduced pressure.
The product was purified by column chromatography (SiO2 , toluene/hexane )
and then crystallized from hexane, to give a purple solid. (200 mg, 14% yield) 1H-NMR (CDCl3, 500 MHz, δ ppm) 4.82 ppm (s, 2H), 2.50 ppm (s, 6H), 2.45
ppm (s,6H), 2.40 (4H,q, J=7.5), 1.05 (6H, t, J=7.5)
0.50.51.01.01.51.52.02.02.52.53.03.03.53.54.04.04.54.55.05.05.55.56.06.06.56.57.07.07.57.58.08.0
Fig. 60. 1H-NMR spectrum of the Bodipy
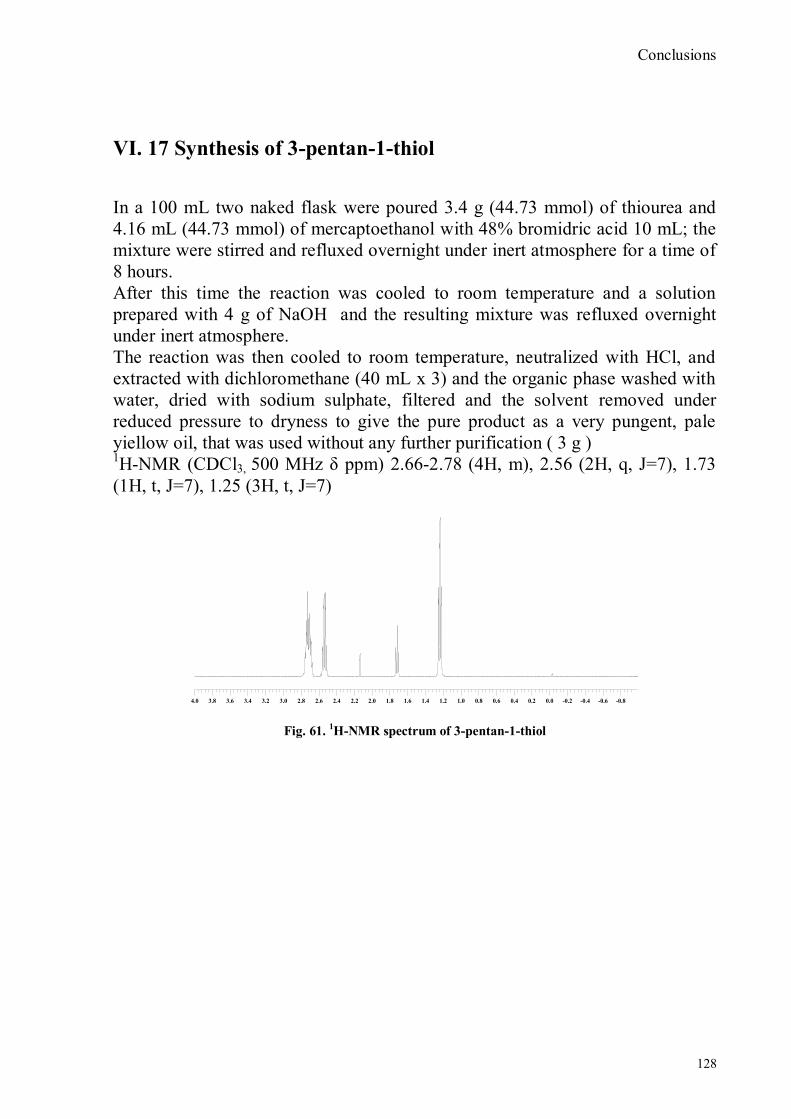
Conclusions
128
VI. 17 Synthesis of 3-pentan-1-thiol
In a 100 mL two naked flask were poured 3.4 g (44.73 mmol) of thiourea and
4.16 mL (44.73 mmol) of mercaptoethanol with 48% bromidric acid 10 mL; the
mixture were stirred and refluxed overnight under inert atmosphere for a time of
8 hours.
After this time the reaction was cooled to room temperature and a solution
prepared with 4 g of NaOH and the resulting mixture was refluxed overnight
under inert atmosphere.
The reaction was then cooled to room temperature, neutralized with HCl, and
extracted with dichloromethane (40 mL x 3) and the organic phase washed with
water, dried with sodium sulphate, filtered and the solvent removed under
reduced pressure to dryness to give the pure product as a very pungent, pale
yiellow oil, that was used without any further purification ( 3 g ) 1H-NMR (CDCl3, 500 MHz δ ppm) 2.66-2.78 (4H, m), 2.56 (2H, q, J=7), 1.73
(1H, t, J=7), 1.25 (3H, t, J=7)
-0.8-0.8-0.6-0.6-0.4-0.4-0.2-0.20.00.00.20.20.40.40.60.60.80.81.01.01.21.21.41.41.61.61.81.82.02.02.22.22.42.42.62.62.82.83.03.03.23.23.43.43.63.63.83.84.04.0
Fig. 61. 1H-NMR spectrum of 3-pentan-1-thiol

Conclusions
129
VI. 18 Synthesis of 3,6,12,15,Tetrathia-9-monoazaheptadecane
In a two nacked flask under nitrogen atmosphere were poured 2.76 g (120
mmol) of sodium, 2.5 g (33.6 mmol) of 3-thiapenthan-1-thiol in 75 mL of
ethanol absolute and the resulting mixture were slowly heated to reflux; at the
same time a previously prepared solution of ethanol 40 mL and bis-(2-
chloroethyl) amine hydrochloride 1.5 g (16.8 mmol) for 4 hours. Then the
solvent was removed under vacuum.
The product was purified by column chromatography (SiO2, eluent mix 5%
Methanol/ dichloromethane) to give the desired product as a brown oil. 1H-NMR (CDCl3, 500 MHz δ ppm) 2.81 ( 4H, t, J=6.5 Hz), 2.64-2.75 ( 12H, m),
2.52 ( 4H, q, J=7 Hz), 1.79 ( 1H, br), 1.22 ( 6H, t, J=7 Hz).
0.50.51.01.01.51.52.02.02.52.53.03.03.53.54.04.04.54.55.05.05.55.56.06.06.56.57.07.07.57.58.08.0
Fig. 62. 1H-NMR spectrum of 3,6,12,15,Tetrathia-9-monoazaheptadecane

Conclusions
130
VI.19 Synthesis of 8-[N,N-bis(3’,6’-dithiaoctyl)-aminomethyl]-2,6-
diethyl-4,4-difluoro-1,3,5,7-tetramethyl-4-bora-3α,4α-diaza-s-
indacene CS1(Copper sensor-1)
A suspension of 150 mg of BODIPY (0.25 mmol) and 260 mg (0.82 mmol) of
3,6,12,15,Tetrathia-9-monoazaheptadecane with 150 mg ( 0,9 mmol) of KI and
125 mg ( 0.9 mmol) of K2CO3 in 50 mL of dry acetonitrile was refluxed under
nitrogen atmosphere overnight.
Then the solvent was removed under vacuum and the residue replaced with
dichloromethane (100 mL).
The organic phase was washed with water, dried with magnesium
sulphate,filtered and the solvent removed under reduced pressure.
The crude was purified by column chromatography and the product re-purified
by flash chromatography (SiO2, eluent mixing: dichloromethane/exhane 1:1) to
give 19.2 mg (12% yield) of pure product as a bright red solid. 1H-NMR (CDCl3, 500 MHz, δ ppm) 4.02 ppm( 2H, s), 2.87 ppm ( 4H,t, J=7.5
Hz), 2.52-2.65 ppm (16 H, m), 2.5 ppm ( 6H, s), 2.4 ppm (6H, s), 2.38 ppm (4H,
q, J=7.5 Hz), 1.24 ( 6H, t, J= 7.5 Hz), 1.05 (6 H, t, J=7 Hz). 13
C-NMR (CDCl3, 125 MHz, δ ppm) 134.43, 131.15, 129.96, 128.83, 124.98,
124.74, 122.88, 115.5, 104.7, 68.07, 65.49, 59.13, 47.46, 41.82, 38.64, 33.47,
32.21, 31.68, 29.63, 24.11, 19.72.
-0.5-0.50.00.00.50.51.01.01.51.52.02.02.52.53.03.03.53.54.04.04.54.55.05.05.55.56.06.06.56.57.07.07.57.58.08.08.58.59.09.0
Fig. 63. 1H-NMR spectrum CS1
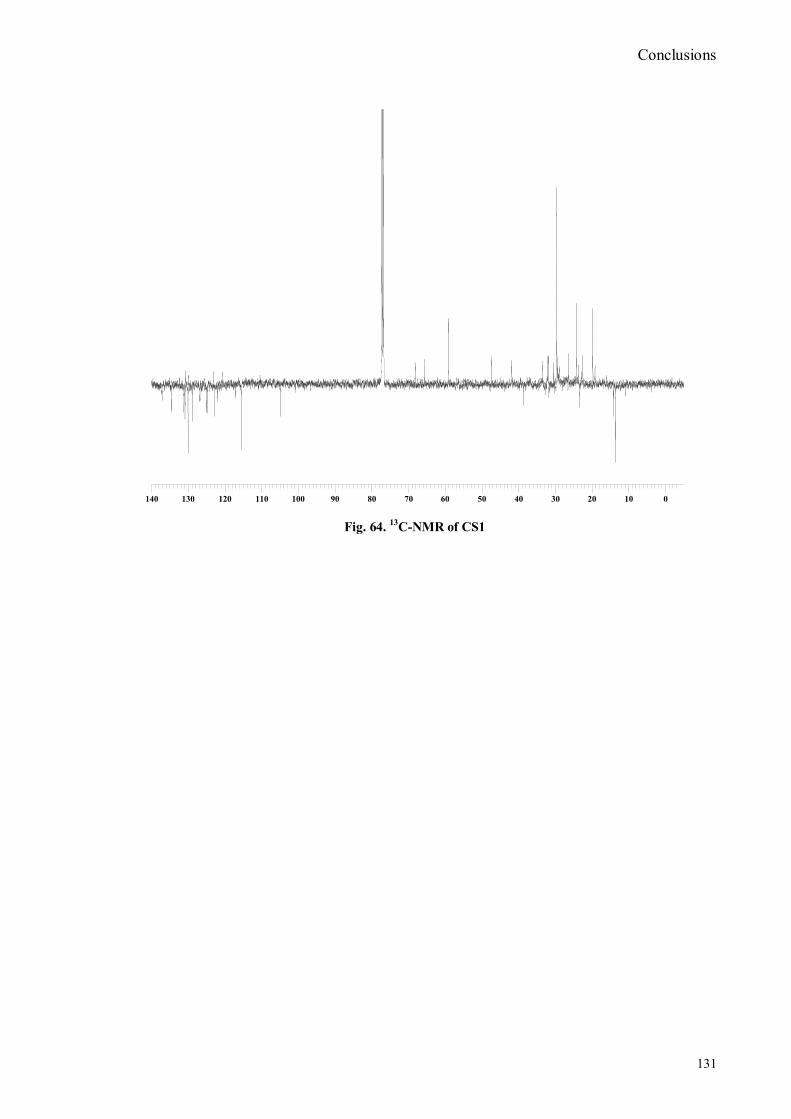
Conclusions
131
00101020203030404050506060707080809090100100110110120120130130140140
Fig. 64. 13
C-NMR of CS1
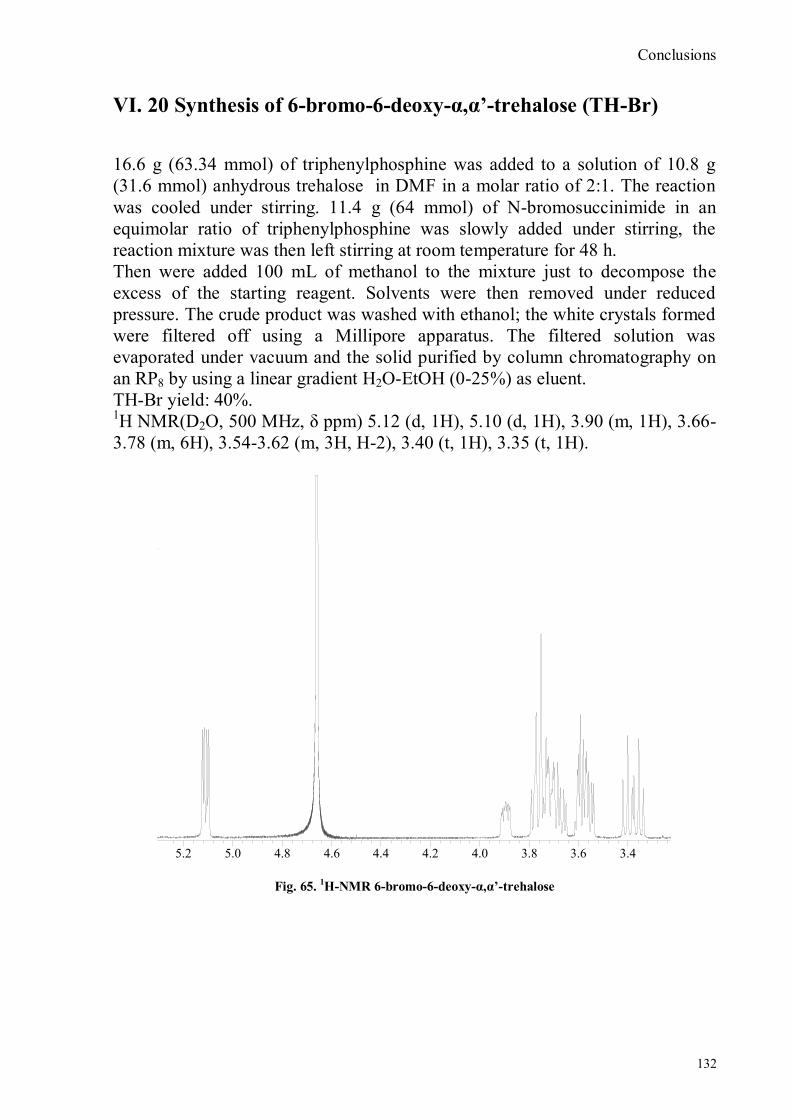
Conclusions
132
VI. 20 Synthesis of 6-bromo-6-deoxy-α,α’-trehalose (TH-Br)
16.6 g (63.34 mmol) of triphenylphosphine was added to a solution of 10.8 g
(31.6 mmol) anhydrous trehalose in DMF in a molar ratio of 2:1. The reaction
was cooled under stirring. 11.4 g (64 mmol) of N-bromosuccinimide in an
equimolar ratio of triphenylphosphine was slowly added under stirring, the
reaction mixture was then left stirring at room temperature for 48 h.
Then were added 100 mL of methanol to the mixture just to decompose the
excess of the starting reagent. Solvents were then removed under reduced
pressure. The crude product was washed with ethanol; the white crystals formed
were filtered off using a Millipore apparatus. The filtered solution was
evaporated under vacuum and the solid purified by column chromatography on
an RP8 by using a linear gradient H2O-EtOH (0-25%) as eluent.
TH-Br yield: 40%. 1H NMR(D2O, 500 MHz, δ ppm) 5.12 (d, 1H), 5.10 (d, 1H), 3.90 (m, 1H), 3.66-
3.78 (m, 6H), 3.54-3.62 (m, 3H, H-2), 3.40 (t, 1H), 3.35 (t, 1H).
3.43.43.63.63.83.84.04.04.24.24.44.44.64.64.84.85.05.05.25.2
Fig. 65. 1H-NMR 6-bromo-6-deoxy-α,α’-trehalose
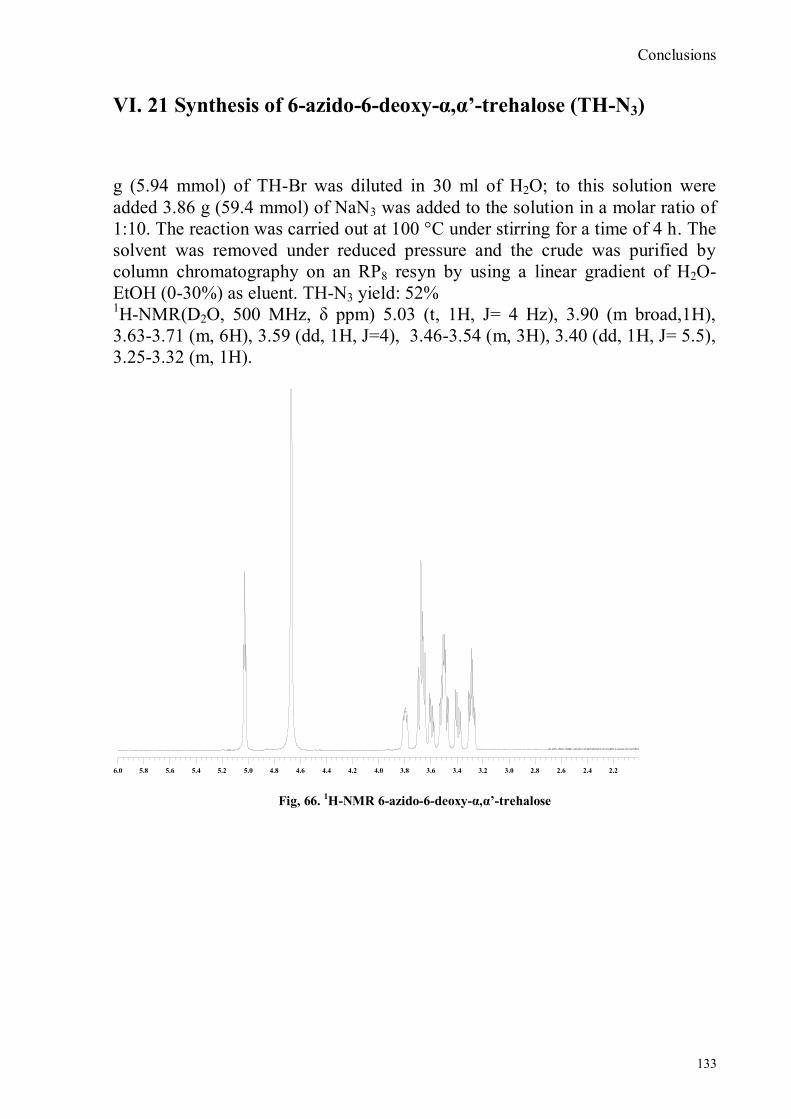
Conclusions
133
VI. 21 Synthesis of 6-azido-6-deoxy-α,α’-trehalose (TH-N3)
g (5.94 mmol) of TH-Br was diluted in 30 ml of H2O; to this solution were
added 3.86 g (59.4 mmol) of NaN3 was added to the solution in a molar ratio of
1:10. The reaction was carried out at 100 °C under stirring for a time of 4 h. The
solvent was removed under reduced pressure and the crude was purified by
column chromatography on an RP8 resyn by using a linear gradient of H2O-
EtOH (0-30%) as eluent. TH-N3 yield: 52% 1H-NMR(D2O, 500 MHz, δ ppm) 5.03 (t, 1H, J= 4 Hz), 3.90 (m broad,1H),
3.63-3.71 (m, 6H), 3.59 (dd, 1H, J=4), 3.46-3.54 (m, 3H), 3.40 (dd, 1H, J= 5.5),
3.25-3.32 (m, 1H).
2.22.22.42.42.62.62.82.83.03.03.23.23.43.43.63.63.83.84.04.04.24.24.44.44.64.64.84.85.05.05.25.25.45.45.65.65.85.86.06.0
Fig, 66. 1H-NMR 6-azido-6-deoxy-α,α’-trehalose

Conclusions
134
VI. 22 Synthesis of 6-amino-6-deoxy-α,α’-trehalose (TH-NH2)
1.05 g (2.86 mmol) of TH-N3 was diluted in DMF, to this solution was added
5.25 g (20.04 mmol) of PPh3. The reaction was carried out at 40 °C under
stirring for 1 h. The product was treated with 30% of NH4OH at room
temperature. After 23 h, white crystals were formed that has been filtered off
using a Millipore apparatus. The filtered solution was evaporated under reduced
pressure and the product was purified by column chromatography of CM-
Sephadex C-25 (20x600 mm, NH4+ form), using a linear gradient of H2O-
NH4HCO3 (0-0,3 M) as eluent.
TH-NH2 yield: 61%. 1H-NMR(D2O, 500 MHz, δ ppm) 5.1 (m, 2H), 3.78-3.64 (m, 6H), 3.57-3.53 (m,
2H), 3.34 (t, 1H, J=9 Hz), 3.24 (t, 1H, J=9 Hz), 3.03 (dd, 1H, J=3Hz), 2.77 (dd,
1H,J=3Hz).
2.82.83.03.03.23.23.43.43.63.63.83.84.04.04.24.24.44.44.64.64.84.85.05.05.25.2
Fig. 67. 1H-NMR 6-amino-6-deoxy-α,α’-trehalose
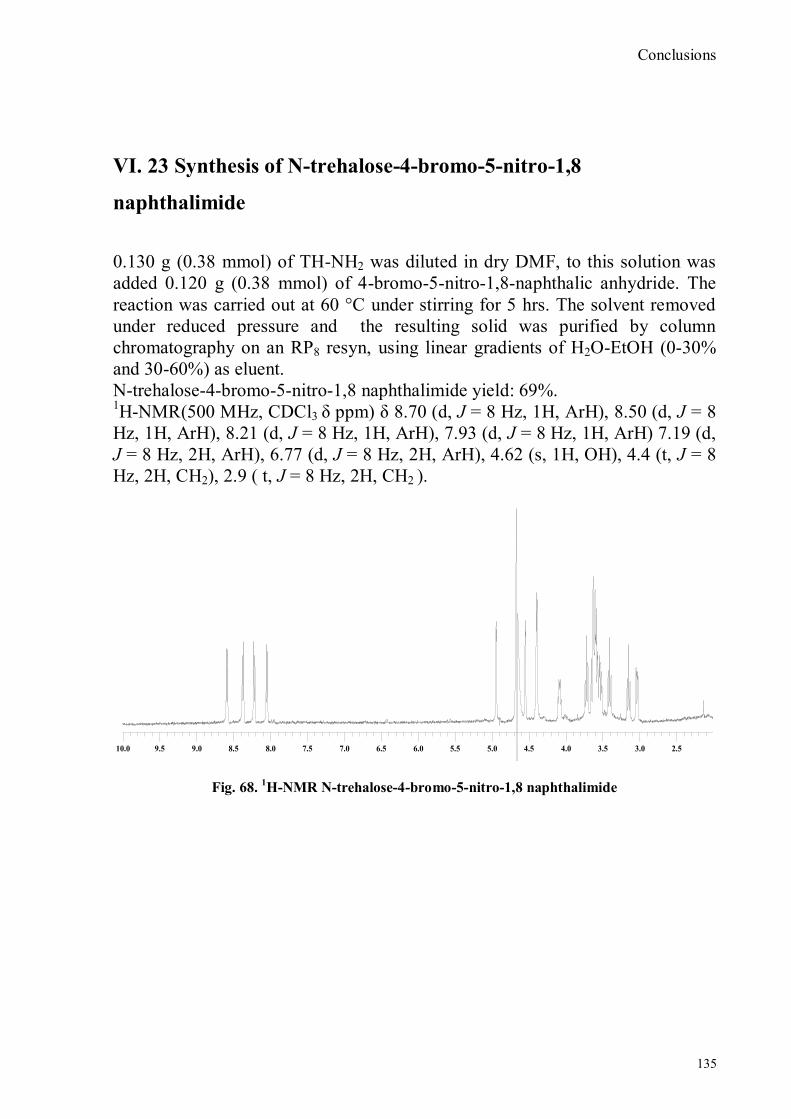
Conclusions
135
VI. 23 Synthesis of N-trehalose-4-bromo-5-nitro-1,8
naphthalimide
0.130 g (0.38 mmol) of TH-NH2 was diluted in dry DMF, to this solution was
added 0.120 g (0.38 mmol) of 4-bromo-5-nitro-1,8-naphthalic anhydride. The
reaction was carried out at 60 °C under stirring for 5 hrs. The solvent removed
under reduced pressure and the resulting solid was purified by column
chromatography on an RP8 resyn, using linear gradients of H2O-EtOH (0-30%
and 30-60%) as eluent.
N-trehalose-4-bromo-5-nitro-1,8 naphthalimide yield: 69%. 1H-NMR(500 MHz, CDCl3 δ ppm) δ 8.70 (d, J = 8 Hz, 1H, ArH), 8.50 (d, J = 8
Hz, 1H, ArH), 8.21 (d, J = 8 Hz, 1H, ArH), 7.93 (d, J = 8 Hz, 1H, ArH) 7.19 (d,
J = 8 Hz, 2H, ArH), 6.77 (d, J = 8 Hz, 2H, ArH), 4.62 (s, 1H, OH), 4.4 (t, J = 8
Hz, 2H, CH2), 2.9 ( t, J = 8 Hz, 2H, CH2 ).
2.52.53.03.03.53.54.04.04.54.55.05.05.55.56.06.06.56.57.07.07.57.58.08.08.58.59.09.09.59.510.010.0
Fig. 68. 1H-NMR N-trehalose-4-bromo-5-nitro-1,8 naphthalimide
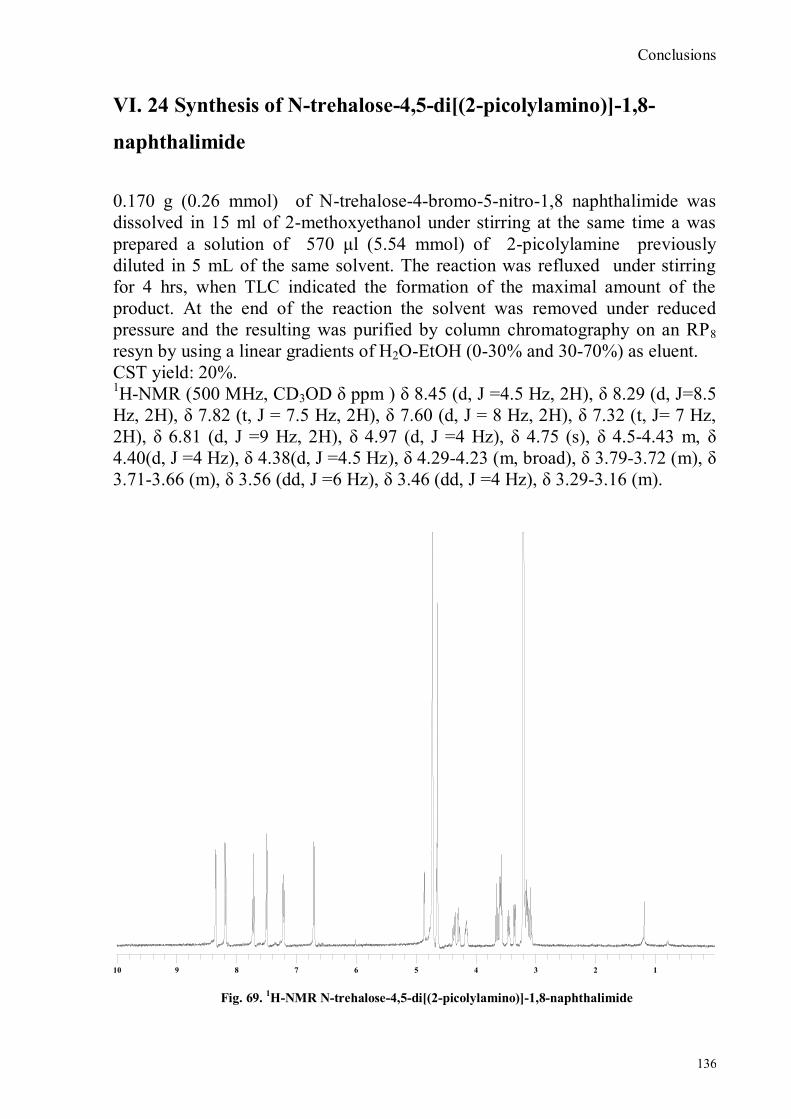
Conclusions
136
VI. 24 Synthesis of N-trehalose-4,5-di[(2-picolylamino)]-1,8-
naphthalimide
0.170 g (0.26 mmol) of N-trehalose-4-bromo-5-nitro-1,8 naphthalimide was
dissolved in 15 ml of 2-methoxyethanol under stirring at the same time a was
prepared a solution of 570 μl (5.54 mmol) of 2-picolylamine previously
diluted in 5 mL of the same solvent. The reaction was refluxed under stirring
for 4 hrs, when TLC indicated the formation of the maximal amount of the
product. At the end of the reaction the solvent was removed under reduced
pressure and the resulting was purified by column chromatography on an RP8
resyn by using a linear gradients of H2O-EtOH (0-30% and 30-70%) as eluent.
CST yield: 20%. 1H-NMR (500 MHz, CD3OD δ ppm ) δ 8.45 (d, J =4.5 Hz, 2H), δ 8.29 (d, J=8.5
Hz, 2H), δ 7.82 (t, J = 7.5 Hz, 2H), δ 7.60 (d, J = 8 Hz, 2H), δ 7.32 (t, J= 7 Hz,
2H), δ 6.81 (d, J =9 Hz, 2H), δ 4.97 (d, J =4 Hz), δ 4.75 (s), δ 4.5-4.43 m, δ
4.40(d, J =4 Hz), δ 4.38(d, J =4.5 Hz), δ 4.29-4.23 (m, broad), δ 3.79-3.72 (m), δ
3.71-3.66 (m), δ 3.56 (dd, J =6 Hz), δ 3.46 (dd, J =4 Hz), δ 3.29-3.16 (m).
1122334455667788991010
Fig. 69. 1H-NMR N-trehalose-4,5-di[(2-picolylamino)]-1,8-naphthalimide
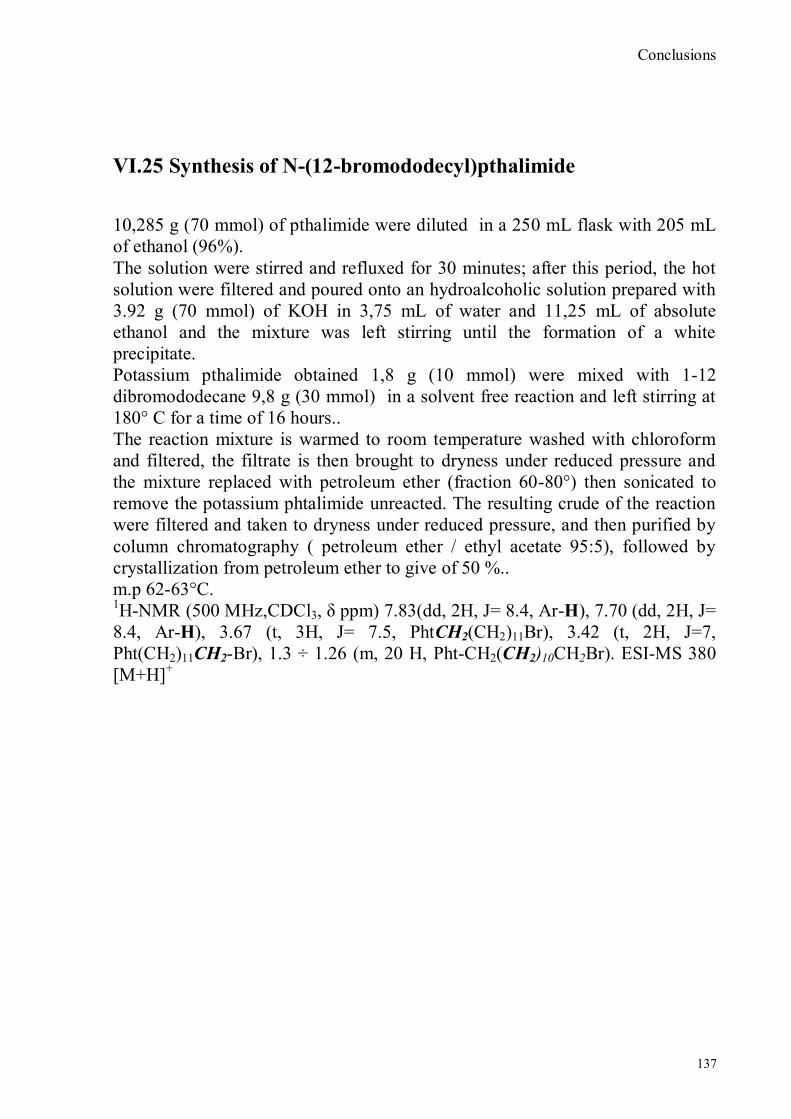
Conclusions
137
VI.25 Synthesis of N-(12-bromododecyl)pthalimide
10,285 g (70 mmol) of pthalimide were diluted in a 250 mL flask with 205 mL
of ethanol (96%).
The solution were stirred and refluxed for 30 minutes; after this period, the hot
solution were filtered and poured onto an hydroalcoholic solution prepared with
3.92 g (70 mmol) of KOH in 3,75 mL of water and 11,25 mL of absolute
ethanol and the mixture was left stirring until the formation of a white
precipitate.
Potassium pthalimide obtained 1,8 g (10 mmol) were mixed with 1-12
dibromododecane 9,8 g (30 mmol) in a solvent free reaction and left stirring at
180° C for a time of 16 hours..
The reaction mixture is warmed to room temperature washed with chloroform
and filtered, the filtrate is then brought to dryness under reduced pressure and
the mixture replaced with petroleum ether (fraction 60-80°) then sonicated to
remove the potassium phtalimide unreacted. The resulting crude of the reaction
were filtered and taken to dryness under reduced pressure, and then purified by
column chromatography ( petroleum ether / ethyl acetate 95:5), followed by
crystallization from petroleum ether to give of 50 %..
m.p 62-63°C. 1H-NMR (500 MHz,CDCl3, δ ppm) 7.83(dd, 2H, J= 8.4, Ar-H), 7.70 (dd, 2H, J=
8.4, Ar-H), 3.67 (t, 3H, J= 7.5, PhtCH2(CH2)11Br), 3.42 (t, 2H, J=7,
Pht(CH2)11CH2-Br), 1.3 ÷ 1.26 (m, 20 H, Pht-CH2(CH2)10CH2Br). ESI-MS 380
[M+H]+

Conclusions
138
0.50.51.01.01.51.52.02.02.52.53.03.03.53.54.04.04.54.55.05.05.55.56.06.06.56.57.07.07.57.58.08.08.58.59.09.0
Fig. 70. 1H- NMR spectrum of N-(12-bromododecyl)pthalimide

Conclusions
139
VI. 26 Synthesis of 2-hydroxy-3-oxy-dodecyl-pthalimido-
benzaldehyde
1 g (7,24 mmol) of 2-3-di-hydroxy-benzaldheyde were diluted in 10 mL DMSO
in a 100 mL 3 naked flask; to this were added 800 mg (33,3 mmol) of sodium
hydride 60% previously washed in pentane.
After this added was noted a chromatic change of the solution that soonely
change from yellow to dark brown the reaction were left stirring for a hour.The
reaction proceed at room temperature under stirring for a hour at room
temperature.
After this time, to the reaction mixture were added dropwise 3,2 g of 12-
bromododecyl pthalimide previously dissolved in 20 mL of DMSO under
stirring and at room temperature.
The reaction were monitored by TLC (eluent chloroform) and were noticed the
formation of two spots corresponding to the mono-alkilated and the di-alkilated
aldehyde, the reaction was stopped after 7 hours.
At the end of the reaction the reaction mixture were poured into 100 mL of cold
water and the crude product extracted 5 times with chloroform.
The organic layer were dried with dry magnesium sulphate, filtered and the
solvent removed under reduced pressure.
The product were purified by column chromatography (SiO2 / Chlorophorm)
with 40% yield. The product were presented as a pale yellow solid. 1H-NMR (500 MHz,CDCl3,δ ppm) 10.98 (s, 1H, OH), 9.92 (s, 1H, ArCHO),
7.83 (d di d, 2H, J=2.5 Hz, ArPhtH), 7.70 (d di d, 2H, J=2.5 Hz, ArPhtH), 7.17
(d, 1H, J=1, ArH), 7.11 (d, 1H, J=1, ArH), 6.93 (t, 1H, J=7.5, ArH), 4.04 (t, 3H,
J= 7,PhtNCH2(CH2)11Ar), 3.68 (t, 2H,J=7,Pht(CH2)11CH2-Ar), 1.28 (m, 20H,
Pht-CH2(CH2)10CH2Ar). ESI-MS m/z 438 [M+H]+
13C-NMR (125 MHz, CDCl3 ) 196.4, 188.4, 151.9, 147.7, 133.8, 132.2, 130.8,
128.8, 124.5, 123.1, 120.94, 119.54, 119.47.

Conclusions
140
112233445566778899101011111212
Fig. 71. 1H-NMR spectrum of 2-hydroxy-3-oxy-dodecylphtalimido-benzaldheyde
Fig. 72. 13
C-APT spectrum of 2--hydroxy-3-oxy-dodecylphtalimido-benzaldheyde

Conclusions
141
VI. 27 Synthesis of the ligand
To 200 mg ( 0,44 mmol ) 2-hydroxy-3-oxo-dodecyl-pthalimido-benzaldehyde
was dissolved in the minimum amount of dichloromethane and 20 mL of ethanol
absolute to this were added 47 mg (0,22 mmol ) of 1R,2R
diphenylethylendiamine previously diluted in 5 mL of absolute ethanol.
The reaction proceed until the disappearing of the reagent, the reaction was
monitored by TLC. Quantitative yield. 1H-NMR (500 MHz,CDCl3,δ ppm) 13.66 (s, 2H, OH), 8.36 (s, 2H, ArCHN),
7.84 (dd, 4H, J= 8.5, ArPhtH), 7.71 (dd, 4H, J=8.5, ArPhtH), 7.16 (m, 10H, ArH
diphenylic bridge), 6.88 (d, 2H,J=7.5, ArH), 6.78 (d, 2H, J=7, ArH), 6.71 (t, 2H,
J= 8, ArH), 4.68 (s, 2H, CH diphenylic bridge) 4.00 (t, 4H, J= 7,
PhtNCH2(CH2)11Ar), 3.69 (t, 4H, J= 7.5, Pht(CH2)11CH2-Ar), 1.28 (m, 20H, Pht-
CH2(CH2)10CH2Ar). ESI-MS m/z 1080 [M+H]+
13C-NMR (125 MHz, CDCl3, δ ppm): 166.2, 151.3, 147.4, 139.3, 133.8, 133.7,
132.1, 128.2, 127.7, 127.6, 123.4, 123, 118.6, 115.7, 80.43, 69.2, 38, 29.7, 29.5,
29.4, 29.3, 29.2, 28.6, 28.8, 26.
00112233445566778899101011111212131314141515
Fig. 73. 1H-NMR spectrum of the ligand-pht
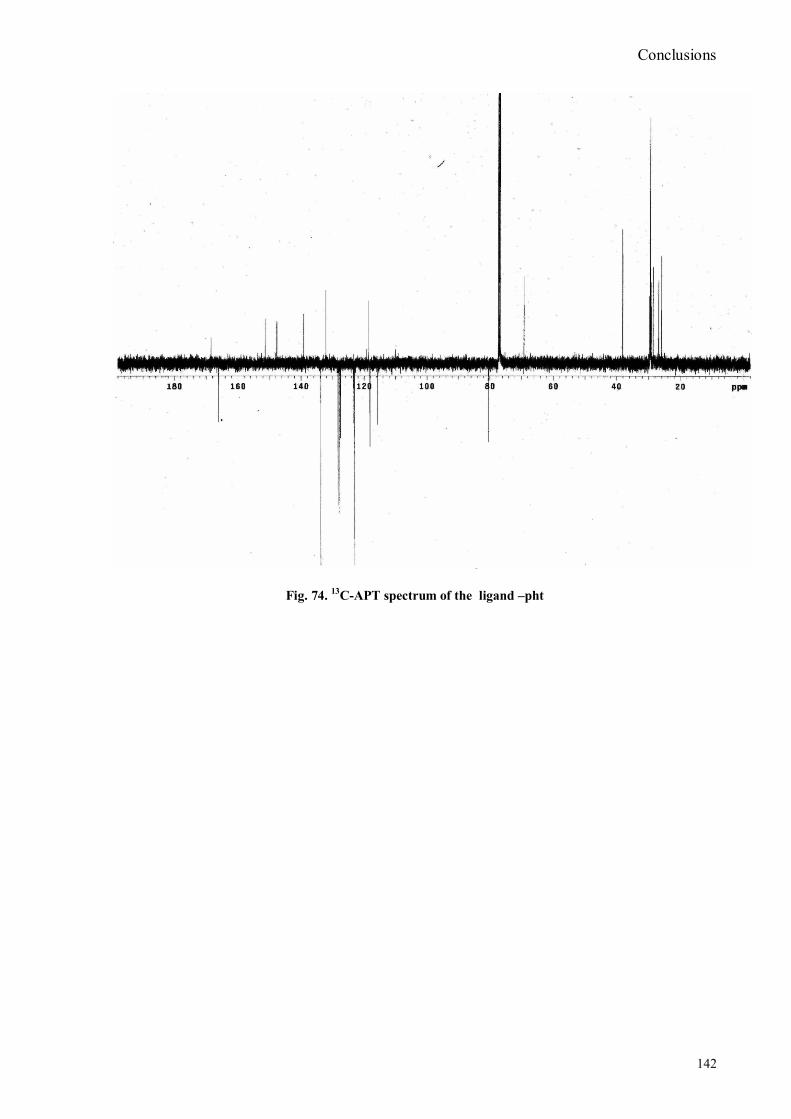
Conclusions
142
Fig. 74. 13
C-APT spectrum of the ligand –pht
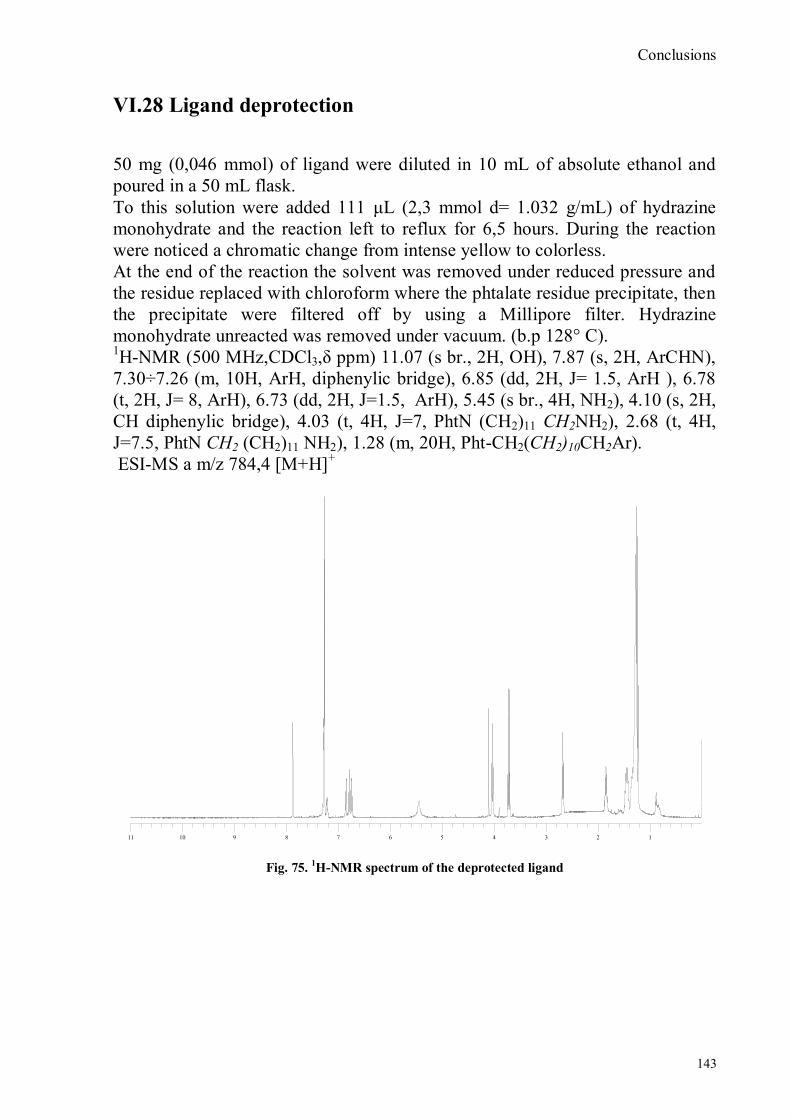
Conclusions
143
VI.28 Ligand deprotection
50 mg (0,046 mmol) of ligand were diluted in 10 mL of absolute ethanol and
poured in a 50 mL flask.
To this solution were added 111 μL (2,3 mmol d= 1.032 g/mL) of hydrazine
monohydrate and the reaction left to reflux for 6,5 hours. During the reaction
were noticed a chromatic change from intense yellow to colorless.
At the end of the reaction the solvent was removed under reduced pressure and
the residue replaced with chloroform where the phtalate residue precipitate, then
the precipitate were filtered off by using a Millipore filter. Hydrazine
monohydrate unreacted was removed under vacuum. (b.p 128° C). 1H-NMR (500 MHz,CDCl3,δ ppm) 11.07 (s br., 2H, OH), 7.87 (s, 2H, ArCHN),
7.30÷7.26 (m, 10H, ArH, diphenylic bridge), 6.85 (dd, 2H, J= 1.5, ArH ), 6.78
(t, 2H, J= 8, ArH), 6.73 (dd, 2H, J=1.5, ArH), 5.45 (s br., 4H, NH2), 4.10 (s, 2H,
CH diphenylic bridge), 4.03 (t, 4H, J=7, PhtN (CH2)11 CH2NH2), 2.68 (t, 4H,
J=7.5, PhtN CH2 (CH2)11 NH2), 1.28 (m, 20H, Pht-CH2(CH2)10CH2Ar).
ESI-MS a m/z 784,4 [M+H]+
11223344556677889910101111
Fig. 75. 1H-NMR spectrum of the deprotected ligand
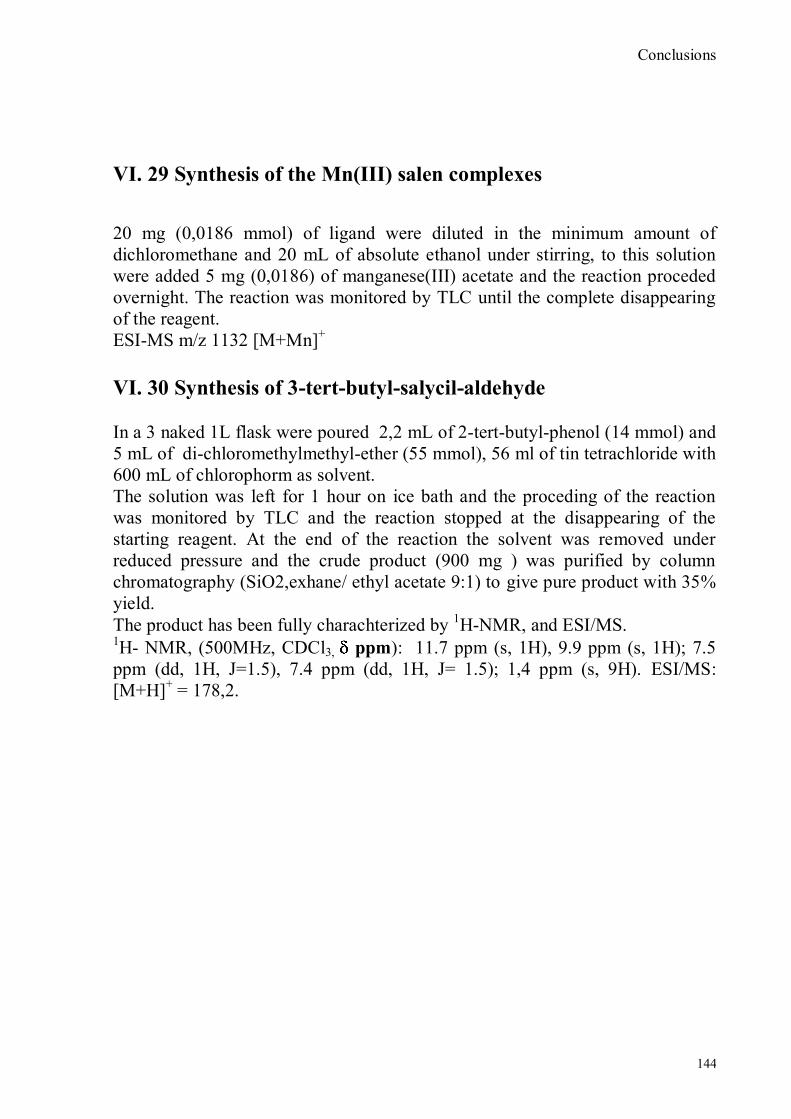
Conclusions
144
VI. 29 Synthesis of the Mn(III) salen complexes
20 mg (0,0186 mmol) of ligand were diluted in the minimum amount of
dichloromethane and 20 mL of absolute ethanol under stirring, to this solution
were added 5 mg (0,0186) of manganese(III) acetate and the reaction proceded
overnight. The reaction was monitored by TLC until the complete disappearing
of the reagent.
ESI-MS m/z 1132 [M+Mn]+
VI. 30 Synthesis of 3-tert-butyl-salycil-aldehyde
In a 3 naked 1L flask were poured 2,2 mL of 2-tert-butyl-phenol (14 mmol) and
5 mL of di-chloromethylmethyl-ether (55 mmol), 56 ml of tin tetrachloride with
600 mL of chlorophorm as solvent.
The solution was left for 1 hour on ice bath and the proceding of the reaction
was monitored by TLC and the reaction stopped at the disappearing of the
starting reagent. At the end of the reaction the solvent was removed under
reduced pressure and the crude product (900 mg ) was purified by column
chromatography (SiO2,exhane/ ethyl acetate 9:1) to give pure product with 35%
yield.
The product has been fully charachterized by 1H-NMR, and ESI/MS.
1H- NMR, (500MHz, CDCl3, ppm): 11.7 ppm (s, 1H), 9.9 ppm (s, 1H); 7.5
ppm (dd, 1H, J=1.5), 7.4 ppm (dd, 1H, J= 1.5); 1,4 ppm (s, 9H). ESI/MS:
[M+H]+ = 178,2.
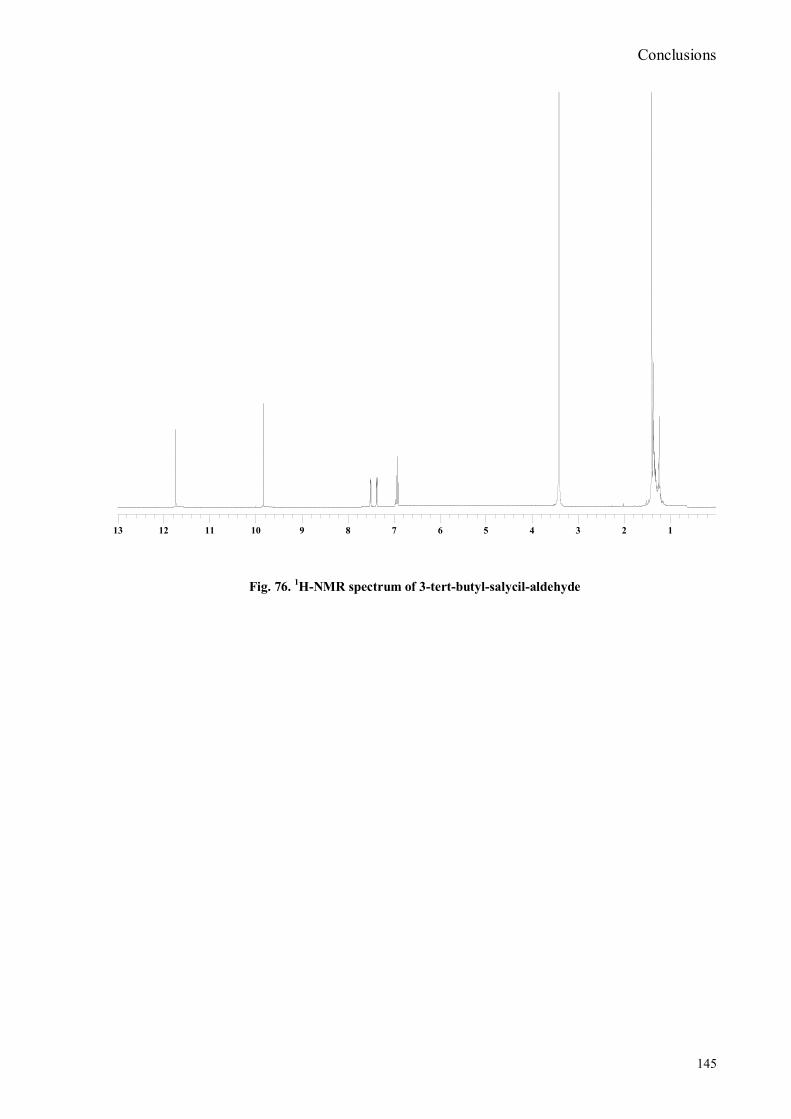
Conclusions
145
1122334455667788991010111112121313
Fig. 76.
1H-NMR spectrum of 3-tert-butyl-salycil-aldehyde
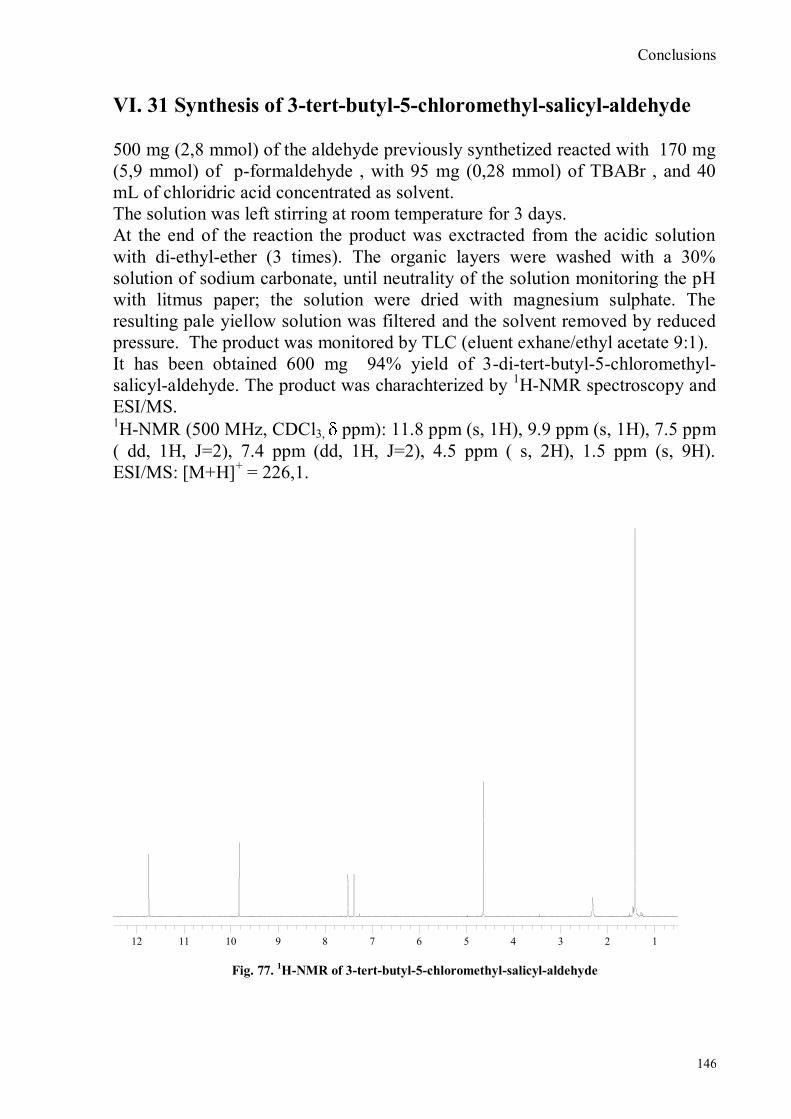
Conclusions
146
VI. 31 Synthesis of 3-tert-butyl-5-chloromethyl-salicyl-aldehyde
500 mg (2,8 mmol) of the aldehyde previously synthetized reacted with 170 mg
(5,9 mmol) of p-formaldehyde , with 95 mg (0,28 mmol) of TBABr , and 40
mL of chloridric acid concentrated as solvent.
The solution was left stirring at room temperature for 3 days.
At the end of the reaction the product was exctracted from the acidic solution
with di-ethyl-ether (3 times). The organic layers were washed with a 30%
solution of sodium carbonate, until neutrality of the solution monitoring the pH
with litmus paper; the solution were dried with magnesium sulphate. The
resulting pale yiellow solution was filtered and the solvent removed by reduced
pressure. The product was monitored by TLC (eluent exhane/ethyl acetate 9:1).
It has been obtained 600 mg 94% yield of 3-di-tert-butyl-5-chloromethyl-
salicyl-aldehyde. The product was charachterized by 1H-NMR spectroscopy and
ESI/MS. 1H-NMR (500 MHz, CDCl3, ppm): 11.8 ppm (s, 1H), 9.9 ppm (s, 1H), 7.5 ppm
( dd, 1H, J=2), 7.4 ppm (dd, 1H, J=2), 4.5 ppm ( s, 2H), 1.5 ppm (s, 9H).
ESI/MS: [M+H]+ = 226,1.
112233445566778899101011111212
Fig. 77. 1H-NMR of 3-tert-butyl-5-chloromethyl-salicyl-aldehyde
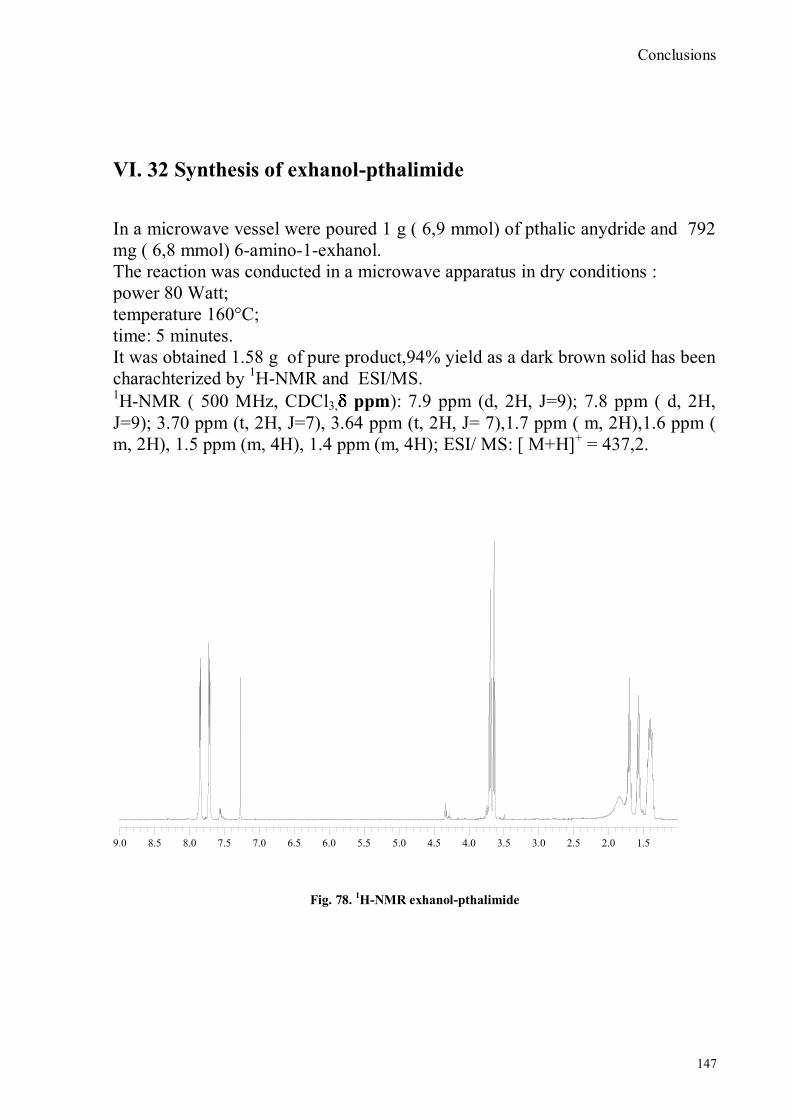
Conclusions
147
VI. 32 Synthesis of exhanol-pthalimide
In a microwave vessel were poured 1 g ( 6,9 mmol) of pthalic anydride and 792
mg ( 6,8 mmol) 6-amino-1-exhanol.
The reaction was conducted in a microwave apparatus in dry conditions :
power 80 Watt;
temperature 160°C;
time: 5 minutes.
It was obtained 1.58 g of pure product,94% yield as a dark brown solid has been
charachterized by 1H-NMR and ESI/MS.
1H-NMR ( 500 MHz, CDCl3, ppm): 7.9 ppm (d, 2H, J=9); 7.8 ppm ( d, 2H,
J=9); 3.70 ppm (t, 2H, J=7), 3.64 ppm (t, 2H, J= 7),1.7 ppm ( m, 2H),1.6 ppm (
m, 2H), 1.5 ppm (m, 4H), 1.4 ppm (m, 4H); ESI/ MS: [ M+H]+ = 437,2.
1.51.52.02.02.52.53.03.03.53.54.04.04.54.55.05.05.55.56.06.06.56.57.07.07.57.58.08.08.58.59.09.0
Fig. 78.
1H-NMR exhanol-pthalimide
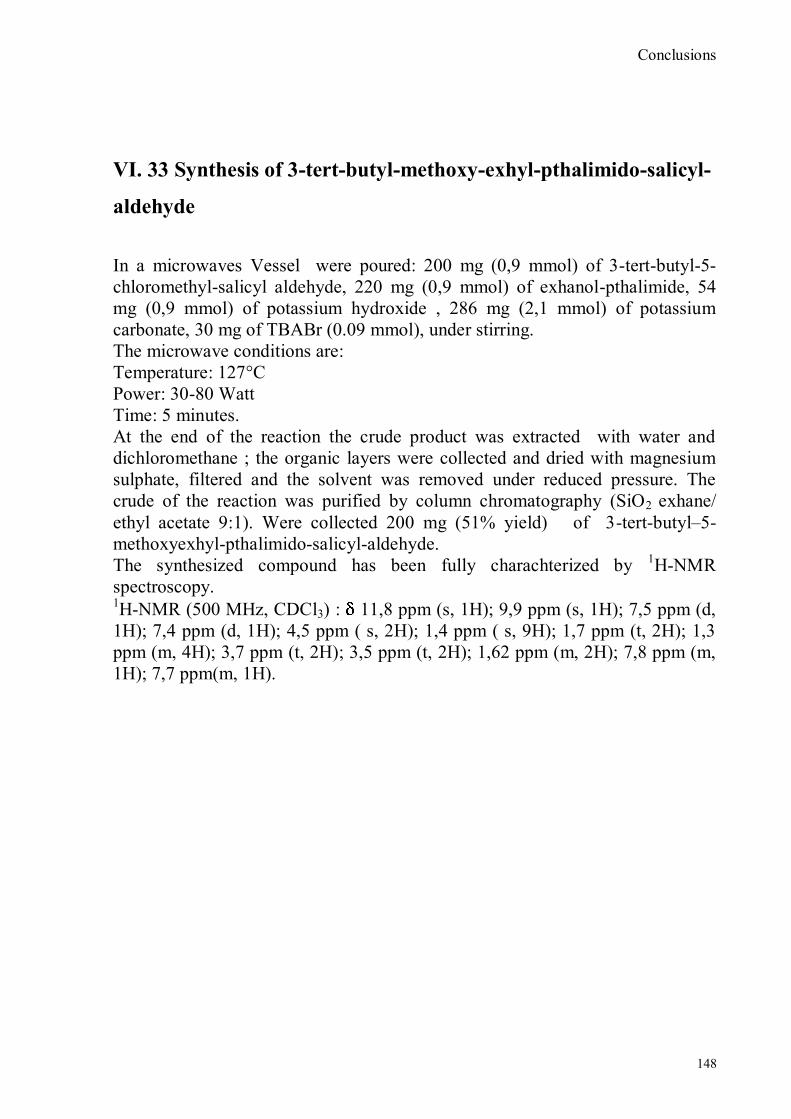
Conclusions
148
VI. 33 Synthesis of 3-tert-butyl-methoxy-exhyl-pthalimido-salicyl-
aldehyde
In a microwaves Vessel were poured: 200 mg (0,9 mmol) of 3-tert-butyl-5-
chloromethyl-salicyl aldehyde, 220 mg (0,9 mmol) of exhanol-pthalimide, 54
mg (0,9 mmol) of potassium hydroxide , 286 mg (2,1 mmol) of potassium
carbonate, 30 mg of TBABr (0.09 mmol), under stirring.
The microwave conditions are:
Temperature: 127°C
Power: 30-80 Watt
Time: 5 minutes.
At the end of the reaction the crude product was extracted with water and
dichloromethane ; the organic layers were collected and dried with magnesium
sulphate, filtered and the solvent was removed under reduced pressure. The
crude of the reaction was purified by column chromatography (SiO2 exhane/
ethyl acetate 9:1). Were collected 200 mg (51% yield) of 3-tert-butyl–5-
methoxyexhyl-pthalimido-salicyl-aldehyde.
The synthesized compound has been fully charachterized by 1H-NMR
spectroscopy. 1H-NMR (500 MHz, CDCl3) : 11,8 ppm (s, 1H); 9,9 ppm (s, 1H); 7,5 ppm (d,
1H); 7,4 ppm (d, 1H); 4,5 ppm ( s, 2H); 1,4 ppm ( s, 9H); 1,7 ppm (t, 2H); 1,3
ppm (m, 4H); 3,7 ppm (t, 2H); 3,5 ppm (t, 2H); 1,62 ppm (m, 2H); 7,8 ppm (m,
1H); 7,7 ppm(m, 1H).
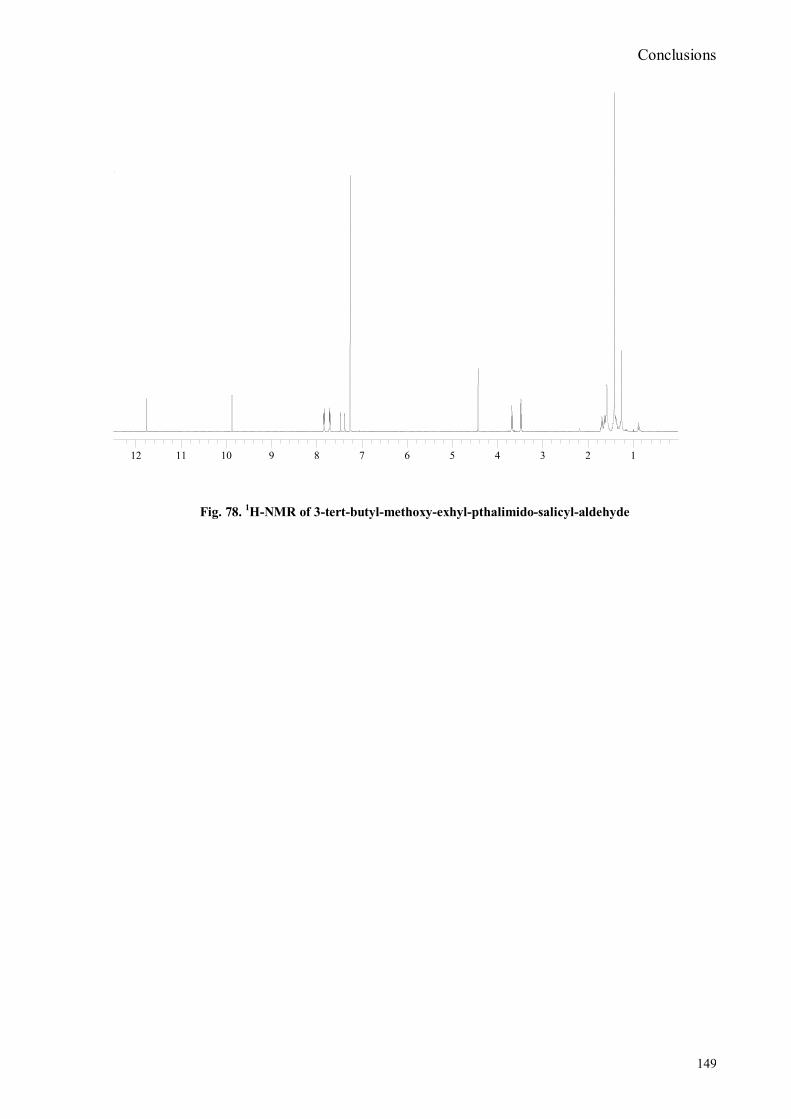
Conclusions
149
112233445566778899101011111212
Fig. 78.
1H-NMR of 3-tert-butyl-methoxy-exhyl-pthalimido-salicyl-aldehyde
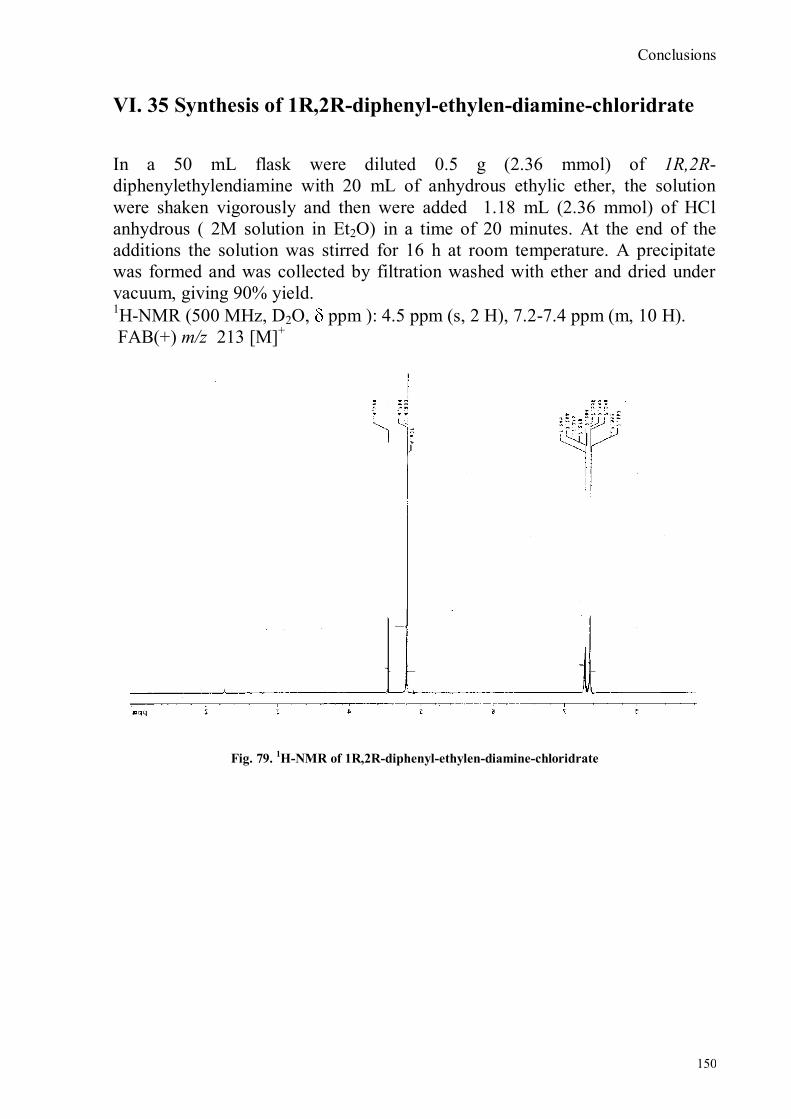
Conclusions
150
VI. 35 Synthesis of 1R,2R-diphenyl-ethylen-diamine-chloridrate
In a 50 mL flask were diluted 0.5 g (2.36 mmol) of 1R,2R-
diphenylethylendiamine with 20 mL of anhydrous ethylic ether, the solution
were shaken vigorously and then were added 1.18 mL (2.36 mmol) of HCl
anhydrous ( 2M solution in Et2O) in a time of 20 minutes. At the end of the
additions the solution was stirred for 16 h at room temperature. A precipitate
was formed and was collected by filtration washed with ether and dried under
vacuum, giving 90% yield. 1H-NMR (500 MHz, D2O, ppm ): 4.5 ppm (s, 2 H), 7.2-7.4 ppm (m, 10 H).
FAB(+) m/z 213 [M]+
Fig. 79.
1H-NMR of 1R,2R-diphenyl-ethylen-diamine-chloridrate
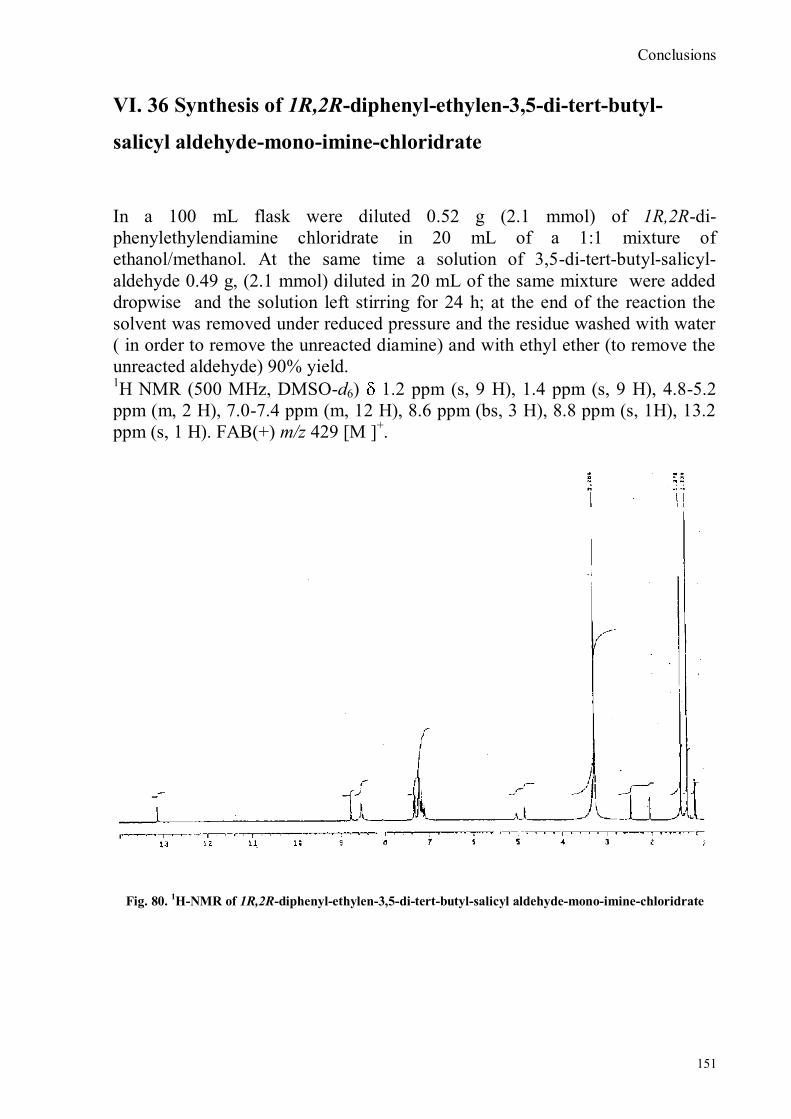
Conclusions
151
VI. 36 Synthesis of 1R,2R-diphenyl-ethylen-3,5-di-tert-butyl-
salicyl aldehyde-mono-imine-chloridrate
In a 100 mL flask were diluted 0.52 g (2.1 mmol) of 1R,2R-di-
phenylethylendiamine chloridrate in 20 mL of a 1:1 mixture of
ethanol/methanol. At the same time a solution of 3,5-di-tert-butyl-salicyl-
aldehyde 0.49 g, (2.1 mmol) diluted in 20 mL of the same mixture were added
dropwise and the solution left stirring for 24 h; at the end of the reaction the
solvent was removed under reduced pressure and the residue washed with water
( in order to remove the unreacted diamine) and with ethyl ether (to remove the
unreacted aldehyde) 90% yield. 1H NMR (500 MHz, DMSO-d6) 1.2 ppm (s, 9 H), 1.4 ppm (s, 9 H), 4.8-5.2
ppm (m, 2 H), 7.0-7.4 ppm (m, 12 H), 8.6 ppm (bs, 3 H), 8.8 ppm (s, 1H), 13.2
ppm (s, 1 H). FAB(+) m/z 429 [M ]+.
Fig. 80.
1H-NMR of 1R,2R-diphenyl-ethylen-3,5-di-tert-butyl-salicyl aldehyde-mono-imine-chloridrate
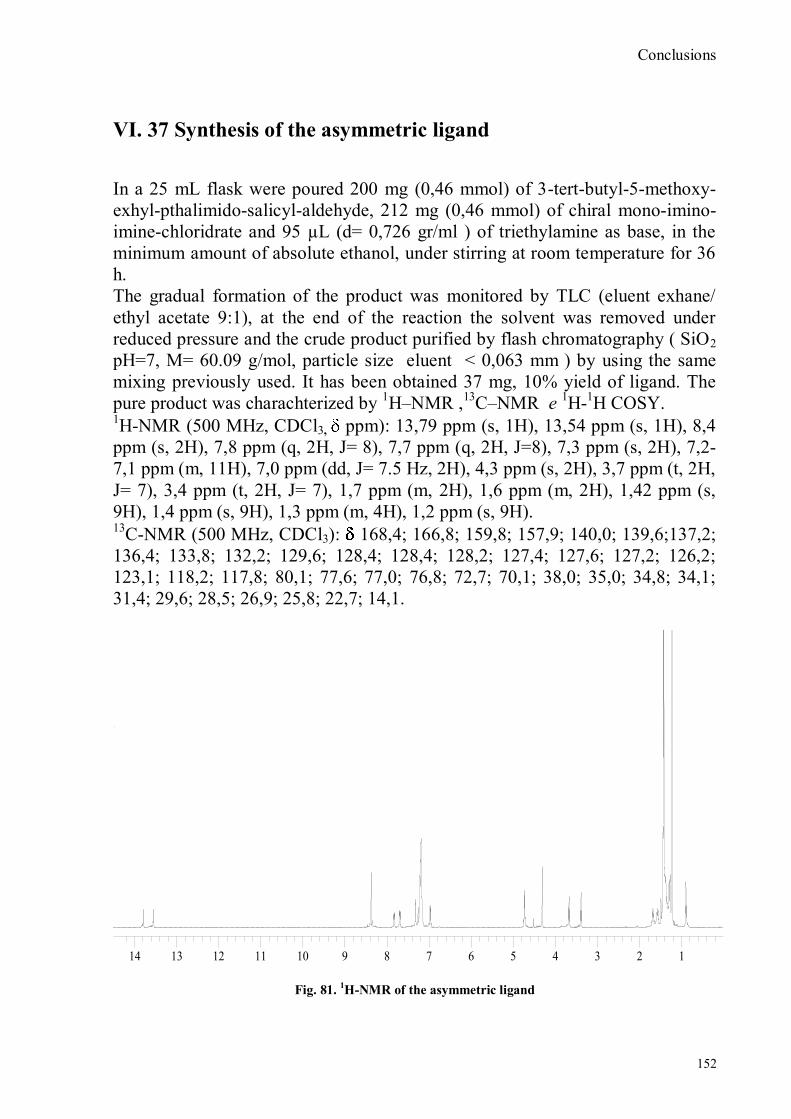
Conclusions
152
VI. 37 Synthesis of the asymmetric ligand
In a 25 mL flask were poured 200 mg (0,46 mmol) of 3-tert-butyl-5-methoxy-
exhyl-pthalimido-salicyl-aldehyde, 212 mg (0,46 mmol) of chiral mono-imino-
imine-chloridrate and 95 µL (d= 0,726 gr/ml ) of triethylamine as base, in the
minimum amount of absolute ethanol, under stirring at room temperature for 36
h.
The gradual formation of the product was monitored by TLC (eluent exhane/
ethyl acetate 9:1), at the end of the reaction the solvent was removed under
reduced pressure and the crude product purified by flash chromatography ( SiO2
pH=7, M= 60.09 g/mol, particle size eluent < 0,063 mm ) by using the same
mixing previously used. It has been obtained 37 mg, 10% yield of ligand. The
pure product was charachterized by 1H–NMR ,
13C–NMR e
1H-
1H COSY.
1H-NMR (500 MHz, CDCl3, ppm): 13,79 ppm (s, 1H), 13,54 ppm (s, 1H), 8,4
ppm (s, 2H), 7,8 ppm (q, 2H, J= 8), 7,7 ppm (q, 2H, J=8), 7,3 ppm (s, 2H), 7,2-
7,1 ppm (m, 11H), 7,0 ppm (dd, J= 7.5 Hz, 2H), 4,3 ppm (s, 2H), 3,7 ppm (t, 2H,
J= 7), 3,4 ppm (t, 2H, J= 7), 1,7 ppm (m, 2H), 1,6 ppm (m, 2H), 1,42 ppm (s,
9H), 1,4 ppm (s, 9H), 1,3 ppm (m, 4H), 1,2 ppm (s, 9H). 13
C-NMR (500 MHz, CDCl3): 168,4; 166,8; 159,8; 157,9; 140,0; 139,6;137,2;
136,4; 133,8; 132,2; 129,6; 128,4; 128,4; 128,2; 127,4; 127,6; 127,2; 126,2;
123,1; 118,2; 117,8; 80,1; 77,6; 77,0; 76,8; 72,7; 70,1; 38,0; 35,0; 34,8; 34,1;
31,4; 29,6; 28,5; 26,9; 25,8; 22,7; 14,1.
11223344556677889910101111121213131414
Fig. 81. 1H-NMR of the asymmetric ligand
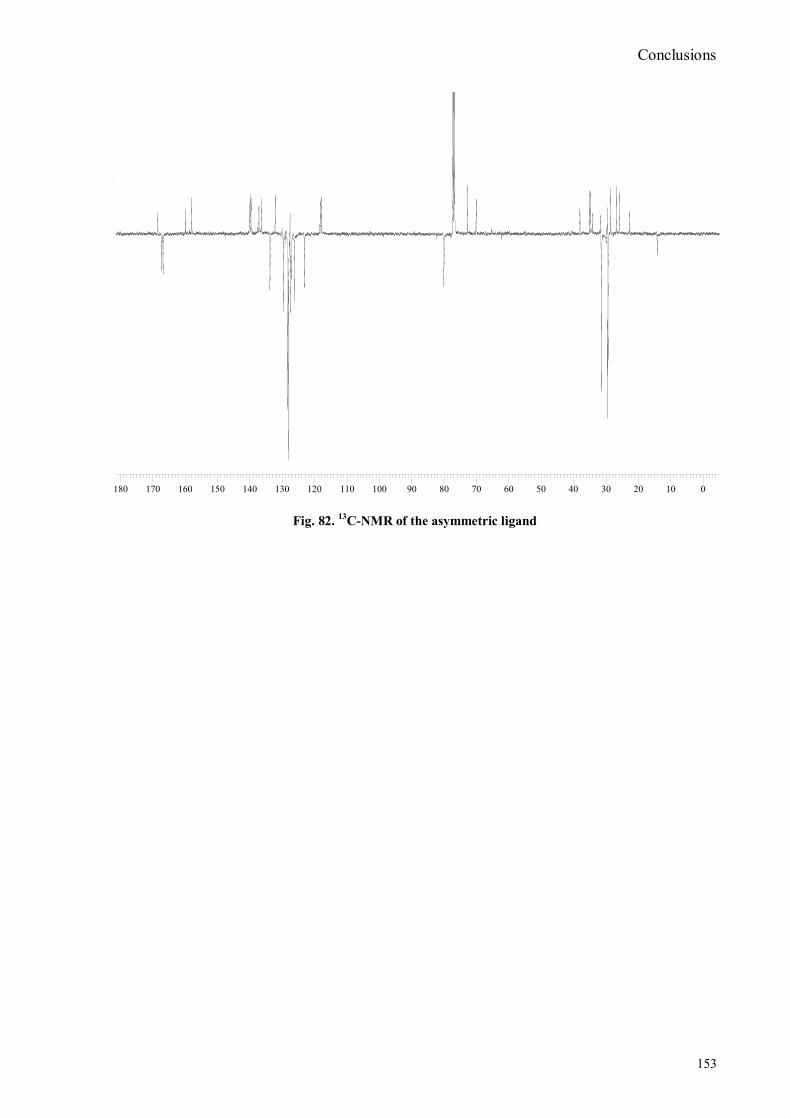
Conclusions
153
00101020203030404050506060707080809090100100110110120120130130140140150150160160170170180180
Fig. 82. 13
C-NMR of the asymmetric ligand
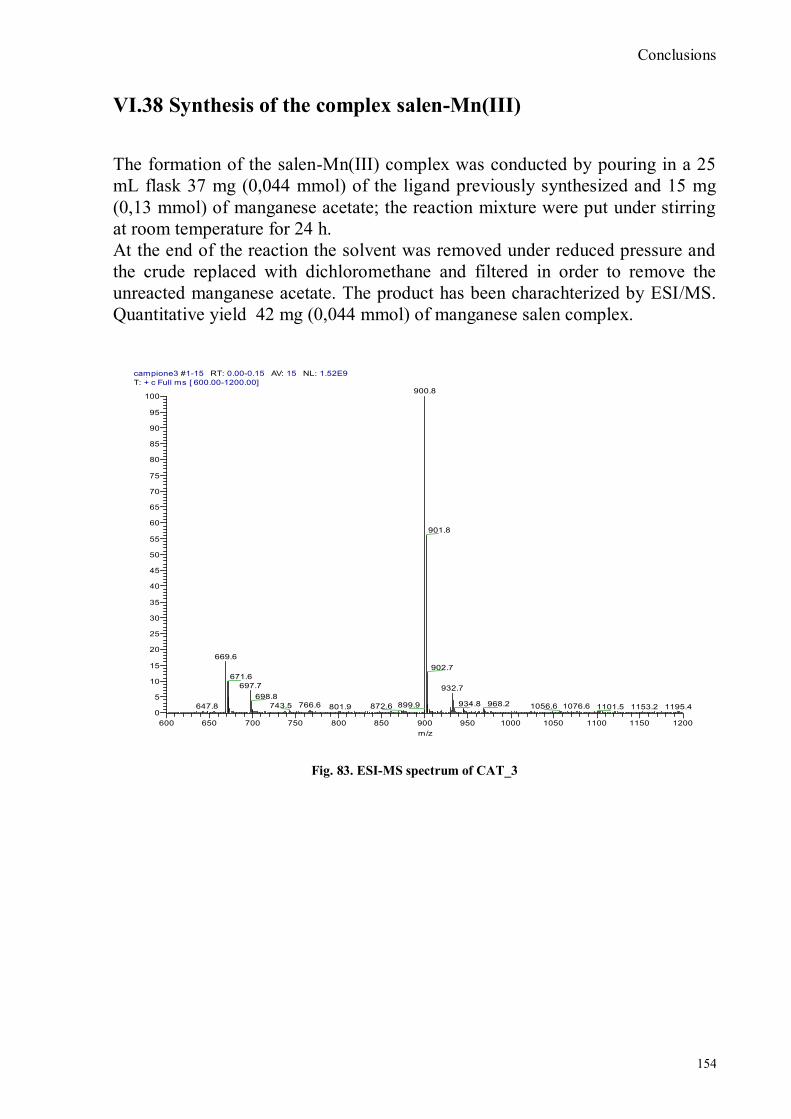
Conclusions
154
VI.38 Synthesis of the complex salen-Mn(III)
The formation of the salen-Mn(III) complex was conducted by pouring in a 25
mL flask 37 mg (0,044 mmol) of the ligand previously synthesized and 15 mg
(0,13 mmol) of manganese acetate; the reaction mixture were put under stirring
at room temperature for 24 h.
At the end of the reaction the solvent was removed under reduced pressure and
the crude replaced with dichloromethane and filtered in order to remove the
unreacted manganese acetate. The product has been charachterized by ESI/MS.
Quantitative yield 42 mg (0,044 mmol) of manganese salen complex.
campione3 #1-15 RT: 0.00-0.15 AV: 15 NL: 1.52E9
T: + c Full ms [ 600.00-1200.00]
600 650 700 750 800 850 900 950 1000 1050 1100 1150 1200
m/z
0
5
10
15
20
25
30
35
40
45
50
55
60
65
70
75
80
85
90
95
100
Re
lativ
e A
bu
nd
an
ce
900.8
901.8
669.6
902.7
671.6
697.7 932.7698.8
934.8 968.2766.6 899.9743.5 1076.61056.6647.8 872.6801.9 1101.5 1195.41153.2
Fig. 83. ESI-MS spectrum of CAT_3
References
155
VII. REFERENCES:
1 A. Hulanicki, S. Glab, F. Ingman, Pure and applied chemistry, 1991, 63, 1247.
2 Fluorescent Chemosensors for Ion and Molecole Recognition, (Ed. A. W. Czarnik) American
Chemical Society, Washington DC, 1992 3 M.Montalti, L. Prodi, N. Zaccheroni in: Handbook of photochemistry and photobiology, Ed. M. S.
4 A. Abdel-Mottaleb, H. Nalwa, American Institute of physic, 2003, 3, 271.
5 K. Stein, G. Schwedt, Anal. Chim. Acta, 1993, 272, 73.
6 L. Prodi, F. Bolletta, M. Montalti, N. Zaccheroni, Coord. Chem. Rev. 2000, 205, 59.
7 R. Pinalli, F. F. Nachtingall, F. Ugozzoli, E. Dalcanale, Angew. Chem. Int. Ed. 1999, 38, 2377.
8 F. C. J. M. Van Veggel in: Comprehensive Supramolecular Chemistry, Ed. J. L. Atwood, J. E. D,
D. MacNicol, F. Vogtle, D. N. Reinhoudt (Pergamon, Oxford), 1996,10, 171. 9 V. Balzani, A. Credi, F. Scandola, Chemistry and life, science and technology, 1996, 78, 1221.
10 Hans-Jorg Schneider, Angew. Chem. Int. Ed, 2009, 48, 3924.
11 Paul D. Beer and Philip A. Gale, Angew. Chem. Int. Ed, 2001, 40, 486.
12 Colette McDonagh, Conor S. Burke, Brian D. MacCraith, Chem. Rev, 2008, 108, 400.
and references therein citated. 13
A. P. De Silva, H. Q. N. Gunaratne, T. Gunnalaugsson, A. J. M. Huxley, C. P. McCoy, J. T.
Rademacher, T. E. Rice, Chem. Rev, 1997, 97, 1515. 14
R. Martinez-Manez, F. Sancenòn, Chem. Rev, 2003, 103, 4419. 15
Sook Kyung Kim, Dong Hoon Lee, Jong-in Hong and Juyoung Yoon, Acc. of Chem. Res, 2009,
42, 23. 16
R. Y. Tsien, Ann. Rev. Neuroscience, 1989, 12, 227. 17
A. Gulino, G. G. Condorelli, P. Mineo, I. Fragalà, Nanotech, 2005, 16, 2170. 18
A. Gulino, P. Mineo, E. Scamporrino, D. Vitalini, I. Fragalà, Chem. Mater, 2004, 16, 1838. 19
S. Royo, R. Martinez Manez, F. Sancenon, A. M. Costero, M. Parra, S, Gil, Chem. Commun,
2007, 4839. 20
S. O. Obare, C. De, W. Guo, T. L. Haywood, T. A. Samuels , C. P. Adams, N. O. Masika, D. H.
Murray, G. A. Anderson, K. Campbell, K. Fletcher, Sensors, 2010, 10, 7018. 21
A. J. Russel, J. A. Berberich, G. F. Drevon and R. R. Koepsel, Annu. Rev. Biomed. Eng, 2003, 5,
4. 22
M. Wheelis, Pure Appl. Chem, 2002, 74, 2247. 23
B. Yu, E. Shiu and K. Levon, Anal. Chem, 2004, 76, 2689. 24
K. Anitha, S. V. V. Mohan and S. J. Reddy, Biosens. Bioelectron, 2004, 19, 848. 25
M. H. Hammond, K. J. Johnson, S. L. Rose- Pehrsson, J. Ziegler, H. Walker, K. Coudy, D. Gary,
D. Tillett, Sens. Actuators B, 2006, 116, 135. 26
W. E. Steiner, S. J. Klopsch, W. A. English, B. H. Clowers, H. H. Hill, Anal. Chem, 2005, 77,
4792. 27
Karl J. Wallace, Jeroni Morey, Vincent M. Lyncha, Eric V. Anslyn, New J. Chem, 2005, 29,
1469. 28
Karl J. Wallace, Ruth I. Fagbemi, Frantz J. Folmer- Andersen, Jeroni Morey, Vincent M. Lynth,
Eric V. Anslyn, Chem. Commun, 2006, 37, 3886. 29
A. M. Costero, S. Gil, M. Parra, P. M. E. Mancini, R. Martinez- Manez, F. Sancenon, S. Royo,
Chem. Commun, 2008, 43, 6002. 30
Daniel Knapton, Mark Burnworth, Stuart J. Rowan, Christoph Weder, Angew. Chem. Int. Ed,
2006, 45, 5825. 31
Karl J. Wallace, Jeroni Morey, Vincent M. Lyncha and Eric V. Anslyn, New J. Chem, 2005, 29,
1469
References
156
32
K. J. Wallace, R. I. Fagbemi, F. J. Folmer- Andersen, J. Morey, V. M. Lynch, E. V. Anslyn,
Chem. Commun. 2006, 3886. 33
F. Terrier, P. Rodriguez- Dafonte, E. Le Guevel, G. Moutiers, Org. Biomol. Chem, 2006, 4, 4352. 34
Sabapathi Gokulnath, Viswanathan Prabhuraja, Jeyaraman Sankar, Tavarekere K. Chandrashekar,
Eur. J. Org. Chem, 2007, 191. 35
S. A. Kuvshinova, A. V. Zav‟yalov, O. I. Koifman, V. V. Aleksandriiskii, V. A. Burmistrov
Russian Journal of Organic chemistry, 2004, 40, 8. 36
Colette McDonagh, Conor S. Burke, Brian D. MacCraith, Chem. Rev, 2008, 108, 400 and
references therein citated. 37
A. I. Bush, Curr. Opin. Chem. Biol, 2000, 4, 184. 38
E. R. Kandel, J. H. Schwartz, T. J. Jessell, Principles of Neural Science, 4th ed; McGraw-Hill:
New York, 2000. 39
M. E. Go¨tz, G. Kunig, P. Riederer, M. B. H. Youdim, Pharmacol Ther. 1994, 63, 37. 40
B. Alberts, A. Johnson, J. Lewis, M. Raff, K. Roberts, P. Walter, Molecular Biology of the Cell,
4th ed.; Taylor & Francis Group: New York, 2002. 41
Emily L. Que, Dylan W. Domaille, Christopher J. Chang, Chem. Rev, 2008, 108, 1517 and
references therein citated. 42
J. Roeper, O. Pongs, Curr. Opin. Neurobiol, 1996, 6, 338. 43
M. J. Berridge, M. D. Bootman, P. Lipp, Nature, 1998, 395, 645. 44
H. Bito, K. Deisseroth, R. W. Tsien, Curr. Opin. Neurobiol. 1997,7, 419. 45
D. E. Clapham, Cell, 2007, 131, 1047. 46
A.Wolf Torsello, S. Fasanella, A. Cittadini, Mol. Aspects Med, 2003, 24, 11. 47
J. Sto¨ckel, J. Safar, A. C.Wallace, F. E. Cohen, S. B Prusiner, Biochemistry, 1998, 37, 7185. 48
J. R. Prohaska, Physiol. ReV. 1987, 67, 858. 49
M. Kozma, P. Szerdahelyi, P. Kasa, Acta Histochem, 1981, 69, 12. 50
S. Puig, D. J. Thiele, Curr. Opin. Chem. Biol, 2002, 6, 171. 51
J. R. Prohaska, A. A. Gybina, J. Nutr, 2004, 134, 1003. 52
P. A. Cobine, L. D. Ojeda, K. M. Rigby, D. R. Winge, J. Biol. Chem, 2004, 279, 14447. 53
J. F. B. Mercer, R. M. Llanos, J. Nutr, 2003, 133, 1481. 54
D. Strausak, J. F. B. Mercer, H. H.Dieter, W. Stremmel, G. Multhaup, Brain Res. Bull.,2001,
55, 175. 55
D. J.Waggoner, T. B., Bartnikas, J. D. Gitlin, Neurobiol. Dis. 1999,6, 221. 56
D. R. Brown, H. Kozlowski, Dalton Trans , 2004, 1907. 57
C. J. Maynard, R. Cappai, I. Volitakis, R. A. Cherny, A. R. White, K. Beyreuther, C. L. Masters,
A. I. Bush, Q. X. Li, J. Biol. Chem.2002, 277, 44670. 58
A. R.White, R. Reyes, J. F. B. Mercer, J. Camakaris, H. Zheng, A. I. Bush, G. Multhaup, K.
Beyreuther, C. L. Masters, R. Cappai, Brain Res. 1999, 842, 439. 59
T. Okamoto, S. Takeda, Y. Murayama, E. Ogata, I. Nishimoto, J. Biol. Chem. 1995, 270, 4205. 60
R. A. Cherny, J. T. Legg, C. A. McLean, D. P. Fairlie, X. D. Huang, C. S. Atwood, K.
Beyreuther, R. E. Tanzi, C. L. Masters, A. I. Bush, J. Biol. Chem. 1999, 274, 23223. 61
G. L. Millhauser, Acc. Chem. Res, 2004, 37, 79 62
G. Yamin, C. B. Glaser, V. N. Uversky, A. L. Fink, J. Biol. Chem, 2003, 278, 27630. 63
Y. S. Kim, D. Lee, E. K. Lee, J. Y. Sung, K. C. Chung, J. Kim, S. R. Paik, Brain Res, 2001, 908,
93. 64
J. S. Valentine, P. A. Doucette, S. Z. Potter, Annu. ReV. Biochem, 2005, 74, 563. 65
J.Wang, H. Slunt, V. Gonzales, D. Fromholt, M. Coonfield, N. G. Copeland, N. A. Jenkins, D. R.
Borchelt, Hum. Mol. Genet, 2003, 12, 2753. 66
S. Zanarini, E. Rampazzo, S. Bonacchi, R. Juris, M. Marcaccio, M. Montalti, F. Paolucci, L.
Prodi, J. Am. Chem. Soc,2009, 131, 14208.
References
157
67
J. Huang, Y. Xu, X. Qian, Chem. Rev, 2008, 108, 1517 and references therein citated 68
R. Noyori, Angew. Chem. Int. Ed, 2002, 41, 2008. 69
K. B. Sharpless, Angew. Chem., Int. Ed, 2002, 41, 2024. 70
E. N. Jacobsen, W. Zhang, A. R. Muci, J. R. Ecker, L. Deng, J. Am. Chem. Soc, 1991, 113, 7063. 71
Sharpless, K. B. Tetrahedron 1994, 50, 4235. 72
E. N. Jacobsen, W. Zhang, A. R. Muci, J. R. Ecker, L. Deng, J. Am. Chem. Soc, 1991, 113, 7063. b E. N. Jacobsen, W. Zhang, M. L. Guler, J. Am. Chem. Soc,1991,113, 6703.
c W. Zhang, E. N.
Jacobsen, J. Org. Chem, 1991, 56, 2296, d W. Zhang, J. L. Loebach, S. R.Wilson, E. N. J.
Jacobsen, Am.Chem. Soc, 1990, 112, 2801, e R. Irie, K. Noda, Y. Ito, N. Matsumoto, T. Katsuki,
Tetrahedron Asymmetry,1991, 2, 481. 73
Cozzi, P. G. Chem. Soc. ReV. 2004, 33, 410, b. Katsuki, T. Chem. Soc. ReV. 2004, 33, 437, c.
Darensbourg, D. J.; Mackiewicz, R. M.; Phelps, A. L.; Billodeaux, D. R. Acc. Chem. Res. 2004, 37,
836. d. Leadbeater, N. E.; Marco, M. Chem. ReV. 2002, 102, 3217,
e. Bandini, M.; Cozzi, P. G.;
Umani-Ronchi, A. Pure Appl. Chem. 2001,73, 325,f. Jacobsen, E. N. Acc. Chem. Res. 2000, 33,
421 74
J. A. Gladysz, Chem. ReV, 2002, 102, 3215. 75
J. F. Larrow, E. N. Jacobsen, Top. Organomet. Chem, 2004, 6, 123. 76
A. Corma, H. Garcia, Chem. ReV, 2002, 102, 3837. 77
P. Pfeiffer, E. Breith, E. Lubbe, T. Tsumaki, J. Liebigs, Ann.Chem, 1933, 503, 84. 78
R. Irie, T. Hashihayata, T. Katsuki, M. Akita, Y. Moro-oka, Chem.Lett, 1998, 1041. 79
K. B. Hansen, J. L. Leighton, E. N. Jacobsen, J. Am. Chem. Soc, 1996, 118, 10924. 80
J. M. Hawkins, T. J. N. Watson, Angew. Chem. Int. Ed, 2004, 43,3224. 81
C. Baleiza, H. Garcia, Chem. Rev, 2006, 106, 3987 and references therein citated. 82
C. K. Shin, S. J. Kim, G. J. Kim, Tetrahedron Lett, 2004, 45, 7429, b
S. S. Thakur, W. J. Li, S. J.
Kim, G. J. Kim, Tetrahedron Lett, 2005, 46, 2263,c. S. S. Thakur, W. J. Li C. K. Shin, G. J. Kim,
Catal. Lett, 2005,104, 151. 83
P. McMorn, G. Hutchings, J. Chem. Soc. ReV, 2004, 33, 108, b. D. J. Darensbourg, J. C. J
Yarbrough, Am. Chem. Soc, 2002, 124,6335.c
M. Alvaro, C. Baleizao, D. Das, E. Carbonell, H.
Garcia, J. Catal, 2004, 228, 254. 84 C. Baleiza, H. Garcia, Chem. Rev, 2006, 106, 3987. 85
F. Lupo, S. Gentile, F.P. Ballistreri, G. A. Tomaselli, M. E. Fragalà, and A. Gulino, Analyst,
2010, 135, 2273. 86
Li Zeng, E. W. Miller, A. Pralle, E. Y. Isacoff, C. J. Chang, J. Am. Chem. Soc., 2006, 128, 10. 87 N. K. Huang, Y. Chern, J. M. Fang, C. I. Lin, W. P. Chen, Y. L. Lin, J.Nat.Product, 2007, 70,
571. 88 K. J. Wallace, J. Morey, V. M. Lyncha, Eric V. Anslyn, New J. Chem., 2005, 29, 1469. 89 S. A. Kuvshinova, A.V. Zav‟ylaov, O.I. Koifman, V. V. Aleksandriiskii and V. A. Burmistrov,
Russian Journal of organic chemistry, 2004, 40, 1113. 90
R. Siewertsen, H. Neumann, B. Buchheim-Stehn, R. Herges, C. Nather, F. Renth, F. Temps, J.
Am. Chem. Soc., 2009, 131, 15595. 91 S. D. Ross, M. Finkelstein, R. C. Petersen, J. Am. Chem. Soc., 1958, 80, 4327. 92 A. T. Peters, Y. S. Behesti, J. of the Society of Dyers and Colourists, 1989, 105 , 29. 93
Z. Xu et al, Tetrahedron, 2006, 62, 10117. 94 Z. Xu, X. Qian, J. Cui, R. Zhang, Tetrahedron, 2006, 62, 10117. 95
S. Onclin, B. J. Ravoo, D. N Reinhoudt, Agew. Chem. Int. Ed., 2005, 44, 6268. 96
S. Zhang, F. Lue, L. Gao, L. Ding, and Y. Fang, Langmuir, 2006, 22, 7437. 97
A. Gulino, G. P. Mineo, S. Bazzano, D. Vitalini and I. Fragalà, Chem. Mat., 2005, 17, 4043. 98
S. Royo, R. Martinez-Manez, F. Sancenon, A. M. Costero, M. Parrab and S. Gilb, Chem.
Commun. 2007, 4839. 99
A. A. Andrade, S. B. Yamaki, L. Misoguti, S. C. Zilio, T. D. Z. Atvars, O. N. Oliviera Jr, C. R.
Mendonca, Optical Materials, 2004, 27, 441.
References
158
100
S. Gokulnath, V. Prabhuraja, J. Sankar, and T. K. Chandrashekar, Eur. J. Org. Chem. 2007, 191. 101
H. Heinz, R. A. Vaia, H. Koerner, and B. L. Farmer, Chem. Mater. 2008, 20, 6444. 102 G.G. Birch, M. L. Wolfrom, R. S. Tyson , Adv. Carbohydr. Chem. Biochem. 1963, 18, 201. 103
A. Elbein, Y. Pan, I. Pastuszak, D. Carroll Glycobiology 2003, 13, 17R. 104 R. Liu, H. Barkhordarian, S. Emadi, C. B. Park, M. R. Sierks, Neurobiol. Dis. 2005, 20, 74. 105
S. Hannessian, P. Lavallèe Carbohydrate Research 1973, 28, 303-311. 106
B. Di Blasio, S. Galdiero, M. Saviano, C. Pedone, E. Benedetti, E. Rizzarelli, S. Pedotti, G.
Vecchio, W. Gibbons, Carbohydrate Research, 1996, 282, 41. 107
Z. Xu, X. Qian, J. Cui, R. Zhang, Tetrahedron, 2006, 62, 10117. 108
M.J. Pfammatter,V. Siljegovic. Helvetica Chimica Acta, 2001, 84, 678. 109
O. Garcia, E. Nicolàs, F. Albericio, Tetrahedron Letters, 2003, 44, 4961. 110
L. L. Lou, K. Yu, F. Ding, X. Peng, M. Dong, C. Zhang, S. Liu, Journal of catalysis, 2007, 249,
102. 111
T. Vidal, A. Petit, A. Loupy, R. N. Gedye, Tetrahedron, 2000, 56, 5473.
112
Y. Peng, G. Sang, Green chemistry, 2002, 4, 349. 113
M. E. Amato, F. P. Ballistreri, A. Pappalardo, G.A. Tomaselli, R. M. Toscano, D. J. Williams
Eur. J.Org. Chem., 2005, 3562.