Temperature-humidity index (THI) 1917-2008 and future...
14
Atmósfera 24(1), 89-102 (2011) Temperature-humidity index (THI) 1917-2008 and future scenarios of livestock comfort in Veracruz, México A. HERNÁNDEZ Laboratorio de Alteraciones Funcionales, Facultad de Medicina Veterinaria y Zootecnia, Universidad Veracruzana,Veracruz, México Corresponding author; e-mail: [email protected] B. DOMÍNGUEZ Laboratorio de Fisiología, Facultad de Medicina Veterinaria y Zootecnia, Universidad Veracruzana, Veracruz, México P. CERVANTES Laboratorio de Alteraciones Funcionales, Facultad de Medicina Veterinaria y Zootecnia, Universidad Veracruzana,Veracruz, México S. MUÑOZ-MELGAREJO Laboratorio de Bioquímica, Facultad de Medicina Veterinaria y Zootecnia, Universidad Veracruzana, Veracruz, México S. SALAZAR-LIZÁN Grupo Ganadería, Facultad de Medicina Veterinaria y Zootecnia, Universidad Veracruzana, Veracruz, México A. TEJEDA-MARTÍNEZ Grupo Climatología Aplicada. Licenciatura en Ciencias Atmosféricas, Universidad Veracruzana, Xalapa, Veracruz, México Received June 17, 2009; accepted May 18, 2010 RESUMEN Se presentan resultados del análisis de datos de temperaturas (ºC) y humedad relativa (RH) combina- dos, para obtener el índice de temperatura y humedad (THI por sus siglas en inglés) en ganado para la región de Veracruz, México, con el propósito de hacer comparaciones climáticas en diferentes periodos de estudio (1917-1960, 1961-1990, 1991-2008), así como futuros escenarios a 2020, 2050 y 2080. Los resultados indican que las posibilidades de confort animal son reducidas. Para los periodos pasados se encuentra un THI creciente: 83, 85 y 86, respectivamente, considerando las temperaturas máximas para el mes de mayo. Para el futuro los THI fueron obtenidos a partir de los escenarios de emisiones A2 y B2 del IPCC para los modelos GFDL 2020 (80.87), 2050 (81.58), 2080 (82.82); ECHAM 2020 (81.27),
Transcript of Temperature-humidity index (THI) 1917-2008 and future...
Atmósfera 24(1), 89-102 (2011)
Temperature-humidity index (THI) 1917-2008 and future scenarios of livestock comfort in Veracruz, México
A. HERNÁNDEZLaboratorio de Alteraciones Funcionales, Facultad de Medicina Veterinaria y Zootecnia,
Universidad Veracruzana,Veracruz, MéxicoCorresponding author; e-mail: [email protected]
B. DOMÍNGUEZLaboratorio de Fisiología, Facultad de Medicina Veterinaria y Zootecnia,
Universidad Veracruzana, Veracruz, México
P. CERVANTESLaboratorio de Alteraciones Funcionales, Facultad de Medicina Veterinaria y Zootecnia,
Universidad Veracruzana,Veracruz, México
S. MUÑOZ-MELGAREJOLaboratorio de Bioquímica, Facultad de Medicina Veterinaria y Zootecnia,
Universidad Veracruzana, Veracruz, México
S. SALAZAR-LIZÁNGrupo Ganadería, Facultad de Medicina Veterinaria y Zootecnia,
Universidad Veracruzana, Veracruz, México
A. TEJEDA-MARTÍNEZGrupo Climatología Aplicada. Licenciatura en Ciencias Atmosféricas,
Universidad Veracruzana, Xalapa, Veracruz, México
Received June 17, 2009; accepted May 18, 2010
RESUMEN
Se presentan resultados del análisis de datos de temperaturas (ºC) y humedad relativa (RH) combina-dos, para obtener el índice de temperatura y humedad (THI por sus siglas en inglés) en ganado para la región de Veracruz, México, con el propósito de hacer comparaciones climáticas en diferentes periodos de estudio (1917-1960, 1961-1990, 1991-2008), así como futuros escenarios a 2020, 2050 y 2080. Los resultados indican que las posibilidades de confort animal son reducidas. Para los periodos pasados se encuentra un THI creciente: 83, 85 y 86, respectivamente, considerando las temperaturas máximas para el mes de mayo. Para el futuro los THI fueron obtenidos a partir de los escenarios de emisiones A2 y B2 del IPCC para los modelos GFDL 2020 (80.87), 2050 (81.58), 2080 (82.82); ECHAM 2020 (81.27),

90 A. Hernández et al.
2050 (82.74), 2080 (83.95) y PRECIS HADCM2 2020 (81.24), 2050 (82.65), 2080 (83.95), que resultan en la categoría de peligrosos.
ABSTRACT
Results of the analysis of combined temperature (ºC) and relative humidity (RH) data are presented in order to obtain the temperature-humidity index (THI) in livestock for the region of Veracruz, México, in order to make climate comparisons in different study periods (1917-1960, 1961-1990, 1991-2008), as well as future scenarios for 2020, 2050 and 2080. The results indicate that the possibilities for animal comfort are scarce. For the past periods a growing THI has been found: 83, 85 and 86, respectively, considering the maximum temperatures for the month of May. For the future, the obtained THI were obtained from IPCC emissions scenarios A2 and B2 for the GFDL 2020 (80.87), 2050 (81.58), 2080 (82.82); ECHAM 2020 (81.27), 2050 (82.74), 2080 (83.95) and PRECIS HADCM2 2020 (81.24), 2050 (82.65), 2080 (83.95) models, whose resultsare in the category of dangerous.
Keywords: THI, climate change, livestock comfort, animal heat stress.
1. IntroductionA contest between farmers and climate has been going on for centuries. Farmers related their agricultural tasks with the state of atmospheric changes on a daily basis (Belliveau et al., 2006). While livestock breeding has been around for nearly 500 years in Veracruz, on the east coast of México, with the arrival of the Spanish conquerors (Malgrejo-Vivanco, 1980; Velasco Toro and Skerritt, 2004), in recent years variations in climate have stopped being a daily occurrence and have become a constant concern among meat and milk producers. Climate change is even beginning to cause unease associated with the increase of global greenhouse gases (Salazar et al., 2008).
This concern is justified, since according to Morton (2007), Allen et al. (2007) and Herrero et al. (2010), the most important impacts of climate change will occur precisely among producers with a subsistence economy in tropical regions of developing countries.
The potential effect of climate change on cattle has been linked to the economic viability of the various animal production systems, since the increase of ambient temperature during summer periods is associated with the decrease of voluntary intake of food, causing reductions in weight in feedlot cattle and a drop in milk production in dairy cattle (Frank et al., 2001; Arias et al., 2008).
The easiest way to assess the effect of increasing temperatures in livestock is the use of indexes like the so-called temperature-humidity index (THI), precisely because they combine data from ambient temperature (T) and relative humidity (RH) (Collier et al., 2007).
The obtained THI based on the hourly meteorological records, allowed Hahn et al. (2000) –using Eq. (1) which will be presented further on– to determine the livestock weather security index (LWSI) for farm animals in the center of the United States; this was based on a threshold for the normal, alert, danger and emergency categories of THI values, smaller than or equal to 74, 75 to 78, 79 to 83 and greater than or equal to 84, respectively. These categories have been used in different regions of Argentina to evaluate the effect of climate on some productive responses in dairy cows (Valtorta et al., 2000), as well as the risk of production from heat stress effects in livestock farms found in the center of the country (de la Casa and Ravelo, 2003).
The THI has been used as a heat stress indicator, which has proven useful to assess the differences in the degree of cattle comfort at different times of the year in the state of Tabasco, México (de Dios-Vallejo et al., 1987), as well as the heat stress effects on milk production and pregnancy

91THI and future scenarios of livestock comfort in México
rate in cows (Lozano et al., 2005). In the state of Veracruz, México, it was used to determine different groups of cows according to animal responses to heat stress and associate them with their bioproduction (Hernández et al., 2007). According to Vitali et al. (2009), a high THI is a risk factor for the survival of cattle, especially for neonates and mature cows.
In the mid 90s, the first regional climate change scenarios were created in the country (Conde et al., 1994, 2000; Gay, 2000). In these studies, the scenarios of extreme temperatures, precipitation and solar radiation were generated for doubling conditions of the carbon dioxide (2 x CO2) concentration, based on the base scenario obtained form the normal means of the period 1941-1970 for 23 sites in México. Subsequently, Conde et al. (1995) and Magaña et al. (2000) created base scenarios of temperature and precipitation from the normal monthly mean of temperature and precipitation from the period 1951-1980.
More recently, from models of the Canadian Centre for Climate (CCC) and the Geophysical Fluid Dynamics Laboratory (GFDLR30), Conde et al. (2000) made scenarios of possible changes in temperature and precipitation for México and also for 2 x CO2 atmospheric conditions. The results of the cited models show that temperatures may increase between 1 and 2 ºC for the CCC model, while the GFDLR model changes will vary between 2 and 3 ºC.
This work aims to estimate, for the livestock of Veracruz, the degree of thermal comfort in the past and present, and the alterations in animal comfort for the years 2020, 2050 and 2080.
2. MethodsThe data used was provided by the Servicio Meteorológico Nacional (National Meteorological Service, SMN). It comes from the Centro de Previsión del Golfo (Gulf Forecast Center –CPG), meteorological station number 3091 692, located in the city of Veracruz, to the east of México, off the coast of the Gulf of México at 19º 08’ 32” north latitude and 96º 06’ 40” west longitude; with an altitude of 15 meters above sea level. According to Vidal (2004), in the state of Veracruz from sea level to 1000 m in altitude, the climate is warm, with an average annual temperature of 22 ºC, to very warm, over 26 ºC.
The degree of climate security for livestock was established by the THI, using the following equation:
THI = 1.8 T + 32 – (0.55-0.55 RH)(1.8 T – 26) (1)
where:T = Daily mean temperature (ºC)RH = Mean relative humidity in Valtorta et al. (2000).
The LWSI by Hahn et al. (2000) considers four categories of the THI to evaluate the impact of thermal environmental conditions and associates them to the respirations per minute. Nienaber et al. (2007), consider the increase of the respiratory frequency as a proportional compensatory response to heat stress (Table I).
The data corresponds to the period 1917-2008 and were analyzed to obtain the monthly mean values (normal 1961-1990) of temperature (ºC) and relative humidity in tenths and from them the THI was calculated to establish the LWSI.

92 A. Hernández et al.
The THI was calculated from the minimum, mean and maximum temperatures with the average relative humidity. Furthermore the THI were obtained in an hourly form (6:00-8:00 a.m.; 1:00-3:00 p.m. and 5:00-7:00 p.m., local time), corresponding to periods of the day in which changes occur in animal behavior (Hernández et al., 2007).
The averages of temperature (ºC) and relative humidity of an hourly form were calculated from the mean maximum temperatures (Tmax) and mean minima (Tmin) of climate normals (1961-1990). That data was used to make climate (not meteorological) comparisons of the THI in different periods of study (1917-1960, 1961-1990, 1991-2008), as well as future scenarios for 2020, 2050 and 2080.
The procedure for obtaining the hourly temperatures (Thor) and relative humidity (RHhor) was obtained from the reported methodology by Tejeda-Martínez and García-Cueto (2002).
Thor = Tmin + y (Tmax - Tmin) (2a)
Where
y ctexp[ [ ]]atb= (2b)
Here, a, b and c are parameters that depend on the season of the year and latitude (Table II); t is in hours as a function of local time (H) and the local time of sunrise (Ho):
t = H - Ho if H ≥ Ho
t = H + 24 - Ho if H < Ho
Table I. The THI categories and their relation with the respiratory rate.
LWSI Category THI value Respirations per minute
Normal ≤ 74 <90Alert 75 – 78 90 – 110Danger 79 – 83 110 – 130Emergency ≥ 84 130
Modified from Hahn et al., (2000) by Nienaber et al. (2007)
Table II. Values of a, b and c in the Eq. (2b) as a function of latitude and time of year for México (Tejeda-Martínez, 1991).
Months LatitudeºN
Values
a b c
March - October ≥ 23.5 0.026 3.190 -0.375November - February ≥ 23.5 0.023 3.436 -0.421January - December < 23.5 0.096 2.422 -0.339

93THI and future scenarios of livestock comfort in México
In the case of monthly temperatures, the precision of Eq. (2) is greater than the De Wit et al. (1978) model, which is the best model according to a review made by Reicosky et al. (1989, cited by Tejeda-Martínez, 1991).
On the other hand, the values of the mean minimum monthly relative humidity (RHmin) were estimated from the combination of mean monthly vapor pressure and from the maximum saturation vapor pressure. The argument is based on the fact that the vapor pressure is unchanged between the time of occurrence of the mean and minimum RH (approximately between 10:00-11:00 a.m. and 2:00-3:00 p.m., respectively). This idea was initially proposed by Geiger (1957, cited by Tejeda-Martínez and García-Cueto, 2002).
The values of mean monthly vapor pressure, result from the monthly means of temperature and relative humidity, and saturation vapor pressure (Es), derived from the application of a polynomial of third-order to the mean monthly maximum temperatures. This polynomial is a regression model of Es in mb, a coefficient of lineal correlation of Pearson r = 0.9997 and a standard estimation error of 0.5 mb in comparison with observed values of Es for temperatures between 10 to 50 ºC (Tejeda-Martínez, 1994).
Es = 6.6 x 10⁻⁴T3 + 4.6 x 10⁻³T 2 + 4.5 x 10⁻¹T + 6.63 (3)
The next step was to obtain the monthly mean maximum relative humidity (RHmax) from the observed value of the monthly average humidity and the monthly mean minimum relative humidity.
Finally, as the curve of the daily relative humidity is inverted with respect to the temperature curve, the expression to estimate the hourly monthly average values is:
RHhor = RHmin + (1 – y)(RHmax – RHmin) (4)
To determine the THI scenarios for the years 2020, 2050 and 2080 the models ECHAM4 (Roeckner et al., 1992), GFDLR30 (Manabe et al., 1991; Delworth et al., 2002) and PRECIS-HADCM2 (Mitchell et al., 1999) were used with initial and boundary conditions HADCM2 Precis at a resolution of 0.5º of latitude by 0.5º of longitude (Gay et al., 2006), using a base scenario generated with the normals of the period 1961-1990 of CPG (SMN-Veracruz). As will be seen further on, despite the differences in resolutions of the models ECHAM4 (2.25º by 3.75º) and GFDLR30 (2.25º by 2.8º), against 0.5º by 0.5º of the PRECIS HADCRM2 system, the results are very similar, indicating that for future estimates of animal bioclimate, scenarios coming from models with a more or less rough resolution could be useful.
3. Results and discussionFigure 1, shows a systematic increase of average temperatures, being more noticeable in the maximum monthly temperatures of the years 1917 to 2008, that is heightened by the periods following the sixties decade (1961-1990) and becomes evident in the last 18 years analyzed (1991-2008; Fig. 1C). The alert category, which shows a THI value greater than or equal to 74, reaches its highest value in the last period of study, in which there is an increase in the number of months with averages of THI different to the thermal comfort ones and the danger and emergency

94 A. Hernández et al.
categories show a higher frequency especially during summer months (Fig. 1C).While the increase of temperature is associated to the inadequate comfort indicator, the alert
and danger categories are accentuated when relative humidity increases. This situation has become evident in recent years (Fig. 2).
By analyzing the data in an hourly way, with the purpose of observing with more detail the heat stress throughout the day, it is possible to establish that the most adverse conditions for livestock of the area are generate at midday (13:00-15:00), although in some months of the years studied livestock security is compromised even in the morning and evening hours (Fig. 3).
The THI value provides a set of categories that indicate the heat stress of animals (Bohmanova et al., 2007). However, for its interpretation it is necessary to know the predominant climate conditions
Tem
pera
ture
(ºC
)
A. Mean monthly temperature
B. Minimum monthly temperature
C. Maximum monthly temperature
1917-1960
30
25
20
15
85
80
75
70
65
85
80
75
70
65
85
90
80
75
70
65
60
30
25
20
15
1961-19901991-2008
December
November
October
September
August
JulyJune
MayApril
MarchFebruary
January
Temperature-H
umidity Index
December
November
October
September
August
JulyJune
MayApril
MarchFebruary
January
30
35
25
20
15
Fig. 1. Temperature (left ºC) and temperature-humidity index (THI, right) in the different periods analyzed (● 1917-1960, ○ 1961-1990 and ▼ 1991-2008). A. Mean monthly temperatures in the three periods analyzed and the monthly THI with the mean monthly temperature. B. Minimum monthly temperatures in the three periods analyzed and the monthly THI with the minimum monthly temperature. C. Maximum monthly temperatures in the three periods analyzed and the monthly THI with the maximum monthly temperature.

95THI and future scenarios of livestock comfort in México
December
November
October
September
August
JulyJune
MayApril
MarchFebruary
January
Temperature (ºC
)
Rel
ativ
e hu
mid
ity (%
) 84
86
Humidity 1917-1960
Tem
pera
ture
Tem
pera
ture
Hum
idity
Hum
idity
Humidity 1961-1990
Maximum temperature 1961-1990
Humidity 1991-2008
Maximum temperature 1991-2008
Maximum temperature 1917-1960
82
80
78
76
74
32
34
30
28
26
24
22
Fig. 2. Mean relative humidity (%) and maximum temperature (°C) analyzed at different time periods. The monthly means of relative humidity are shown (%), left scale throughout the year for the time periods analyzed (● 1917-1960, ∇ 1961-1990, ■ 1991-2008), and the maximum monthly temperatures, right scale throughout the years (● 1917- 1960, ○ 1961-1990 and ▼1991-2008).
December
November
October
September
August
JulyJune
MayApril
MarchFebruary
January
December
November
October
September
August
JulyJune
MayApril
MarchFebruary
January
December
November
October
September
August
JulyJune
MayApril
MarchFebruary
January
1917-1960 1961-1990 1991-2008
Tem
erat
ure-
hum
idity
inde
x
82
84
06:00-08:00
13:00-15:00
17:00-19:00
80
78
76
74
72
70
68
66
64
Fig. 3. Temperature-humidity indexes in an hourly form. THI are shown in an hourly form throughout the year for the studied periods (1917-1960, 1961-1990, 1991-2008) (● 06:00-08:00, ○ 13:00-15:00 and ▼ 17:00-19:00).
96 A. Hernández et al.
in the area of study, as well as relative humidity and how it has been used to differentiate the discomfort category according to the type of heat: dry, typical of semiarid climates or moist heat, like the predominant one in the coastal region of the Gulf of México, where Veracruz is situated (Vidal, 2004). Here, during the season of high temperatures and humidity, the natural capacity of cattle to dissipate the load of heat by evaporation and sweating is compromised and the stress is maximized as heat stress.
However, there are different forms of determining the level of heat stress in animals. The interpretation of the comfort classification of livestock has suffered modifications, with a tendency to reduce the stress values in cattle. According to Bohmanova et al. (2007), the first classifications made by Thom (1959) group the THI like: normal between 70 and 74, not comfortable from 74 to 79 and more than 79 seriously not comfortable. Armstrong (1994), proposes indexes under 71 as a comfort zone with values between 72 and 79 as a medium stress, from 80 to 89 as moderate stress and values above 90 as severe stress. Huhnke et al. (2001), group the THI in two categories: danger situation from 79 to 84 and greater than or equal to 84 in an emergency situation. Vitali et al. (2009) defined quantitatively the relationship between mortality risk and the THI in dairy cattle by establishing a THI value greater to 80 as the limit. It should be clarified that for the determination of the majority of these categories the THI values were generated empirically in livestock exposed to heat stress in climate chambers.
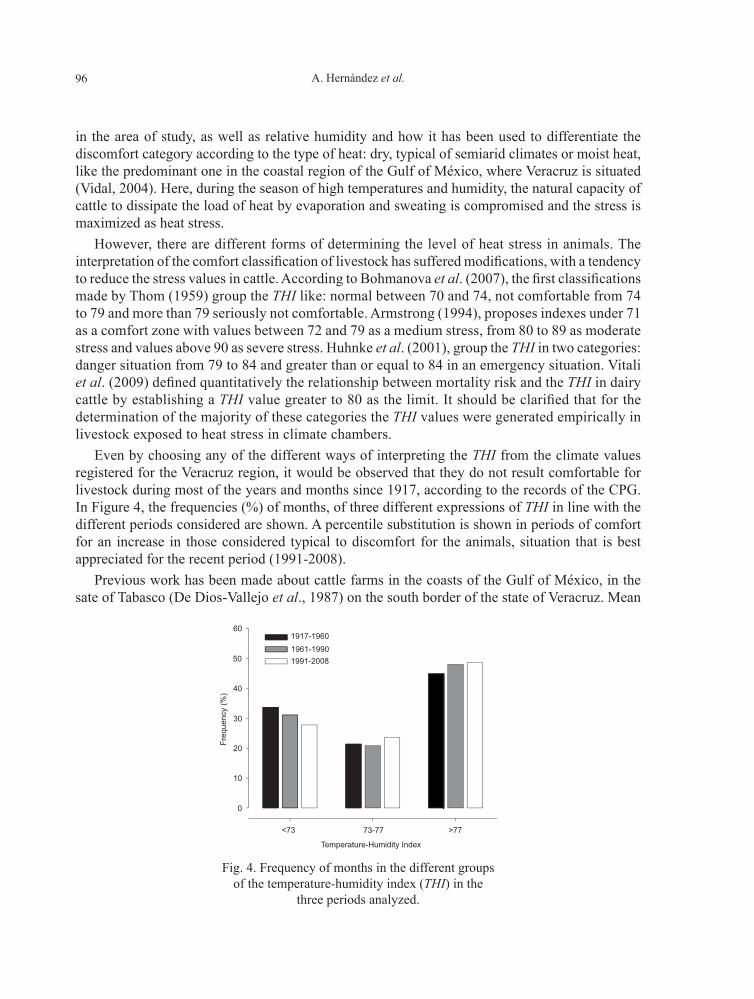
Even by choosing any of the different ways of interpreting the THI from the climate values registered for the Veracruz region, it would be observed that they do not result comfortable for livestock during most of the years and months since 1917, according to the records of the CPG. In Figure 4, the frequencies (%) of months, of three different expressions of THI in line with the different periods considered are shown. A percentile substitution is shown in periods of comfort for an increase in those considered typical to discomfort for the animals, situation that is best appreciated for the recent period (1991-2008).
Previous work has been made about cattle farms in the coasts of the Gulf of México, in the sate of Tabasco (De Dios-Vallejo et al., 1987) on the south border of the state of Veracruz. Mean
Freq
uenc
y (%
)
50
601917-19601961-19901991-2008
40
30
20
10
73-77 >77<73
Temperature-Humidity Index
0
Fig. 4. Frequency of months in the different groups of the temperature-humidity index (THI) in the
three periods analyzed.
97THI and future scenarios of livestock comfort in México
maximum temperatures ranged from 27.4 to 32 ºC and a mean maximum RH of 0.80 to 0.86; the average monthly THI showed values greater than or equal to 72 during eight months of the year, as well as records greater than or equal to 72 from 8 to 23 hours every day. Similarly, significant statistical differences were reported (p < 0.01) for the THI between dry and rainy periods, in morning and evening times, showing THI values greater than or equal to 74 in the rainy season during the evening hours, on farms located 20 km from Veracruz (Hernández et al., 2007). This data confirms that the area of study can be classified as one of discomfort for cattle. Countries with similar temperatures and humidity have seen changes in the management of livestock associated to increases in ambient temperatures that are occurring according to the temperature rise, showing changes in the conformation of existing herd predilection for thermo-tolerant animals (Parry et al., 2004).
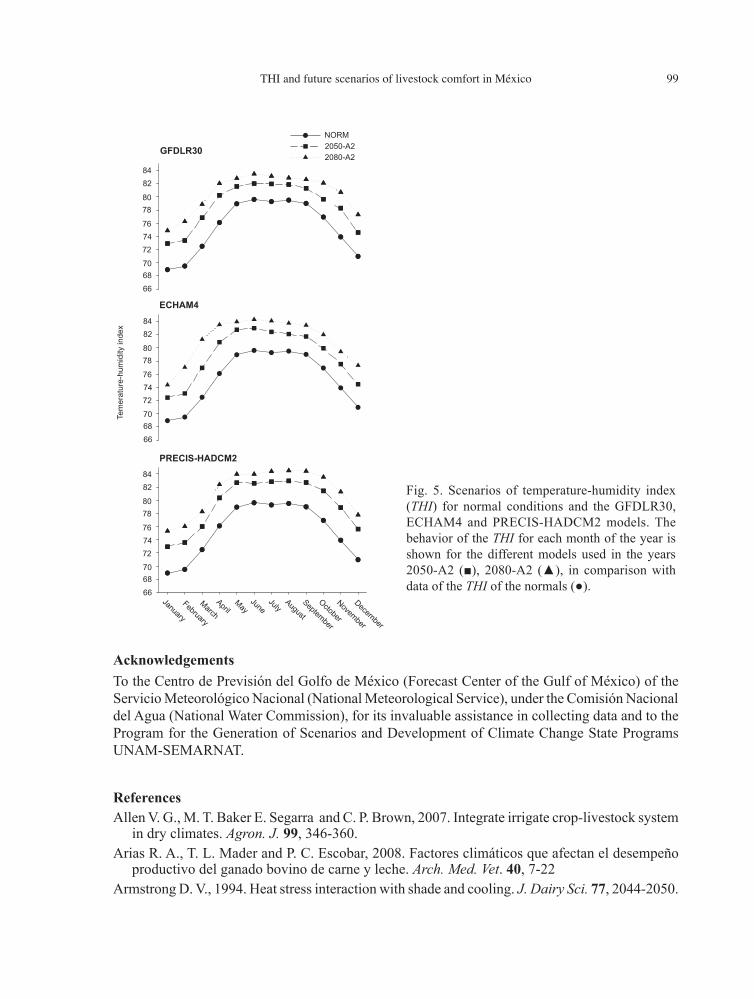
The climate scenarios for the years 2020, 2050 and 2080 were generated with the data of climate normals of the CPG for the years 1961-1990. They are shown in Tables III, IV and V as monthly temperature values (ºC) and relative humidity (%), for the models, GFDLR30 (2020, 2050A2 2050B2), ECHAM4 (2020, 2050A2 2050B2), and PRECIS-HADCM2 (2020, 2050A2 2050B2), respectively. These suggest that climate conditions for these years are conducive to the existence of and adverse environments for the development of livestock in the region of Veracruz, as seen in Figure 5, where scenarios for an average THI are shown deriving from tables III, IV and V. The base scenario was, calculated from the climate normals (1961-1990) and from the selected models (GFDLR30, ECHAM4 and PRECIS-HADCM2 for 2020, 2050 and 2080).
The differences that are seen in the selected models, with respect to the data of climate normals, are in all cases positive (above the current value) and are associated with an unfavorable climate for the practice of livestock breeding in the future.
4. ConclusionsThe practice of cattle breeding in the region of Veracruz, México, is now carried out in a climate that offers a reduced comfort margin for the animals, a condition which has worsened over time
Table III. Scenarios for mean temperatures and mean monthly relative humidity obtained with the use of the GFDLR30 model. A2, B2.
Scenarios
Month
Normals1961-1990
2020 2050 2080
GFDLR30 GFDLR30 A2 GFDLR30 B2 GFDLR30 A2 GFDLR30 B2
Temp RH Temp RH Temp RH Temp RH Temp RH Temp RH
January 21.2 82 22.5 88 23.3 89 22.9 88 24.5 89 23.3 89April 25.7 80 27.0 87 27.9 85 27.4 86 29.4 80 28.2 84July 27.8 80 29.0 80 29.6 78 29.4 79 30.7 75 30.0 77October 26.5 77 27.0 84 27.7 83 27.9 83 29.6 79 29.1 80
Temp= Mean temperature ºCRH = Relative humidity (%)
98 A. Hernández et al.
and has become more evident in recent years (1990-2008). According to the PRECIS-HADCM2 (A2) model, used to estimate regional models, the scenarios made for the THI from three different models suggest that the situation will become more critical in the future, so that for 2020 in the month of August, a relative humidity of 79% and an ambient temperature of 29.2 ºC, will be sufficient to exceed the THI value of 80 considered as dangerous (82). In the same way for 2050 and 2080, this critical THI value will be exceeded with temperatures of 30.5 and 32.3 ºC and with a relative humidity of 0.76 and 0.68 (83 and 85), respectively. It should be emphasized that despite the differences in spatial resolutions of surveyed climate change models, the results are highly coincidental for future estimates towards 2020 and 2050.
Table IV. Scenarios of mean temperatures and mean monthly relative humidity obtained with the use of the ECHAM4 model.
Scenarios
Month
Normals1961-1990
2020 2050 2080
ECHAM4 ECHAM4 A2 ECHAM4 B2 ECHAM4 A2 ECHAM4 B2
Temp RH Temp RH Temp RH Temp RH Temp RH Temp RH
January 21.2 82 22.2 88 23.0 88 22.6 88 24.2 89 23.6 89April 25.7 80 26.6 88 28.4 84 28.6 83 31.1 73 29.4 80July 27.8 80 29.0 80 30.0 77 30.1 77 31.7 71 30.7 75Octuber 26.5 77 27.1 84 27.9 83 28.0 82 29.5 79 28.4 82
Temp. = Mean temperature ºCRH = Relative Humidity (%)
Table V. Scenarios for mean temperatures and mean monthly relative humidity obtained with the use of the PRECIS-HADCM2 model.
Scenarios
Month
Normals1961-1990
2020 2050 2080
PRECIS-HADCM2
PRECIS-HADCM2 A2
PRECIS-HADCM2 B2
PRECIS-HADCM2 A2
PRECIS-HADCM2 B2
Temp RH Temp RH Temp RH Temp RH Temp RH Temp RH
January 21.2 82 22.3 88 23.3 89 23.7 89 24.7 89 24.1 89April 25.7 80 26.8 87 28.0 85 27.0 87 29.8 79 28.9 82July 27.8 80 29.0 80 30.3 76 30.4 76 32.1 69 32.1 69October 26.5 77 27.7 83 29.0 80 28.0 82 31.0 74 29.9 78
Temp. = Mean temperature ºCRH = Relative Humidity (%)
99THI and future scenarios of livestock comfort in México
Fig. 5. Scenarios of temperature-humidity index (THI) for normal conditions and the GFDLR30, ECHAM4 and PRECIS-HADCM2 models. The behavior of the THI for each month of the year is shown for the different models used in the years 2050-A2 (■), 2080-A2 (▲), in comparison with data of the THI of the normals (●).
Tem
erat
ure-
hum
idity
inde
x
8284
GFDLR30
ECHAM4
PRECIS-HADCM2
8078
767472
706866
8284
8078
767472
706866
8284
8078
767472
706866
December
November
October
September
August
JulyJune
MayApril
MarchFebruary
January
NORM2050-A22080-A2
AcknowledgementsTo the Centro de Previsión del Golfo de México (Forecast Center of the Gulf of México) of the Servicio Meteorológico Nacional (National Meteorological Service), under the Comisión Nacional del Agua (National Water Commission), for its invaluable assistance in collecting data and to the Program for the Generation of Scenarios and Development of Climate Change State Programs UNAM-SEMARNAT.
ReferencesAllen V. G., M. T. Baker E. Segarra and C. P. Brown, 2007. Integrate irrigate crop-livestock system
in dry climates. Agron. J. 99, 346-360. Arias R. A., T. L. Mader and P. C. Escobar, 2008. Factores climáticos que afectan el desempeño
productivo del ganado bovino de carne y leche. Arch. Med. Vet. 40, 7-22Armstrong D. V., 1994. Heat stress interaction with shade and cooling. J. Dairy Sci. 77, 2044-2050.

100 A. Hernández et al.
Belliveau S., B. Bradshaw, B. Smit, S. Reid, S. D. Remsey, M. Tarleton and B. Sawyer, 2006, Farm–level adaptation to multiple risks: climate change and other concerns. Occasional paper No. 27. Report of the project A528 and A477 of the Government of Canada´s Climate Changes Impacts and Adaptation Program. Department of Geography, University of Guelph. Canada, 99 pp.
Bohmanova J., I. Misztal, S. Tsuruta, H. D. Norman and T. J. Lawlor. Short communication: Genotype by environment interaction due to heat stress. J. Dairy Sci. 91, 840-846.
De la Casa C. A. and C.A. Ravelo, 2003, Assesing temperature and humidity conditions for Dairy cattle in Cordoba, Argentina. Int. J. Biometeorol. 48, 6-9.
Delworth T. L., R. J. Stouffer, K. W. Dixon, M. J. Spelman, T. R. Knutson, A. J. Broccoli, P. J. Kushner and R. T. Wetherald, 2002. Review of simulations of climate variability and change with the GFDL R30 coupled climate model. Clim. Dyn. 19, 555-574.
De Dios-Vallejo O., H. D. Johson and D. L. Petterson, 1987. El ganado Holstein en el trópico mexicano. I. Condiciones meteorológicas por época y circadianas en relación a la producción de leche. Universidad y Ciencia 4, 13-23.
De Wit, C. T., J. Goudriaan and H. H. Van Laar, 1978. Simulation of respiration and transpiration of crops. Pudoc. Wageningen, Amsterdan, 148 pp.
Collier R. J. and R. B. Zimbelman, 2007. Heat stress effects on cattle: what we know and what we don´t know. 22nd Annual Southwest Nutrition And Management Conference Proceedings. Tempe, AZ, 76-83.
Conde C., O. Sánchez and C. Gay, 1994. Escenarios básicos y regionales. In: Estudio de País: México. Primer Taller de Estudio de País: México. México ante el cambio climático. Memorias, Cuernavaca, México, 39-43.
Conde C., O. Sánchez, V. Magaña and C. Gay, 1995. Escenarios climáticos básicos y regionales. In: Estudio de País: México. Segundo Taller de Estudio de País: México. México ante el cambio climático. Memorias, Cuernavaca, México, 101-111.
Conde C., O. Sánchez and C. Gay, 2000. Escenarios físicos regionales; In: México: Una visión hacia el siglo XXI. El Cambio Climático en México (V. Magaña Ed.). SEMARNAP, UNAM, USCSP, 1-24.
Frank K. L., T. L. Mader, J. A.Harrington and G. L. Hahn, 2001. Potential climate change effects on warm-season livestock productions in the Great Plains. Journal series no. 14462, Agriculture Research Division, University of Nebraska, Omaha.
Gay C. (compilator), 2000. México: Una visión hacia el siglo XXI. El Cambio Climático en México. SEMARNAP, UNAM, USCSP. México, D. F., 220 pp.
Gay C., Conde, C. and Sánchez, O., 2006 Escenarios de Cambio Climático para México. Temperatura y Precipitación. (Documento en línea). Disponible desde Internet en http://www.atmosfera.unam.mx/cambio/escenarios/escenarios_3A_mapas_y_datos.htm.
Hahn G. L., T. L. Mader, J. B. Gaughan, Q. Hu and J. A. Nehacer, 2000. Heat waves and their impacts on feedlot cattle. Proceedings of the Sixth International Symposium on Biometeorology and Urban Climatology at the turn of the Millennium. (R. J. de Dear, J. D. Kalma, T. R. Oke and A. Auliciems, Eds.) WCASP-50, WMO/TD 1026, Geneva 353-357.
Hernández A., P. Cervantes, V. M. Salinas, R. García, A. Tejeda, F. Gallardo and J. L. Álvarez, 2007. Respuesta al estrés por calor en la vaca criollo lechero tropical bajo un sistema de doble propósito en México. Rev. Salud Anim. 29, 85-90.
Herrero M., P. K. Thornton, A. M. Notenbaert, S. Wood, S. Msangi, H. A. Freeman, D. Bossio, J. Dixon, M. Peters, J. Van de Steeg, J. Lynam, P. Parthasaraty Rao, S. Macmillan, B. Gerad, J.
101THI and future scenarios of livestock comfort in México
McDermott, C. Seré and M. Rosegrant, 2010. Smart investments in sustainable food production: Revisiting mixed crop-livestock systems. Science 327, 822-825.
Hunhke R. L., L. C. McCowan, L. C. Meraz, S. L. Harp and M. E. Payton, 2001. Determining the frequency and duration of elevated temperature-humidity index. ASAE. Annual International Meeting, Sacramento, CA. Am. Soc. Agric. Biol. Eng., St. Joseph, MI.
Lozano D. R. R., C. G. Vásquez and E. González-Padilla, 2005. Factores asociados del estrés cálorico y producción de leche sobre la tasa de gestación en bovinos en sistemas intensivos. Téc. Pecu. Mex. 43, 197-210.
Magaña V., C. Conde, O. Sánchez and C. Gay, 2000. Evaluación de escenarios regionales de clima actual y de cambio climático futuro para México. In: México: Una visión hacia el siglo XXI. El Cambio Climático en México, (V. Magaña Ed.). SEMARNAP, UNAM, USCSP, (C. Gay, Compilador), México, D. F., 15-21.
Manabe S., R. J. Stouffer, M. J. Spelman and K. Bryan, 1991. Transient response of a coupled ocean-atmosphere model to gradual changes of atmospheric CO2. Part I: Annual-mean response. J. Climate 4, 785-818.
Melgarejo-Vivanco J. L, 1980. Historia de la ganadería en Veracruz. Ediciones del Gobierno del Estado de Veracruz, 140 pp.
Mitchell J. F. B., T. C. Johns, M. Eagles, W. J. Ingram and R. A. Davis, 1999. Towards the cons-truction of climate change scenarios. Clim. Change 41, 547-581.
Morton J. F., 2007. The impact of climate change on smallholder and subsistence agriculture. PNAS. 104, 19680-19685.
Nienaber J. A. and G. L. Hahn, 2007, Livestock production system management responses to thermal challenges, Int. J. Biometerol. 52, 149-157.
Parry M. L., C. Rosenzweig, A. Iglesias, M. Livermore and G. Fischer, 2004. Effects of climate change on global food production under SRES emissions and socio-economic scenarios. Global Environ. Chang. 14, 53-67.
Reicosky D. C., L. J. Winkelman, J. M. Baker and D. C. Baker, 1989. Accuracy of hourly air temperatures calculated from daily minima and maxima. Agric. Forest Meteorol. 46, 193-209.
Roeckner E., K. Arpe, L. Bengtsson, S. Brinkop, L. Dümenil, M. Esch, E. Kirk, F. Lunkeit, M. Ponater, B. Rockel, R. Suasen, U. Schlese, S. Schubert and M. Windelband, 1992. Simulation of the present-day climate with the ECHAM4 model: impact of model physics and resolution Max-Planck Institute for Meteorology, Report No.93, Hamburg, Germany, 171 pp.
Salazar S., A. Hernández, S. Muñoz, B. Domínguez, P. Cervantes, and C. Lamothe, 2008. La ganadería bovina: vulnerabilidad y mitigación. In: Programa Veracruzano ante el cambio climático. Gobierno de Veracruz. Capítulo 5. Estudios para un programa veracruzano ante el cambio climático. Aspectos económicos. Editorial, Universidad Veracruzana, INE, Embajada Británica, UNAM 48 pp.
Tejeda-Martínez A., 1991. An exponential model of the curve of mean monthly air temperature. Atmósfera 4, 139-144.
Tejeda-Martínez A., 1994. On the evaluation of the wet bulb temperature as a function of the dry bulb temperature and relative humidity. Atmósfera 7, 179-184.
Tejeda-Martinez A. and O. R. García-Cueto. 2002. A comparative simple method for human bioclimatic conditions applied to seasonally hot/warm cities of México. Atmósfera 15, 55-66.
Thom E. C., 1959. The discomfort index. Weatherwise 12, 57-59.
102 A. Hernández et al.
Valtorta E. S., E. O. Escarpati, E. P Leva and R. M. Gallardo, 2000. Summer environmental effects on milk production and composition in an argentine grazing system. Proceedings of the sisth International Symposium on Biometeorology and Urban Climatology at the Turn of the Millennium. WCASP - 50, WMO/TD 1026. 371-374.
Velasco-Toro J. and G. Skerritt, 2004. De Las Marismas del Guadalquivir a la costa de Veracruz: cinco perspectivas sobre cultura ganadera. Editorial: Instituto Veracruzano de Cultura. Veracruz. México. 168 pp.
Vidal R., 2004. Las regiones climáticas de México. Serie: Temas Selectos de la Geografía Mexicana. Instituto de Geografía. UNAM. México D. F., 213 pp.
Vitali A., M. Segnalimi, L. Bertocchi, U. Bernabucci, A. Nardone and N. Lacetera, 2009. Seasonal pattern of mortality and relationships between mortality and temperature-humidity index in dairy cows. J. Dairy Sci. 92, 3781-3790.


![$ 0 ( ! ) ) ) - - . * * $ # 4 3mica.edu.vn/perso/Tran-Thi-Thanh-Hai/Pdf/2016_ICCE_Print.pdf · 2017. 11. 9. · physical properties of the objects. In [3], the authors proposed a](https://static.fdocumenti.com/doc/165x107/611c1b5979a6ac502341175b/-0-4-3micaeduvnpersotran-thi-thanh-haipdf2016icceprintpdf.jpg)